User login
Ensuring a smooth data collection process
Editor’s note: The Society of Hospital Medicine’s (SHM’s) Physician in Training Committee launched a scholarship program in 2015 for medical students to help transform health care and revolutionize patient care. The program has been expanded for the 2017-18 year, offering two options for students to receive funding and engage in scholarly work during their first, second and third years of medical school. As a part of the longitudinal (18-month) program, recipients are required to write about their experience on a monthly basis.
Piloting of data collection is finally underway! My mentor, Dr. Ian Jenkins, an attending in the Division of Hospital Medicine at the University of California, San Diego, and I are currently collaborating with the Surgical Intensive Care Unit at UC San Diego to conduct a daily review of urinary catheter (UC) necessity for patients on the unit, and subsequently coordinating with nursing staff on the unit to look for opportunities to implement UC alternatives.

As far as timeline, we are past the halfway point. One thing that has surprised me is how long it has taken to get piloting phase underway. To that end, I think that our initial project timeline was ambitious, especially because we were unclear on how well initial project enthusiasm would translate into subsequent project participation. Up until this point, our research approach has largely been to fine tune each process prospectively. For instance, we decided a pilot run of data collection prior to final project data collection would allow us to ensure a smoother data collection process. While this has slowed things initially, we are optimistic that this will allow us to progress more quickly and smoothly in the latter stages of the project. We are not currently planning to change this research approach for the time being, but we are open to the idea depending on how well the data piloting phase progresses.
Outside of data collection, the project has provided an excellent opportunity to learn and improve clinical skills. Specifically, the project has improved my understanding of the indications for urinary catheter use, as well as helped me to develop a more critical mindset regarding medical indications in general. The project has made me more aware of the importance of really asking and thinking about why a patient is on a specific medication or using a specific medical device, which is something that is very helpful for anticipating and avoiding errors in the clinical setting.
Overall, I have enjoyed my participation in the project to date and it has increased my enthusiasm for participating in a quality improvement project.
Victor Ekuta is a third-year medical student at UC San Diego.
Editor’s note: The Society of Hospital Medicine’s (SHM’s) Physician in Training Committee launched a scholarship program in 2015 for medical students to help transform health care and revolutionize patient care. The program has been expanded for the 2017-18 year, offering two options for students to receive funding and engage in scholarly work during their first, second and third years of medical school. As a part of the longitudinal (18-month) program, recipients are required to write about their experience on a monthly basis.
Piloting of data collection is finally underway! My mentor, Dr. Ian Jenkins, an attending in the Division of Hospital Medicine at the University of California, San Diego, and I are currently collaborating with the Surgical Intensive Care Unit at UC San Diego to conduct a daily review of urinary catheter (UC) necessity for patients on the unit, and subsequently coordinating with nursing staff on the unit to look for opportunities to implement UC alternatives.
As far as timeline, we are past the halfway point. One thing that has surprised me is how long it has taken to get piloting phase underway. To that end, I think that our initial project timeline was ambitious, especially because we were unclear on how well initial project enthusiasm would translate into subsequent project participation. Up until this point, our research approach has largely been to fine tune each process prospectively. For instance, we decided a pilot run of data collection prior to final project data collection would allow us to ensure a smoother data collection process. While this has slowed things initially, we are optimistic that this will allow us to progress more quickly and smoothly in the latter stages of the project. We are not currently planning to change this research approach for the time being, but we are open to the idea depending on how well the data piloting phase progresses.
Outside of data collection, the project has provided an excellent opportunity to learn and improve clinical skills. Specifically, the project has improved my understanding of the indications for urinary catheter use, as well as helped me to develop a more critical mindset regarding medical indications in general. The project has made me more aware of the importance of really asking and thinking about why a patient is on a specific medication or using a specific medical device, which is something that is very helpful for anticipating and avoiding errors in the clinical setting.
Overall, I have enjoyed my participation in the project to date and it has increased my enthusiasm for participating in a quality improvement project.
Victor Ekuta is a third-year medical student at UC San Diego.

Drug receives fast track designation for FLT3+ rel/ref AML

The US Food and Drug Administration (FDA) has granted fast track designation to crenolanib for the treatment of patients with FLT3 mutation-positive relapsed or refractory acute myeloid leukemia (AML).
Crenolanib is a benzimidazole type I tyrosine kinase inhibitor (TKI) that selectively inhibits signaling of wild-type and mutant isoforms of FLT3 and PDGFRα/β.
Crenolanib is being developed by Arog Pharmaceuticals, Inc.
The company is preparing for a phase 3, randomized, double-blind trial of crenolanib versus placebo in combination with best supportive care in patients with FLT3+ relapsed or refractory AML.
Results from a phase 2 trial of crenolanib in relapsed/refractory FLT3+ AML were presented at the 2016 ASCO Annual Meeting (abstract 7008).
The trial enrolled 69 patients who had a median age of 60 (range, 21-87). Twenty-nine patients had FLT3 ITD, 29 had ITD and D835, and 11 had D835.
Nineteen patients were TKI-naïve, 39 had received a prior TKI, and 11 had secondary AML.
Patients received crenolanib at 100 mg three times a day (n=43) or 66 mg/m2 three times a day (n=26).
In the TKI-naïve patients, the overall response rate (ORR) was 47% (n=9), and 37% of patients had a complete response (CR) or CR with incomplete count recovery (CRi). The median overall survival (OS) was 238 days (range, 25-547).
In patients who previously received a TKI, the ORR was 28% (n=11), and the CR/CRi rate was 15% (n=6). The median OS was 94 days (range, 8-338).
In patients with secondary AML, the ORR was 9% (n=1, partial response). The median OS in this group was 64 days (range, 27-221).
Treatment-emergent adverse events (all grades and grade 3/4, respectively) included nausea (70%, 9%), vomiting (58%, 9%), diarrhea (56%, 2%), fatigue (36%, 11%), febrile neutropenia (35%, 35%), pneumonia (32%, 23%), peripheral edema (30%, 2%), pleural effusion (21%, 8%), dyspnea (20%, 5%), and epistaxis (20%, 8%).
Two patients discontinued crenolanib due to adverse events. One patient discontinued due to grade 3 fatigue, abdominal pain, and headache. The other discontinued due to grade 3 pneumonia.
There were 2 neutropenic septic deaths, which occurred 2 days and 21 days after the discontinuation of crenolanib.
About fast track designation
The FDA’s fast track program is designed to facilitate the development and expedite the review of products intended to treat or prevent serious or life-threatening conditions and address unmet medical need.
Through the fast track program, a product may be eligible for priority review. In addition, the company developing the product may be allowed to submit sections of the new drug application or biologics license application on a rolling basis as data become available.
Fast track designation also provides the company with opportunities for more frequent meetings and written communications with the FDA. ![]()
E-visits less likely to generate antibiotic prescriptions for common ailments
MONTREAL – When the same patient was assessed in person and via an electronic visit (e-visit) for several common complaints, a prescription for antibiotics was more likely to be generated from the face-to-face encounter.
In a recent study, if antibiotics were prescribed in one setting, but not the other, the office visit rather than the e-visit was where the antibiotic prescription was written in 73% of cases. Visits for sinus problems and vaginal symptoms made up over 80% of these cases of nonconcordant prescribing.
The study compared the diagnosis and treatment of five common acute conditions in an outpatient and e-visit setting, examining the concordance of both diagnosis and treatment between the two settings for complaints of vaginal irritation or discharge, urinary symptoms, sinus problems, rash, and diarrhea.
Outcomes tracked included concordance between the office visits and mock e-visits for the diagnosis, whether antibiotics were prescribed, and the general choice of antibiotics. Determinations about concordance were made by a third provider who was not involved with either the in-person visit or the mock e-visit, said Dr. Player, of the department of family medicine at the Medical University of South Carolina, Charleston.
Nonconcordance in treatment could occur either because an antibiotic was prescribed in one setting, but not the other, or because the broad choice of antibiotic class differed between the two settings.
Adult patients who came to the outpatient clinic and agreed to be enrolled in the study also completed the e-visit questionnaires appropriate to their condition before they saw the provider in an office visit. Thus, mock e-visits were created that mirrored the office visit with the e-visit format used in practice.
At a later point in time, the blinded e-visit questionnaires were given to e-visit providers who treated the patients as they would if the questionnaires had been generated in an actual e-visit.
The study generated a total of 142 office visits with accompanying mock e-visits, but 29 were excluded for lack of completeness or inappropriateness for e-visit care. In all, 113 paired visits were evaluated. All but seven patients (94%) were female; slightly more than half (53%) of patients were aged 45 years or older.
About one-third of visits (34%; n = 38) were for vaginal discharge or irritation. Sinus problems were reported by 36 patients (32%). Twenty-five patients (22%) reported urinary problems, while eight patients (7%) reported diarrhea. Six patients (5%) complained of a rash.
In total, 78 visit pairs (69%) were assessed as being concordant. Of the 35 nonconcordant visits, over half (54%) were for sinus problems, 40% were for vaginal discharge or irritation, and 6% were for rash. None of the visits involving urinary problems or diarrhea were assessed as nonconcordant.
Examining the data another way, Dr. Player and his coinvestigators also looked at how many visits involved antibiotic prescribing, and how many of those visits were assessed as nonconcordant. Of the 96 patients (85%) who were prescribed antibiotics, 37 had office and mock e-visits that were assessed as discordant in antibiotic prescribing.
Of these visit pairs, about half (51%) were for sinus problems, and a third (32%) were for vaginal complaints. Urinary complaints made up 11% of the nonconcordant visit pairs where antibiotics were prescribed, and rashes made up the remaining 5%.
Diagnostic concordance was seen in about two-thirds of rash (67%) and vaginal discharge (63%) visit pairs. Concordance of diagnosis for sinus problems occurred in fewer than half (47%) of visit pairs.
Dr. Player said that the investigators excluded visits involving urinary or vaginal complaints that did not have an accompanying urinalysis or vaginal wet mount. This decision was made because the standard of care for both office visits and e-visits requires these laboratory tests for diagnosis, he said.
The study design came with some limitations, said Dr. Player. “Patients self-select for e-visits, and the patients in this study might be different from those in true e-visit encounters,” he said. Also, the diagnosis and treatment of sinus problems, rash, and diarrhea relied on clinical judgment alone in each visit setting. Still, he said, the study supports what many clinicians report anecdotally: Patients want to leave the office knowing that the clinician has “done something” for them, and often, that means walking out with a prescription in hand.
Dr. Player reported no conflicts of interest.
koakes@frontlinemedcom.com
On Twitter @karioakes
AT NAPCRG 2017
Key clinical point:
Major finding: Antibiotics were given in the office but not the e-visit in 73% of cases.
Data source: Prospective study of 113 office visits that were paired with independently assessed e-visits for the same patient and complaint.
Disclosures: Dr. Player reported no conflicts of interest.
How to assess a patient for a bisphosphonate drug holiday
Recorded at the 2017 meeting of the North American Menopause Society

Co-Chair, 2017 NAMS Pre-Meeting Symposium
Founding Director, Oregon Osteoporosis Center
Dr. McClung reports being a consultant to Amgen and Radius Health and a speaker for Amgen and Radius Health.
Co-Chair, 2017 NAMS Pre-Meeting Symposium
Founding Director, Oregon Osteoporosis Center
Dr. McClung reports being a consultant to Amgen and Radius Health and a speaker for Amgen and Radius Health.
Co-Chair, 2017 NAMS Pre-Meeting Symposium
Founding Director, Oregon Osteoporosis Center
Dr. McClung reports being a consultant to Amgen and Radius Health and a speaker for Amgen and Radius Health.
Recorded at the 2017 meeting of the North American Menopause Society
Recorded at the 2017 meeting of the North American Menopause Society

CMS looking to evolve QPP to measure outcomes, not processes
WASHINGTON – The Quality Payment Program, the value-based payment scheme created under the Medicare Access and CHIP Reauthorization Act, will focus on measuring clinical outcomes – instead of processes – if Seema Verma, administrator of the Centers for Medicare & Medicaid Services, has her way.
“I think the concept of paying for value is a good concept,” Ms. Verma told attendees at the annual meeting of the federal Office of the National Coordinator for Health Information Technology on Dec. 1. “A lot of the measures in terms of how we are evaluating providers aren’t necessarily around outcomes. There are a lot of process measures.”
“Many of us have used the health care system and can attest that it is also a lot of times confusing,” she said. “We don’t know where to go for our care. Who is the best doctor? We don’t always have the information about cost or quality or value, and it is difficult to navigate the health care system.”
She said she wants to “make sure that the data that we have at CMS is available to our beneficiaries, whether it be information about their claims data, information about quality, information about the health plan that they may pick, information about their provider directory, information about the quality ratings if they are seeking hospice care.”
Getting to that point will require addressing an ongoing and familiar problem for physicians: interoperability of health care IT systems.
Improved interoperability would allow for greater patient empowerment by providing patients with better access to their own medical data, she said, noting that the data also belongs to the patient.
“That is our information and the patient should have that,” Ms. Verma said. “When we talk about patient empowerment and patients first, this is what we are talking about. This is what I mean. I want to make sure the beneficiaries who are using the Medicaid program, the Medicare program have this information. That is important.”
She also noted that improved interoperability will allow for greater use of data across the health care spectrum, including in the area of drug pricing.
“We have some very high-cost new drugs coming,” she noted. “We are having discussions about how to pay for these drugs in a different way. Maybe we are going [toward] value-based pricing or indication-based pricing [and] so paying for the drug based on the outcomes.”
AT ONC 2017
FDA approves first trastuzumab biosimilar
The Food and Drug Administration has approved trastuzumab-dkst (Ogivri) as a biosimilar to trastuzumab (Herceptin) for the treatment of patients with HER2+ breast or metastatic gastric or gastroesophageal junction adenocarcinoma.
This is the first biosimilar approved in the United States for the treatment of breast cancer or gastric cancer and the second biosimilar approved for the treatment of cancer, the FDA said in a statement.
The approval of trastuzumab-dkst is based on structural and functional characterization, animal study data, human pharmacokinetic and pharmacodynamic data, clinical immunogenicity data, and other clinical safety and effectiveness data.
Common expected side effects of trastuzumab-dkst for the treatment of HER2+ breast cancer include headache, diarrhea, nausea, chills, fever, infection, congestive heart failure, insomnia, cough, and rash. Common expected side effects for the treatment of HER2+ metastatic gastric cancer include neutropenia, diarrhea, fatigue, anemia, stomatitis, weight loss, upper respiratory tract infections, fever, thrombocytopenia, mucosal inflammation, nasopharyngitis, and dysgeusia.
The biosimilar label contains a Boxed Warning – as trastuzumab does – about increased risks of cardiomyopathy, infusion reactions, pulmonary toxicity, and fetal toxicity.
The FDA’s Oncologic Drugs Advisory Committee voted unanimously in July to recommend approval of the biosimilar, made by Mylan and Biocon.
Direct and Indirect Patient Costs of Dermatology Clinic Visits and Their Impact on Access to Care and Provider Preference
Access to outpatient specialty care is notably limited due to time and out-of-pocket costs to patients, leading to patient dissatisfaction and worsened clinical outcomes. Lost time and earnings pose considerable opportunity costs for patients, with the total opportunity cost for all physician visits per year estimated at $52 billion in 2010 in the United States.1
The field of dermatology exemplifies the access issues patients may face when seeking specialty care given the ongoing national shortage of dermatologists and notably long wait times exceeding 60 days in major cities.2-4 With the high demand and limited number of providers, patients may have longer wait times to see dermatologists in their communities or have to travel further to see dermatologists in distant locations who have available appointments; therefore, patients may be subject to higher associated time, travel, and monetary costs. According to the 2013 Medical Expenditure Panel Survey, dermatology visits in the United States cost an average of $221 per visit compared to $166 for primary care. Dermatology visits had the highest median cost per office visit ($124) and were more often associated with out-of-pocket expenses (60.7%) compared to other specialties.5 Despite these high costs, the number of dermatology visits is increasing each year, with more than 38 million dermatology visits in 2012.6
In light of these factors that limit patient access to dermatologists compared to other specialists, we performed an evaluation of the direct and indirect costs to patients visiting an outpatient dermatology clinic in Boston, Massachusetts, to better understand obstacles to receiving dermatologic care. The impact that time and money have on how patients prefer to receive their care also was evaluated. Conducting this study in Boston may best reflect patient barriers to obtaining dermatologic treatment, as nationwide surveys have found that Boston has the highest cumulative average wait times for physician appointments compared to other US metropolitan cities, with an average wait time of 72 days to see a dermatologist.4 New studies of patient costs associated with dermatology clinic visits are lacking, and existing economic analyses rarely include time costs. Understanding time burden and opportunity costs from the patient perspective may motivate patients and physicians to alter how they receive and provide health care, respectively, to minimize these expenses. Advances in health care technology such as telecommunication may facilitate these changes.
Methods
Study Design
This survey study took place from October 1, 2015, to March 4, 2016, at the department of dermatology outpatient clinic of Tufts Medical Center, an academic university hospital located in downtown Boston, Massachusetts, with no satellite clinics. Five general dermatologists, 2 dermatologic surgeons, and 9 dermatology residents comprised the dermatology department. The study protocol and questionnaire received exemption status from the Tufts University Health Science’s institutional review board.
All adult patients (aged ≥18 years) attending a scheduled dermatology clinic visit within the designated time frame were invited to complete a questionnaire available in English, Spanish, or Chinese. Patients completed the questionnaire on paper or electronically using handheld tablets. Data were then compiled into the REDCap (Research Electronic Data Capture) online database. The questionnaire surveyed patient age; gender; ethnicity; language spoken; highest level of education; employment status; reason for visit (ie, skin condition); duration, cost, and mode of transportation; duration of visit including wait time; companion accompaniment; profession; hourly wage; and number of work hours requested off to attend the visit. Lastly, patients were surveyed on whether they prefer to receive dermatologic care at Tufts, to receive in-person care elsewhere, to use teledermatology, or none of the above.
Statistical Analysis
Total time attributed to the visit was the sum of time for round-trip travel to and from the clinic, wait time, and face-to-face time with care providers. Out-of-pocket patient expenses included round-trip travel expenses, child care expenses, and direct payments such as deductibles and co-pays. Opportunity cost for employed patients was calculated as the patient’s average hourly wage multiplied by either the number of hours taken off from work or the number of hours the patient attributed to the visit, whichever value was higher at the individual level. For the purpose of calculating opportunity costs, travel time, wait time, and face-to-face time were imputed using average values for these variables when not reported. Patients could provide exact hourly wage and annual income or select the closest approximation from 10 wage ranges. For patients who selected a wage range, the midpoint of the range was used as the hourly wage. Total costs were the sum of reported out-of-pocket expenses and calculated opportunity costs. For unemployed patients and those who did not report employment status, hourly wage was assumed to be $0, resulting in opportunity costs of $0. Costs are tabulated for individual patients and analyzed in aggregate.
Differences in patient characteristics between those who preferred their current care provider versus those who preferred to seek care elsewhere or via teledermatology were compared using the χ2 and Student t test. A multivariate logistic regression was then performed to identify predictors of patient preference for their current provider. Potential predictors for regression model were time and cost variables as well as factors selected based on results from bivariate analysis. Data analysis was performed using statistical software.
Results
Demographics
Demographic data for respondents are outlined in Table 1. Of 145 patients who completed the survey, the majority had already seen a dermatologist for their presenting condition (87.4%), and were English speaking (96.5%), white (76.6%), employed (59.4%), and male (50.3%), with a mean age (SD) of 52.3 (18.1) years and education level of 4-year university or higher (64.7%). The most common reasons for dermatology clinic attendance were general skin checks (30.8%) and psoriasis (26.6%). A smaller proportion of patients (16.1%) presented for surgical visits. Other less common conditions that brought patients into the clinic included acne (6.3%), eczema (4.9%), and skin rash (2.8%).
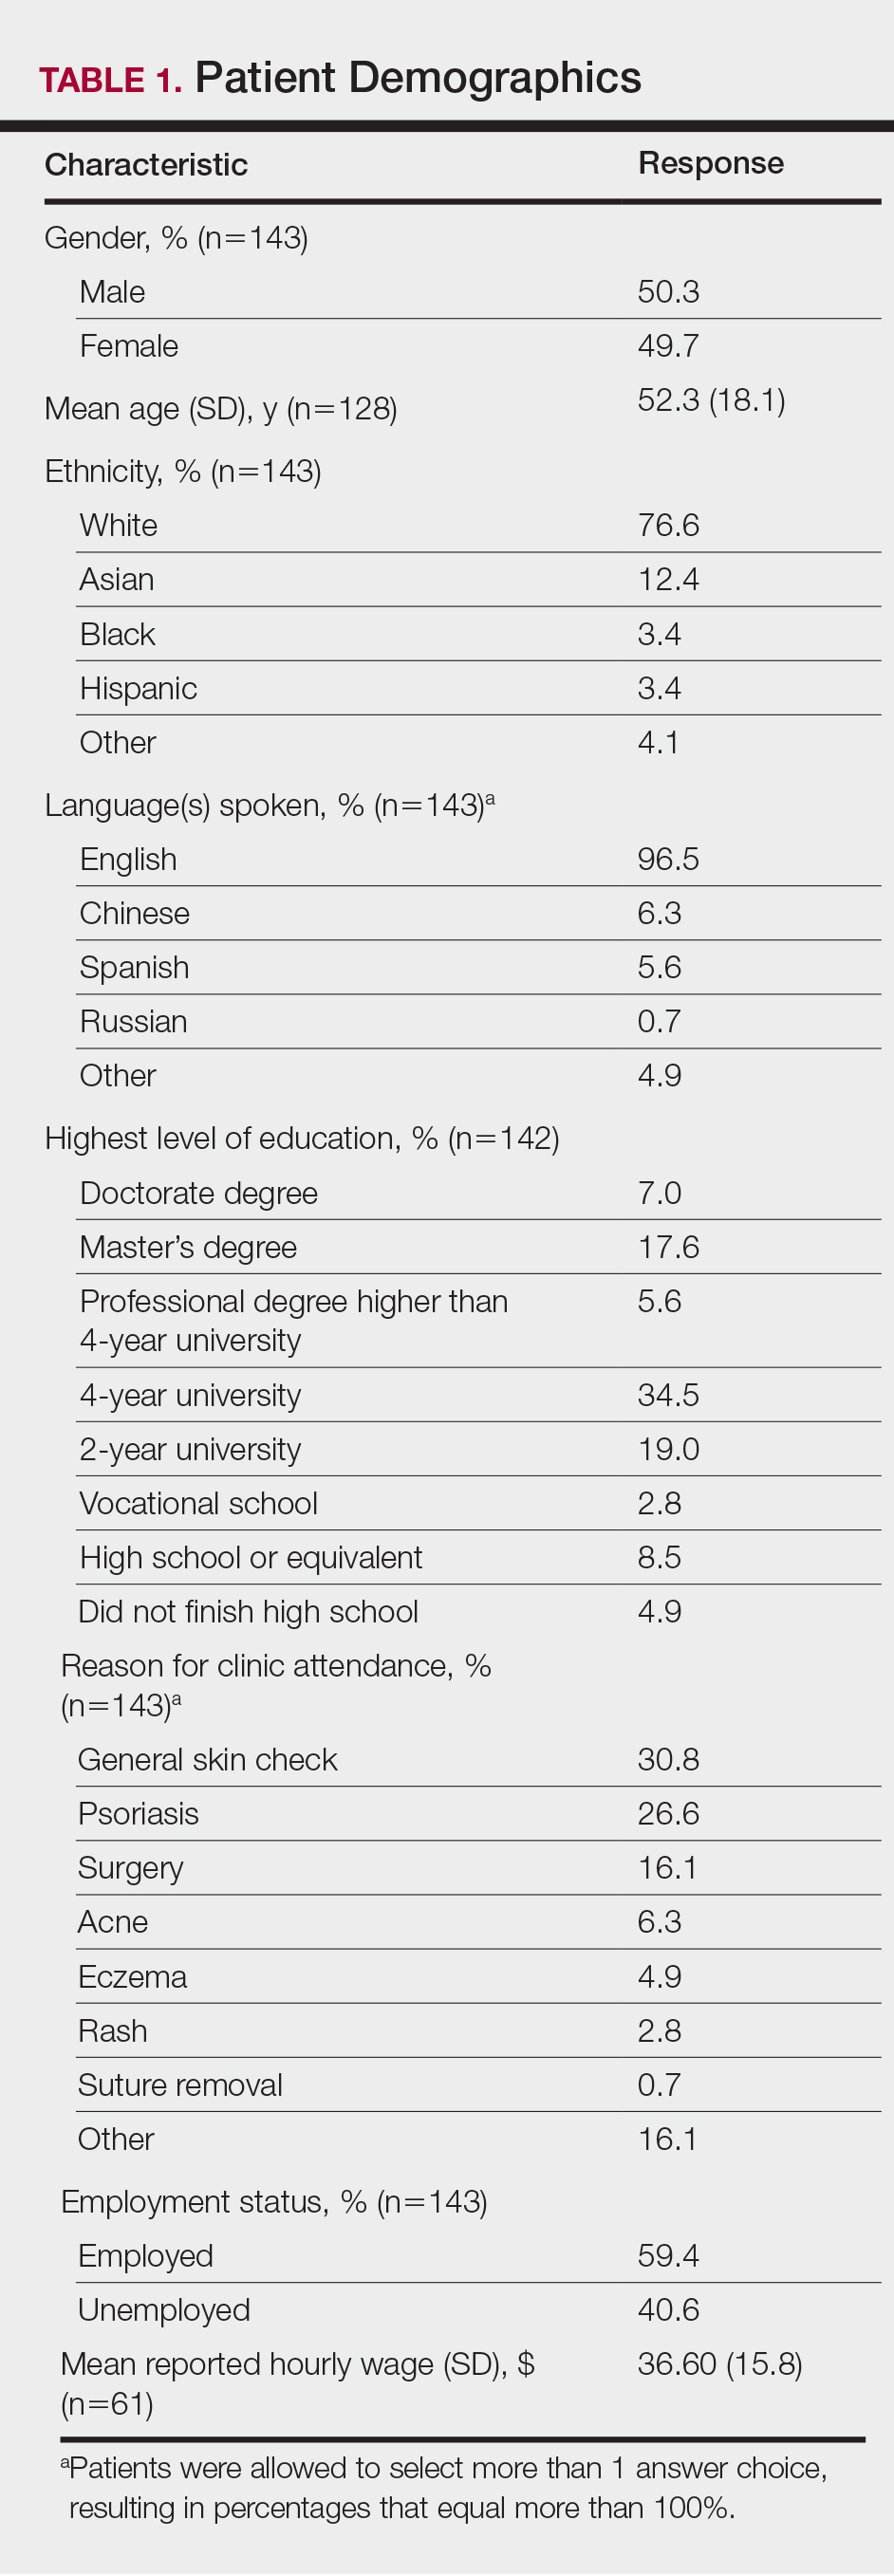
The mean (SD) reported hourly wage of employed patients was $36.60 (15.8). The most common reasons for unemployment were retirement (65.5% [38/58]), disability (10.3% [6/58]), and schooling (10.3% [6/58]).
Time Attributed to Attending Dermatology Clinic Visits
Time costs are reported in Table 2. Patients traveled to the clinic mainly by car (56.5% [78/138]) or train/subway (25.3% [35/138]). One in approximately 5 patients (21.3%) spent more than 1 hour traveling one-way to the clinic. Most patients waited less than 20 minutes to see their care providers. Face-to-face time with providers (ie, residents and attending physicians) ranged from less than 21 minutes to more than 1 hour, with a mean (SD) time of 36.8 (18.9) minutes.
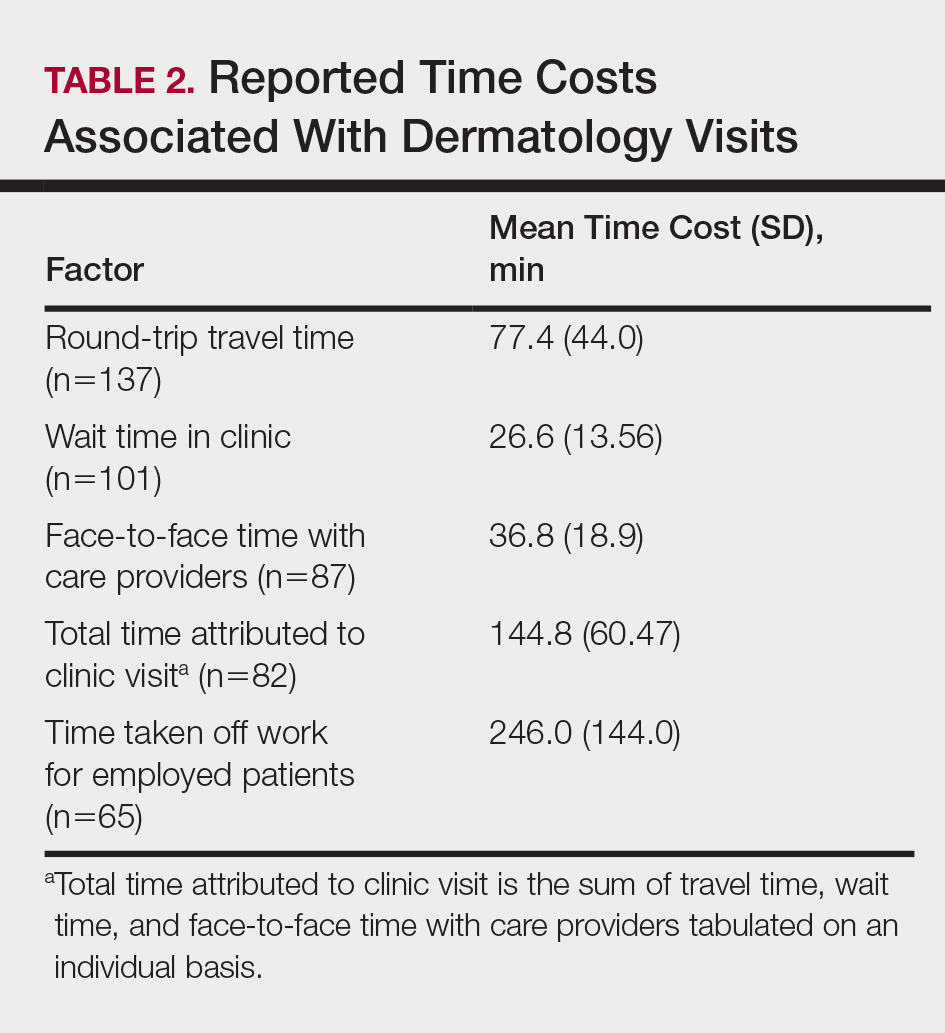
Of the employed respondents, 76.5% (65/85) took off time from work for the appointment. Patients took a mean (SD) of 4.1 (2.4) hours off from work, which was considered sick pay (35%), paid time off (36.6%), or unpaid time (28.3%). The total mean (SD) time dedicated to attending the clinic appointment averaged 144.8 (60.47) minutes. On average, the time spent traveling for the clinic visit was double the amount of time spent with the care provider (77.4 vs 36.8 minutes).
Monetary and Opportunity Costs
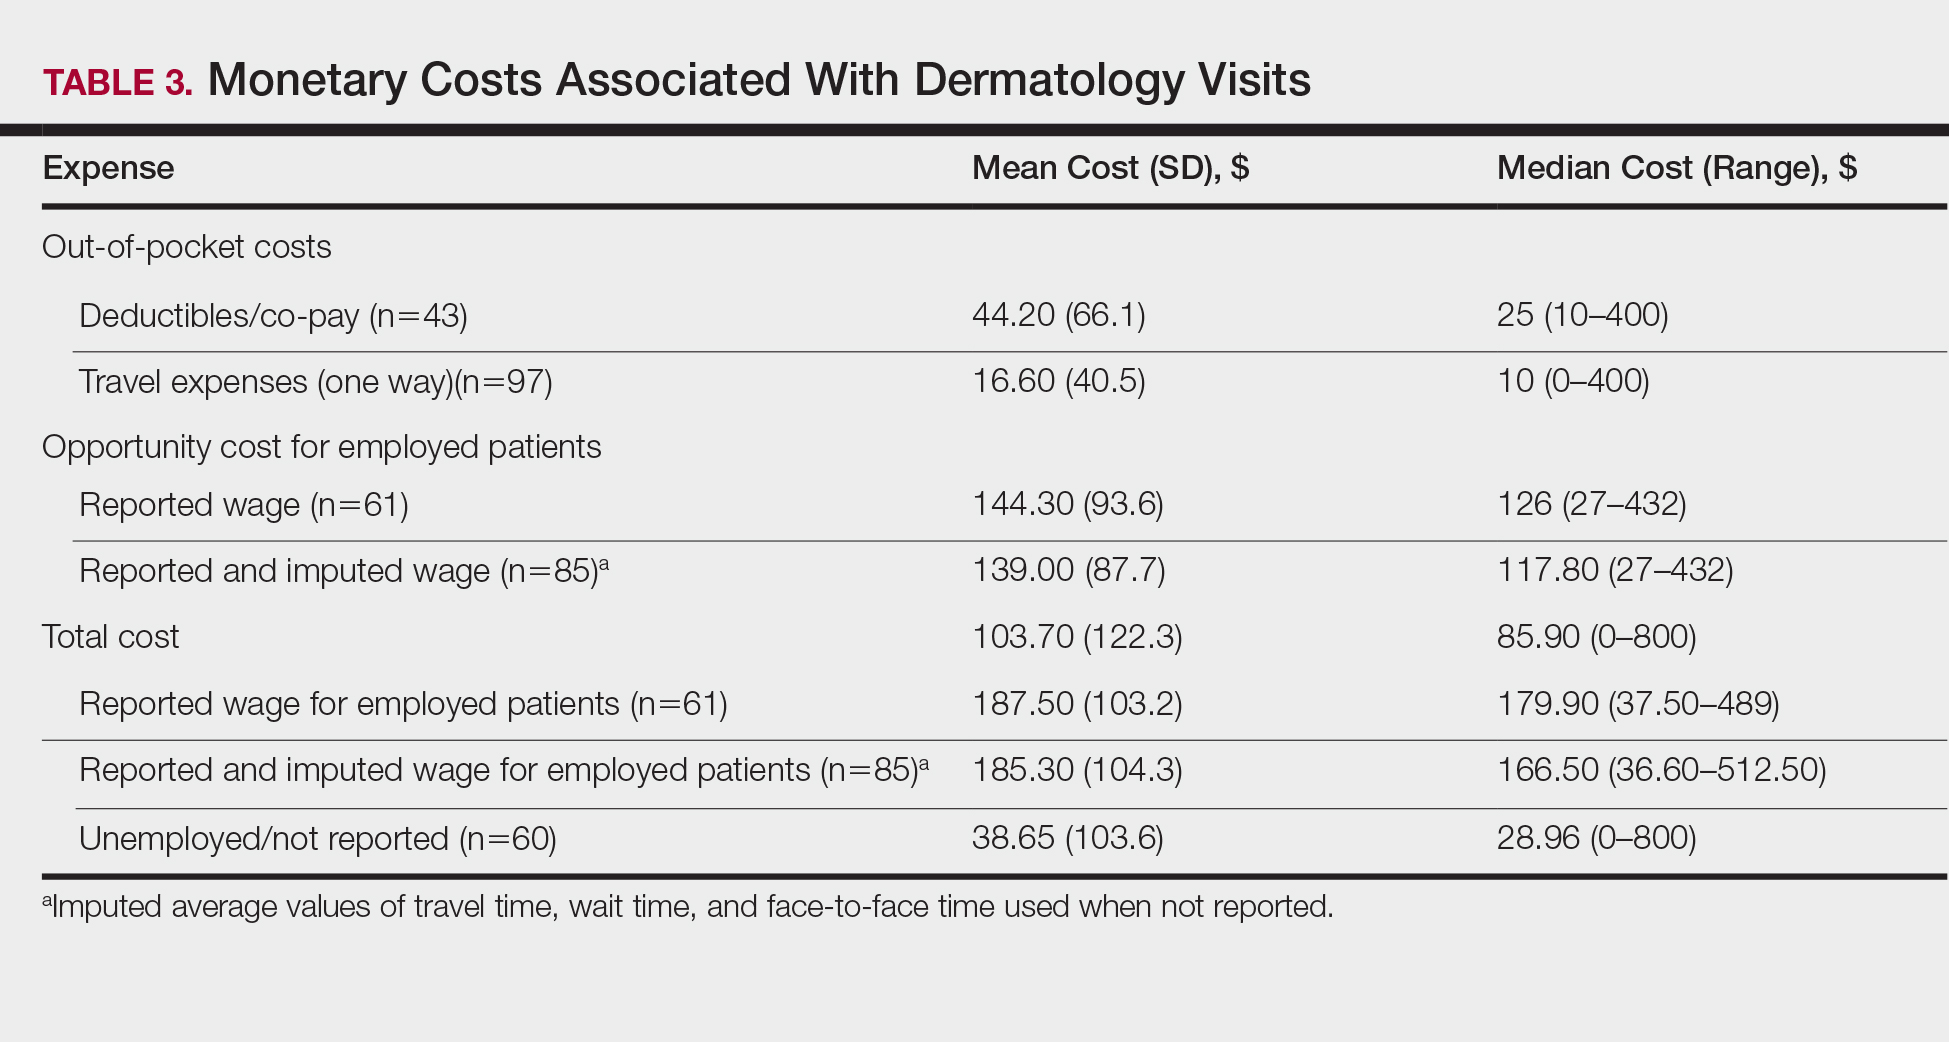
The mean (SD) monetary cost associated with clinic attendance for employed patients who reported their wages was $187.50 (103.2)(range, $37.50–$489), most of which was opportunity cost from loss of potential work income (mean [SD], $144.30 [93.6]; range, $27–$432)(Table 3). Similar total and opportunity costs were found for employed patients using the imputed average wage. The mean (SD) total cost per visit for unemployed patients or those who did not report employment status was $38.65 (103.6)(range, $0–$800), which was 4-times less than the cost per visit for employed patients. Mean (SD) and median one-way travel expenses were $16.60 (40.5) and $10, respectively. Mean (SD) and median reported costs for deductibles/co-pays were $44.20 (66.1) and $25, respectively. Only 2 patients reported child care costs, which were valued at $65 and $75.
Patient Provider Preference
The majority (59.3% [67/113]) of patients preferred their current care providers, whereas 33.6% (38/113) preferred providers closer to work, home, or in a different unspecified setting. Only 7.0% (8/113) of patients who answered this survey question would choose teledermatology over their current providers.
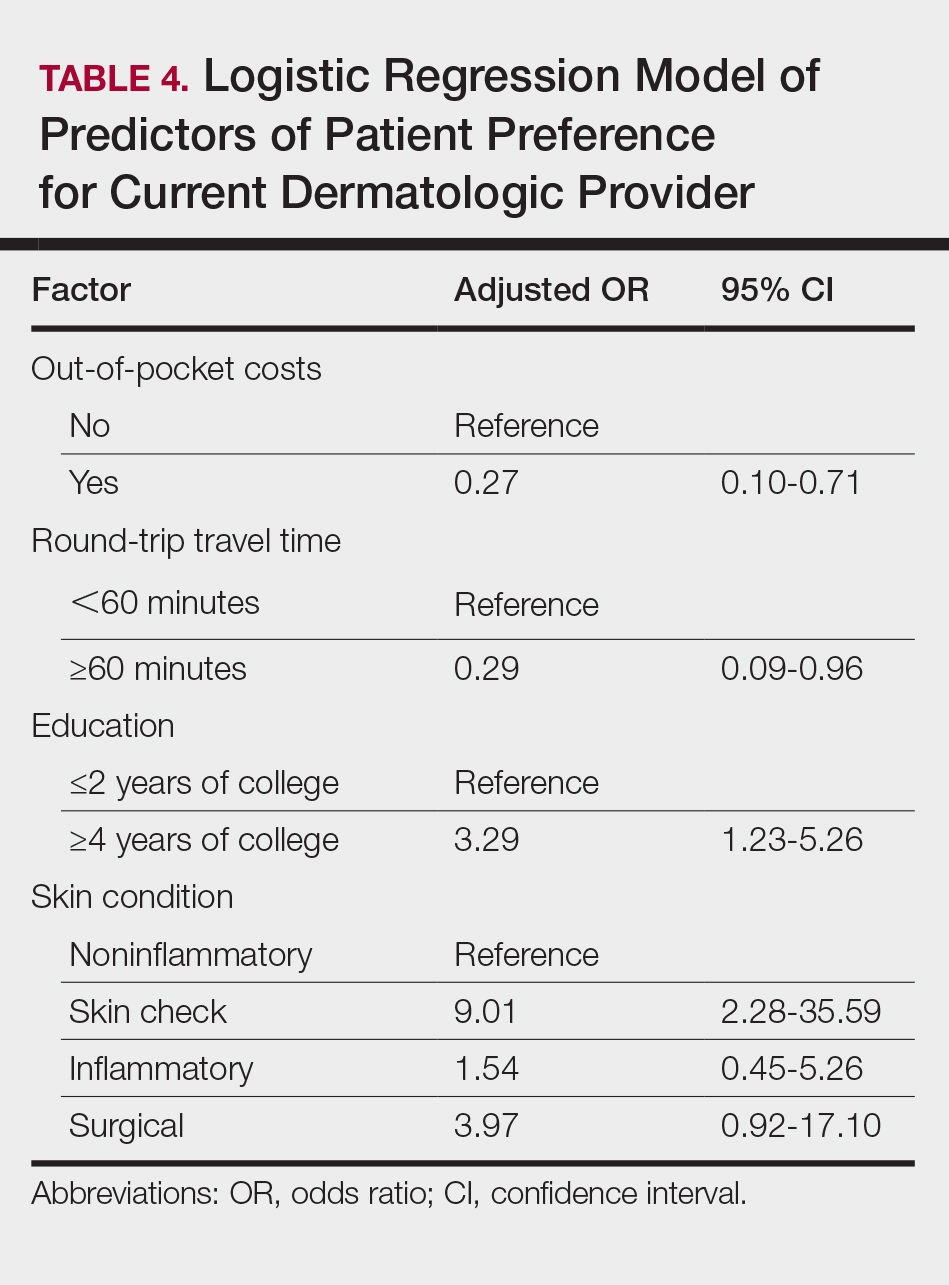
On multivariate logistic regression (Table 4), patients who had additional out-of-pocket costs were significantly less likely to prefer their current care provider compared to patients with no out-of-pocket costs (odds ratio [OR], 0.27; 95% confidence interval [CI], 0.10-0.71; P<.05). Opportunity costs were not a significant predictor of provider preference. For every minute the travel time increased, the likelihood of preference for the current care provider decreased by 2% (OR, 0.98; 95% CI, 0.95–0.99), and patients who traveled 60 minutes or more round-trip were 71% less likely to choose current provider care than those who traveled less than 60 minutes (OR, 0.29; 95% CI, 0.09-0.96; P<.05). Patients with higher education (≥4 years of college) were 3.29-times more likely to stay with their current care provider than those with lower education (≤2 years of college). Those presenting for skin checks also preferred the current provider more than those with noninflammatory skin conditions such as alopecia and warts (OR, 9.01; 95% CI, 2.28-35.59). Age and gender were not statistically significant predictors of patient provider preference.
Comment
Our study revealed that patients spend a substantial amount of time and money attending dermatology clinic appointments. Round-trip travel time exceeded 2 hours for 20% of patients and accounted for the majority of the total time attributed to the visit. Patients who were employed typically requested an average of 4 hours off from work, resulting in a mean (SD) opportunity cost of $144.30 (93.6) due to lost wages. Direct costs such as co-pays, deductibles, travel expenses, and child care accounted for a smaller proportion of total costs. The study assumed a wage of $0 for unemployed patients, thus underestimating the true costs of the visit for these patients whose time may otherwise have been spent on leisure, education, volunteerism, or other activities that contribute to individual and societal productivity. The total costs for unemployed patients reflected only direct costs, and thus were notably lower than those for employed patients.
Direct out-of-pocket costs and travel time negatively impacted provider preference. Patients with out-of-pocket costs were much less likely to stay with their current care provider (OR, 0.27; 95% CI, 0.10-0.71), preferring to seek care closer to home/work or teledermatology services. Similarly, for each minute that travel time increased, preference for current care provider decreased by 2%. Those who traveled 60 minutes or more were 71% less likely than those who traveled less than 60 minutes to stay with their current provider when given other options for care. Opportunity costs did not affect provider preference, even though they far exceeded direct costs for employed patients. Perhaps opportunity costs are not as immediately apparent to patients as out-of-pocket costs and travel time, and thus they do not factor as heavily in provider preference.
Despite high time and monetary costs, the majority of patients (60%) still preferred their current care provider, especially those with 4-year university degrees or higher education level (OR, 3.29; 95% CI, 1.23-5.26) and those presenting for skin checks (OR, 9.01; 95% CI, 2.28-35.59). Patients with higher levels of education likely have higher incomes and thus may not be as adversely affected by direct and/or indirect visit costs. Patients presenting for skin checks may value continuity and prefer providers with whom they already have an established therapeutic relationship. Future studies are needed to analyze the impact of these nonmonetary factors on provider preference.
Seeking Alternative Care
Tufts Medical Center does not have satellite dermatology clinics, making it the only option for patients who wish to receive care within the Tufts hospital network. However, patients do have the option of visiting non–Tufts-affiliated dermatology clinics outside of the city. To our knowledge, no formal studies have been performed comparing wait times for dermatology appointments in suburban versus urban Boston areas; however, it has been reported that rural practitioners have longer wait times than urban dermatologists, possibly due to the fact that physicians tend to aggregate in metropolitan areas.2 Thus, the potential for shorter wait times in the Boston metropolitan area may make it a more desirable location to receive care compared to more suburban or even rural areas of Massachusetts, but additional data are needed to substantiate this hypothesis. Additionally, health insurance restrictions, refractory or complex dermatologic conditions, and referring providers’ preference may affect patients’ decisions to seek care at a particular clinic. However, these factors do not alter our finding that those who travel long distances to our dermatology clinic are less likely to stay with their current provider if given the choice to seek care closer to home/work or utilize teledermatology services.
Prior studies have demonstrated patient preference and willingness to accept alternative modes of care delivery to reduce time and monetary costs associated with in-person medical visits.7,8 Dermatology patients at a clinic in Ontario, Canada, considered the time they spent attending the clinic to be even more burdensome than the monetary cost.7 Patients with nondermatologic chronic diseases and high out-of-pocket costs would prefer email rather than a clinic visit as the first method of contact with care providers.8 The explosive growth of direct-to-consumer (DTC) teledermatology services in the last 10 years speaks to patient demand for alternative care delivery that saves time and money. Although telemedicine has been implemented in various specialties, including ophthalmology and neurology, one of the most common applications is teledermatology. With DTC teledermatology, patients can take photographs or videos using personal smartphones and communicate directly with care providers using mobile or online applications. More recent review articles have identified 22 to 29 DTC mobile and web-based teledermatology services, with costs varying from $0 to $250.9-11 The median consultation fee of $59 for DTC teledermatology services is substantially less than total visit costs for employed patients in our study.9 Teledermatology has become an accessible and affordable modality of care, though perhaps not yet fully optimized for quality of care.
With increasingly higher co-pays and high-deductible insurance plans, time and monetary factors play increasingly important roles in patient preference for specialty care providers,12 as demonstrated by our study. Dermatologists can work with patients to reduce the costs of medical visits. Perhaps monitoring of chronic but stable conditions can be accomplished through telecommunication to reduce the number of follow-up visits. For instance, psoriasis patients enrolled in telemonitoring perceived savings of time and expenses through reduction of clinic visits, resulting in high patient satisfaction levels.13 Telephone calls and secure email messaging are other feasible alternatives shown to aid in clinical management and decrease the need for in-person care.8,14 Fewer unnecessary follow-up visits also means more availability for new patients and those with acute needs.
Barriers to obtaining care are not limited to dermatology and are pervasive across most medical specialties. Issues of patient time burden and out-of-pocket expenses are reflected in recent reports focused on quantifying these costs throughout ambulatory care visits and services such as colorectal, cervical, and breast cancer screenings.1,15-18 Similar to our findings, many of these studies also show high time and opportunity costs from the patient perspective. Expansion of telemedicine to reduce patient costs is becoming a viable option for many specialists, though low reimbursement rates restrict its widespread application.9,19 However, this obstacle is not impossible to surmount. One study found that offering teledermatology to Medicaid patients through their primary care providers significantly improved access, allowing for a 63.8% increase in the number of patients visiting a dermatologist (P<.01).20 Currently, a total of 48 state Medicaid programs now cover telemedicine, and a growing number of states are requiring private insurers to cover telehealth services.21 As more dermatologists adopt telemedicine practices, it may allow for better access as well as expanded insurance coverage.
Limitations
The results of our study are limited by the single-institution survey design. Patients were asked to complete the survey while still at the clinic visit to minimize recall bias. Because these patients actually attended their appointments, they might perceive the time and monetary costs associated with the visit to be less problematic than those who canceled their appointments or transferred care elsewhere; however, we were still able to detect a significant impact of time and monetary costs on provider preference in this cohort (P<.05). Larger studies in different geographic settings and other specialty clinics are needed to confirm our findings and to determine if nonmonetary factors such as specific diagnoses, length of time with a certain care provider, or patient socioeconomic status can modulate the impact of time and monetary costs on provider preference.
Conclusion
This study showed that patients expend a substantial amount of time and monetary costs to attend dermatology clinic visits. Data from the current and prior studies suggest that these costs affect patient provider preference for dermatologic care and may pose barriers to necessary medical care. Recognizing direct and indirect patient costs may drive critical changes in health care delivery, such as increased telecommunication utilization, the more cost-saving alternative. Telemedicine, when integrated appropriately, can help minimize expenses for patients while continuing to maintain a high level of care.
- Ray KN, Chari AV, Engberg J, et al. Opportunity costs of ambulatory medical care in the United States. Am J Manag Care. 2015;21:567-574.
- Kimball AB, Resneck JS Jr. The US dermatology workforce: a specialty remains in shortage. J Am Acad Dermatol. 2008;59:741-745.
- Resneck JS Jr, Lipton S, Pletcher MJ. Short wait times for patients seeking cosmetic botulinum toxin appointments with dermatologists. J Am Acad Dermatol. 2007;57:985-989.
- Physician appointment wait times & Medicaid and Medicare acceptance rates. Merritt Hawkins website. https://www.merritthawkins.com/2014-survey/patientwaittime.aspx. Accessed February 15, 2017.
- Machlin SR, Adams SA. Expenses for office-based physician visits by specialty, 2013. Agency for Healthcare Research and Quality website. https://meps.ahrq.gov/data_files/publications/st484/stat484.pdf. Published November 2015. Accessed February 15, 2017.
- National ambulatory medical care survey: 2012 state and national summary tables. CDC website. www.cdc.gov/nchs/data/ahcd/namcs_summary/2012_namcs_web_tables.pdf. Accessed February 15, 2017.
- Vignjevic PM, Hux JE, Fisher BK, et al. Monetary and nonmonetary costs to patients attending an ambulatory dermatology clinic. J Cutan Med Surg. 1999;3:188-192.
- Reed M, Graetz I, Gordon N, Fung V. Patient-initiated e-mails to providers: associations with out-of-pocket visit costs, and impact on care-seeking and health. Am J Manag Care. 2015;21:E632-E639.
- Peart JM, Kovarik C. Direct-to-patient teledermatology practices. J Am Acad Dermatol. 2015;72:907-909.
- Fogel AL, Sarin KY. A survey of direct-to-consumer teledermatology services available to US patients: explosive growth, opportunities and controversy. J Telemed Telecare. 2017;23:19-25.
- Kochmann M, Locatis C. Direct to consumer mobile teledermatology apps: an exploratory study. Telemed J E Health. 2016;22:689-693.
- Helms AD. High-deductible health plans can ruin finances. Kaiser Health News website. https://khn.org/news/high-deductible-health-plans-can-ruin-finances/. Published April 6, 2015. Accessed February 15, 2017.
- Fruhauf J, Schwantzer G, Ambros-Rudolph CM, et al. Pilot study on the acceptance of mobile teledermatology for the home monitoring of high-need patients with psoriasis. Australas J Dermatol. 2012;53:41-46.
- Eisenberg D, Hwa K, Wren SM. Telephone follow-up by a midlevel provider after laparoscopic inguinal hernia repair instead of face-to-face clinic visit. JSLS. 2015;19:e2014.00205.
- Yabroff KR, Guy GP Jr, Ekwueme DU, et al. Annual patient time costs associated with medical care among cancer survivors in the United States. Med Care. 2014;52:594-601.
- Yabroff KR, Davis WW, Lamont EB, et al. Patient time costs associated with cancer care. J Natl Cancer Inst. 2007;99:14-23.
- Jonas DE, Russell LB, Sandler RS, et al. Value of patient time invested in the colonoscopy screening process: time requirements for colonoscopy study. Med Decis Making. 2008;28:56-65.
- Shireman TI, Tsevat J, Goldie SJ. Time costs associated with cervical cancer screening. Int J Technol Assess Health Care. 2001;17:146-152.
- Dorsey ER, Topol EJ. State of telehealth. N Engl J Med. 2016;375:154-161.
- Uscher-Pines L, Malsberger R, Burgette L, et al. Effect of teledermatology on access to dermatology care among Medicaid enrollees. JAMA Dermatol. 2016;152:905-912.
- Thomas L, Capistrant G. State telemedicine gaps analysis: coverage & reimbursement. Telehealth website. http://www.mtelehealth.com/state-telemedicine-gaps-analysis-coverage-reimbursement/. Published January 19, 2016. Accessed February 15, 2017.
Access to outpatient specialty care is notably limited due to time and out-of-pocket costs to patients, leading to patient dissatisfaction and worsened clinical outcomes. Lost time and earnings pose considerable opportunity costs for patients, with the total opportunity cost for all physician visits per year estimated at $52 billion in 2010 in the United States.1
The field of dermatology exemplifies the access issues patients may face when seeking specialty care given the ongoing national shortage of dermatologists and notably long wait times exceeding 60 days in major cities.2-4 With the high demand and limited number of providers, patients may have longer wait times to see dermatologists in their communities or have to travel further to see dermatologists in distant locations who have available appointments; therefore, patients may be subject to higher associated time, travel, and monetary costs. According to the 2013 Medical Expenditure Panel Survey, dermatology visits in the United States cost an average of $221 per visit compared to $166 for primary care. Dermatology visits had the highest median cost per office visit ($124) and were more often associated with out-of-pocket expenses (60.7%) compared to other specialties.5 Despite these high costs, the number of dermatology visits is increasing each year, with more than 38 million dermatology visits in 2012.6
In light of these factors that limit patient access to dermatologists compared to other specialists, we performed an evaluation of the direct and indirect costs to patients visiting an outpatient dermatology clinic in Boston, Massachusetts, to better understand obstacles to receiving dermatologic care. The impact that time and money have on how patients prefer to receive their care also was evaluated. Conducting this study in Boston may best reflect patient barriers to obtaining dermatologic treatment, as nationwide surveys have found that Boston has the highest cumulative average wait times for physician appointments compared to other US metropolitan cities, with an average wait time of 72 days to see a dermatologist.4 New studies of patient costs associated with dermatology clinic visits are lacking, and existing economic analyses rarely include time costs. Understanding time burden and opportunity costs from the patient perspective may motivate patients and physicians to alter how they receive and provide health care, respectively, to minimize these expenses. Advances in health care technology such as telecommunication may facilitate these changes.
Methods
Study Design
This survey study took place from October 1, 2015, to March 4, 2016, at the department of dermatology outpatient clinic of Tufts Medical Center, an academic university hospital located in downtown Boston, Massachusetts, with no satellite clinics. Five general dermatologists, 2 dermatologic surgeons, and 9 dermatology residents comprised the dermatology department. The study protocol and questionnaire received exemption status from the Tufts University Health Science’s institutional review board.
All adult patients (aged ≥18 years) attending a scheduled dermatology clinic visit within the designated time frame were invited to complete a questionnaire available in English, Spanish, or Chinese. Patients completed the questionnaire on paper or electronically using handheld tablets. Data were then compiled into the REDCap (Research Electronic Data Capture) online database. The questionnaire surveyed patient age; gender; ethnicity; language spoken; highest level of education; employment status; reason for visit (ie, skin condition); duration, cost, and mode of transportation; duration of visit including wait time; companion accompaniment; profession; hourly wage; and number of work hours requested off to attend the visit. Lastly, patients were surveyed on whether they prefer to receive dermatologic care at Tufts, to receive in-person care elsewhere, to use teledermatology, or none of the above.
Statistical Analysis
Total time attributed to the visit was the sum of time for round-trip travel to and from the clinic, wait time, and face-to-face time with care providers. Out-of-pocket patient expenses included round-trip travel expenses, child care expenses, and direct payments such as deductibles and co-pays. Opportunity cost for employed patients was calculated as the patient’s average hourly wage multiplied by either the number of hours taken off from work or the number of hours the patient attributed to the visit, whichever value was higher at the individual level. For the purpose of calculating opportunity costs, travel time, wait time, and face-to-face time were imputed using average values for these variables when not reported. Patients could provide exact hourly wage and annual income or select the closest approximation from 10 wage ranges. For patients who selected a wage range, the midpoint of the range was used as the hourly wage. Total costs were the sum of reported out-of-pocket expenses and calculated opportunity costs. For unemployed patients and those who did not report employment status, hourly wage was assumed to be $0, resulting in opportunity costs of $0. Costs are tabulated for individual patients and analyzed in aggregate.
Differences in patient characteristics between those who preferred their current care provider versus those who preferred to seek care elsewhere or via teledermatology were compared using the χ2 and Student t test. A multivariate logistic regression was then performed to identify predictors of patient preference for their current provider. Potential predictors for regression model were time and cost variables as well as factors selected based on results from bivariate analysis. Data analysis was performed using statistical software.
Results
Demographics
Demographic data for respondents are outlined in Table 1. Of 145 patients who completed the survey, the majority had already seen a dermatologist for their presenting condition (87.4%), and were English speaking (96.5%), white (76.6%), employed (59.4%), and male (50.3%), with a mean age (SD) of 52.3 (18.1) years and education level of 4-year university or higher (64.7%). The most common reasons for dermatology clinic attendance were general skin checks (30.8%) and psoriasis (26.6%). A smaller proportion of patients (16.1%) presented for surgical visits. Other less common conditions that brought patients into the clinic included acne (6.3%), eczema (4.9%), and skin rash (2.8%).
The mean (SD) reported hourly wage of employed patients was $36.60 (15.8). The most common reasons for unemployment were retirement (65.5% [38/58]), disability (10.3% [6/58]), and schooling (10.3% [6/58]).
Time Attributed to Attending Dermatology Clinic Visits
Time costs are reported in Table 2. Patients traveled to the clinic mainly by car (56.5% [78/138]) or train/subway (25.3% [35/138]). One in approximately 5 patients (21.3%) spent more than 1 hour traveling one-way to the clinic. Most patients waited less than 20 minutes to see their care providers. Face-to-face time with providers (ie, residents and attending physicians) ranged from less than 21 minutes to more than 1 hour, with a mean (SD) time of 36.8 (18.9) minutes.
Of the employed respondents, 76.5% (65/85) took off time from work for the appointment. Patients took a mean (SD) of 4.1 (2.4) hours off from work, which was considered sick pay (35%), paid time off (36.6%), or unpaid time (28.3%). The total mean (SD) time dedicated to attending the clinic appointment averaged 144.8 (60.47) minutes. On average, the time spent traveling for the clinic visit was double the amount of time spent with the care provider (77.4 vs 36.8 minutes).
Monetary and Opportunity Costs
The mean (SD) monetary cost associated with clinic attendance for employed patients who reported their wages was $187.50 (103.2)(range, $37.50–$489), most of which was opportunity cost from loss of potential work income (mean [SD], $144.30 [93.6]; range, $27–$432)(Table 3). Similar total and opportunity costs were found for employed patients using the imputed average wage. The mean (SD) total cost per visit for unemployed patients or those who did not report employment status was $38.65 (103.6)(range, $0–$800), which was 4-times less than the cost per visit for employed patients. Mean (SD) and median one-way travel expenses were $16.60 (40.5) and $10, respectively. Mean (SD) and median reported costs for deductibles/co-pays were $44.20 (66.1) and $25, respectively. Only 2 patients reported child care costs, which were valued at $65 and $75.
Patient Provider Preference
The majority (59.3% [67/113]) of patients preferred their current care providers, whereas 33.6% (38/113) preferred providers closer to work, home, or in a different unspecified setting. Only 7.0% (8/113) of patients who answered this survey question would choose teledermatology over their current providers.
On multivariate logistic regression (Table 4), patients who had additional out-of-pocket costs were significantly less likely to prefer their current care provider compared to patients with no out-of-pocket costs (odds ratio [OR], 0.27; 95% confidence interval [CI], 0.10-0.71; P<.05). Opportunity costs were not a significant predictor of provider preference. For every minute the travel time increased, the likelihood of preference for the current care provider decreased by 2% (OR, 0.98; 95% CI, 0.95–0.99), and patients who traveled 60 minutes or more round-trip were 71% less likely to choose current provider care than those who traveled less than 60 minutes (OR, 0.29; 95% CI, 0.09-0.96; P<.05). Patients with higher education (≥4 years of college) were 3.29-times more likely to stay with their current care provider than those with lower education (≤2 years of college). Those presenting for skin checks also preferred the current provider more than those with noninflammatory skin conditions such as alopecia and warts (OR, 9.01; 95% CI, 2.28-35.59). Age and gender were not statistically significant predictors of patient provider preference.
Comment
Our study revealed that patients spend a substantial amount of time and money attending dermatology clinic appointments. Round-trip travel time exceeded 2 hours for 20% of patients and accounted for the majority of the total time attributed to the visit. Patients who were employed typically requested an average of 4 hours off from work, resulting in a mean (SD) opportunity cost of $144.30 (93.6) due to lost wages. Direct costs such as co-pays, deductibles, travel expenses, and child care accounted for a smaller proportion of total costs. The study assumed a wage of $0 for unemployed patients, thus underestimating the true costs of the visit for these patients whose time may otherwise have been spent on leisure, education, volunteerism, or other activities that contribute to individual and societal productivity. The total costs for unemployed patients reflected only direct costs, and thus were notably lower than those for employed patients.
Direct out-of-pocket costs and travel time negatively impacted provider preference. Patients with out-of-pocket costs were much less likely to stay with their current care provider (OR, 0.27; 95% CI, 0.10-0.71), preferring to seek care closer to home/work or teledermatology services. Similarly, for each minute that travel time increased, preference for current care provider decreased by 2%. Those who traveled 60 minutes or more were 71% less likely than those who traveled less than 60 minutes to stay with their current provider when given other options for care. Opportunity costs did not affect provider preference, even though they far exceeded direct costs for employed patients. Perhaps opportunity costs are not as immediately apparent to patients as out-of-pocket costs and travel time, and thus they do not factor as heavily in provider preference.
Despite high time and monetary costs, the majority of patients (60%) still preferred their current care provider, especially those with 4-year university degrees or higher education level (OR, 3.29; 95% CI, 1.23-5.26) and those presenting for skin checks (OR, 9.01; 95% CI, 2.28-35.59). Patients with higher levels of education likely have higher incomes and thus may not be as adversely affected by direct and/or indirect visit costs. Patients presenting for skin checks may value continuity and prefer providers with whom they already have an established therapeutic relationship. Future studies are needed to analyze the impact of these nonmonetary factors on provider preference.
Seeking Alternative Care
Tufts Medical Center does not have satellite dermatology clinics, making it the only option for patients who wish to receive care within the Tufts hospital network. However, patients do have the option of visiting non–Tufts-affiliated dermatology clinics outside of the city. To our knowledge, no formal studies have been performed comparing wait times for dermatology appointments in suburban versus urban Boston areas; however, it has been reported that rural practitioners have longer wait times than urban dermatologists, possibly due to the fact that physicians tend to aggregate in metropolitan areas.2 Thus, the potential for shorter wait times in the Boston metropolitan area may make it a more desirable location to receive care compared to more suburban or even rural areas of Massachusetts, but additional data are needed to substantiate this hypothesis. Additionally, health insurance restrictions, refractory or complex dermatologic conditions, and referring providers’ preference may affect patients’ decisions to seek care at a particular clinic. However, these factors do not alter our finding that those who travel long distances to our dermatology clinic are less likely to stay with their current provider if given the choice to seek care closer to home/work or utilize teledermatology services.
Prior studies have demonstrated patient preference and willingness to accept alternative modes of care delivery to reduce time and monetary costs associated with in-person medical visits.7,8 Dermatology patients at a clinic in Ontario, Canada, considered the time they spent attending the clinic to be even more burdensome than the monetary cost.7 Patients with nondermatologic chronic diseases and high out-of-pocket costs would prefer email rather than a clinic visit as the first method of contact with care providers.8 The explosive growth of direct-to-consumer (DTC) teledermatology services in the last 10 years speaks to patient demand for alternative care delivery that saves time and money. Although telemedicine has been implemented in various specialties, including ophthalmology and neurology, one of the most common applications is teledermatology. With DTC teledermatology, patients can take photographs or videos using personal smartphones and communicate directly with care providers using mobile or online applications. More recent review articles have identified 22 to 29 DTC mobile and web-based teledermatology services, with costs varying from $0 to $250.9-11 The median consultation fee of $59 for DTC teledermatology services is substantially less than total visit costs for employed patients in our study.9 Teledermatology has become an accessible and affordable modality of care, though perhaps not yet fully optimized for quality of care.
With increasingly higher co-pays and high-deductible insurance plans, time and monetary factors play increasingly important roles in patient preference for specialty care providers,12 as demonstrated by our study. Dermatologists can work with patients to reduce the costs of medical visits. Perhaps monitoring of chronic but stable conditions can be accomplished through telecommunication to reduce the number of follow-up visits. For instance, psoriasis patients enrolled in telemonitoring perceived savings of time and expenses through reduction of clinic visits, resulting in high patient satisfaction levels.13 Telephone calls and secure email messaging are other feasible alternatives shown to aid in clinical management and decrease the need for in-person care.8,14 Fewer unnecessary follow-up visits also means more availability for new patients and those with acute needs.
Barriers to obtaining care are not limited to dermatology and are pervasive across most medical specialties. Issues of patient time burden and out-of-pocket expenses are reflected in recent reports focused on quantifying these costs throughout ambulatory care visits and services such as colorectal, cervical, and breast cancer screenings.1,15-18 Similar to our findings, many of these studies also show high time and opportunity costs from the patient perspective. Expansion of telemedicine to reduce patient costs is becoming a viable option for many specialists, though low reimbursement rates restrict its widespread application.9,19 However, this obstacle is not impossible to surmount. One study found that offering teledermatology to Medicaid patients through their primary care providers significantly improved access, allowing for a 63.8% increase in the number of patients visiting a dermatologist (P<.01).20 Currently, a total of 48 state Medicaid programs now cover telemedicine, and a growing number of states are requiring private insurers to cover telehealth services.21 As more dermatologists adopt telemedicine practices, it may allow for better access as well as expanded insurance coverage.
Limitations
The results of our study are limited by the single-institution survey design. Patients were asked to complete the survey while still at the clinic visit to minimize recall bias. Because these patients actually attended their appointments, they might perceive the time and monetary costs associated with the visit to be less problematic than those who canceled their appointments or transferred care elsewhere; however, we were still able to detect a significant impact of time and monetary costs on provider preference in this cohort (P<.05). Larger studies in different geographic settings and other specialty clinics are needed to confirm our findings and to determine if nonmonetary factors such as specific diagnoses, length of time with a certain care provider, or patient socioeconomic status can modulate the impact of time and monetary costs on provider preference.
Conclusion
This study showed that patients expend a substantial amount of time and monetary costs to attend dermatology clinic visits. Data from the current and prior studies suggest that these costs affect patient provider preference for dermatologic care and may pose barriers to necessary medical care. Recognizing direct and indirect patient costs may drive critical changes in health care delivery, such as increased telecommunication utilization, the more cost-saving alternative. Telemedicine, when integrated appropriately, can help minimize expenses for patients while continuing to maintain a high level of care.
- Ray KN, Chari AV, Engberg J, et al. Opportunity costs of ambulatory medical care in the United States. Am J Manag Care. 2015;21:567-574.
- Kimball AB, Resneck JS Jr. The US dermatology workforce: a specialty remains in shortage. J Am Acad Dermatol. 2008;59:741-745.
- Resneck JS Jr, Lipton S, Pletcher MJ. Short wait times for patients seeking cosmetic botulinum toxin appointments with dermatologists. J Am Acad Dermatol. 2007;57:985-989.
- Physician appointment wait times & Medicaid and Medicare acceptance rates. Merritt Hawkins website. https://www.merritthawkins.com/2014-survey/patientwaittime.aspx. Accessed February 15, 2017.
- Machlin SR, Adams SA. Expenses for office-based physician visits by specialty, 2013. Agency for Healthcare Research and Quality website. https://meps.ahrq.gov/data_files/publications/st484/stat484.pdf. Published November 2015. Accessed February 15, 2017.
- National ambulatory medical care survey: 2012 state and national summary tables. CDC website. www.cdc.gov/nchs/data/ahcd/namcs_summary/2012_namcs_web_tables.pdf. Accessed February 15, 2017.
- Vignjevic PM, Hux JE, Fisher BK, et al. Monetary and nonmonetary costs to patients attending an ambulatory dermatology clinic. J Cutan Med Surg. 1999;3:188-192.
- Reed M, Graetz I, Gordon N, Fung V. Patient-initiated e-mails to providers: associations with out-of-pocket visit costs, and impact on care-seeking and health. Am J Manag Care. 2015;21:E632-E639.
- Peart JM, Kovarik C. Direct-to-patient teledermatology practices. J Am Acad Dermatol. 2015;72:907-909.
- Fogel AL, Sarin KY. A survey of direct-to-consumer teledermatology services available to US patients: explosive growth, opportunities and controversy. J Telemed Telecare. 2017;23:19-25.
- Kochmann M, Locatis C. Direct to consumer mobile teledermatology apps: an exploratory study. Telemed J E Health. 2016;22:689-693.
- Helms AD. High-deductible health plans can ruin finances. Kaiser Health News website. https://khn.org/news/high-deductible-health-plans-can-ruin-finances/. Published April 6, 2015. Accessed February 15, 2017.
- Fruhauf J, Schwantzer G, Ambros-Rudolph CM, et al. Pilot study on the acceptance of mobile teledermatology for the home monitoring of high-need patients with psoriasis. Australas J Dermatol. 2012;53:41-46.
- Eisenberg D, Hwa K, Wren SM. Telephone follow-up by a midlevel provider after laparoscopic inguinal hernia repair instead of face-to-face clinic visit. JSLS. 2015;19:e2014.00205.
- Yabroff KR, Guy GP Jr, Ekwueme DU, et al. Annual patient time costs associated with medical care among cancer survivors in the United States. Med Care. 2014;52:594-601.
- Yabroff KR, Davis WW, Lamont EB, et al. Patient time costs associated with cancer care. J Natl Cancer Inst. 2007;99:14-23.
- Jonas DE, Russell LB, Sandler RS, et al. Value of patient time invested in the colonoscopy screening process: time requirements for colonoscopy study. Med Decis Making. 2008;28:56-65.
- Shireman TI, Tsevat J, Goldie SJ. Time costs associated with cervical cancer screening. Int J Technol Assess Health Care. 2001;17:146-152.
- Dorsey ER, Topol EJ. State of telehealth. N Engl J Med. 2016;375:154-161.
- Uscher-Pines L, Malsberger R, Burgette L, et al. Effect of teledermatology on access to dermatology care among Medicaid enrollees. JAMA Dermatol. 2016;152:905-912.
- Thomas L, Capistrant G. State telemedicine gaps analysis: coverage & reimbursement. Telehealth website. http://www.mtelehealth.com/state-telemedicine-gaps-analysis-coverage-reimbursement/. Published January 19, 2016. Accessed February 15, 2017.
Practice Points
- Physicians should be cognizant of the direct and indirect costs patients are subject to when attending dermatology clinic appointments and implement changes to reduce these costs.
- Telephone calls and secure email messaging are feasible alternatives shown to aid in clinical management and decrease the need for in-person care.
- Telecommunication may be used for the monitoring of chronic but stable conditions to reduce the number of follow-up visits.

The h-Index for Associate and Full Professors of Dermatology in the United States: An Epidemiologic Study of Scholastic Production
Academic promotion requires evidence of scholastic production. The number of publications by a scientist is the most frequently reported metric of scholastic production, but it does not account for the impact of publications. The h-index is a bibliometric measure that combines both volume and impact of scientific contributions. The physicist Jorge E. Hirsch introduced this metric in 2005.1 He defined it as the number of publications (h) by an author that have been cited at least h times. For example, a scientist with 30 publications including 12 that have been cited at least 12 times each has an h-index of 12. h-Index is a superior predictor of future scientific achievement in physics compared with total citation count, total publication count, and citations per publication. Hirsch2 proposed h-index thresholds of 12 and 18 for advancement to associate professor and full professor in physics, respectively.2
h-Index values are not comparable across academic disciplines because they are influenced by the number of journals and authors within the field. Scientists in disciplines with numerous scholars and publications will have higher h-indices. For example, the mean h-index for full professors of cardiothoracic anesthesiology is 12, but the mean h-index for full professors of urology is 22.3,4 Hence, h-index thresholds for professional advancement cannot be generalized but must be calculated on a granular, specialty-specific basis.
In a prior study on h-index among academic dermatologists in the United States, John et al5 reported that fellowship-trained dermatologists had a significantly higher mean h-index than those without fellowship training (13.2 vs 11.7; P<.001). They further found the mean h-index increased with academic rank.5
In our study, we measured mean and median h-indices among associate and full professors of dermatology in academic training programs in the United States with the goal of describing h-index distributions in these 2 academic ranks. We further sought to measure regional differences in h-index between northeastern, southern, central, and western states as defined by the National Resident Matching Program.
Methods
Institutional review board approval was deferred because the study did not require patient information or participation. Using the Association of American Medical Colleges Electronic Residency Application Service website (https://www.aamc.org/services/eras/) we identified dermatology residency training programs accredited by the Accreditation Council for Graduate Medical Education and participating in the Electronic Residency Application Service for the National Resident Matching Program in the United States. We visited the official website of each residency program and identified all associate and full professors of dermatology for further study. We included all faculty members listed as professor, clinical professor, associate professor, or clinical associate professor, and excluded assistant professor, volunteer faculty, research professor, and research associate professor. All faculty held an MD degree or an equivalent degree, such as MBBS or MDCM.
We used the Thomson Reuters (now Clarivate Analytics) Web of Science to calculate h-index and publication counts. The initial search was basic using the professor’s last name and first initial. We then augmented this list by searching for all variations of each professor’s name, with or without middle initial. Each publication in the search results was confirmed as belonging to the author of interest by verifying coauthors, institution information, and subject material. For authors with common names, we additionally consulted their online university profiles for specific names used in their “Selected Publications” lists. In a minority of cases, we also limited Research Domain to “dermatology.” Referring to the verified publication list for each dermatology professor, we used the Web of Science Citation Report function to determine number of publications and h-index for the individual. We tabulated results for associate and full professors and subgrouped those results into 4 geographic regions—northeastern, southern, central, and western states—according to the map used by the National Resident Matching Program. Descriptive statistics were performed with Microsoft Excel.
Results
We identified 300 associate professors and 352 full professors from 81 academic institutions. The number of associate professors per institution ranged from 1 to 25; the number of full professors per institution ranged from 1 to 16. The median and mean h-indices for associate and full professors, including interquartile values, are shown in the Table. There was a broad range of h-index scores among both academic ranks; median and mean h-indices varied more than 5-fold between the bottom and upper quartiles in both associate and full professor cohorts. Median interquartile h-index values for upper-quartile associate professors overlapped with those of lower-quartile full professors (Figure 1). h-Index for associate and full professors was similar across the 4 regions defined by the National Resident Matching Program. Median h-index was highest for full professors in western states and lowest for associate professors in southern states (Figure 2).
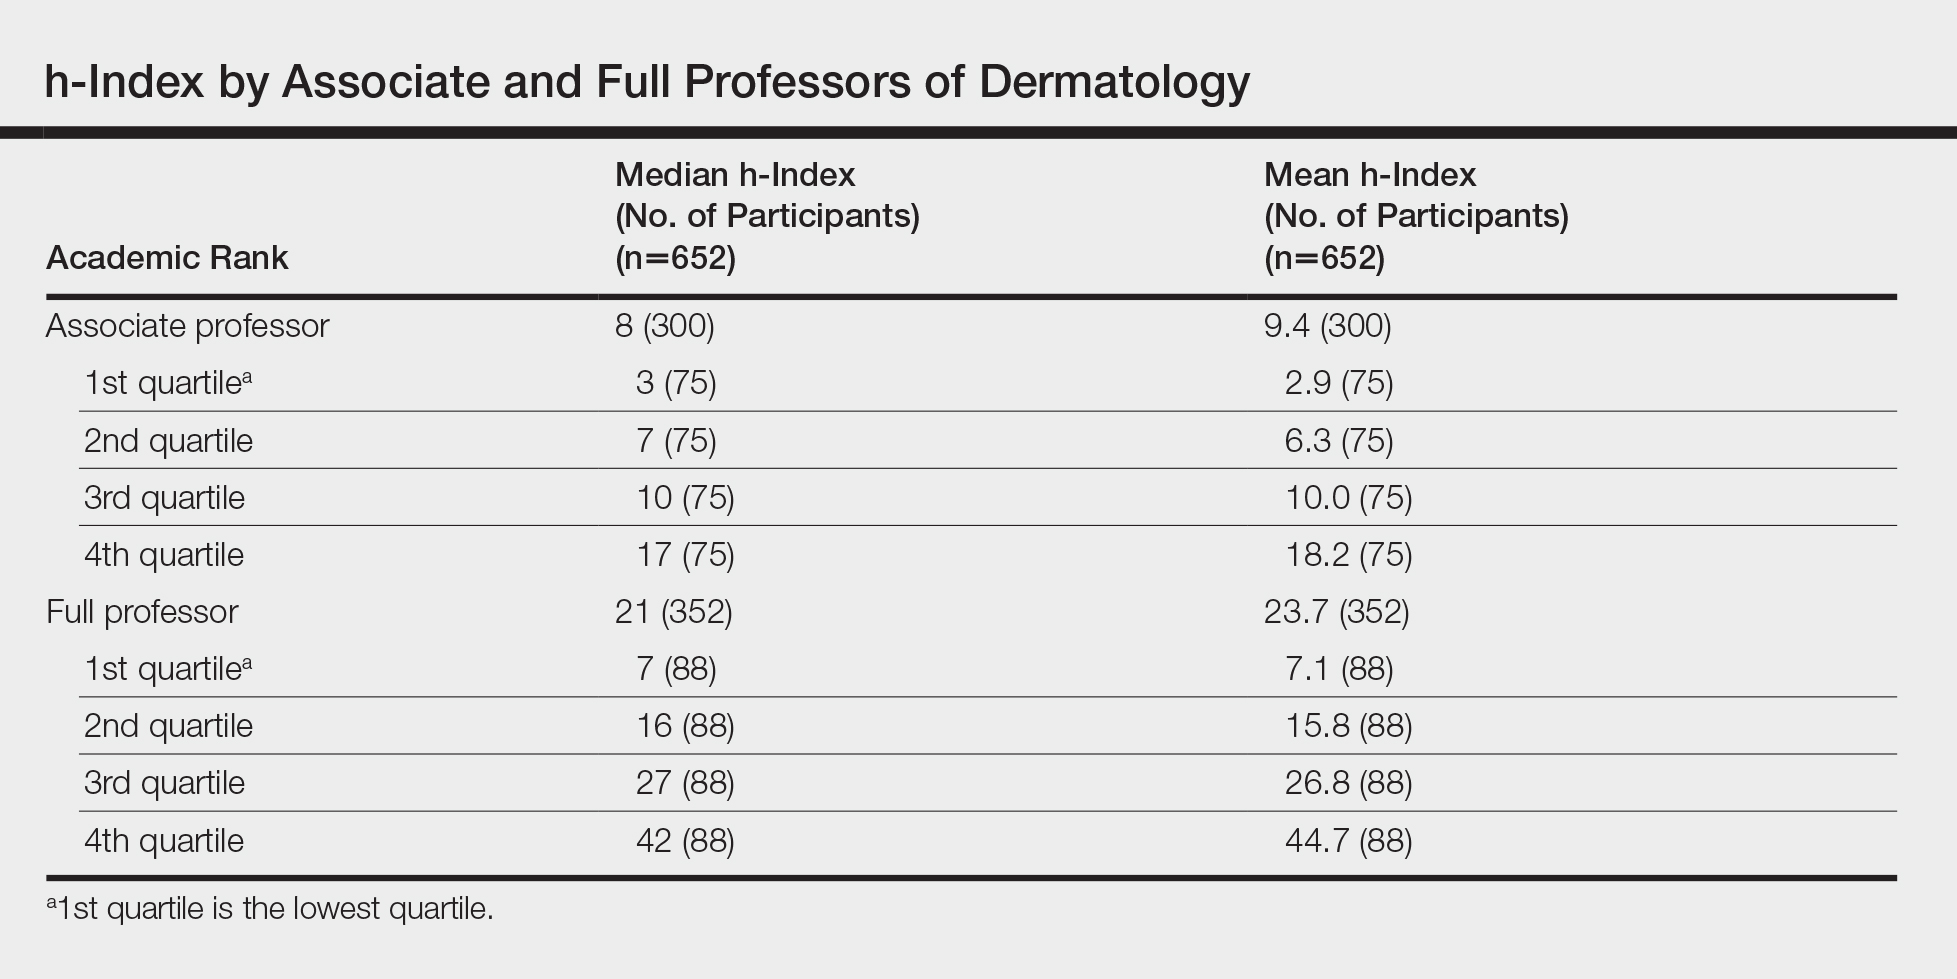
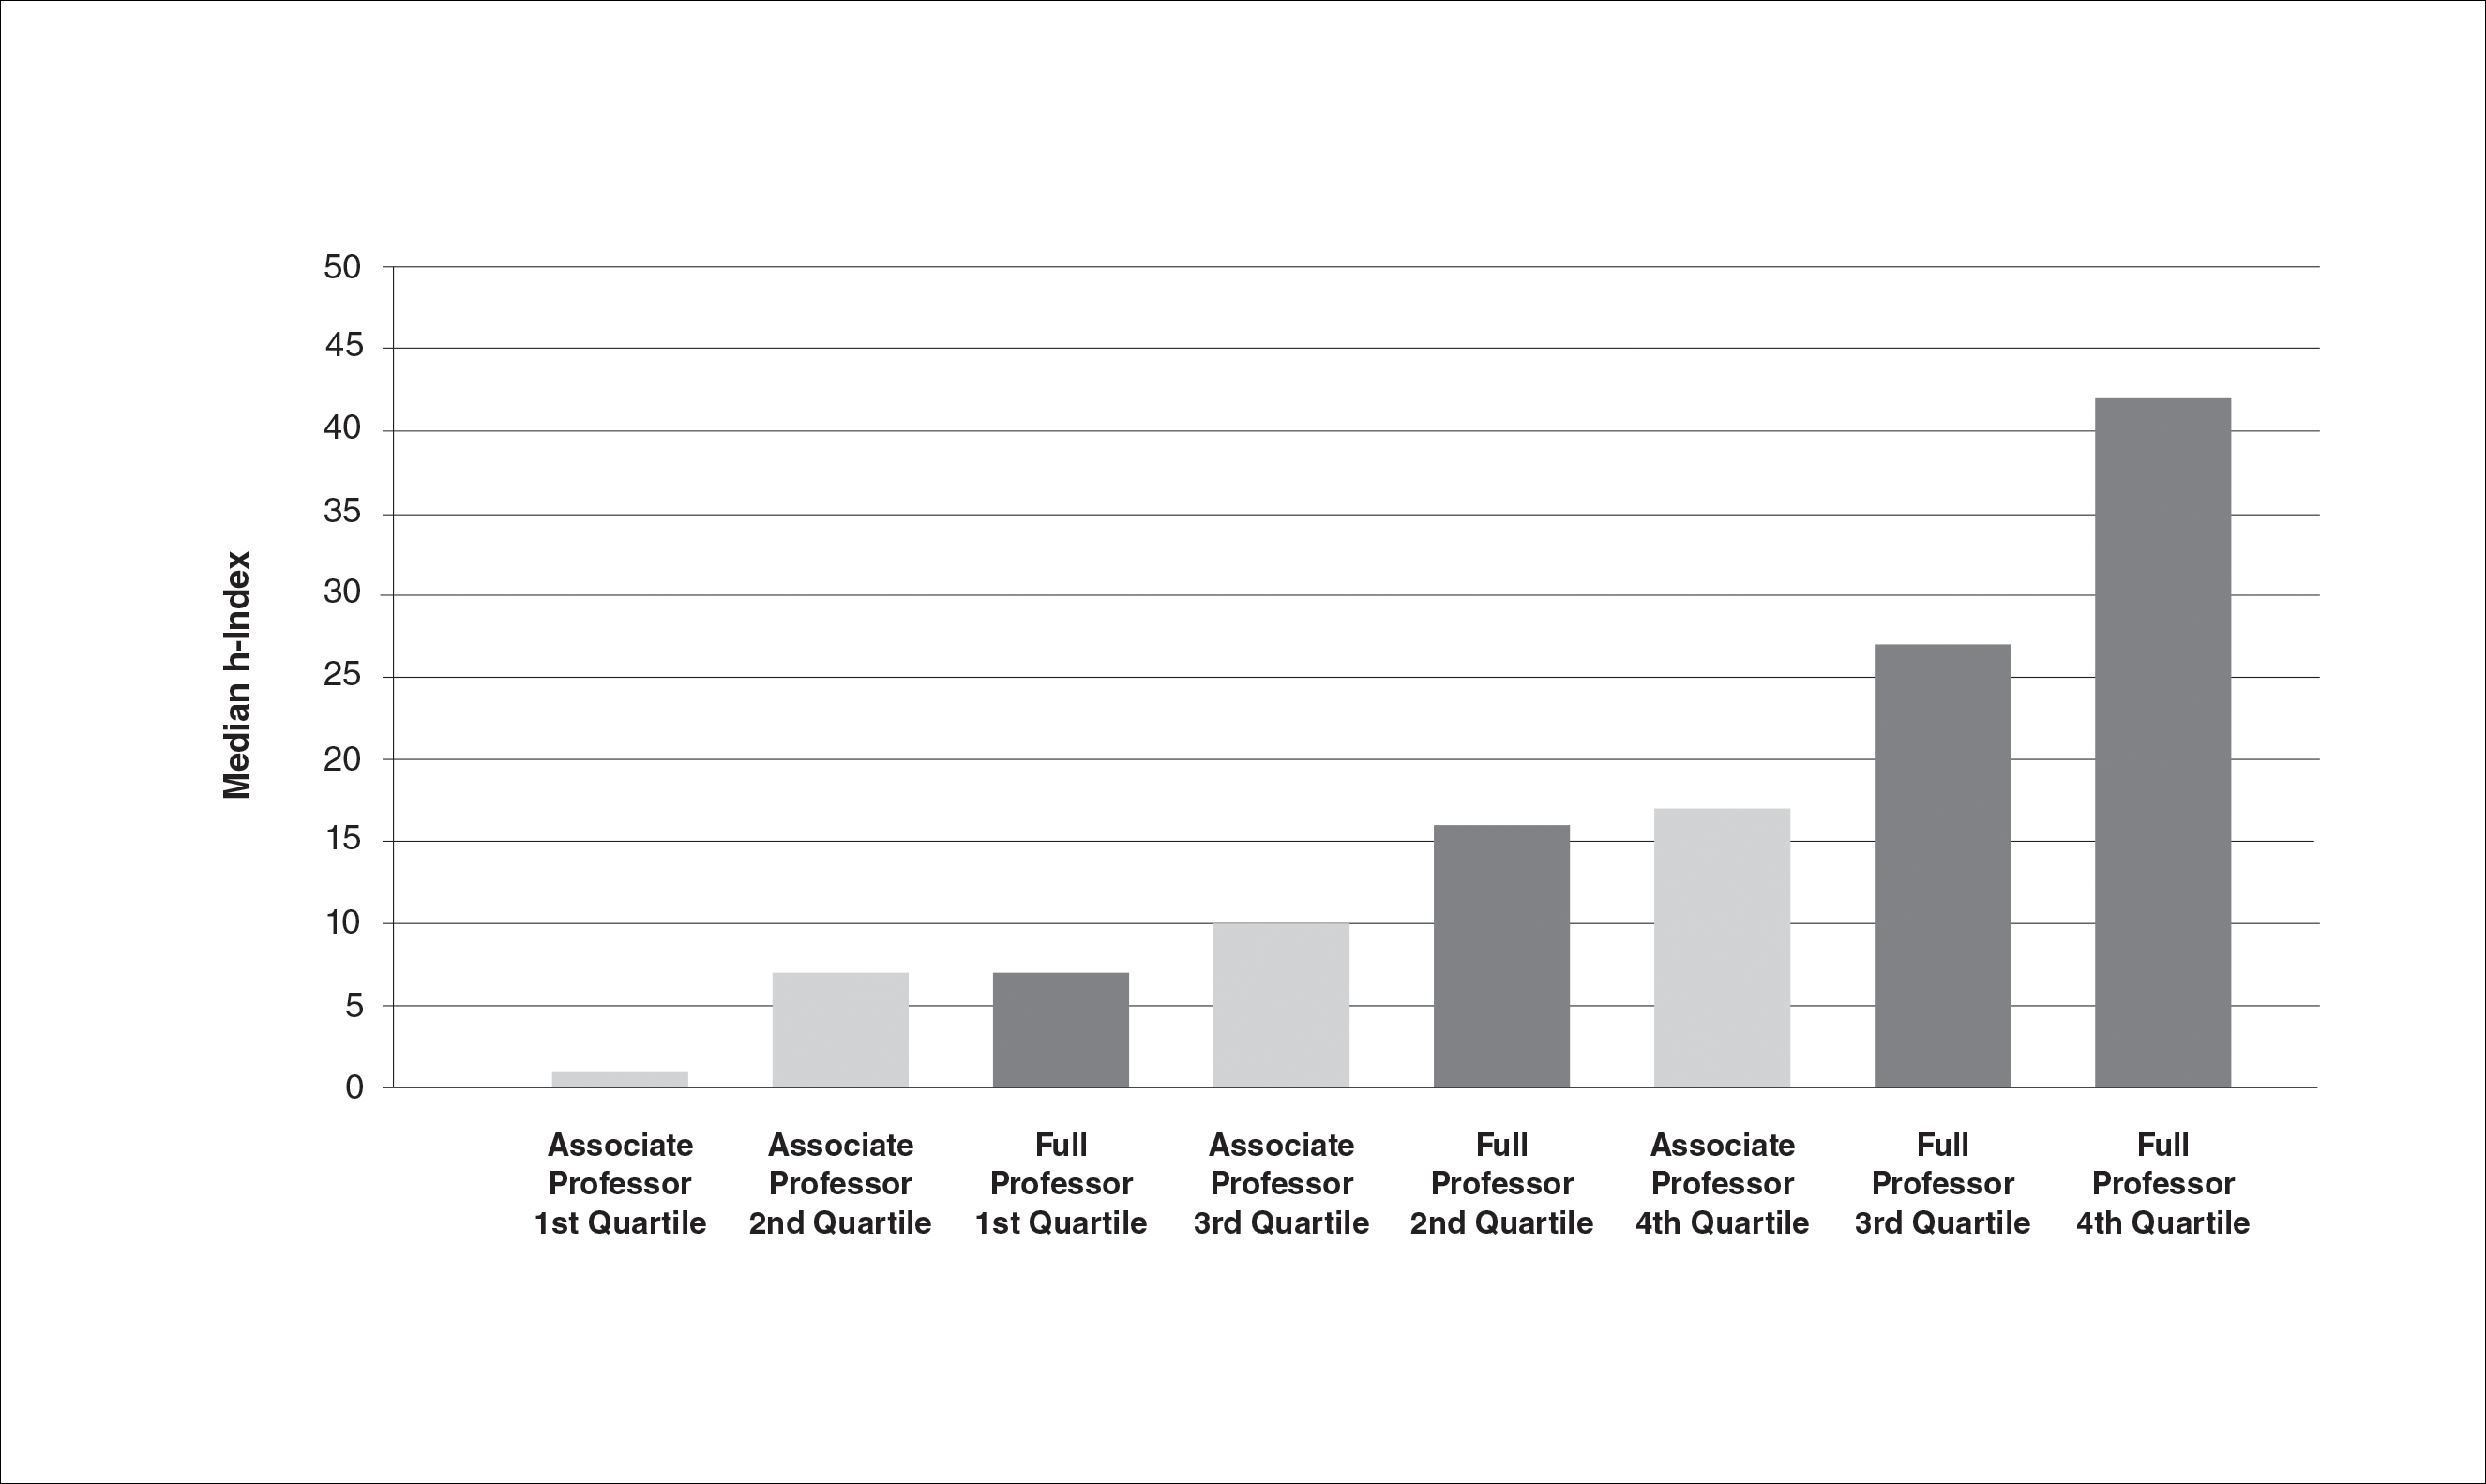

Comment
Professional advancement in academic medicine requires scholastic production. The h-index, defined as the number of publications (h) that have been cited at least h times, is a bibliometric measure that accounts for both volume and impact of an individual’s scientific productivity. The h-index would be a useful tool for determining professional advancement in academic dermatology departments. In this project, we calculated h-index values for 300 associate professors and 352 full professors of dermatology in the United States. We found the median h-index for associate professors was 8 and the median h-index for full professors was 21. There was more than a 5-fold variation in median and mean h-indices between lower and upper quartiles within both the associate and full professor cohorts. The highest median and mean h-indices were found among full professors of dermatology in western states. These results provide the opportunity for academic dermatologists and institutions to compare their research contributions with peers across the United States.
Our results support those of John et al5 who also found academic rank in dermatology was correlated with h-index. Scopus, Web of Science, and Google Scholar can be used to calculate h-index, but they may return different scores for the same individual.6 John et al5 used the Scopus database to calculate h-index. We used Web of Science because Scopus only includes citations since 1996 and Web of Science was used in the original h-index studies by Hirsch.1,2 Institutions that adopt h-index criteria for advancement and resource distribution decisions should be aware that database selection can affect h-index scores.
Caveats With the h-Index
Flaws in the h-index include inflationary effects of self-citation, time bias, and excessive coauthorship. Individuals can increase their h-index by routinely citing their own publications. However, Engqvist and Frommen7 found tripling self-citations increased the h-index by only 1.
Citations tend to increase with time, and authors who have been active for longer periods will have a higher h-index. It is more difficult for junior faculty to distinguish themselves with the h-index, as it takes time for even the most impactful publications to gain citations. Major scientific papers can take years from conception to publication, and an outstanding paper that is 1 year old would have fewer citations than an equally impactful paper that is 10 years old. To adjust for the effect of time bias, Hirsch2 proposed the m-index, in which the h-index is divided by the years between the author’s first and last publication. He proposed that an m-index of 1 would indicate a successful scientist, 2 an outstanding scientist, and 3 a unique individual.2
The literature is increasingly dominated by teams of coauthors, and the number of coauthors within each team has increased over the last 5 decades.8 h-Indices will increase if this trend continues, making it difficult to compare h-indices between different eras. Prosperi et al9 found national differences in kinship-based coauthorship, suggesting nepotism may influence decisions in assigning authorship status. h-Index valuations do not require evidence of meaningful contribution to the work but simply rely on contributors’ self-governance in assigning authorship status.
The h-index also has a bias against highly cited papers. A scientist with a small number of highly influential papers may have a smaller h-index than a scientist with more papers of modest impact. Finally, an author who has changed names (eg, due to marriage) may have an artificially low h-index, as a standard database search would miss publications under a maiden name.
Limitations
This study is limited by possible operator error when compiling each author’s publication list through Web of Science. Our search and refinement methodology took into account that authors may publish with slight variations in name, in various subject areas and fields, and with different institutions and coauthors. Each publication populated through Web of Science was carefully verified by the principal investigator; however, overestimation or underestimation of the number of publications and citations was possible, as the publication lists were not verified by the studied associate and full professors themselves. Our results are consistent with the h-index bar charts published by John et al5 using an alternate citation index, Scopus, which tends to corroborate our findings. This study also is limited by possible time bias because we did not correct the h-index for years of active publication (m-index).
Conclusion
In summary, we found the median h-index for associate professors was 8 and the median h-index for full professors was 21. We found a broad range of h-index values within each academic rank. h-Index for upper-quartile associate professors overlapped with those of lower-quartile full professors. Our results suggest professional advancement occurs over a broad range of scholastic production. Adopting requirements for minimum h-index thresholds for application for promotion might reduce disparities between rank and scientific contributions. We encourage use of the h-index for tracking academic progression and as a parameter to consider in academic promotion.
- Hirsch JE. An index to quantify an individual’s scientific research output. Proc Natl Acad Sci U S A. 2005;102:16569-16572.
- Hirsch JE. Does the H index have predictive power? Proc Natl Acad Sci U S A. 2007;104:19193-19198.
- Pagel PS, Hudetz JA. Scholarly productivity of United States academic cardiothoracic anesthesiologists: influence of fellowship accreditation and transesophageal echocardiographic credentials on h-index and other citation bibliometrics. J Cardiothorac Vasc Anesthesia. 2011;25:761-765.
- Benway BM, Kalidas P, Cabello JM, et al. Does citation analysis reveal association between h-index and academic rank in urology? Urology. 2009;74:30-33.
- John AM, Gupta AB, John ES, et al. The impact of fellowship training on scholarly productivity in academic dermatology. Cutis. 2016;97:353-358.
- Kulkarni AV, Aziz B, Shams I, et al. Comparisons of citations in Web of Science, Scopus, and Google Scholar for articles published in general medical journals. JAMA. 2009;302:1092-1096.
- Engqvist L, Frommen JG. The h-index and self-citations. Trends Ecol Evol. 2008;23:250-252.
- Wuchty S, Jones BF, Uzzi B. The increasing dominance of teams in production of knowledge. Science. 2007;316:1036-1039.
- Prosperi M, Buchan I, Fanti I, et al. Kin of coauthorship in five decades of health science literature. Proc Natl Acad Sci U S A. 2016;113:8957-8962.
Academic promotion requires evidence of scholastic production. The number of publications by a scientist is the most frequently reported metric of scholastic production, but it does not account for the impact of publications. The h-index is a bibliometric measure that combines both volume and impact of scientific contributions. The physicist Jorge E. Hirsch introduced this metric in 2005.1 He defined it as the number of publications (h) by an author that have been cited at least h times. For example, a scientist with 30 publications including 12 that have been cited at least 12 times each has an h-index of 12. h-Index is a superior predictor of future scientific achievement in physics compared with total citation count, total publication count, and citations per publication. Hirsch2 proposed h-index thresholds of 12 and 18 for advancement to associate professor and full professor in physics, respectively.2
h-Index values are not comparable across academic disciplines because they are influenced by the number of journals and authors within the field. Scientists in disciplines with numerous scholars and publications will have higher h-indices. For example, the mean h-index for full professors of cardiothoracic anesthesiology is 12, but the mean h-index for full professors of urology is 22.3,4 Hence, h-index thresholds for professional advancement cannot be generalized but must be calculated on a granular, specialty-specific basis.
In a prior study on h-index among academic dermatologists in the United States, John et al5 reported that fellowship-trained dermatologists had a significantly higher mean h-index than those without fellowship training (13.2 vs 11.7; P<.001). They further found the mean h-index increased with academic rank.5
In our study, we measured mean and median h-indices among associate and full professors of dermatology in academic training programs in the United States with the goal of describing h-index distributions in these 2 academic ranks. We further sought to measure regional differences in h-index between northeastern, southern, central, and western states as defined by the National Resident Matching Program.
Methods
Institutional review board approval was deferred because the study did not require patient information or participation. Using the Association of American Medical Colleges Electronic Residency Application Service website (https://www.aamc.org/services/eras/) we identified dermatology residency training programs accredited by the Accreditation Council for Graduate Medical Education and participating in the Electronic Residency Application Service for the National Resident Matching Program in the United States. We visited the official website of each residency program and identified all associate and full professors of dermatology for further study. We included all faculty members listed as professor, clinical professor, associate professor, or clinical associate professor, and excluded assistant professor, volunteer faculty, research professor, and research associate professor. All faculty held an MD degree or an equivalent degree, such as MBBS or MDCM.
We used the Thomson Reuters (now Clarivate Analytics) Web of Science to calculate h-index and publication counts. The initial search was basic using the professor’s last name and first initial. We then augmented this list by searching for all variations of each professor’s name, with or without middle initial. Each publication in the search results was confirmed as belonging to the author of interest by verifying coauthors, institution information, and subject material. For authors with common names, we additionally consulted their online university profiles for specific names used in their “Selected Publications” lists. In a minority of cases, we also limited Research Domain to “dermatology.” Referring to the verified publication list for each dermatology professor, we used the Web of Science Citation Report function to determine number of publications and h-index for the individual. We tabulated results for associate and full professors and subgrouped those results into 4 geographic regions—northeastern, southern, central, and western states—according to the map used by the National Resident Matching Program. Descriptive statistics were performed with Microsoft Excel.
Results
We identified 300 associate professors and 352 full professors from 81 academic institutions. The number of associate professors per institution ranged from 1 to 25; the number of full professors per institution ranged from 1 to 16. The median and mean h-indices for associate and full professors, including interquartile values, are shown in the Table. There was a broad range of h-index scores among both academic ranks; median and mean h-indices varied more than 5-fold between the bottom and upper quartiles in both associate and full professor cohorts. Median interquartile h-index values for upper-quartile associate professors overlapped with those of lower-quartile full professors (Figure 1). h-Index for associate and full professors was similar across the 4 regions defined by the National Resident Matching Program. Median h-index was highest for full professors in western states and lowest for associate professors in southern states (Figure 2).
Comment
Professional advancement in academic medicine requires scholastic production. The h-index, defined as the number of publications (h) that have been cited at least h times, is a bibliometric measure that accounts for both volume and impact of an individual’s scientific productivity. The h-index would be a useful tool for determining professional advancement in academic dermatology departments. In this project, we calculated h-index values for 300 associate professors and 352 full professors of dermatology in the United States. We found the median h-index for associate professors was 8 and the median h-index for full professors was 21. There was more than a 5-fold variation in median and mean h-indices between lower and upper quartiles within both the associate and full professor cohorts. The highest median and mean h-indices were found among full professors of dermatology in western states. These results provide the opportunity for academic dermatologists and institutions to compare their research contributions with peers across the United States.
Our results support those of John et al5 who also found academic rank in dermatology was correlated with h-index. Scopus, Web of Science, and Google Scholar can be used to calculate h-index, but they may return different scores for the same individual.6 John et al5 used the Scopus database to calculate h-index. We used Web of Science because Scopus only includes citations since 1996 and Web of Science was used in the original h-index studies by Hirsch.1,2 Institutions that adopt h-index criteria for advancement and resource distribution decisions should be aware that database selection can affect h-index scores.
Caveats With the h-Index
Flaws in the h-index include inflationary effects of self-citation, time bias, and excessive coauthorship. Individuals can increase their h-index by routinely citing their own publications. However, Engqvist and Frommen7 found tripling self-citations increased the h-index by only 1.
Citations tend to increase with time, and authors who have been active for longer periods will have a higher h-index. It is more difficult for junior faculty to distinguish themselves with the h-index, as it takes time for even the most impactful publications to gain citations. Major scientific papers can take years from conception to publication, and an outstanding paper that is 1 year old would have fewer citations than an equally impactful paper that is 10 years old. To adjust for the effect of time bias, Hirsch2 proposed the m-index, in which the h-index is divided by the years between the author’s first and last publication. He proposed that an m-index of 1 would indicate a successful scientist, 2 an outstanding scientist, and 3 a unique individual.2
The literature is increasingly dominated by teams of coauthors, and the number of coauthors within each team has increased over the last 5 decades.8 h-Indices will increase if this trend continues, making it difficult to compare h-indices between different eras. Prosperi et al9 found national differences in kinship-based coauthorship, suggesting nepotism may influence decisions in assigning authorship status. h-Index valuations do not require evidence of meaningful contribution to the work but simply rely on contributors’ self-governance in assigning authorship status.
The h-index also has a bias against highly cited papers. A scientist with a small number of highly influential papers may have a smaller h-index than a scientist with more papers of modest impact. Finally, an author who has changed names (eg, due to marriage) may have an artificially low h-index, as a standard database search would miss publications under a maiden name.
Limitations
This study is limited by possible operator error when compiling each author’s publication list through Web of Science. Our search and refinement methodology took into account that authors may publish with slight variations in name, in various subject areas and fields, and with different institutions and coauthors. Each publication populated through Web of Science was carefully verified by the principal investigator; however, overestimation or underestimation of the number of publications and citations was possible, as the publication lists were not verified by the studied associate and full professors themselves. Our results are consistent with the h-index bar charts published by John et al5 using an alternate citation index, Scopus, which tends to corroborate our findings. This study also is limited by possible time bias because we did not correct the h-index for years of active publication (m-index).
Conclusion
In summary, we found the median h-index for associate professors was 8 and the median h-index for full professors was 21. We found a broad range of h-index values within each academic rank. h-Index for upper-quartile associate professors overlapped with those of lower-quartile full professors. Our results suggest professional advancement occurs over a broad range of scholastic production. Adopting requirements for minimum h-index thresholds for application for promotion might reduce disparities between rank and scientific contributions. We encourage use of the h-index for tracking academic progression and as a parameter to consider in academic promotion.
- Hirsch JE. An index to quantify an individual’s scientific research output. Proc Natl Acad Sci U S A. 2005;102:16569-16572.
- Hirsch JE. Does the H index have predictive power? Proc Natl Acad Sci U S A. 2007;104:19193-19198.
- Pagel PS, Hudetz JA. Scholarly productivity of United States academic cardiothoracic anesthesiologists: influence of fellowship accreditation and transesophageal echocardiographic credentials on h-index and other citation bibliometrics. J Cardiothorac Vasc Anesthesia. 2011;25:761-765.
- Benway BM, Kalidas P, Cabello JM, et al. Does citation analysis reveal association between h-index and academic rank in urology? Urology. 2009;74:30-33.
- John AM, Gupta AB, John ES, et al. The impact of fellowship training on scholarly productivity in academic dermatology. Cutis. 2016;97:353-358.
- Kulkarni AV, Aziz B, Shams I, et al. Comparisons of citations in Web of Science, Scopus, and Google Scholar for articles published in general medical journals. JAMA. 2009;302:1092-1096.
- Engqvist L, Frommen JG. The h-index and self-citations. Trends Ecol Evol. 2008;23:250-252.
- Wuchty S, Jones BF, Uzzi B. The increasing dominance of teams in production of knowledge. Science. 2007;316:1036-1039.
- Prosperi M, Buchan I, Fanti I, et al. Kin of coauthorship in five decades of health science literature. Proc Natl Acad Sci U S A. 2016;113:8957-8962.
Practice Points
- Promotion in academic dermatology requires evidence of scholastic production. The h-index is a bibliometric measure that combines both volume and impact of scientific contributions.
- Our study’s findings provide data-driven parameters to consider in academic promotion.
- Institutions that adopt h-index criteria for advancement and resource distribution decisions should be aware that database selection can affect h-index scores.
What’s Eating You? Head Lice (Pediculus humanus capitis)
The head louse (Pediculus humanus capitis) is a blood-sucking arthropod of the suborder Anoplura. Lice are obligate human parasites that have infested humans since antiquity. Pediculosis capitis is an infestation of the scalp by head lice. It is estimated that 6 to 12 million individuals in the United States are affected with head lice per year.1 Resistance to topical chemical pediculicides is widespread, and new agents have been developed to address this gap in care.
Characteristics of Head Lice
The head louse is a tan-gray–colored, wingless insect measuring approximately 2- to 3-mm long with 3 body segments. It has 6 legs with claws used to grasp individual hairs, and it moves by crawling; it does not fly or jump.2,3 The head louse has an elongated abdomen and a small head with short antennae and anterior piercing mouthparts (Figure 1).4 Nits are transparent, flask-shaped, 0.5- to 0.8-mm egg cases found firmly cemented to the hair shafts approximately 1 to 4 mm above the level of the scalp (Figure 2).5 The head louse resides on scalp hair and feeds off the scalp itself. Both lice and nits can be present throughout the scalp but are most commonly found in the postauricular and occipital scalp.3,4
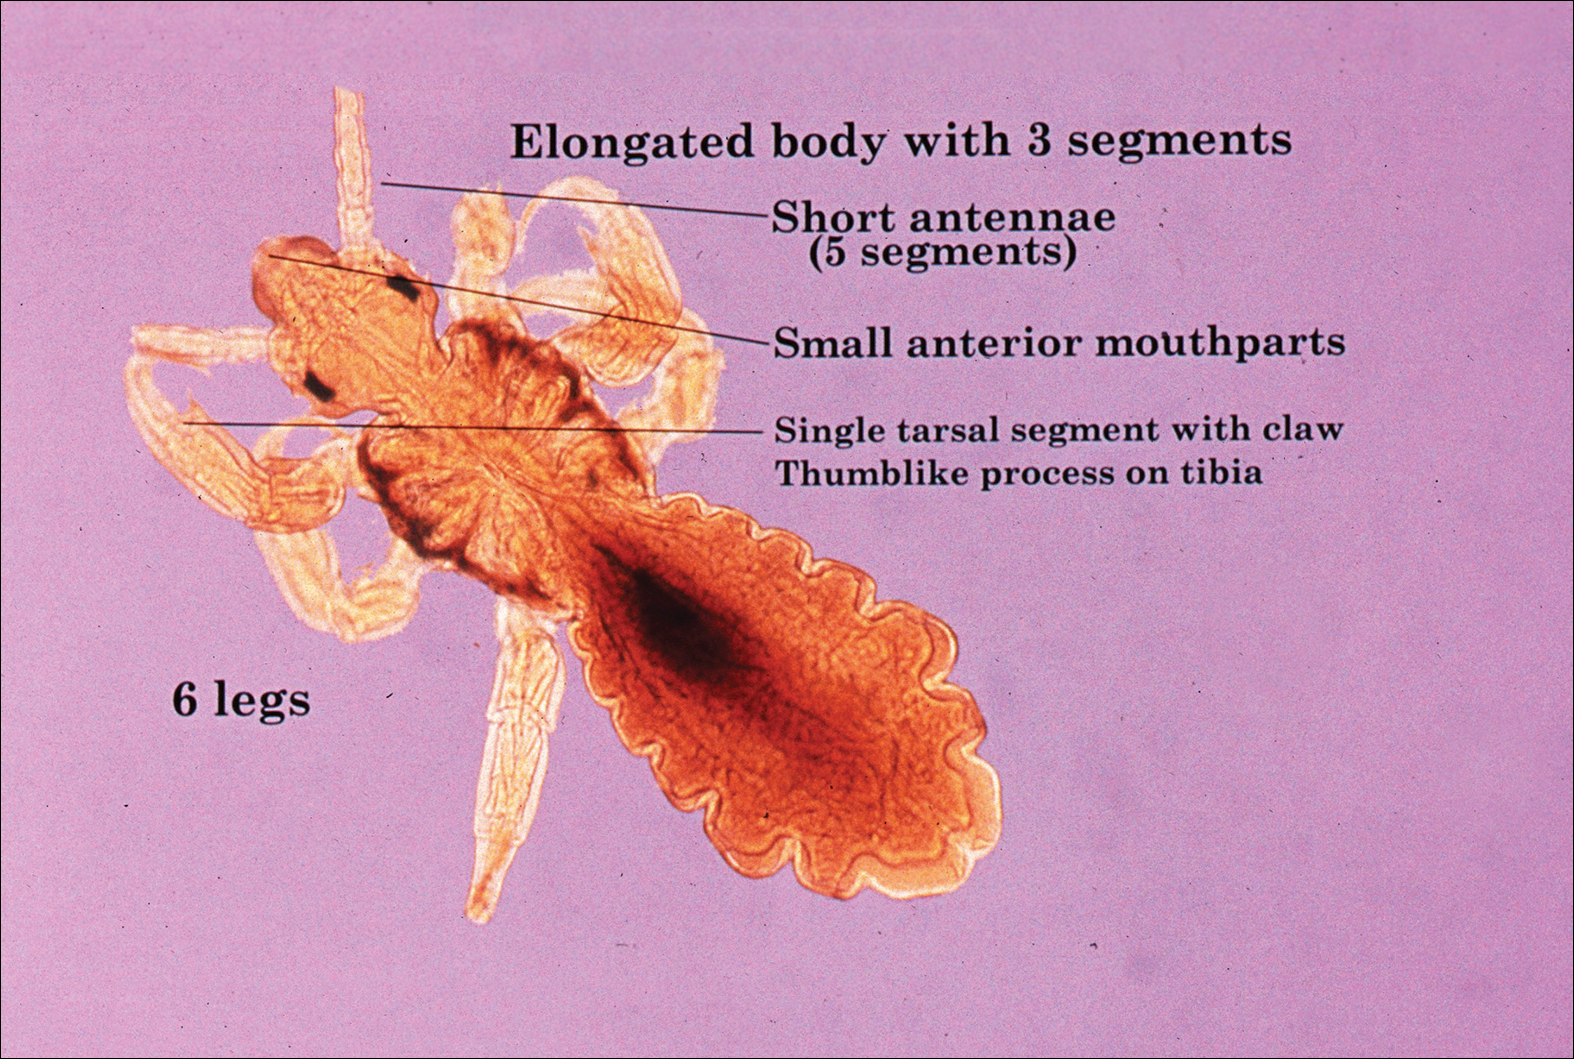
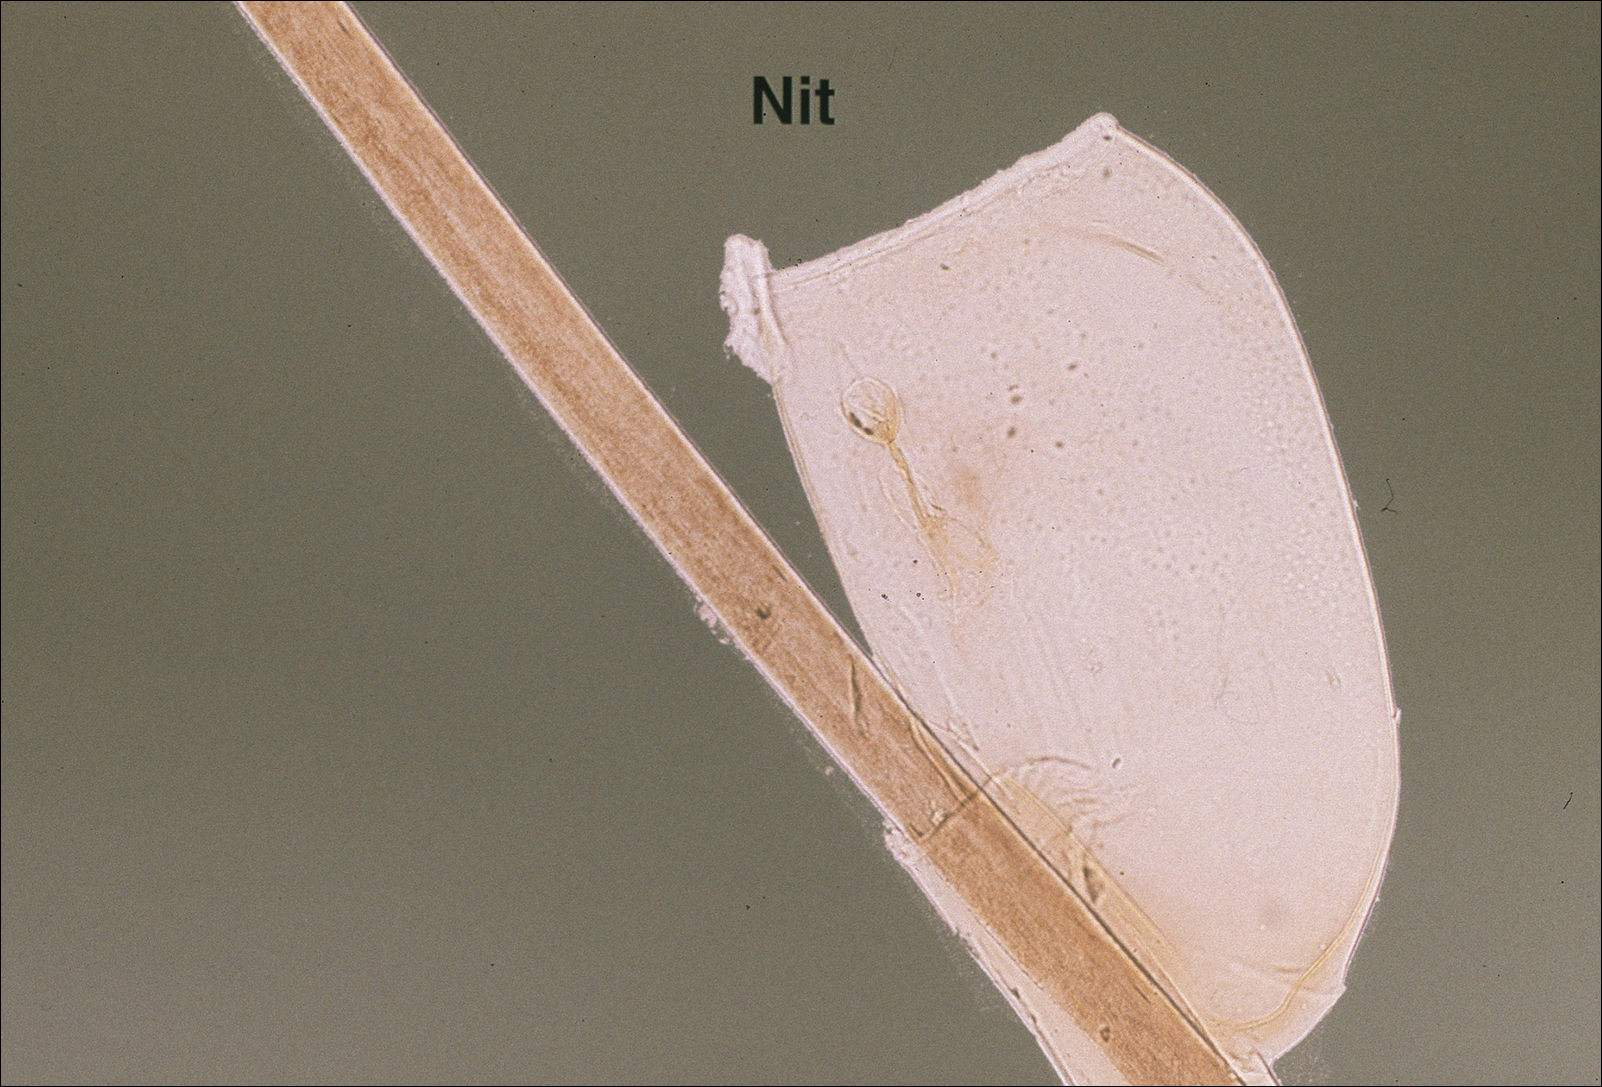
Female lice live approximately 30 days and lay 5 to 10 eggs per day. Eggs incubate individually in nits laid close to the scalp for 8 to 10 days before hatching.1,6 The newly hatched nymphs (also called instars) have multiple exoskeletons that are shed as they grow.7 Nymphs mature into adults in approximately 2 weeks, and the life cycle begins again.8 Head lice are obligate human parasites, feeding approximately every 4 to 6 hours on the blood of the host; however, they can survive up to 4 days without a blood meal on fomites if the climate and conditions are favorable.5,9
Epidemiology and Transmission
Head lice infestations commonly occur in children aged 3 to 11 years and are more prevalent in girls and women.1,10 Infestation rates are not reliably recorded, and few population-based studies have been performed; however, it is estimated that 6 to 12 million individuals are infested annually in the United States.1 Prevalence in some European populations has been estimated to range from 1% to 20%.11 A 2008 literature review found that worldwide prevalence varied across populations from 0.7% to 59%.10
Transmission occurs most frequently from direct head-to-head contact. One study found that transmission is most likely to occur when hairs are arranged in a parallel alignment and move slowly in relation to one another.12 Although controversial and probably less notable, transmission also may occur indirectly via fomites or the sharing of hairbrushes, hats, or other headgear.13,14 Classrooms are a common place for transmission.1 A 2009 study in Germany found an increase in health department consultations for head lice when schools reopened after vacations. The investigators also found that pediculicide sales peaked from mid-September through October, subsequent to schools reopening after the summer holiday.15 There is some evidence that overcrowded housing also can lead to increased incidence and transmission.16,17 There is no consistent correlation of infestation with socioeconomic status.1,17,18
Clinical Manifestations and Diagnosis
Clinically, patients with head lice present with scalp pruritus and sometimes posterior cervical or occipital lymphadenopathy. Pediculosis also can be asymptomatic. With the first exposure, symptoms may not develop for up to 4 to 6 weeks as the immune system develops sensitivity to the louse saliva.6 Bite reactions consisting of papules or wheals are related to immune sensitization.5 Louse feces and excoriations from scratching to relieve itch also may be present on examination. Secondary infection of excoriations also is possible.1
Diagnosis of an active infestation is made by identifying living lice. Because lice move quickly and can be difficult to detect, tightly attached nits on the hair shaft within 4 mm of the scalp are at least indicative of a historic infestation and can be suggestive of active infestation.1,19 Dermoscopy is a helpful tool in differentiating eggs containing nymphs from the empty cases of hatched lice and also from amorphous pseudonits (hair casts)(Figure 3).19,20 Wet combing improves the accuracy of diagnosing an active infection.21
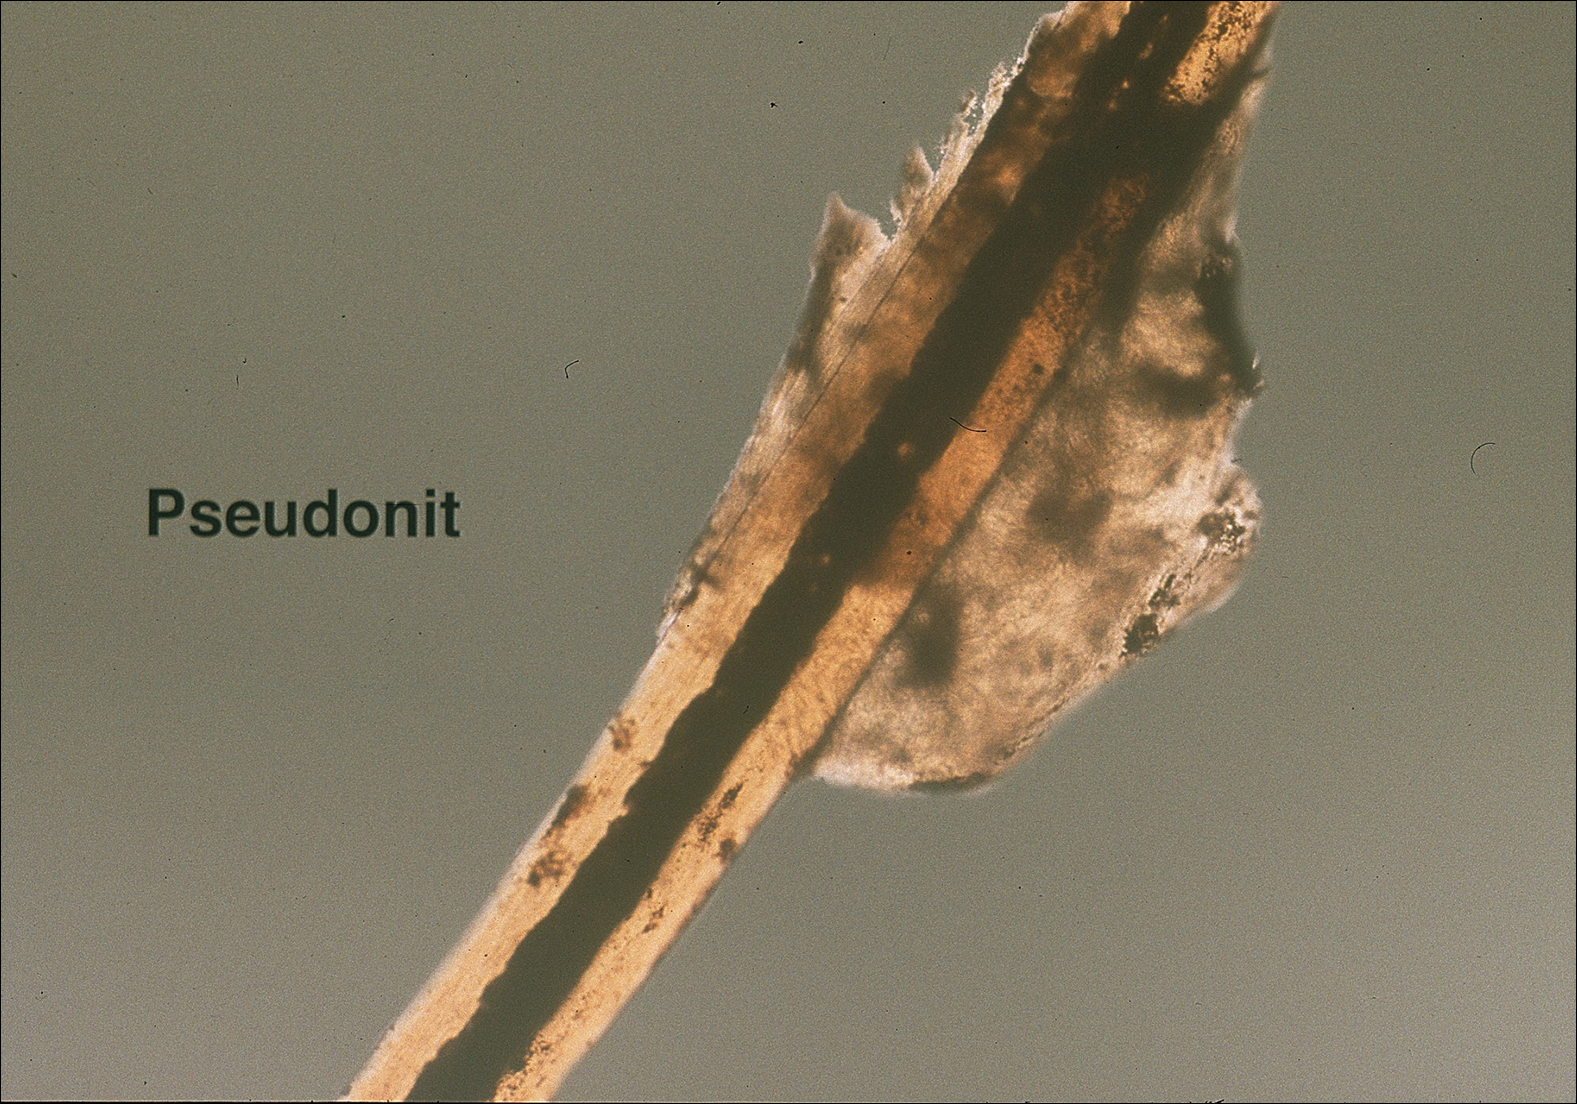
Treatment
Effective treatment of head lice requires eradication of all living lice as well as louse eggs. Topically applied pyrethroids, including pyrethrin shampoos and mousses and permethrin lotion 1%, are considered the first-line therapy.8 Pyrethroids are over-the-counter treatments that act by interfering with sodium transport in the louse, causing depolarization of the neuromembranes and respiratory paralysis.22 Pyrethrins are natural compounds derived from the chrysanthemum plant; permethrin is a synthetic compound. Pyrethrins often are combined with piperonyl butoxide, an insecticide synergist that improves efficacy by inhibiting pyrethrin catabolism.23 Resistance to pyrethroids has become an increasingly important problem in the United States and worldwide.
Malathion lotion 0.5% is another therapeutic option for head lice. Malathion is a prescription organophosphate cholinesterase inhibitor that also causes respiratory paralysis of the louse and is one of the few treatments that is ovicidal.22 It was withdrawn from the market in 1995 due to its flammability and a theoretical risk of respiratory depression if ingested; however, it was reintroduced in 1999 and remains an effective treatment option with little resistance in the United States.24
Lindane 1% (shampoo and lotion), an organochloride compound that acts by causing neuronal hyperstimulation and eventual paralysis of lice, is no longer recommended due to its serious side effects, including central nervous system toxicity and increased risk of seizure.8,24
New US Food and Drug Administration–Approved Therapies
Newer topical treatments include benzyl alcohol lotion 5%, spinosad topical suspension 0.9%, ivermectin lotion 0.5%, and dimethicone-based products. Benzyl alcohol was approved by the US Food and Drug Administration (FDA) in 2009 and is available in the United States by prescription.25 Benzyl alcohol kills lice by asphyxiation. Phase 2 and 3 clinical trials showed significant treatment success 1 day posttreatment (fewer live lice than the vehicle alone; P=.004) and 2 weeks posttreatment (absence of live lice compared to the vehicle alone; P=.001).26
Spinosad was approved by the FDA in 2011 and is available in the United States by prescription.25 It contains the compounds spinosyn A and spinosyn D, which are naturally derived through fermentation by the soil bacterium Saccharopolyspora spinosa. It also contains benzyl alcohol. Spinosad paralyzes lice by disrupting neuronal activity and is at least partially ovicidal.27 Phase 3 clinical trials published in 2009 showed that spinosad was significantly more effective than permethrin in eradicating head lice (P<.001).28
Topical ivermectin was approved by the FDA in 2012 for prescription use.25 It acts on chloride ion channels, causing hyperpolarization of the muscle cells of lice and resulting in paralysis and death. Oral ivermectin (200 μg/kg) given once and repeated in 10 days is not FDA approved for the treatment of head lice but has shown some effectiveness and is sometimes used.8 A comparison study of topical versus oral ivermectin published in 2014 found that eradication was achieved in 88% (n=27) of topical ivermectin users after 1 treatment and 100% (n=31) after 2 treatments. Oral ivermectin produced cure rates of 45% (n=14) after 1 treatment and 97% (n=30) after 2 treatments. Both topical and oral ivermectin treatments are well tolerated.29
Physically Acting Preparations
Products with a physical mode of action are a new attractive option for treatment of pediculosis because the development of resistance is less likely. Studies of silicone-based fluids that physically occlude the respiratory system of the louse, such as dimethicone liquid gel 4%, have shown superiority over treatment with pyrethroids.30,31 Although the safety of dimethicone has been demonstrated, silicone-based treatments have not yet been widely adopted in the United States and are not currently used as a first-line treatment.32 However, use of such physically acting pediculicides may in time surpass traditional neurotoxic treatments due to their low susceptibility to resistance and good safety profile.33,34
Alternative Therapies
Nonchemical treatments for head lice that have shown variable success include wet combing, hot air treatments, and varying occlusive treatments. Physical removal via wet combing requires persistent repeated treatments over several weeks; for example, wet combing may be performed every 3 days for at least 2 weeks or until no head lice are detected on 4 consecutive occasions.35 Cure rates range from 38% to 75% with wet combing as a sole treatment of head lice.36 Because this treatment has minimal risks and no adverse side effects, it can be considered as an alternative treatment for some patients.
Hot air treatments also have been studied. A 2006 study showed that a hot air treatment device had the potential to eradicate head lice, most likely by desiccation. Specifically, 30 minutes of exposure to hot air (at 58.9°F, slightly cooler than a standard hair dryer) using the custom-built device resulted in 98% mortality of eggs and 80% mortality of hatched lice.37 Large randomized controlled trials of hot air treatments have not been performed.
Other alternative treatments include plant-derived oils. A laboratory study of essential oils found that spearmint, cassia, and clove showed pediculicidal activity similar to malathion with improved ovicidal activity.38 However, there is a potential for development of contact dermatitis from essential oils.
Complete Eradication of Head Lice
Removal of nits is an important component of effective lice eradication. Biochemical analysis has revealed that the nit sheath of the head louse is similar in composition to amyloid, rendering it difficult to design products that will unravel the nit sheath while leaving human hair undamaged.39 Because pediculicides are not necessarily ovicidal and complete physical nit removal is difficult to achieve, re-treatment in 7 to 10 days often is advisable to ensure that lice in all stages of the life cycle have been killed.4 Treatment of any secondary bacterial infection also is important. Although transmission of lice via fomites is less likely than from head-to-head contact, the cleaning of hats, hairbrushes, and linens is prudent. Diagnosing and treating infested close contacts also is essential to achieving eradication.4 Coordinated surveillance, education, and treatment efforts in high-risk communities can help detect asymptomatic cases and control local epidemics in a cost-effective manner.40 However, “no nit” policies at schools likely cause a net harm, as nit removal is difficult and children with nonviable nits are then excluded from the classroom.5
Treatment Resistance
Resistance to topical neurotoxic treatments is becoming increasingly common.41-43 Therefore, it is important to identify local patterns of resistance, if possible, when selecting a therapy for head lice. Improper usage, changes in pediculicide formulations and packaging, decreased product efficacy, and natural selection have all contributed to this rise in resistance.7 Additionally, due to protection from multiple exoskeletons and the natural molting process as they mature into adults, nymphs may only receive a sublethal dose when exposed to pediculicides, contributing further to resistance.7 Resistance to synthetic pyrethroids is most predominant, likely due to selection pressure because permethrin historically has been the most widely used insecticide for pediculosis. A 2014 study found that the frequency of sodium-channel insensitivity to pyrethroids, also known as knockdown resistance (or kdr), in US head louse populations collected over a 10-year period was 84.4% and approached 100% in some communities in recent years.44 This evidence strongly supports the use of alternative therapeutic categories to effectively eradicate head lice infestations.
Conclusion
Head lice infestation is common in children, and although it is not harmful to the host, it can be an irritating and symptomatic problem and can lead to notable distress, missed days of school, and secondary infections. Identifying active adult lice is the gold standard for diagnosis. Current recommended treatments include pyrethroids as the first-line therapy; however, resistance to these neurotoxic agents is becoming increasingly common. Alternative therapies such as newer neurotoxic agents or pediculicides with physical mechanisms of action (eg, dimethicone-based products) should be considered, particularly in regions where resistance is known to be high. Education about head lice, proper use of treatment, and coordinated diagnosis are necessary for effective management of this problem.
- Chosidow O. Scabies and pediculosis. Lancet. 2000;355:819-826.
- Centers for Disease Control and Prevention. Head lice. http://www.cdc.gov/parasites/lice/head/index.html. Updated September 24, 2013. Accessed November 9, 2017.
- Hurwitz S. Lice (pediculosis). In: Hurwitz S. Hurwitz Clinical Pediatric Dermatology: A Textbook of Skin Disorders of Childhood and Adolescence. 2nd ed. Philadelphia, PA: WB Saunders Company; 1993:416-419.
- Elston DM. What’s eating you? Pediculus humanus (head louse and body louse). Cutis. 1999;63:259-264.
- Ko CJ, Elston DM. Pediculosis. J Am Acad Dermatol. 2004;50:1-12.
- Frankowski BL, Weiner LB. Head lice. Pediatrics. 2002;110:638-643.
- Meinking TL. Clinical update on resistance and treatment of pediculosis capitis. Am J Manag Care. 2004;10(9 suppl):S264-S268.
- Devore CD, Schutze GE. Head lice. Pediatrics. 2015;135:E1355-E1365.
- Burkhart CN. Fomite transmission with head lice: a continuing controversy. Lancet. 2003;361:99-100.
- Falagas ME, Matthaiou DK, Rafailidis PI, et al. Worldwide prevalence of head lice. Emerg Infect Dis. 2008;14:1493-1494.
- Feldmeier H. Pediculosis capitis: new insights into epidemiology, diagnosis and treatment. Eur J Clin Microbiol Infect Dis. 2012;31:2105-2110.
- Canyon DV, Speare R, Muller R. Spatial and kinetic factors for the transfer of head lice (Pediculus capitis) between hairs. J Invest Dermatol. 2002;119:629-631.
- Burkhart CN, Burkhart CG. Fomite transmission in head lice. J Am Acad Dermatol. 2007;56:1044-1047.
- Canyon DV, Speare R. Indirect transmission of head lice via inanimate objects. Open Dermatol J. 2010;4:72-76.
- Bauer E, Jahnke C, Feldmeier H. Seasonal fluctuations of head lice infestation in Germany. Parasitol Res. 2009;104:677-681.
- Balcioglu IC, Kurt O, Limoncu ME, et al. Rural life, lower socioeconomic status and parasitic infections. Parasitol Int. 2007;56:129-133.
- Lesshafft H, Baier A, Guerra H, et al. Prevalence and risk factors associated with pediculosis capitis in an impoverished urban community in Lima, Peru. J Glob Infect Dis. 2013;5:138-143.
- Tagka A, Lambrou GI, Braoudaki M, et al. Socioeconomical factors associated with pediculosis (Phthiraptera: Pediculidae) in Athens, Greece. J Med Entomol. 2016;53:919-922.
- Di Stefani A, Hofmann-Wellenhof R, Zalaudek I. Dermoscopy for diagnosis and treatment monitoring of pediculosis capitis. J Am Acad Dermatol. 2006;54:909-911.
- Bakos RM, Bakos L. Dermoscopy for diagnosis of pediculosis capitis. J Am Acad Dermatol. 2007;57:727-728.
- Jahnke C, Bauer E, Hengge UR, et al. Accuracy of diagnosis of pediculosis capitis: visual inspection vs wet combing. Arch Dermatol. 2009;145:309-313.
- Elston DM. Drugs used in the treatment of pediculosis. J Drugs Dermatol. 2005;4:207-211.
- National Pesticide Information Center. Piperonyl butoxide (general fact sheet). http://npic.orst.edu/factsheets/pbogen.pdf/. Accessed November 13, 2017.
- Diamantis SA, Morrell DS, Burkhart CN. Treatment of head lice. Dermatol Ther. 2009;22:273-278.
- United States Food and Drug Administration. Treating and preventing head lice. http://www.fda.gov/forconsumers/consumerupdates/ucm171730.htm. Published July 13, 2010. Updated November 8, 2017. Accessed November 13, 2017.
- Meinking TL, Villar ME, Vicaria M, et al. The clinical trials supporting benzyl alcohol lotion 5% (UlesfiaTM): a safe and effective topical treatment for head lice (Pediculosis Humanus Capitis). Pediatr Dermatol. 2010;27:19-24.
- McCormack PL. Spinosad in pediculosis capitis. Am J Clin Dermatol. 2011;12:349-353.
- Stough D, Shellabarger S, Quiring J, et al. Efficacy and safety of spinosad and permethrin creme rinses for pediculosis capitis (head lice). Pediatrics. 2009;124:E389-E395.
- Ahmad HM, Abdel-Azim ES, Abdel-Aziz RT. Assessment of topical versus oral ivermectin as a treatment for head lice. Dermatol Ther. 2014;27:307-310.
- Heukelbach J, Pilger D, Oliveira FA, et al. A highly efficacious pediculicide based on dimethicone: randomized observer blinded comparative trial. BMC Infect Dis. 2008;8:115.
- Burgess IF, Brunton ER, Burgess NA. Single application of 4% dimethicone liquid gel versus two applications of 1% permethrin creme rinse for treatment of head louse infestation: a randomised controlled trial. BMC Dermatol. 2013;13:5.
- Ihde ES, Boscamp JR, Loh JM, et al. Safety and efficacy of a 100% dimethicone pediculocide in school-age children. BMC Pediatr. 2015;15:70.
- Heukelbach J, Oliveira FA, Richter J, et al. Dimethicone-based pediculicides: a physical approach to eradicate head lice. Open Dermatol J. 2010;4:77-81.
- Feldmeier H. Treatment of pediculosis capitis: a critical appraisal of the current literature. Am J Clin Dermatol. 2014;15:401-412.
- Glasziou P, Bennett J, Greenberg P, et al; Handbook Of Non Drug Intervention (HANDI) Project Team. Wet combing for the eradication of head lice. Aust Fam Physician. 2013;42:129-130.
- Tebruegge M, Runnacles J. Is wet combing effective in children with pediculosis capitis infestation? Arch Dis Child. 2007;92:818-820.
- Goates BM, Atkin JS, Wilding KG, et al. An effective nonchemical treatment for head lice: a lot of hot air. Pediatrics. 2006;118:1962-1970.
- Yones DA, Bakir HY, Bayoumi SA. Chemical composition and efficacy of some selected plant oils against Pediculus humanus capitis in vitro. Parasitol Res. 2016;115:3209-3218.
- Burkhart CN, Burkhart CG. Head lice: scientific assessment of the nit sheath with clinical ramifications and therapeutic options. J Am Acad Dermatol. 2005;53:129-133.
- Ibarra J, Fry F, Wickenden C, et al. The impact of well-developed preventative strategies on the eradication of head lice. Perspect Public Health. 2009;129:165-173.
- Mumcuoglu KY, Hemingway J, Miller J, et al. Permethrin resistance in the head louse pediculus humanus capitis from Israel. Med Vet Entomol. 1995;9:427-432.
- Meinking TL, Serrano L, Hard B, et al. Comparative in vitro pediculicidal efficacy of treatments in a resistant head lice population in the United States. Arch Dermatol. 2002;138:220-224.
- Hemingway J, Miller J, Mumcuoglu KY. Pyrethroid resistance mechanisms in the head louse Pediculus capitis from Israel: implications for control. Med Vet Entomol. 1999;13:89-96.
- Yoon KS, Previte DJ, Hodgdon HE, et al. Knockdown resistance allele frequencies in North American head louse (Anoplura: Pediculidae) populations. J Med Entomol. 2014;51:450-457.
The head louse (Pediculus humanus capitis) is a blood-sucking arthropod of the suborder Anoplura. Lice are obligate human parasites that have infested humans since antiquity. Pediculosis capitis is an infestation of the scalp by head lice. It is estimated that 6 to 12 million individuals in the United States are affected with head lice per year.1 Resistance to topical chemical pediculicides is widespread, and new agents have been developed to address this gap in care.
Characteristics of Head Lice
The head louse is a tan-gray–colored, wingless insect measuring approximately 2- to 3-mm long with 3 body segments. It has 6 legs with claws used to grasp individual hairs, and it moves by crawling; it does not fly or jump.2,3 The head louse has an elongated abdomen and a small head with short antennae and anterior piercing mouthparts (Figure 1).4 Nits are transparent, flask-shaped, 0.5- to 0.8-mm egg cases found firmly cemented to the hair shafts approximately 1 to 4 mm above the level of the scalp (Figure 2).5 The head louse resides on scalp hair and feeds off the scalp itself. Both lice and nits can be present throughout the scalp but are most commonly found in the postauricular and occipital scalp.3,4
Female lice live approximately 30 days and lay 5 to 10 eggs per day. Eggs incubate individually in nits laid close to the scalp for 8 to 10 days before hatching.1,6 The newly hatched nymphs (also called instars) have multiple exoskeletons that are shed as they grow.7 Nymphs mature into adults in approximately 2 weeks, and the life cycle begins again.8 Head lice are obligate human parasites, feeding approximately every 4 to 6 hours on the blood of the host; however, they can survive up to 4 days without a blood meal on fomites if the climate and conditions are favorable.5,9
Epidemiology and Transmission
Head lice infestations commonly occur in children aged 3 to 11 years and are more prevalent in girls and women.1,10 Infestation rates are not reliably recorded, and few population-based studies have been performed; however, it is estimated that 6 to 12 million individuals are infested annually in the United States.1 Prevalence in some European populations has been estimated to range from 1% to 20%.11 A 2008 literature review found that worldwide prevalence varied across populations from 0.7% to 59%.10
Transmission occurs most frequently from direct head-to-head contact. One study found that transmission is most likely to occur when hairs are arranged in a parallel alignment and move slowly in relation to one another.12 Although controversial and probably less notable, transmission also may occur indirectly via fomites or the sharing of hairbrushes, hats, or other headgear.13,14 Classrooms are a common place for transmission.1 A 2009 study in Germany found an increase in health department consultations for head lice when schools reopened after vacations. The investigators also found that pediculicide sales peaked from mid-September through October, subsequent to schools reopening after the summer holiday.15 There is some evidence that overcrowded housing also can lead to increased incidence and transmission.16,17 There is no consistent correlation of infestation with socioeconomic status.1,17,18
Clinical Manifestations and Diagnosis
Clinically, patients with head lice present with scalp pruritus and sometimes posterior cervical or occipital lymphadenopathy. Pediculosis also can be asymptomatic. With the first exposure, symptoms may not develop for up to 4 to 6 weeks as the immune system develops sensitivity to the louse saliva.6 Bite reactions consisting of papules or wheals are related to immune sensitization.5 Louse feces and excoriations from scratching to relieve itch also may be present on examination. Secondary infection of excoriations also is possible.1
Diagnosis of an active infestation is made by identifying living lice. Because lice move quickly and can be difficult to detect, tightly attached nits on the hair shaft within 4 mm of the scalp are at least indicative of a historic infestation and can be suggestive of active infestation.1,19 Dermoscopy is a helpful tool in differentiating eggs containing nymphs from the empty cases of hatched lice and also from amorphous pseudonits (hair casts)(Figure 3).19,20 Wet combing improves the accuracy of diagnosing an active infection.21
Treatment
Effective treatment of head lice requires eradication of all living lice as well as louse eggs. Topically applied pyrethroids, including pyrethrin shampoos and mousses and permethrin lotion 1%, are considered the first-line therapy.8 Pyrethroids are over-the-counter treatments that act by interfering with sodium transport in the louse, causing depolarization of the neuromembranes and respiratory paralysis.22 Pyrethrins are natural compounds derived from the chrysanthemum plant; permethrin is a synthetic compound. Pyrethrins often are combined with piperonyl butoxide, an insecticide synergist that improves efficacy by inhibiting pyrethrin catabolism.23 Resistance to pyrethroids has become an increasingly important problem in the United States and worldwide.
Malathion lotion 0.5% is another therapeutic option for head lice. Malathion is a prescription organophosphate cholinesterase inhibitor that also causes respiratory paralysis of the louse and is one of the few treatments that is ovicidal.22 It was withdrawn from the market in 1995 due to its flammability and a theoretical risk of respiratory depression if ingested; however, it was reintroduced in 1999 and remains an effective treatment option with little resistance in the United States.24
Lindane 1% (shampoo and lotion), an organochloride compound that acts by causing neuronal hyperstimulation and eventual paralysis of lice, is no longer recommended due to its serious side effects, including central nervous system toxicity and increased risk of seizure.8,24
New US Food and Drug Administration–Approved Therapies
Newer topical treatments include benzyl alcohol lotion 5%, spinosad topical suspension 0.9%, ivermectin lotion 0.5%, and dimethicone-based products. Benzyl alcohol was approved by the US Food and Drug Administration (FDA) in 2009 and is available in the United States by prescription.25 Benzyl alcohol kills lice by asphyxiation. Phase 2 and 3 clinical trials showed significant treatment success 1 day posttreatment (fewer live lice than the vehicle alone; P=.004) and 2 weeks posttreatment (absence of live lice compared to the vehicle alone; P=.001).26
Spinosad was approved by the FDA in 2011 and is available in the United States by prescription.25 It contains the compounds spinosyn A and spinosyn D, which are naturally derived through fermentation by the soil bacterium Saccharopolyspora spinosa. It also contains benzyl alcohol. Spinosad paralyzes lice by disrupting neuronal activity and is at least partially ovicidal.27 Phase 3 clinical trials published in 2009 showed that spinosad was significantly more effective than permethrin in eradicating head lice (P<.001).28
Topical ivermectin was approved by the FDA in 2012 for prescription use.25 It acts on chloride ion channels, causing hyperpolarization of the muscle cells of lice and resulting in paralysis and death. Oral ivermectin (200 μg/kg) given once and repeated in 10 days is not FDA approved for the treatment of head lice but has shown some effectiveness and is sometimes used.8 A comparison study of topical versus oral ivermectin published in 2014 found that eradication was achieved in 88% (n=27) of topical ivermectin users after 1 treatment and 100% (n=31) after 2 treatments. Oral ivermectin produced cure rates of 45% (n=14) after 1 treatment and 97% (n=30) after 2 treatments. Both topical and oral ivermectin treatments are well tolerated.29
Physically Acting Preparations
Products with a physical mode of action are a new attractive option for treatment of pediculosis because the development of resistance is less likely. Studies of silicone-based fluids that physically occlude the respiratory system of the louse, such as dimethicone liquid gel 4%, have shown superiority over treatment with pyrethroids.30,31 Although the safety of dimethicone has been demonstrated, silicone-based treatments have not yet been widely adopted in the United States and are not currently used as a first-line treatment.32 However, use of such physically acting pediculicides may in time surpass traditional neurotoxic treatments due to their low susceptibility to resistance and good safety profile.33,34
Alternative Therapies
Nonchemical treatments for head lice that have shown variable success include wet combing, hot air treatments, and varying occlusive treatments. Physical removal via wet combing requires persistent repeated treatments over several weeks; for example, wet combing may be performed every 3 days for at least 2 weeks or until no head lice are detected on 4 consecutive occasions.35 Cure rates range from 38% to 75% with wet combing as a sole treatment of head lice.36 Because this treatment has minimal risks and no adverse side effects, it can be considered as an alternative treatment for some patients.
Hot air treatments also have been studied. A 2006 study showed that a hot air treatment device had the potential to eradicate head lice, most likely by desiccation. Specifically, 30 minutes of exposure to hot air (at 58.9°F, slightly cooler than a standard hair dryer) using the custom-built device resulted in 98% mortality of eggs and 80% mortality of hatched lice.37 Large randomized controlled trials of hot air treatments have not been performed.
Other alternative treatments include plant-derived oils. A laboratory study of essential oils found that spearmint, cassia, and clove showed pediculicidal activity similar to malathion with improved ovicidal activity.38 However, there is a potential for development of contact dermatitis from essential oils.
Complete Eradication of Head Lice
Removal of nits is an important component of effective lice eradication. Biochemical analysis has revealed that the nit sheath of the head louse is similar in composition to amyloid, rendering it difficult to design products that will unravel the nit sheath while leaving human hair undamaged.39 Because pediculicides are not necessarily ovicidal and complete physical nit removal is difficult to achieve, re-treatment in 7 to 10 days often is advisable to ensure that lice in all stages of the life cycle have been killed.4 Treatment of any secondary bacterial infection also is important. Although transmission of lice via fomites is less likely than from head-to-head contact, the cleaning of hats, hairbrushes, and linens is prudent. Diagnosing and treating infested close contacts also is essential to achieving eradication.4 Coordinated surveillance, education, and treatment efforts in high-risk communities can help detect asymptomatic cases and control local epidemics in a cost-effective manner.40 However, “no nit” policies at schools likely cause a net harm, as nit removal is difficult and children with nonviable nits are then excluded from the classroom.5
Treatment Resistance
Resistance to topical neurotoxic treatments is becoming increasingly common.41-43 Therefore, it is important to identify local patterns of resistance, if possible, when selecting a therapy for head lice. Improper usage, changes in pediculicide formulations and packaging, decreased product efficacy, and natural selection have all contributed to this rise in resistance.7 Additionally, due to protection from multiple exoskeletons and the natural molting process as they mature into adults, nymphs may only receive a sublethal dose when exposed to pediculicides, contributing further to resistance.7 Resistance to synthetic pyrethroids is most predominant, likely due to selection pressure because permethrin historically has been the most widely used insecticide for pediculosis. A 2014 study found that the frequency of sodium-channel insensitivity to pyrethroids, also known as knockdown resistance (or kdr), in US head louse populations collected over a 10-year period was 84.4% and approached 100% in some communities in recent years.44 This evidence strongly supports the use of alternative therapeutic categories to effectively eradicate head lice infestations.
Conclusion
Head lice infestation is common in children, and although it is not harmful to the host, it can be an irritating and symptomatic problem and can lead to notable distress, missed days of school, and secondary infections. Identifying active adult lice is the gold standard for diagnosis. Current recommended treatments include pyrethroids as the first-line therapy; however, resistance to these neurotoxic agents is becoming increasingly common. Alternative therapies such as newer neurotoxic agents or pediculicides with physical mechanisms of action (eg, dimethicone-based products) should be considered, particularly in regions where resistance is known to be high. Education about head lice, proper use of treatment, and coordinated diagnosis are necessary for effective management of this problem.
- Chosidow O. Scabies and pediculosis. Lancet. 2000;355:819-826.
- Centers for Disease Control and Prevention. Head lice. http://www.cdc.gov/parasites/lice/head/index.html. Updated September 24, 2013. Accessed November 9, 2017.
- Hurwitz S. Lice (pediculosis). In: Hurwitz S. Hurwitz Clinical Pediatric Dermatology: A Textbook of Skin Disorders of Childhood and Adolescence. 2nd ed. Philadelphia, PA: WB Saunders Company; 1993:416-419.
- Elston DM. What’s eating you? Pediculus humanus (head louse and body louse). Cutis. 1999;63:259-264.
- Ko CJ, Elston DM. Pediculosis. J Am Acad Dermatol. 2004;50:1-12.
- Frankowski BL, Weiner LB. Head lice. Pediatrics. 2002;110:638-643.
- Meinking TL. Clinical update on resistance and treatment of pediculosis capitis. Am J Manag Care. 2004;10(9 suppl):S264-S268.
- Devore CD, Schutze GE. Head lice. Pediatrics. 2015;135:E1355-E1365.
- Burkhart CN. Fomite transmission with head lice: a continuing controversy. Lancet. 2003;361:99-100.
- Falagas ME, Matthaiou DK, Rafailidis PI, et al. Worldwide prevalence of head lice. Emerg Infect Dis. 2008;14:1493-1494.
- Feldmeier H. Pediculosis capitis: new insights into epidemiology, diagnosis and treatment. Eur J Clin Microbiol Infect Dis. 2012;31:2105-2110.
- Canyon DV, Speare R, Muller R. Spatial and kinetic factors for the transfer of head lice (Pediculus capitis) between hairs. J Invest Dermatol. 2002;119:629-631.
- Burkhart CN, Burkhart CG. Fomite transmission in head lice. J Am Acad Dermatol. 2007;56:1044-1047.
- Canyon DV, Speare R. Indirect transmission of head lice via inanimate objects. Open Dermatol J. 2010;4:72-76.
- Bauer E, Jahnke C, Feldmeier H. Seasonal fluctuations of head lice infestation in Germany. Parasitol Res. 2009;104:677-681.
- Balcioglu IC, Kurt O, Limoncu ME, et al. Rural life, lower socioeconomic status and parasitic infections. Parasitol Int. 2007;56:129-133.
- Lesshafft H, Baier A, Guerra H, et al. Prevalence and risk factors associated with pediculosis capitis in an impoverished urban community in Lima, Peru. J Glob Infect Dis. 2013;5:138-143.
- Tagka A, Lambrou GI, Braoudaki M, et al. Socioeconomical factors associated with pediculosis (Phthiraptera: Pediculidae) in Athens, Greece. J Med Entomol. 2016;53:919-922.
- Di Stefani A, Hofmann-Wellenhof R, Zalaudek I. Dermoscopy for diagnosis and treatment monitoring of pediculosis capitis. J Am Acad Dermatol. 2006;54:909-911.
- Bakos RM, Bakos L. Dermoscopy for diagnosis of pediculosis capitis. J Am Acad Dermatol. 2007;57:727-728.
- Jahnke C, Bauer E, Hengge UR, et al. Accuracy of diagnosis of pediculosis capitis: visual inspection vs wet combing. Arch Dermatol. 2009;145:309-313.
- Elston DM. Drugs used in the treatment of pediculosis. J Drugs Dermatol. 2005;4:207-211.
- National Pesticide Information Center. Piperonyl butoxide (general fact sheet). http://npic.orst.edu/factsheets/pbogen.pdf/. Accessed November 13, 2017.
- Diamantis SA, Morrell DS, Burkhart CN. Treatment of head lice. Dermatol Ther. 2009;22:273-278.
- United States Food and Drug Administration. Treating and preventing head lice. http://www.fda.gov/forconsumers/consumerupdates/ucm171730.htm. Published July 13, 2010. Updated November 8, 2017. Accessed November 13, 2017.
- Meinking TL, Villar ME, Vicaria M, et al. The clinical trials supporting benzyl alcohol lotion 5% (UlesfiaTM): a safe and effective topical treatment for head lice (Pediculosis Humanus Capitis). Pediatr Dermatol. 2010;27:19-24.
- McCormack PL. Spinosad in pediculosis capitis. Am J Clin Dermatol. 2011;12:349-353.
- Stough D, Shellabarger S, Quiring J, et al. Efficacy and safety of spinosad and permethrin creme rinses for pediculosis capitis (head lice). Pediatrics. 2009;124:E389-E395.
- Ahmad HM, Abdel-Azim ES, Abdel-Aziz RT. Assessment of topical versus oral ivermectin as a treatment for head lice. Dermatol Ther. 2014;27:307-310.
- Heukelbach J, Pilger D, Oliveira FA, et al. A highly efficacious pediculicide based on dimethicone: randomized observer blinded comparative trial. BMC Infect Dis. 2008;8:115.
- Burgess IF, Brunton ER, Burgess NA. Single application of 4% dimethicone liquid gel versus two applications of 1% permethrin creme rinse for treatment of head louse infestation: a randomised controlled trial. BMC Dermatol. 2013;13:5.
- Ihde ES, Boscamp JR, Loh JM, et al. Safety and efficacy of a 100% dimethicone pediculocide in school-age children. BMC Pediatr. 2015;15:70.
- Heukelbach J, Oliveira FA, Richter J, et al. Dimethicone-based pediculicides: a physical approach to eradicate head lice. Open Dermatol J. 2010;4:77-81.
- Feldmeier H. Treatment of pediculosis capitis: a critical appraisal of the current literature. Am J Clin Dermatol. 2014;15:401-412.
- Glasziou P, Bennett J, Greenberg P, et al; Handbook Of Non Drug Intervention (HANDI) Project Team. Wet combing for the eradication of head lice. Aust Fam Physician. 2013;42:129-130.
- Tebruegge M, Runnacles J. Is wet combing effective in children with pediculosis capitis infestation? Arch Dis Child. 2007;92:818-820.
- Goates BM, Atkin JS, Wilding KG, et al. An effective nonchemical treatment for head lice: a lot of hot air. Pediatrics. 2006;118:1962-1970.
- Yones DA, Bakir HY, Bayoumi SA. Chemical composition and efficacy of some selected plant oils against Pediculus humanus capitis in vitro. Parasitol Res. 2016;115:3209-3218.
- Burkhart CN, Burkhart CG. Head lice: scientific assessment of the nit sheath with clinical ramifications and therapeutic options. J Am Acad Dermatol. 2005;53:129-133.
- Ibarra J, Fry F, Wickenden C, et al. The impact of well-developed preventative strategies on the eradication of head lice. Perspect Public Health. 2009;129:165-173.
- Mumcuoglu KY, Hemingway J, Miller J, et al. Permethrin resistance in the head louse pediculus humanus capitis from Israel. Med Vet Entomol. 1995;9:427-432.
- Meinking TL, Serrano L, Hard B, et al. Comparative in vitro pediculicidal efficacy of treatments in a resistant head lice population in the United States. Arch Dermatol. 2002;138:220-224.
- Hemingway J, Miller J, Mumcuoglu KY. Pyrethroid resistance mechanisms in the head louse Pediculus capitis from Israel: implications for control. Med Vet Entomol. 1999;13:89-96.
- Yoon KS, Previte DJ, Hodgdon HE, et al. Knockdown resistance allele frequencies in North American head louse (Anoplura: Pediculidae) populations. J Med Entomol. 2014;51:450-457.
Practice Points
- Transmission of head lice occurs most frequently from direct head-to-head contact; however, head lice can survive up to 4 days on fomites.
- Patients present with scalp pruritus and bite reactions (papules or wheals), but pediculosis can be asymptomatic, particularly with the first exposure before the immune system has developed sensitivity to the louse saliva.
- Topical pyrethroids are available over-the-counter and are considered first-line therapy; however, resistance to pyrethroids has become an important problem in the United States and worldwide.
- Newer topical treatments such as benzyl alcohol lotion 5%, spinosad topical suspension 0.9%, and ivermectin lotion 0.5% can be prescribed as alternative therapies, particularly if resistance to pyrethroids is a concern.
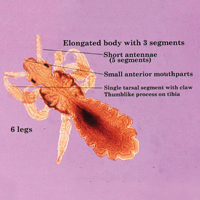
Levofloxacin prophylaxis in AML reduces febrile neutropenia admissions
In patients with acute myeloid leukemia (AML), giving levofloxacin for febrile neutropenia prophylaxis reduced hospital admissions due to this complication by about one-quarter, according to results of a retrospective cohort study.
“Multiple studies have demonstrated the use of an oral fluoroquinolone antibiotic to prevent febrile neutropenia readmission to hospital after receiving consolidation chemotherapy,” Samantha S. F. Lee, PharmD, a clinical pharmacist at St. Michael’s Hospital in Toronto, and her colleagues wrote. “However, this is the first study to demonstrate a positive outcome specific to the AML population.”
The results support recommendations made by the Infectious Diseases Society of America and the National Comprehensive Cancer Network related to treatment of AML after receiving consolidation chemotherapy.
For the study, the investigators retrospectively reviewed the charts of consecutive patients with AML treated at London Health Sciences Centre, a tertiary academic medical center, between 2006 and 2013. They compared outcomes between 50 patients who were prescribed prophylactic levofloxacin (Levaquin) after consolidation therapy and 50 patients who were not prescribed any antibiotics.
Overall, patients given levofloxacin had a lower rate of hospital readmission due to febrile neutropenia whether given the antibiotic after the first chemotherapy consolidation cycle (42% vs. 72%, P = .002) or after all cycles (51.4% vs. 67%, P = .023).
None of the patients in the levofloxacin group developed Clostridium difficile–associated diarrhea within 30 days from discharge after receiving the first cycle of consolidation chemotherapy, compared with one patient in the group not given the antibiotic (Support Care Cancer. 2017 Nov 23. doi: 10.1007/s00520-017-3976-1).
The use of levofloxacin did not significantly impact secondary outcomes, including total days of antibiotic treatment provided to febrile neutropenic patients, days to readmission for febrile neutropenia, or the rate of positive bacterial cultures returned in febrile neutropenic patients.
It was not possible to assess differences in the rate of fluoroquinolone resistance in positive bacterial cultures because fluoroquinolone susceptibilities were infrequently reported.
“This study provides evidence of a strong association between prophylaxis with oral levofloxacin and the rate of febrile neutropenia, but further study is required to evaluate the impact of fluoroquinolone use on antibiotic resistance and [Clostridium difficile–associated diarrhea] rates in this patient setting,” the investigators wrote.
The study was limited by the small sample size, which precluded accurate ascertainment of some outcomes, including safety outcomes, they noted. Additionally, adherence to oral therapy was unknown, and some data, such as fluoroquinolone resistance, were missing for patients admitted for febrile neutropenia to outside hospitals.
Dr. Lee reported having no relevant conflicts of interest.
FROM SUPPORTIVE CARE IN CANCER
Key clinical point:
Major finding: Patients given levofloxacin had lower rates of hospital readmission due to febrile neutropenia whether it was given after the first consolidation cycle (42% vs. 72%, P = .002) or after all cycles (51.4% vs. 67%, P = .023).
Data source: A single-center retrospective cohort study of 100 patients with AML, half of whom were prescribed levofloxacin after consolidation chemotherapy.
Disclosures: Dr. Lee reported having no relevant conflicts of interest.