User login
Insurance and LOS for Children With CAP
Disparities in patterns of care and outcomes for ambulatory‐care sensitive conditions remain a persistent problem for children.19 Many studies have focused on disparities in hospitalization rates and length of stay (LOS) related to asthma, however, few studies have focused on community‐acquired pneumonia (CAP) despite the fact that pneumonia is the most common, preventable, and potentially serious infection in childhood.10 Providers, payers, and families have a common interest in minimizing hospital LOS for different reasons (eg, minimizing costs, lost wages, exposure to antibiotic‐resistant bacteria), however, this interest is balanced against the potentially greater risk of readmission and adverse outcomes if LOS is inappropriately short. To date, the relationship between insurance status and LOS for CAP remains unexplored.
As in other conditions, substantial variation exists with respect to patterns of care and outcomes for children hospitalized with CAP.11 For example, children hospitalized in rural settings have a shorter LOS for pneumonia than those hospitalized in large urban settings.12 Children from racial/ethnic minorities tend to have higher rates of CAP‐associated complications, including death.11 Decades of prior studies have documented that uninsured children are less likely than insured children to make preventive care visits and obtain prescription medications, but differences in LOS or hospitalization rates between insured and uninsured children with CAP have not been studied.6, 8, 13, 14 Though imperfect, insurance status is 1 proxy for healthcare access, and current healthcare reform efforts aim to improve healthcare access and decrease socioeconomic gradients in health by increasing the number of insured American children. Nonetheless, quantifying the relationship between insurance status on LOS for children hospitalized with CAP is a first step towards understanding the influence of ambulatory care access on hospitalization for ambulatory‐care sensitive conditions.
The purpose of this study was to investigate the influence of insurance status and type on LOS for children hospitalized with CAP. In addition, we sought to determine if there were consistent trends over time in the association between insurance status and type with LOS for children hospitalized with CAP.
METHODS
Study Design and Data Source
This retrospective cross‐sectional study used data from the 1997, 2000, 2003, and 2006 Kids' Inpatient Database (KID). The KID is part of the Healthcare Cost and Utilization Project sponsored by the Agency for Healthcare Research and Quality (AHRQ). It is the only dataset on hospital use and outcomes specifically designed to study children's use of hospital services in the United States. The KID samples pediatric discharges from all community non‐rehabilitation hospitals in states participating in the Healthcare Cost and Utilization Project, using a complex stratification system, across pediatric discharge type and hospital characteristics. Community hospitals in the KID are defined as all non‐federal, short‐term, general and other specialty hospitals, including academic medical centers, obstetrics‐gynecology, otolaryngology, orthopedic, and children's hospitals. Federal hospitals, long‐term hospitals, psychiatric hospitals, alcohol/chemical dependency treatment facilities and hospitals units within institutions are excluded. Discharge‐level weights assigned to discharges within the stratum permit calculation of national estimates. Datasets, which each contain approximately 3 million discharges (unweighted), are released every 3 years beginning with 1997. The 2006 KID is the most recently available dataset and contains hospital administrative data from 38 states, representing 88.8% of the estimated US population.15 This study was considered exempt from review by the Committees for the Protection of Human Subjects at The Children's Hospital of Philadelphia.
Study Participants
Patients 18 years of age and younger were eligible for inclusion if they required hospitalization for CAP in 1997, 2000, 2003, or 2006. Using a previously validated algorithm, patients were considered as having CAP if they met 1 of 2 criteria: 1) International Classification of Diseases, 9th Revision, Clinical Modification (ICD‐9 CM) primary diagnosis code indicating pneumonia (480‐483, 485‐486), empyema (510), or pleurisy (511.0‐1, 511.9); or 2) primary diagnosis of pneumonia‐related symptom (eg, cough, fever, tachypnea) and secondary diagnosis of pneumonia, empyema or pleurisy. Pneumonia‐related symptoms included fever, respiratory abnormality unspecified, shortness of breath, tachypnea, wheezing, cough, hemoptysis, abnormal sputum, chest pain, and abnormal chest sounds.16 Because there is no specific ICD‐9 code for nosocomial pneumonia, this previously validated approach minimized such misclassification16 (eg, a child hospitalized following traumatic injury who then develops ventilator‐associated pneumonia is likely to have trauma, rather than pneumonia or a pneumonia‐related symptom, listed as the primary diagnosis). Patients with the following comorbid conditions (identified by KID data elements and ICD‐9 CM codes) were excluded as these comorbidities are characterized by risk factors not reflective of the general pediatric population: acquired and congenital immunologic disorders, malignancy, collagen vascular disease, sickle cell disease, cystic fibrosis, organ transplant, congenital heart defects, and heart failure. Patients identified as in‐hospital births were excluded to minimize the inclusion of perinatally acquired and nosocomial infections occurring in neonates. Patients with a secondary diagnosis code indicating trauma were also excluded, as a diagnosis of pneumonia in this population likely reflects nosocomial etiology. CAP‐related complications (eg, effusion, abscess; for complete list, see Supporting Appendix A in the online version of this article) were identified using ICD‐9 CM diagnosis and procedure codes. Asthma‐related hospitalizations were identified using ICD‐9 CM diagnosis code 493 in any secondary diagnosis field.
Primary Exposure
The primary exposure was insurance type, categorized as private, public, uninsured, or other (eg, Civilian Health and Medical Program Uniform Service (CHAMPUS), worker's compensation, union‐based insurance, but definition varies by state precluding categorization as purely public or private).
Primary Outcome
The primary outcome was the hospital LOS calculated in days.
Statistical Analysis
Consistent with prior work,12 subjects were characterized by age, race, sex, the presence or absence of a pneumonia‐associated complication, discharge status (discharge from hospital vs in‐hospital death), hospital type (rural, urban non‐teaching, urban teaching non‐children's, urban teaching children's), and hospital region (Northeast, Midwest, South, West). Age groups for analysis were defined as <1 year (infant), 1 to 5 years (preschool age), 6 to 11 years (school‐age), and 12 to 18 years old (adolescent). Race was recorded as a single variable (white, black, other, and missing). Patient information for race was missing from 32% of discharges in 1997, 18% in 2000, 29% in 2003, and 26% in 2006. Patients with missing race data were included to preserve the integrity of our estimates. Categorical variables were summarized by frequencies and percents. Continuous variables were summarized by mean and standard deviation values.
All analyses accounted for the complex sampling design with the survey commands included in STATA, version 10 (College Station, TX) to produce weighted estimates. To determine the adjusted impact of patient and hospital‐level characteristics in our cohort, we constructed multivariable negative binomial regression models using all available covariates for LOS because of its rightward‐skewed distribution. The negative binomial model produced an incident rate ratio (IRR) for LOS (IRR >1 indicates that the risk factor is associated with a longer length of stay). As recommended in the AHRQ technical documentation, variance estimates for each model accounted for the clustering of data at the hospital level. To address the impact of missing race data on outcome, we constructed additional multivariable negative binomial regression models while varying the underlying assumptions about race classification. In these secondary analyses, children with race coded as missing were sequentially excluded, assumed to be white, and assumed to be black. These analyses were repeated after excluding insurance from the multivariable model.
RESULTS
The more than 10.5 million children sampled (unweighted) in KID during these 4 time periods (1997, 2000, 2003, and 2006) are representative of the more than 28.9 million children hospitalized in the United States. In each of these sample years, there were approximately 150,000 children hospitalized with pneumonia across the United States (Table 1). Of those hospitalized, 23% to 28% had a concomitant diagnosis of asthma; 6% to 8% had a pneumonia‐associated complication; and mortality was <0.01% in each sample year for patients hospitalized with pneumonia. In all years, among those with racial/ethnic data, the sample population was predominantly white boys less than 6 years old. The greatest proportion of children were hospitalized in urban non‐teaching settings, and also those children living in the southern regions of the United States.
| 1997 | 2000 | 2003 | 2006 | |
|---|---|---|---|---|
| N = 148,702 | N = 157,847 | N = 157,743 | N = 156,810 | |
| ||||
| Race | ||||
| White | 56,348 (38) | 68,643 (44) | 54,903 (35) | 56,108 (36) |
| Black | 22,864 (15) | 22,580 (14) | 17,960 (11) | 18,800 (12) |
| Other | 22,203 (15) | 38,448 (24) | 39,138 (25) | 40,803 (26) |
| Missing | 47,287 (32) | 28,175 (18) | 45,588 (29) | 41,099 (26) |
| Age category | ||||
| <1 year | 43,851 (29) | 44,470 (28) | 37,798 (24) | 37,705 (24) |
| 1 through 5 years | 75,033 (50) | 76,385 (48) | 77,530 (49) | 79,519 (51) |
| 6 through 11 years | 19,372 (13) | 21,403 (14) | 23,126 (15) | 23,494 (15) |
| >12 years | 10,446 (7) | 15,589 (9) | 19,289 (12) | 16,092 (10) |
| Hospital type | ||||
| Urban non‐teaching | 52,756 (35) | 50,718 (32) | 52,552 (34) | 50,718 (32) |
| Rural | 47,910 (32) | 41,715 (27) | 39,605 (26) | 31,947 (21) |
| Urban teaching non‐children's | 20,378 (14) | 30,981 (20) | 28,432 (18) | 30,194 (20) |
| Urban teaching children's | 27,658 (19) | 34,021 (22) | 34,454 (22) | 41,035 (27) |
| Male sex | 83,291 (56) | 8,783 (56) | 86,034 (55) | 85,508 (55) |
| Region* | ||||
| Northeast | 19,750 (13) | 26,092 (17) | 23,867 (15) | 23,832 (15) |
| Midwest | 33,053 (22) | 30,706 (19) | 35,714 (23) | 35,900 (23) |
| South | 68,958 (46) | 68,663 (44) | 65,994 (42) | 65,460 (42) |
| West | 26,741 (18) | 32,385 (21) | 32,169 (20) | 31,618 (20) |
| Asthma | 26,971 (24) | 31,746 (28) | 27,729 (24) | 26,822 (23) |
| Pneumonia‐associated complication | 8,831 (6) | 11,084 (7) | 12,005 (8) | 11,724 (7) |
| Died | 334 (0.002) | 394 (0.002) | 270 (0.002) | 193 (0.001) |
| Insurance | ||||
| Private | 65,428 (44) | 73,528 (47) | 68,720 (44) | 63,997 (41) |
| Public | 68,024 (46) | 71,698 (45) | 76,779 (49) | 80,226 (51) |
| Uninsured | 9,922 (7) | 8,336 (5) | 6,381 (4) | 6,912 (4) |
| Other | 4,964 (3) | 4,285 (3) | 5,391 (3) | 5,283 (3) |
There was little variation in the insurance status of children hospitalized with CAP between 1997 and 2006. In each of the sampled years, at least 40% of sampled children were privately insured, at least 40% were publicly insured, and approximately 5% were uninsured (Table 1). In all years, there were significant racial/ethnic disparities in insurance coverage such that whites were 4 to 6 times more likely to have private insurance than blacks, however, the large amount of missing race/ethnicity data warrant caution in interpreting this finding (Table 2; also see Supporting Information Appendix B in the online version of this article). We also found that children less than 1 year old were the most likely to be publicly insured in all years (see Supporting Appendix C in the online version of this article). There were also regional differences related to insurance coverage such that a greater proportion of children hospitalized in facilities located in the southern part of the United States were publicly insured. Notably, there were no significant differences in CAP‐associated mortality or asthma related to insurance coverage (Table 2). In 2006, CAP‐associated complications occurred in 8.5% of children with private insurance, 6.5% of children with public insurance, and 7.7% of uninsured children; the relative distribution of complications by insurance type were similar in previous years of the KID survey.
| Private | Public | Uninsured | Other Insurance | P | |
|---|---|---|---|---|---|
| |||||
| No. of children (%) | 63,997 (41) | 80,226 (51) | 6,912 (4) | 5,283 (3) | |
| Male sex | 34,639 (41) | 44,140 (52) | 3,727 (4) | 2,808 (3) | 0.092 |
| Race | |||||
| White | 30,707 (55) | 21,282 (38) | 2,241 (4) | 1,774 (3) | <0.001 |
| Black* | 5,112 (27) | 12,239 (65) | 988 (5) | 426 (3) | |
| Other | 11,033 (27) | 26,489 (65) | 2,112 (5) | 1,076 (3) | |
| Missing | 17,145 (42) | 20,216 (49) | 1,572 (4) | 2,007 (4) | |
| Age category | |||||
| <1 year | 10,788 (29) | 24,762 (65) | 1,164 (3) | 880 (3) | <0.001 |
| 1 through 5 years | 33,664 (42) | 39,531 (50) | 3,442 (4) | 2,673 (3) | |
| 6 through 11 years | 11,660 (50) | 9,684 (41) | 1,085 (5) | 1,015 (4) | |
| >12 years | 7,885 (49) | 6,249 (39) | 1,221 (8) | 714 (4) | |
| Hospital type | |||||
| Urban non‐teaching | 22,429 (44) | 24,241 (49) | 2,440 (5) | 1,555 (2) | <0.001 |
| Rural | 10,880 (34) | 18,396 (58) | 1,290 (4) | 1,109 (3) | |
| Urban teaching non‐children's | 13,130 (44) | 14,542 (48) | 1,721 (6) | 750 (2) | |
| Urban teaching children's | 16,591 (40) | 21,544 (53) | 1,417 (3) | 1,465 (4) | |
| Region | |||||
| Northeast | 12,364 (52) | 9,620 (40) | 1,466 (6) | 377 (2) | <0.001 |
| Midwest∥ | 17,891 (50) | 15,573 (43) | 1,160 (3) | 1,215 (3) | |
| South∥ | 21,479 (33) | 38,112 (58) | 3,108 (5) | 2,495 (4) | |
| West∥ | 12,263 (39) | 16,921 (44) | 1,178 (5) | 1,195 (5) | |
| Asthma | 10,829 (41) | 13,923 (52) | 1,119 (4) | 866 (3) | 0.193 |
| Pneumonia‐associated complication | 5,416 (46) | 5,206 (45) | 532 (4) | 556 (5) | <0.001 |
| Died | 66 (34) | 115 (60) | 3 (1) | 8 (5) | 0.131 |
After examining the general and demographic characteristics, we then examined mean LOS for all children with CAP in each sample year (Table 3). The mean LOS for children with CAP was 3.44 days in 1997, with marginal decreases in subsequent years to a mean LOS of 3.18 days in 2006. The distribution of LOS for children with CAP revealed that nearly 70% of children were hospitalized for fewer than 3 days, another 22% to 28% were hospitalized for less than 1 week, and only 3% were hospitalized for more than 1 week. This distribution did not change substantially between 1997 and 2006. Next, we compared mean LOS by insurance type and race/ethnicity in unadjusted analyses. In each sample year, publicly insured children hospitalized with CAP had significantly longer LOS than privately insured children (P < 0.001). Similarly, in all years excepting 1997, uninsured children hospitalized with CAP had significantly shorter LOS than privately insured children. There were also significant racial differences in LOS for children with CAP, such that black children had longer LOS than white children with CAP. However, the large amount of missing data for race/ethnicity limited the robustness of this finding, and subsequent sensitivity analyses demonstrated that there were no consistent racial/ethnic disparities in LOS (see Supporting Appendix B in the online version of this article). These sensitivity analyses for missing race data did not alter our primary finding of shorter LOS for uninsured versus publicly or privately insured children.
| 1997 | P | 2000 | P | 2003 | P | 2006 | P | |
|---|---|---|---|---|---|---|---|---|
| ||||||||
| Overall | 3.44 (0.04) | 3.35 (0.05) | 3.27 (0.05) | 3.18 (0.04) | ||||
| Insurance type | ||||||||
| Private | 3.21 (0.04) | 3.19 (0.04) | 3.09 (0.04) | 3.00 (0.03) | ||||
| Public | 3.71 (0.06) | <0.001 | 3.57 (0.06) | <0.001 | 3.44 (0.06) | <0.001 | 3.34 (0.05) | <0.001 |
| Uninsured | 3.18 (0.14) | 0.792 | 2.92 (0.07) | <0.001 | 2.80 (0.05) | <0.001 | 2.82 (0.05) | <0.001 |
| Other | 3.32 (0.11) | 0.319 | 3.55 (0.14) | 0.0134 | 3.54 (0.21) | 0.037 | 3.42 (0.13) | 0.001 |
| Race | ||||||||
| White | 3.31 (0.05) | 3.18 (0.04) | 3.19 (0.05) | 3.10 (0.04) | ||||
| Black | 3.61 (0.08) | <0.001 | 3.32 (0.07) | <0.001 | 3.36 (0.08) | <0.001 | 3.31 (0.07) | <0.001 |
| Other | 3.96 (0.11) | <0.001 | 3.81 (0.09) | <0.001 | 3.67 (0.10) | <0.001 | 3.56 (0.08) | <0.001 |
| Missing | 3.27 (0.08) | 0.645 | 3.18 (0.08) | 0.926 | 2.99 (0.06) | 0.0134 | 2.86 (0.04) | <0.001 |
After controlling for child age, race/ethnicity, gender, hospital type, transfer status, and presence of asthma or pneumonia‐associated complications, our multivariable analyses examining the relationship between insurance coverage and hospital LOS yielded the following results (Table 4). First, publicly insured children had significantly longer hospital stays than privately insured children, and uninsured children had significantly shorter hospital stays than privately insured children in all years except 1997. Second, children admitted with CAP at urban teaching children's hospitals had significantly longer LOS than those admitted to urban non‐teaching hospitals, and, in 2003, children admitted with CAP to rural hospitals had significantly shorter LOS than those admitted to urban non‐teaching hospitals. Third, children older than 1 year consistently had shorter hospital stays than infants less than 1 year old. Finally, though concomitant diagnosis of asthma did not consistently influence LOS, children who developed any complications had significantly longer LOS than those who did not. The cumulative impact of seemingly small differences in LOS is great. For example, in 2006, our model suggests that, for every 1000 children hospitalized with CAP in a given year, after adjusting for differences in sex, age, race, hospital‐type, region, transfer status, and diagnosis of asthma or complications, publicly insured children spend 90 to 130 more days in the hospital than privately insured children, whereas uninsured children spend between 40 to 90 fewer days in the hospital than privately insured children.
| 1997 | 2000 | 2003 | 2006 | |
|---|---|---|---|---|
| Variable | IRR (95% CI) | IRR (95% CI) | IRR (95% CI) | IRR (95% CI) |
| ||||
| Age category | ||||
| <1 year | ||||
| 15 years | 0.82 (0.81, 0.84) | 0.83 (0.88, 0.95) | 0.86 (0.85, 0.88) | 0.87 (0.86, 0.89) |
| 611 years | 0.91 (0.87, 0.95) | 0.91 (0.88, 0.94) | 0.93 (0.91, 0.95) | 0.93 (0.90, 0.95) |
| >12 years | 1.03 (0.99, 1.07) | 1.17 (1.11, 1.22) | 1.09 (1.06, 1.13) | 1.13 (1.09, 1.16) |
| Race | ||||
| White | ||||
| Black | 1.04 (0.99, 1.08) | 1.00 (0.95, 1.03) | 1.00 (0.98, 1.03) | 1.02 (0.98, 1.06) |
| Other | 1.09 (1.05, 1.13) | 1.11 (1.08, 1.15) | 1.09 (1.06, 1.12) | 1.08 (1.05, 1.11) |
| Missing | 1.00 (0.94, 1.06) | 1.01 (0.96, 1.06) | 0.95 (0.92, 0.99)* | 0.96 (0.93, 0.99) |
| Sex | ||||
| Female | 1.02 (0.94, 1.06) | 1.01 (0.99, 1.02) | 1.01(0.93, 100) | 1.01 (1.00, 1.02) |
| Insurance type | ||||
| Private | ||||
| Public | 1.13 (1.11, 1.16) | 1.11 (1.09, 1.14) | 1.11 (1.09, 1.13) | 1.11 (1.09, 1.13) |
| Uninsured | 1.01 (0.91, 1.11) | 0.93 (0.89, 0.96) | 0.92 (0.90, 0.96) | 0.94 (0.91, 0.96) |
| Other | 1.01 (0.96, 1.06) | 1.10 (1.03, 1.18) | 1.10 (1.02, 1.19)* | 1.07 (1.02, 1.13) |
| Hospital type | ||||
| Urban non‐teaching | ||||
| Rural | 0.98 (0.92, 1.04) | 0.96 (0.92, 1.00) | 0.97 (0.94, 1.00) | 0.97 (0.93, 1.00) |
| Urban teaching (non‐children's) | 0.99 (0.95, 1.04) | 1.06 (1.02, 1.10) | 1.06 (1.02, 1.10) | 1.03 (0.99, 1.07) |
| Urban teaching children's | 1.2 (1.14, 1.26) | 1.23 (1.16, 1.30) | 1.28 (1.21, 1.37) | 1.25 (1.19, 1.31) |
| Region | ||||
| Northeast | ||||
| Midwest | 0.93 (0.88, 0.98)* | 0.96 (0.92, 1.00) | 0.95 (0.91, 0.99)* | 0.95 (0.91, 0.99)* |
| South | 0.98 (0.94, 1.02) | 1.06 (1.02, 1.10)* | 1.04 (1.00, 1.09) | 1.03 (0.98, 1.08) |
| West | 0.97 (0.92, 1.01) | 1.22 (1.16, 1.30)* | 1.02 (0.97, 1.08) | 1.06 (1.00, 1.12)* |
| Transfer status | ||||
| Transfer | 1.35 (1.25, 1.46) | 1.39 (1.27, 1.52) | 1.31 (1.23, 1.37 ) | 1.16 (1.10, 1.23) |
| Asthma | 0.99 (0.96, 1.03) | 0.97 (0.95, 0.99) | 0.98 (0.96, 1.00) | 0.98 (0.97, 1.00)* |
| Pneumonia Complications | 0.99 (0.96, 1.03) | 0.97 (0.95, 0.99)* | 0.98 (0.96, 1.0) | 0.98 (0.97, 1.00)* |
| Any complication | 2.20 (2.07, 2.34) | 2.23 (2.07, 2.40) | 2.22 (2.22, 2.44) | 2.37 (2.27, 2.47) |
DISCUSSION
In this nationally representative sample selected over the past 10 years, we found that publicly insured children hospitalized with CAP have significantly longer LOS than those who are privately insured, and that, since 2000, uninsured children hospitalized with CAP have significantly shorter LOS than those who are privately insured. Though these observed differences are small, they are consistent across all 4 sampled years and, because CAP is one of the most common pediatric inpatient diagnoses, the cumulative impact of the observed differences on hospital LOS is great. Insurance status is often considered a proxy for access to preventive and ambulatory healthcare services or socioeconomic status. However, the underlying mechanisms relating insurance status to healthcare access, utilization, and ultimately, health outcomes are highly complex and difficult to elucidate.17 The observed variation in this study raises questions about the potential influence of insurance status on hospital discharge practices. Additional research is necessary to understand whether there are differences in processes of care (eg, performance of blood cultures or chest radiographs), quality of care, or other outcomes, such as readmissions, related to CAP inpatient management for children with different insurance coverage.
Apart from differences in hospital discharge practices, another possible explanation for uninsured children with CAP having shorter LOS is that these children have less severe disease than privately insured. This may occur if uninsured children with CAP are evaluated in the emergency department rather than the office setting, because emergency department providers may be more likely to admit children with CAP who lack a consistent access to ambulatory primary care services. Countering this alternative, prior studies have shown that uninsured groups are more likely to have greater disease severity than privately insured groups at the time of hospital admission.18, 19 In this study, we attempted to identify children with greater severity of disease using ICD‐9 codes for CAP‐associated complications. Though this is a relatively crude method that might lead to an underestimate of the total number of children with complications, we found that there were no significant differences in the prevalence of CAP‐associated complications between uninsured and insured groups in all sampled years.
On the other hand, uninsured patients may be released earlier by providers in order to reduce the amount of uncompensated care provided, or possibly because parents may urge providers to discharge their children, given their inability to pay forthcoming hospital bills and/or avoid further lost wages due to work absence.20, 21 In California, Bindman et al. demonstrated that decreasing the frequency of Medicaid recertification, and consequently increasing the likelihood of continuous insurance coverage, was associated with a decreased risk of hospitalization for ambulatory‐care sensitive conditions.5
We also found that children admitted to urban teaching children's hospitals with CAP had significantly longer LOS than those admitted to urban non‐teaching hospitals, whereas children in rural hospitals had significantly shorter LOS than those in urban non‐teaching hospitals in 2003. These findings are consistent with prior data from 1996 to1998 demonstrating that children admitted to rural hospitals in New York and Pennsylvania had significantly shorter LOS than large urban hospitals for 19 medical and 9 surgical conditions, including pneumonia.12 These findings may reflect underlying differences in between rural and urban hospital transfer practices, whereby rural hospitals may be more likely than urban hospitals to transfer children with relatively more severe illness to urban referral centers and retain children with less severe illness, leading to shorter LOS.12 Though our empiric understanding of differences in LOS between teaching and non‐teaching hospitals is currently limited, clinical experience supports the notion that there may be decreases in efficiency that occur in teaching hospitals, and are a result of the supervision required for care provided by trainees. It is also possible that, despite our exclusion of comorbid conditions, some children with complex or chronic medical conditions were included in this study. These children are often cared for at teaching hospitals, regardless of the primary cause for admission, and are more likely to have public insurance than other children, thus confounding the relationship between hospital type, insurance type and status, and LOS for children with CAP. The limitations of this dataset preclude further examination of this issue.
There are some limitations to this study. First, the KID data are cross‐sectional and causal inferences are limited. However, our results demonstrating that uninsured children hospitalized with CAP had shorter LOS than privately insured children were quite consistent in each sample year, suggesting that our results are a true association. Additionally, insurance status in KID is typically collected at admission, however, it is not possible to determine whether specific changes to insurance status that occurred during the hospitalization were applied to the data. The impact of this limitation would depend on the type of insurance obtained by the patient. If uninsured patients obtained public insurance, our study would underestimate the increased LOS for publicly insured patients, compared with privately insured patients, but have no effect on the difference in LOS between uninsured and privately insured patients. In the unlikely event that uninsured patients obtained private insurance, then our study would underestimate the difference for uninsured patients, compared with privately insured patients, biasing our current study results towards the null. Second, a substantial proportion of sampled children had missing data for race/ethnicity. To assess the impact of the missing race/ethnicity data on our results, we conducted sensitivity analyses and found that, though difficult to make any definitive conclusions about the relationship between race/ethnicity and LOS for children with CAP, there were no changes to our primary findings regarding differences in LOS between children with different insurance status and type. Third, KID does not include data about other unmeasured confounders (eg, parent income, parent education, regular source of care) that might be related to LOS, as well as a broad spectrum of pediatric outcomes. Serious consideration of expanding KID to include these variables is warranted. Fourth, the other category of insurance is not uniformly coded across states in the KID database. While some states use this category to classify public insurance options other than Medicare and Medicaid, other states include private insurance options in this group. Thus, it is possible that some patients with public insurance are misclassified as having other insurance. We would expect such misclassification to bias our findings towards the null hypothesis. Finally, we focused on the relationship between child health insurance status and CAP, only 1 ambulatory care‐sensitive condition. Additional research examining the relationship between insurance type and other ambulatory care‐sensitive conditions is warranted.
In summary, we found that, after multivariable adjustment, uninsured children hospitalized with community‐acquired pneumonia had significantly shorter LOS than privately insured children, and publicly insured children had a significantly longer hospital stay than privately insured children in these 4 nationally representative samples from 1997 to 2006. Current federal and state efforts to increase enrollment of children into insurance programs are a first step in reducing healthcare disparities. However, insurance coverage alone does not guarantee access to healthcare, thus, these efforts in isolation will likely be insufficient to achieve optimal health for the children of our country. As healthcare reform legislation is implemented, these findings provide hospitals and policy makers additional impetus to develop ways to achieve the ideal length of stay for every child; this ideal state will be achieved when clinical status and course, rather than nonclinical factors such as insurance type or provider's unease with ambulatory follow‐up, determine the duration of hospitalization for every child.
- ,,,,,.Recurrent urinary tract infections in children: risk factors and association with prophylactic antimicrobials.JAMA.2007;298:179–186.
- ,.Factors associated with variability in outcomes for children hospitalized with urinary tract infection.J Pediatr.2009;154:789–796.
- ,,,,.Intravenous immunoglobulin in children with streptococcal toxic shock syndrome.Clin Infect Dis.2009;49:1369–1376.
- ,,.Pediatric hospital adherence to the standard of care for acute gastroenteritis.Pediatrics.2009;124:e1081–e1087.
- ,,.Medicaid re‐enrollment policies and children's risk of hospitalizations for ambulatory care sensitive conditions.Med Care.2008;46:1049–1054.
- ,.Differences associated with age, transfer status, and insurance coverage in end‐of‐life hospital care for children.J Hosp Med.2008;3:376–383.
- ,,,,,.Health care for children and youth in the United States: annual report on patterns of coverage, utilization, quality, and expenditures by a county level of urban influence.Ambul Pediatr.2006;6:241–264.
- ,,.Lengths of stay and costs associated with children's hospitals.Pediatrics.2005;115:839–844.
- ,.Variation in hospital discharges for ambulatory care‐sensitive conditions among children.Pediatrics.2000;106:942–948.
- ,,,,,.Ambulatory visit rates and antibiotic prescribing for children with pneumonia, 1994–2007.Pediatrics.2011;127:411–418.
- ,,,,.Patterns of hospital‐based pediatric care across diverse ethnicities: the case of pneumonia.J Health Care Poor Underserved.2004;15:462–473.
- ,,,,.Equivalent lengths of stay of pediatric patients hospitalized in rural and nonrural hospitals.Pediatrics.2004;114:e400–e408.
- ,.Effect of Child Health Insurance Plan enrollment on the utilization of health care services by children using a public safety net system.Pediatrics.2002;110:940–945.
- ,,,,,.Relationships between welfare status, health insurance status, and health and medical care among children with asthma.Am J Public Health.2002;92:1446–1452.
- HCUP Kids' Inpatient Database (KID). Healthcare Cost and Utilization Project (HCUP), 1997, 2000, 2003, 2006. Agency for Healthcare Research and Quality. Available at: http://www.hcup‐us.ahrq.gov/kidoverview.jsp. Accessed May 17,2010.
- ,,, et al.Community‐acquired pneumonia: can it be defined with claims data?Am J Med Qual.1997;12:187–193.
- .Sicker and poorer—the consequences of being uninsured: a review of the research on the relationship between health insurance, medical care use, health, work, and income.Med Care Res Rev.2003;60:3S–75S; discussion76S–112S.
- ,,,,,.Socioeconomic variation in asthma hospitalization: excess utilization or greater need?Pediatrics.1999;103:e75.
- ,,, et al.Analysis of 23 million US hospitalizations: uninsured children have higher all‐cause in‐hospital mortality.J Public Health (Oxf).2010;32(2)236–244.
- ,.The impact of welfare reform on parents' ability to care for their children's health.Am J Public Health.1999;89:502–505.
- ,,.Knowledge of welfare reform program provisions among families of children with chronic conditions.Am J Public Health.2002;92:228–230.
Disparities in patterns of care and outcomes for ambulatory‐care sensitive conditions remain a persistent problem for children.19 Many studies have focused on disparities in hospitalization rates and length of stay (LOS) related to asthma, however, few studies have focused on community‐acquired pneumonia (CAP) despite the fact that pneumonia is the most common, preventable, and potentially serious infection in childhood.10 Providers, payers, and families have a common interest in minimizing hospital LOS for different reasons (eg, minimizing costs, lost wages, exposure to antibiotic‐resistant bacteria), however, this interest is balanced against the potentially greater risk of readmission and adverse outcomes if LOS is inappropriately short. To date, the relationship between insurance status and LOS for CAP remains unexplored.
As in other conditions, substantial variation exists with respect to patterns of care and outcomes for children hospitalized with CAP.11 For example, children hospitalized in rural settings have a shorter LOS for pneumonia than those hospitalized in large urban settings.12 Children from racial/ethnic minorities tend to have higher rates of CAP‐associated complications, including death.11 Decades of prior studies have documented that uninsured children are less likely than insured children to make preventive care visits and obtain prescription medications, but differences in LOS or hospitalization rates between insured and uninsured children with CAP have not been studied.6, 8, 13, 14 Though imperfect, insurance status is 1 proxy for healthcare access, and current healthcare reform efforts aim to improve healthcare access and decrease socioeconomic gradients in health by increasing the number of insured American children. Nonetheless, quantifying the relationship between insurance status on LOS for children hospitalized with CAP is a first step towards understanding the influence of ambulatory care access on hospitalization for ambulatory‐care sensitive conditions.
The purpose of this study was to investigate the influence of insurance status and type on LOS for children hospitalized with CAP. In addition, we sought to determine if there were consistent trends over time in the association between insurance status and type with LOS for children hospitalized with CAP.
METHODS
Study Design and Data Source
This retrospective cross‐sectional study used data from the 1997, 2000, 2003, and 2006 Kids' Inpatient Database (KID). The KID is part of the Healthcare Cost and Utilization Project sponsored by the Agency for Healthcare Research and Quality (AHRQ). It is the only dataset on hospital use and outcomes specifically designed to study children's use of hospital services in the United States. The KID samples pediatric discharges from all community non‐rehabilitation hospitals in states participating in the Healthcare Cost and Utilization Project, using a complex stratification system, across pediatric discharge type and hospital characteristics. Community hospitals in the KID are defined as all non‐federal, short‐term, general and other specialty hospitals, including academic medical centers, obstetrics‐gynecology, otolaryngology, orthopedic, and children's hospitals. Federal hospitals, long‐term hospitals, psychiatric hospitals, alcohol/chemical dependency treatment facilities and hospitals units within institutions are excluded. Discharge‐level weights assigned to discharges within the stratum permit calculation of national estimates. Datasets, which each contain approximately 3 million discharges (unweighted), are released every 3 years beginning with 1997. The 2006 KID is the most recently available dataset and contains hospital administrative data from 38 states, representing 88.8% of the estimated US population.15 This study was considered exempt from review by the Committees for the Protection of Human Subjects at The Children's Hospital of Philadelphia.
Study Participants
Patients 18 years of age and younger were eligible for inclusion if they required hospitalization for CAP in 1997, 2000, 2003, or 2006. Using a previously validated algorithm, patients were considered as having CAP if they met 1 of 2 criteria: 1) International Classification of Diseases, 9th Revision, Clinical Modification (ICD‐9 CM) primary diagnosis code indicating pneumonia (480‐483, 485‐486), empyema (510), or pleurisy (511.0‐1, 511.9); or 2) primary diagnosis of pneumonia‐related symptom (eg, cough, fever, tachypnea) and secondary diagnosis of pneumonia, empyema or pleurisy. Pneumonia‐related symptoms included fever, respiratory abnormality unspecified, shortness of breath, tachypnea, wheezing, cough, hemoptysis, abnormal sputum, chest pain, and abnormal chest sounds.16 Because there is no specific ICD‐9 code for nosocomial pneumonia, this previously validated approach minimized such misclassification16 (eg, a child hospitalized following traumatic injury who then develops ventilator‐associated pneumonia is likely to have trauma, rather than pneumonia or a pneumonia‐related symptom, listed as the primary diagnosis). Patients with the following comorbid conditions (identified by KID data elements and ICD‐9 CM codes) were excluded as these comorbidities are characterized by risk factors not reflective of the general pediatric population: acquired and congenital immunologic disorders, malignancy, collagen vascular disease, sickle cell disease, cystic fibrosis, organ transplant, congenital heart defects, and heart failure. Patients identified as in‐hospital births were excluded to minimize the inclusion of perinatally acquired and nosocomial infections occurring in neonates. Patients with a secondary diagnosis code indicating trauma were also excluded, as a diagnosis of pneumonia in this population likely reflects nosocomial etiology. CAP‐related complications (eg, effusion, abscess; for complete list, see Supporting Appendix A in the online version of this article) were identified using ICD‐9 CM diagnosis and procedure codes. Asthma‐related hospitalizations were identified using ICD‐9 CM diagnosis code 493 in any secondary diagnosis field.
Primary Exposure
The primary exposure was insurance type, categorized as private, public, uninsured, or other (eg, Civilian Health and Medical Program Uniform Service (CHAMPUS), worker's compensation, union‐based insurance, but definition varies by state precluding categorization as purely public or private).
Primary Outcome
The primary outcome was the hospital LOS calculated in days.
Statistical Analysis
Consistent with prior work,12 subjects were characterized by age, race, sex, the presence or absence of a pneumonia‐associated complication, discharge status (discharge from hospital vs in‐hospital death), hospital type (rural, urban non‐teaching, urban teaching non‐children's, urban teaching children's), and hospital region (Northeast, Midwest, South, West). Age groups for analysis were defined as <1 year (infant), 1 to 5 years (preschool age), 6 to 11 years (school‐age), and 12 to 18 years old (adolescent). Race was recorded as a single variable (white, black, other, and missing). Patient information for race was missing from 32% of discharges in 1997, 18% in 2000, 29% in 2003, and 26% in 2006. Patients with missing race data were included to preserve the integrity of our estimates. Categorical variables were summarized by frequencies and percents. Continuous variables were summarized by mean and standard deviation values.
All analyses accounted for the complex sampling design with the survey commands included in STATA, version 10 (College Station, TX) to produce weighted estimates. To determine the adjusted impact of patient and hospital‐level characteristics in our cohort, we constructed multivariable negative binomial regression models using all available covariates for LOS because of its rightward‐skewed distribution. The negative binomial model produced an incident rate ratio (IRR) for LOS (IRR >1 indicates that the risk factor is associated with a longer length of stay). As recommended in the AHRQ technical documentation, variance estimates for each model accounted for the clustering of data at the hospital level. To address the impact of missing race data on outcome, we constructed additional multivariable negative binomial regression models while varying the underlying assumptions about race classification. In these secondary analyses, children with race coded as missing were sequentially excluded, assumed to be white, and assumed to be black. These analyses were repeated after excluding insurance from the multivariable model.
RESULTS
The more than 10.5 million children sampled (unweighted) in KID during these 4 time periods (1997, 2000, 2003, and 2006) are representative of the more than 28.9 million children hospitalized in the United States. In each of these sample years, there were approximately 150,000 children hospitalized with pneumonia across the United States (Table 1). Of those hospitalized, 23% to 28% had a concomitant diagnosis of asthma; 6% to 8% had a pneumonia‐associated complication; and mortality was <0.01% in each sample year for patients hospitalized with pneumonia. In all years, among those with racial/ethnic data, the sample population was predominantly white boys less than 6 years old. The greatest proportion of children were hospitalized in urban non‐teaching settings, and also those children living in the southern regions of the United States.
| 1997 | 2000 | 2003 | 2006 | |
|---|---|---|---|---|
| N = 148,702 | N = 157,847 | N = 157,743 | N = 156,810 | |
| ||||
| Race | ||||
| White | 56,348 (38) | 68,643 (44) | 54,903 (35) | 56,108 (36) |
| Black | 22,864 (15) | 22,580 (14) | 17,960 (11) | 18,800 (12) |
| Other | 22,203 (15) | 38,448 (24) | 39,138 (25) | 40,803 (26) |
| Missing | 47,287 (32) | 28,175 (18) | 45,588 (29) | 41,099 (26) |
| Age category | ||||
| <1 year | 43,851 (29) | 44,470 (28) | 37,798 (24) | 37,705 (24) |
| 1 through 5 years | 75,033 (50) | 76,385 (48) | 77,530 (49) | 79,519 (51) |
| 6 through 11 years | 19,372 (13) | 21,403 (14) | 23,126 (15) | 23,494 (15) |
| >12 years | 10,446 (7) | 15,589 (9) | 19,289 (12) | 16,092 (10) |
| Hospital type | ||||
| Urban non‐teaching | 52,756 (35) | 50,718 (32) | 52,552 (34) | 50,718 (32) |
| Rural | 47,910 (32) | 41,715 (27) | 39,605 (26) | 31,947 (21) |
| Urban teaching non‐children's | 20,378 (14) | 30,981 (20) | 28,432 (18) | 30,194 (20) |
| Urban teaching children's | 27,658 (19) | 34,021 (22) | 34,454 (22) | 41,035 (27) |
| Male sex | 83,291 (56) | 8,783 (56) | 86,034 (55) | 85,508 (55) |
| Region* | ||||
| Northeast | 19,750 (13) | 26,092 (17) | 23,867 (15) | 23,832 (15) |
| Midwest | 33,053 (22) | 30,706 (19) | 35,714 (23) | 35,900 (23) |
| South | 68,958 (46) | 68,663 (44) | 65,994 (42) | 65,460 (42) |
| West | 26,741 (18) | 32,385 (21) | 32,169 (20) | 31,618 (20) |
| Asthma | 26,971 (24) | 31,746 (28) | 27,729 (24) | 26,822 (23) |
| Pneumonia‐associated complication | 8,831 (6) | 11,084 (7) | 12,005 (8) | 11,724 (7) |
| Died | 334 (0.002) | 394 (0.002) | 270 (0.002) | 193 (0.001) |
| Insurance | ||||
| Private | 65,428 (44) | 73,528 (47) | 68,720 (44) | 63,997 (41) |
| Public | 68,024 (46) | 71,698 (45) | 76,779 (49) | 80,226 (51) |
| Uninsured | 9,922 (7) | 8,336 (5) | 6,381 (4) | 6,912 (4) |
| Other | 4,964 (3) | 4,285 (3) | 5,391 (3) | 5,283 (3) |
There was little variation in the insurance status of children hospitalized with CAP between 1997 and 2006. In each of the sampled years, at least 40% of sampled children were privately insured, at least 40% were publicly insured, and approximately 5% were uninsured (Table 1). In all years, there were significant racial/ethnic disparities in insurance coverage such that whites were 4 to 6 times more likely to have private insurance than blacks, however, the large amount of missing race/ethnicity data warrant caution in interpreting this finding (Table 2; also see Supporting Information Appendix B in the online version of this article). We also found that children less than 1 year old were the most likely to be publicly insured in all years (see Supporting Appendix C in the online version of this article). There were also regional differences related to insurance coverage such that a greater proportion of children hospitalized in facilities located in the southern part of the United States were publicly insured. Notably, there were no significant differences in CAP‐associated mortality or asthma related to insurance coverage (Table 2). In 2006, CAP‐associated complications occurred in 8.5% of children with private insurance, 6.5% of children with public insurance, and 7.7% of uninsured children; the relative distribution of complications by insurance type were similar in previous years of the KID survey.
| Private | Public | Uninsured | Other Insurance | P | |
|---|---|---|---|---|---|
| |||||
| No. of children (%) | 63,997 (41) | 80,226 (51) | 6,912 (4) | 5,283 (3) | |
| Male sex | 34,639 (41) | 44,140 (52) | 3,727 (4) | 2,808 (3) | 0.092 |
| Race | |||||
| White | 30,707 (55) | 21,282 (38) | 2,241 (4) | 1,774 (3) | <0.001 |
| Black* | 5,112 (27) | 12,239 (65) | 988 (5) | 426 (3) | |
| Other | 11,033 (27) | 26,489 (65) | 2,112 (5) | 1,076 (3) | |
| Missing | 17,145 (42) | 20,216 (49) | 1,572 (4) | 2,007 (4) | |
| Age category | |||||
| <1 year | 10,788 (29) | 24,762 (65) | 1,164 (3) | 880 (3) | <0.001 |
| 1 through 5 years | 33,664 (42) | 39,531 (50) | 3,442 (4) | 2,673 (3) | |
| 6 through 11 years | 11,660 (50) | 9,684 (41) | 1,085 (5) | 1,015 (4) | |
| >12 years | 7,885 (49) | 6,249 (39) | 1,221 (8) | 714 (4) | |
| Hospital type | |||||
| Urban non‐teaching | 22,429 (44) | 24,241 (49) | 2,440 (5) | 1,555 (2) | <0.001 |
| Rural | 10,880 (34) | 18,396 (58) | 1,290 (4) | 1,109 (3) | |
| Urban teaching non‐children's | 13,130 (44) | 14,542 (48) | 1,721 (6) | 750 (2) | |
| Urban teaching children's | 16,591 (40) | 21,544 (53) | 1,417 (3) | 1,465 (4) | |
| Region | |||||
| Northeast | 12,364 (52) | 9,620 (40) | 1,466 (6) | 377 (2) | <0.001 |
| Midwest∥ | 17,891 (50) | 15,573 (43) | 1,160 (3) | 1,215 (3) | |
| South∥ | 21,479 (33) | 38,112 (58) | 3,108 (5) | 2,495 (4) | |
| West∥ | 12,263 (39) | 16,921 (44) | 1,178 (5) | 1,195 (5) | |
| Asthma | 10,829 (41) | 13,923 (52) | 1,119 (4) | 866 (3) | 0.193 |
| Pneumonia‐associated complication | 5,416 (46) | 5,206 (45) | 532 (4) | 556 (5) | <0.001 |
| Died | 66 (34) | 115 (60) | 3 (1) | 8 (5) | 0.131 |
After examining the general and demographic characteristics, we then examined mean LOS for all children with CAP in each sample year (Table 3). The mean LOS for children with CAP was 3.44 days in 1997, with marginal decreases in subsequent years to a mean LOS of 3.18 days in 2006. The distribution of LOS for children with CAP revealed that nearly 70% of children were hospitalized for fewer than 3 days, another 22% to 28% were hospitalized for less than 1 week, and only 3% were hospitalized for more than 1 week. This distribution did not change substantially between 1997 and 2006. Next, we compared mean LOS by insurance type and race/ethnicity in unadjusted analyses. In each sample year, publicly insured children hospitalized with CAP had significantly longer LOS than privately insured children (P < 0.001). Similarly, in all years excepting 1997, uninsured children hospitalized with CAP had significantly shorter LOS than privately insured children. There were also significant racial differences in LOS for children with CAP, such that black children had longer LOS than white children with CAP. However, the large amount of missing data for race/ethnicity limited the robustness of this finding, and subsequent sensitivity analyses demonstrated that there were no consistent racial/ethnic disparities in LOS (see Supporting Appendix B in the online version of this article). These sensitivity analyses for missing race data did not alter our primary finding of shorter LOS for uninsured versus publicly or privately insured children.
| 1997 | P | 2000 | P | 2003 | P | 2006 | P | |
|---|---|---|---|---|---|---|---|---|
| ||||||||
| Overall | 3.44 (0.04) | 3.35 (0.05) | 3.27 (0.05) | 3.18 (0.04) | ||||
| Insurance type | ||||||||
| Private | 3.21 (0.04) | 3.19 (0.04) | 3.09 (0.04) | 3.00 (0.03) | ||||
| Public | 3.71 (0.06) | <0.001 | 3.57 (0.06) | <0.001 | 3.44 (0.06) | <0.001 | 3.34 (0.05) | <0.001 |
| Uninsured | 3.18 (0.14) | 0.792 | 2.92 (0.07) | <0.001 | 2.80 (0.05) | <0.001 | 2.82 (0.05) | <0.001 |
| Other | 3.32 (0.11) | 0.319 | 3.55 (0.14) | 0.0134 | 3.54 (0.21) | 0.037 | 3.42 (0.13) | 0.001 |
| Race | ||||||||
| White | 3.31 (0.05) | 3.18 (0.04) | 3.19 (0.05) | 3.10 (0.04) | ||||
| Black | 3.61 (0.08) | <0.001 | 3.32 (0.07) | <0.001 | 3.36 (0.08) | <0.001 | 3.31 (0.07) | <0.001 |
| Other | 3.96 (0.11) | <0.001 | 3.81 (0.09) | <0.001 | 3.67 (0.10) | <0.001 | 3.56 (0.08) | <0.001 |
| Missing | 3.27 (0.08) | 0.645 | 3.18 (0.08) | 0.926 | 2.99 (0.06) | 0.0134 | 2.86 (0.04) | <0.001 |
After controlling for child age, race/ethnicity, gender, hospital type, transfer status, and presence of asthma or pneumonia‐associated complications, our multivariable analyses examining the relationship between insurance coverage and hospital LOS yielded the following results (Table 4). First, publicly insured children had significantly longer hospital stays than privately insured children, and uninsured children had significantly shorter hospital stays than privately insured children in all years except 1997. Second, children admitted with CAP at urban teaching children's hospitals had significantly longer LOS than those admitted to urban non‐teaching hospitals, and, in 2003, children admitted with CAP to rural hospitals had significantly shorter LOS than those admitted to urban non‐teaching hospitals. Third, children older than 1 year consistently had shorter hospital stays than infants less than 1 year old. Finally, though concomitant diagnosis of asthma did not consistently influence LOS, children who developed any complications had significantly longer LOS than those who did not. The cumulative impact of seemingly small differences in LOS is great. For example, in 2006, our model suggests that, for every 1000 children hospitalized with CAP in a given year, after adjusting for differences in sex, age, race, hospital‐type, region, transfer status, and diagnosis of asthma or complications, publicly insured children spend 90 to 130 more days in the hospital than privately insured children, whereas uninsured children spend between 40 to 90 fewer days in the hospital than privately insured children.
| 1997 | 2000 | 2003 | 2006 | |
|---|---|---|---|---|
| Variable | IRR (95% CI) | IRR (95% CI) | IRR (95% CI) | IRR (95% CI) |
| ||||
| Age category | ||||
| <1 year | ||||
| 15 years | 0.82 (0.81, 0.84) | 0.83 (0.88, 0.95) | 0.86 (0.85, 0.88) | 0.87 (0.86, 0.89) |
| 611 years | 0.91 (0.87, 0.95) | 0.91 (0.88, 0.94) | 0.93 (0.91, 0.95) | 0.93 (0.90, 0.95) |
| >12 years | 1.03 (0.99, 1.07) | 1.17 (1.11, 1.22) | 1.09 (1.06, 1.13) | 1.13 (1.09, 1.16) |
| Race | ||||
| White | ||||
| Black | 1.04 (0.99, 1.08) | 1.00 (0.95, 1.03) | 1.00 (0.98, 1.03) | 1.02 (0.98, 1.06) |
| Other | 1.09 (1.05, 1.13) | 1.11 (1.08, 1.15) | 1.09 (1.06, 1.12) | 1.08 (1.05, 1.11) |
| Missing | 1.00 (0.94, 1.06) | 1.01 (0.96, 1.06) | 0.95 (0.92, 0.99)* | 0.96 (0.93, 0.99) |
| Sex | ||||
| Female | 1.02 (0.94, 1.06) | 1.01 (0.99, 1.02) | 1.01(0.93, 100) | 1.01 (1.00, 1.02) |
| Insurance type | ||||
| Private | ||||
| Public | 1.13 (1.11, 1.16) | 1.11 (1.09, 1.14) | 1.11 (1.09, 1.13) | 1.11 (1.09, 1.13) |
| Uninsured | 1.01 (0.91, 1.11) | 0.93 (0.89, 0.96) | 0.92 (0.90, 0.96) | 0.94 (0.91, 0.96) |
| Other | 1.01 (0.96, 1.06) | 1.10 (1.03, 1.18) | 1.10 (1.02, 1.19)* | 1.07 (1.02, 1.13) |
| Hospital type | ||||
| Urban non‐teaching | ||||
| Rural | 0.98 (0.92, 1.04) | 0.96 (0.92, 1.00) | 0.97 (0.94, 1.00) | 0.97 (0.93, 1.00) |
| Urban teaching (non‐children's) | 0.99 (0.95, 1.04) | 1.06 (1.02, 1.10) | 1.06 (1.02, 1.10) | 1.03 (0.99, 1.07) |
| Urban teaching children's | 1.2 (1.14, 1.26) | 1.23 (1.16, 1.30) | 1.28 (1.21, 1.37) | 1.25 (1.19, 1.31) |
| Region | ||||
| Northeast | ||||
| Midwest | 0.93 (0.88, 0.98)* | 0.96 (0.92, 1.00) | 0.95 (0.91, 0.99)* | 0.95 (0.91, 0.99)* |
| South | 0.98 (0.94, 1.02) | 1.06 (1.02, 1.10)* | 1.04 (1.00, 1.09) | 1.03 (0.98, 1.08) |
| West | 0.97 (0.92, 1.01) | 1.22 (1.16, 1.30)* | 1.02 (0.97, 1.08) | 1.06 (1.00, 1.12)* |
| Transfer status | ||||
| Transfer | 1.35 (1.25, 1.46) | 1.39 (1.27, 1.52) | 1.31 (1.23, 1.37 ) | 1.16 (1.10, 1.23) |
| Asthma | 0.99 (0.96, 1.03) | 0.97 (0.95, 0.99) | 0.98 (0.96, 1.00) | 0.98 (0.97, 1.00)* |
| Pneumonia Complications | 0.99 (0.96, 1.03) | 0.97 (0.95, 0.99)* | 0.98 (0.96, 1.0) | 0.98 (0.97, 1.00)* |
| Any complication | 2.20 (2.07, 2.34) | 2.23 (2.07, 2.40) | 2.22 (2.22, 2.44) | 2.37 (2.27, 2.47) |
DISCUSSION
In this nationally representative sample selected over the past 10 years, we found that publicly insured children hospitalized with CAP have significantly longer LOS than those who are privately insured, and that, since 2000, uninsured children hospitalized with CAP have significantly shorter LOS than those who are privately insured. Though these observed differences are small, they are consistent across all 4 sampled years and, because CAP is one of the most common pediatric inpatient diagnoses, the cumulative impact of the observed differences on hospital LOS is great. Insurance status is often considered a proxy for access to preventive and ambulatory healthcare services or socioeconomic status. However, the underlying mechanisms relating insurance status to healthcare access, utilization, and ultimately, health outcomes are highly complex and difficult to elucidate.17 The observed variation in this study raises questions about the potential influence of insurance status on hospital discharge practices. Additional research is necessary to understand whether there are differences in processes of care (eg, performance of blood cultures or chest radiographs), quality of care, or other outcomes, such as readmissions, related to CAP inpatient management for children with different insurance coverage.
Apart from differences in hospital discharge practices, another possible explanation for uninsured children with CAP having shorter LOS is that these children have less severe disease than privately insured. This may occur if uninsured children with CAP are evaluated in the emergency department rather than the office setting, because emergency department providers may be more likely to admit children with CAP who lack a consistent access to ambulatory primary care services. Countering this alternative, prior studies have shown that uninsured groups are more likely to have greater disease severity than privately insured groups at the time of hospital admission.18, 19 In this study, we attempted to identify children with greater severity of disease using ICD‐9 codes for CAP‐associated complications. Though this is a relatively crude method that might lead to an underestimate of the total number of children with complications, we found that there were no significant differences in the prevalence of CAP‐associated complications between uninsured and insured groups in all sampled years.
On the other hand, uninsured patients may be released earlier by providers in order to reduce the amount of uncompensated care provided, or possibly because parents may urge providers to discharge their children, given their inability to pay forthcoming hospital bills and/or avoid further lost wages due to work absence.20, 21 In California, Bindman et al. demonstrated that decreasing the frequency of Medicaid recertification, and consequently increasing the likelihood of continuous insurance coverage, was associated with a decreased risk of hospitalization for ambulatory‐care sensitive conditions.5
We also found that children admitted to urban teaching children's hospitals with CAP had significantly longer LOS than those admitted to urban non‐teaching hospitals, whereas children in rural hospitals had significantly shorter LOS than those in urban non‐teaching hospitals in 2003. These findings are consistent with prior data from 1996 to1998 demonstrating that children admitted to rural hospitals in New York and Pennsylvania had significantly shorter LOS than large urban hospitals for 19 medical and 9 surgical conditions, including pneumonia.12 These findings may reflect underlying differences in between rural and urban hospital transfer practices, whereby rural hospitals may be more likely than urban hospitals to transfer children with relatively more severe illness to urban referral centers and retain children with less severe illness, leading to shorter LOS.12 Though our empiric understanding of differences in LOS between teaching and non‐teaching hospitals is currently limited, clinical experience supports the notion that there may be decreases in efficiency that occur in teaching hospitals, and are a result of the supervision required for care provided by trainees. It is also possible that, despite our exclusion of comorbid conditions, some children with complex or chronic medical conditions were included in this study. These children are often cared for at teaching hospitals, regardless of the primary cause for admission, and are more likely to have public insurance than other children, thus confounding the relationship between hospital type, insurance type and status, and LOS for children with CAP. The limitations of this dataset preclude further examination of this issue.
There are some limitations to this study. First, the KID data are cross‐sectional and causal inferences are limited. However, our results demonstrating that uninsured children hospitalized with CAP had shorter LOS than privately insured children were quite consistent in each sample year, suggesting that our results are a true association. Additionally, insurance status in KID is typically collected at admission, however, it is not possible to determine whether specific changes to insurance status that occurred during the hospitalization were applied to the data. The impact of this limitation would depend on the type of insurance obtained by the patient. If uninsured patients obtained public insurance, our study would underestimate the increased LOS for publicly insured patients, compared with privately insured patients, but have no effect on the difference in LOS between uninsured and privately insured patients. In the unlikely event that uninsured patients obtained private insurance, then our study would underestimate the difference for uninsured patients, compared with privately insured patients, biasing our current study results towards the null. Second, a substantial proportion of sampled children had missing data for race/ethnicity. To assess the impact of the missing race/ethnicity data on our results, we conducted sensitivity analyses and found that, though difficult to make any definitive conclusions about the relationship between race/ethnicity and LOS for children with CAP, there were no changes to our primary findings regarding differences in LOS between children with different insurance status and type. Third, KID does not include data about other unmeasured confounders (eg, parent income, parent education, regular source of care) that might be related to LOS, as well as a broad spectrum of pediatric outcomes. Serious consideration of expanding KID to include these variables is warranted. Fourth, the other category of insurance is not uniformly coded across states in the KID database. While some states use this category to classify public insurance options other than Medicare and Medicaid, other states include private insurance options in this group. Thus, it is possible that some patients with public insurance are misclassified as having other insurance. We would expect such misclassification to bias our findings towards the null hypothesis. Finally, we focused on the relationship between child health insurance status and CAP, only 1 ambulatory care‐sensitive condition. Additional research examining the relationship between insurance type and other ambulatory care‐sensitive conditions is warranted.
In summary, we found that, after multivariable adjustment, uninsured children hospitalized with community‐acquired pneumonia had significantly shorter LOS than privately insured children, and publicly insured children had a significantly longer hospital stay than privately insured children in these 4 nationally representative samples from 1997 to 2006. Current federal and state efforts to increase enrollment of children into insurance programs are a first step in reducing healthcare disparities. However, insurance coverage alone does not guarantee access to healthcare, thus, these efforts in isolation will likely be insufficient to achieve optimal health for the children of our country. As healthcare reform legislation is implemented, these findings provide hospitals and policy makers additional impetus to develop ways to achieve the ideal length of stay for every child; this ideal state will be achieved when clinical status and course, rather than nonclinical factors such as insurance type or provider's unease with ambulatory follow‐up, determine the duration of hospitalization for every child.
- ,,,,,.Recurrent urinary tract infections in children: risk factors and association with prophylactic antimicrobials.JAMA.2007;298:179–186.
- ,.Factors associated with variability in outcomes for children hospitalized with urinary tract infection.J Pediatr.2009;154:789–796.
- ,,,,.Intravenous immunoglobulin in children with streptococcal toxic shock syndrome.Clin Infect Dis.2009;49:1369–1376.
- ,,.Pediatric hospital adherence to the standard of care for acute gastroenteritis.Pediatrics.2009;124:e1081–e1087.
- ,,.Medicaid re‐enrollment policies and children's risk of hospitalizations for ambulatory care sensitive conditions.Med Care.2008;46:1049–1054.
- ,.Differences associated with age, transfer status, and insurance coverage in end‐of‐life hospital care for children.J Hosp Med.2008;3:376–383.
- ,,,,,.Health care for children and youth in the United States: annual report on patterns of coverage, utilization, quality, and expenditures by a county level of urban influence.Ambul Pediatr.2006;6:241–264.
- ,,.Lengths of stay and costs associated with children's hospitals.Pediatrics.2005;115:839–844.
- ,.Variation in hospital discharges for ambulatory care‐sensitive conditions among children.Pediatrics.2000;106:942–948.
- ,,,,,.Ambulatory visit rates and antibiotic prescribing for children with pneumonia, 1994–2007.Pediatrics.2011;127:411–418.
- ,,,,.Patterns of hospital‐based pediatric care across diverse ethnicities: the case of pneumonia.J Health Care Poor Underserved.2004;15:462–473.
- ,,,,.Equivalent lengths of stay of pediatric patients hospitalized in rural and nonrural hospitals.Pediatrics.2004;114:e400–e408.
- ,.Effect of Child Health Insurance Plan enrollment on the utilization of health care services by children using a public safety net system.Pediatrics.2002;110:940–945.
- ,,,,,.Relationships between welfare status, health insurance status, and health and medical care among children with asthma.Am J Public Health.2002;92:1446–1452.
- HCUP Kids' Inpatient Database (KID). Healthcare Cost and Utilization Project (HCUP), 1997, 2000, 2003, 2006. Agency for Healthcare Research and Quality. Available at: http://www.hcup‐us.ahrq.gov/kidoverview.jsp. Accessed May 17,2010.
- ,,, et al.Community‐acquired pneumonia: can it be defined with claims data?Am J Med Qual.1997;12:187–193.
- .Sicker and poorer—the consequences of being uninsured: a review of the research on the relationship between health insurance, medical care use, health, work, and income.Med Care Res Rev.2003;60:3S–75S; discussion76S–112S.
- ,,,,,.Socioeconomic variation in asthma hospitalization: excess utilization or greater need?Pediatrics.1999;103:e75.
- ,,, et al.Analysis of 23 million US hospitalizations: uninsured children have higher all‐cause in‐hospital mortality.J Public Health (Oxf).2010;32(2)236–244.
- ,.The impact of welfare reform on parents' ability to care for their children's health.Am J Public Health.1999;89:502–505.
- ,,.Knowledge of welfare reform program provisions among families of children with chronic conditions.Am J Public Health.2002;92:228–230.
Copyright © 2011 Society of Hospital Medicine
Student Care Transitions Curriculum
There is increasing evidence that the transfer of medically complex patients across different settings can be associated with poor communication and patient dissatisfaction with the care received, potentially leading to negative clinical outcomes. While medical schools are beginning to introduce curricula on these transitions of care, few have been evaluated and subjected to peer review with the purpose of finding the most effective teaching and training methods.
Older adults and those with multiple chronic diseases frequently require medical care that spans multiple locations, and thus are most at risk for poor clinical outcomes during care transitions.1, 2 Medication errors and adverse drug reactions after hospital discharge are common.3, 4 Unsuccessful care transitions may also result in nonelective readmission after discharge, and there is evidence that readmissions may be a quality indicator for hospital care.57 Poor communication between patients and their healthcare providers is another element of poorly executed care transitions. Qualitative studies show that patients are frequently dissatisfied with the discharge process and are often unprepared to assume responsibility for their own care when they leave the hospital.8 Communication among providers can also be suboptimal. One meta‐analysis found that hospital physicians and primary care providers communicated infrequently and the availability of discharge summaries at the postdischarge visit was low, which may have affected the quality of care.9
Knowing that these gaps are common, there have been signs of increased emphasis on improving communication and working in teams as part of health professions training. The Institute of Medicine, in its 2003 report Health Professions Education: A Bridge to Quality,10 stressed education on management of chronic diseases, working in interdisciplinary teams, as well as a focus on quality improvement. In addition, the American Association of Medical Colleges (AAMC) encouraged training medical students on preparing safe discharge plans in its 2007 geriatrics competencies.11
Some medical schools have introduced care transitions curricula, though few have published data on their effectiveness. A search for teaching products using care transitions or transitional care on the online educational portals POGOe (Portal of Geriatric Online Education) and MedEdPortal yielded a total of 7 unique sets of teaching materials on care transitions for medical students.1218 However, a search on PubMed in July 2010 for peer‐reviewed articles on care transitions curricula developed for medical students which contained evaluation data only yielded 3 articles.1921 These 3 curricula, written by Bray‐Hall et al., Lai et al., and Ouchida et al., respectively, all trained third‐year medical students on diverse aspects of the discharge process using methods such as lectures, workshops, and patient visits, and showed favorable skill and knowledge outcomes.
Recognizing the importance of care transitions in medical education, a new curriculum addressing this topic was developed and introduced for fourth‐year medical students at the Emory University School of Medicine in 2009. The broad goal for this module was to develop a course concentrating on concrete skills that would train students to perform better care transitions while minimizing the time they had to spend away from a busy Internal Medicine sub‐internship. This curriculum used a mixed approach that included face‐to‐face teaching with faculty, online didactic instruction and interaction, and direct patient care. The course objectives were for students to develop a working fund of knowledge on care transitions, to learn to write a complete discharge summary, and to communicate the elements of a safe discharge plan. This article will describe the implementation of this curriculum and its evaluation.
METHODS
The Emory Care Transitions Curriculum started in August 2009 with fourth‐year medical students at the Emory University School of Medicine. This section will describe the details of the implementation of this curriculum, as well as the evaluation methodology and results.
Overview
This module was offered to Emory medical students participating in a required Senior Medicine rotation during their fourth year. The study population consisted of the 121 fourth‐year Emory medical students who participated in this rotation during the academic year that started in August 2009 and ended in April 2010. Students participated in the rotation at 1 of 3 teaching sites: Grady Memorial Hospital (GMH), Emory University Hospital (EUH), and the Atlanta VA Medical Center (AVAMC); 98 students completed their rotation at GMH, 12 at EUH, and 11 at AVAMC. For all online activities, students used the Blackboard platform software, available to them at
Course Description
The course consisted of 3 components, each associated with specific student assignments: a slide presentation on care transitions with an associated case discussion, training on discharge summaries, and the execution of a postdischarge phone call. Figure 1 describes the course delivery schedule.

Slide Presentation and Case Discussion
This section started on day 2 of the clerkship, with a face‐to‐face lecture titled Transitions of Care: Why They Are Important, and How to Improve Them. It included the following components: definition of the different posthospital discharge options, explanation of the reasons for the complexity of care transitions in high‐risk patient populations, and an enumeration of methods to improve the safety of care transitions. Students also read a review article on the topic to further add to their fund of knowledge.23
The second part of the section involved discussion of a case posted on Blackboard (a discussion board) designed to highlight some of the challenges associated with care transitions. The case included 2 successive discharge summaries for an elderly patient with congestive heart failure: 1 for the initial exacerbation, and the other for a readmission. Using an online discussion board, students were asked to report the strong points and shortcomings of the patient's management, as well as those of the discharge summaries. Then the students were asked to post responses to at least 2 of their classmates' reports on the discussion board.
Training on Discharge Summaries
During the module, students received training on how to prepare a complete and informative discharge summary. This online training consisted of a lecture prepared by a faculty member (M.A.E.) and the use of a discharge summary template based on a guide prepared by the Boston Association of Academic Hospitalists (BAAHM), which is part of a toolkit available from the Society of Hospital Medicine.24 After reading the lecture, each student selected 1 of the patients they cared for during their rotation, and wrote a discharge summary. They posted it to a Blackboard discussion board, and were then asked to comment on one of their classmates' reports on the same forum. Faculty (M.A.E. and R.C.) also gave online feedback to each student about their discharge summary.
Postdischarge Phone Call
Students were also assigned to communicate with the patient for whom they prepared a discharge summary by performing a postdischarge phone call within a week of the patient's departure from the hospital. They reviewed a discharge checklist adapted from Ideal Discharge for an Elderly Patient: A Hospitalist Checklist, issued by the Society of Hospital Medicine.25 This document contains the necessary elements of a safe discharge plan, and used these points as the basis of the patient phone interview. The goal of the call and the use of the checklist was to reinforce the main elements of communication with patients that need to occur before they leave the hospital.
Students then used the checklist as the basis for a short (<400 words) report discussing the strong points and shortcomings of their patient's discharge, and posted it on a Blackboard discussion board. They were also asked to comment on at least one of their classmates' reports on the board. Faculty (M.A.E. and R.C.) also participated in the discussion board, commenting at least once on all students' reports.
Evaluation
The course was evaluated in order to assess changes in skills, knowledge and attitudes, as well as satisfaction with the course.
Evaluation Components
In order to assess the outcomes described above, questionnaires were utilized, and objective criteria were used to evaluate students' work. Students completed a pretest before the first face‐to‐face session, and a posttest after the second in‐person discussion. Pretest items were identical to those in the posttest, except that the posttest also contained 6 satisfaction questions. The components that were included in both pre‐ and posttests were:
Five multiple choice questions measuring students' confidence in their own skills regarding discharge summaries and transitional care (pre‐ and postsurvey). These 5 questions were adapted from the questionnaire developed by Lai et al.20 Confidence questionnaire items are detailed in Table 1.
Five multiple choice questions assessing students' attitudes regarding the importance of different components of the care transitions process (pre‐ and postsurvey). Attitude questionnaire items are detailed in Table 1.
Ten multiple choice questions in which each had one right answer, assessing students' knowledge base on transitional care issues (pre‐and postsurvey). Knowledge questions and their correct answers are detailed in Table 2.
| Mean Likert Scores* | P Value | ||
|---|---|---|---|
| Pre‐Course | Post‐Course | ||
| |||
| Confidence items | |||
| 1. I am confident in my ability to involve patients in making a plan for their care. | 3.8 | 4.2 | <0.001 |
| 2. I am confident in my ability to review patients' medications and side effects. | 3.4 | 4.1 | <0.001 |
| 3. I can identify factors that may facilitate or impede a patient's transition to an outpatient setting. | 3.4 | 4.3 | <0.001 |
| 4. I am confident in my ability to prepare a complete discharge summary. | 3.0 | 4.2 | <0.001 |
| 5. I can identify the different types of places that may serve as a setting for discharge from the inpatient setting. | 3.1 | 3.9 | <0.001 |
| Total confidence score (out of 25) | 16.7 | 20.7 | <0.001 |
| Attitude items | |||
| 1. A hospital physician should always communicate with a patient's primary care physician before that patient is discharged from the hospital, in order to ensure a smooth transition of care. | 4.0 | 4.1 | 0.78 |
| 2. Before a patient is discharged from the hospital, a physician (not just the nurse or case manager) should always meet with the patient to discuss his medications, and goals of care. | 4.4 | 4.4 | 0.50 |
| 3. It is critical for a primary care physician to have access to a discharge summary when seeing a patient for the first time after leaving the hospital. | 4.6 | 4.7 | 0.25 |
| 4. The main reason patients often don't take their medications properly after discharge is that they are confused by the instructions given to them at the hospital. | 3.7 | 3.8 | 0.65 |
| 5. Avoiding rehospitalization should be a top priority for physicians in the process of discharge from the hospital. | 4.1 | 4.3 | 0.95 |
| Total attitude score (out of 25) | 20.8 | 21.3 | 0.07 |
| Percent Correct | |||
|---|---|---|---|
| Question (Correct Answer in Parenthesis) | Pre‐Course | Post‐Course | P Value |
| |||
| 1. When a patient is discharged with home health care, which of the following services is usually not part of the package? (A caregiver to sit with the patient and supervise them most of the day.) | 70 | 83 | 0.020* |
| 2. When a patient is discharged from the hospital to a skilled nursing facility (SNF) for further care, which of these is a service that is typically provided? (Physical therapy.) | 78 | 75 | 0.649 |
| 3. Which of the following rehabilitation activities is more likely to be in the job description of an occupational therapist? (Training of strength in upper extremities.) | 24 | 51 | <0.001* |
| 4. Which of these is least likely to be a cause of poor patient outcomes after hospital discharge? (The discharging of patients to skilled nursing facilities.) | 93 | 97 | 0.166 |
| 5. Which of these is more likely to be an indicator of poor outcomes after hospital discharge? (Having had 3 hospitalizations in the last 6 months.) | 93 | 96 | 0.287 |
| 6. Which of these data is the least likely to be an indicator that the patient is too sick to be discharged from the hospital? (Hemoglobin concentration of 9.5 g/dl.) | 45 | 74 | <0.001* |
| 7. Which of the following medications would merit the most time spent on communication with patients, family members, and receiving physicians? (Furosemide.) | 58 | 96 | <0.001* |
| 8. You are caring for an 89‐year‐old man who is being treated in the hospital for an exacerbation of his congestive heart failure (CHF). He is doing well, ambulating 100 feet without shortness of breath, and is showing understanding of the need for all his different medications. However, he is not yet back to his functional baseline. Which of the following is the LEAST appropriate setting for discharge? (Hospice care.) | 74 | 70 | 0.458 |
| 9. Which of the following is true about skilled nursing facility (SNF) care? (Patients can be admitted for treatment with IV antibiotics for several weeks.) | 52 | 79 | <0.001* |
| 10. Educating patients at discharge about their illness and medication has been found to help decrease readmission rates. (True.) | 97 | 100 | 0.045 |
| Percentage of total questions correct | 68 | 82 | <0.001* |
The questionnaire items were developed by study faculty (M.A.E. and J.M.F.) and were edited in consultation with clinical faculty members from outside Emory with experience developing care transitions curricula: Dr. Karin Ouchida of Montefiore Medical Center in New York City, and Dr. William Lyons of the University of Nebraska Medical Center.
The 6 posttest items addressed student satisfaction with individual course components, which were: the heart failure online case, training on preparing discharge summaries, initial in‐person slide presentation, postdischarge phone call, overall online discussion across all items, and finally, satisfaction with the overall course. Questionnaire items on comfort, attitudes, and satisfaction all used a five‐point Likert scale ranging from 1 (strongly disagree) to 5 (strongly agree). The 10 multiple‐choice questions on knowledge each had one right answer.
Each student completed one discharge summary during the course. For it to be deemed satisfactory, it had to have the 5 following components, all present in the BAAHM template24:
A documented discharge medication list with specific dosing schedules.
Lists of admission medications and/or a list of medication changes during hospitalization.
A discharge plan that specifies the next setting of care, as well as the planned follow‐up.
A hospital course organized by system and/or specific chronology.
A physical exam, laboratory tests, and diagnostic studies performed on admission.
Student reports of their postdischarge phone call were also evaluated by study faculty (M.A.E. and R.C.). For the report of the interview to be considered satisfactory, it had to contain at least the following 2 elements:
A discussion of the patient's medication list, including documentation of a discussion of hazardous medications (e.g., furosemide, warfarin, digoxin, insulin) if applicable.
Documentation of a discussion on follow‐up plans with a primary physician or specialist.
Data Analysis
Outcomes were evaluated based on the results of pre‐ and posttest questionnaires, in addition to the satisfactoriness of discharge summaries and postdischarge phone call reports. As for the questionnaires, 4 types of scores were analyzed based on students' questionnaire responses:
Skills Confidence Score: The sum of Likert scores for confidence items on the pre‐ and posttest was the confidence score, with a highest possible score of 25, in which the highest scores were associated with the most confidence in executing the discharge process.
Attitude Score: The sum of Likert scores for attitude items on the pre‐ and posttest was the attitude score, with a highest possible score of 25, in which the highest scores were associated with student attitudes ascribing the most importance to a safe discharge process.
Knowledge Score: The percentage of total correct answers on knowledge questions on the pre‐ and posttest were used to obtain the knowledge score, in which a score of 100 was highest.
Satisfaction Score: Satisfaction questions on the posttest questionnaire were analyzed separately to assess satisfaction with each component of the curriculum, ranging from poor (score = 1) to excellent (score = 5). We also determined the percentage of students who rated each portion of the course good or better.
In addition to questionnaire scores, students' performance in the preparation of discharge summaries and the postdischarge phone interview were evaluated. Discharge summaries and postdischarge phone interviews were classified as satisfactory or unsatisfactory based on the criteria outlined in the previous section on outcome evaluation.
Quantitative and Qualitative Analysis
Skills confidence, attitude, and knowledge scores were compared between pre‐ and posttest. Paired t tests were used to calculate statistical significance. A P value below 0.05 was considered statistically significant, using two‐tailed tests.
We also analyzed whether there were any differences in changes in confidence, attitude, and knowledge scores according to the time of year in which the course was taken by students. For this, we divided the nine‐month course into 3 trimesters (AugustOctober, NovemberJanuary, and FebruaryApril). In order to determine whether 3 were any differences in score changes among the different periods, we used a one‐way analysis of variance (ANOVA), in which a P value below 0.05 would indicate a statistically significant difference among the periods. All statistical analyses were performed using SPSS 17.0 for Windows.
Statistical tests were not utilized for the satisfaction scores, but the overall goal was for their mean to be 3 (good) or above. Also, the percentages of satisfactory discharge summaries and postdischarge phone interviews were measured. The goal was for both tasks to have a percentage of satisfactory evaluations of 80% or above.
RESULTS
The 121 students who took the module completed both the pre‐ and posttests. Table 1 details the mean pre‐ and posttest Likert scores for all confidence and attitude questions, as well as the changes in the 25‐point total confidence and attitude score from pre‐ to posttest. The change in confidence scores among survey participants was statistically significant (P < 0.001), while the change in attitude score was not (P = 0.07). Table 2 compares the percentage of correct answers before and after the course for individual knowledge questions, as well as for the entire knowledge quiz. Changes in total knowledge scores were statistically significant: the mean percentage of correct answers out of 10 questions was 68% on the pretest, and 82% on the posttest (P < 0.001).
Table 3 measures the changes in confidence, attitude, and knowledge scores by the period of the year in which students took the course. One‐way ANOVA tests for each of the 3 domains did not find statistically significant changes in confidence, attitude, or knowledge scores among the 3 trimesters in which we divided the module's calendar.
| Section of Questionnaire | Total for Year | Period of Year | F Value | P Value | ||
|---|---|---|---|---|---|---|
| AugustOctober | NovemberJanuary | FebruaryApril | ||||
| Confidence | ||||||
| Mean pre‐course score | 16.7 | 16.5 | 16.5 | 17.0 | ||
| Mean post‐course score | 20.7 | 21.0 | 19.9 | 21.0 | ||
| Mean change in score | 4.0 | 4.5 | 3.4 | 4.0 | 0.92 | 0.40 |
| Attitude | ||||||
| Mean pre‐course score | 20.8 | 20.9 | 20.5 | 20.6 | ||
| Mean post‐course score | 21.3 | 21.3 | 21.3 | 21.1 | ||
| Mean change in score | 0.5 | 0.4 | 0.8 | 0.5 | 0.13 | 0.88 |
| Knowledge | ||||||
| Mean pre‐course percentage correct | 68 | 71.3 | 67.4 | 66.4 | ||
| Mean post‐course percentage correct | 82 | 82.5 | 80.9 | 82.1 | ||
| Mean change in score | 14 | 11.2 | 13.5 | 15.7 | 0.60 | 0.55 |
| No. of participants | 121 | 40 | 34 | 47 | ||
Table 4 shows satisfaction scores on the posttest. The overall Likert rating for the course was 3.9, with 97.5% of students rating it good or better. The highest‐rated individual component of the course by Likert score was the training on discharge summaries, with a rating of 4.1. The lowest‐rated by this parameter was the congestive heart failure case, with a rating of 3.6. The online discussion across all topics had the lowest percentage of students rating it good or above, at 83.5%.
| Curriculum Section | Mean Likert Rating (Out of 5) | Percentage Rated Good or Above |
|---|---|---|
| Congestive heart failure case | 3.6 | 95.0 |
| Discharge summaries | 4.1 | 96.7 |
| Initial in‐person slide presentation | 4.0 | 97.5 |
| Postdischarge phone call | 3.7 | 95.0 |
| Online discussion for all topics | 3.7 | 83.5 |
| Overall curriculum rating | 3.9 | 97.5 |
As for student discharge summaries, 109 out of 121 (90.1%) met all the criteria in order to be deemed satisfactory; 109 out of 121 (90.1%) of postdischarge phone call reports met both required components. Both these results exceeded the goal of 80% set before the course started.
DISCUSSION
The Emory Care Transitions Curriculum for fourth‐year medical students started in the 20092010 academic year with the main goal of teaching students transferable skills that would ultimately lead to their participating in safer hospital discharges in their future practice as physicians. At the end of this course, students exhibited greater confidence in managing the discharge process, improved overall fund of knowledge relating to care transitions, and a demonstration of appropriate skills related to preparing discharge summaries and communicating with patients at discharge. This was all executed with a delivery method that students found engaging.
Analyzing the results, it is noteworthy that confidence improved, while attitudes did not. Even though confidence in performing a task does not necessarily reflect one's ability to perform it, our students' confidence scores may serve as a proxy for their ability to manage tasks related to the discharge process, like managing medications and preparing discharge summaries. Thus, while some studies suggest that self‐assessment among physicians may not always relate well to competence,26, 27 in our study, students did demonstrate skills in discharge summary preparation and in identifying the most relevant aspects of patient communication at hospital discharge. As for the absence of attitude change, this may have partly been a function of the fact that students in our group started with attitude scores that were already quite high, with a mean pretest attitude score of 20.7 out of 25.
Changes in student confidence, attitudes, and knowledge from pre‐ to posttest did not vary significantly across the academic year. Thus, one could interpret from our findings that more experienced students who took the module close to graduation benefited similarly from the course to those who completed it earlier, at least according to those rubrics. Another possible source of variation in student experience was the hospital in which students rotated: the demographics of GMH, with its large uninsured population; AVAMC, with more elderly patients; and EUH, with a more affluent profile, are certainly different. However, the number of students rotating at EUH and AVAMC were comparatively too small to attempt to draw any conclusions about how rotation site affected student experiences.
The use of a blended approach that integrated face‐to‐face didactics, patient care, and online learning offered some advantages. Curricular goals were achieved through a course that required only 2 hours of in‐person faculty time with students. This is significant, considering the time demands that academic medical faculty usually face. This approach also permitted students who were participating in a busy clinical rotation, and had limited opportunities to meet as a group, the ability to do coursework at their own pace. Another strength of the study is that all students who participated in the rotation were able to complete their surveys.
As for limitations, it is worth noting that in a course with a blended curriculum, the online discussion had the lowest percentage of students rating it good or better. Part of the perceived difficulty may have resulted from the fact that there are no other courses in the Emory medical curriculum that utilize discussion boards or distance learning methods as teaching tools. Despite this generation of students' technological savvy, this new mode of discussion may have proven difficult to pick up when they were in the midst of a busy clinical rotation. This serves as a reminder that while online curricula have proven successful in this and other settings, each element needs to be tailored to the audience. One other factor to be considered while interpreting this study's results is that this study utilized some survey instruments that have not been previously validated, even though they were developed in consultation with experts in the field of care transitions education.
We used a dichotomous, criteria‐based system to rate students' discharge summaries and reports of postdischarge phone calls. While this quantitative approach allowed us to more objectively define the quality of students' work, it did offer some disadvantages. First, even though we based the rating system for discharge summaries on a BAAHM template, it was not subjected to more extensive validation. Moreover, the quantitative approach diverted us from finding themes and other qualitative data from students' write‐ups, which could potentially have given us a fuller picture of their work.
This study contributes to the small, but growing, literature on care transitions education. The studies by Bray‐Hall et al., Lai et al., and Ouchida et al.,1921 used different methodologies, but all were directed at third‐year students using curricula with classroom and clinical learning, and showed favorable outcomes in knowledge and skills. The present study also showed positive results in students' knowledge and skills, but targeted it toward graduating medical students and included a focus on concrete skills, such as discharge summary preparation. It also utilized a nontraditional delivery approach which reached its objectives while also limiting the demands on faculty and students' face time during busy clinical rotations, which is especially important when considering that students were dispersed at multiple sites.
It is likely that medical schools will implement more care transitions curricula in coming years, as organizations like the AAMC11 and the Institute of Medicine10 increase the pressure to train future doctors to better address the needs of older and chronically ill patients, who require care from professionals of multiple disciplines, in disparate care settings. Moreover, the 2010 Patient Protection and Affordable Care Act28 contains provisions with financial incentives for hospitals to decrease readmissions. Once these become widely implemented, there will be a greater impetus to train medical practitioners to discharge patients more safely. When that occurs, medical schools will have additional compelling reasons to offer courses that teach students skills to execute better care transitions. The hoped‐for outcome of these curricula will ultimately be safer and more effective patient care.
Acknowledgements
The authors thank Dr. Ted Johnson at the Emory University School of Medicine for editorial review. They also express their gratitude to Dr. Karin Ouchida at Montefiore Medical Center and Dr. William Lyons at University of Nebraska Medical Center for their technical support in preparation of the curriculum. Disclosures: None of the authors has any relevant conflicts of interest. All coauthors have seen and agree with the contents of this manuscript. The authors are responsible for the integrity of the data described in this study. The research in this manuscript has not been submitted or accepted for publication in another journal.
- ,,, et al.Adverse events among medical patients after discharge from hospital.Can Med Assoc J.2004;170(3):345–349.
- ,,,,.The incidence and severity of adverse events affecting patients after discharge from the hospital.Ann Intern Med.2003;138:161–167.
- ,,,.Posthospital medication discrepancies: Prevalence and contributing factors.Arch Intern Med.2005;165:1842–1847.
- ,,.Adverse drug events in elderly patients receiving home health services following hospital discharge.Ann Pharmacother.1999;33:1147–1153.
- ,,,,.The association between the quality of inpatient care and early readmission: A meta‐analysis of the evidence.Med Care.1997;35(10):1044–1059.
- ,,,,.The association between the quality of inpatient care and early readmission.Ann Intern Med.1995;122(6):415–421.
- ,.Hospital readmissions as a measure of quality of health care: Advantages and limitations.Arch Intern Med.2000;160(8):1074–1081.
- ,.Lost in transition: Challenges and opportunities for improving the quality of transitional care.Ann Intern Med.2004;140:533–536.
- ,,,,,.Deficits in communication and information transfer between hospital‐based and primary care physicians.JAMA.2007;297:831–841.
- Institute of Medicine.Health Professions Education: A Bridge to Quality.Washington, DC:National Academy Press;2003.
- American Association of Medical Colleges. Geriatric Competencies for Medical Students: Recommendations of the July 2007 Geriatrics Consensus Conference.2008. Available at: http://www.aamc.org/newsroom/press kits/competencies.pdf. Accessed February 25, 2009.
- Eskildsen M, Price T, Tenover JL. Computer‐based geriatrics workbooks for resident teaching. MedEdPortal. 2007. Available at http://services. aamc.org/30/mededportal/servlet/s/segment/mededportal/ find_resources/ browse/?subid=640.
- .Care transitions in the older adult.MedEdPortal.2008. Available at http://services.aamc.org/30/mededportal/servlet/s/segment/mededportal/find_resources/browse/?subid=678. Accessed March 19, 2011.
- ,,, et al.Web‐based module to train and assess competency in systems‐based practice.Portal of Online Geriatric Education.2009. Product ID #20002. Available at: http://www. pogoe.org/node/407. Accessed March 19, 2011.
- .CHAMP (Curriculum for the Hospitalized Aging Medical Patient): The ideal hospital discharge.Portal of Online Geriatric Education.2009. Product ID #18995. Available at: http://www. pogoe.org/productid/18995. Accessed March 19, 2011.
- .M1 care transitions.Portal of Online Geriatric Education.2009. Product ID #20450. Available at: http://www. pogoe.org/node/660. Accessed March 19, 2011.
- .Transitional care.Portal of Online Geriatric Education.2007. Product ID #18991. Available at: http://www.pogoe.org/node/262. Accessed March 19, 2011.
- .Discharge summary feedback.Portal of Online Geriatric Education.2009. Product ID #20546. Available at: http://www.pogoe.org/node/788. Accessed March 19, 2011.
- ,,.Toward safe hospital discharge: A transitions in care curriculum for medical students.J Gen Intern Med.25(8):878–881.
- ,,,,.Postdischarge follow‐up visits for medical and pharmacy students on an inpatient medicine clerkship.J Hosp Med.2008;3(1):20–27.
- ,,,,.Fast forward rounds: An effective method for teaching medical students to transition patients safely across care settings.J Am Geriatr Soc.2009;57:910–917.
- .Fourth‐year medical student care transitions curriculum (free login required).Portal of Online Geriatric Education.2010. Available at: http://www.pogoe.org/node/867. Accessed July 16, 2010.
- .Falling through the cracks: Challenges and opportunities for improving transitional care for persons with continuous complex care needs.J Am Geriatr Soc.2003;51:549–555.
- Society of Hospital Medicine. Quality initiatives for patient care—BOOSTing care transitions resource room.2010. Available at: http://www.hospitalmedicine.org/ResourceRoomRedesign/RR_Care Transitions/html_CC/12Clinical Tools/01_Toolkits.cfm. Accessed November 16, 2010.
- Society of Hospital Medicine. Ideal discharge for an elderly patient: A hospitalist checklist.2005. Available at: http://www.hospitalmedicine. org/AM/Template.cfm?Section=QI_Clinical_Tools8(2):105–110.
- ,,.Difficulties in recognizing one's own incompetence: Novice physicians who are unskilled and unaware of it.Acad Med.2001;76(10 suppl):S87–S89.
- Patient Protection and Affordable Care Act, H.R. 3590.ENR, 111th Congress, 2010.
There is increasing evidence that the transfer of medically complex patients across different settings can be associated with poor communication and patient dissatisfaction with the care received, potentially leading to negative clinical outcomes. While medical schools are beginning to introduce curricula on these transitions of care, few have been evaluated and subjected to peer review with the purpose of finding the most effective teaching and training methods.
Older adults and those with multiple chronic diseases frequently require medical care that spans multiple locations, and thus are most at risk for poor clinical outcomes during care transitions.1, 2 Medication errors and adverse drug reactions after hospital discharge are common.3, 4 Unsuccessful care transitions may also result in nonelective readmission after discharge, and there is evidence that readmissions may be a quality indicator for hospital care.57 Poor communication between patients and their healthcare providers is another element of poorly executed care transitions. Qualitative studies show that patients are frequently dissatisfied with the discharge process and are often unprepared to assume responsibility for their own care when they leave the hospital.8 Communication among providers can also be suboptimal. One meta‐analysis found that hospital physicians and primary care providers communicated infrequently and the availability of discharge summaries at the postdischarge visit was low, which may have affected the quality of care.9
Knowing that these gaps are common, there have been signs of increased emphasis on improving communication and working in teams as part of health professions training. The Institute of Medicine, in its 2003 report Health Professions Education: A Bridge to Quality,10 stressed education on management of chronic diseases, working in interdisciplinary teams, as well as a focus on quality improvement. In addition, the American Association of Medical Colleges (AAMC) encouraged training medical students on preparing safe discharge plans in its 2007 geriatrics competencies.11
Some medical schools have introduced care transitions curricula, though few have published data on their effectiveness. A search for teaching products using care transitions or transitional care on the online educational portals POGOe (Portal of Geriatric Online Education) and MedEdPortal yielded a total of 7 unique sets of teaching materials on care transitions for medical students.1218 However, a search on PubMed in July 2010 for peer‐reviewed articles on care transitions curricula developed for medical students which contained evaluation data only yielded 3 articles.1921 These 3 curricula, written by Bray‐Hall et al., Lai et al., and Ouchida et al., respectively, all trained third‐year medical students on diverse aspects of the discharge process using methods such as lectures, workshops, and patient visits, and showed favorable skill and knowledge outcomes.
Recognizing the importance of care transitions in medical education, a new curriculum addressing this topic was developed and introduced for fourth‐year medical students at the Emory University School of Medicine in 2009. The broad goal for this module was to develop a course concentrating on concrete skills that would train students to perform better care transitions while minimizing the time they had to spend away from a busy Internal Medicine sub‐internship. This curriculum used a mixed approach that included face‐to‐face teaching with faculty, online didactic instruction and interaction, and direct patient care. The course objectives were for students to develop a working fund of knowledge on care transitions, to learn to write a complete discharge summary, and to communicate the elements of a safe discharge plan. This article will describe the implementation of this curriculum and its evaluation.
METHODS
The Emory Care Transitions Curriculum started in August 2009 with fourth‐year medical students at the Emory University School of Medicine. This section will describe the details of the implementation of this curriculum, as well as the evaluation methodology and results.
Overview
This module was offered to Emory medical students participating in a required Senior Medicine rotation during their fourth year. The study population consisted of the 121 fourth‐year Emory medical students who participated in this rotation during the academic year that started in August 2009 and ended in April 2010. Students participated in the rotation at 1 of 3 teaching sites: Grady Memorial Hospital (GMH), Emory University Hospital (EUH), and the Atlanta VA Medical Center (AVAMC); 98 students completed their rotation at GMH, 12 at EUH, and 11 at AVAMC. For all online activities, students used the Blackboard platform software, available to them at
Course Description
The course consisted of 3 components, each associated with specific student assignments: a slide presentation on care transitions with an associated case discussion, training on discharge summaries, and the execution of a postdischarge phone call. Figure 1 describes the course delivery schedule.
Slide Presentation and Case Discussion
This section started on day 2 of the clerkship, with a face‐to‐face lecture titled Transitions of Care: Why They Are Important, and How to Improve Them. It included the following components: definition of the different posthospital discharge options, explanation of the reasons for the complexity of care transitions in high‐risk patient populations, and an enumeration of methods to improve the safety of care transitions. Students also read a review article on the topic to further add to their fund of knowledge.23
The second part of the section involved discussion of a case posted on Blackboard (a discussion board) designed to highlight some of the challenges associated with care transitions. The case included 2 successive discharge summaries for an elderly patient with congestive heart failure: 1 for the initial exacerbation, and the other for a readmission. Using an online discussion board, students were asked to report the strong points and shortcomings of the patient's management, as well as those of the discharge summaries. Then the students were asked to post responses to at least 2 of their classmates' reports on the discussion board.
Training on Discharge Summaries
During the module, students received training on how to prepare a complete and informative discharge summary. This online training consisted of a lecture prepared by a faculty member (M.A.E.) and the use of a discharge summary template based on a guide prepared by the Boston Association of Academic Hospitalists (BAAHM), which is part of a toolkit available from the Society of Hospital Medicine.24 After reading the lecture, each student selected 1 of the patients they cared for during their rotation, and wrote a discharge summary. They posted it to a Blackboard discussion board, and were then asked to comment on one of their classmates' reports on the same forum. Faculty (M.A.E. and R.C.) also gave online feedback to each student about their discharge summary.
Postdischarge Phone Call
Students were also assigned to communicate with the patient for whom they prepared a discharge summary by performing a postdischarge phone call within a week of the patient's departure from the hospital. They reviewed a discharge checklist adapted from Ideal Discharge for an Elderly Patient: A Hospitalist Checklist, issued by the Society of Hospital Medicine.25 This document contains the necessary elements of a safe discharge plan, and used these points as the basis of the patient phone interview. The goal of the call and the use of the checklist was to reinforce the main elements of communication with patients that need to occur before they leave the hospital.
Students then used the checklist as the basis for a short (<400 words) report discussing the strong points and shortcomings of their patient's discharge, and posted it on a Blackboard discussion board. They were also asked to comment on at least one of their classmates' reports on the board. Faculty (M.A.E. and R.C.) also participated in the discussion board, commenting at least once on all students' reports.
Evaluation
The course was evaluated in order to assess changes in skills, knowledge and attitudes, as well as satisfaction with the course.
Evaluation Components
In order to assess the outcomes described above, questionnaires were utilized, and objective criteria were used to evaluate students' work. Students completed a pretest before the first face‐to‐face session, and a posttest after the second in‐person discussion. Pretest items were identical to those in the posttest, except that the posttest also contained 6 satisfaction questions. The components that were included in both pre‐ and posttests were:
Five multiple choice questions measuring students' confidence in their own skills regarding discharge summaries and transitional care (pre‐ and postsurvey). These 5 questions were adapted from the questionnaire developed by Lai et al.20 Confidence questionnaire items are detailed in Table 1.
Five multiple choice questions assessing students' attitudes regarding the importance of different components of the care transitions process (pre‐ and postsurvey). Attitude questionnaire items are detailed in Table 1.
Ten multiple choice questions in which each had one right answer, assessing students' knowledge base on transitional care issues (pre‐and postsurvey). Knowledge questions and their correct answers are detailed in Table 2.
| Mean Likert Scores* | P Value | ||
|---|---|---|---|
| Pre‐Course | Post‐Course | ||
| |||
| Confidence items | |||
| 1. I am confident in my ability to involve patients in making a plan for their care. | 3.8 | 4.2 | <0.001 |
| 2. I am confident in my ability to review patients' medications and side effects. | 3.4 | 4.1 | <0.001 |
| 3. I can identify factors that may facilitate or impede a patient's transition to an outpatient setting. | 3.4 | 4.3 | <0.001 |
| 4. I am confident in my ability to prepare a complete discharge summary. | 3.0 | 4.2 | <0.001 |
| 5. I can identify the different types of places that may serve as a setting for discharge from the inpatient setting. | 3.1 | 3.9 | <0.001 |
| Total confidence score (out of 25) | 16.7 | 20.7 | <0.001 |
| Attitude items | |||
| 1. A hospital physician should always communicate with a patient's primary care physician before that patient is discharged from the hospital, in order to ensure a smooth transition of care. | 4.0 | 4.1 | 0.78 |
| 2. Before a patient is discharged from the hospital, a physician (not just the nurse or case manager) should always meet with the patient to discuss his medications, and goals of care. | 4.4 | 4.4 | 0.50 |
| 3. It is critical for a primary care physician to have access to a discharge summary when seeing a patient for the first time after leaving the hospital. | 4.6 | 4.7 | 0.25 |
| 4. The main reason patients often don't take their medications properly after discharge is that they are confused by the instructions given to them at the hospital. | 3.7 | 3.8 | 0.65 |
| 5. Avoiding rehospitalization should be a top priority for physicians in the process of discharge from the hospital. | 4.1 | 4.3 | 0.95 |
| Total attitude score (out of 25) | 20.8 | 21.3 | 0.07 |
| Percent Correct | |||
|---|---|---|---|
| Question (Correct Answer in Parenthesis) | Pre‐Course | Post‐Course | P Value |
| |||
| 1. When a patient is discharged with home health care, which of the following services is usually not part of the package? (A caregiver to sit with the patient and supervise them most of the day.) | 70 | 83 | 0.020* |
| 2. When a patient is discharged from the hospital to a skilled nursing facility (SNF) for further care, which of these is a service that is typically provided? (Physical therapy.) | 78 | 75 | 0.649 |
| 3. Which of the following rehabilitation activities is more likely to be in the job description of an occupational therapist? (Training of strength in upper extremities.) | 24 | 51 | <0.001* |
| 4. Which of these is least likely to be a cause of poor patient outcomes after hospital discharge? (The discharging of patients to skilled nursing facilities.) | 93 | 97 | 0.166 |
| 5. Which of these is more likely to be an indicator of poor outcomes after hospital discharge? (Having had 3 hospitalizations in the last 6 months.) | 93 | 96 | 0.287 |
| 6. Which of these data is the least likely to be an indicator that the patient is too sick to be discharged from the hospital? (Hemoglobin concentration of 9.5 g/dl.) | 45 | 74 | <0.001* |
| 7. Which of the following medications would merit the most time spent on communication with patients, family members, and receiving physicians? (Furosemide.) | 58 | 96 | <0.001* |
| 8. You are caring for an 89‐year‐old man who is being treated in the hospital for an exacerbation of his congestive heart failure (CHF). He is doing well, ambulating 100 feet without shortness of breath, and is showing understanding of the need for all his different medications. However, he is not yet back to his functional baseline. Which of the following is the LEAST appropriate setting for discharge? (Hospice care.) | 74 | 70 | 0.458 |
| 9. Which of the following is true about skilled nursing facility (SNF) care? (Patients can be admitted for treatment with IV antibiotics for several weeks.) | 52 | 79 | <0.001* |
| 10. Educating patients at discharge about their illness and medication has been found to help decrease readmission rates. (True.) | 97 | 100 | 0.045 |
| Percentage of total questions correct | 68 | 82 | <0.001* |
The questionnaire items were developed by study faculty (M.A.E. and J.M.F.) and were edited in consultation with clinical faculty members from outside Emory with experience developing care transitions curricula: Dr. Karin Ouchida of Montefiore Medical Center in New York City, and Dr. William Lyons of the University of Nebraska Medical Center.
The 6 posttest items addressed student satisfaction with individual course components, which were: the heart failure online case, training on preparing discharge summaries, initial in‐person slide presentation, postdischarge phone call, overall online discussion across all items, and finally, satisfaction with the overall course. Questionnaire items on comfort, attitudes, and satisfaction all used a five‐point Likert scale ranging from 1 (strongly disagree) to 5 (strongly agree). The 10 multiple‐choice questions on knowledge each had one right answer.
Each student completed one discharge summary during the course. For it to be deemed satisfactory, it had to have the 5 following components, all present in the BAAHM template24:
A documented discharge medication list with specific dosing schedules.
Lists of admission medications and/or a list of medication changes during hospitalization.
A discharge plan that specifies the next setting of care, as well as the planned follow‐up.
A hospital course organized by system and/or specific chronology.
A physical exam, laboratory tests, and diagnostic studies performed on admission.
Student reports of their postdischarge phone call were also evaluated by study faculty (M.A.E. and R.C.). For the report of the interview to be considered satisfactory, it had to contain at least the following 2 elements:
A discussion of the patient's medication list, including documentation of a discussion of hazardous medications (e.g., furosemide, warfarin, digoxin, insulin) if applicable.
Documentation of a discussion on follow‐up plans with a primary physician or specialist.
Data Analysis
Outcomes were evaluated based on the results of pre‐ and posttest questionnaires, in addition to the satisfactoriness of discharge summaries and postdischarge phone call reports. As for the questionnaires, 4 types of scores were analyzed based on students' questionnaire responses:
Skills Confidence Score: The sum of Likert scores for confidence items on the pre‐ and posttest was the confidence score, with a highest possible score of 25, in which the highest scores were associated with the most confidence in executing the discharge process.
Attitude Score: The sum of Likert scores for attitude items on the pre‐ and posttest was the attitude score, with a highest possible score of 25, in which the highest scores were associated with student attitudes ascribing the most importance to a safe discharge process.
Knowledge Score: The percentage of total correct answers on knowledge questions on the pre‐ and posttest were used to obtain the knowledge score, in which a score of 100 was highest.
Satisfaction Score: Satisfaction questions on the posttest questionnaire were analyzed separately to assess satisfaction with each component of the curriculum, ranging from poor (score = 1) to excellent (score = 5). We also determined the percentage of students who rated each portion of the course good or better.
In addition to questionnaire scores, students' performance in the preparation of discharge summaries and the postdischarge phone interview were evaluated. Discharge summaries and postdischarge phone interviews were classified as satisfactory or unsatisfactory based on the criteria outlined in the previous section on outcome evaluation.
Quantitative and Qualitative Analysis
Skills confidence, attitude, and knowledge scores were compared between pre‐ and posttest. Paired t tests were used to calculate statistical significance. A P value below 0.05 was considered statistically significant, using two‐tailed tests.
We also analyzed whether there were any differences in changes in confidence, attitude, and knowledge scores according to the time of year in which the course was taken by students. For this, we divided the nine‐month course into 3 trimesters (AugustOctober, NovemberJanuary, and FebruaryApril). In order to determine whether 3 were any differences in score changes among the different periods, we used a one‐way analysis of variance (ANOVA), in which a P value below 0.05 would indicate a statistically significant difference among the periods. All statistical analyses were performed using SPSS 17.0 for Windows.
Statistical tests were not utilized for the satisfaction scores, but the overall goal was for their mean to be 3 (good) or above. Also, the percentages of satisfactory discharge summaries and postdischarge phone interviews were measured. The goal was for both tasks to have a percentage of satisfactory evaluations of 80% or above.
RESULTS
The 121 students who took the module completed both the pre‐ and posttests. Table 1 details the mean pre‐ and posttest Likert scores for all confidence and attitude questions, as well as the changes in the 25‐point total confidence and attitude score from pre‐ to posttest. The change in confidence scores among survey participants was statistically significant (P < 0.001), while the change in attitude score was not (P = 0.07). Table 2 compares the percentage of correct answers before and after the course for individual knowledge questions, as well as for the entire knowledge quiz. Changes in total knowledge scores were statistically significant: the mean percentage of correct answers out of 10 questions was 68% on the pretest, and 82% on the posttest (P < 0.001).
Table 3 measures the changes in confidence, attitude, and knowledge scores by the period of the year in which students took the course. One‐way ANOVA tests for each of the 3 domains did not find statistically significant changes in confidence, attitude, or knowledge scores among the 3 trimesters in which we divided the module's calendar.
| Section of Questionnaire | Total for Year | Period of Year | F Value | P Value | ||
|---|---|---|---|---|---|---|
| AugustOctober | NovemberJanuary | FebruaryApril | ||||
| Confidence | ||||||
| Mean pre‐course score | 16.7 | 16.5 | 16.5 | 17.0 | ||
| Mean post‐course score | 20.7 | 21.0 | 19.9 | 21.0 | ||
| Mean change in score | 4.0 | 4.5 | 3.4 | 4.0 | 0.92 | 0.40 |
| Attitude | ||||||
| Mean pre‐course score | 20.8 | 20.9 | 20.5 | 20.6 | ||
| Mean post‐course score | 21.3 | 21.3 | 21.3 | 21.1 | ||
| Mean change in score | 0.5 | 0.4 | 0.8 | 0.5 | 0.13 | 0.88 |
| Knowledge | ||||||
| Mean pre‐course percentage correct | 68 | 71.3 | 67.4 | 66.4 | ||
| Mean post‐course percentage correct | 82 | 82.5 | 80.9 | 82.1 | ||
| Mean change in score | 14 | 11.2 | 13.5 | 15.7 | 0.60 | 0.55 |
| No. of participants | 121 | 40 | 34 | 47 | ||
Table 4 shows satisfaction scores on the posttest. The overall Likert rating for the course was 3.9, with 97.5% of students rating it good or better. The highest‐rated individual component of the course by Likert score was the training on discharge summaries, with a rating of 4.1. The lowest‐rated by this parameter was the congestive heart failure case, with a rating of 3.6. The online discussion across all topics had the lowest percentage of students rating it good or above, at 83.5%.
| Curriculum Section | Mean Likert Rating (Out of 5) | Percentage Rated Good or Above |
|---|---|---|
| Congestive heart failure case | 3.6 | 95.0 |
| Discharge summaries | 4.1 | 96.7 |
| Initial in‐person slide presentation | 4.0 | 97.5 |
| Postdischarge phone call | 3.7 | 95.0 |
| Online discussion for all topics | 3.7 | 83.5 |
| Overall curriculum rating | 3.9 | 97.5 |
As for student discharge summaries, 109 out of 121 (90.1%) met all the criteria in order to be deemed satisfactory; 109 out of 121 (90.1%) of postdischarge phone call reports met both required components. Both these results exceeded the goal of 80% set before the course started.
DISCUSSION
The Emory Care Transitions Curriculum for fourth‐year medical students started in the 20092010 academic year with the main goal of teaching students transferable skills that would ultimately lead to their participating in safer hospital discharges in their future practice as physicians. At the end of this course, students exhibited greater confidence in managing the discharge process, improved overall fund of knowledge relating to care transitions, and a demonstration of appropriate skills related to preparing discharge summaries and communicating with patients at discharge. This was all executed with a delivery method that students found engaging.
Analyzing the results, it is noteworthy that confidence improved, while attitudes did not. Even though confidence in performing a task does not necessarily reflect one's ability to perform it, our students' confidence scores may serve as a proxy for their ability to manage tasks related to the discharge process, like managing medications and preparing discharge summaries. Thus, while some studies suggest that self‐assessment among physicians may not always relate well to competence,26, 27 in our study, students did demonstrate skills in discharge summary preparation and in identifying the most relevant aspects of patient communication at hospital discharge. As for the absence of attitude change, this may have partly been a function of the fact that students in our group started with attitude scores that were already quite high, with a mean pretest attitude score of 20.7 out of 25.
Changes in student confidence, attitudes, and knowledge from pre‐ to posttest did not vary significantly across the academic year. Thus, one could interpret from our findings that more experienced students who took the module close to graduation benefited similarly from the course to those who completed it earlier, at least according to those rubrics. Another possible source of variation in student experience was the hospital in which students rotated: the demographics of GMH, with its large uninsured population; AVAMC, with more elderly patients; and EUH, with a more affluent profile, are certainly different. However, the number of students rotating at EUH and AVAMC were comparatively too small to attempt to draw any conclusions about how rotation site affected student experiences.
The use of a blended approach that integrated face‐to‐face didactics, patient care, and online learning offered some advantages. Curricular goals were achieved through a course that required only 2 hours of in‐person faculty time with students. This is significant, considering the time demands that academic medical faculty usually face. This approach also permitted students who were participating in a busy clinical rotation, and had limited opportunities to meet as a group, the ability to do coursework at their own pace. Another strength of the study is that all students who participated in the rotation were able to complete their surveys.
As for limitations, it is worth noting that in a course with a blended curriculum, the online discussion had the lowest percentage of students rating it good or better. Part of the perceived difficulty may have resulted from the fact that there are no other courses in the Emory medical curriculum that utilize discussion boards or distance learning methods as teaching tools. Despite this generation of students' technological savvy, this new mode of discussion may have proven difficult to pick up when they were in the midst of a busy clinical rotation. This serves as a reminder that while online curricula have proven successful in this and other settings, each element needs to be tailored to the audience. One other factor to be considered while interpreting this study's results is that this study utilized some survey instruments that have not been previously validated, even though they were developed in consultation with experts in the field of care transitions education.
We used a dichotomous, criteria‐based system to rate students' discharge summaries and reports of postdischarge phone calls. While this quantitative approach allowed us to more objectively define the quality of students' work, it did offer some disadvantages. First, even though we based the rating system for discharge summaries on a BAAHM template, it was not subjected to more extensive validation. Moreover, the quantitative approach diverted us from finding themes and other qualitative data from students' write‐ups, which could potentially have given us a fuller picture of their work.
This study contributes to the small, but growing, literature on care transitions education. The studies by Bray‐Hall et al., Lai et al., and Ouchida et al.,1921 used different methodologies, but all were directed at third‐year students using curricula with classroom and clinical learning, and showed favorable outcomes in knowledge and skills. The present study also showed positive results in students' knowledge and skills, but targeted it toward graduating medical students and included a focus on concrete skills, such as discharge summary preparation. It also utilized a nontraditional delivery approach which reached its objectives while also limiting the demands on faculty and students' face time during busy clinical rotations, which is especially important when considering that students were dispersed at multiple sites.
It is likely that medical schools will implement more care transitions curricula in coming years, as organizations like the AAMC11 and the Institute of Medicine10 increase the pressure to train future doctors to better address the needs of older and chronically ill patients, who require care from professionals of multiple disciplines, in disparate care settings. Moreover, the 2010 Patient Protection and Affordable Care Act28 contains provisions with financial incentives for hospitals to decrease readmissions. Once these become widely implemented, there will be a greater impetus to train medical practitioners to discharge patients more safely. When that occurs, medical schools will have additional compelling reasons to offer courses that teach students skills to execute better care transitions. The hoped‐for outcome of these curricula will ultimately be safer and more effective patient care.
Acknowledgements
The authors thank Dr. Ted Johnson at the Emory University School of Medicine for editorial review. They also express their gratitude to Dr. Karin Ouchida at Montefiore Medical Center and Dr. William Lyons at University of Nebraska Medical Center for their technical support in preparation of the curriculum. Disclosures: None of the authors has any relevant conflicts of interest. All coauthors have seen and agree with the contents of this manuscript. The authors are responsible for the integrity of the data described in this study. The research in this manuscript has not been submitted or accepted for publication in another journal.
- ,,, et al.Adverse events among medical patients after discharge from hospital.Can Med Assoc J.2004;170(3):345–349.
- ,,,,.The incidence and severity of adverse events affecting patients after discharge from the hospital.Ann Intern Med.2003;138:161–167.
- ,,,.Posthospital medication discrepancies: Prevalence and contributing factors.Arch Intern Med.2005;165:1842–1847.
- ,,.Adverse drug events in elderly patients receiving home health services following hospital discharge.Ann Pharmacother.1999;33:1147–1153.
- ,,,,.The association between the quality of inpatient care and early readmission: A meta‐analysis of the evidence.Med Care.1997;35(10):1044–1059.
- ,,,,.The association between the quality of inpatient care and early readmission.Ann Intern Med.1995;122(6):415–421.
- ,.Hospital readmissions as a measure of quality of health care: Advantages and limitations.Arch Intern Med.2000;160(8):1074–1081.
- ,.Lost in transition: Challenges and opportunities for improving the quality of transitional care.Ann Intern Med.2004;140:533–536.
- ,,,,,.Deficits in communication and information transfer between hospital‐based and primary care physicians.JAMA.2007;297:831–841.
- Institute of Medicine.Health Professions Education: A Bridge to Quality.Washington, DC:National Academy Press;2003.
- American Association of Medical Colleges. Geriatric Competencies for Medical Students: Recommendations of the July 2007 Geriatrics Consensus Conference.2008. Available at: http://www.aamc.org/newsroom/press kits/competencies.pdf. Accessed February 25, 2009.
- Eskildsen M, Price T, Tenover JL. Computer‐based geriatrics workbooks for resident teaching. MedEdPortal. 2007. Available at http://services. aamc.org/30/mededportal/servlet/s/segment/mededportal/ find_resources/ browse/?subid=640.
- .Care transitions in the older adult.MedEdPortal.2008. Available at http://services.aamc.org/30/mededportal/servlet/s/segment/mededportal/find_resources/browse/?subid=678. Accessed March 19, 2011.
- ,,, et al.Web‐based module to train and assess competency in systems‐based practice.Portal of Online Geriatric Education.2009. Product ID #20002. Available at: http://www. pogoe.org/node/407. Accessed March 19, 2011.
- .CHAMP (Curriculum for the Hospitalized Aging Medical Patient): The ideal hospital discharge.Portal of Online Geriatric Education.2009. Product ID #18995. Available at: http://www. pogoe.org/productid/18995. Accessed March 19, 2011.
- .M1 care transitions.Portal of Online Geriatric Education.2009. Product ID #20450. Available at: http://www. pogoe.org/node/660. Accessed March 19, 2011.
- .Transitional care.Portal of Online Geriatric Education.2007. Product ID #18991. Available at: http://www.pogoe.org/node/262. Accessed March 19, 2011.
- .Discharge summary feedback.Portal of Online Geriatric Education.2009. Product ID #20546. Available at: http://www.pogoe.org/node/788. Accessed March 19, 2011.
- ,,.Toward safe hospital discharge: A transitions in care curriculum for medical students.J Gen Intern Med.25(8):878–881.
- ,,,,.Postdischarge follow‐up visits for medical and pharmacy students on an inpatient medicine clerkship.J Hosp Med.2008;3(1):20–27.
- ,,,,.Fast forward rounds: An effective method for teaching medical students to transition patients safely across care settings.J Am Geriatr Soc.2009;57:910–917.
- .Fourth‐year medical student care transitions curriculum (free login required).Portal of Online Geriatric Education.2010. Available at: http://www.pogoe.org/node/867. Accessed July 16, 2010.
- .Falling through the cracks: Challenges and opportunities for improving transitional care for persons with continuous complex care needs.J Am Geriatr Soc.2003;51:549–555.
- Society of Hospital Medicine. Quality initiatives for patient care—BOOSTing care transitions resource room.2010. Available at: http://www.hospitalmedicine.org/ResourceRoomRedesign/RR_Care Transitions/html_CC/12Clinical Tools/01_Toolkits.cfm. Accessed November 16, 2010.
- Society of Hospital Medicine. Ideal discharge for an elderly patient: A hospitalist checklist.2005. Available at: http://www.hospitalmedicine. org/AM/Template.cfm?Section=QI_Clinical_Tools8(2):105–110.
- ,,.Difficulties in recognizing one's own incompetence: Novice physicians who are unskilled and unaware of it.Acad Med.2001;76(10 suppl):S87–S89.
- Patient Protection and Affordable Care Act, H.R. 3590.ENR, 111th Congress, 2010.
Copyright © 2011 Society of Hospital Medicine
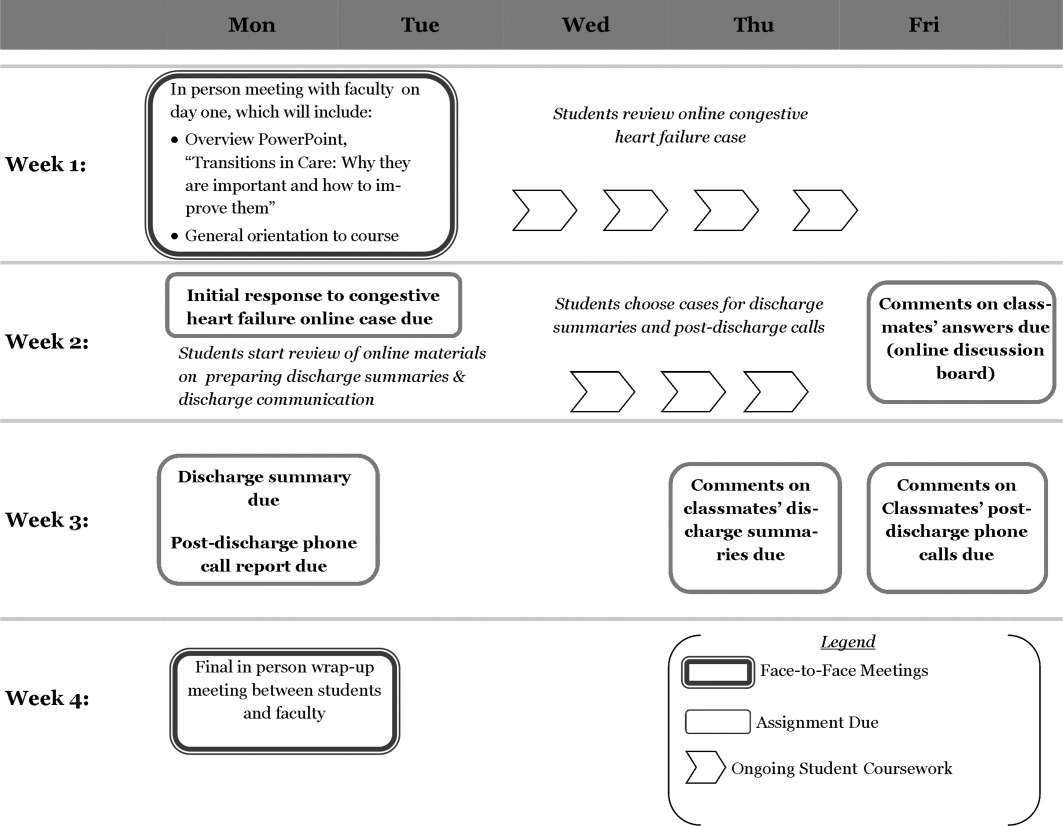
ONLINE EXCLUSIVE: Listen to hospitalists Greg Misky and Tosha Wetterneck discuss career satisfaction
Click here to listen to Dr. Misky.
Click here to listen to Dr. Wetterneck.
Click here to listen to Dr. Misky.
Click here to listen to Dr. Wetterneck.
Click here to listen to Dr. Misky.
Click here to listen to Dr. Wetterneck.
Pediatric HM Literature

Clinical question: What is the incidence of kernicterus over the past few decades?
Background: Recent guidelines for hyperbilirubinemia have recommended a systematic approach to management in order to prevent the occurrence of severe hyperbilirubinemia and, potentially, kernicterus. There has been concern that rates of kernicterus might have increased in the 1990s, when a “kindler, gentler” approach to hyperbilirubinemia was advocated by earlier guidelines.
Study design: Retrospective observational study.
Setting: California registry of developmental services enrollees.
Synopsis: Of 64,346 children born from 1988 to 1997 who received services from the California Department of Developmental Services (DDS) from 1988 to 2002, 25 met a strict definition of kernicterus. The time trend of incidence remained stable during the study years at 0.44 (95% confidence interval [CI]: 0.28-0.65) per 100,000 live births. There were no significant differences in rates before and after 1994.
Data from a national database of death certificates revealed a similar stable trend in deaths attributed to kernicterus.
A primary limitation of this study is the lack of clarity surrounding enrollment in California’s DDS by children with kernicterus. Although all children with developmental disabilities are eligible, the exact enrollment rate likely is unknown. However, this is one of the first studies to put a denominator on kernicterus in this country.
Updated guidelines on the management of hyperbilirubinemia in 2004 advocated a safer, more systematic approach to management, in part because of concerns that there had been a resurgence of kernicterus. This now seems less likely and this article adds to a body of literature that raises questions about whether a large population of patients with hyperbilirubinemia who are at extremely low risk for kernicterus are being overtreated.
Bottom line: Kernicterus rates remained unchanged in the 1990s.
Citation: Brooks JC, Fisher-Owens SA, Wu YW, Strauss DJ, Newman TB. Evidence suggests there was not a “resurgence” of kernicterus in the 1990s. Pediatrics. 2011;127:672-679.
Reviewed by Pediatric Editor Mark Shen, MD, FHM, medical director of hospital medicine at Dell Children’s Medical Center, Austin, Texas.
The Earlier, the Better
Every morning at 8 a.m., a multidisciplinary team at Wayne Memorial Hospital in Honesdale, Pa., a rural pocket of about 5,000 people about 30 miles northeast of Scranton, gathers to discuss discharge planning. Representatives from social services, home health, nursing, physical therapy, pharmacy, and the HM group attend the meeting. Each stakeholder weighs in, listens to others, and voices concerns when applicable.
“We go through each patient in the morning, briefly, and go through the plan so that when there’s a discharge coming, everybody is on the same page and can try to get everything organized,” says Louis O’Boyle, DO, FACP, FHM, medical director of Advanced Inpatient Medicine, the hospitalist program contracted by Wayne Memorial, which has 98 acute-care beds. “The hospital has reminded us to be cognizant of getting that early discharge, and it’s become almost so rote now that we don’t even have to worry about it. It’s just a thing we do.”
Better bed management is a new mantra for hospitalists nationwide, because fewer open beds means fewer dollars for both the physician and the hospital. Better bed management also means improved patient satisfaction scores, as most patients would rather be at home (and those scores in the coming years will factor into Medicare reimbursement). And better bed management means reduced backlogs across the hospital, particularly “boarders” in the ED.
“The pressure really is on the hospital for a number of reasons,” says Ken Simone, DO, SFHM, president of Hospitalist and Practice Solutions in Veazie, Maine, and a member of Team Hospitalist. “In terms of reimbursement, the sooner they can get a patient out of the hospital, it opens bed space for patients in the emergency department. It eases up bottlenecks because the patient in the ED may not need the bed that is being opened, but they may need an ICU bed, and the ICU patient is stable enough to be transferred to that medical bed that you’re opening up. So it’s a domino effect, and it certainly helps with creating a better flow within the hospital.”
It sounds simple, of course: Discharge inpatients early in the day and fill that bed with another patient, akin to a busy restaurant flipping tables to reduce the line stretching out the front door. The more customers, the more money made—both for the restaurant (i.e. hospital) and the servers (i.e. providers). And the less potential customers wait, the happier they are with their service.
But adding new beds, at nearly $1 million per bed inclusive of the space, infrastructure, and technology, is unacceptable math for most U.S. hospitals struggling to make ends meet in a tough economy.1 By contrast, an aggressive bed-management approach creates virtual bed capacity that creates more revenue-generating opportunities without those costs. And as Hospital Consumer Assessment of Healthcare Providers and Systems (HCAHPS) surveys tie patient satisfaction more directly to compensation, the more attention that will be focused on the discharge, as it will be the last process the patient experiences, and the one they likely will remember the most.
So if everyone agrees that discharging inpatients earlier in the day is a good idea, what’s the holdup? Interviews with more than a half-dozen hospitalists show a handful of factors that are present in all hospitals, large and small, academic and community:
- Downstream complications. HM is only one piece of the discharge puzzle. Hospitalists might be ready to discharge, but without that last test, or the ability to reach a pharmacist, the process slows. Even when discharge is complete, the room needs to be cleared and cleaned.
- Rounding protocols. Hospital-ists intuitively round on the sickest patients first, but that time-honored tradition has the byproduct of pushing those patients most likely to be sent home to the end of the line, automatically delaying discharges.
- Shift flexibility. Many hospitalist groups have morning shifts that begin at 8 a.m. Given the time it takes to craft discharge orders and deal with inevitable wrinkles in the process, that almost guarantees discharges will be pushed to later in the day.
- Hospital infrastructure. Insti-tutional bed management begins at the top, with a commitment across departments that discharge procedures are a shared priority. Without such across-the-board buy-in, the best hospitalists can do is fight against the tide. For example, a room could be vacated at 10 a.m., but housekeeping isn’t notified (or prepared) to clean the room for two hours because there is no institutional procedure in place to govern that decision.
“It’s harder than you think,” Dr. O’Boyle admits. “There are always extraneous factors that can delay the hospitalists from getting [discharges] done.”
Continued below...

Bed Management
Early-day discharge is just one pathway to improve “patient flow” and, therefore, bed management, according to a recent editorial in Health Affairs jointly penned by executives from the Institute for Healthcare Optimization in Newton, Mass., and the Institute for Healthcare Improvement in Cambridge, Mass.1
Other techniques are:
- Reducing length of stay (LOS): Hospitalists have long focused on keeping patient stays at a minimum, although many researchers have argued that LOS can only be reduced to a point. Quality and patient safety issues in the Affordable Care Act might actually increase LOS, as hospitalists and other physicians work to reduce 30-day readmissions by ensuring everything is done right the first time.
- Expanding capacity: At an estimated cost of $1 million to add one new bed to a hospital, it is simply unlikely that institutions will be in a fiscal position to add physical beds in the next few years.
- Increasing staff: “Here again,” the authors state flatly, “pressures on hospital systems and operating margins make it unlikely that hospitals will dramatically increase their payrolls.”
No Consensus
Although a variety of techniques can help improve early day discharge, all have hurdles. Two of the most common suggestions are geographic rounding and discharge lounges. A third is the active bed-management (ABM) model that hospitalist Eric Howell, MD, SFHM, associate professor of medicine at Johns Hopkins University and director of Johns Hopkins Bayview Medical Center’s HM division, wrote about in the Annals of Internal Medicine in December 2008.2
Geographic rounding, also dubbed unit-based setups, can help improve bed management because all participants are co-located; however, the gains likely are not enough to motivate an institution to implement the model without demonstrated improvements to other systems as well, says John Nelson, MD, FACP, MHM, cofounder and past president of SHM and a principal in the practice management firm Nelson Flores Hospital Medicine Consultants.
Discharge lounges—areas usually administered by a nurse and billed as a place for patients to gather after they’ve been formally discharged but before they have arranged a ride to physically leave the hospital—have been adopted by many hospitals. Dr. Simone and others question the liability issues associated with keeping discharged patients under the watch of hospital staff and also wonder whether the setup can have a negative impact on patient satisfaction. (For more on discharge lounges, check out “Solution of Problem,” at www.the-hospitalist.org.)

—David Bachman, MD, senior medical director for transitions of care, MaineHealth Clinical Integration, Portland, Maine
David Bachman, MD, senior medical director for transitions of care at MaineHealth Clinical Integration in Portland, Maine, and a former hospital administrator in New England, sees hospitalists as a lynchpin to the discharge process, but he also urges them to get the hospital to see them as “change agents” who need institutional support to make significant improvements.
“You’re trying to run cases through and it’s all dependent on downstream activity,” Dr. Bachman says. “If the hospitalist can push back and get this recognized as a hospital issue, that’s the only time when this problem can be solved. Hospitalists are a piece of the puzzle, but it’s not just them.”
Ideas to Chew On
Mitchell Wilson, MD, SFHM, chief medical officer for Eagle Hospital Physicians in Atlanta, agrees that reprioritizing physician rounds to encourage discharges would push patients out earlier, but he wants to see more physician assistants and nurse practitioners (PAs and NPs) blended into those rounds. The partnership would be a relatively simple and direct way for physicians to pass off nonclinical or less-intensive duties that afford them more time to focus on discharge planning. A dedicated nurse for HM service and the use of telemedicine could be folded into HM practices to help.
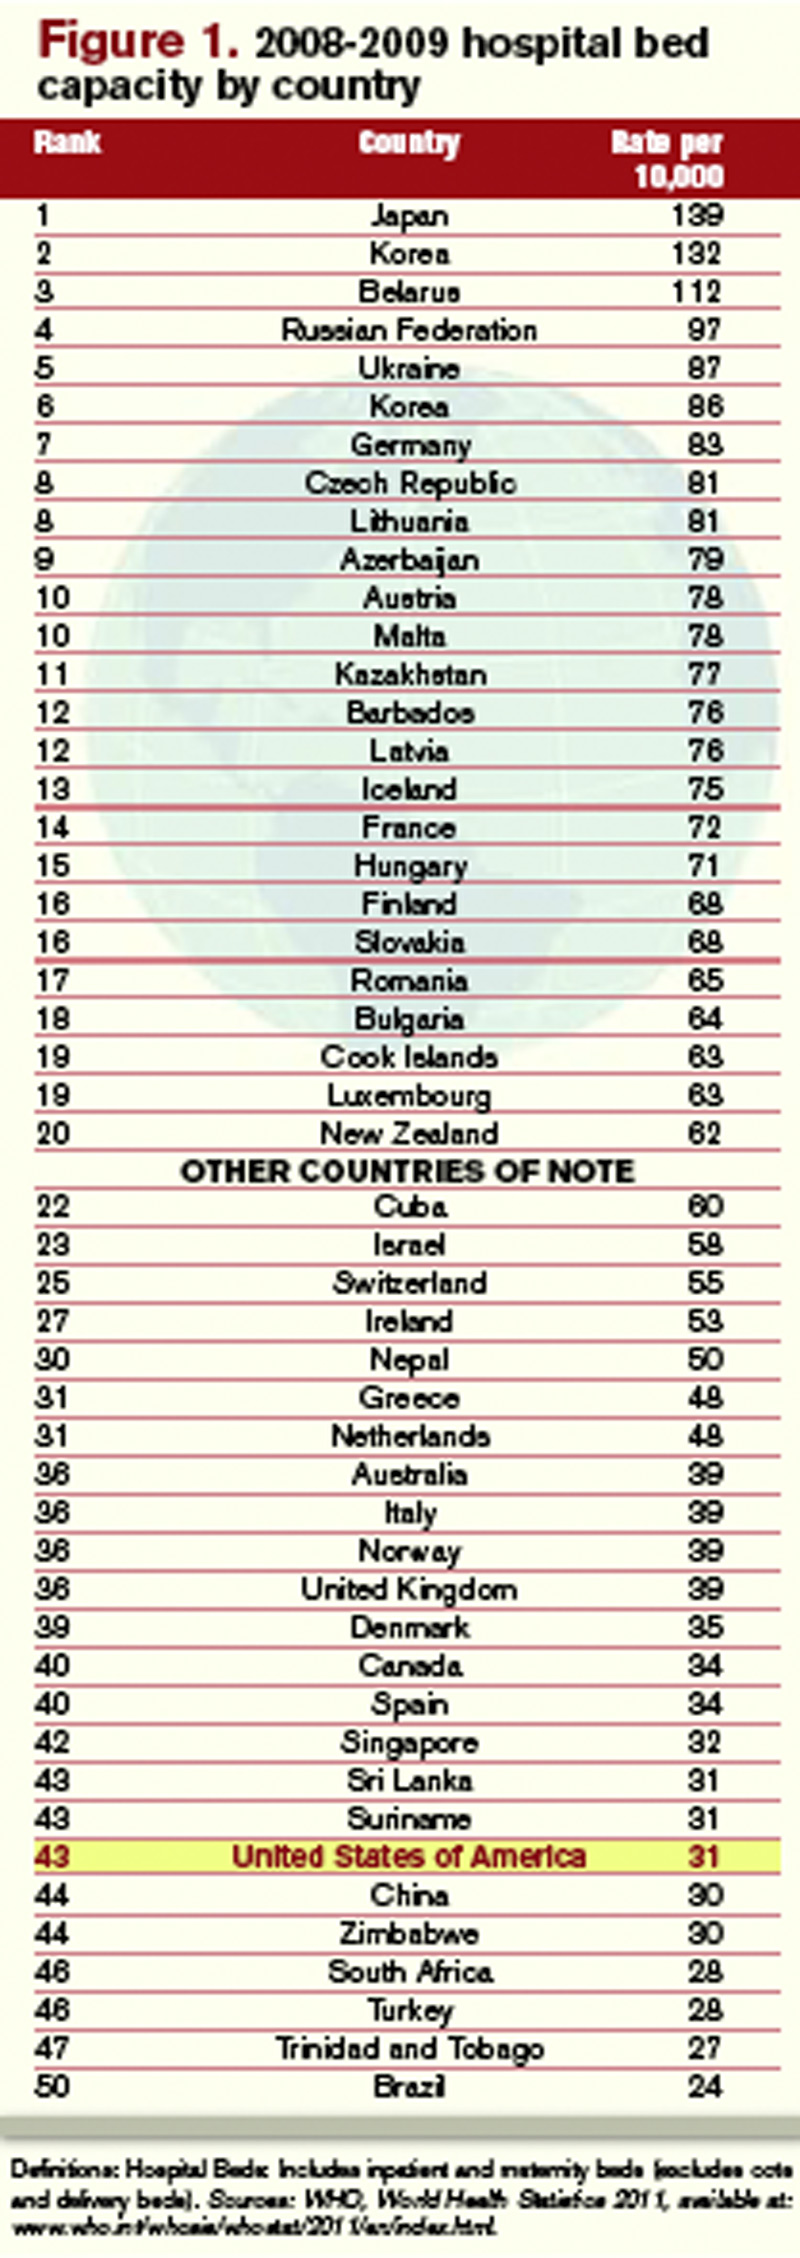
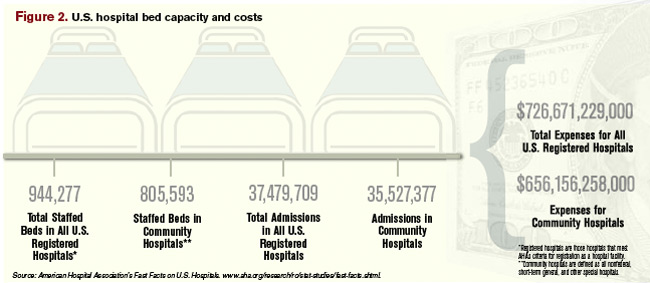
Each of the techniques would serve to get patients out earlier on what is arguably the most costly day of their stay. “Hospitals generally lose money on the last day of a patient’s stay,” Dr. Wilson says. “When appropriate from a patient care standpoint, discharging your patient and getting the bed ready for the next patient sooner is definitely an advantage for the hospital, and for the next patient.”
Dr. Bachman says one of the main hurdles to that process is no single provider “has clear responsibility and oversight. … It’s this diffuse responsibility.” That’s where Dr. Howell and colleagues thought ABM would work well. At Hopkins Bayview, hospitalists staffed an active bed-management program that rounded twice daily in ICUs and visited the ED regularly. The hospitalist on the 12-hour shift had no other duties, a luxury that HM pioneer Robert Wachter, MD, MHM, described at the time as “freeing him or her up to act as a full-time air traffic controller for all medical patients.”
The intervention reduced ED throughput for admitted patients by 98 minutes, to 360 minutes from 458 minutes. It also cut the amount of time the ED diverted ambulances because of overcrowding—the so-called “yellow alert”—by 6%, and the amount of time ambulances were diverted due to a lack of ICU beds—“red alert”—by 27%. Dr. Howell, an SHM board member, says the results showed how hospitalists can lead throughput change through institutions but that more work needs to be done to focus on early-day discharge.
“The hospital medicine side may be incentivized for early discharges,” he says, “but the hospital systems may not.”
Dr. Howell pushes for “2-by-10,” shorthand for identifying two patients daily who could be discharged by 10 a.m. because “the ED doesn’t necessarily need more beds for 24 hours. They need more beds early in the day.” But in keeping with the ABM model, Dr. Howell believes fiscal and personnel resources have to be dedicated to the problem to expect results. In the Hopkins Bayview intervention, Dr. Wachter, professor and associate chairman of the Department of Medicine at the University of California at San Francisco, chief of the division of hospital medicine, and chief of the medical service at UCSF Medical Center, estimated the annual costs of ABM at close to $1 million a year, given the likely need for four to six full-time equivalent hospitalists, according to a post on his Wachter’s World blog (www.wachtersworld. com) after the report was published.
One idea Dr. Howell suggests to push earlier discharges is restructuring physician workweeks, setting aside certain days for admission and certain days for follow-ups. If two shifts of follow-up days are scheduled after two days of admissions, it’s likely a hospitalist could follow a patient through their entire stay, he says. “You have to structure the doctor’s day to focus on discharges first,” he adds.
Dr. Howell also believes multidisciplinary rounds are key to earlier discharges. At Wayne Memorial Hospital and other places that have instituted such teams, discharge usually is just one byproduct of a construct ultimately aimed at quality improvement. Wayne Memorial’s Dr. O’Boyle says that since the team approach was initiated in September 2009, the hospital’s LOS has dropped by 0.75 days and patient satisfaction scores have risen about 25%. Those metrics will be key data points in the years to come as discharges and readmissions become tied to reimbursement via healthcare reform (see “Value-Based Purchasing Raises the Stakes,” May 2011).

“One of the biggest factors for readmissions are things like pharmacy errors, and lack of follow-up, and other loose ends that, if you’re in too much of a hurry to get people out and you don’t have the whole team approach and make sure all your I’s are dotted and T’s are crossed, then they have an increased chance of coming back,” Dr. O’Boyle says. “So we focus on patient satisfaction, and we focus on the discharge day and the discharge time to prevent readmissions and to maximize patient satisfaction. That’s the bottom line for the hospital…It’s interesting how the bottom line seems to follow quality.”
Continued below...
Inherent Conflicts?
Early-day discharge actually can be a bad thing in some cases, Dr. Nelson says. Think of a case in which a patient might be ready for discharge in the late evening or during an overnight. To wait until the morning to send that patient home might not be the best approach.

—Louis O’Boyle, DO, FACP, FHM, medical director, Advanced Inpatient Medicine, Honesdale, Pa.
“The place that manages length of stay most efficiently probably has plenty of late-day discharge,” he says.
Another potential conflict getting in the way of early-day discharge is what Dr. Wilson calls “admission competition.” For example, a hospitalist is working on discharge papers early in the morning but is then called away for a consult on an acute-care case in the ED or elsewhere. Each of the duties is important, but conflicting duties leave the hospitalist having to make choices.
“It’s not all straightforward,” Dr. Nelson says.
Emergency Nurses Association President AnnMarie Papa, DNP, RN, CEN, NE-BC, FAEN, says that collaboration between nurses and physicians is an answer to such competition. Calling the problem a “wrinkle across the system,” Papa says that without hospital administrators taking point and declaring the issue of discharge a priority, little wholesale improvement will be made. Even then, physicians and nurses—as the two main groups interacting with the patient—have to work together, she adds.
“Hospitalists have to partner with nurses,” Papa says, imploring physicians and nurses to work together on discharge decisions. “If the physicians and nurses collaborate on the decision and plans of care for the patients and the care they’re giving them and the discharge instructions, then it’s a win-win for everybody.”
Richard Quinn is a freelance writer based in New Jersey.
Reference
- Litvak E, Bisognano M. More patients, less payment: increasing hospital efficiency in the aftermath of health reform. Health Affairs. 2011;30(1): 76-80.
- Howell E, Bessman E, Kravet S, Kolodner K, Marshall R, Wright S. Active bed management by hospitalists and emergency department throughput. Ann Int Med. 2008;149(11):804-810.
Every morning at 8 a.m., a multidisciplinary team at Wayne Memorial Hospital in Honesdale, Pa., a rural pocket of about 5,000 people about 30 miles northeast of Scranton, gathers to discuss discharge planning. Representatives from social services, home health, nursing, physical therapy, pharmacy, and the HM group attend the meeting. Each stakeholder weighs in, listens to others, and voices concerns when applicable.
“We go through each patient in the morning, briefly, and go through the plan so that when there’s a discharge coming, everybody is on the same page and can try to get everything organized,” says Louis O’Boyle, DO, FACP, FHM, medical director of Advanced Inpatient Medicine, the hospitalist program contracted by Wayne Memorial, which has 98 acute-care beds. “The hospital has reminded us to be cognizant of getting that early discharge, and it’s become almost so rote now that we don’t even have to worry about it. It’s just a thing we do.”
Better bed management is a new mantra for hospitalists nationwide, because fewer open beds means fewer dollars for both the physician and the hospital. Better bed management also means improved patient satisfaction scores, as most patients would rather be at home (and those scores in the coming years will factor into Medicare reimbursement). And better bed management means reduced backlogs across the hospital, particularly “boarders” in the ED.
“The pressure really is on the hospital for a number of reasons,” says Ken Simone, DO, SFHM, president of Hospitalist and Practice Solutions in Veazie, Maine, and a member of Team Hospitalist. “In terms of reimbursement, the sooner they can get a patient out of the hospital, it opens bed space for patients in the emergency department. It eases up bottlenecks because the patient in the ED may not need the bed that is being opened, but they may need an ICU bed, and the ICU patient is stable enough to be transferred to that medical bed that you’re opening up. So it’s a domino effect, and it certainly helps with creating a better flow within the hospital.”
It sounds simple, of course: Discharge inpatients early in the day and fill that bed with another patient, akin to a busy restaurant flipping tables to reduce the line stretching out the front door. The more customers, the more money made—both for the restaurant (i.e. hospital) and the servers (i.e. providers). And the less potential customers wait, the happier they are with their service.
But adding new beds, at nearly $1 million per bed inclusive of the space, infrastructure, and technology, is unacceptable math for most U.S. hospitals struggling to make ends meet in a tough economy.1 By contrast, an aggressive bed-management approach creates virtual bed capacity that creates more revenue-generating opportunities without those costs. And as Hospital Consumer Assessment of Healthcare Providers and Systems (HCAHPS) surveys tie patient satisfaction more directly to compensation, the more attention that will be focused on the discharge, as it will be the last process the patient experiences, and the one they likely will remember the most.
So if everyone agrees that discharging inpatients earlier in the day is a good idea, what’s the holdup? Interviews with more than a half-dozen hospitalists show a handful of factors that are present in all hospitals, large and small, academic and community:
- Downstream complications. HM is only one piece of the discharge puzzle. Hospitalists might be ready to discharge, but without that last test, or the ability to reach a pharmacist, the process slows. Even when discharge is complete, the room needs to be cleared and cleaned.
- Rounding protocols. Hospital-ists intuitively round on the sickest patients first, but that time-honored tradition has the byproduct of pushing those patients most likely to be sent home to the end of the line, automatically delaying discharges.
- Shift flexibility. Many hospitalist groups have morning shifts that begin at 8 a.m. Given the time it takes to craft discharge orders and deal with inevitable wrinkles in the process, that almost guarantees discharges will be pushed to later in the day.
- Hospital infrastructure. Insti-tutional bed management begins at the top, with a commitment across departments that discharge procedures are a shared priority. Without such across-the-board buy-in, the best hospitalists can do is fight against the tide. For example, a room could be vacated at 10 a.m., but housekeeping isn’t notified (or prepared) to clean the room for two hours because there is no institutional procedure in place to govern that decision.
“It’s harder than you think,” Dr. O’Boyle admits. “There are always extraneous factors that can delay the hospitalists from getting [discharges] done.”
Continued below...
Bed Management
Early-day discharge is just one pathway to improve “patient flow” and, therefore, bed management, according to a recent editorial in Health Affairs jointly penned by executives from the Institute for Healthcare Optimization in Newton, Mass., and the Institute for Healthcare Improvement in Cambridge, Mass.1
Other techniques are:
- Reducing length of stay (LOS): Hospitalists have long focused on keeping patient stays at a minimum, although many researchers have argued that LOS can only be reduced to a point. Quality and patient safety issues in the Affordable Care Act might actually increase LOS, as hospitalists and other physicians work to reduce 30-day readmissions by ensuring everything is done right the first time.
- Expanding capacity: At an estimated cost of $1 million to add one new bed to a hospital, it is simply unlikely that institutions will be in a fiscal position to add physical beds in the next few years.
- Increasing staff: “Here again,” the authors state flatly, “pressures on hospital systems and operating margins make it unlikely that hospitals will dramatically increase their payrolls.”
No Consensus
Although a variety of techniques can help improve early day discharge, all have hurdles. Two of the most common suggestions are geographic rounding and discharge lounges. A third is the active bed-management (ABM) model that hospitalist Eric Howell, MD, SFHM, associate professor of medicine at Johns Hopkins University and director of Johns Hopkins Bayview Medical Center’s HM division, wrote about in the Annals of Internal Medicine in December 2008.2
Geographic rounding, also dubbed unit-based setups, can help improve bed management because all participants are co-located; however, the gains likely are not enough to motivate an institution to implement the model without demonstrated improvements to other systems as well, says John Nelson, MD, FACP, MHM, cofounder and past president of SHM and a principal in the practice management firm Nelson Flores Hospital Medicine Consultants.
Discharge lounges—areas usually administered by a nurse and billed as a place for patients to gather after they’ve been formally discharged but before they have arranged a ride to physically leave the hospital—have been adopted by many hospitals. Dr. Simone and others question the liability issues associated with keeping discharged patients under the watch of hospital staff and also wonder whether the setup can have a negative impact on patient satisfaction. (For more on discharge lounges, check out “Solution of Problem,” at www.the-hospitalist.org.)
—David Bachman, MD, senior medical director for transitions of care, MaineHealth Clinical Integration, Portland, Maine
David Bachman, MD, senior medical director for transitions of care at MaineHealth Clinical Integration in Portland, Maine, and a former hospital administrator in New England, sees hospitalists as a lynchpin to the discharge process, but he also urges them to get the hospital to see them as “change agents” who need institutional support to make significant improvements.
“You’re trying to run cases through and it’s all dependent on downstream activity,” Dr. Bachman says. “If the hospitalist can push back and get this recognized as a hospital issue, that’s the only time when this problem can be solved. Hospitalists are a piece of the puzzle, but it’s not just them.”
Ideas to Chew On
Mitchell Wilson, MD, SFHM, chief medical officer for Eagle Hospital Physicians in Atlanta, agrees that reprioritizing physician rounds to encourage discharges would push patients out earlier, but he wants to see more physician assistants and nurse practitioners (PAs and NPs) blended into those rounds. The partnership would be a relatively simple and direct way for physicians to pass off nonclinical or less-intensive duties that afford them more time to focus on discharge planning. A dedicated nurse for HM service and the use of telemedicine could be folded into HM practices to help.
Each of the techniques would serve to get patients out earlier on what is arguably the most costly day of their stay. “Hospitals generally lose money on the last day of a patient’s stay,” Dr. Wilson says. “When appropriate from a patient care standpoint, discharging your patient and getting the bed ready for the next patient sooner is definitely an advantage for the hospital, and for the next patient.”
Dr. Bachman says one of the main hurdles to that process is no single provider “has clear responsibility and oversight. … It’s this diffuse responsibility.” That’s where Dr. Howell and colleagues thought ABM would work well. At Hopkins Bayview, hospitalists staffed an active bed-management program that rounded twice daily in ICUs and visited the ED regularly. The hospitalist on the 12-hour shift had no other duties, a luxury that HM pioneer Robert Wachter, MD, MHM, described at the time as “freeing him or her up to act as a full-time air traffic controller for all medical patients.”
The intervention reduced ED throughput for admitted patients by 98 minutes, to 360 minutes from 458 minutes. It also cut the amount of time the ED diverted ambulances because of overcrowding—the so-called “yellow alert”—by 6%, and the amount of time ambulances were diverted due to a lack of ICU beds—“red alert”—by 27%. Dr. Howell, an SHM board member, says the results showed how hospitalists can lead throughput change through institutions but that more work needs to be done to focus on early-day discharge.
“The hospital medicine side may be incentivized for early discharges,” he says, “but the hospital systems may not.”
Dr. Howell pushes for “2-by-10,” shorthand for identifying two patients daily who could be discharged by 10 a.m. because “the ED doesn’t necessarily need more beds for 24 hours. They need more beds early in the day.” But in keeping with the ABM model, Dr. Howell believes fiscal and personnel resources have to be dedicated to the problem to expect results. In the Hopkins Bayview intervention, Dr. Wachter, professor and associate chairman of the Department of Medicine at the University of California at San Francisco, chief of the division of hospital medicine, and chief of the medical service at UCSF Medical Center, estimated the annual costs of ABM at close to $1 million a year, given the likely need for four to six full-time equivalent hospitalists, according to a post on his Wachter’s World blog (www.wachtersworld. com) after the report was published.
One idea Dr. Howell suggests to push earlier discharges is restructuring physician workweeks, setting aside certain days for admission and certain days for follow-ups. If two shifts of follow-up days are scheduled after two days of admissions, it’s likely a hospitalist could follow a patient through their entire stay, he says. “You have to structure the doctor’s day to focus on discharges first,” he adds.
Dr. Howell also believes multidisciplinary rounds are key to earlier discharges. At Wayne Memorial Hospital and other places that have instituted such teams, discharge usually is just one byproduct of a construct ultimately aimed at quality improvement. Wayne Memorial’s Dr. O’Boyle says that since the team approach was initiated in September 2009, the hospital’s LOS has dropped by 0.75 days and patient satisfaction scores have risen about 25%. Those metrics will be key data points in the years to come as discharges and readmissions become tied to reimbursement via healthcare reform (see “Value-Based Purchasing Raises the Stakes,” May 2011).
“One of the biggest factors for readmissions are things like pharmacy errors, and lack of follow-up, and other loose ends that, if you’re in too much of a hurry to get people out and you don’t have the whole team approach and make sure all your I’s are dotted and T’s are crossed, then they have an increased chance of coming back,” Dr. O’Boyle says. “So we focus on patient satisfaction, and we focus on the discharge day and the discharge time to prevent readmissions and to maximize patient satisfaction. That’s the bottom line for the hospital…It’s interesting how the bottom line seems to follow quality.”
Continued below...
Inherent Conflicts?
Early-day discharge actually can be a bad thing in some cases, Dr. Nelson says. Think of a case in which a patient might be ready for discharge in the late evening or during an overnight. To wait until the morning to send that patient home might not be the best approach.
—Louis O’Boyle, DO, FACP, FHM, medical director, Advanced Inpatient Medicine, Honesdale, Pa.
“The place that manages length of stay most efficiently probably has plenty of late-day discharge,” he says.
Another potential conflict getting in the way of early-day discharge is what Dr. Wilson calls “admission competition.” For example, a hospitalist is working on discharge papers early in the morning but is then called away for a consult on an acute-care case in the ED or elsewhere. Each of the duties is important, but conflicting duties leave the hospitalist having to make choices.
“It’s not all straightforward,” Dr. Nelson says.
Emergency Nurses Association President AnnMarie Papa, DNP, RN, CEN, NE-BC, FAEN, says that collaboration between nurses and physicians is an answer to such competition. Calling the problem a “wrinkle across the system,” Papa says that without hospital administrators taking point and declaring the issue of discharge a priority, little wholesale improvement will be made. Even then, physicians and nurses—as the two main groups interacting with the patient—have to work together, she adds.
“Hospitalists have to partner with nurses,” Papa says, imploring physicians and nurses to work together on discharge decisions. “If the physicians and nurses collaborate on the decision and plans of care for the patients and the care they’re giving them and the discharge instructions, then it’s a win-win for everybody.”
Richard Quinn is a freelance writer based in New Jersey.
Reference
- Litvak E, Bisognano M. More patients, less payment: increasing hospital efficiency in the aftermath of health reform. Health Affairs. 2011;30(1): 76-80.
- Howell E, Bessman E, Kravet S, Kolodner K, Marshall R, Wright S. Active bed management by hospitalists and emergency department throughput. Ann Int Med. 2008;149(11):804-810.
HM@15 - Is Hospital Medicine a Good Bet for Improving Patient Satisfaction?
At first glance, the deck might seem hopelessly stacked against hospitalists with regard to patient satisfaction. HM practitioners lack the long-term relationship with patients that many primary-care physicians (PCPs) have established. Unlike surgeons and other specialists, they tend to care for those patients—more complicated, lacking a regular doctor, or admitted through the ED, for example—who are more inclined to rate their hospital stay unfavorably.1 They may not even be accurately remembered by patients who encounter multiple doctors during the course of their hospitalization.2 And hospital information systems can misidentify the treating physician, while the actual surveys used to gauge hospitalists have been imperfect at best.3
And yet, the hospitalist model has evolved substantially on the question of how it can impact patient perceptions of care.
Initially, hospitalist champions adopted a largely defensive posture: The model would not negatively impact patient satisfaction as it delivered on efficiency—and later on quality. The healthcare system, however, is beginning to recognize the hospitalist as part of a care “team” whose patient-centered approach might pay big dividends in the inpatient experience and, eventually, on satisfaction scores.
“I think the next phase, which is a focus on the hospitalist as a team member and team builder, is going to be key,” says William Southern, MD, MPH, SFHM, chief of the division of hospital medicine at Montefiore Medical Center in Bronx, N.Y.
Recent studies suggest that hospitalists are helping to design and test new tools that will not only improve satisfaction, but also more fairly assess the impact of individual doctors. As the maturation process continues, experts say, hospitalists have an opportunity to influence both provider-based interventions and more programmatic decision-making that can have far-reaching effects. Certainly, the hand dealt to hospitalists is looking more favorable even as the ante has been raised with Medicare programs like value-based purchasing, and its pot of money tied to patient perceptions of care.
So how have hospitalists played their cards so far?
A Look at the Evidence
In its early years, the HM model faced a persistent criticism: Replacing traditional caregivers with these new inpatient providers in the name of efficiency would increase handoffs and, therefore, discontinuities of care delivered by a succession of unfamiliar faces. If patients didn’t see their PCP in the hospital, the thinking went, they might be more disgruntled at being tended to by hospitalists, leading to lower satisfaction scores.4
A particularly heated exchange played out in 1999 in the New England Journal of Medicine. Farris A. Manian, MD, MPH, of Infectious Disease Consultants in St. Louis wrote in one letter, “I am particularly concerned about what impressionable house-staff members will learn from hospitalists who place an inordinate emphasis on cost rather than the quality of patient care or teaching.”5
A few subsequent studies, however, hinted that such concerns might be overstated. A 2000 analysis in the American Journal of Medicine that examined North Mississippi Health Services in Tupelo, for instance, found that care administered by hospitalists led to a shorter length of stay and lower costs than care delivered by internists. Importantly, the study found that patient satisfaction was similar for both models, while quality metrics were likewise equal or even tilted slightly toward hospitalists.6
In their influential 2002 review of a profession that was only a half-decade old, Robert Wachter, MD, MHM, and Lee Goldman, MD, MPH, FACP from the University of California at San Francisco reinforced the message that HM wouldn’t lead to unhappy patients. “Empirical research supports the premise that hospitalists improve inpatient efficiency without harmful effects on quality or patient satisfaction,” they asserted.7
Among pediatric patients, a 2005 review found that “none of the four studies that evaluated patient satisfaction found statistically significant differences in satisfaction with inpatient care. However, two of the three evaluations that did assess parents’ satisfaction with care provided to their children found that parents were more satisfied with some aspects of care provided by hospitalists.”8

—William Southern, MD, chief, division of hospital medicine, Montefiore Medical Center, Bronx, N.Y.
Similar findings were popping up around the country: Replacing an internal medicine residency program with a physician assistant/hospitalist model at Brooklyn, N.Y.’s Coney Island Hospital did not adversely impact patient satisfaction, while it significantly improved mortality.9 Brigham & Women’s Hospital in Boston likewise reported no change in patient satisfaction in a study comparing a physician assistant/hospitalist service with traditional house staff services.10
The shift toward a more proactive position on patient satisfaction is exemplified within a 2008 white paper, “Hospitalists Meeting the Challenge of Patient Satisfaction,” written by a group of 19 private-practice HM experts known as The Phoenix Group.3 The paper acknowledged the flaws and limitations of existing survey methodologies, including Medicare’s Hospital Consumer Assessment of Healthcare Providers and Systems (HCAHPS) scores. Even so, the authors urged practice groups to adopt a team-oriented approach to communicate to hospital administrations “the belief that hospitalists are in the best position to improve survey scores overall for the facility.”
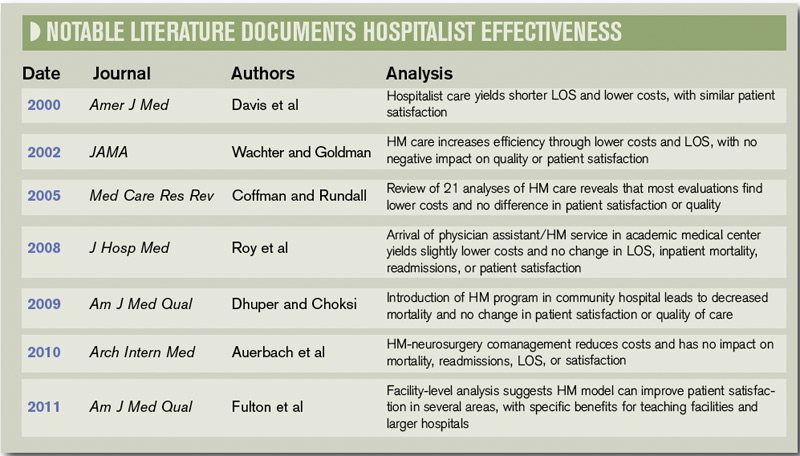
Carle Foundation Hospital in Urbana, Ill., is now publicly advertising its HM service’s contribution to high patient satisfaction scores on its website, and underscoring the hospitalists’ consistency, accessibility, and communication skills. “The hospital is never without a hospitalist, and our nurses know that they can rely on them,” says Lynn Barnes, vice president of hospital operations. “They’re available, they’re within a few minutes away, and patients’ needs get met very efficiently and rapidly.”
As a result, she says, their presence can lead to higher scores in patients’ perceptions of communication.
Hospitalists also have been central to several safety initiatives at Carle. Napoleon Knight, MD, medical director of hospital medicine and associate vice president for quality, says the HM team has helped address undiagnosed sleep apnea and implement rapid responses, such as “Code Speed.” Caregivers or family members can use the code to immediately call for help if they detect a downturn in a patient’s condition.
The ongoing initiatives, Dr. Knight and Barnes say, are helping the hospital improve how patients and their loved ones perceive care as Carle adapts to a rapidly shifting healthcare landscape. “With all of the changes that seem to be coming from the external environment weekly, we want to work collaboratively to make sure we’re connected and aligned and communicating in an ongoing fashion so we can react to all of these changes,” Dr. Knight says.
Continued below...
A Hopeful Trend
So far, evidence that the HM model is more broadly raising patient satisfaction scores is largely anecdotal. But a few analyses suggest the trend is moving in the right direction. A recent study in the American Journal of Medical Quality, for instance, concludes that facilities with hospitalists might have an advantage in patient satisfaction with nursing and such personal issues as privacy, emotional needs, and response to complaints.11 The study also posits that teaching facilities employing hospitalists could see benefits in overall satisfaction, while large facilities with hospitalists might see gains in satisfaction with admissions, nursing, and tests and treatments.
Brad Fulton, PhD, a researcher at South Bend, Ind.-based healthcare consulting firm Press Ganey and the study’s lead author, says the 30,000-foot view of patient satisfaction at the facility level can get foggy in a hurry due to differences in the kind and size of hospitalist programs. “And despite all of that fog, we’re still able to see through that and find something,” he says.
One limitation is that the study findings could also reflect differences in the culture of facilities that choose to add hospitalists. That caveat means it might not be possible to completely untangle the effect of an HM group on inpatient care from the larger, hospitalwide values that have allowed the group to set up shop. The wrinkle brings its own fascinating questions, according to Fulton. For example, is that kind of culture necessary for hospitalists to function as well as they do?

—Lynn Barnes, vice president of hospital operations, Carle Foundation Hospital, Urbana, Ill.
Such considerations will become more important as the healthcare system places additional emphasis on patient satisfaction, as Medicare’s value-based purchasing program is doing through its HCAHPS scores. With all the changes, success or failure on the patient experience front is going to carry “not just a reputational import, but also a financial impact,” says Ethan Cumbler, MD, FACP, director of Acute Care for the Elderly (ACE) Service at the University of Colorado Denver.
So how can HM fairly and accurately assess its own practitioners? “I think one starts by trying to apply some of the rigor that we have learned from our experience as hospitalists in quality improvement to the more warm and fuzzy field of patient experience,” Dr. Cumbler says. Many hospitals employ surveys supplied by consultants like Press Ganey to track the global patient satisfaction for their institution, he says.
“But for an individual hospitalist or hospitalist group, that kind of tool often lacks both the specificity and the timeliness necessary to make good decisions about impact of interventions on patient satisfaction,” he says.
Mark Williams, MD, FACP, FHM, professor and chief of the division of hospital medicine at Northwestern University’s Feinberg School of Medicine in Chicago, agrees that such imprecision could lead to unfair assessments. “You can imagine a scenario where a patient actually liked their hospitalist very much,” he says, “but when they got the survey, they said [their stay] was terrible and the reasons being because maybe the nurse call button was not answered and the food was terrible and medications were given to them incorrectly, or it was noisy at night so they couldn’t sleep.”
A recent study by Dr. Williams and his colleagues, in which they employed a new assessment method called the Communication Assessment Tool (CAT), confirmed the group’s suspicions: “that the results from the Press Ganey didn’t match up with the CAT, which was a direct assessment of the patient’s perception of the hospitalist’s communication skills,” he says.12
The validated tool, he adds, provides directed feedback to the physician based on the percentage of patients rating that provider as excellent, instead of on the average total score. Hospitalists have felt vindicated by the results. “They were very nervous because the hospital talked about basing an incentive off of the Press Ganey scores, and we said, ‘You can’t do that,’ because we didn’t feel they were accurate, and this study proved that,” Dr. Williams explains.
Fortunately, the message has reached researchers and consultants alike, and better tools are starting to reach hospitals around the country. At HM11 in May, Press Ganey unveiled a new survey designed to help patients assess the care delivered by two hospitalists, the average for inpatient stays. The item set is specific to HM functions, and includes the photo and name of each hospitalist, which Fulton says should improve the validity and accuracy of the data.
“The early response looks really good,” Fulton says, though it’s too early to say whether the tool, called Hospitalist Insight, will live up to its billing. If it proves its mettle, Fulton says, the survey could be used to reward top-performing hospitalists, and the growing dataset could allow hospitals to compare themselves with appropriate peer groups for fairer comparisons.
Meanwhile, researchers are testing out checklists to score hospitalist etiquette, and tracking and paging systems to help ensure continuity of care. They have found increased patient satisfaction when doctors engage in verbal communication during a discharge, in interdisciplinary team rounding, and in efforts to address religious and spiritual concerns.
Since 2000, when Montefiore’s hospitalist program began, Dr. Southern says the hospital has explained to patients the tradeoff accompanying the HM model. “I say something like this to every patient: ‘I know I’m not the doctor that you know, and you’re just meeting me. The downside is that you haven’t met me before and I’m a new face, but the upside is that if you need me during the day, I’m here all the time, I’m not someplace else. And so if you need something, I can be here quickly.’ ”
Being very explicit about that tradeoff, he says, has made patients very comfortable with the model of care, especially during a crisis moment in their lives. “I think it’s really important to say, ‘I know you don’t know me, but here’s the upside.’ And my experience is that patients easily understand that tradeoff and are very positive,” Dr. Southern says.
The Verdict
Available evidence suggests that practitioners of the HM model have pivoted from defending against early criticism that they may harm patient satisfaction to pitching themselves as team leaders who can boost facilitywide perceptions of care. So far, too little research has been conducted to suggest whether that optimism is fully warranted, but early signs look promising.
At facilities like Chicago’s Northwestern Memorial Hospital, medical floors staffed by hospitalists are beginning to beat out surgical floors for the traveling patient satisfaction award. And experts like Dr. Cumbler are pondering how ongoing initiatives to boost scores can follow in the footsteps of efficiency and quality-raising efforts by making the transition from focusing on individual doctors to adopting a more programmatic approach. “What’s happening to that patient during the 23 hours and 45 minutes of their hospital day that you are not sitting by the bedside? And what influence should a hospitalist have in affecting that other 23 hours and 45 minutes?” he says.
Handoffs, discharges, communication with PCPs, and other potential weak points in maintaining high levels of patient satisfaction, Dr. Cumbler says, all are amenable to systems-based improvement. “As hospitalists, we are in a unique position to influence not only our one-one-one interaction with the patient, but also to influence that system of care in a way that patients will notice in a real and tangible way,” he says. “I think we’ve recognized for some time that a healthy heart but a miserable patient is not a healthy person.”
Teaching Hospitals Gain Ground in Patient Satisfaction

One widely accepted truism about teaching facilities is that they’re known to have lower patient satisfaction scores than nonteaching hospitals. Brad Fulton, researcher for South Bend, Ind.-based consultant firm Press Ganey, attributes the difference in part to the fact that many doctors at teaching facilities must divide their time among patient care, education, and research. Such hospitals also tend to have some of the more medically difficult patients, he says, some of who may be more apt to feel like they’re on display with the abundance of students and residents.
In one of his recent studies, however, teaching facilities with hospitalists scored higher on patient satisfaction than nonteaching facilities or teaching facilities that lacked hospitalists. One potential follow-up question could have broad implications: “What is it about having hospitalists in teaching facilities that works so well in terms of patient satisfaction?” Can that be replicated elsewhere, he wonders? And is there an essential element that could be applied to nonteaching facilities?
A separate study also defied expectations by finding that teaching bedside procedures to inexperienced residents can be reassuring to patients, if done correctly. In a teaching model instituted at the University of California San Francisco, an experienced hospitalist with extra training supervises a novice during bedside procedures such as lumbar punctures and paracentesis. Study coauthor Diane Sliwka, MD, associate clinical professor of medicine and a hospitalist, says the feedback so far suggests that the model can improve safety, boost education, and deliver a positive patient experience.
Patients may be hesitant about having trainees do procedures, she says, but surveys suggest those patients are reassured when they know an expert is in the room and watching. They also want to hear what will happen next to counteract the anxiety of feeling pain or encountering something unexpected.
As the study suggested, what patients may find to be the most difficult or nerve-wracking can be quite different from what doctors expect. “You would think it was actually the procedure that was most painful part, but actually that was after we had given lidocaine,” Dr. Sliwka says. Patients repeatedly reacted to the doctors using a plastic pen cap to imprint the site where they would insert a needle. “Over and over we would hear people say, ‘That is actually the most painful part and you didn’t warn me about that,’ ” she recalls. “And we didn’t warn people about that because we didn’t think it was a big deal.”
Procedures can take longer with trainees, another tradeoff that can leading to lower satisfaction scores. But what the study also showed is that in academic settings, involving residents doesn’t harm the overall patient experience and can in fact improve it. “Anecdotally, what we hear from patients a lot is, ‘Oh, I had this procedure done before and it went horribly.’ They would tell stories of previous bad experiences, and then really be thankful for the experience that they had in our setting,” Dr. Sliwka says.
The extended face-to-face time can yield another positive effect. Dr. Sliwka found that hospitalists and residents often learned medical and historical information about the patient that the primary care team hadn’t yet had an opportunity to glean. “Patients just start to tell you about their families, their lives, their medical problems, their experiences,” she says, a product of building more rapport with them. “We would often find ourselves telling the primary medical team, ‘By the way, we found this out and you should probably know it: the patient is very concerned about this that’s been going on,’ and the patient hasn’t had a chance to tell the team because there isn’t that kind of time.”
Even without the specific model, Dr. Sliwka says, several principles can be applied to daily interactions. Framing things appropriately, she says, helps patients gain confidence in the doctors and allows them to safely conduct bedside teaching and openly discuss procedures. Even correcting mistakes can be a positive experience. “That actually makes the patient feel more confident in you than less confident,” Dr. Sliwka says.
Ultimately, the teaching experience can help residents broaden their thinking about patient satisfaction. “I think when trainees are starting, their real focus is, ‘How do I deal with this correctly?’ ” Dr. Sliwka says. “It takes a level of comfort with the basic skills to then go beyond that and start thinking about, ‘How is the patient perceiving this?’”
Bryn Nelson is a freelance medical journalist based in Seattle.
References
- Williams M, Flanders SA, Whitcomb WF. Comprehensive hospital medicine: an evidence based approach. Elsevier;2007:971-976.
- Arora V, Gangireddy S, Mehrotra A, Ginde R, Tormey M, Meltzer D. Ability of hospitalized patients to identify their in-hospital physicians. Arch Intern Med. 2009;169(2):199-201.
- Singer AS, et al. Hospitalists meeting the challenge of patient satisfaction. The Phoenix Group. 2008;1-5.
- Manian FA. Whither continuity of care? N Engl J Med. 1999;340:1362-1363.
- Correspondence. Whither continuity of care? N Engl J Med. 1999;341:850-852.
- Davis KM, Koch KE, Harvey JK, et al. Effects of hospitalists on cost, outcomes, and patient satisfaction in a rural health system. Amer J Med. 2000;108(8):621-626.
- Wachter RM, Goldman L. The hospitalist movement 5 years later. JAMA. 2002;287(4):487-494.
- Coffman J, Rundall TG. The impact of hospitalists on the cost and quality of inpatient care in the United States (a research synthesis). Med Care Res Rev. 2005;62:379–406.
- Dhuper S, Choksi S. Replacing an academic internal medicine residency program with a physician assistant-hospitalist model: a comparative analysis study. Am J Med Qual. 2009;24(2):132-139.
- Roy CL, Liang CL, Lund M, et al. Implementation of a physician assistant/hospitalist service in an academic medical center: impact on efficiency and patient outcomes. J Hosp Med. 2008;3(5):361-368.
- Fulton BR, Drevs KE, Ayala LJ, Malott DL Jr. Patient satisfaction with hospitalists: facility-level analyses. Am J Med Qual. 2011;26(2):95-102.
- Ferranti DE, Makoul G, Forth VE, Rauworth J, Lee J, Williams MV. Assessing patient perceptions of hospitalist communication skills using the Communication Assessment Tool (CAT). J Hosp Med. 2010;5(9):522-527.
At first glance, the deck might seem hopelessly stacked against hospitalists with regard to patient satisfaction. HM practitioners lack the long-term relationship with patients that many primary-care physicians (PCPs) have established. Unlike surgeons and other specialists, they tend to care for those patients—more complicated, lacking a regular doctor, or admitted through the ED, for example—who are more inclined to rate their hospital stay unfavorably.1 They may not even be accurately remembered by patients who encounter multiple doctors during the course of their hospitalization.2 And hospital information systems can misidentify the treating physician, while the actual surveys used to gauge hospitalists have been imperfect at best.3
And yet, the hospitalist model has evolved substantially on the question of how it can impact patient perceptions of care.
Initially, hospitalist champions adopted a largely defensive posture: The model would not negatively impact patient satisfaction as it delivered on efficiency—and later on quality. The healthcare system, however, is beginning to recognize the hospitalist as part of a care “team” whose patient-centered approach might pay big dividends in the inpatient experience and, eventually, on satisfaction scores.
“I think the next phase, which is a focus on the hospitalist as a team member and team builder, is going to be key,” says William Southern, MD, MPH, SFHM, chief of the division of hospital medicine at Montefiore Medical Center in Bronx, N.Y.
Recent studies suggest that hospitalists are helping to design and test new tools that will not only improve satisfaction, but also more fairly assess the impact of individual doctors. As the maturation process continues, experts say, hospitalists have an opportunity to influence both provider-based interventions and more programmatic decision-making that can have far-reaching effects. Certainly, the hand dealt to hospitalists is looking more favorable even as the ante has been raised with Medicare programs like value-based purchasing, and its pot of money tied to patient perceptions of care.
So how have hospitalists played their cards so far?
A Look at the Evidence
In its early years, the HM model faced a persistent criticism: Replacing traditional caregivers with these new inpatient providers in the name of efficiency would increase handoffs and, therefore, discontinuities of care delivered by a succession of unfamiliar faces. If patients didn’t see their PCP in the hospital, the thinking went, they might be more disgruntled at being tended to by hospitalists, leading to lower satisfaction scores.4
A particularly heated exchange played out in 1999 in the New England Journal of Medicine. Farris A. Manian, MD, MPH, of Infectious Disease Consultants in St. Louis wrote in one letter, “I am particularly concerned about what impressionable house-staff members will learn from hospitalists who place an inordinate emphasis on cost rather than the quality of patient care or teaching.”5
A few subsequent studies, however, hinted that such concerns might be overstated. A 2000 analysis in the American Journal of Medicine that examined North Mississippi Health Services in Tupelo, for instance, found that care administered by hospitalists led to a shorter length of stay and lower costs than care delivered by internists. Importantly, the study found that patient satisfaction was similar for both models, while quality metrics were likewise equal or even tilted slightly toward hospitalists.6
In their influential 2002 review of a profession that was only a half-decade old, Robert Wachter, MD, MHM, and Lee Goldman, MD, MPH, FACP from the University of California at San Francisco reinforced the message that HM wouldn’t lead to unhappy patients. “Empirical research supports the premise that hospitalists improve inpatient efficiency without harmful effects on quality or patient satisfaction,” they asserted.7
Among pediatric patients, a 2005 review found that “none of the four studies that evaluated patient satisfaction found statistically significant differences in satisfaction with inpatient care. However, two of the three evaluations that did assess parents’ satisfaction with care provided to their children found that parents were more satisfied with some aspects of care provided by hospitalists.”8
—William Southern, MD, chief, division of hospital medicine, Montefiore Medical Center, Bronx, N.Y.
Similar findings were popping up around the country: Replacing an internal medicine residency program with a physician assistant/hospitalist model at Brooklyn, N.Y.’s Coney Island Hospital did not adversely impact patient satisfaction, while it significantly improved mortality.9 Brigham & Women’s Hospital in Boston likewise reported no change in patient satisfaction in a study comparing a physician assistant/hospitalist service with traditional house staff services.10
The shift toward a more proactive position on patient satisfaction is exemplified within a 2008 white paper, “Hospitalists Meeting the Challenge of Patient Satisfaction,” written by a group of 19 private-practice HM experts known as The Phoenix Group.3 The paper acknowledged the flaws and limitations of existing survey methodologies, including Medicare’s Hospital Consumer Assessment of Healthcare Providers and Systems (HCAHPS) scores. Even so, the authors urged practice groups to adopt a team-oriented approach to communicate to hospital administrations “the belief that hospitalists are in the best position to improve survey scores overall for the facility.”
Carle Foundation Hospital in Urbana, Ill., is now publicly advertising its HM service’s contribution to high patient satisfaction scores on its website, and underscoring the hospitalists’ consistency, accessibility, and communication skills. “The hospital is never without a hospitalist, and our nurses know that they can rely on them,” says Lynn Barnes, vice president of hospital operations. “They’re available, they’re within a few minutes away, and patients’ needs get met very efficiently and rapidly.”
As a result, she says, their presence can lead to higher scores in patients’ perceptions of communication.
Hospitalists also have been central to several safety initiatives at Carle. Napoleon Knight, MD, medical director of hospital medicine and associate vice president for quality, says the HM team has helped address undiagnosed sleep apnea and implement rapid responses, such as “Code Speed.” Caregivers or family members can use the code to immediately call for help if they detect a downturn in a patient’s condition.
The ongoing initiatives, Dr. Knight and Barnes say, are helping the hospital improve how patients and their loved ones perceive care as Carle adapts to a rapidly shifting healthcare landscape. “With all of the changes that seem to be coming from the external environment weekly, we want to work collaboratively to make sure we’re connected and aligned and communicating in an ongoing fashion so we can react to all of these changes,” Dr. Knight says.
Continued below...
A Hopeful Trend
So far, evidence that the HM model is more broadly raising patient satisfaction scores is largely anecdotal. But a few analyses suggest the trend is moving in the right direction. A recent study in the American Journal of Medical Quality, for instance, concludes that facilities with hospitalists might have an advantage in patient satisfaction with nursing and such personal issues as privacy, emotional needs, and response to complaints.11 The study also posits that teaching facilities employing hospitalists could see benefits in overall satisfaction, while large facilities with hospitalists might see gains in satisfaction with admissions, nursing, and tests and treatments.
Brad Fulton, PhD, a researcher at South Bend, Ind.-based healthcare consulting firm Press Ganey and the study’s lead author, says the 30,000-foot view of patient satisfaction at the facility level can get foggy in a hurry due to differences in the kind and size of hospitalist programs. “And despite all of that fog, we’re still able to see through that and find something,” he says.
One limitation is that the study findings could also reflect differences in the culture of facilities that choose to add hospitalists. That caveat means it might not be possible to completely untangle the effect of an HM group on inpatient care from the larger, hospitalwide values that have allowed the group to set up shop. The wrinkle brings its own fascinating questions, according to Fulton. For example, is that kind of culture necessary for hospitalists to function as well as they do?
—Lynn Barnes, vice president of hospital operations, Carle Foundation Hospital, Urbana, Ill.
Such considerations will become more important as the healthcare system places additional emphasis on patient satisfaction, as Medicare’s value-based purchasing program is doing through its HCAHPS scores. With all the changes, success or failure on the patient experience front is going to carry “not just a reputational import, but also a financial impact,” says Ethan Cumbler, MD, FACP, director of Acute Care for the Elderly (ACE) Service at the University of Colorado Denver.
So how can HM fairly and accurately assess its own practitioners? “I think one starts by trying to apply some of the rigor that we have learned from our experience as hospitalists in quality improvement to the more warm and fuzzy field of patient experience,” Dr. Cumbler says. Many hospitals employ surveys supplied by consultants like Press Ganey to track the global patient satisfaction for their institution, he says.
“But for an individual hospitalist or hospitalist group, that kind of tool often lacks both the specificity and the timeliness necessary to make good decisions about impact of interventions on patient satisfaction,” he says.
Mark Williams, MD, FACP, FHM, professor and chief of the division of hospital medicine at Northwestern University’s Feinberg School of Medicine in Chicago, agrees that such imprecision could lead to unfair assessments. “You can imagine a scenario where a patient actually liked their hospitalist very much,” he says, “but when they got the survey, they said [their stay] was terrible and the reasons being because maybe the nurse call button was not answered and the food was terrible and medications were given to them incorrectly, or it was noisy at night so they couldn’t sleep.”
A recent study by Dr. Williams and his colleagues, in which they employed a new assessment method called the Communication Assessment Tool (CAT), confirmed the group’s suspicions: “that the results from the Press Ganey didn’t match up with the CAT, which was a direct assessment of the patient’s perception of the hospitalist’s communication skills,” he says.12
The validated tool, he adds, provides directed feedback to the physician based on the percentage of patients rating that provider as excellent, instead of on the average total score. Hospitalists have felt vindicated by the results. “They were very nervous because the hospital talked about basing an incentive off of the Press Ganey scores, and we said, ‘You can’t do that,’ because we didn’t feel they were accurate, and this study proved that,” Dr. Williams explains.
Fortunately, the message has reached researchers and consultants alike, and better tools are starting to reach hospitals around the country. At HM11 in May, Press Ganey unveiled a new survey designed to help patients assess the care delivered by two hospitalists, the average for inpatient stays. The item set is specific to HM functions, and includes the photo and name of each hospitalist, which Fulton says should improve the validity and accuracy of the data.
“The early response looks really good,” Fulton says, though it’s too early to say whether the tool, called Hospitalist Insight, will live up to its billing. If it proves its mettle, Fulton says, the survey could be used to reward top-performing hospitalists, and the growing dataset could allow hospitals to compare themselves with appropriate peer groups for fairer comparisons.
Meanwhile, researchers are testing out checklists to score hospitalist etiquette, and tracking and paging systems to help ensure continuity of care. They have found increased patient satisfaction when doctors engage in verbal communication during a discharge, in interdisciplinary team rounding, and in efforts to address religious and spiritual concerns.
Since 2000, when Montefiore’s hospitalist program began, Dr. Southern says the hospital has explained to patients the tradeoff accompanying the HM model. “I say something like this to every patient: ‘I know I’m not the doctor that you know, and you’re just meeting me. The downside is that you haven’t met me before and I’m a new face, but the upside is that if you need me during the day, I’m here all the time, I’m not someplace else. And so if you need something, I can be here quickly.’ ”
Being very explicit about that tradeoff, he says, has made patients very comfortable with the model of care, especially during a crisis moment in their lives. “I think it’s really important to say, ‘I know you don’t know me, but here’s the upside.’ And my experience is that patients easily understand that tradeoff and are very positive,” Dr. Southern says.
The Verdict
Available evidence suggests that practitioners of the HM model have pivoted from defending against early criticism that they may harm patient satisfaction to pitching themselves as team leaders who can boost facilitywide perceptions of care. So far, too little research has been conducted to suggest whether that optimism is fully warranted, but early signs look promising.
At facilities like Chicago’s Northwestern Memorial Hospital, medical floors staffed by hospitalists are beginning to beat out surgical floors for the traveling patient satisfaction award. And experts like Dr. Cumbler are pondering how ongoing initiatives to boost scores can follow in the footsteps of efficiency and quality-raising efforts by making the transition from focusing on individual doctors to adopting a more programmatic approach. “What’s happening to that patient during the 23 hours and 45 minutes of their hospital day that you are not sitting by the bedside? And what influence should a hospitalist have in affecting that other 23 hours and 45 minutes?” he says.
Handoffs, discharges, communication with PCPs, and other potential weak points in maintaining high levels of patient satisfaction, Dr. Cumbler says, all are amenable to systems-based improvement. “As hospitalists, we are in a unique position to influence not only our one-one-one interaction with the patient, but also to influence that system of care in a way that patients will notice in a real and tangible way,” he says. “I think we’ve recognized for some time that a healthy heart but a miserable patient is not a healthy person.”
Teaching Hospitals Gain Ground in Patient Satisfaction
One widely accepted truism about teaching facilities is that they’re known to have lower patient satisfaction scores than nonteaching hospitals. Brad Fulton, researcher for South Bend, Ind.-based consultant firm Press Ganey, attributes the difference in part to the fact that many doctors at teaching facilities must divide their time among patient care, education, and research. Such hospitals also tend to have some of the more medically difficult patients, he says, some of who may be more apt to feel like they’re on display with the abundance of students and residents.
In one of his recent studies, however, teaching facilities with hospitalists scored higher on patient satisfaction than nonteaching facilities or teaching facilities that lacked hospitalists. One potential follow-up question could have broad implications: “What is it about having hospitalists in teaching facilities that works so well in terms of patient satisfaction?” Can that be replicated elsewhere, he wonders? And is there an essential element that could be applied to nonteaching facilities?
A separate study also defied expectations by finding that teaching bedside procedures to inexperienced residents can be reassuring to patients, if done correctly. In a teaching model instituted at the University of California San Francisco, an experienced hospitalist with extra training supervises a novice during bedside procedures such as lumbar punctures and paracentesis. Study coauthor Diane Sliwka, MD, associate clinical professor of medicine and a hospitalist, says the feedback so far suggests that the model can improve safety, boost education, and deliver a positive patient experience.
Patients may be hesitant about having trainees do procedures, she says, but surveys suggest those patients are reassured when they know an expert is in the room and watching. They also want to hear what will happen next to counteract the anxiety of feeling pain or encountering something unexpected.
As the study suggested, what patients may find to be the most difficult or nerve-wracking can be quite different from what doctors expect. “You would think it was actually the procedure that was most painful part, but actually that was after we had given lidocaine,” Dr. Sliwka says. Patients repeatedly reacted to the doctors using a plastic pen cap to imprint the site where they would insert a needle. “Over and over we would hear people say, ‘That is actually the most painful part and you didn’t warn me about that,’ ” she recalls. “And we didn’t warn people about that because we didn’t think it was a big deal.”
Procedures can take longer with trainees, another tradeoff that can leading to lower satisfaction scores. But what the study also showed is that in academic settings, involving residents doesn’t harm the overall patient experience and can in fact improve it. “Anecdotally, what we hear from patients a lot is, ‘Oh, I had this procedure done before and it went horribly.’ They would tell stories of previous bad experiences, and then really be thankful for the experience that they had in our setting,” Dr. Sliwka says.
The extended face-to-face time can yield another positive effect. Dr. Sliwka found that hospitalists and residents often learned medical and historical information about the patient that the primary care team hadn’t yet had an opportunity to glean. “Patients just start to tell you about their families, their lives, their medical problems, their experiences,” she says, a product of building more rapport with them. “We would often find ourselves telling the primary medical team, ‘By the way, we found this out and you should probably know it: the patient is very concerned about this that’s been going on,’ and the patient hasn’t had a chance to tell the team because there isn’t that kind of time.”
Even without the specific model, Dr. Sliwka says, several principles can be applied to daily interactions. Framing things appropriately, she says, helps patients gain confidence in the doctors and allows them to safely conduct bedside teaching and openly discuss procedures. Even correcting mistakes can be a positive experience. “That actually makes the patient feel more confident in you than less confident,” Dr. Sliwka says.
Ultimately, the teaching experience can help residents broaden their thinking about patient satisfaction. “I think when trainees are starting, their real focus is, ‘How do I deal with this correctly?’ ” Dr. Sliwka says. “It takes a level of comfort with the basic skills to then go beyond that and start thinking about, ‘How is the patient perceiving this?’”
Bryn Nelson is a freelance medical journalist based in Seattle.
References
- Williams M, Flanders SA, Whitcomb WF. Comprehensive hospital medicine: an evidence based approach. Elsevier;2007:971-976.
- Arora V, Gangireddy S, Mehrotra A, Ginde R, Tormey M, Meltzer D. Ability of hospitalized patients to identify their in-hospital physicians. Arch Intern Med. 2009;169(2):199-201.
- Singer AS, et al. Hospitalists meeting the challenge of patient satisfaction. The Phoenix Group. 2008;1-5.
- Manian FA. Whither continuity of care? N Engl J Med. 1999;340:1362-1363.
- Correspondence. Whither continuity of care? N Engl J Med. 1999;341:850-852.
- Davis KM, Koch KE, Harvey JK, et al. Effects of hospitalists on cost, outcomes, and patient satisfaction in a rural health system. Amer J Med. 2000;108(8):621-626.
- Wachter RM, Goldman L. The hospitalist movement 5 years later. JAMA. 2002;287(4):487-494.
- Coffman J, Rundall TG. The impact of hospitalists on the cost and quality of inpatient care in the United States (a research synthesis). Med Care Res Rev. 2005;62:379–406.
- Dhuper S, Choksi S. Replacing an academic internal medicine residency program with a physician assistant-hospitalist model: a comparative analysis study. Am J Med Qual. 2009;24(2):132-139.
- Roy CL, Liang CL, Lund M, et al. Implementation of a physician assistant/hospitalist service in an academic medical center: impact on efficiency and patient outcomes. J Hosp Med. 2008;3(5):361-368.
- Fulton BR, Drevs KE, Ayala LJ, Malott DL Jr. Patient satisfaction with hospitalists: facility-level analyses. Am J Med Qual. 2011;26(2):95-102.
- Ferranti DE, Makoul G, Forth VE, Rauworth J, Lee J, Williams MV. Assessing patient perceptions of hospitalist communication skills using the Communication Assessment Tool (CAT). J Hosp Med. 2010;5(9):522-527.
Mark Your Calendar
For hospitalists, SHM’s annual meeting is more than an educational conference; it’s an extended family reunion. And with HM12 located in sunny San Diego, the next meeting is a conference, vacation, and family reunion wrapped into one.
Like other family reunions, members of the HM family come to connect with others, catch up on recent experiences, and learn from each other.
“I'm really looking forward to the people,” says HM12 course director Jeff Glasheen, MD, SFHM, associate professor of medicine and director of the hospital medicine group at the University of Colorado Denver. “I attend a lot of CME meetings, and the one thing that sets HM12 apart is the people. It’s a chance for me to reconnect with old friends and make future old friends.”
For hospitalists who are new to SHM or considering going to their first annual meeting, Dr. Glasheen says the experience will be pivotal.
“There simply isn’t a better way to network, learn, and re-energize than coming to the annual meeting,” he says. “I can guarantee first-time attendees will find the annual meeting career-altering. I did, nine years ago, and I hear from new attendees every year that it happens for them as well.”
Registration is open at www.hospitalmedicine2012.org.

—Jeffrey Glasheen, MD, SFHM, HM12 course director
HM12: Off the Beaten Path
In recent years, SHM has presented educational content at the annual meeting in a series of tracks: clinical, academic, pediatric, evidence-based rapid fire, workshops, practice management, and quality. Those tracks help hospitalists identify the courses that will be most pertinent to their careers and daily life.
HM12 introduces a new innovation to the content: pathways. Not all courses fit squarely into the categories presented into the tracks, so pathways give hospitalists the chance to identify the most relevant talks from the different tracks.
To illustrate the pathways concept, Dr. Glasheen uses the example of a hospitalist who is interested in quality improvement (QI). Although there is a quality track, there are quality and safety presentations throughout the conference. The quality pathway will quickly allow the attendee to identify these out of the myriad talks contained in the four-day meeting.”
“Additionally, if you are a nurse practitioner or interested in palliative care, you'll be able to choose the NP or palliative-care pathway to immediately identify the sessions that might be most applicable to you,” he says. “You don't have to go to only those sessions, but the pathways will serve as an easy reference to identify the areas of most interest to you.”
And, in recognition of the broad spectrum of nonclinical topics that hospitalists cover, HM12 will present a “potpourri” track for the first time. This track will help round out the meeting by offering such nonclinical topics as “The History of Hospitals,” “Using Art to Improve Your Clinical Observation Skills,” and “Professionalism in the Digital Age”—topics that will help make the meeting, and hospitalists, more holistic.
Improvements aren’t limited to courses, either. HM12 organizers have split the popular Research, Innovation, and Clinical Vignettes (RIV) poster session into two sessions: one for research and innovations, the other for vignettes. Organizers say this will allow RIV participants more time to review the hundreds of posters presented at the annual meeting.
“We’ve heard the feedback that there just wasn’t enough time to get to the hundreds of posters that were presented at last year’s meeting,” Dr. Glasheen says. “By splitting this into two different sessions, we think this will make the poster sessions that much stronger.”
Networking
SHM’s annual meeting always serves as a forum for enterprising hospitalists to make connections and advance careers. For those hospitalists, HM12 will provide unprecedented time and opportunities to connect with peers and leaders in the specialty.
To many hospitalists, including Dr. Glasheen, the biggest benefit of attending SHM’s annual meeting isn’t the feeling in the conference center—it’s the feeling they take with them.
“Every year, I come away from the meeting reinvigorated and refreshed,” he says. “Much of that comes from the energy I get from spending four days with smart, motivated, and highly engaged hospitalists. It’s the one time every year where I feel firsthand how great it is to be a part of the society—small ‘s’—of hospital medicine.”
That sense of connection is what makes the specialty unique and full of energy, he adds. “These are my colleagues on a national level, this is our field, these people are our present and future, and it’s great to spend some time learning with—and from—all of them.”
Brendon Shank is SHM’s associate vice president of communications.
For hospitalists, SHM’s annual meeting is more than an educational conference; it’s an extended family reunion. And with HM12 located in sunny San Diego, the next meeting is a conference, vacation, and family reunion wrapped into one.
Like other family reunions, members of the HM family come to connect with others, catch up on recent experiences, and learn from each other.
“I'm really looking forward to the people,” says HM12 course director Jeff Glasheen, MD, SFHM, associate professor of medicine and director of the hospital medicine group at the University of Colorado Denver. “I attend a lot of CME meetings, and the one thing that sets HM12 apart is the people. It’s a chance for me to reconnect with old friends and make future old friends.”
For hospitalists who are new to SHM or considering going to their first annual meeting, Dr. Glasheen says the experience will be pivotal.
“There simply isn’t a better way to network, learn, and re-energize than coming to the annual meeting,” he says. “I can guarantee first-time attendees will find the annual meeting career-altering. I did, nine years ago, and I hear from new attendees every year that it happens for them as well.”
Registration is open at www.hospitalmedicine2012.org.
—Jeffrey Glasheen, MD, SFHM, HM12 course director
HM12: Off the Beaten Path
In recent years, SHM has presented educational content at the annual meeting in a series of tracks: clinical, academic, pediatric, evidence-based rapid fire, workshops, practice management, and quality. Those tracks help hospitalists identify the courses that will be most pertinent to their careers and daily life.
HM12 introduces a new innovation to the content: pathways. Not all courses fit squarely into the categories presented into the tracks, so pathways give hospitalists the chance to identify the most relevant talks from the different tracks.
To illustrate the pathways concept, Dr. Glasheen uses the example of a hospitalist who is interested in quality improvement (QI). Although there is a quality track, there are quality and safety presentations throughout the conference. The quality pathway will quickly allow the attendee to identify these out of the myriad talks contained in the four-day meeting.”
“Additionally, if you are a nurse practitioner or interested in palliative care, you'll be able to choose the NP or palliative-care pathway to immediately identify the sessions that might be most applicable to you,” he says. “You don't have to go to only those sessions, but the pathways will serve as an easy reference to identify the areas of most interest to you.”
And, in recognition of the broad spectrum of nonclinical topics that hospitalists cover, HM12 will present a “potpourri” track for the first time. This track will help round out the meeting by offering such nonclinical topics as “The History of Hospitals,” “Using Art to Improve Your Clinical Observation Skills,” and “Professionalism in the Digital Age”—topics that will help make the meeting, and hospitalists, more holistic.
Improvements aren’t limited to courses, either. HM12 organizers have split the popular Research, Innovation, and Clinical Vignettes (RIV) poster session into two sessions: one for research and innovations, the other for vignettes. Organizers say this will allow RIV participants more time to review the hundreds of posters presented at the annual meeting.
“We’ve heard the feedback that there just wasn’t enough time to get to the hundreds of posters that were presented at last year’s meeting,” Dr. Glasheen says. “By splitting this into two different sessions, we think this will make the poster sessions that much stronger.”
Networking
SHM’s annual meeting always serves as a forum for enterprising hospitalists to make connections and advance careers. For those hospitalists, HM12 will provide unprecedented time and opportunities to connect with peers and leaders in the specialty.
To many hospitalists, including Dr. Glasheen, the biggest benefit of attending SHM’s annual meeting isn’t the feeling in the conference center—it’s the feeling they take with them.
“Every year, I come away from the meeting reinvigorated and refreshed,” he says. “Much of that comes from the energy I get from spending four days with smart, motivated, and highly engaged hospitalists. It’s the one time every year where I feel firsthand how great it is to be a part of the society—small ‘s’—of hospital medicine.”
That sense of connection is what makes the specialty unique and full of energy, he adds. “These are my colleagues on a national level, this is our field, these people are our present and future, and it’s great to spend some time learning with—and from—all of them.”
Brendon Shank is SHM’s associate vice president of communications.
Survey Insights
Those of you who are familiar with Medical Group Management Association’s reports know that MGMA uses medical group “ownership” categories that are similar to, but slightly different from, the employment model categories historically utilized by SHM. This year, we added the question: “Is your practice part of a multistate hospitalist group or management company?” to the SHM-MGMA Hospital Medicine Supplement. This question enables us to crosswalk from MGMA’s ownership categories to SHM’s traditional employment categories:
- Employed by a hospital or integrated delivery system;
- Employed by a multistate hospitalist group or management company;
- Employed by an independent multispecialty or primary-care medical group;
- Employed by an independent hospitalist-only group;
- Employed by an academic entity; and
- Employed by other.
The blue columns in the chart below show median annual direct compensation (light blue) and retirement benefits (dark blue) for all adult hospitalists by employment model, including the data for academic internal medicine hospitalists from the separate SHM-MGMA academic survey conducted in the fall of 2010.1 The median ratio of compensation to work RVUs for each employment type is represented by red squares.
Academic hospitalists report the lowest compensation but the highest compensation per unit of clinical work, even when production data is standardized to 100% billable clinical time.
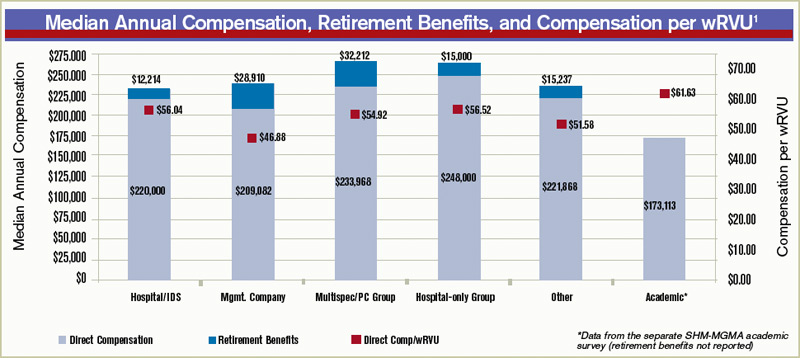
“For most academic hospitalists, teaching and supervising residents is an integral part of our clinical work; this probably impedes our clinical efficiency relative to non-academicians,” explains Grace Huang, MD, a member of SHM’s Practice Analysis Committee (PAC). “On weekends, when only half the residents are present and I don’t spend as much time teaching, I can see two to three times more patients.”
Independent hospitalist-only groups saw both the highest direct compensation and the highest compensation per unit of work, while hospitalists employed by multistate groups and management companies had the second-lowest overall direct compensation and the lowest compensation per wRVU.
When including the value of employer retirement plan contributions, however, hospitalists employed by management companies received a combined total remuneration that was higher than for hospitalists employed by hospitals or “other” employers.
“If I’m a hospitalist working for a multistate group, I want to know I’m getting something good that I might not get working for a hospital,” says PAC member Troy Ahlstrom, MD, SFHM. “A better retirement contribution is an obvious example; a hospital can’t afford to give a high-powered retirement plan to all 5,000-plus employees, while a physician company with all ‘highly compensated’ employees can. It’s a perk of working for an independent company.”
Multispecialty/primary-care medical groups and independent hospitalist-only groups provided the highest direct compensation and total remuneration (including retirement contributions). “Keep in mind, though, that they have different responsibilities that come with the money,” Dr. Ahlstrom says. “Hospitalists in local groups have more management responsibilities and more ownership risk, so they should make more for the extra work of running a business. Hospitalists in multispecialty groups have the benefit of an investment in their salaries by their colleagues, but they also have to answer directly to their colleagues for the privilege.”
Leslie Flores, SHM senior advisor, practice management
Reference

Academic Hospitalists Gear Up for Learning
The challenges of academic HM are different from other sectors of the specialty. Academic hospitalists, division chiefs, and administrators at academic teaching hospitals contend with the pressure of receiving grants, presenting at grand rounds, and reserving time for research and educational projects.
While it can be overwhelming, especially for academic hospitalists early in their careers, the Academic Hospitalist Academy helps untangle those challenges and turn them into long-term professional opportunities. Hosted jointly by SHM, the Society of General Internal Medicine (SGIM), and the Association of Chiefs and Leaders of General Internal Medicine (ACLGIM), the academy is a three-day course dedicated to education, scholarship, and professional success for academic hospitalists.
In addition to helping them become better hospitalists, Academic Hospitalist Academy uses didactic sessions, small-group exercises, and other interactive techniques to help academic hospitalists become better teachers, create and publish scholarly work, and get first in line for promotions.
Now in its third year, Academic Hospitalist Academy is consistently met with rave reviews from attendees. According to evaluations from the 2010 academy, attendees unanimously felt the course was worth their time and money; 99% said they would recommend it to a colleague.
Those of you who are familiar with Medical Group Management Association’s reports know that MGMA uses medical group “ownership” categories that are similar to, but slightly different from, the employment model categories historically utilized by SHM. This year, we added the question: “Is your practice part of a multistate hospitalist group or management company?” to the SHM-MGMA Hospital Medicine Supplement. This question enables us to crosswalk from MGMA’s ownership categories to SHM’s traditional employment categories:
- Employed by a hospital or integrated delivery system;
- Employed by a multistate hospitalist group or management company;
- Employed by an independent multispecialty or primary-care medical group;
- Employed by an independent hospitalist-only group;
- Employed by an academic entity; and
- Employed by other.
The blue columns in the chart below show median annual direct compensation (light blue) and retirement benefits (dark blue) for all adult hospitalists by employment model, including the data for academic internal medicine hospitalists from the separate SHM-MGMA academic survey conducted in the fall of 2010.1 The median ratio of compensation to work RVUs for each employment type is represented by red squares.
Academic hospitalists report the lowest compensation but the highest compensation per unit of clinical work, even when production data is standardized to 100% billable clinical time.
“For most academic hospitalists, teaching and supervising residents is an integral part of our clinical work; this probably impedes our clinical efficiency relative to non-academicians,” explains Grace Huang, MD, a member of SHM’s Practice Analysis Committee (PAC). “On weekends, when only half the residents are present and I don’t spend as much time teaching, I can see two to three times more patients.”
Independent hospitalist-only groups saw both the highest direct compensation and the highest compensation per unit of work, while hospitalists employed by multistate groups and management companies had the second-lowest overall direct compensation and the lowest compensation per wRVU.
When including the value of employer retirement plan contributions, however, hospitalists employed by management companies received a combined total remuneration that was higher than for hospitalists employed by hospitals or “other” employers.
“If I’m a hospitalist working for a multistate group, I want to know I’m getting something good that I might not get working for a hospital,” says PAC member Troy Ahlstrom, MD, SFHM. “A better retirement contribution is an obvious example; a hospital can’t afford to give a high-powered retirement plan to all 5,000-plus employees, while a physician company with all ‘highly compensated’ employees can. It’s a perk of working for an independent company.”
Multispecialty/primary-care medical groups and independent hospitalist-only groups provided the highest direct compensation and total remuneration (including retirement contributions). “Keep in mind, though, that they have different responsibilities that come with the money,” Dr. Ahlstrom says. “Hospitalists in local groups have more management responsibilities and more ownership risk, so they should make more for the extra work of running a business. Hospitalists in multispecialty groups have the benefit of an investment in their salaries by their colleagues, but they also have to answer directly to their colleagues for the privilege.”
Leslie Flores, SHM senior advisor, practice management
Reference
Academic Hospitalists Gear Up for Learning
The challenges of academic HM are different from other sectors of the specialty. Academic hospitalists, division chiefs, and administrators at academic teaching hospitals contend with the pressure of receiving grants, presenting at grand rounds, and reserving time for research and educational projects.
While it can be overwhelming, especially for academic hospitalists early in their careers, the Academic Hospitalist Academy helps untangle those challenges and turn them into long-term professional opportunities. Hosted jointly by SHM, the Society of General Internal Medicine (SGIM), and the Association of Chiefs and Leaders of General Internal Medicine (ACLGIM), the academy is a three-day course dedicated to education, scholarship, and professional success for academic hospitalists.
In addition to helping them become better hospitalists, Academic Hospitalist Academy uses didactic sessions, small-group exercises, and other interactive techniques to help academic hospitalists become better teachers, create and publish scholarly work, and get first in line for promotions.
Now in its third year, Academic Hospitalist Academy is consistently met with rave reviews from attendees. According to evaluations from the 2010 academy, attendees unanimously felt the course was worth their time and money; 99% said they would recommend it to a colleague.
Policy Corner

The 2010 Affordable Care Act (ACA) mandates a hospital value-based purchasing (VBP) program to begin this time next year. But hospitalists should start preparing now to be integral parts of the program in their hospitals.
Though the ACA provision states the VBP program for hospital payments will begin with discharges on Oct. 1, 2012, performance on clinical quality and patient experience measures began impacting hospitals’ bottom lines on July 1, 2011. The VBP’s “baseline period” actually lasted from July 1, 2009, through March 31, 2010. The performance period started July 1 and will last through March 31, 2012.
On Aug. 2, 2012, CMS will notify hospitals of estimated performance scores, delivering the actual performance scores on Nov. 1, 2012. The result: Payments for any discharge on or after Oct. 1, 2012 (the beginning of fiscal-year 2013), will be paid based on the performance period currently under way.
Hospitalists and program leaders might wonder how an ACA provision could start before the ACA was passed. The HVBP program actually is a transition of the well-established “Reporting Hospital Quality Data for Annual Payment Update,” or pay-for-reporting program, which in 2003 initially provided a 0.4% payment differential for public reporting through the Hospital Compare website. The 2005 Deficit Reduction Act increased the payment to 2%, and authorized CMS to develop a HVBP plan for FY2009—it just didn’t materialize.
The ACA created the HVBP program with the intention of transforming Medicare from a passive payor to an active purchaser of higher-quality, more efficient healthcare. In essence, Medicare wants to pay for performance rather than simply accurate reporting.
So hospitalists once again are faced with partnering with their hospitals to ensure payout. Reducing a hospital’s base operating Medicare Severity Diagnosis Related Groups (MS-DRG) by the applicable percentage, which will be phased in through 2017 (starting at 1% in 2013 and increasing 0.25% each year), will generate the HVBP’s source of ongoing incentive payments.
To help, SHM this month launched the “Hospital Value-Based Purchasing Toolkit.” It will help hospitalists and hospital executives gain a better understanding of what all the information above really means (including performance measures), and what to expect when your performance scores arrive.
The toolkit is different from any other product SHM has ever produced, as subscribers will be added to their own social collaboration network, similar to a tool like LinkedIn, putting them in touch with our panel of experts and other subscribers across the nation. We also will be putting on a series of roundtables: short presentations from a subject or quality-measure expert, followed by an opportunity to ask questions of our HVBP panel. All of the information will be based on best practices pulled from case studies we have spent the last 12 months scouring the country for. Most important, the best practices will be hospitalist-relevant. The free portal to the toolkit, which includes detailed background information on each piece of the program, can be accessed at www.hospitalmedicine.org/hvbp.
A subscription to the full toolkit can be purchased through the SHM store.
In the Literature: HM-Related Research You Need to Know
In This Edition
Literature At A Glance
A guide to this month’s studies
- PCI Not Inferior to CABG in Left Main Coronary Artery Stenosis at One Year, But Requires Further Study
- CABG Did Not Decrease Mortality in Patients with CAD and Left Ventricular Dysfunction
- Linezolid Not Superior to Glycopeptide Antibiotics in Treatment of Nosocomial Pneumonia
- CRP and Procalcitonin Independently Differentiated Pneumonia from Asthma or COPD Exacerbation
- Survival Benefit Demonstrated with FOLFIRINOX in Select Patients with Metastatic Pancreatic Cancer
- MRSA Bundle Implementation at VA Hospitals Reduced Healthcare-Associated MRSA Infections
- New Left Bundle Branch Block Does Not Predict MI
- Acute Beta-Blocker Therapy for MI Increased Risk of Shock
PCI Not Inferior to CABG in Left Main Coronary Artery Stenosis at One Year, But Requires Further Study
Clinical question: Is percutaneous coronary intervention (PCI) an acceptable alternative to coronary artery bypass grafting (CABG) in unprotected left main coronary artery disease (CAD)?
Background: The current standard of care for unprotected left main CAD is CABG. A sub-study from a large randomized trial suggests that PCI might be an alternative to CABG for patients with left main CAD. Outcomes after the two treatments have not been directly compared in an appropriately powered trial.
Study design: Prospective, open-label, randomized trial powered for noninferiority.
Setting: Thirteen sites in South Korea.
Synopsis: Six hundred patients with newly diagnosed left main disease with >50% stenosis were randomized to PCI with a sirolimus-eluting stent versus CABG. The primary endpoint of major adverse cardiac or cerebrovascular events occurred in 8.7% in the PCI group and 6.7% in the CABG group at one year (absolute risk difference 2 percentage points, 95% CI, -1.6 to 5.6; P=0.01), which was considered noninferior.
However, ischemia-driven target-vessel revascularization occurred in significantly more patients in the PCI group than in the CABG group. The wide noninferiority margin was due to an unexpectedly low rate of events, thus underpowering the study. Also, study duration was only two years.
Bottom line: PCI with a sirolimus-eluting stent was noninferior to CABG for unprotected left main CAD in this study, but the wide noninferiority margin and limited follow-up duration limit clinical application.
Reference: Park SJ, Kim YH, Park DW, et al. Randomized trial of stents versus bypass surgery for left main coronary artery disease. N Engl J Med. 2011;364(18):1718-1727.
CABG Did Not Decrease Mortality in Patients with CAD and Left Ventricular Dysfunction
Clinical question: What role does coronary-artery bypass grafting (CABG) have in the treatment of patients with both coronary artery disease (CAD) and heart failure?
Background: Although CAD is the most common cause of heart failure, early trials that evaluated the use of CABG in relieving angina excluded patients who had left ventricular (LV) dysfunction with ejection fraction <35%. It is unknown whether CABG adds mortality benefit to intensive medical treatment in patients with CAD and LV dysfunction.
Study design: Multicenter, nonblinded, randomized trial.
Setting: One hundred twenty-seven sites in 26 countries.
Synopsis: From July 2002 to May 2007, 1,212 patients with known CAD amenable to CABG and LV ejection fraction <35% were randomized to medical therapy alone versus CABG plus medical therapy with an average follow-up of five years. The primary outcome of death from any cause occurred in 41% of the medical-therapy-alone group and 36% of the CABG-plus-medical-therapy group (hazard ratio with CABG 0.86; 95% CI 0.72 to 1.04; P=0.12).
Despite subgroup analysis suggesting decreased death rates from cardiovascular causes in the latter group, there was no significant difference in the primary endpoint of death from any cause.
Bottom line: The addition of CABG to medical therapy for patients with CAD and left ventricular dysfunction does not decrease mortality.
Reference: Velazquez EJ, Lee KL, Deja MA, et al. Coronary-artery bypass surgery in patients with left ventricular dysfunction. N Engl J Med. 2011;364(17):1607-1616.
Linezolid Not Superior to Glycopeptide Antibiotics in Treatment of Nosocomial Pneumonia
Clinical question: Is linezolid superior to glycopeptide antibiotics in the treatment of nosocomial pneumonia?
Background: Current ATS/IDSA guidelines suggest that linezolid might be preferred over glycopeptide antibiotics (i.e. vancomycin and teicoplanin) for methicillin-resistant Staphylococcus aureus (MRSA) pneumonia, although this recommendation is based on a retrospective subgroup analysis of one randomized trial. No systematic reviews have looked at the comparative efficacy and safety of linezolid and glycopeptide antibiotics for nosocomial pneumonia.
Study design: Meta-analysis using a highly sensitive search method.
Setting: Eight multicenter, randomized controlled trials (RCTs).
Synopsis: The study authors retrieved 762 articles with a highly sensitive search strategy, from which eight RCTs were identified that met study criteria for a total of 1,641 patients. Primary outcome of clinical success at test-of-cure was not different between the two classes of antibiotics (pooled RR 1.04, 95% CI 0.97-1.11, P=0.28). Other endpoints, including mortality and microbiologic eradication, were similar between the two groups.
Clinical success in the subgroup of patients with culture-confirmed MRSA pneumonia was not different than those without culture-proven MRSA, although the study was not powered for subgroup analysis. Risk of thrombocytopenia and renal impairment were not statistically different in the limited subgroup of trials reporting this data.
The results should not be generalized to community-acquired MRSA or MRSA pneumonia with characteristics of PVL toxin-producing strain.
Bottom line: For the treatment of nosocomial pneumonia, there was no significant difference in clinical success or mortality between linezolid and glycopeptide antibiotics.
Citation: Walkey AJ, O’Donnell MR, Weiner RS. Linezolid vs. glycopeptide antibiotics for the treatment of suspected methicillin-resistant Staphylococcus aureus nosocomial pneumonia. Chest. 2011;139: 1148-1155.
CRP and Procalcitonin Independently Differentiated Pneumonia from Asthma or COPD Exacerbation
Clinical question: Are biomarkers such as CRP or procalcitonin useful in differentiating pneumonia from asthma or COPD exacerbation in hospitalized patients?
Background: Antibiotic overuse is associated with the emergence of drug resistance. One potential strategy to decrease antibiotic overuse is biomarker-guided therapy. Several randomized controlled trials (RCT) with procalcitonin-guided therapy have resulted in reduced antibiotic use for symptoms of acute respiratory tract infections (RTI). The use of CRP as a biomarker in acute RTI is not as well-described.
Study design: Prospective, observational, diagnostic accuracy study.
Setting: Winter months, 2006 to 2008, in two hospitals in England.
Synopsis: The study examined 319 patients: 62 with pneumonia, 96 with asthma exacerbation, and 161 with COPD exacerbation. Patients with pneumonia had significantly higher procalcitonin and CRP levels than those with COPD (P<0.0001) or asthma (P<0.0001). The area under receiver operator characteristic curve for distinguishing between pneumonia (requiring antibiotics) and asthma exacerbation (not requiring antibiotics) was 0.93 (0.88-0.98) for procalcitonin and 0.96 (0.93-1.00) for CRP. A CRP value >48 mg/L had a sensitivity of 91% (95% CI 80%-97%) and specificity of 93% (95% CI 86-98).
Using this CRP threshold, antibiotic use would have been reduced by 88% in asthma exacerbation, 76% in COPD exacerbation, and 9% in pneumonia cases.
This strategy was developed in a single-center study and requires further validation in a multicenter RCT.
Bottom line: Procalcitonin and CRP were elevated in patients with pneumonia compared to patients with asthma or COPD exacerbation and might be useful in guiding antibiotic usage.
Citation: Bafadhel, M, Clark TW, Reid, C, et al. Procalcitonin and C-reactive protein in hospitalized adult patients with community-acquired pneumonia or exacerbation of asthma or COPD. Chest. 2011;139:1410-1418.
Survival Benefit Demonstrated with FOLFIRINOX in Select Patients with Metastatic Pancreatic Cancer
Clinical question: How does FOLFIRINOX compare to gemcitabine as first-line treatment of metastatic pancreatic cancer?
Background: Single-agent gemcitabine is the standard first-line treatment for metastatic pancreatic cancer. Preclinical studies followed by Phase 1 and Phase 2 studies have demonstrated response to the oxaliplatin, irinotecan, leucovorin, and fluorouracil regimen (FOLFIRINOX).
Study design: Multicenter, randomized, controlled Phase 2-3 trial.
Setting: Fifteen centers in France during Phase 2, which then expanded to 48 centers for Phase 3.
Synopsis: Three hundred forty-two patients with good performance status (ECOG 0 or 1) and age <76 were randomized to receive FOLFIRINOX or gemcitabine. Median survival in the FOLFIRINOX group was significantly increased, at 11.1 months, compared with 6.8 months in the gemcitabine group (HR 0.57, CI 95%, 0.45-0.73, P<000.1).
Median progression-free survival, objective response rate, and quality of life score at six months were significantly increased in the FOLFIRINOX group. Significantly more grade 3 or grade 4 toxicity was reported in the FOLFIRINOX group.
Patients with elevated bilirubin were excluded due to increased risk of irinotecan-induced toxicity, resulting in only 38% of study patients with carcinoma of the pancreatic head and low proportion of enrolled patients (14.3%) with biliary stents.
Bottom line: FOLFIRONOX was associated with a significant survival advantage compared with single-agent gemcitabine in carefully selected patients with advanced pancreatic cancer, although it was associated with increased toxicity.
Citation: Conroy T, Desseigne F, Ychou M, et al. FOLFIRINOX versus gemcitabine for metastatic pancreatic cancer. N Engl J Med. 2011;364(19):1817-1825.
MRSA Bundle Implementation at VA Hospitals Reduced Healthcare-Associated MRSA Infections
Clinical question: Can nationwide implementation of a “MRSA bundle,” including universal surveillance, contact isolation, hand hygiene, and institutional culture change, influence healthcare-associated MRSA infection rates?
Background: MRSA is a common cause of nosocomial infection. A pilot project at a single Veterans Affairs (VA) hospital utilized a “MRSA bundle” developed from published guidelines, which resulted in decreased healthcare-associated MRSA infections. In October 2007, the MRSA bundle was implemented throughout VA hospitals nationwide.
Study design: Quality-improvement (QI) observational initiative.
Setting: One hundred fifty-eight acute-care VA hospitals in the U.S.
Synopsis: From October 2007 to June 2010, there were 1,934,598 admissions, transfers, or discharges, and 8,318,675 patient-days. Of this study group, 96% of patients were screened at admission and 93% were screened at transfer or discharge. MRSA colonization or infection at the time of admission was 13.6%. Rates of healthcare-associated MRSA infection declined 45% in the non-ICU setting (0.47 to 0.26 per 1,000 patient-days, P<0.001) and 62% in the ICU setting (1.64 to 0.62 per 1,000 patient days, P<0.001).
It is unclear how much each individual component of the MRSA bundle impacted the declining MRSA infection rate.
Bottom line: Implementation of a “MRSA bundle,” including universal surveillance, contact isolation, hand hygiene, and institutional culture change, decreased the healthcare-associated MRSA infection rate in a large hospital system.
Citation: Jain R, Kralovi S, Evans M, et al. Veterans Affairs initiative to prevent methicillin-resistant Staphylococcus aureus infections. N Engl J Med. 2011;364(15):1419-1430.
New Left Bundle Branch Block Does Not Predict MI
Clinical question: How does the chronicity of left bundle branch block (LBBB) impact diagnosis and outcome in patients undergoing evaluation for acute myocardial infarction (MI)?
Background: ACA/AHA guidelines recommend that patients with new or presumed new LBBB undergo early reperfusion therapy. However, previous studies have shown that a minority of patients with new LBBB are diagnosed with MI.
Study design: Prospective cohort study.
Setting: University hospital in the U.S.
Synopsis: From 1994 to 2009, 401 consecutive patients undergoing evaluation for acute coronary syndrome with LBBB on initial ECG were included in the analysis. Of these patients, 64% had new (37%) or presumably new (27%) LBBB. Twenty-nine percent were diagnosed with MI, but there was no difference in frequency or size of MI between the new, presumably new, or chronic LBBB groups.
Concordant ST-T changes were an independent predictor of MI (OR 17, 95% CI 3.4-81, P<0.001) and mortality (OR 4.3, 95% CI 1.3-15, P<0.001), although this finding was present in only about 11% of the patient group.
Bottom line: Left bundle branch block is not a predictor of MI, although concordant ST-T changes were an independent predictor of MI and mortality.
Citation: Kontos MC, Aziz HA, Chau VQ, et al. Outcomes in patients with chronicity of left bundle-branch block with possible acute myocardial infarction. Am Heart J. 2011;161(4):698-704.
Acute Beta-Blocker Therapy for MI Increased Risk of Shock
Clinical question: How does acute beta-blocker therapy in myocardial infarction (MI) impact outcome?
Background: Long-term treatment with beta-blockers after myocardial infarction (MI) reduces mortality. However, data regarding outcome after acute use of beta-blockers in the first 24 hours of MI is conflicting. Updated ACA/AHA guidelines for STEMI and NSTEMI recommend caution when using beta-blockers in the first 24 hours, particularly in patients at risk for shock.
Study design: Observational registry study.
Setting: Two hundred ninety-one U.S hospitals.
Synopsis: More than 34,600 patients diagnosed with STEMI and NSTEMI from January 2007 to June 2008 were identified from a national QI MI registry. Patients were stratified by guideline-stated risk factors for shock; age >70, HR >110, and systolic BP <120 were associated with increased risk of composite outcome of shock or death.
At least one high-risk factor was present in 63% of the NSTEMI patients and 45% of STEMI patients; however, >90% of these patients received acute beta-blocker therapy. Nearly half (49%) of the NSTEMI patients received beta-blockers in the ED and 62% of the STEMI patients received beta-blockers before PCI.
In a multivariable model, NSTEMI patients receiving beta-blocker therapy in the ED were more likely to develop cardiogenic shock (OR 1.54, 95% CI 1.26-1.88, P<.001), as were STEMI patients receiving beta-blocker therapy prior to PCI (1.40, 95% CI 1.10-1.79, P=.006).
Bottom line: Caution should be exercised when using beta-blocker therapy during acute MI, particularly in the ED or prior to primary PCI.
Citation: Kontos MC, Diercks DB, Ho MP, Wang TY, Chen AY, Roe MT. Treatment and outcomes in patients with myocardial infarction treated with acute beta-blocker therapy: results from the American College of Cardiology’s NCDR. Am Heart J. 2011;161(5):864-870.