User login
FDA Approves Deferiprone for Transfusional Iron Overload
Deferiprone is approved as a second-line treatment for transfusional iron overload when the condition has not been resolved by chelation therapy in patients with thalassemia, the Food and Drug Administration announced Oct. 14.
The new agent will be marketed as Ferriprox by ApoPharma. The FDA said the Toronto-based company has agreed to several postmarketing requirements and commitments, including further study in patients who have transfusional iron overload after treatment for sickle cell disease.
The FDA’s Oncologic Drugs Advisory Committee recently voted 10-2 that treatment with deferiprone had a favorable benefit-risk profile for treatment of patients with transfusional iron overload when current chelation therapy is inadequate.
As the decision date approached, however, the consumer advocacy group Public Citizen announced that it had sent the FDA a letter opposing approval. Public Citizen contended that APO Pharma had failed to demonstrate the drug is safe and effective in its intended population. The group noted that the FDA had refused to approve deferiprone in 2009 without an additional prospective, randomized, controlled study, but that no such study had been conducted.
"Ferriprox represents the first new FDA-approved treatment for this disorder since 2005."
The FDA announcement said its decision on safety and effectiveness was based on 12 clinical studies in which participating patients had not responded to prior iron chelation therapy.
"Ferriprox was considered a successful treatment for patients who experienced at least a 20% decrease in serum ferritin, a protein that stores iron in the body for later use. Half of the patients in the study experienced at least a 20% decrease in ferritin levels," the agency said.
Thalassemia is a genetic blood disorder that causes anemia. It is treated with frequent blood transfusions, but these can lead to excess iron in the body, a serious, potentially fatal condition. Chelation therapy, a process in which chemical agents remove heavy metals from the body, is the standard of care for transfusional iron overload.
"Ferriprox represents the first new FDA-approved treatment for this disorder since 2005," Dr. Richard Pazdur, director of the Office of Hematology and Oncology Products in the FDA’s Center for Drug Evaluation and Research, said in the FDA announcement.
Deferoxamine (Desferal), an iron chelator administered via a subcutaneous infusion pump (usually 6 nights a week), was approved in 1968, and deferasirox (Exjade), an oral chelator, in 2005. The new agent was approved in Europe in 1999, but had not been able to secure a U.S. go-ahead until the current "accelerated approval."
Ferriprox’s most common side effects have included nausea, vomiting, abdominal and joint pain, chromaturia, neutropenia, and "an increase in the level of a liver enzyme that may be indicative of tissue or liver damage at unsafe amounts," according to the FDA.
The agency said the most serious side effect was the development of agranulocytosis in about 2% of patients treated with Ferriprox.
Reconceptualizing Family
Bob is in the kitchen, settling down his family to preparing a celebration dinner with produce from the communal garden. He is a tall, wiry man with a gray beard and kind gentle eyes. His current family includes his wife, who is a therapist in a nearby town; a tall, blonde Scandinavian man who is spending time "finding himself"; a young, eager couple who tend the garden and teach the intricacies of organic farming; and a reclusive artist who works with metals and found objects.
Bob bought the dilapidated commune buildings several years ago, after retiring from his fast-paced, stressful life as an internist in California. He has meticulously restored the adobe buildings using the expertise of traditional builders. There are different types of adobe throughout the compound, sparkling mica walls in the bedrooms, and deep, rich brown in the large circular communal living room. Bob conceptualizes this historic setting as a retreat for meditation and a place to teach organic farming to the next generation. As I observed during my visit a few months ago, Bob is the elder and wise man of this communal family who gently quiets the demons in the spider-phobic Scandinavian.
This is a "family" in the best sense: a group of people who share a spiritual belief in their connection to the land, the goodness of the human spirit, and the importance of connection between people. Like the hippies before them who established New Buffalo in Arroyo Hondo, N.M., the residents reject many Western values, at least for a few years, and try out this alternative way of living. The community’s website says it is no longer a commune but that members are "connected by a common sense of ideals and a strong sense of place."
Communes have always existed in the United States. Native Americans live communally but are not recognized as communes. The largest recognized U.S. communal living group is the Hutterite community. About 42,000 people live in rural Hutterite communities across the United States. They are derived from the Anabaptists, a Christian sect dating back to 16th century Austria, which also spawned Amish and Mennonite communities.
Whatever type of family our patients live in, be it a religious sect, a down-to-earth commune, or a traditional family, to run well, that family needs to be organized, to communicate well and to have good boundaries (Fam. Process 2003;42:1-18).
Why is this important to psychiatry? Good family functioning is associated with good outcomes for patients with all kinds of illnesses from medical to psychiatric (Families, Health, and Behavior: A Section of the Commissioned Report by the Committee on Health and Behavior, Institute of Medicine [Families, Systems & Health 2002;20:7-46]). In addition, "a growing body of research finds that healthy family processes ... matter more than family form for effective functioning...," writes Froma Walsh, Ph.D., (Normal Family Process [N.Y.: Guilford Press, 2003]). To cope well with illness, families need to be able to problem solve, communicate, and stay connected. However, good family functioning looks different in different cultures, from the highly organized rigid religious sects to the looser counterculture New Buffalo community. So how do we describe families and their functioning?
One easy approach is to look at the Global Assessment of Relational Functioning, or the GARF Scale, found in Appendix B of the DSM IV-TR (Washington: American Psychiatric Association, 2000). It has three subscales: problem solving, organization, and emotional climate. The choices for rating families range from 1-20 "Relational unit has become too dysfunctional to retain continuity of contact and attachment," to the 81-100 range in which the "relational unit is functioning satisfactorily from self-report of participants and from the perspective of observers." This scale is easy to learn and use. Also, the scale is independent of culture and can be used for any group of people who call themselves a family. So yes, after observing the New Buffalo community for a few days, I would rank it a solid 88.
Ambulatory Encounters for Hematology/Oncology Unchanged Since 2007
Hematologist/oncologists in group practice had a median of 2,719 ambulatory encounters in 2010, up just 0.3% since 2007, according to a survey by the Medical Group Management Association.
Hematologist/oncologists in hospital-owned practices averaged 2,362 ambulatory encounters in 2010, compared with 2,864 for those who were not in hospital-owned practices, the MGMA reported. Male hematologist/oncologists had a median of 2,864 ambulatory encounters, while the median for females was 2,240. Geographically speaking, those in the western United States had the highest number of ambulatory encounters, 3,027, while those in East, with 2,295 encounters, had the lowest.
The MGMA considered an ambulatory encounter to be "documented, face-to-face contact between a patient and a provider" that did not take place in an inpatient hospital and did not involve a surgical procedure.
The 2010 edition of the annual survey, conducted among MGMA members and nonmembers, includes data from 2,846 group practices representing 59,375 physician and nonphysician providers. The MGMA presents survey highlights in its In Practice blog.
Methylnaltrexone for Acute OIC
The management of postoperative pain is essential to perioperative care, and adequate postoperative analgesia has been associated with several key clinical benefits, including fewer postoperative complications, earlier patient ambulation, reduced costs due to shorter hospital stays, and improved rehabilitation.1, 2 While opioids have long been central to postoperative analgesia, they have been associated with various adverse effects, including sedation, dizziness, nausea, vomiting, constipation, dependence, tolerance, and respiratory depression.2, 3 Constipation, one of the most common adverse effects resulting from opioid therapy, can be debilitating. Indeed, opioid effects on gut motility can occur even after a single dose.3 The consequences of opioid‐induced constipation (OIC) may be severe enough to warrant a dosage reduction of the opioid; however, this may lead to compromised analgesia, which can hinder recovery.4, 5 Thus, effective treatment of OIC is an important clinical consideration in patients undergoing pain management with opioids. Unfortunately, laxatives and other treatment strategies can have unpredictable or suboptimal results for many patients with OIC; therefore, other options are needed for the treatment of OIC.6, 7
Opioid receptor agonists cause constipation by adversely altering many aspects of intestinal function, including fluid dynamics, gastric emptying, propulsive motor activity, and transit time.3 Opioid receptors are widely distributed in the central nervous system and throughout the intestinal system. The mechanism of OIC may have both peripherally and centrally mediated components.8 Nonselective opioid receptor antagonists block the undesired effects on the gut, but because they cross the blood‐brain barrier, they also interfere with analgesia and may lead to symptoms of withdrawal. Methylnaltrexone is a selective, peripherally acting mu‐opioid receptor antagonist,9 formed by the addition of a methyl group to the amine ring of the mu‐opioid receptor antagonist naltrexone. The resulting quarternary amine has greater polarity, lower lipid solubility, and restricted ability to cross the blood‐brain barrier.10 Thus, methylnaltrexone was designed to decrease the peripheral adverse effects of opioids without interfering with centrally mediated analgesia.
Investigations of methylnaltrexone effects in healthy volunteers showed that methylnaltrexone attenuated morphine‐induced delays in gastric emptying and oral‐cecal transit without affecting analgesia.1113 Further studies of methylnaltrexone for the treatment of constipation due to methadone use demonstrated rapid laxation response.1416 Two randomized, double‐blind, placebo‐controlled studies of methylnaltrexone in 288 patients with advanced illness and OIC showed that methylnaltrexone rapidly induced laxation without compromising analgesia.17, 18 Methylnaltrexone is currently approved for the treatment of OIC in patients with advanced illness who are receiving palliative care, when response to laxative therapy has not been sufficient.19
Recently, the use of methylnaltrexone for the treatment of OIC in patients with chronic, nonmalignant pain was assessed in a randomized, double‐blind, placebo‐controlled trial of more than 400 patients. Investigators found that methylnaltrexone induced laxation and was generally well tolerated (Blonsky et al., 28th Annual Scientific Meeting of the American Pain Society, May 7‐9, 2009, San Diego, CA; Duerden et al., 29th Annual Scientific Meeting of the American Pain Society, May 6‐10, 2010, Baltimore, MD), supporting the safety and efficacy of methylnaltrexone in the setting of OIC resulting from chronic opioid treatment. The present study aimed to assess the activity of methylnaltrexone in patients receiving mu‐agonist opioid analgesics during rehabilitation, following an orthopedic surgical procedure, who were experiencing acute OIC.
METHODS
Patients
Patients who had undergone orthopedic procedures within 4 to 10 days were screened for eligibility. Adults aged 18 years or older were considered eligible if they were acutely constipated, were receiving mu‐agonist opioid analgesics, and were expected to require daily opioid analgesics for at least 7 days following randomization. Acute constipation was defined as having no bowel movement for at least 48 hours prior to randomization, difficulty in having a spontaneous bowel movement (straining or sensation of incomplete evacuation or hard, lumpy stools), or the inability to have a spontaneous bowel movement. Exclusion criteria included fecal impaction, mechanical bowel obstruction, constipation not attributed to postprocedure opioid use, calculated creatinine clearance less than 50 mL/min, and corrected QT interval greater than 500 msec on a 12‐lead screening electrocardiogram (ECG). Patients with a known hypersensitivity to methylnaltrexone, naltrexone, or naloxone, who were pregnant or lactating, who had a history of alcohol or drug abuse within the past 2 years, or who had a spinal cord injury or gastrointestinal ostomy were also excluded. Any laxatives, enemas, and/or promotility agents being used must have been discontinued at least 48 hours prior to first dose of study medication and were not permitted during the study, but stool softener use was permitted if it had been administered at least 24 hours prior to screening and a stable dose was maintained throughout the study.
Study Design
This randomized, double‐blind, placebo‐controlled, parallel‐group, hypothesis‐generating phase 2 study was conducted from October 2007 to January 2009 at 16 US hospitals and rehabilitation facilities in accordance with the International Conference on Harmonisation Good Clinical Practice Guidelines and the Declaration of Helsinki, and was approved by the Institutional Review Board and/or Independent Ethics Committee at each of the participating investigational centers. All patients provided written informed consent prior to study participation.
Eligible patients were randomized by interactive voice response system in a 1:1 ratio to receive once‐daily subcutaneous (SC) injections of either 12 mg methylnaltrexone or placebo (Figure 1). The chosen 12‐mg unit dosing corresponds to approximately 0.15 mg/kg (assuming an 80‐kg patient) and was found to be both efficacious and well tolerated in the treatment of OIC in prior studies, including studies in advanced‐illness patients17, 18 and in patients with chronic, nonmalignant pain (Blonsky et al., 28th Annual Scientific Meeting of the American Pain Society, May 7‐9, 2009, San Diego, CA; Duerden et al., 29th Annual Scientific Meeting of the American Pain Society, May 6‐10, 2010, Baltimore, MD.20 The first dose of study medication was administered on the day of randomization or on the next calendar day. Once enrolled, the patient received once‐daily doses of methylnaltrexone for up to 4 or 7 days. Dosing continued until the patient received the maximum number of doses allowed, no longer needed opioid medication, or was discharged from the medical facility. Each patient completed a follow‐up safety visit at 14 3 days following the last dose.
Evaluations
All efficacy variables were considered exploratory and included the occurrence of laxation within 2 and 4 hours of the first dose of study drug, time to laxation, and a questionnaire assessing patient global satisfaction. Patients recorded the date, time, and assessment of each bowel movement in diaries.
Safety variables included adverse events (AEs), serious AEs (SAEs), clinical laboratory parameters, physical examinations, vital signs, ECGs, concomitant medications, Objective and Subjective Opioid Withdrawal Scales (OOWS and SOWS),21 and Numeric Rating Scales for Pain ([NRSP] 0 = no pain, 10 = worst pain possible).
Statistical Analysis
Enrolled patients were defined as all patients who consented to participate in the study. Both the modified intent‐to‐treat (mITT) population and the safety population were defined as all patients who were randomized and received at least 1 injection of study drug. All study results are based on the mITT population.
Categorical variables were summarized using frequency and percentage, while descriptive statistics for continuous variables included sample size, mean, median, standard deviation, and minimum and maximum values. All inferential statistical tests were 2‐tailed and used a tolerance for nominal type I error (alpha, ) of 0.05. There was no correction for multiplicity and no imputations were performed to account for missing data.
Fisher's exact test was used for comparisons between the proportion of patients with laxation within 2 hours and 4 hours of the first dose in the methylnaltrexone group versus the placebo group. The time to first laxation analysis was performed using the log‐rank test and Kaplan‐Meier method.
RESULTS
Patient Populations
The flow of patients through the study is summarized in Figure 2. A total of 51 patients were enrolled. Of these, 33 received at least 1 dose of study treatment following double‐blind randomization and comprised both the mITT and safety populations. Seventeen of these patients were enrolled under the original protocol and could receive study drug for up to 7 days, while 16 patients enrolled under a subsequent protocol revision could receive study drug for up to 4 days. This change from a 7‐day to a 4‐day treatment protocol allowed for the capture of more study patients in view of the time pressures of short lengths of stay in postoperative settings. In total, 31 patients received at least 2 doses, and 26 patients received at least 4 doses of study drug. A total of 27 patients completed the study. Baseline demographics and prestudy surgical procedures were similar in both treatment groups (Table 1).
| Characteristic | Methylnaltrexone (n = 18) | Placebo (n = 15) |
|---|---|---|
| ||
| Mean age, yr (SD) | 64.2 (9.0) | 65.2 (11.6) |
| Mean weight, kg (SD) | 92.5 (22.5) | 91.0 (20.2) |
| Mean BMI, kg/m2 (SD) | 32.3 (7.2) | 34.2 (6.41) |
| Sex, n (%) | ||
| Female | 11 (61.1) | 11 (73.3) |
| Male | 7 (38.9) | 4 (26.7) |
| Race, n (%) | ||
| White | 14 (77.8) | 10 (66.7) |
| Black | 4 (22.2) | 5 (33.3) |
| Type of surgery, n (%) | ||
| Total knee replacement | 8 (44.4) | 7 (46.7) |
| Total hip replacement | 6 (33.3) | 6 (40.0) |
| Spinal fusion | 2 (11.1) | 0 |
| Fracture reduction | 2 (11.1) | 2 (13.3) |
| Median opioid use,* mg (range) | 28.00 (6.75‐168.01) | 25.00 (9.00‐75.00) |
| Median time from surgery to study drug administration, days (range) | 4 (3‐6) | 4 (3‐6) |
Efficacy
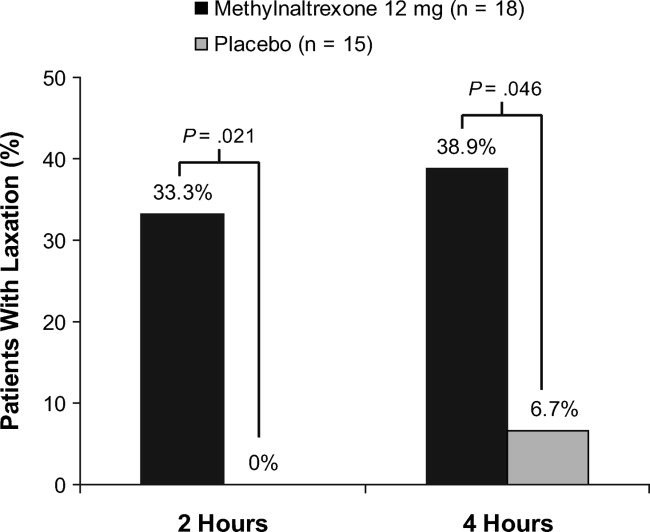
A significantly greater percentage of patients had a bowel movement within 2 hours (P = 0.021) and 4 hours (P = 0.046) of the first dose of methylnaltrexone compared with patients who received placebo (Figure 3). Within 2 hours, 6 patients (33.3%; 95% confidence interval [CI], 13.34‐59.01) who received methylnaltrexone achieved laxation, while laxation did not occur in any patient who received placebo. By 4 hours posttreatment, 7 patients (38.9%; 95% CI, 17.30‐64.25) in the methylnaltrexone group achieved laxation compared with only 1 patient (6.7%; 95% CI, 0.17‐31.95) on placebo. Three patients in each treatment group received rescue laxatives.
The time to first laxation (Figure 4) was significantly shorter in patients who received methylnaltrexone compared with those in the placebo group. Patients on methylnaltrexone achieved laxation in a median time of 15.8 hours, compared with a median time of 50.9 hours for patients in the placebo group (P = 0.02, log‐rank test). The median time to laxation was less than 1 hour in the 7 methylnaltrexone‐treated patients who experienced laxation within 4 hours following the first dose. Of the remaining 11 methylnaltrexone‐treated patients, one experienced no laxation after 6 doses, and the median time to laxation for the others was 29.9 hours (not shown in figure).
Analysis of the Global Satisfaction With Treatment Scale revealed that more patients expressed overall treatment satisfaction (defined as very satisfied, satisfied, or minimally satisfied) with methylnaltrexone assessed 4 hours ( 30 minutes) after the first dose, compared with patients on placebo (83.3% vs 60.0%, respectively). At the study endpoint, overall treatment satisfaction with methylnaltrexone remained high (83.3%), whereas satisfaction with placebo was 53.3%. Additionally, no patients in the methylnaltrexone group expressed any dissatisfaction with treatment (defined as minimally dissatisfied, dissatisfied, or very dissatisfied) at endpoint, compared with 26.7% of patients in the placebo group who expressed some degree of dissatisfaction.
Safety
Overall AE rates were similar between treatment groups (Table 2), with at least 1 treatment‐emergent AE reported in 6 patients (33.3%) in the methylnaltrexone group and 4 patients (26.7%) in the placebo group. The most common AEs reported during the study were classified as gastrointestinal in nature; 3 (nausea, abdominal pain, and diarrhea) were considered by the investigator to be possibly related to study medication. Two patients receiving methylnaltrexone discontinued the study because of AEs (one with moderate constipation, one with mild diarrhea) compared with none of the placebo group patients. No treatment‐emergent SAEs or deaths were reported during this study. Analysis of clinical laboratory parameters, vital signs, and ECGs revealed no safety signals and showed no pattern of concern related to methylnaltrexone exposure.
| Adverse Event* | Methylnaltrexone 12 mg (n = 18) n (%) | Placebo (n = 15) n (%) |
|---|---|---|
| ||
| Any | 6 (33.3) | 4 (26.7) |
| Anemia | 1 (5.6) | 0 |
| Gastrointestinal disorders | 3 (16.7) | 1 (6.7) |
| Abdominal discomfort | 0 | 1 (6.7) |
| Abdominal distension | 1 (5.6) | 0 |
| Abdominal pain | 1 (5.6) | 0 |
| Abdominal tenderness | 1 (5.6) | 0 |
| Constipation | 1 (5.6) | 0 |
| Diarrhea | 1 (5.6) | 0 |
| Nausea | 1 (5.6) | 0 |
| Headache | 1 (5.6) | 0 |
| Hypotension | 1 (5.6) | 0 |
| Joint swelling | 0 | 1 (6.7) |
| Peripheral edema | 0 | 2 (13.3) |
| Procedural pain | 0 | 1 (6.7) |
| Skin ulcer | 0 | 1 (6.7) |
| Somnolence | 0 | 1 (6.7) |
| Urinary tract infection | 1 (5.6) | 0 |
| Wound infection | 1 (5.6) | 0 |
Pain and Opioid Withdrawal
Results from the SOWS and OOWS measures indicated that signs and symptoms of withdrawal did not increase over time in patients treated with methylnaltrexone, and no discernable differences were found between study groups. Pain was assessed using a numeric rating scale ranging from 0 to 10, with higher scores indicating greater severity. Baseline pain scores were not significantly different between treatment groups, with a mean of 5.7 2.7 for placebo, and 5.4 3.0 for the methylnaltrexone group. At 1 day postdose, mean pain scores did not increase from baseline in the placebo (0.9 2.33) or methylnaltrexone group (0.5 2.5), and no significant between‐group differences were found. Similar results were observed at the end of the study. Thus, pain did not appear to increase in patients treated with methylnaltrexone, and changes in pain scores were indistinguishable between the 2 treatment groups.
DISCUSSION
This pilot study suggests that methylnaltrexone actively induces laxation and is generally well tolerated in patients receiving mu‐opioid analgesia, following orthopedic surgery, who develop OIC acutely. It was the first study, to our knowledge, to investigate the efficacy of methylnaltrexone for the treatment of OIC in an acute postoperative setting. The protocol amendment changing the duration of treatment from 7 days to 4 days did not materially affect the results of the study. The response to methylnaltrexone was rapid, with 33.3% experiencing laxation within 2 hours. The median time to laxation was nearly 1.5 days shorter in patients treated with methylnaltrexone compared with those receiving placebo. Correspondingly, overall patient satisfaction was high in the methylnaltrexone group. Efficacy was attained without diminishing opioid analgesia, and without inducing signs or symptoms of opioid withdrawal. The incidence of AEs was similar between groups, and no treatment‐emergent SAEs were reported in this study.
Previous clinical trials investigated the safety and efficacy of methylnaltrexone for the treatment of OIC in patients with advanced illness and with chronic, nonmalignant pain. The present study extends those findings to a population of patients experiencing acute OIC following orthopedic surgery. Previous studies showed that approximately 48% to 62% of advanced‐illness patients experienced laxation within 4 hours of receiving SC methylnaltrexone,17, 18 compared with 38.9% of acute OIC patients in this study. In a clinical trial of patients with chronic, nonmalignant pain, 34.2% of patients experienced laxation within 4 hours of SC methylnaltrexone injection (Blonsky et al., 28th Annual Scientific Meeting of the American Pain Society, May 7‐9, 2009, San Diego, CA). The differences in laxation response between these trials may be attributable to differences in the patient populations or to methodologic differences between the studies.
Similar to findings demonstrated in a clinical study evaluating methylnaltrexone for OIC in a different patient population, those with advanced illness,22 this study supports the premise that future laxation response with prolonged use is most likely to occur when a laxation response was achieved after the first or second initial administrations of methylnaltrexone. In contradistinction, if laxation does not occur with these early doses, continued methylnaltrexone dosing is less likely to produce a response later.
This study has some limitations that must be considered. First, as this was a hypothesis‐generating study, all efficacy parameters investigated were exploratory in nature. The results reported herein warrant careful consideration, owing to a small sample size that may limit their generalizability, prior to replication in a more rigorously designed study with prespecified efficacy endpoints. Likewise, the assessment of health outcome parameters is limited. Another limitation is the small sample size utilized in this study, potentially resulting in a type II error.
Subcutaneous administration potentially offers a considerable benefit over oral therapies for OIC in this patient population post‐orthopedic surgery. Nausea and vomiting can occur as a consequence of anesthesia and of postoperative opioid analgesia, and may compromise adequate dosing of oral medications prescribed to treat OIC. Subcutaneous delivery of methylnaltrexone may circumvent this potential drawback while providing potentially rapid, effective treatment for OIC. Once‐daily dosing may also help to minimize caregiver burden and patient discomfort by preventing the need for more frequent or unpleasant treatments for OIC, such as enemas.
This study provides an initial positive signal for a broader, albeit off‐label use for methylnaltrexonethat being for the treatment of acute constipation that occurs as a consequence of postoperative opioid‐mediated analgesia in patients following orthopedic procedures. Adequate treatment of OIC, even in the acute postoperative setting, is likely to lead to better overall pain management and improved patient outcomes. Additionally, effective management of acute OIC is likely to be cost‐effective in terms of reducing the duration of hospital stays, reducing the need for nursing resources and the time spent administering rescue treatments for OIC (eg, enemas), and avoiding returns to an acute setting (eg, the emergency department) for treatment. The results presented herein suggest that methylnaltrexone may be effective and have a good safety profile in the treatment of acute OIC following orthopedic surgery. Validation of these results in larger well‐controlled trials would be welcome.
Acknowledgements
The authors thank the patients and clinical personnel involved in this study; John Charity, NP, for data collection and management, and John H. Simmons, MD, of Peloton Advantage, LLC, for assistance with manuscript preparation, which was funded by Pfizer Inc.
In addition to the authors, the following investigators participated in this trial: David Nathan Feldman, MD, Holy Name Hospital, Teaneck, NJ; Sam Hakki, MD, Bay Pines VA Healthcare System, Bay Pines, FL; Forrest A. Hanke, MD, Trover Health System, Madisonville, KY; William H. Horton, Jr, MD, Palmetto Clinical Research, Greenville, SC; M. Jay Jazayeri, MD, Pacific Hospital of Long Beach, Long Beach, CA; John F. Peppin, DO, The Pain Treatment Center of the Bluegrass, Lexington, KY; Bruce Pomeranz, MD, Kessler Institute for Rehabilitation, Saddle Brook, NJ, and Chester, NJ; Alan C. Schwartz, MD, Helping Hands Medical Associates, Santa Ana, CA; Michael J. Skyhar, MD, CORE Orthopaedic Medical Center, Encinitas, CA; Lex A. Simpson, MD, CORE Orthopaedic Medical Center, Encinitas, CA; James Slover, MD, New York University Hospital for Joint Disease, New York, NY; Dilip Tapadiya, MD, Fountain Valley Regional Hospital, Fountain Valley, CA; Stanley J. Waters, MD, PhD, Americana Orthopedics, Boise, ID.
- ,.Postoperative pain management.Chest Surg Clin N Am.1997;7:773–799.
- ,.Strategies for effective postoperative pain management.Minerva Anestesiol.2006;72:145–150.
- ,,.Are peripheral opioid antagonists the solution to opioid side effects?Anesth Analg.2004;98:116–122.
- ,.Neuroplasticity—an important factor in acute and chronic pain.Swiss Med Wkly.2002;132:273–278.
- ,,,,.The burden of acute postoperative pain and the potential role of the COX‐2‐specific inhibitors.Rheumatology (Oxford).2003;42(suppl 3):iii40–iii52.
- .Incidence, prevalence, and management of opioid bowel dysfunction.Am J Surg.2001;182(suppl 5A):11S–18S.
- ,.Management of common opioid‐induced adverse effects.Am Fam Physician.2006;74:1347–1354.
- ,.Antagonism of gastrointestinal opioid effects.Reg Anesth Pain Med.2000;25:639–642.
- .Methylnaltrexone mechanisms of action and effects on opioid bowel dysfunction and other opioid adverse effects.Ann Pharmacother.2007;41:984–993.
- ,.Methylnaltrexone: investigation of clinical applications.Drug Dev Res.2000;50:133–141.
- ,,,.Opioid‐induced delay in gastric emptying: a peripheral mechanism in humans.Anesthesiology.1997;87:765–770.
- ,,, et al.Effects of enteric‐coated methylnaltrexone in preventing opioid‐induced delay in oral‐cecal transit time.Clin Pharmacol Ther.2000;67:398–404.
- ,,,,,.Methylnaltrexone prevents morphine‐induced delay in oral‐cecal transit time without affecting analgesia: a double‐blind randomized placebo‐controlled trial.Clin Pharmacol Ther.1996;59:469–475.
- ,,,,,.Effects of intravenous methylnaltrexone on opioid‐induced gut motility and transit time changes in subjects receiving chronic methadone therapy: a pilot study.Pain.1999;83:631–635.
- ,,, et al.Methylnaltrexone for reversal of constipation due to chronic methadone use: a randomized controlled trial.JAMA.2000;283:367–372.
- ,.Oral methylnaltrexone for opioid‐induced constipation.JAMA.2000;284:1383–1384.
- ,,, et al.Methylnaltrexone for opioid‐induced constipation in advanced illness.N Engl J Med.2008;328:2332–2343.
- ,,, et al.Methylnaltrexone for treatment of opioid‐induced constipation in advanced illness patients.J Support Oncol.2009;7:39–46.
- Relistor [package insert].Philadelphia, PA, and Tarrytown, NY:Wyeth Pharmaceuticals Inc and Progenics Pharmaceuticals;2009.
- ,,, et al.Subcutaneous methylnaltrexone for treatment of opioid‐induced constipation in patients with chronic, nonmalignant pain: a randomized controlled study.J Pain.2011;12:554–562.
- ,,,,,.Two new rating scales for opiate withdrawal.Am J Drug Alcohol Abuse.1987;13:293–308.
- ,,, et al.Methylnaltrexone treatment of opioid‐induced constipation in patients with advanced illness.J Pain Symptom Manage.2009;38:683–690.
The management of postoperative pain is essential to perioperative care, and adequate postoperative analgesia has been associated with several key clinical benefits, including fewer postoperative complications, earlier patient ambulation, reduced costs due to shorter hospital stays, and improved rehabilitation.1, 2 While opioids have long been central to postoperative analgesia, they have been associated with various adverse effects, including sedation, dizziness, nausea, vomiting, constipation, dependence, tolerance, and respiratory depression.2, 3 Constipation, one of the most common adverse effects resulting from opioid therapy, can be debilitating. Indeed, opioid effects on gut motility can occur even after a single dose.3 The consequences of opioid‐induced constipation (OIC) may be severe enough to warrant a dosage reduction of the opioid; however, this may lead to compromised analgesia, which can hinder recovery.4, 5 Thus, effective treatment of OIC is an important clinical consideration in patients undergoing pain management with opioids. Unfortunately, laxatives and other treatment strategies can have unpredictable or suboptimal results for many patients with OIC; therefore, other options are needed for the treatment of OIC.6, 7
Opioid receptor agonists cause constipation by adversely altering many aspects of intestinal function, including fluid dynamics, gastric emptying, propulsive motor activity, and transit time.3 Opioid receptors are widely distributed in the central nervous system and throughout the intestinal system. The mechanism of OIC may have both peripherally and centrally mediated components.8 Nonselective opioid receptor antagonists block the undesired effects on the gut, but because they cross the blood‐brain barrier, they also interfere with analgesia and may lead to symptoms of withdrawal. Methylnaltrexone is a selective, peripherally acting mu‐opioid receptor antagonist,9 formed by the addition of a methyl group to the amine ring of the mu‐opioid receptor antagonist naltrexone. The resulting quarternary amine has greater polarity, lower lipid solubility, and restricted ability to cross the blood‐brain barrier.10 Thus, methylnaltrexone was designed to decrease the peripheral adverse effects of opioids without interfering with centrally mediated analgesia.
Investigations of methylnaltrexone effects in healthy volunteers showed that methylnaltrexone attenuated morphine‐induced delays in gastric emptying and oral‐cecal transit without affecting analgesia.1113 Further studies of methylnaltrexone for the treatment of constipation due to methadone use demonstrated rapid laxation response.1416 Two randomized, double‐blind, placebo‐controlled studies of methylnaltrexone in 288 patients with advanced illness and OIC showed that methylnaltrexone rapidly induced laxation without compromising analgesia.17, 18 Methylnaltrexone is currently approved for the treatment of OIC in patients with advanced illness who are receiving palliative care, when response to laxative therapy has not been sufficient.19
Recently, the use of methylnaltrexone for the treatment of OIC in patients with chronic, nonmalignant pain was assessed in a randomized, double‐blind, placebo‐controlled trial of more than 400 patients. Investigators found that methylnaltrexone induced laxation and was generally well tolerated (Blonsky et al., 28th Annual Scientific Meeting of the American Pain Society, May 7‐9, 2009, San Diego, CA; Duerden et al., 29th Annual Scientific Meeting of the American Pain Society, May 6‐10, 2010, Baltimore, MD), supporting the safety and efficacy of methylnaltrexone in the setting of OIC resulting from chronic opioid treatment. The present study aimed to assess the activity of methylnaltrexone in patients receiving mu‐agonist opioid analgesics during rehabilitation, following an orthopedic surgical procedure, who were experiencing acute OIC.
METHODS
Patients
Patients who had undergone orthopedic procedures within 4 to 10 days were screened for eligibility. Adults aged 18 years or older were considered eligible if they were acutely constipated, were receiving mu‐agonist opioid analgesics, and were expected to require daily opioid analgesics for at least 7 days following randomization. Acute constipation was defined as having no bowel movement for at least 48 hours prior to randomization, difficulty in having a spontaneous bowel movement (straining or sensation of incomplete evacuation or hard, lumpy stools), or the inability to have a spontaneous bowel movement. Exclusion criteria included fecal impaction, mechanical bowel obstruction, constipation not attributed to postprocedure opioid use, calculated creatinine clearance less than 50 mL/min, and corrected QT interval greater than 500 msec on a 12‐lead screening electrocardiogram (ECG). Patients with a known hypersensitivity to methylnaltrexone, naltrexone, or naloxone, who were pregnant or lactating, who had a history of alcohol or drug abuse within the past 2 years, or who had a spinal cord injury or gastrointestinal ostomy were also excluded. Any laxatives, enemas, and/or promotility agents being used must have been discontinued at least 48 hours prior to first dose of study medication and were not permitted during the study, but stool softener use was permitted if it had been administered at least 24 hours prior to screening and a stable dose was maintained throughout the study.
Study Design
This randomized, double‐blind, placebo‐controlled, parallel‐group, hypothesis‐generating phase 2 study was conducted from October 2007 to January 2009 at 16 US hospitals and rehabilitation facilities in accordance with the International Conference on Harmonisation Good Clinical Practice Guidelines and the Declaration of Helsinki, and was approved by the Institutional Review Board and/or Independent Ethics Committee at each of the participating investigational centers. All patients provided written informed consent prior to study participation.
Eligible patients were randomized by interactive voice response system in a 1:1 ratio to receive once‐daily subcutaneous (SC) injections of either 12 mg methylnaltrexone or placebo (Figure 1). The chosen 12‐mg unit dosing corresponds to approximately 0.15 mg/kg (assuming an 80‐kg patient) and was found to be both efficacious and well tolerated in the treatment of OIC in prior studies, including studies in advanced‐illness patients17, 18 and in patients with chronic, nonmalignant pain (Blonsky et al., 28th Annual Scientific Meeting of the American Pain Society, May 7‐9, 2009, San Diego, CA; Duerden et al., 29th Annual Scientific Meeting of the American Pain Society, May 6‐10, 2010, Baltimore, MD.20 The first dose of study medication was administered on the day of randomization or on the next calendar day. Once enrolled, the patient received once‐daily doses of methylnaltrexone for up to 4 or 7 days. Dosing continued until the patient received the maximum number of doses allowed, no longer needed opioid medication, or was discharged from the medical facility. Each patient completed a follow‐up safety visit at 14 3 days following the last dose.
Evaluations
All efficacy variables were considered exploratory and included the occurrence of laxation within 2 and 4 hours of the first dose of study drug, time to laxation, and a questionnaire assessing patient global satisfaction. Patients recorded the date, time, and assessment of each bowel movement in diaries.
Safety variables included adverse events (AEs), serious AEs (SAEs), clinical laboratory parameters, physical examinations, vital signs, ECGs, concomitant medications, Objective and Subjective Opioid Withdrawal Scales (OOWS and SOWS),21 and Numeric Rating Scales for Pain ([NRSP] 0 = no pain, 10 = worst pain possible).
Statistical Analysis
Enrolled patients were defined as all patients who consented to participate in the study. Both the modified intent‐to‐treat (mITT) population and the safety population were defined as all patients who were randomized and received at least 1 injection of study drug. All study results are based on the mITT population.
Categorical variables were summarized using frequency and percentage, while descriptive statistics for continuous variables included sample size, mean, median, standard deviation, and minimum and maximum values. All inferential statistical tests were 2‐tailed and used a tolerance for nominal type I error (alpha, ) of 0.05. There was no correction for multiplicity and no imputations were performed to account for missing data.
Fisher's exact test was used for comparisons between the proportion of patients with laxation within 2 hours and 4 hours of the first dose in the methylnaltrexone group versus the placebo group. The time to first laxation analysis was performed using the log‐rank test and Kaplan‐Meier method.
RESULTS
Patient Populations
The flow of patients through the study is summarized in Figure 2. A total of 51 patients were enrolled. Of these, 33 received at least 1 dose of study treatment following double‐blind randomization and comprised both the mITT and safety populations. Seventeen of these patients were enrolled under the original protocol and could receive study drug for up to 7 days, while 16 patients enrolled under a subsequent protocol revision could receive study drug for up to 4 days. This change from a 7‐day to a 4‐day treatment protocol allowed for the capture of more study patients in view of the time pressures of short lengths of stay in postoperative settings. In total, 31 patients received at least 2 doses, and 26 patients received at least 4 doses of study drug. A total of 27 patients completed the study. Baseline demographics and prestudy surgical procedures were similar in both treatment groups (Table 1).
| Characteristic | Methylnaltrexone (n = 18) | Placebo (n = 15) |
|---|---|---|
| ||
| Mean age, yr (SD) | 64.2 (9.0) | 65.2 (11.6) |
| Mean weight, kg (SD) | 92.5 (22.5) | 91.0 (20.2) |
| Mean BMI, kg/m2 (SD) | 32.3 (7.2) | 34.2 (6.41) |
| Sex, n (%) | ||
| Female | 11 (61.1) | 11 (73.3) |
| Male | 7 (38.9) | 4 (26.7) |
| Race, n (%) | ||
| White | 14 (77.8) | 10 (66.7) |
| Black | 4 (22.2) | 5 (33.3) |
| Type of surgery, n (%) | ||
| Total knee replacement | 8 (44.4) | 7 (46.7) |
| Total hip replacement | 6 (33.3) | 6 (40.0) |
| Spinal fusion | 2 (11.1) | 0 |
| Fracture reduction | 2 (11.1) | 2 (13.3) |
| Median opioid use,* mg (range) | 28.00 (6.75‐168.01) | 25.00 (9.00‐75.00) |
| Median time from surgery to study drug administration, days (range) | 4 (3‐6) | 4 (3‐6) |
Efficacy
A significantly greater percentage of patients had a bowel movement within 2 hours (P = 0.021) and 4 hours (P = 0.046) of the first dose of methylnaltrexone compared with patients who received placebo (Figure 3). Within 2 hours, 6 patients (33.3%; 95% confidence interval [CI], 13.34‐59.01) who received methylnaltrexone achieved laxation, while laxation did not occur in any patient who received placebo. By 4 hours posttreatment, 7 patients (38.9%; 95% CI, 17.30‐64.25) in the methylnaltrexone group achieved laxation compared with only 1 patient (6.7%; 95% CI, 0.17‐31.95) on placebo. Three patients in each treatment group received rescue laxatives.
The time to first laxation (Figure 4) was significantly shorter in patients who received methylnaltrexone compared with those in the placebo group. Patients on methylnaltrexone achieved laxation in a median time of 15.8 hours, compared with a median time of 50.9 hours for patients in the placebo group (P = 0.02, log‐rank test). The median time to laxation was less than 1 hour in the 7 methylnaltrexone‐treated patients who experienced laxation within 4 hours following the first dose. Of the remaining 11 methylnaltrexone‐treated patients, one experienced no laxation after 6 doses, and the median time to laxation for the others was 29.9 hours (not shown in figure).
Analysis of the Global Satisfaction With Treatment Scale revealed that more patients expressed overall treatment satisfaction (defined as very satisfied, satisfied, or minimally satisfied) with methylnaltrexone assessed 4 hours ( 30 minutes) after the first dose, compared with patients on placebo (83.3% vs 60.0%, respectively). At the study endpoint, overall treatment satisfaction with methylnaltrexone remained high (83.3%), whereas satisfaction with placebo was 53.3%. Additionally, no patients in the methylnaltrexone group expressed any dissatisfaction with treatment (defined as minimally dissatisfied, dissatisfied, or very dissatisfied) at endpoint, compared with 26.7% of patients in the placebo group who expressed some degree of dissatisfaction.
Safety
Overall AE rates were similar between treatment groups (Table 2), with at least 1 treatment‐emergent AE reported in 6 patients (33.3%) in the methylnaltrexone group and 4 patients (26.7%) in the placebo group. The most common AEs reported during the study were classified as gastrointestinal in nature; 3 (nausea, abdominal pain, and diarrhea) were considered by the investigator to be possibly related to study medication. Two patients receiving methylnaltrexone discontinued the study because of AEs (one with moderate constipation, one with mild diarrhea) compared with none of the placebo group patients. No treatment‐emergent SAEs or deaths were reported during this study. Analysis of clinical laboratory parameters, vital signs, and ECGs revealed no safety signals and showed no pattern of concern related to methylnaltrexone exposure.
| Adverse Event* | Methylnaltrexone 12 mg (n = 18) n (%) | Placebo (n = 15) n (%) |
|---|---|---|
| ||
| Any | 6 (33.3) | 4 (26.7) |
| Anemia | 1 (5.6) | 0 |
| Gastrointestinal disorders | 3 (16.7) | 1 (6.7) |
| Abdominal discomfort | 0 | 1 (6.7) |
| Abdominal distension | 1 (5.6) | 0 |
| Abdominal pain | 1 (5.6) | 0 |
| Abdominal tenderness | 1 (5.6) | 0 |
| Constipation | 1 (5.6) | 0 |
| Diarrhea | 1 (5.6) | 0 |
| Nausea | 1 (5.6) | 0 |
| Headache | 1 (5.6) | 0 |
| Hypotension | 1 (5.6) | 0 |
| Joint swelling | 0 | 1 (6.7) |
| Peripheral edema | 0 | 2 (13.3) |
| Procedural pain | 0 | 1 (6.7) |
| Skin ulcer | 0 | 1 (6.7) |
| Somnolence | 0 | 1 (6.7) |
| Urinary tract infection | 1 (5.6) | 0 |
| Wound infection | 1 (5.6) | 0 |
Pain and Opioid Withdrawal
Results from the SOWS and OOWS measures indicated that signs and symptoms of withdrawal did not increase over time in patients treated with methylnaltrexone, and no discernable differences were found between study groups. Pain was assessed using a numeric rating scale ranging from 0 to 10, with higher scores indicating greater severity. Baseline pain scores were not significantly different between treatment groups, with a mean of 5.7 2.7 for placebo, and 5.4 3.0 for the methylnaltrexone group. At 1 day postdose, mean pain scores did not increase from baseline in the placebo (0.9 2.33) or methylnaltrexone group (0.5 2.5), and no significant between‐group differences were found. Similar results were observed at the end of the study. Thus, pain did not appear to increase in patients treated with methylnaltrexone, and changes in pain scores were indistinguishable between the 2 treatment groups.
DISCUSSION
This pilot study suggests that methylnaltrexone actively induces laxation and is generally well tolerated in patients receiving mu‐opioid analgesia, following orthopedic surgery, who develop OIC acutely. It was the first study, to our knowledge, to investigate the efficacy of methylnaltrexone for the treatment of OIC in an acute postoperative setting. The protocol amendment changing the duration of treatment from 7 days to 4 days did not materially affect the results of the study. The response to methylnaltrexone was rapid, with 33.3% experiencing laxation within 2 hours. The median time to laxation was nearly 1.5 days shorter in patients treated with methylnaltrexone compared with those receiving placebo. Correspondingly, overall patient satisfaction was high in the methylnaltrexone group. Efficacy was attained without diminishing opioid analgesia, and without inducing signs or symptoms of opioid withdrawal. The incidence of AEs was similar between groups, and no treatment‐emergent SAEs were reported in this study.
Previous clinical trials investigated the safety and efficacy of methylnaltrexone for the treatment of OIC in patients with advanced illness and with chronic, nonmalignant pain. The present study extends those findings to a population of patients experiencing acute OIC following orthopedic surgery. Previous studies showed that approximately 48% to 62% of advanced‐illness patients experienced laxation within 4 hours of receiving SC methylnaltrexone,17, 18 compared with 38.9% of acute OIC patients in this study. In a clinical trial of patients with chronic, nonmalignant pain, 34.2% of patients experienced laxation within 4 hours of SC methylnaltrexone injection (Blonsky et al., 28th Annual Scientific Meeting of the American Pain Society, May 7‐9, 2009, San Diego, CA). The differences in laxation response between these trials may be attributable to differences in the patient populations or to methodologic differences between the studies.
Similar to findings demonstrated in a clinical study evaluating methylnaltrexone for OIC in a different patient population, those with advanced illness,22 this study supports the premise that future laxation response with prolonged use is most likely to occur when a laxation response was achieved after the first or second initial administrations of methylnaltrexone. In contradistinction, if laxation does not occur with these early doses, continued methylnaltrexone dosing is less likely to produce a response later.
This study has some limitations that must be considered. First, as this was a hypothesis‐generating study, all efficacy parameters investigated were exploratory in nature. The results reported herein warrant careful consideration, owing to a small sample size that may limit their generalizability, prior to replication in a more rigorously designed study with prespecified efficacy endpoints. Likewise, the assessment of health outcome parameters is limited. Another limitation is the small sample size utilized in this study, potentially resulting in a type II error.
Subcutaneous administration potentially offers a considerable benefit over oral therapies for OIC in this patient population post‐orthopedic surgery. Nausea and vomiting can occur as a consequence of anesthesia and of postoperative opioid analgesia, and may compromise adequate dosing of oral medications prescribed to treat OIC. Subcutaneous delivery of methylnaltrexone may circumvent this potential drawback while providing potentially rapid, effective treatment for OIC. Once‐daily dosing may also help to minimize caregiver burden and patient discomfort by preventing the need for more frequent or unpleasant treatments for OIC, such as enemas.
This study provides an initial positive signal for a broader, albeit off‐label use for methylnaltrexonethat being for the treatment of acute constipation that occurs as a consequence of postoperative opioid‐mediated analgesia in patients following orthopedic procedures. Adequate treatment of OIC, even in the acute postoperative setting, is likely to lead to better overall pain management and improved patient outcomes. Additionally, effective management of acute OIC is likely to be cost‐effective in terms of reducing the duration of hospital stays, reducing the need for nursing resources and the time spent administering rescue treatments for OIC (eg, enemas), and avoiding returns to an acute setting (eg, the emergency department) for treatment. The results presented herein suggest that methylnaltrexone may be effective and have a good safety profile in the treatment of acute OIC following orthopedic surgery. Validation of these results in larger well‐controlled trials would be welcome.
Acknowledgements
The authors thank the patients and clinical personnel involved in this study; John Charity, NP, for data collection and management, and John H. Simmons, MD, of Peloton Advantage, LLC, for assistance with manuscript preparation, which was funded by Pfizer Inc.
In addition to the authors, the following investigators participated in this trial: David Nathan Feldman, MD, Holy Name Hospital, Teaneck, NJ; Sam Hakki, MD, Bay Pines VA Healthcare System, Bay Pines, FL; Forrest A. Hanke, MD, Trover Health System, Madisonville, KY; William H. Horton, Jr, MD, Palmetto Clinical Research, Greenville, SC; M. Jay Jazayeri, MD, Pacific Hospital of Long Beach, Long Beach, CA; John F. Peppin, DO, The Pain Treatment Center of the Bluegrass, Lexington, KY; Bruce Pomeranz, MD, Kessler Institute for Rehabilitation, Saddle Brook, NJ, and Chester, NJ; Alan C. Schwartz, MD, Helping Hands Medical Associates, Santa Ana, CA; Michael J. Skyhar, MD, CORE Orthopaedic Medical Center, Encinitas, CA; Lex A. Simpson, MD, CORE Orthopaedic Medical Center, Encinitas, CA; James Slover, MD, New York University Hospital for Joint Disease, New York, NY; Dilip Tapadiya, MD, Fountain Valley Regional Hospital, Fountain Valley, CA; Stanley J. Waters, MD, PhD, Americana Orthopedics, Boise, ID.
- ,.Postoperative pain management.Chest Surg Clin N Am.1997;7:773–799.
- ,.Strategies for effective postoperative pain management.Minerva Anestesiol.2006;72:145–150.
- ,,.Are peripheral opioid antagonists the solution to opioid side effects?Anesth Analg.2004;98:116–122.
- ,.Neuroplasticity—an important factor in acute and chronic pain.Swiss Med Wkly.2002;132:273–278.
- ,,,,.The burden of acute postoperative pain and the potential role of the COX‐2‐specific inhibitors.Rheumatology (Oxford).2003;42(suppl 3):iii40–iii52.
- .Incidence, prevalence, and management of opioid bowel dysfunction.Am J Surg.2001;182(suppl 5A):11S–18S.
- ,.Management of common opioid‐induced adverse effects.Am Fam Physician.2006;74:1347–1354.
- ,.Antagonism of gastrointestinal opioid effects.Reg Anesth Pain Med.2000;25:639–642.
- .Methylnaltrexone mechanisms of action and effects on opioid bowel dysfunction and other opioid adverse effects.Ann Pharmacother.2007;41:984–993.
- ,.Methylnaltrexone: investigation of clinical applications.Drug Dev Res.2000;50:133–141.
- ,,,.Opioid‐induced delay in gastric emptying: a peripheral mechanism in humans.Anesthesiology.1997;87:765–770.
- ,,, et al.Effects of enteric‐coated methylnaltrexone in preventing opioid‐induced delay in oral‐cecal transit time.Clin Pharmacol Ther.2000;67:398–404.
- ,,,,,.Methylnaltrexone prevents morphine‐induced delay in oral‐cecal transit time without affecting analgesia: a double‐blind randomized placebo‐controlled trial.Clin Pharmacol Ther.1996;59:469–475.
- ,,,,,.Effects of intravenous methylnaltrexone on opioid‐induced gut motility and transit time changes in subjects receiving chronic methadone therapy: a pilot study.Pain.1999;83:631–635.
- ,,, et al.Methylnaltrexone for reversal of constipation due to chronic methadone use: a randomized controlled trial.JAMA.2000;283:367–372.
- ,.Oral methylnaltrexone for opioid‐induced constipation.JAMA.2000;284:1383–1384.
- ,,, et al.Methylnaltrexone for opioid‐induced constipation in advanced illness.N Engl J Med.2008;328:2332–2343.
- ,,, et al.Methylnaltrexone for treatment of opioid‐induced constipation in advanced illness patients.J Support Oncol.2009;7:39–46.
- Relistor [package insert].Philadelphia, PA, and Tarrytown, NY:Wyeth Pharmaceuticals Inc and Progenics Pharmaceuticals;2009.
- ,,, et al.Subcutaneous methylnaltrexone for treatment of opioid‐induced constipation in patients with chronic, nonmalignant pain: a randomized controlled study.J Pain.2011;12:554–562.
- ,,,,,.Two new rating scales for opiate withdrawal.Am J Drug Alcohol Abuse.1987;13:293–308.
- ,,, et al.Methylnaltrexone treatment of opioid‐induced constipation in patients with advanced illness.J Pain Symptom Manage.2009;38:683–690.
Copyright © 2011 Society of Hospital Medicine

BMI‐Related Outcome in Minority Patients
Obesity affects all segments of the American population. However, it imposes a larger burden and poses a greater threat to minority populations.1 The increase in overall prevalence of obesity and obesity‐related diseases are especially pronounced in ethnic minorities,2 and the outlook for minorities who develop obesity‐associated diseases such as stroke and chronic renal disease is worse than in their Caucasian counterparts.3
Despite the higher prevalence of obesity in ethnic minorities, the majority of research on the relationship between body mass index (BMI) and mortality has been conducted among Caucasians in the United States. This is due largely to the small number of minority participants in most studies, which makes for low statistical power.4
A curious epidemiologic paradox has been the observation, in many studies, that black adults have lower morbidity and mortality associated with obesity compared to Caucasians.5 In fact, some authors suggest that high BMI among black and other minorities may not be as strong a risk factor for mortality as it is in others.6, 7
Very few studies have specifically examined the contribution of BMI to postoperative outcome in a large cohort of minority patients.8, 9 Similarly, the authors are unaware of any previous studies describing the clinical relevance of being overweight and obese in minority patients undergoing surgery. Therefore, the primary objective of this observational study was to describe the prevalence of overweight and obesity in a large cohort of minority surgical patients, and the impact of BMI class on their postoperative outcome. Our a priori hypothesis was that obese minority surgical patients would have a poorer postoperative outcome and have higher 30‐day all‐cause mortality than normal weight individuals.
METHODS
Study data were derived from the Participant Use Data File of the American College of Surgeons (ACS) National Surgical Quality Improvement Program (NSQIP) for the calendar years 2005 to 2008. This multi‐institutional (186 participating centers) reporting system was designed to provide risk‐adjusted surgical outcome data from throughout the United States.
The methodology for collecting these data, including their accuracy and reproducibility, has been detailed in previous publications.10, 11 It is briefly reviewed here. Dedicated nurse clinical reviewers at each hospital prospectively enrolled patients and collected data in a standardized fashion according to strict ACS‐NSQIP definitions. A systematic sample was obtained by taking the first 40 cases per nurse reviewer on an 8‐day cycle from the operating room log, ensuring that no particular operating room day block time would bias the weighting of cases. Nurse reviewers had completed comprehensive training regarding definitions and data extraction, as well as continuing education and monitoring through the ACS‐NSQIP program. They are assessed for inter‐rater reliability during biennial site visits. Information was obtained from patient medical records, physician office records, and telephone interviews. Patients were followed through their hospital course and after discharge from hospital up to 30 days postoperatively. A high level of accuracy and reproducibility of the data have been previously demonstrated.12
Race was defined as African American, Hispanic, Asian or Pacific Islander, or American Indian/Alaskan native, as identified by the clinical care provider, or within the medical record. Patients were excluded if race was coded as white, or not recorded. We also excluded patients with missing record of height and/or weight. The final study cohort consisted of 119,619 minority patients. We then computed BMI as weight in kilograms divided by the square of the height in meters (BMI = kg/m2). Patients were classified as underweight (BMI 18.5 kg/m2), normal weight (BMI = 18.6‐24.9 kg/m2), overweight (BMI = 25‐29.9 kg/m2), obese (BMI = 30‐39.9 kg/m2), and morbidly obese (BMI 40 kg/m2) in accordance with National Institute of Health (NIH) standards.13
Outcomes
The primary outcome was death within 30 days of the index surgery. Secondary outcomes were the occurrence of major or minor complications. Major complications were grouped as the occurrence of at least one of following: organ space infection, wound disruption, sepsis or septic shock, bleeding requiring transfusion, postoperative pneumonia, delayed ventilator wean, unplanned reintubation, myocardial infarction, deep venous thrombosis, cardiac arrest, coma, acute renal failure, progressive renal insufficiency, and return to the operating room. We then computed a composite morbidity variable defined as the occurrence of 1 or more of these major postoperative complications. Minor complications included occurrence of urinary tract infection, superficial surgical site infection, and superficial thrombophlebitis.
Statistical Analysis
Data analysis was carried out with SPSS v.16.0 (SPSS, Chicago, IL). Basic descriptive statistics, including means, standard deviations, and percentages were calculated for demographic and anthropometric data. Prevalence of overweight and obesity were described as simple proportions and compared along gender lines. Pearson's chi‐square analysis of categorical variables and 1‐way ANOVA of continuous variables were used to examine baseline clinical and perioperative differences between BMI categories. Pair‐wise comparisons, with the normal BMI class serving as the reference, were performed using the Bonferroni multiple comparison of means method. The overall mortality rate was calculated as well as the distribution of mortality across BMI classes. We also compared mortality rate in patients who developed at least 1 major postoperative complicationdefined as failure to rescue14 across the BMI classes.
Multivariate logistic regression models were fitted to the data to explore the relationship between BMI category and death within 30 days of surgery. Odds ratios for 30‐day all‐cause mortality were calculated in the BMI categories using the normal BMI group as reference. The following characteristics were included in the model as covariates based on a priori statistical significance or clinical relevance: age (<65 years vs 65 years), American Society of Anesthesiology (ASA) status (I‐II vs III), racial groups, and urgency of surgery (elective vs emergent). Other covariates included the presence of multiple medical conditions (coded as yes or no), surgical complexity, need for reoperation, reintubation, and preoperative functional status. A model fit was measured with the Hosmer and Lemeshow test.15 All reported P values were 2‐sided and a P value of 0.05 was considered to be significant.
RESULTS
The study cohort included 119,619 surgical patients (Table 1). Their mean (standard deviation [SD]) age was 50.4 (16.9), and the mean (SD) BMI of 30.3 (8.9) kg/m2 was in the obese range. The overall prevalence of high BMI (overweight or obese) was 70.8%. A very small proportion, 2.7%, of patients was classified as underweight. Sex‐stratified demographic and behavioral characteristics differed significantly across all the variables in our study cohort. Men were more likely to be overweight, whereas women were more likely to be obese or severely obese. A majority (77.4%) of the patients were non‐elderly adults (<65years) undergoing elective (85.9%) surgical procedures. The minority patients in this study were African American (50%), Hispanic (36%), Asian and Pacific Islander (10%), and American Indian and Alaskan native (4%).
| Baseline Characteristics | All Patients (N = 119,619) | Men (N = 44,922) | Women (N = 74,695) | P Value |
|---|---|---|---|---|
| ||||
| Age (yr) | 50.4 16.9 | 51.6 17.1 | 49.6 16.7 | <0.001 |
| Age 65 yr | 22.6 | 25.5 | 20.8 | <0.001 |
| Current smoker | 22.2 | 28.8 | 18.2 | <0.001 |
| >2 Drinks/day | 37.6 | 4.1 | 0.8 | <0.001 |
| BMI | 30.3 8.8 | 28.4 7.3 | 31.4 9.5 | <0.001 |
| Underweight | 2.7 | 2.9 | 2.6 | 0.001 |
| Overweight | 29.2 | 35.5 | 25.4 | <0.001 |
| Obese | 28.8 | 24.9 | 31.2 | <0.001 |
| Severely obese | 12.8 | 6.2 | 16.8 | <0.001 |
| Ethnic categories | ||||
| Black | 50.4 | 48.0 | 51.7 | <0.001 |
| Hispanic | 36.2 | 38.2 | 35.2 | <0.001 |
| Asian* | 9.7 | 10.3 | 9.3 | <0.001 |
| American Indian | 3.6 | 3.5 | 5.8 | <0.001 |
| Surgical specialties | ||||
| General surgery | 77.9 | |||
| Vascular surgery | 10.3 | |||
| Orthopedics | 4.0 | |||
| Gynecology | 3.4 | |||
| Urology | 1.1 | |||
| Others! | 3.3 | |||
The distribution of baseline preoperative clinical characteristics by BMI class revealed many significant differences (Table 2). Age was significantly different among the BMI classes, with the severely obese group being about 8 years younger than the underweight or normal weight group. Similarly, severely obese patients were more likely to be women, less likely to smoke, more likely to be hypertensive, diabetic, have a history of dyspnea at rest, and more likely to belong to high ASA class. On the other hand, underweight patients were more likely to have disseminated cancer, be current smokers, consume more than 2 alcoholic drinks per day, have active chronic obstructive pulmonary disease (COPD), and have ascites. They were also more likely to be on dialysis and have cardiac disease, as well as a history of stroke. Urgency of surgery also varied significantly across the BMI categories, with the underweight group having the highest incidence of emergency surgery (20.6%) and the severely obese group being the least likely to present for emergency surgery (8.2%).
| BMI range (kg/m2) Characteristics | Mean SD or (%) | P Value | ||||
|---|---|---|---|---|---|---|
| UW (18.5) | NW (18.5‐24.9) | OVW (25‐29.9) | OB (30‐39.9) | SevOB (40) | ||
| ||||||
| Age (yr) | 53.4 19.3 | 51.1 18.4 | 51.8 16.9 | 50.4 15.5 | 45.2 13.4 | <0.001 |
| Female | 59.8 | 56.7 | 54.4 | 67.5 | 81.7 | <0.001 |
| Current smoker | 32.1 | 25.6 | 22.1 | 20.4 | 17.1 | <0.001 |
| >2 Drinks/day | 4.1 | 2.7 | 2.2 | 1.6 | 0.7 | <0.001 |
| Hypertension | 41.7 | 38.4 | 44.0 | 51.0 | 56.0 | <0.001 |
| DM (insulin or oral agents) | 12.5 | 13.1 | 16.4 | 22.3 | 26.3 | <0.001 |
| COPD | 7.7 | 3.3 | 2.5 | 2.7 | 2.5 | <0.001 |
| Dyspnea at rest | 10.5 | 7.1 | 7.2 | 9.9 | 20.2 | <0.001 |
| ASA III | 59.0 | 39.5 | 35.6 | 39.8 | 62.2 | <0.001 |
| Emergency surgery | 20.6 | 17.6 | 15.2 | 11.9 | 8.2 | <0.001 |
| Active CHF | 2.2 | 1.3 | 1.1 | 1.1 | 1.1 | <0.001 |
| Recent MI | 1.1 | 0.8 | 0.8 | 0.6 | 0.4 | <0.001 |
| Recent angina | 1.2 | 1.1 | 1.1 | 1.2 | 0.7 | <0.001 |
| Disseminated cancer | 4.3 | 2.5 | 1.6 | 1.3 | 0.6 | <0.001 |
| Recent 10% weight loss | 15.2 | 4.2 | 1.7 | 1.0 | 0.5 | <0.001 |
| Ascites | 4.4 | 2.1 | 1.2 | 0.9 | 0.5 | <0.001 |
| Currently on dialysis | 9.7 | 6.7 | 4.9 | 4.1 | 2.9 | <0.001 |
| Stroke history | 5.6 | 3.5 | 2.9 | 2.6 | 1.3 | <0.001 |
Perioperative outcomes according to BMI classes documented significant differences (Table 3). Work relative value unit (Work RVU, a measure of surgical complexity), as well as total anesthesia and operation time decreased in a stepwise fashion across the BMI classes to the obese group, followed by increase in these parameters in the severely obese group. Following a decrease to the normal BMI category, there was a positive association between BMI and the incidence of postoperative superficial and deep wound infection, as well as wound disruption.
| BMI (kg/m2) Events | Mean SD or (%) | P Value | ||||
|---|---|---|---|---|---|---|
| UW (18.5) | NW (18.5‐24.9) | OVW (25‐29.9) | OB (30‐39.9) | SevOB (40) | ||
| ||||||
| Work RVU | 16.3 9.5 | 14.5 9.1 | 14.0 8.4 | 13.8 7.9 | 17.3 9.1 | <0.001 |
| Anesthesia time (hr) | 2.7 1.9 | 2.5 1.7 | 2.5 1.6 | 2.5 1.6 | 2.7 1.5 | <0.001 |
| Pre‐incision time (min) | 35.9 21.3 | 33.1 21.1 | 33.2 22.5 | 32.5 19.3 | 34.9 21.1 | <0.001 |
| Operation time (hr) | 1.8 1.6 | 1.6 1.4 | 1.7 1.4 | 1.7 1.4 | 1.8 1.2 | <0.001 |
| Transfused intra‐op | 12.8 | 7.1 | 5.3 | 4.4 | 2.9 | <0.001 |
| Superficial wound SSI | 2.9 | 2.5 | 2.6 | 2.8 | 3.1 | <0.001 |
| Deep wound SSI | 1.5 | 0.7 | 0.8 | 0.9 | 1.0 | <0.001 |
| Wound disruption | 1.5 | 0.6 | 0.6 | 0.6 | 0.7 | <0.001 |
| Post‐op sepsis | 5.7 | 2.9 | 2.2 | 2.1 | 2.0 | <0.001 |
| Septic shock | 3.1 | 1.7 | 1.3 | 1.2 | 1.1 | <0.001 |
| Reintubation | 3.8 | 1.8 | 1.2 | 1.0 | 1.0 | <0.001 |
| Delayed ventilator wean | 5.5 | 2.8 | 2.1 | 2.0 | 2.0 | <0.001 |
| Pneumonia | 4.3 | 2.1 | 1.3 | 1.2 | 1.2 | <0.001 |
| Cardiac arrest/CPR | 1.5 | 0.7 | 0.5 | 0.4 | 0.4 | <0.001 |
| Urinary tract infection | 3.4 | 1.8 | 1.5 | 1.6 | 1.6 | <0.001 |
| Post‐op ARF | 2.1 | 1.1 | 0.8 | 0.9 | 0.7 | <0.001 |
| Return to OR | 11.2 | 6.9 | 5.8 | 5.5 | 4.9 | <0.001 |
| Post‐op coma | 0.4 | 0.2 | 0.1 | 0.1 | 0.1 | <0.001 |
| Post‐op transfusion | 1.6 | 0.7 | 0.5 | 0.4 | 0.5 | <0.001 |
| Composite morbidities | 25.2 | 15.3 | 13.0 | 12.8 | 12.1 | <0.001 |
There was a negative association between BMI class and the likelihood of postoperative sepsis, septic shock, reintubation, delayed ventilator wean, and postoperative pneumonia. Similarly, the proportions of patients who developed postoperative acute renal failure, cardiac arrest, and those who required postoperative blood transfusion or needed reoperation, decreased significantly across the BMI classes, with the highest proportion of cases being in the underweight group and the lowest in the severely obese group. Overall composite morbidity was twice as high in the underweight compared to the severely obese group.
There were 1758 deaths among the study's 119,619 patients, resulting in an overall mortality rate of 1.5%. The overall major complication rate was 13.8%. The distribution of total mortality rate as well as mortality in patients with at least 1 major postoperative complication across BMI classes revealed consistent differences (Figure 1). Over the entire range of BMI classes, there was a progressive, stepwise decrease in the proportion of deaths with increasing BMI. This pattern also occurred among patients who developed at least 1 major postoperative complication, indicating a reduced likelihood of death after a major complication. This is reflective of a reduced likelihood of death after a major complication (failure to rescue) with increasing BMI.

Multivariate logistic regression defined a number of factors associated with 30‐day mortality (Table 4). The Hosmer and Lemeshow goodness‐of‐fit test for this model was not statistically significant (2 = 17.8, df = 8, P = 0.23). High ASA physical status was associated with high odds of mortality. Specifically, when controlling for the other covariates in the model, ASA status was associated with a 5‐fold increased relative odds of death (adjusted odds ratio [OR] = 5.30; 95% confidence interval = 4.96‐5.79, P < 0.001). Similarly, occurrence of 1 or more major postoperative complication was associated with 6‐fold increased relative odds of mortality. The paradoxical effect of BMI category observed on univariate analysis was maintained in the multivariate model. Specifically, underweight patients had the highest relative odds of mortality, while severely obese patients had the lowest, compared with patients at a healthy weight (Table 4). Interestingly, smoking had no significant effect on the odds of mortality after controlling for other factors. Similarly, the specific racial group and the timing of the surgical intervention had no significant effect on mortality.
| Variables in the equation | Coefficient () | Wald (2) | P Value | Odds Ratio | 95% CI |
|---|---|---|---|---|---|
| |||||
| ASA status III | 1.67 | 233.0 | <0.001 | 5.31 | 4.96‐5.79 |
| Emergency operation | 0.89 | 241 | <0.001 | 2.43 | 2.17‐2.72 |
| Reoperation | 0.77 | 155.9 | <0.001 | 2.10 | 1.91‐2.44 |
| Reintubation | 0.4 | 51.4 | <0.001 | 1.63 | 1.41‐1.82 |
| Dependent functional status | 1.2 | 422.5 | <0.001 | 3.44 | 3.01‐3.79 |
| Cumulative comorbidity* | 0.09 | 12.37 | <0.001 | 1.18 | 1.03‐1.14 |
| Major POP complication | 1.8 | 686.1 | <0.001 | 6.43 | 5.59‐7.39 |
| Age 65 yr | 0.56 | 95.3 | <0.001 | 1.75 | 1.56‐1.96 |
| Work RVU | 0.17 | 49.7 | <0.001 | 1.02 | 1.01‐1.02 |
| Severely obese | Reference | 1.00 | |||
| Underweight | 0.76 | 30.9 | <0.001 | 2.13 | 1.63‐2.78 |
| Normal BMI | 0.42 | 15.4 | <0.001 | 1.52 | 1.23‐1.87 |
| Overweight | 0.28 | 6.9 | 0.009 | 1.33 | 1.08‐1.65 |
| Obese | 0.19 | 2.86 | 0.091 | 1.20 | 0.97‐1.49 |
| Dyspnea | 0.41 | 40.0 | <0.001 | 1.51 | 1.33‐1.72 |
| Active CHF | 0.60 | 39.6 | <0.001 | 1.83 | 1.52‐2.21 |
| Chronic renal failure (dialysis) | 0.70 | 102.2 | <0.001 | 2.01 | 1.76‐2.30 |
DISCUSSION
In this large, study of minority surgical patients, the impact of BMI on the 30‐day morbidity and mortality was unexpected. The working hypothesis was that overweight and obese patients would have a worse outcome after surgery. However, contrary to this hypothesis, the lowest all‐cause mortality rate was found in the severely obese (BMI 40 kg/m2) group in both men and women. Death rates decreased progressively in a stepwise fashion from the underweight to the severely obese group. Similarly, even in patients who developed at least 1 major postoperative complication, the likelihood of death was still negatively associated with BMI. This negative association of mortality with BMI was observed despite the higher prevalence of chronic diseases, such as hypertension, diabetes, and dyspnea at rest, in the increasing BMI classes.
Controversy remains regarding the association between BMI and mortality, in particular about the shape of the curve for the association between BMI and mortality. Epidemiologic studies have variously described J‐shaped, U‐shaped, monotonic, or linear relationships.16, 17 In the surgical population, a reverse J‐shaped relationship between BMI category and mortality has been described.18, 19 Sometimes this is referred to as obesity paradox or reverse epidemiology: a trend whereby overweight and moderately obese patients have better outcomes and lower risk of death than leaner patients.18 This phenomenon is particularly well described in adult20 and elderly heart failure and hypertensive patients.21 Many of these studies either had very few minority patients,21 or mortality pattern was not analyzed along ethnic lines.
Few studies10 have focused exclusively on minority surgical patients. Some investigators have determined that high BMI in black adults may not be as important a risk factor for mortality6, 7 as in whites. Our data suggest that among minority surgical patients, the relationship appeared to be a downward trend in mortality from low to high BMI, thus revealing the obesity paradox. This pattern was evident even in patients who developed 1 major complication in the postoperative period, suggesting that high BMI also protects against failure to rescueor death after a major complication.
Despite decades of research, the mechanisms underlying the obesity paradox remain speculative.20, 22. Many have posited that adiposity may confer protection against cytokines and various inflammatory mediators in heart failure patients by the production of buffering lipoproteins.23, 24 It is conceivable that similar protection against inflammatory response to surgical tissue trauma is operational in minority patients with high BMI. Another possible reason for the obesity paradox is the clinical presentation and disease progression at the time of surgery. Perhaps, similar to the observation in obese patients with heart failure,25 obese minority patients are symptomatic at an earlier stage of their disease than lean patients, making for earlier diagnosis and treatment. Thus, obesity may simply be a marker of less severe disease at the time of presentation.
Obese patients may also be more aggressively monitored and treated in the perioperative period than lean patients, because of the general perception that they are a high‐risk group.10 This may partly explain the decreased likelihood of failure to rescue with increasing BMI in our patients. Increased vigilance and prompt treatment of complications should reduce the overall morbidity and mortality rate in this group. It is also conceivable that a therapeutic selection bias is operational in the patients we studied. This describes scenarios where relatively healthy obese minority patients were operated upon, while sicker, morbidly obese patients were denied surgery due to perceived prohibitive risks. However, we would have expected a higher proportion of severely obese patients to present for emergency surgery, which is contrary to our finding of the lowest incidence of emergency surgery in the severely obese group. It is also possible that severe obesity may be associated with a higher attrition rate, such that the extremely obese patients did not live long enough to present for surgery. This is somewhat likely, given the significantly younger age of the severely obese patients in our study cohort. It is, however, impossible to determine survival effect from a cross‐sectional hospital‐based study design. Clearly, mechanisms used to explain the obesity paradox in minority surgical patients are likely to remain speculative, owing to the interaction of several factors such as concomitant comorbidities, disease progression at the time of presentation, patients' weight history, and regional fat distribution.
The current study confirms the findings of previous investigators26 about the importance of reducing major postoperative complications in surgical patients. While this may seem axiomatic, it deserves reiteration because the risk of postoperative mortality increases considerably in all the BMI categories following 1 or more major postoperative complication. However, it is not clear why obese and morbidly obese patients had a lower incidence of failure to rescue. This may be related to greater physiologic reserve in the obese and morbidly obese group, especially because patients in the higher BMI groups were significantly younger than the normal weight or lean patients. For the same reason, these younger, severely obese patients may have been more aggressively monitored and treated, thereby increasing the likelihood of being rescued following a major complication. It is also possible that the lower proportion of emergency procedures performed in obese and severely obese groups was somewhat protective, especially because emergency surgery was an independent predictor of overall mortality in this cohort of patients. In fact, when we stratified the patients according to urgency of surgery and explored the bivariate relationship between BMI category and mortality (data not shown) among those undergoing urgent surgery, the geometrical distribution of mortality did show a reverse‐J pattern with the highest proportion of cases in the underweight group, declining in the normal BMI and overweight group, and increasing steadily in obese and severely obese group. To this end, caution should be exercised when interpreting the association of BMI group with postoperative mortality for procedures performed as an emergency.
Smoking and antecedent illness are 2 confounding factors commonly criticized in studies attempting to associated BMI with mortality. This is because smokers tend to weigh less and have higher mortality rates than nonsmokers. The present investigation did not find a significant contribution of smoking to mortality when other factors included in a logistic regression model were considered. The current study's findings are consistent with those of previous data in African American patients,27 and contrasts with the excess mortality described in currently smoking Caucasian men and women.28 It is possible that smoking is not an important effect modifier when considering the relevance of BMI to postoperative mortality in minority patients.
Study Limitations
Although considerable information on several perioperative variables existed, there was a lack of detailed, disease‐specific clinical information for the individual surgical procedures. Likewise, information was unavailable regarding the process of care, such as decision to operate, when to operate, and intraoperative and the postoperative care, which are some of the factors that may determine postoperative outcome. Similarly, we did not have information on surgical experience or hospital caseload, both of which are known to affect postoperative outcome.29
In addition, the anthropometric parameters used to calculate BMI for this study are self‐reported values. Although directly measured height and weight values are preferable for calculating BMI, previous studies have shown that correlations between BMI based on measured height and weight and that based on self‐report are typically greater than 0.9.30 Given the reported strong correlation between self‐reported and measured anthropometric parameters, the reporting error on the observed association between BMI and mortality in our study is likely minimal. The limitations of BMI as a measure of adiposity is well described.31, 32 This study had no information on body fat distribution, which has been shown to have a direct correlation with mortality when BMI did not.33 Additionally, documented weight may be less accurate in the extremely obese group in that they may not have been weighed, either at home or in the hospital, due to lack of adequate weighing scales.
Conclusions
This study demonstrated that among minority surgical patients, higher BMI categories were associated with lower risk of postoperative death. This relationship was maintained, even in patients who developed 1 or more postoperative major complications, such that obese and severely obese patients had better survival compared with underweight and healthy weight patients. Mechanisms underlying this paradoxical survival advantage deserve further elucidation. It is important to emphasize that our findings in no way diminish the long‐term dangers associated with excessive adiposity, but may serve to discard the preconceived notions that overweight and obese minority patients have poorer outcome after surgery than lean patients.
- ,,,.Increasing trends in waist circumference and abdominal obesity among US adults.Obesity.2007;15:216–224.
- ,,,,,.Prevalence of overweight and obesity in the United States, 1999–2004.JAMA.2006;295:1549–1555.
- ,,,,.Ethnic disparities in stroke epidemiology, acute care, and post‐acute outcomes.Stroke.2005;36:374–387.
- ,,,,,.Body mass index and body girths as predictors of mortality in black and white women.Arch Intern Med.1992;152:1257–1262.
- ,,,,,.Relative weight and mortality in U.S. blacks and whites: findings from representative national population samples.Ann Epidemiol.1997;7:383–395.
- ,,,,.Body‐mass index and mortality in a prospective cohort of U.S. adults.N Engl J Med.1999;341:1097–1105.
- ,,, et al.Body mass index and body girths as predictors of mortality in black and white men.Am J Epidemiol.1992;135:1137–1146.
- ,,.Morbidity in obese and non‐obese patients following gynecologic surgery for cancer.J Natl Med Assoc.1988;80:417–420.
- ,,, et al.The influence of obesity on perioperative morbidity: retrospective study of 502 aorto‐coronary bypass operations.Thorac Cardiovasc Surg.1992;40:126–129.
- ,,,,.The impact of high body mass index on postoperative complications and resource utilization in minority patients.J Natl Med Assoc.2011;103:9–15.
- ,,, et al.The patient safety in surgery study: background, study design, and patient populations.J Am Coll Surg.2007;204:1089–1102.
- ,,, et al.The assessment of the reliability of data collected for the Department of Veterans Affairs' National Surgical Quality Improvement Program (NSQIP).J Am Coll Surg.2007;204:550–560.
- Expert Panel on the Identification, Evaluation, and Treatment of Overweight in Adults. Clinical guidelines on the identification, evaluation, and treatment of overweight and obesity in adults: executive summary.Am J Clin Nutr.1998;68:899–917.
- ,,,.Hospital and patient characteristics associated with death after surgery: a study of adverse occurrence and failure to rescue.Med Care.1992;30:615–629.
- ,,,.Multivariate Data Analysis.5th ed.London:Prentice Hall International;1998.
- ,,,,,.Estimating the number of deaths due to obesity: can the divergent findings be reconciled?J Women's Health.2007;16(2):168–176.
- ,,, et al.Body mass index and mortality among US male physicians.Ann Epidemiol.2004;14/10:731–739.
- ,,.The obesity paradox: body mass index and outcomes in patients undergoing non‐bariatric general surgery.Ann Surg.2009;250:166–172.
- ,,,,,.The influence of body mass index obesity status on vascular surgery 30‐day morbidity and mortality.J Vasc Surg.2009;49:140–147.
- ,,, et al.Risk factor paradox in wasting diseases.Curr Opin Clin Nutr Metab Care.2007;10:433–442.
- ,,, et al.The relationship between obesity and mortality in patients with heart failure.J Am Coll Cardiol.2001;38:789–795.
- ,.Reverse epidemiology beyond dialysis patients: chronic heart failure, geriatrics, rheumatoid arthritis, COPD, and AIDS.Semin Dial.2007;20:549–553.
- ,,.The endotoxin‐lipoprotein hypothesis.Lancet.2000;356:930–933.
- ,,, et al.Adiponectin and cardiovascular disease: state of the art?Am J Physiol Heart Circ Physiol.2007;292:H1655–H1663.
- ,,,.Body composition and prognosis in chronic systolic heart failure: the obesity paradox.Am J Cardiol.2003;91:891–894.
- ,,.Variation in hospital mortality associated with inpatient surgery.N Engl J Med.2009;361:1368–1375.
- ,,.Body mass index and 15‐year mortality in a cohort of black men and women.J Clin Epidemiol.1990;43:949–960.
- ,,.Thinness and mortality.Am J Public Health.1987;77:317–322.
- ,,.Operative mortality and procedure volume as predictors of subsequent hospital performance.Ann Surg.2006;243:411–417.
- .Nutritional Epidemiology.2nd ed.Monographs in Epidemiology and Biostatistics; vol30.New York:Oxford University Press,1998:514.
- ,,, et al.Association of general and abdominal obesity with multiple health outcomes in older women: the Iowa Women's Health study.Arch Intern Med.2000;160:2117–2128.
- ,,.Does body mass index adequately capture the relation of body composition and body size to health outcomes?Am J Epidemiol.1998;147:167–172.
- ,,,.Intra‐abdominal adiposity, abdominal obesity, and cardio‐metabolic risk.Eur Heart J Suppl.2008;10(suppl B):B4–10.
Obesity affects all segments of the American population. However, it imposes a larger burden and poses a greater threat to minority populations.1 The increase in overall prevalence of obesity and obesity‐related diseases are especially pronounced in ethnic minorities,2 and the outlook for minorities who develop obesity‐associated diseases such as stroke and chronic renal disease is worse than in their Caucasian counterparts.3
Despite the higher prevalence of obesity in ethnic minorities, the majority of research on the relationship between body mass index (BMI) and mortality has been conducted among Caucasians in the United States. This is due largely to the small number of minority participants in most studies, which makes for low statistical power.4
A curious epidemiologic paradox has been the observation, in many studies, that black adults have lower morbidity and mortality associated with obesity compared to Caucasians.5 In fact, some authors suggest that high BMI among black and other minorities may not be as strong a risk factor for mortality as it is in others.6, 7
Very few studies have specifically examined the contribution of BMI to postoperative outcome in a large cohort of minority patients.8, 9 Similarly, the authors are unaware of any previous studies describing the clinical relevance of being overweight and obese in minority patients undergoing surgery. Therefore, the primary objective of this observational study was to describe the prevalence of overweight and obesity in a large cohort of minority surgical patients, and the impact of BMI class on their postoperative outcome. Our a priori hypothesis was that obese minority surgical patients would have a poorer postoperative outcome and have higher 30‐day all‐cause mortality than normal weight individuals.
METHODS
Study data were derived from the Participant Use Data File of the American College of Surgeons (ACS) National Surgical Quality Improvement Program (NSQIP) for the calendar years 2005 to 2008. This multi‐institutional (186 participating centers) reporting system was designed to provide risk‐adjusted surgical outcome data from throughout the United States.
The methodology for collecting these data, including their accuracy and reproducibility, has been detailed in previous publications.10, 11 It is briefly reviewed here. Dedicated nurse clinical reviewers at each hospital prospectively enrolled patients and collected data in a standardized fashion according to strict ACS‐NSQIP definitions. A systematic sample was obtained by taking the first 40 cases per nurse reviewer on an 8‐day cycle from the operating room log, ensuring that no particular operating room day block time would bias the weighting of cases. Nurse reviewers had completed comprehensive training regarding definitions and data extraction, as well as continuing education and monitoring through the ACS‐NSQIP program. They are assessed for inter‐rater reliability during biennial site visits. Information was obtained from patient medical records, physician office records, and telephone interviews. Patients were followed through their hospital course and after discharge from hospital up to 30 days postoperatively. A high level of accuracy and reproducibility of the data have been previously demonstrated.12
Race was defined as African American, Hispanic, Asian or Pacific Islander, or American Indian/Alaskan native, as identified by the clinical care provider, or within the medical record. Patients were excluded if race was coded as white, or not recorded. We also excluded patients with missing record of height and/or weight. The final study cohort consisted of 119,619 minority patients. We then computed BMI as weight in kilograms divided by the square of the height in meters (BMI = kg/m2). Patients were classified as underweight (BMI 18.5 kg/m2), normal weight (BMI = 18.6‐24.9 kg/m2), overweight (BMI = 25‐29.9 kg/m2), obese (BMI = 30‐39.9 kg/m2), and morbidly obese (BMI 40 kg/m2) in accordance with National Institute of Health (NIH) standards.13
Outcomes
The primary outcome was death within 30 days of the index surgery. Secondary outcomes were the occurrence of major or minor complications. Major complications were grouped as the occurrence of at least one of following: organ space infection, wound disruption, sepsis or septic shock, bleeding requiring transfusion, postoperative pneumonia, delayed ventilator wean, unplanned reintubation, myocardial infarction, deep venous thrombosis, cardiac arrest, coma, acute renal failure, progressive renal insufficiency, and return to the operating room. We then computed a composite morbidity variable defined as the occurrence of 1 or more of these major postoperative complications. Minor complications included occurrence of urinary tract infection, superficial surgical site infection, and superficial thrombophlebitis.
Statistical Analysis
Data analysis was carried out with SPSS v.16.0 (SPSS, Chicago, IL). Basic descriptive statistics, including means, standard deviations, and percentages were calculated for demographic and anthropometric data. Prevalence of overweight and obesity were described as simple proportions and compared along gender lines. Pearson's chi‐square analysis of categorical variables and 1‐way ANOVA of continuous variables were used to examine baseline clinical and perioperative differences between BMI categories. Pair‐wise comparisons, with the normal BMI class serving as the reference, were performed using the Bonferroni multiple comparison of means method. The overall mortality rate was calculated as well as the distribution of mortality across BMI classes. We also compared mortality rate in patients who developed at least 1 major postoperative complicationdefined as failure to rescue14 across the BMI classes.
Multivariate logistic regression models were fitted to the data to explore the relationship between BMI category and death within 30 days of surgery. Odds ratios for 30‐day all‐cause mortality were calculated in the BMI categories using the normal BMI group as reference. The following characteristics were included in the model as covariates based on a priori statistical significance or clinical relevance: age (<65 years vs 65 years), American Society of Anesthesiology (ASA) status (I‐II vs III), racial groups, and urgency of surgery (elective vs emergent). Other covariates included the presence of multiple medical conditions (coded as yes or no), surgical complexity, need for reoperation, reintubation, and preoperative functional status. A model fit was measured with the Hosmer and Lemeshow test.15 All reported P values were 2‐sided and a P value of 0.05 was considered to be significant.
RESULTS
The study cohort included 119,619 surgical patients (Table 1). Their mean (standard deviation [SD]) age was 50.4 (16.9), and the mean (SD) BMI of 30.3 (8.9) kg/m2 was in the obese range. The overall prevalence of high BMI (overweight or obese) was 70.8%. A very small proportion, 2.7%, of patients was classified as underweight. Sex‐stratified demographic and behavioral characteristics differed significantly across all the variables in our study cohort. Men were more likely to be overweight, whereas women were more likely to be obese or severely obese. A majority (77.4%) of the patients were non‐elderly adults (<65years) undergoing elective (85.9%) surgical procedures. The minority patients in this study were African American (50%), Hispanic (36%), Asian and Pacific Islander (10%), and American Indian and Alaskan native (4%).
| Baseline Characteristics | All Patients (N = 119,619) | Men (N = 44,922) | Women (N = 74,695) | P Value |
|---|---|---|---|---|
| ||||
| Age (yr) | 50.4 16.9 | 51.6 17.1 | 49.6 16.7 | <0.001 |
| Age 65 yr | 22.6 | 25.5 | 20.8 | <0.001 |
| Current smoker | 22.2 | 28.8 | 18.2 | <0.001 |
| >2 Drinks/day | 37.6 | 4.1 | 0.8 | <0.001 |
| BMI | 30.3 8.8 | 28.4 7.3 | 31.4 9.5 | <0.001 |
| Underweight | 2.7 | 2.9 | 2.6 | 0.001 |
| Overweight | 29.2 | 35.5 | 25.4 | <0.001 |
| Obese | 28.8 | 24.9 | 31.2 | <0.001 |
| Severely obese | 12.8 | 6.2 | 16.8 | <0.001 |
| Ethnic categories | ||||
| Black | 50.4 | 48.0 | 51.7 | <0.001 |
| Hispanic | 36.2 | 38.2 | 35.2 | <0.001 |
| Asian* | 9.7 | 10.3 | 9.3 | <0.001 |
| American Indian | 3.6 | 3.5 | 5.8 | <0.001 |
| Surgical specialties | ||||
| General surgery | 77.9 | |||
| Vascular surgery | 10.3 | |||
| Orthopedics | 4.0 | |||
| Gynecology | 3.4 | |||
| Urology | 1.1 | |||
| Others! | 3.3 | |||
The distribution of baseline preoperative clinical characteristics by BMI class revealed many significant differences (Table 2). Age was significantly different among the BMI classes, with the severely obese group being about 8 years younger than the underweight or normal weight group. Similarly, severely obese patients were more likely to be women, less likely to smoke, more likely to be hypertensive, diabetic, have a history of dyspnea at rest, and more likely to belong to high ASA class. On the other hand, underweight patients were more likely to have disseminated cancer, be current smokers, consume more than 2 alcoholic drinks per day, have active chronic obstructive pulmonary disease (COPD), and have ascites. They were also more likely to be on dialysis and have cardiac disease, as well as a history of stroke. Urgency of surgery also varied significantly across the BMI categories, with the underweight group having the highest incidence of emergency surgery (20.6%) and the severely obese group being the least likely to present for emergency surgery (8.2%).
| BMI range (kg/m2) Characteristics | Mean SD or (%) | P Value | ||||
|---|---|---|---|---|---|---|
| UW (18.5) | NW (18.5‐24.9) | OVW (25‐29.9) | OB (30‐39.9) | SevOB (40) | ||
| ||||||
| Age (yr) | 53.4 19.3 | 51.1 18.4 | 51.8 16.9 | 50.4 15.5 | 45.2 13.4 | <0.001 |
| Female | 59.8 | 56.7 | 54.4 | 67.5 | 81.7 | <0.001 |
| Current smoker | 32.1 | 25.6 | 22.1 | 20.4 | 17.1 | <0.001 |
| >2 Drinks/day | 4.1 | 2.7 | 2.2 | 1.6 | 0.7 | <0.001 |
| Hypertension | 41.7 | 38.4 | 44.0 | 51.0 | 56.0 | <0.001 |
| DM (insulin or oral agents) | 12.5 | 13.1 | 16.4 | 22.3 | 26.3 | <0.001 |
| COPD | 7.7 | 3.3 | 2.5 | 2.7 | 2.5 | <0.001 |
| Dyspnea at rest | 10.5 | 7.1 | 7.2 | 9.9 | 20.2 | <0.001 |
| ASA III | 59.0 | 39.5 | 35.6 | 39.8 | 62.2 | <0.001 |
| Emergency surgery | 20.6 | 17.6 | 15.2 | 11.9 | 8.2 | <0.001 |
| Active CHF | 2.2 | 1.3 | 1.1 | 1.1 | 1.1 | <0.001 |
| Recent MI | 1.1 | 0.8 | 0.8 | 0.6 | 0.4 | <0.001 |
| Recent angina | 1.2 | 1.1 | 1.1 | 1.2 | 0.7 | <0.001 |
| Disseminated cancer | 4.3 | 2.5 | 1.6 | 1.3 | 0.6 | <0.001 |
| Recent 10% weight loss | 15.2 | 4.2 | 1.7 | 1.0 | 0.5 | <0.001 |
| Ascites | 4.4 | 2.1 | 1.2 | 0.9 | 0.5 | <0.001 |
| Currently on dialysis | 9.7 | 6.7 | 4.9 | 4.1 | 2.9 | <0.001 |
| Stroke history | 5.6 | 3.5 | 2.9 | 2.6 | 1.3 | <0.001 |
Perioperative outcomes according to BMI classes documented significant differences (Table 3). Work relative value unit (Work RVU, a measure of surgical complexity), as well as total anesthesia and operation time decreased in a stepwise fashion across the BMI classes to the obese group, followed by increase in these parameters in the severely obese group. Following a decrease to the normal BMI category, there was a positive association between BMI and the incidence of postoperative superficial and deep wound infection, as well as wound disruption.
| BMI (kg/m2) Events | Mean SD or (%) | P Value | ||||
|---|---|---|---|---|---|---|
| UW (18.5) | NW (18.5‐24.9) | OVW (25‐29.9) | OB (30‐39.9) | SevOB (40) | ||
| ||||||
| Work RVU | 16.3 9.5 | 14.5 9.1 | 14.0 8.4 | 13.8 7.9 | 17.3 9.1 | <0.001 |
| Anesthesia time (hr) | 2.7 1.9 | 2.5 1.7 | 2.5 1.6 | 2.5 1.6 | 2.7 1.5 | <0.001 |
| Pre‐incision time (min) | 35.9 21.3 | 33.1 21.1 | 33.2 22.5 | 32.5 19.3 | 34.9 21.1 | <0.001 |
| Operation time (hr) | 1.8 1.6 | 1.6 1.4 | 1.7 1.4 | 1.7 1.4 | 1.8 1.2 | <0.001 |
| Transfused intra‐op | 12.8 | 7.1 | 5.3 | 4.4 | 2.9 | <0.001 |
| Superficial wound SSI | 2.9 | 2.5 | 2.6 | 2.8 | 3.1 | <0.001 |
| Deep wound SSI | 1.5 | 0.7 | 0.8 | 0.9 | 1.0 | <0.001 |
| Wound disruption | 1.5 | 0.6 | 0.6 | 0.6 | 0.7 | <0.001 |
| Post‐op sepsis | 5.7 | 2.9 | 2.2 | 2.1 | 2.0 | <0.001 |
| Septic shock | 3.1 | 1.7 | 1.3 | 1.2 | 1.1 | <0.001 |
| Reintubation | 3.8 | 1.8 | 1.2 | 1.0 | 1.0 | <0.001 |
| Delayed ventilator wean | 5.5 | 2.8 | 2.1 | 2.0 | 2.0 | <0.001 |
| Pneumonia | 4.3 | 2.1 | 1.3 | 1.2 | 1.2 | <0.001 |
| Cardiac arrest/CPR | 1.5 | 0.7 | 0.5 | 0.4 | 0.4 | <0.001 |
| Urinary tract infection | 3.4 | 1.8 | 1.5 | 1.6 | 1.6 | <0.001 |
| Post‐op ARF | 2.1 | 1.1 | 0.8 | 0.9 | 0.7 | <0.001 |
| Return to OR | 11.2 | 6.9 | 5.8 | 5.5 | 4.9 | <0.001 |
| Post‐op coma | 0.4 | 0.2 | 0.1 | 0.1 | 0.1 | <0.001 |
| Post‐op transfusion | 1.6 | 0.7 | 0.5 | 0.4 | 0.5 | <0.001 |
| Composite morbidities | 25.2 | 15.3 | 13.0 | 12.8 | 12.1 | <0.001 |
There was a negative association between BMI class and the likelihood of postoperative sepsis, septic shock, reintubation, delayed ventilator wean, and postoperative pneumonia. Similarly, the proportions of patients who developed postoperative acute renal failure, cardiac arrest, and those who required postoperative blood transfusion or needed reoperation, decreased significantly across the BMI classes, with the highest proportion of cases being in the underweight group and the lowest in the severely obese group. Overall composite morbidity was twice as high in the underweight compared to the severely obese group.
There were 1758 deaths among the study's 119,619 patients, resulting in an overall mortality rate of 1.5%. The overall major complication rate was 13.8%. The distribution of total mortality rate as well as mortality in patients with at least 1 major postoperative complication across BMI classes revealed consistent differences (Figure 1). Over the entire range of BMI classes, there was a progressive, stepwise decrease in the proportion of deaths with increasing BMI. This pattern also occurred among patients who developed at least 1 major postoperative complication, indicating a reduced likelihood of death after a major complication. This is reflective of a reduced likelihood of death after a major complication (failure to rescue) with increasing BMI.
Multivariate logistic regression defined a number of factors associated with 30‐day mortality (Table 4). The Hosmer and Lemeshow goodness‐of‐fit test for this model was not statistically significant (2 = 17.8, df = 8, P = 0.23). High ASA physical status was associated with high odds of mortality. Specifically, when controlling for the other covariates in the model, ASA status was associated with a 5‐fold increased relative odds of death (adjusted odds ratio [OR] = 5.30; 95% confidence interval = 4.96‐5.79, P < 0.001). Similarly, occurrence of 1 or more major postoperative complication was associated with 6‐fold increased relative odds of mortality. The paradoxical effect of BMI category observed on univariate analysis was maintained in the multivariate model. Specifically, underweight patients had the highest relative odds of mortality, while severely obese patients had the lowest, compared with patients at a healthy weight (Table 4). Interestingly, smoking had no significant effect on the odds of mortality after controlling for other factors. Similarly, the specific racial group and the timing of the surgical intervention had no significant effect on mortality.
| Variables in the equation | Coefficient () | Wald (2) | P Value | Odds Ratio | 95% CI |
|---|---|---|---|---|---|
| |||||
| ASA status III | 1.67 | 233.0 | <0.001 | 5.31 | 4.96‐5.79 |
| Emergency operation | 0.89 | 241 | <0.001 | 2.43 | 2.17‐2.72 |
| Reoperation | 0.77 | 155.9 | <0.001 | 2.10 | 1.91‐2.44 |
| Reintubation | 0.4 | 51.4 | <0.001 | 1.63 | 1.41‐1.82 |
| Dependent functional status | 1.2 | 422.5 | <0.001 | 3.44 | 3.01‐3.79 |
| Cumulative comorbidity* | 0.09 | 12.37 | <0.001 | 1.18 | 1.03‐1.14 |
| Major POP complication | 1.8 | 686.1 | <0.001 | 6.43 | 5.59‐7.39 |
| Age 65 yr | 0.56 | 95.3 | <0.001 | 1.75 | 1.56‐1.96 |
| Work RVU | 0.17 | 49.7 | <0.001 | 1.02 | 1.01‐1.02 |
| Severely obese | Reference | 1.00 | |||
| Underweight | 0.76 | 30.9 | <0.001 | 2.13 | 1.63‐2.78 |
| Normal BMI | 0.42 | 15.4 | <0.001 | 1.52 | 1.23‐1.87 |
| Overweight | 0.28 | 6.9 | 0.009 | 1.33 | 1.08‐1.65 |
| Obese | 0.19 | 2.86 | 0.091 | 1.20 | 0.97‐1.49 |
| Dyspnea | 0.41 | 40.0 | <0.001 | 1.51 | 1.33‐1.72 |
| Active CHF | 0.60 | 39.6 | <0.001 | 1.83 | 1.52‐2.21 |
| Chronic renal failure (dialysis) | 0.70 | 102.2 | <0.001 | 2.01 | 1.76‐2.30 |
DISCUSSION
In this large, study of minority surgical patients, the impact of BMI on the 30‐day morbidity and mortality was unexpected. The working hypothesis was that overweight and obese patients would have a worse outcome after surgery. However, contrary to this hypothesis, the lowest all‐cause mortality rate was found in the severely obese (BMI 40 kg/m2) group in both men and women. Death rates decreased progressively in a stepwise fashion from the underweight to the severely obese group. Similarly, even in patients who developed at least 1 major postoperative complication, the likelihood of death was still negatively associated with BMI. This negative association of mortality with BMI was observed despite the higher prevalence of chronic diseases, such as hypertension, diabetes, and dyspnea at rest, in the increasing BMI classes.
Controversy remains regarding the association between BMI and mortality, in particular about the shape of the curve for the association between BMI and mortality. Epidemiologic studies have variously described J‐shaped, U‐shaped, monotonic, or linear relationships.16, 17 In the surgical population, a reverse J‐shaped relationship between BMI category and mortality has been described.18, 19 Sometimes this is referred to as obesity paradox or reverse epidemiology: a trend whereby overweight and moderately obese patients have better outcomes and lower risk of death than leaner patients.18 This phenomenon is particularly well described in adult20 and elderly heart failure and hypertensive patients.21 Many of these studies either had very few minority patients,21 or mortality pattern was not analyzed along ethnic lines.
Few studies10 have focused exclusively on minority surgical patients. Some investigators have determined that high BMI in black adults may not be as important a risk factor for mortality6, 7 as in whites. Our data suggest that among minority surgical patients, the relationship appeared to be a downward trend in mortality from low to high BMI, thus revealing the obesity paradox. This pattern was evident even in patients who developed 1 major complication in the postoperative period, suggesting that high BMI also protects against failure to rescueor death after a major complication.
Despite decades of research, the mechanisms underlying the obesity paradox remain speculative.20, 22. Many have posited that adiposity may confer protection against cytokines and various inflammatory mediators in heart failure patients by the production of buffering lipoproteins.23, 24 It is conceivable that similar protection against inflammatory response to surgical tissue trauma is operational in minority patients with high BMI. Another possible reason for the obesity paradox is the clinical presentation and disease progression at the time of surgery. Perhaps, similar to the observation in obese patients with heart failure,25 obese minority patients are symptomatic at an earlier stage of their disease than lean patients, making for earlier diagnosis and treatment. Thus, obesity may simply be a marker of less severe disease at the time of presentation.
Obese patients may also be more aggressively monitored and treated in the perioperative period than lean patients, because of the general perception that they are a high‐risk group.10 This may partly explain the decreased likelihood of failure to rescue with increasing BMI in our patients. Increased vigilance and prompt treatment of complications should reduce the overall morbidity and mortality rate in this group. It is also conceivable that a therapeutic selection bias is operational in the patients we studied. This describes scenarios where relatively healthy obese minority patients were operated upon, while sicker, morbidly obese patients were denied surgery due to perceived prohibitive risks. However, we would have expected a higher proportion of severely obese patients to present for emergency surgery, which is contrary to our finding of the lowest incidence of emergency surgery in the severely obese group. It is also possible that severe obesity may be associated with a higher attrition rate, such that the extremely obese patients did not live long enough to present for surgery. This is somewhat likely, given the significantly younger age of the severely obese patients in our study cohort. It is, however, impossible to determine survival effect from a cross‐sectional hospital‐based study design. Clearly, mechanisms used to explain the obesity paradox in minority surgical patients are likely to remain speculative, owing to the interaction of several factors such as concomitant comorbidities, disease progression at the time of presentation, patients' weight history, and regional fat distribution.
The current study confirms the findings of previous investigators26 about the importance of reducing major postoperative complications in surgical patients. While this may seem axiomatic, it deserves reiteration because the risk of postoperative mortality increases considerably in all the BMI categories following 1 or more major postoperative complication. However, it is not clear why obese and morbidly obese patients had a lower incidence of failure to rescue. This may be related to greater physiologic reserve in the obese and morbidly obese group, especially because patients in the higher BMI groups were significantly younger than the normal weight or lean patients. For the same reason, these younger, severely obese patients may have been more aggressively monitored and treated, thereby increasing the likelihood of being rescued following a major complication. It is also possible that the lower proportion of emergency procedures performed in obese and severely obese groups was somewhat protective, especially because emergency surgery was an independent predictor of overall mortality in this cohort of patients. In fact, when we stratified the patients according to urgency of surgery and explored the bivariate relationship between BMI category and mortality (data not shown) among those undergoing urgent surgery, the geometrical distribution of mortality did show a reverse‐J pattern with the highest proportion of cases in the underweight group, declining in the normal BMI and overweight group, and increasing steadily in obese and severely obese group. To this end, caution should be exercised when interpreting the association of BMI group with postoperative mortality for procedures performed as an emergency.
Smoking and antecedent illness are 2 confounding factors commonly criticized in studies attempting to associated BMI with mortality. This is because smokers tend to weigh less and have higher mortality rates than nonsmokers. The present investigation did not find a significant contribution of smoking to mortality when other factors included in a logistic regression model were considered. The current study's findings are consistent with those of previous data in African American patients,27 and contrasts with the excess mortality described in currently smoking Caucasian men and women.28 It is possible that smoking is not an important effect modifier when considering the relevance of BMI to postoperative mortality in minority patients.
Study Limitations
Although considerable information on several perioperative variables existed, there was a lack of detailed, disease‐specific clinical information for the individual surgical procedures. Likewise, information was unavailable regarding the process of care, such as decision to operate, when to operate, and intraoperative and the postoperative care, which are some of the factors that may determine postoperative outcome. Similarly, we did not have information on surgical experience or hospital caseload, both of which are known to affect postoperative outcome.29
In addition, the anthropometric parameters used to calculate BMI for this study are self‐reported values. Although directly measured height and weight values are preferable for calculating BMI, previous studies have shown that correlations between BMI based on measured height and weight and that based on self‐report are typically greater than 0.9.30 Given the reported strong correlation between self‐reported and measured anthropometric parameters, the reporting error on the observed association between BMI and mortality in our study is likely minimal. The limitations of BMI as a measure of adiposity is well described.31, 32 This study had no information on body fat distribution, which has been shown to have a direct correlation with mortality when BMI did not.33 Additionally, documented weight may be less accurate in the extremely obese group in that they may not have been weighed, either at home or in the hospital, due to lack of adequate weighing scales.
Conclusions
This study demonstrated that among minority surgical patients, higher BMI categories were associated with lower risk of postoperative death. This relationship was maintained, even in patients who developed 1 or more postoperative major complications, such that obese and severely obese patients had better survival compared with underweight and healthy weight patients. Mechanisms underlying this paradoxical survival advantage deserve further elucidation. It is important to emphasize that our findings in no way diminish the long‐term dangers associated with excessive adiposity, but may serve to discard the preconceived notions that overweight and obese minority patients have poorer outcome after surgery than lean patients.
- ,,,.Increasing trends in waist circumference and abdominal obesity among US adults.Obesity.2007;15:216–224.
- ,,,,,.Prevalence of overweight and obesity in the United States, 1999–2004.JAMA.2006;295:1549–1555.
- ,,,,.Ethnic disparities in stroke epidemiology, acute care, and post‐acute outcomes.Stroke.2005;36:374–387.
- ,,,,,.Body mass index and body girths as predictors of mortality in black and white women.Arch Intern Med.1992;152:1257–1262.
- ,,,,,.Relative weight and mortality in U.S. blacks and whites: findings from representative national population samples.Ann Epidemiol.1997;7:383–395.
- ,,,,.Body‐mass index and mortality in a prospective cohort of U.S. adults.N Engl J Med.1999;341:1097–1105.
- ,,, et al.Body mass index and body girths as predictors of mortality in black and white men.Am J Epidemiol.1992;135:1137–1146.
- ,,.Morbidity in obese and non‐obese patients following gynecologic surgery for cancer.J Natl Med Assoc.1988;80:417–420.
- ,,, et al.The influence of obesity on perioperative morbidity: retrospective study of 502 aorto‐coronary bypass operations.Thorac Cardiovasc Surg.1992;40:126–129.
- ,,,,.The impact of high body mass index on postoperative complications and resource utilization in minority patients.J Natl Med Assoc.2011;103:9–15.
- ,,, et al.The patient safety in surgery study: background, study design, and patient populations.J Am Coll Surg.2007;204:1089–1102.
- ,,, et al.The assessment of the reliability of data collected for the Department of Veterans Affairs' National Surgical Quality Improvement Program (NSQIP).J Am Coll Surg.2007;204:550–560.
- Expert Panel on the Identification, Evaluation, and Treatment of Overweight in Adults. Clinical guidelines on the identification, evaluation, and treatment of overweight and obesity in adults: executive summary.Am J Clin Nutr.1998;68:899–917.
- ,,,.Hospital and patient characteristics associated with death after surgery: a study of adverse occurrence and failure to rescue.Med Care.1992;30:615–629.
- ,,,.Multivariate Data Analysis.5th ed.London:Prentice Hall International;1998.
- ,,,,,.Estimating the number of deaths due to obesity: can the divergent findings be reconciled?J Women's Health.2007;16(2):168–176.
- ,,, et al.Body mass index and mortality among US male physicians.Ann Epidemiol.2004;14/10:731–739.
- ,,.The obesity paradox: body mass index and outcomes in patients undergoing non‐bariatric general surgery.Ann Surg.2009;250:166–172.
- ,,,,,.The influence of body mass index obesity status on vascular surgery 30‐day morbidity and mortality.J Vasc Surg.2009;49:140–147.
- ,,, et al.Risk factor paradox in wasting diseases.Curr Opin Clin Nutr Metab Care.2007;10:433–442.
- ,,, et al.The relationship between obesity and mortality in patients with heart failure.J Am Coll Cardiol.2001;38:789–795.
- ,.Reverse epidemiology beyond dialysis patients: chronic heart failure, geriatrics, rheumatoid arthritis, COPD, and AIDS.Semin Dial.2007;20:549–553.
- ,,.The endotoxin‐lipoprotein hypothesis.Lancet.2000;356:930–933.
- ,,, et al.Adiponectin and cardiovascular disease: state of the art?Am J Physiol Heart Circ Physiol.2007;292:H1655–H1663.
- ,,,.Body composition and prognosis in chronic systolic heart failure: the obesity paradox.Am J Cardiol.2003;91:891–894.
- ,,.Variation in hospital mortality associated with inpatient surgery.N Engl J Med.2009;361:1368–1375.
- ,,.Body mass index and 15‐year mortality in a cohort of black men and women.J Clin Epidemiol.1990;43:949–960.
- ,,.Thinness and mortality.Am J Public Health.1987;77:317–322.
- ,,.Operative mortality and procedure volume as predictors of subsequent hospital performance.Ann Surg.2006;243:411–417.
- .Nutritional Epidemiology.2nd ed.Monographs in Epidemiology and Biostatistics; vol30.New York:Oxford University Press,1998:514.
- ,,, et al.Association of general and abdominal obesity with multiple health outcomes in older women: the Iowa Women's Health study.Arch Intern Med.2000;160:2117–2128.
- ,,.Does body mass index adequately capture the relation of body composition and body size to health outcomes?Am J Epidemiol.1998;147:167–172.
- ,,,.Intra‐abdominal adiposity, abdominal obesity, and cardio‐metabolic risk.Eur Heart J Suppl.2008;10(suppl B):B4–10.
Copyright © 2011 Society of Hospital Medicine

Incident Database
Recognition that healthcare carries considerable risks of patient injury has focused efforts on identifying problems before they occur, and understanding the root causes of those problems that do occur to prevent them from happening again.1 To further these efforts, a Joint Commission (JC) standard requires hospitals to review sentinel events (SE).2 Reviews must develop a timely, thorough, and credible root cause analysis (RCA), implement action plans to reduce risk, and monitor the effectiveness of implemented improvements.3
Ideally, hospitals would summarize their experiences with SE reviews, identify high‐risk activities and patients, institute system changes to prevent SE recurrences, and share their findings with other healthcare organizations to help them avoid similar patient injuries.1 In support of this last goal, the JC maintains a voluntary database system that allows hospitals to report their SE analyses for other facilities to review and institute preventative actions.
Unfortunately, the reality of SE reviews does not match their ideals for improving patient safety.4 Healthcare organizations often describe their review process as less than credible and note a need for ongoing oversight to maintain the reviews' effectiveness.5 The JC voluntary reporting system captures less than 1% of the SEs that occur nationally,2 because hospitals perceive barriers to external reporting.1 If healthcare organizations decide against reporting externally, they can create their own internal systems to aggregate and summarize SEs, but few such systems exist. A major impediment to designing internal systems is the absence of universally endorsed nomenclature for safety‐related events.6, 7 Poorly aligned terminology and subjective conceptualizations for safety incidents impede the aggregation of SEs, comparisons between facilities, and trend analyses for tracking SE patterns.
In 2005, the World Health Organization (WHO) World Alliance for Patient Safety, in collaboration with the JC, began developing an International Classification for Patient Safety (ICPS) to provide healthcare organizations a consistent conceptual model for safety incidents and promote their classification by a standardized taxonomy.810 Although this system has promise for allowing standardization, data aggregation, analysis, and learning between institutions,11 integration of the ICPS conceptual model into an SE decision support tool with summarizing and reporting features has not been reported.
This report describes our development of an intranet‐based SE reporting system, called Incident Tracker (I‐Tracker), based on the ICPS model. For our SE review groups from the 4 Providence Health Systems (PHS) Portland Service Area (PSA) hospitals, the I‐Tracker system offers a tool to guide efforts in developing RCAs and action plans in alignment with the ICPS framework. The system includes scripts that automatically generate and distribute standardized reports of individual and aggregated SEs. The objectives of this project were to report our experience with developing a flexible and accessible intranet‐based system that assists RCA participants in conforming to the ICPS framework and oversight safety staff in summarizing and reporting root cause analyses.
METHODS
The 4 PSA hospitals have 1083 licensed beds and perform SE reviews with a centralized process that reports results to a Community Governing Board. An ad hoc team for each SE performs the RCAs. The SE groups report RCAs and action plans in an unstructured format that varies for each event. A paper file is maintained for each SE report, but a system for aggregating reports to track trends, disseminating SE trends, or monitoring the completion or effectiveness of action plans is not available.
We designed a system to achieve the following objectives:
-
Apply the ICPS framework (Figure 1) and taxonomy of terms to SE analyses;
-
Provide a computer‐based tool to assist review groups and quality staff to perform their SE reviews and data collection in alignment with the ICPS framework;
-
Create an intranet‐based database that captures elements of the reviews, RCAs, and action plans with the use of drop‐down lists, help windows, windows with live access to Internet educational resources and tools, decision support tools, default entries, and audio prompts to streamline data entry;
-
Generate a suite of standardized reports customized for different audiences that can be accessed online and printed from the database with automated scripts;
-
Produce intranet‐based summaries of aggregated events to identify common causes and disseminate observed patterns and action plans to other PSA hospitals.
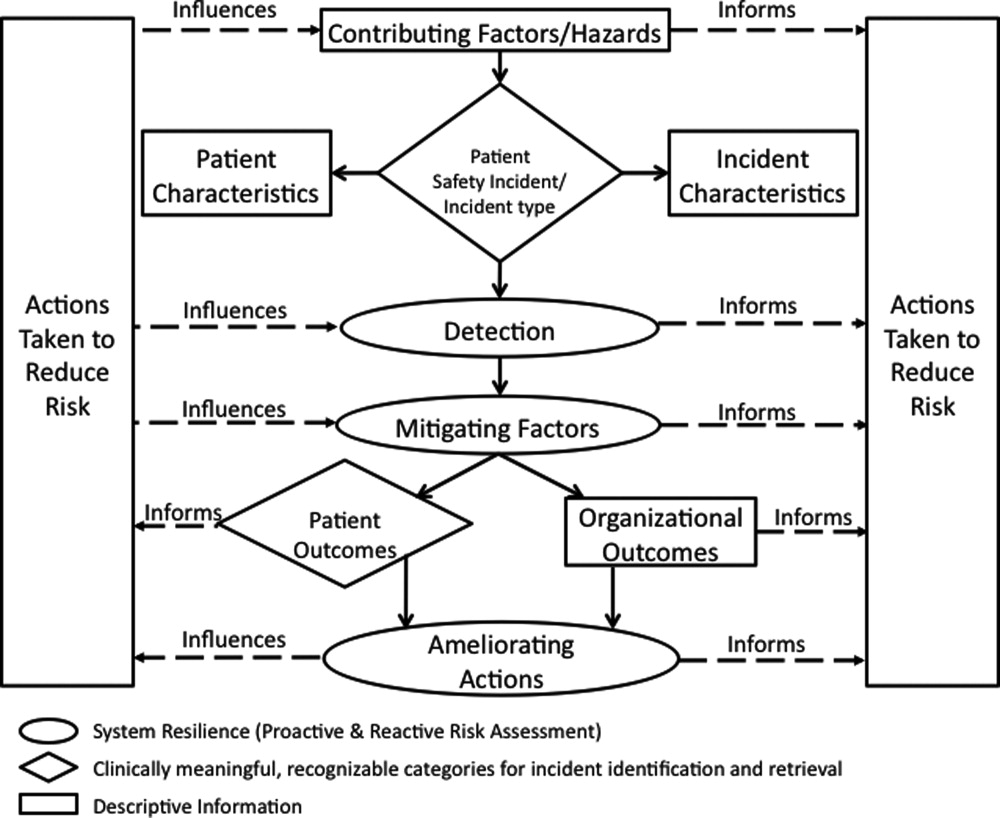
We selected FileMaker Pro 11 Advanced (FMP11) for authoring and maintaining the decision support tool and database, and FileMaker Pro Server 11 Advanced (FMPS11) (Filemaker, Inc, Santa Clara, CA) for hosting the system, because it provides intranet access and tools for updating the system by personnel with minimal programming experience. End users can view and enter data through layouts that display only the information allowed by the user's login password and access privileges, with external authentication by Active Directory and Open Directory technology. Staff who author and manage the database do so through client FMP11 software loaded on a computer that provides remote server access.
The I‐Tracker system was authored using the ICPS definitions for the 48 preferred terms for safety incidents and the ICPS conceptual framework.8 The conceptual framework consists of 10 major incident domains, that include incident type, patient outcomes, patient characteristics, incident characteristics, contributing factors and hazards, organizational outcomes, detection, mitigating factors, ameliorating actions, and actions taken to reduce risk (Figure 1).11 The framework is applicable to all hospital safety incidents, but we limited I‐Tracker to SEs because our hospitals had completed comprehensive reviews and action plans only for these more serious events. The literature on the ICPS framework812 was carefully reviewed to identify the specific data fields that were recommended by ICPS developers to be included under each of the 10 major classification domains. In most instances, data fields existed only in the body of these reports. Article texts, however, provided sufficient descriptions of these data fields to allow their translation into data entry fields in I‐Tracker with accompanying help windows and explanations to guide I‐Tracker users. Sixty ICPS data fields were programmed into I‐Tracker, with another 120 fields that allowed entry of descriptions and explanations of the ICPS data field entries. For instance, an entry of Yes into an ICPS data field that queried Was there a systems problem of an external organization other than a Providence entity opens a Describe field that allows a brief description of the problem, and an additional Details field that allows a longer explanation of the problem if necessary. The brief Describe field contents populate an automatically generated fishbone diagram.
The authors and quality staff translated the most recent 15 SE reviews into ICPS terms and classifications, and entered the results into I‐Tracker as it was being developed, to assist system design and programming of the system. The authors noted during data entry which of the 10 ICPS major domains had not been analyzed by the previous 15 reviews. Because existing reports were unstructured with considerable variation in style and usage of terms, the authors and quality staff made group decisions regarding how to cross‐walk existing information into the standardized ICPS data fields.
RESULTS
In developing I‐Tracker, the authors and quality staff observed that the ICPS framework and recommended data fields were logical and straightforward to learn. Although it was difficult to find the definitions of specific ICPS data fields within the 10 major domains in the text of retrieved articles, these fields could be readily cross‐walked into I‐Tracker data entry fields. Translating existing SE reports into I‐Tracker classifications, however, presented considerable challenges because of the unstructured, discursive, and variable nature of our SE review and reports. The authors and staff spent 1 to 2 hours conferring over each report to make judgments as to which elements of the review would be entered into which I‐Tracker data fields. Once the authors and staff translated existing reports into ICPS terms, actual data entry into I‐Tracker took typically less than 30 minutes for each review. We found that none of our 15 SE reviews included information on the following ICPS major domains: detection, mitigating factors, and ameliorating actions. We also observed that many ICPS data fields were not assessed, such as patient contributions to errors and external organization's contributions to a safety incident.
The latest version of I‐Tracker receives and displays information at the individual patient level. Records are shown onscreen with different screen layouts depending on the viewer's login security clearance. Hospital safety staff have full access to view and enter data on the initial layout, which displays patient demographic information and folder tabs that navigate when clicked to other database fields (Figure 2). Viewers with lower security clearance either view the same opening screen, but have limited access to other screens, or view a different opening screen designed to meet their specific needs. All screens provide definitions of terms and information to assist data entry, buttons that navigate to help pages, pop‐up windows that provide tips, and buttons that trigger brief audio explanations. Most fields use drop‐down lists to standardize data entry around the ICPS definitions, with default values entered into many fields to streamline data entry. A list view allows review of all patients and quick access to an individual patient's record. All fields and combinations of fields with Boolean rules are searchable within the database.
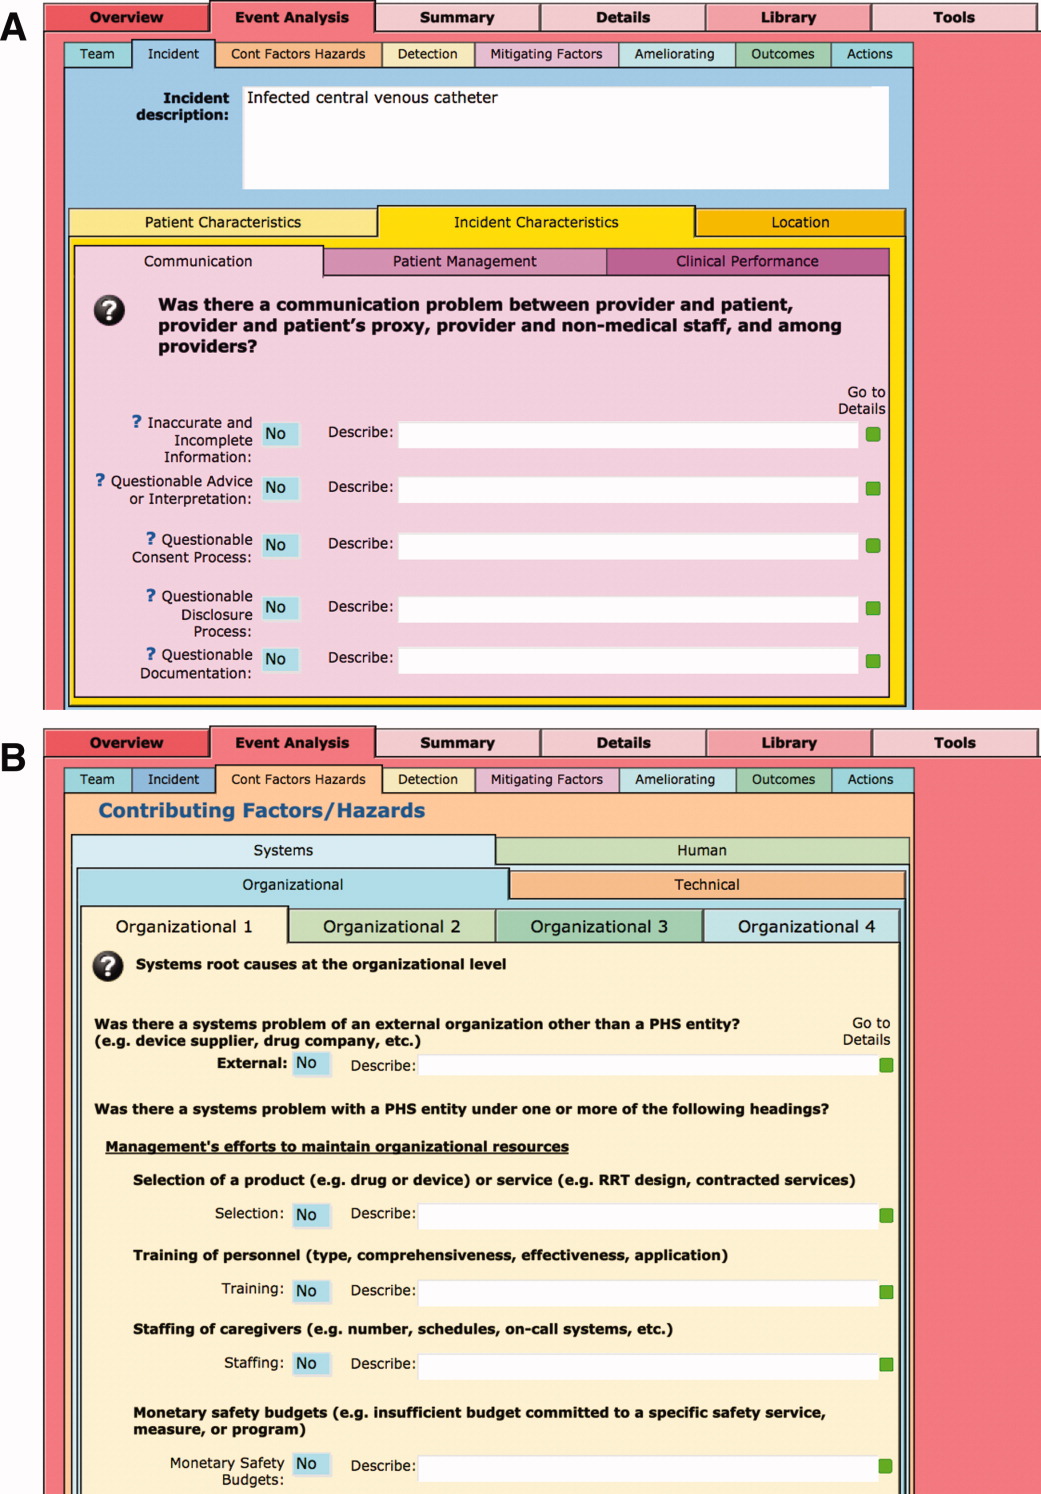
I‐Tracker has features that support SE review groups in beginning an SE review by providing them a paper form or electronic interface by way of a portable computer or tablet device, that guides their discussions and analyses toward providing conclusions that can be entered into the database fields, thereby aligning their deliberations with the ICPS conceptual framework. The same resource is available within the database online for those groups who would prefer to use computer prompts and enter data directly into the database as they proceed through their analyses. Some layouts contain windows that port live views from external Web sites (eg, JC RCA resources) that provide participants of RCA groups with tools to assist their work. FMP11 allows users to access the database by portable computers or handheld tablet devices using the hospitals' WiFi network.
A report screen allows automatic generation of different printouts of individual or aggregate summary reports. A Comprehensive Report includes all of the data fields included in the ICPS conceptual framework. Other reports present subsets of data depending on the user's needs and access privileges. The FMPS11 database allows printing the reports to paper or Portable Document Format (pdf), exporting data into an Excel spreadsheet, or e‐mailing reports to recipients from within I‐Tracker.
Additionally, I‐Tracker functionality facilitates follow‐up and monitoring of action items developed during the RCA process in a manner that conforms to the ICPS framework. We are now developing educational resources for RCA team members to investigate the implementation of I‐Tracker into future RCAs.
DISCUSSION
I‐Tracker provides an intranet‐based tool that met the objectives of the present project. The process of entering 15 existing SE reviews and action plans from our healthcare system into I‐Tracker allowed an incremental development of the database and identified gaps in our existing RCA process. For instance, none of the previous RCAs critically appraised detection, mitigating factors, or ameliorating actions; defined the specific nature or quantified severity of patient injuries using standardized terms; distinguished between human errors and negligence; or comprehensively reported the full spectrum of underlying causes of Tracker's use of standardized terms based on the ICPS conceptual framework provided a potential resource for focusing SE reviews and producing more comprehensive RCAs and action plans in the future. I‐Tracker has additional potential to facilitate dissemination of RCAs to other facilities, both as individual incident reports and aggregated summaries as recommended by experts in patient safety.13
The deficiencies in our existing RCA analyses, identified during data entry into I‐Tracker, represent common shortcomings experienced by other healthcare organizations and summarized in a report by the Agency for Healthcare Research and Quality.4 Considerable hindsight bias and prevailing concerns of the day taint the RCA process, which is time‐consuming and labor intensive, and thereby hinders comprehensive reviews. Also, our SE reviews, like others reviewed in the literature,14 focused on biologic injury to patients and omitted assessment of psychologic, organizational, social, and economic injury domains. Although SE review teams benefit from involvement of quality improvement staff who are trained in techniques and goals of RCA,15 many hospitals like ours have limited resources for fully staffing all SE reviews with trained facilitators. These SE reviews generate both quantitative and qualitative data, the latter of which hinders standardized data entry in the absence of a conceptual framework. A structured database with formative tools to guide RCAs in conformance with the ICPS framework in organizations without sufficient numbers of trained facilitators offers opportunities to produce more comprehensive, standardized, and actionable reports. To date, our quality staff and leadership have responded positively to presentations of the functional features of I‐Tracker (Table 1).
|
| Online availability of the system that allows access both from client database software loaded on Quality Office computers and through intranet browser software (Explorer, Safari, Firefox, etc) |
| Security features of encrypted software that allow full or limited views depending on the user's password security clearance and purpose for reviewing data |
| Software accessibility in authoring and managing the database, which do not require support from information technology data analysts |
| Decision support tools provided in the system to assist RCA analysis |
| System flexibility that allows scripted reporting of single SEs or multiple SE summaries within any selected timeframe |
Limitations of our report include its focus solely on the development and programming phase of I‐Tracker and the absence of information on its actual implementation. We believe, however, the development phase is important to report because it demonstrates that the ICPS framework and specific ICPS data fields are amenable to incorporation into a decision support and reporting tool, which to our knowledge has not been previously reported. We begin implementation of I‐Tracker within our organization this year and will have observations on its feasibility, acceptability, and staff training needs. As an additional limitation, we emphasize that we do not propose I‐Tracker as a solution for other organizations, because we have no plans for its commercial or public domain development. This report is intended to demonstrate, however, that commercially available software, such as FileMaker, can readily support the ICPS Framework and thereby has potential to assist RCAs and SE reporting. Other organizations may develop similar systems on other database platforms that incorporate the ICPS system into their reviews.
To implement I‐Tracker, we are now working with nursing and pharmacy leadership focus groups to develop formative tools, data collection forms, and other resources to assist their RCA efforts and data entry into the database. We also plan to apply the database tool to our residency training program to promote resident involvement in SE reviews by providing standardized, reproducible, and structured processes.16 Our 5‐state healthcare system has funded an evaluation of the implementation phase of I‐Tracker to other Providence facilities. Because the ICPS framework applies to all safety incidents beyond SEs (Table 2), a successful implementation of I‐Tracker for SEs will allow its eventual application to other types of critical incidents.
|
| Clinical administration |
| Clinical process/procedure |
| Documentation |
| Healthcare‐associated infection |
| Medication/IV fluids |
| Blood/blood products |
| Nutrition |
| Oxygen/gas/vapor |
| Medical device/equipment |
| Behavior |
| Patient accidents |
| Infrastructure/building/fixtures |
| Resources/organizational management |
The strength of this project derives from its innovative development of an intranet‐based tool that allows groups to conform their RCAs to the ICPS framework. Because the absence of a standardized classification for patient safety concepts has hindered advances in patient safety,11 we believe I‐Tracker, or decision support tools like it that use the ICPS framework, can standardize RCAs and promote dissemination and adoption of action plans.
Acknowledgements
We appreciate the support of Judy Stenstrom, Lynette Savage, and the Portland Service Area Quality Improvement Office.
- .Reporting of adverse events.N Engl J Med.2002;347:1633–1638.
- The Joint Commission's Sentinel Event Policy: ten years of improving the quality and safety of health care.Jt Comm Perspect.2005;25(1):3–5.
- ,.Root cause analysis and nursing management responsibilities in wrong‐site surgery.Dimens Crit Care Nurs.2006;25,221–225.
- ,.Root Cause Analysis.Making Health Care Safer. Available at: http://archive.ahrq.gov/clinic/ptsafety/chap5.htm. Accessed May 21,2010.
- Oversight group holds RCA teams accountable.Healthcare Benchmarks Qual Improv.2008;15:117–118.
- .Shared meanings: preferred terms and definitions for safety and quality concepts.Med J Aust.2006;184:S41–S43.
- ,,.What do family physicians consider an error? A comparison of definitions and physician perception.BMC Fam Pract.2006;7:73.
- ,,,,,.Towards an International Classification for Patient Safety: key concepts and terms.Int J Qual Health Care.2009;21:18–26.
- ,,,,.The JCAHO patient safety event taxonomy: a standardized terminology and classification schema for near misses and adverse events.Int J Qual Health Care.2005;17:95–105.
- World Health Organization. 2009 Conceptual Framework for the International Classification for Patient Safety. Final Technical Report Version 1.1. Available at: http://www.who.int/patientsafety/taxonomy/icps_full_report.pdf. Accessed April 25,2011.
- ,,, et al.Towards an International Classification for Patient Safety: the conceptual framework.Int J Qual Health Care.2009;21:2–8.
- ,,,,,.Towards an International Classification for Patient Safety: a Delphi survey.Int J Qual Health Care.2009;21:9–17.
- ,,.Effectiveness and efficiency of root cause analysis in medicine.JAMA.2008;299:685–687.
- ,,,,.How can clinicians measure safety and quality in acute care?Lancet.2004;363:1061–1067.
- ,,,,.Systematic root cause analysis of adverse drug events in a tertiary referral hospital.Jt Comm J Qual Improv.2000;26:563–575.
- ,,,,,.Educational quality improvement report: outcomes from a revised morbidity and mortality format that emphasised patient safety.Postgrad Med J.2008;84:211–216.
Recognition that healthcare carries considerable risks of patient injury has focused efforts on identifying problems before they occur, and understanding the root causes of those problems that do occur to prevent them from happening again.1 To further these efforts, a Joint Commission (JC) standard requires hospitals to review sentinel events (SE).2 Reviews must develop a timely, thorough, and credible root cause analysis (RCA), implement action plans to reduce risk, and monitor the effectiveness of implemented improvements.3
Ideally, hospitals would summarize their experiences with SE reviews, identify high‐risk activities and patients, institute system changes to prevent SE recurrences, and share their findings with other healthcare organizations to help them avoid similar patient injuries.1 In support of this last goal, the JC maintains a voluntary database system that allows hospitals to report their SE analyses for other facilities to review and institute preventative actions.
Unfortunately, the reality of SE reviews does not match their ideals for improving patient safety.4 Healthcare organizations often describe their review process as less than credible and note a need for ongoing oversight to maintain the reviews' effectiveness.5 The JC voluntary reporting system captures less than 1% of the SEs that occur nationally,2 because hospitals perceive barriers to external reporting.1 If healthcare organizations decide against reporting externally, they can create their own internal systems to aggregate and summarize SEs, but few such systems exist. A major impediment to designing internal systems is the absence of universally endorsed nomenclature for safety‐related events.6, 7 Poorly aligned terminology and subjective conceptualizations for safety incidents impede the aggregation of SEs, comparisons between facilities, and trend analyses for tracking SE patterns.
In 2005, the World Health Organization (WHO) World Alliance for Patient Safety, in collaboration with the JC, began developing an International Classification for Patient Safety (ICPS) to provide healthcare organizations a consistent conceptual model for safety incidents and promote their classification by a standardized taxonomy.810 Although this system has promise for allowing standardization, data aggregation, analysis, and learning between institutions,11 integration of the ICPS conceptual model into an SE decision support tool with summarizing and reporting features has not been reported.
This report describes our development of an intranet‐based SE reporting system, called Incident Tracker (I‐Tracker), based on the ICPS model. For our SE review groups from the 4 Providence Health Systems (PHS) Portland Service Area (PSA) hospitals, the I‐Tracker system offers a tool to guide efforts in developing RCAs and action plans in alignment with the ICPS framework. The system includes scripts that automatically generate and distribute standardized reports of individual and aggregated SEs. The objectives of this project were to report our experience with developing a flexible and accessible intranet‐based system that assists RCA participants in conforming to the ICPS framework and oversight safety staff in summarizing and reporting root cause analyses.
METHODS
The 4 PSA hospitals have 1083 licensed beds and perform SE reviews with a centralized process that reports results to a Community Governing Board. An ad hoc team for each SE performs the RCAs. The SE groups report RCAs and action plans in an unstructured format that varies for each event. A paper file is maintained for each SE report, but a system for aggregating reports to track trends, disseminating SE trends, or monitoring the completion or effectiveness of action plans is not available.
We designed a system to achieve the following objectives:
-
Apply the ICPS framework (Figure 1) and taxonomy of terms to SE analyses;
-
Provide a computer‐based tool to assist review groups and quality staff to perform their SE reviews and data collection in alignment with the ICPS framework;
-
Create an intranet‐based database that captures elements of the reviews, RCAs, and action plans with the use of drop‐down lists, help windows, windows with live access to Internet educational resources and tools, decision support tools, default entries, and audio prompts to streamline data entry;
-
Generate a suite of standardized reports customized for different audiences that can be accessed online and printed from the database with automated scripts;
-
Produce intranet‐based summaries of aggregated events to identify common causes and disseminate observed patterns and action plans to other PSA hospitals.
We selected FileMaker Pro 11 Advanced (FMP11) for authoring and maintaining the decision support tool and database, and FileMaker Pro Server 11 Advanced (FMPS11) (Filemaker, Inc, Santa Clara, CA) for hosting the system, because it provides intranet access and tools for updating the system by personnel with minimal programming experience. End users can view and enter data through layouts that display only the information allowed by the user's login password and access privileges, with external authentication by Active Directory and Open Directory technology. Staff who author and manage the database do so through client FMP11 software loaded on a computer that provides remote server access.
The I‐Tracker system was authored using the ICPS definitions for the 48 preferred terms for safety incidents and the ICPS conceptual framework.8 The conceptual framework consists of 10 major incident domains, that include incident type, patient outcomes, patient characteristics, incident characteristics, contributing factors and hazards, organizational outcomes, detection, mitigating factors, ameliorating actions, and actions taken to reduce risk (Figure 1).11 The framework is applicable to all hospital safety incidents, but we limited I‐Tracker to SEs because our hospitals had completed comprehensive reviews and action plans only for these more serious events. The literature on the ICPS framework812 was carefully reviewed to identify the specific data fields that were recommended by ICPS developers to be included under each of the 10 major classification domains. In most instances, data fields existed only in the body of these reports. Article texts, however, provided sufficient descriptions of these data fields to allow their translation into data entry fields in I‐Tracker with accompanying help windows and explanations to guide I‐Tracker users. Sixty ICPS data fields were programmed into I‐Tracker, with another 120 fields that allowed entry of descriptions and explanations of the ICPS data field entries. For instance, an entry of Yes into an ICPS data field that queried Was there a systems problem of an external organization other than a Providence entity opens a Describe field that allows a brief description of the problem, and an additional Details field that allows a longer explanation of the problem if necessary. The brief Describe field contents populate an automatically generated fishbone diagram.
The authors and quality staff translated the most recent 15 SE reviews into ICPS terms and classifications, and entered the results into I‐Tracker as it was being developed, to assist system design and programming of the system. The authors noted during data entry which of the 10 ICPS major domains had not been analyzed by the previous 15 reviews. Because existing reports were unstructured with considerable variation in style and usage of terms, the authors and quality staff made group decisions regarding how to cross‐walk existing information into the standardized ICPS data fields.
RESULTS
In developing I‐Tracker, the authors and quality staff observed that the ICPS framework and recommended data fields were logical and straightforward to learn. Although it was difficult to find the definitions of specific ICPS data fields within the 10 major domains in the text of retrieved articles, these fields could be readily cross‐walked into I‐Tracker data entry fields. Translating existing SE reports into I‐Tracker classifications, however, presented considerable challenges because of the unstructured, discursive, and variable nature of our SE review and reports. The authors and staff spent 1 to 2 hours conferring over each report to make judgments as to which elements of the review would be entered into which I‐Tracker data fields. Once the authors and staff translated existing reports into ICPS terms, actual data entry into I‐Tracker took typically less than 30 minutes for each review. We found that none of our 15 SE reviews included information on the following ICPS major domains: detection, mitigating factors, and ameliorating actions. We also observed that many ICPS data fields were not assessed, such as patient contributions to errors and external organization's contributions to a safety incident.
The latest version of I‐Tracker receives and displays information at the individual patient level. Records are shown onscreen with different screen layouts depending on the viewer's login security clearance. Hospital safety staff have full access to view and enter data on the initial layout, which displays patient demographic information and folder tabs that navigate when clicked to other database fields (Figure 2). Viewers with lower security clearance either view the same opening screen, but have limited access to other screens, or view a different opening screen designed to meet their specific needs. All screens provide definitions of terms and information to assist data entry, buttons that navigate to help pages, pop‐up windows that provide tips, and buttons that trigger brief audio explanations. Most fields use drop‐down lists to standardize data entry around the ICPS definitions, with default values entered into many fields to streamline data entry. A list view allows review of all patients and quick access to an individual patient's record. All fields and combinations of fields with Boolean rules are searchable within the database.
I‐Tracker has features that support SE review groups in beginning an SE review by providing them a paper form or electronic interface by way of a portable computer or tablet device, that guides their discussions and analyses toward providing conclusions that can be entered into the database fields, thereby aligning their deliberations with the ICPS conceptual framework. The same resource is available within the database online for those groups who would prefer to use computer prompts and enter data directly into the database as they proceed through their analyses. Some layouts contain windows that port live views from external Web sites (eg, JC RCA resources) that provide participants of RCA groups with tools to assist their work. FMP11 allows users to access the database by portable computers or handheld tablet devices using the hospitals' WiFi network.
A report screen allows automatic generation of different printouts of individual or aggregate summary reports. A Comprehensive Report includes all of the data fields included in the ICPS conceptual framework. Other reports present subsets of data depending on the user's needs and access privileges. The FMPS11 database allows printing the reports to paper or Portable Document Format (pdf), exporting data into an Excel spreadsheet, or e‐mailing reports to recipients from within I‐Tracker.
Additionally, I‐Tracker functionality facilitates follow‐up and monitoring of action items developed during the RCA process in a manner that conforms to the ICPS framework. We are now developing educational resources for RCA team members to investigate the implementation of I‐Tracker into future RCAs.
DISCUSSION
I‐Tracker provides an intranet‐based tool that met the objectives of the present project. The process of entering 15 existing SE reviews and action plans from our healthcare system into I‐Tracker allowed an incremental development of the database and identified gaps in our existing RCA process. For instance, none of the previous RCAs critically appraised detection, mitigating factors, or ameliorating actions; defined the specific nature or quantified severity of patient injuries using standardized terms; distinguished between human errors and negligence; or comprehensively reported the full spectrum of underlying causes of Tracker's use of standardized terms based on the ICPS conceptual framework provided a potential resource for focusing SE reviews and producing more comprehensive RCAs and action plans in the future. I‐Tracker has additional potential to facilitate dissemination of RCAs to other facilities, both as individual incident reports and aggregated summaries as recommended by experts in patient safety.13
The deficiencies in our existing RCA analyses, identified during data entry into I‐Tracker, represent common shortcomings experienced by other healthcare organizations and summarized in a report by the Agency for Healthcare Research and Quality.4 Considerable hindsight bias and prevailing concerns of the day taint the RCA process, which is time‐consuming and labor intensive, and thereby hinders comprehensive reviews. Also, our SE reviews, like others reviewed in the literature,14 focused on biologic injury to patients and omitted assessment of psychologic, organizational, social, and economic injury domains. Although SE review teams benefit from involvement of quality improvement staff who are trained in techniques and goals of RCA,15 many hospitals like ours have limited resources for fully staffing all SE reviews with trained facilitators. These SE reviews generate both quantitative and qualitative data, the latter of which hinders standardized data entry in the absence of a conceptual framework. A structured database with formative tools to guide RCAs in conformance with the ICPS framework in organizations without sufficient numbers of trained facilitators offers opportunities to produce more comprehensive, standardized, and actionable reports. To date, our quality staff and leadership have responded positively to presentations of the functional features of I‐Tracker (Table 1).
|
| Online availability of the system that allows access both from client database software loaded on Quality Office computers and through intranet browser software (Explorer, Safari, Firefox, etc) |
| Security features of encrypted software that allow full or limited views depending on the user's password security clearance and purpose for reviewing data |
| Software accessibility in authoring and managing the database, which do not require support from information technology data analysts |
| Decision support tools provided in the system to assist RCA analysis |
| System flexibility that allows scripted reporting of single SEs or multiple SE summaries within any selected timeframe |
Limitations of our report include its focus solely on the development and programming phase of I‐Tracker and the absence of information on its actual implementation. We believe, however, the development phase is important to report because it demonstrates that the ICPS framework and specific ICPS data fields are amenable to incorporation into a decision support and reporting tool, which to our knowledge has not been previously reported. We begin implementation of I‐Tracker within our organization this year and will have observations on its feasibility, acceptability, and staff training needs. As an additional limitation, we emphasize that we do not propose I‐Tracker as a solution for other organizations, because we have no plans for its commercial or public domain development. This report is intended to demonstrate, however, that commercially available software, such as FileMaker, can readily support the ICPS Framework and thereby has potential to assist RCAs and SE reporting. Other organizations may develop similar systems on other database platforms that incorporate the ICPS system into their reviews.
To implement I‐Tracker, we are now working with nursing and pharmacy leadership focus groups to develop formative tools, data collection forms, and other resources to assist their RCA efforts and data entry into the database. We also plan to apply the database tool to our residency training program to promote resident involvement in SE reviews by providing standardized, reproducible, and structured processes.16 Our 5‐state healthcare system has funded an evaluation of the implementation phase of I‐Tracker to other Providence facilities. Because the ICPS framework applies to all safety incidents beyond SEs (Table 2), a successful implementation of I‐Tracker for SEs will allow its eventual application to other types of critical incidents.
|
| Clinical administration |
| Clinical process/procedure |
| Documentation |
| Healthcare‐associated infection |
| Medication/IV fluids |
| Blood/blood products |
| Nutrition |
| Oxygen/gas/vapor |
| Medical device/equipment |
| Behavior |
| Patient accidents |
| Infrastructure/building/fixtures |
| Resources/organizational management |
The strength of this project derives from its innovative development of an intranet‐based tool that allows groups to conform their RCAs to the ICPS framework. Because the absence of a standardized classification for patient safety concepts has hindered advances in patient safety,11 we believe I‐Tracker, or decision support tools like it that use the ICPS framework, can standardize RCAs and promote dissemination and adoption of action plans.
Acknowledgements
We appreciate the support of Judy Stenstrom, Lynette Savage, and the Portland Service Area Quality Improvement Office.
- .Reporting of adverse events.N Engl J Med.2002;347:1633–1638.
- The Joint Commission's Sentinel Event Policy: ten years of improving the quality and safety of health care.Jt Comm Perspect.2005;25(1):3–5.
- ,.Root cause analysis and nursing management responsibilities in wrong‐site surgery.Dimens Crit Care Nurs.2006;25,221–225.
- ,.Root Cause Analysis.Making Health Care Safer. Available at: http://archive.ahrq.gov/clinic/ptsafety/chap5.htm. Accessed May 21,2010.
- Oversight group holds RCA teams accountable.Healthcare Benchmarks Qual Improv.2008;15:117–118.
- .Shared meanings: preferred terms and definitions for safety and quality concepts.Med J Aust.2006;184:S41–S43.
- ,,.What do family physicians consider an error? A comparison of definitions and physician perception.BMC Fam Pract.2006;7:73.
- ,,,,,.Towards an International Classification for Patient Safety: key concepts and terms.Int J Qual Health Care.2009;21:18–26.
- ,,,,.The JCAHO patient safety event taxonomy: a standardized terminology and classification schema for near misses and adverse events.Int J Qual Health Care.2005;17:95–105.
- World Health Organization. 2009 Conceptual Framework for the International Classification for Patient Safety. Final Technical Report Version 1.1. Available at: http://www.who.int/patientsafety/taxonomy/icps_full_report.pdf. Accessed April 25,2011.
- ,,, et al.Towards an International Classification for Patient Safety: the conceptual framework.Int J Qual Health Care.2009;21:2–8.
- ,,,,,.Towards an International Classification for Patient Safety: a Delphi survey.Int J Qual Health Care.2009;21:9–17.
- ,,.Effectiveness and efficiency of root cause analysis in medicine.JAMA.2008;299:685–687.
- ,,,,.How can clinicians measure safety and quality in acute care?Lancet.2004;363:1061–1067.
- ,,,,.Systematic root cause analysis of adverse drug events in a tertiary referral hospital.Jt Comm J Qual Improv.2000;26:563–575.
- ,,,,,.Educational quality improvement report: outcomes from a revised morbidity and mortality format that emphasised patient safety.Postgrad Med J.2008;84:211–216.

Implementing an RRT
In‐hospital cardiopulmonary arrests are often preceded by signs of clinical instability, such as changes in vital signs or mental status.1 Nearly 85% of patients who suffer from cardiopulmonary arrests have documented observations of deterioration in the 8 hours before arrest.2 A Medical Emergency Team (MET), sometimes known as Rapid Response Team (RRT), can rapidly assess and manage unstable patients, with the goal that early intervention will prevent adverse outcomes. In 2004, the Institute for Healthcare Improvement (IHI), as part of its 100,000 Lives Campaign, called for hospitals to implement rapid response systems as 1 of 6 strategies to reduce deaths in hospital.3 Since this recommendation, hundreds of hospitals in the United States have invested substantial financial and personnel resources to implement some form of a rapid response system, which is comprised of a varying array of healthcare providers who bring critical care expertise to the patient's bedside.4, 5
Despite the intuitive appeal of the approach, and early observational data which suggested that METs could reduce both codes and unexpected in‐hospital mortality,2, 6 the largest randomized controlled trial found that METs failed to reduce unplanned intensive care unit (ICU) admissions, cardiac arrests, or unexpected deaths.7 More recently, in a prospective observational cohort study at 1 US hospital, Chan et al. found that a nurse‐led RRT did not impact hospital‐wide code rates or mortality.4
The study of rapid response systems is further complicated by a lack of standard definition, and the many types of hospitals in which they may be implemented. In 2006, a consensus conference suggested that MET be used to refer to teams led by physicians (usually intensivists), and RRT be used for teams led by nurses.8 Many studies have been conducted at non‐US institutions, and follow‐up periods have generally been 1 year or less. We report on almost 4 years of experience with a hospitalist‐led MET implemented in a major US academic medical center, and examine the subsequent changes in code calls, cardiac arrests, deaths following cardiopulmonary resuscitation, and overall hospital mortality. Because the MET did not operate in the critical care units, and because cardiac arrest may occur without prior signs of deterioration, we hypothesized that implementation of the MET would correspond to a small drop in total code calls, no change in codes called inside of critical care units, no change in cardiac arrest outside of critical care, and a marked drop in other medical crises (mostly respiratory distress) outside critical care. We also hypothesized that there would be no change in the rate of fatal codes, because most deaths occur in patients who were found to be pulseless on arrival of the code team.
METHODS
Setting
Beginning in March 2006, Baystate Medical Center implemented an MET in accordance with the recommendations of the IHI. Baystate is a 670‐bed tertiary care referral center in Springfield, Massachusetts, and a major teaching hospital for Tufts University. Throughout the study period, the hospital had full‐time intensivists and >90% of medical patients were cared for by hospitalists with 24‐hour coverage. As a result, a medical patient's attending physician or corresponding coverage was usually on site. In order to promote acceptance of the team as well as to maximize continuity of care, we constructed our MET to include a critical care nurse, a respiratory therapist, intravenous therapist, and the patient's physician (either attending or resident). Baystate staff members carry alpha‐numeric pagers, so attendings could be alerted to the fact that the MET had been activated by means of a text page. In the event that the patient's physician could not respond, an ICU physician served as a backup team member. The MET was implemented initially in March of 2006 on 2 medical floors, and over a period of 3 months was gradually expanded to cover the entire hospital. For surgical patients, the MET was led by the attending surgeon or appropriate resident. Educational efforts, including meetings, e‐mails, and posters, targeted nurses in particular, but anyone could summon the MET by calling the activation number posted on all ward telephones. Nurses were encouraged to activate the system for any of the following: heart rate (<40 and >130 beats per minute), systolic blood pressure (<90 mmHg), respiratory rate (<8 or >24 per minute), oxygen saturation (<90% despite supplemental oxygen), altered mental status, or simply concern that something is wrong. The MET implementation oversight committee met biweekly and made adjustments to the team composition and protocols using rapid Plan Do Study Act (PDSA) cycles. A full description of the implementation process has been published elsewhere.9
In addition to the MET, Baystate has a separate code team which can be activated for cardiovascular arrests via a call to a designated phone extension, which activates a page to the code team members and an overhead announcement. Code team members include the ICU medical resident and intern, a critical care nurse, an anesthesiologist, a respiratory therapist, a staff nurse, and the house supervisor. In response to the overhead announcement, doctors, nurses and students in the vicinity often respond as well. Prior to implementation of the MET, a code blue was the only level of immediate response available.
Data and Outcomes
The nurse attending a code blue or code completes a report form which becomes part of the permanent medical record. A copy of the report is reviewed by the Division of Healthcare Quality and housed in the Critical Care administrative offices. For this study, we reviewed all code reports from January 2004 through December 2009. For each report, we extracted the following information: the date, location (inside or outside of a critical care unit), whether the patient had a pulse on arrival of the team, and whether the patient survived to discharge. All activations of the code system were included, regardless of the patient's code status (ie, even if the code was called in error) or the reason for the code call. Patients were then aggregated to calculate the rate of codes called per calendar quarter, as well as the rates of codes called in and out of critical care and the rates of two subsets of code calls, namely cardiac arrests and other medical crises (eg, respiratory arrest or seizures).
MET members were also required to collect data on the reason for the MET call, as well as the response time, time of day and unit, duration of the call, whether the physician was present, whether the patient was transferred to critical care, and whether the patient survived to discharge. In addition, we surveyed the nursing staff directly after the call, asking the following questions: 1) Did the team arrive promptly? 2) Were the critical care nurse and respiratory therapist efficient and respectful? 3) Did you feel the patient's needs were addressed appropriately? 4) Did you feel supported by the MET? and 5) Would you call the MET again?
Statistical Analysis
Quarterly event rates per 1000 admissions were calculated for each outcome. Event rates were compared using piecewise Poisson regression10 with robust standard errors.11 We excluded the 2 quarterly periods (2006 Q1 and Q2) during which the MET was implemented. A piecewise Poisson regression model was chosen to facilitate estimation of: 1) change in code calls from immediately before implementation to immediately after; and 2) temporal trends in code calls before and after implementation. Each model was built with 1 pre‐implementation intercept (December 2005), and 1 post‐implementation intercept (July 2006), as well as 2 slopes, with time coded negatively before the intervention (ie, 2, 1, 0), and positively after (ie, 0, 1, 2). Linear contrasts tested for differences in each parameter. A significant difference in intercepts suggests a post‐intervention decrease in code call rates; a significant, negative post‐intervention slope suggests continuing decline in code call rates. Statistical inferences were aided with visual plots of predicted incidence rates for each quarter in the observation period, with 95% confidence intervals (CI) for each quarterly rate estimated by the delta method.12 Alpha was specified at 0.05 and all significance tests were 2‐sided. Analyses were conducted in Stata 11.1 for Windows ( 2010, StataCorp LP, College Station, TX).
RESULTS
Implementation of the MET
The MET was introduced in the first and second quarters of 2006, with 2717 calls logged through the end of 2009 (out of 154,382 admissions). The rate of MET calls increased during the first 6 months of implementation from 5.95 per 1000 admissions in the first quarter of the intervention, to 15.8 calls per 1000 admissions in the second quarter. Call rates peaked in the first half of 2009, at 20.9 calls per 1000 admissions, leveling off to 17.9 calls per 1000 admissions in the last half of 2009 (Figure 1). Of calls with time recorded, 40% occurred on the day shift, 35% on the evening shift, and 25% on the night shift. The most common reason to call the MET was respiratory distress (33%), followed by cardiovascular instability (25%), and neurological abnormality (20%). In 15% of cases, concern about a patient's condition prompted the nurse to call. Calls came primarily from medical floors (75%) and surgical units (20%). The median response time was 4 minutes (interquartile range [IQR], 2.8 to 5.2 minutes) with no meaningful trend during the study period. The median call duration was 50 minutes (IQR, 38 to 72 minutes). Again, there was no trend over time. The most common interventions were arterial blood gas, fluid resuscitation, and electrocardiogram (see Supporting Web Appendix Table 1 in the online version of this article). A physician was present at 52% of the calls in the first year, which rose to 93% of calls in the final year. Approximately 25% of calls resulted in the patient being transferred to a critical care unit. Staff evaluations were overwhelmingly positive. Nurses rated the teams on the following points: whether the critical care nurse and respiratory therapist were efficient and respectful (mean rating 98%, SD 5.6%); promptness (98%, SD 5.6%); whether the patient's needs were addressed appropriately (mean 98%, SD 4.2%); whether the nurse felt supported by the MET (99.5%, SD 1.7%); and whether they would call the MET again (99.7%, SD 1.4%).

Effect of MET on Code Calls and Mortality
Between January 2004 and December of 2009, the hospital case mix index remained constant, and there were a total of 1202 codes called. The majority (62%) took place outside of critical care units. Linear contrasts of pre‐piecewise and post‐piecewise intercepts revealed that overall code calls declined significantly between pre‐implementation and post‐implementation of the MET from 7.30 (95% CI 5.81, 9.16) codes called per 1000 admissions to 4.21 (95% CI 3.42, 5.18) calls per 1000 admissions (Figure 1; also see Supporting Web Appendix Table 2 in the online version of this article). Outside of critical care, code calls declined from 4.70 (95% CI 3.92, 5.63) before the MET was implemented to 3.11 (95% CI 2.44, 3.97) afterwards (Figure 2); this was due primarily to a decrease in medical crises, which averaged 3.29 events per 1000 admissions (95% CI 2.70, 4.02) before implementation and decreased to 1.72 (95% CI 1.28, 2.31) afterwards, whereas cardiac arrests did not change significantly (Figure 3). Following implementation, code calls within critical care also declined significantly, from 2.59 events per 1000 admissions (95% CI 1.82, 3.69) before to 1.24 events per 1000 admissions (95% CI 0.94, 1.63) afterwards. The change in codes called within critical care was smaller, however, and included reductions in both cardiac arrests ( 0.84 events, P = 0.01) and medical crises ( 0.55, P = 0.08). There was no significant change in the rate of fatal codes per 1000 admissions ( +0.06, P = 0.65) (Figure 4). Overall hospital mortality remained steady at 22.0 deaths per 1000 admissions throughout the study period.
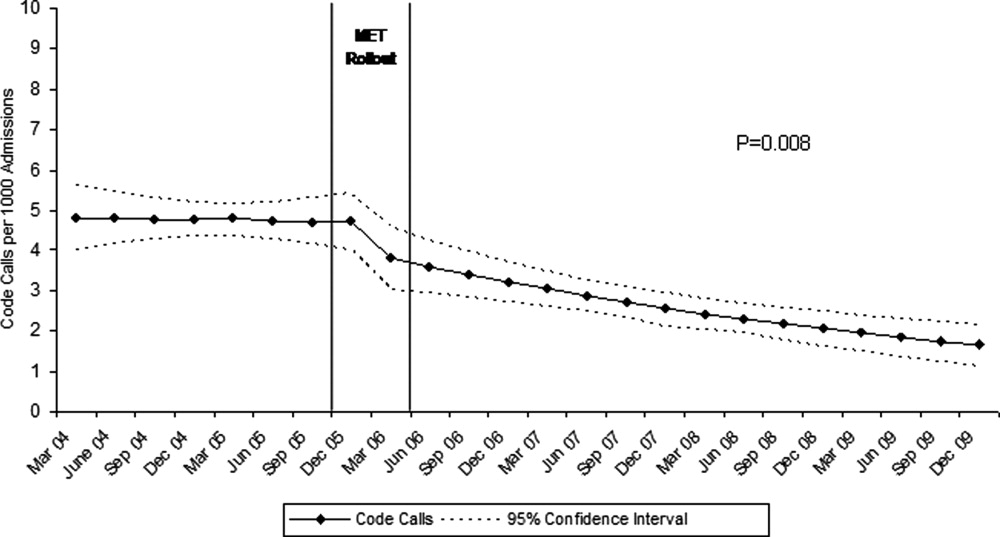
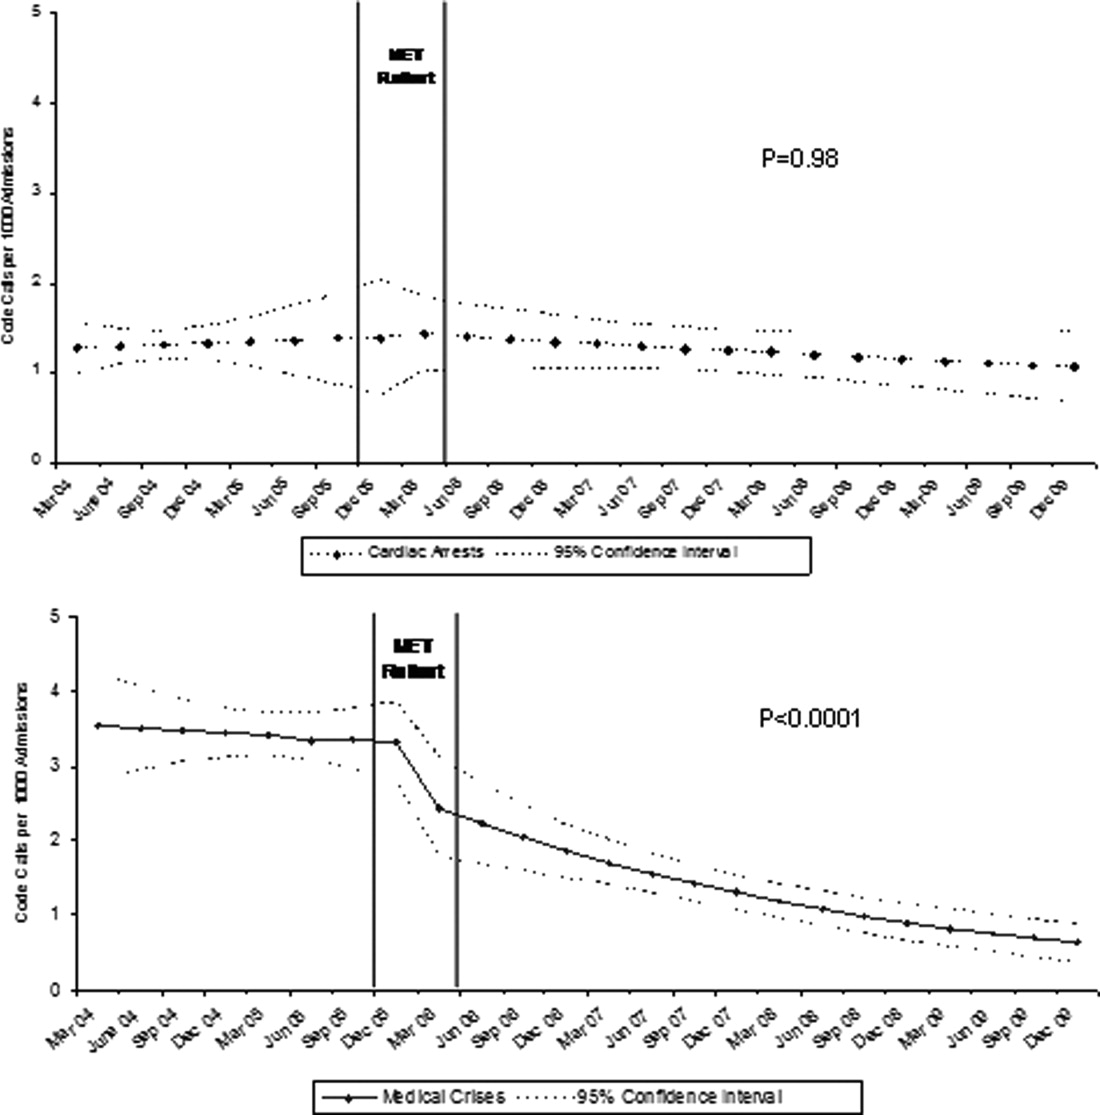
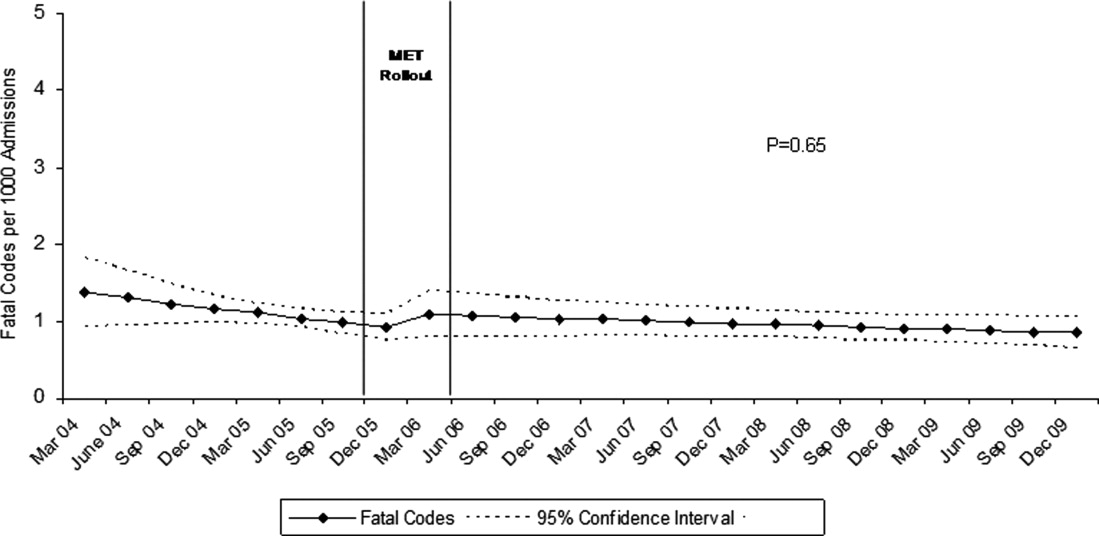
DISCUSSION
In this report, we detail the implementation of a novel hospitalist‐led medical emergency team at a large academic medical center over a period of 4 years. The team, which consisted of the patient's physician, a critical care nurse, a respiratory therapist, and an intravenous therapist, achieved full implementation within 6 months, was well received by the nursing staff, and was associated with a 42% decrease in code calls hospital‐wide. Most of the overall reduction was due to a reduction in codes called for medical crises outside of critical care, accompanied by a lesser reduction in codes called for cardiac arrests and medical crises within critical care units. There was no significant effect on the rate of cardiac arrest outside critical care. More importantly, there was no change in the rate of fatal codes or overall hospital mortality.
The idea of early intervention to prevent deterioration among hospitalized patients appeals to the concept that an ounce of prevention is worth a pound of cure. Like many other preventive interventions, rapid response systems have not always delivered on this promise. Since several early reports from Australia2 suggested that medical emergency teams could reduce not only cardiopulmonary arrests, but overall hospital mortality, there has been a rapid proliferation in their implementation, spurred on by the IHI's 100,000 Lives Campaign, which incorporated rapid response systems as one of 6 hospital‐wide interventions aimed at reducing harm and mortality.13 Subsequent randomized trials have both reproduced and refuted the early observational results. A ward‐randomized trial within 1 British hospital found a 50% reduction in hospital mortality for wards assigned to have an RRT,14 while a cluster randomized trial conducted at 23 Australian hospitals found no difference in rates of cardiac arrest or mortality between hospitals implementing METs and those continuing with usual care.7 Interestingly, in the Australian trial, the rates of cardiac arrest and mortality declined for both groups compared to historical controls, an important limitation to observational trials. Reports from single‐institution observational trials are also divided between those that found a reduction in mortality following implementation and those that did not. A recent meta‐analysis reported that there was too much heterogeneity among these trials to reach a conclusion about the benefits of rapid response systems.15
Our study adds to this literature in several ways. First, our MET design, which included the patient's physician (as opposed to an intensive care physician), was different from those previously studied. Including the patient's physician increases the team's knowledge of the patient and disease, and may improve physician acceptance of METs. In addition, our study provides 4 full years of follow‐up. Second, our rate of MET activation (18 calls/1000 admissions) was 2 to 3 times higher than that seen in most other studies,16 thus, the lack of mortality benefit was not likely the result of underuse. Third, our hospital employs a large number of hospitalists whose continuous presence might be expected to attenuate the benefits of an MET. Indeed, our initial rate of codes (7.5/1000 admissions) was similar to the post‐intervention rate in other studies.4 Nevertheless, the decrease in the overall rate of code calls following implementation of our MET was similar to that observed by others.17 Finally, our stratification of code calls inside critical care (where the MET was not deployed) and outside critical care, as well as the division of codes into cardiac arrest (where intervention is often unsuccessful) and other medical crises (primarily respiratory distress), gives further insight into how METs might work. As expected, we found that outside critical care only, codes called for medical crises declined, implying that the main effect of the MET was to provide early interventions for patients who were not likely to die anyway (eg, respiratory care for patients with respiratory distress or intravenous fluids for hypotensive patients). Instead of intervening to prevent death, MET may avoid emergent intubation by providing respiratory therapy and/or urgent intubation. In addition, it represents a less‐intense option for responding to nonlife‐threatening emergencies, such as seizures or syncope. As codes were no longer called for these types of crises, the rate of code calls necessarily fell. The reason that code calls declined inside critical care is less clear. It could be that patients transferred to critical care by the MET were less likely to code than those transferred before implementation, or the decline might be due to other factors that were not evaluated. Regardless, it is clear that the MET did not simply relocate codes to critical care units.
Our study has a number of limitations. First, it is an observational study and cannot account for other confounders relating to temporal trends in the hospital. However, our long time window allowed us to examine trends over several years. For 2 years prior to implementation of the MET, there was no decline at all in the rate of code calls, followed by an immediate and sustained drop after implementation. Other interventions, including ventilator‐associated pneumonia bundles, sepsis bundles, and advanced cardiac life support simulation training were also implemented at different times during the study period. However, the stark demarcation in code call rates coinciding with MET implementation makes it less likely that these other interventions were responsible for the observed decline. Second, our study was limited to a single institution and a single type of MET. Our findings may not apply to other types of institutions with different staffing arrangements or a different hospital culture, nor would they necessarily apply to different types of MET. Third, our nurse surveys were not collected anonymously, and this may have affected the nurses' responses. Finally, we did not collect physiological parameters on our patients, so we cannot state with certainty what the MET intervention accomplished.
Since initial studies suggested that METs could reduce hospital mortality rates, the Joint Commission has effectively mandated implementation of rapid response systems in all hospitals. Newer evidence, however, has been less convincing of mortality or other benefit. Our study adds to the literature in that we also did not find a mortality benefit. However, there were 2 clear benefits that we did identify. Our MET did appear to substantially reduce total numbers of code calls, particularly codes called for medical crises. Also, our nurses had a very positive response to the MET, which empowered them to get help for a patient when the patient's physician was unavailable or did not take their concerns seriously. Clearly, additional study is needed to better understand the effects of METs on mortality, codes, and other indicators of patient outcomes. However, in the current regulatory environment, such studies will be difficult to perform. Instead, additional studies can clarify which models deliver best outcomes and optimal use of our limited resources.
- ,,,,,.Recognising clinical instability in hospital patients before cardiac arrest or unplanned admission to intensive care. A pilot study in a tertiary‐care hospital.Med J Aust.1999;171:22–25.
- ,,, et al.Rates of in‐hospital arrests, deaths and intensive care admissions: the effect of a medical emergency team.Med J Aust.2000;173:236–240.
- ,,,.The 100,000 Lives Campaign: setting a goal and a deadline for improving health care quality.JAMA.2006;295:324–327.
- ,,,,,.Hospital‐wide code rates and mortality before and after implementation of a rapid response team.JAMA.2008;300:2506–2513.
- ,,,,.Rapid response teams: do they make a difference?Dimens Crit Care Nurs.2007;26:253–262.
- ,,,,,.Effects of a medical emergency team on reduction of incidence of and mortality from unexpected cardiac arrests in hospital: preliminary study.BMJ.2002;324:387–390.
- ,,, et al.Introduction of the medical emergency team (MET) system: a cluster‐randomised controlled trial.Lancet.2005;365:2091–2097.
- ,,, et al.Findings of the first consensus conference on medical emergency teams.Crit Care Med.2006;34:2463–2478.
- ,.Implementation of a rapid response team: a success story.Crit Care Nurse.2009;29:66–76.
- .Practical Biostatistical Methods.Belmont, CA:Wadsworth Publishing;1995.
- ,,,.Regression Methods in Biostatistics: Linear, Logistic, Survival, and Repeated Measures Models.New York:Springer Science + Business Media;2005.
- .A note on the delta method.Am Stat.1992;46:27–29.
- ,.The 100,000 Lives Campaign: crystallizing standards of care for hospitals.Health Aff.2005;24:1560–1570.
- ,,, et al.Introducing critical care outreach: a ward‐randomised trial of phased introduction in a general hospital.Intensive Care Med.2004;30:1398–404.
- ,,,,,.Rapid response systems: a systematic review.Crit Care Med.2007;35:1238–1243.
- ,,,,.Effects of rapid response systems on clinical outcomes: systematic review and meta‐analysis.J Hosp Med.2007;2:422–432.
- ,,,,.Rapid response teams: a systematic review and meta‐analysis.Arch Intern Med.2010;170:18–26.
In‐hospital cardiopulmonary arrests are often preceded by signs of clinical instability, such as changes in vital signs or mental status.1 Nearly 85% of patients who suffer from cardiopulmonary arrests have documented observations of deterioration in the 8 hours before arrest.2 A Medical Emergency Team (MET), sometimes known as Rapid Response Team (RRT), can rapidly assess and manage unstable patients, with the goal that early intervention will prevent adverse outcomes. In 2004, the Institute for Healthcare Improvement (IHI), as part of its 100,000 Lives Campaign, called for hospitals to implement rapid response systems as 1 of 6 strategies to reduce deaths in hospital.3 Since this recommendation, hundreds of hospitals in the United States have invested substantial financial and personnel resources to implement some form of a rapid response system, which is comprised of a varying array of healthcare providers who bring critical care expertise to the patient's bedside.4, 5
Despite the intuitive appeal of the approach, and early observational data which suggested that METs could reduce both codes and unexpected in‐hospital mortality,2, 6 the largest randomized controlled trial found that METs failed to reduce unplanned intensive care unit (ICU) admissions, cardiac arrests, or unexpected deaths.7 More recently, in a prospective observational cohort study at 1 US hospital, Chan et al. found that a nurse‐led RRT did not impact hospital‐wide code rates or mortality.4
The study of rapid response systems is further complicated by a lack of standard definition, and the many types of hospitals in which they may be implemented. In 2006, a consensus conference suggested that MET be used to refer to teams led by physicians (usually intensivists), and RRT be used for teams led by nurses.8 Many studies have been conducted at non‐US institutions, and follow‐up periods have generally been 1 year or less. We report on almost 4 years of experience with a hospitalist‐led MET implemented in a major US academic medical center, and examine the subsequent changes in code calls, cardiac arrests, deaths following cardiopulmonary resuscitation, and overall hospital mortality. Because the MET did not operate in the critical care units, and because cardiac arrest may occur without prior signs of deterioration, we hypothesized that implementation of the MET would correspond to a small drop in total code calls, no change in codes called inside of critical care units, no change in cardiac arrest outside of critical care, and a marked drop in other medical crises (mostly respiratory distress) outside critical care. We also hypothesized that there would be no change in the rate of fatal codes, because most deaths occur in patients who were found to be pulseless on arrival of the code team.
METHODS
Setting
Beginning in March 2006, Baystate Medical Center implemented an MET in accordance with the recommendations of the IHI. Baystate is a 670‐bed tertiary care referral center in Springfield, Massachusetts, and a major teaching hospital for Tufts University. Throughout the study period, the hospital had full‐time intensivists and >90% of medical patients were cared for by hospitalists with 24‐hour coverage. As a result, a medical patient's attending physician or corresponding coverage was usually on site. In order to promote acceptance of the team as well as to maximize continuity of care, we constructed our MET to include a critical care nurse, a respiratory therapist, intravenous therapist, and the patient's physician (either attending or resident). Baystate staff members carry alpha‐numeric pagers, so attendings could be alerted to the fact that the MET had been activated by means of a text page. In the event that the patient's physician could not respond, an ICU physician served as a backup team member. The MET was implemented initially in March of 2006 on 2 medical floors, and over a period of 3 months was gradually expanded to cover the entire hospital. For surgical patients, the MET was led by the attending surgeon or appropriate resident. Educational efforts, including meetings, e‐mails, and posters, targeted nurses in particular, but anyone could summon the MET by calling the activation number posted on all ward telephones. Nurses were encouraged to activate the system for any of the following: heart rate (<40 and >130 beats per minute), systolic blood pressure (<90 mmHg), respiratory rate (<8 or >24 per minute), oxygen saturation (<90% despite supplemental oxygen), altered mental status, or simply concern that something is wrong. The MET implementation oversight committee met biweekly and made adjustments to the team composition and protocols using rapid Plan Do Study Act (PDSA) cycles. A full description of the implementation process has been published elsewhere.9
In addition to the MET, Baystate has a separate code team which can be activated for cardiovascular arrests via a call to a designated phone extension, which activates a page to the code team members and an overhead announcement. Code team members include the ICU medical resident and intern, a critical care nurse, an anesthesiologist, a respiratory therapist, a staff nurse, and the house supervisor. In response to the overhead announcement, doctors, nurses and students in the vicinity often respond as well. Prior to implementation of the MET, a code blue was the only level of immediate response available.
Data and Outcomes
The nurse attending a code blue or code completes a report form which becomes part of the permanent medical record. A copy of the report is reviewed by the Division of Healthcare Quality and housed in the Critical Care administrative offices. For this study, we reviewed all code reports from January 2004 through December 2009. For each report, we extracted the following information: the date, location (inside or outside of a critical care unit), whether the patient had a pulse on arrival of the team, and whether the patient survived to discharge. All activations of the code system were included, regardless of the patient's code status (ie, even if the code was called in error) or the reason for the code call. Patients were then aggregated to calculate the rate of codes called per calendar quarter, as well as the rates of codes called in and out of critical care and the rates of two subsets of code calls, namely cardiac arrests and other medical crises (eg, respiratory arrest or seizures).
MET members were also required to collect data on the reason for the MET call, as well as the response time, time of day and unit, duration of the call, whether the physician was present, whether the patient was transferred to critical care, and whether the patient survived to discharge. In addition, we surveyed the nursing staff directly after the call, asking the following questions: 1) Did the team arrive promptly? 2) Were the critical care nurse and respiratory therapist efficient and respectful? 3) Did you feel the patient's needs were addressed appropriately? 4) Did you feel supported by the MET? and 5) Would you call the MET again?
Statistical Analysis
Quarterly event rates per 1000 admissions were calculated for each outcome. Event rates were compared using piecewise Poisson regression10 with robust standard errors.11 We excluded the 2 quarterly periods (2006 Q1 and Q2) during which the MET was implemented. A piecewise Poisson regression model was chosen to facilitate estimation of: 1) change in code calls from immediately before implementation to immediately after; and 2) temporal trends in code calls before and after implementation. Each model was built with 1 pre‐implementation intercept (December 2005), and 1 post‐implementation intercept (July 2006), as well as 2 slopes, with time coded negatively before the intervention (ie, 2, 1, 0), and positively after (ie, 0, 1, 2). Linear contrasts tested for differences in each parameter. A significant difference in intercepts suggests a post‐intervention decrease in code call rates; a significant, negative post‐intervention slope suggests continuing decline in code call rates. Statistical inferences were aided with visual plots of predicted incidence rates for each quarter in the observation period, with 95% confidence intervals (CI) for each quarterly rate estimated by the delta method.12 Alpha was specified at 0.05 and all significance tests were 2‐sided. Analyses were conducted in Stata 11.1 for Windows ( 2010, StataCorp LP, College Station, TX).
RESULTS
Implementation of the MET
The MET was introduced in the first and second quarters of 2006, with 2717 calls logged through the end of 2009 (out of 154,382 admissions). The rate of MET calls increased during the first 6 months of implementation from 5.95 per 1000 admissions in the first quarter of the intervention, to 15.8 calls per 1000 admissions in the second quarter. Call rates peaked in the first half of 2009, at 20.9 calls per 1000 admissions, leveling off to 17.9 calls per 1000 admissions in the last half of 2009 (Figure 1). Of calls with time recorded, 40% occurred on the day shift, 35% on the evening shift, and 25% on the night shift. The most common reason to call the MET was respiratory distress (33%), followed by cardiovascular instability (25%), and neurological abnormality (20%). In 15% of cases, concern about a patient's condition prompted the nurse to call. Calls came primarily from medical floors (75%) and surgical units (20%). The median response time was 4 minutes (interquartile range [IQR], 2.8 to 5.2 minutes) with no meaningful trend during the study period. The median call duration was 50 minutes (IQR, 38 to 72 minutes). Again, there was no trend over time. The most common interventions were arterial blood gas, fluid resuscitation, and electrocardiogram (see Supporting Web Appendix Table 1 in the online version of this article). A physician was present at 52% of the calls in the first year, which rose to 93% of calls in the final year. Approximately 25% of calls resulted in the patient being transferred to a critical care unit. Staff evaluations were overwhelmingly positive. Nurses rated the teams on the following points: whether the critical care nurse and respiratory therapist were efficient and respectful (mean rating 98%, SD 5.6%); promptness (98%, SD 5.6%); whether the patient's needs were addressed appropriately (mean 98%, SD 4.2%); whether the nurse felt supported by the MET (99.5%, SD 1.7%); and whether they would call the MET again (99.7%, SD 1.4%).
Effect of MET on Code Calls and Mortality
Between January 2004 and December of 2009, the hospital case mix index remained constant, and there were a total of 1202 codes called. The majority (62%) took place outside of critical care units. Linear contrasts of pre‐piecewise and post‐piecewise intercepts revealed that overall code calls declined significantly between pre‐implementation and post‐implementation of the MET from 7.30 (95% CI 5.81, 9.16) codes called per 1000 admissions to 4.21 (95% CI 3.42, 5.18) calls per 1000 admissions (Figure 1; also see Supporting Web Appendix Table 2 in the online version of this article). Outside of critical care, code calls declined from 4.70 (95% CI 3.92, 5.63) before the MET was implemented to 3.11 (95% CI 2.44, 3.97) afterwards (Figure 2); this was due primarily to a decrease in medical crises, which averaged 3.29 events per 1000 admissions (95% CI 2.70, 4.02) before implementation and decreased to 1.72 (95% CI 1.28, 2.31) afterwards, whereas cardiac arrests did not change significantly (Figure 3). Following implementation, code calls within critical care also declined significantly, from 2.59 events per 1000 admissions (95% CI 1.82, 3.69) before to 1.24 events per 1000 admissions (95% CI 0.94, 1.63) afterwards. The change in codes called within critical care was smaller, however, and included reductions in both cardiac arrests ( 0.84 events, P = 0.01) and medical crises ( 0.55, P = 0.08). There was no significant change in the rate of fatal codes per 1000 admissions ( +0.06, P = 0.65) (Figure 4). Overall hospital mortality remained steady at 22.0 deaths per 1000 admissions throughout the study period.
DISCUSSION
In this report, we detail the implementation of a novel hospitalist‐led medical emergency team at a large academic medical center over a period of 4 years. The team, which consisted of the patient's physician, a critical care nurse, a respiratory therapist, and an intravenous therapist, achieved full implementation within 6 months, was well received by the nursing staff, and was associated with a 42% decrease in code calls hospital‐wide. Most of the overall reduction was due to a reduction in codes called for medical crises outside of critical care, accompanied by a lesser reduction in codes called for cardiac arrests and medical crises within critical care units. There was no significant effect on the rate of cardiac arrest outside critical care. More importantly, there was no change in the rate of fatal codes or overall hospital mortality.
The idea of early intervention to prevent deterioration among hospitalized patients appeals to the concept that an ounce of prevention is worth a pound of cure. Like many other preventive interventions, rapid response systems have not always delivered on this promise. Since several early reports from Australia2 suggested that medical emergency teams could reduce not only cardiopulmonary arrests, but overall hospital mortality, there has been a rapid proliferation in their implementation, spurred on by the IHI's 100,000 Lives Campaign, which incorporated rapid response systems as one of 6 hospital‐wide interventions aimed at reducing harm and mortality.13 Subsequent randomized trials have both reproduced and refuted the early observational results. A ward‐randomized trial within 1 British hospital found a 50% reduction in hospital mortality for wards assigned to have an RRT,14 while a cluster randomized trial conducted at 23 Australian hospitals found no difference in rates of cardiac arrest or mortality between hospitals implementing METs and those continuing with usual care.7 Interestingly, in the Australian trial, the rates of cardiac arrest and mortality declined for both groups compared to historical controls, an important limitation to observational trials. Reports from single‐institution observational trials are also divided between those that found a reduction in mortality following implementation and those that did not. A recent meta‐analysis reported that there was too much heterogeneity among these trials to reach a conclusion about the benefits of rapid response systems.15
Our study adds to this literature in several ways. First, our MET design, which included the patient's physician (as opposed to an intensive care physician), was different from those previously studied. Including the patient's physician increases the team's knowledge of the patient and disease, and may improve physician acceptance of METs. In addition, our study provides 4 full years of follow‐up. Second, our rate of MET activation (18 calls/1000 admissions) was 2 to 3 times higher than that seen in most other studies,16 thus, the lack of mortality benefit was not likely the result of underuse. Third, our hospital employs a large number of hospitalists whose continuous presence might be expected to attenuate the benefits of an MET. Indeed, our initial rate of codes (7.5/1000 admissions) was similar to the post‐intervention rate in other studies.4 Nevertheless, the decrease in the overall rate of code calls following implementation of our MET was similar to that observed by others.17 Finally, our stratification of code calls inside critical care (where the MET was not deployed) and outside critical care, as well as the division of codes into cardiac arrest (where intervention is often unsuccessful) and other medical crises (primarily respiratory distress), gives further insight into how METs might work. As expected, we found that outside critical care only, codes called for medical crises declined, implying that the main effect of the MET was to provide early interventions for patients who were not likely to die anyway (eg, respiratory care for patients with respiratory distress or intravenous fluids for hypotensive patients). Instead of intervening to prevent death, MET may avoid emergent intubation by providing respiratory therapy and/or urgent intubation. In addition, it represents a less‐intense option for responding to nonlife‐threatening emergencies, such as seizures or syncope. As codes were no longer called for these types of crises, the rate of code calls necessarily fell. The reason that code calls declined inside critical care is less clear. It could be that patients transferred to critical care by the MET were less likely to code than those transferred before implementation, or the decline might be due to other factors that were not evaluated. Regardless, it is clear that the MET did not simply relocate codes to critical care units.
Our study has a number of limitations. First, it is an observational study and cannot account for other confounders relating to temporal trends in the hospital. However, our long time window allowed us to examine trends over several years. For 2 years prior to implementation of the MET, there was no decline at all in the rate of code calls, followed by an immediate and sustained drop after implementation. Other interventions, including ventilator‐associated pneumonia bundles, sepsis bundles, and advanced cardiac life support simulation training were also implemented at different times during the study period. However, the stark demarcation in code call rates coinciding with MET implementation makes it less likely that these other interventions were responsible for the observed decline. Second, our study was limited to a single institution and a single type of MET. Our findings may not apply to other types of institutions with different staffing arrangements or a different hospital culture, nor would they necessarily apply to different types of MET. Third, our nurse surveys were not collected anonymously, and this may have affected the nurses' responses. Finally, we did not collect physiological parameters on our patients, so we cannot state with certainty what the MET intervention accomplished.
Since initial studies suggested that METs could reduce hospital mortality rates, the Joint Commission has effectively mandated implementation of rapid response systems in all hospitals. Newer evidence, however, has been less convincing of mortality or other benefit. Our study adds to the literature in that we also did not find a mortality benefit. However, there were 2 clear benefits that we did identify. Our MET did appear to substantially reduce total numbers of code calls, particularly codes called for medical crises. Also, our nurses had a very positive response to the MET, which empowered them to get help for a patient when the patient's physician was unavailable or did not take their concerns seriously. Clearly, additional study is needed to better understand the effects of METs on mortality, codes, and other indicators of patient outcomes. However, in the current regulatory environment, such studies will be difficult to perform. Instead, additional studies can clarify which models deliver best outcomes and optimal use of our limited resources.
- ,,,,,.Recognising clinical instability in hospital patients before cardiac arrest or unplanned admission to intensive care. A pilot study in a tertiary‐care hospital.Med J Aust.1999;171:22–25.
- ,,, et al.Rates of in‐hospital arrests, deaths and intensive care admissions: the effect of a medical emergency team.Med J Aust.2000;173:236–240.
- ,,,.The 100,000 Lives Campaign: setting a goal and a deadline for improving health care quality.JAMA.2006;295:324–327.
- ,,,,,.Hospital‐wide code rates and mortality before and after implementation of a rapid response team.JAMA.2008;300:2506–2513.
- ,,,,.Rapid response teams: do they make a difference?Dimens Crit Care Nurs.2007;26:253–262.
- ,,,,,.Effects of a medical emergency team on reduction of incidence of and mortality from unexpected cardiac arrests in hospital: preliminary study.BMJ.2002;324:387–390.
- ,,, et al.Introduction of the medical emergency team (MET) system: a cluster‐randomised controlled trial.Lancet.2005;365:2091–2097.
- ,,, et al.Findings of the first consensus conference on medical emergency teams.Crit Care Med.2006;34:2463–2478.
- ,.Implementation of a rapid response team: a success story.Crit Care Nurse.2009;29:66–76.
- .Practical Biostatistical Methods.Belmont, CA:Wadsworth Publishing;1995.
- ,,,.Regression Methods in Biostatistics: Linear, Logistic, Survival, and Repeated Measures Models.New York:Springer Science + Business Media;2005.
- .A note on the delta method.Am Stat.1992;46:27–29.
- ,.The 100,000 Lives Campaign: crystallizing standards of care for hospitals.Health Aff.2005;24:1560–1570.
- ,,, et al.Introducing critical care outreach: a ward‐randomised trial of phased introduction in a general hospital.Intensive Care Med.2004;30:1398–404.
- ,,,,,.Rapid response systems: a systematic review.Crit Care Med.2007;35:1238–1243.
- ,,,,.Effects of rapid response systems on clinical outcomes: systematic review and meta‐analysis.J Hosp Med.2007;2:422–432.
- ,,,,.Rapid response teams: a systematic review and meta‐analysis.Arch Intern Med.2010;170:18–26.
Copyright © 2011 Society of Hospital Medicine
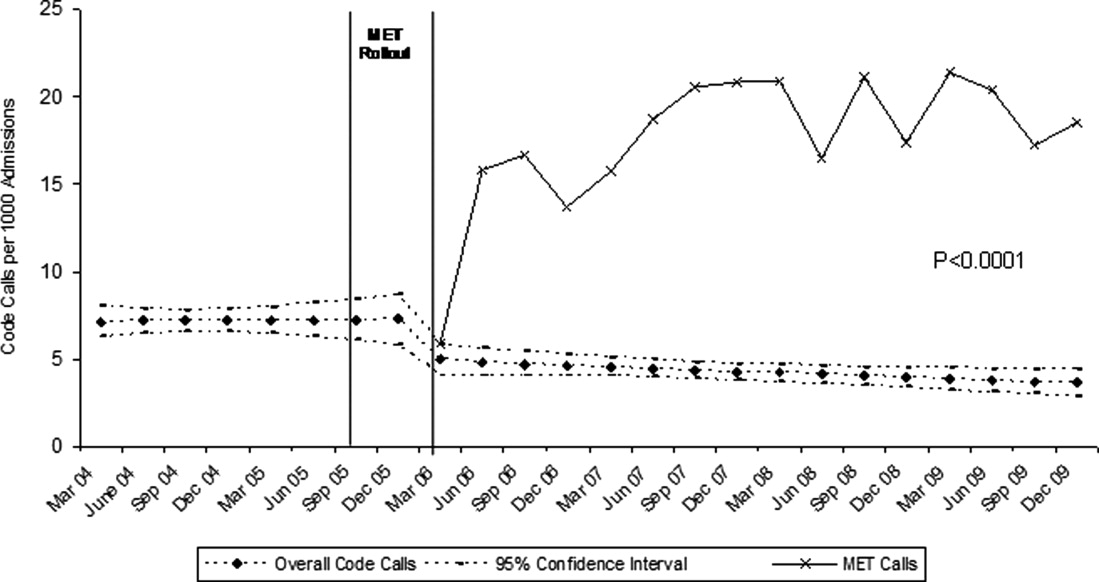
Pediatric Hospitalists' Influences
The number of pediatric hospitalists (PH) in the United States is increasing rapidly. The membership of the American Academy of Pediatrics (AAP) Section on Hospital Medicine has grown to 880 (7/10, AAP Section on Hospital Medicine), and there over 10,000 members of the Society of Hospital Medicine of which an estimated 5% care for children (7/10, Society of Hospital Medicine). Little is known about the educational contributions of pediatric hospitalists, residents' perceptions of hospitalists' roles, or how hospitalists may influence residents' eventual career plans even though 89% of pediatric hospitalists report they serve as teaching attendings.1 Teaching by hospitalists is well received and valued by residents, but, to date, all such data are from single institution studies of individual hospitalist programs.27 Less is known regarding what residents perceive about the differences in patient care provided by hospitalists as compared with traditional pediatric teaching attendings. There is a paucity of information about the level of interest of current pediatric residents in becoming hospitalists, including how many plan such a career, reasons why residents might prefer to become hospitalists, and their perceptions of Pediatric Hospital Medicine (PHM) careers as either long or short term. In addition, the effects of new residency graduates going into Hospital Medicine on the overall pediatric workforce, and how the availability of Hospital Medicine careers affects the choice of practice in Primary Care Pediatrics have not been examined.
We surveyed a national, randomly selected representative sample of pediatric residents to determine their level of exposure to hospitalist attending physicians during training. We asked the resident cohort about their educational experiences with hospitalists, patient care provided by hospitalists on their team, and career plans regarding becoming a hospitalist, including perceived needs for different or additional training. We obtained further information about reasons why hospitalist positions were appealing and about the current relationship between careers in Pediatric Hospital Medicine and Primary Care. To our knowledge, this is the first national study of how pediatric hospitalists might influence residents in the domains of education, patient care, and career planning.
METHODS
We conducted a survey of randomly selected pediatric residents from the AAP membership database. The selection was done by random generation by the AAP Department of Research from the membership database, in the same way members are selected for the annual Survey of Fellows and the annual pediatric level 3 (PL3) survey. Permission was obtained from the American Academy of Pediatrics Section on Residents (AAP SORe) to survey a selection of US pediatric residents in June 2007. The full sample of US pediatric residents included 9569 residents. The AAP SORe had 7694 e‐mail addresses from which the AAP Department of Research generated a random sample of 300 for our use, including Medicine‐Pediatric, Pediatric, and Pediatric Chief residents. One of the researchers (A.H.) sent an e‐mail with the title $200 AAP Career Raffle Survey containing a link to a SurveyMonkey survey (see Supporting Appendix AQuestionnaire in the online version of this article) and offering incentivized participation with a raffle. The need for informed consent was waived, as consent was implied by participation in the survey. The survey was taken anonymously by connecting through the link, and when it was completed, residents were asked to separately e‐mail a Section on Hospital Medicine address if they wished to participate in the raffle. Their raffle request was not linked to their survey results in any way. The $200 was supplied by the AAP Section on Hospital Medicine. The survey was sent 3 times. We analyzed responses with descriptive statistics. Institutional Review Board approval was obtained from Concord Hospital in Concord, New Hampshire.
RESULTS
The respondents are described in Figure 1 and Table 1. For their exposure to PHM, 54% (73 of 111) reported PH attendings in medical school; 90% (75 of 83) did have or will have PH attendings during residency, with no significant variation by program size (small, medium, large, or extra large). The degree of exposure was not asked. To learn about PHM, 47% (46 of 97 respondents) asked a PH in their program, while 28% (27 of 99) visited the AAP web site. Sixty‐eight percent (73 of 108) felt familiar or very familiar with PHM.
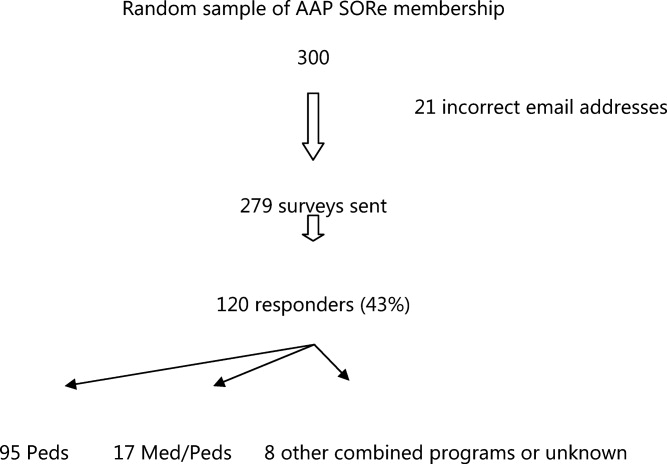
| % | Absolute Response Rate | |
|---|---|---|
| ||
| Training year | ||
| PL1 | 47.5 | 57 |
| PL2 | 35 | 42 |
| PL3 | 9 | 11 |
| PL4 | 1 | 1 |
| Skipped question | 7.5 | 9 |
| Gender | ||
| Male | 31.5 | 38 |
| Female | 61 | 73 |
| Skipped question | 7.5 | 9 |
| Specialty | ||
| Pediatrics | 79 | 95 |
| Med/Peds | 14 | 17 |
| Other (Pediatric combination residencies) | 4 | 5 |
| Skipped question | 3 | 3 |
| Program size | ||
| Less than 15 residents in program | 11 | 12 |
| 16‐30 | 38.5 | 42 |
| 31‐45 | 22.9 | 25 |
| Greater than 45 | 27.5 | 30 |
| Skipped question | 9.1 | 11 |
Table 2 summarizes the respondents' perception of PHM. They report a positive opinion of the field and overwhelmingly feel that PHM is a growing/developing field. Almost none feel PHM will not survive. A small percentage (10%, 28 of 99) felt there was no difference between PH and residents, with 25% (25 of 99) feeling some ambiguity about whether the PH role differs from that of a resident. Many (35 of 99) did not disagree that there is little difference between PH and resident positions, although most did. Sixty percent (59 of 99) agreed or strongly agreed that a PH position would be a good job for the short‐term. Forty‐seven percent (46 of 99) agreed in some form that PHM gives you something to do while you are waiting for another position. Given the choice of PHM as a long‐term opportunity, short‐term opportunity, either or not sure: 21% (21 of 98) saw PHM as a short‐term option only; 26% (25 of 98) saw PHM as a long‐term career only; 49% (48 of 98) saw it as either a short‐term option or long‐term career. Most (65%, 64 of 99) believed PH were better than primary care providers at caring for complex inpatients, but only 28% (28 of 99) thought PH provided better care for routine admissions. Most (82%, 81 of 99) agreed in some form that working with pediatric hospitalists enhances a resident's education.
| Strongly/Somewhat Disagree | Neither Disagree or Agree | Somewhat/Strongly Agree | |
|---|---|---|---|
| |||
| I think it is a great field | 2% (9/99) | 15% (15/99) | 83% (82/99) |
| It's a good job for the short‐term | 13% (13/99) | 27% (27/99) | 60% (59/99) |
| It gives you something to do while you are waiting for another position | 20% (20/99) | 33% (33/99) | 47% (46/99) |
| It's a growing/developing field | 1% (1/99) | 8% (8/99) | 91% (90/99) |
| It's a field that won't survive | 86% (85/99) | 13% (13/99) | 1% (1/99) |
| Hospitalists are better able to take care of complex inpatients than are primary care physicians | 20% (20/99) | 15% (15/99) | 65% (64/99) |
| Hospitalists are better able to take care of routine patient admissions than are primary care physicians | 39% (39/99) | 32% (32/99) | 28% (28/99) |
| There is little difference between hospitalist and resident positions | 65% (64/99) | 25% (25/99) | 10% (10/99) |
| Working with hospitalists enhances a residents education | 2% (2/99) | 16% (16/99) | 82% (81/99) |
On a 5‐point scale ranging from would definitely not include to might or might not include to would definitely include, the majority of respondents felt a PHM job would definitely include Pediatric Wards (86%, 84 of 98) and Inpatient Consultant for Specialists (54%, 52 of 97). Only 47% (46/97) felt the responsibilities would probably or definitely include Medical Student and Resident Education (47%, 46 of 97). The respondents were less certain (might or might not response) if PHM should include Normal Newborn Nursery (37%, 36 of 98), Delivery Room (42%, 41 of 98), Intensive Care Nursery (35%, 34 of 98), ED/Urgent Care (34%, 33 of 98), or Research (50%, 49 of 98). A majority of respondents felt PHM unlikely to include, or felt the job might not or might include: Outpatient Clinics (77%, 75 of 98), Outpatient Consults (81%, 79 of 98), and Pediatric Intensive Care Unit work (70%, 68 of 98).
Of categorical pediatric trainees answering the question, 35% (28 of 80) are considering a PHM career. Immediately post‐residency, 30% (24 of 80) of categorical trainees plan to enter Primary Care (PC), 4% (3 of 80) plan on PHM, and 3% (2 of 80) plan to pursue PH fellowship.
Of all respondents given the choice of whether a factor plays no role, limited role, or strong role in considering a career in PHM: flexible hours (96%, 94 of 98), opportunities to participate in education (97%, 95 of 98), and better salary than PC (94%, 91 of 97) would influence their decision to choose PHM. For 49% (48 of 98), ability to do the job without fellowship would play a strong role in choosing a career in PHM.
Forty‐five percent (44 of 97) support training in addition to residency; 16.5% (16 of 97) are against it; the remaining 38% (37 of 97) are unsure. Three percent (3 of 98) thought 3‐year fellowship best, while 28% (27 of 98) preferred 2‐year fellowship; 29% (28 of 98) would like a hospitalist‐track residency; 28% (27 of 98) believe standard residency sufficient; and 4% (4 of 98) felt a chief year adequate. If they were to pursue PHM, 31% (30 of 98) would enter PH fellowship, 34% (33 of 98) would not, and 36% (35 of 98) were unsure.
On a 5‐point scale, respondents were asked about barriers identified to choosing a career in PHM: 28% (27 of 96) agreed or strongly agreed that not feeling well‐enough trained was a barrier to entering the field; 42% (40 of 96) were agreed in some form that they were unsure of what training they needed; 39% (37 of 95) were unsure about where positions are available. Seven percent (7 of 98) of respondents were less likely to choose to practice Primary Care (PC) pediatrics because of hospitalists. Of respondents choosing PC, 59% (34 of 58) prefer or must have PH to work within their future practices, while 12% (7 of 58) prefer not to, or definitely do not want to, work with PH.
DISCUSSION
In 2006, the American Board of Pediatrics (ABP) General Pediatrics Career Survey found that 1% of first‐time applicants were taking a hospitalist position.8 In 2007, this number grew to 3% choosing a position in Pediatric Hospital Medicine.9, 10 The 2009‐2010 survey data found that 7.6% of first‐time applicants would be taking a job as hospitalist as of July 1.11 Our data suggest this number will continue to grow over the next few years. The growth of PHM has prompted an in‐depth look at the field by the ABP.1, 12, 13 PHM programs appear to have become part of the fabric of pediatric care, with the majority of hospitals with PHM programs planning to continue the programs despite the need to pay for value‐added by hospitalists beyond revenue received for their direct clinical service.13 Looking forward, when the Institute of Medicine recommendations to further restrict resident work hours to 16 hour shifts are implemented, many programs plan on increasing their PHM programs.14, 15 Therefore, residents' views of a career in PHM are important, as they give perspective on attitudes of those who might be, or interact with, hospitalists in the future, and should impact training programs for residents regardless of their interest in a career in PHM.
Our national data support local, large institution studies that hospitalists are positively impacting education.27 However, this study suggests that this is not only a local or large academic center phenomenon, but a national trend towards providing a different and positive education experience for pediatric residents. This mirrors the opinion of the majority of residency and clerkship directors who feel that hospitalists are more accessible to trainees than traditional attendings.12 Training programs should consider this impact when selecting attending hospitalists and supporting their roles as mentors and educators.
As residents finish their training and seek positions as pediatric hospitalists, programs need to be aware that a significant percentage of residents in our survey see PHM as a short‐term career option and/or fail to see a difference between a PH job and their own. Program Directors also need to be aware of the breadth of PHM practice which can include areas our respondents felt were less likely to be part of PHM, such as other inpatient areas and the expectation of research.
While 1 option to address some of these issues is fellowship training, this is not a simple decision. PHM needs to determine if fellowship is truly the best option for future hospitalists and, if so, what the fellowship should look like in terms of duration and scope. While the needs of optimal training should be paramount, resident preferences to not commit to an additional 3 years of training must be considered. Many residents fail to see a difference between the role of PH and their own role during training, and feel that the current format of residency training is all the preparation needed to step into a career as a PH. This demonstrates a clear gap between resident perceptions of PHM and the accepted definition of a hospitalist,16 which reaches far beyond direct inpatient care. While The Core Competencies for Pediatric Hospital Medicine17 address a number of these areas, neither trainees nor hospitalists themselves have fully integrated these into their practice. PH must recognize and prepare for their position as mentors and role models to residents. This responsibility should differentiate PH role from that of a resident, demonstrating roles PH play in policy making, patient safety and quality initiatives, in administration, and in providing advanced thinking in direct patient care. Finally, PH and their employers must work to build programs that present PHM as a long‐term career option for residents.
There is a significant impact on the field if those who enter it see it only as something to do while waiting for a position elsewhere. While some of these new‐careerists may stay with the field once they have tried it and become significant contributors, inherent in these answers are the issues of turnover and lack of senior experience many Hospital Medicine programs currently face. Additionally, and outside the scope of this survey, it is unclear what those next positions are and how a brief experience as a hospitalist might impact their future practice.
It is a significant change that residents entering a Primary Care career expect to work with pediatric hospitalists and, in general, see this as a benefit and necessity. The 2007 American Board of Pediatrics' survey found that 27% of respondents planned a career in General Pediatrics with little or no inpatient care.10 Hospitalists of the near future will likely face a dichotomy of needs between primary care providers who trained before, and those who trained after, the existence of hospitalists. Hospitalists will need to understand and address the ongoing needs of both of these groups in order to adequately serve them and their patient‐bases.
Limitations of our study include our small sample size, with a response rate of 43% at best (individual question response rate varied). Though the group was nationally representative, it was skewed towards first year respondents, likely due to the time of year in which it was distributed. There is likely some bias due to the low response rate, in that those more interested in careers as hospitalists might be more likely to respond. This might potentially inflate the percentages of those who state they are interested in being a hospitalist. In addition, given that the last round of the survey went out at the very end of the academic year, graduating residents had a lower response rate.
We were unable to compare opinions across unexposed and exposed residents because only 6.5% reported knowing nothing about the field, and only 2 respondents had not had any exposure to pediatric hospitalists to date. Given that most residencies have PHM services,12 this distinction is unlikely to be significant. In looking at training desires, we did not compare them to residents considering entering other fields of medicine. It may be true that residents considering other fellowships do not desire to do 3 years of fellowship training. That being said, it in no way diminishes the implication that 3‐year fellowships for PHM may not be the right answer for future training.
Strengths of the study include that it is, to our knowledge, the first national study of a group of residents regarding exposure to, and career plans as related to, PH. In addition, the group is gender‐balanced, and represents residents from a range of training sites (urban, suburban, rural) and program sizes. This study offers important information that must be considered in the further development of the field of Pediatric Hospital Medicine.
CONCLUSION
This was the first national study of residents regarding Pediatric Hospital Medicine. Almost all residents are exposed to PH during their training, though a gap of no exposure still exists. More work needs to be done to improve the perception of PHM as a viable long‐term career. Nevertheless, PHM has become a career consideration for trainees. Nearly half agreed that some type of specialized training would be helpful. This information should impact on the development of PHM training programs.
Acknowledgements
Thanks to the American Academy of Pediatrics Section on Hospital Medicine for raffle funding, and Texas Children's Hospital and Dr Yong Han for use of SurveyMonkey and assistance with survey set‐up. Also thanks to Dr Vincent Chang for his guidance and review.
- ,,,;for the Research Advisory Committee of the American Board of Pediatrics.Characteristics of the pediatric hospitalist workforce: its roles and work environment.Pediatrics.2007;120(1):33–39.
- ,,,,,.Effect of a pediatric hospitalist system on housestaff education and experience.Arch Pediatr Adolesc Med.2002;156(9):877–883.
- ,,.Establishing a pediatric hospitalist program at an academic medical center.Clin Pediatr (Phila).2000;39(4):221–227.
- ,,,,,.Restructuring an academic pediatric inpatient service using concepts developed by hospitalists.Clin Pediatr (Phila).2001;40(12):653–660.
- .Employing hospitalists to improve residents' inpatient learning.Acad Med.2001;76(5):556.
- ,,,,,.Community and hospital‐based physicians' attitudes regarding pediatric hospitalist systems.Pediatrics.2005;115(1):34–38.
- ,,,.Pediatric hospitalists: a systematic review of the literature.Pediatrics.2006;117(5):1736–1744.
- American Board of Pediatrics. 2006 General Pediatrics Career Survey. Available at: http://www.abp.org. Accessed on January 15, 2008.
- ,,,,;for the Research Advisory Committee of the American Board of Pediatrics.General pediatrics resident perspectives on training decisions and career choice.Pediatrics.2009;123(1 suppl):S26–S30.
- American Board of Pediatrics. 2007 General Pediatrics Career Survey. Available at: http://www.abp.org. Accessed July 10,2009.
- American Board of Pediatrics. 2009–2010 Workforce Data. Available at: http://www.abp.org. Accessed July 20,2010.
- ,,.Hospitalists' involvement in pediatrics training: perspectives from pediatric residency program and clerkship directors.Acad Med.2009;84(11):1617–1621.
- ,,.Assessing the value of pediatric hospitalist programs: the perspective of hospital leaders.Acad Pediatr.2009;9(3):192–196.
- ,,,.Inpatient staffing within pediatric residency programs: work hour restrictions and the evolving role of the pediatric hospitalist.J Hosp Med.2011;6(in press).
- Accreditation Council for Graduate Medical Education. Available at: http://acgme‐2010standards.org/. Accessed December 15, 2010.
- Society of Hospital Medicine. Available at: http://www.hospitalmedicine.org/AM/Template.cfm?Section=Hospitalist_Definition5:i–iv. doi://10.1002/jhm.776. Available at: http://www3.interscience.wiley.com. Accessed on May 11, 2011.
The number of pediatric hospitalists (PH) in the United States is increasing rapidly. The membership of the American Academy of Pediatrics (AAP) Section on Hospital Medicine has grown to 880 (7/10, AAP Section on Hospital Medicine), and there over 10,000 members of the Society of Hospital Medicine of which an estimated 5% care for children (7/10, Society of Hospital Medicine). Little is known about the educational contributions of pediatric hospitalists, residents' perceptions of hospitalists' roles, or how hospitalists may influence residents' eventual career plans even though 89% of pediatric hospitalists report they serve as teaching attendings.1 Teaching by hospitalists is well received and valued by residents, but, to date, all such data are from single institution studies of individual hospitalist programs.27 Less is known regarding what residents perceive about the differences in patient care provided by hospitalists as compared with traditional pediatric teaching attendings. There is a paucity of information about the level of interest of current pediatric residents in becoming hospitalists, including how many plan such a career, reasons why residents might prefer to become hospitalists, and their perceptions of Pediatric Hospital Medicine (PHM) careers as either long or short term. In addition, the effects of new residency graduates going into Hospital Medicine on the overall pediatric workforce, and how the availability of Hospital Medicine careers affects the choice of practice in Primary Care Pediatrics have not been examined.
We surveyed a national, randomly selected representative sample of pediatric residents to determine their level of exposure to hospitalist attending physicians during training. We asked the resident cohort about their educational experiences with hospitalists, patient care provided by hospitalists on their team, and career plans regarding becoming a hospitalist, including perceived needs for different or additional training. We obtained further information about reasons why hospitalist positions were appealing and about the current relationship between careers in Pediatric Hospital Medicine and Primary Care. To our knowledge, this is the first national study of how pediatric hospitalists might influence residents in the domains of education, patient care, and career planning.
METHODS
We conducted a survey of randomly selected pediatric residents from the AAP membership database. The selection was done by random generation by the AAP Department of Research from the membership database, in the same way members are selected for the annual Survey of Fellows and the annual pediatric level 3 (PL3) survey. Permission was obtained from the American Academy of Pediatrics Section on Residents (AAP SORe) to survey a selection of US pediatric residents in June 2007. The full sample of US pediatric residents included 9569 residents. The AAP SORe had 7694 e‐mail addresses from which the AAP Department of Research generated a random sample of 300 for our use, including Medicine‐Pediatric, Pediatric, and Pediatric Chief residents. One of the researchers (A.H.) sent an e‐mail with the title $200 AAP Career Raffle Survey containing a link to a SurveyMonkey survey (see Supporting Appendix AQuestionnaire in the online version of this article) and offering incentivized participation with a raffle. The need for informed consent was waived, as consent was implied by participation in the survey. The survey was taken anonymously by connecting through the link, and when it was completed, residents were asked to separately e‐mail a Section on Hospital Medicine address if they wished to participate in the raffle. Their raffle request was not linked to their survey results in any way. The $200 was supplied by the AAP Section on Hospital Medicine. The survey was sent 3 times. We analyzed responses with descriptive statistics. Institutional Review Board approval was obtained from Concord Hospital in Concord, New Hampshire.
RESULTS
The respondents are described in Figure 1 and Table 1. For their exposure to PHM, 54% (73 of 111) reported PH attendings in medical school; 90% (75 of 83) did have or will have PH attendings during residency, with no significant variation by program size (small, medium, large, or extra large). The degree of exposure was not asked. To learn about PHM, 47% (46 of 97 respondents) asked a PH in their program, while 28% (27 of 99) visited the AAP web site. Sixty‐eight percent (73 of 108) felt familiar or very familiar with PHM.
| % | Absolute Response Rate | |
|---|---|---|
| ||
| Training year | ||
| PL1 | 47.5 | 57 |
| PL2 | 35 | 42 |
| PL3 | 9 | 11 |
| PL4 | 1 | 1 |
| Skipped question | 7.5 | 9 |
| Gender | ||
| Male | 31.5 | 38 |
| Female | 61 | 73 |
| Skipped question | 7.5 | 9 |
| Specialty | ||
| Pediatrics | 79 | 95 |
| Med/Peds | 14 | 17 |
| Other (Pediatric combination residencies) | 4 | 5 |
| Skipped question | 3 | 3 |
| Program size | ||
| Less than 15 residents in program | 11 | 12 |
| 16‐30 | 38.5 | 42 |
| 31‐45 | 22.9 | 25 |
| Greater than 45 | 27.5 | 30 |
| Skipped question | 9.1 | 11 |
Table 2 summarizes the respondents' perception of PHM. They report a positive opinion of the field and overwhelmingly feel that PHM is a growing/developing field. Almost none feel PHM will not survive. A small percentage (10%, 28 of 99) felt there was no difference between PH and residents, with 25% (25 of 99) feeling some ambiguity about whether the PH role differs from that of a resident. Many (35 of 99) did not disagree that there is little difference between PH and resident positions, although most did. Sixty percent (59 of 99) agreed or strongly agreed that a PH position would be a good job for the short‐term. Forty‐seven percent (46 of 99) agreed in some form that PHM gives you something to do while you are waiting for another position. Given the choice of PHM as a long‐term opportunity, short‐term opportunity, either or not sure: 21% (21 of 98) saw PHM as a short‐term option only; 26% (25 of 98) saw PHM as a long‐term career only; 49% (48 of 98) saw it as either a short‐term option or long‐term career. Most (65%, 64 of 99) believed PH were better than primary care providers at caring for complex inpatients, but only 28% (28 of 99) thought PH provided better care for routine admissions. Most (82%, 81 of 99) agreed in some form that working with pediatric hospitalists enhances a resident's education.
| Strongly/Somewhat Disagree | Neither Disagree or Agree | Somewhat/Strongly Agree | |
|---|---|---|---|
| |||
| I think it is a great field | 2% (9/99) | 15% (15/99) | 83% (82/99) |
| It's a good job for the short‐term | 13% (13/99) | 27% (27/99) | 60% (59/99) |
| It gives you something to do while you are waiting for another position | 20% (20/99) | 33% (33/99) | 47% (46/99) |
| It's a growing/developing field | 1% (1/99) | 8% (8/99) | 91% (90/99) |
| It's a field that won't survive | 86% (85/99) | 13% (13/99) | 1% (1/99) |
| Hospitalists are better able to take care of complex inpatients than are primary care physicians | 20% (20/99) | 15% (15/99) | 65% (64/99) |
| Hospitalists are better able to take care of routine patient admissions than are primary care physicians | 39% (39/99) | 32% (32/99) | 28% (28/99) |
| There is little difference between hospitalist and resident positions | 65% (64/99) | 25% (25/99) | 10% (10/99) |
| Working with hospitalists enhances a residents education | 2% (2/99) | 16% (16/99) | 82% (81/99) |
On a 5‐point scale ranging from would definitely not include to might or might not include to would definitely include, the majority of respondents felt a PHM job would definitely include Pediatric Wards (86%, 84 of 98) and Inpatient Consultant for Specialists (54%, 52 of 97). Only 47% (46/97) felt the responsibilities would probably or definitely include Medical Student and Resident Education (47%, 46 of 97). The respondents were less certain (might or might not response) if PHM should include Normal Newborn Nursery (37%, 36 of 98), Delivery Room (42%, 41 of 98), Intensive Care Nursery (35%, 34 of 98), ED/Urgent Care (34%, 33 of 98), or Research (50%, 49 of 98). A majority of respondents felt PHM unlikely to include, or felt the job might not or might include: Outpatient Clinics (77%, 75 of 98), Outpatient Consults (81%, 79 of 98), and Pediatric Intensive Care Unit work (70%, 68 of 98).
Of categorical pediatric trainees answering the question, 35% (28 of 80) are considering a PHM career. Immediately post‐residency, 30% (24 of 80) of categorical trainees plan to enter Primary Care (PC), 4% (3 of 80) plan on PHM, and 3% (2 of 80) plan to pursue PH fellowship.
Of all respondents given the choice of whether a factor plays no role, limited role, or strong role in considering a career in PHM: flexible hours (96%, 94 of 98), opportunities to participate in education (97%, 95 of 98), and better salary than PC (94%, 91 of 97) would influence their decision to choose PHM. For 49% (48 of 98), ability to do the job without fellowship would play a strong role in choosing a career in PHM.
Forty‐five percent (44 of 97) support training in addition to residency; 16.5% (16 of 97) are against it; the remaining 38% (37 of 97) are unsure. Three percent (3 of 98) thought 3‐year fellowship best, while 28% (27 of 98) preferred 2‐year fellowship; 29% (28 of 98) would like a hospitalist‐track residency; 28% (27 of 98) believe standard residency sufficient; and 4% (4 of 98) felt a chief year adequate. If they were to pursue PHM, 31% (30 of 98) would enter PH fellowship, 34% (33 of 98) would not, and 36% (35 of 98) were unsure.
On a 5‐point scale, respondents were asked about barriers identified to choosing a career in PHM: 28% (27 of 96) agreed or strongly agreed that not feeling well‐enough trained was a barrier to entering the field; 42% (40 of 96) were agreed in some form that they were unsure of what training they needed; 39% (37 of 95) were unsure about where positions are available. Seven percent (7 of 98) of respondents were less likely to choose to practice Primary Care (PC) pediatrics because of hospitalists. Of respondents choosing PC, 59% (34 of 58) prefer or must have PH to work within their future practices, while 12% (7 of 58) prefer not to, or definitely do not want to, work with PH.
DISCUSSION
In 2006, the American Board of Pediatrics (ABP) General Pediatrics Career Survey found that 1% of first‐time applicants were taking a hospitalist position.8 In 2007, this number grew to 3% choosing a position in Pediatric Hospital Medicine.9, 10 The 2009‐2010 survey data found that 7.6% of first‐time applicants would be taking a job as hospitalist as of July 1.11 Our data suggest this number will continue to grow over the next few years. The growth of PHM has prompted an in‐depth look at the field by the ABP.1, 12, 13 PHM programs appear to have become part of the fabric of pediatric care, with the majority of hospitals with PHM programs planning to continue the programs despite the need to pay for value‐added by hospitalists beyond revenue received for their direct clinical service.13 Looking forward, when the Institute of Medicine recommendations to further restrict resident work hours to 16 hour shifts are implemented, many programs plan on increasing their PHM programs.14, 15 Therefore, residents' views of a career in PHM are important, as they give perspective on attitudes of those who might be, or interact with, hospitalists in the future, and should impact training programs for residents regardless of their interest in a career in PHM.
Our national data support local, large institution studies that hospitalists are positively impacting education.27 However, this study suggests that this is not only a local or large academic center phenomenon, but a national trend towards providing a different and positive education experience for pediatric residents. This mirrors the opinion of the majority of residency and clerkship directors who feel that hospitalists are more accessible to trainees than traditional attendings.12 Training programs should consider this impact when selecting attending hospitalists and supporting their roles as mentors and educators.
As residents finish their training and seek positions as pediatric hospitalists, programs need to be aware that a significant percentage of residents in our survey see PHM as a short‐term career option and/or fail to see a difference between a PH job and their own. Program Directors also need to be aware of the breadth of PHM practice which can include areas our respondents felt were less likely to be part of PHM, such as other inpatient areas and the expectation of research.
While 1 option to address some of these issues is fellowship training, this is not a simple decision. PHM needs to determine if fellowship is truly the best option for future hospitalists and, if so, what the fellowship should look like in terms of duration and scope. While the needs of optimal training should be paramount, resident preferences to not commit to an additional 3 years of training must be considered. Many residents fail to see a difference between the role of PH and their own role during training, and feel that the current format of residency training is all the preparation needed to step into a career as a PH. This demonstrates a clear gap between resident perceptions of PHM and the accepted definition of a hospitalist,16 which reaches far beyond direct inpatient care. While The Core Competencies for Pediatric Hospital Medicine17 address a number of these areas, neither trainees nor hospitalists themselves have fully integrated these into their practice. PH must recognize and prepare for their position as mentors and role models to residents. This responsibility should differentiate PH role from that of a resident, demonstrating roles PH play in policy making, patient safety and quality initiatives, in administration, and in providing advanced thinking in direct patient care. Finally, PH and their employers must work to build programs that present PHM as a long‐term career option for residents.
There is a significant impact on the field if those who enter it see it only as something to do while waiting for a position elsewhere. While some of these new‐careerists may stay with the field once they have tried it and become significant contributors, inherent in these answers are the issues of turnover and lack of senior experience many Hospital Medicine programs currently face. Additionally, and outside the scope of this survey, it is unclear what those next positions are and how a brief experience as a hospitalist might impact their future practice.
It is a significant change that residents entering a Primary Care career expect to work with pediatric hospitalists and, in general, see this as a benefit and necessity. The 2007 American Board of Pediatrics' survey found that 27% of respondents planned a career in General Pediatrics with little or no inpatient care.10 Hospitalists of the near future will likely face a dichotomy of needs between primary care providers who trained before, and those who trained after, the existence of hospitalists. Hospitalists will need to understand and address the ongoing needs of both of these groups in order to adequately serve them and their patient‐bases.
Limitations of our study include our small sample size, with a response rate of 43% at best (individual question response rate varied). Though the group was nationally representative, it was skewed towards first year respondents, likely due to the time of year in which it was distributed. There is likely some bias due to the low response rate, in that those more interested in careers as hospitalists might be more likely to respond. This might potentially inflate the percentages of those who state they are interested in being a hospitalist. In addition, given that the last round of the survey went out at the very end of the academic year, graduating residents had a lower response rate.
We were unable to compare opinions across unexposed and exposed residents because only 6.5% reported knowing nothing about the field, and only 2 respondents had not had any exposure to pediatric hospitalists to date. Given that most residencies have PHM services,12 this distinction is unlikely to be significant. In looking at training desires, we did not compare them to residents considering entering other fields of medicine. It may be true that residents considering other fellowships do not desire to do 3 years of fellowship training. That being said, it in no way diminishes the implication that 3‐year fellowships for PHM may not be the right answer for future training.
Strengths of the study include that it is, to our knowledge, the first national study of a group of residents regarding exposure to, and career plans as related to, PH. In addition, the group is gender‐balanced, and represents residents from a range of training sites (urban, suburban, rural) and program sizes. This study offers important information that must be considered in the further development of the field of Pediatric Hospital Medicine.
CONCLUSION
This was the first national study of residents regarding Pediatric Hospital Medicine. Almost all residents are exposed to PH during their training, though a gap of no exposure still exists. More work needs to be done to improve the perception of PHM as a viable long‐term career. Nevertheless, PHM has become a career consideration for trainees. Nearly half agreed that some type of specialized training would be helpful. This information should impact on the development of PHM training programs.
Acknowledgements
Thanks to the American Academy of Pediatrics Section on Hospital Medicine for raffle funding, and Texas Children's Hospital and Dr Yong Han for use of SurveyMonkey and assistance with survey set‐up. Also thanks to Dr Vincent Chang for his guidance and review.
- ,,,;for the Research Advisory Committee of the American Board of Pediatrics.Characteristics of the pediatric hospitalist workforce: its roles and work environment.Pediatrics.2007;120(1):33–39.
- ,,,,,.Effect of a pediatric hospitalist system on housestaff education and experience.Arch Pediatr Adolesc Med.2002;156(9):877–883.
- ,,.Establishing a pediatric hospitalist program at an academic medical center.Clin Pediatr (Phila).2000;39(4):221–227.
- ,,,,,.Restructuring an academic pediatric inpatient service using concepts developed by hospitalists.Clin Pediatr (Phila).2001;40(12):653–660.
- .Employing hospitalists to improve residents' inpatient learning.Acad Med.2001;76(5):556.
- ,,,,,.Community and hospital‐based physicians' attitudes regarding pediatric hospitalist systems.Pediatrics.2005;115(1):34–38.
- ,,,.Pediatric hospitalists: a systematic review of the literature.Pediatrics.2006;117(5):1736–1744.
- American Board of Pediatrics. 2006 General Pediatrics Career Survey. Available at: http://www.abp.org. Accessed on January 15, 2008.
- ,,,,;for the Research Advisory Committee of the American Board of Pediatrics.General pediatrics resident perspectives on training decisions and career choice.Pediatrics.2009;123(1 suppl):S26–S30.
- American Board of Pediatrics. 2007 General Pediatrics Career Survey. Available at: http://www.abp.org. Accessed July 10,2009.
- American Board of Pediatrics. 2009–2010 Workforce Data. Available at: http://www.abp.org. Accessed July 20,2010.
- ,,.Hospitalists' involvement in pediatrics training: perspectives from pediatric residency program and clerkship directors.Acad Med.2009;84(11):1617–1621.
- ,,.Assessing the value of pediatric hospitalist programs: the perspective of hospital leaders.Acad Pediatr.2009;9(3):192–196.
- ,,,.Inpatient staffing within pediatric residency programs: work hour restrictions and the evolving role of the pediatric hospitalist.J Hosp Med.2011;6(in press).
- Accreditation Council for Graduate Medical Education. Available at: http://acgme‐2010standards.org/. Accessed December 15, 2010.
- Society of Hospital Medicine. Available at: http://www.hospitalmedicine.org/AM/Template.cfm?Section=Hospitalist_Definition5:i–iv. doi://10.1002/jhm.776. Available at: http://www3.interscience.wiley.com. Accessed on May 11, 2011.
Copyright © 2011 Society of Hospital Medicine

Can Healthcare Go From Good to Great?
The American healthcare system produces a product whose quality, safety, reliability, and cost would be incompatible with corporate survival, were they created by a business operating in a competitive industry. Care fails to comport with best evidence nearly half of the time.1 Tens of thousands of Americans die yearly from preventable medical mistakes.2 The healthcare inflation rate is nearly twice that of the rest of the economy, rapidly outstripping the ability of employers, tax revenues, and consumers to pay the mounting bills.
Increasingly, the healthcare system is being held accountable for this lack of value. Whether through a more robust accreditation and regulatory environment, public reporting of quality and safety metrics, or pay for performance (or no pay for errors) initiatives, outside stakeholders are creating performance pressures that scarcely existed a decade ago.
Healthcare organizations and providers have begun to take notice and act, often by seeking answers from industries outside healthcare and thoughtfully importing these lessons into medicine. For example, the use of checklists has been adopted by healthcare (from aviation), with impressive results.3, 4 Many quality methods drawn from industry (Lean, Toyota, Six Sigma) have been used to try to improve performance and remove waste from complex processes.5, 6
While these efforts have been helpful, their focus has generally been at the point‐of‐careimproving the care of patients with acute myocardial infarction or decreasing readmissions. However, while the business community has long recognized that poor management and structure can thwart most efforts to improve individual processes, healthcare has paid relatively little attention to issues of organizational structure and leadership. The question arises: Could methods that have been used to learn from top‐performing businesses be helpful to healthcare's efforts to improve its own organizational performance?
In this article, we describe perhaps the best known effort to identify top‐performing corporations, compare them to carefully selected organizations that failed to achieve similar levels of performance, and glean lessons from these analyses. This effort, described in a book entitled Good to Great: Why Some Companies Make the Leapand Others Don't, has sold more than 3 million copies in its 35 languages, and is often cited by business leaders as a seminal work. We ask whether the methods of Good to Great might be applicable to healthcare organizations seeking to produce the kinds of value that patients and purchasers need and deserve.
GOOD TO GREAT METHODOLOGY
In 2001, business consultant Jim Collins published Good to Great. Its methods can be divided into 3 main components: (1) a gold standard metric to identify top organizations; (2) the creation of a control group of organizations that appeared similar to the top performers at the start of the study, but failed to match the successful organizations' performance over time; and (3) a detailed review of the methods, leadership, and structure of both the winning and laggard organizations, drawing lessons from their differences. Before discussing whether these methods could be used to analyze healthcare organizations, it is worth describing Collins' methods in more detail.
The first component of Good to Great's structure was the use of 4 metrics to identify top‐performing companies (Table 1). To select the good to great companies, Collins and his team began with a field of 1435 companies drawn from Fortune magazine's rankings of America's largest public companies. They then used the criteria in Table 1 to narrow the list to their final 11 companies, which formed the experimental group for the analysis.
|
| The company had to show a pattern of good performance punctuated by a transition point when it shifted to great performance. Great performance was defined as a cumulative total stock return of at least 3 times the general stock market for the period from the transition point through 15 years. |
| The transition from good to great had to be company‐specific, not an industry‐wide event. |
| The company had to be an established enterprise, not a startup, in business for at least 10 years prior to its transition. |
| At the time of the selection (in 1996), the company still had to show an upward trend. |
After identifying these 11 top‐performing companies, Collins created a control group, composed of companies with similar attributes that could have made the transition, but failed to do so.7 To create the control group, Collins matched and scored a pool of control group candidates based on the following criteria: similarities of business model, size, age, and cumulative stock returns prior to the good to great transition. When there were several potential controls, Collins chose companies that were larger, more profitable, and had a stronger market position and reputation prior to the transition, in order to increase the probability that the experimental companies' successes were not incidental.8 Table 2 lists the paired experimental and control companies.
| Experimental Company | Control Company |
|---|---|
| |
| Abbott | Upjohn |
| Circuit City | Silo |
| Fannie Mae | Great Western |
| Gillette | Warner‐Lambert |
| Kimberly‐Clark | Scott Paper |
| Kroger | A&P |
| Nucor | Bethlehem Steel |
| Philip Morris | R.J. Reynolds |
| Pitney Bowes | Addressograph |
| Walgreen's | Eckerd |
| Wells Fargo | Bank of America |
Finally, Collins performed a detailed historical analysis on the experimental and control groups, using materials (such as major articles published on the company, books, academic case studies, analyst reports, and financial and annual reports) that assessed the companies in real time. Good to Great relied on evidence from the period of interest (ie, accrued prior to the transition point) to avoid biases that would likely result from relying on retrospective sources of data.9
This analysis identified a series of factors that were generally present in good to great companies and absent in the control organizations. In brief, they were: building a culture of discipline, making change through gradual and consistent improvement, having a leader with a paradoxical blend of personal humility and professional will, and relentlessly focusing on hiring and nurturing the best employees. Over 6000 articles and 5 years of analysis support these conclusions.8
EFFORTS TO DATE TO ANALYZE HEALTHCARE ORGANIZATIONAL CHARACTERISTICS
We reviewed a convenience sample of the literature on organizational change in healthcare, and found only 1 study that utilized a similar methodology to that of Good to Great: an analysis of the academic medical centers that participate in the University HealthSystem Consortium (UHC). Drawing inspiration from Collins' methodologies, the UHC study developed a holistic measure of quality, based on safety, mortality, compliance with evidence‐based practices, and equity of care. Using these criteria, the investigators selected 3 UHC member organizations that were performing extremely well, and 3 others performing toward the middle and bottom of the pack. Experts on health system organization then conducted detailed site visits to these 6 academic medical centers. The researchers were blinded to these rankings at the time of the visits, but were able to perfectly predict which cohort the organizations were in.
The investigators analyzed the factors that seemed to be present in the top‐performing organizations, but were absent in the laggards, and found: hospital leadership emphasizing a patients‐first mission, an alignment of departmental objectives to reduce conflict, a concrete accountability structure for quality, a relentless focus on measurable improvement, and a culture promoting interprofessional collaboration on quality.10
While the UHC study is among the most robust exploration of healthcare organization dynamics in the literature, it has a few limitations. The first is that it studied a small, relatively specialized population: UHC members, which are large, mostly urban, well‐resourced teaching hospitals. While studying segments of populations can limit the generalizability of some of the UHC studies' findings, their approach can be a useful model to apply to studying other types of healthcare institutions. (And, to be fair, Good to Great also studies a specialized populationFortune 500 companiesand thus its lessons need to be extrapolated to other businesses, such as small companies, with a degree of caution.) The study also suffers from the relative paucity of publicly accessible organizational data in healthcare. The fact that the UHC investigators depended on both top‐performing and laggard hospitals, to voluntarily release their organizational data and permit a detailed site visit, potentially introduces a selection bias into the survey population, a bias not present in Good to Great due to Collins' protocol for matching cases and controls.
There have been several other efforts, using different methods, to determine organizational predictors of success in healthcare. The results of several important studies are shown in Table 3. Taken together, they indicate that higher performing organizations make practitioners accountable for performance measurements, and implement systems designed to both reduce errors and facilitate adherence to evidence‐based guidelines. In addition to these studies, several consulting organizations and foundations have performed focused reviews of high‐performing healthcare organizations in an effort to identify key success factors.11 These studies, while elucidating factors that influence organizational performance, suffer from variable quality measures and subjective methods for gathering organizational data, both of which are addressed within a good to great‐style analysis.12
| Study | Key Findings |
|---|---|
| |
| Keroack et al.10 | Superior‐performing organizations were distinguished from average ones by having: hospital leadership emphasizing a patients‐first mission, an alignment of departmental objectives to reduce conflict, concrete accountability structures for quality, a relentless focus on measurable improvement, and a culture promoting interprofessional collaboration toward quality improvement measures. |
| Jha et al.22 | Factors that led to the VA's improved performance included: |
| Implementation of a systematic approach to measurement, management, and accountability for quality. | |
| Initiating routine performance measurements for high‐priority conditions. | |
| Creating performance contracts to hold managers accountable for meeting improvement goals. | |
| Having an independent agency gather and monitor data. | |
| Implementing process improvements, such as an integrated, comprehensive medical‐record system. | |
| Making performance data public and distributing these data widely within the VA and among other key stakeholders (veterans' service organizations, Congress). | |
| Shortell et al.20 | Focusing on reducing the barriers and encouraging the adoption of evidence‐based organizational management is associated with better patient outcomes. Examples of reducing barriers to encourage adoption of evidence‐based guidelines include: |
| Installing an IT system to improve chronic care management. | |
| Creating a culture where practitioners can help each other learn from their mistakes. | |
| Knaus et al.21 | The interaction and coordination of each hospital's ICU staff had a greater correlation with reduced mortality rates than did the unit's administrative structure, amount of specialized treatment used, or the hospital's teaching status. |
| Pronovost et al.3 | Introducing a checklist of 5 evidence‐based procedures into a healthcare team's operation can significantly reduce the rate of catheter‐associated infections. |
| Simple process change interventions, such as checklists, must be accompanied by efforts to improve team culture and create leadership accountability and engagement. | |
| Pronovost et al.30 | Implementing evidence‐based therapies by embedding them within a healthcare team's culture is more effective than simply focusing on changing physician behavior. |
| The authors proposed a 4‐step model for implementing evidence‐based therapies: select interventions with the largest benefit and lowest barriers to use, identify local barriers to implementation, measure performance, and ensure all patients receive the interventions. | |
Perhaps the best‐known study on healthcare organizational performance is The Dartmouth Atlas, an analysis that (though based on data accumulated over more than 30 years) has received tremendous public attention, in recent years, in the context of the debate over healthcare reform.13 However, by early 2010, the Dartmouth analysis was stirring controversy, with some observers expressing concerns over its focus on care toward the end of life, its methods for adjusting for case‐mix and sociodemographic predictors of outcomes and costs, and its exclusive use of Medicare data.14, 15 These limitations are also addressed by a good to great‐style analysis.
WOULD A GOOD TO GREAT ANALYSIS BE POSSIBLE IN HEALTHCARE?
While this review of prior research on organizational success factors in healthcare illustrates considerable interest in this area, none of the studies, to date, matches Good to Great in the robustness of the analysis or, obviously, its impact on the profession. Could a good to great analysis be carried out in healthcare? It is worth considering this by assessing each of Collins' 3 key steps: identifying the enterprises that made a good to great leap, selecting appropriate control organizations, and determining the factors that contributed to the successes of the former group.
Good to Great used an impressive elevation in stock price as a summary measure of organizational success. In the for‐profit business world, it is often assumed that Adam Smith's invisible hand makes corporate information available to investors, causing an organization's stock price to capture the overall success of its business strategy, including its product quality and operational efficiency.16 In the healthcare world, mostly populated by non‐profit organizations that are simultaneously working toward a bottom line and carrying out a social mission, there is no obvious equivalent to the stock price for measuring overall organizational performance and value. All of the methods for judging top hospitals, for example, are flaweda recent study found that the widely cited U.S. News & World Report's America's Best Hospitals list is largely driven by hospital reputation,17 while another study found glaring inconsistencies among methods used to calculate risk‐adjusted mortality rates.18 A generally accepted set of metrics defining the value of care produced by a healthcare organization (including quality, safety, access, patient satisfaction, and efficiency) would be needed to mirror the first good to great step: defining top‐performing organizations using a gold standard.19 The summary measure used in the UHC study is the closest we have seen to a good to great‐style summary performance measure in healthcare.10
While it is important to identify a gold‐standard measure of organizational quality, careful selection of a control organization may be the most important step in conducting a good to great analysis. Although Collins' use of stock price as a summary measure of organizational performance is the best measure available in business, it is by no means perfect. Despite this shortcoming, however, Collins believes that the central requirement is not finding a perfect measure of organizational success, but rather determining what correlates with a divergence of performance in stock price (J. Collins, oral communication, July 2010). Similar to clinical trials, meticulous matching of a good to great organization with a control has the advantage of canceling out extraneous environmental factors, thereby enabling the elucidation of organizational factors that contribute to divergent performance. Good to Great's methods depended on substantial historical background to define top performers and controls. Unfortunately, healthcare lacks an analog to the business world's robust historical and publicly accessible record of performance and organizational data. Therefore, even if a certain organization was determined to be a top performer based on a gold‐standard measure, selecting a control organization by matching its organizational and performance data to the top performer's would be unfeasible.
Finally, the lack of a historical record in healthcare also places substantial roadblocks in the way of looking under the organization's hood. Even in pioneering organizational analyses by Shortell et al.,20 Knaus et al.,21 and Jha et al.,22 substantial parts of their analyses relied on retrospective accounts to determine organizational characteristics. To remove the bias that comes from knowing the organization's ultimate performance, Collins was careful to base his analysis of organizational structures and leadership on documents available before the good to great transition. Equivalent data in healthcare are extremely difficult to find.
While it is best to rely on an historical record, it may be possible to carry out a good to great‐type analysis through meticulous structuring of personal interviews. Collins has endorsed a non‐healthcare study that utilized the good to great matching strategy but used personal interviews to make up for lack of access to a substantial historical record.23 To reduce the bias inherent in relying on interviews, the research team ensured that the good to great transition was sustained for many years, and that the practices elicited from the interviews started before the good to great transition. Both of these techniques helped increase the probability that the identified practices contributed to the transition to superior results (in this case, in public education outcomes) and, thus, that the adoption of these practices could result in improvements elsewhere (J. Collins, oral communication, July 2010).
To make such a study possible in healthcare, more organizational data are required. Without prodding by outside stakeholders, most healthcare organizations have been reluctant to publicize performance data for fear of malpractice risk,24 or based on their belief that current data paint an incomplete or inaccurate picture of their quality.25 Trends toward required reporting of quality data (such as via Medicare's Hospital Compare Web site) offer hope that future comparisons could rely on robust organizational quality and safety data. Instituting healthcare analogs to Securities & Exchange Commission (SEC) reporting mandates would further ameliorate this information deficit.26
While we believe that Good to Great offers lessons relevant to healthcare, there are limitations that are worth considering. First, the extraordinary complexity of healthcare organizations makes it likely that a matched‐pair‐type study would need to be accompanied by other types of analyses, including more quantitative analyses of large datasets, to give a full picture of structural and leadership predictors of strong performance. Moreover, before embracing the good to great method, some will undoubtedly point to the demise of Circuit City and Fannie Mae (2 of the Good to Great companies; Table 2) as a cautionary note. Collins addresses this issue with the commonsensical argument that the success of a company needs to be judged in the context of the era. By way of analogy, he points to the value of studying a sports team, such as the John Wooden‐coached UCLA teams of the 1960s and 1970s, notwithstanding the less stellar performance of today's UCLA team. In fact, Collins' recent book mines some of these failures for their important lessons.27
GOOD TO GREAT IN HEALTHCARE
Breaking through healthcare's myopia to explore solutions drawn from other industries, such as checklists, simulation, and industrial approaches to quality improvement, has yielded substantial insights and catalyzed major improvements in care. Similarly, we believe that finding ways to measure the performance of healthcare organizations on both cost and quality, to learn from those organizations achieving superior performance, and to create a policy and educational environment that rewards superior performance and helps poor performers improve, is a defining issue for healthcare. This will be particularly crucial as the policy environment changestransitions to Accountable Care Organizations28 and bundled payments29 are likely to increase the pressure on healthcare organizations to learn the secrets of their better‐performing brethren. These shifts are likely to put an even greater premium on the kinds of leadership, organizational structure, and ability to adapt to a changing environment that Collins highlighted in his analysis. After all, it is under the most challenging conditions that top organizations often prove their mettle.
Although there are considerable challenges in performing a good to great analysis in healthcare (Table 4), the overall point remains: Healthcare is likely to benefit from rigorous, unbiased methods to distinguish successful from less successful organizations, to learn the lessons of both, and to apply these lessons to improvement efforts.
| Issue* | Good to Great* | What Exists in Healthcare | How Healthcare Can Fill in the Gaps |
|---|---|---|---|
| |||
| Gold standard measure of quality | Cumulative total stock return of at least 3 times the general market for the period from the transition point through 15 years. | Risk‐adjusted patient outcomes data (eg, mortality), process data (eg, appropriate medication use), structural data (eg, stroke center). | Create a more robust constellation of quality criteria to measure organizational performance (risk‐adjusted patient outcomes, avoidable deaths, adherence to evidence‐based guidelines, cost effectiveness, patient satisfaction); develop a generally accepted roll‐up measure. Of the studies we reviewed, the UHC study's summary measure was the closest representation to a good to great‐summary performance measure. |
| At the time of the selection, the good to great company still had to show an upward trend. | The study of the VA's transformation and the ongoing UHC study stand out as examples of studying the upward trends of healthcare organizations.22 | Make sure that the high‐performing healthcare organizations are still improvingas indicated by gold standard measures. Once the organizations are identified, study the methods these organizations utilized to improve their performance. | |
| The turnaround had to be company‐specific, not an industry‐wide event. | A few organizations have been lauded for transformations (such as the VA system).22 In most circumstances, organizations praised for high quality (eg, Geisinger, Mayo Clinic, Cleveland Clinic) have long‐established corporate tradition and culture that would be difficult to imitate. The VA operates within a system that is unique and not replicable by most healthcare organizations. | Healthcare needs to identify more examples like the VA turnaround, particularly examples of hospitals or healthcare organizations operating in more typical environmentssuch as a community or rural hospital. | |
| The company had to be an established enterprise, not a startup, in business for at least 10 years prior to its transition. | Most of the healthcare organizations of interest are large organizations with complex corporate cultures, not startups. | Not applicable. | |
| Comparison method | Collins selected a comparison company that was almost exactly the same as the good to great company, except for the transition. The selection criteria were business fit, size fit, age fit, stock chart fit, conservative test, and face validity.* | Healthcare organizational studies are mostly comparisons of organizations that all experience success; few studies compare high‐performing with nonhigh‐performing organizations. (Jha et al. compared Medicare data from non‐VA hospitals and the VA, but did not use similar criteria to select similar organizations22; Keroack and colleagues' comparison of 3 mediocre to 3 superior‐performing hospitals is the closest analog to the Good to Great methodology thus far.10) | Similar to the Good to Great study, a set of factors that can categorize healthcare organizations according to similarities must be devised (eg, outpatient care, inpatient care, academic affiliation, tertiary care center, patient demographics), but finding similar organizations whose performance diverged over time is challenging. |
| Analysis of factors that separated great companies from those that did not make the transition to greatness | Good to Great used annual reports, letters to shareholders, articles written about the company during the period of interest, books about the company, business school case studies, analyst reports written in real time. | Most of the research conducted thus far has been retrospective analyses of why organizations became top performers. | The historical source of data is almost nonexistent in comparison with the business world. A parallel effort would have to capture a mixture of structure and process changes, along with organizational variables. The most effective method would be a prospective organizational assessment of several organizations, following them over time to see which ones markedly improved their performance. |
- ,,, et al.The quality of health care delivered to adults in the United States.N Engl J Med.2003;348(26):2635–2645.
- ,,;for the Institute of Medicine (US), Committee on Quality of Health Care in America.To Err Is Human: Building a Safer Health System.Washington, DC:National Academy Press;1999. Available at: http://www.nap.edu/books/0309068371/html/. Accessed August 22, 2011.
- ,,, et al.An intervention to decrease catheter‐related bloodstream infections in the ICU.N Engl J Med.2006;355(26):2725–2732.
- ,,, et al.A surgical safety checklist to reduce morbidity and mortality in a global population.N Engl J Med.2009;360(5):491–499.
- ,,,,,.Using industrial processes to improve patient care.BMJ.2004;328(7432):162–164.
- ,,,,.Lean six sigma in healthcare.J Healthc Qual.2006;28(2):4–11.
- .Good to great.Fast Company. September 30,2001. Available at: http://www.fastcompany.com/magazine/51/goodtogreat.html. Accessed August 22, 2011.
- .Good to Great: Why Some Companies Make the Leap… and Others Don't.New York, NY:HarperBusiness;2001.
- .It's in the research.Jim Collins. Available at: http://www.jimcollins.com/books/research.html. Accessed May 23,2010.
- ,,,,,.Organizational factors associated with high performance in quality and safety in academic medical centers.Acad Med.2007;82(12):1178–1186.
- ,,,,.Hosptial Quality: Ingredients for Success—a Case Study of Beth Israel Deaconess Medical Center.New York, NY:Commonwealth Fund;2004. Available at: http://www.commonwealthfund.org/Content/Publications/Fund‐Reports/2004/Jul/Hospital‐Quality–Ingredients‐for‐Success‐A‐Case‐Study‐of‐Beth‐Israel‐Deaconess‐Medical‐Center. aspx. Accessed August 22, 2011.
- ,,;for the Commonwealth Fund.Hospital quality improvement strategies and lessons from U.S. hospitals.New York, NY:Commonwealth Fund;2007. Available at: http://www.commonwealthfund.org/usr_doc/Silow‐Carroll_hosp_quality_ improve_strategies_lessons_1009.pdf?section=4039. Accessed August 22, 2011.
- .The cost conundrum: what a Texas town can teach us about healthcare.The New Yorker. June 1,2009.
- .A map to bad policy—hospital efficiency measures in the Dartmouth Atlas.N Engl J Med.2010;362(7):569–574.
- ,.Critics question study cited in health debate.The New York Times. June 2,2010.
- Smith A. Campbell RH, Skinner AS, eds.An Inquiry Into the Nature and Causes of the Wealth of Nations.Oxford, England:Clarendon Press;1976.
- .The role of reputation in U.S. News 152(8):521–525.
- ,,,,.Variability in the measurement of hospital‐wide mortality rates.N Engl J Med.2010;363(26):2530–2539.
- .The elephant of patient safety: what you see depends on how you look.Jt Comm J Qual Patient Saf.2010;36(9):399–401.
- ,,.Improving patient care by linking evidence‐based medicine and evidence‐based management.JAMA.2007;298(6):673–676.
- ,,,.An evaluation of outcome from intensive care in major medical centers.Ann Intern Med.1986;104(3):410–418.
- ,,,.Effect of the transformation of the Veterans Affairs Health Care System on the quality of care.N Engl J Med.2003;348(22):2218–2227.
- ;for the Morrison Institute for Public Policy, Center for the Future of Arizona.Why Some Schools With Latino Children Beat the Odds, and Others Don't.Tempe, AZ:Morrison Institute for Public Policy;2006.
- ,,, et al.Error reporting and disclosure systems: views from hospital leaders.JAMA.2005;293(11):1359–1366.
- .Public release of performance data: a progress report from the front.JAMA.2000;283(14):1884–1886.
- ,,.The GAAP in quality measurement and reporting.JAMA.2007;298(15):1800–1802.
- .How the Mighty Fall: And Why Some Companies Never Give in.New York, NY:Jim Collins [distributed in the US and Canada exclusively by HarperCollins Publishers];2009.
- ,,,.Creating accountable care organizations: the extended hospital medical staff.Health Aff (Millwood).2007;26(1):w44–w57.
- ,,,.Using Medicare payment policy to transform the health system: a framework for improving performance.Health Aff (Millwood).2009;28(2):w238–w250.
- ,,.Translating evidence into practice: a model for large scale knowledge translation.BMJ.2008;337:a1714.
The American healthcare system produces a product whose quality, safety, reliability, and cost would be incompatible with corporate survival, were they created by a business operating in a competitive industry. Care fails to comport with best evidence nearly half of the time.1 Tens of thousands of Americans die yearly from preventable medical mistakes.2 The healthcare inflation rate is nearly twice that of the rest of the economy, rapidly outstripping the ability of employers, tax revenues, and consumers to pay the mounting bills.
Increasingly, the healthcare system is being held accountable for this lack of value. Whether through a more robust accreditation and regulatory environment, public reporting of quality and safety metrics, or pay for performance (or no pay for errors) initiatives, outside stakeholders are creating performance pressures that scarcely existed a decade ago.
Healthcare organizations and providers have begun to take notice and act, often by seeking answers from industries outside healthcare and thoughtfully importing these lessons into medicine. For example, the use of checklists has been adopted by healthcare (from aviation), with impressive results.3, 4 Many quality methods drawn from industry (Lean, Toyota, Six Sigma) have been used to try to improve performance and remove waste from complex processes.5, 6
While these efforts have been helpful, their focus has generally been at the point‐of‐careimproving the care of patients with acute myocardial infarction or decreasing readmissions. However, while the business community has long recognized that poor management and structure can thwart most efforts to improve individual processes, healthcare has paid relatively little attention to issues of organizational structure and leadership. The question arises: Could methods that have been used to learn from top‐performing businesses be helpful to healthcare's efforts to improve its own organizational performance?
In this article, we describe perhaps the best known effort to identify top‐performing corporations, compare them to carefully selected organizations that failed to achieve similar levels of performance, and glean lessons from these analyses. This effort, described in a book entitled Good to Great: Why Some Companies Make the Leapand Others Don't, has sold more than 3 million copies in its 35 languages, and is often cited by business leaders as a seminal work. We ask whether the methods of Good to Great might be applicable to healthcare organizations seeking to produce the kinds of value that patients and purchasers need and deserve.
GOOD TO GREAT METHODOLOGY
In 2001, business consultant Jim Collins published Good to Great. Its methods can be divided into 3 main components: (1) a gold standard metric to identify top organizations; (2) the creation of a control group of organizations that appeared similar to the top performers at the start of the study, but failed to match the successful organizations' performance over time; and (3) a detailed review of the methods, leadership, and structure of both the winning and laggard organizations, drawing lessons from their differences. Before discussing whether these methods could be used to analyze healthcare organizations, it is worth describing Collins' methods in more detail.
The first component of Good to Great's structure was the use of 4 metrics to identify top‐performing companies (Table 1). To select the good to great companies, Collins and his team began with a field of 1435 companies drawn from Fortune magazine's rankings of America's largest public companies. They then used the criteria in Table 1 to narrow the list to their final 11 companies, which formed the experimental group for the analysis.
|
| The company had to show a pattern of good performance punctuated by a transition point when it shifted to great performance. Great performance was defined as a cumulative total stock return of at least 3 times the general stock market for the period from the transition point through 15 years. |
| The transition from good to great had to be company‐specific, not an industry‐wide event. |
| The company had to be an established enterprise, not a startup, in business for at least 10 years prior to its transition. |
| At the time of the selection (in 1996), the company still had to show an upward trend. |
After identifying these 11 top‐performing companies, Collins created a control group, composed of companies with similar attributes that could have made the transition, but failed to do so.7 To create the control group, Collins matched and scored a pool of control group candidates based on the following criteria: similarities of business model, size, age, and cumulative stock returns prior to the good to great transition. When there were several potential controls, Collins chose companies that were larger, more profitable, and had a stronger market position and reputation prior to the transition, in order to increase the probability that the experimental companies' successes were not incidental.8 Table 2 lists the paired experimental and control companies.
| Experimental Company | Control Company |
|---|---|
| |
| Abbott | Upjohn |
| Circuit City | Silo |
| Fannie Mae | Great Western |
| Gillette | Warner‐Lambert |
| Kimberly‐Clark | Scott Paper |
| Kroger | A&P |
| Nucor | Bethlehem Steel |
| Philip Morris | R.J. Reynolds |
| Pitney Bowes | Addressograph |
| Walgreen's | Eckerd |
| Wells Fargo | Bank of America |
Finally, Collins performed a detailed historical analysis on the experimental and control groups, using materials (such as major articles published on the company, books, academic case studies, analyst reports, and financial and annual reports) that assessed the companies in real time. Good to Great relied on evidence from the period of interest (ie, accrued prior to the transition point) to avoid biases that would likely result from relying on retrospective sources of data.9
This analysis identified a series of factors that were generally present in good to great companies and absent in the control organizations. In brief, they were: building a culture of discipline, making change through gradual and consistent improvement, having a leader with a paradoxical blend of personal humility and professional will, and relentlessly focusing on hiring and nurturing the best employees. Over 6000 articles and 5 years of analysis support these conclusions.8
EFFORTS TO DATE TO ANALYZE HEALTHCARE ORGANIZATIONAL CHARACTERISTICS
We reviewed a convenience sample of the literature on organizational change in healthcare, and found only 1 study that utilized a similar methodology to that of Good to Great: an analysis of the academic medical centers that participate in the University HealthSystem Consortium (UHC). Drawing inspiration from Collins' methodologies, the UHC study developed a holistic measure of quality, based on safety, mortality, compliance with evidence‐based practices, and equity of care. Using these criteria, the investigators selected 3 UHC member organizations that were performing extremely well, and 3 others performing toward the middle and bottom of the pack. Experts on health system organization then conducted detailed site visits to these 6 academic medical centers. The researchers were blinded to these rankings at the time of the visits, but were able to perfectly predict which cohort the organizations were in.
The investigators analyzed the factors that seemed to be present in the top‐performing organizations, but were absent in the laggards, and found: hospital leadership emphasizing a patients‐first mission, an alignment of departmental objectives to reduce conflict, a concrete accountability structure for quality, a relentless focus on measurable improvement, and a culture promoting interprofessional collaboration on quality.10
While the UHC study is among the most robust exploration of healthcare organization dynamics in the literature, it has a few limitations. The first is that it studied a small, relatively specialized population: UHC members, which are large, mostly urban, well‐resourced teaching hospitals. While studying segments of populations can limit the generalizability of some of the UHC studies' findings, their approach can be a useful model to apply to studying other types of healthcare institutions. (And, to be fair, Good to Great also studies a specialized populationFortune 500 companiesand thus its lessons need to be extrapolated to other businesses, such as small companies, with a degree of caution.) The study also suffers from the relative paucity of publicly accessible organizational data in healthcare. The fact that the UHC investigators depended on both top‐performing and laggard hospitals, to voluntarily release their organizational data and permit a detailed site visit, potentially introduces a selection bias into the survey population, a bias not present in Good to Great due to Collins' protocol for matching cases and controls.
There have been several other efforts, using different methods, to determine organizational predictors of success in healthcare. The results of several important studies are shown in Table 3. Taken together, they indicate that higher performing organizations make practitioners accountable for performance measurements, and implement systems designed to both reduce errors and facilitate adherence to evidence‐based guidelines. In addition to these studies, several consulting organizations and foundations have performed focused reviews of high‐performing healthcare organizations in an effort to identify key success factors.11 These studies, while elucidating factors that influence organizational performance, suffer from variable quality measures and subjective methods for gathering organizational data, both of which are addressed within a good to great‐style analysis.12
| Study | Key Findings |
|---|---|
| |
| Keroack et al.10 | Superior‐performing organizations were distinguished from average ones by having: hospital leadership emphasizing a patients‐first mission, an alignment of departmental objectives to reduce conflict, concrete accountability structures for quality, a relentless focus on measurable improvement, and a culture promoting interprofessional collaboration toward quality improvement measures. |
| Jha et al.22 | Factors that led to the VA's improved performance included: |
| Implementation of a systematic approach to measurement, management, and accountability for quality. | |
| Initiating routine performance measurements for high‐priority conditions. | |
| Creating performance contracts to hold managers accountable for meeting improvement goals. | |
| Having an independent agency gather and monitor data. | |
| Implementing process improvements, such as an integrated, comprehensive medical‐record system. | |
| Making performance data public and distributing these data widely within the VA and among other key stakeholders (veterans' service organizations, Congress). | |
| Shortell et al.20 | Focusing on reducing the barriers and encouraging the adoption of evidence‐based organizational management is associated with better patient outcomes. Examples of reducing barriers to encourage adoption of evidence‐based guidelines include: |
| Installing an IT system to improve chronic care management. | |
| Creating a culture where practitioners can help each other learn from their mistakes. | |
| Knaus et al.21 | The interaction and coordination of each hospital's ICU staff had a greater correlation with reduced mortality rates than did the unit's administrative structure, amount of specialized treatment used, or the hospital's teaching status. |
| Pronovost et al.3 | Introducing a checklist of 5 evidence‐based procedures into a healthcare team's operation can significantly reduce the rate of catheter‐associated infections. |
| Simple process change interventions, such as checklists, must be accompanied by efforts to improve team culture and create leadership accountability and engagement. | |
| Pronovost et al.30 | Implementing evidence‐based therapies by embedding them within a healthcare team's culture is more effective than simply focusing on changing physician behavior. |
| The authors proposed a 4‐step model for implementing evidence‐based therapies: select interventions with the largest benefit and lowest barriers to use, identify local barriers to implementation, measure performance, and ensure all patients receive the interventions. | |
Perhaps the best‐known study on healthcare organizational performance is The Dartmouth Atlas, an analysis that (though based on data accumulated over more than 30 years) has received tremendous public attention, in recent years, in the context of the debate over healthcare reform.13 However, by early 2010, the Dartmouth analysis was stirring controversy, with some observers expressing concerns over its focus on care toward the end of life, its methods for adjusting for case‐mix and sociodemographic predictors of outcomes and costs, and its exclusive use of Medicare data.14, 15 These limitations are also addressed by a good to great‐style analysis.
WOULD A GOOD TO GREAT ANALYSIS BE POSSIBLE IN HEALTHCARE?
While this review of prior research on organizational success factors in healthcare illustrates considerable interest in this area, none of the studies, to date, matches Good to Great in the robustness of the analysis or, obviously, its impact on the profession. Could a good to great analysis be carried out in healthcare? It is worth considering this by assessing each of Collins' 3 key steps: identifying the enterprises that made a good to great leap, selecting appropriate control organizations, and determining the factors that contributed to the successes of the former group.
Good to Great used an impressive elevation in stock price as a summary measure of organizational success. In the for‐profit business world, it is often assumed that Adam Smith's invisible hand makes corporate information available to investors, causing an organization's stock price to capture the overall success of its business strategy, including its product quality and operational efficiency.16 In the healthcare world, mostly populated by non‐profit organizations that are simultaneously working toward a bottom line and carrying out a social mission, there is no obvious equivalent to the stock price for measuring overall organizational performance and value. All of the methods for judging top hospitals, for example, are flaweda recent study found that the widely cited U.S. News & World Report's America's Best Hospitals list is largely driven by hospital reputation,17 while another study found glaring inconsistencies among methods used to calculate risk‐adjusted mortality rates.18 A generally accepted set of metrics defining the value of care produced by a healthcare organization (including quality, safety, access, patient satisfaction, and efficiency) would be needed to mirror the first good to great step: defining top‐performing organizations using a gold standard.19 The summary measure used in the UHC study is the closest we have seen to a good to great‐style summary performance measure in healthcare.10
While it is important to identify a gold‐standard measure of organizational quality, careful selection of a control organization may be the most important step in conducting a good to great analysis. Although Collins' use of stock price as a summary measure of organizational performance is the best measure available in business, it is by no means perfect. Despite this shortcoming, however, Collins believes that the central requirement is not finding a perfect measure of organizational success, but rather determining what correlates with a divergence of performance in stock price (J. Collins, oral communication, July 2010). Similar to clinical trials, meticulous matching of a good to great organization with a control has the advantage of canceling out extraneous environmental factors, thereby enabling the elucidation of organizational factors that contribute to divergent performance. Good to Great's methods depended on substantial historical background to define top performers and controls. Unfortunately, healthcare lacks an analog to the business world's robust historical and publicly accessible record of performance and organizational data. Therefore, even if a certain organization was determined to be a top performer based on a gold‐standard measure, selecting a control organization by matching its organizational and performance data to the top performer's would be unfeasible.
Finally, the lack of a historical record in healthcare also places substantial roadblocks in the way of looking under the organization's hood. Even in pioneering organizational analyses by Shortell et al.,20 Knaus et al.,21 and Jha et al.,22 substantial parts of their analyses relied on retrospective accounts to determine organizational characteristics. To remove the bias that comes from knowing the organization's ultimate performance, Collins was careful to base his analysis of organizational structures and leadership on documents available before the good to great transition. Equivalent data in healthcare are extremely difficult to find.
While it is best to rely on an historical record, it may be possible to carry out a good to great‐type analysis through meticulous structuring of personal interviews. Collins has endorsed a non‐healthcare study that utilized the good to great matching strategy but used personal interviews to make up for lack of access to a substantial historical record.23 To reduce the bias inherent in relying on interviews, the research team ensured that the good to great transition was sustained for many years, and that the practices elicited from the interviews started before the good to great transition. Both of these techniques helped increase the probability that the identified practices contributed to the transition to superior results (in this case, in public education outcomes) and, thus, that the adoption of these practices could result in improvements elsewhere (J. Collins, oral communication, July 2010).
To make such a study possible in healthcare, more organizational data are required. Without prodding by outside stakeholders, most healthcare organizations have been reluctant to publicize performance data for fear of malpractice risk,24 or based on their belief that current data paint an incomplete or inaccurate picture of their quality.25 Trends toward required reporting of quality data (such as via Medicare's Hospital Compare Web site) offer hope that future comparisons could rely on robust organizational quality and safety data. Instituting healthcare analogs to Securities & Exchange Commission (SEC) reporting mandates would further ameliorate this information deficit.26
While we believe that Good to Great offers lessons relevant to healthcare, there are limitations that are worth considering. First, the extraordinary complexity of healthcare organizations makes it likely that a matched‐pair‐type study would need to be accompanied by other types of analyses, including more quantitative analyses of large datasets, to give a full picture of structural and leadership predictors of strong performance. Moreover, before embracing the good to great method, some will undoubtedly point to the demise of Circuit City and Fannie Mae (2 of the Good to Great companies; Table 2) as a cautionary note. Collins addresses this issue with the commonsensical argument that the success of a company needs to be judged in the context of the era. By way of analogy, he points to the value of studying a sports team, such as the John Wooden‐coached UCLA teams of the 1960s and 1970s, notwithstanding the less stellar performance of today's UCLA team. In fact, Collins' recent book mines some of these failures for their important lessons.27
GOOD TO GREAT IN HEALTHCARE
Breaking through healthcare's myopia to explore solutions drawn from other industries, such as checklists, simulation, and industrial approaches to quality improvement, has yielded substantial insights and catalyzed major improvements in care. Similarly, we believe that finding ways to measure the performance of healthcare organizations on both cost and quality, to learn from those organizations achieving superior performance, and to create a policy and educational environment that rewards superior performance and helps poor performers improve, is a defining issue for healthcare. This will be particularly crucial as the policy environment changestransitions to Accountable Care Organizations28 and bundled payments29 are likely to increase the pressure on healthcare organizations to learn the secrets of their better‐performing brethren. These shifts are likely to put an even greater premium on the kinds of leadership, organizational structure, and ability to adapt to a changing environment that Collins highlighted in his analysis. After all, it is under the most challenging conditions that top organizations often prove their mettle.
Although there are considerable challenges in performing a good to great analysis in healthcare (Table 4), the overall point remains: Healthcare is likely to benefit from rigorous, unbiased methods to distinguish successful from less successful organizations, to learn the lessons of both, and to apply these lessons to improvement efforts.
| Issue* | Good to Great* | What Exists in Healthcare | How Healthcare Can Fill in the Gaps |
|---|---|---|---|
| |||
| Gold standard measure of quality | Cumulative total stock return of at least 3 times the general market for the period from the transition point through 15 years. | Risk‐adjusted patient outcomes data (eg, mortality), process data (eg, appropriate medication use), structural data (eg, stroke center). | Create a more robust constellation of quality criteria to measure organizational performance (risk‐adjusted patient outcomes, avoidable deaths, adherence to evidence‐based guidelines, cost effectiveness, patient satisfaction); develop a generally accepted roll‐up measure. Of the studies we reviewed, the UHC study's summary measure was the closest representation to a good to great‐summary performance measure. |
| At the time of the selection, the good to great company still had to show an upward trend. | The study of the VA's transformation and the ongoing UHC study stand out as examples of studying the upward trends of healthcare organizations.22 | Make sure that the high‐performing healthcare organizations are still improvingas indicated by gold standard measures. Once the organizations are identified, study the methods these organizations utilized to improve their performance. | |
| The turnaround had to be company‐specific, not an industry‐wide event. | A few organizations have been lauded for transformations (such as the VA system).22 In most circumstances, organizations praised for high quality (eg, Geisinger, Mayo Clinic, Cleveland Clinic) have long‐established corporate tradition and culture that would be difficult to imitate. The VA operates within a system that is unique and not replicable by most healthcare organizations. | Healthcare needs to identify more examples like the VA turnaround, particularly examples of hospitals or healthcare organizations operating in more typical environmentssuch as a community or rural hospital. | |
| The company had to be an established enterprise, not a startup, in business for at least 10 years prior to its transition. | Most of the healthcare organizations of interest are large organizations with complex corporate cultures, not startups. | Not applicable. | |
| Comparison method | Collins selected a comparison company that was almost exactly the same as the good to great company, except for the transition. The selection criteria were business fit, size fit, age fit, stock chart fit, conservative test, and face validity.* | Healthcare organizational studies are mostly comparisons of organizations that all experience success; few studies compare high‐performing with nonhigh‐performing organizations. (Jha et al. compared Medicare data from non‐VA hospitals and the VA, but did not use similar criteria to select similar organizations22; Keroack and colleagues' comparison of 3 mediocre to 3 superior‐performing hospitals is the closest analog to the Good to Great methodology thus far.10) | Similar to the Good to Great study, a set of factors that can categorize healthcare organizations according to similarities must be devised (eg, outpatient care, inpatient care, academic affiliation, tertiary care center, patient demographics), but finding similar organizations whose performance diverged over time is challenging. |
| Analysis of factors that separated great companies from those that did not make the transition to greatness | Good to Great used annual reports, letters to shareholders, articles written about the company during the period of interest, books about the company, business school case studies, analyst reports written in real time. | Most of the research conducted thus far has been retrospective analyses of why organizations became top performers. | The historical source of data is almost nonexistent in comparison with the business world. A parallel effort would have to capture a mixture of structure and process changes, along with organizational variables. The most effective method would be a prospective organizational assessment of several organizations, following them over time to see which ones markedly improved their performance. |
- ,,, et al.The quality of health care delivered to adults in the United States.N Engl J Med.2003;348(26):2635–2645.
- ,,;for the Institute of Medicine (US), Committee on Quality of Health Care in America.To Err Is Human: Building a Safer Health System.Washington, DC:National Academy Press;1999. Available at: http://www.nap.edu/books/0309068371/html/. Accessed August 22, 2011.
- ,,, et al.An intervention to decrease catheter‐related bloodstream infections in the ICU.N Engl J Med.2006;355(26):2725–2732.
- ,,, et al.A surgical safety checklist to reduce morbidity and mortality in a global population.N Engl J Med.2009;360(5):491–499.
- ,,,,,.Using industrial processes to improve patient care.BMJ.2004;328(7432):162–164.
- ,,,,.Lean six sigma in healthcare.J Healthc Qual.2006;28(2):4–11.
- .Good to great.Fast Company. September 30,2001. Available at: http://www.fastcompany.com/magazine/51/goodtogreat.html. Accessed August 22, 2011.
- .Good to Great: Why Some Companies Make the Leap… and Others Don't.New York, NY:HarperBusiness;2001.
- .It's in the research.Jim Collins. Available at: http://www.jimcollins.com/books/research.html. Accessed May 23,2010.
- ,,,,,.Organizational factors associated with high performance in quality and safety in academic medical centers.Acad Med.2007;82(12):1178–1186.
- ,,,,.Hosptial Quality: Ingredients for Success—a Case Study of Beth Israel Deaconess Medical Center.New York, NY:Commonwealth Fund;2004. Available at: http://www.commonwealthfund.org/Content/Publications/Fund‐Reports/2004/Jul/Hospital‐Quality–Ingredients‐for‐Success‐A‐Case‐Study‐of‐Beth‐Israel‐Deaconess‐Medical‐Center. aspx. Accessed August 22, 2011.
- ,,;for the Commonwealth Fund.Hospital quality improvement strategies and lessons from U.S. hospitals.New York, NY:Commonwealth Fund;2007. Available at: http://www.commonwealthfund.org/usr_doc/Silow‐Carroll_hosp_quality_ improve_strategies_lessons_1009.pdf?section=4039. Accessed August 22, 2011.
- .The cost conundrum: what a Texas town can teach us about healthcare.The New Yorker. June 1,2009.
- .A map to bad policy—hospital efficiency measures in the Dartmouth Atlas.N Engl J Med.2010;362(7):569–574.
- ,.Critics question study cited in health debate.The New York Times. June 2,2010.
- Smith A. Campbell RH, Skinner AS, eds.An Inquiry Into the Nature and Causes of the Wealth of Nations.Oxford, England:Clarendon Press;1976.
- .The role of reputation in U.S. News 152(8):521–525.
- ,,,,.Variability in the measurement of hospital‐wide mortality rates.N Engl J Med.2010;363(26):2530–2539.
- .The elephant of patient safety: what you see depends on how you look.Jt Comm J Qual Patient Saf.2010;36(9):399–401.
- ,,.Improving patient care by linking evidence‐based medicine and evidence‐based management.JAMA.2007;298(6):673–676.
- ,,,.An evaluation of outcome from intensive care in major medical centers.Ann Intern Med.1986;104(3):410–418.
- ,,,.Effect of the transformation of the Veterans Affairs Health Care System on the quality of care.N Engl J Med.2003;348(22):2218–2227.
- ;for the Morrison Institute for Public Policy, Center for the Future of Arizona.Why Some Schools With Latino Children Beat the Odds, and Others Don't.Tempe, AZ:Morrison Institute for Public Policy;2006.
- ,,, et al.Error reporting and disclosure systems: views from hospital leaders.JAMA.2005;293(11):1359–1366.
- .Public release of performance data: a progress report from the front.JAMA.2000;283(14):1884–1886.
- ,,.The GAAP in quality measurement and reporting.JAMA.2007;298(15):1800–1802.
- .How the Mighty Fall: And Why Some Companies Never Give in.New York, NY:Jim Collins [distributed in the US and Canada exclusively by HarperCollins Publishers];2009.
- ,,,.Creating accountable care organizations: the extended hospital medical staff.Health Aff (Millwood).2007;26(1):w44–w57.
- ,,,.Using Medicare payment policy to transform the health system: a framework for improving performance.Health Aff (Millwood).2009;28(2):w238–w250.
- ,,.Translating evidence into practice: a model for large scale knowledge translation.BMJ.2008;337:a1714.
Cardiac Risk in Diabetes Often Overestimated
DENVER – Diabetes patients with stable symptoms of coronary artery disease appear to have a lower cardiac event risk than previously thought.
The yearly rate of cardiovascular death or nonfatal MI was just 2.4% in a series of 444 consecutive diabetes outpatients with symptoms suggestive of coronary artery disease (CAD) who underwent exercise treadmill or pharmacologic stress single-photon emission computed tomography (SPECT) myocardial perfusion imaging. The cardiovascular death rate of 0.4% per year and the nonfatal MI rate of 2.0% per year were surprisingly low, given that 39% of subjects had known CAD and the rest had symptoms suggestive of CAD, Dr. Jamieson M. Bourque noted at the annual meeting of the American Society of Nuclear Cardiology.
The explanation may be found at least in part in contemporary evidence-based intensive medical management for risk reduction in this traditionally high-risk population, added Dr. Bourque of the University of Virginia, Charlottesville.
Of the 444 symptomatic diabetes patients, 78.5% had no inducible ischemia on stress SPECT myocardial perfusion imaging, 16.5% had 1%-9% left ventricular ischemia, and 5% had left ventricular ischemia of at least 10%. Again, these are lower rates than would be expected based on historical data taken from the era before aggressive risk factor modification in patients with diabetes and CAD symptoms.
During a median 2.4 years of follow-up, the combined rate of cardiovascular death, nonfatal MI, or revascularization more than 4 weeks after myocardial perfusion imaging was 32% in patients with at least 10% left ventricular ischemia on their presenting SPECT study, 14% in those with 1%-9% ischemia, and 8% in those with no ischemia.
Patients who achieved at least 10 METs (metabolic equivalents) on the treadmill during testing had the best prognosis. The sole event that occurred in this subgroup was a late revascularization.
In all, 60% of hard cardiac events occurring in this study were in patients with no perfusion defects. This points to the need for improved patient selection and risk stratification techniques in diabetes patients, according to Dr. Bourque.
He declared having no financial conflicts.
FROM THE ANNUAL MEETING OF THE AMERICAN SOCIETY OF NUCLEAR CARDIOLOGY
Major Finding: The annual combined rate of cardiovascular death or nonfatal MI was 2.4% in a prospective series of diabetes patients with stable symptoms suggestive of CAD.
Data Source: A consecutive series of 444 patients followed for a median of 2.4 years.
Disclosures: No conflicts of interest.