User login
Bariatric surgery leads to less improvement in black patients
“Per this analysis, there are significant racial disparities in perioperative outcomes, weight loss, and quality of life after bariatric surgery,” wrote lead author Michael H. Wood, MD, of Wayne State University, Detroit, and his coauthors, adding that, “while biological differences may explain some of the disparity in outcomes, environmental, social, and behavioral factors likely play a role.” The study was published online in JAMA Surgery.
This study reviewed data from 14,210 participants in the Michigan Bariatric Surgery Collaborative (MBSC), a state-wide consortium and clinical registry of bariatric surgery patients. Matching cohorts were established for black (n = 7,105) and white (n = 7,105) patients who underwent a primary bariatric operation (Roux-en-Y gastric bypass, sleeve gastrectomy, or adjustable gastric banding) between June 2006 and January 2017. The only significant differences between cohorts – clarified as “never more than 1 or 2 percentage points” – were in regard to income brackets and procedure type.
At 30-day follow-up, the rate of overall complications was higher in black patients (628, 8.8%) than in white patients (481, 6.8%; adjusted odds ratio, 1.33; 95% confidence interval, 1.17-1.51; P = .02), as was the length of stay (mean, 2.2 days vs. 1.9 days; aOR, 0.30; 95% CI, 0.20-0.40; P less than .001). Black patients also had a higher rate of both ED visits (541 [11.6%] vs. 826 [7.6%]; aOR, 1.60; 95% CI, 1.43-1.79; P less than .001) and readmissions (414 [5.8%] vs. 245 [3.5%]; aOR, 1.73; 95% CI, 1.47-2.03; P less than .001).
In addition, at 1-year follow-up, black patients had a lower mean weight loss (32.0 kg vs. 38.3 kg; P less than .001) and percentage of total weight loss (26% vs. 29%; P less than .001) compared with white patients. And though black patients were more likely than white patients to report a high quality of life before surgery (2,672 [49.5%] vs. 2,354 [41.4%]; P less than .001), they were less likely to do so 1 year afterward (1,379 [87.2%] vs. 2,133 [90.4%]; P = .002).
The coauthors acknowledged the limitations of their study, including potential unmeasured factors between cohorts such as disease duration or severity. They also noted that a wider time horizon than 30 days post surgery could have altered the results, although “serious adverse events and resource use tend to be highest within the first month after surgery, and we anticipate that this effect would have been negligible.”
The study was funded by Blue Cross Blue Shield Michigan/Blue Care Network. Dr. Wood reported no conflicts of interest. Three of his coauthors reported receiving salary support from Blue Cross Blue Shield Michigan/Blue Care Network for their work with the MBSC, and one other coauthor reported receiving an honorarium for being the MBSC’s executive committee chair.
SOURCE: Wood MH et al. JAMA Surg. 2019 Mar 6. doi: 10.1001/jamasurg.2019.0029.
The well-documented disparities between black and white patients after bariatric surgery are brought back to the forefront via to this study from Wood et al., according to Brian Hodgens, MD, and Kenric M. Murayama, MD, of the University of Hawaii, Honolulu.
Some of the findings hint at the cultural differences that permeate the time before and after a surgery like this: In particular, they highlighted how black patients were more likely to report good or very good quality of life before surgery but less likely after. This could be related to a “difference in perceptions of obesity by black patients,” where they are more hesitant to pursue the surgery than their white counterparts, Dr. Hodgens and Dr. Murayama wrote.
More work is needed, they added, but “this study and others like it can better equip practicing bariatric surgeons to educate themselves and patients on expectations before and after bariatric surgery.”
These comments are adapted from an accompanying editorial ( JAMA Surg. 2019 Mar 6. doi: 1 0.1001/jamasurg.2019.0067 ). Dr. Murayama reported receiving personal fees from Medtronic outside the submitted work.
The well-documented disparities between black and white patients after bariatric surgery are brought back to the forefront via to this study from Wood et al., according to Brian Hodgens, MD, and Kenric M. Murayama, MD, of the University of Hawaii, Honolulu.
Some of the findings hint at the cultural differences that permeate the time before and after a surgery like this: In particular, they highlighted how black patients were more likely to report good or very good quality of life before surgery but less likely after. This could be related to a “difference in perceptions of obesity by black patients,” where they are more hesitant to pursue the surgery than their white counterparts, Dr. Hodgens and Dr. Murayama wrote.
More work is needed, they added, but “this study and others like it can better equip practicing bariatric surgeons to educate themselves and patients on expectations before and after bariatric surgery.”
These comments are adapted from an accompanying editorial ( JAMA Surg. 2019 Mar 6. doi: 1 0.1001/jamasurg.2019.0067 ). Dr. Murayama reported receiving personal fees from Medtronic outside the submitted work.
The well-documented disparities between black and white patients after bariatric surgery are brought back to the forefront via to this study from Wood et al., according to Brian Hodgens, MD, and Kenric M. Murayama, MD, of the University of Hawaii, Honolulu.
Some of the findings hint at the cultural differences that permeate the time before and after a surgery like this: In particular, they highlighted how black patients were more likely to report good or very good quality of life before surgery but less likely after. This could be related to a “difference in perceptions of obesity by black patients,” where they are more hesitant to pursue the surgery than their white counterparts, Dr. Hodgens and Dr. Murayama wrote.
More work is needed, they added, but “this study and others like it can better equip practicing bariatric surgeons to educate themselves and patients on expectations before and after bariatric surgery.”
These comments are adapted from an accompanying editorial ( JAMA Surg. 2019 Mar 6. doi: 1 0.1001/jamasurg.2019.0067 ). Dr. Murayama reported receiving personal fees from Medtronic outside the submitted work.
“Per this analysis, there are significant racial disparities in perioperative outcomes, weight loss, and quality of life after bariatric surgery,” wrote lead author Michael H. Wood, MD, of Wayne State University, Detroit, and his coauthors, adding that, “while biological differences may explain some of the disparity in outcomes, environmental, social, and behavioral factors likely play a role.” The study was published online in JAMA Surgery.
This study reviewed data from 14,210 participants in the Michigan Bariatric Surgery Collaborative (MBSC), a state-wide consortium and clinical registry of bariatric surgery patients. Matching cohorts were established for black (n = 7,105) and white (n = 7,105) patients who underwent a primary bariatric operation (Roux-en-Y gastric bypass, sleeve gastrectomy, or adjustable gastric banding) between June 2006 and January 2017. The only significant differences between cohorts – clarified as “never more than 1 or 2 percentage points” – were in regard to income brackets and procedure type.
At 30-day follow-up, the rate of overall complications was higher in black patients (628, 8.8%) than in white patients (481, 6.8%; adjusted odds ratio, 1.33; 95% confidence interval, 1.17-1.51; P = .02), as was the length of stay (mean, 2.2 days vs. 1.9 days; aOR, 0.30; 95% CI, 0.20-0.40; P less than .001). Black patients also had a higher rate of both ED visits (541 [11.6%] vs. 826 [7.6%]; aOR, 1.60; 95% CI, 1.43-1.79; P less than .001) and readmissions (414 [5.8%] vs. 245 [3.5%]; aOR, 1.73; 95% CI, 1.47-2.03; P less than .001).
In addition, at 1-year follow-up, black patients had a lower mean weight loss (32.0 kg vs. 38.3 kg; P less than .001) and percentage of total weight loss (26% vs. 29%; P less than .001) compared with white patients. And though black patients were more likely than white patients to report a high quality of life before surgery (2,672 [49.5%] vs. 2,354 [41.4%]; P less than .001), they were less likely to do so 1 year afterward (1,379 [87.2%] vs. 2,133 [90.4%]; P = .002).
The coauthors acknowledged the limitations of their study, including potential unmeasured factors between cohorts such as disease duration or severity. They also noted that a wider time horizon than 30 days post surgery could have altered the results, although “serious adverse events and resource use tend to be highest within the first month after surgery, and we anticipate that this effect would have been negligible.”
The study was funded by Blue Cross Blue Shield Michigan/Blue Care Network. Dr. Wood reported no conflicts of interest. Three of his coauthors reported receiving salary support from Blue Cross Blue Shield Michigan/Blue Care Network for their work with the MBSC, and one other coauthor reported receiving an honorarium for being the MBSC’s executive committee chair.
SOURCE: Wood MH et al. JAMA Surg. 2019 Mar 6. doi: 10.1001/jamasurg.2019.0029.
“Per this analysis, there are significant racial disparities in perioperative outcomes, weight loss, and quality of life after bariatric surgery,” wrote lead author Michael H. Wood, MD, of Wayne State University, Detroit, and his coauthors, adding that, “while biological differences may explain some of the disparity in outcomes, environmental, social, and behavioral factors likely play a role.” The study was published online in JAMA Surgery.
This study reviewed data from 14,210 participants in the Michigan Bariatric Surgery Collaborative (MBSC), a state-wide consortium and clinical registry of bariatric surgery patients. Matching cohorts were established for black (n = 7,105) and white (n = 7,105) patients who underwent a primary bariatric operation (Roux-en-Y gastric bypass, sleeve gastrectomy, or adjustable gastric banding) between June 2006 and January 2017. The only significant differences between cohorts – clarified as “never more than 1 or 2 percentage points” – were in regard to income brackets and procedure type.
At 30-day follow-up, the rate of overall complications was higher in black patients (628, 8.8%) than in white patients (481, 6.8%; adjusted odds ratio, 1.33; 95% confidence interval, 1.17-1.51; P = .02), as was the length of stay (mean, 2.2 days vs. 1.9 days; aOR, 0.30; 95% CI, 0.20-0.40; P less than .001). Black patients also had a higher rate of both ED visits (541 [11.6%] vs. 826 [7.6%]; aOR, 1.60; 95% CI, 1.43-1.79; P less than .001) and readmissions (414 [5.8%] vs. 245 [3.5%]; aOR, 1.73; 95% CI, 1.47-2.03; P less than .001).
In addition, at 1-year follow-up, black patients had a lower mean weight loss (32.0 kg vs. 38.3 kg; P less than .001) and percentage of total weight loss (26% vs. 29%; P less than .001) compared with white patients. And though black patients were more likely than white patients to report a high quality of life before surgery (2,672 [49.5%] vs. 2,354 [41.4%]; P less than .001), they were less likely to do so 1 year afterward (1,379 [87.2%] vs. 2,133 [90.4%]; P = .002).
The coauthors acknowledged the limitations of their study, including potential unmeasured factors between cohorts such as disease duration or severity. They also noted that a wider time horizon than 30 days post surgery could have altered the results, although “serious adverse events and resource use tend to be highest within the first month after surgery, and we anticipate that this effect would have been negligible.”
The study was funded by Blue Cross Blue Shield Michigan/Blue Care Network. Dr. Wood reported no conflicts of interest. Three of his coauthors reported receiving salary support from Blue Cross Blue Shield Michigan/Blue Care Network for their work with the MBSC, and one other coauthor reported receiving an honorarium for being the MBSC’s executive committee chair.
SOURCE: Wood MH et al. JAMA Surg. 2019 Mar 6. doi: 10.1001/jamasurg.2019.0029.
FROM JAMA SURGERY
Peer-Review Transparency
Federal health care providers live under a microscope, so it seems only fair that we at Fed Pract honor that reality and open ourselves up to scrutiny as well.1 We hope that by shedding light on our peer-review process and manuscript acceptance rate, we will not only highlight our accomplishments, but identify areas for improvement.
Free access to Fed Pract content has always been our priority. While many journals charge authors or readers, Fed Pract has been and will remain free for readers and authors.2 Advertising enables the journal to support this free model of publishing, but we take care to ensure that advertisements do not influence content in any way. Our advertising policy can be found at www.mdedge.com/fedprac/page/advertising.
In January 2019, Fed Pract placed > 400 peer-reviewed articles published since January 2015 in the PubMed Central (PMC) database (ncbi.nlm.nih.gov/pmc). The full text of these and all future Fed Pract peer-reviewed articles will be available at PMC (no registration required), and the citations also will be included in PubMed. We hope that this process will make it even easier for anyone to access our authors’ works.
In 2018 about 36,000 federal health care providers (HCPs) received hard copies of this journal. The print journal is free, but circulation is limited to HCPs who work at the US Department of Veterans Affairs (VA), US Department of Defense (DoD), and the US Public Health Service (PHS). The mdedge.com/fedprac website, which includes every article published since 2003, had 1.4 million page views in 2018. After reading 3 online articles, readers in the US are asked to complete a simple registration form to help us better customize the reader experience. In some cases, international readers may be asked to pay for access to articles online; however, any VA, DoD, or PHS officer stationed overseas can contact the editorial staff (fedprac@mdedge.com) to ensure that they can access the articles for free.
In 2018 the journal received 164 manuscripts and published 94 articles written by 357 different federal HCPs. The 164 manuscript submissions represented a 45% growth over previous years. Not surprisingly, the increased rate of submissions began shortly after the May 2018 announcement that journal articles would be included in PMC. Most of those articles (83%) were submitted unsolicited.
Fed Pract has always prided itself on being an early promoter of interdisciplinary health care professional publications. Nearly half of its listed authors were physicians (48%), while pharmacists made up the next largest cohort (18%). There were smaller numbers of PhDs, nurses, social workers, and physical therapists. The majority were written by HCPs affiliated with the VA (95% of articles and 93% of authors), and no articles in 2018 were written by PHS officers. Physicians comprise about two-thirds of the audience, while pharmacists make up 17% and nurses 9%. PHS and DoD HCPs make up 19% of the Fed Pract audience, suggesting that the journal needs to do more work to encourage these HCPs to contribute articles to the journal.3
Articles published in 2018 covered a broad range of topics from “Anesthesia Care Practice Models in the VHA” and “Army Behavioral Health System” to “Vitreous Hemorrhage in the Setting of a Vascular Loop” and “A Workforce Assessment of VA Home-Based Primary Care Pharmacists.” Categorizing the articles is a challenge. Few health care topics fit neatly into a single topic or specialty. This is especially true in federal health care where much of the care is delivered by multidisciplinary patient-centered medical homes or patient aligned care teams. Nevertheless, a few broad outlines can be discerned. Articles were roughly split between primary care and hospital-based and/or specialty care topics; one-quarter of the articles were case studies or case series articles, and about 20% were editorials or opinion columns. Nineteen articles dealt explicitly with chronic conditions, and 10 articles focused on mental health care.
Peer reviewers are an essential part of the process. Reviewers are blinded to the identityof the authors, ensuring fairness and reducing potential conflicts of interest. We are extremely grateful to each and every reviewer for the time and energy they contribute to the journal. Peer reviewers do not get nearly enough recognition for their important work. In 2018 Fed Pract invited 1,205 reviewers for 164 manuscript submissions and 94 manuscript revisions. More than 200 different reviewers submitted 487 reviews with a median (SD) of 2 reviews (1.8) and a range of 1 to 10. The top 20 reviewers completed 134 reviews with a median (SD) of 6 reviews (1.2). The results stand in contrast to some journals that must offer many invitations per review and depend on a small number of reviewers.1,4-6
The reviewers recommended to reject 14% and to revise 26% of the articles, which is a much lower rejection rate than many other journals (Table).4 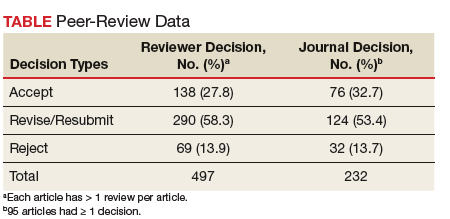
These data suggest that Fed Pract and its peer-review process is on a sound foundation but needs to make improvements. Moving into 2019, the journal expects that an increasing number of submissions will require a higher rejection rate. Moreover, we will need to do a better job reaching out to underrepresented portions of our audience. To decrease the time to publication for accepted manuscripts, in 2019 we will publish more articles online ahead of the print publication as we strive to improve the experience for authors, reviewers, readers, and the entire Fed Pract audience.
None of this work can be done without our small and dedicated staff. I would like to thank Managing Editor Joyce Brody who sent out each and every one of those reviewer invitations, Deputy Editor Robert Fee, who manages the special issues, Web Editor Teraya Smith, who runs our entire digital operation, and of course, Editor in Chief Cynthia Geppert, who oversees it all. Finally, it is important that you let us know how we are doing and whether we are meeting your needs. Visit mdedge.com/fedprac to take the readership survey or reach out to me at rpaul@mdedge.com.
1. Geppert CMA. Caring under a microscope. Fed Pract. 2018;35(7):6-7.
2. Smith R. Peer review: a flawed process at the heart of science and journals. J R Soc Med. 2006;99(4):178-182.
3. BPA Worldwide. Federal Practitioner brand report for the 6 month period ending June 2018. https://www.frontlinemedcom.com/wp-content/uploads/FEDPRAC_BPA.pdf. Updated June 2018. Accessed March 5, 2019.
4. Fontanarosa PB, Bauchner H, Golub RM. Thank you to JAMA authors, peer reviewers, and readers. JAMA. 2017;317(8):812-813.
5. Publons, Clarivate Analytics. 2018 global state of peer review. https://publons.com/static/Publons-Global-State-Of-Peer-Review-2018.pdf. Published September 2018. Accessed March 5, 2019.
6. Malcom D. It’s time we fix the peer review system. Am J Pharm Educ. 2018;82(5):7144.
Federal health care providers live under a microscope, so it seems only fair that we at Fed Pract honor that reality and open ourselves up to scrutiny as well.1 We hope that by shedding light on our peer-review process and manuscript acceptance rate, we will not only highlight our accomplishments, but identify areas for improvement.
Free access to Fed Pract content has always been our priority. While many journals charge authors or readers, Fed Pract has been and will remain free for readers and authors.2 Advertising enables the journal to support this free model of publishing, but we take care to ensure that advertisements do not influence content in any way. Our advertising policy can be found at www.mdedge.com/fedprac/page/advertising.
In January 2019, Fed Pract placed > 400 peer-reviewed articles published since January 2015 in the PubMed Central (PMC) database (ncbi.nlm.nih.gov/pmc). The full text of these and all future Fed Pract peer-reviewed articles will be available at PMC (no registration required), and the citations also will be included in PubMed. We hope that this process will make it even easier for anyone to access our authors’ works.
In 2018 about 36,000 federal health care providers (HCPs) received hard copies of this journal. The print journal is free, but circulation is limited to HCPs who work at the US Department of Veterans Affairs (VA), US Department of Defense (DoD), and the US Public Health Service (PHS). The mdedge.com/fedprac website, which includes every article published since 2003, had 1.4 million page views in 2018. After reading 3 online articles, readers in the US are asked to complete a simple registration form to help us better customize the reader experience. In some cases, international readers may be asked to pay for access to articles online; however, any VA, DoD, or PHS officer stationed overseas can contact the editorial staff (fedprac@mdedge.com) to ensure that they can access the articles for free.
In 2018 the journal received 164 manuscripts and published 94 articles written by 357 different federal HCPs. The 164 manuscript submissions represented a 45% growth over previous years. Not surprisingly, the increased rate of submissions began shortly after the May 2018 announcement that journal articles would be included in PMC. Most of those articles (83%) were submitted unsolicited.
Fed Pract has always prided itself on being an early promoter of interdisciplinary health care professional publications. Nearly half of its listed authors were physicians (48%), while pharmacists made up the next largest cohort (18%). There were smaller numbers of PhDs, nurses, social workers, and physical therapists. The majority were written by HCPs affiliated with the VA (95% of articles and 93% of authors), and no articles in 2018 were written by PHS officers. Physicians comprise about two-thirds of the audience, while pharmacists make up 17% and nurses 9%. PHS and DoD HCPs make up 19% of the Fed Pract audience, suggesting that the journal needs to do more work to encourage these HCPs to contribute articles to the journal.3
Articles published in 2018 covered a broad range of topics from “Anesthesia Care Practice Models in the VHA” and “Army Behavioral Health System” to “Vitreous Hemorrhage in the Setting of a Vascular Loop” and “A Workforce Assessment of VA Home-Based Primary Care Pharmacists.” Categorizing the articles is a challenge. Few health care topics fit neatly into a single topic or specialty. This is especially true in federal health care where much of the care is delivered by multidisciplinary patient-centered medical homes or patient aligned care teams. Nevertheless, a few broad outlines can be discerned. Articles were roughly split between primary care and hospital-based and/or specialty care topics; one-quarter of the articles were case studies or case series articles, and about 20% were editorials or opinion columns. Nineteen articles dealt explicitly with chronic conditions, and 10 articles focused on mental health care.
Peer reviewers are an essential part of the process. Reviewers are blinded to the identityof the authors, ensuring fairness and reducing potential conflicts of interest. We are extremely grateful to each and every reviewer for the time and energy they contribute to the journal. Peer reviewers do not get nearly enough recognition for their important work. In 2018 Fed Pract invited 1,205 reviewers for 164 manuscript submissions and 94 manuscript revisions. More than 200 different reviewers submitted 487 reviews with a median (SD) of 2 reviews (1.8) and a range of 1 to 10. The top 20 reviewers completed 134 reviews with a median (SD) of 6 reviews (1.2). The results stand in contrast to some journals that must offer many invitations per review and depend on a small number of reviewers.1,4-6
The reviewers recommended to reject 14% and to revise 26% of the articles, which is a much lower rejection rate than many other journals (Table).4
These data suggest that Fed Pract and its peer-review process is on a sound foundation but needs to make improvements. Moving into 2019, the journal expects that an increasing number of submissions will require a higher rejection rate. Moreover, we will need to do a better job reaching out to underrepresented portions of our audience. To decrease the time to publication for accepted manuscripts, in 2019 we will publish more articles online ahead of the print publication as we strive to improve the experience for authors, reviewers, readers, and the entire Fed Pract audience.
None of this work can be done without our small and dedicated staff. I would like to thank Managing Editor Joyce Brody who sent out each and every one of those reviewer invitations, Deputy Editor Robert Fee, who manages the special issues, Web Editor Teraya Smith, who runs our entire digital operation, and of course, Editor in Chief Cynthia Geppert, who oversees it all. Finally, it is important that you let us know how we are doing and whether we are meeting your needs. Visit mdedge.com/fedprac to take the readership survey or reach out to me at rpaul@mdedge.com.
Federal health care providers live under a microscope, so it seems only fair that we at Fed Pract honor that reality and open ourselves up to scrutiny as well.1 We hope that by shedding light on our peer-review process and manuscript acceptance rate, we will not only highlight our accomplishments, but identify areas for improvement.
Free access to Fed Pract content has always been our priority. While many journals charge authors or readers, Fed Pract has been and will remain free for readers and authors.2 Advertising enables the journal to support this free model of publishing, but we take care to ensure that advertisements do not influence content in any way. Our advertising policy can be found at www.mdedge.com/fedprac/page/advertising.
In January 2019, Fed Pract placed > 400 peer-reviewed articles published since January 2015 in the PubMed Central (PMC) database (ncbi.nlm.nih.gov/pmc). The full text of these and all future Fed Pract peer-reviewed articles will be available at PMC (no registration required), and the citations also will be included in PubMed. We hope that this process will make it even easier for anyone to access our authors’ works.
In 2018 about 36,000 federal health care providers (HCPs) received hard copies of this journal. The print journal is free, but circulation is limited to HCPs who work at the US Department of Veterans Affairs (VA), US Department of Defense (DoD), and the US Public Health Service (PHS). The mdedge.com/fedprac website, which includes every article published since 2003, had 1.4 million page views in 2018. After reading 3 online articles, readers in the US are asked to complete a simple registration form to help us better customize the reader experience. In some cases, international readers may be asked to pay for access to articles online; however, any VA, DoD, or PHS officer stationed overseas can contact the editorial staff (fedprac@mdedge.com) to ensure that they can access the articles for free.
In 2018 the journal received 164 manuscripts and published 94 articles written by 357 different federal HCPs. The 164 manuscript submissions represented a 45% growth over previous years. Not surprisingly, the increased rate of submissions began shortly after the May 2018 announcement that journal articles would be included in PMC. Most of those articles (83%) were submitted unsolicited.
Fed Pract has always prided itself on being an early promoter of interdisciplinary health care professional publications. Nearly half of its listed authors were physicians (48%), while pharmacists made up the next largest cohort (18%). There were smaller numbers of PhDs, nurses, social workers, and physical therapists. The majority were written by HCPs affiliated with the VA (95% of articles and 93% of authors), and no articles in 2018 were written by PHS officers. Physicians comprise about two-thirds of the audience, while pharmacists make up 17% and nurses 9%. PHS and DoD HCPs make up 19% of the Fed Pract audience, suggesting that the journal needs to do more work to encourage these HCPs to contribute articles to the journal.3
Articles published in 2018 covered a broad range of topics from “Anesthesia Care Practice Models in the VHA” and “Army Behavioral Health System” to “Vitreous Hemorrhage in the Setting of a Vascular Loop” and “A Workforce Assessment of VA Home-Based Primary Care Pharmacists.” Categorizing the articles is a challenge. Few health care topics fit neatly into a single topic or specialty. This is especially true in federal health care where much of the care is delivered by multidisciplinary patient-centered medical homes or patient aligned care teams. Nevertheless, a few broad outlines can be discerned. Articles were roughly split between primary care and hospital-based and/or specialty care topics; one-quarter of the articles were case studies or case series articles, and about 20% were editorials or opinion columns. Nineteen articles dealt explicitly with chronic conditions, and 10 articles focused on mental health care.
Peer reviewers are an essential part of the process. Reviewers are blinded to the identityof the authors, ensuring fairness and reducing potential conflicts of interest. We are extremely grateful to each and every reviewer for the time and energy they contribute to the journal. Peer reviewers do not get nearly enough recognition for their important work. In 2018 Fed Pract invited 1,205 reviewers for 164 manuscript submissions and 94 manuscript revisions. More than 200 different reviewers submitted 487 reviews with a median (SD) of 2 reviews (1.8) and a range of 1 to 10. The top 20 reviewers completed 134 reviews with a median (SD) of 6 reviews (1.2). The results stand in contrast to some journals that must offer many invitations per review and depend on a small number of reviewers.1,4-6
The reviewers recommended to reject 14% and to revise 26% of the articles, which is a much lower rejection rate than many other journals (Table).4
These data suggest that Fed Pract and its peer-review process is on a sound foundation but needs to make improvements. Moving into 2019, the journal expects that an increasing number of submissions will require a higher rejection rate. Moreover, we will need to do a better job reaching out to underrepresented portions of our audience. To decrease the time to publication for accepted manuscripts, in 2019 we will publish more articles online ahead of the print publication as we strive to improve the experience for authors, reviewers, readers, and the entire Fed Pract audience.
None of this work can be done without our small and dedicated staff. I would like to thank Managing Editor Joyce Brody who sent out each and every one of those reviewer invitations, Deputy Editor Robert Fee, who manages the special issues, Web Editor Teraya Smith, who runs our entire digital operation, and of course, Editor in Chief Cynthia Geppert, who oversees it all. Finally, it is important that you let us know how we are doing and whether we are meeting your needs. Visit mdedge.com/fedprac to take the readership survey or reach out to me at rpaul@mdedge.com.
1. Geppert CMA. Caring under a microscope. Fed Pract. 2018;35(7):6-7.
2. Smith R. Peer review: a flawed process at the heart of science and journals. J R Soc Med. 2006;99(4):178-182.
3. BPA Worldwide. Federal Practitioner brand report for the 6 month period ending June 2018. https://www.frontlinemedcom.com/wp-content/uploads/FEDPRAC_BPA.pdf. Updated June 2018. Accessed March 5, 2019.
4. Fontanarosa PB, Bauchner H, Golub RM. Thank you to JAMA authors, peer reviewers, and readers. JAMA. 2017;317(8):812-813.
5. Publons, Clarivate Analytics. 2018 global state of peer review. https://publons.com/static/Publons-Global-State-Of-Peer-Review-2018.pdf. Published September 2018. Accessed March 5, 2019.
6. Malcom D. It’s time we fix the peer review system. Am J Pharm Educ. 2018;82(5):7144.
1. Geppert CMA. Caring under a microscope. Fed Pract. 2018;35(7):6-7.
2. Smith R. Peer review: a flawed process at the heart of science and journals. J R Soc Med. 2006;99(4):178-182.
3. BPA Worldwide. Federal Practitioner brand report for the 6 month period ending June 2018. https://www.frontlinemedcom.com/wp-content/uploads/FEDPRAC_BPA.pdf. Updated June 2018. Accessed March 5, 2019.
4. Fontanarosa PB, Bauchner H, Golub RM. Thank you to JAMA authors, peer reviewers, and readers. JAMA. 2017;317(8):812-813.
5. Publons, Clarivate Analytics. 2018 global state of peer review. https://publons.com/static/Publons-Global-State-Of-Peer-Review-2018.pdf. Published September 2018. Accessed March 5, 2019.
6. Malcom D. It’s time we fix the peer review system. Am J Pharm Educ. 2018;82(5):7144.
Juvenile idiopathic arthritis: Old disease, new tactics
Juvenile idiopathic arthritis (JIA) is a clinically heterogeneous group of arthritides that are characterized by onset before 16 years of age and defined in part as lasting ≥6 weeks.1 Significantly, the etiology of JIA is unknown, making it a diagnosis of exclusion.2
The most common autoimmune condition of childhood, JIA has a prevalence of 3.8 to 400 affected children for every 100,000 people.3,4 As the leading cause of musculoskeletal disability in children,5 and comprising 7 categories of disease, JIA must be managed with appropriate initial and ongoing intervention.
The amalgam of care that a JIA patient requires—medical, social, physical, psychological—calls for a primary care physician’s expert ability to collaborate and coordinate with medical specialists and subspecialists, including rheumatology, ophthalmology, social work, physical and occupational therapy, and psychology. The goal? As this article describes, the goal is to provide prompt diagnosis, suitable and effective intervention, and continuity of care. (JIA is a lifelong disease, in many cases.)
How JIA is classifiedfor diagnosis and treatment
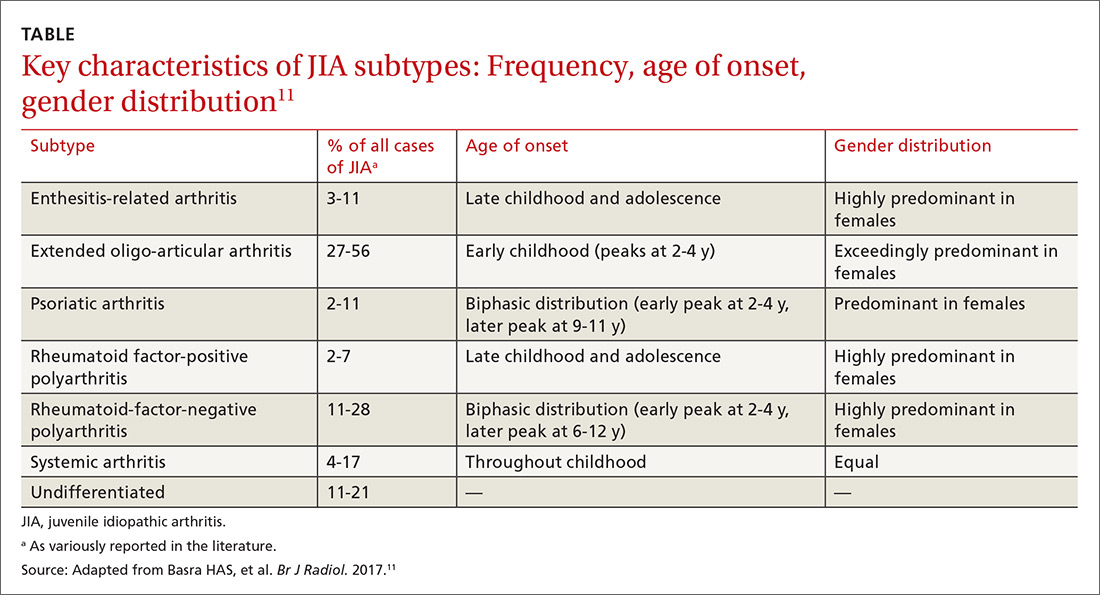
JIA comprises 7 categories, or classes.6 The scheme devised by the International League of Associations for Rheumatology (ILAR), now widely accepted, classifies JIA on the basis of clinical and biochemical markers that aid detection and treatment of the disorder, as well as research. (See “How efforts to classify JIA have caused confusion.”7-10) The ILAR classes (TABLE11) are:
- enthesitis-related arthritis (ERA)
- extended oligo-articular JIA (eoJIA), which involves ≤4 joints
- juvenile psoriatic arthritis (jPsA)
- rheumatoid factor (RF)-positive polyarticular JIA (RF+ pJIA)
- RF-negative polyarticular JIA (RF– pJIA)
- systemic-onset JIA (sJIA)
- undifferentiated JIA, which, generally, involves ≥4 joints.
SIDEBAR
How efforts to classiy JIA have caused confusion7-10
Various classifications of juvenile arthritis have been proposed and used over the past 3 decades. First was the American College of Rheumatology’s 1972 criteria for juvenile rheumatoid arthritis7; next came the European League against Rheumatism (EULAR) criteria for juvenile chronic arthritis, developed in 1977.8 Being contemporaneous, the 2 classifications led to a complicated, dichotomous definition of JIA among clinicians and researchers.
As a result of this disarray, the 1997 Durban, South Africa, meeting of the Pediatric Standing Committee of the International League of Associations for Rheumatology (ILAR)9 proposed that juvenile idiopathic arthritis be adopted as the umbrella term for the misunderstood terms juvenile rheumatoid arthritis and juvenile chronic arthritis. The intent of including “idiopathic” in the term was to acknowledge that the cause of these diseases was (and is still) unknown.
The novel classification proposed by the Pediatric Standing Committee was followed, in 2001, by an ILAR task force meeting in Edmonton, Alberta, Canada, on the classification of childhood arthritis. The outcome was a recommendation to add exclusion and inclusion criteria, to make all classes of JIA mutually exclusive.10 Most recently, as discussed in the body of this article, updated ILAR guidelines on JIA classification emphasize 1) heterogeneity among the 7 disease subtypes and 2) the fact that overlapping and exclusive features exist from class to class.
Updated guidelines regarding the 7 ILAR classes of JIA emphasize heterogeneity among disease subtypes, with overlapping and exclusive features noted from class to class.11
Extended oligo-articular JIA (27%-56%), pJIA (13%-35%), sJIA (4%-17%), and ERA,(3%-11%) are the most common JIA subtypes,12 with age of onset and sex predilection differing according to JIA class.11 The disease occurs more often in girls than in boys,11 and the predisposition is higher among Whites and Asians. The incidence of JIA (all classes taken together, for every 100,000 people) is: in Japan, 10 to 15 cases13; in Turkey, 64 cases14; in Norway, 65 cases15; and in the United States and Canada, taken together, 10 to 15 cases.16
What causes JIA?
The etiology of JIA remains unclear. It is known that the disease involves inflammation of the synovium and destruction of hard and soft tissues in joints.17 It has been postulated, therefore, that a combination of genetic, environmental, and immunogenic mechanisms might be responsible for JIA.
Continue to: For example, there is an increased...
For example, there is an increased frequency of autoimmune diseases among JIA patients.18 There are also reports documenting an increased rate of infection, including with enteric pathogens, parvovirus B,19 rubella, mumps, hepatitis B, Epstein-Barr virus, mycoplasma, and chlamydia.19 Stress and trauma have also been implicated.12
The T-lymphocyte percentage is increased in the synovial fluid of JIA patients, although that percentage varies from subtype to subtype.20 This elevation results in an increase in the number of macrophages, which are induced by secreted cytokines to produce interleukin (IL)-1, IL-6, and tumor necrosis factor alpha (TNF-a). This activity of cellular immunity leads to joint destruction.21
Clinical features
The most common signs and symptoms of JIA are arthralgias (39%), arthritis (25%), fever (18%), limping (9%), rash (8%), abdominal pain (1.3%), and uveitis (1.3%).15 Forty percent of JIA patients are reported to have temporomandibular joint involvement at some point in their life; mandibular asymmetry secondary to condylar resorption and remodeling17 is the most common presenting complaint—not arthralgia or pain, as would be expected.
Most JIA patients (52%) first present to the emergency department; another 42% present to the office of a general medical practitioner.15 On average, 3 visits to a physician, over the course of approximately 3 months, are made before a definitive diagnosis (usually by a pediatric rheumatologist) is made.15
Pertinent questions to ask a patient who has a confirmed diagnosis of JIA include the nature, severity, and duration of morning stiffness and pain, as well as any encumbering factors to regular functioning at home or school.22 Different scoring charts can be used to determine the extent of pain and disability, including the Juvenile Arthritis Disease Activity Score (JADAS)23 and the clinical JADAS (cJADAS),24 which measure minimal disease activity25 and clinically inactive disease26 cutoffs.
Continue to: Macrophage-activating syndrome increases risk of morbidity, mortality
Macrophage-activating syndrome increases risk of morbidity, mortality
An overactivation and expansion of T lymphocytes and macrophagic histiocytes with hemophagocytic activity, macrophage-activating syndrome (MAS) occurs in approximately 10% of JIA patients,27 increasing their risk of morbidity and mortality. The syndrome, which typically presents as fever, seizures, hypotension, purpura, hepatitis, splenomegaly, and occasionally, multisystem organ failure, is seen in 30% to 40% of sJIA patients; approximately 11% of them experience sudden death as a consequence.28
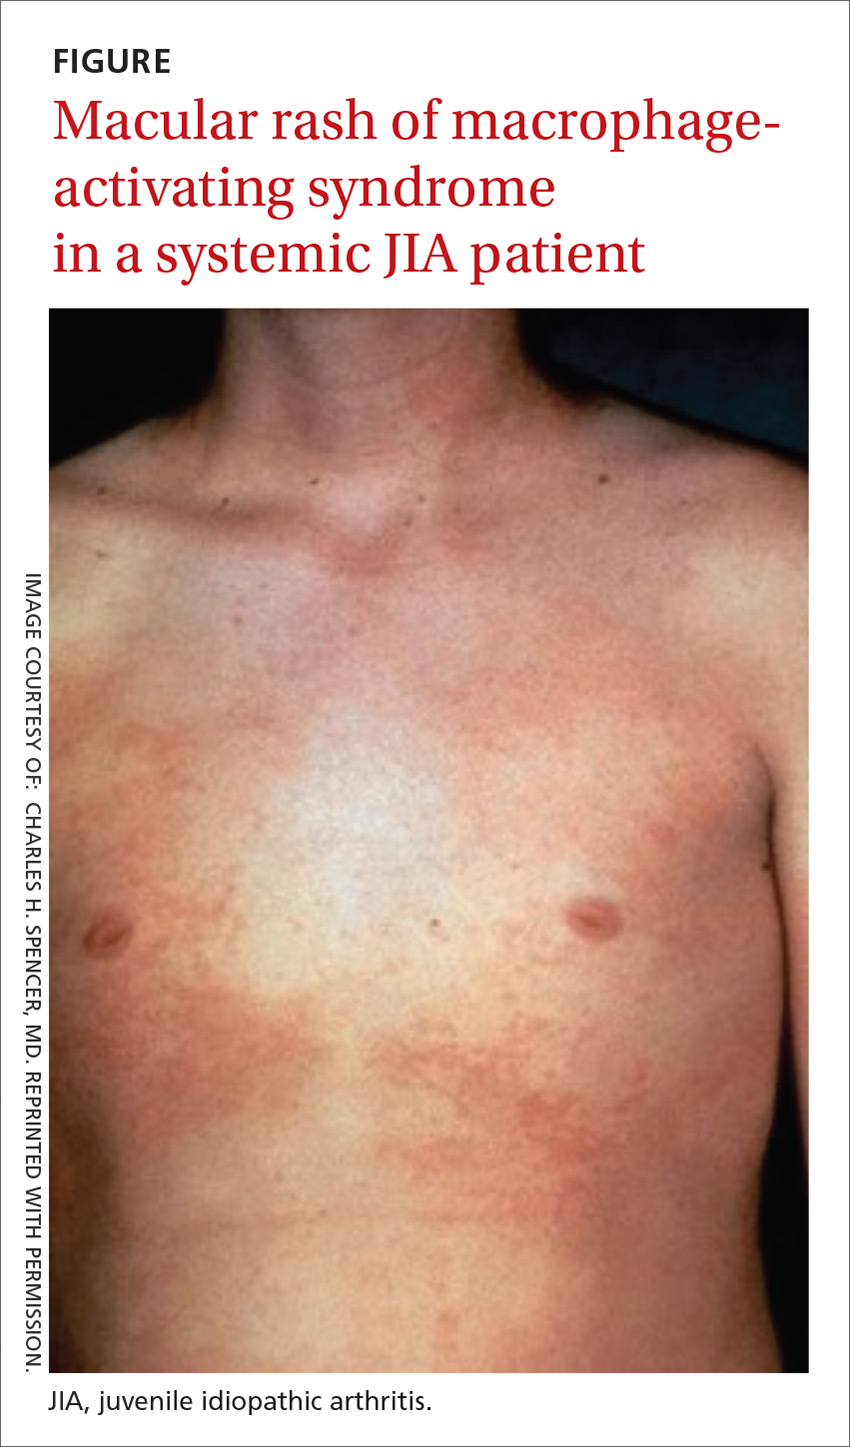
The clinical setting of MAS includes presenting symptoms of fever and a salmon-pink macular rash (FIGURE). For many sJIA patients with MAS, the diagnosis is made when laboratory results show hyperferritinemia, thrombocytopenia, anemia, leukopenia, coagulopathy, and elevated levels of C-reactive protein and D-dimer.27
Different classes, different features
The following clinical profiles have been documented in different classes of JIA:
Systemic JIA presents with intermittent fever of at least 2 weeks’ duration, arthritis, and occasionally, a rash.
Extended oligo-articular JIA involves pain, in a mono-articular lower-extremity joint, that can develop suddenly or insidiously, and is characterized by early-morning stiffness and uveitis (especially in early-onset, antinuclear antibody-positive JIA patients).
Continue to: Poly-articular JIA
Poly-articular JIA patients present with mild fever, weight loss, and anemia.
Enthesis-related arthritis patients have findings of enthesopathy; asymmetric arthritis of the lower extremities, particularly the Achilles tendon29; and recurrent acute, symptomatic iridocyclitis.30
Juvenile psoriatic arthritis can involve any joint but is readily differentiated from pJIA by involvement of distal interphalangeal joints and psoriatic skin and nail changes.29
Investigations
Imaging
Radiography is still the most widely used imaging tool for making the diagnosis of JIA. Plain films demonstrate structural joint damage and disturbances of growth and maturation in bones. Radiography has poor sensitivity for detecting acute synovitis and limited utility in visualizing erosion changes early in the course of disease, however, which has led to increased use of ultrasonography (US) and contrast-enhanced magnetic resonance imaging (MRI) to diagnose JIA.30
Contrast-enhanced MRI is superior to US for detecting early inflammation and monitoring subsequent joint disease. Of course, MRI is more expensive than US, and less widely available. Other imaging options are computed tomography and positron emission tomography, but these scans are not as sensitive as contrast-enhanced MRI and have the disadvantage of radiation exposure (in the former) and cost (in the latter).
Continue to: Laboratory testing
Laboratory testing
No diagnostic tests for JIA exist. Assays of acute-phase reactants, including C-reactive protein, the erythrocyte sedimentation rate, and serum amyloid-A proteins, can be utilized to demonstrate inflammation but not to confirm the diagnosis. For some classes of JIA, various tests, including rheumatoid factor, antinuclear antibody, human leukocyte antigen B-27, and cyclic citrullated peptide antibodies, can be used to confirm a specific class but, again, are not recommended for confirming JIA.6
The complete blood count, blood cultures, and tests of uric acid and lactate dehydrogenase can be ordered during treatment to monitor for complications, such as malignancy, infection, MAS, and sepsis.
Treatment is based on disease class
Nonsteroidal anti-inflammatory drugs (NSAIDs) and intra-articular steroids are used in all JIA classes, as an adjunct to class-specific treatment, or as induction agents.31 These therapies, although they alleviate acute signs and symptoms, such as pain, inflammation, swelling and joint contractures, are not useful for long-term treatment of JIA because they do not halt disease progression.
Systemic steroids can be utilized in exceptional cases, including chronic uveitis with arthritis or in patients with destructive arthritis and poor prognostic features, including cyclic citrullated peptide antibodies, positive RF, erosions, and joint-space narrowing.32
Other drugs. Options include traditional disease-modifying anti-rheumatic drugs (csDMARDs), such as methotrexate and leflunomide; biologic agents, such as TNF-a inhibitors (eg, etanercept, adalimumab, and infliximab); and anti-IL monoclonal antibody drugs (eg, the IL-6 inhibitor tocilizumab and IL-1 inhibitors anakinra, and canakinumab).31 Indications by class include:
- csDMARDs as first-line therapy in persistent eoJIA and pJIA;
- TNF-Symbolα inhibitors for refractory eoJIA and for pJIA episodes31;
- tocilizumab, recommended for sJIA patients who have persistent systemic signs; and
- anakinra and canakinumab for refractory SJIA patients.32
Continue to: Failure
Failure
When treatment of JIA fails with a given drug, options include increasing the dosage; switching to another agent in the same drug class; switching to a different class; and combining an NSAID with a csDMARD or a biologic agent.32 In class-specific JIA cases, a change in a drug regimen is warranted on the basis of the evidence-based historical clinical response rate.32
What is the prognosis?
Treatment of JIA with novel agents, such as biologics, has opened up the possibility that JIA patients can live not just with suppressed symptoms but immunologically inactive disease. This is the result of better understanding of the pathogenesis of JIA and the mechanism of action of targeted drugs, and identification of biomarkers that are helpful in predicting prognosis, adverse effects, and response to treatment.
JIA is often a lifelong disease; one-third of patients continue to exhibit symptoms into adulthood.4 If their disease is properly managed, however, these patients do not develop typical features of rheumatoid arthritis, including hand, limb, and spine deformities. Last, patients with JIA who have only intermittent disease tend to do better over the long term than those whose disease is continual.32
The mortality rate of JIA has dropped: from 1% to 4% in the mid-1970s to 0.3% to 1% today4—an improvement in life expectancy that is echoed in enhanced quality of life for patients. According to the 4-level Steinbrocker functional classification scale33 (used to rate the extent of physical disability), 15% of JIA patients were Class III (limited to few or no activities of the patient’s usual occupation) or Class IV (bedridden with little or no self-care) in the period from 1976 to 1994—a percentage that had declined to 5% by 2002.34
The family physician plays pivotal role in JIA care
For the family physician, appropriate initial intervention in the management of JIA is imperative. This includes ordering imaging (whether plain films or MRI), laboratory tests as described earlier (although not to make the diagnosis), and the use of NSAIDs, intra-articular steroids, and other induction agents. Once the diagnosis is made, and a drug regimen is put in place, you will need to monitor for adverse effects. This monitoring will need to occur when a patient is escalated to csDMARDs, biological agents, or systemic steroids; is maintained on an NSAID; or is placed on a combination regimen.
Continue to: Before beginning therapy with a biologic agent...
Before beginning therapy with a biologic agent, it’s important to screen for hepatitis B, hepatitis C, human immunodeficiency virus infection, tuberculosis, and fungal infection (eg, Histoplasma capsulatum, Coccidioides immitis32). Be sure to make a timely referral to the ophthalmology service for a bi-annual eye exam and, in the event that surgery is necessary, conduct a preoperative evaluation, with the knowledge of how long before surgery a biologic agent must be withheld (duration varies by drug).32
CORRESPONDENCE
Tobe Momah, MD, Department of Family Medicine, Clinical Science Building, 4th Floor, University of Mississippi Medical Center, 2500 North State Street, Jackson, MS 39216; tmomah@umc.edu.
1. Adriano LS, de França Fonteles MM, de Fátima Menezes Azevedo M, et al. Medication adherence in patients with juvenile idiopathic arthritis. Rev Bras Reumatol Engl Ed. 2017;57:23-29.
2. Akioka S. A better understanding of juvenile idiopathic arthritis with classification criteria. Nihon Rinsho Meneki Gakkai Kaishi. 2016;39:513-521.
3. Thierry S, Fautrel B, Lemelle I, Guillemin F. Prevalence and incidence of juvenile idiopathic arthritis: a systematic review. Joint Bone Spine. 2014;81:112-117.
4. Petty RE, Laxer RM, Lindsley CB, et al. Pediatric Rheumatology. Philadelphia, PA: Elsevier; 2016:188-201.e6.
5. Scott C, Brice N. Juvenile idiopathic arthritis–an update on its diagnosis and management. S Afr Med J. 2015;105:1077.
6. Giancane G, Consolaro A, Lanni S, et al. Juvenile idiopathic arthritis: diagnosis and treatment. Rheumatol Ther. 2016;3:187-207.
7. Criteria for the classification of juvenile rheumatoid arthritis. Bull Rheum Dis. 1972;23:712-719.
8. Wood PHN: Special meeting on nomenclature and classification of arthritis in children. In: Munthe E, ed. The Care of Rheumatic Children. Basel, Switzerland: EULAR Publishers; 1978:47-50.
9. Petty RE, Southwood TR, Baum J, et al. Revision of the proposed classification criteria for juvenile idiopathic arthritis: Durban, 1997. J Rheumatol. 1998;25:1991-1994.
10. Petty RE, Southwood TR, Manners P, et al; International League of Associations for Rheumatology. International League of Associations for Rheumatology classification of juvenile idiopathic arthritis: second revision, Edmonton, 2001. J Rheumatol. 2004;31:390-392.
11. Basra HAS, Humphries PD. Juvenile idiopathic arthritis: what is the utility of ultrasound? Br J Radiol. 2017;90:20160920.
12. Weiss J, Ilowite NT. Juvenile idiopathic arthritis. Pediatr Clin North Am. 2005;52:413-442, vi.
13. Fujikawa S, Okuni M. A nationwide surveillance study of rheumatic diseases among Japanese children. Acta Pediatric Jpn. 1997:39:242-244.
14. Ozen S, Karaaslan Y, Ozdemir O, et al. Prevalence of juvenile chronic arthritis and familial Mediterranean fever in Turkey: a field study. J Rheumatol. 1998;25:2445-2449.
15. Aoust L, Rossi-Semerano L, Koné-PauL I, et al. Time to diagnosis in juvenile idiopathic arthritis: a French perspective. Orphanet J Rare Dis. 2017;12:43.
16. Moe N, Rygg M. Epidemiology of juvenile chronic arthritis in northern Norway; a ten-year retrospective study. Clin Exp Rheumatol. 1998;16:99-101.
17. Abramowicz S, Kim S, Prahalad S, et al. Juvenile arthritis: current concepts in terminology, etiopathogenesis, diagnosis, and management. Int J Oral Maxillofac Surg. 2016;45:801-812.
18. Prahalad S, Shear ES, Thompson SD, et al. Increased prevalence of familial autoimmunity in simplex and multiplex families with juvenile rheumatoid arthritis. Arthritis Rheum. 2002;46:1851-1856.
19. Gonzalez B, Larrañaga C, León O, et al. Parvovirus B19 may have a role in the pathogenesis of juvenile idiopathic arthritis. J Rheumatol. 2007;34:1336-1340.
20. Prakken B, Albani S, Martini A. Juvenile idiopathic arthritis. Lancet. 2011;377:2138-2149.
21. Zhou J, Ding Y, Zhang Y, et al. CD3+CD56+ natural killer T cell activity in children with different forms of juvenile idiopathic arthritis and the influence of etanercept treatment on polyarticular subgroup. Clin Immunol. 2016;176:1-11.
22. Shoop-Worrall SJW, Verstappen SMM, Baildam E, et al. How common is clinically inactive disease in a prospective cohort of patients with juvenile idiopathic arthritis? The importance of definition. Ann Rheum Dis. 2017;0:1-8.
23. Nordal EB, Zak M, Berntson L, et al. Juvenile Arthritis Disease Activity Score (JADAS) based on CRP; validity and predictive ability in a Nordic population-based setting. Pediatr Rheumatol Online J. 2011;9(suppl 1):155.
24. Swart JF, Dijkhuizen EHP, Wulffraat NM, et al. Clinical Juvenile Arthritis Disease Activity Score proves to be a useful tool in treat-to-target therapy in juvenile idiopathic arthritis. Ann Rheum Dis. 2018;77:336-342.
25. Horneff G, Klein A, Ganser G, et al. Protocols on classification, monitoring and therapy in children’s rheumatology (PRO-KIND): results of the working group polyarticular juvenile idiopathic arthritis. Pediatr Rheumatol Online J. 2017;15:78.
26. Shoop-Worrall SJW, Verstappen SMM, McDonagh JE, et al. Long‐term outcomes following achievement of clinically inactive disease in juvenile idiopathic arthritis. Arthritis Rheumatol. 2018;70:1519-1529.
27. Ahn SS, Yoo BW, Jung SM, et al. In-hospital mortality in febrile lupus patients based on 2016 EULAR/ACR/PRINTO classification criteria for macrophage activation syndrome. Sem Arthritis Rheum. 2017;.47:216-221.
28. Yokota S, Mori M, Imagawa T, et al. Proposal for juvenile idiopathic arthritis guidance on diagnosis and treatment for primary care pediatricians and nonpediatric rheumatologists (2007). Mod Rheumatol. 2007;17:353-363.
29. Barut K, Adrovic A, Şahin S, et al. Juvenile idiopathic arthritis. Balkan Med J. 2017;34:90-101.
30. Colebatch-Bourn AN, Edwards CJ, et al. EULAR-PReS points to consider for the use of imaging in the diagnosis and management of juvenile idiopathic arthritis in clinical practice. Ann Rheum Dis. 2015;74:1946-1957.
31. Blazina Š, Markelj G, AvramoviČ MZ, et al. Management of juvenile idiopathic arthritis: a clinical guide. Pediatr Drugs. 2016;18:397-412.
32. Santos MJ, Conde M, Mourão AF, et al. 2016 update of the Portuguese recommendations for the use of biologic therapies in children and adolescents with juvenile idiopathic arthritis. Acta Rheumatol Port. 2016;41:194-212.
33. Steinbrocker 0, Traeger CH, Batterman RC. Therapeutic criteria in rheumatoid arthritis. JAMA. 1949;140:659-662.
34. Oen K, Malleson PN, Cabral D, et al. Disease course and outcome of juvenile rheumatoid arthritis in a multicenter cohort. J Rheumatol. 2002;29:1989-1999.
Juvenile idiopathic arthritis (JIA) is a clinically heterogeneous group of arthritides that are characterized by onset before 16 years of age and defined in part as lasting ≥6 weeks.1 Significantly, the etiology of JIA is unknown, making it a diagnosis of exclusion.2
The most common autoimmune condition of childhood, JIA has a prevalence of 3.8 to 400 affected children for every 100,000 people.3,4 As the leading cause of musculoskeletal disability in children,5 and comprising 7 categories of disease, JIA must be managed with appropriate initial and ongoing intervention.
The amalgam of care that a JIA patient requires—medical, social, physical, psychological—calls for a primary care physician’s expert ability to collaborate and coordinate with medical specialists and subspecialists, including rheumatology, ophthalmology, social work, physical and occupational therapy, and psychology. The goal? As this article describes, the goal is to provide prompt diagnosis, suitable and effective intervention, and continuity of care. (JIA is a lifelong disease, in many cases.)
How JIA is classifiedfor diagnosis and treatment
JIA comprises 7 categories, or classes.6 The scheme devised by the International League of Associations for Rheumatology (ILAR), now widely accepted, classifies JIA on the basis of clinical and biochemical markers that aid detection and treatment of the disorder, as well as research. (See “How efforts to classify JIA have caused confusion.”7-10) The ILAR classes (TABLE11) are:
- enthesitis-related arthritis (ERA)
- extended oligo-articular JIA (eoJIA), which involves ≤4 joints
- juvenile psoriatic arthritis (jPsA)
- rheumatoid factor (RF)-positive polyarticular JIA (RF+ pJIA)
- RF-negative polyarticular JIA (RF– pJIA)
- systemic-onset JIA (sJIA)
- undifferentiated JIA, which, generally, involves ≥4 joints.
SIDEBAR
How efforts to classiy JIA have caused confusion7-10
Various classifications of juvenile arthritis have been proposed and used over the past 3 decades. First was the American College of Rheumatology’s 1972 criteria for juvenile rheumatoid arthritis7; next came the European League against Rheumatism (EULAR) criteria for juvenile chronic arthritis, developed in 1977.8 Being contemporaneous, the 2 classifications led to a complicated, dichotomous definition of JIA among clinicians and researchers.
As a result of this disarray, the 1997 Durban, South Africa, meeting of the Pediatric Standing Committee of the International League of Associations for Rheumatology (ILAR)9 proposed that juvenile idiopathic arthritis be adopted as the umbrella term for the misunderstood terms juvenile rheumatoid arthritis and juvenile chronic arthritis. The intent of including “idiopathic” in the term was to acknowledge that the cause of these diseases was (and is still) unknown.
The novel classification proposed by the Pediatric Standing Committee was followed, in 2001, by an ILAR task force meeting in Edmonton, Alberta, Canada, on the classification of childhood arthritis. The outcome was a recommendation to add exclusion and inclusion criteria, to make all classes of JIA mutually exclusive.10 Most recently, as discussed in the body of this article, updated ILAR guidelines on JIA classification emphasize 1) heterogeneity among the 7 disease subtypes and 2) the fact that overlapping and exclusive features exist from class to class.
Updated guidelines regarding the 7 ILAR classes of JIA emphasize heterogeneity among disease subtypes, with overlapping and exclusive features noted from class to class.11
Extended oligo-articular JIA (27%-56%), pJIA (13%-35%), sJIA (4%-17%), and ERA,(3%-11%) are the most common JIA subtypes,12 with age of onset and sex predilection differing according to JIA class.11 The disease occurs more often in girls than in boys,11 and the predisposition is higher among Whites and Asians. The incidence of JIA (all classes taken together, for every 100,000 people) is: in Japan, 10 to 15 cases13; in Turkey, 64 cases14; in Norway, 65 cases15; and in the United States and Canada, taken together, 10 to 15 cases.16
What causes JIA?
The etiology of JIA remains unclear. It is known that the disease involves inflammation of the synovium and destruction of hard and soft tissues in joints.17 It has been postulated, therefore, that a combination of genetic, environmental, and immunogenic mechanisms might be responsible for JIA.
Continue to: For example, there is an increased...
For example, there is an increased frequency of autoimmune diseases among JIA patients.18 There are also reports documenting an increased rate of infection, including with enteric pathogens, parvovirus B,19 rubella, mumps, hepatitis B, Epstein-Barr virus, mycoplasma, and chlamydia.19 Stress and trauma have also been implicated.12
The T-lymphocyte percentage is increased in the synovial fluid of JIA patients, although that percentage varies from subtype to subtype.20 This elevation results in an increase in the number of macrophages, which are induced by secreted cytokines to produce interleukin (IL)-1, IL-6, and tumor necrosis factor alpha (TNF-a). This activity of cellular immunity leads to joint destruction.21
Clinical features
The most common signs and symptoms of JIA are arthralgias (39%), arthritis (25%), fever (18%), limping (9%), rash (8%), abdominal pain (1.3%), and uveitis (1.3%).15 Forty percent of JIA patients are reported to have temporomandibular joint involvement at some point in their life; mandibular asymmetry secondary to condylar resorption and remodeling17 is the most common presenting complaint—not arthralgia or pain, as would be expected.
Most JIA patients (52%) first present to the emergency department; another 42% present to the office of a general medical practitioner.15 On average, 3 visits to a physician, over the course of approximately 3 months, are made before a definitive diagnosis (usually by a pediatric rheumatologist) is made.15
Pertinent questions to ask a patient who has a confirmed diagnosis of JIA include the nature, severity, and duration of morning stiffness and pain, as well as any encumbering factors to regular functioning at home or school.22 Different scoring charts can be used to determine the extent of pain and disability, including the Juvenile Arthritis Disease Activity Score (JADAS)23 and the clinical JADAS (cJADAS),24 which measure minimal disease activity25 and clinically inactive disease26 cutoffs.
Continue to: Macrophage-activating syndrome increases risk of morbidity, mortality
Macrophage-activating syndrome increases risk of morbidity, mortality
An overactivation and expansion of T lymphocytes and macrophagic histiocytes with hemophagocytic activity, macrophage-activating syndrome (MAS) occurs in approximately 10% of JIA patients,27 increasing their risk of morbidity and mortality. The syndrome, which typically presents as fever, seizures, hypotension, purpura, hepatitis, splenomegaly, and occasionally, multisystem organ failure, is seen in 30% to 40% of sJIA patients; approximately 11% of them experience sudden death as a consequence.28
The clinical setting of MAS includes presenting symptoms of fever and a salmon-pink macular rash (FIGURE). For many sJIA patients with MAS, the diagnosis is made when laboratory results show hyperferritinemia, thrombocytopenia, anemia, leukopenia, coagulopathy, and elevated levels of C-reactive protein and D-dimer.27
Different classes, different features
The following clinical profiles have been documented in different classes of JIA:
Systemic JIA presents with intermittent fever of at least 2 weeks’ duration, arthritis, and occasionally, a rash.
Extended oligo-articular JIA involves pain, in a mono-articular lower-extremity joint, that can develop suddenly or insidiously, and is characterized by early-morning stiffness and uveitis (especially in early-onset, antinuclear antibody-positive JIA patients).
Continue to: Poly-articular JIA
Poly-articular JIA patients present with mild fever, weight loss, and anemia.
Enthesis-related arthritis patients have findings of enthesopathy; asymmetric arthritis of the lower extremities, particularly the Achilles tendon29; and recurrent acute, symptomatic iridocyclitis.30
Juvenile psoriatic arthritis can involve any joint but is readily differentiated from pJIA by involvement of distal interphalangeal joints and psoriatic skin and nail changes.29
Investigations
Imaging
Radiography is still the most widely used imaging tool for making the diagnosis of JIA. Plain films demonstrate structural joint damage and disturbances of growth and maturation in bones. Radiography has poor sensitivity for detecting acute synovitis and limited utility in visualizing erosion changes early in the course of disease, however, which has led to increased use of ultrasonography (US) and contrast-enhanced magnetic resonance imaging (MRI) to diagnose JIA.30
Contrast-enhanced MRI is superior to US for detecting early inflammation and monitoring subsequent joint disease. Of course, MRI is more expensive than US, and less widely available. Other imaging options are computed tomography and positron emission tomography, but these scans are not as sensitive as contrast-enhanced MRI and have the disadvantage of radiation exposure (in the former) and cost (in the latter).
Continue to: Laboratory testing
Laboratory testing
No diagnostic tests for JIA exist. Assays of acute-phase reactants, including C-reactive protein, the erythrocyte sedimentation rate, and serum amyloid-A proteins, can be utilized to demonstrate inflammation but not to confirm the diagnosis. For some classes of JIA, various tests, including rheumatoid factor, antinuclear antibody, human leukocyte antigen B-27, and cyclic citrullated peptide antibodies, can be used to confirm a specific class but, again, are not recommended for confirming JIA.6
The complete blood count, blood cultures, and tests of uric acid and lactate dehydrogenase can be ordered during treatment to monitor for complications, such as malignancy, infection, MAS, and sepsis.
Treatment is based on disease class
Nonsteroidal anti-inflammatory drugs (NSAIDs) and intra-articular steroids are used in all JIA classes, as an adjunct to class-specific treatment, or as induction agents.31 These therapies, although they alleviate acute signs and symptoms, such as pain, inflammation, swelling and joint contractures, are not useful for long-term treatment of JIA because they do not halt disease progression.
Systemic steroids can be utilized in exceptional cases, including chronic uveitis with arthritis or in patients with destructive arthritis and poor prognostic features, including cyclic citrullated peptide antibodies, positive RF, erosions, and joint-space narrowing.32
Other drugs. Options include traditional disease-modifying anti-rheumatic drugs (csDMARDs), such as methotrexate and leflunomide; biologic agents, such as TNF-a inhibitors (eg, etanercept, adalimumab, and infliximab); and anti-IL monoclonal antibody drugs (eg, the IL-6 inhibitor tocilizumab and IL-1 inhibitors anakinra, and canakinumab).31 Indications by class include:
- csDMARDs as first-line therapy in persistent eoJIA and pJIA;
- TNF-Symbolα inhibitors for refractory eoJIA and for pJIA episodes31;
- tocilizumab, recommended for sJIA patients who have persistent systemic signs; and
- anakinra and canakinumab for refractory SJIA patients.32
Continue to: Failure
Failure
When treatment of JIA fails with a given drug, options include increasing the dosage; switching to another agent in the same drug class; switching to a different class; and combining an NSAID with a csDMARD or a biologic agent.32 In class-specific JIA cases, a change in a drug regimen is warranted on the basis of the evidence-based historical clinical response rate.32
What is the prognosis?
Treatment of JIA with novel agents, such as biologics, has opened up the possibility that JIA patients can live not just with suppressed symptoms but immunologically inactive disease. This is the result of better understanding of the pathogenesis of JIA and the mechanism of action of targeted drugs, and identification of biomarkers that are helpful in predicting prognosis, adverse effects, and response to treatment.
JIA is often a lifelong disease; one-third of patients continue to exhibit symptoms into adulthood.4 If their disease is properly managed, however, these patients do not develop typical features of rheumatoid arthritis, including hand, limb, and spine deformities. Last, patients with JIA who have only intermittent disease tend to do better over the long term than those whose disease is continual.32
The mortality rate of JIA has dropped: from 1% to 4% in the mid-1970s to 0.3% to 1% today4—an improvement in life expectancy that is echoed in enhanced quality of life for patients. According to the 4-level Steinbrocker functional classification scale33 (used to rate the extent of physical disability), 15% of JIA patients were Class III (limited to few or no activities of the patient’s usual occupation) or Class IV (bedridden with little or no self-care) in the period from 1976 to 1994—a percentage that had declined to 5% by 2002.34
The family physician plays pivotal role in JIA care
For the family physician, appropriate initial intervention in the management of JIA is imperative. This includes ordering imaging (whether plain films or MRI), laboratory tests as described earlier (although not to make the diagnosis), and the use of NSAIDs, intra-articular steroids, and other induction agents. Once the diagnosis is made, and a drug regimen is put in place, you will need to monitor for adverse effects. This monitoring will need to occur when a patient is escalated to csDMARDs, biological agents, or systemic steroids; is maintained on an NSAID; or is placed on a combination regimen.
Continue to: Before beginning therapy with a biologic agent...
Before beginning therapy with a biologic agent, it’s important to screen for hepatitis B, hepatitis C, human immunodeficiency virus infection, tuberculosis, and fungal infection (eg, Histoplasma capsulatum, Coccidioides immitis32). Be sure to make a timely referral to the ophthalmology service for a bi-annual eye exam and, in the event that surgery is necessary, conduct a preoperative evaluation, with the knowledge of how long before surgery a biologic agent must be withheld (duration varies by drug).32
CORRESPONDENCE
Tobe Momah, MD, Department of Family Medicine, Clinical Science Building, 4th Floor, University of Mississippi Medical Center, 2500 North State Street, Jackson, MS 39216; tmomah@umc.edu.
Juvenile idiopathic arthritis (JIA) is a clinically heterogeneous group of arthritides that are characterized by onset before 16 years of age and defined in part as lasting ≥6 weeks.1 Significantly, the etiology of JIA is unknown, making it a diagnosis of exclusion.2
The most common autoimmune condition of childhood, JIA has a prevalence of 3.8 to 400 affected children for every 100,000 people.3,4 As the leading cause of musculoskeletal disability in children,5 and comprising 7 categories of disease, JIA must be managed with appropriate initial and ongoing intervention.
The amalgam of care that a JIA patient requires—medical, social, physical, psychological—calls for a primary care physician’s expert ability to collaborate and coordinate with medical specialists and subspecialists, including rheumatology, ophthalmology, social work, physical and occupational therapy, and psychology. The goal? As this article describes, the goal is to provide prompt diagnosis, suitable and effective intervention, and continuity of care. (JIA is a lifelong disease, in many cases.)
How JIA is classifiedfor diagnosis and treatment
JIA comprises 7 categories, or classes.6 The scheme devised by the International League of Associations for Rheumatology (ILAR), now widely accepted, classifies JIA on the basis of clinical and biochemical markers that aid detection and treatment of the disorder, as well as research. (See “How efforts to classify JIA have caused confusion.”7-10) The ILAR classes (TABLE11) are:
- enthesitis-related arthritis (ERA)
- extended oligo-articular JIA (eoJIA), which involves ≤4 joints
- juvenile psoriatic arthritis (jPsA)
- rheumatoid factor (RF)-positive polyarticular JIA (RF+ pJIA)
- RF-negative polyarticular JIA (RF– pJIA)
- systemic-onset JIA (sJIA)
- undifferentiated JIA, which, generally, involves ≥4 joints.
SIDEBAR
How efforts to classiy JIA have caused confusion7-10
Various classifications of juvenile arthritis have been proposed and used over the past 3 decades. First was the American College of Rheumatology’s 1972 criteria for juvenile rheumatoid arthritis7; next came the European League against Rheumatism (EULAR) criteria for juvenile chronic arthritis, developed in 1977.8 Being contemporaneous, the 2 classifications led to a complicated, dichotomous definition of JIA among clinicians and researchers.
As a result of this disarray, the 1997 Durban, South Africa, meeting of the Pediatric Standing Committee of the International League of Associations for Rheumatology (ILAR)9 proposed that juvenile idiopathic arthritis be adopted as the umbrella term for the misunderstood terms juvenile rheumatoid arthritis and juvenile chronic arthritis. The intent of including “idiopathic” in the term was to acknowledge that the cause of these diseases was (and is still) unknown.
The novel classification proposed by the Pediatric Standing Committee was followed, in 2001, by an ILAR task force meeting in Edmonton, Alberta, Canada, on the classification of childhood arthritis. The outcome was a recommendation to add exclusion and inclusion criteria, to make all classes of JIA mutually exclusive.10 Most recently, as discussed in the body of this article, updated ILAR guidelines on JIA classification emphasize 1) heterogeneity among the 7 disease subtypes and 2) the fact that overlapping and exclusive features exist from class to class.
Updated guidelines regarding the 7 ILAR classes of JIA emphasize heterogeneity among disease subtypes, with overlapping and exclusive features noted from class to class.11
Extended oligo-articular JIA (27%-56%), pJIA (13%-35%), sJIA (4%-17%), and ERA,(3%-11%) are the most common JIA subtypes,12 with age of onset and sex predilection differing according to JIA class.11 The disease occurs more often in girls than in boys,11 and the predisposition is higher among Whites and Asians. The incidence of JIA (all classes taken together, for every 100,000 people) is: in Japan, 10 to 15 cases13; in Turkey, 64 cases14; in Norway, 65 cases15; and in the United States and Canada, taken together, 10 to 15 cases.16
What causes JIA?
The etiology of JIA remains unclear. It is known that the disease involves inflammation of the synovium and destruction of hard and soft tissues in joints.17 It has been postulated, therefore, that a combination of genetic, environmental, and immunogenic mechanisms might be responsible for JIA.
Continue to: For example, there is an increased...
For example, there is an increased frequency of autoimmune diseases among JIA patients.18 There are also reports documenting an increased rate of infection, including with enteric pathogens, parvovirus B,19 rubella, mumps, hepatitis B, Epstein-Barr virus, mycoplasma, and chlamydia.19 Stress and trauma have also been implicated.12
The T-lymphocyte percentage is increased in the synovial fluid of JIA patients, although that percentage varies from subtype to subtype.20 This elevation results in an increase in the number of macrophages, which are induced by secreted cytokines to produce interleukin (IL)-1, IL-6, and tumor necrosis factor alpha (TNF-a). This activity of cellular immunity leads to joint destruction.21
Clinical features
The most common signs and symptoms of JIA are arthralgias (39%), arthritis (25%), fever (18%), limping (9%), rash (8%), abdominal pain (1.3%), and uveitis (1.3%).15 Forty percent of JIA patients are reported to have temporomandibular joint involvement at some point in their life; mandibular asymmetry secondary to condylar resorption and remodeling17 is the most common presenting complaint—not arthralgia or pain, as would be expected.
Most JIA patients (52%) first present to the emergency department; another 42% present to the office of a general medical practitioner.15 On average, 3 visits to a physician, over the course of approximately 3 months, are made before a definitive diagnosis (usually by a pediatric rheumatologist) is made.15
Pertinent questions to ask a patient who has a confirmed diagnosis of JIA include the nature, severity, and duration of morning stiffness and pain, as well as any encumbering factors to regular functioning at home or school.22 Different scoring charts can be used to determine the extent of pain and disability, including the Juvenile Arthritis Disease Activity Score (JADAS)23 and the clinical JADAS (cJADAS),24 which measure minimal disease activity25 and clinically inactive disease26 cutoffs.
Continue to: Macrophage-activating syndrome increases risk of morbidity, mortality
Macrophage-activating syndrome increases risk of morbidity, mortality
An overactivation and expansion of T lymphocytes and macrophagic histiocytes with hemophagocytic activity, macrophage-activating syndrome (MAS) occurs in approximately 10% of JIA patients,27 increasing their risk of morbidity and mortality. The syndrome, which typically presents as fever, seizures, hypotension, purpura, hepatitis, splenomegaly, and occasionally, multisystem organ failure, is seen in 30% to 40% of sJIA patients; approximately 11% of them experience sudden death as a consequence.28
The clinical setting of MAS includes presenting symptoms of fever and a salmon-pink macular rash (FIGURE). For many sJIA patients with MAS, the diagnosis is made when laboratory results show hyperferritinemia, thrombocytopenia, anemia, leukopenia, coagulopathy, and elevated levels of C-reactive protein and D-dimer.27
Different classes, different features
The following clinical profiles have been documented in different classes of JIA:
Systemic JIA presents with intermittent fever of at least 2 weeks’ duration, arthritis, and occasionally, a rash.
Extended oligo-articular JIA involves pain, in a mono-articular lower-extremity joint, that can develop suddenly or insidiously, and is characterized by early-morning stiffness and uveitis (especially in early-onset, antinuclear antibody-positive JIA patients).
Continue to: Poly-articular JIA
Poly-articular JIA patients present with mild fever, weight loss, and anemia.
Enthesis-related arthritis patients have findings of enthesopathy; asymmetric arthritis of the lower extremities, particularly the Achilles tendon29; and recurrent acute, symptomatic iridocyclitis.30
Juvenile psoriatic arthritis can involve any joint but is readily differentiated from pJIA by involvement of distal interphalangeal joints and psoriatic skin and nail changes.29
Investigations
Imaging
Radiography is still the most widely used imaging tool for making the diagnosis of JIA. Plain films demonstrate structural joint damage and disturbances of growth and maturation in bones. Radiography has poor sensitivity for detecting acute synovitis and limited utility in visualizing erosion changes early in the course of disease, however, which has led to increased use of ultrasonography (US) and contrast-enhanced magnetic resonance imaging (MRI) to diagnose JIA.30
Contrast-enhanced MRI is superior to US for detecting early inflammation and monitoring subsequent joint disease. Of course, MRI is more expensive than US, and less widely available. Other imaging options are computed tomography and positron emission tomography, but these scans are not as sensitive as contrast-enhanced MRI and have the disadvantage of radiation exposure (in the former) and cost (in the latter).
Continue to: Laboratory testing
Laboratory testing
No diagnostic tests for JIA exist. Assays of acute-phase reactants, including C-reactive protein, the erythrocyte sedimentation rate, and serum amyloid-A proteins, can be utilized to demonstrate inflammation but not to confirm the diagnosis. For some classes of JIA, various tests, including rheumatoid factor, antinuclear antibody, human leukocyte antigen B-27, and cyclic citrullated peptide antibodies, can be used to confirm a specific class but, again, are not recommended for confirming JIA.6
The complete blood count, blood cultures, and tests of uric acid and lactate dehydrogenase can be ordered during treatment to monitor for complications, such as malignancy, infection, MAS, and sepsis.
Treatment is based on disease class
Nonsteroidal anti-inflammatory drugs (NSAIDs) and intra-articular steroids are used in all JIA classes, as an adjunct to class-specific treatment, or as induction agents.31 These therapies, although they alleviate acute signs and symptoms, such as pain, inflammation, swelling and joint contractures, are not useful for long-term treatment of JIA because they do not halt disease progression.
Systemic steroids can be utilized in exceptional cases, including chronic uveitis with arthritis or in patients with destructive arthritis and poor prognostic features, including cyclic citrullated peptide antibodies, positive RF, erosions, and joint-space narrowing.32
Other drugs. Options include traditional disease-modifying anti-rheumatic drugs (csDMARDs), such as methotrexate and leflunomide; biologic agents, such as TNF-a inhibitors (eg, etanercept, adalimumab, and infliximab); and anti-IL monoclonal antibody drugs (eg, the IL-6 inhibitor tocilizumab and IL-1 inhibitors anakinra, and canakinumab).31 Indications by class include:
- csDMARDs as first-line therapy in persistent eoJIA and pJIA;
- TNF-Symbolα inhibitors for refractory eoJIA and for pJIA episodes31;
- tocilizumab, recommended for sJIA patients who have persistent systemic signs; and
- anakinra and canakinumab for refractory SJIA patients.32
Continue to: Failure
Failure
When treatment of JIA fails with a given drug, options include increasing the dosage; switching to another agent in the same drug class; switching to a different class; and combining an NSAID with a csDMARD or a biologic agent.32 In class-specific JIA cases, a change in a drug regimen is warranted on the basis of the evidence-based historical clinical response rate.32
What is the prognosis?
Treatment of JIA with novel agents, such as biologics, has opened up the possibility that JIA patients can live not just with suppressed symptoms but immunologically inactive disease. This is the result of better understanding of the pathogenesis of JIA and the mechanism of action of targeted drugs, and identification of biomarkers that are helpful in predicting prognosis, adverse effects, and response to treatment.
JIA is often a lifelong disease; one-third of patients continue to exhibit symptoms into adulthood.4 If their disease is properly managed, however, these patients do not develop typical features of rheumatoid arthritis, including hand, limb, and spine deformities. Last, patients with JIA who have only intermittent disease tend to do better over the long term than those whose disease is continual.32
The mortality rate of JIA has dropped: from 1% to 4% in the mid-1970s to 0.3% to 1% today4—an improvement in life expectancy that is echoed in enhanced quality of life for patients. According to the 4-level Steinbrocker functional classification scale33 (used to rate the extent of physical disability), 15% of JIA patients were Class III (limited to few or no activities of the patient’s usual occupation) or Class IV (bedridden with little or no self-care) in the period from 1976 to 1994—a percentage that had declined to 5% by 2002.34
The family physician plays pivotal role in JIA care
For the family physician, appropriate initial intervention in the management of JIA is imperative. This includes ordering imaging (whether plain films or MRI), laboratory tests as described earlier (although not to make the diagnosis), and the use of NSAIDs, intra-articular steroids, and other induction agents. Once the diagnosis is made, and a drug regimen is put in place, you will need to monitor for adverse effects. This monitoring will need to occur when a patient is escalated to csDMARDs, biological agents, or systemic steroids; is maintained on an NSAID; or is placed on a combination regimen.
Continue to: Before beginning therapy with a biologic agent...
Before beginning therapy with a biologic agent, it’s important to screen for hepatitis B, hepatitis C, human immunodeficiency virus infection, tuberculosis, and fungal infection (eg, Histoplasma capsulatum, Coccidioides immitis32). Be sure to make a timely referral to the ophthalmology service for a bi-annual eye exam and, in the event that surgery is necessary, conduct a preoperative evaluation, with the knowledge of how long before surgery a biologic agent must be withheld (duration varies by drug).32
CORRESPONDENCE
Tobe Momah, MD, Department of Family Medicine, Clinical Science Building, 4th Floor, University of Mississippi Medical Center, 2500 North State Street, Jackson, MS 39216; tmomah@umc.edu.
1. Adriano LS, de França Fonteles MM, de Fátima Menezes Azevedo M, et al. Medication adherence in patients with juvenile idiopathic arthritis. Rev Bras Reumatol Engl Ed. 2017;57:23-29.
2. Akioka S. A better understanding of juvenile idiopathic arthritis with classification criteria. Nihon Rinsho Meneki Gakkai Kaishi. 2016;39:513-521.
3. Thierry S, Fautrel B, Lemelle I, Guillemin F. Prevalence and incidence of juvenile idiopathic arthritis: a systematic review. Joint Bone Spine. 2014;81:112-117.
4. Petty RE, Laxer RM, Lindsley CB, et al. Pediatric Rheumatology. Philadelphia, PA: Elsevier; 2016:188-201.e6.
5. Scott C, Brice N. Juvenile idiopathic arthritis–an update on its diagnosis and management. S Afr Med J. 2015;105:1077.
6. Giancane G, Consolaro A, Lanni S, et al. Juvenile idiopathic arthritis: diagnosis and treatment. Rheumatol Ther. 2016;3:187-207.
7. Criteria for the classification of juvenile rheumatoid arthritis. Bull Rheum Dis. 1972;23:712-719.
8. Wood PHN: Special meeting on nomenclature and classification of arthritis in children. In: Munthe E, ed. The Care of Rheumatic Children. Basel, Switzerland: EULAR Publishers; 1978:47-50.
9. Petty RE, Southwood TR, Baum J, et al. Revision of the proposed classification criteria for juvenile idiopathic arthritis: Durban, 1997. J Rheumatol. 1998;25:1991-1994.
10. Petty RE, Southwood TR, Manners P, et al; International League of Associations for Rheumatology. International League of Associations for Rheumatology classification of juvenile idiopathic arthritis: second revision, Edmonton, 2001. J Rheumatol. 2004;31:390-392.
11. Basra HAS, Humphries PD. Juvenile idiopathic arthritis: what is the utility of ultrasound? Br J Radiol. 2017;90:20160920.
12. Weiss J, Ilowite NT. Juvenile idiopathic arthritis. Pediatr Clin North Am. 2005;52:413-442, vi.
13. Fujikawa S, Okuni M. A nationwide surveillance study of rheumatic diseases among Japanese children. Acta Pediatric Jpn. 1997:39:242-244.
14. Ozen S, Karaaslan Y, Ozdemir O, et al. Prevalence of juvenile chronic arthritis and familial Mediterranean fever in Turkey: a field study. J Rheumatol. 1998;25:2445-2449.
15. Aoust L, Rossi-Semerano L, Koné-PauL I, et al. Time to diagnosis in juvenile idiopathic arthritis: a French perspective. Orphanet J Rare Dis. 2017;12:43.
16. Moe N, Rygg M. Epidemiology of juvenile chronic arthritis in northern Norway; a ten-year retrospective study. Clin Exp Rheumatol. 1998;16:99-101.
17. Abramowicz S, Kim S, Prahalad S, et al. Juvenile arthritis: current concepts in terminology, etiopathogenesis, diagnosis, and management. Int J Oral Maxillofac Surg. 2016;45:801-812.
18. Prahalad S, Shear ES, Thompson SD, et al. Increased prevalence of familial autoimmunity in simplex and multiplex families with juvenile rheumatoid arthritis. Arthritis Rheum. 2002;46:1851-1856.
19. Gonzalez B, Larrañaga C, León O, et al. Parvovirus B19 may have a role in the pathogenesis of juvenile idiopathic arthritis. J Rheumatol. 2007;34:1336-1340.
20. Prakken B, Albani S, Martini A. Juvenile idiopathic arthritis. Lancet. 2011;377:2138-2149.
21. Zhou J, Ding Y, Zhang Y, et al. CD3+CD56+ natural killer T cell activity in children with different forms of juvenile idiopathic arthritis and the influence of etanercept treatment on polyarticular subgroup. Clin Immunol. 2016;176:1-11.
22. Shoop-Worrall SJW, Verstappen SMM, Baildam E, et al. How common is clinically inactive disease in a prospective cohort of patients with juvenile idiopathic arthritis? The importance of definition. Ann Rheum Dis. 2017;0:1-8.
23. Nordal EB, Zak M, Berntson L, et al. Juvenile Arthritis Disease Activity Score (JADAS) based on CRP; validity and predictive ability in a Nordic population-based setting. Pediatr Rheumatol Online J. 2011;9(suppl 1):155.
24. Swart JF, Dijkhuizen EHP, Wulffraat NM, et al. Clinical Juvenile Arthritis Disease Activity Score proves to be a useful tool in treat-to-target therapy in juvenile idiopathic arthritis. Ann Rheum Dis. 2018;77:336-342.
25. Horneff G, Klein A, Ganser G, et al. Protocols on classification, monitoring and therapy in children’s rheumatology (PRO-KIND): results of the working group polyarticular juvenile idiopathic arthritis. Pediatr Rheumatol Online J. 2017;15:78.
26. Shoop-Worrall SJW, Verstappen SMM, McDonagh JE, et al. Long‐term outcomes following achievement of clinically inactive disease in juvenile idiopathic arthritis. Arthritis Rheumatol. 2018;70:1519-1529.
27. Ahn SS, Yoo BW, Jung SM, et al. In-hospital mortality in febrile lupus patients based on 2016 EULAR/ACR/PRINTO classification criteria for macrophage activation syndrome. Sem Arthritis Rheum. 2017;.47:216-221.
28. Yokota S, Mori M, Imagawa T, et al. Proposal for juvenile idiopathic arthritis guidance on diagnosis and treatment for primary care pediatricians and nonpediatric rheumatologists (2007). Mod Rheumatol. 2007;17:353-363.
29. Barut K, Adrovic A, Şahin S, et al. Juvenile idiopathic arthritis. Balkan Med J. 2017;34:90-101.
30. Colebatch-Bourn AN, Edwards CJ, et al. EULAR-PReS points to consider for the use of imaging in the diagnosis and management of juvenile idiopathic arthritis in clinical practice. Ann Rheum Dis. 2015;74:1946-1957.
31. Blazina Š, Markelj G, AvramoviČ MZ, et al. Management of juvenile idiopathic arthritis: a clinical guide. Pediatr Drugs. 2016;18:397-412.
32. Santos MJ, Conde M, Mourão AF, et al. 2016 update of the Portuguese recommendations for the use of biologic therapies in children and adolescents with juvenile idiopathic arthritis. Acta Rheumatol Port. 2016;41:194-212.
33. Steinbrocker 0, Traeger CH, Batterman RC. Therapeutic criteria in rheumatoid arthritis. JAMA. 1949;140:659-662.
34. Oen K, Malleson PN, Cabral D, et al. Disease course and outcome of juvenile rheumatoid arthritis in a multicenter cohort. J Rheumatol. 2002;29:1989-1999.
1. Adriano LS, de França Fonteles MM, de Fátima Menezes Azevedo M, et al. Medication adherence in patients with juvenile idiopathic arthritis. Rev Bras Reumatol Engl Ed. 2017;57:23-29.
2. Akioka S. A better understanding of juvenile idiopathic arthritis with classification criteria. Nihon Rinsho Meneki Gakkai Kaishi. 2016;39:513-521.
3. Thierry S, Fautrel B, Lemelle I, Guillemin F. Prevalence and incidence of juvenile idiopathic arthritis: a systematic review. Joint Bone Spine. 2014;81:112-117.
4. Petty RE, Laxer RM, Lindsley CB, et al. Pediatric Rheumatology. Philadelphia, PA: Elsevier; 2016:188-201.e6.
5. Scott C, Brice N. Juvenile idiopathic arthritis–an update on its diagnosis and management. S Afr Med J. 2015;105:1077.
6. Giancane G, Consolaro A, Lanni S, et al. Juvenile idiopathic arthritis: diagnosis and treatment. Rheumatol Ther. 2016;3:187-207.
7. Criteria for the classification of juvenile rheumatoid arthritis. Bull Rheum Dis. 1972;23:712-719.
8. Wood PHN: Special meeting on nomenclature and classification of arthritis in children. In: Munthe E, ed. The Care of Rheumatic Children. Basel, Switzerland: EULAR Publishers; 1978:47-50.
9. Petty RE, Southwood TR, Baum J, et al. Revision of the proposed classification criteria for juvenile idiopathic arthritis: Durban, 1997. J Rheumatol. 1998;25:1991-1994.
10. Petty RE, Southwood TR, Manners P, et al; International League of Associations for Rheumatology. International League of Associations for Rheumatology classification of juvenile idiopathic arthritis: second revision, Edmonton, 2001. J Rheumatol. 2004;31:390-392.
11. Basra HAS, Humphries PD. Juvenile idiopathic arthritis: what is the utility of ultrasound? Br J Radiol. 2017;90:20160920.
12. Weiss J, Ilowite NT. Juvenile idiopathic arthritis. Pediatr Clin North Am. 2005;52:413-442, vi.
13. Fujikawa S, Okuni M. A nationwide surveillance study of rheumatic diseases among Japanese children. Acta Pediatric Jpn. 1997:39:242-244.
14. Ozen S, Karaaslan Y, Ozdemir O, et al. Prevalence of juvenile chronic arthritis and familial Mediterranean fever in Turkey: a field study. J Rheumatol. 1998;25:2445-2449.
15. Aoust L, Rossi-Semerano L, Koné-PauL I, et al. Time to diagnosis in juvenile idiopathic arthritis: a French perspective. Orphanet J Rare Dis. 2017;12:43.
16. Moe N, Rygg M. Epidemiology of juvenile chronic arthritis in northern Norway; a ten-year retrospective study. Clin Exp Rheumatol. 1998;16:99-101.
17. Abramowicz S, Kim S, Prahalad S, et al. Juvenile arthritis: current concepts in terminology, etiopathogenesis, diagnosis, and management. Int J Oral Maxillofac Surg. 2016;45:801-812.
18. Prahalad S, Shear ES, Thompson SD, et al. Increased prevalence of familial autoimmunity in simplex and multiplex families with juvenile rheumatoid arthritis. Arthritis Rheum. 2002;46:1851-1856.
19. Gonzalez B, Larrañaga C, León O, et al. Parvovirus B19 may have a role in the pathogenesis of juvenile idiopathic arthritis. J Rheumatol. 2007;34:1336-1340.
20. Prakken B, Albani S, Martini A. Juvenile idiopathic arthritis. Lancet. 2011;377:2138-2149.
21. Zhou J, Ding Y, Zhang Y, et al. CD3+CD56+ natural killer T cell activity in children with different forms of juvenile idiopathic arthritis and the influence of etanercept treatment on polyarticular subgroup. Clin Immunol. 2016;176:1-11.
22. Shoop-Worrall SJW, Verstappen SMM, Baildam E, et al. How common is clinically inactive disease in a prospective cohort of patients with juvenile idiopathic arthritis? The importance of definition. Ann Rheum Dis. 2017;0:1-8.
23. Nordal EB, Zak M, Berntson L, et al. Juvenile Arthritis Disease Activity Score (JADAS) based on CRP; validity and predictive ability in a Nordic population-based setting. Pediatr Rheumatol Online J. 2011;9(suppl 1):155.
24. Swart JF, Dijkhuizen EHP, Wulffraat NM, et al. Clinical Juvenile Arthritis Disease Activity Score proves to be a useful tool in treat-to-target therapy in juvenile idiopathic arthritis. Ann Rheum Dis. 2018;77:336-342.
25. Horneff G, Klein A, Ganser G, et al. Protocols on classification, monitoring and therapy in children’s rheumatology (PRO-KIND): results of the working group polyarticular juvenile idiopathic arthritis. Pediatr Rheumatol Online J. 2017;15:78.
26. Shoop-Worrall SJW, Verstappen SMM, McDonagh JE, et al. Long‐term outcomes following achievement of clinically inactive disease in juvenile idiopathic arthritis. Arthritis Rheumatol. 2018;70:1519-1529.
27. Ahn SS, Yoo BW, Jung SM, et al. In-hospital mortality in febrile lupus patients based on 2016 EULAR/ACR/PRINTO classification criteria for macrophage activation syndrome. Sem Arthritis Rheum. 2017;.47:216-221.
28. Yokota S, Mori M, Imagawa T, et al. Proposal for juvenile idiopathic arthritis guidance on diagnosis and treatment for primary care pediatricians and nonpediatric rheumatologists (2007). Mod Rheumatol. 2007;17:353-363.
29. Barut K, Adrovic A, Şahin S, et al. Juvenile idiopathic arthritis. Balkan Med J. 2017;34:90-101.
30. Colebatch-Bourn AN, Edwards CJ, et al. EULAR-PReS points to consider for the use of imaging in the diagnosis and management of juvenile idiopathic arthritis in clinical practice. Ann Rheum Dis. 2015;74:1946-1957.
31. Blazina Š, Markelj G, AvramoviČ MZ, et al. Management of juvenile idiopathic arthritis: a clinical guide. Pediatr Drugs. 2016;18:397-412.
32. Santos MJ, Conde M, Mourão AF, et al. 2016 update of the Portuguese recommendations for the use of biologic therapies in children and adolescents with juvenile idiopathic arthritis. Acta Rheumatol Port. 2016;41:194-212.
33. Steinbrocker 0, Traeger CH, Batterman RC. Therapeutic criteria in rheumatoid arthritis. JAMA. 1949;140:659-662.
34. Oen K, Malleson PN, Cabral D, et al. Disease course and outcome of juvenile rheumatoid arthritis in a multicenter cohort. J Rheumatol. 2002;29:1989-1999.
PRACTICE RECOMMENDATIONS
› Pair the findings of your clinical exam with the results of imaging and laboratory testing to make the diagnosis of juvenile idiopathic arthritis (JIA), as it is a diagnosis of exclusion. B
› Individualize treatment based on where the patient falls in the JIA disease spectrum to increase the likelihood that medical therapy will be effective. A
› Consider treating diagnosed JIA with an available biologic agent, which can provide a long asymptomatic period. B
Strength of recommendation (SOR)
A Good-quality patient-oriented evidence
B Inconsistent or limited-quality patient-oriented evidence
C Consensus, usual practice, opinion, disease-oriented evidence, case series
Patient, heal thyself!
Octavio has prostate cancer. His prostate growth is large but localized.
“What do your doctors suggest?” I asked him.
“They sent me to two specialists at the medical center,” he said. “One does robotic surgery, the other does radiation. Each one told me why they recommend their technique.”
“How will you decide?”
“I’ll do some reading,” he said.
“What about the doctor who sent you to them?”
“He hasn’t discussed the choice with me, just sent me to get opinions. I have to make up own mind.”
Out of training for some time, I gather from students and family medical interactions that patient autonomy is now a reigning principle. Here is one definition:
. Patient autonomy does allow for health care providers to educate the patient but does not allow the health care provider to make the decision for the patient.
This sounds sensible, even admirable: no more paternalistic physicians talking down to patients and ordering them around. Yet a closer look shows a contradiction:
1. The second sentence says that patient autonomy “does not allow the health care provider to make the decision for the patient.”
2. But the first one says that patients should decide, “without their health care provider trying to influence the decision.”
Is “trying to influence” the same as making the decision for the patient?
Some would argue that it is: The power discrepancy between the parties makes a doctor’s attempt to influence amount to coercion.
Do you agree, esteemed colleagues, those of you who, like me, treat patients all day? If the choice is between freezing an actinic keratosis, burning it, or using topical chemotherapy, do you just lay all three options out there and ask the patient to pick one? What if your patient works in public and doesn’t have 2 weeks to wait while the reaction to topical 5-fluorouracil that makes his skin look like raw lobster subsides? Can you point that out? Or would that be “trying to influence” and thus not allowed?
You and I can think of many other examples, about medical choices large and small, where we could pose similar questions. This is not abstract philosophy; it is what we do all day.
Look up robot-assisted surgery and radiation for prostate cancer. You will find proponents of both, each making claims concerning survival, recurrence, discomfort, complications. Which is more important – a 15% greater chance of living 2 years longer or a 22% lower risk of incontinence? Will reading such statistics make your choice easier? What if other studies show different numbers?
Octavio chose surgery. I asked him how he decided.
“I talked with an internist I know socially,” he said. “He shared his experience with patients he’s referred for my problem and advised surgery as the better choice. I also saw a story online about a lawyer who chose one method, then 5 years later had to do the other.”
Octavio is sophisticated and well read. He lives near Boston, the self-described hub of medical expertise and academic excellence. Yet he makes up his mind the way everybody does: by asking a trusted adviser, by hearing an arresting anecdote. It’s not science. It’s how people think.
You don’t have to be a behavioral psychologist to know how hard it is for patients, especially frightened ones, to interpret statistical variances or compare disparate categories. Which is better – shorter life with less pain or longer life with more? How much less? How much more? There are ways to address such questions, but having an expert, trusted, and sympathetic adviser is a pretty good way to start. Only an abstract ethicist with no practical exposure to (or sympathy with) actual existing patients and their actual existing providers could possibly think otherwise.
“Let’s freeze those actinics off,” I suggest to a patient. “That won’t scar, you won’t need a dozen shots of lidocaine, and you won’t have to hide for 3 weeks.”

Did I influence her health care decision? Sure. Guilty as charged, with no apologies. When I am a patient, I want nothing less for myself: sympathetic, experienced guidance, shared by someone who knows me and appears to care one way or the other how I do.
Lord preserve us, doctors and patients both, from dogmatists who would demand otherwise.
Dr. Rockoff practices dermatology in Brookline, Mass., and is a longtime contributor to Dermatology News. He serves on the clinical faculty at Tufts University, Boston, and has taught senior medical students and other trainees for 30 years. His second book, “Act Like a Doctor, Think Like a Patient,” is available at amazon.com and barnesandnoble.com. Write to him at dermnews@mdedge.com.
Octavio has prostate cancer. His prostate growth is large but localized.
“What do your doctors suggest?” I asked him.
“They sent me to two specialists at the medical center,” he said. “One does robotic surgery, the other does radiation. Each one told me why they recommend their technique.”
“How will you decide?”
“I’ll do some reading,” he said.
“What about the doctor who sent you to them?”
“He hasn’t discussed the choice with me, just sent me to get opinions. I have to make up own mind.”
Out of training for some time, I gather from students and family medical interactions that patient autonomy is now a reigning principle. Here is one definition:
. Patient autonomy does allow for health care providers to educate the patient but does not allow the health care provider to make the decision for the patient.
This sounds sensible, even admirable: no more paternalistic physicians talking down to patients and ordering them around. Yet a closer look shows a contradiction:
1. The second sentence says that patient autonomy “does not allow the health care provider to make the decision for the patient.”
2. But the first one says that patients should decide, “without their health care provider trying to influence the decision.”
Is “trying to influence” the same as making the decision for the patient?
Some would argue that it is: The power discrepancy between the parties makes a doctor’s attempt to influence amount to coercion.
Do you agree, esteemed colleagues, those of you who, like me, treat patients all day? If the choice is between freezing an actinic keratosis, burning it, or using topical chemotherapy, do you just lay all three options out there and ask the patient to pick one? What if your patient works in public and doesn’t have 2 weeks to wait while the reaction to topical 5-fluorouracil that makes his skin look like raw lobster subsides? Can you point that out? Or would that be “trying to influence” and thus not allowed?
You and I can think of many other examples, about medical choices large and small, where we could pose similar questions. This is not abstract philosophy; it is what we do all day.
Look up robot-assisted surgery and radiation for prostate cancer. You will find proponents of both, each making claims concerning survival, recurrence, discomfort, complications. Which is more important – a 15% greater chance of living 2 years longer or a 22% lower risk of incontinence? Will reading such statistics make your choice easier? What if other studies show different numbers?
Octavio chose surgery. I asked him how he decided.
“I talked with an internist I know socially,” he said. “He shared his experience with patients he’s referred for my problem and advised surgery as the better choice. I also saw a story online about a lawyer who chose one method, then 5 years later had to do the other.”
Octavio is sophisticated and well read. He lives near Boston, the self-described hub of medical expertise and academic excellence. Yet he makes up his mind the way everybody does: by asking a trusted adviser, by hearing an arresting anecdote. It’s not science. It’s how people think.
You don’t have to be a behavioral psychologist to know how hard it is for patients, especially frightened ones, to interpret statistical variances or compare disparate categories. Which is better – shorter life with less pain or longer life with more? How much less? How much more? There are ways to address such questions, but having an expert, trusted, and sympathetic adviser is a pretty good way to start. Only an abstract ethicist with no practical exposure to (or sympathy with) actual existing patients and their actual existing providers could possibly think otherwise.
“Let’s freeze those actinics off,” I suggest to a patient. “That won’t scar, you won’t need a dozen shots of lidocaine, and you won’t have to hide for 3 weeks.”
Did I influence her health care decision? Sure. Guilty as charged, with no apologies. When I am a patient, I want nothing less for myself: sympathetic, experienced guidance, shared by someone who knows me and appears to care one way or the other how I do.
Lord preserve us, doctors and patients both, from dogmatists who would demand otherwise.
Dr. Rockoff practices dermatology in Brookline, Mass., and is a longtime contributor to Dermatology News. He serves on the clinical faculty at Tufts University, Boston, and has taught senior medical students and other trainees for 30 years. His second book, “Act Like a Doctor, Think Like a Patient,” is available at amazon.com and barnesandnoble.com. Write to him at dermnews@mdedge.com.
Octavio has prostate cancer. His prostate growth is large but localized.
“What do your doctors suggest?” I asked him.
“They sent me to two specialists at the medical center,” he said. “One does robotic surgery, the other does radiation. Each one told me why they recommend their technique.”
“How will you decide?”
“I’ll do some reading,” he said.
“What about the doctor who sent you to them?”
“He hasn’t discussed the choice with me, just sent me to get opinions. I have to make up own mind.”
Out of training for some time, I gather from students and family medical interactions that patient autonomy is now a reigning principle. Here is one definition:
. Patient autonomy does allow for health care providers to educate the patient but does not allow the health care provider to make the decision for the patient.
This sounds sensible, even admirable: no more paternalistic physicians talking down to patients and ordering them around. Yet a closer look shows a contradiction:
1. The second sentence says that patient autonomy “does not allow the health care provider to make the decision for the patient.”
2. But the first one says that patients should decide, “without their health care provider trying to influence the decision.”
Is “trying to influence” the same as making the decision for the patient?
Some would argue that it is: The power discrepancy between the parties makes a doctor’s attempt to influence amount to coercion.
Do you agree, esteemed colleagues, those of you who, like me, treat patients all day? If the choice is between freezing an actinic keratosis, burning it, or using topical chemotherapy, do you just lay all three options out there and ask the patient to pick one? What if your patient works in public and doesn’t have 2 weeks to wait while the reaction to topical 5-fluorouracil that makes his skin look like raw lobster subsides? Can you point that out? Or would that be “trying to influence” and thus not allowed?
You and I can think of many other examples, about medical choices large and small, where we could pose similar questions. This is not abstract philosophy; it is what we do all day.
Look up robot-assisted surgery and radiation for prostate cancer. You will find proponents of both, each making claims concerning survival, recurrence, discomfort, complications. Which is more important – a 15% greater chance of living 2 years longer or a 22% lower risk of incontinence? Will reading such statistics make your choice easier? What if other studies show different numbers?
Octavio chose surgery. I asked him how he decided.
“I talked with an internist I know socially,” he said. “He shared his experience with patients he’s referred for my problem and advised surgery as the better choice. I also saw a story online about a lawyer who chose one method, then 5 years later had to do the other.”
Octavio is sophisticated and well read. He lives near Boston, the self-described hub of medical expertise and academic excellence. Yet he makes up his mind the way everybody does: by asking a trusted adviser, by hearing an arresting anecdote. It’s not science. It’s how people think.
You don’t have to be a behavioral psychologist to know how hard it is for patients, especially frightened ones, to interpret statistical variances or compare disparate categories. Which is better – shorter life with less pain or longer life with more? How much less? How much more? There are ways to address such questions, but having an expert, trusted, and sympathetic adviser is a pretty good way to start. Only an abstract ethicist with no practical exposure to (or sympathy with) actual existing patients and their actual existing providers could possibly think otherwise.
“Let’s freeze those actinics off,” I suggest to a patient. “That won’t scar, you won’t need a dozen shots of lidocaine, and you won’t have to hide for 3 weeks.”
Did I influence her health care decision? Sure. Guilty as charged, with no apologies. When I am a patient, I want nothing less for myself: sympathetic, experienced guidance, shared by someone who knows me and appears to care one way or the other how I do.
Lord preserve us, doctors and patients both, from dogmatists who would demand otherwise.
Dr. Rockoff practices dermatology in Brookline, Mass., and is a longtime contributor to Dermatology News. He serves on the clinical faculty at Tufts University, Boston, and has taught senior medical students and other trainees for 30 years. His second book, “Act Like a Doctor, Think Like a Patient,” is available at amazon.com and barnesandnoble.com. Write to him at dermnews@mdedge.com.

Neurologists grappling with patients who embrace ‘stem cell tourism’
DALLAS – Stem cell tourism – the unethical practice of offering unproven cellular preparations to patients for a variety of conditions – is increasingly sought by patients with incurable conditions such as multiple sclerosis and amyotrophic lateral sclerosis, results from a novel survey suggest.
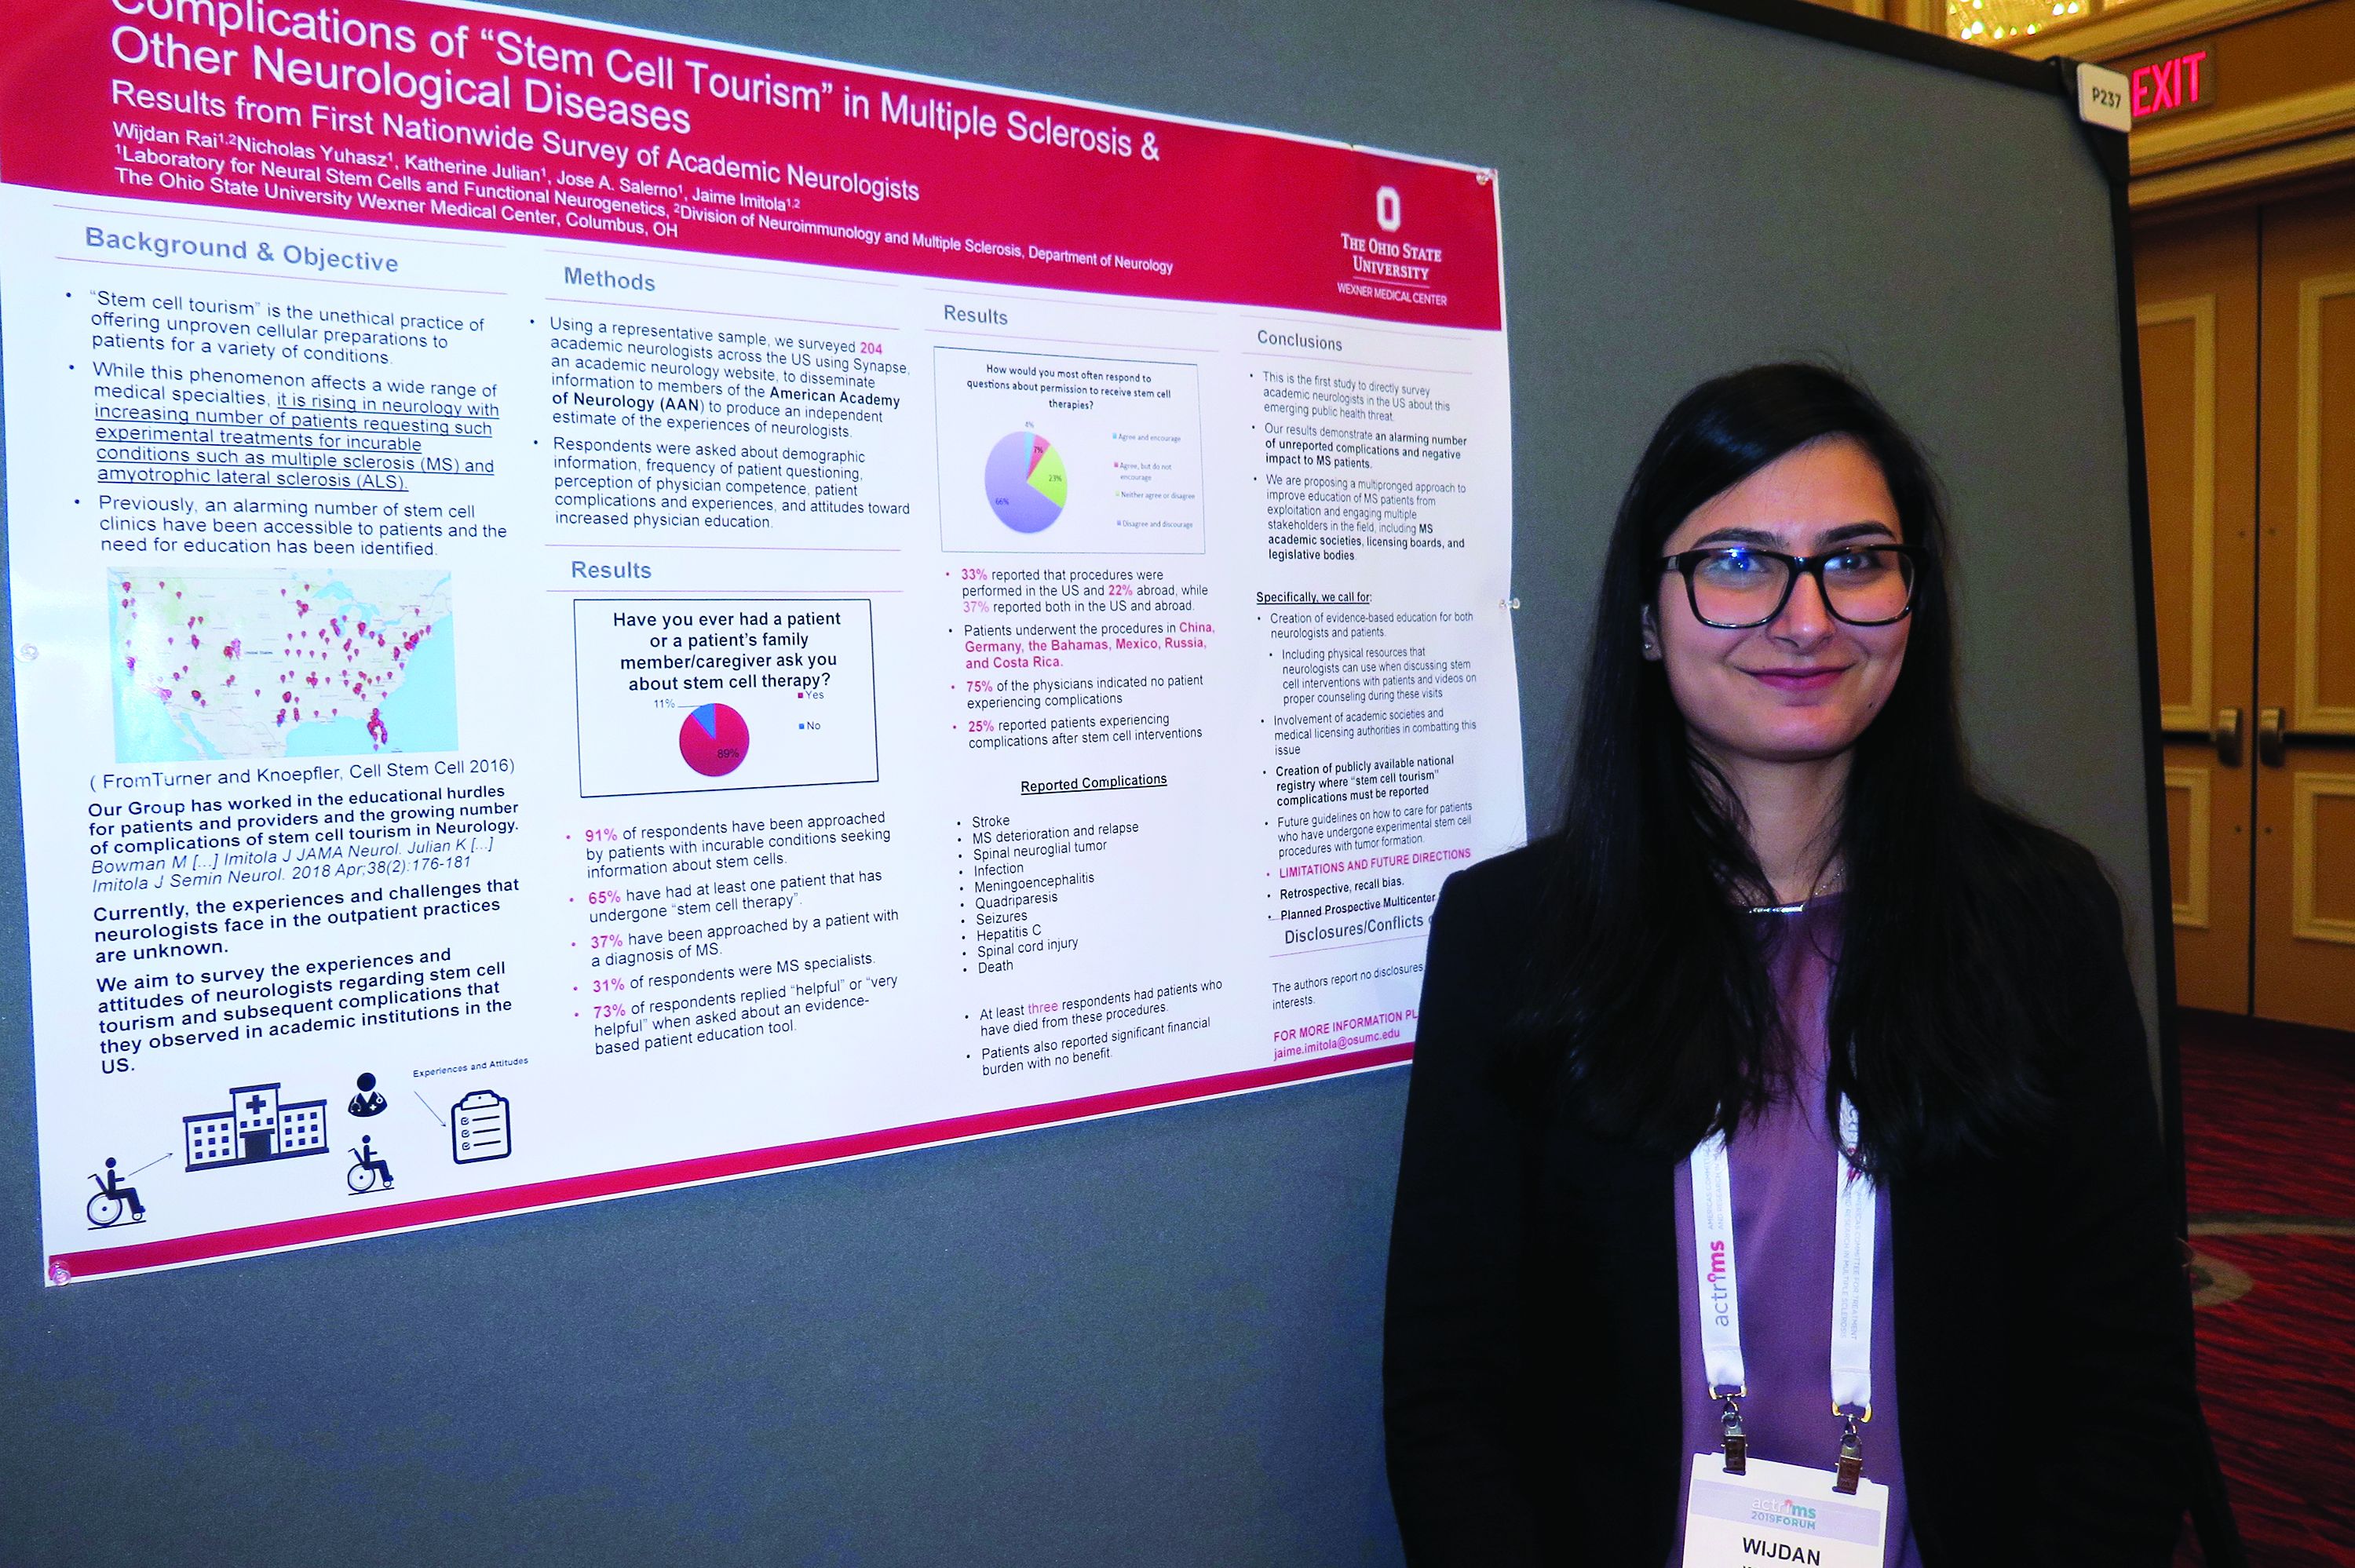
In fact, most academic neurologists have been approached by patients with incurable conditions who ask them about stem cell therapy, while about two-thirds have had at least one patient who has undergone stem cell therapy.
“It’s really scary,” Wijdan Rai, MBBS, the study’s first author, said in an interview at the meeting held by the Americas Committee for Treatment and Research in Multiple Sclerosis. “This is a more prevalent issue than we think, and the complication rates are higher than we think.”
According to the study’s senior author, Jaime Imitola, MD, who directs the Progressive Multiple Sclerosis Multidisciplinary Clinic and Translational Research Program at the Ohio State University Wexner Medical Center, Columbus, the results “call for the creation of a nationwide registry where neurologists can document adverse reactions to stem cell procedures and further support dedicated patient and neurologist education as we have proposed before” (See Semin Neurol. 2018; 38[2]:176-81 and JAMA Neurol. 2015;72[11]:1342-5).
In an effort to understand the experiences and attitudes of academic neurologists regarding stem cell tourism and patient-reported complications, the researchers developed a 25-question survey disseminated via Synapse, a web tool from the American Academy of Neurology. Respondents were asked about demographic information, frequency of patient questioning, perception of physician competence, patient complications and experiences, and attitudes toward increased physician education.
Dr. Rai, who is a senior neurology resident at the medical center, presented findings from 204 neurologist respondents, of whom 31% identified themselves as MS specialists. Nearly all respondents (91%) said they have been approached by patients with incurable conditions seeking information about stem cells (37% of whom had diagnosis of MS). In addition, 65% have had at least one patient that has undergone “stem cell therapy,” and 73% said it would be “helpful” or “very helpful” to have an evidence-based patient education tool on the topic. “Patients most often wanted general information,” Dr. Rai said. “However, 50% requested permission to undergo a stem cell procedure, and 31% approached their neurologist after the procedure.”
Survey respondents reported that 33% of the stem cell interventions were performed in the United States and 22% abroad, while 37% reported both in the U.S. and abroad. Patients underwent the procedures in China, Germany, the Bahamas, Mexico, Russia, and Costa Rica. Three-quarters of respondents (75%) indicated no patient experiencing complications from the stem cell interventions. However, 25% reported patients experiencing a variety of complications from the procedures, including strokes, meningoencephalitis, quadriparesis, MS deterioration, sepsis, hepatitis C, seizures, meningitis from intrathecal cell injections, infections, and spinal cord tumors. “At least three respondents had a patient who died as a direct complication from stem cell therapy,” Dr. Rai said.
In their poster, the researchers recommended a “multipronged approach to improve education of MS patients from exploitation and engaging multiple stakeholders in the field, including MS academic societies, licensing boards, and legislative bodies. Specifically, we call for creation of evidence-based education for both neurologists and patients, including physical resources that neurologists can use when discussing stem cell interventions with patients and videos on proper counseling during these visits.”
Colleagues from OSU’s Laboratory for Neural Stem Cells and Functional Neurogenetics contributed to this work. The researchers reported having no financial disclosures.
SOURCE: Rai W et al. ACTRIMS Forum 2019, Poster 237.
DALLAS – Stem cell tourism – the unethical practice of offering unproven cellular preparations to patients for a variety of conditions – is increasingly sought by patients with incurable conditions such as multiple sclerosis and amyotrophic lateral sclerosis, results from a novel survey suggest.
In fact, most academic neurologists have been approached by patients with incurable conditions who ask them about stem cell therapy, while about two-thirds have had at least one patient who has undergone stem cell therapy.
“It’s really scary,” Wijdan Rai, MBBS, the study’s first author, said in an interview at the meeting held by the Americas Committee for Treatment and Research in Multiple Sclerosis. “This is a more prevalent issue than we think, and the complication rates are higher than we think.”
According to the study’s senior author, Jaime Imitola, MD, who directs the Progressive Multiple Sclerosis Multidisciplinary Clinic and Translational Research Program at the Ohio State University Wexner Medical Center, Columbus, the results “call for the creation of a nationwide registry where neurologists can document adverse reactions to stem cell procedures and further support dedicated patient and neurologist education as we have proposed before” (See Semin Neurol. 2018; 38[2]:176-81 and JAMA Neurol. 2015;72[11]:1342-5).
In an effort to understand the experiences and attitudes of academic neurologists regarding stem cell tourism and patient-reported complications, the researchers developed a 25-question survey disseminated via Synapse, a web tool from the American Academy of Neurology. Respondents were asked about demographic information, frequency of patient questioning, perception of physician competence, patient complications and experiences, and attitudes toward increased physician education.
Dr. Rai, who is a senior neurology resident at the medical center, presented findings from 204 neurologist respondents, of whom 31% identified themselves as MS specialists. Nearly all respondents (91%) said they have been approached by patients with incurable conditions seeking information about stem cells (37% of whom had diagnosis of MS). In addition, 65% have had at least one patient that has undergone “stem cell therapy,” and 73% said it would be “helpful” or “very helpful” to have an evidence-based patient education tool on the topic. “Patients most often wanted general information,” Dr. Rai said. “However, 50% requested permission to undergo a stem cell procedure, and 31% approached their neurologist after the procedure.”
Survey respondents reported that 33% of the stem cell interventions were performed in the United States and 22% abroad, while 37% reported both in the U.S. and abroad. Patients underwent the procedures in China, Germany, the Bahamas, Mexico, Russia, and Costa Rica. Three-quarters of respondents (75%) indicated no patient experiencing complications from the stem cell interventions. However, 25% reported patients experiencing a variety of complications from the procedures, including strokes, meningoencephalitis, quadriparesis, MS deterioration, sepsis, hepatitis C, seizures, meningitis from intrathecal cell injections, infections, and spinal cord tumors. “At least three respondents had a patient who died as a direct complication from stem cell therapy,” Dr. Rai said.
In their poster, the researchers recommended a “multipronged approach to improve education of MS patients from exploitation and engaging multiple stakeholders in the field, including MS academic societies, licensing boards, and legislative bodies. Specifically, we call for creation of evidence-based education for both neurologists and patients, including physical resources that neurologists can use when discussing stem cell interventions with patients and videos on proper counseling during these visits.”
Colleagues from OSU’s Laboratory for Neural Stem Cells and Functional Neurogenetics contributed to this work. The researchers reported having no financial disclosures.
SOURCE: Rai W et al. ACTRIMS Forum 2019, Poster 237.
DALLAS – Stem cell tourism – the unethical practice of offering unproven cellular preparations to patients for a variety of conditions – is increasingly sought by patients with incurable conditions such as multiple sclerosis and amyotrophic lateral sclerosis, results from a novel survey suggest.
In fact, most academic neurologists have been approached by patients with incurable conditions who ask them about stem cell therapy, while about two-thirds have had at least one patient who has undergone stem cell therapy.
“It’s really scary,” Wijdan Rai, MBBS, the study’s first author, said in an interview at the meeting held by the Americas Committee for Treatment and Research in Multiple Sclerosis. “This is a more prevalent issue than we think, and the complication rates are higher than we think.”
According to the study’s senior author, Jaime Imitola, MD, who directs the Progressive Multiple Sclerosis Multidisciplinary Clinic and Translational Research Program at the Ohio State University Wexner Medical Center, Columbus, the results “call for the creation of a nationwide registry where neurologists can document adverse reactions to stem cell procedures and further support dedicated patient and neurologist education as we have proposed before” (See Semin Neurol. 2018; 38[2]:176-81 and JAMA Neurol. 2015;72[11]:1342-5).
In an effort to understand the experiences and attitudes of academic neurologists regarding stem cell tourism and patient-reported complications, the researchers developed a 25-question survey disseminated via Synapse, a web tool from the American Academy of Neurology. Respondents were asked about demographic information, frequency of patient questioning, perception of physician competence, patient complications and experiences, and attitudes toward increased physician education.
Dr. Rai, who is a senior neurology resident at the medical center, presented findings from 204 neurologist respondents, of whom 31% identified themselves as MS specialists. Nearly all respondents (91%) said they have been approached by patients with incurable conditions seeking information about stem cells (37% of whom had diagnosis of MS). In addition, 65% have had at least one patient that has undergone “stem cell therapy,” and 73% said it would be “helpful” or “very helpful” to have an evidence-based patient education tool on the topic. “Patients most often wanted general information,” Dr. Rai said. “However, 50% requested permission to undergo a stem cell procedure, and 31% approached their neurologist after the procedure.”
Survey respondents reported that 33% of the stem cell interventions were performed in the United States and 22% abroad, while 37% reported both in the U.S. and abroad. Patients underwent the procedures in China, Germany, the Bahamas, Mexico, Russia, and Costa Rica. Three-quarters of respondents (75%) indicated no patient experiencing complications from the stem cell interventions. However, 25% reported patients experiencing a variety of complications from the procedures, including strokes, meningoencephalitis, quadriparesis, MS deterioration, sepsis, hepatitis C, seizures, meningitis from intrathecal cell injections, infections, and spinal cord tumors. “At least three respondents had a patient who died as a direct complication from stem cell therapy,” Dr. Rai said.
In their poster, the researchers recommended a “multipronged approach to improve education of MS patients from exploitation and engaging multiple stakeholders in the field, including MS academic societies, licensing boards, and legislative bodies. Specifically, we call for creation of evidence-based education for both neurologists and patients, including physical resources that neurologists can use when discussing stem cell interventions with patients and videos on proper counseling during these visits.”
Colleagues from OSU’s Laboratory for Neural Stem Cells and Functional Neurogenetics contributed to this work. The researchers reported having no financial disclosures.
SOURCE: Rai W et al. ACTRIMS Forum 2019, Poster 237.
REPORTING FROM ACTRIMS FORUM 2019
Understanding AD as immune-driven disease has opened the door to new therapies
WASHINGTON – The “ of the disease has grown, Emma Guttman-Yassky, MD, PhD, said during a presentation at the annual meeting of the American Academy of Dermatology.
“It’s due to the increased understanding we now have in atopic dermatitis,” Dr. Guttman-Yassky, professor and vice chair for research in the department of dermatology at the Icahn School of Medicine at Mount Sinai, New York, said in her presentation.
According to Dr. Guttman-Yassky, therapeutic development was prevented in AD because of the abnormalities present in the disease immune responses and barrier abnormalities. “Frankly, pharma[ceutical] companies didn’t know what they should go after,” she said. “Should they go after the immune abnormalities, or should they go after the barrier? I think that’s why we’re so far behind psoriasis – but don’t worry, we are catching up quite fast because now ... we understand what we need to go after.”
It was when researchers began to look at AD in the same way as psoriasis that they realized the two were “polar” immune diseases, with psoriasis having Th17/interleukin-17 involvement while atopic dermatitis had Th2/IL-13 involvement. The same approach of “bedside-to-bench pathogenic dissection and translational testing of therapeutics” that led to successful advancements in therapies for psoriasis can also be applied to AD, Dr. Guttman-Yassky said.
To create a translational approach to AD, researchers need to have a well-defined molecular phenotype and understanding of inflammatory pathways, good baseline biomarkers of disease activity and treatment responses, and drugs that would selectively target the immune system. Th2-type cytokines such as IL-4 and IL-13 could help link the barrier and immune defects in AD. In addition, all variations of AD subtypes across white, black, Asian, and pediatric populations have “robust Th2 activation” but differ in other areas. “We’ll need to stratify biomarkers specific to different atopic dermatitis phenotypes to really develop a personalized medicine approach in atopic dermatitis,” she said.
High-level systemic immune activation shows that AD is emerging as a systemic disease that leads to atopic comorbidities such as allergy and asthma, as well as cardiovascular and infectious comorbidities. “We need to think about it when we treat our patients, because we really need to give them systemic treatment approaches when they have this moderate to severe disease,” Dr. Guttman-Yassky said. “When adult patients have moderate to severe disease, what is nonlesional today may be lesional tomorrow, and to treat them effectively, you have to offer them some systemic approaches.”
There is evidence that dupilumab, a human monoclonal antibody that targets IL-4 receptor alpha, is “proving the immune hypothesis” of AD, Dr. Guttman-Yassky said. She cited a recent study from her own group that found use of dupilumab to inhibit IL-4/IL-13 signaling improved disease activity for patients with AD, including reducing the expression of genes that caused type 2 inflammation, epidermal hyperplasia, T cells, dendritic cells, and Th17/Th22 activity (J Allergy Clin Immunol. 2019 Jan;143(1):155-72).
“We could postulate it before, but we couldn’t prove it,” she said. “Basically, this opened the door to all the therapy that we now have in atopic dermatitis.”
According to Dr. Guttman-Yassky, the future of AD will be in creating personalized treatments for patients by stratifying biomarkers specific to different AD phenotypes.
“It’s a very hopeful time in atopic dermatitis with this growing knowledge that we have of the biology of [the disease],” she said. “We have many more agents to treat our patients, and I think the future will be about personalized medicine so we really are treating the disease very well.”
Dr. Guttman-Yassky reported relationships with AbbVie, Allergan, Almirall, Anacor Pharmaceuticals, Asana BioSciences, Celgene, Dermira, Eli Lilly, Escalier Biosciences, Galderma Research & Development, Glenmark Generics, Janssen, Kyowa Hakko Kirin, Leo Pharma, Medimmune, Novartis, Pfizer, Regeneron, Sanofi-Aventis, Sanofi/Regeneron, Stiefel, Theravance Biopharma, and Vitae Pharmaceuticals.
WASHINGTON – The “ of the disease has grown, Emma Guttman-Yassky, MD, PhD, said during a presentation at the annual meeting of the American Academy of Dermatology.
“It’s due to the increased understanding we now have in atopic dermatitis,” Dr. Guttman-Yassky, professor and vice chair for research in the department of dermatology at the Icahn School of Medicine at Mount Sinai, New York, said in her presentation.
According to Dr. Guttman-Yassky, therapeutic development was prevented in AD because of the abnormalities present in the disease immune responses and barrier abnormalities. “Frankly, pharma[ceutical] companies didn’t know what they should go after,” she said. “Should they go after the immune abnormalities, or should they go after the barrier? I think that’s why we’re so far behind psoriasis – but don’t worry, we are catching up quite fast because now ... we understand what we need to go after.”
It was when researchers began to look at AD in the same way as psoriasis that they realized the two were “polar” immune diseases, with psoriasis having Th17/interleukin-17 involvement while atopic dermatitis had Th2/IL-13 involvement. The same approach of “bedside-to-bench pathogenic dissection and translational testing of therapeutics” that led to successful advancements in therapies for psoriasis can also be applied to AD, Dr. Guttman-Yassky said.
To create a translational approach to AD, researchers need to have a well-defined molecular phenotype and understanding of inflammatory pathways, good baseline biomarkers of disease activity and treatment responses, and drugs that would selectively target the immune system. Th2-type cytokines such as IL-4 and IL-13 could help link the barrier and immune defects in AD. In addition, all variations of AD subtypes across white, black, Asian, and pediatric populations have “robust Th2 activation” but differ in other areas. “We’ll need to stratify biomarkers specific to different atopic dermatitis phenotypes to really develop a personalized medicine approach in atopic dermatitis,” she said.
High-level systemic immune activation shows that AD is emerging as a systemic disease that leads to atopic comorbidities such as allergy and asthma, as well as cardiovascular and infectious comorbidities. “We need to think about it when we treat our patients, because we really need to give them systemic treatment approaches when they have this moderate to severe disease,” Dr. Guttman-Yassky said. “When adult patients have moderate to severe disease, what is nonlesional today may be lesional tomorrow, and to treat them effectively, you have to offer them some systemic approaches.”
There is evidence that dupilumab, a human monoclonal antibody that targets IL-4 receptor alpha, is “proving the immune hypothesis” of AD, Dr. Guttman-Yassky said. She cited a recent study from her own group that found use of dupilumab to inhibit IL-4/IL-13 signaling improved disease activity for patients with AD, including reducing the expression of genes that caused type 2 inflammation, epidermal hyperplasia, T cells, dendritic cells, and Th17/Th22 activity (J Allergy Clin Immunol. 2019 Jan;143(1):155-72).
“We could postulate it before, but we couldn’t prove it,” she said. “Basically, this opened the door to all the therapy that we now have in atopic dermatitis.”
According to Dr. Guttman-Yassky, the future of AD will be in creating personalized treatments for patients by stratifying biomarkers specific to different AD phenotypes.
“It’s a very hopeful time in atopic dermatitis with this growing knowledge that we have of the biology of [the disease],” she said. “We have many more agents to treat our patients, and I think the future will be about personalized medicine so we really are treating the disease very well.”
Dr. Guttman-Yassky reported relationships with AbbVie, Allergan, Almirall, Anacor Pharmaceuticals, Asana BioSciences, Celgene, Dermira, Eli Lilly, Escalier Biosciences, Galderma Research & Development, Glenmark Generics, Janssen, Kyowa Hakko Kirin, Leo Pharma, Medimmune, Novartis, Pfizer, Regeneron, Sanofi-Aventis, Sanofi/Regeneron, Stiefel, Theravance Biopharma, and Vitae Pharmaceuticals.
WASHINGTON – The “ of the disease has grown, Emma Guttman-Yassky, MD, PhD, said during a presentation at the annual meeting of the American Academy of Dermatology.
“It’s due to the increased understanding we now have in atopic dermatitis,” Dr. Guttman-Yassky, professor and vice chair for research in the department of dermatology at the Icahn School of Medicine at Mount Sinai, New York, said in her presentation.
According to Dr. Guttman-Yassky, therapeutic development was prevented in AD because of the abnormalities present in the disease immune responses and barrier abnormalities. “Frankly, pharma[ceutical] companies didn’t know what they should go after,” she said. “Should they go after the immune abnormalities, or should they go after the barrier? I think that’s why we’re so far behind psoriasis – but don’t worry, we are catching up quite fast because now ... we understand what we need to go after.”
It was when researchers began to look at AD in the same way as psoriasis that they realized the two were “polar” immune diseases, with psoriasis having Th17/interleukin-17 involvement while atopic dermatitis had Th2/IL-13 involvement. The same approach of “bedside-to-bench pathogenic dissection and translational testing of therapeutics” that led to successful advancements in therapies for psoriasis can also be applied to AD, Dr. Guttman-Yassky said.
To create a translational approach to AD, researchers need to have a well-defined molecular phenotype and understanding of inflammatory pathways, good baseline biomarkers of disease activity and treatment responses, and drugs that would selectively target the immune system. Th2-type cytokines such as IL-4 and IL-13 could help link the barrier and immune defects in AD. In addition, all variations of AD subtypes across white, black, Asian, and pediatric populations have “robust Th2 activation” but differ in other areas. “We’ll need to stratify biomarkers specific to different atopic dermatitis phenotypes to really develop a personalized medicine approach in atopic dermatitis,” she said.
High-level systemic immune activation shows that AD is emerging as a systemic disease that leads to atopic comorbidities such as allergy and asthma, as well as cardiovascular and infectious comorbidities. “We need to think about it when we treat our patients, because we really need to give them systemic treatment approaches when they have this moderate to severe disease,” Dr. Guttman-Yassky said. “When adult patients have moderate to severe disease, what is nonlesional today may be lesional tomorrow, and to treat them effectively, you have to offer them some systemic approaches.”
There is evidence that dupilumab, a human monoclonal antibody that targets IL-4 receptor alpha, is “proving the immune hypothesis” of AD, Dr. Guttman-Yassky said. She cited a recent study from her own group that found use of dupilumab to inhibit IL-4/IL-13 signaling improved disease activity for patients with AD, including reducing the expression of genes that caused type 2 inflammation, epidermal hyperplasia, T cells, dendritic cells, and Th17/Th22 activity (J Allergy Clin Immunol. 2019 Jan;143(1):155-72).
“We could postulate it before, but we couldn’t prove it,” she said. “Basically, this opened the door to all the therapy that we now have in atopic dermatitis.”
According to Dr. Guttman-Yassky, the future of AD will be in creating personalized treatments for patients by stratifying biomarkers specific to different AD phenotypes.
“It’s a very hopeful time in atopic dermatitis with this growing knowledge that we have of the biology of [the disease],” she said. “We have many more agents to treat our patients, and I think the future will be about personalized medicine so we really are treating the disease very well.”
Dr. Guttman-Yassky reported relationships with AbbVie, Allergan, Almirall, Anacor Pharmaceuticals, Asana BioSciences, Celgene, Dermira, Eli Lilly, Escalier Biosciences, Galderma Research & Development, Glenmark Generics, Janssen, Kyowa Hakko Kirin, Leo Pharma, Medimmune, Novartis, Pfizer, Regeneron, Sanofi-Aventis, Sanofi/Regeneron, Stiefel, Theravance Biopharma, and Vitae Pharmaceuticals.
EXPERT ANALYSIS FROM AAD 19
Quitting smoking during pregnancy cuts SUID risk
Odds of sudden unexpected infant death (SUID) more than doubled with maternal prenatal smoking and increased linearly with each additional cigarette mothers smoked during pregnancy, but quitting smoking during pregnancy cut SUID risk, according to a new study in Pediatrics.

“As prevalence of prone sleeping has declined, the relative contribution of prenatal maternal smoking to the risk of sudden infant death has increased,” Tatiana M. Anderson, PhD, of the Seattle Children’s Research Institute and her associates reported. When the researchers considered causality, they estimated that approximately 800 infants (22% of all SUID cases) per year in the United States could be attributed to maternal smoking during pregnancy.
The researchers analyzed 19,127 SUID cases among 20,685,463 births included in the Centers for Disease Control and Prevention Birth Cohort Linked Birth/Infant Death Data Set for 2007-2011. A SUID diagnosis included sudden infant death syndrome, infant death from ill-defined or unknown cause, and accidental suffocation or strangulation in bed for any infants under 1 year old.
When the authors calculated odds related to prenatal maternal smoking and SUID, they adjusted for infant sex and birth weight, gestational length of pregnancy, delivery method (vaginal or cesarean), total prenatal visits, live birth order, maternal marital status and education, and maternal and paternal age and race/ethnicity.
Any maternal smoking at all during pregnancy was associated with more than twice the odds of SUID (adjusted odds ratio, 2.44). Odds of SUID also doubled for smoking one cigarette daily during pregnancy versus smoking none. For each additional cigarette smoked daily during pregnancy, odds of SUID increased by 0.07 up until 20 cigarettes, when the risk evened out, which suggests “that smoking cessation efforts may have greater impact on decreasing SUID rates when directed toward those who smoke fewer than 1 pack per day versus the more traditionally targeted heavy ([more than] 20 cigarettes per day) smokers,” the authors wrote.
Odds of SUID dropped 12% when mothers cut down on smoking during pregnancy and dropped 23% when they quit altogether (aORs, 0.88 and 0.77, respectively). “However, there may be some selection bias because the group who reduced smoking started at a higher average number of cigarettes in the first trimester, whereas those who successfully quit smoked fewer cigarettes in the first trimester,” the authors noted.
Among the 11.6% of mothers who said in 2011 that they smoked in the 3 months leading up to pregnancy, only a quarter quit while pregnant, the authors wrote. Quitting after having smoked before pregnancy was linked to a 47% increased risk of SUID, although the researchers noted that second- and third-hand smoke may have played a role since mothers who smoke may begin smoking again post partum and/or often have a partner who smokes.
“This group may have also included women who stopped smoking as soon as they knew they were pregnant and thus reported that they were nonsmokers in the first trimester, but the fetus had been exposed to maternal smoking during the period before pregnancy was diagnosed,” the authors wrote. They also acknowledged the possibility of residual confounding, particularly from socioeconomic factors or alcohol consumption during pregnancy.
The research was funded by the National Institutes of Health, Microsoft, and the Aaron Matthew Sudden Infant Death Syndrome Research Guild. One author has testified as a paid expert in a SUID case. No other authors reported conflicts of interest.
SOURCE: Anderson TM et al. Pediatrics. 2019 March 11. doi: 10.1542/peds.2018-3325.
Odds of sudden unexpected infant death (SUID) more than doubled with maternal prenatal smoking and increased linearly with each additional cigarette mothers smoked during pregnancy, but quitting smoking during pregnancy cut SUID risk, according to a new study in Pediatrics.
“As prevalence of prone sleeping has declined, the relative contribution of prenatal maternal smoking to the risk of sudden infant death has increased,” Tatiana M. Anderson, PhD, of the Seattle Children’s Research Institute and her associates reported. When the researchers considered causality, they estimated that approximately 800 infants (22% of all SUID cases) per year in the United States could be attributed to maternal smoking during pregnancy.
The researchers analyzed 19,127 SUID cases among 20,685,463 births included in the Centers for Disease Control and Prevention Birth Cohort Linked Birth/Infant Death Data Set for 2007-2011. A SUID diagnosis included sudden infant death syndrome, infant death from ill-defined or unknown cause, and accidental suffocation or strangulation in bed for any infants under 1 year old.
When the authors calculated odds related to prenatal maternal smoking and SUID, they adjusted for infant sex and birth weight, gestational length of pregnancy, delivery method (vaginal or cesarean), total prenatal visits, live birth order, maternal marital status and education, and maternal and paternal age and race/ethnicity.
Any maternal smoking at all during pregnancy was associated with more than twice the odds of SUID (adjusted odds ratio, 2.44). Odds of SUID also doubled for smoking one cigarette daily during pregnancy versus smoking none. For each additional cigarette smoked daily during pregnancy, odds of SUID increased by 0.07 up until 20 cigarettes, when the risk evened out, which suggests “that smoking cessation efforts may have greater impact on decreasing SUID rates when directed toward those who smoke fewer than 1 pack per day versus the more traditionally targeted heavy ([more than] 20 cigarettes per day) smokers,” the authors wrote.
Odds of SUID dropped 12% when mothers cut down on smoking during pregnancy and dropped 23% when they quit altogether (aORs, 0.88 and 0.77, respectively). “However, there may be some selection bias because the group who reduced smoking started at a higher average number of cigarettes in the first trimester, whereas those who successfully quit smoked fewer cigarettes in the first trimester,” the authors noted.
Among the 11.6% of mothers who said in 2011 that they smoked in the 3 months leading up to pregnancy, only a quarter quit while pregnant, the authors wrote. Quitting after having smoked before pregnancy was linked to a 47% increased risk of SUID, although the researchers noted that second- and third-hand smoke may have played a role since mothers who smoke may begin smoking again post partum and/or often have a partner who smokes.
“This group may have also included women who stopped smoking as soon as they knew they were pregnant and thus reported that they were nonsmokers in the first trimester, but the fetus had been exposed to maternal smoking during the period before pregnancy was diagnosed,” the authors wrote. They also acknowledged the possibility of residual confounding, particularly from socioeconomic factors or alcohol consumption during pregnancy.
The research was funded by the National Institutes of Health, Microsoft, and the Aaron Matthew Sudden Infant Death Syndrome Research Guild. One author has testified as a paid expert in a SUID case. No other authors reported conflicts of interest.
SOURCE: Anderson TM et al. Pediatrics. 2019 March 11. doi: 10.1542/peds.2018-3325.
Odds of sudden unexpected infant death (SUID) more than doubled with maternal prenatal smoking and increased linearly with each additional cigarette mothers smoked during pregnancy, but quitting smoking during pregnancy cut SUID risk, according to a new study in Pediatrics.
“As prevalence of prone sleeping has declined, the relative contribution of prenatal maternal smoking to the risk of sudden infant death has increased,” Tatiana M. Anderson, PhD, of the Seattle Children’s Research Institute and her associates reported. When the researchers considered causality, they estimated that approximately 800 infants (22% of all SUID cases) per year in the United States could be attributed to maternal smoking during pregnancy.
The researchers analyzed 19,127 SUID cases among 20,685,463 births included in the Centers for Disease Control and Prevention Birth Cohort Linked Birth/Infant Death Data Set for 2007-2011. A SUID diagnosis included sudden infant death syndrome, infant death from ill-defined or unknown cause, and accidental suffocation or strangulation in bed for any infants under 1 year old.
When the authors calculated odds related to prenatal maternal smoking and SUID, they adjusted for infant sex and birth weight, gestational length of pregnancy, delivery method (vaginal or cesarean), total prenatal visits, live birth order, maternal marital status and education, and maternal and paternal age and race/ethnicity.
Any maternal smoking at all during pregnancy was associated with more than twice the odds of SUID (adjusted odds ratio, 2.44). Odds of SUID also doubled for smoking one cigarette daily during pregnancy versus smoking none. For each additional cigarette smoked daily during pregnancy, odds of SUID increased by 0.07 up until 20 cigarettes, when the risk evened out, which suggests “that smoking cessation efforts may have greater impact on decreasing SUID rates when directed toward those who smoke fewer than 1 pack per day versus the more traditionally targeted heavy ([more than] 20 cigarettes per day) smokers,” the authors wrote.
Odds of SUID dropped 12% when mothers cut down on smoking during pregnancy and dropped 23% when they quit altogether (aORs, 0.88 and 0.77, respectively). “However, there may be some selection bias because the group who reduced smoking started at a higher average number of cigarettes in the first trimester, whereas those who successfully quit smoked fewer cigarettes in the first trimester,” the authors noted.
Among the 11.6% of mothers who said in 2011 that they smoked in the 3 months leading up to pregnancy, only a quarter quit while pregnant, the authors wrote. Quitting after having smoked before pregnancy was linked to a 47% increased risk of SUID, although the researchers noted that second- and third-hand smoke may have played a role since mothers who smoke may begin smoking again post partum and/or often have a partner who smokes.
“This group may have also included women who stopped smoking as soon as they knew they were pregnant and thus reported that they were nonsmokers in the first trimester, but the fetus had been exposed to maternal smoking during the period before pregnancy was diagnosed,” the authors wrote. They also acknowledged the possibility of residual confounding, particularly from socioeconomic factors or alcohol consumption during pregnancy.
The research was funded by the National Institutes of Health, Microsoft, and the Aaron Matthew Sudden Infant Death Syndrome Research Guild. One author has testified as a paid expert in a SUID case. No other authors reported conflicts of interest.
SOURCE: Anderson TM et al. Pediatrics. 2019 March 11. doi: 10.1542/peds.2018-3325.
FROM PEDIATRICS

To avoid Hep B reactivation, screen before immunosuppression
CASE A 53-year-old woman you are seeing for the first time has been taking 10 mg of prednisone daily for a month, prescribed by another practitioner for polymyalgia rheumatica. Testing is negative for hepatitis B surface antigen but is positive for hepatitis B core antibody total, indicating a resolved hepatitis B infection. The absence of hepatitis B DNA is confirmed.
How would you proceed with this patient?
Patients with resolved hepatitis B virus (HBV) or chronic hepatitis B (CHB) infections are at risk for HBV reactivation (HBVr) if they undergo immunosuppressive therapy for a condition such as cancer. HBVr can in turn lead to delays in treatment and increased morbidity and mortality.
HBVr is a well-documented adverse outcome in patients treated with rituximab and in those undergoing stem cell transplantation. Current oncology guidelines recommend screening for HBV prior to initiating these treatments.1,2 More recent evidence shows that many other immunosuppressive therapies can also lead to HBVr.3 Such treatments are now used across a multitude of specialties and conditions. For many of these conditions, there are no consistent guidelines regarding HBV screening.
In 2013, the US Food and Drug Administration (FDA) announced the requirement of a Boxed Warning for the immunosuppressive drugs ofatumumab and rituximab. In 2016, the FDA announced the same requirement for certain direct-acting antiviral medicines for hepatitis C virus.
Among patients who are positive for hepatitis-B surface antigen (HBsAg) and who are treated with immunosuppression, the frequency of HBVr has ranged from 0% to 39%.4,5
As the list of immunosuppressive therapies that can cause HBVr grows, specialty guidelines are evolving to address the risk that HBVr poses.
Continue to: An underrecognized problem
An underrecognized problem. CHB affects an estimated 350 million people worldwide6 but remains underrecognized and underdiagnosed. An estimated 1.4 million Americans6 have CHB, but only a minority of them are aware of their positive status and are followed by a hepatologist or receive medical care for their disease.7 Compared with the natural-born US population, a higher prevalence of CHB exists among immigrants to this country from the Asian Pacific and Eastern Mediterranean regions, sub-Saharan Africa, and certain parts of South America.8-10 In 2008, the Centers for Disease Control and Prevention (CDC) updated its recommendations on screening for HBV to include immigrants to the United States from intermediate and high endemic areas.6 Unfortunately, data published on physicians’ adherence to the CDC guidelines for screening show that only 60% correctly screened at-risk patients.11
Individuals with CHB are at risk and rely on a robust immune system to keep their disease from becoming active. During infection, the virus gains entry into the hepatocytes and the double-stranded viral genome is imported into the nucleus of the cell, where it is repaired into covalently closed circular DNA (cccDNA). Research has demonstrated the stability of cccDNA and its persistence as a latent reservoir for HBV reactivation, even decades after recovery from infection.12
Also at risk are individuals who have unrecovered from HBV infection and are HBsAg negative and anti-HBc positive. To avert reverse seroconversion, they also rely on a robust immune system.13 Reverse seroconversion is defined as a reappearance of HBV DNA and HBsAg positivity in individuals who were previously negative.13 In these individuals, HBV DNA may not be quantifiable in circulation, but trace amounts of viral DNA found in the liver are enough to pose a reactivation risk in the setting of immune suppression.14
Moreover, often overlooked is the fact that reactivation or reverse seroconversion can necessitate disruptions and delays in immunosuppressive treatment for other life-threatening disease processes.14,15
Universal screening reduces risk for HBVr. Patients with CHB are at risk for reactivation, as are patients with resolved HBV infection. Many patients, however, do not know their status. By screening all patients before beginning immunosuppressive therapy, physicians can provide effective prophylaxis, which has been shown to significantly reduce the risk for HBVr.8.15
Continue to: Recognizing the onset of HBVr
Recognizing the onset of HBVr
In patients with CHB, HBVr is defined as at least a 3-fold increase in aspart aminotransferase (AST) and alanine aminotransferase (ALT) and at least a 10-fold increase from baseline in HBV DNA. In patients with resolved HBV infection, there may be reverse seroconversion from HbsAg-negative to HBsAg-positive status (TABLE 113,16).
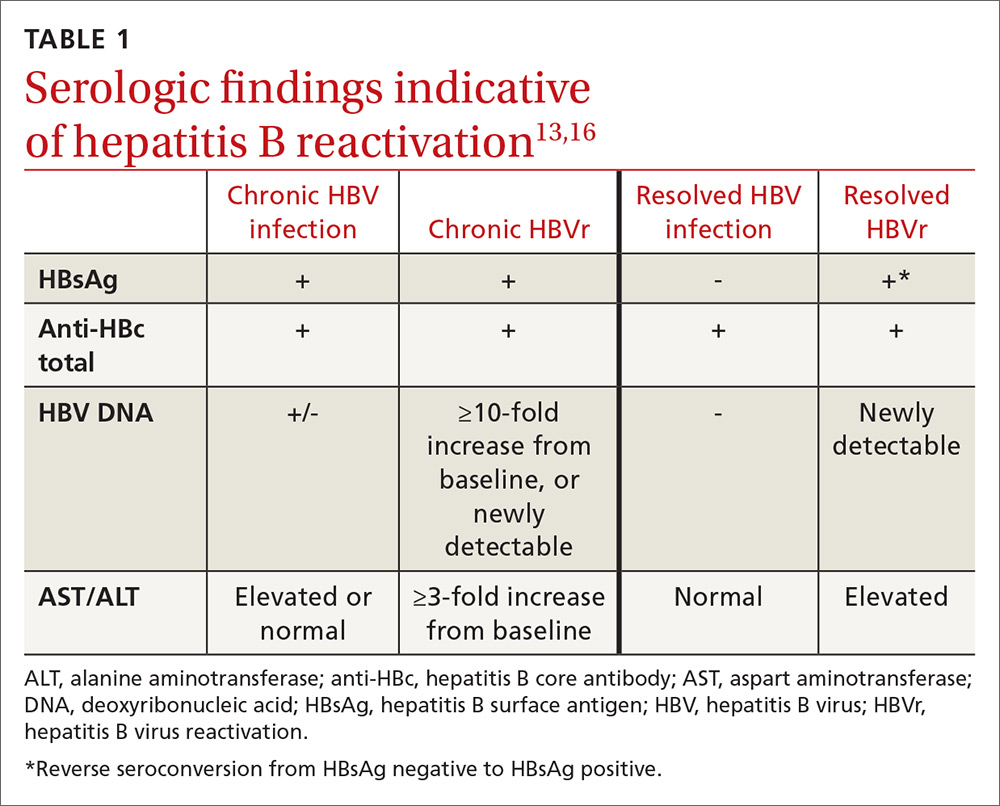
Not all elevations in AST/ALT in patients undergoing chemotherapy or immunosuppressive therapy indicate HBVr. Very often, derangements in AST/ALT may be related to the toxic effects of therapy or to the underlying disease process. However, as immunosuppressive therapy is now used for a wide array of medical conditions, consider HBVr as a potential cause of abnormal liver function in all patients receiving such therapy
A patient is at risk for HBVr when starting immunosuppression and up to a year following the completion of therapy. With suppression of the immune system, HBV replication increases and serum AST/ALT concentrations may rise. HBVr may also present with the appearance of HBV DNA in patients with previously undetectable levels.12,17
Most patients remain asymptomatic, and abnormal AST/ALT levels eventually resolve after completion of immunosuppression. However, some patients' liver enzymes may rise, indicating a more severe hepatic flare. These patients may present with right upper-quadrant tenderness, jaundice, or fatigue. In these cases, recognizing HBVr and starting antivirals may reduce hepatitis flare.
Unfortunately, despite early recognition of HBVr and initiation of appropriate therapy, some patients can progress to hepatic decompensation and even fulminant hepatic failure that may have been prevented with prophylaxis.
Continue to: The justification for universal screening
The justification for universal screening
Although nongastroenterology societies differ in their recommendations on screening for HBV, universal screening before implementing prolonged immunosuppressive treatment is recommended by the CDC,6 the American Association for the Study of Liver Diseases,18 the Asian Pacific Association for the Study of the Liver,19 the European Association for the Study of the Liver,20 and the American Gastroenterological Association (AGA).21
Older guidelines recommended screening only high-risk populations. But such screening has downfalls. It requires that patients or their physicians recognize that they are at high risk. In one study, nearly 65% of an infected Asian-American population was unaware of their positive HBV status.22 Risk-based screening also requires that physicians ask the appropriate questions and that patients admit to high-risk behavior. Screening patients based only on risk factors may easily overlook patients who need prophylaxis against HBVr.
Common arguments against universal screening include the cost of testing, the possibility of false-positive results, and the implications of a new diagnosis of hepatitis B. However, the potential benefits of screening are significant, and HBV screening in the general population has been shown to be cost effective when the prevalence of HBV is 0.3%.21 In the United States, conservative estimates are a prevalence of HBsAg positivity of 0.4% and past infection of 3%, making screening a cost-effective recommendation.16 It is therefore prudent to screen all patients before starting immunosuppressive therapy.
How to screen
All guidelines agree on how to test for HBV. Measuring levels of HBsAg and hepatitis B core antibody (anti-HBc total) allows the clinician to ascertain whether the patient’s HBV infection status is acute, chronic, or resolved (TABLE 223) and to perform HBVr risk stratification (discussed later).
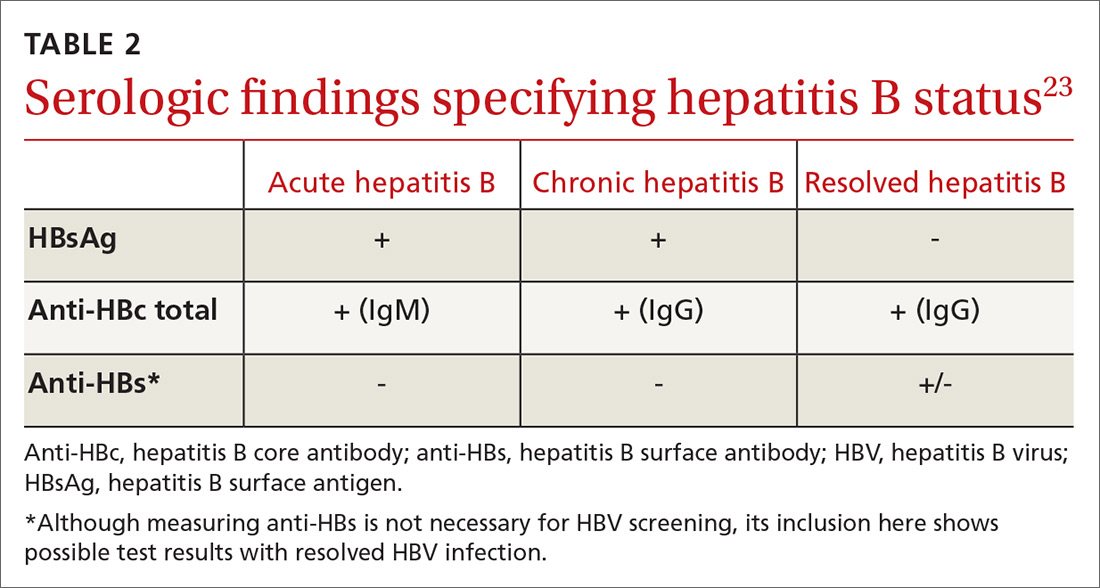
Patients with acute infections should be referred to a hepatologist. With chronic or resolved HBV, stratify patients into a prophylaxis group or monitoring group (FIGURE14). Stratification involves identifying HBV status (chronic or resolved) and selecting a type of immunosuppressive therapy. Whether the patient falls into prophylaxis or monitoring, obtain a baseline level of viral DNA, as this has proven to be the best predictor of HBV reactivation.16
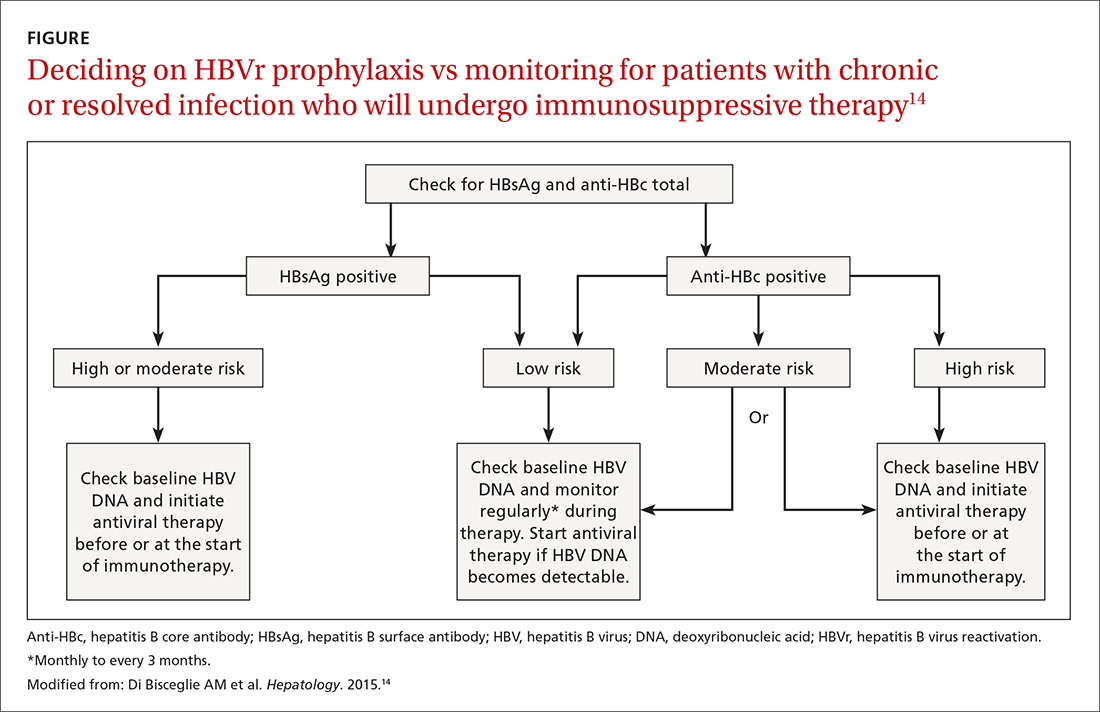
Continue to: In screening, be sure the appropriate...
In screening, be sure the appropriate anti-HBc testing is covered. Common usage of the term anti-HBc may refer to immunoglobulin G (IgG) or immunoglobulin M (IgM)or total core antibody, containing both IgG and IgM. But in this context, accurate screening requires either total core antibody or anti-HBc IgG. Anti-IgM alone is inadequate. Many commercial laboratories offer acute hepatitis panels or hepatitis profiles (TABLE 324,25), and it is important to confirm that such order sets contain the tests necessary to allow for risk stratification.
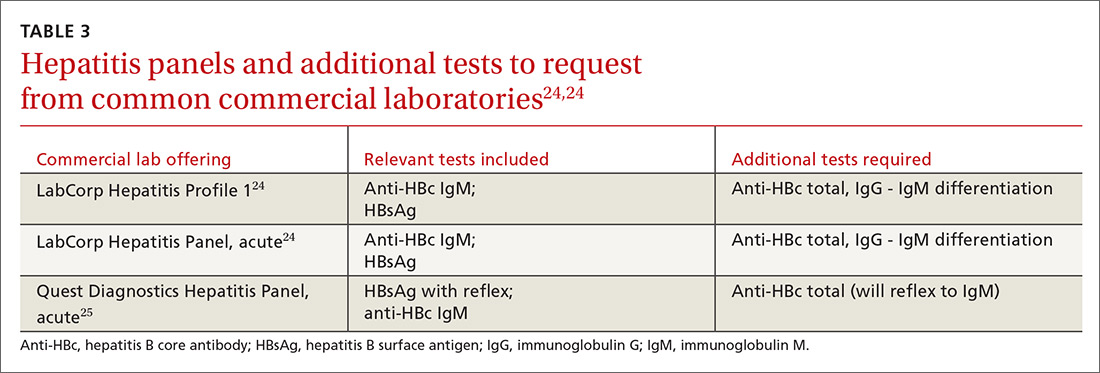
Testing for hepatitis B surface antibody (anti-HBs) is not useful in screening. Although it was hypothesized that the presence of this antibody lowered risk, recent studies have proven no change in risk based on this value.21
How to assess HBVr risk
Assessing risk for HBVr takes into account both the patient’s serology and intended treatment. Reddy et al delineated patient groups into high, moderate, and low risk (TABLES 4 and 5).21 The high-risk group was defined by anticipated incidence of HBVr in > 10% of cases; the moderate-risk group had an anticipated incidence of 1% to 10%; and the low-risk group had an anticipated incidence of <1%.21 Evidence was strongest in the high-risk group.
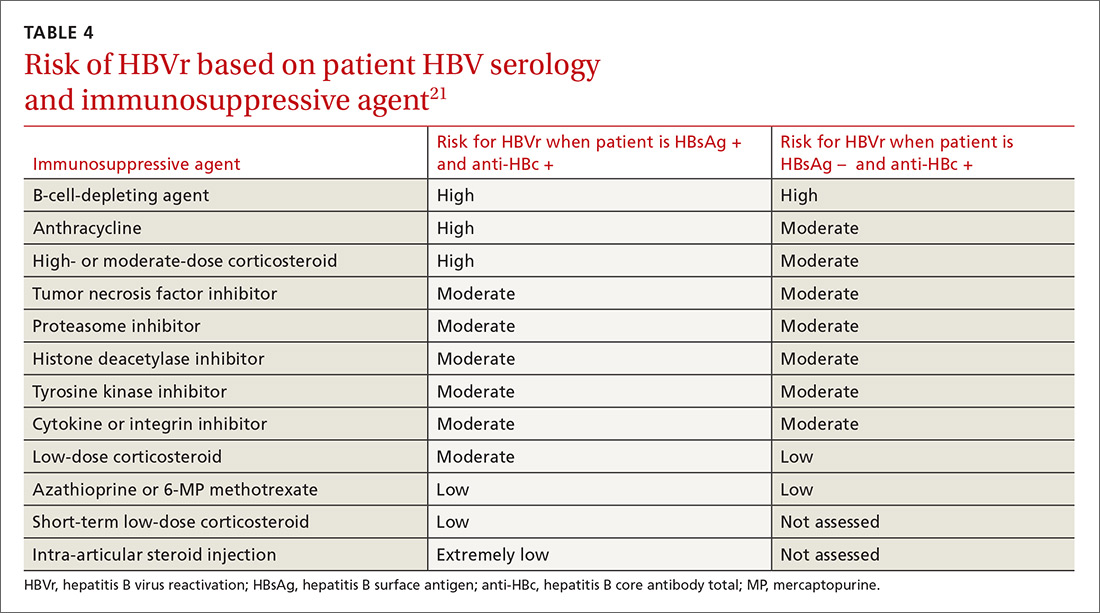
Patients with CHB (HBsAg positive and anti-HBc positive) are considered high risk for reactivation with a wide variety of immunosuppressive therapies. Such patients are 5 to 8 times more likely to develop HBVr than patients with an HBsAg-negative status signifying a resolved infection.16

Immunosuppressive agents and associated risks. The AGA guidelines consider treatment with B-cell-depleting agents, such as rituximab and ofatumumab, to be high risk, regardless of a patient’s surface antigen status. Additionally, for patients who are HBsAg positive, high-risk treatments include anthracycline derivatives, such as doxorubicin and epirubicin, or high- or moderate-dose steroids. These treatments are considered moderate risk when used in patients who have resolved HBV infection (HBsAg negative/anti-HBc positive). Moderate-risk modalities also include tumor necrosis factor inhibitors and tyrosine kinase inhibitors, regardless of surface antigen status; and low-dose steroids or cytokine or integrin inhibitors in HbsAg-positive individuals.21
Continue to: Other immunosuppression modalities...
Other immunosuppression modalities considered to be moderate risk independent of HBV serology include proteasome inhibitors, such as bortezomib, used for multiple myeloma treatment, and histone deacetylase inhibitors, such as romidepsin, used to treat T-cell lymphoma.13 Low-dose steroids or cytokine or integrin inhibitors are considered to be low risk in surface antigen-negative individuals; azathioprine, mercaptopurine, or methotrexate are low risk regardless of HBsAg status.21 Intra-articular steroid injections are considered extremely low risk in HbsAg-positive individuals, and are unclassified for HbsAg-negative individuals.13
More recent evidence has implicated other medication classes in triggering HBVr — (eg, direct-acting antivirals.)26
Prophylaxis options: High to moderate risk vs low risk
The consensus of major guideline issuers is to offer prophylaxis to high-risk patients and to monitor low-risk patients. The AGA additionally recommends prophylaxis for patients at moderate risk.
Controversy surrounding the moderate-risk group. Some authors argue that monitoring HBV DNA in the moderate-risk group is preferable to committing patients to long periods of prophylaxis, and that rescue treatment could be initiated as needed. However, the ideal monitoring period has not been determined, and the effectiveness of prophylaxis over monitoring is so significant that monitoring is losing favor.
Perrillo et al performed a meta-analysis of 5 randomized controlled trials evaluating antiviral agents vs no prophylaxis.16 The analysis included 139 patients receiving prophylaxis and 137 controls. The pooled results demonstrated an 87% relative risk reduction with prophylaxis, supporting the trend toward treating patients with moderate risk.16
Continue to: Prophylactic treatment options are safe...
Prophylactic treatment options are safe and well tolerated. For this reason, committing a high- or moderate-risk patient to a course of treatment should be less of a concern than the risk for HBVr.
In the early randomized controlled trials for HBVr prophylaxis, lamivudine, although effective, unfortunately led to a high incidence of viral resistance after prolonged use, thus diminishing its desirability.18 Newer agents, such as entecavir and tenofovir, have proven just as effective as lamivudine and are largely unaffected by viral resistance.27
In retrospective and prospective studies on HBVr prophylaxis, patients treated with entecavir had less HBV-related hepatitis, less delay in chemotherapy, and a lower rate of HBVr when compared with lamivudine.28,29 Tenofovir is recommended, however, if patients were previously treated with lamivudine.30
A recent meta-analysis demonstrated that tenofovir and entecavir are preferable to lamivudine in preventing HBVr.31
Looking ahead
Screening for HBsAg and anti-HBc total before starting immunosuppressive therapy can reduce morbidity and mortality in patients undergoing such treatment. The AGA recommends screening all patients about to begin high- or moderate-risk therapy or patients in populations with a prevalence of CHB ≥2%, per the CDC.6,21
Continue to: Classes of medications...
Classes of medications other than immunosuppressants may also trigger HBVr. The FDA has issued a warning regarding direct-acting antivirals, but optimal management of these patients is still evolving.
Once HBV status is established, a patient’s risk for HBVr can be specified as high, moderate, or low using their HBV status and the type of therapy being initiated. The AGA recommends prophylactic treatment with well-tolerated and effective agents for patients classified as high or moderate risk. If a patient’s risk is low, regular monitoring of HBV DNA and AST and ALT levels is sufficient. Recommendations of monitoring intervals span from monthly to every 3 months.13,14
CASE Given the patient’s status of resolved HBV infection and her current moderate-dose regimen of prednisone, her risk for HBV reactivation is moderate. She could either receive antiviral prophylaxis or undergo regular monitoring. Following a discussion of the options, she opts for referral to a hepatologist to discuss possible prophylactic treatment.
Increased awareness of HBVr risk associated with immunosuppressive therapy, coupled with a planned approach to appropriate screening and risk stratification, can help health care providers prevent the reactivation of HBV or initiate early intervention for CHB.
CORRESPONDENCE
Ronan Farrell, MD, Rhode Island Hospital, 593 Eddy Street, Providence, RI 02903; ronan_farrell@brown.edu.
1. Artz AS, Somerfield MR, Feld JJ, et al. American Society of Clinical Oncology provisional clinical opinion: chronic hepatitis B virus infection screening in patients receiving cytotoxic chemotherapy for treatment of malignant diseases. J Clin Oncol. 2010;28:3199-3202.
2. Day FL, Link E, Thursky K, et al. Current hepatitis B screening practices and clinical experience of reactivation in patients undergoing chemotherapy for solid tumors: a nationwide survey of medical oncologists. J Oncol Pract. 2011;7:141-147.
3. Paul S, Saxena A, Terrin N, et al. Hepatitis B virus reactivation and prophylaxis during solid tumor chemotherapy: a systematic review and meta-analysis. Ann Internal Med. 2016;164:30-40.
4. Kim MK, Ahn JH, Kim SB, et al. Hepatitis B reactivation during adjuvant anthracycline-based chemotherapy in patients with breast cancer: a single institution’s experience. Korean J Intern Med. 2007;22:237-243.
5. Esteve M, Saro C, González-Huix F, et al. Chronic hepatitis B reactivation following infliximab therapy in Crohn’s disease patients: need for primary prophylaxis. Gut. 2004;53:1363-1365.
6. Weinbaum CM, Williams I, Mast EE, et al. Recommendations for identification and public health management of persons with chronic hepatitis B virus infection. MMWR Recomm Rep. 2008;57:1-20.
7. Liang TJ, Block TM, McMahon BJ, et al. Present and future therapies of hepatitis B: from discovery to cure. Hepatology. 2015;62:1893-1908.
8, , , A mathematical model to estimate global hepatitis B disease burden and vaccination impact. Int J Epidemiol. 2005;34:1329-1339.
9. WHO. Hepatitis B. www.who.int/en/news-room/fact-sheets/detail/hepatitis-b. Accessed February 28, 2019.
10. Kowdley KV, Wang CC, Welch S, et al. Prevalence of chronic hepatitis B among foreign-born persons living in the United States by country of origin. Hepatology. 2012;56:422-433.
11. Foster T, Hon H, Kanwal F, et al. Screening high risk individuals for hepatitis B: physician knowledge, attitudes, and beliefs. Dig Dis Sci. 2011;56:3471-3487.
12. Rehermann B, Ferrari C, Pasquinelli C, et al. The hepatitis B virus persists for decades after patients’ recovery from acute viral hepatitis despite active maintenance of a cytotoxic T-lymphocyte response. Nat Med. 1996;2:1104-1108.
13. Loomba R, Liang TJ. Hepatitis B reactivation associated with immune suppressive and biological modifier therapies: current concepts, management strategies, and future directions. Gastroenterology. 2017;152:1297-1309.
14. Di Bisceglie AM, Lok AS, Martin P, et al. Recent US Food and Drug Administration warnings on hepatitis B reactivation with immune-suppressing and anticancer drugs: just the tip of the iceberg? Hepatology. 2015;61:703-711.
15. Lok AS, Ward JW, Perrillo RP, et al. Reactivation of hepatitis B during immunosuppressive therapy: potentially fatal yet preventable. Ann Intern Med. 2012;156:743-745.
16. Perrillo RP, Gish R, Falck-Ytter YT. American Gastroenterological Association Institute technical review on prevention and treatment of hepatitis B virus reactivation during immunosuppressive drug therapy. Gastroenterology. 2015;148:221-244.
17. Hwang JP, Lok AS. Management of patients with hepatitis B who require immunosuppressive therapy. Nat Rev Gastroenterol Hepatol. 2014;11:209-219.
18. Lok AS, McMahon BJ. Chronic hepatitis B: update 2009. Hepatology. 2009;50:661-662.
19. Asian-Pacific consensus statement on the management of chronic hepatitis B: a 2012 update. Hepatol Int. 2012;6:531-561.
20. EASL clinical practice guidelines: management of chronic hepatitis B virus infection. J Hepatol. 2012;57:167-185.
21. Reddy KR, Beavers KL, Hammond SP, et al. American Gastroenterological Association Institute guideline on the prevention and treatment of hepatitis B virus reactivation during immunosuppressive drug therapy. Gastroenterology. 2015;148:215-219.
, , . Why we should routinely screen Asian American adults for hepatitis B: a cross-sectional study of Asians in California. Hepatology. 2007;46:1034-1040.
23. Hwang JP, Artz AS, Somerfield MR. Hepatitis B virus screening for patients with cancer before therapy: American Society of Clinical Oncology Provisional Clinical Opinion Update. J Oncol Pract. 2015;11:e487-489.
24. LabCorp. Hepatitis B core antibody, IgG, IgM, differentiation. www.labcorp.com/test-menu/27196/hepatitis-b-core-antibody-igg-igm-differentiation. Accessed February 28, 2019.
25. Quest diagnostics. Hepatitis B Core Antibody, Total. www.questdiagnostics.com/testcenter/TestDetail.action?ntc=501.Accessed November 5, 2018.
26. The Food and Drug Administration Adverse Event Reporting System (FAERS). www.fda.gov/Drugs/DrugSafety/ucm522932.htm. Accessed February 28, 2019.
27. Lim YS. Management of antiviral resistance in chronic hepatitis B. Gut Liver. 2017;11:189-195.
28. Huang H, Li X, Zhu J, et al. Entecavir vs lamivudine for prevention of hepatitis B virus reactivation among patients with untreated diffuse large B-cell lymphoma receiving R-CHOP chemotherapy: a randomized clinical trial. JAMA. 2014;312:2521-2530.
29. Chen WC, Cheng JS, Chiang PH, et al. A comparison of entecavir and lamivudine for the prophylaxis of hepatitis B virus reactivation in solid tumor patients undergoing systemic cytotoxic chemotherapy. PLoS One. 2015;10:e0131545.
30. Tenney DJ, Rose RE, Baldick CJ, et al. Long-term monitoring shows hepatitis B virus resistance to entecavir in nucleoside-naïve patients is rare through 5 years of therapy. Hepatology. 2009;49:1503-1514.
31. Zhang MY, Zhu GQ, Shi KQ, et al. Systematic review with network meta-analysis: comparative efficacy of oral nucleos(t)ide analogues for the prevention of chemotherapy-induced hepatitis B virus reactivation. Oncotarget. 2016;7:30642-30658.
CASE A 53-year-old woman you are seeing for the first time has been taking 10 mg of prednisone daily for a month, prescribed by another practitioner for polymyalgia rheumatica. Testing is negative for hepatitis B surface antigen but is positive for hepatitis B core antibody total, indicating a resolved hepatitis B infection. The absence of hepatitis B DNA is confirmed.
How would you proceed with this patient?
Patients with resolved hepatitis B virus (HBV) or chronic hepatitis B (CHB) infections are at risk for HBV reactivation (HBVr) if they undergo immunosuppressive therapy for a condition such as cancer. HBVr can in turn lead to delays in treatment and increased morbidity and mortality.
HBVr is a well-documented adverse outcome in patients treated with rituximab and in those undergoing stem cell transplantation. Current oncology guidelines recommend screening for HBV prior to initiating these treatments.1,2 More recent evidence shows that many other immunosuppressive therapies can also lead to HBVr.3 Such treatments are now used across a multitude of specialties and conditions. For many of these conditions, there are no consistent guidelines regarding HBV screening.
In 2013, the US Food and Drug Administration (FDA) announced the requirement of a Boxed Warning for the immunosuppressive drugs ofatumumab and rituximab. In 2016, the FDA announced the same requirement for certain direct-acting antiviral medicines for hepatitis C virus.
Among patients who are positive for hepatitis-B surface antigen (HBsAg) and who are treated with immunosuppression, the frequency of HBVr has ranged from 0% to 39%.4,5
As the list of immunosuppressive therapies that can cause HBVr grows, specialty guidelines are evolving to address the risk that HBVr poses.
Continue to: An underrecognized problem
An underrecognized problem. CHB affects an estimated 350 million people worldwide6 but remains underrecognized and underdiagnosed. An estimated 1.4 million Americans6 have CHB, but only a minority of them are aware of their positive status and are followed by a hepatologist or receive medical care for their disease.7 Compared with the natural-born US population, a higher prevalence of CHB exists among immigrants to this country from the Asian Pacific and Eastern Mediterranean regions, sub-Saharan Africa, and certain parts of South America.8-10 In 2008, the Centers for Disease Control and Prevention (CDC) updated its recommendations on screening for HBV to include immigrants to the United States from intermediate and high endemic areas.6 Unfortunately, data published on physicians’ adherence to the CDC guidelines for screening show that only 60% correctly screened at-risk patients.11
Individuals with CHB are at risk and rely on a robust immune system to keep their disease from becoming active. During infection, the virus gains entry into the hepatocytes and the double-stranded viral genome is imported into the nucleus of the cell, where it is repaired into covalently closed circular DNA (cccDNA). Research has demonstrated the stability of cccDNA and its persistence as a latent reservoir for HBV reactivation, even decades after recovery from infection.12
Also at risk are individuals who have unrecovered from HBV infection and are HBsAg negative and anti-HBc positive. To avert reverse seroconversion, they also rely on a robust immune system.13 Reverse seroconversion is defined as a reappearance of HBV DNA and HBsAg positivity in individuals who were previously negative.13 In these individuals, HBV DNA may not be quantifiable in circulation, but trace amounts of viral DNA found in the liver are enough to pose a reactivation risk in the setting of immune suppression.14
Moreover, often overlooked is the fact that reactivation or reverse seroconversion can necessitate disruptions and delays in immunosuppressive treatment for other life-threatening disease processes.14,15
Universal screening reduces risk for HBVr. Patients with CHB are at risk for reactivation, as are patients with resolved HBV infection. Many patients, however, do not know their status. By screening all patients before beginning immunosuppressive therapy, physicians can provide effective prophylaxis, which has been shown to significantly reduce the risk for HBVr.8.15
Continue to: Recognizing the onset of HBVr
Recognizing the onset of HBVr
In patients with CHB, HBVr is defined as at least a 3-fold increase in aspart aminotransferase (AST) and alanine aminotransferase (ALT) and at least a 10-fold increase from baseline in HBV DNA. In patients with resolved HBV infection, there may be reverse seroconversion from HbsAg-negative to HBsAg-positive status (TABLE 113,16).
Not all elevations in AST/ALT in patients undergoing chemotherapy or immunosuppressive therapy indicate HBVr. Very often, derangements in AST/ALT may be related to the toxic effects of therapy or to the underlying disease process. However, as immunosuppressive therapy is now used for a wide array of medical conditions, consider HBVr as a potential cause of abnormal liver function in all patients receiving such therapy
A patient is at risk for HBVr when starting immunosuppression and up to a year following the completion of therapy. With suppression of the immune system, HBV replication increases and serum AST/ALT concentrations may rise. HBVr may also present with the appearance of HBV DNA in patients with previously undetectable levels.12,17
Most patients remain asymptomatic, and abnormal AST/ALT levels eventually resolve after completion of immunosuppression. However, some patients' liver enzymes may rise, indicating a more severe hepatic flare. These patients may present with right upper-quadrant tenderness, jaundice, or fatigue. In these cases, recognizing HBVr and starting antivirals may reduce hepatitis flare.
Unfortunately, despite early recognition of HBVr and initiation of appropriate therapy, some patients can progress to hepatic decompensation and even fulminant hepatic failure that may have been prevented with prophylaxis.
Continue to: The justification for universal screening
The justification for universal screening
Although nongastroenterology societies differ in their recommendations on screening for HBV, universal screening before implementing prolonged immunosuppressive treatment is recommended by the CDC,6 the American Association for the Study of Liver Diseases,18 the Asian Pacific Association for the Study of the Liver,19 the European Association for the Study of the Liver,20 and the American Gastroenterological Association (AGA).21
Older guidelines recommended screening only high-risk populations. But such screening has downfalls. It requires that patients or their physicians recognize that they are at high risk. In one study, nearly 65% of an infected Asian-American population was unaware of their positive HBV status.22 Risk-based screening also requires that physicians ask the appropriate questions and that patients admit to high-risk behavior. Screening patients based only on risk factors may easily overlook patients who need prophylaxis against HBVr.
Common arguments against universal screening include the cost of testing, the possibility of false-positive results, and the implications of a new diagnosis of hepatitis B. However, the potential benefits of screening are significant, and HBV screening in the general population has been shown to be cost effective when the prevalence of HBV is 0.3%.21 In the United States, conservative estimates are a prevalence of HBsAg positivity of 0.4% and past infection of 3%, making screening a cost-effective recommendation.16 It is therefore prudent to screen all patients before starting immunosuppressive therapy.
How to screen
All guidelines agree on how to test for HBV. Measuring levels of HBsAg and hepatitis B core antibody (anti-HBc total) allows the clinician to ascertain whether the patient’s HBV infection status is acute, chronic, or resolved (TABLE 223) and to perform HBVr risk stratification (discussed later).
Patients with acute infections should be referred to a hepatologist. With chronic or resolved HBV, stratify patients into a prophylaxis group or monitoring group (FIGURE14). Stratification involves identifying HBV status (chronic or resolved) and selecting a type of immunosuppressive therapy. Whether the patient falls into prophylaxis or monitoring, obtain a baseline level of viral DNA, as this has proven to be the best predictor of HBV reactivation.16
Continue to: In screening, be sure the appropriate...
In screening, be sure the appropriate anti-HBc testing is covered. Common usage of the term anti-HBc may refer to immunoglobulin G (IgG) or immunoglobulin M (IgM)or total core antibody, containing both IgG and IgM. But in this context, accurate screening requires either total core antibody or anti-HBc IgG. Anti-IgM alone is inadequate. Many commercial laboratories offer acute hepatitis panels or hepatitis profiles (TABLE 324,25), and it is important to confirm that such order sets contain the tests necessary to allow for risk stratification.
Testing for hepatitis B surface antibody (anti-HBs) is not useful in screening. Although it was hypothesized that the presence of this antibody lowered risk, recent studies have proven no change in risk based on this value.21
How to assess HBVr risk
Assessing risk for HBVr takes into account both the patient’s serology and intended treatment. Reddy et al delineated patient groups into high, moderate, and low risk (TABLES 4 and 5).21 The high-risk group was defined by anticipated incidence of HBVr in > 10% of cases; the moderate-risk group had an anticipated incidence of 1% to 10%; and the low-risk group had an anticipated incidence of <1%.21 Evidence was strongest in the high-risk group.
Patients with CHB (HBsAg positive and anti-HBc positive) are considered high risk for reactivation with a wide variety of immunosuppressive therapies. Such patients are 5 to 8 times more likely to develop HBVr than patients with an HBsAg-negative status signifying a resolved infection.16
Immunosuppressive agents and associated risks. The AGA guidelines consider treatment with B-cell-depleting agents, such as rituximab and ofatumumab, to be high risk, regardless of a patient’s surface antigen status. Additionally, for patients who are HBsAg positive, high-risk treatments include anthracycline derivatives, such as doxorubicin and epirubicin, or high- or moderate-dose steroids. These treatments are considered moderate risk when used in patients who have resolved HBV infection (HBsAg negative/anti-HBc positive). Moderate-risk modalities also include tumor necrosis factor inhibitors and tyrosine kinase inhibitors, regardless of surface antigen status; and low-dose steroids or cytokine or integrin inhibitors in HbsAg-positive individuals.21
Continue to: Other immunosuppression modalities...
Other immunosuppression modalities considered to be moderate risk independent of HBV serology include proteasome inhibitors, such as bortezomib, used for multiple myeloma treatment, and histone deacetylase inhibitors, such as romidepsin, used to treat T-cell lymphoma.13 Low-dose steroids or cytokine or integrin inhibitors are considered to be low risk in surface antigen-negative individuals; azathioprine, mercaptopurine, or methotrexate are low risk regardless of HBsAg status.21 Intra-articular steroid injections are considered extremely low risk in HbsAg-positive individuals, and are unclassified for HbsAg-negative individuals.13
More recent evidence has implicated other medication classes in triggering HBVr — (eg, direct-acting antivirals.)26
Prophylaxis options: High to moderate risk vs low risk
The consensus of major guideline issuers is to offer prophylaxis to high-risk patients and to monitor low-risk patients. The AGA additionally recommends prophylaxis for patients at moderate risk.
Controversy surrounding the moderate-risk group. Some authors argue that monitoring HBV DNA in the moderate-risk group is preferable to committing patients to long periods of prophylaxis, and that rescue treatment could be initiated as needed. However, the ideal monitoring period has not been determined, and the effectiveness of prophylaxis over monitoring is so significant that monitoring is losing favor.
Perrillo et al performed a meta-analysis of 5 randomized controlled trials evaluating antiviral agents vs no prophylaxis.16 The analysis included 139 patients receiving prophylaxis and 137 controls. The pooled results demonstrated an 87% relative risk reduction with prophylaxis, supporting the trend toward treating patients with moderate risk.16
Continue to: Prophylactic treatment options are safe...
Prophylactic treatment options are safe and well tolerated. For this reason, committing a high- or moderate-risk patient to a course of treatment should be less of a concern than the risk for HBVr.
In the early randomized controlled trials for HBVr prophylaxis, lamivudine, although effective, unfortunately led to a high incidence of viral resistance after prolonged use, thus diminishing its desirability.18 Newer agents, such as entecavir and tenofovir, have proven just as effective as lamivudine and are largely unaffected by viral resistance.27
In retrospective and prospective studies on HBVr prophylaxis, patients treated with entecavir had less HBV-related hepatitis, less delay in chemotherapy, and a lower rate of HBVr when compared with lamivudine.28,29 Tenofovir is recommended, however, if patients were previously treated with lamivudine.30
A recent meta-analysis demonstrated that tenofovir and entecavir are preferable to lamivudine in preventing HBVr.31
Looking ahead
Screening for HBsAg and anti-HBc total before starting immunosuppressive therapy can reduce morbidity and mortality in patients undergoing such treatment. The AGA recommends screening all patients about to begin high- or moderate-risk therapy or patients in populations with a prevalence of CHB ≥2%, per the CDC.6,21
Continue to: Classes of medications...
Classes of medications other than immunosuppressants may also trigger HBVr. The FDA has issued a warning regarding direct-acting antivirals, but optimal management of these patients is still evolving.
Once HBV status is established, a patient’s risk for HBVr can be specified as high, moderate, or low using their HBV status and the type of therapy being initiated. The AGA recommends prophylactic treatment with well-tolerated and effective agents for patients classified as high or moderate risk. If a patient’s risk is low, regular monitoring of HBV DNA and AST and ALT levels is sufficient. Recommendations of monitoring intervals span from monthly to every 3 months.13,14
CASE Given the patient’s status of resolved HBV infection and her current moderate-dose regimen of prednisone, her risk for HBV reactivation is moderate. She could either receive antiviral prophylaxis or undergo regular monitoring. Following a discussion of the options, she opts for referral to a hepatologist to discuss possible prophylactic treatment.
Increased awareness of HBVr risk associated with immunosuppressive therapy, coupled with a planned approach to appropriate screening and risk stratification, can help health care providers prevent the reactivation of HBV or initiate early intervention for CHB.
CORRESPONDENCE
Ronan Farrell, MD, Rhode Island Hospital, 593 Eddy Street, Providence, RI 02903; ronan_farrell@brown.edu.
CASE A 53-year-old woman you are seeing for the first time has been taking 10 mg of prednisone daily for a month, prescribed by another practitioner for polymyalgia rheumatica. Testing is negative for hepatitis B surface antigen but is positive for hepatitis B core antibody total, indicating a resolved hepatitis B infection. The absence of hepatitis B DNA is confirmed.
How would you proceed with this patient?
Patients with resolved hepatitis B virus (HBV) or chronic hepatitis B (CHB) infections are at risk for HBV reactivation (HBVr) if they undergo immunosuppressive therapy for a condition such as cancer. HBVr can in turn lead to delays in treatment and increased morbidity and mortality.
HBVr is a well-documented adverse outcome in patients treated with rituximab and in those undergoing stem cell transplantation. Current oncology guidelines recommend screening for HBV prior to initiating these treatments.1,2 More recent evidence shows that many other immunosuppressive therapies can also lead to HBVr.3 Such treatments are now used across a multitude of specialties and conditions. For many of these conditions, there are no consistent guidelines regarding HBV screening.
In 2013, the US Food and Drug Administration (FDA) announced the requirement of a Boxed Warning for the immunosuppressive drugs ofatumumab and rituximab. In 2016, the FDA announced the same requirement for certain direct-acting antiviral medicines for hepatitis C virus.
Among patients who are positive for hepatitis-B surface antigen (HBsAg) and who are treated with immunosuppression, the frequency of HBVr has ranged from 0% to 39%.4,5
As the list of immunosuppressive therapies that can cause HBVr grows, specialty guidelines are evolving to address the risk that HBVr poses.
Continue to: An underrecognized problem
An underrecognized problem. CHB affects an estimated 350 million people worldwide6 but remains underrecognized and underdiagnosed. An estimated 1.4 million Americans6 have CHB, but only a minority of them are aware of their positive status and are followed by a hepatologist or receive medical care for their disease.7 Compared with the natural-born US population, a higher prevalence of CHB exists among immigrants to this country from the Asian Pacific and Eastern Mediterranean regions, sub-Saharan Africa, and certain parts of South America.8-10 In 2008, the Centers for Disease Control and Prevention (CDC) updated its recommendations on screening for HBV to include immigrants to the United States from intermediate and high endemic areas.6 Unfortunately, data published on physicians’ adherence to the CDC guidelines for screening show that only 60% correctly screened at-risk patients.11
Individuals with CHB are at risk and rely on a robust immune system to keep their disease from becoming active. During infection, the virus gains entry into the hepatocytes and the double-stranded viral genome is imported into the nucleus of the cell, where it is repaired into covalently closed circular DNA (cccDNA). Research has demonstrated the stability of cccDNA and its persistence as a latent reservoir for HBV reactivation, even decades after recovery from infection.12
Also at risk are individuals who have unrecovered from HBV infection and are HBsAg negative and anti-HBc positive. To avert reverse seroconversion, they also rely on a robust immune system.13 Reverse seroconversion is defined as a reappearance of HBV DNA and HBsAg positivity in individuals who were previously negative.13 In these individuals, HBV DNA may not be quantifiable in circulation, but trace amounts of viral DNA found in the liver are enough to pose a reactivation risk in the setting of immune suppression.14
Moreover, often overlooked is the fact that reactivation or reverse seroconversion can necessitate disruptions and delays in immunosuppressive treatment for other life-threatening disease processes.14,15
Universal screening reduces risk for HBVr. Patients with CHB are at risk for reactivation, as are patients with resolved HBV infection. Many patients, however, do not know their status. By screening all patients before beginning immunosuppressive therapy, physicians can provide effective prophylaxis, which has been shown to significantly reduce the risk for HBVr.8.15
Continue to: Recognizing the onset of HBVr
Recognizing the onset of HBVr
In patients with CHB, HBVr is defined as at least a 3-fold increase in aspart aminotransferase (AST) and alanine aminotransferase (ALT) and at least a 10-fold increase from baseline in HBV DNA. In patients with resolved HBV infection, there may be reverse seroconversion from HbsAg-negative to HBsAg-positive status (TABLE 113,16).
Not all elevations in AST/ALT in patients undergoing chemotherapy or immunosuppressive therapy indicate HBVr. Very often, derangements in AST/ALT may be related to the toxic effects of therapy or to the underlying disease process. However, as immunosuppressive therapy is now used for a wide array of medical conditions, consider HBVr as a potential cause of abnormal liver function in all patients receiving such therapy
A patient is at risk for HBVr when starting immunosuppression and up to a year following the completion of therapy. With suppression of the immune system, HBV replication increases and serum AST/ALT concentrations may rise. HBVr may also present with the appearance of HBV DNA in patients with previously undetectable levels.12,17
Most patients remain asymptomatic, and abnormal AST/ALT levels eventually resolve after completion of immunosuppression. However, some patients' liver enzymes may rise, indicating a more severe hepatic flare. These patients may present with right upper-quadrant tenderness, jaundice, or fatigue. In these cases, recognizing HBVr and starting antivirals may reduce hepatitis flare.
Unfortunately, despite early recognition of HBVr and initiation of appropriate therapy, some patients can progress to hepatic decompensation and even fulminant hepatic failure that may have been prevented with prophylaxis.
Continue to: The justification for universal screening
The justification for universal screening
Although nongastroenterology societies differ in their recommendations on screening for HBV, universal screening before implementing prolonged immunosuppressive treatment is recommended by the CDC,6 the American Association for the Study of Liver Diseases,18 the Asian Pacific Association for the Study of the Liver,19 the European Association for the Study of the Liver,20 and the American Gastroenterological Association (AGA).21
Older guidelines recommended screening only high-risk populations. But such screening has downfalls. It requires that patients or their physicians recognize that they are at high risk. In one study, nearly 65% of an infected Asian-American population was unaware of their positive HBV status.22 Risk-based screening also requires that physicians ask the appropriate questions and that patients admit to high-risk behavior. Screening patients based only on risk factors may easily overlook patients who need prophylaxis against HBVr.
Common arguments against universal screening include the cost of testing, the possibility of false-positive results, and the implications of a new diagnosis of hepatitis B. However, the potential benefits of screening are significant, and HBV screening in the general population has been shown to be cost effective when the prevalence of HBV is 0.3%.21 In the United States, conservative estimates are a prevalence of HBsAg positivity of 0.4% and past infection of 3%, making screening a cost-effective recommendation.16 It is therefore prudent to screen all patients before starting immunosuppressive therapy.
How to screen
All guidelines agree on how to test for HBV. Measuring levels of HBsAg and hepatitis B core antibody (anti-HBc total) allows the clinician to ascertain whether the patient’s HBV infection status is acute, chronic, or resolved (TABLE 223) and to perform HBVr risk stratification (discussed later).
Patients with acute infections should be referred to a hepatologist. With chronic or resolved HBV, stratify patients into a prophylaxis group or monitoring group (FIGURE14). Stratification involves identifying HBV status (chronic or resolved) and selecting a type of immunosuppressive therapy. Whether the patient falls into prophylaxis or monitoring, obtain a baseline level of viral DNA, as this has proven to be the best predictor of HBV reactivation.16
Continue to: In screening, be sure the appropriate...
In screening, be sure the appropriate anti-HBc testing is covered. Common usage of the term anti-HBc may refer to immunoglobulin G (IgG) or immunoglobulin M (IgM)or total core antibody, containing both IgG and IgM. But in this context, accurate screening requires either total core antibody or anti-HBc IgG. Anti-IgM alone is inadequate. Many commercial laboratories offer acute hepatitis panels or hepatitis profiles (TABLE 324,25), and it is important to confirm that such order sets contain the tests necessary to allow for risk stratification.
Testing for hepatitis B surface antibody (anti-HBs) is not useful in screening. Although it was hypothesized that the presence of this antibody lowered risk, recent studies have proven no change in risk based on this value.21
How to assess HBVr risk
Assessing risk for HBVr takes into account both the patient’s serology and intended treatment. Reddy et al delineated patient groups into high, moderate, and low risk (TABLES 4 and 5).21 The high-risk group was defined by anticipated incidence of HBVr in > 10% of cases; the moderate-risk group had an anticipated incidence of 1% to 10%; and the low-risk group had an anticipated incidence of <1%.21 Evidence was strongest in the high-risk group.
Patients with CHB (HBsAg positive and anti-HBc positive) are considered high risk for reactivation with a wide variety of immunosuppressive therapies. Such patients are 5 to 8 times more likely to develop HBVr than patients with an HBsAg-negative status signifying a resolved infection.16
Immunosuppressive agents and associated risks. The AGA guidelines consider treatment with B-cell-depleting agents, such as rituximab and ofatumumab, to be high risk, regardless of a patient’s surface antigen status. Additionally, for patients who are HBsAg positive, high-risk treatments include anthracycline derivatives, such as doxorubicin and epirubicin, or high- or moderate-dose steroids. These treatments are considered moderate risk when used in patients who have resolved HBV infection (HBsAg negative/anti-HBc positive). Moderate-risk modalities also include tumor necrosis factor inhibitors and tyrosine kinase inhibitors, regardless of surface antigen status; and low-dose steroids or cytokine or integrin inhibitors in HbsAg-positive individuals.21
Continue to: Other immunosuppression modalities...
Other immunosuppression modalities considered to be moderate risk independent of HBV serology include proteasome inhibitors, such as bortezomib, used for multiple myeloma treatment, and histone deacetylase inhibitors, such as romidepsin, used to treat T-cell lymphoma.13 Low-dose steroids or cytokine or integrin inhibitors are considered to be low risk in surface antigen-negative individuals; azathioprine, mercaptopurine, or methotrexate are low risk regardless of HBsAg status.21 Intra-articular steroid injections are considered extremely low risk in HbsAg-positive individuals, and are unclassified for HbsAg-negative individuals.13
More recent evidence has implicated other medication classes in triggering HBVr — (eg, direct-acting antivirals.)26
Prophylaxis options: High to moderate risk vs low risk
The consensus of major guideline issuers is to offer prophylaxis to high-risk patients and to monitor low-risk patients. The AGA additionally recommends prophylaxis for patients at moderate risk.
Controversy surrounding the moderate-risk group. Some authors argue that monitoring HBV DNA in the moderate-risk group is preferable to committing patients to long periods of prophylaxis, and that rescue treatment could be initiated as needed. However, the ideal monitoring period has not been determined, and the effectiveness of prophylaxis over monitoring is so significant that monitoring is losing favor.
Perrillo et al performed a meta-analysis of 5 randomized controlled trials evaluating antiviral agents vs no prophylaxis.16 The analysis included 139 patients receiving prophylaxis and 137 controls. The pooled results demonstrated an 87% relative risk reduction with prophylaxis, supporting the trend toward treating patients with moderate risk.16
Continue to: Prophylactic treatment options are safe...
Prophylactic treatment options are safe and well tolerated. For this reason, committing a high- or moderate-risk patient to a course of treatment should be less of a concern than the risk for HBVr.
In the early randomized controlled trials for HBVr prophylaxis, lamivudine, although effective, unfortunately led to a high incidence of viral resistance after prolonged use, thus diminishing its desirability.18 Newer agents, such as entecavir and tenofovir, have proven just as effective as lamivudine and are largely unaffected by viral resistance.27
In retrospective and prospective studies on HBVr prophylaxis, patients treated with entecavir had less HBV-related hepatitis, less delay in chemotherapy, and a lower rate of HBVr when compared with lamivudine.28,29 Tenofovir is recommended, however, if patients were previously treated with lamivudine.30
A recent meta-analysis demonstrated that tenofovir and entecavir are preferable to lamivudine in preventing HBVr.31
Looking ahead
Screening for HBsAg and anti-HBc total before starting immunosuppressive therapy can reduce morbidity and mortality in patients undergoing such treatment. The AGA recommends screening all patients about to begin high- or moderate-risk therapy or patients in populations with a prevalence of CHB ≥2%, per the CDC.6,21
Continue to: Classes of medications...
Classes of medications other than immunosuppressants may also trigger HBVr. The FDA has issued a warning regarding direct-acting antivirals, but optimal management of these patients is still evolving.
Once HBV status is established, a patient’s risk for HBVr can be specified as high, moderate, or low using their HBV status and the type of therapy being initiated. The AGA recommends prophylactic treatment with well-tolerated and effective agents for patients classified as high or moderate risk. If a patient’s risk is low, regular monitoring of HBV DNA and AST and ALT levels is sufficient. Recommendations of monitoring intervals span from monthly to every 3 months.13,14
CASE Given the patient’s status of resolved HBV infection and her current moderate-dose regimen of prednisone, her risk for HBV reactivation is moderate. She could either receive antiviral prophylaxis or undergo regular monitoring. Following a discussion of the options, she opts for referral to a hepatologist to discuss possible prophylactic treatment.
Increased awareness of HBVr risk associated with immunosuppressive therapy, coupled with a planned approach to appropriate screening and risk stratification, can help health care providers prevent the reactivation of HBV or initiate early intervention for CHB.
CORRESPONDENCE
Ronan Farrell, MD, Rhode Island Hospital, 593 Eddy Street, Providence, RI 02903; ronan_farrell@brown.edu.
1. Artz AS, Somerfield MR, Feld JJ, et al. American Society of Clinical Oncology provisional clinical opinion: chronic hepatitis B virus infection screening in patients receiving cytotoxic chemotherapy for treatment of malignant diseases. J Clin Oncol. 2010;28:3199-3202.
2. Day FL, Link E, Thursky K, et al. Current hepatitis B screening practices and clinical experience of reactivation in patients undergoing chemotherapy for solid tumors: a nationwide survey of medical oncologists. J Oncol Pract. 2011;7:141-147.
3. Paul S, Saxena A, Terrin N, et al. Hepatitis B virus reactivation and prophylaxis during solid tumor chemotherapy: a systematic review and meta-analysis. Ann Internal Med. 2016;164:30-40.
4. Kim MK, Ahn JH, Kim SB, et al. Hepatitis B reactivation during adjuvant anthracycline-based chemotherapy in patients with breast cancer: a single institution’s experience. Korean J Intern Med. 2007;22:237-243.
5. Esteve M, Saro C, González-Huix F, et al. Chronic hepatitis B reactivation following infliximab therapy in Crohn’s disease patients: need for primary prophylaxis. Gut. 2004;53:1363-1365.
6. Weinbaum CM, Williams I, Mast EE, et al. Recommendations for identification and public health management of persons with chronic hepatitis B virus infection. MMWR Recomm Rep. 2008;57:1-20.
7. Liang TJ, Block TM, McMahon BJ, et al. Present and future therapies of hepatitis B: from discovery to cure. Hepatology. 2015;62:1893-1908.
8, , , A mathematical model to estimate global hepatitis B disease burden and vaccination impact. Int J Epidemiol. 2005;34:1329-1339.
9. WHO. Hepatitis B. www.who.int/en/news-room/fact-sheets/detail/hepatitis-b. Accessed February 28, 2019.
10. Kowdley KV, Wang CC, Welch S, et al. Prevalence of chronic hepatitis B among foreign-born persons living in the United States by country of origin. Hepatology. 2012;56:422-433.
11. Foster T, Hon H, Kanwal F, et al. Screening high risk individuals for hepatitis B: physician knowledge, attitudes, and beliefs. Dig Dis Sci. 2011;56:3471-3487.
12. Rehermann B, Ferrari C, Pasquinelli C, et al. The hepatitis B virus persists for decades after patients’ recovery from acute viral hepatitis despite active maintenance of a cytotoxic T-lymphocyte response. Nat Med. 1996;2:1104-1108.
13. Loomba R, Liang TJ. Hepatitis B reactivation associated with immune suppressive and biological modifier therapies: current concepts, management strategies, and future directions. Gastroenterology. 2017;152:1297-1309.
14. Di Bisceglie AM, Lok AS, Martin P, et al. Recent US Food and Drug Administration warnings on hepatitis B reactivation with immune-suppressing and anticancer drugs: just the tip of the iceberg? Hepatology. 2015;61:703-711.
15. Lok AS, Ward JW, Perrillo RP, et al. Reactivation of hepatitis B during immunosuppressive therapy: potentially fatal yet preventable. Ann Intern Med. 2012;156:743-745.
16. Perrillo RP, Gish R, Falck-Ytter YT. American Gastroenterological Association Institute technical review on prevention and treatment of hepatitis B virus reactivation during immunosuppressive drug therapy. Gastroenterology. 2015;148:221-244.
17. Hwang JP, Lok AS. Management of patients with hepatitis B who require immunosuppressive therapy. Nat Rev Gastroenterol Hepatol. 2014;11:209-219.
18. Lok AS, McMahon BJ. Chronic hepatitis B: update 2009. Hepatology. 2009;50:661-662.
19. Asian-Pacific consensus statement on the management of chronic hepatitis B: a 2012 update. Hepatol Int. 2012;6:531-561.
20. EASL clinical practice guidelines: management of chronic hepatitis B virus infection. J Hepatol. 2012;57:167-185.
21. Reddy KR, Beavers KL, Hammond SP, et al. American Gastroenterological Association Institute guideline on the prevention and treatment of hepatitis B virus reactivation during immunosuppressive drug therapy. Gastroenterology. 2015;148:215-219.
, , . Why we should routinely screen Asian American adults for hepatitis B: a cross-sectional study of Asians in California. Hepatology. 2007;46:1034-1040.
23. Hwang JP, Artz AS, Somerfield MR. Hepatitis B virus screening for patients with cancer before therapy: American Society of Clinical Oncology Provisional Clinical Opinion Update. J Oncol Pract. 2015;11:e487-489.
24. LabCorp. Hepatitis B core antibody, IgG, IgM, differentiation. www.labcorp.com/test-menu/27196/hepatitis-b-core-antibody-igg-igm-differentiation. Accessed February 28, 2019.
25. Quest diagnostics. Hepatitis B Core Antibody, Total. www.questdiagnostics.com/testcenter/TestDetail.action?ntc=501.Accessed November 5, 2018.
26. The Food and Drug Administration Adverse Event Reporting System (FAERS). www.fda.gov/Drugs/DrugSafety/ucm522932.htm. Accessed February 28, 2019.
27. Lim YS. Management of antiviral resistance in chronic hepatitis B. Gut Liver. 2017;11:189-195.
28. Huang H, Li X, Zhu J, et al. Entecavir vs lamivudine for prevention of hepatitis B virus reactivation among patients with untreated diffuse large B-cell lymphoma receiving R-CHOP chemotherapy: a randomized clinical trial. JAMA. 2014;312:2521-2530.
29. Chen WC, Cheng JS, Chiang PH, et al. A comparison of entecavir and lamivudine for the prophylaxis of hepatitis B virus reactivation in solid tumor patients undergoing systemic cytotoxic chemotherapy. PLoS One. 2015;10:e0131545.
30. Tenney DJ, Rose RE, Baldick CJ, et al. Long-term monitoring shows hepatitis B virus resistance to entecavir in nucleoside-naïve patients is rare through 5 years of therapy. Hepatology. 2009;49:1503-1514.
31. Zhang MY, Zhu GQ, Shi KQ, et al. Systematic review with network meta-analysis: comparative efficacy of oral nucleos(t)ide analogues for the prevention of chemotherapy-induced hepatitis B virus reactivation. Oncotarget. 2016;7:30642-30658.
1. Artz AS, Somerfield MR, Feld JJ, et al. American Society of Clinical Oncology provisional clinical opinion: chronic hepatitis B virus infection screening in patients receiving cytotoxic chemotherapy for treatment of malignant diseases. J Clin Oncol. 2010;28:3199-3202.
2. Day FL, Link E, Thursky K, et al. Current hepatitis B screening practices and clinical experience of reactivation in patients undergoing chemotherapy for solid tumors: a nationwide survey of medical oncologists. J Oncol Pract. 2011;7:141-147.
3. Paul S, Saxena A, Terrin N, et al. Hepatitis B virus reactivation and prophylaxis during solid tumor chemotherapy: a systematic review and meta-analysis. Ann Internal Med. 2016;164:30-40.
4. Kim MK, Ahn JH, Kim SB, et al. Hepatitis B reactivation during adjuvant anthracycline-based chemotherapy in patients with breast cancer: a single institution’s experience. Korean J Intern Med. 2007;22:237-243.
5. Esteve M, Saro C, González-Huix F, et al. Chronic hepatitis B reactivation following infliximab therapy in Crohn’s disease patients: need for primary prophylaxis. Gut. 2004;53:1363-1365.
6. Weinbaum CM, Williams I, Mast EE, et al. Recommendations for identification and public health management of persons with chronic hepatitis B virus infection. MMWR Recomm Rep. 2008;57:1-20.
7. Liang TJ, Block TM, McMahon BJ, et al. Present and future therapies of hepatitis B: from discovery to cure. Hepatology. 2015;62:1893-1908.
8, , , A mathematical model to estimate global hepatitis B disease burden and vaccination impact. Int J Epidemiol. 2005;34:1329-1339.
9. WHO. Hepatitis B. www.who.int/en/news-room/fact-sheets/detail/hepatitis-b. Accessed February 28, 2019.
10. Kowdley KV, Wang CC, Welch S, et al. Prevalence of chronic hepatitis B among foreign-born persons living in the United States by country of origin. Hepatology. 2012;56:422-433.
11. Foster T, Hon H, Kanwal F, et al. Screening high risk individuals for hepatitis B: physician knowledge, attitudes, and beliefs. Dig Dis Sci. 2011;56:3471-3487.
12. Rehermann B, Ferrari C, Pasquinelli C, et al. The hepatitis B virus persists for decades after patients’ recovery from acute viral hepatitis despite active maintenance of a cytotoxic T-lymphocyte response. Nat Med. 1996;2:1104-1108.
13. Loomba R, Liang TJ. Hepatitis B reactivation associated with immune suppressive and biological modifier therapies: current concepts, management strategies, and future directions. Gastroenterology. 2017;152:1297-1309.
14. Di Bisceglie AM, Lok AS, Martin P, et al. Recent US Food and Drug Administration warnings on hepatitis B reactivation with immune-suppressing and anticancer drugs: just the tip of the iceberg? Hepatology. 2015;61:703-711.
15. Lok AS, Ward JW, Perrillo RP, et al. Reactivation of hepatitis B during immunosuppressive therapy: potentially fatal yet preventable. Ann Intern Med. 2012;156:743-745.
16. Perrillo RP, Gish R, Falck-Ytter YT. American Gastroenterological Association Institute technical review on prevention and treatment of hepatitis B virus reactivation during immunosuppressive drug therapy. Gastroenterology. 2015;148:221-244.
17. Hwang JP, Lok AS. Management of patients with hepatitis B who require immunosuppressive therapy. Nat Rev Gastroenterol Hepatol. 2014;11:209-219.
18. Lok AS, McMahon BJ. Chronic hepatitis B: update 2009. Hepatology. 2009;50:661-662.
19. Asian-Pacific consensus statement on the management of chronic hepatitis B: a 2012 update. Hepatol Int. 2012;6:531-561.
20. EASL clinical practice guidelines: management of chronic hepatitis B virus infection. J Hepatol. 2012;57:167-185.
21. Reddy KR, Beavers KL, Hammond SP, et al. American Gastroenterological Association Institute guideline on the prevention and treatment of hepatitis B virus reactivation during immunosuppressive drug therapy. Gastroenterology. 2015;148:215-219.
, , . Why we should routinely screen Asian American adults for hepatitis B: a cross-sectional study of Asians in California. Hepatology. 2007;46:1034-1040.
23. Hwang JP, Artz AS, Somerfield MR. Hepatitis B virus screening for patients with cancer before therapy: American Society of Clinical Oncology Provisional Clinical Opinion Update. J Oncol Pract. 2015;11:e487-489.
24. LabCorp. Hepatitis B core antibody, IgG, IgM, differentiation. www.labcorp.com/test-menu/27196/hepatitis-b-core-antibody-igg-igm-differentiation. Accessed February 28, 2019.
25. Quest diagnostics. Hepatitis B Core Antibody, Total. www.questdiagnostics.com/testcenter/TestDetail.action?ntc=501.Accessed November 5, 2018.
26. The Food and Drug Administration Adverse Event Reporting System (FAERS). www.fda.gov/Drugs/DrugSafety/ucm522932.htm. Accessed February 28, 2019.
27. Lim YS. Management of antiviral resistance in chronic hepatitis B. Gut Liver. 2017;11:189-195.
28. Huang H, Li X, Zhu J, et al. Entecavir vs lamivudine for prevention of hepatitis B virus reactivation among patients with untreated diffuse large B-cell lymphoma receiving R-CHOP chemotherapy: a randomized clinical trial. JAMA. 2014;312:2521-2530.
29. Chen WC, Cheng JS, Chiang PH, et al. A comparison of entecavir and lamivudine for the prophylaxis of hepatitis B virus reactivation in solid tumor patients undergoing systemic cytotoxic chemotherapy. PLoS One. 2015;10:e0131545.
30. Tenney DJ, Rose RE, Baldick CJ, et al. Long-term monitoring shows hepatitis B virus resistance to entecavir in nucleoside-naïve patients is rare through 5 years of therapy. Hepatology. 2009;49:1503-1514.
31. Zhang MY, Zhu GQ, Shi KQ, et al. Systematic review with network meta-analysis: comparative efficacy of oral nucleos(t)ide analogues for the prevention of chemotherapy-induced hepatitis B virus reactivation. Oncotarget. 2016;7:30642-30658.
PRACTICE RECOMMENDATIONS
› Measure levels of hepatitis B surface antigen and core antibody total. Although testing for IgG alone can be acceptable, testing for IgM alone is unacceptable. C
› Use both a patient’s serologic findings and the recognized risk associated with intended therapy to determine the threat of hepatitis B virus (HBV) reactivation. C
› Offer antiviral prophylaxis when risk for HBV reactivation is high. Consider prophylaxis or monitoring for those at moderate risk. C
Strength of recommendation (SOR)
A Good-quality patient-oriented evidence
B Inconsistent or limited-quality patient-oriented evidence
C Consensus, usual practice, opinion, disease-oriented evidence, case series
Letters: National Suicide Strategy
To the Editor: Even one death by suicide is too many. Suicide is complex and a serious national public health issue that affects people from all walks of life—not just veterans—for a variety of reasons. While there is still a lot we can learn about suicide, we know that suicide is preventable, treatment works, and there is hope.
At the US Department of Veterans Affairs (VA), our suicide prevention efforts are guided by the National Strategy for Preventing Veteran Suicide.1 Published in 2018, this long-term strategy expands beyond crisis intervention and provides a framework for identifying priorities, organizing efforts, and focusing national attention and community resources to prevent suicide among veterans through a broad public health approach with an emphasis on comprehensive, community-based engagement.
This approach is grounded in 4 key areas: Primary prevention focuses on preventing suicidal behavior before it occurs; whole health considers factors beyond mental health, such as physical health, alcohol or substance misuse, and life events; application of data and research emphasizes evidence-based approaches that can be tailored to the needs of veterans in local communities; and collaboration educates and empowers diverse communities to participate in suicide prevention efforts through coordination.
A recent article by Russell Lemle, PhD, noted that the National Strategy does not emphasize the work of the VA, and he is correct.2 Rather than perpetuate the myth that VA can address suicide alone, the strategy was intended to guide veteran suicide prevention efforts across the entire nation, not just within VA’s walls. It is a plan for how we can ALL work together to prevent veteran suicide. The National Strategy does not minimize VA’s role in suicide prevention. It enhances VA’s ability and expectation to engage in collaborative efforts across the nation.
Every year, about 6,000 veterans die by suicide, the majority of whom have not received recent VA care. We are mindful that some veterans may not receive any or all of their health care services from the VA, for various reasons, and want to be respectful and cognizant of those choices. To save lives, VA needs the support of partners across sectors. We need to ensure that multiple systems are working in a coordinated way to reach veterans where they live, work, and thrive.
Our philosophy is that there is no wrong door to care. That is why we focused on universal, non-VA community interventions. Preventing suicide among all of the nation’s 20 million veterans cannot be the sole responsibility of VA—it requires a nationwide effort. As there is no single cause of suicide, no single organization can tackle suicide prevention alone. Put simply, VA must ensure suicide prevention is a part of every aspect of veterans’ lives, not just their VA interactions. At VA, we know that the care and support that veterans need often comes before a mental health crisis occurs, and communities and families may be better equipped to provide these types of supports.
Activities or special interest groups can boost protective factors against suicide and combat risk factors. Communities can foster an environment where veterans can find connection and camaraderie, achieve a sense of purpose, bolster their coping skills, and live healthily. And partners like the National Shooting Sports Foundation help VA to address sensitive issues, such as lethal means safety, while correcting misconceptions about how VA handles gun ownership.
Data also are an integral piece of our public health approach, driving how VA defines the problem, targets its programs, and delivers and implements interventions. VA was one of the first institutions to implement comprehensive suicide analysis and predictive analytics, and VA has continuously improved data surveillance related to veteran suicide.
We began comprehensive suicide monitoring for the entire VA patient population in 2006, and in 2012, VA released its first report of suicide surveillance among all veterans in select partnering states. Though we are able to share data, we acknowledge the limitations Dr. Lemle highlighted in implementing predictive analytics program outside the VA. However, VA continues to improve reporting and surveillance efforts, especially to better understand the 20 veterans and service members who die by suicide each day.
As Lemle noted, little was previously known about the 14 of 20 veterans who die by suicide every day who weren’t recent users of VA health services. Since the September 2018 release of the National Strategy, VA has obtained additional data. In addition to sharing data, VA will focus on helping non-VA entities understand the problem so that they can help reach veterans who may never go to VA for care. Efforts are underway to better understand specific groups that are at elevated risk, such as veterans aged 18 to 34 years, women veterans, never federally activated guardsmen and reservists, recently separated veterans, and former service members with Other Than Honorable discharges.
To end veteran suicide, VA is relentlessly working to make improvements to existing suicide prevention programs, develop VA-specific plans to advance the National Strategy, find innovative ways to get people into care, and educate veterans and family members about VA care. Through Executive Order 13822, for example, VA has partnered with the Departments of Defense and Homeland Security, which allows us to educate service members about VA offerings before they become veterans. We also are making it easier for them to quickly find information online about VA mental health services.
We acknowledge VA is not a perfect organization, and a negative image can turn away veterans. VA is actively working with the media to get more good news stories published. We have many exciting things to talk about, such as a newly implemented Comprehensive Suicide Risk Assessment, and it is important for people to know that VA is providing the gold standard of care. Sometimes, those stories are better messaged and amplified by partners and non-VA entities, and this is a key part of our approach.
Lemle also raised a concern around funding this new public health initiative. While we recognize the challenges in advancing this new public health approach without additional funding, we are hopeful we can energize communities to work with us to find a solution.
The National Strategy is not the end of the conversation. It is a starting point. We are thankful for Lemle’s thoughtful questions and are actively pursuing and investigating solutions regarding veteran suicide studies, peer support, and community care guidelines for partners as we seek to improve our services. We also are putting pen to paper on a plan to strengthen family involvement and integrate suicide prevention within VA’s whole health and social services strategies.
The National Strategy is a call to action to every organization, system, and institution interested in preventing veteran suicide to help do this work where we cannot. For our part, VA will continue to energize communities to increase local involvement to reach all veterans, and we will continue to empower and equip ALL veterans with the resources and care they need to thrive.
To learn about the resources available for veterans and how you can #BeThere as a VA employee, family member, friend, community partner, or clinician, visit www.mentalhealth.va.gov/suicide_prevention/resources.asp. If you or someone you know is having thoughts of suicide, contact the Veterans Crisis Line to receive free, confidential support and crisis intervention available 24 hours a day, 7 days a week, 365 days a year. Call 800-273-8255 and press 1, text to 838255, or chat online at VeteransCrisisLine.net/Chat.
- Keita Franklin, LCSD, PhD
Author affiliations: Executive Director, Suicide Prevention VA Office of Mental Health and Suicide Prevention.
Author disclosures: Keita Franklin participated in the development of the National Strategy for Preventing Veteran Suicide .
Disclaimer: The opinions expressed herein are those of the author and do not necessarily reflect those of Federal Practitioner , Frontline Medical Communications Inc., the US Government, or any of its agencies.
Author Response: Keita Franklin, PhD, offers a valuable response to my December critique of the VA National Strategy to Prevent Veteran Suicide. Dr. Franklin thoughtfully articulates why public health approaches to prevent suicide must be a core component of a multifaceted strategy. She is right about that.
While I see considerable overlap between our statements, there are 2 important points where we diverge: (1) Unless Congress appropriates sufficient funds for extensive public health outreach, there is a danger that funds to implement it would be diverted from VA’s extant effective VA suicide prevention programs. (2) A prospective suicide prevention plan requires 3 prongs of universal, group, and individually focused strategies, because suicide cannot be prevented by any single strategy. The VA National Strategy as well as the March 2019 Executive Order on a National Roadmap to Empower Veterans and End Suicide, focus predominantly on universal strategies, and I believe its overall approach would be improved by also explicitly supporting VA’s targeted programs for at-risk veterans.
- Russell B. Lemle, PhD
Author affiliations: Policy Analyst at the Veterans Healthcare Policy Institute in Oakland, California.
1. US Department of Veterans Affairs. National strategy for preventing veteran suicide 2018–2028. https://www.mentalhealth.va.gov/suicide_prevention/docs/Office-of-Mental-Health-and-Suicide-Prevention-National-Strategy-for-Preventing-Veterans-Suicide.pdf. Published September 2018. Accessed February 19, 2019.
2. Lemle R. Communities emphasis could undercut VA successes in National Strategy for Preventing Veteran Suicide. Fed Pract. 2018;35(12):16-17.
To the Editor: Even one death by suicide is too many. Suicide is complex and a serious national public health issue that affects people from all walks of life—not just veterans—for a variety of reasons. While there is still a lot we can learn about suicide, we know that suicide is preventable, treatment works, and there is hope.
At the US Department of Veterans Affairs (VA), our suicide prevention efforts are guided by the National Strategy for Preventing Veteran Suicide.1 Published in 2018, this long-term strategy expands beyond crisis intervention and provides a framework for identifying priorities, organizing efforts, and focusing national attention and community resources to prevent suicide among veterans through a broad public health approach with an emphasis on comprehensive, community-based engagement.
This approach is grounded in 4 key areas: Primary prevention focuses on preventing suicidal behavior before it occurs; whole health considers factors beyond mental health, such as physical health, alcohol or substance misuse, and life events; application of data and research emphasizes evidence-based approaches that can be tailored to the needs of veterans in local communities; and collaboration educates and empowers diverse communities to participate in suicide prevention efforts through coordination.
A recent article by Russell Lemle, PhD, noted that the National Strategy does not emphasize the work of the VA, and he is correct.2 Rather than perpetuate the myth that VA can address suicide alone, the strategy was intended to guide veteran suicide prevention efforts across the entire nation, not just within VA’s walls. It is a plan for how we can ALL work together to prevent veteran suicide. The National Strategy does not minimize VA’s role in suicide prevention. It enhances VA’s ability and expectation to engage in collaborative efforts across the nation.
Every year, about 6,000 veterans die by suicide, the majority of whom have not received recent VA care. We are mindful that some veterans may not receive any or all of their health care services from the VA, for various reasons, and want to be respectful and cognizant of those choices. To save lives, VA needs the support of partners across sectors. We need to ensure that multiple systems are working in a coordinated way to reach veterans where they live, work, and thrive.
Our philosophy is that there is no wrong door to care. That is why we focused on universal, non-VA community interventions. Preventing suicide among all of the nation’s 20 million veterans cannot be the sole responsibility of VA—it requires a nationwide effort. As there is no single cause of suicide, no single organization can tackle suicide prevention alone. Put simply, VA must ensure suicide prevention is a part of every aspect of veterans’ lives, not just their VA interactions. At VA, we know that the care and support that veterans need often comes before a mental health crisis occurs, and communities and families may be better equipped to provide these types of supports.
Activities or special interest groups can boost protective factors against suicide and combat risk factors. Communities can foster an environment where veterans can find connection and camaraderie, achieve a sense of purpose, bolster their coping skills, and live healthily. And partners like the National Shooting Sports Foundation help VA to address sensitive issues, such as lethal means safety, while correcting misconceptions about how VA handles gun ownership.
Data also are an integral piece of our public health approach, driving how VA defines the problem, targets its programs, and delivers and implements interventions. VA was one of the first institutions to implement comprehensive suicide analysis and predictive analytics, and VA has continuously improved data surveillance related to veteran suicide.
We began comprehensive suicide monitoring for the entire VA patient population in 2006, and in 2012, VA released its first report of suicide surveillance among all veterans in select partnering states. Though we are able to share data, we acknowledge the limitations Dr. Lemle highlighted in implementing predictive analytics program outside the VA. However, VA continues to improve reporting and surveillance efforts, especially to better understand the 20 veterans and service members who die by suicide each day.
As Lemle noted, little was previously known about the 14 of 20 veterans who die by suicide every day who weren’t recent users of VA health services. Since the September 2018 release of the National Strategy, VA has obtained additional data. In addition to sharing data, VA will focus on helping non-VA entities understand the problem so that they can help reach veterans who may never go to VA for care. Efforts are underway to better understand specific groups that are at elevated risk, such as veterans aged 18 to 34 years, women veterans, never federally activated guardsmen and reservists, recently separated veterans, and former service members with Other Than Honorable discharges.
To end veteran suicide, VA is relentlessly working to make improvements to existing suicide prevention programs, develop VA-specific plans to advance the National Strategy, find innovative ways to get people into care, and educate veterans and family members about VA care. Through Executive Order 13822, for example, VA has partnered with the Departments of Defense and Homeland Security, which allows us to educate service members about VA offerings before they become veterans. We also are making it easier for them to quickly find information online about VA mental health services.
We acknowledge VA is not a perfect organization, and a negative image can turn away veterans. VA is actively working with the media to get more good news stories published. We have many exciting things to talk about, such as a newly implemented Comprehensive Suicide Risk Assessment, and it is important for people to know that VA is providing the gold standard of care. Sometimes, those stories are better messaged and amplified by partners and non-VA entities, and this is a key part of our approach.
Lemle also raised a concern around funding this new public health initiative. While we recognize the challenges in advancing this new public health approach without additional funding, we are hopeful we can energize communities to work with us to find a solution.
The National Strategy is not the end of the conversation. It is a starting point. We are thankful for Lemle’s thoughtful questions and are actively pursuing and investigating solutions regarding veteran suicide studies, peer support, and community care guidelines for partners as we seek to improve our services. We also are putting pen to paper on a plan to strengthen family involvement and integrate suicide prevention within VA’s whole health and social services strategies.
The National Strategy is a call to action to every organization, system, and institution interested in preventing veteran suicide to help do this work where we cannot. For our part, VA will continue to energize communities to increase local involvement to reach all veterans, and we will continue to empower and equip ALL veterans with the resources and care they need to thrive.
To learn about the resources available for veterans and how you can #BeThere as a VA employee, family member, friend, community partner, or clinician, visit www.mentalhealth.va.gov/suicide_prevention/resources.asp. If you or someone you know is having thoughts of suicide, contact the Veterans Crisis Line to receive free, confidential support and crisis intervention available 24 hours a day, 7 days a week, 365 days a year. Call 800-273-8255 and press 1, text to 838255, or chat online at VeteransCrisisLine.net/Chat.
- Keita Franklin, LCSD, PhD
Author affiliations: Executive Director, Suicide Prevention VA Office of Mental Health and Suicide Prevention.
Author disclosures: Keita Franklin participated in the development of the National Strategy for Preventing Veteran Suicide .
Disclaimer: The opinions expressed herein are those of the author and do not necessarily reflect those of Federal Practitioner , Frontline Medical Communications Inc., the US Government, or any of its agencies.
Author Response: Keita Franklin, PhD, offers a valuable response to my December critique of the VA National Strategy to Prevent Veteran Suicide. Dr. Franklin thoughtfully articulates why public health approaches to prevent suicide must be a core component of a multifaceted strategy. She is right about that.
While I see considerable overlap between our statements, there are 2 important points where we diverge: (1) Unless Congress appropriates sufficient funds for extensive public health outreach, there is a danger that funds to implement it would be diverted from VA’s extant effective VA suicide prevention programs. (2) A prospective suicide prevention plan requires 3 prongs of universal, group, and individually focused strategies, because suicide cannot be prevented by any single strategy. The VA National Strategy as well as the March 2019 Executive Order on a National Roadmap to Empower Veterans and End Suicide, focus predominantly on universal strategies, and I believe its overall approach would be improved by also explicitly supporting VA’s targeted programs for at-risk veterans.
- Russell B. Lemle, PhD
Author affiliations: Policy Analyst at the Veterans Healthcare Policy Institute in Oakland, California.
To the Editor: Even one death by suicide is too many. Suicide is complex and a serious national public health issue that affects people from all walks of life—not just veterans—for a variety of reasons. While there is still a lot we can learn about suicide, we know that suicide is preventable, treatment works, and there is hope.
At the US Department of Veterans Affairs (VA), our suicide prevention efforts are guided by the National Strategy for Preventing Veteran Suicide.1 Published in 2018, this long-term strategy expands beyond crisis intervention and provides a framework for identifying priorities, organizing efforts, and focusing national attention and community resources to prevent suicide among veterans through a broad public health approach with an emphasis on comprehensive, community-based engagement.
This approach is grounded in 4 key areas: Primary prevention focuses on preventing suicidal behavior before it occurs; whole health considers factors beyond mental health, such as physical health, alcohol or substance misuse, and life events; application of data and research emphasizes evidence-based approaches that can be tailored to the needs of veterans in local communities; and collaboration educates and empowers diverse communities to participate in suicide prevention efforts through coordination.
A recent article by Russell Lemle, PhD, noted that the National Strategy does not emphasize the work of the VA, and he is correct.2 Rather than perpetuate the myth that VA can address suicide alone, the strategy was intended to guide veteran suicide prevention efforts across the entire nation, not just within VA’s walls. It is a plan for how we can ALL work together to prevent veteran suicide. The National Strategy does not minimize VA’s role in suicide prevention. It enhances VA’s ability and expectation to engage in collaborative efforts across the nation.
Every year, about 6,000 veterans die by suicide, the majority of whom have not received recent VA care. We are mindful that some veterans may not receive any or all of their health care services from the VA, for various reasons, and want to be respectful and cognizant of those choices. To save lives, VA needs the support of partners across sectors. We need to ensure that multiple systems are working in a coordinated way to reach veterans where they live, work, and thrive.
Our philosophy is that there is no wrong door to care. That is why we focused on universal, non-VA community interventions. Preventing suicide among all of the nation’s 20 million veterans cannot be the sole responsibility of VA—it requires a nationwide effort. As there is no single cause of suicide, no single organization can tackle suicide prevention alone. Put simply, VA must ensure suicide prevention is a part of every aspect of veterans’ lives, not just their VA interactions. At VA, we know that the care and support that veterans need often comes before a mental health crisis occurs, and communities and families may be better equipped to provide these types of supports.
Activities or special interest groups can boost protective factors against suicide and combat risk factors. Communities can foster an environment where veterans can find connection and camaraderie, achieve a sense of purpose, bolster their coping skills, and live healthily. And partners like the National Shooting Sports Foundation help VA to address sensitive issues, such as lethal means safety, while correcting misconceptions about how VA handles gun ownership.
Data also are an integral piece of our public health approach, driving how VA defines the problem, targets its programs, and delivers and implements interventions. VA was one of the first institutions to implement comprehensive suicide analysis and predictive analytics, and VA has continuously improved data surveillance related to veteran suicide.
We began comprehensive suicide monitoring for the entire VA patient population in 2006, and in 2012, VA released its first report of suicide surveillance among all veterans in select partnering states. Though we are able to share data, we acknowledge the limitations Dr. Lemle highlighted in implementing predictive analytics program outside the VA. However, VA continues to improve reporting and surveillance efforts, especially to better understand the 20 veterans and service members who die by suicide each day.
As Lemle noted, little was previously known about the 14 of 20 veterans who die by suicide every day who weren’t recent users of VA health services. Since the September 2018 release of the National Strategy, VA has obtained additional data. In addition to sharing data, VA will focus on helping non-VA entities understand the problem so that they can help reach veterans who may never go to VA for care. Efforts are underway to better understand specific groups that are at elevated risk, such as veterans aged 18 to 34 years, women veterans, never federally activated guardsmen and reservists, recently separated veterans, and former service members with Other Than Honorable discharges.
To end veteran suicide, VA is relentlessly working to make improvements to existing suicide prevention programs, develop VA-specific plans to advance the National Strategy, find innovative ways to get people into care, and educate veterans and family members about VA care. Through Executive Order 13822, for example, VA has partnered with the Departments of Defense and Homeland Security, which allows us to educate service members about VA offerings before they become veterans. We also are making it easier for them to quickly find information online about VA mental health services.
We acknowledge VA is not a perfect organization, and a negative image can turn away veterans. VA is actively working with the media to get more good news stories published. We have many exciting things to talk about, such as a newly implemented Comprehensive Suicide Risk Assessment, and it is important for people to know that VA is providing the gold standard of care. Sometimes, those stories are better messaged and amplified by partners and non-VA entities, and this is a key part of our approach.
Lemle also raised a concern around funding this new public health initiative. While we recognize the challenges in advancing this new public health approach without additional funding, we are hopeful we can energize communities to work with us to find a solution.
The National Strategy is not the end of the conversation. It is a starting point. We are thankful for Lemle’s thoughtful questions and are actively pursuing and investigating solutions regarding veteran suicide studies, peer support, and community care guidelines for partners as we seek to improve our services. We also are putting pen to paper on a plan to strengthen family involvement and integrate suicide prevention within VA’s whole health and social services strategies.
The National Strategy is a call to action to every organization, system, and institution interested in preventing veteran suicide to help do this work where we cannot. For our part, VA will continue to energize communities to increase local involvement to reach all veterans, and we will continue to empower and equip ALL veterans with the resources and care they need to thrive.
To learn about the resources available for veterans and how you can #BeThere as a VA employee, family member, friend, community partner, or clinician, visit www.mentalhealth.va.gov/suicide_prevention/resources.asp. If you or someone you know is having thoughts of suicide, contact the Veterans Crisis Line to receive free, confidential support and crisis intervention available 24 hours a day, 7 days a week, 365 days a year. Call 800-273-8255 and press 1, text to 838255, or chat online at VeteransCrisisLine.net/Chat.
- Keita Franklin, LCSD, PhD
Author affiliations: Executive Director, Suicide Prevention VA Office of Mental Health and Suicide Prevention.
Author disclosures: Keita Franklin participated in the development of the National Strategy for Preventing Veteran Suicide .
Disclaimer: The opinions expressed herein are those of the author and do not necessarily reflect those of Federal Practitioner , Frontline Medical Communications Inc., the US Government, or any of its agencies.
Author Response: Keita Franklin, PhD, offers a valuable response to my December critique of the VA National Strategy to Prevent Veteran Suicide. Dr. Franklin thoughtfully articulates why public health approaches to prevent suicide must be a core component of a multifaceted strategy. She is right about that.
While I see considerable overlap between our statements, there are 2 important points where we diverge: (1) Unless Congress appropriates sufficient funds for extensive public health outreach, there is a danger that funds to implement it would be diverted from VA’s extant effective VA suicide prevention programs. (2) A prospective suicide prevention plan requires 3 prongs of universal, group, and individually focused strategies, because suicide cannot be prevented by any single strategy. The VA National Strategy as well as the March 2019 Executive Order on a National Roadmap to Empower Veterans and End Suicide, focus predominantly on universal strategies, and I believe its overall approach would be improved by also explicitly supporting VA’s targeted programs for at-risk veterans.
- Russell B. Lemle, PhD
Author affiliations: Policy Analyst at the Veterans Healthcare Policy Institute in Oakland, California.
1. US Department of Veterans Affairs. National strategy for preventing veteran suicide 2018–2028. https://www.mentalhealth.va.gov/suicide_prevention/docs/Office-of-Mental-Health-and-Suicide-Prevention-National-Strategy-for-Preventing-Veterans-Suicide.pdf. Published September 2018. Accessed February 19, 2019.
2. Lemle R. Communities emphasis could undercut VA successes in National Strategy for Preventing Veteran Suicide. Fed Pract. 2018;35(12):16-17.
1. US Department of Veterans Affairs. National strategy for preventing veteran suicide 2018–2028. https://www.mentalhealth.va.gov/suicide_prevention/docs/Office-of-Mental-Health-and-Suicide-Prevention-National-Strategy-for-Preventing-Veterans-Suicide.pdf. Published September 2018. Accessed February 19, 2019.
2. Lemle R. Communities emphasis could undercut VA successes in National Strategy for Preventing Veteran Suicide. Fed Pract. 2018;35(12):16-17.
Necrotizing Infection of the Upper Extremity: A Veterans Affairs Medical Center Experience (2008-2017)
Necrotizing infection of the extremity is a rare but potentially lethal diagnosis with a mortality rate in the range of 17% to 35%.1-4 The plastic surgery service at the Malcom Randall Veterans Affairs Medical Center (MRVAMC) treats all hand emergencies, including upper extremity infection, in the North Florida/South Georgia Veterans Heath System. There has been a well-coordinated emergency hand care system in place for several years that includes specialty templates on the electronic health record, pre-existing urgent clinic appointments, and single service surgical specialty care.5 This facilitates a fluid line of communication between primary care, emergency department (ED) providers, and surgical specialties. The objective of the study was to evaluate our identification, treatment, and outcome of these serious infections.
Methods
The MRVAMC Institutional Review Board approved a retrospective review of necrotizing infection of the upper extremity treated at the facility by the plastic surgery service. Surgical cases over a 9-year period (June 5, 2008-June 5, 2017) were identified by CPT (current procedural technology) codes for amputation and/or debridement of the upper extremity. The charts were reviewed for evidence of necrotizing infection by clinical description or pathology report. The patients’ age, sex, etiology, comorbidities from their problem list, vitals, and laboratory results were recorded upon arrival at the hospital. Time from presentation to surgery, treatment, and outcomes were recorded.
Results
Ten patients were treated for necrotizing infection of the upper extremity over a 9-year period; all were men with an average age of 64 years. Etiologies included nail biting, “bug bites,” crush injuries, burns, suspected IV drug use, and unknown. Nine of 10 patients had diabetes mellitus (DM). Most did not show evidence of hemodynamic instability on hospital arrival (Table). One patient was hypotensive with a mean arterial blood pressure < 65 mm Hg, 2 had heart rates > 100 beats/min, 1 patient had a temperature > 38° C, and 7 had elevated white blood cell (WBC) counts ranging from 11 to 24 k/cmm. Two undiagnosed patients with DM (patients 1 and 8) expressed no complaints of pain and presented with blood glucose > 450 mg/dL with hemoglobin A1c levels > 12%.
Infectious disease and critical care services were involved in the treatment of several cases when requested. A computed tomography (CT) scan was used in 2 of the patients (patients 1 and 4) to assist in the diagnosis (Figure 1). 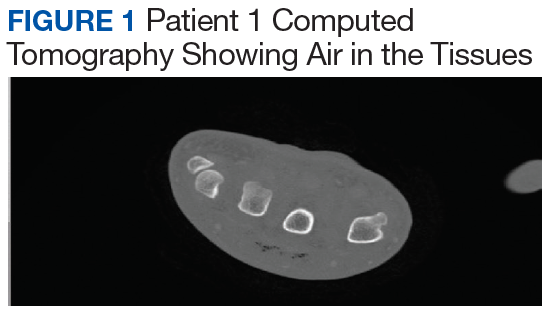
Seven patients out of 10 were treated with surgery within 24 hours on hospital arrival. The severity of the pathology was not initially recognized in 2 of the patients earlier in the review. A third patient resisted surgical treatment until the second hospital day. Four patients had from 1 to 3 digital amputations, 2 patients had wrist disarticulations, and 1 had a distal forearm amputation. 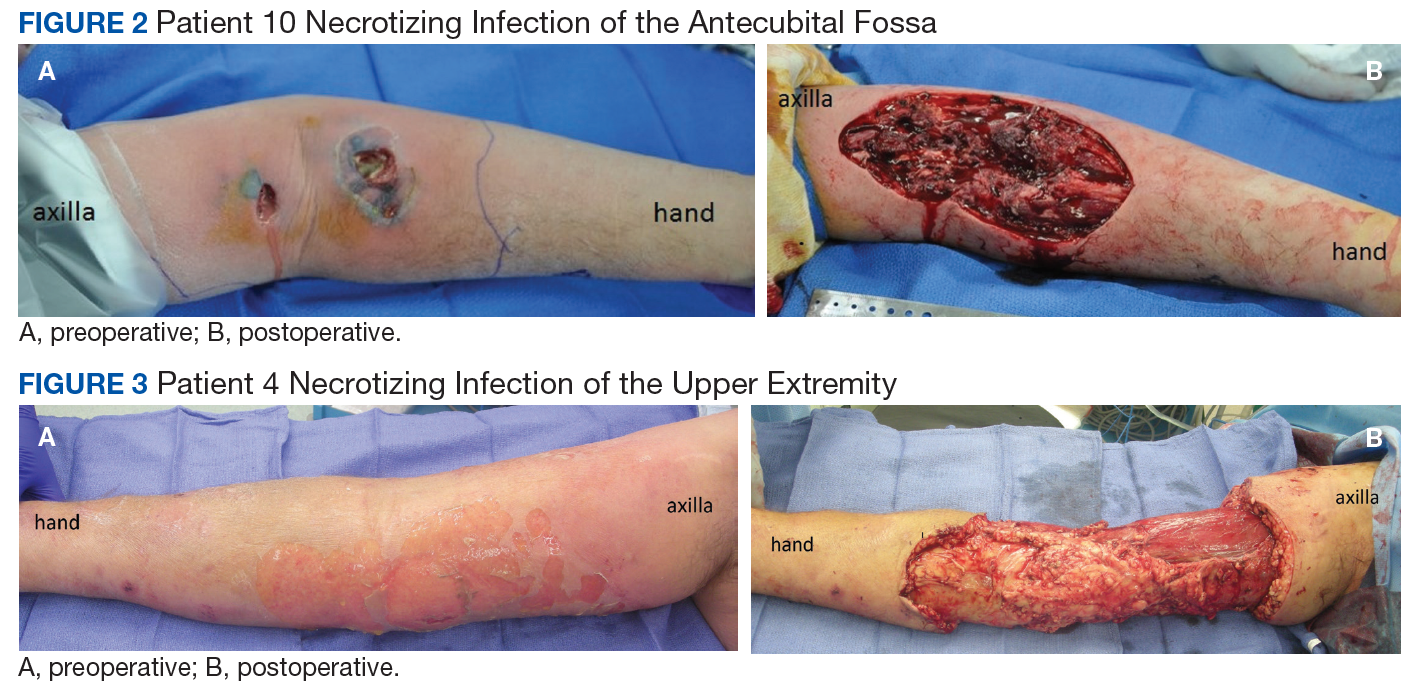
Antibiotics were managed by critical care, hospitalist, or infectious disease services and adjusted once final cultures were returned (Table). 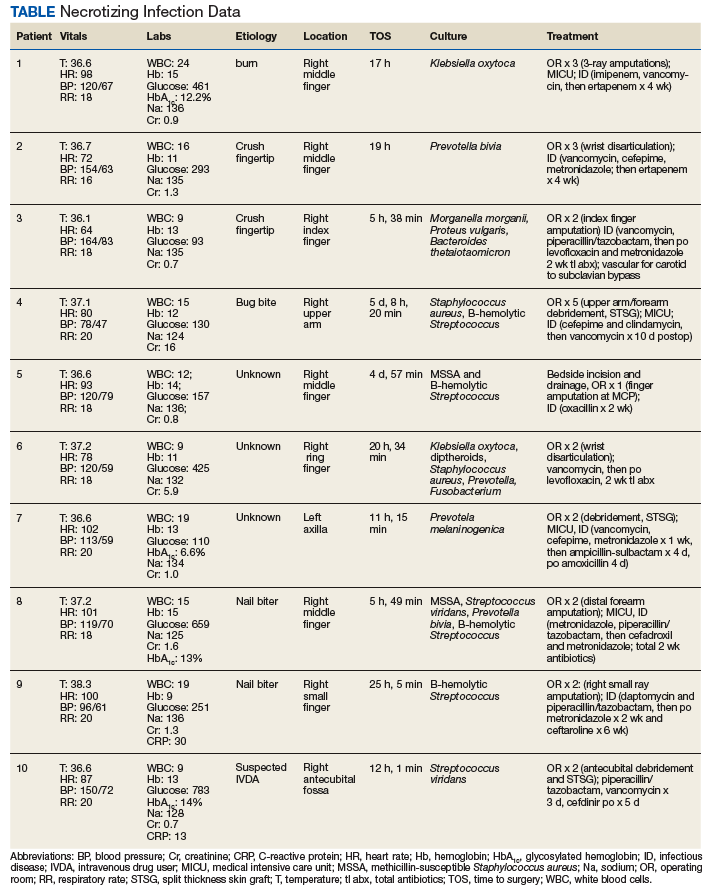
Discussion
Necrotizing infection of the upper extremity is a rare pathology with a substantial risk of amputation and mortality that requires a high index of suspicion and expeditious referral to a hand surgeon. It is well accepted that the key to survival is prompt surgical debridement of all necrotic tissue, ideally within 24 hours of hospital arrival.2-4,6 Death is usually secondary to sepsis.3 The classic presentation of pain out of proportion to exam, hypotension, erythema, skin necrosis, elevated WBC count, and fever may not be present and can delay diagnosis.1-4,6
DM is the most common comorbidity, and reviews have found the disease occurs more often in males, both which are consistent with our study.1-3 Diabetic infections have been found to be more likely to present as necrotizing infection than are nondiabetic infections and be at a higher risk for amputation.7 The patients with the wrist disarticulations and forearm amputation had DM. A minor trauma can be a portal for infection, which can be monomicrobial or polymicrobial.1,4 Once the diagnosis is suspected, prompt resuscitation, surgical debridement, IV antibiotics, and early intensive care are lifesaving. Hyperbaric oxygen is not available at MRVAMC and was not pursued as a transfer request due to its controversial benefit.6
There were no perioperative 30-day mortalities over a 9-year period in patients identified as having necrotizing infection of the upper extremity. This is attributed to an aggressive and well-coordinated, multisystem approach involving emergency, surgical, anesthesia, intensive care, and infectious disease services.
The hand trauma triage system in place at MRVAMC was started in 2008 and presented at the 38th Annual VA Surgeons Meeting in New Haven, Connecticut. The process starts at the level of the ED, urgent care or primary care provider and facilitates rapid access to subspecialty care by reducing unnecessary phone calls and appointment wait times.
All hand emergencies are covered by the plastic surgery service rather than the traditional split coverage between orthopedics and plastic surgery. This provides consistency and continuity for the patients and staff. The electronic health record consult template gives specific instructions to contact the on-call plastic surgeon. The resident/fellow gets called if patient is in-house, and faculty is called if the patient is outside the main hospital. The requesting provider gets instructions on treatment and follow-up. Clinic profiles have appointments reserved for urgent consults during the first hour so that patients can be sent to pre-anesthesia clinic or hand therapy, depending on the diagnosis. This triage system increased our hand trauma volume by a multiple of 6 between 2008 and 2012 but cut the appointment wait time > 1 week by half, as a percentage of consults, and did not significantly increase after-hour use of the operating room. The number of faculty and trainees stayed the same.
We did find that speed to diagnosis for necrotizing infection is an area that can be improved on with a higher clinical suspicion. There is a learning curve to the diagnosis and treatment, which can be prolonged when the index cases do not present themselves often and the patients do not appear in distress. This argues for consistency in hand-specific trauma coverage. The patients were most often initially seen by the resident and examined by a faculty member within hours. There were 4 different plastic surgery faculty involved in these cases, and they all included resident participation before, during, and after surgery. Debridement consists of wide local excision to bleeding tissue. Author review of the operative notes found the numbers of trips to the operating room for debridement can be reduced as the surgeon becomes more confident in the diagnosis and management, resulting in less “whittling” and a more definitive debridement, resulting in a faster recovery.
The LRINEC (Laboratory Risk Indicator for Necrotizing Fasciitis) is a tool that helps to distinguish necrotizing infection from other forms of soft tissue infection by using a point system for laboratory values that include C-reactive protein (CRP), white blood count, hemoglobin, sodium, creatinine, and glucose values.8 We do not routinely request CRP results, but 1 of the 2 patients (patient 9) who had the full complement of laboratory tests would have met high-risk criteria. The diagnostic accuracy of this tool has been questioned9; however, the authors welcome any method that can rapidly and noninvasively assist in getting the patient proper attention.
The patients were not seen for long-term follow-up, but some did return to the main hospital or clinic for other pathology and were pleased to show off their grip strength after a 3-ray amputation (patient 1) and aesthetics after upper arm and forearm debridement and skin graft reconstruction (patient 4, Figure 4). 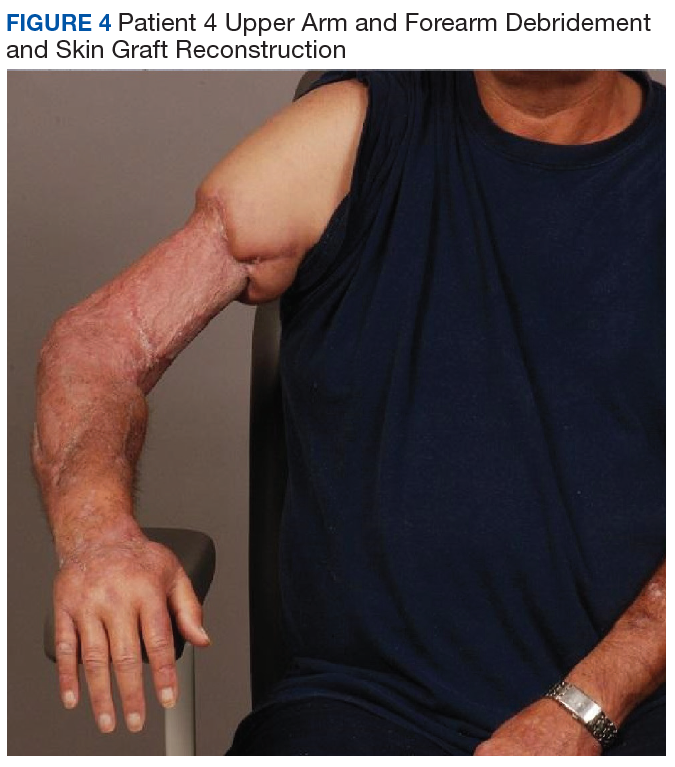
A single-ray amputation can be expected to result in a loss of grip and pinch strength, about 43.3% and 33.6%, respectively; however, given the alternative of further loss of life or limb, this was considered a reasonable trade-off.10 One wrist disarticulation and the forearm amputation were seen by amputee clinic for prosthetic fitting many months after the amputations once the wounds were healed and edema had subsided.
Conclusion
A well-coordinated multidisciplinary effort was the key to successful identification and treatment of this serious life- and limb-threatening infection at our institution. We did identify room for improvement in making an earlier diagnosis and performing a more aggressive first debridement.
Acknowledgments
This project is the result of work supported with resources and use of facilities at the Malcom Randall VA Medical Center in Gainesville, Florida.
1. Angoules AG, Kontakis G, Drakoulakis E, Vrentzos G, Granick MS, Giannoudis PV. Necrotizing fasciitis of upper and lower limb: a systemic review. Injury. 2007;38(suppl 5):S19-S26.
2. Chauhan A, Wigton MD, Palmer BA. Necrotizing fasciitis. J Hand Surg Am. 2014;39(8):1598-1601.
3. Cheng NC, SU YM, Kuo YS, Tai HC, Tang YB. Factors affecting the mortality of necrotizing fasciitis involving the upper extremities. Surg Today. 2008;38(12):1108-1113.
4. Sunderland IR, Friedrich JB. Predictors of mortality and limb loss in necrotizing soft tissue infections of the upper extremity. J Hand Surg Am. 2009;34(10):1900-1901.
5. Coady-Fariborzian L, McGreane A. Comparison of hand emergency triage before and after specialty templates (2007 vs 2012). Hand (N Y). 2015;10(2):215-220.
6. Stevens D, Bryant A. Necrotizing soft-tissue infections. N Engl J Med. 2017;377(23):2253-2265.
7. Sharma K, Pan D, Friedman J, Yu JL, Mull A, Moore AM. Quantifying the effect of diabetes on surgical hand and forearm infections. J Hand Surg Am. 2018;43(2):105-114.
8. Wong CH, Khin LW, Heng KS, Tan KC, Low CO. The LRINEC (Laboratory Risk Indicator for Necrotizing Fasciitis) score: a tool for distinguishing necrotizing fasciitis from other soft tissue infections. Crit Care Med. 2004;32(7):1535-1541.
9. Fernando SM, Tran A, Cheng W, et al. Necrotizing soft tissue infection: diagnostic accuracy of physical examination, imaging, and LRINEC score: a systematic review and meta-analysis. Ann Surg. 2019;269(1):58-65. 10. Bhat AK, Acharya AM, Narayanakurup JK, Kumar B, Nagpal PS, Kamath A. Functional and cosmetic outcome of single-digit ray amputation in hand. Musculoskelet Surg. 2017;101(3):275-281.
Necrotizing infection of the extremity is a rare but potentially lethal diagnosis with a mortality rate in the range of 17% to 35%.1-4 The plastic surgery service at the Malcom Randall Veterans Affairs Medical Center (MRVAMC) treats all hand emergencies, including upper extremity infection, in the North Florida/South Georgia Veterans Heath System. There has been a well-coordinated emergency hand care system in place for several years that includes specialty templates on the electronic health record, pre-existing urgent clinic appointments, and single service surgical specialty care.5 This facilitates a fluid line of communication between primary care, emergency department (ED) providers, and surgical specialties. The objective of the study was to evaluate our identification, treatment, and outcome of these serious infections.
Methods
The MRVAMC Institutional Review Board approved a retrospective review of necrotizing infection of the upper extremity treated at the facility by the plastic surgery service. Surgical cases over a 9-year period (June 5, 2008-June 5, 2017) were identified by CPT (current procedural technology) codes for amputation and/or debridement of the upper extremity. The charts were reviewed for evidence of necrotizing infection by clinical description or pathology report. The patients’ age, sex, etiology, comorbidities from their problem list, vitals, and laboratory results were recorded upon arrival at the hospital. Time from presentation to surgery, treatment, and outcomes were recorded.
Results
Ten patients were treated for necrotizing infection of the upper extremity over a 9-year period; all were men with an average age of 64 years. Etiologies included nail biting, “bug bites,” crush injuries, burns, suspected IV drug use, and unknown. Nine of 10 patients had diabetes mellitus (DM). Most did not show evidence of hemodynamic instability on hospital arrival (Table). One patient was hypotensive with a mean arterial blood pressure < 65 mm Hg, 2 had heart rates > 100 beats/min, 1 patient had a temperature > 38° C, and 7 had elevated white blood cell (WBC) counts ranging from 11 to 24 k/cmm. Two undiagnosed patients with DM (patients 1 and 8) expressed no complaints of pain and presented with blood glucose > 450 mg/dL with hemoglobin A1c levels > 12%.
Infectious disease and critical care services were involved in the treatment of several cases when requested. A computed tomography (CT) scan was used in 2 of the patients (patients 1 and 4) to assist in the diagnosis (Figure 1).
Seven patients out of 10 were treated with surgery within 24 hours on hospital arrival. The severity of the pathology was not initially recognized in 2 of the patients earlier in the review. A third patient resisted surgical treatment until the second hospital day. Four patients had from 1 to 3 digital amputations, 2 patients had wrist disarticulations, and 1 had a distal forearm amputation.
Antibiotics were managed by critical care, hospitalist, or infectious disease services and adjusted once final cultures were returned (Table).
Discussion
Necrotizing infection of the upper extremity is a rare pathology with a substantial risk of amputation and mortality that requires a high index of suspicion and expeditious referral to a hand surgeon. It is well accepted that the key to survival is prompt surgical debridement of all necrotic tissue, ideally within 24 hours of hospital arrival.2-4,6 Death is usually secondary to sepsis.3 The classic presentation of pain out of proportion to exam, hypotension, erythema, skin necrosis, elevated WBC count, and fever may not be present and can delay diagnosis.1-4,6
DM is the most common comorbidity, and reviews have found the disease occurs more often in males, both which are consistent with our study.1-3 Diabetic infections have been found to be more likely to present as necrotizing infection than are nondiabetic infections and be at a higher risk for amputation.7 The patients with the wrist disarticulations and forearm amputation had DM. A minor trauma can be a portal for infection, which can be monomicrobial or polymicrobial.1,4 Once the diagnosis is suspected, prompt resuscitation, surgical debridement, IV antibiotics, and early intensive care are lifesaving. Hyperbaric oxygen is not available at MRVAMC and was not pursued as a transfer request due to its controversial benefit.6
There were no perioperative 30-day mortalities over a 9-year period in patients identified as having necrotizing infection of the upper extremity. This is attributed to an aggressive and well-coordinated, multisystem approach involving emergency, surgical, anesthesia, intensive care, and infectious disease services.
The hand trauma triage system in place at MRVAMC was started in 2008 and presented at the 38th Annual VA Surgeons Meeting in New Haven, Connecticut. The process starts at the level of the ED, urgent care or primary care provider and facilitates rapid access to subspecialty care by reducing unnecessary phone calls and appointment wait times.
All hand emergencies are covered by the plastic surgery service rather than the traditional split coverage between orthopedics and plastic surgery. This provides consistency and continuity for the patients and staff. The electronic health record consult template gives specific instructions to contact the on-call plastic surgeon. The resident/fellow gets called if patient is in-house, and faculty is called if the patient is outside the main hospital. The requesting provider gets instructions on treatment and follow-up. Clinic profiles have appointments reserved for urgent consults during the first hour so that patients can be sent to pre-anesthesia clinic or hand therapy, depending on the diagnosis. This triage system increased our hand trauma volume by a multiple of 6 between 2008 and 2012 but cut the appointment wait time > 1 week by half, as a percentage of consults, and did not significantly increase after-hour use of the operating room. The number of faculty and trainees stayed the same.
We did find that speed to diagnosis for necrotizing infection is an area that can be improved on with a higher clinical suspicion. There is a learning curve to the diagnosis and treatment, which can be prolonged when the index cases do not present themselves often and the patients do not appear in distress. This argues for consistency in hand-specific trauma coverage. The patients were most often initially seen by the resident and examined by a faculty member within hours. There were 4 different plastic surgery faculty involved in these cases, and they all included resident participation before, during, and after surgery. Debridement consists of wide local excision to bleeding tissue. Author review of the operative notes found the numbers of trips to the operating room for debridement can be reduced as the surgeon becomes more confident in the diagnosis and management, resulting in less “whittling” and a more definitive debridement, resulting in a faster recovery.
The LRINEC (Laboratory Risk Indicator for Necrotizing Fasciitis) is a tool that helps to distinguish necrotizing infection from other forms of soft tissue infection by using a point system for laboratory values that include C-reactive protein (CRP), white blood count, hemoglobin, sodium, creatinine, and glucose values.8 We do not routinely request CRP results, but 1 of the 2 patients (patient 9) who had the full complement of laboratory tests would have met high-risk criteria. The diagnostic accuracy of this tool has been questioned9; however, the authors welcome any method that can rapidly and noninvasively assist in getting the patient proper attention.
The patients were not seen for long-term follow-up, but some did return to the main hospital or clinic for other pathology and were pleased to show off their grip strength after a 3-ray amputation (patient 1) and aesthetics after upper arm and forearm debridement and skin graft reconstruction (patient 4, Figure 4).
A single-ray amputation can be expected to result in a loss of grip and pinch strength, about 43.3% and 33.6%, respectively; however, given the alternative of further loss of life or limb, this was considered a reasonable trade-off.10 One wrist disarticulation and the forearm amputation were seen by amputee clinic for prosthetic fitting many months after the amputations once the wounds were healed and edema had subsided.
Conclusion
A well-coordinated multidisciplinary effort was the key to successful identification and treatment of this serious life- and limb-threatening infection at our institution. We did identify room for improvement in making an earlier diagnosis and performing a more aggressive first debridement.
Acknowledgments
This project is the result of work supported with resources and use of facilities at the Malcom Randall VA Medical Center in Gainesville, Florida.
Necrotizing infection of the extremity is a rare but potentially lethal diagnosis with a mortality rate in the range of 17% to 35%.1-4 The plastic surgery service at the Malcom Randall Veterans Affairs Medical Center (MRVAMC) treats all hand emergencies, including upper extremity infection, in the North Florida/South Georgia Veterans Heath System. There has been a well-coordinated emergency hand care system in place for several years that includes specialty templates on the electronic health record, pre-existing urgent clinic appointments, and single service surgical specialty care.5 This facilitates a fluid line of communication between primary care, emergency department (ED) providers, and surgical specialties. The objective of the study was to evaluate our identification, treatment, and outcome of these serious infections.
Methods
The MRVAMC Institutional Review Board approved a retrospective review of necrotizing infection of the upper extremity treated at the facility by the plastic surgery service. Surgical cases over a 9-year period (June 5, 2008-June 5, 2017) were identified by CPT (current procedural technology) codes for amputation and/or debridement of the upper extremity. The charts were reviewed for evidence of necrotizing infection by clinical description or pathology report. The patients’ age, sex, etiology, comorbidities from their problem list, vitals, and laboratory results were recorded upon arrival at the hospital. Time from presentation to surgery, treatment, and outcomes were recorded.
Results
Ten patients were treated for necrotizing infection of the upper extremity over a 9-year period; all were men with an average age of 64 years. Etiologies included nail biting, “bug bites,” crush injuries, burns, suspected IV drug use, and unknown. Nine of 10 patients had diabetes mellitus (DM). Most did not show evidence of hemodynamic instability on hospital arrival (Table). One patient was hypotensive with a mean arterial blood pressure < 65 mm Hg, 2 had heart rates > 100 beats/min, 1 patient had a temperature > 38° C, and 7 had elevated white blood cell (WBC) counts ranging from 11 to 24 k/cmm. Two undiagnosed patients with DM (patients 1 and 8) expressed no complaints of pain and presented with blood glucose > 450 mg/dL with hemoglobin A1c levels > 12%.
Infectious disease and critical care services were involved in the treatment of several cases when requested. A computed tomography (CT) scan was used in 2 of the patients (patients 1 and 4) to assist in the diagnosis (Figure 1).
Seven patients out of 10 were treated with surgery within 24 hours on hospital arrival. The severity of the pathology was not initially recognized in 2 of the patients earlier in the review. A third patient resisted surgical treatment until the second hospital day. Four patients had from 1 to 3 digital amputations, 2 patients had wrist disarticulations, and 1 had a distal forearm amputation.
Antibiotics were managed by critical care, hospitalist, or infectious disease services and adjusted once final cultures were returned (Table).
Discussion
Necrotizing infection of the upper extremity is a rare pathology with a substantial risk of amputation and mortality that requires a high index of suspicion and expeditious referral to a hand surgeon. It is well accepted that the key to survival is prompt surgical debridement of all necrotic tissue, ideally within 24 hours of hospital arrival.2-4,6 Death is usually secondary to sepsis.3 The classic presentation of pain out of proportion to exam, hypotension, erythema, skin necrosis, elevated WBC count, and fever may not be present and can delay diagnosis.1-4,6
DM is the most common comorbidity, and reviews have found the disease occurs more often in males, both which are consistent with our study.1-3 Diabetic infections have been found to be more likely to present as necrotizing infection than are nondiabetic infections and be at a higher risk for amputation.7 The patients with the wrist disarticulations and forearm amputation had DM. A minor trauma can be a portal for infection, which can be monomicrobial or polymicrobial.1,4 Once the diagnosis is suspected, prompt resuscitation, surgical debridement, IV antibiotics, and early intensive care are lifesaving. Hyperbaric oxygen is not available at MRVAMC and was not pursued as a transfer request due to its controversial benefit.6
There were no perioperative 30-day mortalities over a 9-year period in patients identified as having necrotizing infection of the upper extremity. This is attributed to an aggressive and well-coordinated, multisystem approach involving emergency, surgical, anesthesia, intensive care, and infectious disease services.
The hand trauma triage system in place at MRVAMC was started in 2008 and presented at the 38th Annual VA Surgeons Meeting in New Haven, Connecticut. The process starts at the level of the ED, urgent care or primary care provider and facilitates rapid access to subspecialty care by reducing unnecessary phone calls and appointment wait times.
All hand emergencies are covered by the plastic surgery service rather than the traditional split coverage between orthopedics and plastic surgery. This provides consistency and continuity for the patients and staff. The electronic health record consult template gives specific instructions to contact the on-call plastic surgeon. The resident/fellow gets called if patient is in-house, and faculty is called if the patient is outside the main hospital. The requesting provider gets instructions on treatment and follow-up. Clinic profiles have appointments reserved for urgent consults during the first hour so that patients can be sent to pre-anesthesia clinic or hand therapy, depending on the diagnosis. This triage system increased our hand trauma volume by a multiple of 6 between 2008 and 2012 but cut the appointment wait time > 1 week by half, as a percentage of consults, and did not significantly increase after-hour use of the operating room. The number of faculty and trainees stayed the same.
We did find that speed to diagnosis for necrotizing infection is an area that can be improved on with a higher clinical suspicion. There is a learning curve to the diagnosis and treatment, which can be prolonged when the index cases do not present themselves often and the patients do not appear in distress. This argues for consistency in hand-specific trauma coverage. The patients were most often initially seen by the resident and examined by a faculty member within hours. There were 4 different plastic surgery faculty involved in these cases, and they all included resident participation before, during, and after surgery. Debridement consists of wide local excision to bleeding tissue. Author review of the operative notes found the numbers of trips to the operating room for debridement can be reduced as the surgeon becomes more confident in the diagnosis and management, resulting in less “whittling” and a more definitive debridement, resulting in a faster recovery.
The LRINEC (Laboratory Risk Indicator for Necrotizing Fasciitis) is a tool that helps to distinguish necrotizing infection from other forms of soft tissue infection by using a point system for laboratory values that include C-reactive protein (CRP), white blood count, hemoglobin, sodium, creatinine, and glucose values.8 We do not routinely request CRP results, but 1 of the 2 patients (patient 9) who had the full complement of laboratory tests would have met high-risk criteria. The diagnostic accuracy of this tool has been questioned9; however, the authors welcome any method that can rapidly and noninvasively assist in getting the patient proper attention.
The patients were not seen for long-term follow-up, but some did return to the main hospital or clinic for other pathology and were pleased to show off their grip strength after a 3-ray amputation (patient 1) and aesthetics after upper arm and forearm debridement and skin graft reconstruction (patient 4, Figure 4).
A single-ray amputation can be expected to result in a loss of grip and pinch strength, about 43.3% and 33.6%, respectively; however, given the alternative of further loss of life or limb, this was considered a reasonable trade-off.10 One wrist disarticulation and the forearm amputation were seen by amputee clinic for prosthetic fitting many months after the amputations once the wounds were healed and edema had subsided.
Conclusion
A well-coordinated multidisciplinary effort was the key to successful identification and treatment of this serious life- and limb-threatening infection at our institution. We did identify room for improvement in making an earlier diagnosis and performing a more aggressive first debridement.
Acknowledgments
This project is the result of work supported with resources and use of facilities at the Malcom Randall VA Medical Center in Gainesville, Florida.
1. Angoules AG, Kontakis G, Drakoulakis E, Vrentzos G, Granick MS, Giannoudis PV. Necrotizing fasciitis of upper and lower limb: a systemic review. Injury. 2007;38(suppl 5):S19-S26.
2. Chauhan A, Wigton MD, Palmer BA. Necrotizing fasciitis. J Hand Surg Am. 2014;39(8):1598-1601.
3. Cheng NC, SU YM, Kuo YS, Tai HC, Tang YB. Factors affecting the mortality of necrotizing fasciitis involving the upper extremities. Surg Today. 2008;38(12):1108-1113.
4. Sunderland IR, Friedrich JB. Predictors of mortality and limb loss in necrotizing soft tissue infections of the upper extremity. J Hand Surg Am. 2009;34(10):1900-1901.
5. Coady-Fariborzian L, McGreane A. Comparison of hand emergency triage before and after specialty templates (2007 vs 2012). Hand (N Y). 2015;10(2):215-220.
6. Stevens D, Bryant A. Necrotizing soft-tissue infections. N Engl J Med. 2017;377(23):2253-2265.
7. Sharma K, Pan D, Friedman J, Yu JL, Mull A, Moore AM. Quantifying the effect of diabetes on surgical hand and forearm infections. J Hand Surg Am. 2018;43(2):105-114.
8. Wong CH, Khin LW, Heng KS, Tan KC, Low CO. The LRINEC (Laboratory Risk Indicator for Necrotizing Fasciitis) score: a tool for distinguishing necrotizing fasciitis from other soft tissue infections. Crit Care Med. 2004;32(7):1535-1541.
9. Fernando SM, Tran A, Cheng W, et al. Necrotizing soft tissue infection: diagnostic accuracy of physical examination, imaging, and LRINEC score: a systematic review and meta-analysis. Ann Surg. 2019;269(1):58-65. 10. Bhat AK, Acharya AM, Narayanakurup JK, Kumar B, Nagpal PS, Kamath A. Functional and cosmetic outcome of single-digit ray amputation in hand. Musculoskelet Surg. 2017;101(3):275-281.
1. Angoules AG, Kontakis G, Drakoulakis E, Vrentzos G, Granick MS, Giannoudis PV. Necrotizing fasciitis of upper and lower limb: a systemic review. Injury. 2007;38(suppl 5):S19-S26.
2. Chauhan A, Wigton MD, Palmer BA. Necrotizing fasciitis. J Hand Surg Am. 2014;39(8):1598-1601.
3. Cheng NC, SU YM, Kuo YS, Tai HC, Tang YB. Factors affecting the mortality of necrotizing fasciitis involving the upper extremities. Surg Today. 2008;38(12):1108-1113.
4. Sunderland IR, Friedrich JB. Predictors of mortality and limb loss in necrotizing soft tissue infections of the upper extremity. J Hand Surg Am. 2009;34(10):1900-1901.
5. Coady-Fariborzian L, McGreane A. Comparison of hand emergency triage before and after specialty templates (2007 vs 2012). Hand (N Y). 2015;10(2):215-220.
6. Stevens D, Bryant A. Necrotizing soft-tissue infections. N Engl J Med. 2017;377(23):2253-2265.
7. Sharma K, Pan D, Friedman J, Yu JL, Mull A, Moore AM. Quantifying the effect of diabetes on surgical hand and forearm infections. J Hand Surg Am. 2018;43(2):105-114.
8. Wong CH, Khin LW, Heng KS, Tan KC, Low CO. The LRINEC (Laboratory Risk Indicator for Necrotizing Fasciitis) score: a tool for distinguishing necrotizing fasciitis from other soft tissue infections. Crit Care Med. 2004;32(7):1535-1541.
9. Fernando SM, Tran A, Cheng W, et al. Necrotizing soft tissue infection: diagnostic accuracy of physical examination, imaging, and LRINEC score: a systematic review and meta-analysis. Ann Surg. 2019;269(1):58-65. 10. Bhat AK, Acharya AM, Narayanakurup JK, Kumar B, Nagpal PS, Kamath A. Functional and cosmetic outcome of single-digit ray amputation in hand. Musculoskelet Surg. 2017;101(3):275-281.