User login
Sarcoidosis
THE COMPARISON
A Pink, elevated, granulomatous, indurated plaques on the face, including the nasal alae, of a 52-year-old woman with a darker skin tone.
B Orange and pink, elevated, granulomatous, indurated plaques on the face of a 55-year-old woman with a lighter skin tone.

Sarcoidosis is a granulomatous disease that may affect the skin in addition to multiple body organ systems, including the lungs. Bilateral hilar adenopathy on a chest radiograph is the most common finding. Sarcoidosis also has a variety of cutaneous manifestations. Early diagnosis is vital, as patients with sarcoidosis and pulmonary fibrosis have a shortened life span compared to the overall population.1 With a growing skin of color population, it is important to recognize sarcoidosis as soon as possible.2
Epidemiology
People of African descent have the highest sarcoidosis prevalence in the United States.3 In the United States, the incidence of sarcoidosis in Black individuals peaks in the fourth decade of life. A 5-year study in a US health maintenance organization found that the age-adjusted annual incidence was 10.9 per 100,000 cases among Whites and 35.5 per 100,000 cases among Blacks.4
Key clinical features in people with darker skin tones:
• Papules are seen in sarcoidosis, primarily on the face, and may start as orange hued or yellow-brown and then become brown-red or pink to violaceous before involuting into faint macules.5-7
• When round or oval sarcoid plaques appear, they often are more erythematous.
• In skin of color, plaques may become hypopigmented.8
• Erythema nodosum, the most common nonspecific cutaneous lesion seen in sarcoidosis, is less commonly seen in those of African and Asian descent.9-11 This is in contrast to distinctive forms of specific sarcoid skin lesions such as lupus pernio and scar sarcoidosis, as well as papules and plaques and minor forms of specific sarcoid skin lesions including subcutaneous nodules; hypopigmented macules; psoriasiform lesions; and ulcerative, localized erythrodermic, ichthyosiform, scalp, and nail lesions.
• Lupus pernio is a cutaneous manifestation of sarcoidosis that appears on the face. It looks similar to lupus erythematosus and occurs most commonly in women of African descent.8,12
• Hypopigmented lesions are more common in those with darker skin tones.9
• Ulcerative lesions are more common in those of African descent and women.13
• Scalp sarcoidosis is more common in patients of African descent.14
• Sarcoidosis may develop at sites of trauma, such as scars and tattoos.15-17
Worth noting
The cutaneous lesions seen in sarcoidosis may be emotionally devastating and disfiguring. Due to the variety of clinical manifestations, sarcoidosis may be misdiagnosed, leading to delays in treatment.18
Health disparity highlight
Patients older than 40 years presenting with sarcoidosis and those of African descent have a worse prognosis.19 Despite adjustment for race, ethnic group, age, and sex, patients with low income and financial barriers present with more severe sarcoidosis.20
1. Nardi A, Brillet P-Y, Letoumelin P, et al. Stage IV sarcoidosis: comparison of survival with the general population and causes of death. Eur Respir J. 2011;38:1368-1373.
2. Heath CR, David J, Taylor SC. Sarcoidosis: are there differences in your skin of color patients? J Am Acad Dermatol. 2012;66: 121.e1-121.e14.
3. Sève P, Pacheco Y, Durupt F, et al. Sarcoidosis: a clinical overview from symptoms to diagnosis. Cells. 2021;10:766. doi:10.3390/ cells10040766
4. Rybicki BA, Major M, Popovich J Jr, et al. Racial differences in sarcoidosis incidence: a 5-year study in a health maintenance organization. Am J Epidemiol. 1997;145:234-241. doi:10.1093/ oxfordjournals.aje.a009096
5. Mahajan VK, Sharma NL, Sharma RC, et al. Cutaneous sarcoidosis: clinical profile of 23 Indian patients. Indian J Dermatol Venerol Leprol. 2007;73:16-21.
6. Yanardag H, Pamuk ON, Karayel T. Cutaneous involvement in sarcoidosis: analysis of features in 170 patients. Respir Med. 2003;97:978-982.
7. Olive KE, Kartaria YP. Cutaneous manifestations of sarcoidosis to other organ system involvement, abnormal laboratory measurements, and disease course. Arch Intern Med. 1985;145:1811-1814.
8. Mañá J, Marcoval J, Graells J, et al. Cutaneous involvement in sarcoidosis. relationship to systemic disease. Arch Dermatol. 1997;133:882-888. doi:10.1001/archderm.1997.03890430098013
9. Minus HR, Grimes PE. Cutaneous manifestations of sarcoidosis in blacks. Cutis. 1983;32:361-364.
10. Edmondstone WM, Wilson AG. Sarcoidosis in Caucasians, blacks and Asians in London. Br J Dis Chest. 1985;79:27-36.
11. James DG, Neville E, Siltzbach LE. Worldwide review of sarcoidosis. Ann N Y Acad Sci. 1976;278:321-334.
12. Hunninghake GW, Costabel U, Ando M, et al. ATS/ERS/WASOG statement on sarcoidosis. American Thoracic Society/European Respiratory Society/World Association of Sarcoidosis and other Granulomatous Disorders. Sarcoidosis Vasc Diffuse Lung Dis. 1999;16:149-173.
13. Albertini JG, Tyler W, Miller OF III. Ulcerative sarcoidosis: case report and review of literature. Arch Dermatol. 1997;133:215-219.
14. Marchell RM, Judson MA. Chronic cutaneous lesions of sarcoidosis. Clin Dermatol. 2007;25:295-302.
15. Nayar M. Sarcoidosis on ritual scarification. Int J Dermatol. 1993;32:116-118.
16. Chudomirova K, Velichkva L, Anavi B. Recurrent sarcoidosis in skin scars accompanying systemic sarcoidosis. J Eur Acad Dermatol Venerol. 2003;17:360-361.
17. Kim YC, Triffet MK, Gibson LE. Foreign bodies in sarcoidosis. Am J Dermatopathol. 2000;22:408-412.
18. Iannuzzi MC, Rybicki BA, Teirstein AS. Sarcoidosis. N Engl J Med. 2007; 357:2153-2165.
19. Nunes H, Bouvry D, Soler P, et al. Sarcoidosis. Orphanet J Rare Dis. 2007;2:46. doi:10.1186/1750-1172-2-46
20. Baughman RP, Teirstein AS, Judson MA, et al. Clinical characteristics of patients in a case control study of sarcoidosis. Am J Respir Crit Care Med. 2001;164:1885-1889.
THE COMPARISON
A Pink, elevated, granulomatous, indurated plaques on the face, including the nasal alae, of a 52-year-old woman with a darker skin tone.
B Orange and pink, elevated, granulomatous, indurated plaques on the face of a 55-year-old woman with a lighter skin tone.
Sarcoidosis is a granulomatous disease that may affect the skin in addition to multiple body organ systems, including the lungs. Bilateral hilar adenopathy on a chest radiograph is the most common finding. Sarcoidosis also has a variety of cutaneous manifestations. Early diagnosis is vital, as patients with sarcoidosis and pulmonary fibrosis have a shortened life span compared to the overall population.1 With a growing skin of color population, it is important to recognize sarcoidosis as soon as possible.2
Epidemiology
People of African descent have the highest sarcoidosis prevalence in the United States.3 In the United States, the incidence of sarcoidosis in Black individuals peaks in the fourth decade of life. A 5-year study in a US health maintenance organization found that the age-adjusted annual incidence was 10.9 per 100,000 cases among Whites and 35.5 per 100,000 cases among Blacks.4
Key clinical features in people with darker skin tones:
• Papules are seen in sarcoidosis, primarily on the face, and may start as orange hued or yellow-brown and then become brown-red or pink to violaceous before involuting into faint macules.5-7
• When round or oval sarcoid plaques appear, they often are more erythematous.
• In skin of color, plaques may become hypopigmented.8
• Erythema nodosum, the most common nonspecific cutaneous lesion seen in sarcoidosis, is less commonly seen in those of African and Asian descent.9-11 This is in contrast to distinctive forms of specific sarcoid skin lesions such as lupus pernio and scar sarcoidosis, as well as papules and plaques and minor forms of specific sarcoid skin lesions including subcutaneous nodules; hypopigmented macules; psoriasiform lesions; and ulcerative, localized erythrodermic, ichthyosiform, scalp, and nail lesions.
• Lupus pernio is a cutaneous manifestation of sarcoidosis that appears on the face. It looks similar to lupus erythematosus and occurs most commonly in women of African descent.8,12
• Hypopigmented lesions are more common in those with darker skin tones.9
• Ulcerative lesions are more common in those of African descent and women.13
• Scalp sarcoidosis is more common in patients of African descent.14
• Sarcoidosis may develop at sites of trauma, such as scars and tattoos.15-17
Worth noting
The cutaneous lesions seen in sarcoidosis may be emotionally devastating and disfiguring. Due to the variety of clinical manifestations, sarcoidosis may be misdiagnosed, leading to delays in treatment.18
Health disparity highlight
Patients older than 40 years presenting with sarcoidosis and those of African descent have a worse prognosis.19 Despite adjustment for race, ethnic group, age, and sex, patients with low income and financial barriers present with more severe sarcoidosis.20
1. Nardi A, Brillet P-Y, Letoumelin P, et al. Stage IV sarcoidosis: comparison of survival with the general population and causes of death. Eur Respir J. 2011;38:1368-1373.
2. Heath CR, David J, Taylor SC. Sarcoidosis: are there differences in your skin of color patients? J Am Acad Dermatol. 2012;66: 121.e1-121.e14.
3. Sève P, Pacheco Y, Durupt F, et al. Sarcoidosis: a clinical overview from symptoms to diagnosis. Cells. 2021;10:766. doi:10.3390/ cells10040766
4. Rybicki BA, Major M, Popovich J Jr, et al. Racial differences in sarcoidosis incidence: a 5-year study in a health maintenance organization. Am J Epidemiol. 1997;145:234-241. doi:10.1093/ oxfordjournals.aje.a009096
5. Mahajan VK, Sharma NL, Sharma RC, et al. Cutaneous sarcoidosis: clinical profile of 23 Indian patients. Indian J Dermatol Venerol Leprol. 2007;73:16-21.
6. Yanardag H, Pamuk ON, Karayel T. Cutaneous involvement in sarcoidosis: analysis of features in 170 patients. Respir Med. 2003;97:978-982.
7. Olive KE, Kartaria YP. Cutaneous manifestations of sarcoidosis to other organ system involvement, abnormal laboratory measurements, and disease course. Arch Intern Med. 1985;145:1811-1814.
8. Mañá J, Marcoval J, Graells J, et al. Cutaneous involvement in sarcoidosis. relationship to systemic disease. Arch Dermatol. 1997;133:882-888. doi:10.1001/archderm.1997.03890430098013
9. Minus HR, Grimes PE. Cutaneous manifestations of sarcoidosis in blacks. Cutis. 1983;32:361-364.
10. Edmondstone WM, Wilson AG. Sarcoidosis in Caucasians, blacks and Asians in London. Br J Dis Chest. 1985;79:27-36.
11. James DG, Neville E, Siltzbach LE. Worldwide review of sarcoidosis. Ann N Y Acad Sci. 1976;278:321-334.
12. Hunninghake GW, Costabel U, Ando M, et al. ATS/ERS/WASOG statement on sarcoidosis. American Thoracic Society/European Respiratory Society/World Association of Sarcoidosis and other Granulomatous Disorders. Sarcoidosis Vasc Diffuse Lung Dis. 1999;16:149-173.
13. Albertini JG, Tyler W, Miller OF III. Ulcerative sarcoidosis: case report and review of literature. Arch Dermatol. 1997;133:215-219.
14. Marchell RM, Judson MA. Chronic cutaneous lesions of sarcoidosis. Clin Dermatol. 2007;25:295-302.
15. Nayar M. Sarcoidosis on ritual scarification. Int J Dermatol. 1993;32:116-118.
16. Chudomirova K, Velichkva L, Anavi B. Recurrent sarcoidosis in skin scars accompanying systemic sarcoidosis. J Eur Acad Dermatol Venerol. 2003;17:360-361.
17. Kim YC, Triffet MK, Gibson LE. Foreign bodies in sarcoidosis. Am J Dermatopathol. 2000;22:408-412.
18. Iannuzzi MC, Rybicki BA, Teirstein AS. Sarcoidosis. N Engl J Med. 2007; 357:2153-2165.
19. Nunes H, Bouvry D, Soler P, et al. Sarcoidosis. Orphanet J Rare Dis. 2007;2:46. doi:10.1186/1750-1172-2-46
20. Baughman RP, Teirstein AS, Judson MA, et al. Clinical characteristics of patients in a case control study of sarcoidosis. Am J Respir Crit Care Med. 2001;164:1885-1889.

COVID brain fog is a ‘true neurologic condition’
early research suggests. Investigators found abnormalities in cerebrospinal fluid (CSF) and other risk factors, including diabetes and hypertension, present in individuals with mild COVID-19 experiencing persistent cognitive problems, often referred to as “brain fog.”
“We’re seeing changes to the [CSF] in the brain of most people who report cognitive changes,” said Joanna Hellmuth, MD, assistant professor of neurology, Memory and Aging Center, University of California, San Francisco. “We’re just in the beginning stages, but I hope this study will provide some legitimacy to this being a true neurologic condition.”
The study was published online Jan. 18, 2022, in Annals of Clinical and Translational Neurology.
No guidance
There is currently no guidance on how to identify patients with COVID-related cognitive changes, said Dr. Hellmuth. “The term ‘brain fog’ is not based in science or medicine, but that’s the most common term we use to describe this.”
The analysis included adults with confirmed SARS-CoV-2 infection not requiring hospitalization who were enrolled in the Long-term Impact of Infection with Novel Coronavirus study.
Participants underwent a structured interview that covered COVID-19 illness, past medical history, preexisting cognitive risk factors, medications, and cognitive symptoms following onset of COVID-19. They also completed an in-person battery of cognitive tests.
The analysis included 22 participants with at least one new cognitive symptom who had cognitive post-acute sequelae of SARS-CoV-2 infection (PASC). Ten cognitive controls reported no new cognitive symptoms after acute infection.
Participants were a median age of 41 years, had a median of 16 years of education, and were assessed a median of 10.1 months from their first COVID-19 symptom. There were no group differences in terms of age, gender, years of education, or distribution of race/ethnicity (all P > .05).
Among those with cognitive PASC, 43% reported cognitive symptoms starting 1 or more months after the first COVID symptom. About 29% reported cognitive changes started 2 or more months after their first COVID symptom.
“The immune system could be altered in some way after the infection, and perhaps that’s what’s contributing to these delayed onset cognitive changes,” said Dr. Hellmuth.
Compared with controls, participants with cognitive PASC had more preexisting cognitive risk factors (a median of 2.5 vs. 0; P = .03). These included hypertension and diabetes, which increase the risk of stroke, mild cognitive impairment, vascular dementia, traumatic brain injury, (TBI), learning disabilities, anxiety, depression, stimulant use, and ADHD, which may make the brain more vulnerable to executive functioning problems.
Dr. Hellmuth noted that the study wasn’t powered to determine whether any individual risk factor was associated with risk of cognitive changes.
As there are no published neuropsychological testing criteria for cognitive PASC, the researchers applied the equivalent criteria for HIV-associated neurocognitive disorder (HAND), a similar, virally associated cognitive disorder. Only 59% of those with cognitive PASC met equivalent HAND criteria for objective cognitive impairment versus 70% of cognitive controls. This, the investigators noted, highlights “the challenges and incongruities of using subjective, versus objective cognitive assessments for diagnosis.”
Is self-report enough?
While there is currently “nothing objective doctors can hang their hats on to say ‘you do’ or ‘you don’t’ have cognitive changes related to COVID,” using the HAND criteria is “not particularly helpful,” said Dr. Hellmuth. “Comparing an individual to a population-based norm in this case is really nuanced, and we shouldn’t rely on this solely to determine whether they do, or don’t, have cognitive changes.”
Perhaps self-reports in this case are “enough” said Dr. Hellmuth. “People know their brains better than anyone else, better than any doctor will.”
A total of 13 in the cognitive PASC group and 4 in the control group consented to a lumbar puncture. Cognitive PASC participants were older than controls (median of 47 vs. 28 years; P = .03) with no other between-group differences.
Overall, 77% of participants with cognitive PASC had a CSF abnormality, compared with 0% of cognitive controls (P = .01). CSF abnormalities included elevated protein levels with no other explainable cause in 2 of the 13 subjects with PASC, which Dr. Hellmuth said is typically a marker of inflammation.
Researchers also noted abnormal oligoclonal banding, a collection of antibodies, in the blood or brain fluid. These were identified in 69% of participants with cognitive PASC, compared with 0% of cognitive controls (P = .03).
“When we find this pattern in both blood and brain, it suggests a systemic inflammatory disorder,” although “we have no idea what these antibodies are targeting,” said Dr. Hellmuth.
The study represents “the very beginning stages” of PASC becoming a medical diagnosis “where doctors know what to call it, how to treat it, and how to do blood and cerebrospinal fluid tests to diagnose it,” said Dr. Hellmuth.
She hopes PASC will receive medical legitimacy just as TBI has. In years past, a player was hit on the head or had their “bell rung,” simply returned to the field. “Now that we understand the science, we call it a mild TBI or concussion, and we have a very different medical approach to it.”
A limitation of the study was the small sample size, which may hinder the results’ validity. In addition, the study demographics may not reflect the broader population of those impacted by PASC.
‘A first substantial step’
Commenting on the research, William Schaffner, MD, professor, division of infectious diseases, Vanderbilt University Medical Center, Nashville, Tenn., said the new results represent “a first substantial step on the road to trying to find out what’s going on” with COVID patients dealing with cognitive issues.
Dr. Schaffner noted that elevated protein levels, identified in some study subjects, “is usually a consequence of previous inflammation” and is “a very interesting” finding. “In people who are otherwise normal, if you do a lumbar puncture, you don’t find elevated proteins.”
However, he noted the “diversity of results” from CSF examinations. “A single pattern does not leap out.”
What the researchers are observing “is not just a phenomenon of the mind or just something psychological,” said Dr. Schaffner. “Something physical is going on here.”
The study was funded by grants from the National Institute of Mental Health and the National Institute of Neurological Disorders and Stroke. Dr. Hellmuth received grant support from the National Institutes of Health/NIMH supporting this work and personal fees for medical-legal consultation outside of the submitted work. Dr. Schaffner has disclosed not relevant financial relationships.
A version of this article first appeared on Medscape.com.
FROM ANNALS OF CLINICAL AND TRANSLATIONAL NEUROLOGY
Watch, but don’t worry yet, about new Omicron subvariant
In the meantime, it’s worth watching BA.2, the World Health Organization said. The subvariant has been identified across at least 40 countries, including three cases reported in Houston and several in Washington state.
BA.2 accounts for only a small minority of reported cases so far, including 5% in India, 4% of those in the United Kingdom, and 2% each of cases in Sweden and Singapore.
The one exception is Denmark, a country with robust genetic sequencing abilities, where estimates range from 50% to 81% of cases.
The news throws a little more uncertainty into an already uncertain situation, including how close the world might be to a less life-altering infectious disease.
For example, the world is at an ideal point for a new variant to emerge, WHO Director General Tedros Adhanom Ghebreyesus, PhD, said during a Jan. 24 meeting of the WHO executive board. He also said it’s too early to call an “end game” to the pandemic.
Similarly, Anthony S. Fauci, MD, said on Jan. 19 that it remained “an open question” whether the Omicron variant could hasten endemic COVID-19, a situation where the virus still circulates but is much less disruptive to everyday life.
No Pi for you
This could be the first time a coronavirus subvariant rises to the level of a household name, or – if previous variants of the moment have shown us – it could recede from the spotlight.
For example, a lot of focus on the potential of the Mu variant to wreak havoc fizzled out a few weeks after the WHO listed it as a variant of interest on Aug. 30.
Subvariants can feature mutations and other small differences but are not distinct enough from an existing strain to be called a variant on their own and be named after the next letter in the Greek alphabet. That’s why BA.2 is not called the “Pi variant.”
Predicting what’s next for the coronavirus has puzzled many experts throughout the pandemic. That is why many public health officials wait for the WHO to officially designate a strain as a variant of interest or variant of concern before taking action.
At the moment with BA.2, it seems close monitoring is warranted.
Because it’s too early to call, expert predictions about BA.2 vary widely, from worry to cautious optimism.
For example, early data indicates that BA.2 could be more worrisome than original Omicron, Eric Feigl-Ding, ScD, an epidemiologist and health economist, said on Twitter.
Information from Denmark seems to show BA.2 either has “much faster transmission or it evades immunity even more,” he said.
The same day, Jan. 23, Dr. Feigl-Ding tweeted that other data shows the subvariant can spread twice as fast as Omicron, which was already much more contagious than previous versions of the virus.
At the same time, other experts appear less concerned. Robert Garry, PhD, a virologist at Tulane University, New Orleans, told the Washington Post that there is no reason to think BA.2 will be any worse than the original Omicron strain.
So which expert predictions will come closer to BA.2’s potential? For now, it’s just a watch-and-see situation.
For updated information, the website outbreak.info tracks BA.2’s average daily and cumulative prevalence in the United States and in other locations.
Also, if and when WHO experts decide to elevate BA.2 to a variant of interest or a variant of concern, it will be noted on its coronavirus variant tracking website.
A version of this article first appeared on WebMD.com.
Is it time to approach spontaneous pneumothorax more conservatively?
ILLUSTRATIVE CASE
A 26-year-old man presents to the emergency department complaining of sudden-onset left-side chest pain and mild dyspnea that started while he was playing basketball. He denies any medical problems and takes no medications. He is able to speak in complete sentences as he answers your questions. His O2 saturation is 95% and a chest x-ray reveals a left-side, moderate-to-large pneumothorax.
A primary spontaneous pneumothorax is one that occurs in the absence of underlying clinical lung disease and is not associated with an inciting cause, such as a rib fracture.2 In the United States, the estimated incidence of primary spontaneous pneumothorax is 7.4 cases per 100,000 men and 1.2 cases per 100,000 women.3 The etiology is often unknown, but it is associated with several risk factors, including male sex, smoking, and a tall, thin body habitus.2
The management strategy for stable patients with a primary spontaneous pneumothorax largely depends on pneumothorax size and institutional practice. Multiple methods define pneumothorax size; the US standard cutoff for a small or large pneumothorax is 3 cm, between the pleural line and chest wall at the level of the apex,4 compared with 2 cm in Europe, when evaluating the distance at the hilum in an upright chest radiograph.5 The Collins method uses a formula to calculate the percentage of lung area affected based on 3 distinct measurements on a posterior/anterior upright chest radiograph.6
Management options include observation, supplemental oxygen, simple aspiration, and thoracostomy or chest tube placement. British Thoracic Society guidelines published in 2010 state that only a small pneumothorax can be managed conservatively with observation alone; for a large pneumothorax, the guidelines recommend needle aspiration to achieve lung reinflation, followed by chest tube placement if unsuccessful.5
In practice, management of a large primary spontaneous pneumothorax varies, but the most common treatment is chest tube placement.7 This procedure can be painful and may result in complications such as bleeding, infection, injury to internal structures, or the need for surgical intervention.7 In addition, once a chest tube is placed, hospital admission ensues, lasting an average of 4 days.8 Given these consequences, there is a need for safe and feasible treatment options for a large primary spontaneous pneumothorax.
STUDY SUMMARY
Observational management judged noninferior, with multiple advantages
The Primary Spontaneous Pneumothorax (PSP) trial was a prospective noninferiority trial conducted at 39 hospitals in Australia and New Zealand. This randomized controlled trial compared observational (“watch and wait”) vs interventional (chest tube placement) management of uncomplicated, unilateral, primary spontaneous pneumothorax. Patients ages 14 to 50 years with a moderate-to-large pneumothorax—32% or greater, as defined by the Collins method4—were randomly assigned to a study group to examine the primary outcome of lung reexpansion at 8 weeks.
The intervention included chest tube insertion attached to an underwater seal without suction for 1 hour, followed by an x-ray and clamping for 4 hours if there was no air leak, followed by a repeat chest x-ray. If there was no evidence of radiographic resolution, or if during observation the pneumothorax recurred, the underwater seal was recommenced and the patient was admitted to the hospital, with further intervention at the discretion of the inpatient clinicians. If radiographic improvement was seen, the tube was removed and the patient discharged.
Continue to: In contrast...
In contrast, conservative management entailed patient observation for at least 4 hours followed by a repeat chest x-ray. If after the observation period, patients were walking comfortably and without supplemental oxygen, they were discharged. Patients in the observation group underwent an intervention if they met a variety of criteria, including unstable vitals or an enlarging pneumothorax. All patients received standard care with analgesia and supplemental oxygen as needed.
A total of 316 patients were randomized, with 154 assigned to the intervention group and 162 to the observation group. The mean age for all participants was 26. Most patients were male (84.4% in the intervention group and 87.7% in the observation group) and almost half were current smokers (49.3% in the intervention and 42.5% in the observation group). The mean body mass index of participants was 21.4 in the intervention and 21.3 in the observation group. Twenty-five patients (15%) in the observation group underwent interventions for reasons specified in the research protocol (eg, “significant symptoms” such as abnormal physiologic observations and intolerable symptoms, or patient unwillingness to continue in the assigned group), and 10 patients assigned to the intervention group declined treatment.
Using a complete-case analysis, 129 of 131 patients (98.5%) in the intervention group and 118 of 125 patients (94.4%) in the observation group met the primary outcome of radiographic resolution within 8 weeks (risk difference [RD] = –4.1%; 95% CI, –8.6 to 0.5), thereby falling within the prespecified margin for noninferiority of less than 9%.
Per-protocol analysis at 8 weeks also proved observational management noninferior, with 124 of 126 patients (98.4%) in the intervention group and 123 of 130 patients (94.6%) in the observation group achieving lung reexpansion within 8 weeks (RD = –3.8%; 95% CI, –8.3 to 0.7). The time to symptom resolution was similar between groups, with a median time of 15.5 days in the intervention group compared with 14 days in the observation group (hazard ratio = 1.11; 95% CI, 0.88-1.4). A lower risk of serious adverse events (relative risk [RR] = 3.3; 95% CI, 1.37-8.1) and pneumothorax recurrence (absolute RD = 8%; 95% CI, 0.5-15.4) occurred in the observation group vs the intervention group. The average length of hospital stay for patients in the intervention group was 6.1 days, vs 1.6 days in the observation group (RR = 2.8; 95% CI, 1.8-3.6).
Two additional sensitivity analyses were performed because multiple study participants were lost to follow-up or had data collected after 8 weeks. Noninferiority was maintained when data collected after the 8-week visit were included and extended to 63 days (RD = –3.7%: 95% CI, –7.9 to 0.6). However, noninferiority was lost when missing data after 8 weeks were deemed “treatment failure” (RD = –11%; 95% CI, –18.4 to –3.5).
Continue to: WHAT'S NEW
WHAT’S NEW
Conservative management enabled most patients to avoid invasive Tx risks
In this specific patient population, conservative management of primary spontaneous pneumothorax was noninferior to interventional management and had a lower risk of serious adverse events. This management practice spared 85% of the patients from invasive intervention. As a result, they experienced a shortened hospital stay, fewer days missed from school or work, less exposure to radiation from repeat chest x-rays, and a lower rate of adverse events. Additionally, fewer of these patients had early pneumothorax recurrence.
CAVEATS
There were limitations in the trial’s original statistical design
This study had a specific follow-up timetable, and some of the participants were not examined until after the 8-week checkpoint or were lost to follow-up entirely. The authors attempted to address these limitations (and show transparency) by providing additional sensitivity analyses as well as providing the intention-to-treat and per-protocol analyses for the primary outcome at 8 weeks. Noninferiority was maintained in all analyses except for the sensitivity analysis that treated missing data as treatment failure. Therefore, the authors note these approaches result in “statistical fragility” and are exploratory.
CHALLENGES TO IMPLEMENTATION
Pneumothorax is not commonly seen in outpatient settings
Family physicians working in outpatient settings generally do not encounter pneumothorax and, using current guidelines, would refer for emergency or inpatient care. This study opens the possibility of managing selected patients in an outpatient setting; however, this would require at least a 4-hour period of observation, which may be impractical for many outpatient-based physicians. Additionally, the study uses the Collins method to define moderate-to-large pneumothorax, which is likely an uncommon practice and thus not applicable in most primary care settings.
ACKNOWLEDGEMENT
The PURLs Surveillance System was supported in part by Grant Number UL1RR024999 from the National Center for Research Resources, a Clinical Translational Science Award to the University of Chicago. The content is solely the responsibility of the authors and does not necessarily represent the official views of the National Center for Research Resources or the National Institutes of Health.
1. Brown SGA, Ball EL, Perrin K, et al; PSP Investigators. Conservative versus interventional treatment for spontaneous pneumothorax. N Engl J Med. 2020;382:405-415. doi: 10.1056/NEJMoa1910775
2. Hallifax RJ, Goldacre R, Landray MJ, et al. Trends in the incidence and recurrence of inpatient-treated spontaneous pneumothorax, 1968-2016. JAMA. 2018;320:1471-1480. doi: 10.1001/jama.2018.14299
3. Melton LJ III, Hepper NGG, Offord KP. Incidence of spontaneous pneumothorax in Olmstead County, Minnesota: 1950 to 1974. Am Rev Respir Dis. 1979;120:1379-1382. doi: 10.1164/arrd.1979.120.6.1379
4. Baumann MH, Strange C, Heffner JE, et al; AACP Pneumothorax Consensus Group. Management of spontaneous pneumothorax: an American College of Chest Physicians Delphi consensus statement. Chest. 2001;119:590-602. doi: 10.1378/chest.119.2.590
5. MacDuff A, Arnold A, Harvey J; BTS Pleural Disease Guideline Group. Management of spontaneous pneumothorax: British Thoracic Society Pleural Disease Guideline 2010. Thorax. 2010;65(suppl):ii18-ii31. doi: 10.1136/thx.2010.136986
6. Collins CD, Lopez A, Mathie A, et al. Quantification of pneumothorax size on chest radiographs using interpleural distances: regression analysis based on volume measurements from helical CT. Am J Roentgenol. 1995;165:1127-1130. doi: 10.2214/ajr.165.5.7572489
7. Kwiatt M, Tarbox A, Seamon MJ, et al. Thoracostomy tubes: a comprehensive review of complications and related topics. Int J Crit Illn Inj Sci. 2014;4:143-155. doi: 10.4103/2229-5151.134182
8. Maskell NA, Medford A, Gleeson FV. Seldinger chest drain insertion: simpler but not necessarily safer. Thorax. 2010;65:5-6. doi: 10.1136/thx.2009.117200
ILLUSTRATIVE CASE
A 26-year-old man presents to the emergency department complaining of sudden-onset left-side chest pain and mild dyspnea that started while he was playing basketball. He denies any medical problems and takes no medications. He is able to speak in complete sentences as he answers your questions. His O2 saturation is 95% and a chest x-ray reveals a left-side, moderate-to-large pneumothorax.
A primary spontaneous pneumothorax is one that occurs in the absence of underlying clinical lung disease and is not associated with an inciting cause, such as a rib fracture.2 In the United States, the estimated incidence of primary spontaneous pneumothorax is 7.4 cases per 100,000 men and 1.2 cases per 100,000 women.3 The etiology is often unknown, but it is associated with several risk factors, including male sex, smoking, and a tall, thin body habitus.2
The management strategy for stable patients with a primary spontaneous pneumothorax largely depends on pneumothorax size and institutional practice. Multiple methods define pneumothorax size; the US standard cutoff for a small or large pneumothorax is 3 cm, between the pleural line and chest wall at the level of the apex,4 compared with 2 cm in Europe, when evaluating the distance at the hilum in an upright chest radiograph.5 The Collins method uses a formula to calculate the percentage of lung area affected based on 3 distinct measurements on a posterior/anterior upright chest radiograph.6
Management options include observation, supplemental oxygen, simple aspiration, and thoracostomy or chest tube placement. British Thoracic Society guidelines published in 2010 state that only a small pneumothorax can be managed conservatively with observation alone; for a large pneumothorax, the guidelines recommend needle aspiration to achieve lung reinflation, followed by chest tube placement if unsuccessful.5
In practice, management of a large primary spontaneous pneumothorax varies, but the most common treatment is chest tube placement.7 This procedure can be painful and may result in complications such as bleeding, infection, injury to internal structures, or the need for surgical intervention.7 In addition, once a chest tube is placed, hospital admission ensues, lasting an average of 4 days.8 Given these consequences, there is a need for safe and feasible treatment options for a large primary spontaneous pneumothorax.
STUDY SUMMARY
Observational management judged noninferior, with multiple advantages
The Primary Spontaneous Pneumothorax (PSP) trial was a prospective noninferiority trial conducted at 39 hospitals in Australia and New Zealand. This randomized controlled trial compared observational (“watch and wait”) vs interventional (chest tube placement) management of uncomplicated, unilateral, primary spontaneous pneumothorax. Patients ages 14 to 50 years with a moderate-to-large pneumothorax—32% or greater, as defined by the Collins method4—were randomly assigned to a study group to examine the primary outcome of lung reexpansion at 8 weeks.
The intervention included chest tube insertion attached to an underwater seal without suction for 1 hour, followed by an x-ray and clamping for 4 hours if there was no air leak, followed by a repeat chest x-ray. If there was no evidence of radiographic resolution, or if during observation the pneumothorax recurred, the underwater seal was recommenced and the patient was admitted to the hospital, with further intervention at the discretion of the inpatient clinicians. If radiographic improvement was seen, the tube was removed and the patient discharged.
Continue to: In contrast...
In contrast, conservative management entailed patient observation for at least 4 hours followed by a repeat chest x-ray. If after the observation period, patients were walking comfortably and without supplemental oxygen, they were discharged. Patients in the observation group underwent an intervention if they met a variety of criteria, including unstable vitals or an enlarging pneumothorax. All patients received standard care with analgesia and supplemental oxygen as needed.
A total of 316 patients were randomized, with 154 assigned to the intervention group and 162 to the observation group. The mean age for all participants was 26. Most patients were male (84.4% in the intervention group and 87.7% in the observation group) and almost half were current smokers (49.3% in the intervention and 42.5% in the observation group). The mean body mass index of participants was 21.4 in the intervention and 21.3 in the observation group. Twenty-five patients (15%) in the observation group underwent interventions for reasons specified in the research protocol (eg, “significant symptoms” such as abnormal physiologic observations and intolerable symptoms, or patient unwillingness to continue in the assigned group), and 10 patients assigned to the intervention group declined treatment.
Using a complete-case analysis, 129 of 131 patients (98.5%) in the intervention group and 118 of 125 patients (94.4%) in the observation group met the primary outcome of radiographic resolution within 8 weeks (risk difference [RD] = –4.1%; 95% CI, –8.6 to 0.5), thereby falling within the prespecified margin for noninferiority of less than 9%.
Per-protocol analysis at 8 weeks also proved observational management noninferior, with 124 of 126 patients (98.4%) in the intervention group and 123 of 130 patients (94.6%) in the observation group achieving lung reexpansion within 8 weeks (RD = –3.8%; 95% CI, –8.3 to 0.7). The time to symptom resolution was similar between groups, with a median time of 15.5 days in the intervention group compared with 14 days in the observation group (hazard ratio = 1.11; 95% CI, 0.88-1.4). A lower risk of serious adverse events (relative risk [RR] = 3.3; 95% CI, 1.37-8.1) and pneumothorax recurrence (absolute RD = 8%; 95% CI, 0.5-15.4) occurred in the observation group vs the intervention group. The average length of hospital stay for patients in the intervention group was 6.1 days, vs 1.6 days in the observation group (RR = 2.8; 95% CI, 1.8-3.6).
Two additional sensitivity analyses were performed because multiple study participants were lost to follow-up or had data collected after 8 weeks. Noninferiority was maintained when data collected after the 8-week visit were included and extended to 63 days (RD = –3.7%: 95% CI, –7.9 to 0.6). However, noninferiority was lost when missing data after 8 weeks were deemed “treatment failure” (RD = –11%; 95% CI, –18.4 to –3.5).
Continue to: WHAT'S NEW
WHAT’S NEW
Conservative management enabled most patients to avoid invasive Tx risks
In this specific patient population, conservative management of primary spontaneous pneumothorax was noninferior to interventional management and had a lower risk of serious adverse events. This management practice spared 85% of the patients from invasive intervention. As a result, they experienced a shortened hospital stay, fewer days missed from school or work, less exposure to radiation from repeat chest x-rays, and a lower rate of adverse events. Additionally, fewer of these patients had early pneumothorax recurrence.
CAVEATS
There were limitations in the trial’s original statistical design
This study had a specific follow-up timetable, and some of the participants were not examined until after the 8-week checkpoint or were lost to follow-up entirely. The authors attempted to address these limitations (and show transparency) by providing additional sensitivity analyses as well as providing the intention-to-treat and per-protocol analyses for the primary outcome at 8 weeks. Noninferiority was maintained in all analyses except for the sensitivity analysis that treated missing data as treatment failure. Therefore, the authors note these approaches result in “statistical fragility” and are exploratory.
CHALLENGES TO IMPLEMENTATION
Pneumothorax is not commonly seen in outpatient settings
Family physicians working in outpatient settings generally do not encounter pneumothorax and, using current guidelines, would refer for emergency or inpatient care. This study opens the possibility of managing selected patients in an outpatient setting; however, this would require at least a 4-hour period of observation, which may be impractical for many outpatient-based physicians. Additionally, the study uses the Collins method to define moderate-to-large pneumothorax, which is likely an uncommon practice and thus not applicable in most primary care settings.
ACKNOWLEDGEMENT
The PURLs Surveillance System was supported in part by Grant Number UL1RR024999 from the National Center for Research Resources, a Clinical Translational Science Award to the University of Chicago. The content is solely the responsibility of the authors and does not necessarily represent the official views of the National Center for Research Resources or the National Institutes of Health.
1. Brown SGA, Ball EL, Perrin K, et al; PSP Investigators. Conservative versus interventional treatment for spontaneous pneumothorax. N Engl J Med. 2020;382:405-415. doi: 10.1056/NEJMoa1910775
2. Hallifax RJ, Goldacre R, Landray MJ, et al. Trends in the incidence and recurrence of inpatient-treated spontaneous pneumothorax, 1968-2016. JAMA. 2018;320:1471-1480. doi: 10.1001/jama.2018.14299
3. Melton LJ III, Hepper NGG, Offord KP. Incidence of spontaneous pneumothorax in Olmstead County, Minnesota: 1950 to 1974. Am Rev Respir Dis. 1979;120:1379-1382. doi: 10.1164/arrd.1979.120.6.1379
4. Baumann MH, Strange C, Heffner JE, et al; AACP Pneumothorax Consensus Group. Management of spontaneous pneumothorax: an American College of Chest Physicians Delphi consensus statement. Chest. 2001;119:590-602. doi: 10.1378/chest.119.2.590
5. MacDuff A, Arnold A, Harvey J; BTS Pleural Disease Guideline Group. Management of spontaneous pneumothorax: British Thoracic Society Pleural Disease Guideline 2010. Thorax. 2010;65(suppl):ii18-ii31. doi: 10.1136/thx.2010.136986
6. Collins CD, Lopez A, Mathie A, et al. Quantification of pneumothorax size on chest radiographs using interpleural distances: regression analysis based on volume measurements from helical CT. Am J Roentgenol. 1995;165:1127-1130. doi: 10.2214/ajr.165.5.7572489
7. Kwiatt M, Tarbox A, Seamon MJ, et al. Thoracostomy tubes: a comprehensive review of complications and related topics. Int J Crit Illn Inj Sci. 2014;4:143-155. doi: 10.4103/2229-5151.134182
8. Maskell NA, Medford A, Gleeson FV. Seldinger chest drain insertion: simpler but not necessarily safer. Thorax. 2010;65:5-6. doi: 10.1136/thx.2009.117200
PRACTICE CHANGER
Consider observation rather than chest tube placement for primary, uncomplicated, unilateral moderate-to-large spontaneous pneumothorax in patients ages 14 to 50.
STRENGTH OF RECOMMENDATION
B: Based on a single, lower-quality randomized controlled trial1
Brown SGA, Ball EL, Perrin K, et al; PSP Investigators. Conservative versus interventional treatment for spontaneous pneumothorax. N Engl J Med. 2020;382:405-415. doi: 10.1056/NEJMoa1910775

Medicare NCDs hinder access to cancer biomarker testing for minorities
of data from patients with advanced non–small cell lung cancer (aNSCLC), metastatic colorectal cancer, metastatic breast cancer, or advanced melanoma. The finding was reported in JAMA Network Open.
Biomarker testing has become an essential tool in cancer care over the last decade. In 2011, for example, less than 1% of patients with aNSCLC, metastatic colorectal cancer, metastatic breast cancer, and advanced melanoma underwent NGS testing, but by 2019, 40% of patients with these cancers received the testing.
“Next-generation sequencing testing has become increasingly important because it enables identification of multiple biomarkers simultaneously and efficiently while minimizing the number of biopsies required,” wrote the authors, led by William B. Wong, PharmD, of Genentech.
It has been unknown whether for Medicare beneficiaries and the overall population, if the NCD affected health equity issues, the authors wrote. While increased use of appropriate targeted therapies facilitated by NGS testing is associated with improved survival rates in patients with advanced or metastatic cancer, variability in health care coverage policies has posed a significant barrier to obtaining NGS testing for cancer patients, specifically through policy coverage limitations. It has remained unclear if the NCD has influenced NGS testing coverage in insurance types (for example, Medicaid) encompassing a larger population of minority racial and ethnic groups often experiencing poorer care and outcomes.
The retrospective cohort analysis compared EHR data from 280 U.S. cancer clinics in the (800 sites of care) pre- versus post-NCD period for patients with aNSCLC, metastatic colorectal cancer, metastatic breast cancer, or advanced melanoma (January 2011–March 2020). Nearly 70% of all patients in the study were Medicare recipients who needed NCD approval to cover the cost of testing.
Among 92,687 patients (mean age, 66.6 years; 55.7% women), compared with Medicare beneficiaries, changes in pre- to post-NCD NGS testing trends were similar in commercially insured patients (odds ratio, 1.03; 95% CI, 0.98-1.08; P = .25). Pre- to post-NCD NGS testing trends increased at a slower rate among patients in assistance programs (OR, 0.93; 95% CI, 0.87-0.99; P = .03), compared with Medicare beneficiaries. The rate of increase for patients receiving Medicaid was not significantly different statistically compared with those receiving Medicare (OR, 0.92; 95% CI, 0.84-1.01; P = .07). Also, the NCD was not associated with racial and ethnic groups within Medicare beneficiaries alone or across all insurance types.
Compared with non-Hispanic White individuals, increases in average NGS use from the pre-NCD to post-NCD period were 14% lower (OR, 0.86; 95% CI, 0.74-0.99; P = .04) among African American and 23% lower (OR, 0.77; 95% CI, 0.62-0.96; P = .02) among Hispanic/Latino individuals; increases were similar, however, among Asian individuals and other races and ethnicities.
The authors observed that the post-NCD trend of increasing NGS testing seen in Medicare beneficiaries was similarly observed in those with commercial insurance. Testing rate differences, however, widened or were maintained after versus before the NCD in PAP (personal assistance program) and Medicaid beneficiaries relative to Medicare beneficiaries, suggesting that access to NGS testing did not improve equally across insurance types. Since Medicare coverage is determined at the state level, the authors urged research examining individual state coverage policies to further elucidate factors slowing uptake among Medicaid beneficiaries. “Additional efforts beyond coverage policies,” the authors concluded, “are needed to ensure equitable access to the benefits of precision medicine.”
The study was supported by Genentech.
FROM JAMA NETWORK OPEN
Digital algorithm better predicts risk for postpartum hemorrhage
A digital algorithm using 24 patient characteristics identifies far more women who are likely to develop a postpartum hemorrhage than currently used tools to predict the risk for bleeding after delivery, according to a study published in the Journal of the American Medical Informatics Association.
About 1 in 10 of the roughly 700 pregnancy-related deaths in the United States are caused by postpartum hemorrhage, according to the U.S. Centers for Disease Control and Prevention. These deaths disproportionately occur among Black women, for whom studies show the risk of dying from a postpartum hemorrhage is fivefold greater than that of White women.
“Postpartum hemorrhage is a preventable medical emergency but remains the leading cause of maternal mortality globally,” the study’s senior author Li Li, MD, senior vice president of clinical informatics at Sema4, a company that uses artificial intelligence and machine learning to develop data-based clinical tools, told this news organization. “Early intervention is critical for reducing postpartum hemorrhage morbidity and mortality.”
Porous predictors
Existing tools for risk prediction are not particularly effective, Dr. Li said. For example, the American College of Obstetricians and Gynecologists’ (ACOG) Safe Motherhood Initiative offers checklists of clinical characteristics to classify women as low, medium, or high risk. However, 40% of the women classified as low risk based on this type of tool experience a hemorrhage.
ACOG also recommends quantifying blood loss during delivery or immediately after to identify women who are hemorrhaging, because imprecise estimates from clinicians may delay urgently needed care. Yet many hospitals have not implemented methods for measuring bleeding, said Dr. Li, who also is an assistant professor of genetics and genomic sciences at the Icahn School of Medicine at Mount Sinai, New York.
To develop a more precise way of identifying women at risk, Dr. Li and colleagues turned to artificial intelligence technology to create a “digital phenotype” based on approximately 72,000 births in the Mount Sinai Health System.
The digital tool retrospectively identified about 6,600 cases of postpartum hemorrhage, about 3.8 times the roughly 1,700 cases that would have been predicted based on methods that estimate blood loss. A blinded physician review of a subset of 45 patient charts – including 26 patients who experienced a hemorrhage, 11 who didn’t, and 6 with unclear outcomes – found that the digital approach was 89% percent accurate at identifying cases, whereas blood loss–based methods were accurate 67% of the time.
Several of the 24 characteristics included in the model appear in other risk predictors, including whether a woman has had a previous cesarean delivery or prior postdelivery bleeding and whether she has anemia or related blood disorders. Among the rest were risk factors that have been identified in the literature, including maternal blood pressure, time from admission to delivery, and average pulse during hospitalization. Five more features were new: red blood cell count and distribution width, mean corpuscular hemoglobin, absolute neutrophil count, and white blood cell count.
“These [new] values are easily obtainable from standard blood draws in the hospital but are not currently used in clinical practice to estimate postpartum hemorrhage risk,” Dr. Li said.
In a related retrospective study, Dr. Li and her colleagues used the new tool to classify women into high, low, or medium risk categories. They found that 28% of the women the algorithm classified as high risk experienced a postpartum hemorrhage compared with 15% to 19% of the women classified as high risk by standard predictive tools. They also identified potential “inflection points” where changes in vital signs may suggest a substantial increase in risk. For example, women whose median blood pressure during labor and delivery was above 132 mm Hg had an 11% average increase in their risk for bleeding.
By more precisely identifying women at risk, the new method “could be used to pre-emptively allocate resources that can ultimately reduce postpartum hemorrhage morbidity and mortality,” Dr. Li said. Sema4 is launching a prospective clinical trial to further assess the algorithm, she added.
Finding the continuum of risk
Holly Ende, MD, an obstetric anesthesiologist at Vanderbilt University Medical Center, Nashville, Tenn., said approaches that leverage electronic health records to identify women at risk for hemorrhage have many advantages over currently used tools.
“Machine learning models or statistical models are able to take into account many more risk factors and weigh each of those risk factors based on how much they contribute to risk,” Dr. Ende, who was not involved in the new studies, told this news organization. “We can stratify women more on a continuum.”
But digital approaches have potential downsides.
“Machine learning algorithms can be developed in such a way that perpetuates racial bias, and it’s important to be aware of potential biases in coded algorithms,” Dr. Li said. To help reduce such bias, they used a database that included a racially and ethnically diverse patient population, but she acknowledged that additional research is needed.
Dr. Ende, the coauthor of a commentary in Obstetrics & Gynecology on risk assessment for postpartum hemorrhage, said algorithm developers must be sensitive to pre-existing disparities in health care that may affect the data they use to build the software.
She pointed to uterine atony – a known risk factor for hemorrhage – as an example. In her own research, she and her colleagues identified women with atony by searching their medical records for medications used to treat the condition. But when they ran their model, Black women were less likely to develop uterine atony, which the team knew wasn’t true in the real world. They traced the problem to an existing disparity in obstetric care: Black women with uterine atony were less likely than women of other races to receive medications for the condition.
“People need to be cognizant as they are developing these types of prediction models and be extremely careful to avoid perpetuating any disparities in care,” Dr. Ende cautioned. On the other hand, if carefully developed, these tools might also help reduce disparities in health care by standardizing risk stratification and clinical practices, she said.
In addition to independent validation of data-based risk prediction tools, Dr. Ende said ensuring that clinicians are properly trained to use these tools is crucial.
“Implementation may be the biggest limitation,” she said.
Dr. Ende and Dr. Li have disclosed no relevant financial relationships.
A version of this article first appeared on Medscape.com.
This doc still supports NP/PA-led care ... with caveats
Two years ago, I argued that independent care from nurse practitioners (NPs) and physician assistants (PAs) would not have ill effects on health outcomes. To the surprise of no one, NPs and PAs embraced the argument; physicians clobbered it.
My case had three pegs: One was that medicine isn’t rocket science and clinicians control a lot less than we think we do. The second peg was that technology levels the playing field of clinical care. High-sensitivity troponin assays, for instance, make missing MI a lot less likely. The third peg was empirical: Studies have found little difference in MD versus non–MD-led care. Looking back, I now see empiricism as the weakest part of the argument because the studies had so many limitations.
I update this viewpoint now because health care is increasingly delivered by NPs and PAs. And there are two concerning trends regarding NP education and experience. First is that nurses are turning to advanced practitioner training earlier in their careers – without gathering much bedside experience. And these training programs are increasingly likely to be online, with minimal hands-on clinical tutoring.
Education and experience pop in my head often. Not every day, but many days I think back to my lucky 7 years in Indiana learning under the supervision of master clinicians – at a time when trainees were allowed the leeway to make decisions ... and mistakes. Then, when I joined private practice, I continued to learn from experienced practitioners.
It would be foolish to argue that training and experience aren’t important.
But here’s the thing:
I will make three points: First, I will bolster two of my old arguments as to why we shouldn’t be worried about non-MD clinicians, then I will propose some ideas to increase confidence in NP and PA care.
Health care does not equal health
On the matter of how much clinicians affect outcomes, a recently published randomized controlled trial performed in India found that subsidizing insurance care led to increased utilization of hospital services but had no significant effect on health outcomes. This follows the RAND and Oregon Health Insurance studies in the United States, which largely reported similar results.
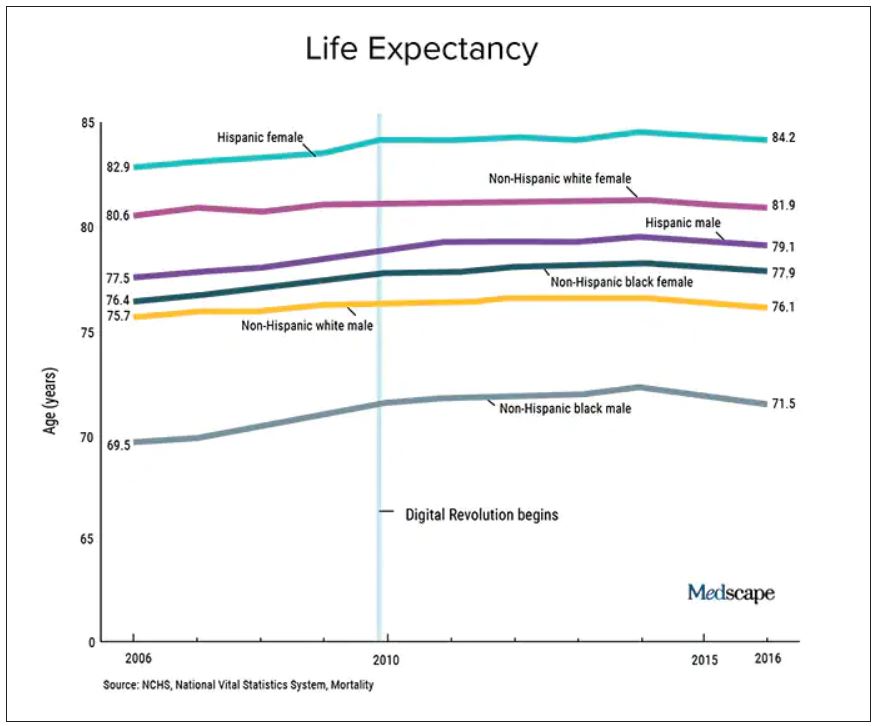
We should also not dismiss the fact that – despite the massive technology gains over the past half-century in digital health and artificial intelligence and increased use of quality measures, new drugs and procedures, and mega-medical centers – the average lifespan of Americans is flat to declining (in most ethnic and racial groups). Worse than no gains in longevity, perhaps, is that death from diseases like dementia and Parkinson’s disease are on the rise.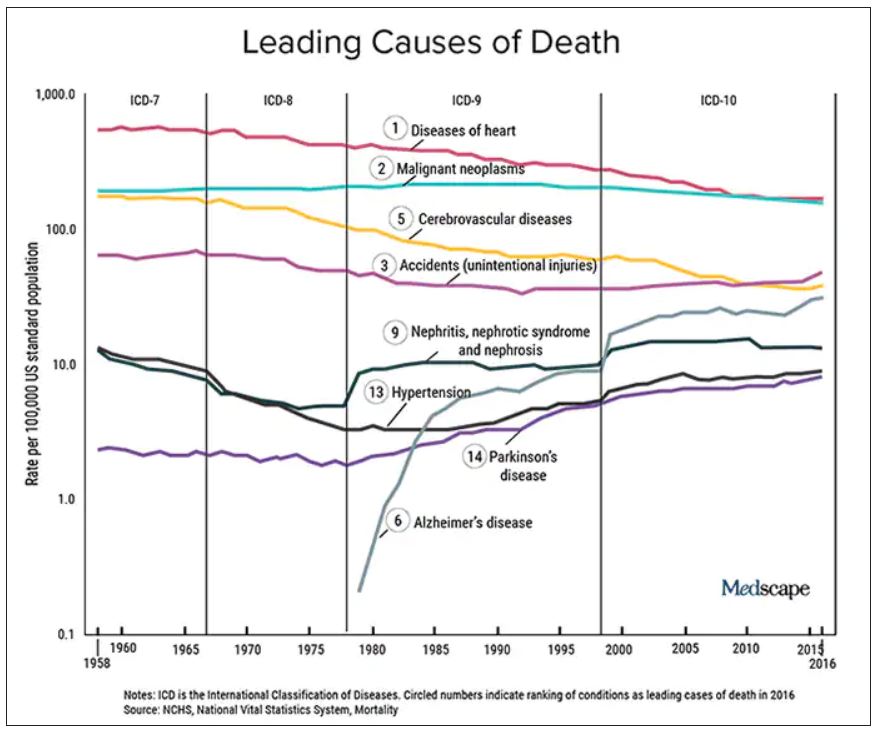
A neutral Martian would look down and wonder why all this health care hasn’t translated to longer and better lives. The causes of this paradox remain speculative, and are for another column, but the point remains that – on average – more health care is clearly not delivering more health. And if that is true, one may deduce that much of U.S. health care is marginal when it comes to affecting major outcomes.
It’s about the delta
Logos trumps pathos. Sure, my physician colleagues can tell scary anecdotes of bad outcomes caused by an inexperienced NP or PA. I would counter that by saying I have sat on our hospital’s peer review committee for 2 decades, including the era before NPs or PAs were practicing, and I have plenty of stories of physician errors. These include, of course, my own errors.
Logos: We must consider the difference between non–MD-led care and MD-led care.
My arguments from 2020 remain relevant today. Most medical problems are not engineering puzzles. Many, perhaps most, patients fall into an easy protocol – say, chest pain, dyspnea, or atrial fibrillation. With basic training, a motivated serious person quickly gains skill in recognizing and treating everyday problems.
And just 2 years on, technology further levels the playing field. Consider radiology in 2022 – it’s easy to take for granted the speed of the CT scan, the fidelity of the MRI, and the easy access to both in the U.S. hospital system. Less experienced clinicians have never had more tools to assist with diagnostics and therapeutics.
The expansion of team-based care has also mitigated the effects of inexperience. It took Americans longer than Canadians to figure out how helpful pharmacists could be. Pharmacists in my hospital now help us dose complicated medicines and protect us against prescribing errors.
Then there is the immediate access to online information. Gone are the days when you had to memorize long-QT syndromes. Book knowledge – that I spent years acquiring – now comes in seconds. The other day an NP corrected me. I asked, Are you sure? Boom, she took out her phone and showed me the evidence.
In sum, if it were even possible to measure the clinical competence of care from NP and PA versus physicians, there would be two bell-shaped curves with a tremendous amount of overlap. And that overlap would steadily increase as a given NP or PA gathered experience. (The NP in our electrophysiology division has more than 25 years’ experience in heart rhythm care, and it is common for colleagues to call her before one of us docs. Rightly so.)
Three basic proposals regarding NP and PA care
To ensure quality of care, I have three proposals.
It has always seemed strange to me that an NP or PA can flip from one field to another without a period of training. I can’t just change practice from electrophysiology to dermatology without doing a residency. But NPs and PAs can.
My first proposal would be that NPs and PAs spend a substantial period of training in a field before practice – a legit apprenticeship. The duration of this period is a matter of debate, but it ought to be standardized.
My second proposal is that, if physicians are required to pass certification exams, so should NPs. (PAs have an exam every 10 years.) The exam should be the same as (or very similar to) the physician exam, and it should be specific to their field of practice.
While I have argued (and still feel) that the American Board of Internal Medicine brand of certification is dubious, the fact remains that physicians must maintain proficiency in their field. Requiring NPs and PAs to do the same would help foster specialization. And while I can’t cite empirical evidence, specialization seems super-important. We have NPs at my hospital who have been in the same area for years, and they exude clinical competence.
Finally, I have come to believe that the best way for nearly any clinician to practice medicine is as part of a team. (The exception being primary care in rural areas where there are clinician shortages.)
On the matter of team care, I’ve practiced for a long time, but nearly every day I run situations by a colleague; often this person is an NP. The economist Friedrich Hayek proposed that dispersed knowledge always outpaces the wisdom of any individual. That notion pertains well to the increasing complexities and specialization of modern medical practice.
A person who commits to learning one area of medicine, enjoys helping people, asks often for help, and has the support of colleagues is set up to be a successful clinician – whether the letters after their name are APRN, PA, DO, or MD.
Dr. Mandrola practices cardiac electrophysiology in Louisville, Ky. He did not report any relevant financial disclosures. A version of this article first appeared on Medscape.com.
Two years ago, I argued that independent care from nurse practitioners (NPs) and physician assistants (PAs) would not have ill effects on health outcomes. To the surprise of no one, NPs and PAs embraced the argument; physicians clobbered it.
My case had three pegs: One was that medicine isn’t rocket science and clinicians control a lot less than we think we do. The second peg was that technology levels the playing field of clinical care. High-sensitivity troponin assays, for instance, make missing MI a lot less likely. The third peg was empirical: Studies have found little difference in MD versus non–MD-led care. Looking back, I now see empiricism as the weakest part of the argument because the studies had so many limitations.
I update this viewpoint now because health care is increasingly delivered by NPs and PAs. And there are two concerning trends regarding NP education and experience. First is that nurses are turning to advanced practitioner training earlier in their careers – without gathering much bedside experience. And these training programs are increasingly likely to be online, with minimal hands-on clinical tutoring.
Education and experience pop in my head often. Not every day, but many days I think back to my lucky 7 years in Indiana learning under the supervision of master clinicians – at a time when trainees were allowed the leeway to make decisions ... and mistakes. Then, when I joined private practice, I continued to learn from experienced practitioners.
It would be foolish to argue that training and experience aren’t important.
But here’s the thing:
I will make three points: First, I will bolster two of my old arguments as to why we shouldn’t be worried about non-MD clinicians, then I will propose some ideas to increase confidence in NP and PA care.
Health care does not equal health
On the matter of how much clinicians affect outcomes, a recently published randomized controlled trial performed in India found that subsidizing insurance care led to increased utilization of hospital services but had no significant effect on health outcomes. This follows the RAND and Oregon Health Insurance studies in the United States, which largely reported similar results.
We should also not dismiss the fact that – despite the massive technology gains over the past half-century in digital health and artificial intelligence and increased use of quality measures, new drugs and procedures, and mega-medical centers – the average lifespan of Americans is flat to declining (in most ethnic and racial groups). Worse than no gains in longevity, perhaps, is that death from diseases like dementia and Parkinson’s disease are on the rise.
A neutral Martian would look down and wonder why all this health care hasn’t translated to longer and better lives. The causes of this paradox remain speculative, and are for another column, but the point remains that – on average – more health care is clearly not delivering more health. And if that is true, one may deduce that much of U.S. health care is marginal when it comes to affecting major outcomes.
It’s about the delta
Logos trumps pathos. Sure, my physician colleagues can tell scary anecdotes of bad outcomes caused by an inexperienced NP or PA. I would counter that by saying I have sat on our hospital’s peer review committee for 2 decades, including the era before NPs or PAs were practicing, and I have plenty of stories of physician errors. These include, of course, my own errors.
Logos: We must consider the difference between non–MD-led care and MD-led care.
My arguments from 2020 remain relevant today. Most medical problems are not engineering puzzles. Many, perhaps most, patients fall into an easy protocol – say, chest pain, dyspnea, or atrial fibrillation. With basic training, a motivated serious person quickly gains skill in recognizing and treating everyday problems.
And just 2 years on, technology further levels the playing field. Consider radiology in 2022 – it’s easy to take for granted the speed of the CT scan, the fidelity of the MRI, and the easy access to both in the U.S. hospital system. Less experienced clinicians have never had more tools to assist with diagnostics and therapeutics.
The expansion of team-based care has also mitigated the effects of inexperience. It took Americans longer than Canadians to figure out how helpful pharmacists could be. Pharmacists in my hospital now help us dose complicated medicines and protect us against prescribing errors.
Then there is the immediate access to online information. Gone are the days when you had to memorize long-QT syndromes. Book knowledge – that I spent years acquiring – now comes in seconds. The other day an NP corrected me. I asked, Are you sure? Boom, she took out her phone and showed me the evidence.
In sum, if it were even possible to measure the clinical competence of care from NP and PA versus physicians, there would be two bell-shaped curves with a tremendous amount of overlap. And that overlap would steadily increase as a given NP or PA gathered experience. (The NP in our electrophysiology division has more than 25 years’ experience in heart rhythm care, and it is common for colleagues to call her before one of us docs. Rightly so.)
Three basic proposals regarding NP and PA care
To ensure quality of care, I have three proposals.
It has always seemed strange to me that an NP or PA can flip from one field to another without a period of training. I can’t just change practice from electrophysiology to dermatology without doing a residency. But NPs and PAs can.
My first proposal would be that NPs and PAs spend a substantial period of training in a field before practice – a legit apprenticeship. The duration of this period is a matter of debate, but it ought to be standardized.
My second proposal is that, if physicians are required to pass certification exams, so should NPs. (PAs have an exam every 10 years.) The exam should be the same as (or very similar to) the physician exam, and it should be specific to their field of practice.
While I have argued (and still feel) that the American Board of Internal Medicine brand of certification is dubious, the fact remains that physicians must maintain proficiency in their field. Requiring NPs and PAs to do the same would help foster specialization. And while I can’t cite empirical evidence, specialization seems super-important. We have NPs at my hospital who have been in the same area for years, and they exude clinical competence.
Finally, I have come to believe that the best way for nearly any clinician to practice medicine is as part of a team. (The exception being primary care in rural areas where there are clinician shortages.)
On the matter of team care, I’ve practiced for a long time, but nearly every day I run situations by a colleague; often this person is an NP. The economist Friedrich Hayek proposed that dispersed knowledge always outpaces the wisdom of any individual. That notion pertains well to the increasing complexities and specialization of modern medical practice.
A person who commits to learning one area of medicine, enjoys helping people, asks often for help, and has the support of colleagues is set up to be a successful clinician – whether the letters after their name are APRN, PA, DO, or MD.
Dr. Mandrola practices cardiac electrophysiology in Louisville, Ky. He did not report any relevant financial disclosures. A version of this article first appeared on Medscape.com.
Seven ways doctors could get better payment from insurers
, say experts in physician-payer contracts.
Many doctors sign long-term agreements and then forget about them, says Marcia Brauchler, president and founder of Physicians’ Ally, Littleton, Colorado, a health care consulting company. “The average doctor is trying to run a practice on 2010 rates because they haven’t touched their insurance contracts for 10 years,” she says.
Payers also make a lot of money by adopting dozens of unilateral policy and procedure changes every year that they know physicians are too busy to read. They are counting on the fact that few doctors will understand what the policy changes are and that even fewer will contest them, says Greg Brodek, JD, chair of the health law practice group and head of the managed care litigation practice at Duane Morris, who represents doctors in disputes with payers.
These experts say doctors can push back on one-sided payer contracts and negotiate changes. Mr. Brodek says some practices have more leverage than others to influence payers – if they are larger, in a specialty that the payer needs in its network, or located in a remote area where the payer has limited options.
Here are seven key areas to pay attention to:
1. Long-term contracts. Most doctors sign multiyear “evergreen” contracts that renew automatically every year. This allows insurers to continue to pay doctors the same rate for years.
To avoid this, doctors should negotiate new rates when their agreements renew or, if they prefer, ask that a cost-of-living adjustment be included in the multiyear contract that applies to subsequent years, says Ms. Brauchler.
2. Fee schedules. Payers will “whitewash” what they’re paying you by saying it’s 100% of the payer fee schedule. When it comes to Medicare, they may be paying you a lot less, says Ms. Brauchler.
“My biggest takeaway is to compare the CPT codes of the payer’s fee schedule against what Medicare allows. For example, for CPT code 99213, a 15-minute established office visit, if Medicare pays you $100 and Aetna pays you $75.00, you’re getting 75% of Medicare,” says Ms. Brauchler. To avoid this, doctors should ask that the contract state that reimbursement be made according to Medicare’s medical policies rather than the payer’s.
3. Audits. Commercial payers will claim they have a contractual right to conduct pre- and post-payment audits of physicians’ claims that can result in reduced payments. The contract only states that if doctors correctly submit claims, they will get paid, not that they will have to go through extra steps, which is a breach of their agreement, says Mr. Brodek.
In his experience, 90% of payers back down when asked to provide the contractual basis to conduct these audits. “Or, they take the position that it’s not in the contract but that they have a policy.”
4. Contract amendments versus policies and procedures. This is a huge area that needs to be clarified in contracts and monitored by providers throughout their relationships with payers. Contracts have three elements: the parties, the services provided, and the payment. Changing any one of those terms requires an amendment and advance written notice that has to be delivered to the other party in a certain way, such as by overnight delivery, says Mr. Brodek.
In addition, both parties have to sign that they agree to an amendment. “But, that’s too cumbersome and complicated for payers who have decided to adopt policies instead. These are unilateral changes made with no advance notice given, since the payer typically posts the change on its website,” says Mr. Brodek.
5. Recoupment efforts. Payers will review claims after they’re paid and contact the doctor saying they found a mistake, such as inappropriate coding. They will claim that the doctor now owes them a large sum of money based on a percentage of claims reviewed. “They typically send the doctor a letter that ends with, ‘If you do not pay this amount within 30 days, we will offset the amount due against future payments that we would otherwise make to you,’” says Mr. Brodek.
He recommends that contracts include the doctors’ right to contest an audit so the “payer doesn’t have the unilateral right to disregard the initial coding that the doctor appropriately assigned to the claim and recoup the money anyway,” says Mr. Brodek.
6. Medical network rentals and products. Most contracts say that payers can rent out their medical networks to other health plans, such as HMOs, and that the clinicians agree to comply with all of their policies and procedures. The agreement may also cover the products of other plans.
“The problem is that physicians are not given information about the other plans, including their terms and conditions for getting paid,” says Mr. Brodek. If a problem with payment arises, they have no written agreement with that plan, which makes it harder to enforce.
“That’s why we recommend that doctors negotiate agreements that only cover the main payer. Most of the time, the payer is amenable to putting that language in the contract,” he says.
7. Payer products. In the past several years, a typical contract has included appendices that list the payer’s products, such as Medicare, workers compensation, auto insurance liability, or health care exchange products. Many clinicians don’t realize they can pick the plans they want to participate in by accepting or opting out, says Mr. Brodek.
“We advise clients to limit the contract to what you want covered and to make informed decisions, because some products have low fees set by the states, such as workers compensation and health care exchanges,” says Mr. Brodek.
A version of this article first appeared on Medscape.com.
Ways to make sure 2022 doesn’t stink for docs
Depending on the data you’re looking at, 40%-60% of physicians are burned out.
Research studies and the eye test reveal the painfully obvious: Colleagues are tired, winded, spent, and at times way past burned out. People aren’t asking me if they’re burned out. They know they’re burned out; heck, they can even recite the Maslach burnout inventory, forward and backward, in a mask, or while completing a COVID quarantine. A fair share of people know the key steps to prevent burnout and promote recovery.
What I’m starting to see more of is, “Why should I even bother to recover from this? Why pick myself up again just to get another occupational stress injury (burnout, demoralization, moral injury, etc.)?” In other words, it’s not just simply about negating burnout; it’s about supporting and facilitating the motivation to work.
We’ve been through so much with COVID that it might be challenging to remember when you saw a truly engaged work environment. No doubt, we have outstanding professionals across medicine who answer the bell every day. However, if you’ve been looking closely, many teams/units have lost a bit of the zip and pep. The synergy and trust aren’t as smooth, and at noon, everyone counts the hours to the end of the shift.
You may be thinking, Well, of course, they are; we’re still amid a pandemic, and people have been through hell. Your observation would be correct, except I’ve personally seen some teams weather the pandemic storm and still remain engaged (some even more involved).
The No. 1 consult result for the GW Resiliency and Well-Being Center, where I work, has been on lectures for burnout. The R&WC has given so many of these lectures that my dreams take the form of a PowerPoint presentation. Overall the talks have gone very well. We’ve added skills sections on practices of whole-person care. We’ve blitzed the daylights out of restorative sleep, yet I know we are still searching for the correct narrative.
Motivated staff, faculty, and students will genuinely take in the information and follow the recommendations; however, they still struggle to find that drive and zest for work. Yes, moving from burnout to neutral is reasonable but likely won’t move the needle of your professional or personal life. We need to have the emotional energy and the clear desire to utilize that energy for a meaningful purpose.
Talking about burnout in specific ways is straightforward and, in my opinion, much easier than talking about engagement. Part of the challenge when trying to discuss engagement is that people can feel invalidated or that you’re telling them to be stoic. Or worse yet, that the problem of burnout primarily lies with them. It’s essential to recognize the role of an organizational factor in burnout (approximately 80%, depending on the study); still, even if you address burnout, people may not be miserable, but it doesn’t mean they will stay at their current job (please cue intro music for the Great Resignation).
Engagement models have existed for some time and certainly have gained much more attention in health care settings over the past 2 decades. Engagement can be described as having three components: dedication, vigor, and absorption. When a person is filling all three of these components over time, presto – you get the much-sought-after state of the supremely engaged professional.
These models definitely give us excellent starting points to approach engagement from a pre-COVID era. In COVID and beyond, I’m not sure how these models will stand up in a hybrid work environment, where autonomy and flexibility could be more valued than ever. Personally, COVID revealed some things I was missing in my work pre-COVID:
- Time to think and process. This was one of the great things about being a consultation-liaison psychiatrist; it was literally feast or famine.
- Doing what I’m talented at and really enjoy.
- Time is short, and I want to be more present in the life of my family.
The list above isn’t exhaustive, but I’ve found them to be my own personal recipe for being engaged. Over the next series of articles, I’m going to focus on engagement and factors related to key resilience. These articles will be informed by a front-line view from my colleagues, and hopefully start to separate the myth from reality on the subject of health professional engagement and resilience.
Everyone be safe and well!
A version of this article first appeared on Medscape.com.
Does COVID-19 induce type 1 diabetes in kids? Jury still out
Two new studies from different parts of the world have identified an increase in the incidence of type 1 diabetes in children since the COVID-19 pandemic began, but the reasons still aren’t clear.
The findings from the two studies, in Germany and the United States, align closely, endocrinologist Jane J. Kim, MD, professor of pediatrics and principal investigator of the U.S. study, told this news organization. “I think that the general conclusion based on their data and our data is that there appears to be an increased rate of new type 1 diabetes diagnoses in children since the onset of the pandemic.”
Dr. Kim noted that because her group’s data pertain to just a single center, she is “heartened to see that the [German team’s] general conclusions are the same as ours.” Moreover, she pointed out that other studies examining this question came from Europe early in the pandemic, whereas “now both they [the German group] and we have had the opportunity to look at what’s happening over a longer period of time.”
But the reason for the association remains unclear. Some answers may be forthcoming from a database designed in mid-2020 specifically to examine the relationship between COVID-19 and new-onset diabetes. Called CoviDiab, the registry aims “to establish the extent and characteristics of new-onset, COVID-19–related diabetes and to investigate its pathogenesis, management, and outcomes,” according to the website.
The first new study, a multicenter German diabetes registry study, was published online Jan. 17 in Diabetes Care by Clemens Kamrath, MD, of Justus Liebig University, Giessen, Germany, and colleagues.
The other, from Rady Children’s Hospital of San Diego, was published online Jan. 24 in JAMA Pediatrics by Bethany L. Gottesman, MD, and colleagues, all with the University of California, San Diego.
Mechanisms likely to differ for type 1 versus type 2 diabetes
Neither the German nor the U.S. investigators were able to directly correlate current or prior SARS-CoV-2 infection in children with the subsequent development of type 1 diabetes.
Earlier this month, a study from the U.S. Centers for Disease Control and Prevention did examine that issue, but it also included youth with type 2 diabetes and did not separate out the two groups.
Dr. Kim said her institution has also seen an increase in type 2 diabetes among youth since the COVID-19 pandemic began but did not include that in their current article.
“When we started looking at our data, diabetes and COVID-19 in adults had been relatively well established. To see an increase in type 2 [diabetes] was not so surprising to our group. But we had the sense we were seeing more patients with type 1, and when we looked at our hospital that was very much the case. I think that was a surprise to people,” said Dr. Kim.
Although a direct effect of SARS-CoV-2 on pancreatic beta cells has been proposed, in both the German and San Diego datasets the diagnosis of type 1 diabetes was confirmed with autoantibodies that are typically present years prior to the onset of clinical symptoms.
The German group suggests possible other explanations for the link, including the lack of immune system exposure to other common pediatric infections during pandemic-necessitated social distancing – the so-called hygiene hypothesis – as well as the possible role of psychological stress, which several studies have linked to type 1 diabetes.
But as of now, Dr. Kim said, “Nobody really knows.”
Is the effect direct or indirect?
Using data from the multicenter German Diabetes Prospective Follow-up Registry, Dr. Kamrath and colleagues compared the incidence of type 1 diabetes in children and adolescents from Jan. 1, 2020 through June 30, 2021 with the incidence in 2011-2019.
During the pandemic period, a total of 5,162 youth were newly diagnosed with type 1 diabetes at 236 German centers. That incidence, 24.4 per 100,000 patient-years, was significantly higher than the 21.2 per 100,000 patient-years expected based on the prior decade, with an incidence rate ratio of 1.15 (P < .001). The increase was similar in both males and females.
There was a difference by age, however, as the phenomenon appeared to be limited to the preadolescent age groups. The incidence rate ratios (IRRs) for ages below 6 years and 6-11 years were 1.23 and 1.18 (both P < .001), respectively, compared to a nonsignificant IRR of 1.06 (P = .13) in those aged 12-17 years.
Compared with the expected monthly incidence, the observed incidence was significantly higher in June 2020 (IRR, 1.43; P = .003), July 2020 (IRR, 1.48; P < 0.001), March 2021 (IRR, 1.29; P = .028), and June 2021 (IRR, 1.39; P = .01).
Among the 3,851 patients for whom data on type 1 diabetes-associated autoantibodies were available, the adjusted rates of autoantibody negativity did not differ from 2018-2019 during the entire pandemic period or during the year 2020 or the first half of 2021.
“Therefore, the increase in the incidence of type 1 diabetes in children appears to be due to immune-mediated type 1 diabetes. However, because autoimmunity and progressive beta-cell destruction typically begin long before the clinical diagnosis of type 1 diabetes, we were surprised to see the incidence of type 1 diabetes followed the peak incidence of COVID-19 and also the pandemic containment measures by only approximately 3 months,” Dr. Kamrath and colleagues write.
Taken together, they say, the data suggest that “the impact on type 1 diabetes incidence is not due to infection with SARS-CoV-2 but rather a consequence of environmental changes resulting from the pandemic itself or pandemic containment measures.”
Similar findings at a U.S. children’s hospital
In the cross-sectional study in San Diego, Dr. Gottesman and colleagues looked at the electronic medical records (EMRs) at Rady Children’s Hospital for patients aged younger than 19 years with at least one positive type 1 diabetes antibody titer.
During March 19, 2020 to March 18, 2021, a total of 187 children were admitted for new-onset type 1 diabetes, compared with just 119 the previous year, a 57% increase.
From July 2020 through February 2021, the number of new type 1 diabetes diagnoses significantly exceeded the number expected based on a quarterly moving average of each of the preceding 5 years.
Only four of the 187 patients (2.1%) diagnosed during the pandemic period had a COVID-19 infection at the time of presentation. Antibody testing to assess prior infection wasn’t feasible, and now that children are receiving the vaccine – and therefore most will have antibodies – “we’ve lost our window of opportunity to look at that question,” Dr. Kim noted.
As has been previously shown, there was an increase in the percentage of patients presenting with diabetic ketoacidosis during the pandemic compared with the prior 5 years (49.7% vs. 40.7% requiring insulin infusion). However, there was no difference in mean age at presentation, body mass index, A1c, or percentage requiring admission to intensive care.
Because these data only go through March 2021, Dr. Kim noted, “We need to see what’s happening with these different variants. We’ll have a chance to look in a month or two to see the effects of Omicron on the rates of diabetes in the hospital.”
Will CoviDiab answer the question?
Data from CoviDiab will include diabetes type in adults and children, registry coprincipal investigator Francesco Rubino, MD, of King’s College London, told this news organization.
“We aimed at having as many as possible cases of new-onset diabetes for which we can have also a minimum set of clinical data including type of diabetes and A1c. By looking at this information we can infer whether a role of COVID-19 in triggering diabetes is clinically plausible – or not – and what type of diabetes is most frequently associated with COVID-19 as this also speaks about mechanisms of action.”
Dr. Rubino said that the CoviDiab team is approaching the data with the assumption that, at least in adults diagnosed with type 2 diabetes, the explanation might be that the person already had undiagnosed diabetes or that the hyperglycemia may be stress-induced and temporary.
“We’re looking at this question with a skeptical eye ... Is it just an association, or does the virus have a role in inducing diabetes from scratch, or can the virus advance pathophysiology in a way that it ends up in full-blown diabetes in predisposed individuals?”
While no single study will prove that SARS-CoV-2 causes diabetes, “combining observations from various studies and approaches we may get a higher degree of certainty,” Dr. Rubino said, noting that the CoviDiab team plans to publish data from the first 800 cases “soon.”
Dr. Kim has reported no relevant financial relationships. Dr. Rubino has reported receiving grants from Ethicon and Medtronic, personal fees from GI Dynamic, Keyron, Novo Nordisk, Ethicon, and Medtronic.
A version of this article first appeared on Medscape.com.