User login
Bringing you the latest news, research and reviews, exclusive interviews, podcasts, quizzes, and more.
div[contains(@class, 'read-next-article')]
div[contains(@class, 'nav-primary')]
nav[contains(@class, 'nav-primary')]
section[contains(@class, 'footer-nav-section-wrapper')]
nav[contains(@class, 'nav-ce-stack nav-ce-stack__large-screen')]
header[@id='header']
div[contains(@class, 'header__large-screen')]
div[contains(@class, 'read-next-article')]
div[contains(@class, 'main-prefix')]
div[contains(@class, 'nav-primary')]
nav[contains(@class, 'nav-primary')]
section[contains(@class, 'footer-nav-section-wrapper')]
footer[@id='footer']
section[contains(@class, 'nav-hidden')]
div[contains(@class, 'ce-card-content')]
nav[contains(@class, 'nav-ce-stack')]
div[contains(@class, 'view-medstat-quiz-listing-panes')]
div[contains(@class, 'pane-article-sidebar-latest-news')]
Pandemic pregnancy-linked deaths up 35% from 2019
Pregnancy-associated deaths, including drug-related deaths and homicide, were up 35% in 2020, compared with prepandemic 2019, new research indicates.
The data also show a 7.1% decrease in pregnancy-related suicides in 2020 from 2019.
The study, led by Claire E. Margerison, PhD, with the department of epidemiology and biostatistics at Michigan State University, East Lansing, included 4,528 pregnancy-associated deaths. The rate of deaths per 100,000 live births from April to December 2020 was 66.9 (95% confidence interval, 63.9-70.1). The comparative rate from April to December 2019 was 49.6. Researchers looked at that time period because the pandemic started in March 2020.
The findings were published online in JAMA Open Network.
Drug-related deaths up 55.3%
During the study period, drug deaths increased 55.3% and deaths from homicide increased 41.2%. Deaths from obstetric and other causes (mainly vehicle crashes) increased 28.4% and 56.7%, respectively, according to Dr. Margerison's group.
“Although pregnancy-associated deaths increased over time, increases from 2019 to 2020 were substantially larger than increases from 2018 to 2019,” the authors wrote.
The findings align with deaths in the general population in that time frame, they added.
Another study – this one looking at all-cause and cause-specific mortality from 2019 to 2020 in recently pregnant women, also published in JAMA Network Open, found significant racial and ethnic disparities in rates and cause of death.
According to the study, “Compared with non-Hispanic White women, mortality rates were three- to fivefold higher among American Indian or Alaska Native women for every cause, including suicide. Likewise, these findings suggest that non-Hispanic Black women experienced significantly higher mortality rates across causes, with the highest rates for homicide.”
Dr. Margerison and colleagues did not try to answer what caused the increases but pointed to the fentanyl epidemic, the murder of George Floyd, and COVID-19–related economic strain as potential stressors. They also suggest fewer screenings during the pandemic may have played a role.
Prevention opportunities missed
“Although pregnancy is considered an opportunity for screening and prevention related to physical, mental, and behavioral health, our data suggest that such opportunities were missed for hundreds of pregnant people during the pandemic,” the authors wrote.
Researchers analyzed cross-sectional U.S. death certificates from Jan. 1, 2018, to Dec. 31, 2020, for female U.S. residents ages 15-44 years. They then obtained the count for live births for the same population and time frame from the Centers for Disease Control and Prevention WONDER database.
They were able to identify pregnancy-associated deaths as the 2003 Revised Death Certificate contains a standardized pregnancy checkbox that asks whether the person was pregnant at the time of death, within 42 days of death, or within 43 days to 1 year of death.
Researchers also included deaths with ICD-10 codes linked with death from obstetric causes.
Deaths from overdose, suicide, and homicide are making up large and growing proportions of all deaths during pregnancy and in the first year postpartum, the authors report.
Dr. Margerison and coauthors, in research published in 2022, reported that these causes account for more than one-fifth of all pregnancy-related deaths. They also reported that drug-related deaths and homicides in this population have increased over the past 10 years.
“Substantial racial and ethnic inequities in these deaths exist,” they wrote in that paper.
The authors concluded in the current research: “Our study findings suggest that there is a need for prevention and intervention efforts, including harm-reduction strategies, tailored to pregnant and postpartum women, particularly during times of population stress and decreased utilization of preventive care, such as a pandemic.”
Dr. Margerison and coauthors reported receiving grant support from the Eunice Kennedy Shriver National Institute of Child Health and Human Development during the study. One coauthor received personal fees from the World Health Organization and Population Reference Bureau outside the submitted work. One coauthor reported receiving grant support from the National Institutes of Mental Health during the study.
*This story was updated on 2/1.
FROM JAMA NETWORK OPEN
Similar brain atrophy in obesity and Alzheimer’s disease
Comparisons of MRI scans for more than 1,000 participants indicate correlations between the two conditions, especially in areas of gray matter thinning, suggesting that managing excess weight might slow cognitive decline and lower the risk for AD, according to the researchers.
However, brain maps of obesity did not correlate with maps of amyloid or tau protein accumulation.
“The fact that obesity-related brain atrophy did not correlate with the distribution of amyloid and tau proteins in AD was not what we expected,” study author Filip Morys, PhD, a postdoctoral researcher at McGill University, Montreal, said in an interview. “But it might just show that the specific mechanisms underpinning obesity- and Alzheimer’s disease–related neurodegeneration are different. This remains to be confirmed.”
The study was published in the Journal of Alzheimer’s Disease.
Cortical Thinning
The current study was prompted by the team’s earlier study, which showed that obesity-related neurodegeneration patterns were visually similar to those of AD, said Dr. Morys. “It was known previously that obesity is a risk factor for AD, but we wanted to directly compare brain atrophy patterns in both, which is what we did in this new study.”
The researchers analyzed data from a pooled sample of more than 1,300 participants. From the ADNI database, the researchers selected participants with AD and age- and sex-matched cognitively healthy controls. From the UK Biobank, the researchers drew a sample of lean, overweight, and obese participants without neurologic disease.
To determine how the weight status of patients with AD affects the correspondence between AD and obesity maps, they categorized participants with AD and healthy controls from the ADNI database into lean, overweight, and obese subgroups.
Then, to investigate mechanisms that might drive the similarities between obesity-related brain atrophy and AD-related amyloid-beta accumulation, they looked for overlapping areas in PET brain maps between patients with these outcomes.
The investigations showed that obesity maps were highly correlated with AD maps, but not with amyloid-beta or tau protein maps. The researchers also found significant correlations between obesity and the lean individuals with AD.
Brain regions with the highest similarities between obesity and AD were located mainly in the left temporal and bilateral prefrontal cortices.
“Our research confirms that obesity-related gray matter atrophy resembles that of AD,” the authors concluded. “Excess weight management could lead to improved health outcomes, slow down cognitive decline in aging, and lower the risk for AD.”
Upcoming research “will focus on investigating how weight loss can affect the risk for AD, other dementias, and cognitive decline in general,” said Dr. Morys. “At this point, our study suggests that obesity prevention, weight loss, but also decreasing other metabolic risk factors related to obesity, such as type-2 diabetes or hypertension, might reduce the risk for AD and have beneficial effects on cognition.”
Lifestyle habits
Commenting on the findings, Claire Sexton, DPhil, vice president of scientific programs and outreach at the Alzheimer’s Association, cautioned that a single cross-sectional study isn’t conclusive. “Previous studies have illustrated that the relationship between obesity and dementia is complex. Growing evidence indicates that people can reduce their risk of cognitive decline by adopting key lifestyle habits, like regular exercise, a heart-healthy diet and staying socially and cognitively engaged.”
The Alzheimer’s Association is leading a 2-year clinical trial, U.S. Pointer, to study how targeting these risk factors in combination may reduce risk for cognitive decline in older adults.
The work was supported by a Foundation Scheme award from the Canadian Institutes of Health Research. Dr. Morys received a postdoctoral fellowship from Fonds de Recherche du Quebec – Santé. Data collection and sharing were funded by the Alzheimer’s Disease Neuroimaging Initiative, the National Institute on Aging, the National Institute of Biomedical Imaging and Bioengineering, and multiple pharmaceutical companies and other private sector organizations. Dr. Morys and Dr. Sexton reported no relevant financial relationships.
A version of this article first appeared on Medscape.com.
FROM THE JOURNAL OF ALZHEIMER’S DISEASE
Long QT syndrome overdiagnosis persists
Five factors underlie the ongoing overdiagnosis and misdiagnosis of long QT syndrome (LQTS), including temporary QT prolongation following vasovagal syncope, a “pseudo”-positive genetic test result, family history of sudden cardiac death, transient QT prolongation, and misinterpretation of the QTc interval, a new study suggests.
Awareness of these characteristics, which led to a diagnostic reversal in 290 of 1,841 (16%) patients, could reduce the burden of overdiagnosis on the health care system and on patients and families, senior author Michael J. Ackerman, MD, PhD, of Mayo Clinic, Rochester, Minn., and colleagues conclude.
“The findings are a disturbing and disappointing sequel to the paper we published about LQTS overdiagnosis back in 2007, which showed that 2 out of every 5 patients who came to Mayo Clinic for a second opinion left without the diagnosis,” Dr. Ackerman told this news organization.
To date, Dr. Ackerman has reversed the diagnosis for 350 patients, he said.
The consequences of an LQTS diagnosis are “profound,” he noted, including years of unnecessary drug therapy, implantation of a cardioverter defibrillator, disqualification from competitive sports, and emotional stress to the individual and family.
By pointing out the five biggest mistakes his team has seen, he said, “we hope to equip the diagnostician with the means to challenge and assess the veracity of a LQTS diagnosis.”
The study was published online in the Journal of the American College of Cardiology.
Time to do better
Dr. Ackerman and colleagues analyzed electronic medical records on 290 of 1,841 (16%) patients who presented with an outside diagnosis of LQTS but subsequently were dismissed as having normal findings. The mean age of these patients at their first Mayo Clinic evaluation was 22, 60% were female, and the mean QTc interval was 427 ±25 milliseconds.
Overall, 38% of misdiagnoses were the result of misinterpretation of clinical factors; 29%, to diagnostic test misinterpretations; 17%, to an apparently positive genetic test in the context of a weak or absent phenotype; and 16%, to a family history of false LQTS or of sudden cardiac or sudden unexplained death.
More specifically, the most common cause of an LQTS misdiagnosis was QT prolongation following vasovagal syncope, which was misinterpreted as LQTS-attributed syncope.
The second most common cause was an apparently positive genetic test for an LQTS gene that turned out to be a benign or likely benign variant.
The third most common cause was an LQTS diagnosis based solely on a family history of sudden unexplained death (26 patients), QT prolongation (11 patients), or sudden cardiac arrest (9 patients).
The fourth most common cause was an isolated event of QT prolongation (44 patients). The transient QT prolongation was observed under myriad conditions unrelated to LQTS. Yet, 31 patients received a diagnosis based solely on the event.
The fifth most common cause was inclusion of the U-wave in the calculation of the QTc interval (40 patients), leading to an inaccurate interpretation of the electrocardiogram.
Dr. Ackerman noted that these LQTS diagnoses were given by heart-rhythm specialists, and most patients self-referred for a second opinion because a family member questioned the diagnosis after doing their own research.
“It’s time that we step up to the plate and do better,” Dr. Ackerman said. The team’s evaluation of the impact of the misdiagnosis on the patients’ lifestyle and quality of life showed that 45% had been restricted from competitive sports (and subsequently resumed sports activity with no adverse events); 80% had been started on beta-blockers (the drugs were discontinued in 84% as a result of the Mayo Clinic evaluation, whereas 16% opted to continue); and 10 of 22 patients (45%) who received an implanted cardioverter device underwent an extraction of the device without complications.
The authors conclude: “Although missing a patient who truly has LQTS can lead to a tragic outcome, the implications of overdiagnosed LQTS are not trivial and are potentially tragic as well.”
‘Tricky diagnosis’
LQTS specialist Peter Aziz, MD, director of pediatric electrophysiology at the Cleveland Clinic, agreed with these findings.
“Most of us ‘channelopathists’ who see LQTS for a living have a good grasp of the disease, but it can be elusive for others,” he said in an interview. “This is a tricky diagnosis. There are ends of the spectrum where people for sure don’t have it and people for sure do. Most clinicians are able to identify that.”
However, he added, “A lot of patients fall into that gray area where it may not be clear at first, even to an expert. But the expert knows how to do a comprehensive evaluation, examining episodes and symptoms and understanding whether they are relevant to LQTS or completely red herrings, and feeling confident about how they calculate the acute interval on an electrocardiogram.”
“All of these may seem mundane, but without the experience, clinicians are vulnerable to miscalculations,” he said. “That’s why our bias, as channelopathists, is that every patient who has a suspected diagnosis or is being treated for LQTS really should see an expert.”
Similarly, Arthur A.M. Wilde, MD, PhD, of the University of Amsterdam, and Peter J. Schwartz, MD, of IRCCS Istituto Auxologico Italiano, Milan, write in a related editorial that it “has to be kept in mind that both diagnostic scores and risk scores are dynamic and can be modified by time and by appropriate therapy.
“Therefore, to make hasty diagnosis of a disease that requires life-long treatment is inappropriate, especially when this is done without the support of adequate, specific experience.”
No commercial funding or relevant financial relationships were reported.
A version of this article first appeared on Medscape.com.
FROM THE JOURNAL OF THE AMERICAN COLLEGE OF CARDIOLOGY
Can a nationwide liver paired donation program work?
For a patient who needs a liver, living donation offers an alternative to staying on a list of more than 10,000 people waiting for a transplant. But what happens when your donor is not a match?
“It’s an exciting time to be caring for patients who need liver transplants,” Benjamin Samstein, MD, chief of liver transplantation at New York–Presbyterian/Weill Cornell Medical Center, New York, said in an interview. He is the principal investigator for the UNOS pilot program. “I do believe it is within our grasp to make sure that nobody dies while waiting for an organ,” he said.
The initiative involves 15 U.S. transplant centers. So far, one recipient-donor pair has enrolled in the program. The pilot program has three main goals: Increase access to living donor transplants; increase access to transplants earlier, when recipients are in better health; and work out how to create and sustain a national program.
What is paired donation?
In 2020, 1,095 people died while waiting for a liver transplant, according to a report from the Organ Procurement and Transplant Network (OPTN) – a public-private partnership that includes more than 250 transplant centers and 50 organ procurement organizations across the country.
Most liver transplants involve deceased donors. One way to improve access to lifesaving transplants is through living donation, by which a healthy individual donates part of his or her liver. Someone can participate in nondirected or “altruistic” donation, in which someone donates a liver to someone they don’t know, or they can donate to a specific individual (usually a blood relative or a spouse).
With living liver donation, someone may receive a liver earlier, before getting sick enough to be given priority on the wait-list for deceased donation. Because the recipients are in better health, they may have an easier time recovering from the surgery, Ruthanne Leishman, who manages paired donation programs at UNOS, said in an interview.
In some cases, an individual will want to donate an organ to a specific person, but testing reveals that the two would not be a good match. Paired donation allows incompatible donors and recipients to find matches with other incompatible pairs. Each donor matches with the other pairs’ recipient, so the organs are essentially swapped or exchanged between the two pairs.
“People who want to donate get excited about the fact that they are not just helping their loved one but they’re also helping somebody else,” Ms. Leishman said.
Paired kidney donation programs have been running since 2002, but paired liver donation is relatively new. Since the first U.S. living-donor liver transplant in 1989, the procedure has become safer and is a viable alternative to deceased liver donation. A growing number of living donor programs are popping up at transplant centers across the country.
Still, living-donor liver donation makes up a small percentage of the liver transplants that are performed every year. In 2022, 603 living-donor liver transplants were performed in the United States, compared to 8,925 liver transplants from deceased donors, according to OPTN data. Dr. Samstein estimates a couple dozen paired liver exchanges may have been performed in the United States over the past few years within individual hospital systems. A goal of this pilot program, along with increasing access to liver transplants, is to see whether paired liver donation works on a national level, Ms. Leishman said.
Challenges to building a national program
There are several notable differences between living donor kidney transplants and living donor liver transplants. For example, living donor liver transplant is a more complicated surgery and poses greater risk to the donor. According to the OPTN 2020 Annual Report, from 2015 to 2019, the rehospitalization rate for living liver donors was twice that of living kidney donors up to 6 weeks after transplant (4.7% vs. 2.4%). One year post transplant, the cumulative rehospitalization rate was 11.0% for living liver donors and 4.8% for living kidney donors.
The risk of dying because of living donation is also higher for liver donors compared to kidney donors. The National Kidney Association states that the odds of dying during kidney donation are about 3 in 100,000, while estimates for risk of death for living liver donors range from 1 in 500 to 1 in 1,000. But some of these estimates are from 10 or more years ago, and outcomes have likely improved, said Whitney Jackson, MD, medical director of living donor liver transplant at UCHealth University of Colorado Hospital, Aurora. Her program is participating in the UNOS pilot.
More recent data from OPTN provides some idea of risk: Of 3,967 liver donors who donated between March 1, 2008, to Sept. 30, 2022, three deaths were reported within 30 days of transplant. However, the causes of death were not specified and therefore may be unrelated to the surgery. By comparison, of 74,555 kidney donors during that date range, 10 deaths were reported at 30 days post surgery.
In addition to a more complex surgery, surgeons also have a smaller time window in which to transplant a liver than than they do to transplant a kidney. A kidney can remain viable in cold storage for 24-36 hours, and it can be transported via commercial airlines cross country. Livers have to be transplanted within 8-12 hours, according to the OPTN website. For living donation, the graft needs to be transplanted within about 4 hours, Dr. Samstein noted; this poses a logistical challenge for a national organ paired donation program.
“We worked around that with the idea that we would move the donor rather than the organ,” he said. The program will require a donor (and a support person) to travel to the recipient’s transplant center where the surgery will be performed. While 3 of the 15 pilot paired donation transplant centers are in New York City, the other programs are scattered across the country, meaning a donor may have to fly to a different city to undergo surgery.
Including the preoperative evaluation, meeting the surgical team, the surgery itself, and follow-up, the donor could stay for about a month. The program offers up to $10,000 of financial assistance for travel expenses (for both the donor and support person), as well as lost wages and dependent care (for the donor only). Health insurance coverage will also be provided by the pilot program, in partnership with the American Foundation for Donation and Transplant.
The program requires that transplant candidates (the recipients) be at least 12 years old, be on the waiting list for deceased liver donation at one of the pilot’s transplant centers, and have a Model for End-Stage Liver Disease (MELD) score of 25 or less. All potential donors must be 18 years or older and must undergo a medical and psychosocial evaluation. Nondirected donors can register with the program, and they will be paired with a candidate on the liver transplant waiting list at the same transplant center.
The 1-year pilot program is set to begin when the program conducts its first match run – an algorithm will help match pairs who are enrolled in the program. About five to seven enrolled pairs would be ideal for the first match run, a UNOS spokesperson said. It is possible that the 1-year pilot program could run without performing any paired transplants, but that’s unlikely if multiple pairs are enrolled in the system, the spokesperson said. At the time of this story’s publication, the one enrolled pair are a mother and daughter who are registered at the UCHealth Transplant Center in Colorado.
Is a national liver paired donor program feasible?
While the UNOS pilot program offers financial assistance for expenses related to liver donation, some transplant surgeons are skeptical about the potential travel component of the pilot program.
The pilot program requires that the donor bring one support person if there is a need to travel for the surgery, but undergoing major abdominal surgery from a transplant team they are not familiar with may be stressful, said Peter Abt, MD, a transplant surgeon at the Hospital of the University of Pennsylvania and the Children’s Hospital of Philadelphia. “That’s a big ask,” he said, “and I’m not sure many potential donors would be up to that.”
John Roberts, MD, a transplant surgeon at the University of California, San Francisco, agreed that the travel component may put additional stress on the donor, but “if it’s the only way for the recipient to get a transplant, then the donor might be motivated,” he added.
Dr. Jackson remains optimistic. “Our experience so far has been that, yes, some people have been hesitant for things like traveling, but a lot of people who seem to be genuinely dedicated to the idea of living donation have been very enthusiastic,” she noted.
Dr. Leishman agreed that the travel aspect appears to one of the greatest barriers to participants entering the program but noted that a goal of the pilot program is to understand better what works - and what doesn’t – when considering a liver paired donation program on a national scale. “[Our] steering committee has put together a really nice framework that they think will work, but they know it’s not perfect. We’re going to have to tweak it along the way,” she said.
More information on the paired liver donation pilot program can be found on the UNOS website.
The sources interviewed for this article reported no financial conflicts of interest.
A version of this article first appeared on Medscape.com.
This article was updated 2/15/23.
Children and COVID: Weekly cases may have doubled in early January
Although new COVID-19 cases in children, as measured by the American Academy of Pediatrics and the Children’s Hospital Association, have remained fairly steady in recent months, data from the Centers for Diseases Control and Prevention suggest that weekly cases took a big jump in early January.
For the most recent week covered . New cases for the first 2 weeks of the year – 31,000 for the week of Dec. 30 to Jan. 5 and 26,000 during Jan. 6-12 – were consistent with the AAP/CHA assertion that “weekly reported child cases have plateaued at an average of about 32,000 cases ... over the past 4 months.”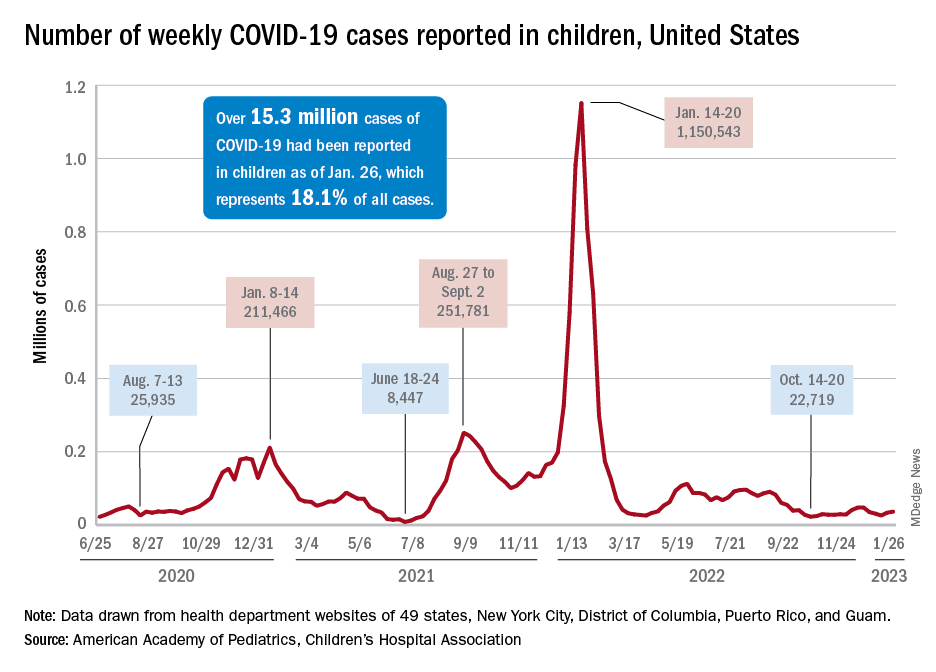
The CDC data, however, show that new cases doubled during the week of Jan. 1-7 to over 65,000, compared with the end of December, and stayed at that level for Jan. 8-14, and since CDC figures are subject to a 6-week reporting delay, the final numbers are likely to be even higher. The composition by age changed somewhat between the 2 weeks, though, as those aged 0-4 years went from almost half of all cases in the first week down to 40% in the second, while cases rose for children aged 5-11 and 12-15, based on data from the COVID-19 response team.
Emergency department visits for January do not show a corresponding increase. ED visits among children aged 0-11 years with COVID-19, measured as a percentage of all ED visits, declined over the course of the month, as did visits for 16- and 17-year-olds, while those aged 12-15 started the month at 1.4% and were at 1.4% on Jan. 27, with a slight dip down to 1.2% in between, the CDC said on its COVID Data Tracker. Daily hospitalizations for children aged 0-17 also declined through mid-January and did not reflect the jump in new cases.
Meanwhile, vaccinated children are still in the minority: 57% of those under age 18 have received no COVID vaccine yet, the AAP said in a separate report. Just 7.4% of children under age 2 years had received at least one dose as of Jan. 25, as had 10.1% of those aged 2-4 years, 39.6% of 5- to 11-year-olds and 71.8% of those 12-17 years old, according to the CDC, with corresponding figures for completion of the primary series at 3.5%, 5.3%, 32.5%, and 61.5%.
Managing respiratory symptoms in the ‘tripledemic’ era
Is it COVID-19, flu, or even RSV? I recently described just such a patient, an obese woman with type 2 diabetes, presenting with fever, cough, myalgia, and fatigue. I asked readers whether they agreed with my management of this patient.
Thank you for your comments as we continue to react to high rates of URIs. Your comments highlight the importance of local resources and practice habits when managing patients with URI.
It was clear that readers value testing to distinguish between infections. However, access to testing is highly variable around the world and is likely to be routinely used only in high-income countries. The Kaiser Family Foundation performed a cost analysis of testing for SARS-CoV-2 in 2020 and found, not surprisingly, wide variability in the cost of testing. Medicare covers tests at rates of $36-$143 per test; a study of list prices for SARS-CoV-2 tests at 93 hospitals found a median cost of $148 per test. And this does not include collection or facility fees. About 20% of tests cost more than $300.
These costs are prohibitive for many health systems. However, more devices have been introduced since that analysis, and competition and evolving technology should drive down prices. Generally, multiplex polymerase chain reaction (PCR) testing for multiple pathogens is less expensive than ordering two or three separate molecular tests and is more convenient for patients and practices alike.
Other reader comments focused on the challenges of getting accurate data on viral epidemiology, and there is certainly a time lag between infection trends and public health reports. This is exacerbated by underreporting of symptoms and more testing at home using antigen tests.
But please do not give up on epidemiology! If a test such as PCR is 90% sensitive for identifying infection, the yield in terms of the number of individuals infected with a particular virus should be high, and that is true when infection is in broad circulation. If 20% of a population of 1,000 has an infection and the test sensitivity is 90%, the yield of testing is 180 true cases versus 20 false positives.
However, if just 2% of the population of 1,000 has the infection in this same scenario, then only 18 true cases are identified. The effect on public health is certainly less, and a lower prevalence rate means that confounding variables, such as how long an individual might shed viral particles and the method of sample collection, have an outsized effect on results. This reduces the validity of diagnostic tests.
Even trends on a national level can provide some insight regarding whom to test. Traditionally, our practice has been to not routinely test patients for influenza or RSV from late spring to early fall unless there was a compelling reason, such as recent travel to an area where these infections were more prevalent. The loss of temporality for these infections since 2020 has altered this approach and made us pay more attention to reports from public health organizations.
I also appreciate the discussion of how to treat Agnes’s symptoms as she waits to improve, and anyone who suffers with or treats a viral URI knows that there are few interventions effective for such symptoms as cough and congestion. A systematic review of 29 randomized controlled trials of over-the-counter medications for cough yielded mixed and largely negative results.
Antihistamines alone do not seem to work, and guaifenesin was successful in only one of three trials. Combinations of different drug classes appeared to be slightly more effective.
My personal favorite for the management of acute cough is something that kids generally love: honey. In a review of 14 studies, 9 of which were limited to pediatric patients, honey was associated with significant reductions in cough frequency, cough severity, and total symptom score. However, there was a moderate risk of bias in the included research, and evidence of honey’s benefit in placebo-controlled trials was limited. Honey used in this research came in a variety of forms, so the best dosage is uncertain.
Clearly, advancements are needed. Better symptom management in viral URI will almost certainly improve productivity across the population and will probably reduce the inappropriate use of antibiotics as well. I have said for years that the scientists who can solve the Gordian knot of pediatric mucus deserve three Nobel prizes. I look forward to that golden day.
Dr. Vega is a clinical professor of family medicine at the University of California, Irvine. He reported a conflict of interest with McNeil Pharmaceuticals.
A version of this article first appeared on Medscape.com.
Feds charge 25 nursing school execs, staff in fake diploma scheme
The U.S. Department of Justice recently announced charges against 25 owners, operators, and employees of three Florida nursing schools in a fraud scheme in which they sold as many as 7,600 fake nursing degrees.
The purchasers in the diploma scheme paid $10,000 to $15,000 for degrees and transcripts and some 2,800 of the buyers passed the national nursing licensing exam to become registered nurses (RNs) and licensed practice nurses/vocational nurses (LPN/VNs) around the country, according to The New York Times.
Many of the degree recipients went on to work at hospitals, nursing homes, and Veterans Affairs medical centers, according to the U.S. Attorney’s Office for the Southern District of Florida.
Several national nursing organizations cooperated with the investigation, and the Delaware Division of Professional Regulation already annulled 26 licenses, according to the Delaware Nurses Association. Fake licenses were issued in five states, according to federal reports.
“We are deeply unsettled by this egregious act,” DNA President Stephanie McClellan, MSN, RN, CMSRN, said in the group’s press statement. “We want all Delaware nurses to be aware of this active issue and to speak up if there is a concern regarding capacity to practice safely by a colleague/peer,” she said.
The Oregon State Board of Nursing is also investigating at least a dozen nurses who may have paid for their degrees, according to a Portland CBS affiliate.
The National Council of State Boards of Nursing said in a statement that it had helped authorities identify and monitor the individuals who allegedly provided the false degrees.
Nursing community reacts
News of the fraud scheme spread through the nursing community, including social media. “The recent report on falsified nursing school degrees is both heartbreaking and serves as an eye-opener,” tweeted Usha Menon, PhD, RN, FAAN, dean and health professor of the University of South Florida Health College of Nursing. “There was enough of a need that prompted these bad actors to develop a scheme that could’ve endangered dozens of lives.”
Jennifer Mensik Kennedy, PhD, MBA, RN, the new president of the American Nurses Association, also weighed in. “The accusation that personnel at once-accredited nursing schools allegedly participated in this scheme is simply deplorable. These unlawful and unethical acts disparage the reputation of actual nurses everywhere who have rightfully earned [their titles] through their education, hard work, dedication, and time.”
The false degrees and transcripts were issued by three once-accredited and now-shuttered nursing schools in South Florida: Palm Beach School of Nursing, Sacred Heart International Institute, and Sienna College.
The alleged co-conspirators reportedly made $114 million from the scheme, which dates back to 2016, according to several news reports. Each defendant faces up to 20 years in prison.
Most LPN programs charge $10,000 to $15,000 to complete a program, Robert Rosseter, a spokesperson for the American Association of Colleges of Nursing (AACN), told this news organization.
None were AACN members, and none were accredited by the Commission on Collegiate Nursing Education, which is AACN’s autonomous accrediting agency, Mr. Rosseter said. AACN membership is voluntary and is open to schools offering baccalaureate or higher degrees, he explained.
“What is disturbing about this investigation is that there are over 7,600 people around the country with fraudulent nursing credentials who are potentially in critical health care roles treating patients,” Chad Yarbrough, acting special agent in charge for the FBI in Miami, said in the federal justice department release.
‘Operation Nightingale’ based on tip
The federal action, dubbed “Operation Nightingale” after the nursing pioneer Florence Nightingale, began in 2019. It was based on a tip related to a case in Maryland, according to Nurse.org.
That case ensnared Palm Beach School of Nursing owner Johanah Napoleon, who reportedly was selling fake degrees for $6,000 to $18,000 each to two individuals in Maryland and Virginia. Ms. Napoleon was charged in 2021 and eventually pled guilty. The Florida Board of Nursing shut down the Palm Beach school in 2017 owing to its students’ low passing rate on the national licensing exam.
Two participants in the bigger scheme who had also worked with Ms. Napoleon – Geralda Adrien and Woosvelt Predestin – were indicted in 2021. Ms. Adrien owned private education companies for people who at aspired to be nurses, and Mr. Predestin was an employee. They were sentenced to 27 months in prison last year and helped the federal officials build the larger case.
The 25 individuals who were charged Jan. 25 operated in Delaware, New York, New Jersey, Texas, and Florida.
Schemes lured immigrants
In the scheme involving Siena College, some of the individuals acted as recruiters to direct nurses who were looking for employment to the school, where they allegedly would then pay for an RN or LPN/VN degree. The recipients of the false documents then used them to obtain jobs, including at a hospital in Georgia and a Veterans Affairs medical center in Maryland, according to one indictment. The president of Siena and her co-conspirators sold more than 2,000 fake diplomas, according to charging documents.
At the Palm Beach College of Nursing, individuals at various nursing prep and education programs allegedly helped others obtain fake degrees and transcripts, which were then used to pass RN and LPN/VN licensing exams in states that included Massachusetts, New Jersey, New York, and Ohio, according to the indictment.
Some individuals then secured employment with a nursing home in Ohio, a home health agency for pediatric patients in Massachusetts, and skilled nursing facilities in New York and New Jersey.
Prosecutors allege that the president of Sacred Heart International Institute and two other co-conspirators sold 588 fake diplomas.
The FBI said that some of the aspiring nurses who were talked into buying the degrees were LPNs who wanted to become RNs and that most of those lured into the scheme were from South Florida’s Haitian American immigrant community, Nurse.org reported.
A version of this article first appeared on Medscape.com.
Biden to end COVID emergencies in May
Doing so will have many effects, including the end of free vaccines and health services to fight the pandemic. The public health emergency has been renewed every 90 days since it was declared by the Trump administration in January 2020.
The declaration allowed major changes throughout the health care system to deal with the pandemic, including the free distribution of vaccines, testing, and treatments. In addition, telehealth services were expanded, and Medicaid and the Children’s Health Insurance Program were extended to millions more Americans.
Biden said the COVID-19 national emergency is set to expire March 1 while the declared public health emergency would currently expire on April 11. The president said both will be extended to end May 11.
There were nearly 300,000 newly reported COVID-19 cases in the United States for the week ending Jan. 25, according to CDC data, as well as more than 3,750 deaths.
A version of this article first appeared on WebMD.com.
Healthy habits lower T2D microvascular risks: Cohort study
People with diabetes who adhere to a healthy diet, exercise regularly, and follow other healthy lifestyle practices have a significantly lower risk of microvascular complications from the disease, such as diabetic neuropathy, retinopathy, and nephropathy, as well as foot disorders, than counterparts with diabetes who don’t, a prospective cohort study of more than 7,000 patients with type 2 diabetes has found.

“We believe this is one of the first large-scale analyses among diabetes patients that specifically examined an overall healthy lifestyle in relation to the risk of developing microvascular complications,” senior study author Qi Sun, MD, ScD, said in an interview. “The results are not surprising that the healthy lifestyle is associated with lower risk of developing these complications and the enhanced adherence to the healthy lifestyle is associated with lower risk as well. And these findings bear lots of public health significance as they suggest the important role of living a healthy lifestyle in the prevention of diabetes complications, on top of the clinical treatment.”
Dr. Sun is an associate professor of nutrition and epidemiology at the Harvard T.H. Chan School of Public Health, Boston.
The study stated that the findings “lend support” for the American Diabetes Association guidelines for healthy lifestyle practices in people with diabetes.
The study used a cohort from two large prospective cohort studies, the Nurses’ Health Study (NHS) and the Health Professionals Follow-up Study (HPFS), comprising 4,982 women and 2,095 men who were diagnosed with type 2 diabetes during follow-up. They had no cardiovascular disease or cancer at the time of their diabetes diagnosis. Both NHS and HPFS used validated questionnaires to gather information on diet, lifestyle, medical history, and newly diagnosed diseases every 2-4 years. The latter study included NHS and HPFS participants who also completed supplementary questionnaires about their diabetes.
The latest study took into account five modifiable lifestyle-related factors: diet, body weight, smoking status, alcohol, and physical activity. For diet, both large studies used the 2010 Alternate Healthy Eating Index to assess diet quality; those in the upper 40th percentile of the study population were defined as healthy diet. Healthy body weight was defined at a body mass index of 18.5-25 kg/m2.
Among the latter study cohort, 2,878 incident cases of diabetic microvascular complications were documented during follow-up. Patients who adhered to a healthy lifestyle before their diabetes diagnosis, defined as having four or more low-risk lifestyle factors, had a 27% lower relative risk of developing any microvascular complication than counterparts with no low-risk lifestyle factors (relative risk, 0.73; 95% confidence interval, 0.35-1; P = .006).
The study found similar outcomes for those who adopted a healthy lifestyle after their diabetes diagnosis, with a 32% reduction in relative risk compared with those who didn’t adopt any healthy lifestyle practices (RR, 0.68; 95% CI, 0.55-0.83; P < .001).
Dr. Sun noted what was noteworthy about his group’s cohort study. “The unique design is truly the prospective follow-up over time so that we could examine the lifestyle at diabetes diagnosis as well as changes in lifestyle before and after diabetes in relation to the future risk of developing the complications,” he said.
A randomized trial would be a more rigorous way to evaluate the impact of a healthy lifestyle, he added, “although it’s much more expensive than a cohort study like what we did with this investigation.”
As for future research, Dr. Sun said, “It will be interesting to understand mechanisms underlying these observations. It’s also critical to understand why certain diabetes patients may not benefit from a healthy lifestyle, since some of them, even when living a healthy lifestyle, still develop the complications.”
This trial shows in a new light the benefits of healthy lifestyle practices on microvascular complications of type 2 diabetes, Paul S. Jellinger, MD, of the Center for Diabetes and Endocrine Care in Hollywood, Fla., and a professor at the University of Miami, said in a comment. “These benefits have always been surmised and demonstrated in a limited way in previous trials, but not subject to the level of analysis seen in this prospective cohort trial.”
He called the study design “excellent,” adding, “ ‘Validated’ self-reported questionnaires were used widely, although minimal detail is provided about the validation process.” One limitation, he noted, was “the homogeneity of the participants; all were health professionals.”
The study “affirms” and “quantitates” the benefits of a healthy lifestyle in type 2 diabetes. “The issue is not unawareness but rather application,” Dr. Jellinger said. “Modifying long-held lifestyle habits is a real challenge. Perhaps by ‘quantitating’ the benefit, as shown in this trial and hopefully additional studies, impetus will be provided to refocus on this approach, which is too often simply given lip service.”
The National Institutes of Health provided funding for the study. Dr. Sun has no relevant disclosures. Dr. Jellinger disclosed relationships with Amgen and Esperion.
People with diabetes who adhere to a healthy diet, exercise regularly, and follow other healthy lifestyle practices have a significantly lower risk of microvascular complications from the disease, such as diabetic neuropathy, retinopathy, and nephropathy, as well as foot disorders, than counterparts with diabetes who don’t, a prospective cohort study of more than 7,000 patients with type 2 diabetes has found.
“We believe this is one of the first large-scale analyses among diabetes patients that specifically examined an overall healthy lifestyle in relation to the risk of developing microvascular complications,” senior study author Qi Sun, MD, ScD, said in an interview. “The results are not surprising that the healthy lifestyle is associated with lower risk of developing these complications and the enhanced adherence to the healthy lifestyle is associated with lower risk as well. And these findings bear lots of public health significance as they suggest the important role of living a healthy lifestyle in the prevention of diabetes complications, on top of the clinical treatment.”
Dr. Sun is an associate professor of nutrition and epidemiology at the Harvard T.H. Chan School of Public Health, Boston.
The study stated that the findings “lend support” for the American Diabetes Association guidelines for healthy lifestyle practices in people with diabetes.
The study used a cohort from two large prospective cohort studies, the Nurses’ Health Study (NHS) and the Health Professionals Follow-up Study (HPFS), comprising 4,982 women and 2,095 men who were diagnosed with type 2 diabetes during follow-up. They had no cardiovascular disease or cancer at the time of their diabetes diagnosis. Both NHS and HPFS used validated questionnaires to gather information on diet, lifestyle, medical history, and newly diagnosed diseases every 2-4 years. The latter study included NHS and HPFS participants who also completed supplementary questionnaires about their diabetes.
The latest study took into account five modifiable lifestyle-related factors: diet, body weight, smoking status, alcohol, and physical activity. For diet, both large studies used the 2010 Alternate Healthy Eating Index to assess diet quality; those in the upper 40th percentile of the study population were defined as healthy diet. Healthy body weight was defined at a body mass index of 18.5-25 kg/m2.
Among the latter study cohort, 2,878 incident cases of diabetic microvascular complications were documented during follow-up. Patients who adhered to a healthy lifestyle before their diabetes diagnosis, defined as having four or more low-risk lifestyle factors, had a 27% lower relative risk of developing any microvascular complication than counterparts with no low-risk lifestyle factors (relative risk, 0.73; 95% confidence interval, 0.35-1; P = .006).
The study found similar outcomes for those who adopted a healthy lifestyle after their diabetes diagnosis, with a 32% reduction in relative risk compared with those who didn’t adopt any healthy lifestyle practices (RR, 0.68; 95% CI, 0.55-0.83; P < .001).
Dr. Sun noted what was noteworthy about his group’s cohort study. “The unique design is truly the prospective follow-up over time so that we could examine the lifestyle at diabetes diagnosis as well as changes in lifestyle before and after diabetes in relation to the future risk of developing the complications,” he said.
A randomized trial would be a more rigorous way to evaluate the impact of a healthy lifestyle, he added, “although it’s much more expensive than a cohort study like what we did with this investigation.”
As for future research, Dr. Sun said, “It will be interesting to understand mechanisms underlying these observations. It’s also critical to understand why certain diabetes patients may not benefit from a healthy lifestyle, since some of them, even when living a healthy lifestyle, still develop the complications.”
This trial shows in a new light the benefits of healthy lifestyle practices on microvascular complications of type 2 diabetes, Paul S. Jellinger, MD, of the Center for Diabetes and Endocrine Care in Hollywood, Fla., and a professor at the University of Miami, said in a comment. “These benefits have always been surmised and demonstrated in a limited way in previous trials, but not subject to the level of analysis seen in this prospective cohort trial.”
He called the study design “excellent,” adding, “ ‘Validated’ self-reported questionnaires were used widely, although minimal detail is provided about the validation process.” One limitation, he noted, was “the homogeneity of the participants; all were health professionals.”
The study “affirms” and “quantitates” the benefits of a healthy lifestyle in type 2 diabetes. “The issue is not unawareness but rather application,” Dr. Jellinger said. “Modifying long-held lifestyle habits is a real challenge. Perhaps by ‘quantitating’ the benefit, as shown in this trial and hopefully additional studies, impetus will be provided to refocus on this approach, which is too often simply given lip service.”
The National Institutes of Health provided funding for the study. Dr. Sun has no relevant disclosures. Dr. Jellinger disclosed relationships with Amgen and Esperion.
FROM JAMA NETWORK OPEN
Scalp ridges

The gyrate or cerebriform pattern of inflammatory, often pus-filled, subcutaneous tracts of the scalp pointed to a diagnosis of dissecting cellulitis. This patient did not have the fluctuant tracts frequently seen in more active disease but did have the scarring and alopecia common with this disorder.
Dissecting cellulitis is similar to acne and hidradenitis suppurativa in that it starts with follicular plugging. This plugging leads to inflammation, dilation and rupture of the follicle, and purulent sinus tract formation. The sinus tracts of the scalp can be extensive. Dissecting cellulitis is most common in 18- to 40-year-olds and more common in Black individuals.1 When it occurs in conjunction with cystic acne and hidradenitis suppurativa, it is known as the follicular occlusion triad syndrome.
While oral antibiotics are an option for the treatment of dissecting cellulitis, oral isotretinoin is the first-line approach. Tumor necrosis factor alfa inhibitors have also been used with success, according to case reports.1
Given that this patient had a small area of current inflammation, he was started on oral doxycycline 100 mg twice daily for 2 months. He was scheduled for a follow-up appointment in 3 months to reassess his progress and to explore treatment with isotretinoin if the condition worsened or did not improve.
Photo and text courtesy of Daniel Stulberg, MD, FAAFP, Professor and Chair, Department of Family and Community Medicine, Western Michigan University Homer Stryker, MD School of Medicine, Kalamazoo.
1. Federico A, Rossi A, Caro G, et al. Are dissecting cellulitis and hidradenitis suppurativa different diseases? Clin Dermatol. 2021;39:496-499. doi: 10.1016/j.clindermatol.2021.01.002
The gyrate or cerebriform pattern of inflammatory, often pus-filled, subcutaneous tracts of the scalp pointed to a diagnosis of dissecting cellulitis. This patient did not have the fluctuant tracts frequently seen in more active disease but did have the scarring and alopecia common with this disorder.
Dissecting cellulitis is similar to acne and hidradenitis suppurativa in that it starts with follicular plugging. This plugging leads to inflammation, dilation and rupture of the follicle, and purulent sinus tract formation. The sinus tracts of the scalp can be extensive. Dissecting cellulitis is most common in 18- to 40-year-olds and more common in Black individuals.1 When it occurs in conjunction with cystic acne and hidradenitis suppurativa, it is known as the follicular occlusion triad syndrome.
While oral antibiotics are an option for the treatment of dissecting cellulitis, oral isotretinoin is the first-line approach. Tumor necrosis factor alfa inhibitors have also been used with success, according to case reports.1
Given that this patient had a small area of current inflammation, he was started on oral doxycycline 100 mg twice daily for 2 months. He was scheduled for a follow-up appointment in 3 months to reassess his progress and to explore treatment with isotretinoin if the condition worsened or did not improve.
Photo and text courtesy of Daniel Stulberg, MD, FAAFP, Professor and Chair, Department of Family and Community Medicine, Western Michigan University Homer Stryker, MD School of Medicine, Kalamazoo.
1. Federico A, Rossi A, Caro G, et al. Are dissecting cellulitis and hidradenitis suppurativa different diseases? Clin Dermatol. 2021;39:496-499. doi: 10.1016/j.clindermatol.2021.01.002
1. Federico A, Rossi A, Caro G, et al. Are dissecting cellulitis and hidradenitis suppurativa different diseases? Clin Dermatol. 2021;39:496-499. doi: 10.1016/j.clindermatol.2021.01.002
