User login
Timely Diagnosis of Lung Cancer in a Dedicated VA Referral Unit with Endobronchial Ultrasound Capability (FULL)
Lung cancer is the leading cause of cancer death in the US, with 154 050 deaths in 2018.1 There have been many attempts to reduce mortality of the disease through early diagnosis with use of computed tomography (CT). The National Lung Cancer Screening trial showed that screening high-risk populations with low-dose CT (LDCT) can reduce mortality.2 However, implementing LDCT screening in the clinical setting has proven challenging, as illustrated by the VA Lung Cancer Screening Demonstration Project (LCSDP).3 A lung cancer diagnosis typically comprises several steps that require different medical specialties; this can lead to delays. In the LCSDP, the mean time to diagnosis was 137 days.3 There are no federal standards for timeliness of lung cancer diagnosis.
The nonprofit RAND Corporation is the only American research organization that has published guidelines specifying acceptable intervals for the diagnosis and treatment of lung cancer. In Quality of Care for Oncologic Conditions and HIV, RAND Corporation researchers propose management quality indicators: lung cancer diagnosis within 2 months of an abnormal radiologic study and treatment within 6 weeks of diagnosis.4 The Swedish Lung Cancer Study5 and the Canadian Strategy for Cancer Control6 both recommended a standard of about 30 days—half the time recommended by the RAND Corporation.
Bukhari and colleagues at the Dayton US Department of Veterans Affairs (VA) Medical Center (VAMC) conducted a quality improvement study that examined lung cancer diagnosis and management.7 They found the time (SD) from abnormal chest imaging to diagnosis was 35.5 (31.6) days. Of those veterans who received a lung cancer diagnosis, 89.2% had the diagnosis made within the 60 days recommended by the RAND Corporation. Although these results surpass those of the LCSDP, they can be exceeded.
Beyond the potential emotional distress of awaiting the final diagnosis of a lung lesion, a delay in diagnosis and treatment may adversely affect outcomes. LDCT screening has been shown to reduce mortality, which implies a link between survival and time to intervention. There is no published evidence that time to diagnosis in advanced stage lung cancer affects outcome. The National Cancer Database (NCDB) contains informtion on about 70% of the cancers diagnosed each year in the US.8 An analysis of 4984 patients with stage IA squamous cell lung cancer undergoing lobectomy from NCDB showed that earlier surgery was associated with an absolute decrease in 5-year mortality of 5% to 8%. 9 Hence, at least in early-stage disease, reduced time from initial suspect imaging to definitive treatment may improve survival.
A system that coordinates the requisite diagnostic steps and avoids delays should provide a significant improvement in patient care. The results of such an approach that utilized nurse navigators has been previously published. 10 Here, we present the results of a dedicated VA referral clinic with priority access to pulmonary consultation and procedures in place that are designed to expedite the diagnosis of potential lung cancer.
Methods
The John L. McClellan Memorial Veterans Hospital (JLMMVH) in Little Rock, Arkansas institutional review board approved this study, which was performed in accordance with the Declaration of Helsinki. Requirement for informed consent was waived, and patient confidentiality was maintained throughout.
We have developed a plan of care specifically to facilitate diagnosis and treatment of the large number of veterans referred to the JLMMVH Diagnostic Clinic for abnormal results of chest imaging. The clinic has priority access to same-day imaging and subspecialty consultation services. In the clinic, medical students and residents perform evaluations and a registered nurse (RN) manager coordinates care.
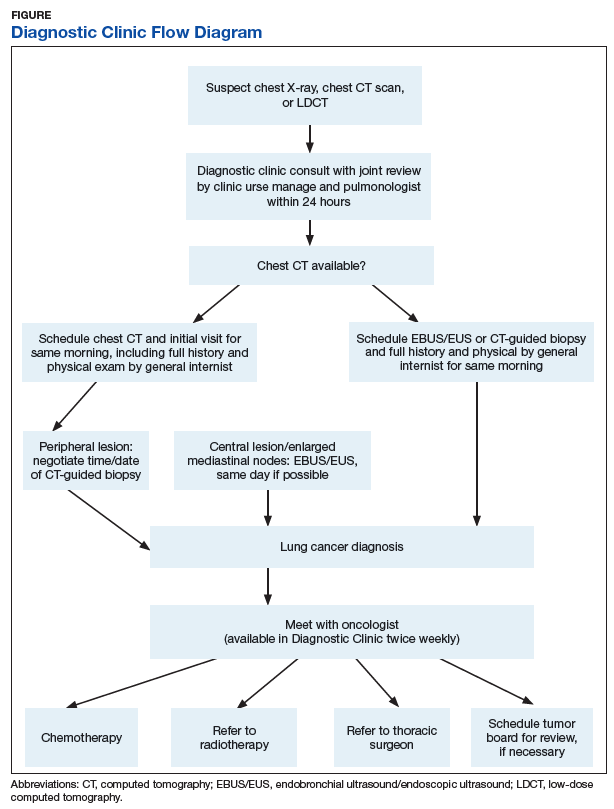
A Diagnostic Clinic consult for abnormal thoracic imaging immediately triggers an e-consult to an interventional pulmonologist (Figure). The RN manager and pulmonologist perform a joint review of records/imaging prior to scheduling, and the pulmonologist triages the patient. Triage options include follow-up imaging, bronchoscopy with endobronchial ultrasound (EBUS), endoscopic ultrasound (EUS), and CT-guided biopsy.
The RN manager then schedules a clinic visit that includes a medical evaluation by clinic staff and any indicated procedures on the same day. The interventional pulmonologist performs EBUS, EUS with the convex curvilinear bronchoscope, or both combined as indicated for diagnosis and staging. All procedures are performed in the JLMMVH bronchoscopy suite with standard conscious sedation using midazolam and fentanyl. Any other relevant procedures, such as pleural tap, also are performed at time of procedure. The pulmonologist and an attending pathologist interpret biopsies obtained in the bronchoscopy suite.
We performed a retrospective chart review of patients diagnosed with primary lung cancer through referral to the JLMMVH Diagnostic Clinic. The primary outcome was time from initial suspect chest imaging to cancer diagnosis. The study population consisted of patients referred for abnormal thoracic imaging between January 1, 2013 and December 31, 2016 and subsequently diagnosed with a primary lung cancer.
Subjects were excluded if (1) the patient was referred from outside our care network and a delay of > 10 days occurred between initial lesion imaging and referral; (2) the patient did not show up for appointments or chose to delay evaluation following referral; (3) biopsy demonstrated a nonlung primary cancer; and (4) serious intercurrent illness interrupted the diagnostic plan. In some cases, the radiologist or consulting pulmonologist had judged the lung lesion too small for immediate biopsy and recommended repeat imaging at a later date.
Patients were included in the study if the follow- up imaging led to a lung cancer diagnosis. However, because the interval between the initial imaging and the follow-up imaging in these patients did not represent a systems delay problem, the date of the scheduled follow-up abnormal imaging, which resulted in initiation of a potential cancer evaluation, served as the index suspect imaging date for this study.
Patient electronic medical records were reviewed and the following data were abstracted: date of the abnormal imaging that led to referral and time from abnormal chest X-ray to chest CT scan if applicable; date of referral and date of clinic visit; date of biopsy; date of lung cancer diagnosis; method of obtaining diagnostic specimen; lung cancer type and stage; type and date of treatment initiation or decision for supportive care only; and decision to seek further evaluation or care outside of our system.
All patients diagnosed with lung cancer during the study period were reviewed for inclusion, hence no required sample-size estimate was calculated. All outcomes were assessed as calendar days. The primary outcome was the time from the index suspect chest imaging study to the date of diagnosis of lung cancer. Prior to the initiation of our study, we chose this more stringent 30-day recommendation of the Canadian6 and Swedish5 studies as the comparator for our primary outcome, although data with respect to the 60-day Rand Corporation guidelines also are reported.4
Statistical Methods
The mean time to lung cancer diagnosis in our cohort was compared with this 30-day standard using a 2-sided Mann–Whitney U test. Normality of data distribution was determined using the Kolmogorov–Smirnov test. For statistical significance testing a P value of .05 was used. Statistical calculations were performed using R statistical software version 3.2.4. Secondary outcomes consisted of time from diagnosis to treatment; proportion of subjects diagnosed within 60 days; time from initial clinic visit to biopsy; and time from biopsy to diagnosis.
Results
Overall, 222 patients were diagnosed with a malignant lung lesion, of which 63 were excluded from analysis: 22 cancelled or did not appear for appointments, declined further evaluation, or completed evaluation outside of our network; 13 had the diagnosis made prior to Diagnostic Clinic visit; 13 proved to have a nonlung primary tumor presenting in the lung or mediastinal nodes; 12 were delayed > 10 days in referral from an outside network; and 3 had an intervening serious acute medical problem forcing delay in the diagnostic process.
Of the 159 included subjects, 154 (96.9%) were male, and the mean (SD) age was 67.6 (8.1) years. For 76 subjects, the abnormal chest X-ray and subsequent chest CT scan were performed the same day or the lung lesion had initially been noted on a CT scan. For 54 subjects, there was a delay of ≥ 1 week in obtaining a chest CT scan. The mean (SD) time from placement of the Diagnostic Clinic consultation by the primary care provider (PCP) or other provider and the initial Diagnostic Clinic visit was 6.3 (4.4) days. The mean (SD) time from suspect imaging to diagnosis (primary outcome) was 22.6(16.6) days.
The distribution of this outcome was nonnormal (Kolmogorov-Smirnov test P < .01). When compared with the standard of 30 days, the primary outcome of 22.6 days was significantly shorter (2-sided Mann–Whitney U test P < .01). Three-quarters (76.1%) of subjects were diagnosed within 30 days and 95.0% of subjects were diagnosed within 60 days of the initial imaging. For the 8 subjects diagnosed after 60 days, contributing factors included PCP delay in Diagnostic Clinic consultation, initial negative biopsy, delay in performance of chest CT scan prior to consultation, and outsourcing of positron emission tomography (PET) scans.
Overall, 57 (35.8%) of the subjects underwent biopsy on the day of their Diagnostic Clinic visit: 14 underwent CT-guided biopsy and 43 underwent EBUS/EUS. Within 2 days of the initial visit 106 subjects (66.7%) had undergone biopsy. The mean (SD) time from initial Diagnostic Clinic visit to biopsy was 6.3 (9.5) days. The mean (SD) interval was 1.8 (3.0) days for EBUS/ EUS and 11.3 (11.7) days for CT-guided biopsy. The mean (SD) interval from biopsy to diagnosis was 3.2 (6.2) days with 64 cases (40.3%) diagnosed the day of biopsy.
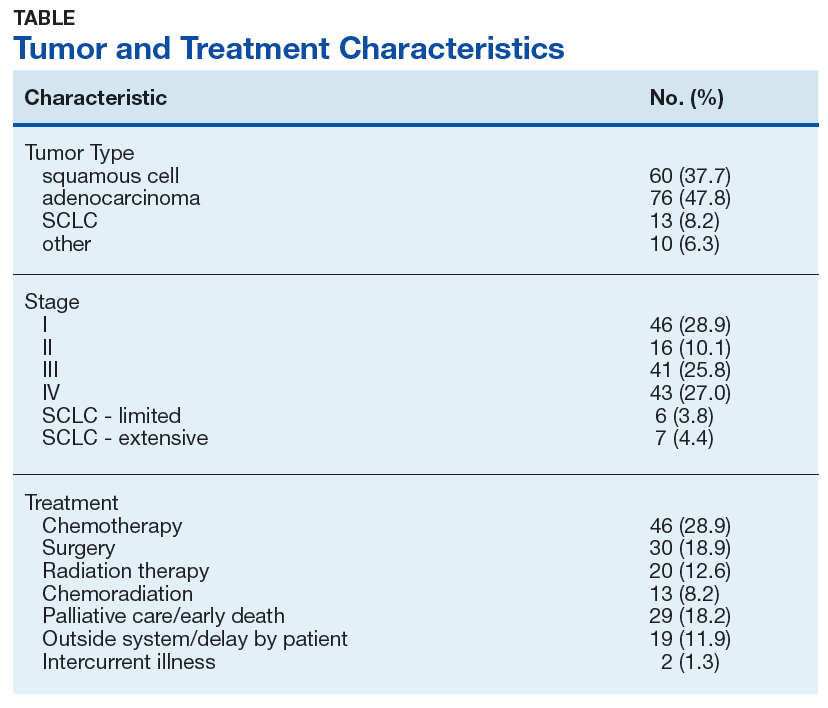
Excluding subjects whose treatment was delayed by patient choice or intercurrent illness, and those who left the VA system to seek treatment elsewhere (n = 21), 24 opted for palliative care, 5 died before treatment could be initiated, and 109 underwent treatment for their tumors (Table). The mean times (SD) from diagnosis to treatment were: chemotherapy alone 34.7 (25.3) days; chemoradiation 37.0 (22.8) days; surgery 44.3 (24.4) days; radiation therapy alone 47.9 (26.0) days. With respect to the RAND Corporation recommended diagnosis to treatment time, 60.9% of chemotherapy alone, 61.5% of chemoradiation, 66.7% of surgery, and 45.0% of radiation therapy alone treatments were initiated within the 6-week window.
Discussion
This retrospective case study demonstrates the effectiveness of a dedicated diagnostic clinic with priority EBUS/EUS access in diagnosing lung cancer within the VA system. Although there is no universally accepted quality standard for comparison, the RAND Corporation recommendation of 60 days from abnormal imaging to diagnosis and the Dayton VAMC published mean of 35.5 days are guideposts; however, the results from the Dayton VAMC may have been affected negatively by some subjects undergoing serial imaging for asymptomatic nodules. We chose a more stringent standard of 30 days as recommended by Swedish and Canadian task forces.
When diagnosing lung cancer, the overriding purpose of the Diagnostic Clinic is to minimize system delays. The method is to have as simple a task as possible for the PCP or other provider who identifies a lung nodule or mass and submits a single consultation request to the Diagnostic Clinic. Once this consultation is placed, the clinic RN manager oversees all further steps required for diagnosis and referral for treatment. The key factor in achieving a mean diagnosis time of 22.6 days is the cooperation between the RN manager and the interventional pulmonologist. When a consultation is received, the RN manager and pulmonologist review the data together and schedule the initial clinic visit; the goal is same-day biopsy, which is achieved in more than one-third of cases. Not all patients with a chest image suspected for lung cancer had it ordered by their PCP. For this reason, a Diagnostic Clinic consultation is available to all health care providers in our system. Many patients reach the clinic after the discovery of a suspect chest X-ray during an emergency department visit, a regularly scheduled subspecialty appointment, or during a preoperative evaluation.
The mean time from initial visit to biopsy was 1.8 days for EBUS/EUS compared with an interval of 11.3 days for CT-guided biopsy. This difference reflects the pulmonologist’s involvement in initial scheduling of Diagnostic Clinic patients. The ability of the pulmonologist to provide an accurate assessment of sample adequacy and a preliminary diagnosis at bedside, with concurrent confirmation by a staff pathologist, permitted the Diagnostic Clinic to inform 40.3% of patients of the finding of malignancy on the day of biopsy. A published comparison of the onsite review of biopsy material showed our pulmonologist and staff pathologists to be equally accurate in their interpretations.11
Sources of Delays
While this study documents the shortest intervals from suspect imaging to diagnosis reported to date, it also identifies sources of system delay in diagnosing lung cancer that JLMMVH could further optimize. The first is the time from initial abnormal chest X-ray imaging to performance of the chest CT scan. On occasion, the index lung lesion is identified unexpectedly on an outpatient or emergency department chest CT scan. With greater use of LDCT lung cancer screening, the initial detection of suspect lesions by CT scanning will increase in the future. However, the PCP most often investigates a patient complaint with a standard chest X-ray that reveals a suspect nodule or mass. When ordered by the PCP as an outpatient test, scheduling of the follow-up chest CT scan is not given priority. More than a third of subjects experienced a delay ≥ 1 week in obtaining a chest CT scan ordered by the PCP; for 29 subjects the delay was ≥ 3weeks. At JLMMVH, the Diagnostic Clinic is given priority in scheduling CT scans. Hence, for suspect lung lesions, the chest CT scan, if not already obtained, is generally performed on the morning of the clinic visit. Educating the PCP to refer the patient immediately to the Diagnostic Clinic rather than waiting to obtain an outpatient chest CT scan may remove this source of unnecessary delay.
Scheduling a CT-guided fine needle aspiration of a lung lesion is another source of system delay. When the chest CT scan is available at the time of the Diagnostic Clinic referral, the clinic visit is scheduled for the earliest day a required CT-guided biopsy can be performed. However, the mean time of 11.3 days from initial Diagnostic Clinic visit to CT-guided biopsy is indicative of the backlog faced by the interventional radiologists.
Although infrequent, PET scans that are required before biopsy can lead to substantial delays. PET scans are performed at our university affiliate, and the joint VA-university lung tumor board sometimes generates requests for such scans prior to tissue diagnosis, yet another source of delay.
The time from referral receipt to the Diagnostic Clinic visit averaged 6.3 days. This delay usually was determined by the availability of the CT-guided biopsy or the dedicated interventional pulmonologist. Although other interventional pulmonologists at JLMMVH may perform the requisite diagnostic procedures, they are not always available for immediate review of imaging studies of referred patients nor can their schedules flexibly accommodate the number of patients seen in our clinic for evaluation.
Lung Cancer Diagnosis
Prompt diagnosis in the setting of a worrisome chest X-ray may help decrease patient anxiety, but does the clinic improve lung cancer treatment outcomes? Such improvement has been demonstrated only in stage IA squamous cell lung cancer.9 Of our study population, 37.7% had squamous cell carcinoma, and 85.5% had non-small cell lung cancer. Of those with non-small cell lung cancer, 28.9% had a clinical stage I tumor. Stage I squamous cell carcinoma, the type of tumor most likely to benefit from early diagnosis and treatment, was diagnosed in 11.3% of patients. With the increased application of LDCT screening, the proportion of veterans identified with early stage lung cancer may rise. The Providence VAMC in Rhode Island reported its results from instituting LDCT screening.12 Prior to screening, 28% of patients diagnosed with lung cancer had a stage I tumor. Following the introduction of LDCT screening, 49% diagnosed by LDCT screening had a stage I tumor. Nearly a third of their patients diagnosed with lung cancer through LDCT screening had squamous cell tumor histology. Thus, we can anticipate an increasing number of veterans with early stage lung cancer who would benefit from timely diagnosis.
The JLMMVH is a referral center for the entire state of Arkansas. Quite a few of its referred patients come from a long distance, which may require overnight housing and other related travel expenses. Apart from any potential outcome benefit, the efficiencies of the system described herein include the minimization of extra trips, an inconvenience and cost to both patient and JLMMVH.
Although the primary task of the clinic is diagnosis, we also seek to facilitate timely treatment. Our lack of an on-site PET scanner and radiation therapy, resources present on-site at the Dayton VAMC, contribute to longer therapy wait times. The shortest mean wait time at JLMMVH is for chemotherapy alone (34.7 days), in part because the JLMMVH oncologists, performing initial consultations 2 to 3 times weekly in the Diagnostic Clinic, are more readily available than are our thoracic surgeons or radiation therapists. Yet overall, JLMMVH patients often face delay from the time of lung cancer diagnosis to initiation of treatment.
The Connecticut Veterans Affairs Healthcare System has published the results of changes in lung cancer management associated with a nurse navigator system.10 Prior to creating the position of cancer care coordinator, filled by an advanced practice RNs, the mean time from clinical suspicion of lung cancer to treatment was 117 days. After 4 years of such care navigation, this waiting time had decreased to 52.4 days. Associated with this dramatic improvement in overall waiting time were decreases in the turnaround time required for performance of CT and PET scans. With respect to this big picture view of lung cancer care, our Diagnostic Clinic serves as a model for the initial step of diagnosis. Coordination and streamlining of the various steps from diagnosis to definitive therapy shall require a more system-wide effort involving all the key players in cancer care.
Conclusion
We have developed a care pathway based in a dedicated diagnostic clinic and have been able to document the shortest interval from abnormality to diagnosis of lung cancer reported in the literature to date. Efficient functioning of this clinic is dependent upon the close cooperation between a full-time RN clinic manager and an interventional pulmonologist experienced in lung cancer management and able to interpret cytologic samples at the time of biopsy. Shortening the delay between diagnosis and definitive therapy remains a challenge and may benefit from the oncology nurse navigator model previously described within the VA system. 10
1. American Cancer Society. Cancer Facts & Figures. https://www.cancer.org/content/dam/cancer-org/research/cancer-facts-and-statistics/annual-cancer-facts-and-figures/2018/cancer-facts-and-figures-2018.pdf. Accessed July 13, 2019.
2. National Lung Screening Trial Research Team, Aberle DR, Adams AM, et al. Reduced lung-cancer mortality with low-dose computed tomographic screening. N Eng J Med. 2011;365(5):395-409.
3. Kinsinger LS, Anderson C, Kim J, et al. Implementation of lung cancer screening in the Veterans Health Administration. JAMA Intern Med. 2017;177(3):399-406.
4. Asch SM, Kerr EA, Hamilton EG, Reifel JL, McGlynn EA, eds. Quality of Care for Oncologic Conditions and HIV: A Review of the Literature and Quality Indicators. Santa Monica, CA: RAND Corporation; 2000.
5. Hillerdal G. [Recommendations from the Swedish Lung Cancer Study Group: Shorter waiting times are demanded for quality in diagnostic work-ups for lung care.] Swedish Med J 1999; 96: 4691.
6. Simunovic M, Gagliardi A, McCready D, Coates A, Levine M, DePetrillo D. A snapshot of waiting times for cancer surgery provided by surgeons affiliated with regional cancer centres in Ontario. CMAJ. 2001;165(4):421-425. [Canadian Strategy for Cancer Control]
7. Bukhari A, Kumar G, Rajsheker R, Markert R. Timeliness of lung cancer diagnosis and treatment. Fed Pract. 2017;34(suppl 1):24S-29S.
8. Bilimoria KY, Ko CY, Tomlinson JS, et al. Wait times for cancer surgery in the United States: trends and predictors of delays. Ann Surg. 2011;253(4):779-785.
9. Yang CJ, Wang H, Kumar A, et al. Impact of timing of lobectomy on survival for clinical stage IA lung squamous cell carcinoma. Chest. 2017;152(6):1239-1250.
10. Hunnibell LS, Rose MG, Connery DM, et al. Using nurse navigation to improve timeliness of lung cancer care at a veterans hospital. Clin J Oncol Nurs. 2012;16(1):29-36.
11. Meena N, Jeffus S, Massoll N, et al. Rapid onsite evaluation: a comparison of cytopathologist and pulmonologist performance. Cancer Cytopatho. 2016;124(4):279-84.
12. Okereke IC, Bates MF, Jankowich MD, et al. Effects of implementation of lung cancer screening at one Veterans Affairs Medical Center. Chest 2016;150(5):1023-1029.
Lung cancer is the leading cause of cancer death in the US, with 154 050 deaths in 2018.1 There have been many attempts to reduce mortality of the disease through early diagnosis with use of computed tomography (CT). The National Lung Cancer Screening trial showed that screening high-risk populations with low-dose CT (LDCT) can reduce mortality.2 However, implementing LDCT screening in the clinical setting has proven challenging, as illustrated by the VA Lung Cancer Screening Demonstration Project (LCSDP).3 A lung cancer diagnosis typically comprises several steps that require different medical specialties; this can lead to delays. In the LCSDP, the mean time to diagnosis was 137 days.3 There are no federal standards for timeliness of lung cancer diagnosis.
The nonprofit RAND Corporation is the only American research organization that has published guidelines specifying acceptable intervals for the diagnosis and treatment of lung cancer. In Quality of Care for Oncologic Conditions and HIV, RAND Corporation researchers propose management quality indicators: lung cancer diagnosis within 2 months of an abnormal radiologic study and treatment within 6 weeks of diagnosis.4 The Swedish Lung Cancer Study5 and the Canadian Strategy for Cancer Control6 both recommended a standard of about 30 days—half the time recommended by the RAND Corporation.
Bukhari and colleagues at the Dayton US Department of Veterans Affairs (VA) Medical Center (VAMC) conducted a quality improvement study that examined lung cancer diagnosis and management.7 They found the time (SD) from abnormal chest imaging to diagnosis was 35.5 (31.6) days. Of those veterans who received a lung cancer diagnosis, 89.2% had the diagnosis made within the 60 days recommended by the RAND Corporation. Although these results surpass those of the LCSDP, they can be exceeded.
Beyond the potential emotional distress of awaiting the final diagnosis of a lung lesion, a delay in diagnosis and treatment may adversely affect outcomes. LDCT screening has been shown to reduce mortality, which implies a link between survival and time to intervention. There is no published evidence that time to diagnosis in advanced stage lung cancer affects outcome. The National Cancer Database (NCDB) contains informtion on about 70% of the cancers diagnosed each year in the US.8 An analysis of 4984 patients with stage IA squamous cell lung cancer undergoing lobectomy from NCDB showed that earlier surgery was associated with an absolute decrease in 5-year mortality of 5% to 8%. 9 Hence, at least in early-stage disease, reduced time from initial suspect imaging to definitive treatment may improve survival.
A system that coordinates the requisite diagnostic steps and avoids delays should provide a significant improvement in patient care. The results of such an approach that utilized nurse navigators has been previously published. 10 Here, we present the results of a dedicated VA referral clinic with priority access to pulmonary consultation and procedures in place that are designed to expedite the diagnosis of potential lung cancer.
Methods
The John L. McClellan Memorial Veterans Hospital (JLMMVH) in Little Rock, Arkansas institutional review board approved this study, which was performed in accordance with the Declaration of Helsinki. Requirement for informed consent was waived, and patient confidentiality was maintained throughout.
We have developed a plan of care specifically to facilitate diagnosis and treatment of the large number of veterans referred to the JLMMVH Diagnostic Clinic for abnormal results of chest imaging. The clinic has priority access to same-day imaging and subspecialty consultation services. In the clinic, medical students and residents perform evaluations and a registered nurse (RN) manager coordinates care.
A Diagnostic Clinic consult for abnormal thoracic imaging immediately triggers an e-consult to an interventional pulmonologist (Figure). The RN manager and pulmonologist perform a joint review of records/imaging prior to scheduling, and the pulmonologist triages the patient. Triage options include follow-up imaging, bronchoscopy with endobronchial ultrasound (EBUS), endoscopic ultrasound (EUS), and CT-guided biopsy.
The RN manager then schedules a clinic visit that includes a medical evaluation by clinic staff and any indicated procedures on the same day. The interventional pulmonologist performs EBUS, EUS with the convex curvilinear bronchoscope, or both combined as indicated for diagnosis and staging. All procedures are performed in the JLMMVH bronchoscopy suite with standard conscious sedation using midazolam and fentanyl. Any other relevant procedures, such as pleural tap, also are performed at time of procedure. The pulmonologist and an attending pathologist interpret biopsies obtained in the bronchoscopy suite.
We performed a retrospective chart review of patients diagnosed with primary lung cancer through referral to the JLMMVH Diagnostic Clinic. The primary outcome was time from initial suspect chest imaging to cancer diagnosis. The study population consisted of patients referred for abnormal thoracic imaging between January 1, 2013 and December 31, 2016 and subsequently diagnosed with a primary lung cancer.
Subjects were excluded if (1) the patient was referred from outside our care network and a delay of > 10 days occurred between initial lesion imaging and referral; (2) the patient did not show up for appointments or chose to delay evaluation following referral; (3) biopsy demonstrated a nonlung primary cancer; and (4) serious intercurrent illness interrupted the diagnostic plan. In some cases, the radiologist or consulting pulmonologist had judged the lung lesion too small for immediate biopsy and recommended repeat imaging at a later date.
Patients were included in the study if the follow- up imaging led to a lung cancer diagnosis. However, because the interval between the initial imaging and the follow-up imaging in these patients did not represent a systems delay problem, the date of the scheduled follow-up abnormal imaging, which resulted in initiation of a potential cancer evaluation, served as the index suspect imaging date for this study.
Patient electronic medical records were reviewed and the following data were abstracted: date of the abnormal imaging that led to referral and time from abnormal chest X-ray to chest CT scan if applicable; date of referral and date of clinic visit; date of biopsy; date of lung cancer diagnosis; method of obtaining diagnostic specimen; lung cancer type and stage; type and date of treatment initiation or decision for supportive care only; and decision to seek further evaluation or care outside of our system.
All patients diagnosed with lung cancer during the study period were reviewed for inclusion, hence no required sample-size estimate was calculated. All outcomes were assessed as calendar days. The primary outcome was the time from the index suspect chest imaging study to the date of diagnosis of lung cancer. Prior to the initiation of our study, we chose this more stringent 30-day recommendation of the Canadian6 and Swedish5 studies as the comparator for our primary outcome, although data with respect to the 60-day Rand Corporation guidelines also are reported.4
Statistical Methods
The mean time to lung cancer diagnosis in our cohort was compared with this 30-day standard using a 2-sided Mann–Whitney U test. Normality of data distribution was determined using the Kolmogorov–Smirnov test. For statistical significance testing a P value of .05 was used. Statistical calculations were performed using R statistical software version 3.2.4. Secondary outcomes consisted of time from diagnosis to treatment; proportion of subjects diagnosed within 60 days; time from initial clinic visit to biopsy; and time from biopsy to diagnosis.
Results
Overall, 222 patients were diagnosed with a malignant lung lesion, of which 63 were excluded from analysis: 22 cancelled or did not appear for appointments, declined further evaluation, or completed evaluation outside of our network; 13 had the diagnosis made prior to Diagnostic Clinic visit; 13 proved to have a nonlung primary tumor presenting in the lung or mediastinal nodes; 12 were delayed > 10 days in referral from an outside network; and 3 had an intervening serious acute medical problem forcing delay in the diagnostic process.
Of the 159 included subjects, 154 (96.9%) were male, and the mean (SD) age was 67.6 (8.1) years. For 76 subjects, the abnormal chest X-ray and subsequent chest CT scan were performed the same day or the lung lesion had initially been noted on a CT scan. For 54 subjects, there was a delay of ≥ 1 week in obtaining a chest CT scan. The mean (SD) time from placement of the Diagnostic Clinic consultation by the primary care provider (PCP) or other provider and the initial Diagnostic Clinic visit was 6.3 (4.4) days. The mean (SD) time from suspect imaging to diagnosis (primary outcome) was 22.6(16.6) days.
The distribution of this outcome was nonnormal (Kolmogorov-Smirnov test P < .01). When compared with the standard of 30 days, the primary outcome of 22.6 days was significantly shorter (2-sided Mann–Whitney U test P < .01). Three-quarters (76.1%) of subjects were diagnosed within 30 days and 95.0% of subjects were diagnosed within 60 days of the initial imaging. For the 8 subjects diagnosed after 60 days, contributing factors included PCP delay in Diagnostic Clinic consultation, initial negative biopsy, delay in performance of chest CT scan prior to consultation, and outsourcing of positron emission tomography (PET) scans.
Overall, 57 (35.8%) of the subjects underwent biopsy on the day of their Diagnostic Clinic visit: 14 underwent CT-guided biopsy and 43 underwent EBUS/EUS. Within 2 days of the initial visit 106 subjects (66.7%) had undergone biopsy. The mean (SD) time from initial Diagnostic Clinic visit to biopsy was 6.3 (9.5) days. The mean (SD) interval was 1.8 (3.0) days for EBUS/ EUS and 11.3 (11.7) days for CT-guided biopsy. The mean (SD) interval from biopsy to diagnosis was 3.2 (6.2) days with 64 cases (40.3%) diagnosed the day of biopsy.
Excluding subjects whose treatment was delayed by patient choice or intercurrent illness, and those who left the VA system to seek treatment elsewhere (n = 21), 24 opted for palliative care, 5 died before treatment could be initiated, and 109 underwent treatment for their tumors (Table). The mean times (SD) from diagnosis to treatment were: chemotherapy alone 34.7 (25.3) days; chemoradiation 37.0 (22.8) days; surgery 44.3 (24.4) days; radiation therapy alone 47.9 (26.0) days. With respect to the RAND Corporation recommended diagnosis to treatment time, 60.9% of chemotherapy alone, 61.5% of chemoradiation, 66.7% of surgery, and 45.0% of radiation therapy alone treatments were initiated within the 6-week window.
Discussion
This retrospective case study demonstrates the effectiveness of a dedicated diagnostic clinic with priority EBUS/EUS access in diagnosing lung cancer within the VA system. Although there is no universally accepted quality standard for comparison, the RAND Corporation recommendation of 60 days from abnormal imaging to diagnosis and the Dayton VAMC published mean of 35.5 days are guideposts; however, the results from the Dayton VAMC may have been affected negatively by some subjects undergoing serial imaging for asymptomatic nodules. We chose a more stringent standard of 30 days as recommended by Swedish and Canadian task forces.
When diagnosing lung cancer, the overriding purpose of the Diagnostic Clinic is to minimize system delays. The method is to have as simple a task as possible for the PCP or other provider who identifies a lung nodule or mass and submits a single consultation request to the Diagnostic Clinic. Once this consultation is placed, the clinic RN manager oversees all further steps required for diagnosis and referral for treatment. The key factor in achieving a mean diagnosis time of 22.6 days is the cooperation between the RN manager and the interventional pulmonologist. When a consultation is received, the RN manager and pulmonologist review the data together and schedule the initial clinic visit; the goal is same-day biopsy, which is achieved in more than one-third of cases. Not all patients with a chest image suspected for lung cancer had it ordered by their PCP. For this reason, a Diagnostic Clinic consultation is available to all health care providers in our system. Many patients reach the clinic after the discovery of a suspect chest X-ray during an emergency department visit, a regularly scheduled subspecialty appointment, or during a preoperative evaluation.
The mean time from initial visit to biopsy was 1.8 days for EBUS/EUS compared with an interval of 11.3 days for CT-guided biopsy. This difference reflects the pulmonologist’s involvement in initial scheduling of Diagnostic Clinic patients. The ability of the pulmonologist to provide an accurate assessment of sample adequacy and a preliminary diagnosis at bedside, with concurrent confirmation by a staff pathologist, permitted the Diagnostic Clinic to inform 40.3% of patients of the finding of malignancy on the day of biopsy. A published comparison of the onsite review of biopsy material showed our pulmonologist and staff pathologists to be equally accurate in their interpretations.11
Sources of Delays
While this study documents the shortest intervals from suspect imaging to diagnosis reported to date, it also identifies sources of system delay in diagnosing lung cancer that JLMMVH could further optimize. The first is the time from initial abnormal chest X-ray imaging to performance of the chest CT scan. On occasion, the index lung lesion is identified unexpectedly on an outpatient or emergency department chest CT scan. With greater use of LDCT lung cancer screening, the initial detection of suspect lesions by CT scanning will increase in the future. However, the PCP most often investigates a patient complaint with a standard chest X-ray that reveals a suspect nodule or mass. When ordered by the PCP as an outpatient test, scheduling of the follow-up chest CT scan is not given priority. More than a third of subjects experienced a delay ≥ 1 week in obtaining a chest CT scan ordered by the PCP; for 29 subjects the delay was ≥ 3weeks. At JLMMVH, the Diagnostic Clinic is given priority in scheduling CT scans. Hence, for suspect lung lesions, the chest CT scan, if not already obtained, is generally performed on the morning of the clinic visit. Educating the PCP to refer the patient immediately to the Diagnostic Clinic rather than waiting to obtain an outpatient chest CT scan may remove this source of unnecessary delay.
Scheduling a CT-guided fine needle aspiration of a lung lesion is another source of system delay. When the chest CT scan is available at the time of the Diagnostic Clinic referral, the clinic visit is scheduled for the earliest day a required CT-guided biopsy can be performed. However, the mean time of 11.3 days from initial Diagnostic Clinic visit to CT-guided biopsy is indicative of the backlog faced by the interventional radiologists.
Although infrequent, PET scans that are required before biopsy can lead to substantial delays. PET scans are performed at our university affiliate, and the joint VA-university lung tumor board sometimes generates requests for such scans prior to tissue diagnosis, yet another source of delay.
The time from referral receipt to the Diagnostic Clinic visit averaged 6.3 days. This delay usually was determined by the availability of the CT-guided biopsy or the dedicated interventional pulmonologist. Although other interventional pulmonologists at JLMMVH may perform the requisite diagnostic procedures, they are not always available for immediate review of imaging studies of referred patients nor can their schedules flexibly accommodate the number of patients seen in our clinic for evaluation.
Lung Cancer Diagnosis
Prompt diagnosis in the setting of a worrisome chest X-ray may help decrease patient anxiety, but does the clinic improve lung cancer treatment outcomes? Such improvement has been demonstrated only in stage IA squamous cell lung cancer.9 Of our study population, 37.7% had squamous cell carcinoma, and 85.5% had non-small cell lung cancer. Of those with non-small cell lung cancer, 28.9% had a clinical stage I tumor. Stage I squamous cell carcinoma, the type of tumor most likely to benefit from early diagnosis and treatment, was diagnosed in 11.3% of patients. With the increased application of LDCT screening, the proportion of veterans identified with early stage lung cancer may rise. The Providence VAMC in Rhode Island reported its results from instituting LDCT screening.12 Prior to screening, 28% of patients diagnosed with lung cancer had a stage I tumor. Following the introduction of LDCT screening, 49% diagnosed by LDCT screening had a stage I tumor. Nearly a third of their patients diagnosed with lung cancer through LDCT screening had squamous cell tumor histology. Thus, we can anticipate an increasing number of veterans with early stage lung cancer who would benefit from timely diagnosis.
The JLMMVH is a referral center for the entire state of Arkansas. Quite a few of its referred patients come from a long distance, which may require overnight housing and other related travel expenses. Apart from any potential outcome benefit, the efficiencies of the system described herein include the minimization of extra trips, an inconvenience and cost to both patient and JLMMVH.
Although the primary task of the clinic is diagnosis, we also seek to facilitate timely treatment. Our lack of an on-site PET scanner and radiation therapy, resources present on-site at the Dayton VAMC, contribute to longer therapy wait times. The shortest mean wait time at JLMMVH is for chemotherapy alone (34.7 days), in part because the JLMMVH oncologists, performing initial consultations 2 to 3 times weekly in the Diagnostic Clinic, are more readily available than are our thoracic surgeons or radiation therapists. Yet overall, JLMMVH patients often face delay from the time of lung cancer diagnosis to initiation of treatment.
The Connecticut Veterans Affairs Healthcare System has published the results of changes in lung cancer management associated with a nurse navigator system.10 Prior to creating the position of cancer care coordinator, filled by an advanced practice RNs, the mean time from clinical suspicion of lung cancer to treatment was 117 days. After 4 years of such care navigation, this waiting time had decreased to 52.4 days. Associated with this dramatic improvement in overall waiting time were decreases in the turnaround time required for performance of CT and PET scans. With respect to this big picture view of lung cancer care, our Diagnostic Clinic serves as a model for the initial step of diagnosis. Coordination and streamlining of the various steps from diagnosis to definitive therapy shall require a more system-wide effort involving all the key players in cancer care.
Conclusion
We have developed a care pathway based in a dedicated diagnostic clinic and have been able to document the shortest interval from abnormality to diagnosis of lung cancer reported in the literature to date. Efficient functioning of this clinic is dependent upon the close cooperation between a full-time RN clinic manager and an interventional pulmonologist experienced in lung cancer management and able to interpret cytologic samples at the time of biopsy. Shortening the delay between diagnosis and definitive therapy remains a challenge and may benefit from the oncology nurse navigator model previously described within the VA system. 10
1. American Cancer Society. Cancer Facts & Figures. https://www.cancer.org/content/dam/cancer-org/research/cancer-facts-and-statistics/annual-cancer-facts-and-figures/2018/cancer-facts-and-figures-2018.pdf. Accessed July 13, 2019.
2. National Lung Screening Trial Research Team, Aberle DR, Adams AM, et al. Reduced lung-cancer mortality with low-dose computed tomographic screening. N Eng J Med. 2011;365(5):395-409.
3. Kinsinger LS, Anderson C, Kim J, et al. Implementation of lung cancer screening in the Veterans Health Administration. JAMA Intern Med. 2017;177(3):399-406.
4. Asch SM, Kerr EA, Hamilton EG, Reifel JL, McGlynn EA, eds. Quality of Care for Oncologic Conditions and HIV: A Review of the Literature and Quality Indicators. Santa Monica, CA: RAND Corporation; 2000.
5. Hillerdal G. [Recommendations from the Swedish Lung Cancer Study Group: Shorter waiting times are demanded for quality in diagnostic work-ups for lung care.] Swedish Med J 1999; 96: 4691.
6. Simunovic M, Gagliardi A, McCready D, Coates A, Levine M, DePetrillo D. A snapshot of waiting times for cancer surgery provided by surgeons affiliated with regional cancer centres in Ontario. CMAJ. 2001;165(4):421-425. [Canadian Strategy for Cancer Control]
7. Bukhari A, Kumar G, Rajsheker R, Markert R. Timeliness of lung cancer diagnosis and treatment. Fed Pract. 2017;34(suppl 1):24S-29S.
8. Bilimoria KY, Ko CY, Tomlinson JS, et al. Wait times for cancer surgery in the United States: trends and predictors of delays. Ann Surg. 2011;253(4):779-785.
9. Yang CJ, Wang H, Kumar A, et al. Impact of timing of lobectomy on survival for clinical stage IA lung squamous cell carcinoma. Chest. 2017;152(6):1239-1250.
10. Hunnibell LS, Rose MG, Connery DM, et al. Using nurse navigation to improve timeliness of lung cancer care at a veterans hospital. Clin J Oncol Nurs. 2012;16(1):29-36.
11. Meena N, Jeffus S, Massoll N, et al. Rapid onsite evaluation: a comparison of cytopathologist and pulmonologist performance. Cancer Cytopatho. 2016;124(4):279-84.
12. Okereke IC, Bates MF, Jankowich MD, et al. Effects of implementation of lung cancer screening at one Veterans Affairs Medical Center. Chest 2016;150(5):1023-1029.
Intraoperative Electrosurgical Smoke During Outpatient Surgery: A Survey of Dermatologic Surgeon and Staff Preferences
A growing body of evidence shows that electrosurgical smoke contains both harmful chemicals as well as live material, including blood particles, bacteria, and viruses.1 Both human immunodeficiency virus and human papillomavirus have been identified in surgical smoke plumes, and bacterial colony growth has been demonstrated from electrosurgical smoke specimens, specifically Staphylococcus, Corynebacterium, and Neisseria species.2-8 Treating 1 g of tissue with electrocoagulation produces chemical by-products equivalent to burning 6 unfiltered cigarettes,9 which is twice the amount of chemical by-products produced by CO2 laser vaporization of the same quantity of tissue. It is a common misconception that electrosurgical smoke is less hazardous than smoke produced by ablative CO2 procedures.9 Many chemicals are present in electrosurgical smoke plumes, including nitriles, benzenes, carbon monoxide, hydrogen cyanide, indoles, phenols, pyridine, pyrrole, styrene, toluene, and xylene.10-12 In animal model studies of rat lungs exposed to surgical smoke, pathologic changes, including interstitial pneumonia, bronchiolitis, and emphysema, have been shown in a dose-dependent manner.1,13-16 Diseases and symptoms linked to inhalation of electrosurgical smoke in humans include anemia, eye irritation, hypoxia, dizziness, nasopharyngeal lesions, vomiting, sneezing, throat irritation, and weakness.1,8,17-19 A study of 153 dermatology residents found that more than 70% reported receiving no formal education on the hazards of electrosurgical smoke.20 Approximately 45% were unaware if they had access to smoke evacuation in rooms where electrosurgery was performed. More than 76% were concerned with the infectious risk of electrosurgical smoke, and more than 71% were concerned with its potential carcinogenic risk.20
We surveyed dermatologists who perform skin surgery as well as staff members with respect to their experiences with electrosurgical smoke and to observe any difference that information on the potential hazards of electrosurgical smoke may have on their attitudes and preferences.
Materials and Methods
Survey Instrument
We developed a REDCap survey consisting of 17 questions that was approved by the executive committees of the American College of Mohs Surgery and the American Society for Dermatologic Surgery for distribution to their dermatologist memberships. It was emailed to eligible participants using their mailing lists. Although the survey was sent directly to member physicians, it was recommended that they forward the survey to their clinical staff to complete.
After responding to an initial set of survey questions, respondents were informed that there is growing evidence of potential harms of inhalation of surgical smoke. They then were asked the same series of survey questions in light of this information.
Statistical Analysis
Statistical analysis of the survey responses was then completed, and free-text responses as a final question of the survey were assessed for themes. Preintervention responses of staff and clinicians noticing smoke and being bothered by smoke were assessed using proportions and 95% confidence interval (CI) estimates of the proportions. On most questions, respondents could answer on a scale of 1 to 10. Responses of 5 to 10 on noticing smoke and 5 to 10 on being bothered or troubled by the smoke smell were grouped for analyses. A cross-tabulation using the Bhapkar test for marginal homogeneity was used to assess if information presented on potential smoke hazards changed responses. A Cochran-Mantel-Haenszel test for ordinal responses was used to determine differences between surgeons and staff. A McNemar test was used to determine statistical significance of change in responses to cost. Statistical analysis was performed using SAS version 9.
Results
There was a total of 443 responses to our questionnaire. Two respondents answered that they did not work in an office where skin surgery was performed, and 4 respondents did not answer any questions and were therefore excluded, leaving a total of 437 responses (402 physicians and 35 staff members). A summary of the characteristics of the respondents is shown in the Table. Some respondents did not answer each question, leading to fewer than 437 answers for some questions.
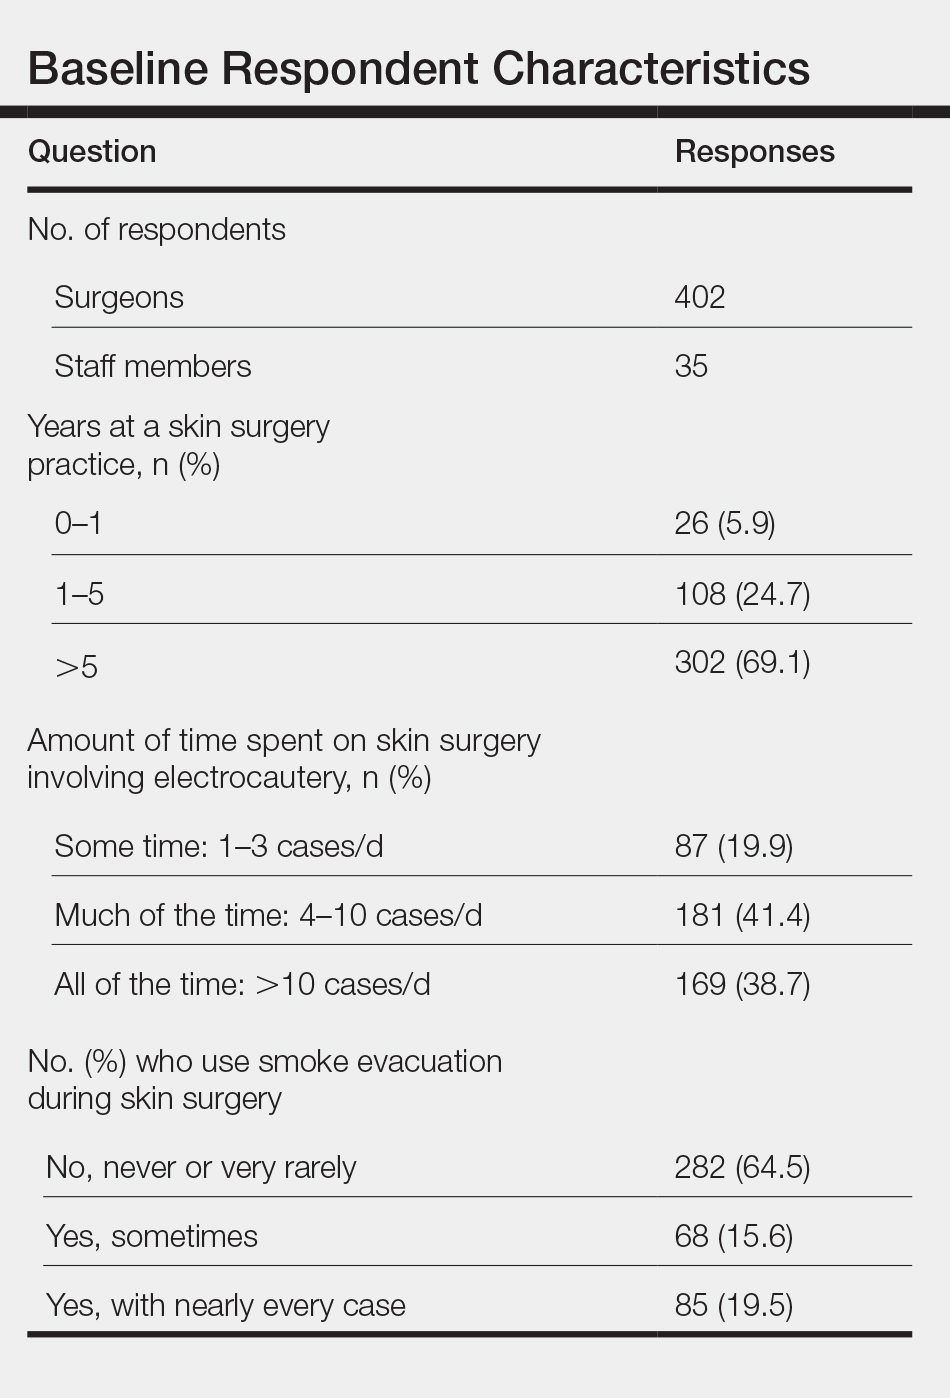
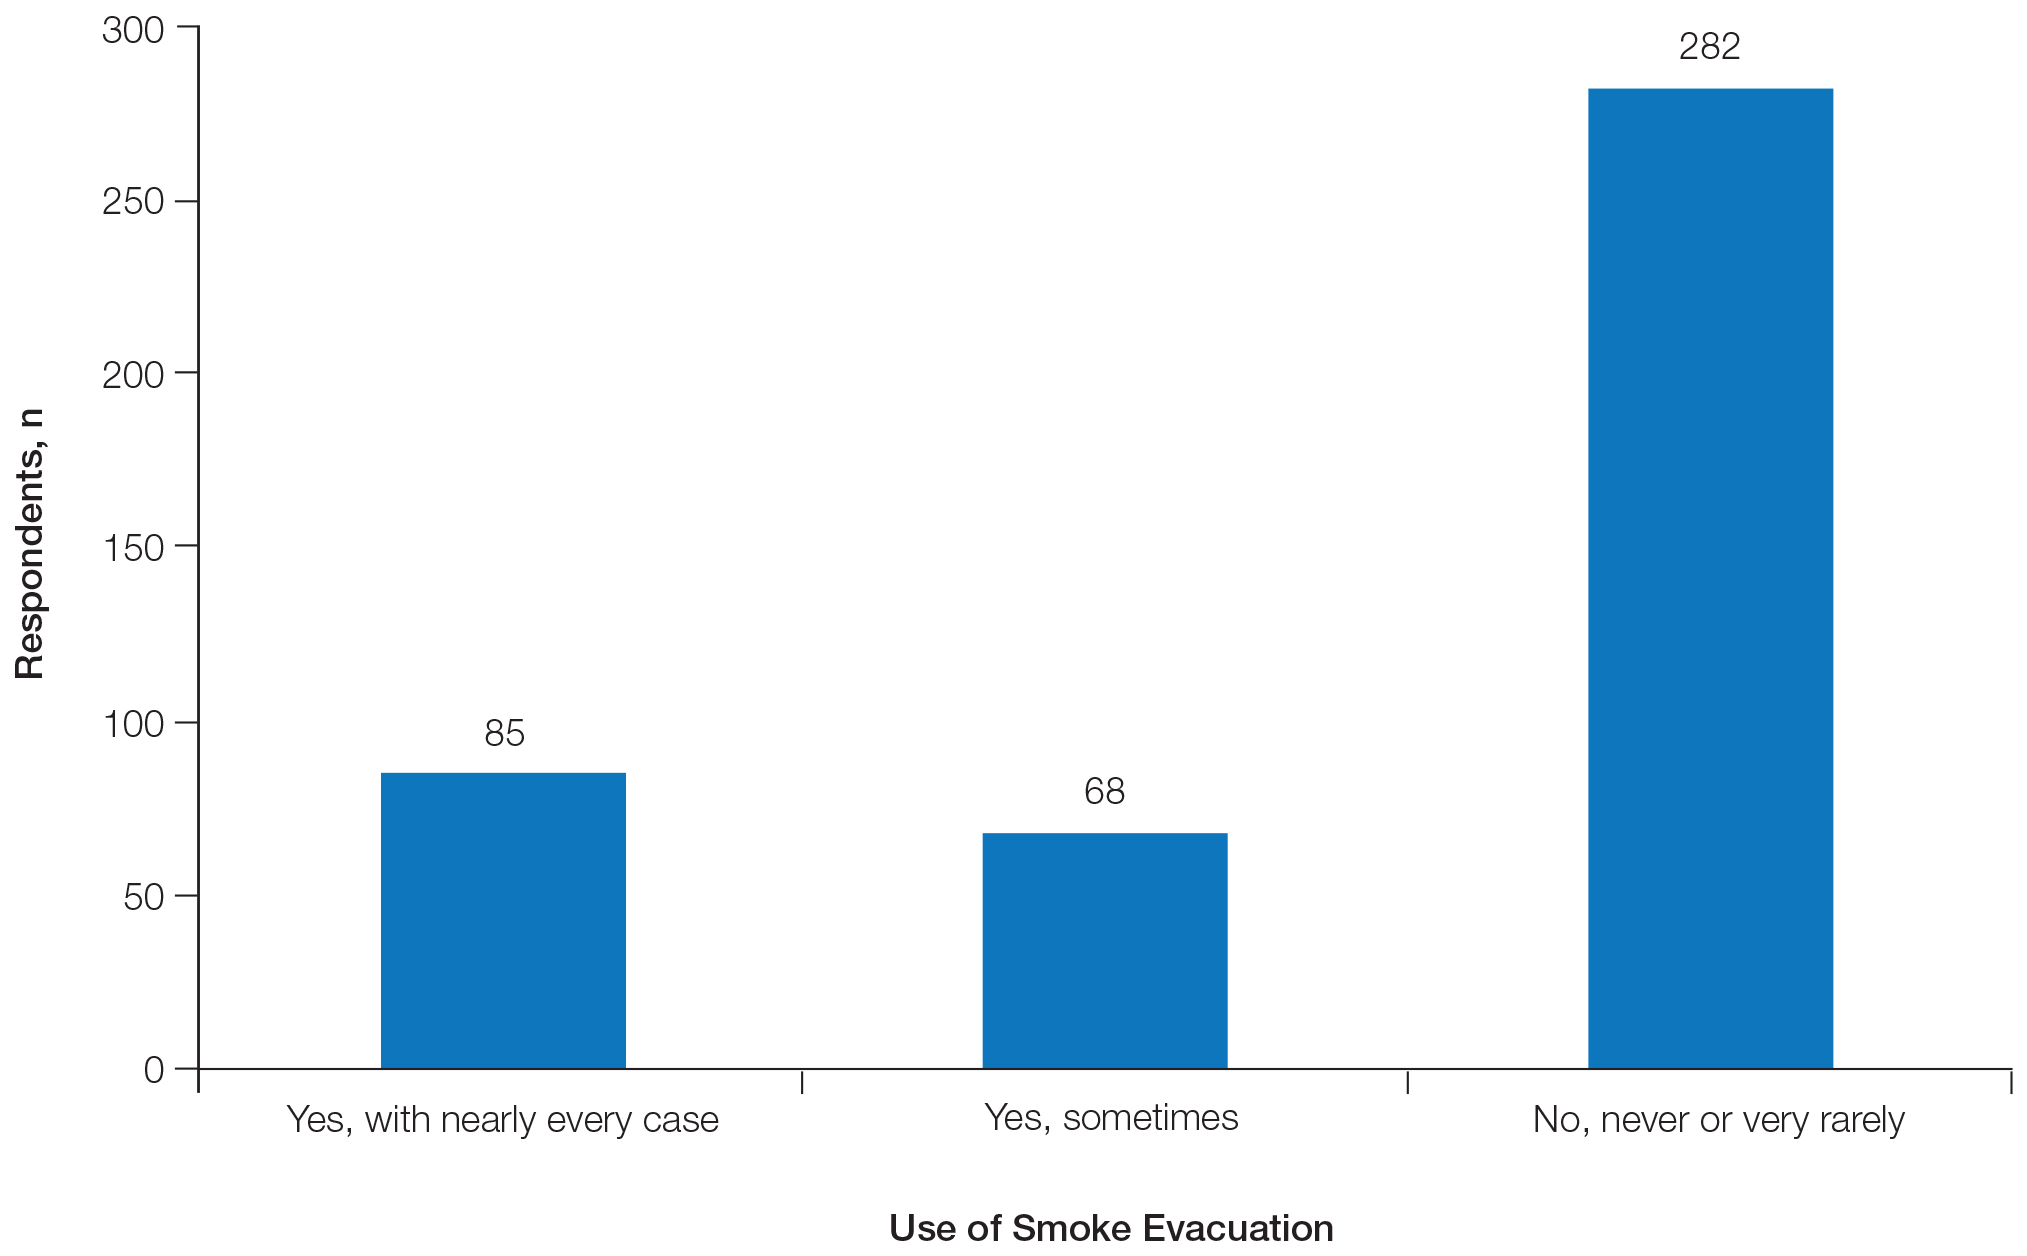
Two hundred eighty-two respondents (64.5%) never or very rarely used smoke evacuation during skin surgical procedures, and only 85 (19.5%) used smoke evacuation with nearly every case. The remaining respondents sometimes used smoke evacuation (Figure 1).
Prior to being presented with the potential dangers of electrosurgical smoke and using a value of 5 to 10 to determine if respondents noticed smoke, 54.4% (95% CI, 49.5%-59.1%) did notice intraoperative smoke during procedures. Using a value of 5 to 10 to indicate if respondents were bothered or troubled by the smoke smell, 35.5% (95% CI, 31.0%-40.2%) were bothered or troubled by intraoperative smoke prior to potential hazards being presented.
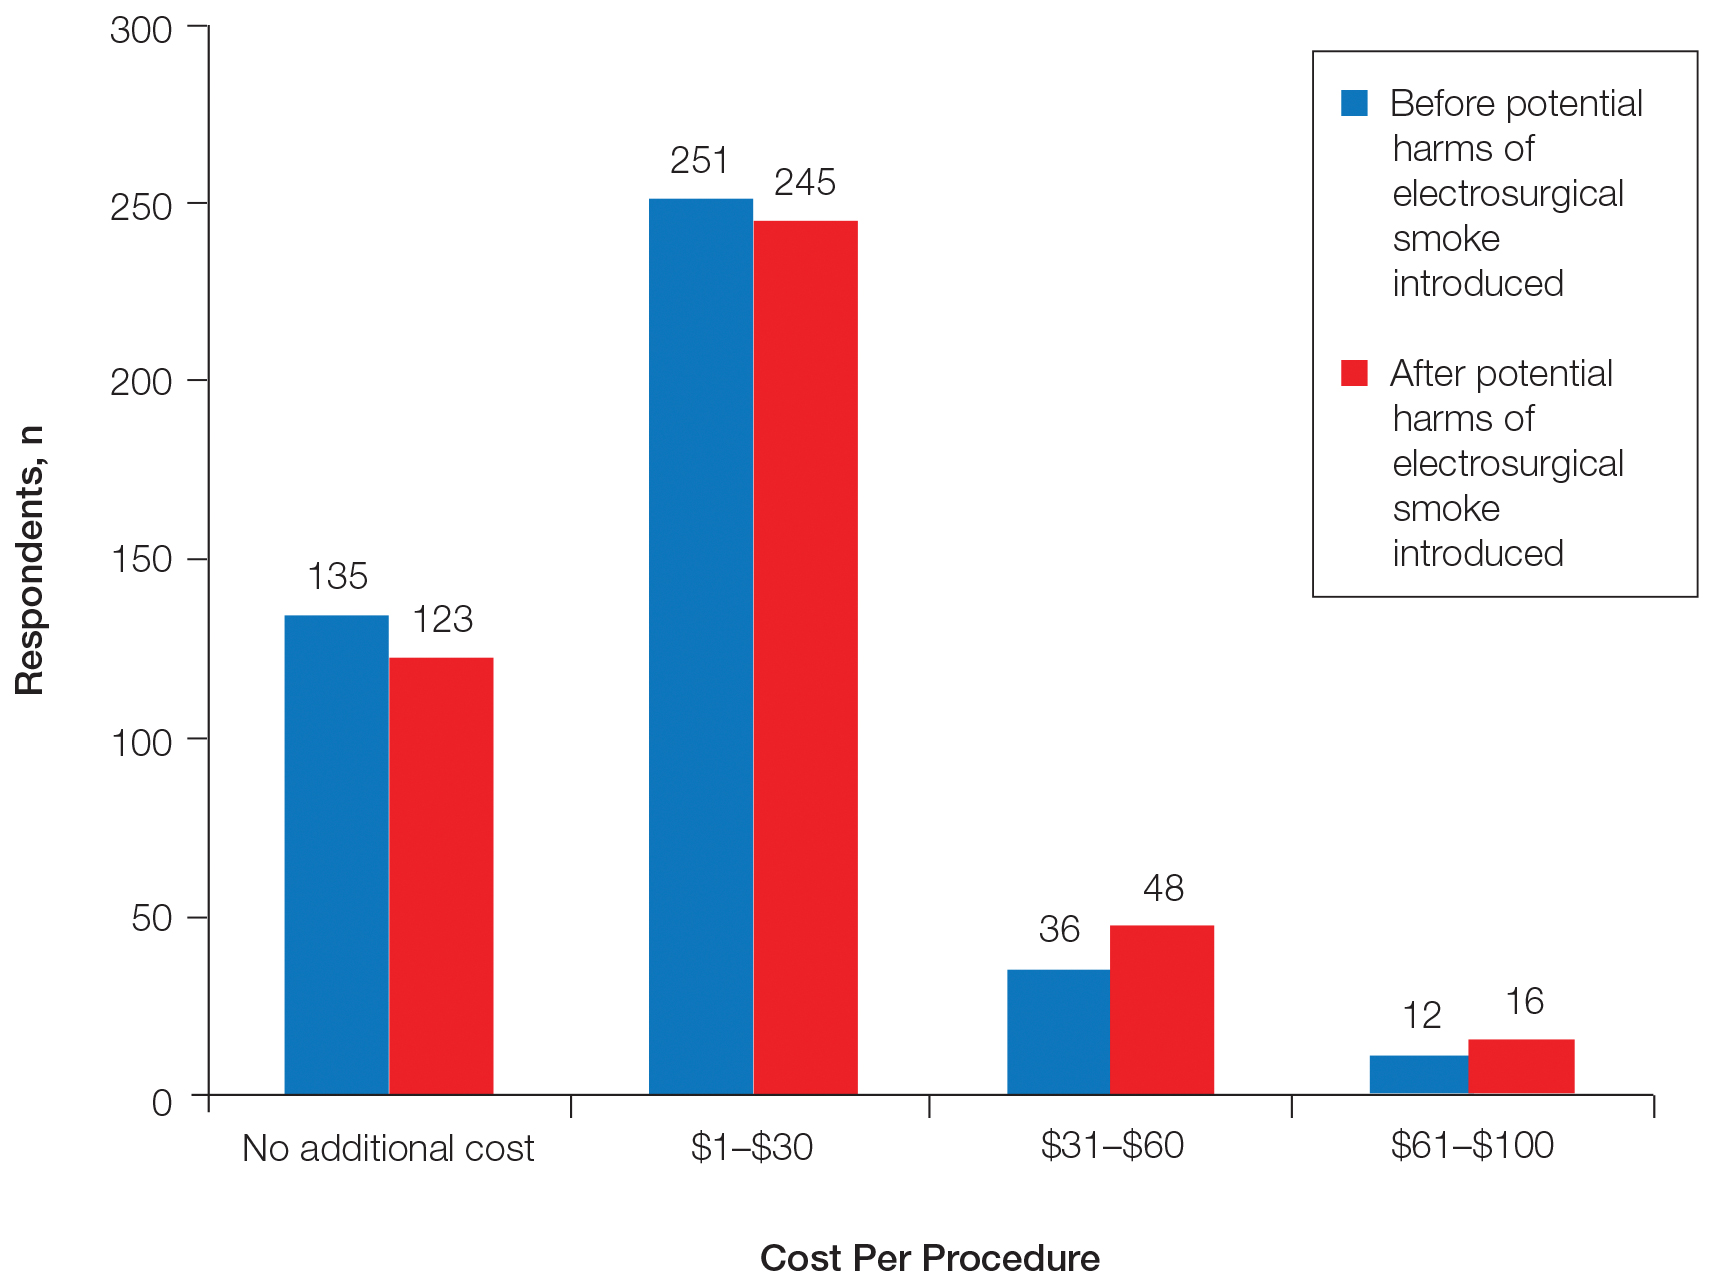
Regarding acceptable increase in cost per procedure for smoke evacuation at baseline, 68.9% of respondents favored additional cost; 57.8% of respondents chose the lowest cost grouping of $1 to $30. After being presented with information about the potential harm of intraoperative smoke, the respondents in favor of additional cost increased to 71.5%, which was a small but statistically significant change (P=.0075)(Figure 2).
Respondents were sorted into groups consisting of those who never used smoke evacuation, those who used it occasionally, and those who used it with all smoke-producing procedures. The degree to which respondents noticed intraoperative smoke was strongly correlated with their use of smoke evacuation; those who never used smoke evacuation noticed the presence of smoke more, and those who always used smoke evacuation noticed it less (P=.0002). Similar trends were noted regarding if the smoke smell bothered or troubled respondents (P=.0014).
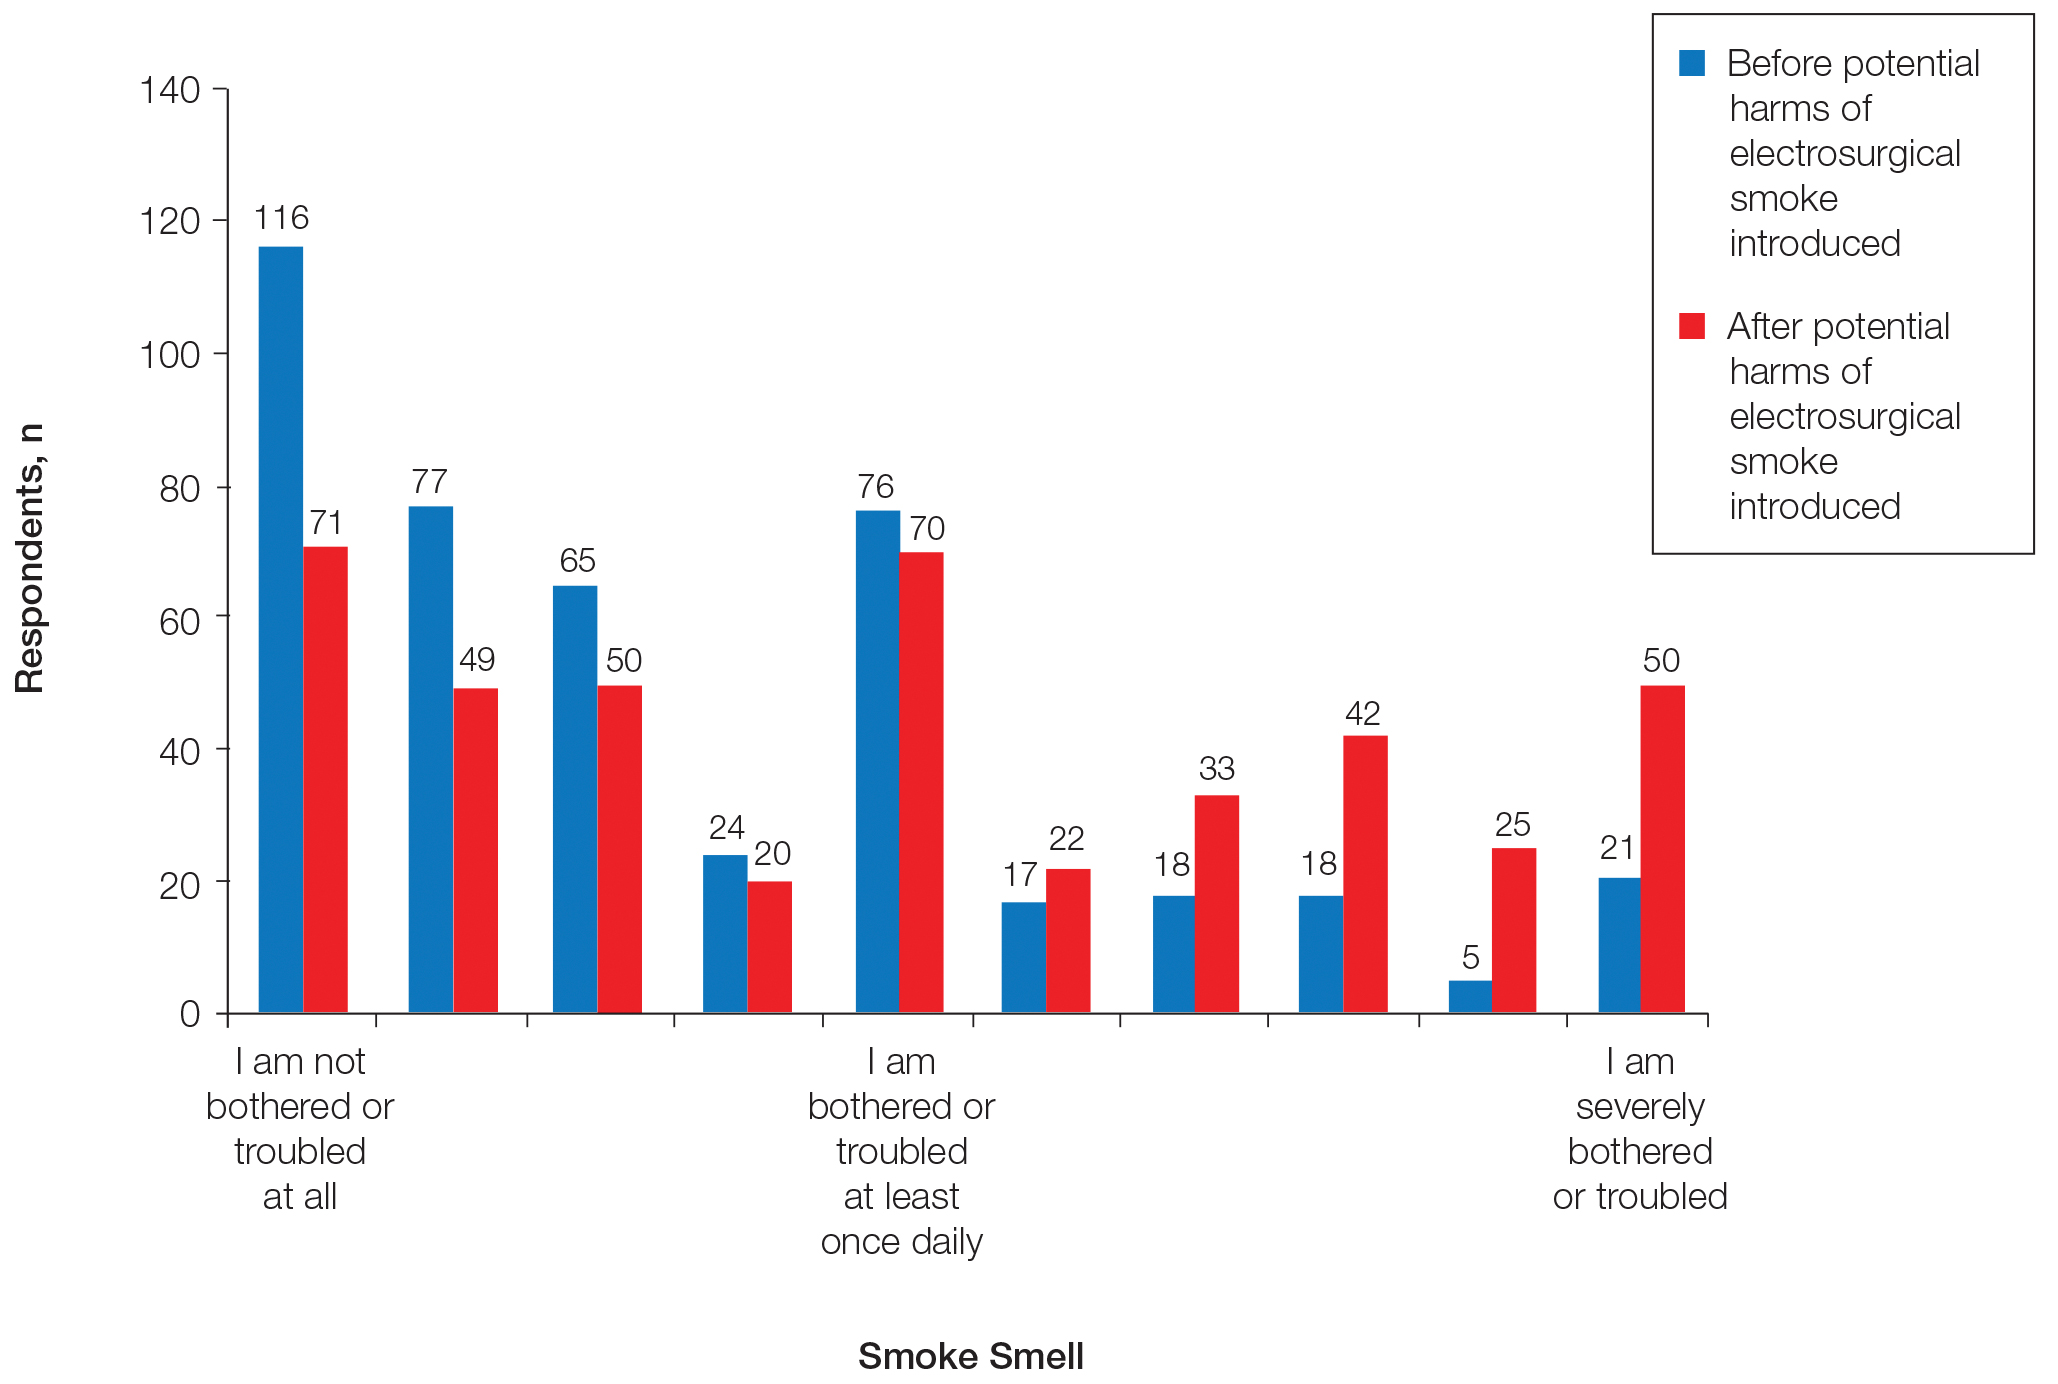
After being presented with the potential risks of electrosurgical smoke, 29 more respondents answered that they were severely bothered by electrosurgical smoke, whereas 45 fewer respondents selected that they were not bothered or troubled at all by electrosurgical smoke (Figure 3). This difference was statistically significant (P<.0001). Fifteen more respondents answered that they would be much more likely to choose to work at a practice with smoke evacuation once the potential harm of electrosurgical smoke was introduced, and 11 were somewhat more likely to choose a practice with smoke evacuation (P<.0001).
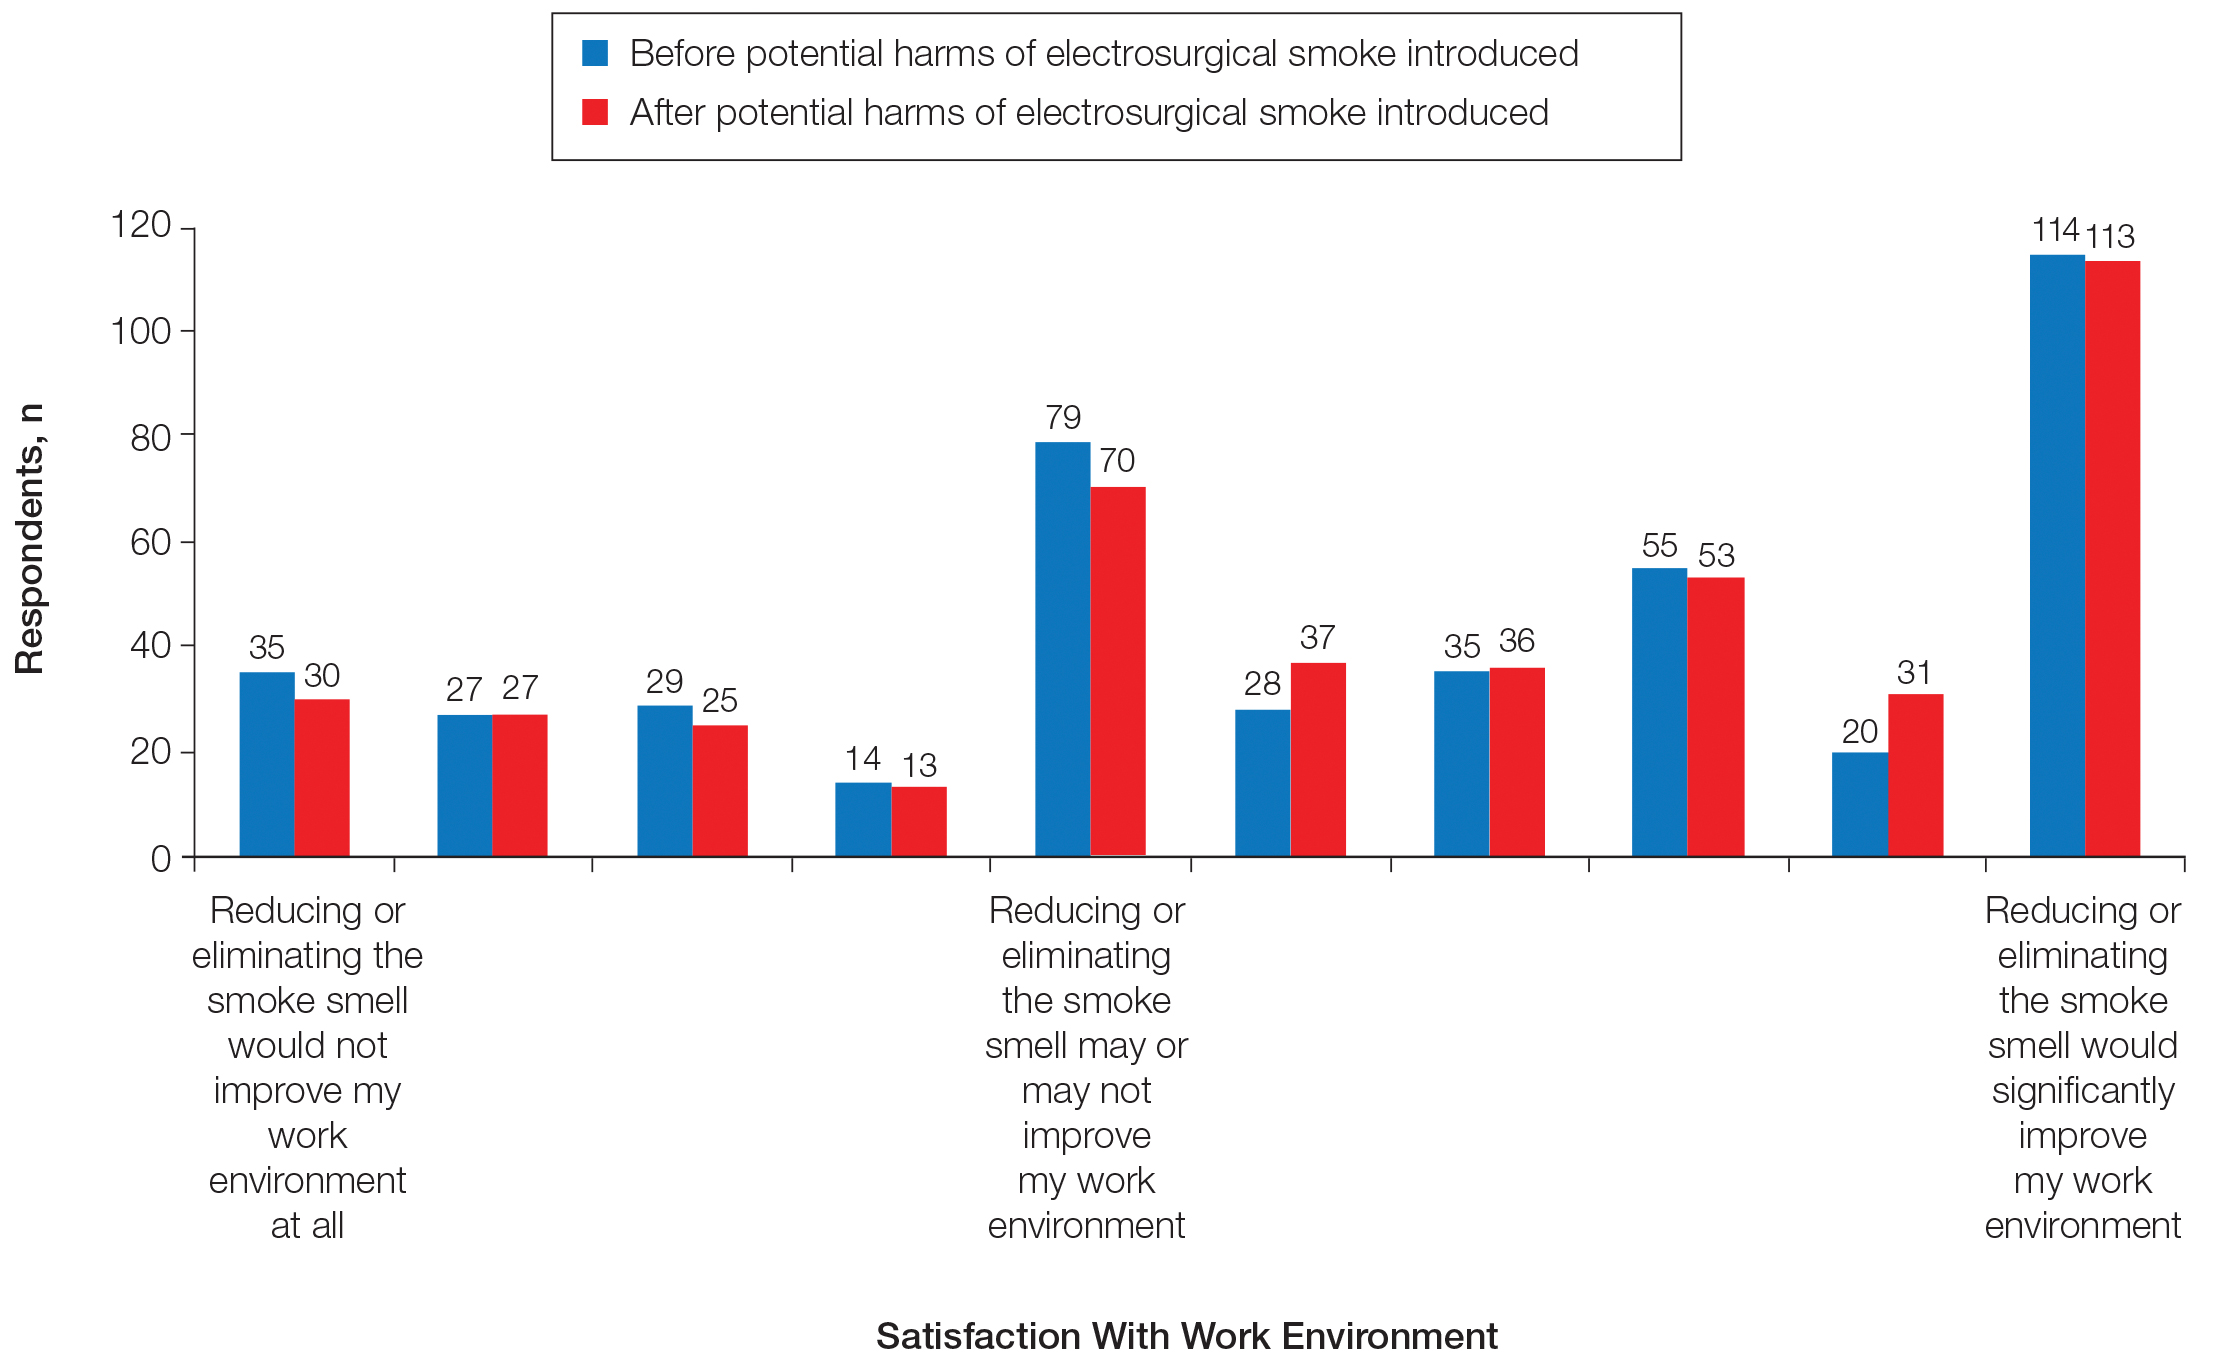
Information about the potential harm of electrosurgical smoke did not statistically significantly affect satisfaction with work environment (P=.3139)(Figure 4).
There were no statistically significant differences between surgeon and staff responses on any questions.
Comment
Developing evidence of health risks associated with electrosurgical smoke plumes has led to an increasing interest in the use of smoke protection or remediation tools during surgical procedures. High-filtration face masks and smoke-evacuation devices protect physicians, staff members, and patients, as well as improve the patient’s clinical experience.
Our study was designed to query dermatologists who perform skin surgery as well as staff members with respect to their experiences with electrosurgical smoke and to observe any difference that information on the potential hazards of electrosurgical smoke may have on their attitudes and preferences. We received 437 responses to our survey (Table). At baseline, 54.4% of respondents noticed and 35.5% were bothered or troubled by the smoke smell produced during skin electrosurgery. These data were intuitively associated in a statistically significant manner with the use of smoke evacuation for respondents; those respondents who more commonly used smoke evacuation were bothered less by electrosurgical smoke, and those respondents who used smoke evacuation less often were more likely to notice and be bothered by surgical smoke.
Once our respondents were presented with the potentially harmful effects of electrosurgical smoke, they became significantly more likely to be bothered by electrosurgical smoke and to want to work in a practice where smoke evacuation was available. This information, however, did not change respondents’ satisfaction with their work environment, and no statistically significant differences were noted between physicians and staff.
At baseline, 68.9% of respondents favored additional cost for smoke evacuation, with approximately 58% favoring the lowest cost category we presented ($1–$30). After being presented with information about the potential dangers of electrosurgical smoke, 71.5% were in favor of increased cost for smoke evacuation, which was a small but statistically significant increase.
The open-comment section of the survey provided interesting insight into the opinions of our respondents on smoke remediation. It is important to note that statistical analysis cannot be performed with these data, and firm generalizable conclusions cannot be drawn from them; however, they reveal topics that may guide further research and policy and certainly merit mention. Of 437 respondents, 108 left free-text comments. Twenty-six percent were categorized as unqualified proponents (in favor of smoke remediation) and 45% as qualified proponents (defined as an individual who verbalized a desire for smoke remediation but also cited a factor limiting their ability to use it, such as cost or staff availability). Only 12% were firmly against smoke remediation, while the remaining 17% did not comment discernibly for or against smoke remediation, indicating that a majority (71% of our comment section respondents) were in favor of some type of smoke remediation, especially if obstacles such as cost could be addressed. Only a small minority was firmly against smoke remediation.
The comments section of our survey highlighted some of the concerns that dermatologic surgeons and their staff have with electrosurgical smoke evacuation. Thirty percent cited cost as an obstacle to use of these devices, and several comments raised concern about increasing overhead and regulatory demands placed on practices. Many indicated that, without sufficient evidence of the harm caused by electrosurgical smoke, regulation that forces use of smoke remediation devices would represent a costly unfunded mandate. Others referenced the logistical challenges of smoke evacuation and the need for staff assistance. Newer smoke-evacuation wands built into cautery pens address much of this concern regarding logistical and staff challenges and further allow the evacuator tip to be located where it is most effective: 1 cm to 2 in from the point of cautery.21,22
Additionally, 12% of commenters noted that their patients were bothered by the smell of electrosurgical smoke, which is a point that requires further research and is the focus of a current randomized trial at our institution (ClinicalTrials.gov Identifier NCT02958826).
Our current study is limited in that it is a survey and therefore is subject to response bias. Further, some may assert that the hazards of electrosurgical smoke are not settled science, and although we agree with this point on some level, the study aim was not to prove risk but rather to assess current attitudes and see if awareness of a potential risk influenced those attitudes. Additionally, most responses were from physicians—only 35 responses were from nonphysician staff—so it may be difficult to generalize the findings of this study to staff. The large number of physician respondents, however, can be seen as a strength, and the findings are likely much more generalizable to providers who routinely perform clinic-based surgical procedures involving electrosurgery.
Conclusion
Our study shows that most dermatologists who perform skin surgery notice and are bothered by the smoke produced by electrosurgery to at least some extent. When presented with the possibility that inhaling electrosurgical smoke may be harmful, dermatologists were more likely to be bothered by electrosurgical smoke, more likely to prefer a practice environment where smoke evacuation was available, and more likely to be willing to bear additional cost for smoke evacuation. The free-text comments on our survey highlighted that many dermatologic surgeons are proponents of smoke evacuation but have concerns about cost and potential regulatory challenges associated with smoke evacuation, especially if the potential risks are not settled science. Many logistical concerns for smoke evacuation are addressed with the use of integrated devices. More research is needed to determine the health effects of the surgical smoke we are exposed to daily and the optimal way to limit any risk.
Acknowledgment
The authors would like to thank Richard W. Madsen, PhD (Columbia, Missouri), biostatistician, for his valuable guidance in the statistical analysis of data, interpretation of results, and editorial support in finalizing the manuscript.
- Lewin J, Brauer J, Ostad A. Surgical smoke and the dermatologist. J Am Acad Dermatol. 2011;65:636-641.
- Garden JM, O’Banion MK, Shelnitz LS, et al. Papillomavirus in the vapor of carbon dioxide laser-treated verrucae. JAMA. 1988;259:1199-1202.
- Sawchuk WS, Weber PJ, Lowy DR, et al. Infectious papillomavirus in the vapor of warts treated with carbon dioxide laser or electrocoagulation: detection and protection. J Am Acad Dermatol. 1989;21:41-49.
- Baggish MS, Poiesz BJ, Joret D, et al. Presence of human immunodeficiency virus DNA in laser smoke. Lasers Surg Med. 1991;11:197-203.
- Capizzi PJ, Clay RP, Battey MJ. Microbiologic activity in laser resurfacing plume and debris. Lasers Surg Med. 1998;23:172-174.
- Sebben JE. The hazards of electrosurgery. J Am Acad Dermatol. 1987;16:869-872.
- Bigony L. Risks associated with exposure to surgical smoke plume: a review of the literature. AORN J. 2007;86:1013-1020.
- Barrett WL, Garber SM. Surgical smoke: a review of the literature. Surg Endosc. 2003;17:979-987.
- Tomita Y, Mihashi S, Nagata K, et al. Mutagenicity of smoke condensates induced by CO2-laser irradiation and electrocauterization. Mutat Res. 1981;89:145-149.
- Hollmann R, Hort CE, Kammer E, et al. Smoke in the operating theater: an unregarded source of danger. Plast Reconstr Surg. 2004;114:458-463.
- Hensman C, Baty D, Willis RG, et al. Chemical composition of smoke produced by high-frequency electrosurgery in a closed gaseous environment. An in vitro study. Surg Endosc. 1998;12:1017-1019.
- Ulmer B. The hazards of surgical smoke. AORN J. 2008;87:721-734; quiz 735-738.
- Baggish MS, Baltoyannis P, Sze E. Protection of the rat lung from the harmful effects of laser smoke. Lasers Surg Med. 1988;8:248-253.
- Baggish MS, Elbakry M. The effects of laser smoke on the lungs of rats. Am J Obstet Gynecol. 1987;156:1260-1265.
- Freitag L, Chapman GA, Sielczak M, et al. Laser smoke effect on the bronchial system. Lasers Surg Med. 1987;7:283-288.
- Gracie KW. Hazards of vaporized tissue plume. Surgical Technologist. 2001;33:20-26.
- Giordano BP. Don’t be a victim of surgical smoke. AORN J. 1996;63:520, 522.
- Dikes CN. Is it safe to allow smoke in our operating room? Todays Surg Nurse. 1999;21:15-21; quiz 38-39.
- Wu MP, Ou CS, Chen SL, et al. Complications and recommended practices for electrosurgery in laparoscopy. Am J Surg. 2000;179:67-73.
- Chapman LW, Korta DZ, Lee PK, et al. Awareness of surgical smoke risks and assessment of safety practices during electrosurgery among US dermatology residents. JAMA Dermatol. 2017;153:467-468.
- Trevor M. Presence of virus in CO2 laser plumes raises infection concern. Hosp Infect Control. 1987;14:166-167.
- Smith JP, Moss CE, Bryant CJ, et al. Evaluation of a smoke evacuator used for laser surgery. Lasers Surg Med. 1989;9:276-281.
A growing body of evidence shows that electrosurgical smoke contains both harmful chemicals as well as live material, including blood particles, bacteria, and viruses.1 Both human immunodeficiency virus and human papillomavirus have been identified in surgical smoke plumes, and bacterial colony growth has been demonstrated from electrosurgical smoke specimens, specifically Staphylococcus, Corynebacterium, and Neisseria species.2-8 Treating 1 g of tissue with electrocoagulation produces chemical by-products equivalent to burning 6 unfiltered cigarettes,9 which is twice the amount of chemical by-products produced by CO2 laser vaporization of the same quantity of tissue. It is a common misconception that electrosurgical smoke is less hazardous than smoke produced by ablative CO2 procedures.9 Many chemicals are present in electrosurgical smoke plumes, including nitriles, benzenes, carbon monoxide, hydrogen cyanide, indoles, phenols, pyridine, pyrrole, styrene, toluene, and xylene.10-12 In animal model studies of rat lungs exposed to surgical smoke, pathologic changes, including interstitial pneumonia, bronchiolitis, and emphysema, have been shown in a dose-dependent manner.1,13-16 Diseases and symptoms linked to inhalation of electrosurgical smoke in humans include anemia, eye irritation, hypoxia, dizziness, nasopharyngeal lesions, vomiting, sneezing, throat irritation, and weakness.1,8,17-19 A study of 153 dermatology residents found that more than 70% reported receiving no formal education on the hazards of electrosurgical smoke.20 Approximately 45% were unaware if they had access to smoke evacuation in rooms where electrosurgery was performed. More than 76% were concerned with the infectious risk of electrosurgical smoke, and more than 71% were concerned with its potential carcinogenic risk.20
We surveyed dermatologists who perform skin surgery as well as staff members with respect to their experiences with electrosurgical smoke and to observe any difference that information on the potential hazards of electrosurgical smoke may have on their attitudes and preferences.
Materials and Methods
Survey Instrument
We developed a REDCap survey consisting of 17 questions that was approved by the executive committees of the American College of Mohs Surgery and the American Society for Dermatologic Surgery for distribution to their dermatologist memberships. It was emailed to eligible participants using their mailing lists. Although the survey was sent directly to member physicians, it was recommended that they forward the survey to their clinical staff to complete.
After responding to an initial set of survey questions, respondents were informed that there is growing evidence of potential harms of inhalation of surgical smoke. They then were asked the same series of survey questions in light of this information.
Statistical Analysis
Statistical analysis of the survey responses was then completed, and free-text responses as a final question of the survey were assessed for themes. Preintervention responses of staff and clinicians noticing smoke and being bothered by smoke were assessed using proportions and 95% confidence interval (CI) estimates of the proportions. On most questions, respondents could answer on a scale of 1 to 10. Responses of 5 to 10 on noticing smoke and 5 to 10 on being bothered or troubled by the smoke smell were grouped for analyses. A cross-tabulation using the Bhapkar test for marginal homogeneity was used to assess if information presented on potential smoke hazards changed responses. A Cochran-Mantel-Haenszel test for ordinal responses was used to determine differences between surgeons and staff. A McNemar test was used to determine statistical significance of change in responses to cost. Statistical analysis was performed using SAS version 9.
Results
There was a total of 443 responses to our questionnaire. Two respondents answered that they did not work in an office where skin surgery was performed, and 4 respondents did not answer any questions and were therefore excluded, leaving a total of 437 responses (402 physicians and 35 staff members). A summary of the characteristics of the respondents is shown in the Table. Some respondents did not answer each question, leading to fewer than 437 answers for some questions.
Two hundred eighty-two respondents (64.5%) never or very rarely used smoke evacuation during skin surgical procedures, and only 85 (19.5%) used smoke evacuation with nearly every case. The remaining respondents sometimes used smoke evacuation (Figure 1).
Prior to being presented with the potential dangers of electrosurgical smoke and using a value of 5 to 10 to determine if respondents noticed smoke, 54.4% (95% CI, 49.5%-59.1%) did notice intraoperative smoke during procedures. Using a value of 5 to 10 to indicate if respondents were bothered or troubled by the smoke smell, 35.5% (95% CI, 31.0%-40.2%) were bothered or troubled by intraoperative smoke prior to potential hazards being presented.
Regarding acceptable increase in cost per procedure for smoke evacuation at baseline, 68.9% of respondents favored additional cost; 57.8% of respondents chose the lowest cost grouping of $1 to $30. After being presented with information about the potential harm of intraoperative smoke, the respondents in favor of additional cost increased to 71.5%, which was a small but statistically significant change (P=.0075)(Figure 2).
Respondents were sorted into groups consisting of those who never used smoke evacuation, those who used it occasionally, and those who used it with all smoke-producing procedures. The degree to which respondents noticed intraoperative smoke was strongly correlated with their use of smoke evacuation; those who never used smoke evacuation noticed the presence of smoke more, and those who always used smoke evacuation noticed it less (P=.0002). Similar trends were noted regarding if the smoke smell bothered or troubled respondents (P=.0014).
After being presented with the potential risks of electrosurgical smoke, 29 more respondents answered that they were severely bothered by electrosurgical smoke, whereas 45 fewer respondents selected that they were not bothered or troubled at all by electrosurgical smoke (Figure 3). This difference was statistically significant (P<.0001). Fifteen more respondents answered that they would be much more likely to choose to work at a practice with smoke evacuation once the potential harm of electrosurgical smoke was introduced, and 11 were somewhat more likely to choose a practice with smoke evacuation (P<.0001).
Information about the potential harm of electrosurgical smoke did not statistically significantly affect satisfaction with work environment (P=.3139)(Figure 4).
There were no statistically significant differences between surgeon and staff responses on any questions.
Comment
Developing evidence of health risks associated with electrosurgical smoke plumes has led to an increasing interest in the use of smoke protection or remediation tools during surgical procedures. High-filtration face masks and smoke-evacuation devices protect physicians, staff members, and patients, as well as improve the patient’s clinical experience.
Our study was designed to query dermatologists who perform skin surgery as well as staff members with respect to their experiences with electrosurgical smoke and to observe any difference that information on the potential hazards of electrosurgical smoke may have on their attitudes and preferences. We received 437 responses to our survey (Table). At baseline, 54.4% of respondents noticed and 35.5% were bothered or troubled by the smoke smell produced during skin electrosurgery. These data were intuitively associated in a statistically significant manner with the use of smoke evacuation for respondents; those respondents who more commonly used smoke evacuation were bothered less by electrosurgical smoke, and those respondents who used smoke evacuation less often were more likely to notice and be bothered by surgical smoke.
Once our respondents were presented with the potentially harmful effects of electrosurgical smoke, they became significantly more likely to be bothered by electrosurgical smoke and to want to work in a practice where smoke evacuation was available. This information, however, did not change respondents’ satisfaction with their work environment, and no statistically significant differences were noted between physicians and staff.
At baseline, 68.9% of respondents favored additional cost for smoke evacuation, with approximately 58% favoring the lowest cost category we presented ($1–$30). After being presented with information about the potential dangers of electrosurgical smoke, 71.5% were in favor of increased cost for smoke evacuation, which was a small but statistically significant increase.
The open-comment section of the survey provided interesting insight into the opinions of our respondents on smoke remediation. It is important to note that statistical analysis cannot be performed with these data, and firm generalizable conclusions cannot be drawn from them; however, they reveal topics that may guide further research and policy and certainly merit mention. Of 437 respondents, 108 left free-text comments. Twenty-six percent were categorized as unqualified proponents (in favor of smoke remediation) and 45% as qualified proponents (defined as an individual who verbalized a desire for smoke remediation but also cited a factor limiting their ability to use it, such as cost or staff availability). Only 12% were firmly against smoke remediation, while the remaining 17% did not comment discernibly for or against smoke remediation, indicating that a majority (71% of our comment section respondents) were in favor of some type of smoke remediation, especially if obstacles such as cost could be addressed. Only a small minority was firmly against smoke remediation.
The comments section of our survey highlighted some of the concerns that dermatologic surgeons and their staff have with electrosurgical smoke evacuation. Thirty percent cited cost as an obstacle to use of these devices, and several comments raised concern about increasing overhead and regulatory demands placed on practices. Many indicated that, without sufficient evidence of the harm caused by electrosurgical smoke, regulation that forces use of smoke remediation devices would represent a costly unfunded mandate. Others referenced the logistical challenges of smoke evacuation and the need for staff assistance. Newer smoke-evacuation wands built into cautery pens address much of this concern regarding logistical and staff challenges and further allow the evacuator tip to be located where it is most effective: 1 cm to 2 in from the point of cautery.21,22
Additionally, 12% of commenters noted that their patients were bothered by the smell of electrosurgical smoke, which is a point that requires further research and is the focus of a current randomized trial at our institution (ClinicalTrials.gov Identifier NCT02958826).
Our current study is limited in that it is a survey and therefore is subject to response bias. Further, some may assert that the hazards of electrosurgical smoke are not settled science, and although we agree with this point on some level, the study aim was not to prove risk but rather to assess current attitudes and see if awareness of a potential risk influenced those attitudes. Additionally, most responses were from physicians—only 35 responses were from nonphysician staff—so it may be difficult to generalize the findings of this study to staff. The large number of physician respondents, however, can be seen as a strength, and the findings are likely much more generalizable to providers who routinely perform clinic-based surgical procedures involving electrosurgery.
Conclusion
Our study shows that most dermatologists who perform skin surgery notice and are bothered by the smoke produced by electrosurgery to at least some extent. When presented with the possibility that inhaling electrosurgical smoke may be harmful, dermatologists were more likely to be bothered by electrosurgical smoke, more likely to prefer a practice environment where smoke evacuation was available, and more likely to be willing to bear additional cost for smoke evacuation. The free-text comments on our survey highlighted that many dermatologic surgeons are proponents of smoke evacuation but have concerns about cost and potential regulatory challenges associated with smoke evacuation, especially if the potential risks are not settled science. Many logistical concerns for smoke evacuation are addressed with the use of integrated devices. More research is needed to determine the health effects of the surgical smoke we are exposed to daily and the optimal way to limit any risk.
Acknowledgment
The authors would like to thank Richard W. Madsen, PhD (Columbia, Missouri), biostatistician, for his valuable guidance in the statistical analysis of data, interpretation of results, and editorial support in finalizing the manuscript.
- Lewin J, Brauer J, Ostad A. Surgical smoke and the dermatologist. J Am Acad Dermatol. 2011;65:636-641.
- Garden JM, O’Banion MK, Shelnitz LS, et al. Papillomavirus in the vapor of carbon dioxide laser-treated verrucae. JAMA. 1988;259:1199-1202.
- Sawchuk WS, Weber PJ, Lowy DR, et al. Infectious papillomavirus in the vapor of warts treated with carbon dioxide laser or electrocoagulation: detection and protection. J Am Acad Dermatol. 1989;21:41-49.
- Baggish MS, Poiesz BJ, Joret D, et al. Presence of human immunodeficiency virus DNA in laser smoke. Lasers Surg Med. 1991;11:197-203.
- Capizzi PJ, Clay RP, Battey MJ. Microbiologic activity in laser resurfacing plume and debris. Lasers Surg Med. 1998;23:172-174.
- Sebben JE. The hazards of electrosurgery. J Am Acad Dermatol. 1987;16:869-872.
- Bigony L. Risks associated with exposure to surgical smoke plume: a review of the literature. AORN J. 2007;86:1013-1020.
- Barrett WL, Garber SM. Surgical smoke: a review of the literature. Surg Endosc. 2003;17:979-987.
- Tomita Y, Mihashi S, Nagata K, et al. Mutagenicity of smoke condensates induced by CO2-laser irradiation and electrocauterization. Mutat Res. 1981;89:145-149.
- Hollmann R, Hort CE, Kammer E, et al. Smoke in the operating theater: an unregarded source of danger. Plast Reconstr Surg. 2004;114:458-463.
- Hensman C, Baty D, Willis RG, et al. Chemical composition of smoke produced by high-frequency electrosurgery in a closed gaseous environment. An in vitro study. Surg Endosc. 1998;12:1017-1019.
- Ulmer B. The hazards of surgical smoke. AORN J. 2008;87:721-734; quiz 735-738.
- Baggish MS, Baltoyannis P, Sze E. Protection of the rat lung from the harmful effects of laser smoke. Lasers Surg Med. 1988;8:248-253.
- Baggish MS, Elbakry M. The effects of laser smoke on the lungs of rats. Am J Obstet Gynecol. 1987;156:1260-1265.
- Freitag L, Chapman GA, Sielczak M, et al. Laser smoke effect on the bronchial system. Lasers Surg Med. 1987;7:283-288.
- Gracie KW. Hazards of vaporized tissue plume. Surgical Technologist. 2001;33:20-26.
- Giordano BP. Don’t be a victim of surgical smoke. AORN J. 1996;63:520, 522.
- Dikes CN. Is it safe to allow smoke in our operating room? Todays Surg Nurse. 1999;21:15-21; quiz 38-39.
- Wu MP, Ou CS, Chen SL, et al. Complications and recommended practices for electrosurgery in laparoscopy. Am J Surg. 2000;179:67-73.
- Chapman LW, Korta DZ, Lee PK, et al. Awareness of surgical smoke risks and assessment of safety practices during electrosurgery among US dermatology residents. JAMA Dermatol. 2017;153:467-468.
- Trevor M. Presence of virus in CO2 laser plumes raises infection concern. Hosp Infect Control. 1987;14:166-167.
- Smith JP, Moss CE, Bryant CJ, et al. Evaluation of a smoke evacuator used for laser surgery. Lasers Surg Med. 1989;9:276-281.
Practice Points
- Growing evidence suggests that the surgical smoke plume generated during electrosurgery may be harmful if inhaled.
- Our survey indicates that this information may affect clinician and staff perceptions about exposure to electrosurgical smoke and its remediation.

Treatment Facility: An Important Prognostic Factor for Dedifferentiated Liposarcoma Survival (FULL)
Approximately 17% to 25% of all softtissue sarcomas (STS) are liposarcomas, making liposarcoma the most common type of STS.1 The 2013 World Health Organization (WHO) classification separates liposarcoma into 4 histologic subtypes: atypical lipomatous tumor/well-differentiated (ALT/ WDLPS), dedifferentiated (DDLPS), myxoid, and pleomorphic.2 Each subtype has unique histology, morphology, and natural history. WDLPS and DDLPS are the most common histologic subtypes, comprising approximately 50% of all sarcomas that arise in the retroperitoneum.3 DDLPS represents 18% of all liposarcomas, making it the second most common subtype of liposarcoma.4
In 1979, DDLPS was first characterized.5 Most (90%) cases of DDLPS present de novo, whereas the other 10% transform from preexisting low-grade WDLPS.2 DDLPSs are formed by an amplification of 12q14-15 involving the MDM2 gene.4 These malignancies most commonly present in the retroperitoneum as a large painless mass, consisting of both fatty and nonfatty components.2 Primary site has been previously reported as a major prognostic factor for DDLPSs, with retroperitoneal DDLPSs demonstrating the worst prognosis.6 DDLPSs have a high risk of local recurrence, with some reports estimating recurrence rates approaching 40%.2 Overall mortality at 5 years for DDLPS is estimated to be between 30% and 40%.4
Previous literature has determined that median income, race, health insurance, and facility type are related to survival outcomes for patients with DDLPS.7-9 When comparing the most common types of cancers, residents of poorer US counties consistently had a higher risk of mortality than residents in affluent US counties, and all racial minorities showed worse survival outcomes when compared with white patients.7 Differences in survival outcomes have been reported in patients attending different treatment facilities for other cancers including pancreatic cancers, glioblastomas, and oral cancers, with multiple studies concluding that academic and research programs are associated with the longest survival outcomes.10-12 For many cancers, insurance status has been shown to be a significant prognostic factor, with private insurance typically resulting in the best prognosis.8,9
The goal of this retrospective study was to assess the prognostic effects of socioeconomic variables on the overall survival (OS) probabilities in a large cohort of DDLPS patients in order to inform clinicians about a potentially at-risk population.
Method
The National Cancer Database (NCDB) was created by the Commission on Cancer (CoC) of the American College of Surgeons and the American Cancer Society. The NCDB is the largest cancer database in the US and includes data on almost 70% of US patients with cancer. CoC-accredited cancer programs add data on patients with cancer to the NCDB. The authors accessed the NCDB data through the use of the NCDB Participant Use File program.
Patients’ data from 2004 through 2015 were abstracted. Only patients with the International Classification of Diseases for Oncology histology code 8858, corresponding to DDLPS, were analyzed. Patients with other comorbid malignant tumors were excluded to accurately capture the true survival rates for DDLPS. Variables analyzed included age, sex, race, insurance status, treatment facility type, median household income by zip code, and percentage of adults in the patient’s zip code with no high school (HS) education.
Median survival, 5- and 10-year OS probabilities, and Kaplan-Meier survival curves were calculated for multiple variables, specifically race, insurance status, treatment facility type, median family income, and percentage of adults without a HS degree. Both 5- and 10-year OS probabilities were determined by race with the patients separated into white, African American, Asian, American Indian/Alaska Native (AI/AN), and Asian Indian or Pakistani groups. Our study categorized Chinese, Japanese, Filipino, Hmong, Korean, Vietnamese, Thai, Guamanian, Asian not otherwise specified, and other Asian ethnicity patients together into one collective Asian group. Insurance status was classified into Medicare, Medicaid, other government insurance, and private insurance groups. Other government insurance consisted of US Department of Veterans Affairs, Indian Health Service, Public Health Service, and other government health care programs. Further analysis could not be performed into the distribution of the other government insurance variable.
Facility types were divided into 4 groups: community, comprehensive community, academic/ research, and integrated network cancer treatment facilities. Median income quartiles and the percentage of adults with no high school degree were estimated by comparison of the patient’s zip code with US Census Bureau data. Median household income was separated into 4 groups, including lowest level of household income (< $38,000), low level of household income ($38,000 to $47,999), moderate level of household income ($48,000 to $62,999), and highest level of household income (≥ $63,000). The percentages of adults with no high school degree were divided into 4 groups: lowest level of HS education (≥ 21% ), low level of HS education (13.0% to 20.9%), moderate level of HS education (7.0% to 12.9%), and highest level of HS education (≤ 7%). The 5- and 10-year survival probabilities were calculated using the number of months between the date of diagnosis and the date of death or last known contact.
Continuous variables are presented as median and interquartile range (IQR) whereas categorical variables are presented as frequencies and proportion. IBM SPSS version 25.0 was used to produce Kaplan-Meier survival curves and descriptive statistics. This study used Kaplan- Meier survival tables and log-rank tests to analyze both the 5- and 10-year OS rates for the 5 variables listed above. This study also used a multivariable Cox regression model that accommodated the correlative nature of outcomes within facilities to study the association of the treatment facility type and other socioeconomic factors, while controlling for age, race (which was collapsed into 3 categories), sex, primary site, tumor stage, and treatment approaches. The proportional hazards assumption was individually checked for all pertinent variables. Any patient records that were missing data were excluded from the multivariable Cox regression model, which was analyzed with SAS version 9.4 (Cary, NC). P < 0.05 was used to indicate statistical significance for all analyses.
Results
Table 1 provides descriptive analysis for demographic characteristics of the 3573 patients including age, sex, and race. The median age at diagnosis was 64 years. There were 1073 more men (65%) than women (35%) in this analysis. Whites were the predominant racial category, comprising 87.7% of the patient population, followed by African Americans (6.5%) and Asians (2.5%).
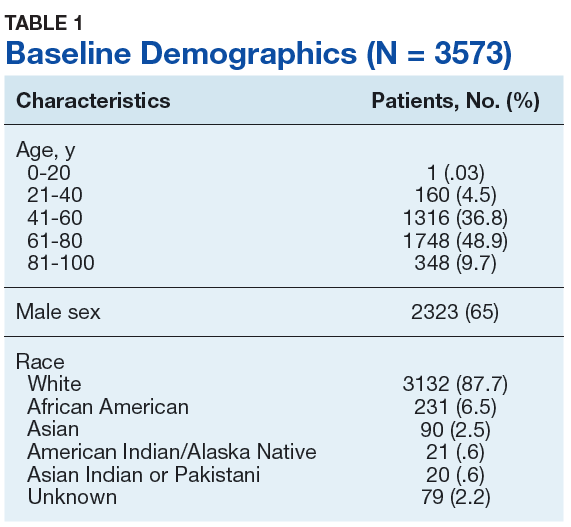
Socioeconomic Variables
The largest proportion of the patient population (45.5%) had private insurance (Table 2). Medicare came in a close second covering almost 42.2% of the population, followed by Medicaid (5.0%), uninsured (2.8%), and other government insurance (1.5%). About half (53.7%) of the patients were treated at academic or research facilities, while the fewest number of patients (5.2%) underwent treatment at community cancer facilities. The largest percentage (36.6%) of patients lived in zip codes with the highest level of median household income, while 26.0% and 22.3% had moderate and low levels of income, respectively. About 14% of patients lived within an area of the lowest level of income. Similarly, almost 15% of patients lived in an area of lowest level of HS education. The greatest percentage of the patient population (34.5%) lived in a zip code with moderate level of HS education. Surgery was the most common treatment modality with 90.8% of the cohort undergoing surgery, while 35.4% and 16.5% were treated with radiation and chemotherapy, respectively (some patients received more than one type of treatment modality).
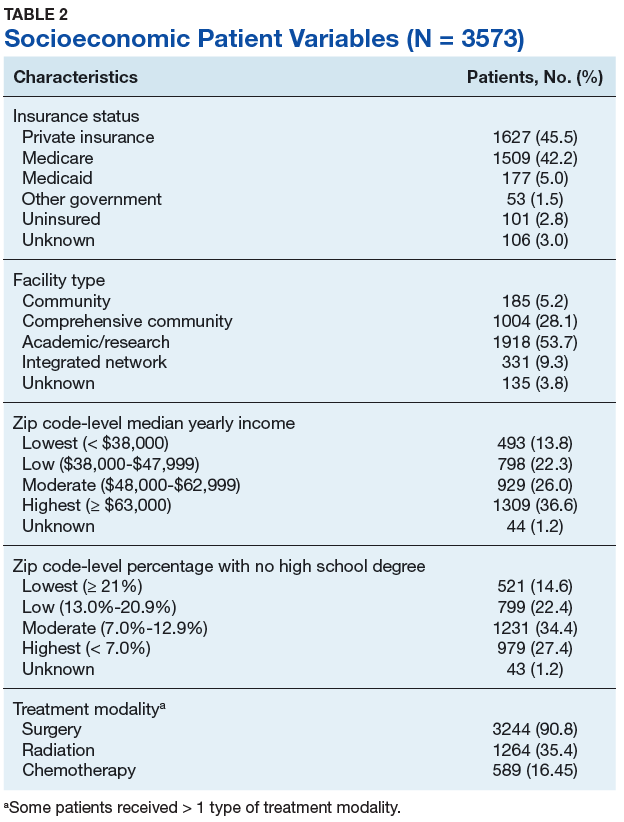
Survival Data
Survival data were available for 3112 patients. Kaplan-Meier survival curves were used to analyze OS according to insurance status, racial background, treatment facility type, median family income, and percentage of adults with no high school education. Overall 5- and 10- year OS probabilities were 51.5% and 34.8%, respectively, while the median OS (SD) was 63.57 (2.8) months (Table 3).
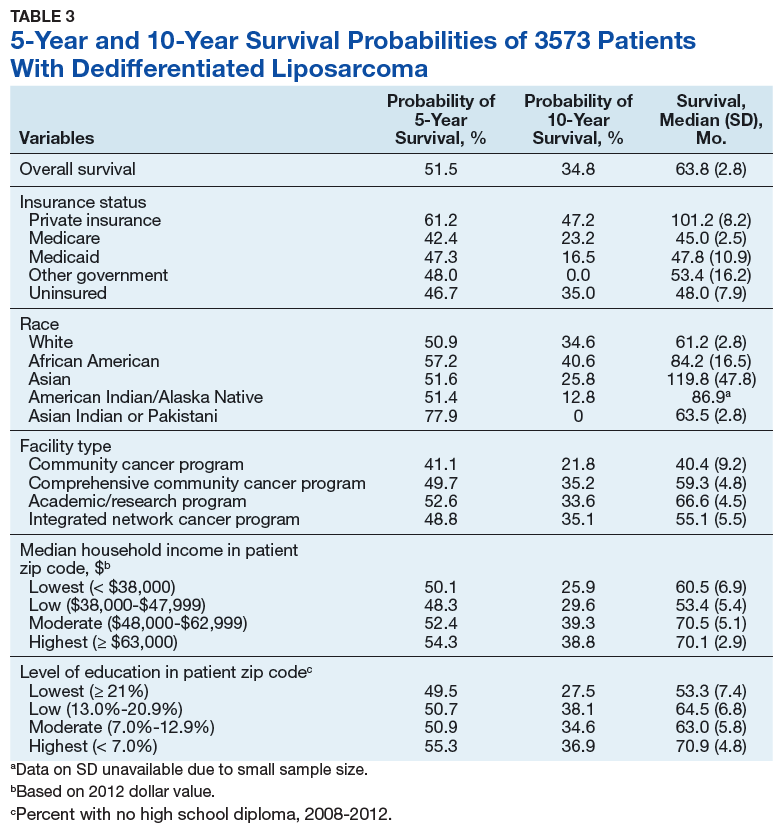
Private insurance showed significantly higher 5- and 10-year OS probabilities and median OS: 5-year OS was 61.2%, 10-year OS was 47.2%, and median survival (SD) was 101.2 (8.2) months compared with that of all other insurance groups (Medicare, Medicaid, other government insurance, and uninsured) (Figure 1). These other insurance types were fairly similar in their 5-year and median OS, but surprisingly, patients with no insurance had the second longest 10-year OS. The difference between the 5-year OS probabilities of private insurance compared with an average of the other insurances was 15.1%, which had almost doubled to 28.5% at 10 years, with a median OS difference of almost 5 years (56 months; data not shown).
Using the Kaplan-Meier survival curve, Asian Indians had the longest 5-year OS probability of 77.9% and African Americans had the longest 10-year OS probability of 40.6%. However, Asians as a group demonstrated the longest median (SD) OS outcome with 119.8 (47.8) months (Figure 2).
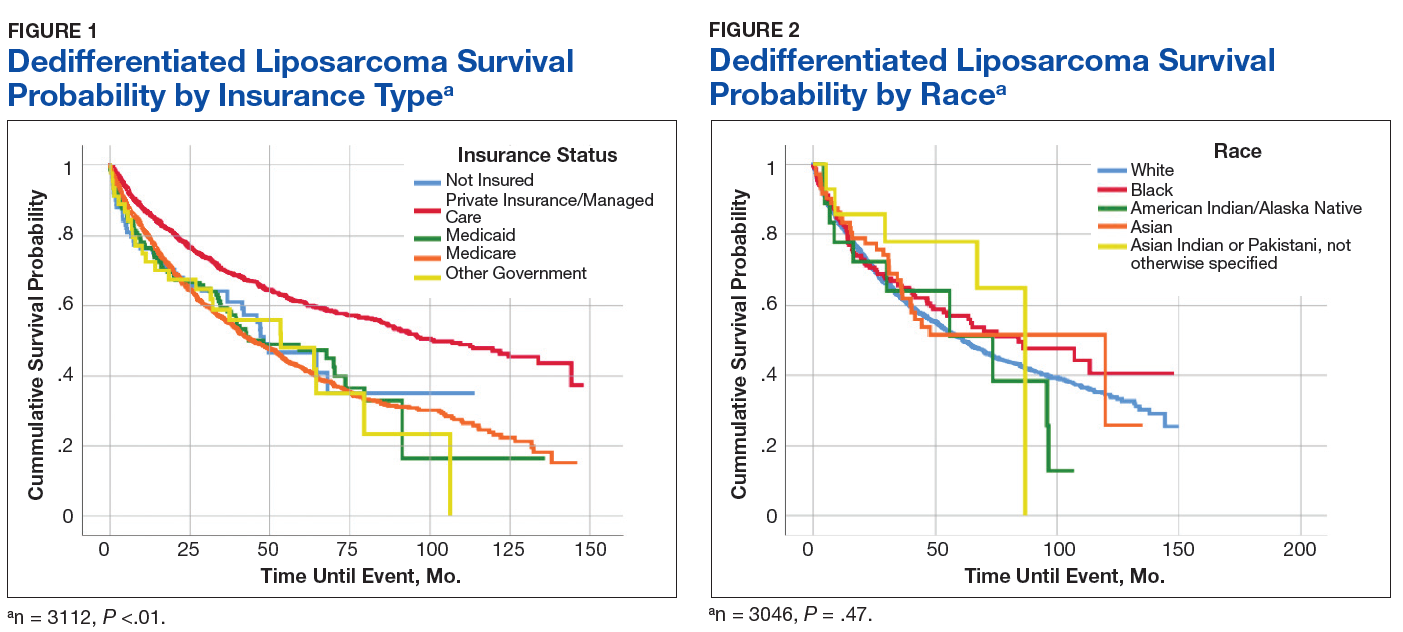
Overall, academic/research programs had the longest median OS and 5-year OS probability (SD) of 66.6 (4.5) months and 52.6%, respectively (Figure 3). Comprehensive community cancer programs and integrated network cancer programs had nearly identical 10-year OS rates (35.2% vs 35.1%, respectively). Community cancer programs had the worst 5- and 10-year OS probabilities (41.1% and 21.8%, respectively).
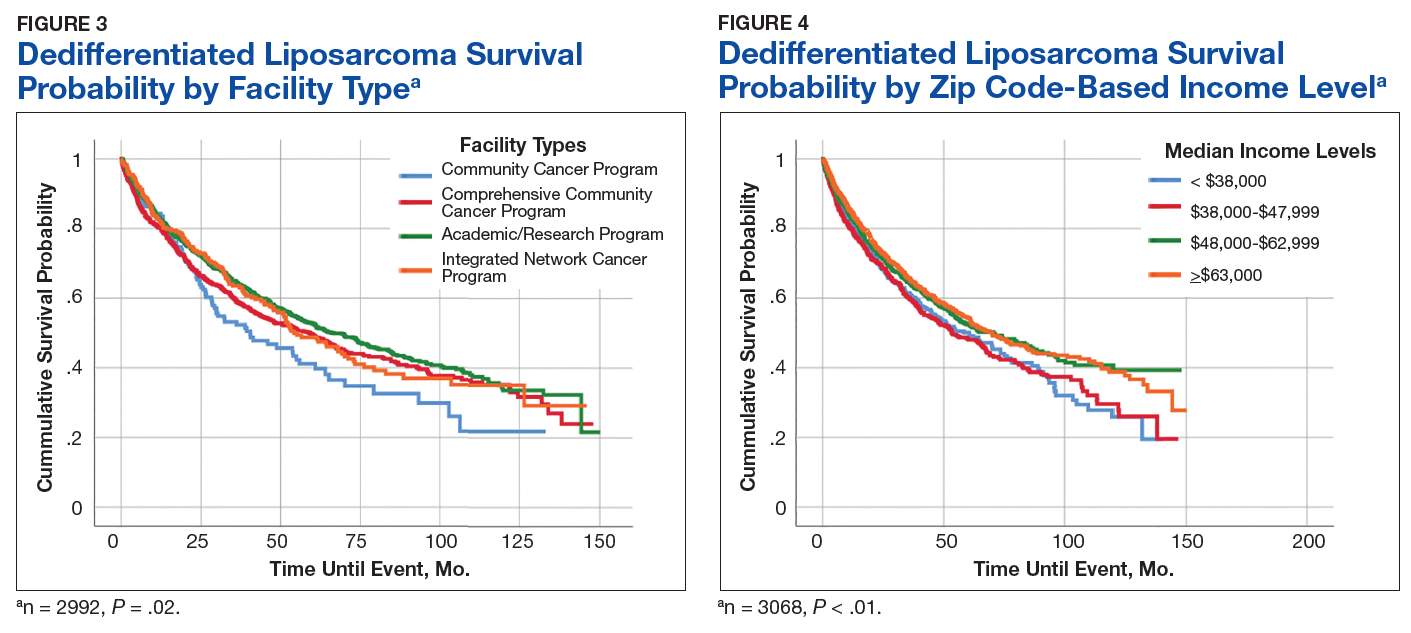
The top 2 income quartiles combined to demonstrate the longest median, 5-year, and 10-year OS probabilities and were very similar. Patients living in a zip code with the highest income level had the longest 5-year OS rates of 54.3%, while patients living in zip codes with a moderate income level had the longest 10-year OS at 39.3% and the longest median OS of about 71 months. Patients with the lowest level of median household income had the worst 5-year OS rates (48.3%) and a median (SD) OS of 53.4 (5.4) months (Figure 4).
A Kaplan-Meier curve for percentage of adults without a HS degree is displayed in Figure 5. Zip codes with the highest level of education had the longest 5-year OS rates and median (SD) OS of 55.3% and 70.9 (4.8) months, respectively. The longest 10-year OS outcomes at 38.1% were found in patients who lived in areas of low-education levels. The worst 5- and 10- year OS outcomes and median OS were found in the least educated zip codes.
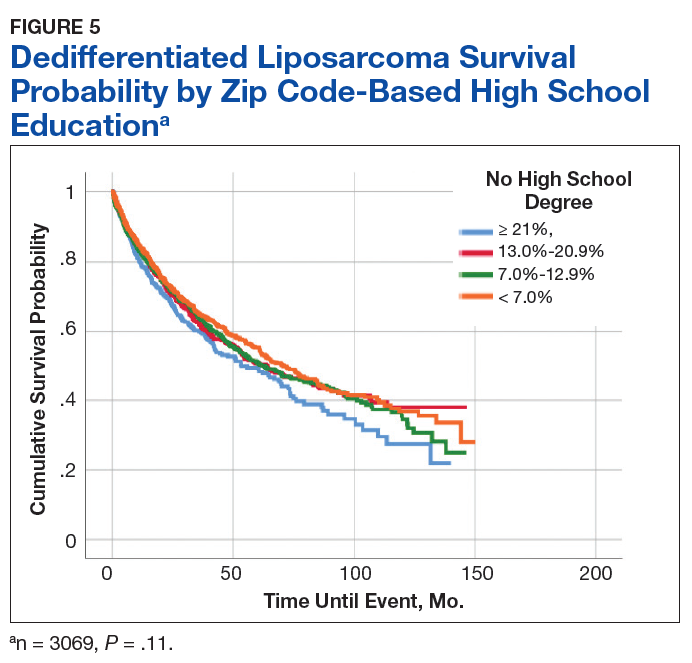
Results from the Cox regression model of OS are displayed in Table 4. Race and ethnicity, zip code-level median household income, and zip code-level education were not associated with OS. Patients with no insurance had an increased risk of death (hazard ratio [HR], 1.84; 95% CI, 1.17-2.88; P < .01) when compared with patients with private insurance. Patients with other government insurance also had an increased risk of death (HR, 2.12; 95% CI, 1.27-3.54; P < .01) when compared with patients with private insurance while controlling for all other variables. Patients with Medicare had a decreased risk of death when compared with patients with other government insurance and no insurance (HR, 0.53; 95% CI, 0.31-0.92; P = .02 and HR, 0.62; 95% CI, 0.38-0.99; P = .05, respectively). Patients treated at academic centers had better OS when compared with patients treated at comprehensive treatment centers (HR, 0.77; 95% CI, 0.65-0.92;P < .01) and community treatment centers (HR, 0.62; 95% CI, 0.44-0.86; P < .01).
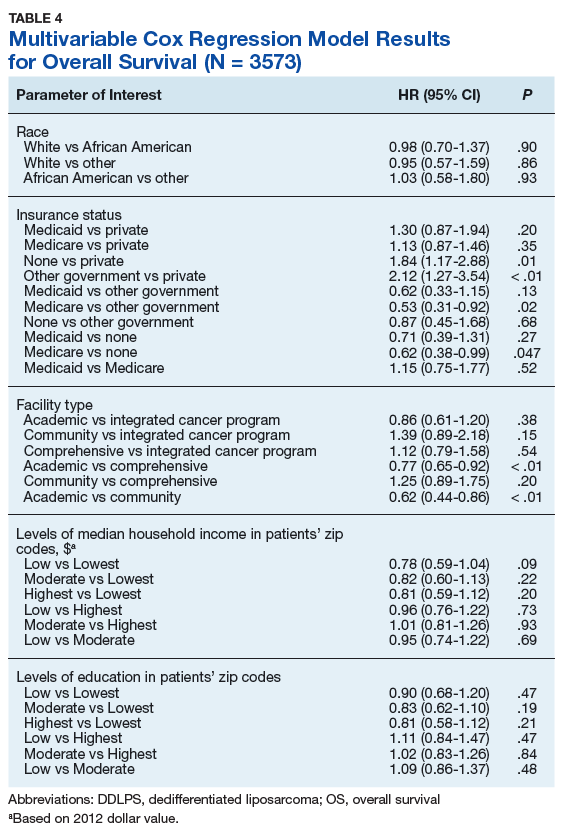
Discussion
This study is the largest study to date that specifically studies the type of treatment facilities and socioeconomic factors, including insurance status, race, income, and education, and how they affect survival of DDLPS. The overall 5- and 10-year OS probabilities for DDLPS in this study were 51.5% and 34.8%, respectively, with median OS of 63.6 months. These results were more encouraging than previous reports, which found a 5-year survival probability of 36.5% and a median OS of 45 months.13,14
The largest age grouping was aged 61 to 80 years (48.9% of the cohort), and the median age at diagnosis was 64 years. DDLPSs most typically present between the ages of 50 and 70 years.15 Our cohort was 65% male. Previous studies have indicated that DDLPSs affect the sexes equally; however, another study showed a similar male predominance (68.8%) at the MD Anderson Cancer Center in Houston, Texas.13,16
In our study, approximately 88% of patients were white, 6.5% were African American, and 2.5% were Asian, which differed from a previous study of 84 patients that had a 78.6% white, 4.8% Asian, and 1.2% African American patient population.14
Asian Indian or Pakistani patients had the best 5-year OS probability at 77.9%, followed by African American (57.2%), Asian (51.6%), AI/AN (51.4%), and white patients (50.9%). This trend had disappeared by 10 years and Asian, AI/AN, African American, and Asian Indian or Pakistani groups all demonstrated longer median OS than did white patients. In fact, Asian patients had the longest median OS at 119.8 months, which was almost double that of white patients with the lowest median OS of 61.2 months. This finding is contrary to previous studies, which reported that racial minorities typically had worse OS outcomes when compared with white patients in different types of cancer.7,17 Notably, these findings were not statistically significant in our current study in the log-rank or multivariable analyses.
Private insurance was the most common form of insurance followed in decreasing order by Medicare, Medicaid, uninsured, and other government insurance. About 42% of the cohort had Medicare, which is a federally funded US insurance program designated for patients aged ≥ 65 years and certain younger patients with disabilities.
Patients with private insurance demonstrated the longest OS, essentially twice the median OS of all other insured groups at 101 months. Medicare had the worst 5-year OS probability and median OS of all groups. A previous study of 77 patients with DDLPS reported that patients aged > 65 years had reduced OS.13 Medicare patients in this study were older, with a mean and median age at DDLPS diagnosis of 71 and 72 years, respectively, while private insurance had a mean and median age at diagnosis of 56 and 57 years, respectively. Medicare inherently covers older patients and this age difference could account for the decrease in overall survival.
Improved OS for privately insured patients was most notable compared with the uninsured or patients with other government insurance. Uninsured patients had an 83.7% increased risk of mortality when compared with patients with private insurance. When compared with patients with private insurance, patients with other government insurance had an 111.5% increased risk of mortality. Comparing patients with Medicare vs patients with no insurance or other government insurance, there was a decreased risk of mortality of 38.5% and 46.6%, respectively. This decreased OS in patients with other government insurance could be related to the choice of treatment facility, because only 31% of the patients with other government insurance went to academic or research centers when compared with the 58.4% and 50.8% of patients with private and Medicare insurance treated there (data not shown). Such centers often have access to more advanced technology and protocols that may not be available at other treatment facilities.
A little more than half of the patients in the cohort went to an academic or research center for treatment (53.7%); comprehensive community cancer programs were the second most common treatment facility at 28%. Patients treated at academic or research centers demonstrated the best outcomes with a 5-year OS of 52.6%, followed in decreasing order by comprehensive community cancer programs (49.7%), integrated network cancer programs (48.8%), and community cancer programs (41.1%). In our patient cocohort, patients treated at an academic/research center had slightly decreased 10-year OS rates compared with those patients treated at a comprehensive community cancer program, although the median OS for the academic/research centers were still the highest of all treatment facilities.
Treatment options varied significantly by facility, and the number of patients treated surgically followed a similar trend, with 92% undergoing surgery as the primary treatment at academic or research programs compared with 89% at comprehensive cancer programs and 82.7% at community cancer programs (data not shown). Another potential explaination for differing OS outcomes across facilities is the surgical margin outcome. Surgeries performed at community cancer programs or comprehensive cancer programs resulted with no residual tumor in 36% and 40% of cases, respectively, whereas cases performed at academic or research programs resulted with no residual tumor in 47% of cases (data not shown). Regardless, multivariate analysis demonstrated a marked decrease in the chance of mortality when comparing treatment received at academic facility centers with that received at comprehensive cancer centers (22.9%) and community cancer centers (38.3%) (data not shown).
A recent study demonstrated improved outcomes for patients with retroperitoneal or extremity STS treated at high-volume treatment centers.18 Patients treated at high-volume centers were found to have an 8% decreased risk of death compared with patients treated at low-volume centers. Notably, they found highvolume academic centers demonstrated the strongest improvement in survival, while highvolume community centers showed decreased survival.18 Similarly, we found that patients treated at academic/research institutions had improved 5-year OS and greater median OS than did patients treated at community cancer programs or comprehensive community cancer programs.
The top 2 income quartiles (≥ $48,000) combined to demonstrate the longest median, 5-year, and 10-year OS and were fairly similar between the quartiles. Patients living in zip codes with a median income of $38,000 to $47,999 had the worst 5-year OS and median OS. The log-rank analysis showed statistical evidence of differences in survival associated with income, but within the context of the multivariable analysis, there was no remaining evidence of a difference.
The longest 5-year OS outcomes were seen in patients living in zip codes with the highest level of education (55.3%). However, the difference in OS was not statistically significant using either the log-rank analysis or multivariate analysis.
Limitations
This study has certain inherent limitations in using a retrospective design and a large database such as the NCDB. Many different pathologists at CoC-accredited cancer programs perform the pathology that contributes to the data in the NCDB. There was no pathological review of these findings, which could potentially introduce error into the findings of this study. With the NCDB, potential selection bias is possible because patients in the database are added only from CoC-accredited cancer programs. This risk is minimized because NCDB contains data on most newly diagnosed cancer patients in the US. Further potential risks, which are unable to be controlled for, include potential interobserver error and data that may be incompletely, improperly, or inaccurately recorded from the patients’ charts. Without patient-specific information regarding income and education, it is challenging to utilize zip codes to estimate socioeconomic status and educational level. Even though a patient may live in a zip code identified with specific economic and educational characteristics, that patient may not share those characteristics. Furthermore, patients with Medicare tend to be older than patients with other forms of insurance, which limits the significance of comparisons across insurance groups. A future SEER (Surveillance, Epidemiology, and End Results) program study to confirm this study’s results and the effects of socioeconomic variables on DDLPS would be an excellent followup study.
Conclusion
This study used a large cohort of patients with DDLPS to study the effects of treatment facility, insurance status, and socioeconomic variables on survival outcomes. Although insurance status, median household income, and treatment facility were associated with differences in median OS and 5- and 10-year OS probabilities, evidence for a difference remained for only insurance status and facility type within the context of a multivariable analysis irrespective of age, race, sex, insurance status, education, and median income. Patients with private insurance and Medicaid had a decreased risk of mortality compared with other government insurance and no insurance. Patients receiving treatment at academic research programs had the highest median and 5-year OS of 66.6 months and 52.6%, respectively. Patients receiving treatment at academic centers had improved survival outcomes with a decrease in mortality of 23% and 38% compared to comprehensive or community cancer programs.
1. Dodd LG. Update on liposarcoma: a review for cytopathologists. Diagn Cytopathol. 2012;40(12):1122-1131.
2. Mangham D. World Health Organisation classification of tumours: pathology and genetics of tumours of soft tissue and bone. J Bone Joint Surg Am. 2004;86(3):466.
3. Dalal KM, Kattan MW, Antonescu CR, Brennan MF, Singer S. Subtype specific prognostic nomogram for patients with primary liposarcoma of the retroperitoneum, extremity, or trunk. Ann Surg. 2006;244(3):381-391.
4. Coindre JM, Pédeutour F, Aurias A. Well-differentiated and dedifferentiated liposarcomas. Virchows Arch. 2010;456(2):167-179.
5. Evans HL. Liposarcoma: a study of 55 cases with a reassessment of its classification. Am J Surg Pathol. 1979;3(6):507-523.
6. Henricks WH, Chu YC, Goldblum JR, Weiss SW. Dedifferentiated liposarcoma: a clinicopathological analysis of 155 cases with a proposal for an expanded definition of dedifferentiation. Am J Surg Pathol. 1997;21(3):271-281.
7. Ward E, Jemal A, Cokkinides V, et al. Cancer disparities by race/ethnicity and socioeconomic status. CA Cancer J Clin. 2004;54(2):78-93.
8. Halpern MT, Ward EM, Pavluck AL, Schrag NM, Bian J, Chen AY. Association of insurance status and ethnicity with cancer stage at diagnosis for 12 cancer sites: a retrospective analysis. Lancet Oncol. 2008;9(3):222-231.
9. Niu X, Roche LM, Pawlish KS, Henry KA. Cancer survival disparities by health insurance status. Cancer Med. 2013;2(3):403-411.
10. Hauser A, Dutta SW, Showalter TN, Sheehan JP, Grover S, Trifiletti DM. Impact of academic facility type and volume on post-surgical outcomes following diagnosis of glioblastoma. J Clin Neurosci. 2018;47:103-110.
11. Chu Q, Medeiros K, Zhou M, et al. Effect of facility type on outcome following pancreatectomy for pancreatic adenocarcinoma: analysis of the National Cancer Data Base [Abstract FP26-02]. HPB (Oxford). 2016;18(suppl 1):E81-E82.
12. Rubin SJ, Cohen MB, Kirke DN, Qureshi MM, Truong MT, Jalisi S. Comparison of facility type outcomes for oral cavity cancer: analysis of the National Cancer Database. Laryngoscope. 2017;127(11):2551-2557.
13. Lahat G, Anaya DA, Wang X, Tuvin D, Lev D, Pollock RE. Resectable well-differentiated versus dedifferentiated liposarcomas: two different diseases possibly requiring different treatment approaches. Ann Surg Oncol. 2008;15(6):1585-1593.
14. Livingston JA, Bugano D, Barbo A, et al. Role of chemotherapy in dedifferentiated liposarcoma of the retroperitoneum: defining the benefit and challenges of the standard. Sci Rep. 2017;7(1):11836.
15. Brennan MF, Antonescu CR, Alektiar KM, Maki RG. Management of Soft Tissue Sarcoma. 2nd ed. New York, NY: Springer; 2016.
16. Goldblum JR, Folpe AL, Weiss SW. Enzinger and Weiss’s Soft Tissue Tumors. 6th ed. Philadelphia, PA: Saunders; 2014.
17. White A, Djenaba J, Rim SH, Johnson CJ, Coleman MP, Allemani C. Colon cancer survival in the United States by race and stage (2001‐2009): findings from the CONCORD‐2 study. Cancer. 2017;123 (suppl 24):5014-5036.
18. Murphy JD, Padwal J, Guss ZD, Okamoto K, Sardar R. Impact of hospital volume on patterns of care and outcomes in soft tissue sarcoma [ASCO Abstract e23550]. J Clin Oncol. 2018;36(suppl 15):e23550
Approximately 17% to 25% of all softtissue sarcomas (STS) are liposarcomas, making liposarcoma the most common type of STS.1 The 2013 World Health Organization (WHO) classification separates liposarcoma into 4 histologic subtypes: atypical lipomatous tumor/well-differentiated (ALT/ WDLPS), dedifferentiated (DDLPS), myxoid, and pleomorphic.2 Each subtype has unique histology, morphology, and natural history. WDLPS and DDLPS are the most common histologic subtypes, comprising approximately 50% of all sarcomas that arise in the retroperitoneum.3 DDLPS represents 18% of all liposarcomas, making it the second most common subtype of liposarcoma.4
In 1979, DDLPS was first characterized.5 Most (90%) cases of DDLPS present de novo, whereas the other 10% transform from preexisting low-grade WDLPS.2 DDLPSs are formed by an amplification of 12q14-15 involving the MDM2 gene.4 These malignancies most commonly present in the retroperitoneum as a large painless mass, consisting of both fatty and nonfatty components.2 Primary site has been previously reported as a major prognostic factor for DDLPSs, with retroperitoneal DDLPSs demonstrating the worst prognosis.6 DDLPSs have a high risk of local recurrence, with some reports estimating recurrence rates approaching 40%.2 Overall mortality at 5 years for DDLPS is estimated to be between 30% and 40%.4
Previous literature has determined that median income, race, health insurance, and facility type are related to survival outcomes for patients with DDLPS.7-9 When comparing the most common types of cancers, residents of poorer US counties consistently had a higher risk of mortality than residents in affluent US counties, and all racial minorities showed worse survival outcomes when compared with white patients.7 Differences in survival outcomes have been reported in patients attending different treatment facilities for other cancers including pancreatic cancers, glioblastomas, and oral cancers, with multiple studies concluding that academic and research programs are associated with the longest survival outcomes.10-12 For many cancers, insurance status has been shown to be a significant prognostic factor, with private insurance typically resulting in the best prognosis.8,9
The goal of this retrospective study was to assess the prognostic effects of socioeconomic variables on the overall survival (OS) probabilities in a large cohort of DDLPS patients in order to inform clinicians about a potentially at-risk population.
Method
The National Cancer Database (NCDB) was created by the Commission on Cancer (CoC) of the American College of Surgeons and the American Cancer Society. The NCDB is the largest cancer database in the US and includes data on almost 70% of US patients with cancer. CoC-accredited cancer programs add data on patients with cancer to the NCDB. The authors accessed the NCDB data through the use of the NCDB Participant Use File program.
Patients’ data from 2004 through 2015 were abstracted. Only patients with the International Classification of Diseases for Oncology histology code 8858, corresponding to DDLPS, were analyzed. Patients with other comorbid malignant tumors were excluded to accurately capture the true survival rates for DDLPS. Variables analyzed included age, sex, race, insurance status, treatment facility type, median household income by zip code, and percentage of adults in the patient’s zip code with no high school (HS) education.
Median survival, 5- and 10-year OS probabilities, and Kaplan-Meier survival curves were calculated for multiple variables, specifically race, insurance status, treatment facility type, median family income, and percentage of adults without a HS degree. Both 5- and 10-year OS probabilities were determined by race with the patients separated into white, African American, Asian, American Indian/Alaska Native (AI/AN), and Asian Indian or Pakistani groups. Our study categorized Chinese, Japanese, Filipino, Hmong, Korean, Vietnamese, Thai, Guamanian, Asian not otherwise specified, and other Asian ethnicity patients together into one collective Asian group. Insurance status was classified into Medicare, Medicaid, other government insurance, and private insurance groups. Other government insurance consisted of US Department of Veterans Affairs, Indian Health Service, Public Health Service, and other government health care programs. Further analysis could not be performed into the distribution of the other government insurance variable.
Facility types were divided into 4 groups: community, comprehensive community, academic/ research, and integrated network cancer treatment facilities. Median income quartiles and the percentage of adults with no high school degree were estimated by comparison of the patient’s zip code with US Census Bureau data. Median household income was separated into 4 groups, including lowest level of household income (< $38,000), low level of household income ($38,000 to $47,999), moderate level of household income ($48,000 to $62,999), and highest level of household income (≥ $63,000). The percentages of adults with no high school degree were divided into 4 groups: lowest level of HS education (≥ 21% ), low level of HS education (13.0% to 20.9%), moderate level of HS education (7.0% to 12.9%), and highest level of HS education (≤ 7%). The 5- and 10-year survival probabilities were calculated using the number of months between the date of diagnosis and the date of death or last known contact.
Continuous variables are presented as median and interquartile range (IQR) whereas categorical variables are presented as frequencies and proportion. IBM SPSS version 25.0 was used to produce Kaplan-Meier survival curves and descriptive statistics. This study used Kaplan- Meier survival tables and log-rank tests to analyze both the 5- and 10-year OS rates for the 5 variables listed above. This study also used a multivariable Cox regression model that accommodated the correlative nature of outcomes within facilities to study the association of the treatment facility type and other socioeconomic factors, while controlling for age, race (which was collapsed into 3 categories), sex, primary site, tumor stage, and treatment approaches. The proportional hazards assumption was individually checked for all pertinent variables. Any patient records that were missing data were excluded from the multivariable Cox regression model, which was analyzed with SAS version 9.4 (Cary, NC). P < 0.05 was used to indicate statistical significance for all analyses.
Results
Table 1 provides descriptive analysis for demographic characteristics of the 3573 patients including age, sex, and race. The median age at diagnosis was 64 years. There were 1073 more men (65%) than women (35%) in this analysis. Whites were the predominant racial category, comprising 87.7% of the patient population, followed by African Americans (6.5%) and Asians (2.5%).
Socioeconomic Variables
The largest proportion of the patient population (45.5%) had private insurance (Table 2). Medicare came in a close second covering almost 42.2% of the population, followed by Medicaid (5.0%), uninsured (2.8%), and other government insurance (1.5%). About half (53.7%) of the patients were treated at academic or research facilities, while the fewest number of patients (5.2%) underwent treatment at community cancer facilities. The largest percentage (36.6%) of patients lived in zip codes with the highest level of median household income, while 26.0% and 22.3% had moderate and low levels of income, respectively. About 14% of patients lived within an area of the lowest level of income. Similarly, almost 15% of patients lived in an area of lowest level of HS education. The greatest percentage of the patient population (34.5%) lived in a zip code with moderate level of HS education. Surgery was the most common treatment modality with 90.8% of the cohort undergoing surgery, while 35.4% and 16.5% were treated with radiation and chemotherapy, respectively (some patients received more than one type of treatment modality).
Survival Data
Survival data were available for 3112 patients. Kaplan-Meier survival curves were used to analyze OS according to insurance status, racial background, treatment facility type, median family income, and percentage of adults with no high school education. Overall 5- and 10- year OS probabilities were 51.5% and 34.8%, respectively, while the median OS (SD) was 63.57 (2.8) months (Table 3).
Private insurance showed significantly higher 5- and 10-year OS probabilities and median OS: 5-year OS was 61.2%, 10-year OS was 47.2%, and median survival (SD) was 101.2 (8.2) months compared with that of all other insurance groups (Medicare, Medicaid, other government insurance, and uninsured) (Figure 1). These other insurance types were fairly similar in their 5-year and median OS, but surprisingly, patients with no insurance had the second longest 10-year OS. The difference between the 5-year OS probabilities of private insurance compared with an average of the other insurances was 15.1%, which had almost doubled to 28.5% at 10 years, with a median OS difference of almost 5 years (56 months; data not shown).
Using the Kaplan-Meier survival curve, Asian Indians had the longest 5-year OS probability of 77.9% and African Americans had the longest 10-year OS probability of 40.6%. However, Asians as a group demonstrated the longest median (SD) OS outcome with 119.8 (47.8) months (Figure 2).
Overall, academic/research programs had the longest median OS and 5-year OS probability (SD) of 66.6 (4.5) months and 52.6%, respectively (Figure 3). Comprehensive community cancer programs and integrated network cancer programs had nearly identical 10-year OS rates (35.2% vs 35.1%, respectively). Community cancer programs had the worst 5- and 10-year OS probabilities (41.1% and 21.8%, respectively).
The top 2 income quartiles combined to demonstrate the longest median, 5-year, and 10-year OS probabilities and were very similar. Patients living in a zip code with the highest income level had the longest 5-year OS rates of 54.3%, while patients living in zip codes with a moderate income level had the longest 10-year OS at 39.3% and the longest median OS of about 71 months. Patients with the lowest level of median household income had the worst 5-year OS rates (48.3%) and a median (SD) OS of 53.4 (5.4) months (Figure 4).
A Kaplan-Meier curve for percentage of adults without a HS degree is displayed in Figure 5. Zip codes with the highest level of education had the longest 5-year OS rates and median (SD) OS of 55.3% and 70.9 (4.8) months, respectively. The longest 10-year OS outcomes at 38.1% were found in patients who lived in areas of low-education levels. The worst 5- and 10- year OS outcomes and median OS were found in the least educated zip codes.
Results from the Cox regression model of OS are displayed in Table 4. Race and ethnicity, zip code-level median household income, and zip code-level education were not associated with OS. Patients with no insurance had an increased risk of death (hazard ratio [HR], 1.84; 95% CI, 1.17-2.88; P < .01) when compared with patients with private insurance. Patients with other government insurance also had an increased risk of death (HR, 2.12; 95% CI, 1.27-3.54; P < .01) when compared with patients with private insurance while controlling for all other variables. Patients with Medicare had a decreased risk of death when compared with patients with other government insurance and no insurance (HR, 0.53; 95% CI, 0.31-0.92; P = .02 and HR, 0.62; 95% CI, 0.38-0.99; P = .05, respectively). Patients treated at academic centers had better OS when compared with patients treated at comprehensive treatment centers (HR, 0.77; 95% CI, 0.65-0.92;P < .01) and community treatment centers (HR, 0.62; 95% CI, 0.44-0.86; P < .01).
Discussion
This study is the largest study to date that specifically studies the type of treatment facilities and socioeconomic factors, including insurance status, race, income, and education, and how they affect survival of DDLPS. The overall 5- and 10-year OS probabilities for DDLPS in this study were 51.5% and 34.8%, respectively, with median OS of 63.6 months. These results were more encouraging than previous reports, which found a 5-year survival probability of 36.5% and a median OS of 45 months.13,14
The largest age grouping was aged 61 to 80 years (48.9% of the cohort), and the median age at diagnosis was 64 years. DDLPSs most typically present between the ages of 50 and 70 years.15 Our cohort was 65% male. Previous studies have indicated that DDLPSs affect the sexes equally; however, another study showed a similar male predominance (68.8%) at the MD Anderson Cancer Center in Houston, Texas.13,16
In our study, approximately 88% of patients were white, 6.5% were African American, and 2.5% were Asian, which differed from a previous study of 84 patients that had a 78.6% white, 4.8% Asian, and 1.2% African American patient population.14
Asian Indian or Pakistani patients had the best 5-year OS probability at 77.9%, followed by African American (57.2%), Asian (51.6%), AI/AN (51.4%), and white patients (50.9%). This trend had disappeared by 10 years and Asian, AI/AN, African American, and Asian Indian or Pakistani groups all demonstrated longer median OS than did white patients. In fact, Asian patients had the longest median OS at 119.8 months, which was almost double that of white patients with the lowest median OS of 61.2 months. This finding is contrary to previous studies, which reported that racial minorities typically had worse OS outcomes when compared with white patients in different types of cancer.7,17 Notably, these findings were not statistically significant in our current study in the log-rank or multivariable analyses.
Private insurance was the most common form of insurance followed in decreasing order by Medicare, Medicaid, uninsured, and other government insurance. About 42% of the cohort had Medicare, which is a federally funded US insurance program designated for patients aged ≥ 65 years and certain younger patients with disabilities.
Patients with private insurance demonstrated the longest OS, essentially twice the median OS of all other insured groups at 101 months. Medicare had the worst 5-year OS probability and median OS of all groups. A previous study of 77 patients with DDLPS reported that patients aged > 65 years had reduced OS.13 Medicare patients in this study were older, with a mean and median age at DDLPS diagnosis of 71 and 72 years, respectively, while private insurance had a mean and median age at diagnosis of 56 and 57 years, respectively. Medicare inherently covers older patients and this age difference could account for the decrease in overall survival.
Improved OS for privately insured patients was most notable compared with the uninsured or patients with other government insurance. Uninsured patients had an 83.7% increased risk of mortality when compared with patients with private insurance. When compared with patients with private insurance, patients with other government insurance had an 111.5% increased risk of mortality. Comparing patients with Medicare vs patients with no insurance or other government insurance, there was a decreased risk of mortality of 38.5% and 46.6%, respectively. This decreased OS in patients with other government insurance could be related to the choice of treatment facility, because only 31% of the patients with other government insurance went to academic or research centers when compared with the 58.4% and 50.8% of patients with private and Medicare insurance treated there (data not shown). Such centers often have access to more advanced technology and protocols that may not be available at other treatment facilities.
A little more than half of the patients in the cohort went to an academic or research center for treatment (53.7%); comprehensive community cancer programs were the second most common treatment facility at 28%. Patients treated at academic or research centers demonstrated the best outcomes with a 5-year OS of 52.6%, followed in decreasing order by comprehensive community cancer programs (49.7%), integrated network cancer programs (48.8%), and community cancer programs (41.1%). In our patient cocohort, patients treated at an academic/research center had slightly decreased 10-year OS rates compared with those patients treated at a comprehensive community cancer program, although the median OS for the academic/research centers were still the highest of all treatment facilities.
Treatment options varied significantly by facility, and the number of patients treated surgically followed a similar trend, with 92% undergoing surgery as the primary treatment at academic or research programs compared with 89% at comprehensive cancer programs and 82.7% at community cancer programs (data not shown). Another potential explaination for differing OS outcomes across facilities is the surgical margin outcome. Surgeries performed at community cancer programs or comprehensive cancer programs resulted with no residual tumor in 36% and 40% of cases, respectively, whereas cases performed at academic or research programs resulted with no residual tumor in 47% of cases (data not shown). Regardless, multivariate analysis demonstrated a marked decrease in the chance of mortality when comparing treatment received at academic facility centers with that received at comprehensive cancer centers (22.9%) and community cancer centers (38.3%) (data not shown).
A recent study demonstrated improved outcomes for patients with retroperitoneal or extremity STS treated at high-volume treatment centers.18 Patients treated at high-volume centers were found to have an 8% decreased risk of death compared with patients treated at low-volume centers. Notably, they found highvolume academic centers demonstrated the strongest improvement in survival, while highvolume community centers showed decreased survival.18 Similarly, we found that patients treated at academic/research institutions had improved 5-year OS and greater median OS than did patients treated at community cancer programs or comprehensive community cancer programs.
The top 2 income quartiles (≥ $48,000) combined to demonstrate the longest median, 5-year, and 10-year OS and were fairly similar between the quartiles. Patients living in zip codes with a median income of $38,000 to $47,999 had the worst 5-year OS and median OS. The log-rank analysis showed statistical evidence of differences in survival associated with income, but within the context of the multivariable analysis, there was no remaining evidence of a difference.
The longest 5-year OS outcomes were seen in patients living in zip codes with the highest level of education (55.3%). However, the difference in OS was not statistically significant using either the log-rank analysis or multivariate analysis.
Limitations
This study has certain inherent limitations in using a retrospective design and a large database such as the NCDB. Many different pathologists at CoC-accredited cancer programs perform the pathology that contributes to the data in the NCDB. There was no pathological review of these findings, which could potentially introduce error into the findings of this study. With the NCDB, potential selection bias is possible because patients in the database are added only from CoC-accredited cancer programs. This risk is minimized because NCDB contains data on most newly diagnosed cancer patients in the US. Further potential risks, which are unable to be controlled for, include potential interobserver error and data that may be incompletely, improperly, or inaccurately recorded from the patients’ charts. Without patient-specific information regarding income and education, it is challenging to utilize zip codes to estimate socioeconomic status and educational level. Even though a patient may live in a zip code identified with specific economic and educational characteristics, that patient may not share those characteristics. Furthermore, patients with Medicare tend to be older than patients with other forms of insurance, which limits the significance of comparisons across insurance groups. A future SEER (Surveillance, Epidemiology, and End Results) program study to confirm this study’s results and the effects of socioeconomic variables on DDLPS would be an excellent followup study.
Conclusion
This study used a large cohort of patients with DDLPS to study the effects of treatment facility, insurance status, and socioeconomic variables on survival outcomes. Although insurance status, median household income, and treatment facility were associated with differences in median OS and 5- and 10-year OS probabilities, evidence for a difference remained for only insurance status and facility type within the context of a multivariable analysis irrespective of age, race, sex, insurance status, education, and median income. Patients with private insurance and Medicaid had a decreased risk of mortality compared with other government insurance and no insurance. Patients receiving treatment at academic research programs had the highest median and 5-year OS of 66.6 months and 52.6%, respectively. Patients receiving treatment at academic centers had improved survival outcomes with a decrease in mortality of 23% and 38% compared to comprehensive or community cancer programs.
1. Dodd LG. Update on liposarcoma: a review for cytopathologists. Diagn Cytopathol. 2012;40(12):1122-1131.
2. Mangham D. World Health Organisation classification of tumours: pathology and genetics of tumours of soft tissue and bone. J Bone Joint Surg Am. 2004;86(3):466.
3. Dalal KM, Kattan MW, Antonescu CR, Brennan MF, Singer S. Subtype specific prognostic nomogram for patients with primary liposarcoma of the retroperitoneum, extremity, or trunk. Ann Surg. 2006;244(3):381-391.
4. Coindre JM, Pédeutour F, Aurias A. Well-differentiated and dedifferentiated liposarcomas. Virchows Arch. 2010;456(2):167-179.
5. Evans HL. Liposarcoma: a study of 55 cases with a reassessment of its classification. Am J Surg Pathol. 1979;3(6):507-523.
6. Henricks WH, Chu YC, Goldblum JR, Weiss SW. Dedifferentiated liposarcoma: a clinicopathological analysis of 155 cases with a proposal for an expanded definition of dedifferentiation. Am J Surg Pathol. 1997;21(3):271-281.
7. Ward E, Jemal A, Cokkinides V, et al. Cancer disparities by race/ethnicity and socioeconomic status. CA Cancer J Clin. 2004;54(2):78-93.
8. Halpern MT, Ward EM, Pavluck AL, Schrag NM, Bian J, Chen AY. Association of insurance status and ethnicity with cancer stage at diagnosis for 12 cancer sites: a retrospective analysis. Lancet Oncol. 2008;9(3):222-231.
9. Niu X, Roche LM, Pawlish KS, Henry KA. Cancer survival disparities by health insurance status. Cancer Med. 2013;2(3):403-411.
10. Hauser A, Dutta SW, Showalter TN, Sheehan JP, Grover S, Trifiletti DM. Impact of academic facility type and volume on post-surgical outcomes following diagnosis of glioblastoma. J Clin Neurosci. 2018;47:103-110.
11. Chu Q, Medeiros K, Zhou M, et al. Effect of facility type on outcome following pancreatectomy for pancreatic adenocarcinoma: analysis of the National Cancer Data Base [Abstract FP26-02]. HPB (Oxford). 2016;18(suppl 1):E81-E82.
12. Rubin SJ, Cohen MB, Kirke DN, Qureshi MM, Truong MT, Jalisi S. Comparison of facility type outcomes for oral cavity cancer: analysis of the National Cancer Database. Laryngoscope. 2017;127(11):2551-2557.
13. Lahat G, Anaya DA, Wang X, Tuvin D, Lev D, Pollock RE. Resectable well-differentiated versus dedifferentiated liposarcomas: two different diseases possibly requiring different treatment approaches. Ann Surg Oncol. 2008;15(6):1585-1593.
14. Livingston JA, Bugano D, Barbo A, et al. Role of chemotherapy in dedifferentiated liposarcoma of the retroperitoneum: defining the benefit and challenges of the standard. Sci Rep. 2017;7(1):11836.
15. Brennan MF, Antonescu CR, Alektiar KM, Maki RG. Management of Soft Tissue Sarcoma. 2nd ed. New York, NY: Springer; 2016.
16. Goldblum JR, Folpe AL, Weiss SW. Enzinger and Weiss’s Soft Tissue Tumors. 6th ed. Philadelphia, PA: Saunders; 2014.
17. White A, Djenaba J, Rim SH, Johnson CJ, Coleman MP, Allemani C. Colon cancer survival in the United States by race and stage (2001‐2009): findings from the CONCORD‐2 study. Cancer. 2017;123 (suppl 24):5014-5036.
18. Murphy JD, Padwal J, Guss ZD, Okamoto K, Sardar R. Impact of hospital volume on patterns of care and outcomes in soft tissue sarcoma [ASCO Abstract e23550]. J Clin Oncol. 2018;36(suppl 15):e23550
Prevalence of Cancer in Thyroid Nodules In the Veteran Population (FULL)
Thyroid nodules are identified incidentally in 4% to 10% of the general population in the US.1,2 Clinicians and patients often are concerned about potential malignancy when thyroid nodules are identified because 5% to 15% of nodules will be cancerous.1 The most common form of cancer is papillary carcinoma followed by follicular carcinoma.2 Initially, serum thyroid-stimulating hormone (TSH) levels and thyroid ultrasound are used to evaluate a thyroid nodule because both tests can reveal vital information about malignancy potential.3 Ultrasound characteristics, such as macrocalcifications, hypoechogenicity, absence of halo, increased vascularity, and irregular nodular margins, increase suspicion for malignancy and warrant further investigation.3
Ultrasound-guided fine-needle aspiration (FNA) is the modality of choice for evaluation of thyroid nodules with sensitivity and specificity > 90%.2,4 Most patients receive a definitive diagnosis with this test; however, about 25% of cases are indeterminate based on the Bethesda System and require surgical investigation.3
Currently, it is well accepted clinical practice to refer all nodules > 4 cm for surgical intervention regardless of malignancy risk factors or the mass effect of the nodule.3-6 The preference for surgery—rather than FNA—is because of the notable false negative rate with FNA in larger nodules; studies have described false negative rates for FNA close to 10%.7,8 In contrast, Megwalu recently reported a FNA false negative rate of 0%.9
The risk of malignancy associated with nodule size has been researched for many years, but studies have produced conflicting results. In this retrospective cohort study, the authors compared malignancy rates between patients with nodules ≥ 3 cm and those with nodules < 3 cm.
Methods
The authors performed a retrospective chart review of the medical records of 329 patients presenting for thyroid nodule evaluation found on physical exam or incidentally identified with imaging at the Dayton Veteran Affairs Medical Center from January 2000 to May 2016. Data collection included sex, age, race, personal history of neck radiation treatment, family history of thyroid cancer, personal history of thyroid cancer, hot nodules/Graves disease, abnormal neck lymph nodes, and serum TSH levels. The authors looked for an association between TSH level and cancer. Hot thyroid nodules are known to have low risk of malignancy.
All patients aged 18 to 99 years with a thyroid nodule evaluated with FNA were included in the study. Patients were divided into 2 groups, those with nodules ≥ 3 cm and those with nodules < 3 cm. For nodules requiring subsequent biopsies, only the initial nodule biopsy was included in our study. The 3-cm cutoff was selected based on previous studies.1,5,10 Patients who did not undergo a FNA study were excluded. Indications for surgery were positive FNA results, suspicious imaging, size of nodule, or patient preference.
Means and standard deviations are reported for continuous variables and counts and percentages for categorical variables. We used the Mann-Whitney test for comparisons involving continuous variables with 2 groups and the Kruskal-Wallis test for 4 groups. The chi-square test—corrected for continuity if necessary—was used to compare 2 categorical variables. We used multiple logistic regression to adjust for demographic and clinical variables other than nodule size that were related to malignancy. Inferences were made at the 0.05 level of significance.
Results
A total of 329 patients with thyroid nodules were identified: 236 were < 3 cm and 93 were ≥ 3 cm. The 2 groups differed on race, with more white patients in the < 3-cm nodule group (78% vs 67%, P = .036) (Table 1). 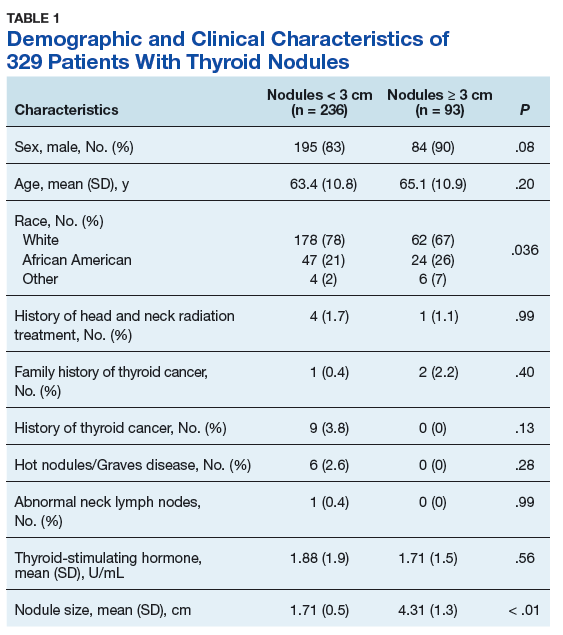
Prevalence of cancer based on FNA in nodules < 3 cm was 6.4% (95% CI, 3.6%–10.3%) and nodules ≥ 3 cm was 8.6% (95% CI, 3.8%–16.2%; P = .23) (Table 2). 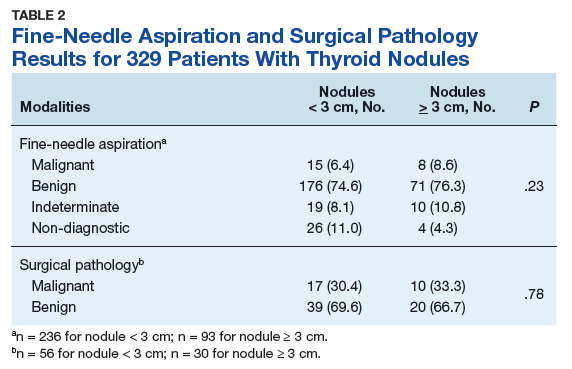
When divided into 4 subgroups, cancer using FNA was found in 35.1% of nodules < 2 cm, 21.1% of nodules 2 cm to < 3 cm, 42.1% of nodules 3 cm to 4 cm, and 18.2% of nodules > 4 cm (P = .32) (Table 3). 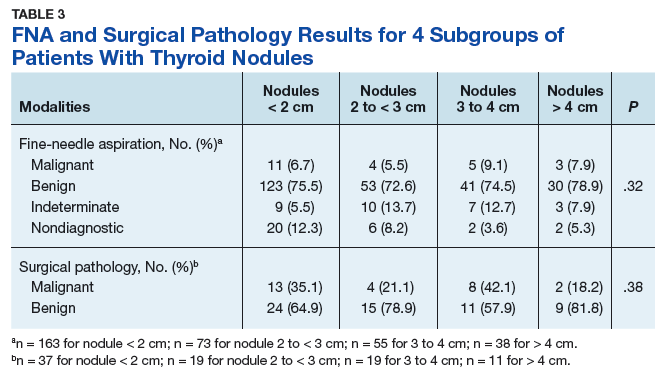
Surgical pathology results showed 17 cases of papillary carcinoma in nodules < 3 cm, whereas there were 9 cases of papillary carcinoma and 1 case of follicular carcinoma in nodules > 3 cm. When correlated with the cytology results, 10 cases were reported as benign, 11 were malignant, and 6 samples were non-diagnostic.
There were 30 nondiagnostic FNA samples: 7 patients had surgery, 19 were monitored with serial imaging, 2 were lost to follow-up, and 2 expired for other reasons. Of the 19 patients who were monitored with serial imaging, the nodules were stable and did not require repeat sampling.
Discussion
The authors found no relationship between thyroid nodule size and malignancy over a 16-year period in a veteran population, either with FNA or surgical pathology. The lack of relationship persists when adjusted for the only nonthyroid variable on which the 2 groups differed (race).
The finding of no relationship between larger thyroid nodule size and cancer is consistent with other studies. In a 10-year chart review of 695 patients at Walter Reed Army Medical Center, Burch and colleagues found a malignancy rate of 18.6% but no association between thyroid nodule size and malignancy.11 They concluded that nodules ≥ 4 cm did not increase malignancy risk. In a 3-year retrospective study of 326 patients, Mangister and colleagues reported that the malignancy rate was higher in nodules < 3 cm (48.4%) compared with nodules ≥ 3 cm (33.3%).10 This study concluded that the malignancy potential of thyroid nodules peaked at 2 cm and decreased at > 3 cm. Kamran and colleagues reported a nonlinear relationship between nodule size and malignancy with a threshold of 2 cm, beyond which there was no increased risk of malignancy.1
Conversely, in a prospective study Kuru and colleagues followed 571 patients who had undergone thyroidectomy and found that nodules ≥ 4 cm were associated with increased malignancy risk compared with nodules < 4 cm. However, with a cutoff of 3 cm there was no relationship.5 Discrepancies among studies might be because of variability in patient demographics and the prevalence of thyroid cancer in a specific institution. Although the majority of thyroid nodules are seen in females, the current study’s population was predominantly male and entirely veteran. Consequently, interpretation of these studies highlight the need to individualize clinical decision-making for each patient.
Limitations
This study has several limitations. It was conducted at a single institution with a group of veterans, which limits the ability to generalize its results to the general population. Second, data omissions are likely in retrospective chart reviews, and ensuring accuracy of data collection could be challenging. Third, all thyroid nodules found to be benign with cytology did not undergo surgical intervention to confirm the diagnosis; therefore, only 93 of 329 nodules were evaluated with the definitive diagnostic test. Therefore, selection bias was introduced into the nodule size comparisons when surgical intervention was used to measure the outcome. However, because false negative rates for FNA is low, likely few malignant nodules were missed. In addition, all patients with thyroid nodules are not referred for surgery because of potential complications.
Conclusion
This study strongly suggests there is no increased or decreased cancer risk for thyroid nodules ≥ 3 cm compared with those < 3 cm. Current clinical practice is to refer patients with larger nodules for surgical evaluation. In a large systemic review, Shin and colleagues reported higher pretest probability of malignancy in larger nodules and recommended consideration of surgical intervention for nodules > 3 cm because of false negatives and concerns for diagnostic inaccuracy with FNA.8 Although data were mixed, Shin and colleagues reported higher incidence of false negative FNA results in larger nodules.8 Given the authors’ findings and earlier conflicting results, the decision for surgical intervention cannot be made solely on nodule size and requires consideration of additional factors including FNA results, nodule characteristics, patient risk factors, and patient preference.
1. Kamran SC, Marqusee E, Kim MI, et al. Thyroid nodule size and prediction of cancer. J Clin Endocrinol Metab. 2013;98(2):564-570.
2. Haugen BR, Alexander EK, Bible KC, et al. 2015 American Thyroid Association Management guidelines for adult patients with thyroid nodules and differentiated thyroid cancer: The American Thyroid Association Guidelines Task Force on Thyroid Nodules and Differentiated Thyroid Cancer. Thyroid. 2016;26(1):1-33.
3. Popoveniuc G, Jonklaas J. Thyroid nodules. Med Clin North Am. 2012;96(2):329-349.
4. Amrikachi M, Ramzy I, Rubenfeld S, Wheeler TM. Accuracy of fine needle aspiration of thyroid. Arch Pathol Lab Med. 2001;125(4):484-488.
5. Kuru B, Gulcelik NE, Gulcelik MA, Dincer H. Predictive index for carcinoma of thyroid nodules and its integration with fine-needle aspiration cytology. Head Neck. 2009;31(7):856-866.
6. Kim JH, Kim NK, Oh YL, et al. The validity of ultrasonography-guided fine needle aspiration biopsy in thyroid nodules 4 cm or larger depends on ultrasound characteristics. Endocrinol Metab (Seoul). 2014;29(4):545-552.
7. Wharry LI, McCoy KL, Stang MT, et al. Thyroid nodules (≥4 cm): can ultrasound and cytology reliably exclude cancer? World J Surg. 2014;38(3):614-621.
8. Pinchot SN, Al-Wagih H, Schaefer S, Sippel R, Chen H. Accuracy of fine needle aspiration biopsy for predicting neoplasm or carcinoma in thyroid nodules 4 cm or larger. Arch Surg. 2009;144(7):649-655.
9. Megwalu UC. Risk of malignancy in thyroid nodules 4 cm or larger. Endocrinol Metab (Seoul). 2017;32(1):77-82.
10. Magister MJ, Chaikhoutdinov I, Schaefer E, et al. Association of thyroid nodule size and Bethesda class with rate of malignant disease. JAMA Otolaryngol Head Neck Surg. 2015;141(12):1089-1095.
11. Shrestha M, Crothers BA, Burch HB. The impact of thyroid nodule size on the risk of malignancy and accuracy of fine needle aspiration: a 10-year study from a single institution. Thyroid. 2012;22(12):1251-1256.
Thyroid nodules are identified incidentally in 4% to 10% of the general population in the US.1,2 Clinicians and patients often are concerned about potential malignancy when thyroid nodules are identified because 5% to 15% of nodules will be cancerous.1 The most common form of cancer is papillary carcinoma followed by follicular carcinoma.2 Initially, serum thyroid-stimulating hormone (TSH) levels and thyroid ultrasound are used to evaluate a thyroid nodule because both tests can reveal vital information about malignancy potential.3 Ultrasound characteristics, such as macrocalcifications, hypoechogenicity, absence of halo, increased vascularity, and irregular nodular margins, increase suspicion for malignancy and warrant further investigation.3
Ultrasound-guided fine-needle aspiration (FNA) is the modality of choice for evaluation of thyroid nodules with sensitivity and specificity > 90%.2,4 Most patients receive a definitive diagnosis with this test; however, about 25% of cases are indeterminate based on the Bethesda System and require surgical investigation.3
Currently, it is well accepted clinical practice to refer all nodules > 4 cm for surgical intervention regardless of malignancy risk factors or the mass effect of the nodule.3-6 The preference for surgery—rather than FNA—is because of the notable false negative rate with FNA in larger nodules; studies have described false negative rates for FNA close to 10%.7,8 In contrast, Megwalu recently reported a FNA false negative rate of 0%.9
The risk of malignancy associated with nodule size has been researched for many years, but studies have produced conflicting results. In this retrospective cohort study, the authors compared malignancy rates between patients with nodules ≥ 3 cm and those with nodules < 3 cm.
Methods
The authors performed a retrospective chart review of the medical records of 329 patients presenting for thyroid nodule evaluation found on physical exam or incidentally identified with imaging at the Dayton Veteran Affairs Medical Center from January 2000 to May 2016. Data collection included sex, age, race, personal history of neck radiation treatment, family history of thyroid cancer, personal history of thyroid cancer, hot nodules/Graves disease, abnormal neck lymph nodes, and serum TSH levels. The authors looked for an association between TSH level and cancer. Hot thyroid nodules are known to have low risk of malignancy.
All patients aged 18 to 99 years with a thyroid nodule evaluated with FNA were included in the study. Patients were divided into 2 groups, those with nodules ≥ 3 cm and those with nodules < 3 cm. For nodules requiring subsequent biopsies, only the initial nodule biopsy was included in our study. The 3-cm cutoff was selected based on previous studies.1,5,10 Patients who did not undergo a FNA study were excluded. Indications for surgery were positive FNA results, suspicious imaging, size of nodule, or patient preference.
Means and standard deviations are reported for continuous variables and counts and percentages for categorical variables. We used the Mann-Whitney test for comparisons involving continuous variables with 2 groups and the Kruskal-Wallis test for 4 groups. The chi-square test—corrected for continuity if necessary—was used to compare 2 categorical variables. We used multiple logistic regression to adjust for demographic and clinical variables other than nodule size that were related to malignancy. Inferences were made at the 0.05 level of significance.
Results
A total of 329 patients with thyroid nodules were identified: 236 were < 3 cm and 93 were ≥ 3 cm. The 2 groups differed on race, with more white patients in the < 3-cm nodule group (78% vs 67%, P = .036) (Table 1).
Prevalence of cancer based on FNA in nodules < 3 cm was 6.4% (95% CI, 3.6%–10.3%) and nodules ≥ 3 cm was 8.6% (95% CI, 3.8%–16.2%; P = .23) (Table 2).
When divided into 4 subgroups, cancer using FNA was found in 35.1% of nodules < 2 cm, 21.1% of nodules 2 cm to < 3 cm, 42.1% of nodules 3 cm to 4 cm, and 18.2% of nodules > 4 cm (P = .32) (Table 3).
Surgical pathology results showed 17 cases of papillary carcinoma in nodules < 3 cm, whereas there were 9 cases of papillary carcinoma and 1 case of follicular carcinoma in nodules > 3 cm. When correlated with the cytology results, 10 cases were reported as benign, 11 were malignant, and 6 samples were non-diagnostic.
There were 30 nondiagnostic FNA samples: 7 patients had surgery, 19 were monitored with serial imaging, 2 were lost to follow-up, and 2 expired for other reasons. Of the 19 patients who were monitored with serial imaging, the nodules were stable and did not require repeat sampling.
Discussion
The authors found no relationship between thyroid nodule size and malignancy over a 16-year period in a veteran population, either with FNA or surgical pathology. The lack of relationship persists when adjusted for the only nonthyroid variable on which the 2 groups differed (race).
The finding of no relationship between larger thyroid nodule size and cancer is consistent with other studies. In a 10-year chart review of 695 patients at Walter Reed Army Medical Center, Burch and colleagues found a malignancy rate of 18.6% but no association between thyroid nodule size and malignancy.11 They concluded that nodules ≥ 4 cm did not increase malignancy risk. In a 3-year retrospective study of 326 patients, Mangister and colleagues reported that the malignancy rate was higher in nodules < 3 cm (48.4%) compared with nodules ≥ 3 cm (33.3%).10 This study concluded that the malignancy potential of thyroid nodules peaked at 2 cm and decreased at > 3 cm. Kamran and colleagues reported a nonlinear relationship between nodule size and malignancy with a threshold of 2 cm, beyond which there was no increased risk of malignancy.1
Conversely, in a prospective study Kuru and colleagues followed 571 patients who had undergone thyroidectomy and found that nodules ≥ 4 cm were associated with increased malignancy risk compared with nodules < 4 cm. However, with a cutoff of 3 cm there was no relationship.5 Discrepancies among studies might be because of variability in patient demographics and the prevalence of thyroid cancer in a specific institution. Although the majority of thyroid nodules are seen in females, the current study’s population was predominantly male and entirely veteran. Consequently, interpretation of these studies highlight the need to individualize clinical decision-making for each patient.
Limitations
This study has several limitations. It was conducted at a single institution with a group of veterans, which limits the ability to generalize its results to the general population. Second, data omissions are likely in retrospective chart reviews, and ensuring accuracy of data collection could be challenging. Third, all thyroid nodules found to be benign with cytology did not undergo surgical intervention to confirm the diagnosis; therefore, only 93 of 329 nodules were evaluated with the definitive diagnostic test. Therefore, selection bias was introduced into the nodule size comparisons when surgical intervention was used to measure the outcome. However, because false negative rates for FNA is low, likely few malignant nodules were missed. In addition, all patients with thyroid nodules are not referred for surgery because of potential complications.
Conclusion
This study strongly suggests there is no increased or decreased cancer risk for thyroid nodules ≥ 3 cm compared with those < 3 cm. Current clinical practice is to refer patients with larger nodules for surgical evaluation. In a large systemic review, Shin and colleagues reported higher pretest probability of malignancy in larger nodules and recommended consideration of surgical intervention for nodules > 3 cm because of false negatives and concerns for diagnostic inaccuracy with FNA.8 Although data were mixed, Shin and colleagues reported higher incidence of false negative FNA results in larger nodules.8 Given the authors’ findings and earlier conflicting results, the decision for surgical intervention cannot be made solely on nodule size and requires consideration of additional factors including FNA results, nodule characteristics, patient risk factors, and patient preference.
1. Kamran SC, Marqusee E, Kim MI, et al. Thyroid nodule size and prediction of cancer. J Clin Endocrinol Metab. 2013;98(2):564-570.
2. Haugen BR, Alexander EK, Bible KC, et al. 2015 American Thyroid Association Management guidelines for adult patients with thyroid nodules and differentiated thyroid cancer: The American Thyroid Association Guidelines Task Force on Thyroid Nodules and Differentiated Thyroid Cancer. Thyroid. 2016;26(1):1-33.
3. Popoveniuc G, Jonklaas J. Thyroid nodules. Med Clin North Am. 2012;96(2):329-349.
4. Amrikachi M, Ramzy I, Rubenfeld S, Wheeler TM. Accuracy of fine needle aspiration of thyroid. Arch Pathol Lab Med. 2001;125(4):484-488.
5. Kuru B, Gulcelik NE, Gulcelik MA, Dincer H. Predictive index for carcinoma of thyroid nodules and its integration with fine-needle aspiration cytology. Head Neck. 2009;31(7):856-866.
6. Kim JH, Kim NK, Oh YL, et al. The validity of ultrasonography-guided fine needle aspiration biopsy in thyroid nodules 4 cm or larger depends on ultrasound characteristics. Endocrinol Metab (Seoul). 2014;29(4):545-552.
7. Wharry LI, McCoy KL, Stang MT, et al. Thyroid nodules (≥4 cm): can ultrasound and cytology reliably exclude cancer? World J Surg. 2014;38(3):614-621.
8. Pinchot SN, Al-Wagih H, Schaefer S, Sippel R, Chen H. Accuracy of fine needle aspiration biopsy for predicting neoplasm or carcinoma in thyroid nodules 4 cm or larger. Arch Surg. 2009;144(7):649-655.
9. Megwalu UC. Risk of malignancy in thyroid nodules 4 cm or larger. Endocrinol Metab (Seoul). 2017;32(1):77-82.
10. Magister MJ, Chaikhoutdinov I, Schaefer E, et al. Association of thyroid nodule size and Bethesda class with rate of malignant disease. JAMA Otolaryngol Head Neck Surg. 2015;141(12):1089-1095.
11. Shrestha M, Crothers BA, Burch HB. The impact of thyroid nodule size on the risk of malignancy and accuracy of fine needle aspiration: a 10-year study from a single institution. Thyroid. 2012;22(12):1251-1256.
Use of Mobile Messaging System for Self-Management of Chemotherapy Symptoms in Patients with Advanced Cancer (FULL)
Cancer and cancer-related treatment can cause a myriad of adverse effects.1,2 Early identification and management of these symptoms is paramount to the success of cancer treatment completion; however, clinic and telephonic strategies for addressing symptoms often result in delays in care.1 New strategies for patient engagement in the management of cancer and treatment-related symptoms are needed.
The use of online self-management tools can result in improvement in symptoms, reduce cancer symptom distress, improve quality-of-life, and improve medication adherence.3-9 A meta-analysis concluded that online interventions showed promise, but optimizing interventions would require additional research.10 Another meta-analysis found that online self-management was effective in managing several symptoms.11 An e-health method of collecting patient self-reported symptoms has been found to be acceptable to patients and feasible for use.12-14 We postulated that a mobile text messaging strategy may be an effective modality for augmenting symptom management for cancer patients in real time.
In the US Departmant of Veterans Affairs (VA), “Annie,” a self-care tool utilizing a text-messaging system has been implemented. Annie was developed modeling “Flo,” a messaging system in the United Kingdom that has been used for case management of chronic obstructive pulmonary disease, heart failure, stress incontinence, asthma, as a medication reminder tool, and to provide support for weight loss or post-operatively.15-17 Using Annie in the US, veterans have the ability to receive and track health information. Use of the Annie program has demonstrated improved continuous positive airway pressure monitor utilization in veterans with traumatic brain injury.18 Other uses within the Veterans Health Administration (VHA) include assisting patients with anger management, liver disease, anxiety, asthma, diabetes, HIV, hypertension, weight loss, and smoking cessation.
Methods
The Hematology/Oncology division of the Minneapolis VA Healthcare System (MVAHCS) is a tertiary care facility that administers about 260 new chemotherapy regimens annually. The MVAHCS interdisciplinary hematology/oncology group initiated a quality improvement project to determine the feasibility, acceptability, and experience of tailoring the Annie tool for self-management of cancer symptoms. The group consisted of 2 physicians, 3 advanced practice registered nurses, 1 physician assistant, 2 registered nurses, and 2 Annie program team members.
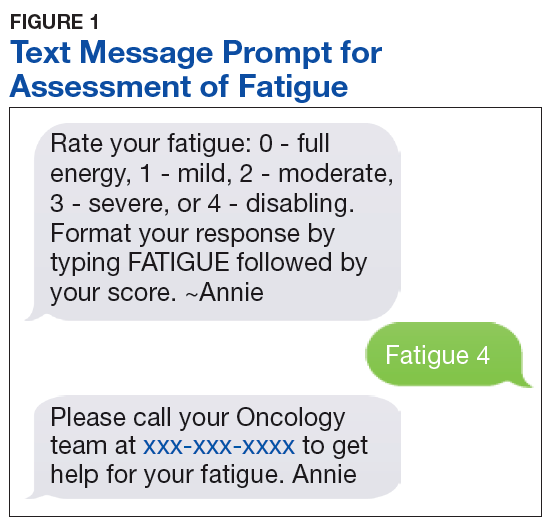
We first created a symptom management pilot protocol as a result of multidisciplinary team discussions. Examples of discussion points for consideration included, but were not limited to, timing of texts, amount of information to ask for and provide, what potential symptoms to consider, and which patient population to pilot first.
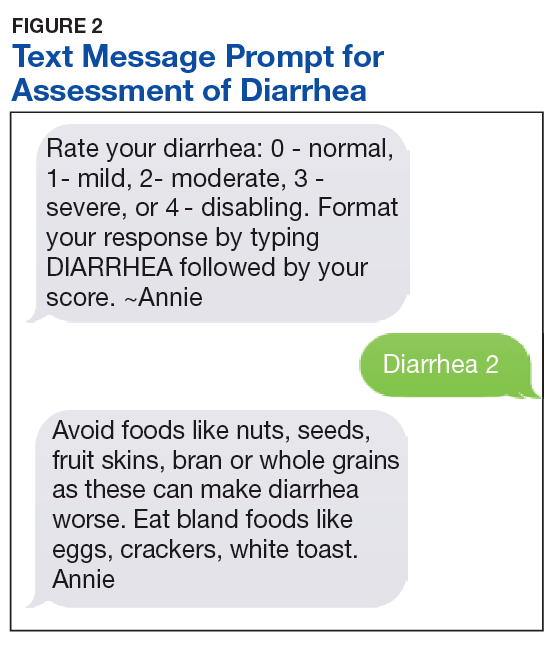
The initial protocol was agreed upon and is as follows: Patients were sent text messages twice daily Monday through Friday, and asked to rate 2 symptoms per day, using a severity scale of 0 to 4 (absent, mild, moderate, severe, or disabling): nausea/vomiting, mouth sores, fatigue (Figure 1), trouble breathing, appetite, constipation, diarrhea (Figure 2), numbness/tingling, pain. In addition, patients were asked whether they had had a fever or not. Based on their response to the symptom inquiries, the patient received an automated text response. The text may have provided positive affirmation that they were doing well, given them advice for home management, referred them to an educational hyperlink, asked them to call a direct number to the clinic, or instructed them to report directly to the emergency department (ED). Patients could input a particular symptom on any day, even if they were not specifically asked about that symptom on that day. Patients also were instructed to text, only if it was not an inconvenience to them, as we wanted the intervention to be helpful and not a burden.
Results
Through screening new patient consults or those referred for chemotherapy education, 15 male veterans enrolled in the symptom monitoring program over an 8 month period. There were additional patients who were not offered the program or chose not to participate; often due to not having texting capabilities on their phone or not liking the texting feature. The majority of those who participated in the program (n = 14) were enrolled at the start of Cycle 1; the other patient was enrolled at the start of Cycle 2. Patients were enrolled an average of 89 days (range 8-204). Average response rate was 84.2% (range 30-100%).
Although symptoms were not reviewed in real time, we reviewed responses to determine the utilization of the instructions given for the program. No veteran had 0 symptoms reported. There were numerous occurrences of a score of 1 or 2. Many of these patients had baseline symptoms due to their underlying cancer. A score of 3 or 4 on the system prompted the patient to call the clinic or go to the ED. Seven patients (some with multiple occurrences) were prompted to call; only 4 of these made the follow-up call to the clinic. All were offered a same day visit, but each declined. Only 1 patient reported a symptom on a day not prompted for that symptom. Symptoms that were reported are listed in order of frequency: fatigue, appetite loss, numbness, pain, mouth sore, and breathing difficulty. There were no visits to the ED.
Program Evaluation
An evaluation was conducted 30 to 60 days after program enrollment. We elicited feedback to determine who was reading and responding to the text message: the patient, a family member, or a caregiver; whether they found the prompts helpful and took action; how they felt about the number of texts; if they felt the program was helpful; and any other feedback that would improve the program. In general, the patients (8) answered the texts independently. In 4 cases, the spouse answered the texts, and 3 patients answered the texts together with their spouses. Most patients (11) found the amount of texting to be “just right.” However, 3 found it to be too many texts and 1 didn’t find the amount of texting to be enough.
Three veterans did not have enough symptoms to feel the program was of benefit to them, but they did feel it would have been helpful if they had been more symptomatic. One veteran recalled taking loperamide as needed, as a result of prompting. No veterans felt as though the texting feature was difficult to use; and overall, were very positive about the program. Several appreciated receiving messages that validated when they were doing well, and they felt empowered by self-management. One of the spouses was a registered nurse and found the information too basic to be of use.
Discussion
Initial evaluation of the program via survey found no technology challenges. Patients have been very positive about the program including ease of use, appreciation of messages that validated when they were doing well, empowerment of self-management, and some utilization of the texting advice for symptom management. Educational hyperlinks for constipation, fatigue, diarrhea, and nausea/vomiting were added after this evaluation, and patients felt that these additions provided a higher level of education.
Staff time for this intervention was minimal. A nurse navigator offered the texting program to the patient during chemotherapy education, along with some instructions, which generally took about 5 minutes. One of the Annie program staff enrolled the patient. From that point forward, this was a self-management tool, beyond checking to ensure that the patient was successful in starting the program and evaluating use for the purposes of this quality improvement project. This self-management tool did not replace any other mechanism that a patient would normally have in our department for seeking help for symptoms. The MVAHSC typical process for symptom management is to have patients call a 24/7 nurse line. If the triage nurse feels the symptoms are related to the patient’s cancer or cancer treatment, they are referred to the physician assistant who is assigned to take those calls and has the option to see the patient the same day. Patients could continue to call the nurse line or speak with providers at the next appointment at their discretion.
Conclusion
Although Annie has the option of using either text messaging or a mobile application, this project only utilized text messaging. The study by Basch and colleagues was the closest randomized trial we could identify to compare to our quality improvement intervention.5 The 2 main, distinct differences were that Basch and colleagues utilized online monitoring; and nurses were utilized to screen and intervene on responses, as appropriate.
The ability of our program to text patients without the use of an application or tablet, may enable more patients to participate due to ease of use. There would be no increased in expected workload for clinical staff, and may lead to decreased call burden. Since our program is automated, while still providing patients with the option to call and speak with a staff member as needed, this is a cost-effective, first-line option for symptom management for those experiencing cancer-related symptoms. We believe this text messaging tool can have system wide use and benefit throughout the VHA.
1. Bruera E, Dev R. Overview of managing common non-pain symptoms in palliative care. https://www.uptodate.com/contents/overview-of-managing-common-non-pain-symptoms-in-palliative-care. Updated June 12, 2019. Accessed July 18, 2019.
2. Pirschel C. The crucial role of symptom management in cancer care. https://voice.ons.org/news-and-views/the-crucial-role-of-symptom-management-in-cancer-care. Published December 14, 2017. Accessed July 18, 2019.
3. Adam R, Burton CD, Bond CM, de Bruin M, Murchie P. Can patient-reported measurements of pain be used to improve cancer pain management? A systematic review and meta-analysis. BMJ Support Palliat Care. 2017;7(4):373-382.
4. Basch E, Deal AM, Kris MG, et al. Symptom monitoring with patient-reported outcomes during routine cancer treatment: a randomized controlled trial. J Clin Oncol. 2016;34(6):557-565.
5. Berry DL, Blonquist TM, Patel RA, Halpenny B, McReynolds J. Exposure to a patient-centered, Web-based intervention for managing cancer symptom and quality of life issues: Impact on symptom distress. J Med Internet Res. 2015;3(7):e136.
6. Kolb NA, Smith AG, Singleton JR, et al. Chemotherapy-related neuropathic symptom management: a randomized trial of an automated symptom-monitoring system paired with nurse practitioner follow-up. Support Care Cancer. 2018;26(5):1607-1615
7. Kamdar MM, Centi AJ, Fischer N, Jetwani K. A randomized controlled trial of a novel artificial-intelligence based smartphone application to optimize the management of cancer-related pain. Presented at: 2018 Palliative and Supportive Care in Oncology Symposium; November 16-17, 2018; San Diego, CA.
8. Mooney KH, Beck SL, Wong B, et al. Automated home monitoring and management of patient-reported symptoms during chemotherapy: results of the symptom care at home RCT. Cancer Med. 2017;6(3):537-546.
9. Spoelstra SL, Given CW, Sikorskii A, et al. Proof of concept of a mobile health short message service text message intervention that promotes adherence to oral anticancer agent medications: a randomized controlled trial. Telemed J E Health. 2016;22(6):497-506.
10. Fridriksdottir N, Gunnarsdottir S, Zoëga S, Ingadottir B, Hafsteinsdottir EJG. Effects of web-based interventions on cancer patients’ symptoms: review of randomized trials. Support Care Cancer. 2018;26(2):3370-351.
11. Kim AR, Park HA. Web-based self-management support intervention for cancer survivors: a systematic review and meta-analysis. Stud Health Technol Inform. 2015;216:142-147.
12. Girgis A, Durcinoska I, Levesque JV, et al; PROMPT-Care Program Group. eHealth system for collecting and utilizing patient reported outcome measures for personalized treatment and care (PROMPT-Care) among cancer patients: mixed methods approach to evaluate feasibility and acceptability. J Med Internet Res. 2017;19(10):e330.
13. Moradian S, Krzyzanowska MK, Maguire R, et al. Usability evaluation of a mobile phone-based system for remote monitoring and management of chemotherapy-related side effects in cancer patients: Mixed methods study. JMIR Cancer. 2018;4(2): e10932.
14. Voruganti T, Grunfeld E, Jamieson T, et al. My team of care study: a pilot randomized controlled trial of a web-based communication tool for collaborative care in patients with advanced cancer. J Med Internet Res. 2017;19(7):e219.
15. The Health Foundation. Overview of Florence simple telehealth text messaging system. https://www.health.org.uk/article/overview-of-the-florence-simple-telehealth-text-messaging-system. Accessed July 31, 2019.
16. Bragg DD, Edis H, Clark S, Parsons SL, Perumpalath B…Maxwell-Armstrong CA. Development of a telehealth monitoring service after colorectal surgery: a feasibility study. 2017;9(9):193-199.
17. O’Connell P. Annie-the VA’s self-care game changer. http://www.simple.uk.net/home/blog/blogcontent/annie-thevasself-caregamechanger. Published April 21, 2016. Accessed August 2, 2019.
18. Kataria L, Sundahl, C, Skalina L, et al. Text message reminders and intensive education improves positive airway pressure compliance and cognition in veterans with traumatic brain injury and obstructive sleep apnea: ANNIE pilot study (P1.097). Neurology, 2018; 90(suppl 15):P1.097.
Cancer and cancer-related treatment can cause a myriad of adverse effects.1,2 Early identification and management of these symptoms is paramount to the success of cancer treatment completion; however, clinic and telephonic strategies for addressing symptoms often result in delays in care.1 New strategies for patient engagement in the management of cancer and treatment-related symptoms are needed.
The use of online self-management tools can result in improvement in symptoms, reduce cancer symptom distress, improve quality-of-life, and improve medication adherence.3-9 A meta-analysis concluded that online interventions showed promise, but optimizing interventions would require additional research.10 Another meta-analysis found that online self-management was effective in managing several symptoms.11 An e-health method of collecting patient self-reported symptoms has been found to be acceptable to patients and feasible for use.12-14 We postulated that a mobile text messaging strategy may be an effective modality for augmenting symptom management for cancer patients in real time.
In the US Departmant of Veterans Affairs (VA), “Annie,” a self-care tool utilizing a text-messaging system has been implemented. Annie was developed modeling “Flo,” a messaging system in the United Kingdom that has been used for case management of chronic obstructive pulmonary disease, heart failure, stress incontinence, asthma, as a medication reminder tool, and to provide support for weight loss or post-operatively.15-17 Using Annie in the US, veterans have the ability to receive and track health information. Use of the Annie program has demonstrated improved continuous positive airway pressure monitor utilization in veterans with traumatic brain injury.18 Other uses within the Veterans Health Administration (VHA) include assisting patients with anger management, liver disease, anxiety, asthma, diabetes, HIV, hypertension, weight loss, and smoking cessation.
Methods
The Hematology/Oncology division of the Minneapolis VA Healthcare System (MVAHCS) is a tertiary care facility that administers about 260 new chemotherapy regimens annually. The MVAHCS interdisciplinary hematology/oncology group initiated a quality improvement project to determine the feasibility, acceptability, and experience of tailoring the Annie tool for self-management of cancer symptoms. The group consisted of 2 physicians, 3 advanced practice registered nurses, 1 physician assistant, 2 registered nurses, and 2 Annie program team members.
We first created a symptom management pilot protocol as a result of multidisciplinary team discussions. Examples of discussion points for consideration included, but were not limited to, timing of texts, amount of information to ask for and provide, what potential symptoms to consider, and which patient population to pilot first.
The initial protocol was agreed upon and is as follows: Patients were sent text messages twice daily Monday through Friday, and asked to rate 2 symptoms per day, using a severity scale of 0 to 4 (absent, mild, moderate, severe, or disabling): nausea/vomiting, mouth sores, fatigue (Figure 1), trouble breathing, appetite, constipation, diarrhea (Figure 2), numbness/tingling, pain. In addition, patients were asked whether they had had a fever or not. Based on their response to the symptom inquiries, the patient received an automated text response. The text may have provided positive affirmation that they were doing well, given them advice for home management, referred them to an educational hyperlink, asked them to call a direct number to the clinic, or instructed them to report directly to the emergency department (ED). Patients could input a particular symptom on any day, even if they were not specifically asked about that symptom on that day. Patients also were instructed to text, only if it was not an inconvenience to them, as we wanted the intervention to be helpful and not a burden.
Results
Through screening new patient consults or those referred for chemotherapy education, 15 male veterans enrolled in the symptom monitoring program over an 8 month period. There were additional patients who were not offered the program or chose not to participate; often due to not having texting capabilities on their phone or not liking the texting feature. The majority of those who participated in the program (n = 14) were enrolled at the start of Cycle 1; the other patient was enrolled at the start of Cycle 2. Patients were enrolled an average of 89 days (range 8-204). Average response rate was 84.2% (range 30-100%).
Although symptoms were not reviewed in real time, we reviewed responses to determine the utilization of the instructions given for the program. No veteran had 0 symptoms reported. There were numerous occurrences of a score of 1 or 2. Many of these patients had baseline symptoms due to their underlying cancer. A score of 3 or 4 on the system prompted the patient to call the clinic or go to the ED. Seven patients (some with multiple occurrences) were prompted to call; only 4 of these made the follow-up call to the clinic. All were offered a same day visit, but each declined. Only 1 patient reported a symptom on a day not prompted for that symptom. Symptoms that were reported are listed in order of frequency: fatigue, appetite loss, numbness, pain, mouth sore, and breathing difficulty. There were no visits to the ED.
Program Evaluation
An evaluation was conducted 30 to 60 days after program enrollment. We elicited feedback to determine who was reading and responding to the text message: the patient, a family member, or a caregiver; whether they found the prompts helpful and took action; how they felt about the number of texts; if they felt the program was helpful; and any other feedback that would improve the program. In general, the patients (8) answered the texts independently. In 4 cases, the spouse answered the texts, and 3 patients answered the texts together with their spouses. Most patients (11) found the amount of texting to be “just right.” However, 3 found it to be too many texts and 1 didn’t find the amount of texting to be enough.
Three veterans did not have enough symptoms to feel the program was of benefit to them, but they did feel it would have been helpful if they had been more symptomatic. One veteran recalled taking loperamide as needed, as a result of prompting. No veterans felt as though the texting feature was difficult to use; and overall, were very positive about the program. Several appreciated receiving messages that validated when they were doing well, and they felt empowered by self-management. One of the spouses was a registered nurse and found the information too basic to be of use.
Discussion
Initial evaluation of the program via survey found no technology challenges. Patients have been very positive about the program including ease of use, appreciation of messages that validated when they were doing well, empowerment of self-management, and some utilization of the texting advice for symptom management. Educational hyperlinks for constipation, fatigue, diarrhea, and nausea/vomiting were added after this evaluation, and patients felt that these additions provided a higher level of education.
Staff time for this intervention was minimal. A nurse navigator offered the texting program to the patient during chemotherapy education, along with some instructions, which generally took about 5 minutes. One of the Annie program staff enrolled the patient. From that point forward, this was a self-management tool, beyond checking to ensure that the patient was successful in starting the program and evaluating use for the purposes of this quality improvement project. This self-management tool did not replace any other mechanism that a patient would normally have in our department for seeking help for symptoms. The MVAHSC typical process for symptom management is to have patients call a 24/7 nurse line. If the triage nurse feels the symptoms are related to the patient’s cancer or cancer treatment, they are referred to the physician assistant who is assigned to take those calls and has the option to see the patient the same day. Patients could continue to call the nurse line or speak with providers at the next appointment at their discretion.
Conclusion
Although Annie has the option of using either text messaging or a mobile application, this project only utilized text messaging. The study by Basch and colleagues was the closest randomized trial we could identify to compare to our quality improvement intervention.5 The 2 main, distinct differences were that Basch and colleagues utilized online monitoring; and nurses were utilized to screen and intervene on responses, as appropriate.
The ability of our program to text patients without the use of an application or tablet, may enable more patients to participate due to ease of use. There would be no increased in expected workload for clinical staff, and may lead to decreased call burden. Since our program is automated, while still providing patients with the option to call and speak with a staff member as needed, this is a cost-effective, first-line option for symptom management for those experiencing cancer-related symptoms. We believe this text messaging tool can have system wide use and benefit throughout the VHA.
1. Bruera E, Dev R. Overview of managing common non-pain symptoms in palliative care. https://www.uptodate.com/contents/overview-of-managing-common-non-pain-symptoms-in-palliative-care. Updated June 12, 2019. Accessed July 18, 2019.
2. Pirschel C. The crucial role of symptom management in cancer care. https://voice.ons.org/news-and-views/the-crucial-role-of-symptom-management-in-cancer-care. Published December 14, 2017. Accessed July 18, 2019.
3. Adam R, Burton CD, Bond CM, de Bruin M, Murchie P. Can patient-reported measurements of pain be used to improve cancer pain management? A systematic review and meta-analysis. BMJ Support Palliat Care. 2017;7(4):373-382.
4. Basch E, Deal AM, Kris MG, et al. Symptom monitoring with patient-reported outcomes during routine cancer treatment: a randomized controlled trial. J Clin Oncol. 2016;34(6):557-565.
5. Berry DL, Blonquist TM, Patel RA, Halpenny B, McReynolds J. Exposure to a patient-centered, Web-based intervention for managing cancer symptom and quality of life issues: Impact on symptom distress. J Med Internet Res. 2015;3(7):e136.
6. Kolb NA, Smith AG, Singleton JR, et al. Chemotherapy-related neuropathic symptom management: a randomized trial of an automated symptom-monitoring system paired with nurse practitioner follow-up. Support Care Cancer. 2018;26(5):1607-1615
7. Kamdar MM, Centi AJ, Fischer N, Jetwani K. A randomized controlled trial of a novel artificial-intelligence based smartphone application to optimize the management of cancer-related pain. Presented at: 2018 Palliative and Supportive Care in Oncology Symposium; November 16-17, 2018; San Diego, CA.
8. Mooney KH, Beck SL, Wong B, et al. Automated home monitoring and management of patient-reported symptoms during chemotherapy: results of the symptom care at home RCT. Cancer Med. 2017;6(3):537-546.
9. Spoelstra SL, Given CW, Sikorskii A, et al. Proof of concept of a mobile health short message service text message intervention that promotes adherence to oral anticancer agent medications: a randomized controlled trial. Telemed J E Health. 2016;22(6):497-506.
10. Fridriksdottir N, Gunnarsdottir S, Zoëga S, Ingadottir B, Hafsteinsdottir EJG. Effects of web-based interventions on cancer patients’ symptoms: review of randomized trials. Support Care Cancer. 2018;26(2):3370-351.
11. Kim AR, Park HA. Web-based self-management support intervention for cancer survivors: a systematic review and meta-analysis. Stud Health Technol Inform. 2015;216:142-147.
12. Girgis A, Durcinoska I, Levesque JV, et al; PROMPT-Care Program Group. eHealth system for collecting and utilizing patient reported outcome measures for personalized treatment and care (PROMPT-Care) among cancer patients: mixed methods approach to evaluate feasibility and acceptability. J Med Internet Res. 2017;19(10):e330.
13. Moradian S, Krzyzanowska MK, Maguire R, et al. Usability evaluation of a mobile phone-based system for remote monitoring and management of chemotherapy-related side effects in cancer patients: Mixed methods study. JMIR Cancer. 2018;4(2): e10932.
14. Voruganti T, Grunfeld E, Jamieson T, et al. My team of care study: a pilot randomized controlled trial of a web-based communication tool for collaborative care in patients with advanced cancer. J Med Internet Res. 2017;19(7):e219.
15. The Health Foundation. Overview of Florence simple telehealth text messaging system. https://www.health.org.uk/article/overview-of-the-florence-simple-telehealth-text-messaging-system. Accessed July 31, 2019.
16. Bragg DD, Edis H, Clark S, Parsons SL, Perumpalath B…Maxwell-Armstrong CA. Development of a telehealth monitoring service after colorectal surgery: a feasibility study. 2017;9(9):193-199.
17. O’Connell P. Annie-the VA’s self-care game changer. http://www.simple.uk.net/home/blog/blogcontent/annie-thevasself-caregamechanger. Published April 21, 2016. Accessed August 2, 2019.
18. Kataria L, Sundahl, C, Skalina L, et al. Text message reminders and intensive education improves positive airway pressure compliance and cognition in veterans with traumatic brain injury and obstructive sleep apnea: ANNIE pilot study (P1.097). Neurology, 2018; 90(suppl 15):P1.097.
Review of Radiologic Considerations in an Immunocompetent Patient With Primary Central Nervous System Lymphoma (FULL)
Central nervous system (CNS) lymphoma can be classified into 2 categories: primary CNS lymphoma (PCNSL), which includes disease limited to brain, eyes, spinal cord; and leptomeninges without coexisting or previous systemic lymphoma. Secondary CNS lymphoma (SCNSL) is essentially metastatic disease from a systemic primary site.1 The focus of this case presentation is PCNSL, with an emphasis on imaging characteristics and differential diagnosis.
The median age at diagnosis for PCNSL is 65 years, and the overall incidence has been decreasing since the mid-1990s, likely related to the increased use of highly-active antiretroviral therapy (HAART) in patients with AIDS.2,3 Although overall incidence has decreased, incidence in the elderly population has increased.4 Historically, PCNSL has been considered an AIDS-defining illness.5 These patients, among other immunocompromised patients, such as those on chronic immunosuppressive therapy, are at a higher risk for developing the malignancy.6
Clinical presentation varies because of the location of CNS involvement and may present with headache, mood or personality disturbances, or focal neurologic deficits. Seizures are less likely due to the tendency of PCNSL to spare gray matter. Initial workup generally includes a head computed tomography (CT) scan, as well as a contrast-enhanced magnetic resonance image (MRI), which may help direct clinicians to the appropriate diagnosis. However, there is significant overlap between the imaging characteristics of PCNSL and numerous other disease processes, including glioblastoma and demyelination. The imaging characteristics of PCNSL are considerably different depending on the patient’s immune status.7
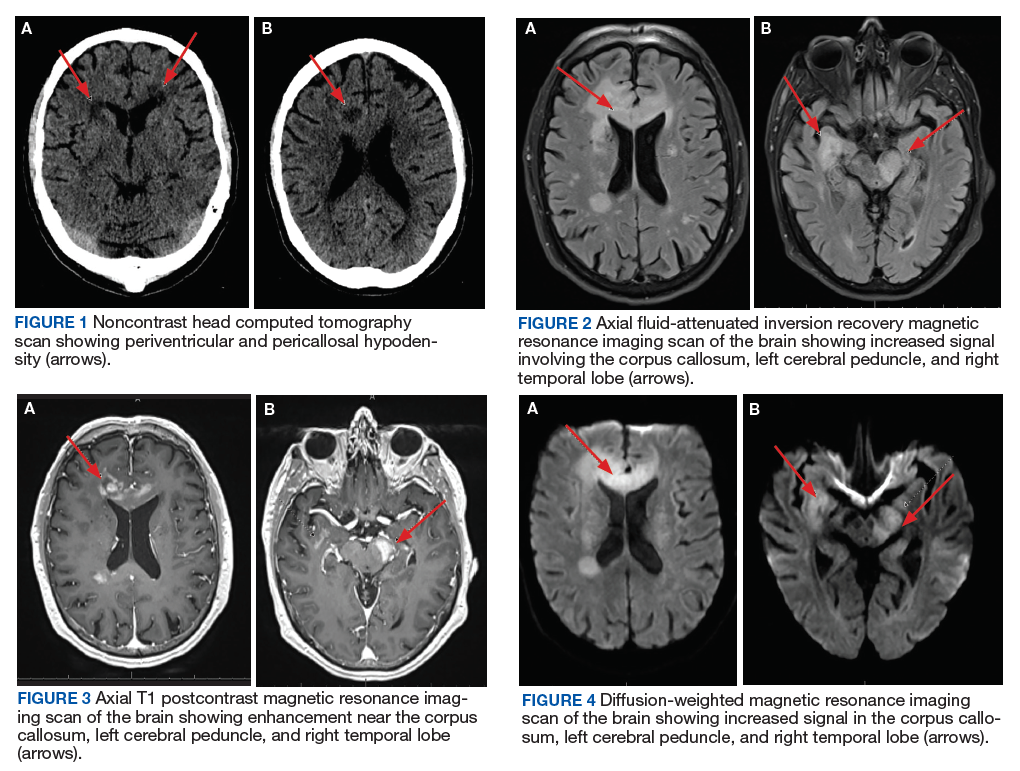
This case illustrates a rare presentation of PCNSL in an immunocompetent patient whose MRI characteristics were seemingly more consistent with those seen in patients with immunodeficiency. The main differential diagnoses and key imaging characteristics, which may help obtain accurate diagnosis, will be discussed.
Case Presentation
A 72-year-old male veteran presented with a 2-month history of subjective weakness in his upper and lower extremities progressing to multiple falls at home. He had no significant medical history other than a thymectomy at age 15 for an enlarged thymus, which per patient report, was benign. An initial laboratory test that included vitamin B12, folate, thyroid-stimulating hormone, complete blood cell count, and comprehensive metabolic panel, were unremarkable, with a white blood cell count of 8.5 K/uL. The initial neurologic evaluation did not show any focal neurologic deficits; however, during the initial hospital stay, the patient developed increasing lower extremity weakness on examination. A noncontrast CT head scan showed extensive nonspecific hypodensities within the periventricular white matter (Figure 1). A contrast-enhanced MRI showed enhancing lesions involving the corpus callosum, left cerebral peduncle, and right temporal lobe (Figures 2, 3, and 4). These lesions also exhibited significant restricted diffusion and a mild amount of surrounding vasogenic edema. The working diagnosis after the MRI included primary CNS lymphoma, multifocal glioblastoma, and tumefactive demyelinating disease. The patient was started on IV steroids and transferred for neurosurgical evaluation and biopsy at an outside hospital. The frontal lesion was biopsied, and the initial frozen section was consistent with lymphoma; a bone marrow biopsy was negative. The workup for immunodeficiency was unremarkable. Pathology revealed high-grade B-cell lymphoma, and the patient began a chemotherapy regimen.
Discussion
The workup of altered mental status, focal neurologic deficits, headaches, or other neurologic conditions often begins with a noncontrast CT scan. On CT, PCNSL generally appears isodense to hyperdense to gray matter, but appearance is variable. The often hyperdense appearance is attributable to the hypercellular nature of lymphoma. Many times, as in this case, CT may show only vague hypodensities, some of which may be associated with surrounding edema. This presentation is nonspecific and may be seen with advancing age due to changes of chronic microvascular ischemia as well as demyelination, other malignancies, and several other disease processes, both benign and malignant. After the initial CT scan, further workup requires evaluation with MRI. PCNSL exhibits restricted diffusion and variable signal intensity on T2-weighted imaging.
PCNSL is frequently centrally located within the periventricular white matter, often within the frontal lobe but can involve other lobes, the basal ganglia, brainstem, cerebellum, or less likely, the spinal canal.7 Contrary to primary CNS disease, secondary lymphoma within the CNS has been described classically as affecting a leptomeningeal (pia and arachnoid mater) distribution two-thirds of the time, with parenchymal involvement occurring in the other one-third of patients. A recent study by Malikova and colleagues found parenchymal involvement may be much more common than previously thought.1 Leptomeningeal spread of disease often involves the cranial nerves, subependymal regions, spinal cord, or spinal nerve roots. Dural involvement in primary or secondary lymphoma is rare.
PCNSL nearly always shows enhancement. Linear enhancement along perivascular spaces is highly characteristic of PCNSL. The typical appearance of PCNSL associated with immunodeficiency varies from that seen in an otherwise immunocompetent patient. Patients with immunodeficiency usually have multifocal involvement, central necrosis leading to a ring enhancement appearance, and have more propensity for spontaneous hemorrhage.7 Immunocompetent patients are less likely to present with multifocal disease and rarely show ring enhancement. Also, spontaneous hemorrhage is rare in immunocompetent patients. In our case, extensive multifocal involvement was present, whereas typically immunocompetent patients will present with a solitary homogeneously enhancing parenchymal mass.
The primary differential for PCNSL includes malignant glioma, tumefactive multiple sclerosis, metastatic disease, and in an immunocompromised patient, toxoplasmosis. The degree of associated vasogenic edema and mass effect is generally lower in PCNSL than that of malignant gliomas and metastasis. Also, PCNSL tends to spare the cerebral cortex.8
Classically, PCNSL, malignant gliomas, and demyelinating disease have been considered the main differential for lesions that cross midline and involve both cerebral hemispheres. Lymphoma generally exhibits more restricted diffusion than malignant gliomas and metastasis, attributable to the highly cellular nature of lymphoma.7 Tumefactive multiple sclerosis is associated with relatively minimal mass effect for lesion size and exhibits less restricted diffusion values when compared to high grade gliomas and PCNSL. One fairly specific finding for tumefactive demyelinating lesions is incomplete rim enhancement.9 Unfortunately, an MRI is not reliable in differentiating these entities, and biopsy is required for definitive diagnosis. Many advancing imaging modalities may help provide the correct diagnosis of PCNSL, including diffusion-weighted and apparent diffusion coefficient imaging, diffusion tensor imaging, MR spectroscopy and PET imaging.7
Conclusion
With the increasing use of HAART, the paradigm of PCNSL is shifting toward one predominantly affecting immunocompetent patients. PCNSL should be considered in any patient with multiple enhancing CNS lesions, regardless of immune status. Several key imaging characteristics may help differentiate PCNSL and other disease processes; however, at this time, biopsy is recommended for definitive diagnosis.
1. Malikova H, Burghardtova M, Koubska E, Mandys V, Kozak T, Weichet J. Secondary central nervous system lymphoma: spectrum of morphological MRI appearances. Neuropsychiatr Dis Treat. 2018;4:733-740.
2. Dolecek TA, Propp JM, Stroup NE, Kruchko C. CBTRUS statistical report: primary brain and central nervous system tumors diagnosed in the United States in 2005-2009. Neuro-Oncol. 2012;14(suppl 5):v1-v49.
3. Diamond C, Taylor TH, Aboumrad T, Anton-Culver H. Changes in acquired immunodeficiency syndrome-related non-Hodgkin lymphoma in the era of highly active antiretroviral therapy: incidence, presentation, treatment, and survival. Cancer. 2006;106(1):128-135.
4. O’Neill BP, Decker PA, Tieu C, Cerhan JR. The changing incidence of primary central nervous system lymphoma is driven primarily by the changing incidence in young and middle-aged men and differs from time trends in systemic diffuse large B-cell non-Hodgkins lymphoma. Am J Hematol. 2013;88(12):997-1000.
5. [no authors listed]. 1993 revised classification system for HIV infection and expanded surveillance case definition for AIDS among adolescents and adults. MMWR Recomm Rep. 1992;41(rr-17):1-19.
6. Maiuri F. Central nervous system lymphomas and immunodeficiency. Neurological Research. 1989;11(1):2-5.
7. Haldorsen IS, Espeland A, Larsson EM. Central nervous system lymphoma: characteristic findings on traditional and advanced imaging. AJNR Am J Neuroradiol. 2010;32(6):984-992.
8. Gómez Roselló E, Quiles Granado AM, Laguillo Sala G, Gutiérrez S. Primary central nervous system lymphoma in immunocompetent patients: spectrum of findings and differential characteristics. Radiología. 2018;60(4):280-289.
9. Mabray MC, Cohen BA, Villanueva-Meyer JE, et al. Performance of Apparent Diffusion Coefficient Values and Conventional MRI Features in Differentiating Tumefactive Demyelinating Lesions From Primary Brain Neoplasms. American Journal of Roentgenology. 2015;205(5):1075-1085.
Central nervous system (CNS) lymphoma can be classified into 2 categories: primary CNS lymphoma (PCNSL), which includes disease limited to brain, eyes, spinal cord; and leptomeninges without coexisting or previous systemic lymphoma. Secondary CNS lymphoma (SCNSL) is essentially metastatic disease from a systemic primary site.1 The focus of this case presentation is PCNSL, with an emphasis on imaging characteristics and differential diagnosis.
The median age at diagnosis for PCNSL is 65 years, and the overall incidence has been decreasing since the mid-1990s, likely related to the increased use of highly-active antiretroviral therapy (HAART) in patients with AIDS.2,3 Although overall incidence has decreased, incidence in the elderly population has increased.4 Historically, PCNSL has been considered an AIDS-defining illness.5 These patients, among other immunocompromised patients, such as those on chronic immunosuppressive therapy, are at a higher risk for developing the malignancy.6
Clinical presentation varies because of the location of CNS involvement and may present with headache, mood or personality disturbances, or focal neurologic deficits. Seizures are less likely due to the tendency of PCNSL to spare gray matter. Initial workup generally includes a head computed tomography (CT) scan, as well as a contrast-enhanced magnetic resonance image (MRI), which may help direct clinicians to the appropriate diagnosis. However, there is significant overlap between the imaging characteristics of PCNSL and numerous other disease processes, including glioblastoma and demyelination. The imaging characteristics of PCNSL are considerably different depending on the patient’s immune status.7
This case illustrates a rare presentation of PCNSL in an immunocompetent patient whose MRI characteristics were seemingly more consistent with those seen in patients with immunodeficiency. The main differential diagnoses and key imaging characteristics, which may help obtain accurate diagnosis, will be discussed.
Case Presentation
A 72-year-old male veteran presented with a 2-month history of subjective weakness in his upper and lower extremities progressing to multiple falls at home. He had no significant medical history other than a thymectomy at age 15 for an enlarged thymus, which per patient report, was benign. An initial laboratory test that included vitamin B12, folate, thyroid-stimulating hormone, complete blood cell count, and comprehensive metabolic panel, were unremarkable, with a white blood cell count of 8.5 K/uL. The initial neurologic evaluation did not show any focal neurologic deficits; however, during the initial hospital stay, the patient developed increasing lower extremity weakness on examination. A noncontrast CT head scan showed extensive nonspecific hypodensities within the periventricular white matter (Figure 1). A contrast-enhanced MRI showed enhancing lesions involving the corpus callosum, left cerebral peduncle, and right temporal lobe (Figures 2, 3, and 4). These lesions also exhibited significant restricted diffusion and a mild amount of surrounding vasogenic edema. The working diagnosis after the MRI included primary CNS lymphoma, multifocal glioblastoma, and tumefactive demyelinating disease. The patient was started on IV steroids and transferred for neurosurgical evaluation and biopsy at an outside hospital. The frontal lesion was biopsied, and the initial frozen section was consistent with lymphoma; a bone marrow biopsy was negative. The workup for immunodeficiency was unremarkable. Pathology revealed high-grade B-cell lymphoma, and the patient began a chemotherapy regimen.
Discussion
The workup of altered mental status, focal neurologic deficits, headaches, or other neurologic conditions often begins with a noncontrast CT scan. On CT, PCNSL generally appears isodense to hyperdense to gray matter, but appearance is variable. The often hyperdense appearance is attributable to the hypercellular nature of lymphoma. Many times, as in this case, CT may show only vague hypodensities, some of which may be associated with surrounding edema. This presentation is nonspecific and may be seen with advancing age due to changes of chronic microvascular ischemia as well as demyelination, other malignancies, and several other disease processes, both benign and malignant. After the initial CT scan, further workup requires evaluation with MRI. PCNSL exhibits restricted diffusion and variable signal intensity on T2-weighted imaging.
PCNSL is frequently centrally located within the periventricular white matter, often within the frontal lobe but can involve other lobes, the basal ganglia, brainstem, cerebellum, or less likely, the spinal canal.7 Contrary to primary CNS disease, secondary lymphoma within the CNS has been described classically as affecting a leptomeningeal (pia and arachnoid mater) distribution two-thirds of the time, with parenchymal involvement occurring in the other one-third of patients. A recent study by Malikova and colleagues found parenchymal involvement may be much more common than previously thought.1 Leptomeningeal spread of disease often involves the cranial nerves, subependymal regions, spinal cord, or spinal nerve roots. Dural involvement in primary or secondary lymphoma is rare.
PCNSL nearly always shows enhancement. Linear enhancement along perivascular spaces is highly characteristic of PCNSL. The typical appearance of PCNSL associated with immunodeficiency varies from that seen in an otherwise immunocompetent patient. Patients with immunodeficiency usually have multifocal involvement, central necrosis leading to a ring enhancement appearance, and have more propensity for spontaneous hemorrhage.7 Immunocompetent patients are less likely to present with multifocal disease and rarely show ring enhancement. Also, spontaneous hemorrhage is rare in immunocompetent patients. In our case, extensive multifocal involvement was present, whereas typically immunocompetent patients will present with a solitary homogeneously enhancing parenchymal mass.
The primary differential for PCNSL includes malignant glioma, tumefactive multiple sclerosis, metastatic disease, and in an immunocompromised patient, toxoplasmosis. The degree of associated vasogenic edema and mass effect is generally lower in PCNSL than that of malignant gliomas and metastasis. Also, PCNSL tends to spare the cerebral cortex.8
Classically, PCNSL, malignant gliomas, and demyelinating disease have been considered the main differential for lesions that cross midline and involve both cerebral hemispheres. Lymphoma generally exhibits more restricted diffusion than malignant gliomas and metastasis, attributable to the highly cellular nature of lymphoma.7 Tumefactive multiple sclerosis is associated with relatively minimal mass effect for lesion size and exhibits less restricted diffusion values when compared to high grade gliomas and PCNSL. One fairly specific finding for tumefactive demyelinating lesions is incomplete rim enhancement.9 Unfortunately, an MRI is not reliable in differentiating these entities, and biopsy is required for definitive diagnosis. Many advancing imaging modalities may help provide the correct diagnosis of PCNSL, including diffusion-weighted and apparent diffusion coefficient imaging, diffusion tensor imaging, MR spectroscopy and PET imaging.7
Conclusion
With the increasing use of HAART, the paradigm of PCNSL is shifting toward one predominantly affecting immunocompetent patients. PCNSL should be considered in any patient with multiple enhancing CNS lesions, regardless of immune status. Several key imaging characteristics may help differentiate PCNSL and other disease processes; however, at this time, biopsy is recommended for definitive diagnosis.
1. Malikova H, Burghardtova M, Koubska E, Mandys V, Kozak T, Weichet J. Secondary central nervous system lymphoma: spectrum of morphological MRI appearances. Neuropsychiatr Dis Treat. 2018;4:733-740.
2. Dolecek TA, Propp JM, Stroup NE, Kruchko C. CBTRUS statistical report: primary brain and central nervous system tumors diagnosed in the United States in 2005-2009. Neuro-Oncol. 2012;14(suppl 5):v1-v49.
3. Diamond C, Taylor TH, Aboumrad T, Anton-Culver H. Changes in acquired immunodeficiency syndrome-related non-Hodgkin lymphoma in the era of highly active antiretroviral therapy: incidence, presentation, treatment, and survival. Cancer. 2006;106(1):128-135.
4. O’Neill BP, Decker PA, Tieu C, Cerhan JR. The changing incidence of primary central nervous system lymphoma is driven primarily by the changing incidence in young and middle-aged men and differs from time trends in systemic diffuse large B-cell non-Hodgkins lymphoma. Am J Hematol. 2013;88(12):997-1000.
5. [no authors listed]. 1993 revised classification system for HIV infection and expanded surveillance case definition for AIDS among adolescents and adults. MMWR Recomm Rep. 1992;41(rr-17):1-19.
6. Maiuri F. Central nervous system lymphomas and immunodeficiency. Neurological Research. 1989;11(1):2-5.
7. Haldorsen IS, Espeland A, Larsson EM. Central nervous system lymphoma: characteristic findings on traditional and advanced imaging. AJNR Am J Neuroradiol. 2010;32(6):984-992.
8. Gómez Roselló E, Quiles Granado AM, Laguillo Sala G, Gutiérrez S. Primary central nervous system lymphoma in immunocompetent patients: spectrum of findings and differential characteristics. Radiología. 2018;60(4):280-289.
9. Mabray MC, Cohen BA, Villanueva-Meyer JE, et al. Performance of Apparent Diffusion Coefficient Values and Conventional MRI Features in Differentiating Tumefactive Demyelinating Lesions From Primary Brain Neoplasms. American Journal of Roentgenology. 2015;205(5):1075-1085.
Accuracy of Endoscopic Ultrasound in Staging of Early Rectal Cancer (FULL)
Endoscopic ultrasound can be highly accurate for the staging of neoplasms in early rectal cancer.
Colorectal cancer is the second most common cause of cancer death in the US, with one-third of all colorectal cancers occurring within the rectum. Each year, an estimated 40000 Americans are diagnosed with rectal cancer (RC).1,2 The prognosis and treatment of RC depends on both T and N stage at the time of diagnosis.3-5 According to the most recent National Comprehensive Cancer Network guidelines from May 2019, patients with T1 to T2N0 tumors should undergo transanal or transabdominal surgery upfront, whereas patients with T3 to T4N0 or any TN1 to 2 should start with neoadjuvant therapy for better locoregional control, followed by surgery.6 Therefore, the appropriate management of RC requires adequate staging.
Endoscopic ultrasound (EUS), magnetic resonance imaging (MRI), and computed tomography (CT) are the imaging techniques currently used to stage RC. In a meta-analysis of 90 articles published between 1985 and 2002 that compared the 3 radiologic modalities, Bipat and colleagues found that MRI and EUS had a similar sensitivity of 94%, whereas the specificity of EUS (86%) was significantly higher than that of MRI (69%) for muscularis propria invasion.7 CT was performed only in a limited number of trials because CT was considered inadequate to assess early T stage. For perirectal tissue invasion, the sensitivity of EUS was statistically higher than that of CT and MRI imaging: 90% compared with 79% and 82%, respectively. The specificity estimates for EUS, CT, and MRI were comparable: 75%, 78%, and 76%, respectively. The respective sensitivity and specificity of the 3 imaging modalities to evaluate lymph nodes were also comparable: EUS, 67% and 78%; CT, 55% and 74%; and MRI, 66% and 76%.
The role of EUS in the diagnosis and treatment of RC has long been validated.1,2-5 A meta-analysis of 42 studies involving 5039 patients found EUS to be highly accurate for differentiating various T stages.8 However, EUS cannot assess iliac and mesenteric lymph nodes or posterior tumor extension beyond endopelvic fascia in advanced RC. Notable heterogeneity was found among the studies in the meta-analyses with regard to the type of equipment used for staging, as well as the criteria used to assess the depth of penetration and nodal status. The recent introduction of phased-array coils and the development of T2-weighted fast spin sequences have improved the resolution of MRI. The MERCURY trial showed that extension of tumor to within 1 mm of the circumferential margin on high-resolution MRI correctly predicted margin involvement at the time of surgery in 92% of the patients.9 In the retrospective study by Balyasnikova and colleagues, MRI was found to correctly identify partial submucosal invasion and suitability for local excision in 89% of the cases.10
Therefore, both EUS and MRI are useful, more so than CT, in assessment of the depth of tumor invasion, nodal staging, and predicting the circumferential resection margin. The use of EUS, however, does not preclude the use of MRI, or vice versa. Rather, the 2 modalities can complement each other in staging and proper patient selection for treatment.11
Despite data supporting the value of EUS in staging RC, its use is limited by a high degree of operator dependence and a substantial learning curve,12-17 which may explain the low EUS accuracy observed in some reports.7,13,15 Given the presence of recognized alternatives such as MRI, we decided to reevaluate EUS accuracy for the staging of RC outside high-volume specialized centers and prospective clinical trials.
Methods
A retrospective chart review was performed that included all consecutive patients undergoing rectal ultrasound from January 2011 to August 2015 at the US Department of Veterans Affairs Medical Center (VAMC) in Memphis, Tennessee. Sixty-five patients with short-stocked or sessile lesions < 15 cm from anal margin staged T2N0M0 or lower by endorectal ultrasound (ERUS) were included. The patients with neoplasms staged in excess of T2 or N0 were excluded from the study because treatment protocol dictates immediate neoadjuvant treatment, the administration of which would affect subsequent histopathology.
For the 37 patients included in the final analysis, ERUS results were compared with surgical pathology to ascertain accuracy. The resections were performed endoscopically or surgically with a goal of obtaining clear margins. The choice of procedure depended on size, shape, location, and depth of invasion. All patients underwent clinical and endoscopic surveillance with flexible sigmoidoscopy/EUS every 3 to 6 months for the first 2 years. We used 2 different gold standards for surveillance depending on the type of procedure performed to remove the lesion. A pathology report was the gold standard used for patients who underwent surgery. In patients who underwent endoscopic resection, we used the lack of recurrent disease, determined by normal endoscopic and endoscopic ultrasound examination, to signify complete endoscopic resection and therefore adequate staging as an early neoplasm.
Results
From January 2011 to August 2015, 65 rectal ultrasounds were performed. All EUS procedures were performed by 1 physician (C Ruben Tombazzi). All patients had previous endoscopic evaluation and tissue diagnoses. Twenty-eight patients were excluded: 18 had T3 or N1 disease, 2 had T2N0 but refused surgery, 2 had anal cancer, 3 patients with suspected cancer had benign nonneoplastic disease (2 radiation proctitis, 1 normal rectal wall), and 3 underwent EUS for benign tumors (1 ganglioneuroma and 2 lipomas).
Thirty-seven patients were included in the study, 3 of whom were staged as T2N0 and 34 as T1N0 or lower by EUS. All patients were men ranging in age from 43 to 73 years (mean, 59 years). All 37 patients underwent endoscopic or surgical resection of their early rectal neoplasm. The final pathologic evaluation of the specimens demonstrated 14 carcinoid tumors, 11 adenocarcinomas, 6 tubular adenomas with high-grade dysplasia, and 6 benign adenomas. The preoperative EUS staging was confirmed for all patients, with 100% sensitivity, specificity, and accuracy. None of the patients who underwent endoscopic or surgical transanal resection had recurrence, determined by normal endoscopic and endoscopic ultrasound appearance, during a mean of 32.6 months surveillance.
Discussion
EUS has long been a recognized method for T and N staging of RC.1,3-5,7,8 Our data confirm that, in experienced hands, EUS is highly accurate in the staging of early rectal cancers.
The impact of EUS on the management of RC was demonstrated in a Mayo Clinic prospective blinded study.1 In that cohort of 80 consecutive patients who had previously had a CT for staging, EUS altered patient management in about 30% of cases. The most common change precipatated by EUS was the indication for additional neoadjuvant treatment.
However, the results have not been as encouraging when ERUS is performed outside of strict research protocol. A multicenter, prospective, country-wide quality assurance study from > 300 German hospitals was designed to assess the diagnostic accuracy of EUS in RC.13 Of 29206 patients, 7096 underwent surgery, without neoadjuvant treatment, and were included in the final analysis. The correspondence of tumor invasion with histopathology was 64.7%, with understaging of 18% and overstaging of 17.3%.13 These numbers were better in hospitals with greater experience performing ERUS: 73% accuracy in the centers with a case load of > 30 cases per year compared with 63.2% accuracy for the centers with < 10 cases a year. Marusch and colleagues had previously demonstrated an EUS accuracy of 63.3% in a study of 1463 patients with RC in Germany.14 Another study based out of the UK had similar findings. Ashraf and colleagues performed a database analyses from 20 UK centers and identified 165 patients with RC who underwent ERUS and endoscopic microsurgery.15 Compared with histopathology, EUS had 57.1% sensitivity, 73% specificity, and 42.9% accuracy for T1 cancers; EUS accuracy was 50% for T2 and 58% for T3 tumors. The authors concluded that the general accuracy of EUS in determining stage was around 50%, the statistical equivalent of flipping a coin.
The low accuracy of EUS observed by German and British multicenter studies13-15 was attributed to the difference that may exist in clinical trials at specialized centers compared with wider use of EUS in a community setting. As seen by our data, the Memphis VAMC is not a high-volume center for the treatment of RC. However, all our EUS procedures were performed and interpreted by a single operator (C. Ruben Tombazzi) with 18 years of EUS experience. We cannot conclude that no patient was overstaged, as patients receiving a stage of T3N0 or T > N0 received neoadjuvant treatment and were not included. However, we can conclude that no patient was understaged. All patients deemed to be T1 to T2N0 included in our study received accurate staging. Our results are consistent with the high accuracy of EUS reported from other centers with experience in diagnosis and treatment of RC.1,3-5,17,18
Although EUS is accurate in differentiating T1 from T2 tumors, it cannot reliably differentiate T1 from T0 lesions. In one study, 57.6% of adenomas and 30.7% of carcinomas in situ were staged as T1 on EUS, while almost half of T1 cancers were interpreted as T0.17 This drawback is a well-known limitation of EUS; although, the misinterpretation does not affect treatment, as both T0 and T1 lesions can be treated successfully by local excision alone, which was the algorithm used for our patients. The choice of the specific procedure for local excision was left to the clinicians and included transanal endoscopic or surgical resections. At a mean follow-up of 32.6 months, none of the 37 patients who underwent endoscopic or surgical transanal resection had evidence of recurrent disease.
A limitation of EUS, or any other imaging modality, is differentiating tumor invasion from peritumoral inflammation. The inflammation can render images of tumor borders ill-defined and irregular, which hinders precise staging. However, the accurate identification of tumors with deep involvement of the submucosa (T1sm3) is of importance, because these tumors are more advanced than the superficial and intermediate T1 lesions (T1sm1 and T1sm2, respectively).
Patients with RC whose lesions are considered T1sm3 are at higher risk of harboring lymph node metastases.18 Nascimbeni and colleagues had shown that the invasion into the lower third of the submucosa (sm3) was an independent risk factor for lower cancer-free survival among patients with T1 RC.19
Unlike rectal adenocarcinomas, the prognosis for carcinoid tumors correlates not only with the depth of invasion but also with the size of the tumor. The other adverse prognostic features include poor differentiation, high mitosis index, and lymphovascular invasion.20
EUS had been shown to be highly accurate in determining the precise carcinoid tumor size, depth of invasion, and lymph node metastases.20,21 In a study of 66 resected rectal carcinoid tumors by Ishii and colleagues, 57 lesions had a diameter of ≤ 10 mm and 9 lesions had a diameter of > 10 mm.21 All of the 57 carcinoid tumors with a diameter of ≤ 10 mm were confined to the submucosa. In contrast, 5 of the 9 lesions > 10 mm invaded the muscularis propria, 6 had a lymphovascular invasion, 4 were lymph node metastases, and 1 was a liver metastasis.
In our series, 4 of the 14 carcinoid tumors were > 10 mm but none were > 20 mm. None of the carcinoids with a diameter ≤ 10 mm invaded the muscularis propria. Of the 4 carcinoids > 10 mm, 1 was T2N0 and 3 were T1N0. All carcinoid tumors in our series were low grade and with low proliferation indexes, and all were treated successfully by local excision.
Conclusion
We believe our study shows that EUS can be highly accurate in staging rectal lesions, specifically lesions that are T1-T2N0, be they adenocarcinoma or carcinoid. Although we could not assess overstaging for lesions that were staged > T2 or > N0, we w
1. Harewood GC, Wiersema MJ, Nelson H, et al. A prospective, blinded assessment of the impact of preoperative staging on the management of rectal cancer. Gastroenterology. 2002;123(1):24-32.
2. Siegel RL, Miller KD, Jemal A. Cancer statistics, 2015. CA Cancer J Clin. 2015;65(1):5-29.
3. Ahuja NK, Sauer BG, Wang AY, et al. Performance of endoscopic ultrasound in staging rectal adenocarcinoma appropriate for primary surgical resection. Clin Gastroenterol Hepatol. 2015;13:339-44.
4. Doornebosch PG, Bronkhorst PJ, Hop WC, Bode WA, Sing AK, de Graaf EJ. The role of endorectal ultrasound in therapeutic decision-making for local vs. transabdominal resection of rectal tumors. Dis Colon Rectum. 2008;51(1):38-42.
5. Santoro GA, Gizzi G, Pellegrini L, Battistella G, Di Falco G. The value of high-resolution three-dimensional endorectal ultrasonography in the management of submucosal invasive rectal tumors. Dis Colon Rectum. 2009;52(11):1837-1843.
6. National Comprehensive Cancer Network. NCCN clinical practice guidelines in oncology: rectal cancer, version 2.2019. https://www.nccn.org/professionals/physician_gls/pdf/rectal.pdf. Published May 15, 2019. Accessed July 19, 2019.
7. Bipat S, Glas AS, Slors FJ, Zwinderman AH, Bossuyt PM, Stoker J. Rectal cancer: local staging and assessment of lymph node involvement with endoluminal US, CT, and MR imaging—a meta-analysis. Radiology. 2004;232(3):773-783.
8. Puli SR, Bechtold ML, Reddy JB, Choudhary A, Antillon MR, Brugge WR. How good is endoscopic ultrasound in differentiating various T stages of rectal cancer? Meta-analysis and systematic review. Ann Surg Oncol. 2009;16(2):254-265.
9. MERCURY Study Group. Diagnostic accuracy of preoperative magnetic resonance imaging in predicting curative resection of rectal cancer: prospective observational study. BMJ. 2006;333(7572):779.
10. Balyasnikova S, Read J, Wotherspoon A, et al. Diagnostic accuracy of high-resolution MRI as a method to predict potentially safe endoscopic and surgical planes in patient with early rectal cancer. BMJ Open Gastroenterol. 2017;4(1):e000151.
11. Frasson M, Garcia-Granero E, Roda D, et al. Preoperative chemoradiation may not always be needed for patients with T3 and T2N+ rectal cancer. Cancer. 2011;117(14):3118-3125.
12. Rafaelsen SR, Sørensen T, Jakobsen A, Bisgaard C, Lindebjerg J. Transrectal ultrasonography and magnetic resonance imaging in the staging of rectal cancer. Effect of experience. Scand J Gastroenterol. 2008;43(4):440-446.
13. Marusch F, Ptok H, Sahm M, et al. Endorectal ultrasound in rectal carcinoma – do the literature results really correspond to the realities of routine clinical care? Endoscopy. 2011;43(5):425-431.
14. Marusch F, Koch A, Schmidt U, et al. Routine use of transrectal ultrasound in rectal carcinoma: results of a prospective multicenter study. Endoscopy. 2002;34(5):385-390.
15. Ashraf S, Hompes R, Slater A, et al; Association of Coloproctology of Great Britain and Ireland Transanal Endoscopic Microsurgery (TEM) Collaboration. A critical appraisal of endorectal ultrasound and transanal endoscopic microsurgery and decision-making in early rectal cancer. Colorectal Dis. 2012;14(7):821-826.
16. Harewood GC. Assessment of clinical impact of endoscopic ultrasound on rectal cancer. Am J Gastroenterol. 2004;99(4):623-627.
17. Zorcolo L, Fantola G, Cabras F, Marongiu L, D’Alia G, Casula G. Preoperative staging of patients with rectal tumors suitable for transanal endoscopic microsurgery (TEM): comparison of endorectal ultrasound and histopathologic findings. Surg Endosc. 2009;23(6):1384-1389.
18. Akasu T, Kondo H, Moriya Y, et al. Endoscopic ultrasonography and treatment of early stage rectal cancer. World J Surg. 2000;24(9):1061-1068.
19. Nascimbeni R, Nivatvongs S, Larson DR, Burgart LJ. Long-term survival after local excision for T1 carcinoma of the rectum. Dis Colon Rectum. 2004;47(11):1773-1779.
20. Park CH, Cheon JH, Kim JO, et al. Criteria for decision making after endoscopic resection of well-differentiated rectal carcinoids with regard to potential lymphatic spread. Endoscopy. 2011;43(9):790-795.
21. Ishii N, Horiki N, Itoh T, et al. Endoscopic submucosal dissection and preoperative assessment with endoscopic ultrasonography for the treatment of rectal carcinoid tumors. Surg Endosc. 2010;24(6):1413-1419.
Endoscopic ultrasound can be highly accurate for the staging of neoplasms in early rectal cancer.
Endoscopic ultrasound can be highly accurate for the staging of neoplasms in early rectal cancer.
Colorectal cancer is the second most common cause of cancer death in the US, with one-third of all colorectal cancers occurring within the rectum. Each year, an estimated 40000 Americans are diagnosed with rectal cancer (RC).1,2 The prognosis and treatment of RC depends on both T and N stage at the time of diagnosis.3-5 According to the most recent National Comprehensive Cancer Network guidelines from May 2019, patients with T1 to T2N0 tumors should undergo transanal or transabdominal surgery upfront, whereas patients with T3 to T4N0 or any TN1 to 2 should start with neoadjuvant therapy for better locoregional control, followed by surgery.6 Therefore, the appropriate management of RC requires adequate staging.
Endoscopic ultrasound (EUS), magnetic resonance imaging (MRI), and computed tomography (CT) are the imaging techniques currently used to stage RC. In a meta-analysis of 90 articles published between 1985 and 2002 that compared the 3 radiologic modalities, Bipat and colleagues found that MRI and EUS had a similar sensitivity of 94%, whereas the specificity of EUS (86%) was significantly higher than that of MRI (69%) for muscularis propria invasion.7 CT was performed only in a limited number of trials because CT was considered inadequate to assess early T stage. For perirectal tissue invasion, the sensitivity of EUS was statistically higher than that of CT and MRI imaging: 90% compared with 79% and 82%, respectively. The specificity estimates for EUS, CT, and MRI were comparable: 75%, 78%, and 76%, respectively. The respective sensitivity and specificity of the 3 imaging modalities to evaluate lymph nodes were also comparable: EUS, 67% and 78%; CT, 55% and 74%; and MRI, 66% and 76%.
The role of EUS in the diagnosis and treatment of RC has long been validated.1,2-5 A meta-analysis of 42 studies involving 5039 patients found EUS to be highly accurate for differentiating various T stages.8 However, EUS cannot assess iliac and mesenteric lymph nodes or posterior tumor extension beyond endopelvic fascia in advanced RC. Notable heterogeneity was found among the studies in the meta-analyses with regard to the type of equipment used for staging, as well as the criteria used to assess the depth of penetration and nodal status. The recent introduction of phased-array coils and the development of T2-weighted fast spin sequences have improved the resolution of MRI. The MERCURY trial showed that extension of tumor to within 1 mm of the circumferential margin on high-resolution MRI correctly predicted margin involvement at the time of surgery in 92% of the patients.9 In the retrospective study by Balyasnikova and colleagues, MRI was found to correctly identify partial submucosal invasion and suitability for local excision in 89% of the cases.10
Therefore, both EUS and MRI are useful, more so than CT, in assessment of the depth of tumor invasion, nodal staging, and predicting the circumferential resection margin. The use of EUS, however, does not preclude the use of MRI, or vice versa. Rather, the 2 modalities can complement each other in staging and proper patient selection for treatment.11
Despite data supporting the value of EUS in staging RC, its use is limited by a high degree of operator dependence and a substantial learning curve,12-17 which may explain the low EUS accuracy observed in some reports.7,13,15 Given the presence of recognized alternatives such as MRI, we decided to reevaluate EUS accuracy for the staging of RC outside high-volume specialized centers and prospective clinical trials.
Methods
A retrospective chart review was performed that included all consecutive patients undergoing rectal ultrasound from January 2011 to August 2015 at the US Department of Veterans Affairs Medical Center (VAMC) in Memphis, Tennessee. Sixty-five patients with short-stocked or sessile lesions < 15 cm from anal margin staged T2N0M0 or lower by endorectal ultrasound (ERUS) were included. The patients with neoplasms staged in excess of T2 or N0 were excluded from the study because treatment protocol dictates immediate neoadjuvant treatment, the administration of which would affect subsequent histopathology.
For the 37 patients included in the final analysis, ERUS results were compared with surgical pathology to ascertain accuracy. The resections were performed endoscopically or surgically with a goal of obtaining clear margins. The choice of procedure depended on size, shape, location, and depth of invasion. All patients underwent clinical and endoscopic surveillance with flexible sigmoidoscopy/EUS every 3 to 6 months for the first 2 years. We used 2 different gold standards for surveillance depending on the type of procedure performed to remove the lesion. A pathology report was the gold standard used for patients who underwent surgery. In patients who underwent endoscopic resection, we used the lack of recurrent disease, determined by normal endoscopic and endoscopic ultrasound examination, to signify complete endoscopic resection and therefore adequate staging as an early neoplasm.
Results
From January 2011 to August 2015, 65 rectal ultrasounds were performed. All EUS procedures were performed by 1 physician (C Ruben Tombazzi). All patients had previous endoscopic evaluation and tissue diagnoses. Twenty-eight patients were excluded: 18 had T3 or N1 disease, 2 had T2N0 but refused surgery, 2 had anal cancer, 3 patients with suspected cancer had benign nonneoplastic disease (2 radiation proctitis, 1 normal rectal wall), and 3 underwent EUS for benign tumors (1 ganglioneuroma and 2 lipomas).
Thirty-seven patients were included in the study, 3 of whom were staged as T2N0 and 34 as T1N0 or lower by EUS. All patients were men ranging in age from 43 to 73 years (mean, 59 years). All 37 patients underwent endoscopic or surgical resection of their early rectal neoplasm. The final pathologic evaluation of the specimens demonstrated 14 carcinoid tumors, 11 adenocarcinomas, 6 tubular adenomas with high-grade dysplasia, and 6 benign adenomas. The preoperative EUS staging was confirmed for all patients, with 100% sensitivity, specificity, and accuracy. None of the patients who underwent endoscopic or surgical transanal resection had recurrence, determined by normal endoscopic and endoscopic ultrasound appearance, during a mean of 32.6 months surveillance.
Discussion
EUS has long been a recognized method for T and N staging of RC.1,3-5,7,8 Our data confirm that, in experienced hands, EUS is highly accurate in the staging of early rectal cancers.
The impact of EUS on the management of RC was demonstrated in a Mayo Clinic prospective blinded study.1 In that cohort of 80 consecutive patients who had previously had a CT for staging, EUS altered patient management in about 30% of cases. The most common change precipatated by EUS was the indication for additional neoadjuvant treatment.
However, the results have not been as encouraging when ERUS is performed outside of strict research protocol. A multicenter, prospective, country-wide quality assurance study from > 300 German hospitals was designed to assess the diagnostic accuracy of EUS in RC.13 Of 29206 patients, 7096 underwent surgery, without neoadjuvant treatment, and were included in the final analysis. The correspondence of tumor invasion with histopathology was 64.7%, with understaging of 18% and overstaging of 17.3%.13 These numbers were better in hospitals with greater experience performing ERUS: 73% accuracy in the centers with a case load of > 30 cases per year compared with 63.2% accuracy for the centers with < 10 cases a year. Marusch and colleagues had previously demonstrated an EUS accuracy of 63.3% in a study of 1463 patients with RC in Germany.14 Another study based out of the UK had similar findings. Ashraf and colleagues performed a database analyses from 20 UK centers and identified 165 patients with RC who underwent ERUS and endoscopic microsurgery.15 Compared with histopathology, EUS had 57.1% sensitivity, 73% specificity, and 42.9% accuracy for T1 cancers; EUS accuracy was 50% for T2 and 58% for T3 tumors. The authors concluded that the general accuracy of EUS in determining stage was around 50%, the statistical equivalent of flipping a coin.
The low accuracy of EUS observed by German and British multicenter studies13-15 was attributed to the difference that may exist in clinical trials at specialized centers compared with wider use of EUS in a community setting. As seen by our data, the Memphis VAMC is not a high-volume center for the treatment of RC. However, all our EUS procedures were performed and interpreted by a single operator (C. Ruben Tombazzi) with 18 years of EUS experience. We cannot conclude that no patient was overstaged, as patients receiving a stage of T3N0 or T > N0 received neoadjuvant treatment and were not included. However, we can conclude that no patient was understaged. All patients deemed to be T1 to T2N0 included in our study received accurate staging. Our results are consistent with the high accuracy of EUS reported from other centers with experience in diagnosis and treatment of RC.1,3-5,17,18
Although EUS is accurate in differentiating T1 from T2 tumors, it cannot reliably differentiate T1 from T0 lesions. In one study, 57.6% of adenomas and 30.7% of carcinomas in situ were staged as T1 on EUS, while almost half of T1 cancers were interpreted as T0.17 This drawback is a well-known limitation of EUS; although, the misinterpretation does not affect treatment, as both T0 and T1 lesions can be treated successfully by local excision alone, which was the algorithm used for our patients. The choice of the specific procedure for local excision was left to the clinicians and included transanal endoscopic or surgical resections. At a mean follow-up of 32.6 months, none of the 37 patients who underwent endoscopic or surgical transanal resection had evidence of recurrent disease.
A limitation of EUS, or any other imaging modality, is differentiating tumor invasion from peritumoral inflammation. The inflammation can render images of tumor borders ill-defined and irregular, which hinders precise staging. However, the accurate identification of tumors with deep involvement of the submucosa (T1sm3) is of importance, because these tumors are more advanced than the superficial and intermediate T1 lesions (T1sm1 and T1sm2, respectively).
Patients with RC whose lesions are considered T1sm3 are at higher risk of harboring lymph node metastases.18 Nascimbeni and colleagues had shown that the invasion into the lower third of the submucosa (sm3) was an independent risk factor for lower cancer-free survival among patients with T1 RC.19
Unlike rectal adenocarcinomas, the prognosis for carcinoid tumors correlates not only with the depth of invasion but also with the size of the tumor. The other adverse prognostic features include poor differentiation, high mitosis index, and lymphovascular invasion.20
EUS had been shown to be highly accurate in determining the precise carcinoid tumor size, depth of invasion, and lymph node metastases.20,21 In a study of 66 resected rectal carcinoid tumors by Ishii and colleagues, 57 lesions had a diameter of ≤ 10 mm and 9 lesions had a diameter of > 10 mm.21 All of the 57 carcinoid tumors with a diameter of ≤ 10 mm were confined to the submucosa. In contrast, 5 of the 9 lesions > 10 mm invaded the muscularis propria, 6 had a lymphovascular invasion, 4 were lymph node metastases, and 1 was a liver metastasis.
In our series, 4 of the 14 carcinoid tumors were > 10 mm but none were > 20 mm. None of the carcinoids with a diameter ≤ 10 mm invaded the muscularis propria. Of the 4 carcinoids > 10 mm, 1 was T2N0 and 3 were T1N0. All carcinoid tumors in our series were low grade and with low proliferation indexes, and all were treated successfully by local excision.
Conclusion
We believe our study shows that EUS can be highly accurate in staging rectal lesions, specifically lesions that are T1-T2N0, be they adenocarcinoma or carcinoid. Although we could not assess overstaging for lesions that were staged > T2 or > N0, we w
1. Harewood GC, Wiersema MJ, Nelson H, et al. A prospective, blinded assessment of the impact of preoperative staging on the management of rectal cancer. Gastroenterology. 2002;123(1):24-32.
2. Siegel RL, Miller KD, Jemal A. Cancer statistics, 2015. CA Cancer J Clin. 2015;65(1):5-29.
3. Ahuja NK, Sauer BG, Wang AY, et al. Performance of endoscopic ultrasound in staging rectal adenocarcinoma appropriate for primary surgical resection. Clin Gastroenterol Hepatol. 2015;13:339-44.
4. Doornebosch PG, Bronkhorst PJ, Hop WC, Bode WA, Sing AK, de Graaf EJ. The role of endorectal ultrasound in therapeutic decision-making for local vs. transabdominal resection of rectal tumors. Dis Colon Rectum. 2008;51(1):38-42.
5. Santoro GA, Gizzi G, Pellegrini L, Battistella G, Di Falco G. The value of high-resolution three-dimensional endorectal ultrasonography in the management of submucosal invasive rectal tumors. Dis Colon Rectum. 2009;52(11):1837-1843.
6. National Comprehensive Cancer Network. NCCN clinical practice guidelines in oncology: rectal cancer, version 2.2019. https://www.nccn.org/professionals/physician_gls/pdf/rectal.pdf. Published May 15, 2019. Accessed July 19, 2019.
7. Bipat S, Glas AS, Slors FJ, Zwinderman AH, Bossuyt PM, Stoker J. Rectal cancer: local staging and assessment of lymph node involvement with endoluminal US, CT, and MR imaging—a meta-analysis. Radiology. 2004;232(3):773-783.
8. Puli SR, Bechtold ML, Reddy JB, Choudhary A, Antillon MR, Brugge WR. How good is endoscopic ultrasound in differentiating various T stages of rectal cancer? Meta-analysis and systematic review. Ann Surg Oncol. 2009;16(2):254-265.
9. MERCURY Study Group. Diagnostic accuracy of preoperative magnetic resonance imaging in predicting curative resection of rectal cancer: prospective observational study. BMJ. 2006;333(7572):779.
10. Balyasnikova S, Read J, Wotherspoon A, et al. Diagnostic accuracy of high-resolution MRI as a method to predict potentially safe endoscopic and surgical planes in patient with early rectal cancer. BMJ Open Gastroenterol. 2017;4(1):e000151.
11. Frasson M, Garcia-Granero E, Roda D, et al. Preoperative chemoradiation may not always be needed for patients with T3 and T2N+ rectal cancer. Cancer. 2011;117(14):3118-3125.
12. Rafaelsen SR, Sørensen T, Jakobsen A, Bisgaard C, Lindebjerg J. Transrectal ultrasonography and magnetic resonance imaging in the staging of rectal cancer. Effect of experience. Scand J Gastroenterol. 2008;43(4):440-446.
13. Marusch F, Ptok H, Sahm M, et al. Endorectal ultrasound in rectal carcinoma – do the literature results really correspond to the realities of routine clinical care? Endoscopy. 2011;43(5):425-431.
14. Marusch F, Koch A, Schmidt U, et al. Routine use of transrectal ultrasound in rectal carcinoma: results of a prospective multicenter study. Endoscopy. 2002;34(5):385-390.
15. Ashraf S, Hompes R, Slater A, et al; Association of Coloproctology of Great Britain and Ireland Transanal Endoscopic Microsurgery (TEM) Collaboration. A critical appraisal of endorectal ultrasound and transanal endoscopic microsurgery and decision-making in early rectal cancer. Colorectal Dis. 2012;14(7):821-826.
16. Harewood GC. Assessment of clinical impact of endoscopic ultrasound on rectal cancer. Am J Gastroenterol. 2004;99(4):623-627.
17. Zorcolo L, Fantola G, Cabras F, Marongiu L, D’Alia G, Casula G. Preoperative staging of patients with rectal tumors suitable for transanal endoscopic microsurgery (TEM): comparison of endorectal ultrasound and histopathologic findings. Surg Endosc. 2009;23(6):1384-1389.
18. Akasu T, Kondo H, Moriya Y, et al. Endoscopic ultrasonography and treatment of early stage rectal cancer. World J Surg. 2000;24(9):1061-1068.
19. Nascimbeni R, Nivatvongs S, Larson DR, Burgart LJ. Long-term survival after local excision for T1 carcinoma of the rectum. Dis Colon Rectum. 2004;47(11):1773-1779.
20. Park CH, Cheon JH, Kim JO, et al. Criteria for decision making after endoscopic resection of well-differentiated rectal carcinoids with regard to potential lymphatic spread. Endoscopy. 2011;43(9):790-795.
21. Ishii N, Horiki N, Itoh T, et al. Endoscopic submucosal dissection and preoperative assessment with endoscopic ultrasonography for the treatment of rectal carcinoid tumors. Surg Endosc. 2010;24(6):1413-1419.
Quality of Care for Veterans With In-Hospital Stroke
Stroke is a leading cause of death and long-term disability in the US.1 Quality improvement efforts for acute stroke care delivery have successfully led to increased rates of thrombolytic utilization.2 Increasing attention is now being paid to additional quality metrics for stroke care, including hospital management and initiation of appropriate secondary stroke prevention measures at discharge. Many organizations, including the Veterans Health Administration (VHA), use these measures to monitor health care quality and certify centers that are committed to excellence in stroke care.3-6 It is anticipated that collection, evaluation, and feedback from these data may lead to improvements in outcomes after stroke.7
Patients who experience onset of stroke symptoms while already admitted to a hospital may be uniquely suited for quality improvement strategies. In-hospital strokes (IHS) are not uncommon and have been associated with higher stroke severity and increased mortality compared with patients with stroke symptoms prior to arriving at the emergency department (ED).8-10 A potential reason for the higher observed mortality is that patients with IHS may have poorer access to acute stroke resources, such as stroke teams and neuroimaging, as well as increased rates of medical comorbidities.9,11,12 Furthermore, stroke management protocols are typically created based on ED resources, which may not be equivalent to resources available on inpatient settings.
Although many studies have examined clinical characteristics of patients with IHS, few studies have looked at the quality of stroke care for IHS. Information on stroke quality data is even more limited in VHA hospitals due to the small number of admitted patients with stroke.13 VHA released a directive on Acute Stroke Treatment (Directive 2011-03) in 2011 with a recent update in 2018, which aimed to implement quality improvement strategies for stroke care in VHA hospitals.14 Although focusing primarily on acute stroke care in the ED, this directive has led to increased awareness of areas for improvement, particularly among larger VHA hospitals. Prior to this directive, although national stroke guidelines were well-defined, more variability likely existed in stroke protocols and the manner in which stroke care was delivered across care settings. As efforts to measure and improve stroke care evolve, it is important to ensure that strategies used in ED settings also are implemented for patients already admitted to the hospital. This study seeks to define the quality of care in VHA hospitals between patients having an in-hospital ischemic stroke compared with those presenting to the ED.
Methods
As a secondary analysis, we examined stroke care quality data from an 11-site VHA stroke quality improvement study.15 Sites participating in this study were high stroke volume VHA hospitals from various geographic regions of the US. This study collected data on ICD-9 discharge diagnosis-defined ischemic stroke admissions between January 2009 and June 2012. Patient charts were reviewed by a group of central, trained abstractors who collected information on patient demographics, clinical history, and stroke characteristics. Stroke severity was defined using the National Institutes of Health Stroke Scale (NIHSS), assessed by standardized retrospective review of admission physical examination documentation.16 A multidisciplinary team defined 11 stroke quality indicators (QIs; the 8 Joint Commission indictors and 3 additional indicators: smoking cessation and dysphagia screening, and NIHSS assessment), and the chart abstractors’ data were used to evaluate eligibility and passing rates for each QI.
For our analysis, patients were stratified into 2 categories: patients admitted to the hospital for another diagnosis who developed an IHS, and patients presenting with stroke to the ED. We excluded patients transferred from other facilities. We then compared the demographic and clinical features of the 2 groups as well as eligibility and passing rates for each of the 11 QIs. Patients were recorded as eligible if they did not have any clinical contraindication to receiving the assessment or intervention measured by the quality metric. Passing rates were defined by the presence of clear documentation in the patient record that the quality metric was met or fulfilled. Comparisons were made using nonparametric Mann-Whitney U tests and chi-square tests. All tests were performed at α .05 level.
Results
A total of 1823 patients were included in this analysis: 35 IHS and 1788 ED strokes. The 2 groups did not differ with respect to age, race, or sex (Table 1). Patients with IHS had higher stroke severity (mean NIHSS 11.3 vs 5.1, P <.01) and longer length of stay than did ED patients with stroke (mean 12.8 vs 7.3 days, P < .01). Patients with IHS also were less likely to be discharged home when compared with ED patients with stroke (34.3% vs 63.8%, P < .01).
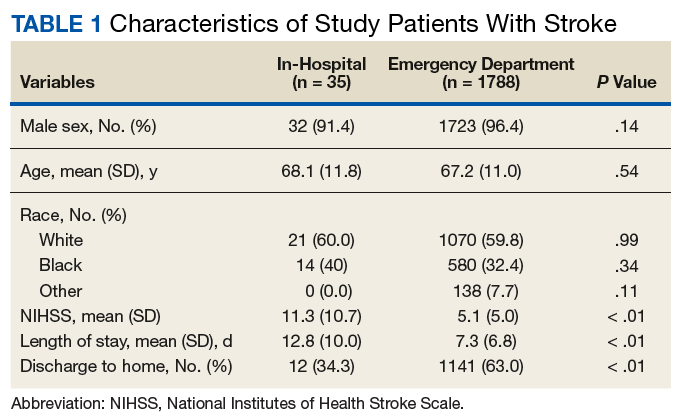
Table 2 summarizes our findings on eligibility and passing rates for the 11 QIs. For acute care metrics, we found that stroke severity documentation rates did not differ but were low for each patient group (51% vs 48%, P = .07). Patients with IHS were more likely to be eligible for IV tissue plasminogen activator (tPA; P < .01) although utilization rates did not differ. Only 2% of ED patients met eligibility criteria to receive tPA (36 of 1788), and among these patients only 16 actually received the drug. By comparison, 5 of 6 of eligible patients with IHS received tPA. Rates of dysphagia screening also were low for both groups, and patients with IHS were less likely to receive this screen prior to initiation of oral intake than were ED patients with stroke (27% vs 50%, P = .01).
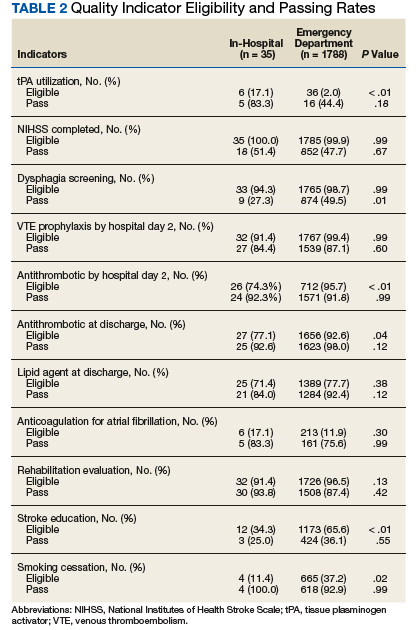
Beyond the acute period, we found that patients with IHS were less likely than were ED patients with stroke to be eligible to receive antithrombotic therapy by 2 days after their initial stroke evaluation (74% vs 96%, P < .01), although treatment rates were similar between the 2 groups (P = .99). In patients with documented atrial fibrillation, initiation of anticoagulation therapy also did not differ (P = .99). The 2 groups were similar with respect to initiation of venous thromboembolism (VTE) prophylaxis (P = .596) and evaluation for rehabilitation needs (P = .42). Although rates of smoking cessation counseling and stroke education prior to discharge did not differ, overall rates of stroke education were very low for both groups (25% vs 36%, P = .55).
Similar to initiation of antithrombotic therapy in the hospital, we found lower rates of eligibility to receive antithrombotic therapy on discharge in the IHS group when compared with the ED group (77% vs 93%, P = .04). However, actual treatment initiation rates did not differ (P = .12). Use of lipid-lowering agents was similar for the 2 groups (P = .12).
Discussion
Our study found that veterans who develop an IHS received similar quality of care as did those presenting to the ED with stroke symptoms for many QIs, although there were some notable differences. We were pleased to find that overall rates of secondary stroke prevention initiation (antithrombotic and statin therapy), VTE prophylaxis, rehabilitation evaluations, and smoking cessation counseling were high for both groups, in keeping with evidence-based guidelines.17 This likely reflected the fact that these metrics typically involve care outside of the acute period and are less likely to be influenced by the location of initial stroke evaluation. Furthermore, efforts to improve smoking cessation and VTE prophylaxis are not exclusive to stroke care and have been the target of several nonstroke quality projects in the VHA. Many aspects of acute stroke care did differ, and present opportunities for quality improvement in the future.
In our sample, patients with IHS had higher IV thrombolytic eligibility, which has not typically been reported in other samples.10,11,18 In these studies, hospitalized patients have been reported to more often have contraindications to tPA, such as recent surgery or lack of stroke symptom recognition due to delirium or medication effects. Interestingly, patients presenting to VHA EDs had extremely low rates of tPA eligibility (2%), which is lower than many reported estimates of tPA eligibility outside of the VHA.19,20 This may be due to multiple influences, such as geographic barriers, patient perceptions about stroke symptoms, access to emergency medical services (EMS), EMS routing patterns, and social/cultural factors. Although not statistically significant due to small sample size, tPA use also was twice as high in the IHS group.
Given that a significant proportion of patients with IHS in the VHA system may be eligible for acute thrombolysis, our findings highlight the need for acute stroke protocols to ensure that patients with IHS receive the same rapid stroke assessment and access to thrombolytics as do patients evaluated in the ED. Further investigation is needed to determine whether there are unique features of patients with IHS in VHA hospitals, which may make them more eligible for IV thrombolysis.
Dysphagia is associated with increased risks for aspiration pneumonia in stroke patients.21 We found that patients with IHS were less likely to receive dysphagia screening compared with that of stroke patients admitted through the ED. This finding is consistent with the fact that care for patients with IHS is less frequently guided by specific stroke care protocols and algorithms that are more often used in EDs.8,11 Although attention to swallowing function may lead to improved outcomes in stroke, this can be easily overlooked in patients with IHS.22 However, low dysphagia screening also was found in patients admitted through the ED, suggesting that low screening rates cannot be solely explained by differences in where the initial stroke evaluation is occurring. These findings suggest a need for novel approaches to dysphagia screening in VHA stroke patients that can be universally implemented throughout the hospital.
Finally, we also found very low rates of stroke education prior to discharge for both groups. Given the risk of stroke recurrence and the overall poor level of public knowledge about stroke, providing patients with stroke with formal oral and written information on stroke is a critical component of secondary prevention.23,24 Educational tools, including those that are veteran specific, are now available for use in VHA hospitals and should be incorporated into quality improvement strategies for stroke care in VHA hospitals.
In 2012, the VHA Acute Stroke Treatment Directive was published in an effort to improve stroke care systemwide. Several of the metrics examined in this study are addressed in this directive. The data presented in this study is one of the only samples of stroke quality metrics within the VHA that largely predates the directive and can serve as a baseline comparator for future work examining stroke care after release of the directive. At present, although continuous internal reviews of quality data are ongoing, longitudinal description of stroke care quality since publication of the directive will help to inform future efforts to improve stroke care for veterans.
Limitations
Despite the strength of being a multicenter sampling of stroke care in high volume VHA hospitals, our study had several limitations. The IHS sample size was small, which limited our ability to evaluate differences between the groups, to evaluate generalizability, and account for estimation error.13 It is possible that differences existed between the groups that could not be observed in this sample due to small size (type II error) or that patient-specific characteristics not captured by these data could influence these metrics. Assessments of eligibility and passing were based on retrospective chart review and post hoc coding. Our sample assessed only patients who presented to larger VHA hospitals with higher stroke volumes, thus these findings may not be generalizable to smaller VHA hospitals with less systematized stroke care. This sample did not describe the specialty care services that were received by each patient, which may have influenced their stroke care. Finally, this study is an analysis of use of QIs in stroke care and did not examine how these indicators affect outcomes.
Conclusion
Despite reassuring findings for several inpatient ischemic stroke quality metrics, we found several differences in stroke care between patients with IHS compared with those presenting to the ED, emphasizing the need for standardized approaches to stroke care regardless of care setting. Although patients with IHS may be more likely to be eligible for tPA, these patients received dysphagia screening and less often than did ED patients with stroke. Ongoing quality initiatives should continue to place emphasis on improving all quality metrics (particularly dysphagia screening, stroke severity documentation, and stroke education) for patients with stroke at VHA hospitals across all care settings. Future work will be needed to examine how specific patient characteristics and revisions to stroke protocols may affect stroke quality metrics and outcomes between patients with IHS and those presenting to the ED.
Acknowledgments
The authors would like to thank Danielle Sager for her contributions to this project.
1. Go AS, Mozaffarian D, Roger VL, et al; American Heart Association Statistics Committee and Stroke Statistics Subcommittee. Heart disease and stroke statistics—2014 update: a report from the American Heart Association. Circulation. 2014;129:e28-e292.
2. Schwamm LH, Ali SF, Reeves MJ, et al. Temporal trends in patient characteristics and treatment with intravenous thrombolysis among acute ischemic stroke patients at Get With the Guidelines—Stroke hospitals. Circ Cardiovasc Qual Outcomes. 2013;6(5):543-549.
3. Reeves MJ, Parker C, Fonarow GC, Smith EE, Schwamm LH. Development of stroke performance measures: definitions, methods, and current measures. Stroke. 2010;41(7):1573-1578.
4. The Joint Commission. Certificate of distinction for primary stroke centers. https://www.jointcommission.org/certificate_of_distinction_for_primary_stroke_centers_/.Published April 30, 2012. Accessed July 9, 2019.
5. US Department of Veterans Affairs. Center highlight: acute ischemic stroke care for veterans. https://www.queri.research.va.gov/center_highlights/stroke.cfm. Updated February 20, 2014. Accessed July 16, 2019.
6. Chumbler NR, Jia H, Phipps MS, et al. Does inpatient quality of care differ by age among US veterans with ischemic stroke? J Stroke Cerebrovasc Dis. 2012;21(8):844-851.
7. Katzan IL, Spertus J, Bettger JP, et al; American Heart Association Stroke Council; Council on Quality of Care and Outcomes Research; Council on Cardiovascular and Stroke Nursing; Council on Cardiovascular Radiology and Intervention; Council on Cardiovascular Surgery and Anesthesia; Council on Clinical Cardiology. Risk adjustment of ischemic stroke outcomes for comparing hospital performance: a statement for healthcare professionals from the American Heart Association/American Stroke Association. Stroke. 2014;45(3):918-944.
8. Cumbler E, Wald H, Bhatt DL, et al. Quality of care and outcomes for in-hospital ischemic stroke: findings from the National Get With the Guidelines—Stroke. Stroke. 2014;45(1):231-238.
9. Blacker DJ. In-hospital stroke. Lancet Neurol. 2003;2(12):741-746.
10. Farooq MU, Reeves MJ, Gargano J, Wehner S, Hickenbottom S, Majid A; Paul Coverdell National Acute Stroke Registry Michigan Prototype Investigators. In-hospital stroke in a statewide stroke registry. Cerebrovascular Dis. 2008;25(1-2):12-20.
11. Bhalla A, Smeeton N, Rudd AG, Heuschmann P, Wolfe CD. A comparison of characteristics and resource use between in-hospital and admitted patients with stroke. J Stroke Cerebrovasc Dis. 2010;19:(5)357-363.
12. Garcia-Santibanez R, Liang J, Walker A, Matos-Diaz I, Kahkeshani K, Boniece I. Comparison of stroke codes in the emergency room and inpatient setting. J Stroke Cerebrovasc Dis. 2015;24(8):1948-1950.
13. Arling G, Reeves M, Ross J, et al. Estimating and reporting on the quality of inpatient stroke care by Veterans Health Administration medical centers. Circ Cardiovasc Qual Outcomes. 2012;5(1):44-51.
14. US Department of Veterans Affairs. Treatment of Acute Ischemic Stroke (AIS). VHA Directive 2011-038. https://www.hsrd.research.va.gov/news/feature/stroke.cfm. Updated January 20, 2014. Accessed July 17, 2019.
15. Williams LS, Daggett V, Slaven J, et al. Abstract 18: Does quality improvement training add to audit and feedback for inpatient stroke care processes? [International Stroke Conference abstract 18] Stroke. 2014;45(suppl 1):A18.
16. Williams LS, Yilmaz EY, Lopez-Yunez AM. Retrospective assessment of initial stroke severity with the NIH Stroke Scale. Stroke. 2000;31(4):858-862.
17. Jauch EC, Saver JL, Adams HP Jr, et al; American Heart Association Stroke Council; Council on Cardiovascular Nursing; Council on Peripheral Vascular Disease; Council on Clinical Cardiology. Guidelines for the early management of patients with acute ischemic stroke: a guideline for healthcare professionals from the American Heart Association/American Stroke Association. Stroke. 2013;44(3):870-947.
18. Park HJ, Cho HJ, Kim YD, et al. Comparison of the characteristics for in-hospital and out-of-hospital ischaemic strokes. Eur J Neurol. 2009;16(5):582-588.
19. Messé SR, Fonarow GC, Smith EE, et al. Use of tissue-type plasminogen activator before and after publication of the European Cooperative Acute Stroke Study III in Get With the Guidelines-Stroke. Circ Cardiovasc Qual Outcomes. 2012;5(3):321-326.
20. Allen NB, Kaltenbach L, Goldstein LB, et al. Regional variation in recommended treatments for ischemic stroke and TIA: Get With the Guidelines—Stroke 2003-2010. Stroke. 2012;43(7):1858-1864.
21. Martino R, Foley N, Bhogal S, Diamant N, Speechley M, Teasell R. Dysphagia after stroke: incidence, diagnosis, and pulmonary complications. Stroke. 2005;36(12):2756-2763.
22. Bravata DM, Wells CK, Lo AC, et al. Processes of care associated with acute stroke outcomes. Arch Intern Med. 2010;170(9):804-810.
23. Mosley I, Nicol M, Donnan G, Patrick I, Dewey H. Stroke symptoms and the decision to call for an ambulance. Stroke; a journal of cerebral circulation. 2007;38(2):361-366.
24. Jurkowski JM, Maniccia DM, Dennison BA, Samuels SJ, Spicer DA. Awareness of necessity to call 9-1-1 for stroke symptoms, upstate New York. Prev Chronic Dis. 2008;5(2):A41.
Stroke is a leading cause of death and long-term disability in the US.1 Quality improvement efforts for acute stroke care delivery have successfully led to increased rates of thrombolytic utilization.2 Increasing attention is now being paid to additional quality metrics for stroke care, including hospital management and initiation of appropriate secondary stroke prevention measures at discharge. Many organizations, including the Veterans Health Administration (VHA), use these measures to monitor health care quality and certify centers that are committed to excellence in stroke care.3-6 It is anticipated that collection, evaluation, and feedback from these data may lead to improvements in outcomes after stroke.7
Patients who experience onset of stroke symptoms while already admitted to a hospital may be uniquely suited for quality improvement strategies. In-hospital strokes (IHS) are not uncommon and have been associated with higher stroke severity and increased mortality compared with patients with stroke symptoms prior to arriving at the emergency department (ED).8-10 A potential reason for the higher observed mortality is that patients with IHS may have poorer access to acute stroke resources, such as stroke teams and neuroimaging, as well as increased rates of medical comorbidities.9,11,12 Furthermore, stroke management protocols are typically created based on ED resources, which may not be equivalent to resources available on inpatient settings.
Although many studies have examined clinical characteristics of patients with IHS, few studies have looked at the quality of stroke care for IHS. Information on stroke quality data is even more limited in VHA hospitals due to the small number of admitted patients with stroke.13 VHA released a directive on Acute Stroke Treatment (Directive 2011-03) in 2011 with a recent update in 2018, which aimed to implement quality improvement strategies for stroke care in VHA hospitals.14 Although focusing primarily on acute stroke care in the ED, this directive has led to increased awareness of areas for improvement, particularly among larger VHA hospitals. Prior to this directive, although national stroke guidelines were well-defined, more variability likely existed in stroke protocols and the manner in which stroke care was delivered across care settings. As efforts to measure and improve stroke care evolve, it is important to ensure that strategies used in ED settings also are implemented for patients already admitted to the hospital. This study seeks to define the quality of care in VHA hospitals between patients having an in-hospital ischemic stroke compared with those presenting to the ED.
Methods
As a secondary analysis, we examined stroke care quality data from an 11-site VHA stroke quality improvement study.15 Sites participating in this study were high stroke volume VHA hospitals from various geographic regions of the US. This study collected data on ICD-9 discharge diagnosis-defined ischemic stroke admissions between January 2009 and June 2012. Patient charts were reviewed by a group of central, trained abstractors who collected information on patient demographics, clinical history, and stroke characteristics. Stroke severity was defined using the National Institutes of Health Stroke Scale (NIHSS), assessed by standardized retrospective review of admission physical examination documentation.16 A multidisciplinary team defined 11 stroke quality indicators (QIs; the 8 Joint Commission indictors and 3 additional indicators: smoking cessation and dysphagia screening, and NIHSS assessment), and the chart abstractors’ data were used to evaluate eligibility and passing rates for each QI.
For our analysis, patients were stratified into 2 categories: patients admitted to the hospital for another diagnosis who developed an IHS, and patients presenting with stroke to the ED. We excluded patients transferred from other facilities. We then compared the demographic and clinical features of the 2 groups as well as eligibility and passing rates for each of the 11 QIs. Patients were recorded as eligible if they did not have any clinical contraindication to receiving the assessment or intervention measured by the quality metric. Passing rates were defined by the presence of clear documentation in the patient record that the quality metric was met or fulfilled. Comparisons were made using nonparametric Mann-Whitney U tests and chi-square tests. All tests were performed at α .05 level.
Results
A total of 1823 patients were included in this analysis: 35 IHS and 1788 ED strokes. The 2 groups did not differ with respect to age, race, or sex (Table 1). Patients with IHS had higher stroke severity (mean NIHSS 11.3 vs 5.1, P <.01) and longer length of stay than did ED patients with stroke (mean 12.8 vs 7.3 days, P < .01). Patients with IHS also were less likely to be discharged home when compared with ED patients with stroke (34.3% vs 63.8%, P < .01).
Table 2 summarizes our findings on eligibility and passing rates for the 11 QIs. For acute care metrics, we found that stroke severity documentation rates did not differ but were low for each patient group (51% vs 48%, P = .07). Patients with IHS were more likely to be eligible for IV tissue plasminogen activator (tPA; P < .01) although utilization rates did not differ. Only 2% of ED patients met eligibility criteria to receive tPA (36 of 1788), and among these patients only 16 actually received the drug. By comparison, 5 of 6 of eligible patients with IHS received tPA. Rates of dysphagia screening also were low for both groups, and patients with IHS were less likely to receive this screen prior to initiation of oral intake than were ED patients with stroke (27% vs 50%, P = .01).
Beyond the acute period, we found that patients with IHS were less likely than were ED patients with stroke to be eligible to receive antithrombotic therapy by 2 days after their initial stroke evaluation (74% vs 96%, P < .01), although treatment rates were similar between the 2 groups (P = .99). In patients with documented atrial fibrillation, initiation of anticoagulation therapy also did not differ (P = .99). The 2 groups were similar with respect to initiation of venous thromboembolism (VTE) prophylaxis (P = .596) and evaluation for rehabilitation needs (P = .42). Although rates of smoking cessation counseling and stroke education prior to discharge did not differ, overall rates of stroke education were very low for both groups (25% vs 36%, P = .55).
Similar to initiation of antithrombotic therapy in the hospital, we found lower rates of eligibility to receive antithrombotic therapy on discharge in the IHS group when compared with the ED group (77% vs 93%, P = .04). However, actual treatment initiation rates did not differ (P = .12). Use of lipid-lowering agents was similar for the 2 groups (P = .12).
Discussion
Our study found that veterans who develop an IHS received similar quality of care as did those presenting to the ED with stroke symptoms for many QIs, although there were some notable differences. We were pleased to find that overall rates of secondary stroke prevention initiation (antithrombotic and statin therapy), VTE prophylaxis, rehabilitation evaluations, and smoking cessation counseling were high for both groups, in keeping with evidence-based guidelines.17 This likely reflected the fact that these metrics typically involve care outside of the acute period and are less likely to be influenced by the location of initial stroke evaluation. Furthermore, efforts to improve smoking cessation and VTE prophylaxis are not exclusive to stroke care and have been the target of several nonstroke quality projects in the VHA. Many aspects of acute stroke care did differ, and present opportunities for quality improvement in the future.
In our sample, patients with IHS had higher IV thrombolytic eligibility, which has not typically been reported in other samples.10,11,18 In these studies, hospitalized patients have been reported to more often have contraindications to tPA, such as recent surgery or lack of stroke symptom recognition due to delirium or medication effects. Interestingly, patients presenting to VHA EDs had extremely low rates of tPA eligibility (2%), which is lower than many reported estimates of tPA eligibility outside of the VHA.19,20 This may be due to multiple influences, such as geographic barriers, patient perceptions about stroke symptoms, access to emergency medical services (EMS), EMS routing patterns, and social/cultural factors. Although not statistically significant due to small sample size, tPA use also was twice as high in the IHS group.
Given that a significant proportion of patients with IHS in the VHA system may be eligible for acute thrombolysis, our findings highlight the need for acute stroke protocols to ensure that patients with IHS receive the same rapid stroke assessment and access to thrombolytics as do patients evaluated in the ED. Further investigation is needed to determine whether there are unique features of patients with IHS in VHA hospitals, which may make them more eligible for IV thrombolysis.
Dysphagia is associated with increased risks for aspiration pneumonia in stroke patients.21 We found that patients with IHS were less likely to receive dysphagia screening compared with that of stroke patients admitted through the ED. This finding is consistent with the fact that care for patients with IHS is less frequently guided by specific stroke care protocols and algorithms that are more often used in EDs.8,11 Although attention to swallowing function may lead to improved outcomes in stroke, this can be easily overlooked in patients with IHS.22 However, low dysphagia screening also was found in patients admitted through the ED, suggesting that low screening rates cannot be solely explained by differences in where the initial stroke evaluation is occurring. These findings suggest a need for novel approaches to dysphagia screening in VHA stroke patients that can be universally implemented throughout the hospital.
Finally, we also found very low rates of stroke education prior to discharge for both groups. Given the risk of stroke recurrence and the overall poor level of public knowledge about stroke, providing patients with stroke with formal oral and written information on stroke is a critical component of secondary prevention.23,24 Educational tools, including those that are veteran specific, are now available for use in VHA hospitals and should be incorporated into quality improvement strategies for stroke care in VHA hospitals.
In 2012, the VHA Acute Stroke Treatment Directive was published in an effort to improve stroke care systemwide. Several of the metrics examined in this study are addressed in this directive. The data presented in this study is one of the only samples of stroke quality metrics within the VHA that largely predates the directive and can serve as a baseline comparator for future work examining stroke care after release of the directive. At present, although continuous internal reviews of quality data are ongoing, longitudinal description of stroke care quality since publication of the directive will help to inform future efforts to improve stroke care for veterans.
Limitations
Despite the strength of being a multicenter sampling of stroke care in high volume VHA hospitals, our study had several limitations. The IHS sample size was small, which limited our ability to evaluate differences between the groups, to evaluate generalizability, and account for estimation error.13 It is possible that differences existed between the groups that could not be observed in this sample due to small size (type II error) or that patient-specific characteristics not captured by these data could influence these metrics. Assessments of eligibility and passing were based on retrospective chart review and post hoc coding. Our sample assessed only patients who presented to larger VHA hospitals with higher stroke volumes, thus these findings may not be generalizable to smaller VHA hospitals with less systematized stroke care. This sample did not describe the specialty care services that were received by each patient, which may have influenced their stroke care. Finally, this study is an analysis of use of QIs in stroke care and did not examine how these indicators affect outcomes.
Conclusion
Despite reassuring findings for several inpatient ischemic stroke quality metrics, we found several differences in stroke care between patients with IHS compared with those presenting to the ED, emphasizing the need for standardized approaches to stroke care regardless of care setting. Although patients with IHS may be more likely to be eligible for tPA, these patients received dysphagia screening and less often than did ED patients with stroke. Ongoing quality initiatives should continue to place emphasis on improving all quality metrics (particularly dysphagia screening, stroke severity documentation, and stroke education) for patients with stroke at VHA hospitals across all care settings. Future work will be needed to examine how specific patient characteristics and revisions to stroke protocols may affect stroke quality metrics and outcomes between patients with IHS and those presenting to the ED.
Acknowledgments
The authors would like to thank Danielle Sager for her contributions to this project.
1. Go AS, Mozaffarian D, Roger VL, et al; American Heart Association Statistics Committee and Stroke Statistics Subcommittee. Heart disease and stroke statistics—2014 update: a report from the American Heart Association. Circulation. 2014;129:e28-e292.
2. Schwamm LH, Ali SF, Reeves MJ, et al. Temporal trends in patient characteristics and treatment with intravenous thrombolysis among acute ischemic stroke patients at Get With the Guidelines—Stroke hospitals. Circ Cardiovasc Qual Outcomes. 2013;6(5):543-549.
3. Reeves MJ, Parker C, Fonarow GC, Smith EE, Schwamm LH. Development of stroke performance measures: definitions, methods, and current measures. Stroke. 2010;41(7):1573-1578.
4. The Joint Commission. Certificate of distinction for primary stroke centers. https://www.jointcommission.org/certificate_of_distinction_for_primary_stroke_centers_/.Published April 30, 2012. Accessed July 9, 2019.
5. US Department of Veterans Affairs. Center highlight: acute ischemic stroke care for veterans. https://www.queri.research.va.gov/center_highlights/stroke.cfm. Updated February 20, 2014. Accessed July 16, 2019.
6. Chumbler NR, Jia H, Phipps MS, et al. Does inpatient quality of care differ by age among US veterans with ischemic stroke? J Stroke Cerebrovasc Dis. 2012;21(8):844-851.
7. Katzan IL, Spertus J, Bettger JP, et al; American Heart Association Stroke Council; Council on Quality of Care and Outcomes Research; Council on Cardiovascular and Stroke Nursing; Council on Cardiovascular Radiology and Intervention; Council on Cardiovascular Surgery and Anesthesia; Council on Clinical Cardiology. Risk adjustment of ischemic stroke outcomes for comparing hospital performance: a statement for healthcare professionals from the American Heart Association/American Stroke Association. Stroke. 2014;45(3):918-944.
8. Cumbler E, Wald H, Bhatt DL, et al. Quality of care and outcomes for in-hospital ischemic stroke: findings from the National Get With the Guidelines—Stroke. Stroke. 2014;45(1):231-238.
9. Blacker DJ. In-hospital stroke. Lancet Neurol. 2003;2(12):741-746.
10. Farooq MU, Reeves MJ, Gargano J, Wehner S, Hickenbottom S, Majid A; Paul Coverdell National Acute Stroke Registry Michigan Prototype Investigators. In-hospital stroke in a statewide stroke registry. Cerebrovascular Dis. 2008;25(1-2):12-20.
11. Bhalla A, Smeeton N, Rudd AG, Heuschmann P, Wolfe CD. A comparison of characteristics and resource use between in-hospital and admitted patients with stroke. J Stroke Cerebrovasc Dis. 2010;19:(5)357-363.
12. Garcia-Santibanez R, Liang J, Walker A, Matos-Diaz I, Kahkeshani K, Boniece I. Comparison of stroke codes in the emergency room and inpatient setting. J Stroke Cerebrovasc Dis. 2015;24(8):1948-1950.
13. Arling G, Reeves M, Ross J, et al. Estimating and reporting on the quality of inpatient stroke care by Veterans Health Administration medical centers. Circ Cardiovasc Qual Outcomes. 2012;5(1):44-51.
14. US Department of Veterans Affairs. Treatment of Acute Ischemic Stroke (AIS). VHA Directive 2011-038. https://www.hsrd.research.va.gov/news/feature/stroke.cfm. Updated January 20, 2014. Accessed July 17, 2019.
15. Williams LS, Daggett V, Slaven J, et al. Abstract 18: Does quality improvement training add to audit and feedback for inpatient stroke care processes? [International Stroke Conference abstract 18] Stroke. 2014;45(suppl 1):A18.
16. Williams LS, Yilmaz EY, Lopez-Yunez AM. Retrospective assessment of initial stroke severity with the NIH Stroke Scale. Stroke. 2000;31(4):858-862.
17. Jauch EC, Saver JL, Adams HP Jr, et al; American Heart Association Stroke Council; Council on Cardiovascular Nursing; Council on Peripheral Vascular Disease; Council on Clinical Cardiology. Guidelines for the early management of patients with acute ischemic stroke: a guideline for healthcare professionals from the American Heart Association/American Stroke Association. Stroke. 2013;44(3):870-947.
18. Park HJ, Cho HJ, Kim YD, et al. Comparison of the characteristics for in-hospital and out-of-hospital ischaemic strokes. Eur J Neurol. 2009;16(5):582-588.
19. Messé SR, Fonarow GC, Smith EE, et al. Use of tissue-type plasminogen activator before and after publication of the European Cooperative Acute Stroke Study III in Get With the Guidelines-Stroke. Circ Cardiovasc Qual Outcomes. 2012;5(3):321-326.
20. Allen NB, Kaltenbach L, Goldstein LB, et al. Regional variation in recommended treatments for ischemic stroke and TIA: Get With the Guidelines—Stroke 2003-2010. Stroke. 2012;43(7):1858-1864.
21. Martino R, Foley N, Bhogal S, Diamant N, Speechley M, Teasell R. Dysphagia after stroke: incidence, diagnosis, and pulmonary complications. Stroke. 2005;36(12):2756-2763.
22. Bravata DM, Wells CK, Lo AC, et al. Processes of care associated with acute stroke outcomes. Arch Intern Med. 2010;170(9):804-810.
23. Mosley I, Nicol M, Donnan G, Patrick I, Dewey H. Stroke symptoms and the decision to call for an ambulance. Stroke; a journal of cerebral circulation. 2007;38(2):361-366.
24. Jurkowski JM, Maniccia DM, Dennison BA, Samuels SJ, Spicer DA. Awareness of necessity to call 9-1-1 for stroke symptoms, upstate New York. Prev Chronic Dis. 2008;5(2):A41.
VHA Practice Guideline Recommendations for Diffuse Gliomas (FULL)
Over the past few decades, our understanding of the molecular underpinning of primary neoplasms of the central nervous system (CNS) has progressed substantially. Thanks in large part to this expansion in our knowledge base, the World Health Organization (WHO) has recently updated its classification of tumors of the CNS.1 One of the key elements of this update was the inclusion of molecular diagnostic criteria for the classification of infiltrating gliomas. While the previous classification system was based upon histologic subtypes of the tumor (astrocytoma, oligodendroglioma, and oligoastrocytoma), the revised classification system incorporates molecular testing to establish the genetic characteristics of the tumor to reach a final integrated diagnosis.
In this article, we present 3 cases to highlight some of these recent changes in the WHO diagnostic categories of primary CNS tumors and to illustrate the role of specific molecular tests in reaching a final integrated diagnosis. We then propose a clinical practice guideline for the Veterans Health Administration (VHA) that recommends use of molecular testing for veterans as part of the diagnostic workup of primary CNS neoplasms.
Purpose
In 2013 the VHA National Director of Pathology & Laboratory Medicine Services (P&LMS) chartered a national molecular genetics pathology workgroup (MGPW) that was charged with 4 specific tasks: (1) Provide recommendations about the effective use of molecular genetic testing for veterans; (2) Promote increased quality and availability of molecular testing within the VHA; (3) Encourage internal referral testing; and (4) Create an organizational structure and policies for molecular genetic testing and laboratory developed tests. The workgroup is currently composed of 4 subcommittees: genetic medicine, hematopathology, pharmacogenomics, and molecular oncology. The molecular oncology subcommittee is focused upon molecular genetic testing for solid tumors.
This article is intended to be the first of several publications from the molecular oncology subcommittee of the MGPW that address some of the aforementioned tasks. Similar to the recent publication from the hematopathology subcommittee of the MGPW, this article focuses on CNS neoplasms.2
Scope of Problem
The incidence of tumors of the CNS in the US population varies among age groups. It is the most common solid tumor in children aged < 14 years and represents a significant cause of mortality across all age groups.3 Of CNS tumors, diffuse gliomas comprise about 20% of the tumors and more than 70% of the primary malignant CNS tumors.3 Analysis of the VA Central Cancer Registry data from 2010 to 2014 identified 1,186 veterans (about 237 veterans per year) who were diagnosed with diffuse gliomas. (Lynch, Kulich, Colman, unpublished data, February 2018). While the majority (nearly 80%) of these cases were glioblastomas (GBMs), unfortunately a majority of these cases did not undergo molecular testing (Lynch, Kulich, Colman, unpublished data, February 2018).
Although this low rate of testing may be in part reflective of the period from which these data were gleaned (ie, prior to the WHO release of their updated the classification of tumors of the CNS), it is important to raise VA practitioners’ awareness of these recent changes to ensure that veterans receive the proper diagnosis and treatment for their disease. Thus, while the number of veterans diagnosed with diffuse gliomas within the VHA is relatively small in comparison to other malignancies, such as prostatic adenocarcinomas and lung carcinomas, the majority of diffuse gliomas do not seem to be receiving the molecular testing that would be necessary for (1) appropriate classification under the recently revised WHO recommendations; and (2) making important treatment decisions.
Case Presentations
Case 1. A veteran of the Gulf War presented with a 3-month history of possible narcoleptic events associated with a motor vehicle accident. Magnetic resonance imaging (MRI) revealed a large left frontal mass lesion with minimal surrounding edema without appreciable contrast enhancement (Figures 1A, 1B, and 1C). 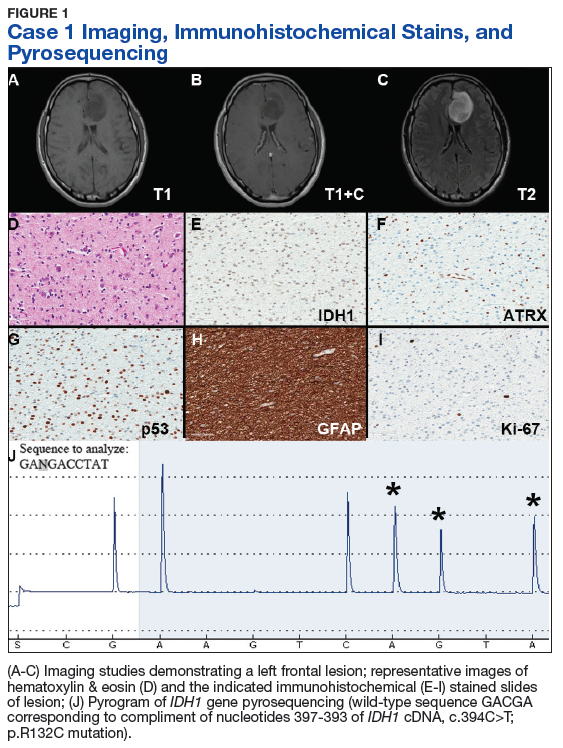
Neither mitotic figures nor endothelial proliferation were identified. Immunohistochemical stains revealed a lack of R132H mutant IDH1 protein expression, a loss of nuclear staining for ATRX protein within a substantial number of cells, and a clonal pattern of p53 protein overexpression (Figures 1E, 1F, and 1G). The lesion demonstrated diffuse glial fibrillary acidic protein (GFAP) immunoreactivity and a low proliferation index (as determined by Ki-67 staining; estimated at less than 5%) (Figures 1H and 1I).
Based upon these results, an initial morphologic diagnosis of diffuse glioma was issued, and tissue was subjected to a variety of nucleic acid-based tests. While fluorescence in situ hybridization (FISH) studies were negative for 1p/19q codeletion, pyrosequencing analysis revealed the presence of a c.394C>T (R132C) mutation of the IDH1 gene (Figure 1J). The University of Pittsburgh Medical Center’s GlioSeq targeted next-generation sequence (NGS) analysis confirmed the presence of the c.394C > T mutation in IDH1 gene.4 Based upon this additional information, a final integrated morphologic and molecular diagnosis of diffuse astrocytoma, IDH-mutant was rendered.
Case 2. A Vietnam War veteran presented with a 6-week history of new onset falls with associated left lower extremity weakness. A MRI revealed a right frontoparietal mass lesion with surrounding edema without appreciable contrast enhancement (Figures 2A, 2B, and 2C). 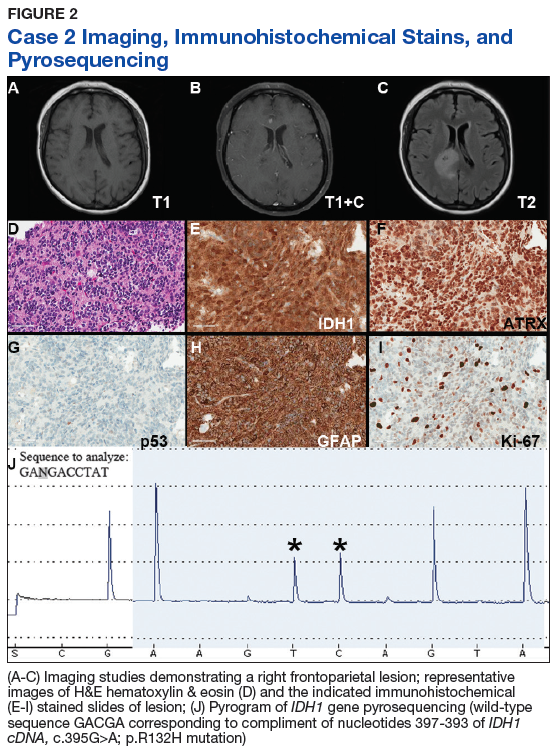
Immunohistochemical stains revealed R132H mutant IDH1 protein expression, retention of nuclear staining for ATRX protein, the lack of a clonal pattern of p53 protein overexpression, diffuse GFAP immunoreactivity, and a proliferation index (as determined by Ki-67 staining) focally approaching 20% (Figures 2E, 2F, 2G, 2H and 2I).
Based upon these results, an initial morphologic diagnosis of diffuse (high grade) glioma was issued, and tissue was subjected to a variety of nucleic acid-based tests. The FISH studies were positive for 1p/19q codeletion, and pyrosequencing analysis confirmed the immunohistochemical findings of a c.395G>A (R132H) mutation of the IDH1 gene (Figure 2J). GlioSeq targeted NGS analysis confirmed the presence of the c.395G>A mutation in the IDH1 gene, a mutation in the telomerase reverse transcriptase (TERT) promoter, and possible decreased copy number of the CIC (chromosome 1p) and FUBP1 (chromosome 19q) genes.
A final integrated morphologic and molecular diagnosis of anaplastic oligodendroglioma, IDH-mutant and 1p/19q-codeleted was rendered based on the additional information. With this final diagnosis, methylation analysis of the MGMT gene promoter, which was performed for prognostic and predictive purposes, was identified in this case.5,6
Case 3. A veteran of the Vietnam War presented with a new onset seizure. A MRI revealed a focally contrast-enhancing mass with surrounding edema within the left frontal lobe (Figures 3A, 3B, and 3C). 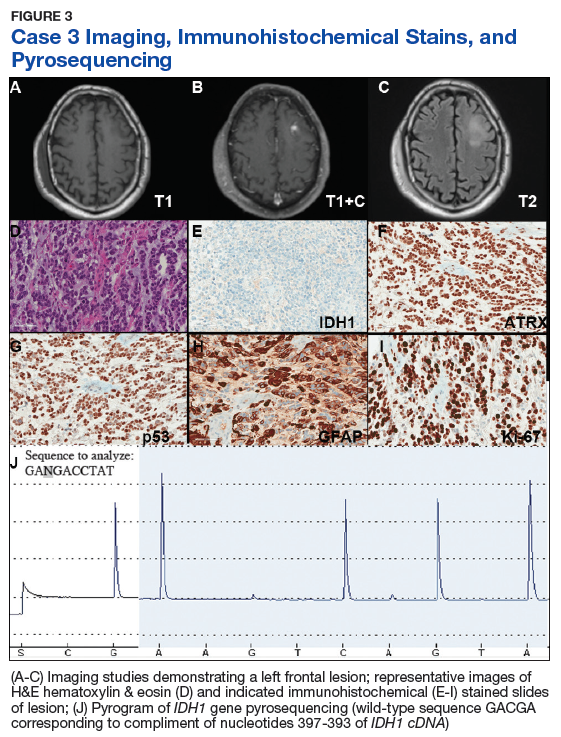
Hematoxylin and eosin (H&E) stained sections following formalin fixation and paraffin embedding demonstrated similar findings (Figure 3D), and while mitotic figures were readily identified, areas of necrosis were not identified and endothelial proliferation was not a prominent feature. Immunohistochemical stains revealed no evidence of R132H mutant IDH1 protein expression, retention of nuclear staining for ATRX protein, a clonal pattern of p53 protein overexpression, patchy GFAP immunoreactivity, and a proliferation index (as determined by Ki-67 staining) focally approaching 50% (Figures 3E, 3F, 3G, 3H, and 3I).
Based upon these results, an initial morphologic diagnosis of diffuse (high grade) glioma was issued, and the tissue was subjected to a variety of nucleic acid-based tests. The FISH studies were negative for EGFR gene amplification and 1p/19q codeletion, although a gain of the long arm of chromosome 1 was detected. Pyrosequencing analysis for mutations in codon 132 of the IDH1 gene revealed no mutations (Figure 3J). GlioSeq targeted NGS analysis identified mutations within the NF1, TP53, and PIK3CA genes without evidence of mutations in the IDH1, IDH2, ATRX, H3F3A, or EGFR genes or the TERT promoter. Based upon this additional information, a final integrated morphologic and molecular diagnosis of GBM, IDH wild-type was issued. The MGMT gene promoter was negative for methylation, a finding that has prognostic and predictive impact with regard to treatment with temazolamide.7-9
New Diffuse Glioma Classification
Since the issuance of the previous edition of the WHO classification of CNS tumors in 2007, several sentinel discoveries have been made that have advanced our understanding of the underlying biology of primary CNS neoplasms. Since a detailed review of these findings is beyond the scope and purpose of this manuscript and salient reviews on the topic can be found elsewhere, we will focus on the molecular findings that have been incorporated into the recently revised WHO classification.10 The importance of providing such information for proper patient management is illustrated by the recent acknowledgement by the American Academy of Neurology that molecular testing of brain tumors is a specific area in which there is a need for quality improvement.11 Therefore, it is critical that these underlying molecular abnormalities are identified to allow for proper classification and treatment of diffuse gliomas in the veteran population.
As noted previously, based on VA cancer registry data, diffuse gliomas are the most commonly encountered primary CNS cancers in the veteran population. Several of the aforementioned seminal discoveries have been incorporated into the updated classification of diffuse gliomas. While the recently updated WHO classification allows for the assignment of “not otherwise specified (NOS)” diagnostic designation, this category must be limited to cases where there is insufficient data to allow for a more precise classification due to sample limitations and not simply due to a failure of VA pathology laboratories to pursue the appropriate diagnostic testing.
Figure 4 presents the recommended diagnostic workflow for the workup of diffuse gliomas. As illustrated in the above cases, a variety of different methodologies, including immunohistochemical, FISH, loss of heterozygosity analysis, traditional and NGS may be applied when elucidating the status of molecular events at critical diagnostic branch points. 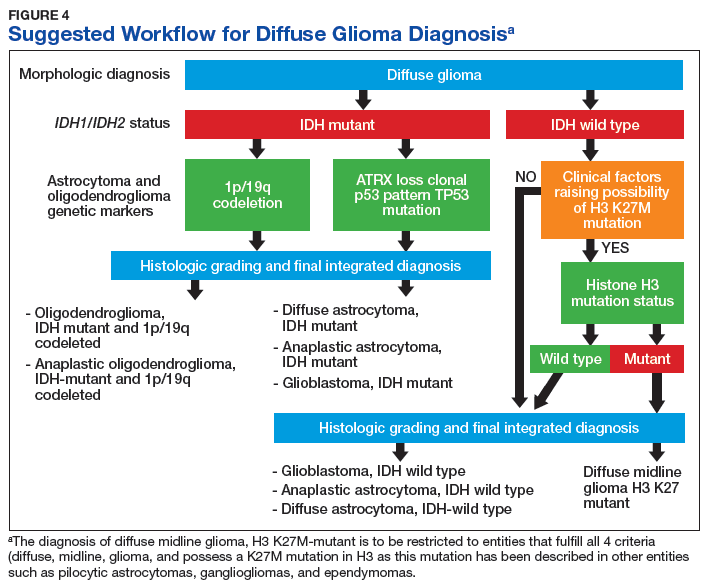
Diagnostic Uses of Molecular Testing
While the case studies in this article demonstrate the use of ancillary testing and provide a suggested strategy for properly subclassifying diffuse gliomas, inherent in this strategy is the assumption that, based upon the initial clinical and pathologic information available, one can accurately categorize the lesion as a diffuse glioma. In reality, such a distinction is not always a straightforward endeavor. It is well recognized that a proportion of low-grade, typically radiologically circumscribed, CNS neoplasms, such as pilocytic astrocytomas and glioneuronal tumors, may infiltrate the surrounding brain parenchyma. In addition, many of these low-grade CNS neoplasms also may have growth patterns that are shared with diffuse gliomas, a diagnostic challenge that often can be further hampered by the inherent limitations involved in obtaining adequate samples for diagnosis from the CNS.
Although there are limitations and caveats, molecular diagnostic testing may be invaluable in properly classifying CNS tumors in such situations. The finding of mutations in the IDH1 or IDH2 genes has been shown to be very valuable in distinguishing low-grade diffuse glioma from both nonneoplastic and low-grade circumscribed neuroepithelial neoplasms that may exhibit growth patterns that can mimic those of diffuse gliomas.15-17 Conversely, finding abnormalities in the BRAF gene in a brain neoplasm that has a low-grade morphology suggests that the lesion may represent one of these low-grade lesions such as a pleomorphic xanthoastrocytoma, pilocytic astrocytoma, or mixed neuronal-glial tumor as opposed to a diffuse glioma.18,19
Depending upon the environment in which one practices, small biopsy specimens may be prevalent, and unfortunately, it is not uncommon to obtain a biopsy that exhibits a histologic growth pattern that is discordant from what one would predict based on the clinical context and imaging findings. Molecular testing may be useful in resolving discordances in such situations. If a biopsy of a ring-enhancing lesion demonstrates a diffuse glioma that doesn’t meet WHO grade IV criteria, applying methodologies that look for genetic features commonly encountered in high-grade astrocytomas may identify genetic abnormalities that suggest a more aggressive lesion than is indicated by the histologic findings. The presence of genetic abnormalities such as homozygous deletion of the CDKN2A gene, TERT promoter mutation, loss of heterozygosity of chromosome 10q and/or phosphatase and tensin homolog (PTEN) mutations, EGFR gene amplification or the presence of the EGFR variant III are a few findings that would suggest the aforementioned sample may represent an undersampling of a higher grade diffuse astrocytoma, which would be important information to convey to the treating clinicians.20-26
Testing In the VA
The goals of the MPWG include promoting increased quality and availability of genetic testing within the VHA as well as encouraging internal referral testing. An informal survey of the chiefs of VA Pathology and Laboratory Medicine Services was conducted in November of 2017 in an attempt to identify internal VA pathology laboratories currently conducting testing that may be of use in the workup of diffuse gliomas (Table 1). 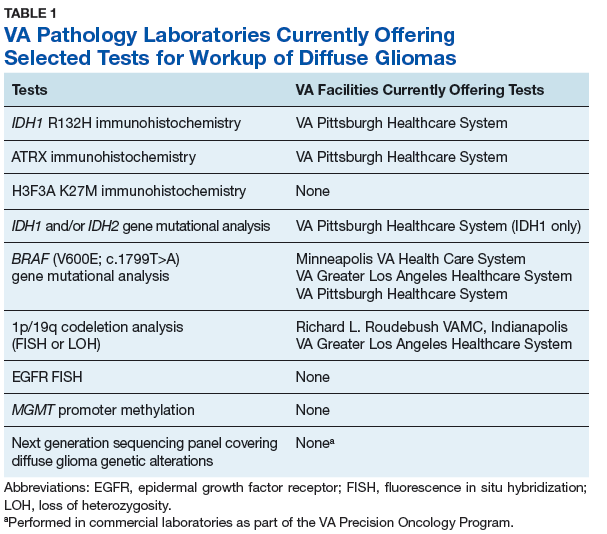
The VA currently offers NGS panels for patients with advanced-stage malignancies under the auspices of the Precision Oncology Program, whose reports provide both (1) mutational analyses for genes such as TP53, ATRX, NF1, BRAF, PTEN, TERT IDH1, and IDH2 that may be useful in the proper classifying of high-grade diffuse gliomas; and (2) information regarding clinical trials for which the veteran may be eligible for based on their glioma’s mutational profile. Interested VA providers should visit tinyurl.com/precisiononcology/ for more information about this program. Finally, although internal testing within VA laboratories is recommended to allow for the development of more cost-effective testing, testing may be performed through many nationally contracted reference laboratories.
Conclusion
In light of the recent progress made in our understanding of the molecular events of gliomagenesis, the way we diagnose diffuse gliomas within the CNS has undergone a major paradigm shift. While histology still plays a critical role in the process, we believe that additional ancillary testing is a requirement for all diffuse gliomas diagnosed within VA pathology laboratories. In the context of recently encountered cases, we have provided a recommended workflow highlighting the testing that can be performed to allow for the proper diagnosis of our veterans with diffuse gliomas (Figure 4).
Unless limited by the amount of tissue available for such tests, ancillary testing must be performed on all diffuse gliomas diagnosed within the VA system to ensure proper diagnosis and treatment of our veterans with diffuse gliomas. 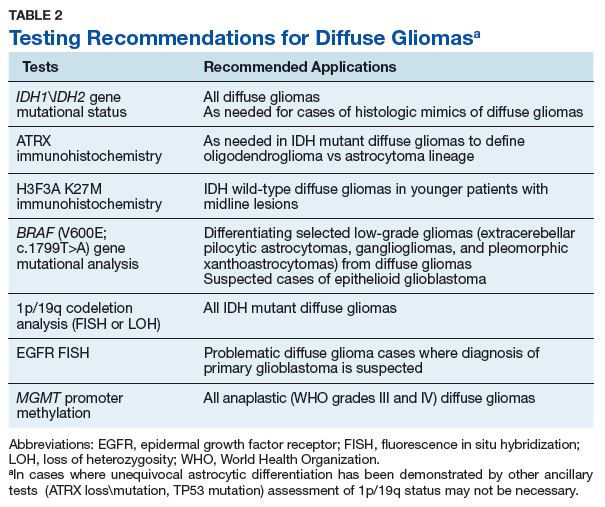
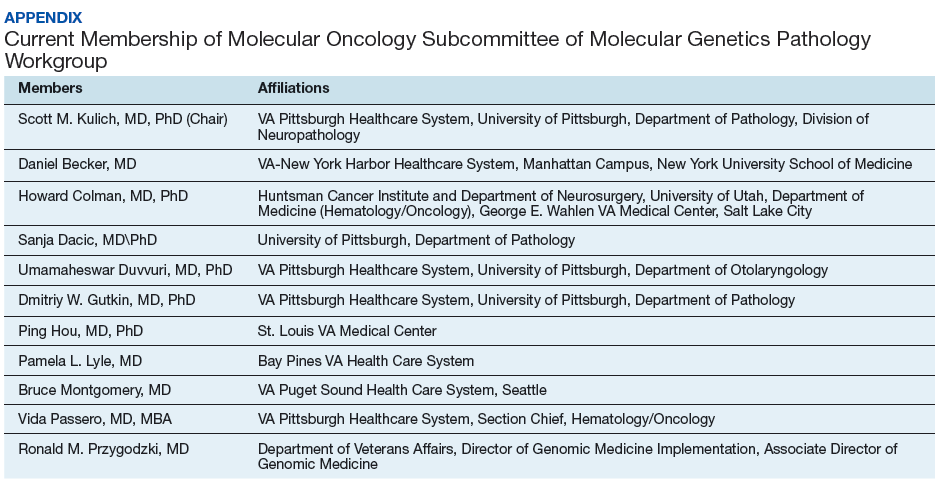
Acknowledgments
The authors thank Dr. Craig M. Horbinski (Feinberg School of Medicine, Northwestern University) and Dr. Geoffrey H. Murdoch (University of Pittsburgh) for their constructive criticism of the manuscript. We also thank the following individuals for past service as members of the molecular oncology subcommittee of the MGPW: Dr. George Ansstas (Washington University School of Medicine), Dr. Osssama Hemadeh (Bay Pines VA Health Care System), Dr. James Herman (VA Pittsburgh Healthcare System), and Dr. Ryan Phan (formerly of the VA Greater Los Angeles Healthcare System) as well as the members of the Veterans Administration pathology and laboratory medicine service molecular genetics pathology workgroup.
Author disclosures
The authors report no actual or potential conflicts of interest with regard to this article.
Disclaimer
The opinions expressed herein are those of the authors and do not necessarily reflect those of Federal Practitioner, Frontline Medical Communications Inc., the US Government, or any of its agencies.
Dr. Kulich is the Acting Chief of Pathology and Laboratory Medicine Service at VA Pittsburgh Healthcare System and member of the Division of Neuropathology at University of Pittsburgh Department of Pathology, Dr. Duvvuri is an Otolaryngologist at VA Pittsburgh Healthcare System, and Dr. Passero is the Section Chief of Hematology\Oncology at VA Pittsburgh Healthcare System in Pennsylvania. Dr. Becker is an Oncologist at VA-New York Harbor Healthcare System. Dr. Dacic is a Pathologist at University of Pittsburgh Department of Pathology in Pennsylvania. Dr. Ehsan is Chief of Pathology and Laboratory Medicine Services at the South Texas Veterans Healthcare System in San Antonio. Dr. Gutkin is the former Chief of Pathology and Laboratory Medicine Service at VA Pittsburgh Healthcare System. Dr. Hou is a Pathologist at St. Louis VA Medical Center in Missouri. Dr. Icardi is the VA National Director of Pathology and Laboratory Medicine Services. Dr. Lyle is a Pathologist at Bay Pine Health Care System in Florida. Dr. Lynch is an Investigator at VA Salt Lake Health Care System Informatics and Computing Infrastructure. Dr. Montgomery is an Oncologist at VA Puget Sound Health Care System, in Seattle, Washington. Dr. Przygodzki is the Director of Genomic Medicine Implementation and Associate Director of Genomic Medicine for the VA. Dr. Colman is a Neuro-Oncologist at George E. Wahlen VA Medical Center and the Director of Medical Neuro-Oncology at the Huntsman Cancer Institute, Salt Lake City, Utah.
Correspondence: Dr. Kulich (scott.kulich@va.gov)
1. Louis DN, Perry A, Reifenberger G, et al. The 2016 World Health Organization Classification of Tumors of the Central Nervous System: a summary. Acta Neuropathol. 2016;131(6):803-820.
2. Wang-Rodriguez J, Yunes A, Phan R, et al. The challenges of precision medicine and new advances in molecular diagnostic testing in hematolymphoid malignancies: impact on the VHA. Fed Pract. 2017;34(suppl 5):S38-S49.
3. Ostrom QT, Gittleman H, Liao P, et al. CBTRUS statistical report: primary brain and other central nervous system tumors diagnosed in the United States in 2010-2014. Neuro Oncol. 2017;19(suppl 5):v1-v88.
4. Nikiforova MN, Wald AI, Melan MA, et al. Targeted next-generation sequencing panel (GlioSeq) provides comprehensive genetic profiling of central nervous system tumors. Neuro Oncol. 2016;18(3)379-387.
5. Cairncross JG, Ueki K, Zlatescu MC, et al. Specific genetic predictors of chemotherapeutic response and survival in patients with anaplastic oligodendrogliomas. J Natl Cancer Inst. 1998;90(19):1473-1479.
6. van den Bent MJ, Erdem-Eraslan L, Idbaih A, et al. MGMT-STP27 methylation status as predictive marker for response to PCV in anaplastic oligodendrogliomas and oligoastrocytomas. A report from EORTC study 26951. Clin Cancer Res. 2013;19(19):5513-5522.
7. Stupp R, Hegi ME, Mason WP, et al; European Organisation for Research and Treatment of Cancer Brain Tumour and Radiation Oncology Groups; National Cancer Institute of Canada Clinical Trials Group. Effects of radiotherapy with concomitant and adjuvant temozolomide versus radiotherapy alone on survival in glioblastoma in a randomised phase III study: 5-year analysis of the EORTC-NCIC trial. Lancet Oncol. 2009;10(5):459-466.
8. Malmstrom A, Gronberg BH, Marosi C, et al. Temozolomide versus standard 6-week radiotherapy versus hypofractionated radiotherapy in patients older than 60 years with glioblastoma: the Nordic randomised, phase 3 trial. Lancet Oncol. 2012;13(9):916-926.
9. van den Bent MJ, Kros JM. Predictive and prognostic markers in neuro-oncology. J Neuropathol Exp Neurol. 2007;66(12):1074-1081.
10. Chen R, Smith-Cohn M, Cohen AL, Colman H. Glioma subclassifications and their clinical significance. Neurotherapeutics. 2017;14(2):284-297.
11. Jordan JT, Sanders AE, Armstrong T, et al. Quality improvement in neurology: neuro-oncology quality measurement set. Neurology. 2018;90(14):652-658.
12. Chen L, Voronovich Z, Clark K, et al. Predicting the likelihood of an isocitrate dehydrogenase 1 or 2 mutation in diagnoses of infiltrative glioma. Neuro Oncol. 2014;16(11):1478-1483.
13. Hegi ME, Diserens AC, Gorlia T, et al. MGMT gene silencing and benefit from temozolomide in glioblastoma. N Engl J Med. 2005;352(10):997-1003.
14. Wick W, Platten M, Meisner C, et al; NOA-08 Study Group of Neuro-oncology Working Group (NOA) of German Cancer Society. Temozolomide chemotherapy alone versus radiotherapy alone for malignant astrocytoma in the elderly: the NOA-08 randomised, phase 3 trial. Lancet Oncol. 2012;13(7):707-715.
15. Horbinski C, Kofler J, Kelly LM, Murdoch GH, Nikiforova MN. Diagnostic use of IDH1/2 mutation analysis in routine clinical testing of formalin-fixed, paraffin-embedded glioma tissues. J Neuropathol Exp Neurol. 2009;68(12):1319-1325.
16. Camelo-Piragua S, Jansen M, Ganguly A, Kim JC, Louis DN, Nutt CL. Mutant IDH1-specific immunohistochemistry distinguishes diffuse astrocytoma from astrocytosis. Acta Neuropathol. 2010;119(4):509-511.
17. Horbinski C, Kofler J, Yeaney G, et al. Isocitrate dehydrogenase 1 analysis differentiates gangliogliomas from infiltrative gliomas. Brain Pathol. 2011;21(5):564-574.
18. Berghoff AS, Preusser M. BRAF alterations in brain tumours: molecular pathology and therapeutic opportunities. Curr Opin Neurol. 2014;27(6):689-696.
19. Korshunov A, Meyer J, Capper D, et al. Combined molecular analysis of BRAF and IDH1 distinguishes pilocytic astrocytoma from diffuse astrocytoma. Acta Neuropathol. 2009;118(3):401-405.
20. Fuller CE, Schmidt RE, Roth KA, et al. Clinical utility of fluorescence in situ hybridization (FISH) in morphologically ambiguous gliomas with hybrid oligodendroglial/astrocytic features. J Neuropathol Exp Neurol. 2003;62(11):1118-1128.
21. Horbinski C. Practical molecular diagnostics in neuropathology: making a tough job a little easier. Semin Diagn Pathol. 2010;27(2):105-113.
22. Fuller GN, Bigner SH. Amplified cellular oncogenes in neoplasms of the human central nervous system. Mutat Res. 1992;276(3):299-306.
23. Brennan CW, Verhaak RG, McKenna A, et al; TCGA Research Network. The somatic genomic landscape of glioblastoma. Cell. 2013;155(2):462-477.
24. Aldape K, Zadeh G, Mansouri S, Reifenberger G, von Deimling A. Glioblastoma: pathology, molecular mechanisms and markers. Acta Neuropathol. 2015;129(6):829-848.
25. Killela PJ, Reitman ZJ, Jiao Y, et al. TERT promoter mutations occur frequently in gliomas and a subset of tumors derived from cells with low rates of self-renewal. Proc Natl Acad Sci U S A. 2013;110(15):6021-6026.
26. Nikiforova MN, Hamilton RL. Molecular diagnostics of gliomas. Arch Pathol Lab Med. 2011;135(5):558-568.
Over the past few decades, our understanding of the molecular underpinning of primary neoplasms of the central nervous system (CNS) has progressed substantially. Thanks in large part to this expansion in our knowledge base, the World Health Organization (WHO) has recently updated its classification of tumors of the CNS.1 One of the key elements of this update was the inclusion of molecular diagnostic criteria for the classification of infiltrating gliomas. While the previous classification system was based upon histologic subtypes of the tumor (astrocytoma, oligodendroglioma, and oligoastrocytoma), the revised classification system incorporates molecular testing to establish the genetic characteristics of the tumor to reach a final integrated diagnosis.
In this article, we present 3 cases to highlight some of these recent changes in the WHO diagnostic categories of primary CNS tumors and to illustrate the role of specific molecular tests in reaching a final integrated diagnosis. We then propose a clinical practice guideline for the Veterans Health Administration (VHA) that recommends use of molecular testing for veterans as part of the diagnostic workup of primary CNS neoplasms.
Purpose
In 2013 the VHA National Director of Pathology & Laboratory Medicine Services (P&LMS) chartered a national molecular genetics pathology workgroup (MGPW) that was charged with 4 specific tasks: (1) Provide recommendations about the effective use of molecular genetic testing for veterans; (2) Promote increased quality and availability of molecular testing within the VHA; (3) Encourage internal referral testing; and (4) Create an organizational structure and policies for molecular genetic testing and laboratory developed tests. The workgroup is currently composed of 4 subcommittees: genetic medicine, hematopathology, pharmacogenomics, and molecular oncology. The molecular oncology subcommittee is focused upon molecular genetic testing for solid tumors.
This article is intended to be the first of several publications from the molecular oncology subcommittee of the MGPW that address some of the aforementioned tasks. Similar to the recent publication from the hematopathology subcommittee of the MGPW, this article focuses on CNS neoplasms.2
Scope of Problem
The incidence of tumors of the CNS in the US population varies among age groups. It is the most common solid tumor in children aged < 14 years and represents a significant cause of mortality across all age groups.3 Of CNS tumors, diffuse gliomas comprise about 20% of the tumors and more than 70% of the primary malignant CNS tumors.3 Analysis of the VA Central Cancer Registry data from 2010 to 2014 identified 1,186 veterans (about 237 veterans per year) who were diagnosed with diffuse gliomas. (Lynch, Kulich, Colman, unpublished data, February 2018). While the majority (nearly 80%) of these cases were glioblastomas (GBMs), unfortunately a majority of these cases did not undergo molecular testing (Lynch, Kulich, Colman, unpublished data, February 2018).
Although this low rate of testing may be in part reflective of the period from which these data were gleaned (ie, prior to the WHO release of their updated the classification of tumors of the CNS), it is important to raise VA practitioners’ awareness of these recent changes to ensure that veterans receive the proper diagnosis and treatment for their disease. Thus, while the number of veterans diagnosed with diffuse gliomas within the VHA is relatively small in comparison to other malignancies, such as prostatic adenocarcinomas and lung carcinomas, the majority of diffuse gliomas do not seem to be receiving the molecular testing that would be necessary for (1) appropriate classification under the recently revised WHO recommendations; and (2) making important treatment decisions.
Case Presentations
Case 1. A veteran of the Gulf War presented with a 3-month history of possible narcoleptic events associated with a motor vehicle accident. Magnetic resonance imaging (MRI) revealed a large left frontal mass lesion with minimal surrounding edema without appreciable contrast enhancement (Figures 1A, 1B, and 1C).
Neither mitotic figures nor endothelial proliferation were identified. Immunohistochemical stains revealed a lack of R132H mutant IDH1 protein expression, a loss of nuclear staining for ATRX protein within a substantial number of cells, and a clonal pattern of p53 protein overexpression (Figures 1E, 1F, and 1G). The lesion demonstrated diffuse glial fibrillary acidic protein (GFAP) immunoreactivity and a low proliferation index (as determined by Ki-67 staining; estimated at less than 5%) (Figures 1H and 1I).
Based upon these results, an initial morphologic diagnosis of diffuse glioma was issued, and tissue was subjected to a variety of nucleic acid-based tests. While fluorescence in situ hybridization (FISH) studies were negative for 1p/19q codeletion, pyrosequencing analysis revealed the presence of a c.394C>T (R132C) mutation of the IDH1 gene (Figure 1J). The University of Pittsburgh Medical Center’s GlioSeq targeted next-generation sequence (NGS) analysis confirmed the presence of the c.394C > T mutation in IDH1 gene.4 Based upon this additional information, a final integrated morphologic and molecular diagnosis of diffuse astrocytoma, IDH-mutant was rendered.
Case 2. A Vietnam War veteran presented with a 6-week history of new onset falls with associated left lower extremity weakness. A MRI revealed a right frontoparietal mass lesion with surrounding edema without appreciable contrast enhancement (Figures 2A, 2B, and 2C).
Immunohistochemical stains revealed R132H mutant IDH1 protein expression, retention of nuclear staining for ATRX protein, the lack of a clonal pattern of p53 protein overexpression, diffuse GFAP immunoreactivity, and a proliferation index (as determined by Ki-67 staining) focally approaching 20% (Figures 2E, 2F, 2G, 2H and 2I).
Based upon these results, an initial morphologic diagnosis of diffuse (high grade) glioma was issued, and tissue was subjected to a variety of nucleic acid-based tests. The FISH studies were positive for 1p/19q codeletion, and pyrosequencing analysis confirmed the immunohistochemical findings of a c.395G>A (R132H) mutation of the IDH1 gene (Figure 2J). GlioSeq targeted NGS analysis confirmed the presence of the c.395G>A mutation in the IDH1 gene, a mutation in the telomerase reverse transcriptase (TERT) promoter, and possible decreased copy number of the CIC (chromosome 1p) and FUBP1 (chromosome 19q) genes.
A final integrated morphologic and molecular diagnosis of anaplastic oligodendroglioma, IDH-mutant and 1p/19q-codeleted was rendered based on the additional information. With this final diagnosis, methylation analysis of the MGMT gene promoter, which was performed for prognostic and predictive purposes, was identified in this case.5,6
Case 3. A veteran of the Vietnam War presented with a new onset seizure. A MRI revealed a focally contrast-enhancing mass with surrounding edema within the left frontal lobe (Figures 3A, 3B, and 3C).
Hematoxylin and eosin (H&E) stained sections following formalin fixation and paraffin embedding demonstrated similar findings (Figure 3D), and while mitotic figures were readily identified, areas of necrosis were not identified and endothelial proliferation was not a prominent feature. Immunohistochemical stains revealed no evidence of R132H mutant IDH1 protein expression, retention of nuclear staining for ATRX protein, a clonal pattern of p53 protein overexpression, patchy GFAP immunoreactivity, and a proliferation index (as determined by Ki-67 staining) focally approaching 50% (Figures 3E, 3F, 3G, 3H, and 3I).
Based upon these results, an initial morphologic diagnosis of diffuse (high grade) glioma was issued, and the tissue was subjected to a variety of nucleic acid-based tests. The FISH studies were negative for EGFR gene amplification and 1p/19q codeletion, although a gain of the long arm of chromosome 1 was detected. Pyrosequencing analysis for mutations in codon 132 of the IDH1 gene revealed no mutations (Figure 3J). GlioSeq targeted NGS analysis identified mutations within the NF1, TP53, and PIK3CA genes without evidence of mutations in the IDH1, IDH2, ATRX, H3F3A, or EGFR genes or the TERT promoter. Based upon this additional information, a final integrated morphologic and molecular diagnosis of GBM, IDH wild-type was issued. The MGMT gene promoter was negative for methylation, a finding that has prognostic and predictive impact with regard to treatment with temazolamide.7-9
New Diffuse Glioma Classification
Since the issuance of the previous edition of the WHO classification of CNS tumors in 2007, several sentinel discoveries have been made that have advanced our understanding of the underlying biology of primary CNS neoplasms. Since a detailed review of these findings is beyond the scope and purpose of this manuscript and salient reviews on the topic can be found elsewhere, we will focus on the molecular findings that have been incorporated into the recently revised WHO classification.10 The importance of providing such information for proper patient management is illustrated by the recent acknowledgement by the American Academy of Neurology that molecular testing of brain tumors is a specific area in which there is a need for quality improvement.11 Therefore, it is critical that these underlying molecular abnormalities are identified to allow for proper classification and treatment of diffuse gliomas in the veteran population.
As noted previously, based on VA cancer registry data, diffuse gliomas are the most commonly encountered primary CNS cancers in the veteran population. Several of the aforementioned seminal discoveries have been incorporated into the updated classification of diffuse gliomas. While the recently updated WHO classification allows for the assignment of “not otherwise specified (NOS)” diagnostic designation, this category must be limited to cases where there is insufficient data to allow for a more precise classification due to sample limitations and not simply due to a failure of VA pathology laboratories to pursue the appropriate diagnostic testing.
Figure 4 presents the recommended diagnostic workflow for the workup of diffuse gliomas. As illustrated in the above cases, a variety of different methodologies, including immunohistochemical, FISH, loss of heterozygosity analysis, traditional and NGS may be applied when elucidating the status of molecular events at critical diagnostic branch points.
Diagnostic Uses of Molecular Testing
While the case studies in this article demonstrate the use of ancillary testing and provide a suggested strategy for properly subclassifying diffuse gliomas, inherent in this strategy is the assumption that, based upon the initial clinical and pathologic information available, one can accurately categorize the lesion as a diffuse glioma. In reality, such a distinction is not always a straightforward endeavor. It is well recognized that a proportion of low-grade, typically radiologically circumscribed, CNS neoplasms, such as pilocytic astrocytomas and glioneuronal tumors, may infiltrate the surrounding brain parenchyma. In addition, many of these low-grade CNS neoplasms also may have growth patterns that are shared with diffuse gliomas, a diagnostic challenge that often can be further hampered by the inherent limitations involved in obtaining adequate samples for diagnosis from the CNS.
Although there are limitations and caveats, molecular diagnostic testing may be invaluable in properly classifying CNS tumors in such situations. The finding of mutations in the IDH1 or IDH2 genes has been shown to be very valuable in distinguishing low-grade diffuse glioma from both nonneoplastic and low-grade circumscribed neuroepithelial neoplasms that may exhibit growth patterns that can mimic those of diffuse gliomas.15-17 Conversely, finding abnormalities in the BRAF gene in a brain neoplasm that has a low-grade morphology suggests that the lesion may represent one of these low-grade lesions such as a pleomorphic xanthoastrocytoma, pilocytic astrocytoma, or mixed neuronal-glial tumor as opposed to a diffuse glioma.18,19
Depending upon the environment in which one practices, small biopsy specimens may be prevalent, and unfortunately, it is not uncommon to obtain a biopsy that exhibits a histologic growth pattern that is discordant from what one would predict based on the clinical context and imaging findings. Molecular testing may be useful in resolving discordances in such situations. If a biopsy of a ring-enhancing lesion demonstrates a diffuse glioma that doesn’t meet WHO grade IV criteria, applying methodologies that look for genetic features commonly encountered in high-grade astrocytomas may identify genetic abnormalities that suggest a more aggressive lesion than is indicated by the histologic findings. The presence of genetic abnormalities such as homozygous deletion of the CDKN2A gene, TERT promoter mutation, loss of heterozygosity of chromosome 10q and/or phosphatase and tensin homolog (PTEN) mutations, EGFR gene amplification or the presence of the EGFR variant III are a few findings that would suggest the aforementioned sample may represent an undersampling of a higher grade diffuse astrocytoma, which would be important information to convey to the treating clinicians.20-26
Testing In the VA
The goals of the MPWG include promoting increased quality and availability of genetic testing within the VHA as well as encouraging internal referral testing. An informal survey of the chiefs of VA Pathology and Laboratory Medicine Services was conducted in November of 2017 in an attempt to identify internal VA pathology laboratories currently conducting testing that may be of use in the workup of diffuse gliomas (Table 1).
The VA currently offers NGS panels for patients with advanced-stage malignancies under the auspices of the Precision Oncology Program, whose reports provide both (1) mutational analyses for genes such as TP53, ATRX, NF1, BRAF, PTEN, TERT IDH1, and IDH2 that may be useful in the proper classifying of high-grade diffuse gliomas; and (2) information regarding clinical trials for which the veteran may be eligible for based on their glioma’s mutational profile. Interested VA providers should visit tinyurl.com/precisiononcology/ for more information about this program. Finally, although internal testing within VA laboratories is recommended to allow for the development of more cost-effective testing, testing may be performed through many nationally contracted reference laboratories.
Conclusion
In light of the recent progress made in our understanding of the molecular events of gliomagenesis, the way we diagnose diffuse gliomas within the CNS has undergone a major paradigm shift. While histology still plays a critical role in the process, we believe that additional ancillary testing is a requirement for all diffuse gliomas diagnosed within VA pathology laboratories. In the context of recently encountered cases, we have provided a recommended workflow highlighting the testing that can be performed to allow for the proper diagnosis of our veterans with diffuse gliomas (Figure 4).
Unless limited by the amount of tissue available for such tests, ancillary testing must be performed on all diffuse gliomas diagnosed within the VA system to ensure proper diagnosis and treatment of our veterans with diffuse gliomas.
Acknowledgments
The authors thank Dr. Craig M. Horbinski (Feinberg School of Medicine, Northwestern University) and Dr. Geoffrey H. Murdoch (University of Pittsburgh) for their constructive criticism of the manuscript. We also thank the following individuals for past service as members of the molecular oncology subcommittee of the MGPW: Dr. George Ansstas (Washington University School of Medicine), Dr. Osssama Hemadeh (Bay Pines VA Health Care System), Dr. James Herman (VA Pittsburgh Healthcare System), and Dr. Ryan Phan (formerly of the VA Greater Los Angeles Healthcare System) as well as the members of the Veterans Administration pathology and laboratory medicine service molecular genetics pathology workgroup.
Author disclosures
The authors report no actual or potential conflicts of interest with regard to this article.
Disclaimer
The opinions expressed herein are those of the authors and do not necessarily reflect those of Federal Practitioner, Frontline Medical Communications Inc., the US Government, or any of its agencies.
Dr. Kulich is the Acting Chief of Pathology and Laboratory Medicine Service at VA Pittsburgh Healthcare System and member of the Division of Neuropathology at University of Pittsburgh Department of Pathology, Dr. Duvvuri is an Otolaryngologist at VA Pittsburgh Healthcare System, and Dr. Passero is the Section Chief of Hematology\Oncology at VA Pittsburgh Healthcare System in Pennsylvania. Dr. Becker is an Oncologist at VA-New York Harbor Healthcare System. Dr. Dacic is a Pathologist at University of Pittsburgh Department of Pathology in Pennsylvania. Dr. Ehsan is Chief of Pathology and Laboratory Medicine Services at the South Texas Veterans Healthcare System in San Antonio. Dr. Gutkin is the former Chief of Pathology and Laboratory Medicine Service at VA Pittsburgh Healthcare System. Dr. Hou is a Pathologist at St. Louis VA Medical Center in Missouri. Dr. Icardi is the VA National Director of Pathology and Laboratory Medicine Services. Dr. Lyle is a Pathologist at Bay Pine Health Care System in Florida. Dr. Lynch is an Investigator at VA Salt Lake Health Care System Informatics and Computing Infrastructure. Dr. Montgomery is an Oncologist at VA Puget Sound Health Care System, in Seattle, Washington. Dr. Przygodzki is the Director of Genomic Medicine Implementation and Associate Director of Genomic Medicine for the VA. Dr. Colman is a Neuro-Oncologist at George E. Wahlen VA Medical Center and the Director of Medical Neuro-Oncology at the Huntsman Cancer Institute, Salt Lake City, Utah.
Correspondence: Dr. Kulich (scott.kulich@va.gov)
1. Louis DN, Perry A, Reifenberger G, et al. The 2016 World Health Organization Classification of Tumors of the Central Nervous System: a summary. Acta Neuropathol. 2016;131(6):803-820.
2. Wang-Rodriguez J, Yunes A, Phan R, et al. The challenges of precision medicine and new advances in molecular diagnostic testing in hematolymphoid malignancies: impact on the VHA. Fed Pract. 2017;34(suppl 5):S38-S49.
3. Ostrom QT, Gittleman H, Liao P, et al. CBTRUS statistical report: primary brain and other central nervous system tumors diagnosed in the United States in 2010-2014. Neuro Oncol. 2017;19(suppl 5):v1-v88.
4. Nikiforova MN, Wald AI, Melan MA, et al. Targeted next-generation sequencing panel (GlioSeq) provides comprehensive genetic profiling of central nervous system tumors. Neuro Oncol. 2016;18(3)379-387.
5. Cairncross JG, Ueki K, Zlatescu MC, et al. Specific genetic predictors of chemotherapeutic response and survival in patients with anaplastic oligodendrogliomas. J Natl Cancer Inst. 1998;90(19):1473-1479.
6. van den Bent MJ, Erdem-Eraslan L, Idbaih A, et al. MGMT-STP27 methylation status as predictive marker for response to PCV in anaplastic oligodendrogliomas and oligoastrocytomas. A report from EORTC study 26951. Clin Cancer Res. 2013;19(19):5513-5522.
7. Stupp R, Hegi ME, Mason WP, et al; European Organisation for Research and Treatment of Cancer Brain Tumour and Radiation Oncology Groups; National Cancer Institute of Canada Clinical Trials Group. Effects of radiotherapy with concomitant and adjuvant temozolomide versus radiotherapy alone on survival in glioblastoma in a randomised phase III study: 5-year analysis of the EORTC-NCIC trial. Lancet Oncol. 2009;10(5):459-466.
8. Malmstrom A, Gronberg BH, Marosi C, et al. Temozolomide versus standard 6-week radiotherapy versus hypofractionated radiotherapy in patients older than 60 years with glioblastoma: the Nordic randomised, phase 3 trial. Lancet Oncol. 2012;13(9):916-926.
9. van den Bent MJ, Kros JM. Predictive and prognostic markers in neuro-oncology. J Neuropathol Exp Neurol. 2007;66(12):1074-1081.
10. Chen R, Smith-Cohn M, Cohen AL, Colman H. Glioma subclassifications and their clinical significance. Neurotherapeutics. 2017;14(2):284-297.
11. Jordan JT, Sanders AE, Armstrong T, et al. Quality improvement in neurology: neuro-oncology quality measurement set. Neurology. 2018;90(14):652-658.
12. Chen L, Voronovich Z, Clark K, et al. Predicting the likelihood of an isocitrate dehydrogenase 1 or 2 mutation in diagnoses of infiltrative glioma. Neuro Oncol. 2014;16(11):1478-1483.
13. Hegi ME, Diserens AC, Gorlia T, et al. MGMT gene silencing and benefit from temozolomide in glioblastoma. N Engl J Med. 2005;352(10):997-1003.
14. Wick W, Platten M, Meisner C, et al; NOA-08 Study Group of Neuro-oncology Working Group (NOA) of German Cancer Society. Temozolomide chemotherapy alone versus radiotherapy alone for malignant astrocytoma in the elderly: the NOA-08 randomised, phase 3 trial. Lancet Oncol. 2012;13(7):707-715.
15. Horbinski C, Kofler J, Kelly LM, Murdoch GH, Nikiforova MN. Diagnostic use of IDH1/2 mutation analysis in routine clinical testing of formalin-fixed, paraffin-embedded glioma tissues. J Neuropathol Exp Neurol. 2009;68(12):1319-1325.
16. Camelo-Piragua S, Jansen M, Ganguly A, Kim JC, Louis DN, Nutt CL. Mutant IDH1-specific immunohistochemistry distinguishes diffuse astrocytoma from astrocytosis. Acta Neuropathol. 2010;119(4):509-511.
17. Horbinski C, Kofler J, Yeaney G, et al. Isocitrate dehydrogenase 1 analysis differentiates gangliogliomas from infiltrative gliomas. Brain Pathol. 2011;21(5):564-574.
18. Berghoff AS, Preusser M. BRAF alterations in brain tumours: molecular pathology and therapeutic opportunities. Curr Opin Neurol. 2014;27(6):689-696.
19. Korshunov A, Meyer J, Capper D, et al. Combined molecular analysis of BRAF and IDH1 distinguishes pilocytic astrocytoma from diffuse astrocytoma. Acta Neuropathol. 2009;118(3):401-405.
20. Fuller CE, Schmidt RE, Roth KA, et al. Clinical utility of fluorescence in situ hybridization (FISH) in morphologically ambiguous gliomas with hybrid oligodendroglial/astrocytic features. J Neuropathol Exp Neurol. 2003;62(11):1118-1128.
21. Horbinski C. Practical molecular diagnostics in neuropathology: making a tough job a little easier. Semin Diagn Pathol. 2010;27(2):105-113.
22. Fuller GN, Bigner SH. Amplified cellular oncogenes in neoplasms of the human central nervous system. Mutat Res. 1992;276(3):299-306.
23. Brennan CW, Verhaak RG, McKenna A, et al; TCGA Research Network. The somatic genomic landscape of glioblastoma. Cell. 2013;155(2):462-477.
24. Aldape K, Zadeh G, Mansouri S, Reifenberger G, von Deimling A. Glioblastoma: pathology, molecular mechanisms and markers. Acta Neuropathol. 2015;129(6):829-848.
25. Killela PJ, Reitman ZJ, Jiao Y, et al. TERT promoter mutations occur frequently in gliomas and a subset of tumors derived from cells with low rates of self-renewal. Proc Natl Acad Sci U S A. 2013;110(15):6021-6026.
26. Nikiforova MN, Hamilton RL. Molecular diagnostics of gliomas. Arch Pathol Lab Med. 2011;135(5):558-568.
Association of Nausea and Length of Stay with Carbohydrate Loading Prior to Total Joint Arthroplasty
From Stony Brook Medical Center, Stony Brook, NY (Dr. Blum), and NYU Winthrop Medical Center,
Abstract
- Background: Enhanced Recovery After Surgery (ERAS) is a multimodal, standardized approach to the surgical patient that incorporates evidenced-based interventions designed to achieve rapid recovery after surgery by minimizing the patient’s stress response. One aspect of ERAS, carbohydrate loading, has been shown in multiple randomized controlled trials to result in postoperative benefits in patients undergoing colorectal surgery, but there appears to be insufficient data to make definitive recommendations for or against carbohydrate loading in joint replacement patients.
- Objective: To evaluate postoperative nausea and length of stay (LOS) after a preoperative carbohydrate loading protocol was initiated for patients undergoing total joint replacement.
- Design: Retrospective chart review.
- Setting and participants: 100 patients who underwent either total knee or hip arthroplasty at Winthrop University Hospital, Mineola, NY, in the past 4 years and either had (n = 50) or had not received preoperative carbohydrate supplements (n = 50).
- Methods: Using the total joint database, the medical record was reviewed for the patient’s demographics, LOS, documentation of postoperative nausea, and number of doses of antiemetic medication given to the patient.
- Results: The mean LOS for the carbohydrate-loading group and non-carbohydrate group was 1.9 days and 2.6 days. respectively, a difference of 0.70 days (P < 0.0001). The carbohydrate-loaded group received a total of 13 doses of antiemetic medications and the non-carbohydrate group received 21 doses. The average number of antiemetic doses given to a patient postoperatively was 0.26 for the carbohydrate-loaded group and 0.42 for the non-carbohydrate-loaded group. The difference was 0.16 doses (P < 0.7815).
- Conclusion: The implementation of carbohydrate loading decreased LOS for joint replacement patients by approximately 1 day. Additionally, there was a trend towards decreased antiemetic use and fewer documented cases of postoperative nausea after carbohydrate loading.
Keywords: carbohydrate loading, ERAS, joint arthroplasty, length of stay, nausea.
Enhanced Recovery After Surgery (ERAS) is a multimodal, standardized approach to the surgical patient that incorporates evidenced-based interventions designed to achieve rapid recovery after surgery by minimizing the patient’s stress response.1-4 The ERAS protocols have been shown to reduce complications, decrease length of stay (LOS), and improve patient outcomes.3-7 The program was originally designed to facilitate recovery after colorectal operative procedures by maintaining preoperative organ function and reducing the postoperative stress response. This was done through a coordinated program of preoperative counseling, optimizing nutritional status, standardizing analgesic regimens, and early mobilization.3
The principles of an ERAS program with standardized pre- and postoperative protocols appear ideally suited for the total joint arthroplasty patient.1,3-5 Prior studies have demonstrated ERAS to be effective in facilitating decreased LOS, with no apparent increase in readmission rates or complications for both colorectal and joint arthroplasty patients.1-7 The protocols have also been shown to be cost-effective, with decreased incidence of postoperative complications, including thromboembolic disease and infections.3,4,6
An important tenet of ERAS protocols is optimizing the nutritional status of the patient prior to surgery.6 This includes avoidance of preoperative fasting in conjunction with carbohydrate loading. ERAS protocols instruct the patient to ingest a carbohydrate-rich beverage 2 hours prior to surgery. The concept of allowing a patient to eat prior to surgery is based on the preference for the patient to present for surgery in an anabolic rather than a catabolic state.2,3,11 Patients in an anabolic state undergo less postoperative protein and nitrogen losses, which appears to facilitate wound healing.2,6,11
There have been multiple randomized controlled trials demonstrating the postoperative benefits of carbohydrate loading prior to colorectal surgery.2,6
Another potential benefit of preoperative carbohydrate loading is a decrease in postoperative nausea.1,5,12-14 A decrease in nausea in theory would allow for earlier mobilization with physical therapy and potentially a shorter LOS. Hence, the goal of this study was to examine the impact of preoperative carbohydrate loading on postoperative nausea directly, as well as on LOS, at a single institution in the setting of an ERAS protocol.
Methods
We retrospectively reviewed the records of 100 patients who underwent total hip or total knee replacement between 2014 and 2018 at NYU Winthrop University Hospital, Mineola, NY. Fifty patients had received preoperative carbohydrate supplements and 50 patients had not. The remainder of the total joint protocol was identical for the 2 groups.
Protocol
All patients attended preoperative educational classes. For patients receiving carbohydrate loading, written and oral instructions were given for the patient to drink Ensure Clear followed by 8 ounces of water before going to bed the night before surgery. They were also instructed to drink the Ensure Pre-Surgery Drink 2 hours prior to their operative procedure. Patients with diabetes were instructed to drink the Ensure Glucerna Clear drink the night before surgery. No carbohydrate drink was given on the day of surgery until a finger-stick glucose level was performed upon arrival at the hospital. Spinal anesthesia was utilized in all patients, with adductor canal block supplementation for patients undergoing total knee replacement. Orders were written to have physical therapy evaluate the patients in the PACU to facilitate ambulation. Pre- and postoperative pain protocols were identical for the 2 groups.
Data Collection
A chart review was performed using the patients’ medical record numbers from the joint replacement database at our institution. Exemption was obtained for the project from our institution’s Institutional Review Board (IRB).
Analysis
Descriptive statistics (mean, standard deviation, and median for continuous variables; frequencies and percentages for categorical variables) were calculated separately by group. The 2 groups were compared using the chi-square test or Fisher’s exact test, as deemed appropriate, for categorical variables, the 2-sample t-test for age, and the Mann-Whitney test for LOS and number of antiemetic doses given. A result was considered statistically significant at the P < 0.05 level of significance. All analyses were performed using SAS version 9.4 (SAS Institute Inc., Cary, NC).
Results
The carbohydrate-loading group (n = 50) and the non-carbohydrate-loading group (n = 50) were comparable for age, gender, type of arthroplasty, episodes of vomiting, diabetes, and nerve block (Table). 
 for carbohydrate-loaded (n = 50) versus non-carbohydrate-loaded patients (n = 50).")
Discussion
In this study we explored whether carbohydrate loading prior to total joint replacement influenced postoperative nausea and LOS in a single institution. The 2 groups appeared similar in terms of demographics as well as the types of surgical procedures performed. After initiation of the carbohydrate-loading protocol, LOS decreased by approximately 1 day. There was also a trend toward decreased usage of antiemetics in the carbohydrate-loaded group, although the final values were not statistically significant. There were also fewer documented cases of postoperative nausea in the carbohydrate-loaded group.
The failure to find a statistical difference in postoperative antiemetic usage between carbohydrate-loaded and non-carbohydrate-loaded patients may be due to incomplete documentation (ie, not all patients who were nauseous having their symptoms documented in the chart). Due to the small number of antiemetic doses given to each patient, we may have lacked the necessary numbers to visualize the difference between the groups. We were unable to perform a post-hoc power calculation with our current data. Additionally, the decrease seen in LOS may not have been due solely to carbohydrate loading, since the data were collected over multiple years during implementation of the ERAS protocol. There is a possibility that the ERAS protocol, which is multimodal, was better implemented as time progressed, adding a confounding variable to our data. Despite these limitations, however, we were able to demonstrate a decreased LOS for patients who underwent total joint replacement with the initiation of a preoperative carbohydrate-loading ERAS protocol. Furthermore, there was a trend toward decreased documented postoperative nausea and decreased antiemetic use in the group that avoided fasting and received carbohydrate supplements.
This decrease in LOS by almost 1 day is consistent with multiple prior studies that demonstrated a similar decrease when implementing an ERAS protocol.3-5,7 The trend towards lower antiemetic use and less postoperative nausea in the carbohydrate-loading ERAS protocol gives merit to further research on this topic, with the goal of finding an optimal preoperative practice that allows patients to experience rapid mobilization, minimal postoperative nausea, and faster recovery overall.
Conclusion
Corresponding author: Christopher L. Blum, MD, Stony Brook Medical Center, Stony Brook, NY; blumc18@gmail.com.
Financial disclosures: None.
1. Proudfoot S, Bennett B, Duff S, Palmer J. Implementation and effects of Enhanced Recovery After Surgery for hip and knee replacements and fractured neck of femur in New Zealand orthopaedic services. N Z Med J. 2017;130:77-90.
2. Geltzeiler CB, Rotramel A, Wilson C, et al. Prospective study of colorectal enhanced recovery after surgery in a community hospital. JAMA Surg. 2014;149:955-961.
3. Soffin EM, YaDeau JT. Enhanced recovery after surgery for primary hip and knee arthroplasty: a review of the evidence. Br J Anaesth. 2016;117(suppl 3):iii62-iii72.
4. Stowers MD, Manuopangai L, Hill AG, et al. Enhanced Recovery After Surgery in elective hip and knee arthroplasty reduces length of hospital stay. ANZ J Surg. 2016;86:475-479.
5. Gwynne-Jones DP, Martin G, Crane C. Enhanced Recovery After Surgery for hip and knee replacements. Orthop Nurs. 2017;36:203-210.
6. Semerjian A, Milbar N, Kates M, et al. Hospital charges and length of stay following radical cystectomy in the enhanced recovery after surgery era. Urology. 2018;111:86-91.
7. Stambough JB, Nunley RM, Curry MC, et al. Rapid recovery protocols for primary total hip arthroplasty can safely reduce length of stay without increasing readmissions. J Arthroplasty. 2015;30:521-526.
8. Ljungqvist O, Soreide E. Preoperative fasting. Br J Surg. 2003;90:400-406.
9. Riis J, Lomholt B, Haxholdt O, et al. Immediate and long-term mental recovery from general versus epidural anesthesia in elderly patients. Acta Anaesthesiol Scand. 1983;27:44-49.
10. Kehlet H, Wilmore DW. Multimodal strategies to improve surgical outcome. Am J Surg. 2002;183:630-641.
11. Svanfeldt M, Thorell A, Hausel J, Soop M, et al. Randomized clinical trial of the effect of preoperative oral carbohydrate treatment on postoperative whole-body protein and glucose kinetics. Br J Surg. 2007;94:1342-1350.
12. Halaszynski TM, Juda R, Silverman DG. Optimizing postoperative outcomes with efficient preoperative assessment and management. Crit Care Med. 2004;32(4 suppl):S76-S86.
13. Aronsson A, Al-Ani NA, Brismar K, Hedstrom M. A carbohydrate-rich drink shortly before surgery affected IGF-I bioavailability after a total hip replacement. A double-blind placebo controlled study on 29 patients. Aging Clin Exp Res. 2009;21:97-101.
14. Bilku DK, Dennison AR, Hall TC, Metcalfe MS, Garcea G. Role of preoperative carbohydrate loading: a systematic review. Ann R Coll Surg Engl. 2014;96:15-22.
From Stony Brook Medical Center, Stony Brook, NY (Dr. Blum), and NYU Winthrop Medical Center,
Abstract
- Background: Enhanced Recovery After Surgery (ERAS) is a multimodal, standardized approach to the surgical patient that incorporates evidenced-based interventions designed to achieve rapid recovery after surgery by minimizing the patient’s stress response. One aspect of ERAS, carbohydrate loading, has been shown in multiple randomized controlled trials to result in postoperative benefits in patients undergoing colorectal surgery, but there appears to be insufficient data to make definitive recommendations for or against carbohydrate loading in joint replacement patients.
- Objective: To evaluate postoperative nausea and length of stay (LOS) after a preoperative carbohydrate loading protocol was initiated for patients undergoing total joint replacement.
- Design: Retrospective chart review.
- Setting and participants: 100 patients who underwent either total knee or hip arthroplasty at Winthrop University Hospital, Mineola, NY, in the past 4 years and either had (n = 50) or had not received preoperative carbohydrate supplements (n = 50).
- Methods: Using the total joint database, the medical record was reviewed for the patient’s demographics, LOS, documentation of postoperative nausea, and number of doses of antiemetic medication given to the patient.
- Results: The mean LOS for the carbohydrate-loading group and non-carbohydrate group was 1.9 days and 2.6 days. respectively, a difference of 0.70 days (P < 0.0001). The carbohydrate-loaded group received a total of 13 doses of antiemetic medications and the non-carbohydrate group received 21 doses. The average number of antiemetic doses given to a patient postoperatively was 0.26 for the carbohydrate-loaded group and 0.42 for the non-carbohydrate-loaded group. The difference was 0.16 doses (P < 0.7815).
- Conclusion: The implementation of carbohydrate loading decreased LOS for joint replacement patients by approximately 1 day. Additionally, there was a trend towards decreased antiemetic use and fewer documented cases of postoperative nausea after carbohydrate loading.
Keywords: carbohydrate loading, ERAS, joint arthroplasty, length of stay, nausea.
Enhanced Recovery After Surgery (ERAS) is a multimodal, standardized approach to the surgical patient that incorporates evidenced-based interventions designed to achieve rapid recovery after surgery by minimizing the patient’s stress response.1-4 The ERAS protocols have been shown to reduce complications, decrease length of stay (LOS), and improve patient outcomes.3-7 The program was originally designed to facilitate recovery after colorectal operative procedures by maintaining preoperative organ function and reducing the postoperative stress response. This was done through a coordinated program of preoperative counseling, optimizing nutritional status, standardizing analgesic regimens, and early mobilization.3
The principles of an ERAS program with standardized pre- and postoperative protocols appear ideally suited for the total joint arthroplasty patient.1,3-5 Prior studies have demonstrated ERAS to be effective in facilitating decreased LOS, with no apparent increase in readmission rates or complications for both colorectal and joint arthroplasty patients.1-7 The protocols have also been shown to be cost-effective, with decreased incidence of postoperative complications, including thromboembolic disease and infections.3,4,6
An important tenet of ERAS protocols is optimizing the nutritional status of the patient prior to surgery.6 This includes avoidance of preoperative fasting in conjunction with carbohydrate loading. ERAS protocols instruct the patient to ingest a carbohydrate-rich beverage 2 hours prior to surgery. The concept of allowing a patient to eat prior to surgery is based on the preference for the patient to present for surgery in an anabolic rather than a catabolic state.2,3,11 Patients in an anabolic state undergo less postoperative protein and nitrogen losses, which appears to facilitate wound healing.2,6,11
There have been multiple randomized controlled trials demonstrating the postoperative benefits of carbohydrate loading prior to colorectal surgery.2,6
Another potential benefit of preoperative carbohydrate loading is a decrease in postoperative nausea.1,5,12-14 A decrease in nausea in theory would allow for earlier mobilization with physical therapy and potentially a shorter LOS. Hence, the goal of this study was to examine the impact of preoperative carbohydrate loading on postoperative nausea directly, as well as on LOS, at a single institution in the setting of an ERAS protocol.
Methods
We retrospectively reviewed the records of 100 patients who underwent total hip or total knee replacement between 2014 and 2018 at NYU Winthrop University Hospital, Mineola, NY. Fifty patients had received preoperative carbohydrate supplements and 50 patients had not. The remainder of the total joint protocol was identical for the 2 groups.
Protocol
All patients attended preoperative educational classes. For patients receiving carbohydrate loading, written and oral instructions were given for the patient to drink Ensure Clear followed by 8 ounces of water before going to bed the night before surgery. They were also instructed to drink the Ensure Pre-Surgery Drink 2 hours prior to their operative procedure. Patients with diabetes were instructed to drink the Ensure Glucerna Clear drink the night before surgery. No carbohydrate drink was given on the day of surgery until a finger-stick glucose level was performed upon arrival at the hospital. Spinal anesthesia was utilized in all patients, with adductor canal block supplementation for patients undergoing total knee replacement. Orders were written to have physical therapy evaluate the patients in the PACU to facilitate ambulation. Pre- and postoperative pain protocols were identical for the 2 groups.
Data Collection
A chart review was performed using the patients’ medical record numbers from the joint replacement database at our institution. Exemption was obtained for the project from our institution’s Institutional Review Board (IRB).
Analysis
Descriptive statistics (mean, standard deviation, and median for continuous variables; frequencies and percentages for categorical variables) were calculated separately by group. The 2 groups were compared using the chi-square test or Fisher’s exact test, as deemed appropriate, for categorical variables, the 2-sample t-test for age, and the Mann-Whitney test for LOS and number of antiemetic doses given. A result was considered statistically significant at the P < 0.05 level of significance. All analyses were performed using SAS version 9.4 (SAS Institute Inc., Cary, NC).
Results
The carbohydrate-loading group (n = 50) and the non-carbohydrate-loading group (n = 50) were comparable for age, gender, type of arthroplasty, episodes of vomiting, diabetes, and nerve block (Table).
Discussion
In this study we explored whether carbohydrate loading prior to total joint replacement influenced postoperative nausea and LOS in a single institution. The 2 groups appeared similar in terms of demographics as well as the types of surgical procedures performed. After initiation of the carbohydrate-loading protocol, LOS decreased by approximately 1 day. There was also a trend toward decreased usage of antiemetics in the carbohydrate-loaded group, although the final values were not statistically significant. There were also fewer documented cases of postoperative nausea in the carbohydrate-loaded group.
The failure to find a statistical difference in postoperative antiemetic usage between carbohydrate-loaded and non-carbohydrate-loaded patients may be due to incomplete documentation (ie, not all patients who were nauseous having their symptoms documented in the chart). Due to the small number of antiemetic doses given to each patient, we may have lacked the necessary numbers to visualize the difference between the groups. We were unable to perform a post-hoc power calculation with our current data. Additionally, the decrease seen in LOS may not have been due solely to carbohydrate loading, since the data were collected over multiple years during implementation of the ERAS protocol. There is a possibility that the ERAS protocol, which is multimodal, was better implemented as time progressed, adding a confounding variable to our data. Despite these limitations, however, we were able to demonstrate a decreased LOS for patients who underwent total joint replacement with the initiation of a preoperative carbohydrate-loading ERAS protocol. Furthermore, there was a trend toward decreased documented postoperative nausea and decreased antiemetic use in the group that avoided fasting and received carbohydrate supplements.
This decrease in LOS by almost 1 day is consistent with multiple prior studies that demonstrated a similar decrease when implementing an ERAS protocol.3-5,7 The trend towards lower antiemetic use and less postoperative nausea in the carbohydrate-loading ERAS protocol gives merit to further research on this topic, with the goal of finding an optimal preoperative practice that allows patients to experience rapid mobilization, minimal postoperative nausea, and faster recovery overall.
Conclusion
Corresponding author: Christopher L. Blum, MD, Stony Brook Medical Center, Stony Brook, NY; blumc18@gmail.com.
Financial disclosures: None.
1. Proudfoot S, Bennett B, Duff S, Palmer J. Implementation and effects of Enhanced Recovery After Surgery for hip and knee replacements and fractured neck of femur in New Zealand orthopaedic services. N Z Med J. 2017;130:77-90.
2. Geltzeiler CB, Rotramel A, Wilson C, et al. Prospective study of colorectal enhanced recovery after surgery in a community hospital. JAMA Surg. 2014;149:955-961.
3. Soffin EM, YaDeau JT. Enhanced recovery after surgery for primary hip and knee arthroplasty: a review of the evidence. Br J Anaesth. 2016;117(suppl 3):iii62-iii72.
4. Stowers MD, Manuopangai L, Hill AG, et al. Enhanced Recovery After Surgery in elective hip and knee arthroplasty reduces length of hospital stay. ANZ J Surg. 2016;86:475-479.
5. Gwynne-Jones DP, Martin G, Crane C. Enhanced Recovery After Surgery for hip and knee replacements. Orthop Nurs. 2017;36:203-210.
6. Semerjian A, Milbar N, Kates M, et al. Hospital charges and length of stay following radical cystectomy in the enhanced recovery after surgery era. Urology. 2018;111:86-91.
7. Stambough JB, Nunley RM, Curry MC, et al. Rapid recovery protocols for primary total hip arthroplasty can safely reduce length of stay without increasing readmissions. J Arthroplasty. 2015;30:521-526.
8. Ljungqvist O, Soreide E. Preoperative fasting. Br J Surg. 2003;90:400-406.
9. Riis J, Lomholt B, Haxholdt O, et al. Immediate and long-term mental recovery from general versus epidural anesthesia in elderly patients. Acta Anaesthesiol Scand. 1983;27:44-49.
10. Kehlet H, Wilmore DW. Multimodal strategies to improve surgical outcome. Am J Surg. 2002;183:630-641.
11. Svanfeldt M, Thorell A, Hausel J, Soop M, et al. Randomized clinical trial of the effect of preoperative oral carbohydrate treatment on postoperative whole-body protein and glucose kinetics. Br J Surg. 2007;94:1342-1350.
12. Halaszynski TM, Juda R, Silverman DG. Optimizing postoperative outcomes with efficient preoperative assessment and management. Crit Care Med. 2004;32(4 suppl):S76-S86.
13. Aronsson A, Al-Ani NA, Brismar K, Hedstrom M. A carbohydrate-rich drink shortly before surgery affected IGF-I bioavailability after a total hip replacement. A double-blind placebo controlled study on 29 patients. Aging Clin Exp Res. 2009;21:97-101.
14. Bilku DK, Dennison AR, Hall TC, Metcalfe MS, Garcea G. Role of preoperative carbohydrate loading: a systematic review. Ann R Coll Surg Engl. 2014;96:15-22.