User login
Comparison of Dermatologist Ratings on Health Care–Specific and General Consumer Websites
Health care–specific (eg, Healthgrades, Zocdoc, Vitals, WebMD) and general consumer websites (eg, Google, Yelp) are popular platforms for patients to find physicians, schedule appointments, and review physician experiences. Patients find ratings on these websites more trustworthy than standardized surveys distributed by hospitals, but many physicians do not trust the reviews on these sites. For example, in a survey of both physicians (n=828) and patients (n=494), 36% of physicians trusted online reviews compared to 57% of patients.1 The objective of this study was to determine if health care–specific or general consumer websites more accurately reflect overall patient sentiment. This knowledge can help physicians who are seeking to improve the patient experience understand which websites have more accurate and trustworthy reviews.
Methods
A list of dermatologists from the top 10 most and least dermatologist–dense areas in the United States was compiled to examine different physician populations.2 Equal numbers of male and female dermatologists were randomly selected from the most dense areas. All physicians were included from the least dense areas because of limited sample size. Ratings were collected from websites most likely to appear on the first page of a Google search for a physician name, as these are most likely to be seen by patients. Descriptive statistics were generated to describe the study population; mean and median physician rating (using a scale of 1–5); SD; and minimum, maximum, and interquartile ranges. Spearman correlation coefficients were generated to examine the strength of association between ratings from website pairs. P<.05 was considered statistically significant, with analyses performed in R (3.6.2) for Windows (the R Foundation).
Results
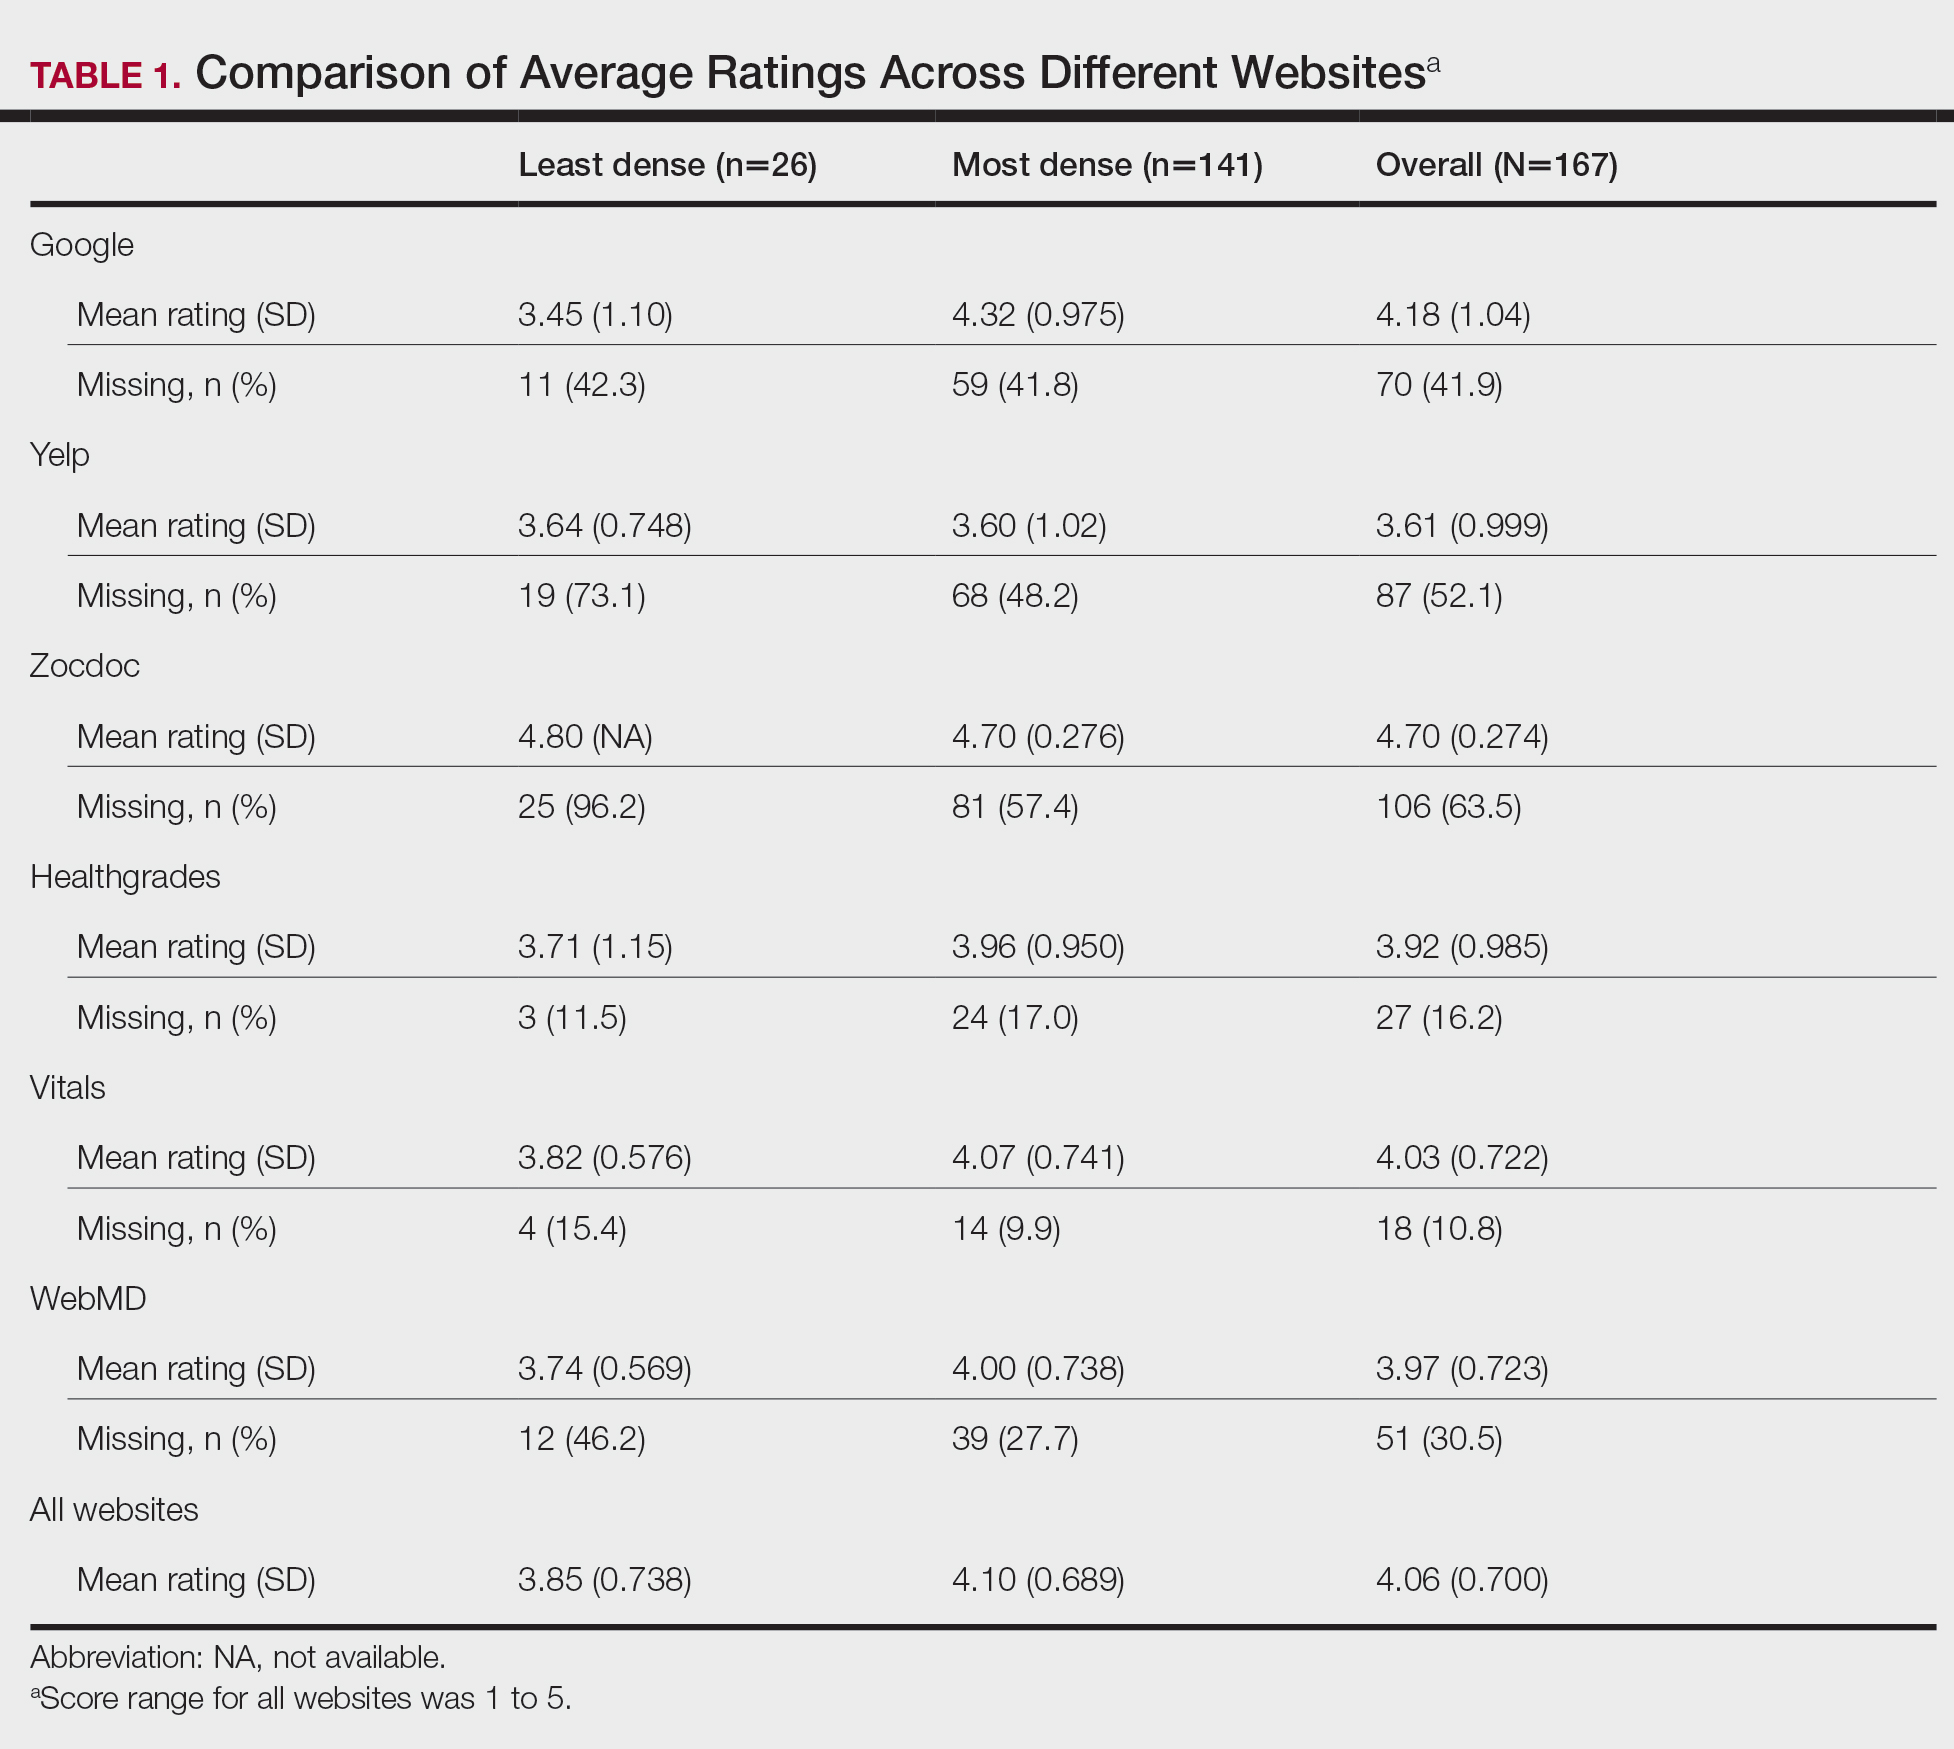
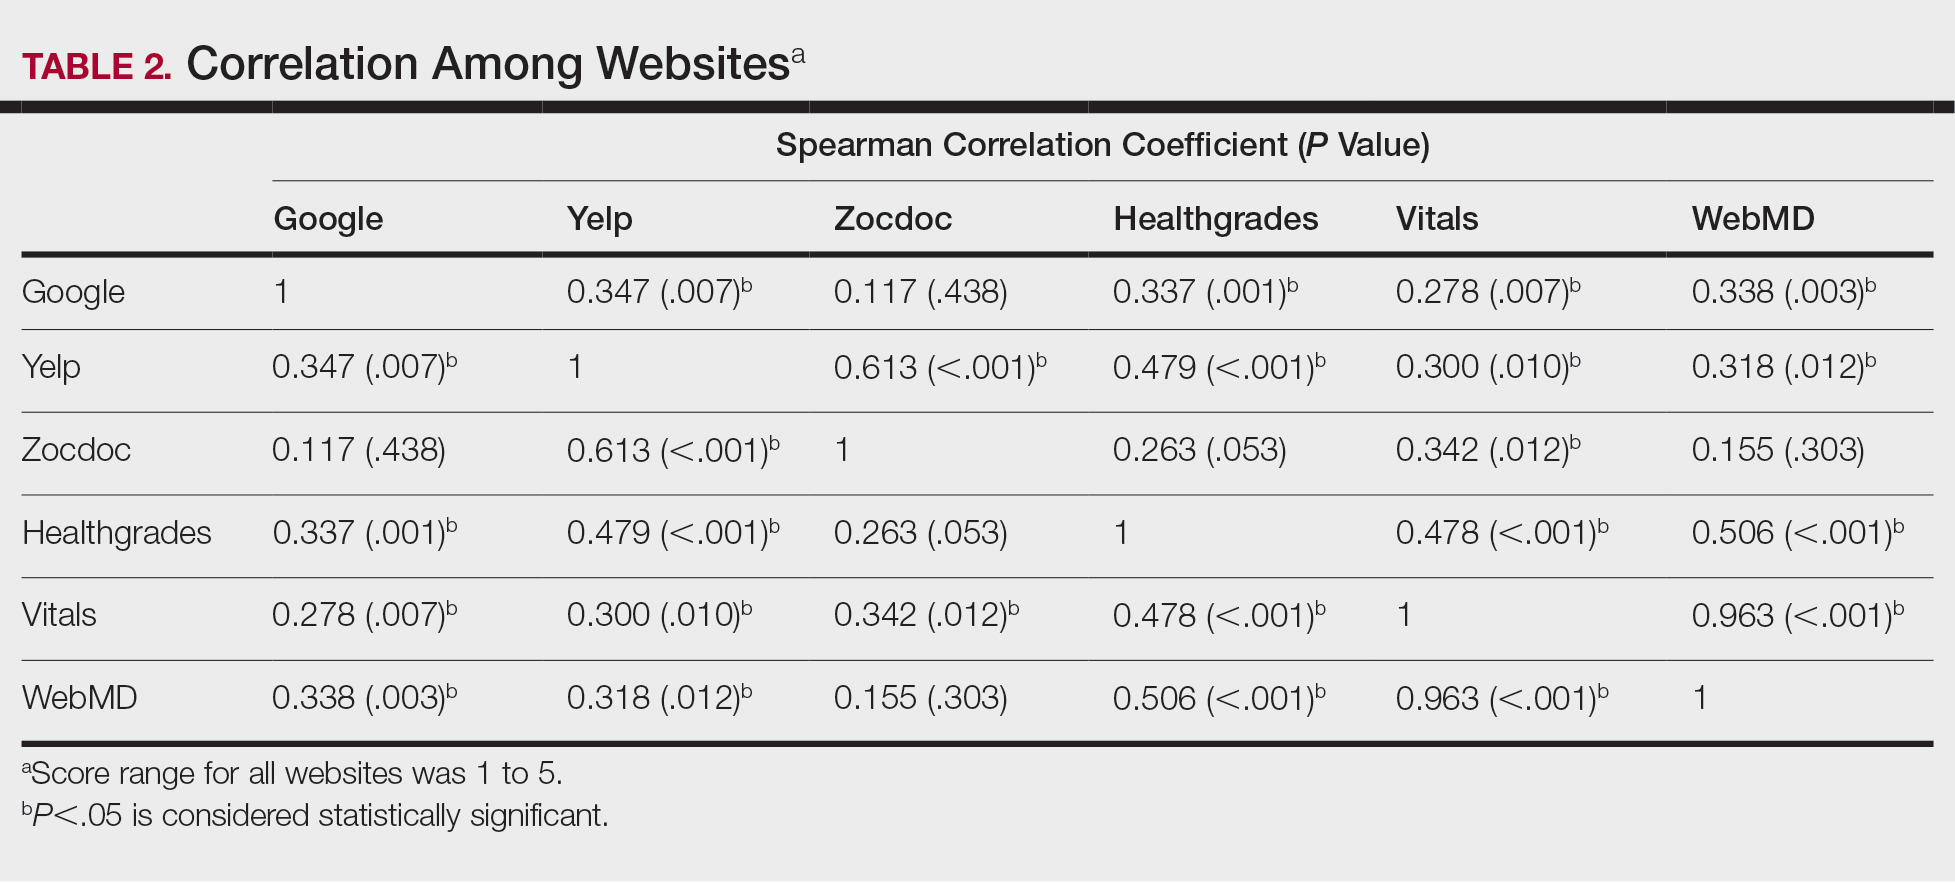
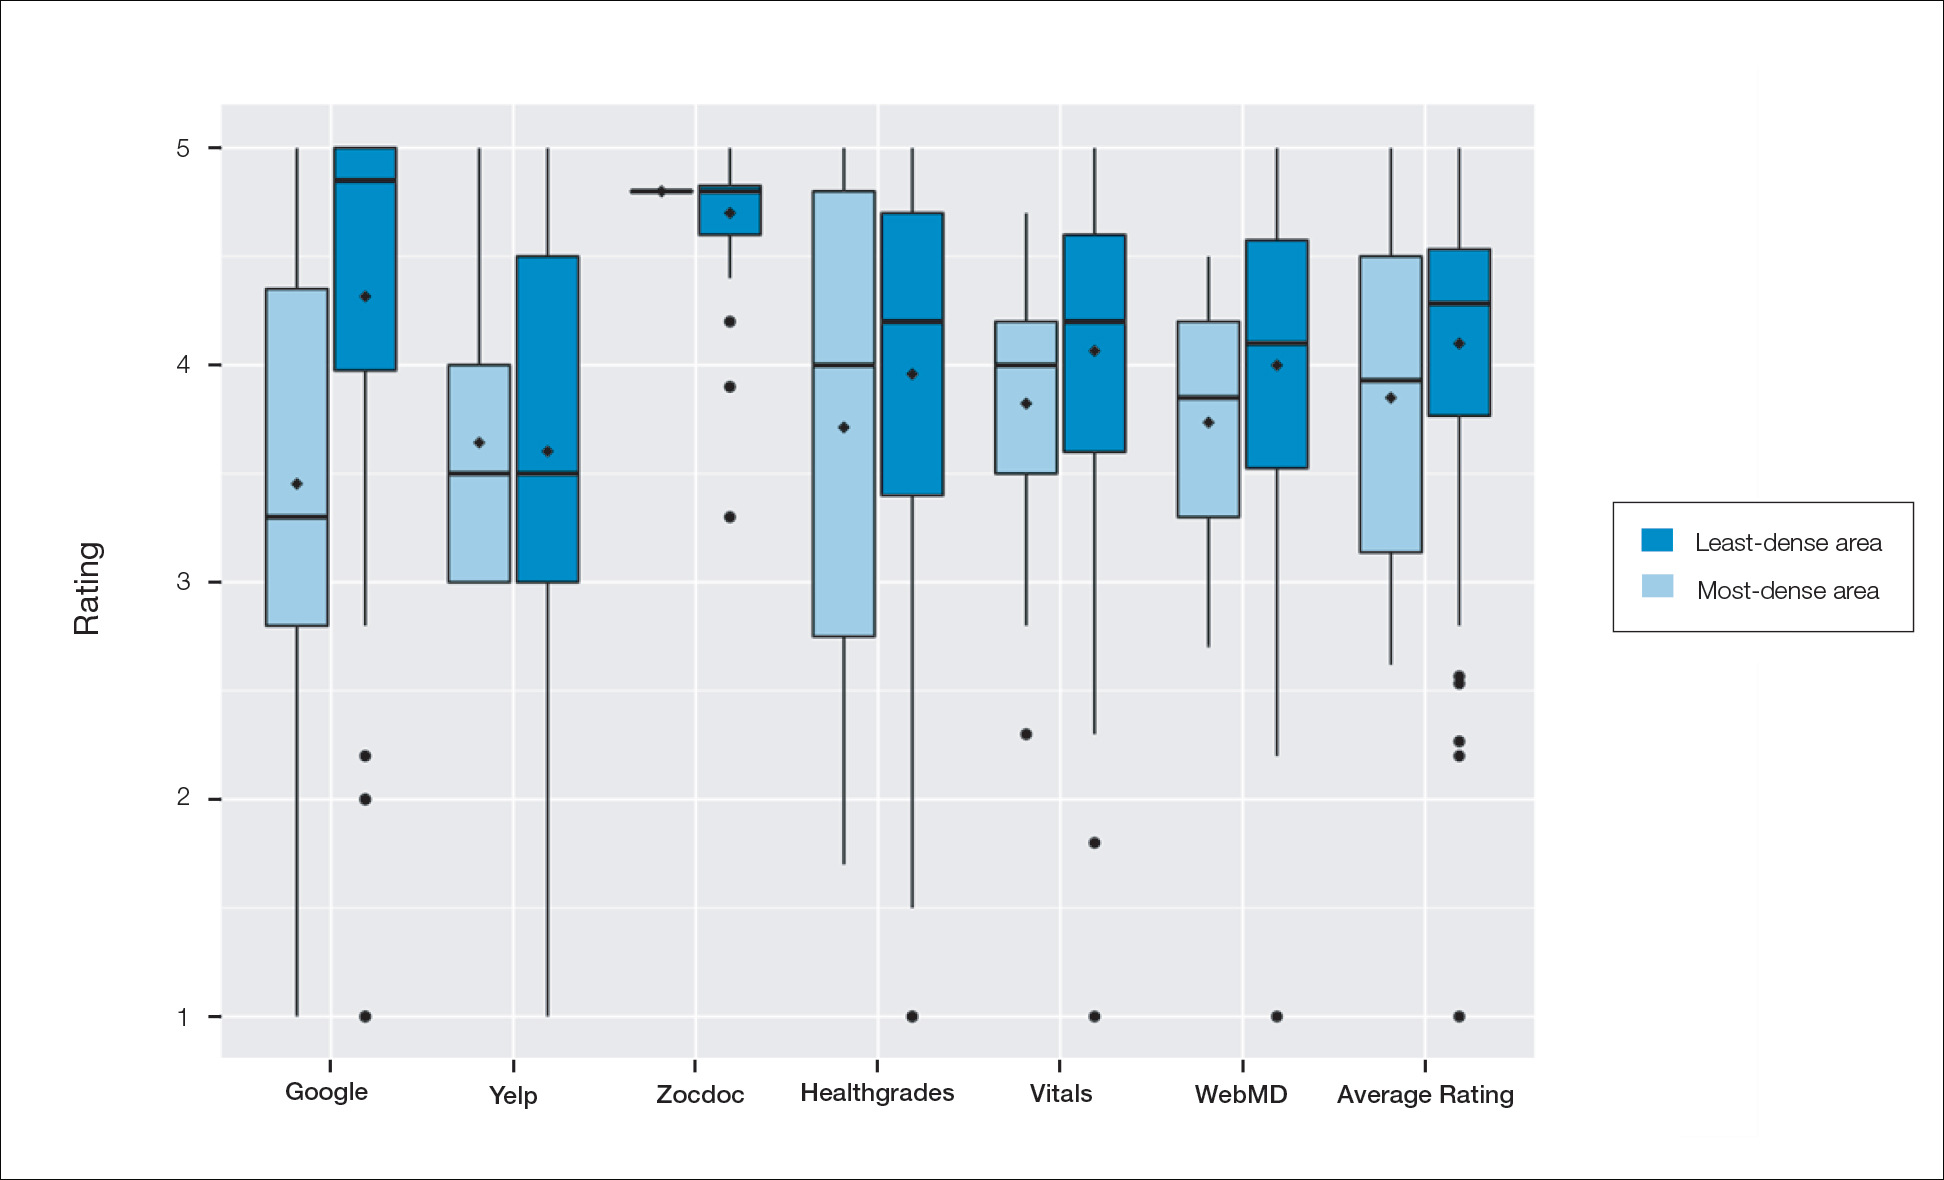
A total of 167 representative physicians were included in this analysis; 141 from the most dense areas, and 26 from the least dense areas. The lowest average ratings for the entire sample and most dermatologist–dense areas were found on Yelp (3.61 and 3.60, respectively), and the lowest ratings in the least dermatologist–dense areas were found on Google (3.45)(Table 1). Correlation coefficient values were lowest for Zocdoc and Healthgrades (0.263) and highest for Vitals and WebMD (0.963)(Table 2). The health care–specific sites were closer to the overall average (4.06) than the general consumer sites (eFigure).
Comment
Although dermatologist ratings on each site had a broad range, we found that patients typically expressed negative interactions on general consumer websites rather than health care–specific websites. When comparing the ratings of the same group of dermatologists across different sites, ratings on health care–specific sites had a higher degree of correlation, with physician ratings more similar between 2 health care–specific sites and less similar between a health care–specific and a general consumer website. This pattern was consistent in both dermatologist-dense and dermatologist-poor areas, despite patients having varying levels of access to dermatologic care and medical resources and potentially different regional preferences of consumer websites. Taken together, these findings imply that health care–specific websites more consistently reflect overall patient sentiment.
Although one 2016 study comparing reviews of dermatology practices on Zocdoc and Yelp also demonstrated lower average ratings on Yelp,3 our study suggests that this trend is not isolated to these 2 sites but can be seen when comparing many health care–specific sites vs general consumer sites.
Our study compared ratings of dermatologists among popular websites to understand those that are most representative of patient attitudes toward physicians. These findings are important because online reviews reflect the entire patient experience, not just the patient-physician interaction, which may explain why physician scores on standardized questionnaires, such as Press Ganey surveys, do not correlate well with their online reviews.4 In a study comparing 98 physicians with negative online ratings to 82 physicians in similar departments with positive ratings, there was no significant difference in scores on patient-physician interaction questions on the Press Ganey survey.5 However, physicians who received negative online reviews scored lower on Press Ganey questions related to nonphysician interactions (eg, office cleanliness, interactions with staff).
The current study was subject to several limitations. Our analysis included all physicians in our random selection without accounting for those physicians with a greater online presence who might be more cognizant of these ratings and try to manipulate them through a reputation-management company or public relations consultant.
Conclusion
Our study suggests that consumer websites are not primarily used by disgruntled patients wishing to express grievances; instead, on average, most physicians received positive reviews. Furthermore, health care–specific websites show a higher degree of concordance than and may more accurately reflect overall patient attitudes toward their physicians than general consumer sites. Reviews from these health care–specific sites may be more helpful than general consumer websites in allowing physicians to understand patient sentiment and improve patient experiences.
- Frost C, Mesfin A. Online reviews of orthopedic surgeons: an emerging trend. Orthopedics. 2015;38:e257-e262. doi:10.3928/01477447-20150402-52
- Waqas B, Cooley V, Lipner SR. Association of sex, location, and experience with online patient ratings of dermatologists. J Am Acad Dermatol. 2020;83:954-955.
- Smith RJ, Lipoff JB. Evaluation of dermatology practice online reviews: lessons from qualitative analysis. JAMA Dermatol. 2016;152:153-157. doi:10.1001/jamadermatol.2015.3950
- Chen J, Presson A, Zhang C, et al. Online physician review websites poorly correlate to a validated metric of patient satisfaction. J Surg Res. 2018;227:1-6.
- Widmer RJ, Maurer MJ, Nayar VR, et al. Online physician reviews do not reflect patient satisfaction survey responses. Mayo Clinic Proc. 2018;93:453-457.
Health care–specific (eg, Healthgrades, Zocdoc, Vitals, WebMD) and general consumer websites (eg, Google, Yelp) are popular platforms for patients to find physicians, schedule appointments, and review physician experiences. Patients find ratings on these websites more trustworthy than standardized surveys distributed by hospitals, but many physicians do not trust the reviews on these sites. For example, in a survey of both physicians (n=828) and patients (n=494), 36% of physicians trusted online reviews compared to 57% of patients.1 The objective of this study was to determine if health care–specific or general consumer websites more accurately reflect overall patient sentiment. This knowledge can help physicians who are seeking to improve the patient experience understand which websites have more accurate and trustworthy reviews.
Methods
A list of dermatologists from the top 10 most and least dermatologist–dense areas in the United States was compiled to examine different physician populations.2 Equal numbers of male and female dermatologists were randomly selected from the most dense areas. All physicians were included from the least dense areas because of limited sample size. Ratings were collected from websites most likely to appear on the first page of a Google search for a physician name, as these are most likely to be seen by patients. Descriptive statistics were generated to describe the study population; mean and median physician rating (using a scale of 1–5); SD; and minimum, maximum, and interquartile ranges. Spearman correlation coefficients were generated to examine the strength of association between ratings from website pairs. P<.05 was considered statistically significant, with analyses performed in R (3.6.2) for Windows (the R Foundation).
Results
A total of 167 representative physicians were included in this analysis; 141 from the most dense areas, and 26 from the least dense areas. The lowest average ratings for the entire sample and most dermatologist–dense areas were found on Yelp (3.61 and 3.60, respectively), and the lowest ratings in the least dermatologist–dense areas were found on Google (3.45)(Table 1). Correlation coefficient values were lowest for Zocdoc and Healthgrades (0.263) and highest for Vitals and WebMD (0.963)(Table 2). The health care–specific sites were closer to the overall average (4.06) than the general consumer sites (eFigure).
Comment
Although dermatologist ratings on each site had a broad range, we found that patients typically expressed negative interactions on general consumer websites rather than health care–specific websites. When comparing the ratings of the same group of dermatologists across different sites, ratings on health care–specific sites had a higher degree of correlation, with physician ratings more similar between 2 health care–specific sites and less similar between a health care–specific and a general consumer website. This pattern was consistent in both dermatologist-dense and dermatologist-poor areas, despite patients having varying levels of access to dermatologic care and medical resources and potentially different regional preferences of consumer websites. Taken together, these findings imply that health care–specific websites more consistently reflect overall patient sentiment.
Although one 2016 study comparing reviews of dermatology practices on Zocdoc and Yelp also demonstrated lower average ratings on Yelp,3 our study suggests that this trend is not isolated to these 2 sites but can be seen when comparing many health care–specific sites vs general consumer sites.
Our study compared ratings of dermatologists among popular websites to understand those that are most representative of patient attitudes toward physicians. These findings are important because online reviews reflect the entire patient experience, not just the patient-physician interaction, which may explain why physician scores on standardized questionnaires, such as Press Ganey surveys, do not correlate well with their online reviews.4 In a study comparing 98 physicians with negative online ratings to 82 physicians in similar departments with positive ratings, there was no significant difference in scores on patient-physician interaction questions on the Press Ganey survey.5 However, physicians who received negative online reviews scored lower on Press Ganey questions related to nonphysician interactions (eg, office cleanliness, interactions with staff).
The current study was subject to several limitations. Our analysis included all physicians in our random selection without accounting for those physicians with a greater online presence who might be more cognizant of these ratings and try to manipulate them through a reputation-management company or public relations consultant.
Conclusion
Our study suggests that consumer websites are not primarily used by disgruntled patients wishing to express grievances; instead, on average, most physicians received positive reviews. Furthermore, health care–specific websites show a higher degree of concordance than and may more accurately reflect overall patient attitudes toward their physicians than general consumer sites. Reviews from these health care–specific sites may be more helpful than general consumer websites in allowing physicians to understand patient sentiment and improve patient experiences.
- Frost C, Mesfin A. Online reviews of orthopedic surgeons: an emerging trend. Orthopedics. 2015;38:e257-e262. doi:10.3928/01477447-20150402-52
- Waqas B, Cooley V, Lipner SR. Association of sex, location, and experience with online patient ratings of dermatologists. J Am Acad Dermatol. 2020;83:954-955.
- Smith RJ, Lipoff JB. Evaluation of dermatology practice online reviews: lessons from qualitative analysis. JAMA Dermatol. 2016;152:153-157. doi:10.1001/jamadermatol.2015.3950
- Chen J, Presson A, Zhang C, et al. Online physician review websites poorly correlate to a validated metric of patient satisfaction. J Surg Res. 2018;227:1-6.
- Widmer RJ, Maurer MJ, Nayar VR, et al. Online physician reviews do not reflect patient satisfaction survey responses. Mayo Clinic Proc. 2018;93:453-457.
Practice Points
- Online physician-rating websites are commonly used by patients to find physicians and review experiences.
- Health care–specific sites may more accurately reflect patient sentiment than general consumer sites.
- Dermatologists can use health care–specific sites to understand patient sentiment and learn how to improve patient experiences.
An Analysis of the Involvement and Attitudes of Resident Physicians in Reporting Errors in Patient Care
From Adelante Healthcare, Mesa, AZ (Dr. Chin), University Hospitals of Cleveland, Cleveland, OH (Drs. Delozier, Bascug, Levine, Bejanishvili, and Wynbrandt and Janet C. Peachey, Rachel M. Cerminara, and Sharon M. Darkovich), and Houston Methodist Hospitals, Houston, TX (Dr. Bhakta).
Abstract
Background: Resident physicians play an active role in the reporting of errors that occur in patient care. Previous studies indicate that residents significantly underreport errors in patient care.
Methods: Fifty-four of 80 eligible residents enrolled at University Hospitals–Regional Hospitals (UH-RH) during the 2018-2019 academic year completed a survey assessing their knowledge and experience in completing Patient Advocacy and Shared Stories (PASS) reports, which serve as incident reports in the UH health system in reporting errors in patient care. A series of interventions aimed at educating residents about the PASS report system were then conducted. The 54 residents who completed the first survey received it again 4 months later.
Results: Residents demonstrated greater understanding of when filing PASS reports was appropriate after the intervention, as significantly more residents reported having been involved in a situation where they should have filed a PASS report but did not (P = 0.036).
Conclusion: In this study, residents often did not report errors in patient care because they simply did not know the process for doing so. In addition, many residents often felt that the reporting of patient errors could be used as a form of retaliation.
Keywords: resident physicians; quality improvement; high-value care; medical errors; patient safety.
Resident physicians play a critical role in patient care. Residents undergo extensive supervised training in order to one day be able to practice medicine in an unsupervised setting, with the goal of providing the highest quality of care possible. One study reported that primary care provided by residents in a training program is of similar or higher quality than that provided by attending physicians.1
Besides providing high-quality care, it is important that residents play an active role in the reporting of errors that occur regarding patient care as well as in identifying events that may compromise patient safety and quality.2 In fact, increased reporting of patient errors has been shown to decrease liability-related costs for hospitals.3 Unfortunately, physicians, and residents in particular, have historically been poor reporters of errors in patient care.4 This is especially true when comparing physicians to other health professionals, such as nurses, in error reporting.5
Several studies have examined the involvement of residents in reporting errors in patient care. One recent study showed that a graduate medical education financial incentive program significantly increased the number of patient safety events reported by residents and fellows.6 This study, along with several others, supports the concept of using incentives to help improve the reporting of errors in patient care for physicians in training.7-10 Another study used Quality Improvement Knowledge Assessment Tool (QIKAT) scores to assess quality improvement (QI) knowledge. The study demonstrated that self-assessment scores of QI skills using QIKAT scores improved following a targeted intervention.11 Because further information on the involvement and attitudes of residents in reporting errors in patient care is needed, University Hospitals of Cleveland (UH) designed and implemented a QI study during the 2018-2019 academic year. This prospective study used anonymous surveys to objectively examine the involvement and attitudes of residents in reporting errors in patient care.
Methods
The UH health system uses Patient Advocacy and Shared Stories (PASS) reports as incident reports to not only disclose errors in patient care but also to identify any events that may compromise patient safety and quality. Based on preliminary review, nurses, ancillary staff, and administrators file the majority of PASS reports.
The study group consisted of residents at University Hospitals–Regional Hospitals (UH-RH), which is comprised of 2 hospitals: University Hospitals–Richmond Medical Center (UH-RMC) and University Hospitals –Bedford Medical Center (UH-BMC). UH-RMC and UH-BMC are 2 medium-sized university-affiliated community hospitals located in the Cleveland metropolitan area in Northeast Ohio. Both serve as clinical training sites for Case Western Reserve University School of Medicine and Lake Erie College of Osteopathic Medicine, the latter of which helped fund this study. The study was submitted to the Institutional Review Board (IRB) of University Hospitals of Cleveland and granted “not human subjects research” status as a QI study.
Surveys
UH-RH offers residency programs in dermatology, emergency medicine, family medicine, internal medicine, orthopedic surgery, and physical medicine and rehabilitation, along with a 1-year transitional/preliminary year. A total of 80 residents enrolled at UH-RH during the 2018-2019 academic year. All 80 residents at UH-RH received an email in December 2018 asking them to complete an anonymous survey regarding the PASS report system. The survey was administered using the REDCap software system and consisted of 15 multiple-choice questions. As an incentive for completing the survey, residents were offered a $10 Amazon gift card. The gift cards were funded through a research grant from Lake Erie College of Osteopathic Medicine. Residents were given 1 week to complete the survey. At the end of the week, 54 of 80 residents completed the first survey.
Following the first survey, efforts were undertaken by the study authors, in conjunction with the quality improvement department at UH-RH, to educate residents about the PASS report system. These interventions included giving a lecture on the PASS report system during resident didactic sessions, sending an email to all residents about the PASS report system, and providing residents an opportunity to complete an optional online training course regarding the PASS report system. As an incentive for completing the online training course, residents were offered a $10 Amazon gift card. As before, the gift cards were funded through a research grant from Lake Erie College of Osteopathic Medicine.
A second survey was administered in April 2019, 4 months after the first survey. To determine whether the intervention made an impact on the involvement and attitudes of residents in the reporting errors in patient care, only residents who completed the first survey were sent the second survey. The second survey consisted of the same questions as the first survey and was also administered using the REDCap software system. As an incentive for completing the survey, residents were offered another $10 Amazon gift card, again were funded through a research grant from Lake Erie College of Osteopathic Medicine. Residents were given 1 week to complete the survey.
Analysis
Chi-square analyses were utilized to examine differences between preintervention and postintervention responses across categories. All analyses were conducted using R statistical software, version 3.6.1 (R Foundation for Statistical Computing).
Results
A total of 54 of 80 eligible residents responded to the first survey (Table). Twenty-nine of 54 eligible residents responded to the second survey. Postintervention, significantly more residents indicated being involved in a situation where they should have filed a PASS report but did not (58.6% vs 53.7%; P = 0.036). Improvement was seen in PASS knowledge postintervention, where fewer residents reported not knowing how to file a PASS report (31.5% vs 55.2%; P = 0.059). No other improvements were significant, nor were there significant differences in responses between any other categories pre- and postintervention.

Discussion
Errors in patient care are a common occurrence in the hospital setting. Reporting errors when they happen is important for hospitals to gain data and better care for patients, but studies show that patient errors are usually underreported. This is concerning, as data on errors and other aspects of patient care are needed to inform quality improvement programs.
This study measured residents’ attitudes and knowledge regarding the filing of a PASS report. It also aimed to increase both the frequency of and knowledge about filing a PASS report with interventions. The results from each survey indicated a statistically significant increase in knowledge of when to file a PASS report. In the first survey, 53.7% of residents responded they they were involved in an instance where they should have filed a PASS report but did not. In the second survey, 58.5% of residents reported being involved in an instance where they should have filed a PASS report but did not. This difference was statistically significant (P = 0.036), sugesting that the intervention was successful at increasing residents’ knowledge regarding PASS reports and the appropriate times to file a PASS report.
The survey results also showed a trend toward increasing aggregate knowledge level of how to file PASS reports on the first survey and second surveys (from 31.5% vs 55.2%. This demonstrates an increase in knowledge of how to file a PASS report among residents at our hospital after the intervention. It should be noted that the intervention that was performed in this study was simple, easy to perform, and can be completed at any hospital system that uses a similar system for reporting patient errors.
Another important trend indicating the effectiveness of the intervention was a 15% increase in knowledge of what the PASS report acronym stands for, along with a 13.1% aggregate increase in the number of residents who filed a PASS report. This indicated that residents may have wanted to file a PASS report previously but simply did not know how to until the intervention. In addition, there was also a decrease in the aggregate percentages of residents who had never filed a PASS report and an increase in how many PASS reports were filed.
While PASS reports are a great way for hospitals to gain data and insight into problems at their sites, there was also a negative view of PASS reports. For example, a large percentage of residents indicated that filing a PASS report would not make any difference and that PASS reports are often used as a form of retaliation, either against themselves as the submitter or the person(s) mentioned in the PASS report. More specifically, more than 50% of residents felt that PASS reports were sometimes or often used as a form of retaliation against others. While many residents correctly identified in the survey that PASS reports are not equivalent to a “write-up,” it is concerning that they still feel there is a strong potential for retaliation when filing a PASS report. This finding is unfortunate but matches the results of a multicenter study that found that 44.6% of residents felt uncomfortable reporting patient errors, possibly secondary to fear of retaliation, along with issues with the reporting system.12
It is interesting to note that a minority of residents indicated that they feel that PASS reports are filed as often as they should be (25.9% on first survey and 24.1% on second survey). This is concerning, as the data gathered through PASS reports is used to improve patient care. However, the percentage reported in our study, although low, is higher than that reported in a similar study involving patients with Medicare insurance, which showed that only 14% of patient safety events were reported.13 These results demonstrate that further interventions are necessary in order to ensure that a PASS report is filed each time a patient safety event occurs.
Another finding of note is that the majority of residents also feel that the process of filing a PASS report is too time consuming. The majority of residents who have completed a PASS report stated that it took them between 10 and 20 minutes to complete a PASS report, but those same individuals also feel that it should take < 10 minutes to complete a PASS report. This is an important issue for hospital systems to address. Reducing the time it takes to file a PASS report may facilitate an increase in the amount of PASS reports filed.
We administered our surveys using email outreach to residents asking them to complete an anonymous online survey regarding the PASS report system using the REDCap software system. Researchers have various ways of administering surveys, ranging from paper surveys, emails, and even mobile apps. One study showed that online surveys tend to have higher response rates compared to non-online surveys, such as paper surveys and telephone surveys, which is likely due to the ease of use of online surveys.14 At the same time, unsolicited email surveys have been shown to have a negative influence on response rates. Mobile apps are a new way of administering surveys. However, research has not found any significant difference in the time required to complete the survey using mobile apps compared to other forms of administering surveys. In addition, surveys using mobile apps did not have increased response rates compared to other forms of administering surveys.15
To increase the response rate of our surveys, we offered gift cards to the study population for completing the survey. Studies have shown that surveys that offer incentives tend to have higher response rates than surveys that do not.16 Also, in addition to serving as a method for gathering data from our study population, we used our surveys as an intervention to increase awareness of PASS reporting, as reported in other studies. For example, another study used the HABITS questionnaire to not only gather information about children’s diet, but also to promote behavioral change towards healthy eating habits.17
This study had several limitations. First, the study was conducted using an anonymous online survey, which means we could not clarify questions that residents found confusing or needed further explanation. For example, 17 residents indicated in the first survey that they knew how to PASS report, but 19 residents indicated in the same survey that they have filed a PASS report in the past.
A second limitation of the study was that fewer residents completed the second survey (29 of 54 eligible residents) compared to the first survey (54 of 80 eligible residents). This may have impacted the results of the analysis, as certain findings were not statistically significant, despite trends in the data.
A third limitation of the study is that not all of the residents that completed the first and second surveys completed the entire intervention. For example, some residents did not attend the didactic lecture discussing PASS reports, and as such may not have received the appropriate training prior to completing the second survey.
The findings from this study can be used by the residency programs at UH-RH and by residency programs across the country to improve the involvement and attitudes of residents in reporting errors in patient care. Hospital staff need to be encouraged and educated on how to better report patient errors and the importance of reporting these errors. It would benefit hospital systems to provide continued and targeted training to familiarize physicians with the process of reporting patient errors, and take steps to reduce the time it takes to report patient errors. By increasing the reporting of errors, hospitals will be able to improve patient care through initiatives aimed at preventing errors.
Conclusion
Residents play an important role in providing high-quality care for patients. Part of providing high-quality care is the reporting of errors in patient care when they occur. Physicians, and in particular, residents, have historically underreported errors in patient care. Part of this underreporting results from residents not knowing or understanding the process of filing a report and feeling that the reports could be used as a form of retaliation. For hospital systems to continue to improve patient care, it is important for residents to not only know how to report errors in patient care but to feel comfortable doing so.
Corresponding author: Andrew J. Chin, DO, MS, MPH, Department of Internal Medicine, Adelante Healthcare, 1705 W Main St, Mesa, AZ 85201; anchin@adelantehealthcare.com.
Financial disclosures: None.
Funding: This study was funded by a research grant provided by Lake Eric College of Osteopathic Medicine to Andrew J. Chin and Anish Bhakta.
1. Zallman L, Ma J, Xiao L, Lasser KE. Quality of US primary care delivered by resident and staff physicians. J Gen Intern Med. 2010;25(11):1193-1197.
2. Bagain JP. The future of graduate medical education: a systems-based approach to ensure patient safety. Acad Med. 2015;90(9):1199-1202.
3. Kachalia A, Kaufman SR, Boothman R, et al. Liability claims and costs before and after implementation of a medical disclosure program. Ann Intern Med. 2010;153(4):213-221.
4. Kaldjian LC, Jones EW, Wu BJ, et al. Reporting medical errors to improve patient safety: a survey of physicians in teaching hospitals. Arch Intern Med. 2008;168(1):40-46.
5. Rowin EJ, Lucier D, Pauker SG, et al. Does error and adverse event reporting by physicians and nurses differ? Jt Comm J Qual Patient Saf. 2008;34(9):537-545.
6. Turner DA, Bae J, Cheely G, et al. Improving resident and fellow engagement in patient safety through a graduate medical education incentive program. J Grad Med Educ. 2018;10(6):671-675.
7. Macht R, Balen A, McAneny D, Hess D. A multifaceted intervention to increase surgery resident engagement in reporting adverse events. J Surg Educ. 2015;72(6):e117-e122.
8. Scott DR, Weimer M, English C, et al. A novel approach to increase residents’ involvement in reporting adverse events. Acad Med. 2011;86(6):742-746.
9. Stewart DA, Junn J, Adams MA, et al. House staff participation in patient safety reporting: identification of predominant barriers and implementation of a pilot program. South Med J. 2016;109(7):395-400.
10. Vidyarthi AR, Green AL, Rosenbluth G, Baron RB. Engaging residents and fellows to improve institution-wide quality: the first six years of a novel financial incentive program. Acad Med. 2014;89(3):460-468.
11. Fok MC, Wong RY. Impact of a competency based curriculum on quality improvement among internal medicine residents. BMC Med Educ. 2014;14:252.
12. Wijesekera TP, Sanders L, Windish DM. Education and reporting of diagnostic errors among physicians in internal medicine training programs. JAMA Intern Med. 2018;178(11):1548-1549.
13. Levinson DR. Hospital incident reporting systems do not capture most patient harm. Washington, D.C.: U.S. Department of Health and Human Services Office of the Inspector General. January 2012. Report No. OEI-06-09-00091.
14. Evans JR, Mathur A. The value of online surveys. Internet Research. 2005;15(2):192-219.
15. Marcano Belisario JS, Jamsek J, Huckvale K, et al. Comparison of self‐administered survey questionnaire responses collected using mobile apps versus other methods. Cochrane Database of Syst Rev. 2015;7:MR000042.
16. Manfreda KL, Batagelj Z, Vehovar V. Design of web survey questionnaires: three basic experiments. J Comput Mediat Commun. 2002;7(3):JCMC731.
17. Wright ND, Groisman‐Perelstein AE, Wylie‐Rosett J, et al. A lifestyle assessment and intervention tool for pediatric weight management: the HABITS questionnaire. J Hum Nutr Diet. 2011;24(1):96-100.
From Adelante Healthcare, Mesa, AZ (Dr. Chin), University Hospitals of Cleveland, Cleveland, OH (Drs. Delozier, Bascug, Levine, Bejanishvili, and Wynbrandt and Janet C. Peachey, Rachel M. Cerminara, and Sharon M. Darkovich), and Houston Methodist Hospitals, Houston, TX (Dr. Bhakta).
Abstract
Background: Resident physicians play an active role in the reporting of errors that occur in patient care. Previous studies indicate that residents significantly underreport errors in patient care.
Methods: Fifty-four of 80 eligible residents enrolled at University Hospitals–Regional Hospitals (UH-RH) during the 2018-2019 academic year completed a survey assessing their knowledge and experience in completing Patient Advocacy and Shared Stories (PASS) reports, which serve as incident reports in the UH health system in reporting errors in patient care. A series of interventions aimed at educating residents about the PASS report system were then conducted. The 54 residents who completed the first survey received it again 4 months later.
Results: Residents demonstrated greater understanding of when filing PASS reports was appropriate after the intervention, as significantly more residents reported having been involved in a situation where they should have filed a PASS report but did not (P = 0.036).
Conclusion: In this study, residents often did not report errors in patient care because they simply did not know the process for doing so. In addition, many residents often felt that the reporting of patient errors could be used as a form of retaliation.
Keywords: resident physicians; quality improvement; high-value care; medical errors; patient safety.
Resident physicians play a critical role in patient care. Residents undergo extensive supervised training in order to one day be able to practice medicine in an unsupervised setting, with the goal of providing the highest quality of care possible. One study reported that primary care provided by residents in a training program is of similar or higher quality than that provided by attending physicians.1
Besides providing high-quality care, it is important that residents play an active role in the reporting of errors that occur regarding patient care as well as in identifying events that may compromise patient safety and quality.2 In fact, increased reporting of patient errors has been shown to decrease liability-related costs for hospitals.3 Unfortunately, physicians, and residents in particular, have historically been poor reporters of errors in patient care.4 This is especially true when comparing physicians to other health professionals, such as nurses, in error reporting.5
Several studies have examined the involvement of residents in reporting errors in patient care. One recent study showed that a graduate medical education financial incentive program significantly increased the number of patient safety events reported by residents and fellows.6 This study, along with several others, supports the concept of using incentives to help improve the reporting of errors in patient care for physicians in training.7-10 Another study used Quality Improvement Knowledge Assessment Tool (QIKAT) scores to assess quality improvement (QI) knowledge. The study demonstrated that self-assessment scores of QI skills using QIKAT scores improved following a targeted intervention.11 Because further information on the involvement and attitudes of residents in reporting errors in patient care is needed, University Hospitals of Cleveland (UH) designed and implemented a QI study during the 2018-2019 academic year. This prospective study used anonymous surveys to objectively examine the involvement and attitudes of residents in reporting errors in patient care.
Methods
The UH health system uses Patient Advocacy and Shared Stories (PASS) reports as incident reports to not only disclose errors in patient care but also to identify any events that may compromise patient safety and quality. Based on preliminary review, nurses, ancillary staff, and administrators file the majority of PASS reports.
The study group consisted of residents at University Hospitals–Regional Hospitals (UH-RH), which is comprised of 2 hospitals: University Hospitals–Richmond Medical Center (UH-RMC) and University Hospitals –Bedford Medical Center (UH-BMC). UH-RMC and UH-BMC are 2 medium-sized university-affiliated community hospitals located in the Cleveland metropolitan area in Northeast Ohio. Both serve as clinical training sites for Case Western Reserve University School of Medicine and Lake Erie College of Osteopathic Medicine, the latter of which helped fund this study. The study was submitted to the Institutional Review Board (IRB) of University Hospitals of Cleveland and granted “not human subjects research” status as a QI study.
Surveys
UH-RH offers residency programs in dermatology, emergency medicine, family medicine, internal medicine, orthopedic surgery, and physical medicine and rehabilitation, along with a 1-year transitional/preliminary year. A total of 80 residents enrolled at UH-RH during the 2018-2019 academic year. All 80 residents at UH-RH received an email in December 2018 asking them to complete an anonymous survey regarding the PASS report system. The survey was administered using the REDCap software system and consisted of 15 multiple-choice questions. As an incentive for completing the survey, residents were offered a $10 Amazon gift card. The gift cards were funded through a research grant from Lake Erie College of Osteopathic Medicine. Residents were given 1 week to complete the survey. At the end of the week, 54 of 80 residents completed the first survey.
Following the first survey, efforts were undertaken by the study authors, in conjunction with the quality improvement department at UH-RH, to educate residents about the PASS report system. These interventions included giving a lecture on the PASS report system during resident didactic sessions, sending an email to all residents about the PASS report system, and providing residents an opportunity to complete an optional online training course regarding the PASS report system. As an incentive for completing the online training course, residents were offered a $10 Amazon gift card. As before, the gift cards were funded through a research grant from Lake Erie College of Osteopathic Medicine.
A second survey was administered in April 2019, 4 months after the first survey. To determine whether the intervention made an impact on the involvement and attitudes of residents in the reporting errors in patient care, only residents who completed the first survey were sent the second survey. The second survey consisted of the same questions as the first survey and was also administered using the REDCap software system. As an incentive for completing the survey, residents were offered another $10 Amazon gift card, again were funded through a research grant from Lake Erie College of Osteopathic Medicine. Residents were given 1 week to complete the survey.
Analysis
Chi-square analyses were utilized to examine differences between preintervention and postintervention responses across categories. All analyses were conducted using R statistical software, version 3.6.1 (R Foundation for Statistical Computing).
Results
A total of 54 of 80 eligible residents responded to the first survey (Table). Twenty-nine of 54 eligible residents responded to the second survey. Postintervention, significantly more residents indicated being involved in a situation where they should have filed a PASS report but did not (58.6% vs 53.7%; P = 0.036). Improvement was seen in PASS knowledge postintervention, where fewer residents reported not knowing how to file a PASS report (31.5% vs 55.2%; P = 0.059). No other improvements were significant, nor were there significant differences in responses between any other categories pre- and postintervention.
Discussion
Errors in patient care are a common occurrence in the hospital setting. Reporting errors when they happen is important for hospitals to gain data and better care for patients, but studies show that patient errors are usually underreported. This is concerning, as data on errors and other aspects of patient care are needed to inform quality improvement programs.
This study measured residents’ attitudes and knowledge regarding the filing of a PASS report. It also aimed to increase both the frequency of and knowledge about filing a PASS report with interventions. The results from each survey indicated a statistically significant increase in knowledge of when to file a PASS report. In the first survey, 53.7% of residents responded they they were involved in an instance where they should have filed a PASS report but did not. In the second survey, 58.5% of residents reported being involved in an instance where they should have filed a PASS report but did not. This difference was statistically significant (P = 0.036), sugesting that the intervention was successful at increasing residents’ knowledge regarding PASS reports and the appropriate times to file a PASS report.
The survey results also showed a trend toward increasing aggregate knowledge level of how to file PASS reports on the first survey and second surveys (from 31.5% vs 55.2%. This demonstrates an increase in knowledge of how to file a PASS report among residents at our hospital after the intervention. It should be noted that the intervention that was performed in this study was simple, easy to perform, and can be completed at any hospital system that uses a similar system for reporting patient errors.
Another important trend indicating the effectiveness of the intervention was a 15% increase in knowledge of what the PASS report acronym stands for, along with a 13.1% aggregate increase in the number of residents who filed a PASS report. This indicated that residents may have wanted to file a PASS report previously but simply did not know how to until the intervention. In addition, there was also a decrease in the aggregate percentages of residents who had never filed a PASS report and an increase in how many PASS reports were filed.
While PASS reports are a great way for hospitals to gain data and insight into problems at their sites, there was also a negative view of PASS reports. For example, a large percentage of residents indicated that filing a PASS report would not make any difference and that PASS reports are often used as a form of retaliation, either against themselves as the submitter or the person(s) mentioned in the PASS report. More specifically, more than 50% of residents felt that PASS reports were sometimes or often used as a form of retaliation against others. While many residents correctly identified in the survey that PASS reports are not equivalent to a “write-up,” it is concerning that they still feel there is a strong potential for retaliation when filing a PASS report. This finding is unfortunate but matches the results of a multicenter study that found that 44.6% of residents felt uncomfortable reporting patient errors, possibly secondary to fear of retaliation, along with issues with the reporting system.12
It is interesting to note that a minority of residents indicated that they feel that PASS reports are filed as often as they should be (25.9% on first survey and 24.1% on second survey). This is concerning, as the data gathered through PASS reports is used to improve patient care. However, the percentage reported in our study, although low, is higher than that reported in a similar study involving patients with Medicare insurance, which showed that only 14% of patient safety events were reported.13 These results demonstrate that further interventions are necessary in order to ensure that a PASS report is filed each time a patient safety event occurs.
Another finding of note is that the majority of residents also feel that the process of filing a PASS report is too time consuming. The majority of residents who have completed a PASS report stated that it took them between 10 and 20 minutes to complete a PASS report, but those same individuals also feel that it should take < 10 minutes to complete a PASS report. This is an important issue for hospital systems to address. Reducing the time it takes to file a PASS report may facilitate an increase in the amount of PASS reports filed.
We administered our surveys using email outreach to residents asking them to complete an anonymous online survey regarding the PASS report system using the REDCap software system. Researchers have various ways of administering surveys, ranging from paper surveys, emails, and even mobile apps. One study showed that online surveys tend to have higher response rates compared to non-online surveys, such as paper surveys and telephone surveys, which is likely due to the ease of use of online surveys.14 At the same time, unsolicited email surveys have been shown to have a negative influence on response rates. Mobile apps are a new way of administering surveys. However, research has not found any significant difference in the time required to complete the survey using mobile apps compared to other forms of administering surveys. In addition, surveys using mobile apps did not have increased response rates compared to other forms of administering surveys.15
To increase the response rate of our surveys, we offered gift cards to the study population for completing the survey. Studies have shown that surveys that offer incentives tend to have higher response rates than surveys that do not.16 Also, in addition to serving as a method for gathering data from our study population, we used our surveys as an intervention to increase awareness of PASS reporting, as reported in other studies. For example, another study used the HABITS questionnaire to not only gather information about children’s diet, but also to promote behavioral change towards healthy eating habits.17
This study had several limitations. First, the study was conducted using an anonymous online survey, which means we could not clarify questions that residents found confusing or needed further explanation. For example, 17 residents indicated in the first survey that they knew how to PASS report, but 19 residents indicated in the same survey that they have filed a PASS report in the past.
A second limitation of the study was that fewer residents completed the second survey (29 of 54 eligible residents) compared to the first survey (54 of 80 eligible residents). This may have impacted the results of the analysis, as certain findings were not statistically significant, despite trends in the data.
A third limitation of the study is that not all of the residents that completed the first and second surveys completed the entire intervention. For example, some residents did not attend the didactic lecture discussing PASS reports, and as such may not have received the appropriate training prior to completing the second survey.
The findings from this study can be used by the residency programs at UH-RH and by residency programs across the country to improve the involvement and attitudes of residents in reporting errors in patient care. Hospital staff need to be encouraged and educated on how to better report patient errors and the importance of reporting these errors. It would benefit hospital systems to provide continued and targeted training to familiarize physicians with the process of reporting patient errors, and take steps to reduce the time it takes to report patient errors. By increasing the reporting of errors, hospitals will be able to improve patient care through initiatives aimed at preventing errors.
Conclusion
Residents play an important role in providing high-quality care for patients. Part of providing high-quality care is the reporting of errors in patient care when they occur. Physicians, and in particular, residents, have historically underreported errors in patient care. Part of this underreporting results from residents not knowing or understanding the process of filing a report and feeling that the reports could be used as a form of retaliation. For hospital systems to continue to improve patient care, it is important for residents to not only know how to report errors in patient care but to feel comfortable doing so.
Corresponding author: Andrew J. Chin, DO, MS, MPH, Department of Internal Medicine, Adelante Healthcare, 1705 W Main St, Mesa, AZ 85201; anchin@adelantehealthcare.com.
Financial disclosures: None.
Funding: This study was funded by a research grant provided by Lake Eric College of Osteopathic Medicine to Andrew J. Chin and Anish Bhakta.
1. Zallman L, Ma J, Xiao L, Lasser KE. Quality of US primary care delivered by resident and staff physicians. J Gen Intern Med. 2010;25(11):1193-1197.
2. Bagain JP. The future of graduate medical education: a systems-based approach to ensure patient safety. Acad Med. 2015;90(9):1199-1202.
3. Kachalia A, Kaufman SR, Boothman R, et al. Liability claims and costs before and after implementation of a medical disclosure program. Ann Intern Med. 2010;153(4):213-221.
4. Kaldjian LC, Jones EW, Wu BJ, et al. Reporting medical errors to improve patient safety: a survey of physicians in teaching hospitals. Arch Intern Med. 2008;168(1):40-46.
5. Rowin EJ, Lucier D, Pauker SG, et al. Does error and adverse event reporting by physicians and nurses differ? Jt Comm J Qual Patient Saf. 2008;34(9):537-545.
6. Turner DA, Bae J, Cheely G, et al. Improving resident and fellow engagement in patient safety through a graduate medical education incentive program. J Grad Med Educ. 2018;10(6):671-675.
7. Macht R, Balen A, McAneny D, Hess D. A multifaceted intervention to increase surgery resident engagement in reporting adverse events. J Surg Educ. 2015;72(6):e117-e122.
8. Scott DR, Weimer M, English C, et al. A novel approach to increase residents’ involvement in reporting adverse events. Acad Med. 2011;86(6):742-746.
9. Stewart DA, Junn J, Adams MA, et al. House staff participation in patient safety reporting: identification of predominant barriers and implementation of a pilot program. South Med J. 2016;109(7):395-400.
10. Vidyarthi AR, Green AL, Rosenbluth G, Baron RB. Engaging residents and fellows to improve institution-wide quality: the first six years of a novel financial incentive program. Acad Med. 2014;89(3):460-468.
11. Fok MC, Wong RY. Impact of a competency based curriculum on quality improvement among internal medicine residents. BMC Med Educ. 2014;14:252.
12. Wijesekera TP, Sanders L, Windish DM. Education and reporting of diagnostic errors among physicians in internal medicine training programs. JAMA Intern Med. 2018;178(11):1548-1549.
13. Levinson DR. Hospital incident reporting systems do not capture most patient harm. Washington, D.C.: U.S. Department of Health and Human Services Office of the Inspector General. January 2012. Report No. OEI-06-09-00091.
14. Evans JR, Mathur A. The value of online surveys. Internet Research. 2005;15(2):192-219.
15. Marcano Belisario JS, Jamsek J, Huckvale K, et al. Comparison of self‐administered survey questionnaire responses collected using mobile apps versus other methods. Cochrane Database of Syst Rev. 2015;7:MR000042.
16. Manfreda KL, Batagelj Z, Vehovar V. Design of web survey questionnaires: three basic experiments. J Comput Mediat Commun. 2002;7(3):JCMC731.
17. Wright ND, Groisman‐Perelstein AE, Wylie‐Rosett J, et al. A lifestyle assessment and intervention tool for pediatric weight management: the HABITS questionnaire. J Hum Nutr Diet. 2011;24(1):96-100.
Amputation Care Quality and Satisfaction With Prosthetic Limb Services: A Longitudinal Study of Veterans With Upper Limb Amputation
Veterans with upper limb amputation (ULA) are a small, but important population, who have received more attention in the past decade due to the increased growth of the population of veterans with conflict-related amputation from recent military engagements. Among the 808 veterans with ULA receiving any care in the US Department of Veterans Affairs (VA) from 2010 to 2015 who participated in our national study, an estimated 28 to 35% had a conflict-related amputation.1 The care of these individuals with ULA is highly specialized, and there is a recognized shortage of experienced professionals in this area.2,3 The provision of high-quality prosthetic care is increasingly complex with advances in technology, such as externally powered devices with multiple functions.
The VA is a comprehensive, integrated health care system that serves more than 8.9 million veterans each year. Interdisciplinary amputation care is provided within the VA through a traditional clinic setting or by using one of several currently available virtual care modalities.4,5 In consultation with the veteran, VA health care providers (HCPs) prescribe prostheses and services based on the clinical needs and furnish authorized items and services to eligible veterans. Prescribed items and/or services are furnished either by internal VA resources or through a community-based prosthetist who is an authorized vendor or contractor. Although several studies have reported that the majority of veterans with ULA utilize VA services for at least some aspects of their health care, little is known about: (1) prosthetic limb care satisfaction or the quality of care that veterans receive; or (2) how care within the VA or Department of Defense (DoD) compares with care provided in the civilian sector.6-8
Earlier studies that examined the amputation rehabilitation services received by veterans with ULA pointed to quality gaps in care and differences in satisfaction in the VA and DoD when compared with the civilian sector but were limited in their scope and methodology.7,8 A 2008 study of veterans of the Vietnam War, Operation Iraqi Freedom (OIF), and Operation Enduring Freedom (OEF) compared satisfaction by location of care receipt (DoD only, VA only, private only, and multiple sources). That study dichotomized response categories for items related to satisfaction with care (satisfied/not), but did not estimate degree of satisfaction, calculate summary scores of the items, or utilize validated care satisfaction metrics. That study found that a greater proportion of Vietnam War veterans (compared with OIF/OEF veterans receiving care in the private sector) agreed that they “had a role in choosing prosthesis” and disagreed that they wanted to change their current prosthesis to another type.7 The assumption made by the authors is that much of this private sector care was actually VA-sponsored care prescribed and procured by the VA but delivered in the community. However, no data were collected to confirm or refute this assumption, and it is possible that some care was both VA sponsored and delivered, some was VA sponsored but commercially delivered, and in some cases, care was sponsored by other sources and delivered in still other facilities.
A 2012 VA Office of the Inspector General study of OIF, OEF, and Operation New Dawn (OND) veterans reported lower prosthetic satisfaction for veterans with upper limb when compared with lower limb amputation and described respondents concerns about lack of VA prosthetic expertise, difficulty with accessing VA services, and dissatisfaction with the sometimes lengthy approval process for obtaining fee-basis or VA contract care.8 Although this report suggested that there were quality gaps and areas for improvement, it did not employ validated metrics of prosthesis or care satisfaction and instead relied on qualitative data collected through telephone interviews.
Given the VA effort to enhance the quality and consistency of its amputation care services through the formal establishment of the Amputation System of Care, which began in 2008, further evaluation of care satisfaction and quality of care is warranted. In 2014 the VA and DoD released the first evidence-based clinical practice guidelines (CPGs) for the rehabilitation of persons with ULA.2 The CPG describes care paths to improve outcomes and basic tenets of amputation rehabilitation care and can be used to identify process activities that are essential aspects of quality care. However, the extent to which the CPG has impacted the quality and timeliness of care for veterans with ULA are presently unclear.
Thus, the purposes of this study were to: (1) measure veteran satisfaction with prosthetic limb care and identify factors associated with service satisfaction; (2) assess quality indicators that potentially reflect CPG) adoption; (3) compare care satisfaction and quality for those who received care in or outside of the VA or DoD; and (4) evaluate change in satisfaction over time.
Methods
The study was approved by the VA Central Institutional Review Board (IRB) (Study #16-20) and Human Research Protection Office, U.S. Army Medical Research and Development Command. The sampling frame consisted of veterans with major ULA who received care in the VA between 2010 and 2015 identified in VA Corporate Data Warehouse. We sent recruitment packages to nondeceased veterans who had current addresses and phone numbers. Those who did not opt out or inform us that they did not meet eligibility criteria were contacted by study interviewers. A waiver of documentation of written informed consent was obtained from the VA Central IRB. When reached by the study interviewer, Veterans provided oral informed consent. At baseline, 808 veterans were interviewed for a response rate of 47.7% as calculated by the American Association for Public Opinion Research (AAPOR) methodology.9 Follow-up interviews approximately 1 year later (mean [SD] 367 [16.8] days), were conducted with 585 respondents for a 72.4% response rate (Figure).
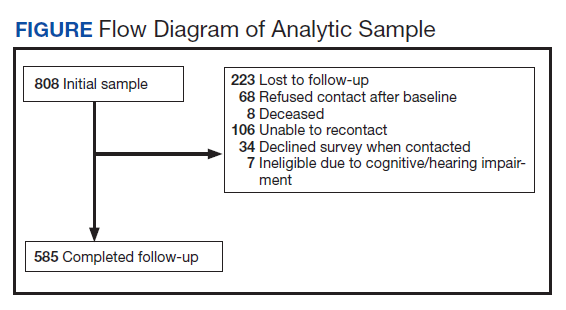
Survey Content
Development and pilot testing of the survey instrument previously was reported.1 The content of the survey drew from existing survey items and metrics, and included new items specifically designed to address patterns of amputation care, based on care goals within the CPG. All new and modified items were tested and refined through cognitive interviews with 10 participants, and tested with an additional 13 participants.
The survey collected data on demographics, amputation characteristics (year of amputation, level, laterality, and etiology), current prosthesis use, and type of prosthesis. This article focused on the sections of the survey pertaining to satisfaction with prosthetic care and indicators of quality of care. A description of the content of the full survey and a synopsis of overall findings are reported in a prior publication.1 The key independent, dependent, and other variables utilized in the analyses reported in this manuscript are described below.
Primary Independent Variables
In the follow-up survey, we asked respondents whether they had any amputation care in the prior 12 months, and if so to indicate where they had gone for care. We categorized respondents as having received VA/DoD care if they reported any care at the VA or DoD, and as having received non-VA/DoD care if they did not report care at the VA or DoD but indicated that they had received amputation care between baseline and follow-up.
Two primary outcomes were utilized; the Orthotics and Prosthetics User’s Survey (OPUS), client satisfaction with services scale (CSS), and a measure of care quality specifically developed for this study. The CSS is a measure developed specifically for orthotic and prosthesis users.10 This 11-item scale measures satisfaction with prosthetic limb services and contains items evaluating facets of care such as courtesy received from prosthetists and clinical staff, care coordination, appointment wait time, willingness of the prosthetist to listen to participant concerns, and satisfaction with prosthesis training. Items are rated on a 4-point scale (strongly agree [1] to strongly disagree [4]), thus higher CSS scores indicate worse satisfaction with services. The CSS was administered only to prosthesis users.
The Quality of Care assessment developed for this study contained items pertaining to amputation related care receipt and care quality. These items were generated by the study team in consultation with representatives from the VA/DoD Extremity Amputation Center of Excellence after review of the ULA rehabilitation CPG. Survey questions asked respondents about the clinicians visited for amputation related care in the past 12 months, whether they had an annual amputation-related checkup, whether any clinician had assessed their function, worked with them to identify goals, and/or to develop an amputation-related care plan. Respondents were also asked whether there had been family/caregiver involvement in their care and care coordination, whether a peer visitor was involved in their initial care, whether they had received information about amputation management in the prior year, and whether they had amputation-related pain. Those that indicated that they had amputation-related pain were subsequently asked whether their pain was well managed, whether they used medication for pain management, and whether they used any nonpharmaceutical strategies.
Quality of Care Index
We initially developed 15 indicator items of quality of care. We selected 7 of the items to create a summary index. We omitted 3 items about pain management, since these items were completed only by participants who indicated that they had experienced pain; however, we examined the 3 pain items individually given the importance of this topic. We omitted an additional 2 items from the summary index because they would not be sensitive to change because they pertained to the care in the year after initial amputation. One of these items asked whether caregivers were involved in initial amputation management and the other asked whether a peer visit occurred after amputation. Another 3 items were omitted because they only were completed by small subsamples due to intentional skip patterns in the survey. These items addressed whether clinical HCPs discussed amputation care goals in the prior year, worked to develop a care plan in the prior year, or helped to coordinate care after a move. Completion rates for all items considered for the index are shown in eAppendix 1 (Available at doi:10.12788/fp.0096). After item selection, we generated an index score, which was the number of reported “yes” responses to the seven relevant items.
Other Variables
We created a single variable called level/laterality which categorized ULA as unilateral or bilateral. We further categorized respondents with unilateral amputation by their amputation level. We categorized respondents as transradial for wrist joint or below the elbow amputations; transhumeral for at or above the elbow amputations; and shoulder for shoulder joint or forequarter amputations. Participants indicated the amputation etiology using 7 yes/no variables: combat injury, accident, burn, cancer, diabetes mellitus, and infection. Participants could select ≥ 1 etiology.
Primary prosthesis type was categorized as body powered, myoelectric/hybrid, cosmetic, other/unknown, or nonuser. The service era was classified based on amputation date as Before Vietnam, Vietnam War, After Vietnam to Gulf War, After Gulf War to September 10, 2001, and September 11, 2001 to present. For race, individuals with > 1 race were classified as other. We classified participants by region, using the station identification of the most recent VA medical center that they had visited between January 1, 2010 and December 30, 2015.
The survey also employed 2 measures of satisfaction with the prosthesis, the Trinity Amputation and Prosthetic Experience Scale (TAPES) satisfaction scale and the OPUS Client Satisfaction with Devices (CSD). TAPES consists of 10 items addressing color, shape, noise, appearance, weight, usefulness, reliability, fit, comfort and overall satisfaction.11 Items are rated on a 5-point Likert scale from very dissatisfied (1) to very satisfied (5). An 8-item version of the CSD scale was created for this study, after conducting a Rasch analysis (using Winsteps version 4.4.2) of the original 11-item CSD. The 8 items assess satisfaction with prosthesis fit, weight, comfort, donning ease, appearance, durability, skin contact, and pain. Items are rated on a 4-point scale from strongly agree (1) to strongly disagree (4); higher CSD scores indicate less satisfaction with devices. Psychometric analysis of the revised CSD score was reported in a prior publication.12 We also reported on the CSS using the original 10-item measure.
Data Analyses
We described characteristics of respondents at baseline and follow-up. We used baseline data to calculate CSS scores and described scores for all participants, for subgroups of unilateral and bilateral amputees, and for unilateral amputees stratified by amputation level. Wilcoxon rank sum tests were used to compare the CSS item and total scores of 461 prosthesis users with unilateral amputation and 29 with bilateral amputation. To identify factors that we hypothesized might be associated with CSS scores at baseline, we developed separate bivariate linear regression models. We added those factors that were associated with CSS scores at P ≤ .1 in bivariate analyses to a multivariable linear regression model of factors associated with CSS score. The P ≤ .1 threshold was used to ensure that relevant confounders were controlled for in regression models. We excluded 309 participants with no reported prosthesis use (who were not asked to complete the CSS), 20 participants with other/unknown prosthesis types, and 106 with missing data on amputation care in the prior year or on satisfaction metrics. We used baseline data for this analysis to maximize the sample size.
We compared CSS scores for those who reported receiving care within or outside of the VA or DoD in the prior year, using Wilcoxon Mann-Whitney rank tests. We also compared scores of individual quality of care items for these groups using Fisher exact tests. We chose to examine individual items rather than the full Index because several items specified care receipt within the VA and thus would be inappropriate to utilize in comparisons by site location; however, we described responses to all items. In these analyses, we excluded 2 respondents who had conflicting information regarding location of care. We used follow-up data for this analysis because it allowed us to identify location of care received in the prior year.
We also described the CSS scores, the 7-item Quality of Care Index and responses to other items related to quality of care at baseline and follow-up. To examine whether satisfaction with prosthetic care or aspects of care quality had changed over time, we compared baseline and follow-up CSS and quality of care scores for respondents who had measures at both times using Wilcoxon signed ranks tests. Individual items were compared using McNemar tests.
Results
Respondents were 97.4% male and included 776 unilateral amputees and 32 bilateral amputees with a mean (SD) age of 63.3 (14.1) years (Table 1). Respondents had lost their limbs a mean (SD) 31.4 (14.1) years prior, and half were transradial, 34.2% transhumeral, and 11.6% shoulder amputation. At baseline 185 (22.9%) participants received amputation-related care in the prior year and 118 (20.2%) participants received amputation-related care within 1 year of follow-up. Of respondents, 113 (19.3%) stated that their care was between baseline and follow-up and 89 (78.8%) of these received care at either the VA, the DoD or both; just 16 (14.2%) received care elsewhere.
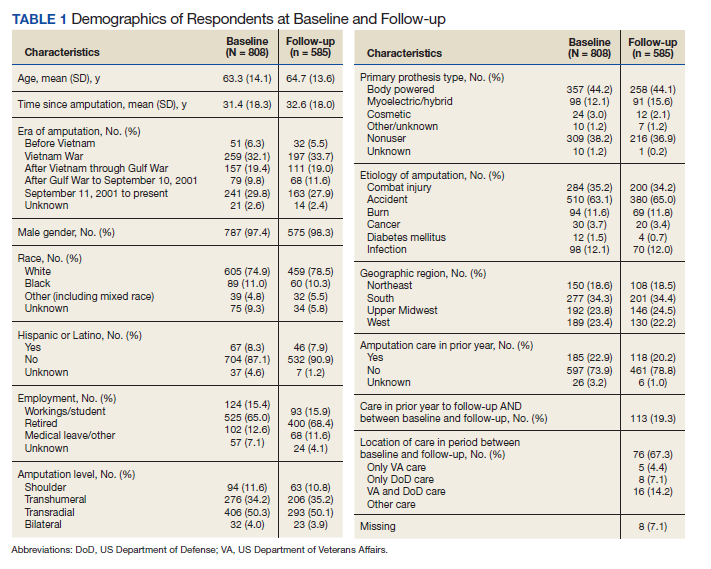
Mean (SD) CSS scores were highest (lower satisfaction) for those with amputation at the shoulder and lowest for those with transhumeral amputation: 42.2 (20.0) vs 33.4 (20.8). Persons with bilateral amputation were less satisfied in almost every category when compared with those with unilateral amputation, although the total CSS score was not substantially different. Wilcoxon rank sum analyses revealed statistically significant differences in wait time satisfaction: bilateral amputees were less satisfied than unilateral amputees. Factors associated with overall CSS score in bivariate analyses were CSD score, TAPES score, amputation care receipt, prosthesis type, race, and region of care (eAppendix 2, available at doi:10.12788/fp.0096).
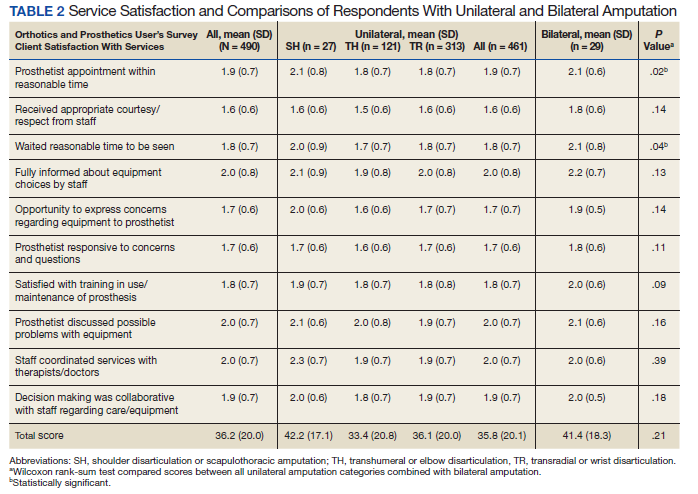
In the multivariate regression model of baseline CSS scores, only 2 variables were independently associated with CSS scores: CSD score and recent amputation care (Table 3). For each 1-point increase in CSD score there was a 0.7 point increase in CSS score. Those with amputation care in the prior year had higher satisfaction when compared with those who had not received care (P = .003).
For participants who indicated that they received amputation care between baseline and follow-up, CSS mean (SD) scores were better, but not statistically different, for those who reported care in the VA or DoD vs private care, 31.6 (22.6) vs 38.0 (17.7) (Table 4). When compared with community-based care, more participants who received care in the VA or DoD in the prior year had a functional assessment in that time period (33.7% vs 7.1%, P = .06), were contacted by HCPs outside of appointments (42.7% vs 18.8%, P = .07), and received information about amputation care in the prior year (41.6% vs 0%, P =.002). There was no difference in the proportion whose family/caregivers were involved in care in the prior year.
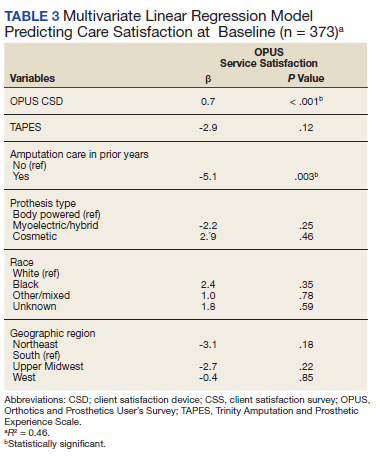
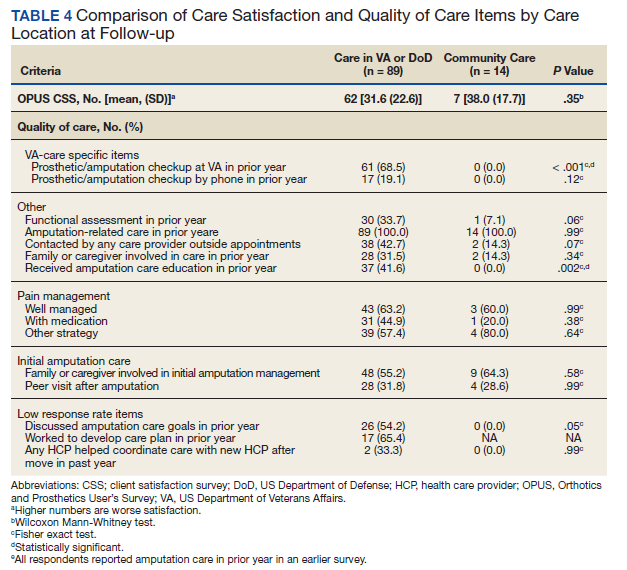
No statistically significant differences were observed in paired comparisons of the CSS and Quality of Care Index at baseline or follow-up for all participants with data at both time points (Table 5; eAppendix 3 available at doi:10.12788/fp.0096). Individual pain measures did not differ significantly between timepoints. Quality Index mean (SD) scores were 1.3 (1.5) and 1.2 (1.5) at baseline and follow-up, respectively (P = .07). For the 214 prosthesis users with longitudinal data, baseline CSS mean (SD) scores were generally worse at baseline than at follow-up: 34.4 (19.8) vs 32.5 (21.0) (P = .23). Family/caregiver involvement in amputation care was significantly higher in the year before baseline when compared with the year prior to follow-up (24.4% vs 17.7%, P = .001). There were no other statistically significant differences in Quality of Care items between baseline and follow-up.
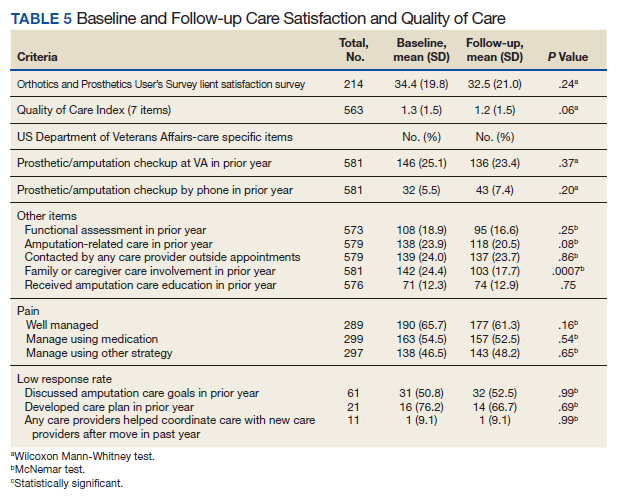
Discussion
Our longitudinal study provides insights into the experiences of veterans with major ULA related to satisfaction with prosthetic limb care services and receipt of amputation-related care. We reported on the development and use of a new summary measure of amputation care quality, which we designed to capture some of the key elements of care quality as provided in the VA/DoD CPG.2
We used baseline data to identify factors independently associated with prosthetic limb care satisfaction as measured by a previously validated measure, the OPUS CSS. The CSS addresses satisfaction with prosthetic limb services and does not reflect satisfaction with other amputation care services. We found that persons who received amputation care in the prior year had CSS scores that were a mean 5.1 points better than those who had not received recent care. Although causality cannot be determined with this investigation, this finding highlights an important relationship between frequency of care and satisfaction, which can be leveraged by the VA in future care initiatives. Care satisfaction was also better by 0.7 points for every 1-point decrease (indicating higher satisfaction) in the OPUS CSD prosthetic satisfaction scale. This finding isn’t surprising, given that a major purpose of prosthetic limb care services is to procure and fit a satisfactory device. To determine whether these same relationships were observed in the smaller, longitudinal cohort data at follow-up, we repeated these models and found similar relationships between recent care receipt and prosthesis satisfaction and satisfaction with services. We believe that these findings are meaningful and emphasize the importance of both service and device satisfaction to the veteran with an ULA. Lower service satisfaction scores among those with amputations at the shoulder and those with bilateral limb loss suggest that these individuals may benefit from different service delivery approaches.
We did observe a difference in satisfaction scores by geographic region in the follow-up (but not the baseline) data with satisfaction higher in the Western vs the Southern region (data not shown). This finding suggests a need for continued monitoring of care satisfaction over time to determine whether differences by region persist. We grouped respondents into geographic region based on the location where they had received their most recent VA care of any type. Many veterans receive care at multiple VA locations. Thus, it is possible that some veterans received their amputation care at a non-VA facility or a VA facility in a different region.
Our findings related to prosthetic limb care services satisfaction are generalizable to veteran prosthesis users. Findings may not be generalizable to nonusers, because in our study, the CSS only was administered to prosthesis users. Thus, we were unable to identify factors associated with care satisfaction for persons who were not current users of an upper limb prosthesis.
The study findings confirmed that most veterans with ULA receive amputation-related care in the VA or DoD. We compared CSS and Quality of Care item scores for those who reported receiving care at the VA or DoD vs elsewhere. Amputation care within the VA is complex. Some services are provided at VA facilities and some are ordered by VA clinicians but provided by community-based HCPs. However, we found that better (though not statistically significantly different) CSS scores and several Quality of Care items were endorsed by a significantly more of those reporting care in the VA or DoD as compared to elsewhere. Given the dissemination of a rehabilitation of upper limb amputees CPG, we hypothesized that VA and DoD HCPs would be more aware of care guidelines and would provide better care. Overall, our findings supported this hypothesis while also suggesting that areas such as caregiver involvement and peer visitation may benefit from additional attention and program improvement.
We used longitudinal data to describe and compare CSS and Quality of Care Index scores. Our analyses did not detect any statistically significant differences between baseline and follow-up. This finding may reflect that this was a relatively stable population with regard to amputation experiences given the mean time since amputation was 31.4 years. However, we also recognize that our measures may not have captured all aspects of care satisfaction or quality. It is possible that there were other changes that had occurred over the course of the year that were not captured by the CSS or by the Quality of Care Index. It is also possible that some implementation and adoption of the CPG had happened prior to our baseline survey. Finally, it is possible that some elements of the CPG have not yet been fully integrated into clinical care. We believe that the latter is likely, given that nearly 80% of respondents did not report receiving any amputation care within the past year at follow-up, though the CPGs recommend an annual visit.
Aside from recall bias, 2 explanations must be considered relative to the low rate of adherence to the CPG recommendation for an annual follow-up. The first is that the CPG simply may not be widely adopted. The second is that the majority of patients with ULA who use prostheses use a body-powered system. These tend to be low maintenance, long-lasting systems and may ultimately not need annual maintenance and repair. Further, if the veteran’s body-powered system is functioning properly and health status has not changed, they may simply be opting out of an annual visit despite the CPG recommendation. Nonetheless, this apparent low rate of annual follow-up emphasizes the need for additional process improvement measures for the VA.
Strengths and Limitations
The VA provides a unique setting for a nationally representative study of amputation rehabilitation because it has centralized data sources that can be used to identify veterans with ULA. Our study had a strong response rate, and its prosthetic limb care satisfaction findings are generalizable to all veterans with major ULA who received VA care from 2010 to 2015. However, there are limits to generalizability outside of this population to civilians or to veterans who do not receive VA care. To examine possible nonresponse bias, which could limit generalizability, we compared the baseline characteristics of respondents and nonrespondents to the follow-up study (eAppendix 4 available at doi:10.12788/fp.0096). There were no significant differences in satisfaction, quality of care, or receipt of amputation-related care between those lost to follow-up and those with follow-up data. Although, we did find small differences in gender, race, and service era (defined by amputation date). We do not believe that these differences threaten the interpretation of findings at follow-up, but there may be limits to generalizability of these findings to the full baseline sample. The data were from a telephone survey of veterans. It is possible that some veterans did not recall their care receipt or did not understand some of the questions and thus may not have accurately answered questions related to type of care received or the timing of that care.
Our interpretation of findings comparing care received within the VA and DoD or elsewhere is also limited because we cannot say with certainty whether those who indicated no care in the VA or DoD actually had care that was sponsored by the VA or DoD as contract or fee-basis care. Just 8 respondents indicated that they had received care only outside of the VA or DoD in the prior year. There were also some limitations in the collection of data about care location. We asked about receipt of amputation care in the prior year and about location of any amputation care received between baseline and follow-up, and there were differences in responses. Thus, we used a combination of these items to identify location of care received in the prior year.
Despite these limitations, we believe that our study provides novel, important findings about the satisfaction with prosthetic limb care services and quality of amputation rehabilitation care for veterans. Findings from this study can be used to address amputation and prosthetic limb care satisfaction and quality weaknesses highlighted and to benchmark care satisfaction and CPG compliance. Other studies evaluating care guideline compliance have used indicators obtained from clinical records or data repositories.13-15 Future work could combine self-reported satisfaction and care quality measures with indicators obtained from clinical or repository sources to provide a more complete snapshot of care delivery.
Conclusions
We reported on a national survey of veterans with major upper limb loss that assessed satisfaction with prosthetic limb care services and quality of amputation care. Satisfaction with prosthetic limb care was independently associated with satisfaction with the prosthesis, and receipt of care within the prior year. Most of the veterans surveyed received care within the VA or DoD and reported receiving higher quality of care, when compared with those who received care outside of the VA or DoD. Satisfaction with care and quality of care were stable over the year of this study. Data presented in this study can serve to direct VA amputation care process improvement initiatives as benchmarks for future work. Future studies are needed to track satisfaction with and quality of care for veterans with ULA.
1. Resnik L, Ekerholm S, Borgia M, Clark MA. A national study of veterans with major upper limb amputation: Survey methods, participants, and summary findings. PLoS One. 2019;14(3):e0213578. Published 2019 Mar 14. doi:10.1371/journal.pone.0213578
2. US Department of Defense, US Department of Veterans Affairs, Management of Upper Extremity Amputation Rehabilitation Working Group. VA/DoD clinical practice guideline for the management of upper extremity amputation rehabilitation.Published 2014. Accessed February 18, 2021. https://www.healthquality.va.gov/guidelines/Rehab/UEAR/VADoDCPGManagementofUEAR121614Corrected508.pdf
3. Jette AM. The Promise of Assistive Technology to Enhance Work Participation. Phys Ther. 2017;97(7):691-692. doi:10.1093/ptj/pzx054
4. Webster JB, Poorman CE, Cifu DX. Guest editorial: Department of Veterans Affairs amputations system of care: 5 years of accomplishments and outcomes. J Rehabil Res Dev. 2014;51(4):vii-xvi. doi:10.1682/JRRD.2014.01.0024
5. Scholten J, Poorman C, Culver L, Webster JB. Department of Veterans Affairs polytrauma telerehabilitation: twenty-first century care. Phys Med Rehabil Clin N Am. 2019;30(1):207-215. doi:10.1016/j.pmr.2018.08.003
6. Melcer T, Walker J, Bhatnagar V, Richard E. Clinic use at the Departments of Defense and Veterans Affairs following combat related amputations. Mil Med. 2020;185(1-2):e244-e253. doi:10.1093/milmed/usz149
7. Berke GM, Fergason J, Milani JR, et al. Comparison of satisfaction with current prosthetic care in veterans and servicemembers from Vietnam and OIF/OEF conflicts with major traumatic limb loss. J Rehabil Res Dev. 2010;47(4):361-371. doi:10.1682/jrrd.2009.12.0193
8. US Department of Veterans Affairs, Office of Inspector General. Healthcare inspection prosthetic limb care in VA facilities. Published March 8, 2012. Accessed February 18, 2021. https://www.va.gov/oig/pubs/VAOIG-11-02138-116.pdf 9. American Association for Public Opinion Research. Response rates - an overview. Accessed February 18, 2021. https://www.aapor.org/Education-Resources/For-Researchers/Poll-Survey-FAQ/Response-Rates-An-Overview.aspx
10. Heinemann AW, Bode RK, O’Reilly C. Development and measurement properties of the Orthotics and Prosthetics Users’ Survey (OPUS): a comprehensive set of clinical outcome instruments. Prosthet Orthot Int. 2003;27(3):191-206. doi:10.1080/03093640308726682
11. Desmond DM, MacLachlan M. Factor structure of the Trinity Amputation and Prosthesis Experience Scales (TAPES) with individuals with acquired upper limb amputations. Am J Phys Med Rehabil. 2005;84(7):506-513. doi:10.1097/01.phm.0000166885.16180.63
12. Resnik L, Borgia M, Heinemann AW, Clark MA. Prosthesis satisfaction in a national sample of veterans with upper limb amputation. Prosthet Orthot Int. 2020;44(2):81-91. doi:10.1177/0309364619895201
13. Ho TH, Caughey GE, Shakib S. Guideline compliance in chronic heart failure patients with multiple comorbid diseases: evaluation of an individualised multidisciplinary model of care. PLoS One. 2014;9(4):e93129. Published 2014 Apr 8. doi:10.1371/journal.pone.0093129
14. Mitchell KB, Lin H, Shen Y, et al. DCIS and axillary nodal evaluation: compliance with national guidelines. BMC Surg. 2017;17(1):12. Published 2017 Feb 7. doi:10.1186/s12893-017-0210-5
15. Moesker MJ, de Groot JF, Damen NL, et al. Guideline compliance for bridging anticoagulation use in vitamin-K antagonist patients; practice variation and factors associated with non-compliance. Thromb J. 2019;17:15. Published 2019 Aug 5. doi:10.1186/s12959-019-0204-x
Veterans with upper limb amputation (ULA) are a small, but important population, who have received more attention in the past decade due to the increased growth of the population of veterans with conflict-related amputation from recent military engagements. Among the 808 veterans with ULA receiving any care in the US Department of Veterans Affairs (VA) from 2010 to 2015 who participated in our national study, an estimated 28 to 35% had a conflict-related amputation.1 The care of these individuals with ULA is highly specialized, and there is a recognized shortage of experienced professionals in this area.2,3 The provision of high-quality prosthetic care is increasingly complex with advances in technology, such as externally powered devices with multiple functions.
The VA is a comprehensive, integrated health care system that serves more than 8.9 million veterans each year. Interdisciplinary amputation care is provided within the VA through a traditional clinic setting or by using one of several currently available virtual care modalities.4,5 In consultation with the veteran, VA health care providers (HCPs) prescribe prostheses and services based on the clinical needs and furnish authorized items and services to eligible veterans. Prescribed items and/or services are furnished either by internal VA resources or through a community-based prosthetist who is an authorized vendor or contractor. Although several studies have reported that the majority of veterans with ULA utilize VA services for at least some aspects of their health care, little is known about: (1) prosthetic limb care satisfaction or the quality of care that veterans receive; or (2) how care within the VA or Department of Defense (DoD) compares with care provided in the civilian sector.6-8
Earlier studies that examined the amputation rehabilitation services received by veterans with ULA pointed to quality gaps in care and differences in satisfaction in the VA and DoD when compared with the civilian sector but were limited in their scope and methodology.7,8 A 2008 study of veterans of the Vietnam War, Operation Iraqi Freedom (OIF), and Operation Enduring Freedom (OEF) compared satisfaction by location of care receipt (DoD only, VA only, private only, and multiple sources). That study dichotomized response categories for items related to satisfaction with care (satisfied/not), but did not estimate degree of satisfaction, calculate summary scores of the items, or utilize validated care satisfaction metrics. That study found that a greater proportion of Vietnam War veterans (compared with OIF/OEF veterans receiving care in the private sector) agreed that they “had a role in choosing prosthesis” and disagreed that they wanted to change their current prosthesis to another type.7 The assumption made by the authors is that much of this private sector care was actually VA-sponsored care prescribed and procured by the VA but delivered in the community. However, no data were collected to confirm or refute this assumption, and it is possible that some care was both VA sponsored and delivered, some was VA sponsored but commercially delivered, and in some cases, care was sponsored by other sources and delivered in still other facilities.
A 2012 VA Office of the Inspector General study of OIF, OEF, and Operation New Dawn (OND) veterans reported lower prosthetic satisfaction for veterans with upper limb when compared with lower limb amputation and described respondents concerns about lack of VA prosthetic expertise, difficulty with accessing VA services, and dissatisfaction with the sometimes lengthy approval process for obtaining fee-basis or VA contract care.8 Although this report suggested that there were quality gaps and areas for improvement, it did not employ validated metrics of prosthesis or care satisfaction and instead relied on qualitative data collected through telephone interviews.
Given the VA effort to enhance the quality and consistency of its amputation care services through the formal establishment of the Amputation System of Care, which began in 2008, further evaluation of care satisfaction and quality of care is warranted. In 2014 the VA and DoD released the first evidence-based clinical practice guidelines (CPGs) for the rehabilitation of persons with ULA.2 The CPG describes care paths to improve outcomes and basic tenets of amputation rehabilitation care and can be used to identify process activities that are essential aspects of quality care. However, the extent to which the CPG has impacted the quality and timeliness of care for veterans with ULA are presently unclear.
Thus, the purposes of this study were to: (1) measure veteran satisfaction with prosthetic limb care and identify factors associated with service satisfaction; (2) assess quality indicators that potentially reflect CPG) adoption; (3) compare care satisfaction and quality for those who received care in or outside of the VA or DoD; and (4) evaluate change in satisfaction over time.
Methods
The study was approved by the VA Central Institutional Review Board (IRB) (Study #16-20) and Human Research Protection Office, U.S. Army Medical Research and Development Command. The sampling frame consisted of veterans with major ULA who received care in the VA between 2010 and 2015 identified in VA Corporate Data Warehouse. We sent recruitment packages to nondeceased veterans who had current addresses and phone numbers. Those who did not opt out or inform us that they did not meet eligibility criteria were contacted by study interviewers. A waiver of documentation of written informed consent was obtained from the VA Central IRB. When reached by the study interviewer, Veterans provided oral informed consent. At baseline, 808 veterans were interviewed for a response rate of 47.7% as calculated by the American Association for Public Opinion Research (AAPOR) methodology.9 Follow-up interviews approximately 1 year later (mean [SD] 367 [16.8] days), were conducted with 585 respondents for a 72.4% response rate (Figure).
Survey Content
Development and pilot testing of the survey instrument previously was reported.1 The content of the survey drew from existing survey items and metrics, and included new items specifically designed to address patterns of amputation care, based on care goals within the CPG. All new and modified items were tested and refined through cognitive interviews with 10 participants, and tested with an additional 13 participants.
The survey collected data on demographics, amputation characteristics (year of amputation, level, laterality, and etiology), current prosthesis use, and type of prosthesis. This article focused on the sections of the survey pertaining to satisfaction with prosthetic care and indicators of quality of care. A description of the content of the full survey and a synopsis of overall findings are reported in a prior publication.1 The key independent, dependent, and other variables utilized in the analyses reported in this manuscript are described below.
Primary Independent Variables
In the follow-up survey, we asked respondents whether they had any amputation care in the prior 12 months, and if so to indicate where they had gone for care. We categorized respondents as having received VA/DoD care if they reported any care at the VA or DoD, and as having received non-VA/DoD care if they did not report care at the VA or DoD but indicated that they had received amputation care between baseline and follow-up.
Two primary outcomes were utilized; the Orthotics and Prosthetics User’s Survey (OPUS), client satisfaction with services scale (CSS), and a measure of care quality specifically developed for this study. The CSS is a measure developed specifically for orthotic and prosthesis users.10 This 11-item scale measures satisfaction with prosthetic limb services and contains items evaluating facets of care such as courtesy received from prosthetists and clinical staff, care coordination, appointment wait time, willingness of the prosthetist to listen to participant concerns, and satisfaction with prosthesis training. Items are rated on a 4-point scale (strongly agree [1] to strongly disagree [4]), thus higher CSS scores indicate worse satisfaction with services. The CSS was administered only to prosthesis users.
The Quality of Care assessment developed for this study contained items pertaining to amputation related care receipt and care quality. These items were generated by the study team in consultation with representatives from the VA/DoD Extremity Amputation Center of Excellence after review of the ULA rehabilitation CPG. Survey questions asked respondents about the clinicians visited for amputation related care in the past 12 months, whether they had an annual amputation-related checkup, whether any clinician had assessed their function, worked with them to identify goals, and/or to develop an amputation-related care plan. Respondents were also asked whether there had been family/caregiver involvement in their care and care coordination, whether a peer visitor was involved in their initial care, whether they had received information about amputation management in the prior year, and whether they had amputation-related pain. Those that indicated that they had amputation-related pain were subsequently asked whether their pain was well managed, whether they used medication for pain management, and whether they used any nonpharmaceutical strategies.
Quality of Care Index
We initially developed 15 indicator items of quality of care. We selected 7 of the items to create a summary index. We omitted 3 items about pain management, since these items were completed only by participants who indicated that they had experienced pain; however, we examined the 3 pain items individually given the importance of this topic. We omitted an additional 2 items from the summary index because they would not be sensitive to change because they pertained to the care in the year after initial amputation. One of these items asked whether caregivers were involved in initial amputation management and the other asked whether a peer visit occurred after amputation. Another 3 items were omitted because they only were completed by small subsamples due to intentional skip patterns in the survey. These items addressed whether clinical HCPs discussed amputation care goals in the prior year, worked to develop a care plan in the prior year, or helped to coordinate care after a move. Completion rates for all items considered for the index are shown in eAppendix 1 (Available at doi:10.12788/fp.0096). After item selection, we generated an index score, which was the number of reported “yes” responses to the seven relevant items.
Other Variables
We created a single variable called level/laterality which categorized ULA as unilateral or bilateral. We further categorized respondents with unilateral amputation by their amputation level. We categorized respondents as transradial for wrist joint or below the elbow amputations; transhumeral for at or above the elbow amputations; and shoulder for shoulder joint or forequarter amputations. Participants indicated the amputation etiology using 7 yes/no variables: combat injury, accident, burn, cancer, diabetes mellitus, and infection. Participants could select ≥ 1 etiology.
Primary prosthesis type was categorized as body powered, myoelectric/hybrid, cosmetic, other/unknown, or nonuser. The service era was classified based on amputation date as Before Vietnam, Vietnam War, After Vietnam to Gulf War, After Gulf War to September 10, 2001, and September 11, 2001 to present. For race, individuals with > 1 race were classified as other. We classified participants by region, using the station identification of the most recent VA medical center that they had visited between January 1, 2010 and December 30, 2015.
The survey also employed 2 measures of satisfaction with the prosthesis, the Trinity Amputation and Prosthetic Experience Scale (TAPES) satisfaction scale and the OPUS Client Satisfaction with Devices (CSD). TAPES consists of 10 items addressing color, shape, noise, appearance, weight, usefulness, reliability, fit, comfort and overall satisfaction.11 Items are rated on a 5-point Likert scale from very dissatisfied (1) to very satisfied (5). An 8-item version of the CSD scale was created for this study, after conducting a Rasch analysis (using Winsteps version 4.4.2) of the original 11-item CSD. The 8 items assess satisfaction with prosthesis fit, weight, comfort, donning ease, appearance, durability, skin contact, and pain. Items are rated on a 4-point scale from strongly agree (1) to strongly disagree (4); higher CSD scores indicate less satisfaction with devices. Psychometric analysis of the revised CSD score was reported in a prior publication.12 We also reported on the CSS using the original 10-item measure.
Data Analyses
We described characteristics of respondents at baseline and follow-up. We used baseline data to calculate CSS scores and described scores for all participants, for subgroups of unilateral and bilateral amputees, and for unilateral amputees stratified by amputation level. Wilcoxon rank sum tests were used to compare the CSS item and total scores of 461 prosthesis users with unilateral amputation and 29 with bilateral amputation. To identify factors that we hypothesized might be associated with CSS scores at baseline, we developed separate bivariate linear regression models. We added those factors that were associated with CSS scores at P ≤ .1 in bivariate analyses to a multivariable linear regression model of factors associated with CSS score. The P ≤ .1 threshold was used to ensure that relevant confounders were controlled for in regression models. We excluded 309 participants with no reported prosthesis use (who were not asked to complete the CSS), 20 participants with other/unknown prosthesis types, and 106 with missing data on amputation care in the prior year or on satisfaction metrics. We used baseline data for this analysis to maximize the sample size.
We compared CSS scores for those who reported receiving care within or outside of the VA or DoD in the prior year, using Wilcoxon Mann-Whitney rank tests. We also compared scores of individual quality of care items for these groups using Fisher exact tests. We chose to examine individual items rather than the full Index because several items specified care receipt within the VA and thus would be inappropriate to utilize in comparisons by site location; however, we described responses to all items. In these analyses, we excluded 2 respondents who had conflicting information regarding location of care. We used follow-up data for this analysis because it allowed us to identify location of care received in the prior year.
We also described the CSS scores, the 7-item Quality of Care Index and responses to other items related to quality of care at baseline and follow-up. To examine whether satisfaction with prosthetic care or aspects of care quality had changed over time, we compared baseline and follow-up CSS and quality of care scores for respondents who had measures at both times using Wilcoxon signed ranks tests. Individual items were compared using McNemar tests.
Results
Respondents were 97.4% male and included 776 unilateral amputees and 32 bilateral amputees with a mean (SD) age of 63.3 (14.1) years (Table 1). Respondents had lost their limbs a mean (SD) 31.4 (14.1) years prior, and half were transradial, 34.2% transhumeral, and 11.6% shoulder amputation. At baseline 185 (22.9%) participants received amputation-related care in the prior year and 118 (20.2%) participants received amputation-related care within 1 year of follow-up. Of respondents, 113 (19.3%) stated that their care was between baseline and follow-up and 89 (78.8%) of these received care at either the VA, the DoD or both; just 16 (14.2%) received care elsewhere.
Mean (SD) CSS scores were highest (lower satisfaction) for those with amputation at the shoulder and lowest for those with transhumeral amputation: 42.2 (20.0) vs 33.4 (20.8). Persons with bilateral amputation were less satisfied in almost every category when compared with those with unilateral amputation, although the total CSS score was not substantially different. Wilcoxon rank sum analyses revealed statistically significant differences in wait time satisfaction: bilateral amputees were less satisfied than unilateral amputees. Factors associated with overall CSS score in bivariate analyses were CSD score, TAPES score, amputation care receipt, prosthesis type, race, and region of care (eAppendix 2, available at doi:10.12788/fp.0096).
In the multivariate regression model of baseline CSS scores, only 2 variables were independently associated with CSS scores: CSD score and recent amputation care (Table 3). For each 1-point increase in CSD score there was a 0.7 point increase in CSS score. Those with amputation care in the prior year had higher satisfaction when compared with those who had not received care (P = .003).
For participants who indicated that they received amputation care between baseline and follow-up, CSS mean (SD) scores were better, but not statistically different, for those who reported care in the VA or DoD vs private care, 31.6 (22.6) vs 38.0 (17.7) (Table 4). When compared with community-based care, more participants who received care in the VA or DoD in the prior year had a functional assessment in that time period (33.7% vs 7.1%, P = .06), were contacted by HCPs outside of appointments (42.7% vs 18.8%, P = .07), and received information about amputation care in the prior year (41.6% vs 0%, P =.002). There was no difference in the proportion whose family/caregivers were involved in care in the prior year.
No statistically significant differences were observed in paired comparisons of the CSS and Quality of Care Index at baseline or follow-up for all participants with data at both time points (Table 5; eAppendix 3 available at doi:10.12788/fp.0096). Individual pain measures did not differ significantly between timepoints. Quality Index mean (SD) scores were 1.3 (1.5) and 1.2 (1.5) at baseline and follow-up, respectively (P = .07). For the 214 prosthesis users with longitudinal data, baseline CSS mean (SD) scores were generally worse at baseline than at follow-up: 34.4 (19.8) vs 32.5 (21.0) (P = .23). Family/caregiver involvement in amputation care was significantly higher in the year before baseline when compared with the year prior to follow-up (24.4% vs 17.7%, P = .001). There were no other statistically significant differences in Quality of Care items between baseline and follow-up.
Discussion
Our longitudinal study provides insights into the experiences of veterans with major ULA related to satisfaction with prosthetic limb care services and receipt of amputation-related care. We reported on the development and use of a new summary measure of amputation care quality, which we designed to capture some of the key elements of care quality as provided in the VA/DoD CPG.2
We used baseline data to identify factors independently associated with prosthetic limb care satisfaction as measured by a previously validated measure, the OPUS CSS. The CSS addresses satisfaction with prosthetic limb services and does not reflect satisfaction with other amputation care services. We found that persons who received amputation care in the prior year had CSS scores that were a mean 5.1 points better than those who had not received recent care. Although causality cannot be determined with this investigation, this finding highlights an important relationship between frequency of care and satisfaction, which can be leveraged by the VA in future care initiatives. Care satisfaction was also better by 0.7 points for every 1-point decrease (indicating higher satisfaction) in the OPUS CSD prosthetic satisfaction scale. This finding isn’t surprising, given that a major purpose of prosthetic limb care services is to procure and fit a satisfactory device. To determine whether these same relationships were observed in the smaller, longitudinal cohort data at follow-up, we repeated these models and found similar relationships between recent care receipt and prosthesis satisfaction and satisfaction with services. We believe that these findings are meaningful and emphasize the importance of both service and device satisfaction to the veteran with an ULA. Lower service satisfaction scores among those with amputations at the shoulder and those with bilateral limb loss suggest that these individuals may benefit from different service delivery approaches.
We did observe a difference in satisfaction scores by geographic region in the follow-up (but not the baseline) data with satisfaction higher in the Western vs the Southern region (data not shown). This finding suggests a need for continued monitoring of care satisfaction over time to determine whether differences by region persist. We grouped respondents into geographic region based on the location where they had received their most recent VA care of any type. Many veterans receive care at multiple VA locations. Thus, it is possible that some veterans received their amputation care at a non-VA facility or a VA facility in a different region.
Our findings related to prosthetic limb care services satisfaction are generalizable to veteran prosthesis users. Findings may not be generalizable to nonusers, because in our study, the CSS only was administered to prosthesis users. Thus, we were unable to identify factors associated with care satisfaction for persons who were not current users of an upper limb prosthesis.
The study findings confirmed that most veterans with ULA receive amputation-related care in the VA or DoD. We compared CSS and Quality of Care item scores for those who reported receiving care at the VA or DoD vs elsewhere. Amputation care within the VA is complex. Some services are provided at VA facilities and some are ordered by VA clinicians but provided by community-based HCPs. However, we found that better (though not statistically significantly different) CSS scores and several Quality of Care items were endorsed by a significantly more of those reporting care in the VA or DoD as compared to elsewhere. Given the dissemination of a rehabilitation of upper limb amputees CPG, we hypothesized that VA and DoD HCPs would be more aware of care guidelines and would provide better care. Overall, our findings supported this hypothesis while also suggesting that areas such as caregiver involvement and peer visitation may benefit from additional attention and program improvement.
We used longitudinal data to describe and compare CSS and Quality of Care Index scores. Our analyses did not detect any statistically significant differences between baseline and follow-up. This finding may reflect that this was a relatively stable population with regard to amputation experiences given the mean time since amputation was 31.4 years. However, we also recognize that our measures may not have captured all aspects of care satisfaction or quality. It is possible that there were other changes that had occurred over the course of the year that were not captured by the CSS or by the Quality of Care Index. It is also possible that some implementation and adoption of the CPG had happened prior to our baseline survey. Finally, it is possible that some elements of the CPG have not yet been fully integrated into clinical care. We believe that the latter is likely, given that nearly 80% of respondents did not report receiving any amputation care within the past year at follow-up, though the CPGs recommend an annual visit.
Aside from recall bias, 2 explanations must be considered relative to the low rate of adherence to the CPG recommendation for an annual follow-up. The first is that the CPG simply may not be widely adopted. The second is that the majority of patients with ULA who use prostheses use a body-powered system. These tend to be low maintenance, long-lasting systems and may ultimately not need annual maintenance and repair. Further, if the veteran’s body-powered system is functioning properly and health status has not changed, they may simply be opting out of an annual visit despite the CPG recommendation. Nonetheless, this apparent low rate of annual follow-up emphasizes the need for additional process improvement measures for the VA.
Strengths and Limitations
The VA provides a unique setting for a nationally representative study of amputation rehabilitation because it has centralized data sources that can be used to identify veterans with ULA. Our study had a strong response rate, and its prosthetic limb care satisfaction findings are generalizable to all veterans with major ULA who received VA care from 2010 to 2015. However, there are limits to generalizability outside of this population to civilians or to veterans who do not receive VA care. To examine possible nonresponse bias, which could limit generalizability, we compared the baseline characteristics of respondents and nonrespondents to the follow-up study (eAppendix 4 available at doi:10.12788/fp.0096). There were no significant differences in satisfaction, quality of care, or receipt of amputation-related care between those lost to follow-up and those with follow-up data. Although, we did find small differences in gender, race, and service era (defined by amputation date). We do not believe that these differences threaten the interpretation of findings at follow-up, but there may be limits to generalizability of these findings to the full baseline sample. The data were from a telephone survey of veterans. It is possible that some veterans did not recall their care receipt or did not understand some of the questions and thus may not have accurately answered questions related to type of care received or the timing of that care.
Our interpretation of findings comparing care received within the VA and DoD or elsewhere is also limited because we cannot say with certainty whether those who indicated no care in the VA or DoD actually had care that was sponsored by the VA or DoD as contract or fee-basis care. Just 8 respondents indicated that they had received care only outside of the VA or DoD in the prior year. There were also some limitations in the collection of data about care location. We asked about receipt of amputation care in the prior year and about location of any amputation care received between baseline and follow-up, and there were differences in responses. Thus, we used a combination of these items to identify location of care received in the prior year.
Despite these limitations, we believe that our study provides novel, important findings about the satisfaction with prosthetic limb care services and quality of amputation rehabilitation care for veterans. Findings from this study can be used to address amputation and prosthetic limb care satisfaction and quality weaknesses highlighted and to benchmark care satisfaction and CPG compliance. Other studies evaluating care guideline compliance have used indicators obtained from clinical records or data repositories.13-15 Future work could combine self-reported satisfaction and care quality measures with indicators obtained from clinical or repository sources to provide a more complete snapshot of care delivery.
Conclusions
We reported on a national survey of veterans with major upper limb loss that assessed satisfaction with prosthetic limb care services and quality of amputation care. Satisfaction with prosthetic limb care was independently associated with satisfaction with the prosthesis, and receipt of care within the prior year. Most of the veterans surveyed received care within the VA or DoD and reported receiving higher quality of care, when compared with those who received care outside of the VA or DoD. Satisfaction with care and quality of care were stable over the year of this study. Data presented in this study can serve to direct VA amputation care process improvement initiatives as benchmarks for future work. Future studies are needed to track satisfaction with and quality of care for veterans with ULA.
1. Resnik L, Ekerholm S, Borgia M, Clark MA. A national study of veterans with major upper limb amputation: Survey methods, participants, and summary findings. PLoS One. 2019;14(3):e0213578. Published 2019 Mar 14. doi:10.1371/journal.pone.0213578
2. US Department of Defense, US Department of Veterans Affairs, Management of Upper Extremity Amputation Rehabilitation Working Group. VA/DoD clinical practice guideline for the management of upper extremity amputation rehabilitation.Published 2014. Accessed February 18, 2021. https://www.healthquality.va.gov/guidelines/Rehab/UEAR/VADoDCPGManagementofUEAR121614Corrected508.pdf
3. Jette AM. The Promise of Assistive Technology to Enhance Work Participation. Phys Ther. 2017;97(7):691-692. doi:10.1093/ptj/pzx054
4. Webster JB, Poorman CE, Cifu DX. Guest editorial: Department of Veterans Affairs amputations system of care: 5 years of accomplishments and outcomes. J Rehabil Res Dev. 2014;51(4):vii-xvi. doi:10.1682/JRRD.2014.01.0024
5. Scholten J, Poorman C, Culver L, Webster JB. Department of Veterans Affairs polytrauma telerehabilitation: twenty-first century care. Phys Med Rehabil Clin N Am. 2019;30(1):207-215. doi:10.1016/j.pmr.2018.08.003
6. Melcer T, Walker J, Bhatnagar V, Richard E. Clinic use at the Departments of Defense and Veterans Affairs following combat related amputations. Mil Med. 2020;185(1-2):e244-e253. doi:10.1093/milmed/usz149
7. Berke GM, Fergason J, Milani JR, et al. Comparison of satisfaction with current prosthetic care in veterans and servicemembers from Vietnam and OIF/OEF conflicts with major traumatic limb loss. J Rehabil Res Dev. 2010;47(4):361-371. doi:10.1682/jrrd.2009.12.0193
8. US Department of Veterans Affairs, Office of Inspector General. Healthcare inspection prosthetic limb care in VA facilities. Published March 8, 2012. Accessed February 18, 2021. https://www.va.gov/oig/pubs/VAOIG-11-02138-116.pdf 9. American Association for Public Opinion Research. Response rates - an overview. Accessed February 18, 2021. https://www.aapor.org/Education-Resources/For-Researchers/Poll-Survey-FAQ/Response-Rates-An-Overview.aspx
10. Heinemann AW, Bode RK, O’Reilly C. Development and measurement properties of the Orthotics and Prosthetics Users’ Survey (OPUS): a comprehensive set of clinical outcome instruments. Prosthet Orthot Int. 2003;27(3):191-206. doi:10.1080/03093640308726682
11. Desmond DM, MacLachlan M. Factor structure of the Trinity Amputation and Prosthesis Experience Scales (TAPES) with individuals with acquired upper limb amputations. Am J Phys Med Rehabil. 2005;84(7):506-513. doi:10.1097/01.phm.0000166885.16180.63
12. Resnik L, Borgia M, Heinemann AW, Clark MA. Prosthesis satisfaction in a national sample of veterans with upper limb amputation. Prosthet Orthot Int. 2020;44(2):81-91. doi:10.1177/0309364619895201
13. Ho TH, Caughey GE, Shakib S. Guideline compliance in chronic heart failure patients with multiple comorbid diseases: evaluation of an individualised multidisciplinary model of care. PLoS One. 2014;9(4):e93129. Published 2014 Apr 8. doi:10.1371/journal.pone.0093129
14. Mitchell KB, Lin H, Shen Y, et al. DCIS and axillary nodal evaluation: compliance with national guidelines. BMC Surg. 2017;17(1):12. Published 2017 Feb 7. doi:10.1186/s12893-017-0210-5
15. Moesker MJ, de Groot JF, Damen NL, et al. Guideline compliance for bridging anticoagulation use in vitamin-K antagonist patients; practice variation and factors associated with non-compliance. Thromb J. 2019;17:15. Published 2019 Aug 5. doi:10.1186/s12959-019-0204-x
Impact of an Oral Antineoplastic Renewal Clinic on Medication Possession Ratio and Cost-Savings
Evaluation of oral antineoplastic agent (OAN) adherence patterns have identified correlations between nonadherence or over-adherence and poorer disease-related outcomes. Multiple studies have focused on imatinib use in chronic myeloid leukemia (CML) due to its continuous, long-term use. A study by Ganesan and colleagues found that nonadherence to imatinib showed a significant decrease in 5-year event-free survival between 76.7% of adherent participants compared with 59.8% of nonadherent participants.1 This study found that 44% of patients who were adherent to imatinib achieved complete cytogenetic response vs only 26% of patients who were nonadherent. In another study of imatinib for CML, major molecular response (MMR) was strongly correlated with adherence and no patients with adherence < 80% were able to achieve MMR.2 Similarly, in studies of tamoxifen for breast cancer, < 80% adherence resulted in a 10% decrease in survival when compared to those who were more adherent.3,4
In addition to the clinical implications of nonadherence, there can be a significant cost associated with suboptimal use of these medications. The price of a single dose of OAN medication may cost as much as $440.5
The benefits of multidisciplinary care teams have been identified in many studies.6,7 While studies are limited in oncology, pharmacists provide vital contributions to the oncology multidisciplinary team when managing OANs as these health care professionals have expert knowledge of the medications, potential adverse events (AEs), and necessary monitoring parameters.8 In one study, patients seen by the pharmacist-led oral chemotherapy management program experienced improved clinical outcomes and response to therapy when compared with preintervention patients (early molecular response, 88.9% vs 54.8%, P = .01; major molecular response, 83.3% vs 57.6%, P = .06).9 During the study, 318 AEs were reported, leading to 235 pharmacist interventions to ameliorate AEs and improve adherence.
The primary objective of this study was to measure the impact of a pharmacist-driven OAN renewal clinic on medication adherence. The secondary objective was to estimate cost-savings of this new service.
Methods
Prior to July 2014, several limitations were identified related to OAN prescribing and monitoring at the Richard L. Roudebush Veterans Affairs Medical Center in Indianapolis, Indiana (RLRVAMC). The prescription ordering process relied primarily on the patient to initiate refills, rather than the prescriber OAN prescriptions also lacked consistency for number of refills or quantities dispensed. Furthermore, ordering of antineoplastic products was not limited to hematology/oncology providers. Patients were identified with significant supply on hand at the time of medication discontinuation, creating concerns for medication waste, tolerability, and nonadherence.
As a result, opportunities were identified to improve the prescribing process, recommended monitoring, toxicity and tolerability evaluation, medication reconciliation, and medication adherence. In July of 2014, the RLRVAMC adopted a new chemotherapy order entry system capable of restricting prescriptions to hematology/oncology providers and limiting dispensed quantities and refill amounts. A comprehensive pharmacist driven OAN renewal clinic was implemented on September 1, 2014 with the goal of improving long-term adherence and tolerability, in addition to minimizing medication waste.
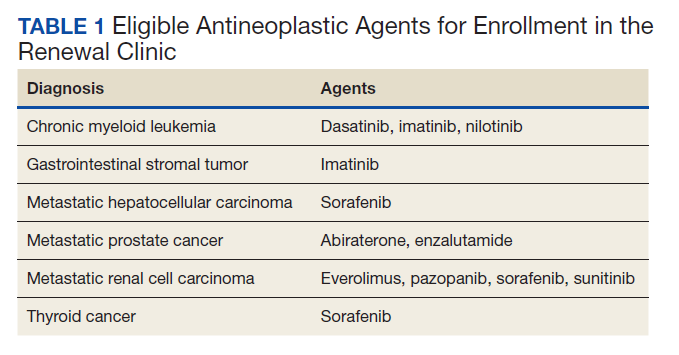
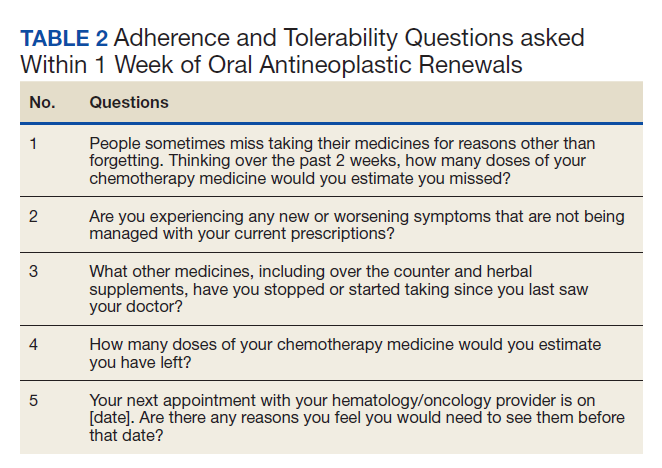
Patients were eligible for enrollment in the clinic if they had a cancer diagnosis and were concomitantly prescribed an OAN outlined in Table 1. All eligible patients were automatically enrolled in the clinic when they were deemed stable on their OAN by a hematology/oncology pharmacy specialist. Stability was defined as ≤ Grade 1 symptoms associated with the toxicities of OAN therapy managed with or without intervention as defined by the Common Terminology Criteria for Adverse Events (CTCAE) version 4.03. Once enrolled in the renewal clinic, patients were called by an oncology pharmacy resident (PGY2) 1 week prior to any OAN refill due date. Patients were asked a series of 5 adherence and tolerability questions (Table 2) to evaluate renewal criteria for approval or need for further evaluation. These questions were developed based on targeted information and published reports on monitoring adherence.10,11 Criteria for renewal included: < 10% self-reported missed doses of the OAN during the previous dispensing period, no hospitalizations or emergency department visits since most recent hematology/oncology provider appointment, no changes to concomitant medication therapies, and no new or worsening medication-related AEs. Patients meeting all criteria were given a 30-day supply of OAN. Prescribing, dispensing, and delivery of OAN were facilitated by the pharmacist. Patient cases that did not meet criteria for renewal were escalated to the hematology/oncology provider or oncology clinical pharmacy specialist for further evaluation.
Study Design and Setting
This was a pre/post retrospective cohort, quality improvement study of patients enrolled in the RLRVAMC OAN pharmacist renewal clinic. The study was deemed exempt from institutional review board (IRB) by the US Department of Veterans Affairs (VA) Research and Development Department.
Study Population
Patients were included in the preimplementation group if they had received at least 2 prescriptions of an eligible OAN. Therapy for the preimplementation group was required to be a monthly duration > 21 days and between the dates of September 1, 2013 and August 31, 2014. Patients were included in the postimplementation group if they had received at least 2 prescriptions of the studied OANs between September 1, 2014 and January 31, 2015. Patients were excluded if they had filled < 2 prescriptions of OAN; were managed by a non-VA oncologist or hematologist; or received an OAN other than those listed in Table 1.
Data Collection
For all patients in both the pre- and postimplementation cohorts, a standardized data collection tool was used to collect the following via electronic health record review by a PGY2 oncology resident: age, race, gender, oral antineoplastic agent, refill dates, days’ supply, estimated unit cost per dose cancer diagnosis, distance from the RLRVAMC, copay status, presence of hospitalizations/ED visits/dosage reductions, discontinuation rates, reasons for discontinuation, and total number of current prescriptions. The presence or absence of dosage reductions were collected to identify concerns for tolerability, but only the original dose for the preimplementation group and dosage at time of clinic enrollment for the postimplementation group was included in the analysis.
Outcomes and Statistical Analyses
The primary outcome was medication adherence defined as the median medication possession ratio (MPR) before and after implementation of the clinic. Secondary outcomes included the proportion of patients who were adherent from before implementation to after and estimated cost-savings of this clinic after implementation. MPR was used to estimate medication adherence by taking the cumulative day supply of medication on hand divided by the number of days on therapy.12 Number of days on therapy was determined by taking the difference on the start date of the new medication regimen and the discontinuation date of the same regimen. Patients were grouped by adherence into one of the following categories: < 0.8, 0.8 to 0.89, 0.9 to 1, and > 1.1. Patients were considered adherent if they reported taking ≥ 90% (MPR ≥ 0.9) of prescribed doses, adopted from the study by Anderson and colleagues.12 A patient with an MPR > 1, likely due to filling prior to the anticipated refill date, was considered 100% adherent (MPR = 1). If a patient switched OAN during the study, both agents were included as separate entities.
A conservative estimate of cost-savings was made by multiplying the RLRVAMC cost per unit of medication at time of initial prescription fill by the number of units taken each day multiplied by the total days’ supply on hand at time of therapy discontinuation. Patients with an MPR < 1 at time of therapy discontinuation were assumed to have zero remaining units on hand and zero cost savings was estimated. Waste, for purposes of cost-savings, was calculated for all MPR values > 1. Additional supply anticipated to be on hand from dose reductions was not included in the estimated cost of unused medication.
Descriptive statistics compared demographic characteristics between the pre- and postimplementation groups. MPR data were not normally distributed, which required the use of nonparametric Mann-Whitney U tests to compare pre- and postMPRs. Pearson χ2 compared the proportion of adherent patients between groups while descriptive statistics were used to estimate cost savings. Significance was determined based on a P value < .05. IBM SPSS Statistics software was used for all statistical analyses. As this was a complete sample of all eligible subjects, no sample size calculation was performed.
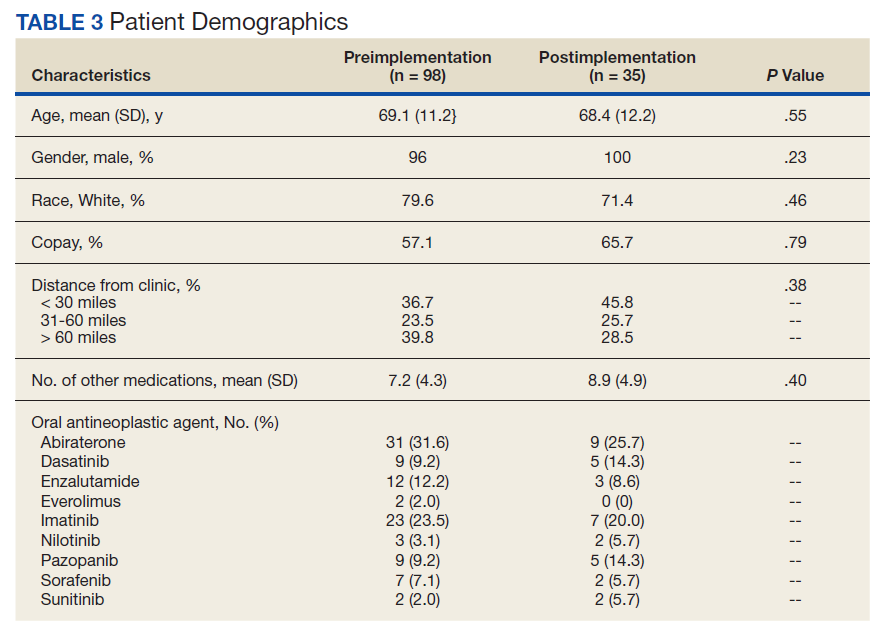
Results
In the preimplementation period, 246 patients received an OAN and 61 patients received an OAN in the postimplementation period (Figure 1). Of the 246 patients in the preimplementation period, 98 were eligible and included in the preimplementation group. Similarly, of the 61 patients in the postimplementation period, 35 patients met inclusion criteria for the postimplementation group. The study population was predominantly male with an average age of approximately 70 years in both groups (Table 3). More than 70% of the population in each group was White. No statistically significant differences between groups were identified. The most commonly prescribed OAN in the preimplementation group were abiraterone, imatinib, and enzalutamide (Table 3). In the postimplementation group, the most commonly prescribed agents were abiraterone, imatinib, pazopanib, and dasatinib. No significant differences were observed in prescribing of individual agents between the pre- and postimplementation groups or other characteristics that may affect adherence including patient copay status, number of concomitant medications, and driving distance from the RLRVAMC.
Thirty-six (36.7%) patients in the preimplementation group were considered nonadherent (MPR < 0.9) and 18 (18.4%) had an MPR < 0.8. Fifteen (15.3%) patients in the preimplementation clinic were considered overadherent (MPR > 1.1). Forty-seven (47.9%) patients in the preimplementation group were considered adherent (MPR 0.9 - 1.1) while all 35 (100%) patients in the postimplementation group were considered adherent (MPR 0.9 - 1.1). No non- or overadherent patients were identified in the postimplementation group (Figure 2). The median MPR for all patients in the preimplementation group was 0.94 compared with 1.06 (P < .001) in the postimplementation group.
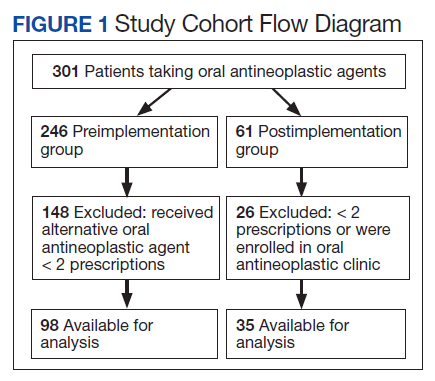
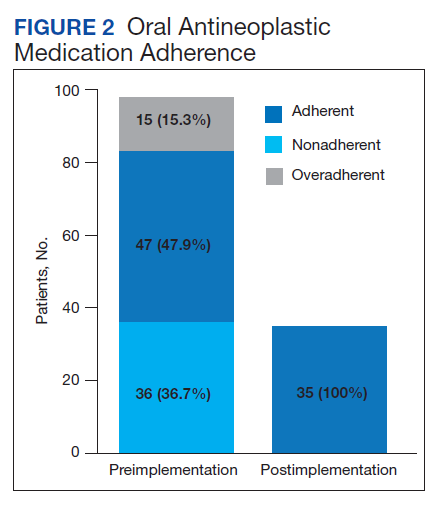
Thirty-five (35.7%) patients had therapy discontinued or held in the preimplementation group compared with 2 (5.7%) patients in the postimplementation group (P < .001). Reasons for discontinuation in the preimplementation group included disease progression (n = 27), death (n = 3), lost to follow up (n = 2), and intolerability of therapy (n = 3). Both patients that discontinued therapy in the postimplementation group did so due to disease progression. Of the 35 patients who had their OAN discontinued or held in the preimplementation group, 14 patients had excess supply on hand at time of discontinuation. The estimated value of the unused medication was $37,890. Nine (25%) of the 35 patients who discontinued therapy had a dosage reduction during the course of therapy and the additional supply was not included in the cost estimate. Similarly, 1 of the 2 patients in the postimplementation group had their OAN discontinued during study. The cost of oversupply of medication at the time of therapy discontinuation was estimated at $1,555. No patients in the postimplementation group had dose reductions. After implementation of the OAN renewal clinic, the total cost savings between pre ($37,890) and postimplementation ($1,555) groups was $36,355.
Discussion
OANs are widely used therapies, with more than 25 million doses administered per year in the United States alone.12 The use of these agents will continue to grow as more targeted agents become available and patients request more convenient treatment options. The role for hematology/oncology clinical pharmacy services must adapt to this increased usage of OANs, including increasing pharmacist involvement in medication education, adherence and tolerability assessments, and proactive drug interaction monitoring.However, additional research is needed to determine optimal management strategies.
Our study aimed to compare OAN adherence among patients at a tertiary care VA hospital before and after implementation of a renewal clinic. The preimplementation population had a median MPR of 0.94 compared with 1.06 in the postimplementation group (P < .001). Although an ideal MPR is 1.0, we aimed for a slightly higher MPR to allow a supply buffer in the event of prescription delivery delays, as more than 90% of prescriptions are mailed to patients from a regional mail-order pharmacy. Importantly, the median MPRs do not adequately convey the impact from this clinic. The proportion of patients who were considered adherent to OANs increased from 47.9% in the preimplementation to 100% in the postimplementation period. These finding suggest that the clinical pharmacist role to assess and encourage adherence through monitoring tolerability of these OANs improved the overall medication taking experience of these patients.
Upon initial evaluation of adherence pre- and postimplementation, median adherence rates in both groups appeared to be above goal at 0.94 and 1.06 respectively. Patients in the postimplementation group intentionally received a 5- to 7-day supply buffer to account for potential prescription delivery delays due to holidays and inclement weather. This would indicate that the patients in the postimplementation group would have 15% oversupply due to the 5-day supply buffer. After correcting for patients with confounding reasons for excess (dose reductions, breaks in treatment, etc.), the median MPR in the prerefill clinic group decreased to 0.9 and the MPR in the postrefill clinic group increased slightly to 1.08. Although the median adherence rate in both the pre- and postimplementation groups were above goal of 0.90, 36% of the patients in the preimplementation group were considered nonadherent (MPR < 0.9) compared with no patients in the postimplementation group. Therefore, our intervention to improve patient adherence appeared to be beneficial at our institution.
In addition to improving adherence, one of the goals of the renewal clinic was to minimize excess supply at the time of therapy discontinuation. This was accomplished by aligning medication fills with medical visits and objective monitoring, as well as limiting supply to no more than 30 days. Of the patients in the postimplementation group, only 1 patient had remaining medication at the time of therapy discontinuation compared with 14 patients in the preimplementation group. The estimated cost savings from excess supply was $36,335. Limiting the amount of unused supply not only saves money for the patient and the institution, but also decreases opportunity for improper hazardous waste disposal and unnecessary exposure of hazardous materials to others.
Our results show the pharmacist intervention in the coordination of renewals improved adherence, minimized medication waste, and saved money. The cost of pharmacist time participating in the refill clinic was not calculated. Each visit was completed in approximately 5 minutes, with subsequent documentation and coordination taking an additional 5 to 10 minutes. During the launch of this service, the oncology pharmacy resident provided all coverage of the clinic. Oversite of the resident was provided by hematology/oncology clinical pharmacy specialists. We have continued to utilize pharmacy resident coverage since that time to meet education needs and keep the estimated cost per visit low. Another option in the case that pharmacy residents are not available would be utilization of a pharmacy technician, intern, or professional student to conduct the adherence and tolerability phone assessments. Our escalation protocol allows intervention by clinical pharmacy specialist and/or other health care providers when necessary. Trainees have only required basic training on how to use the protocol.
Limitations
Due to this study’s retrospective design, an inherent limitation is dependence on prescriber and refill records for documentation of initiation and discontinuation dates. Therefore, only the association of impact of pharmacist intervention on medication adherence can be determined as opposed to causation. We did not take into account discrepancies in day supply secondary to ‘held’ therapies, dose reductions, or doses supplied during an inpatient admission, which may alter estimates of MPR and cost-savings data. Patients in the postimplementation group intentionally received a 5 to 7-day supply buffer to account for potential prescription delivery delays due to holidays and inclement weather. This would indicate that the patients in the postimplementation group would have 15% oversupply due to the 5-day supply buffer, thereby skewing MPR values. This study did not account for cost avoidance resulting from early identification and management of toxicity. Finally, the postimplementation data only spans 4 months and a longer duration of time is needed to more accurately determine sustainability of renewal clinic interventions and provide comprehensive evaluation of cost-avoidance.
Conclusion
Implementation of an OAN renewal clinic was associated with an increase in MPR, improved proportion of patients considered adherent, and an estimated $36,335 cost-savings. However, prospective evaluation and a longer study duration are needed to determine causality of improved adherence and cost-savings associated with a pharmacist-driven OAN renewal clinic.
1. Ganesan P, Sagar TG, Dubashi B, et al. Nonadherence to imatinib adversely affects event free survival in chronic phase chronic myeloid leukemia. Am J Hematol 2011; 86: 471-474. doi:10.1002/ajh.22019
2. Marin D, Bazeos A, Mahon FX, et al. Adherence is the critical factor for achieving molecular responses in patients with chronic myeloid leukemia who achieve complete cytogenetic responses on imatinib. J Clin Oncol 2010; 28: 2381-2388. doi:10.1200/JCO.2009.26.3087
3. McCowan C, Shearer J, Donnan PT, et al. Cohort study examining tamoxifen adherence and its relationship to mortality in women with breast cancer. Br J Cancer 2008; 99: 1763-1768. doi:10.1038/sj.bjc.6604758
4. Lexicomp Online. Sunitinib. Hudson, Ohio: Lexi-Comp, Inc; August 20, 2019.
5. Babiker A, El Husseini M, Al Nemri A, et al. Health care professional development: Working as a team to improve patient care. Sudan J Paediatr. 2014;14(2):9-16.
6. Spence MM, Makarem AF, Reyes SL, et al. Evaluation of an outpatient pharmacy clinical services program on adherence and clinical outcomes among patients with diabetes and/or coronary artery disease. J Manag Care Spec Pharm. 2014;20(10):1036-1045. doi:10.18553/jmcp.2014.20.10.1036
7. Holle LM, Puri S, Clement JM. Physician-pharmacist collaboration for oral chemotherapy monitoring: Insights from an academic genitourinary oncology practice. J Oncol Pharm Pract 2015; doi:10.1177/1078155215581524
8. Muluneh B, Schneider M, Faso A, et al. Improved Adherence Rates and Clinical Outcomes of an Integrated, Closed-Loop, Pharmacist-Led Oral Chemotherapy Management Program. Journal of Oncology Practice. 2018;14(6):371-333. doi:10.1200/JOP.17.00039.
9. Font R, Espinas JA, Gil-Gil M, et al. Prescription refill, patient self-report and physician report in assessing adherence to oral endocrine therapy in early breast cancer patients: a retrospective cohort study in Catalonia, Spain. British Journal of Cancer. 2012 ;107(8):1249-1256. doi:10.1038/bjc.2012.389.
10. Anderson KR, Chambers CR, Lam N, et al. Medication adherence among adults prescribed imatinib, dasatinib, or nilotinib for the treatment of chronic myeloid leukemia. J Oncol Pharm Practice. 2015;21(1):19–25. doi:10.1177/1078155213520261
11. Weingart SN, Brown E, Bach PB, et al. NCCN Task Force Report: oral chemotherapy. J Natl Compr Canc Netw. 2008;6(3): S1-S14.
Evaluation of oral antineoplastic agent (OAN) adherence patterns have identified correlations between nonadherence or over-adherence and poorer disease-related outcomes. Multiple studies have focused on imatinib use in chronic myeloid leukemia (CML) due to its continuous, long-term use. A study by Ganesan and colleagues found that nonadherence to imatinib showed a significant decrease in 5-year event-free survival between 76.7% of adherent participants compared with 59.8% of nonadherent participants.1 This study found that 44% of patients who were adherent to imatinib achieved complete cytogenetic response vs only 26% of patients who were nonadherent. In another study of imatinib for CML, major molecular response (MMR) was strongly correlated with adherence and no patients with adherence < 80% were able to achieve MMR.2 Similarly, in studies of tamoxifen for breast cancer, < 80% adherence resulted in a 10% decrease in survival when compared to those who were more adherent.3,4
In addition to the clinical implications of nonadherence, there can be a significant cost associated with suboptimal use of these medications. The price of a single dose of OAN medication may cost as much as $440.5
The benefits of multidisciplinary care teams have been identified in many studies.6,7 While studies are limited in oncology, pharmacists provide vital contributions to the oncology multidisciplinary team when managing OANs as these health care professionals have expert knowledge of the medications, potential adverse events (AEs), and necessary monitoring parameters.8 In one study, patients seen by the pharmacist-led oral chemotherapy management program experienced improved clinical outcomes and response to therapy when compared with preintervention patients (early molecular response, 88.9% vs 54.8%, P = .01; major molecular response, 83.3% vs 57.6%, P = .06).9 During the study, 318 AEs were reported, leading to 235 pharmacist interventions to ameliorate AEs and improve adherence.
The primary objective of this study was to measure the impact of a pharmacist-driven OAN renewal clinic on medication adherence. The secondary objective was to estimate cost-savings of this new service.
Methods
Prior to July 2014, several limitations were identified related to OAN prescribing and monitoring at the Richard L. Roudebush Veterans Affairs Medical Center in Indianapolis, Indiana (RLRVAMC). The prescription ordering process relied primarily on the patient to initiate refills, rather than the prescriber OAN prescriptions also lacked consistency for number of refills or quantities dispensed. Furthermore, ordering of antineoplastic products was not limited to hematology/oncology providers. Patients were identified with significant supply on hand at the time of medication discontinuation, creating concerns for medication waste, tolerability, and nonadherence.
As a result, opportunities were identified to improve the prescribing process, recommended monitoring, toxicity and tolerability evaluation, medication reconciliation, and medication adherence. In July of 2014, the RLRVAMC adopted a new chemotherapy order entry system capable of restricting prescriptions to hematology/oncology providers and limiting dispensed quantities and refill amounts. A comprehensive pharmacist driven OAN renewal clinic was implemented on September 1, 2014 with the goal of improving long-term adherence and tolerability, in addition to minimizing medication waste.
Patients were eligible for enrollment in the clinic if they had a cancer diagnosis and were concomitantly prescribed an OAN outlined in Table 1. All eligible patients were automatically enrolled in the clinic when they were deemed stable on their OAN by a hematology/oncology pharmacy specialist. Stability was defined as ≤ Grade 1 symptoms associated with the toxicities of OAN therapy managed with or without intervention as defined by the Common Terminology Criteria for Adverse Events (CTCAE) version 4.03. Once enrolled in the renewal clinic, patients were called by an oncology pharmacy resident (PGY2) 1 week prior to any OAN refill due date. Patients were asked a series of 5 adherence and tolerability questions (Table 2) to evaluate renewal criteria for approval or need for further evaluation. These questions were developed based on targeted information and published reports on monitoring adherence.10,11 Criteria for renewal included: < 10% self-reported missed doses of the OAN during the previous dispensing period, no hospitalizations or emergency department visits since most recent hematology/oncology provider appointment, no changes to concomitant medication therapies, and no new or worsening medication-related AEs. Patients meeting all criteria were given a 30-day supply of OAN. Prescribing, dispensing, and delivery of OAN were facilitated by the pharmacist. Patient cases that did not meet criteria for renewal were escalated to the hematology/oncology provider or oncology clinical pharmacy specialist for further evaluation.
Study Design and Setting
This was a pre/post retrospective cohort, quality improvement study of patients enrolled in the RLRVAMC OAN pharmacist renewal clinic. The study was deemed exempt from institutional review board (IRB) by the US Department of Veterans Affairs (VA) Research and Development Department.
Study Population
Patients were included in the preimplementation group if they had received at least 2 prescriptions of an eligible OAN. Therapy for the preimplementation group was required to be a monthly duration > 21 days and between the dates of September 1, 2013 and August 31, 2014. Patients were included in the postimplementation group if they had received at least 2 prescriptions of the studied OANs between September 1, 2014 and January 31, 2015. Patients were excluded if they had filled < 2 prescriptions of OAN; were managed by a non-VA oncologist or hematologist; or received an OAN other than those listed in Table 1.
Data Collection
For all patients in both the pre- and postimplementation cohorts, a standardized data collection tool was used to collect the following via electronic health record review by a PGY2 oncology resident: age, race, gender, oral antineoplastic agent, refill dates, days’ supply, estimated unit cost per dose cancer diagnosis, distance from the RLRVAMC, copay status, presence of hospitalizations/ED visits/dosage reductions, discontinuation rates, reasons for discontinuation, and total number of current prescriptions. The presence or absence of dosage reductions were collected to identify concerns for tolerability, but only the original dose for the preimplementation group and dosage at time of clinic enrollment for the postimplementation group was included in the analysis.
Outcomes and Statistical Analyses
The primary outcome was medication adherence defined as the median medication possession ratio (MPR) before and after implementation of the clinic. Secondary outcomes included the proportion of patients who were adherent from before implementation to after and estimated cost-savings of this clinic after implementation. MPR was used to estimate medication adherence by taking the cumulative day supply of medication on hand divided by the number of days on therapy.12 Number of days on therapy was determined by taking the difference on the start date of the new medication regimen and the discontinuation date of the same regimen. Patients were grouped by adherence into one of the following categories: < 0.8, 0.8 to 0.89, 0.9 to 1, and > 1.1. Patients were considered adherent if they reported taking ≥ 90% (MPR ≥ 0.9) of prescribed doses, adopted from the study by Anderson and colleagues.12 A patient with an MPR > 1, likely due to filling prior to the anticipated refill date, was considered 100% adherent (MPR = 1). If a patient switched OAN during the study, both agents were included as separate entities.
A conservative estimate of cost-savings was made by multiplying the RLRVAMC cost per unit of medication at time of initial prescription fill by the number of units taken each day multiplied by the total days’ supply on hand at time of therapy discontinuation. Patients with an MPR < 1 at time of therapy discontinuation were assumed to have zero remaining units on hand and zero cost savings was estimated. Waste, for purposes of cost-savings, was calculated for all MPR values > 1. Additional supply anticipated to be on hand from dose reductions was not included in the estimated cost of unused medication.
Descriptive statistics compared demographic characteristics between the pre- and postimplementation groups. MPR data were not normally distributed, which required the use of nonparametric Mann-Whitney U tests to compare pre- and postMPRs. Pearson χ2 compared the proportion of adherent patients between groups while descriptive statistics were used to estimate cost savings. Significance was determined based on a P value < .05. IBM SPSS Statistics software was used for all statistical analyses. As this was a complete sample of all eligible subjects, no sample size calculation was performed.
Results
In the preimplementation period, 246 patients received an OAN and 61 patients received an OAN in the postimplementation period (Figure 1). Of the 246 patients in the preimplementation period, 98 were eligible and included in the preimplementation group. Similarly, of the 61 patients in the postimplementation period, 35 patients met inclusion criteria for the postimplementation group. The study population was predominantly male with an average age of approximately 70 years in both groups (Table 3). More than 70% of the population in each group was White. No statistically significant differences between groups were identified. The most commonly prescribed OAN in the preimplementation group were abiraterone, imatinib, and enzalutamide (Table 3). In the postimplementation group, the most commonly prescribed agents were abiraterone, imatinib, pazopanib, and dasatinib. No significant differences were observed in prescribing of individual agents between the pre- and postimplementation groups or other characteristics that may affect adherence including patient copay status, number of concomitant medications, and driving distance from the RLRVAMC.
Thirty-six (36.7%) patients in the preimplementation group were considered nonadherent (MPR < 0.9) and 18 (18.4%) had an MPR < 0.8. Fifteen (15.3%) patients in the preimplementation clinic were considered overadherent (MPR > 1.1). Forty-seven (47.9%) patients in the preimplementation group were considered adherent (MPR 0.9 - 1.1) while all 35 (100%) patients in the postimplementation group were considered adherent (MPR 0.9 - 1.1). No non- or overadherent patients were identified in the postimplementation group (Figure 2). The median MPR for all patients in the preimplementation group was 0.94 compared with 1.06 (P < .001) in the postimplementation group.
Thirty-five (35.7%) patients had therapy discontinued or held in the preimplementation group compared with 2 (5.7%) patients in the postimplementation group (P < .001). Reasons for discontinuation in the preimplementation group included disease progression (n = 27), death (n = 3), lost to follow up (n = 2), and intolerability of therapy (n = 3). Both patients that discontinued therapy in the postimplementation group did so due to disease progression. Of the 35 patients who had their OAN discontinued or held in the preimplementation group, 14 patients had excess supply on hand at time of discontinuation. The estimated value of the unused medication was $37,890. Nine (25%) of the 35 patients who discontinued therapy had a dosage reduction during the course of therapy and the additional supply was not included in the cost estimate. Similarly, 1 of the 2 patients in the postimplementation group had their OAN discontinued during study. The cost of oversupply of medication at the time of therapy discontinuation was estimated at $1,555. No patients in the postimplementation group had dose reductions. After implementation of the OAN renewal clinic, the total cost savings between pre ($37,890) and postimplementation ($1,555) groups was $36,355.
Discussion
OANs are widely used therapies, with more than 25 million doses administered per year in the United States alone.12 The use of these agents will continue to grow as more targeted agents become available and patients request more convenient treatment options. The role for hematology/oncology clinical pharmacy services must adapt to this increased usage of OANs, including increasing pharmacist involvement in medication education, adherence and tolerability assessments, and proactive drug interaction monitoring.However, additional research is needed to determine optimal management strategies.
Our study aimed to compare OAN adherence among patients at a tertiary care VA hospital before and after implementation of a renewal clinic. The preimplementation population had a median MPR of 0.94 compared with 1.06 in the postimplementation group (P < .001). Although an ideal MPR is 1.0, we aimed for a slightly higher MPR to allow a supply buffer in the event of prescription delivery delays, as more than 90% of prescriptions are mailed to patients from a regional mail-order pharmacy. Importantly, the median MPRs do not adequately convey the impact from this clinic. The proportion of patients who were considered adherent to OANs increased from 47.9% in the preimplementation to 100% in the postimplementation period. These finding suggest that the clinical pharmacist role to assess and encourage adherence through monitoring tolerability of these OANs improved the overall medication taking experience of these patients.
Upon initial evaluation of adherence pre- and postimplementation, median adherence rates in both groups appeared to be above goal at 0.94 and 1.06 respectively. Patients in the postimplementation group intentionally received a 5- to 7-day supply buffer to account for potential prescription delivery delays due to holidays and inclement weather. This would indicate that the patients in the postimplementation group would have 15% oversupply due to the 5-day supply buffer. After correcting for patients with confounding reasons for excess (dose reductions, breaks in treatment, etc.), the median MPR in the prerefill clinic group decreased to 0.9 and the MPR in the postrefill clinic group increased slightly to 1.08. Although the median adherence rate in both the pre- and postimplementation groups were above goal of 0.90, 36% of the patients in the preimplementation group were considered nonadherent (MPR < 0.9) compared with no patients in the postimplementation group. Therefore, our intervention to improve patient adherence appeared to be beneficial at our institution.
In addition to improving adherence, one of the goals of the renewal clinic was to minimize excess supply at the time of therapy discontinuation. This was accomplished by aligning medication fills with medical visits and objective monitoring, as well as limiting supply to no more than 30 days. Of the patients in the postimplementation group, only 1 patient had remaining medication at the time of therapy discontinuation compared with 14 patients in the preimplementation group. The estimated cost savings from excess supply was $36,335. Limiting the amount of unused supply not only saves money for the patient and the institution, but also decreases opportunity for improper hazardous waste disposal and unnecessary exposure of hazardous materials to others.
Our results show the pharmacist intervention in the coordination of renewals improved adherence, minimized medication waste, and saved money. The cost of pharmacist time participating in the refill clinic was not calculated. Each visit was completed in approximately 5 minutes, with subsequent documentation and coordination taking an additional 5 to 10 minutes. During the launch of this service, the oncology pharmacy resident provided all coverage of the clinic. Oversite of the resident was provided by hematology/oncology clinical pharmacy specialists. We have continued to utilize pharmacy resident coverage since that time to meet education needs and keep the estimated cost per visit low. Another option in the case that pharmacy residents are not available would be utilization of a pharmacy technician, intern, or professional student to conduct the adherence and tolerability phone assessments. Our escalation protocol allows intervention by clinical pharmacy specialist and/or other health care providers when necessary. Trainees have only required basic training on how to use the protocol.
Limitations
Due to this study’s retrospective design, an inherent limitation is dependence on prescriber and refill records for documentation of initiation and discontinuation dates. Therefore, only the association of impact of pharmacist intervention on medication adherence can be determined as opposed to causation. We did not take into account discrepancies in day supply secondary to ‘held’ therapies, dose reductions, or doses supplied during an inpatient admission, which may alter estimates of MPR and cost-savings data. Patients in the postimplementation group intentionally received a 5 to 7-day supply buffer to account for potential prescription delivery delays due to holidays and inclement weather. This would indicate that the patients in the postimplementation group would have 15% oversupply due to the 5-day supply buffer, thereby skewing MPR values. This study did not account for cost avoidance resulting from early identification and management of toxicity. Finally, the postimplementation data only spans 4 months and a longer duration of time is needed to more accurately determine sustainability of renewal clinic interventions and provide comprehensive evaluation of cost-avoidance.
Conclusion
Implementation of an OAN renewal clinic was associated with an increase in MPR, improved proportion of patients considered adherent, and an estimated $36,335 cost-savings. However, prospective evaluation and a longer study duration are needed to determine causality of improved adherence and cost-savings associated with a pharmacist-driven OAN renewal clinic.
1. Ganesan P, Sagar TG, Dubashi B, et al. Nonadherence to imatinib adversely affects event free survival in chronic phase chronic myeloid leukemia. Am J Hematol 2011; 86: 471-474. doi:10.1002/ajh.22019
2. Marin D, Bazeos A, Mahon FX, et al. Adherence is the critical factor for achieving molecular responses in patients with chronic myeloid leukemia who achieve complete cytogenetic responses on imatinib. J Clin Oncol 2010; 28: 2381-2388. doi:10.1200/JCO.2009.26.3087
3. McCowan C, Shearer J, Donnan PT, et al. Cohort study examining tamoxifen adherence and its relationship to mortality in women with breast cancer. Br J Cancer 2008; 99: 1763-1768. doi:10.1038/sj.bjc.6604758
4. Lexicomp Online. Sunitinib. Hudson, Ohio: Lexi-Comp, Inc; August 20, 2019.
5. Babiker A, El Husseini M, Al Nemri A, et al. Health care professional development: Working as a team to improve patient care. Sudan J Paediatr. 2014;14(2):9-16.
6. Spence MM, Makarem AF, Reyes SL, et al. Evaluation of an outpatient pharmacy clinical services program on adherence and clinical outcomes among patients with diabetes and/or coronary artery disease. J Manag Care Spec Pharm. 2014;20(10):1036-1045. doi:10.18553/jmcp.2014.20.10.1036
7. Holle LM, Puri S, Clement JM. Physician-pharmacist collaboration for oral chemotherapy monitoring: Insights from an academic genitourinary oncology practice. J Oncol Pharm Pract 2015; doi:10.1177/1078155215581524
8. Muluneh B, Schneider M, Faso A, et al. Improved Adherence Rates and Clinical Outcomes of an Integrated, Closed-Loop, Pharmacist-Led Oral Chemotherapy Management Program. Journal of Oncology Practice. 2018;14(6):371-333. doi:10.1200/JOP.17.00039.
9. Font R, Espinas JA, Gil-Gil M, et al. Prescription refill, patient self-report and physician report in assessing adherence to oral endocrine therapy in early breast cancer patients: a retrospective cohort study in Catalonia, Spain. British Journal of Cancer. 2012 ;107(8):1249-1256. doi:10.1038/bjc.2012.389.
10. Anderson KR, Chambers CR, Lam N, et al. Medication adherence among adults prescribed imatinib, dasatinib, or nilotinib for the treatment of chronic myeloid leukemia. J Oncol Pharm Practice. 2015;21(1):19–25. doi:10.1177/1078155213520261
11. Weingart SN, Brown E, Bach PB, et al. NCCN Task Force Report: oral chemotherapy. J Natl Compr Canc Netw. 2008;6(3): S1-S14.
Preliminary Evaluation of an Order Template to Improve Diagnosis and Testosterone Therapy of Hypogonadism in Veterans
Testosterone treatment is clinically indicated when a patient presents with symptoms and signs and biochemical evidence of testosterone deficiency, ie, male hypogonadism. Laboratory confirmation of hypogonadism requires repeatedly low serum testosterone concentrations; between 8
Recent studies have reported an increase in testosterone prescriptions and raised concerns regarding health care provider (HCP) prescribing practices despite current clinical practice guidelines from major societies, such as the Endocrine Society. In the US from 2001 to 2011, testosterone use among men aged ≥ 40 years increased more than 3-fold in all age groups.3 Subsequently in the years from 2013 to 2016, prescription rates declined perhaps due to the cardiovascular and stroke concerns.4
In the US Department of Veterans Affairs (VA), new testosterone prescriptions across VA medical centers increased from 20,437 in fiscal year (FY) 2009 to 36,394 in FY 2012. Yet only 3.1% of men who received testosterone therapy had 2 or more low morning total or free testosterone concentrations measured; LH and/or FSH levels assessed; and presence of contraindications to therapy documented. Remarkably, 16.5% of these veterans did not have a testosterone level tested prior to being prescribed testosterone. Among veterans who were prescribed testosterone, 1.4% had a diagnosis of prostate cancer, 7.6% had a diagnosis of obstructive sleep apnea (OSA), and 3.5% had elevated hematocrit at baseline.5 These findings raised concerns of whether the diagnosis and etiology of hypogonadism were appropriately established and risks were considered before testosterone treatment was initiated.5,6
To further understand VA prescribing practices of testosterone therapy, a 2018 VA Office of the Inspector General (OIG) report evaluated the initiation and follow-up of testosterone replacement therapy. The OIG randomly sampled and reviewed 1,091 male patients who filled at least 1 outpatient testosterone prescription from VA in FY 2014 and who did not have a prior testosterone prescription in FY 2013. Patients were followed through September 30, 2015. Within 1 year prior to initiating testosterone, only 1.5% had clinical signs and symptoms of testosterone deficiency documented prior to testosterone testing (76% within 18 months of starting testosterone); only 9.1% of veterans had the recommended measurements of 2 low morning testosterone levels; and only 12% had LH and FSH levels measured. Within 3 to 6 months after starting testosterone therapy, only 24% of veterans were assessed for symptom improvement, and 29% to 33% were evaluated for adverse effects, hematocrit levels and adherence to the therapy. The OIG report concluded that VA HCPs were not adhering to guidelines (referencing the Endocrine Society guidelines) when evaluating and treating veterans with testosterone deficiency.7
Considering the OIG recommendations and need to improve current practices among providers, VA Puget Sound Health Care System (VAPSHCS) in Washington established a multidisciplinary workgroup consisting of an endocrinologist, geriatrician, primary care provider (PCP), pharmacists, VA information technology (IT) specialist, and health products support (HPS) clinical team in the spring of 2019 to assess and improve testosterone prescribing practices.
Methods
A testosterone order template was developed, approved by VAPSHCS Pharmacy and Therapeutics Committee, and implemented on July 1, 2019, at VAPSHCS, a 1a medical facility caring for more than 112,000 veterans. Given its potential risks and the propensity for varied prescribing practices, testosterone was designated as a restricted drug requiring a prior authorization drug request (PADR) and required completion of the testosterone order template in the Computerized Patient Record System (CPRS).
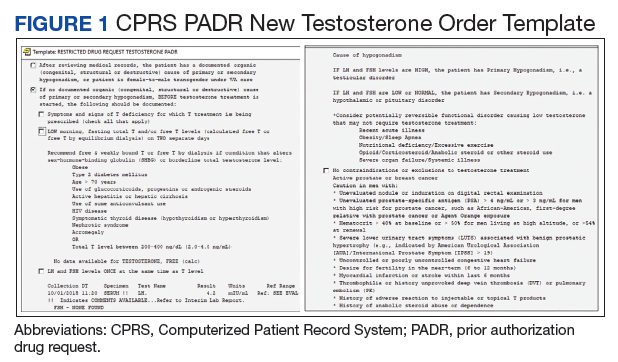
Testosterone Order Template
The testosterone order template had 2 components. Completion of the template for new testosterone orders was required to initiate treatment unless the patient had known organic hypogonadism or was a transgender male. The template ensured documentation of defined symptoms and signs of testosterone deficiency; low serum testosterone levels on at least 2 occasions and LH and FSH concentrations; no contraindications to testosterone treatment; discussion of risks and benefits of therapy; and baseline hematocrit (Figure 1). Relevant educational content (eg, risks and benefits of testosterone) was incorporated in the template. The second template was required for the first renewal of testosterone to document adherence to or reason for discontinuation of testosterone; improvement of symptoms and signs; and confirm monitoring hematocrit and testosterone levels during treatment.
Prior to implementation, the PADR template was introduced to HCPs at 2 chief-of-medicine rounds on the diagnosis and evaluation of hypogonadism by a pharmacist and endocrinologist. These educational sessions used case examples and discussions to teach the appropriate use of testosterone therapy in men with hypogonadism. The target audience was PCPs, residents, and other specialists who might prescribe testosterone.
Retrospective Chart Review
To assess the impact of the new testosterone order template on adherence to OIG recommendations, a retrospective chart review was completed comparing the appropriateness of initiating testosterone replacement therapy pretemplate period (July 1 to December 31, 2018) vs posttemplate period (July 1 to December 31, 2019). Inclusion and exclusion criteria were modeled after the 2018 OIG report to allow for comparison with the OIG study population. Eligible veterans in each time period included males who received a new testosterone prescription without having been prescribed testosterone in the previous 12 months. Exclusion criteria included community care network prescriptions (CCNRx); current testosterone prescription from a different VA site; clinic administration of testosterone in the previous 12 months; an organic hypogonadism (ie, Klinefelter syndrome) or gender dysphoria diagnosis; and whether the testosterone prescription was never dispensed (PADR was denied or veteran never had the prescription filled). Veterans who met the inclusion criteria in CPRS were identified by an algorithm developed by the VAPSHCS pharmacoeconomist.
Determining the appropriateness of testosterone prescribing, such as symptoms and laboratory measurements to confirm the diagnosis of hypogonadism, was based on the OIG report and Endocrine Society guidelines. A chart review of the 12 months before testosterone prescribing was completed for each veteran, assessing for documentation of symptoms of testosterone deficiency and laboratory measurements of serum testosterone, LH, and FSH. Also, documentation of a discussion of risks and benefits of testosterone therapy in the 3 months before prescribing was assessed, which matched the timeframe in the VA OIG report.
Interim Analysis
After initial template implementation, the multidisciplinary workgroup reconvened for a preplanned interim analysis in November 2019. The evaluation at this meeting revealed multiple order pathways in CPRS that were not linked to the PADR testosterone order template. Testosterone could be ordered in the generic order dialog, medications by drug class, and medications by alphabet, and endocrinology specialty menus without prompting to complete the testosterone order template or redirection to the restricted drug menu (Figure 2). These alternative testosterone ordering pathways were removed in early December 2019 and additional data collection was conducted for 3 months after discontinuation of alternative order pathways, the posttemplate/no alternative ordering pathways period, from December 7, 2019 to February 29, 2020.
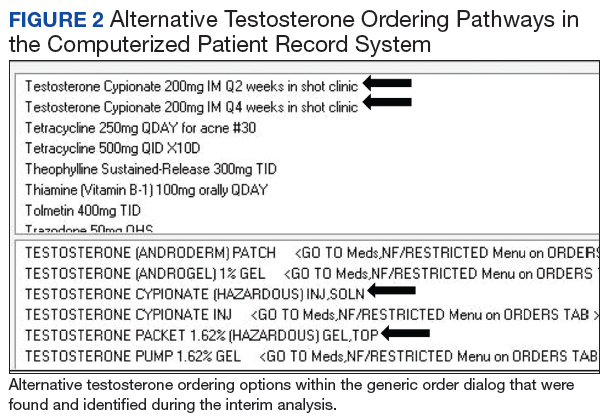
Exclusion of Previous Testosterone Prescriptions Predating Chart Review Period, Subgroup Analysis
In the OIG report and the initial retrospective chart review, only veterans without a testosterone prescription in the previous 12 months were evaluated. To assess whether a previous testosterone prescription influenced completion of the PADR and order template, a further subgroup analysis was conducted that excluded veterans who had a previous testosterone prescription at any time before the chart review periods. Therefore, “new testosterone prescription” refers to a veteran who never had a history of being on testosterone vs “former testosterone prescription,” meaning a patient could have had a previous testosterone prescription > 1 year prior to a new VA testosterone prescription.
Results
One hundred seventy-five veterans with a new testosterone prescription were identified in the pretemplate period; of these 80 (46%) met eligibility criteria; only 20 eligible veterans (25%) had a completed PADR (Figure 3). Ninety-one veterans with a new testosterone prescription were identified in the posttemplate period of which 41 (46%) veterans were eligible; 18 eligible veterans (44%) had a completed PADR, but only 7 (17%) had a completed testosterone order template.
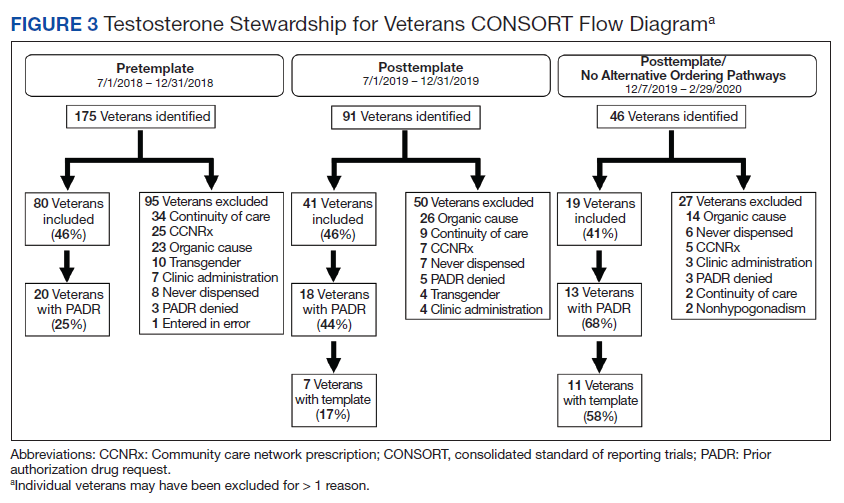
After excluding veterans who had alternative ordering pathways for testosterone, 46 veterans were identified in the posttemplate/no alternative ordering pathways period of which 19 (41%) veterans were eligible. Compared with the posttemplate period, a higher proportion of eligible veterans, 68% (13) had a completed PADR, and 58% (11) had a testosterone order template during the posttemplate/no alternative ordering pathways period.
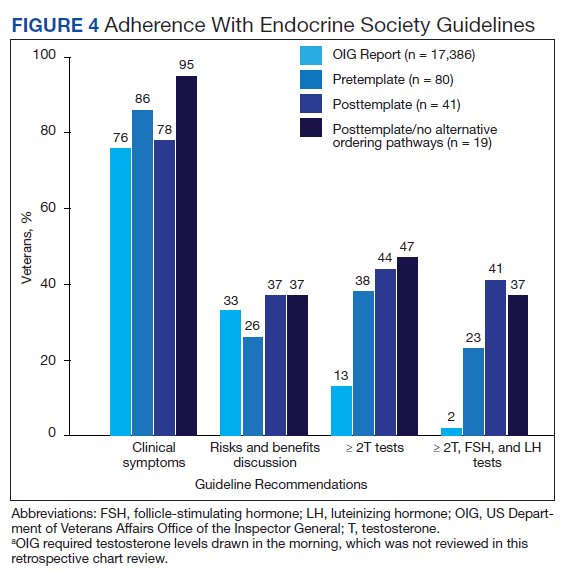
Compared with the OIG report findings, a similar percentage of veterans at VAPSHCS in the pretemplate period had documented clinical symptoms of testosterone deficiency and documented discussion of risks and benefits of testosterone therapy (Figure 4). However, a higher percentage of veterans had biochemical confirmation of testosterone deficiency with ≥ 2 low testosterone levels and evaluation of LH and FSH levels in the pretemplate period (23%) vs that in the OIG report (2%).
Compared with the pretemplate period, activation of the testosterone ordering template in the posttemplate period (Figure 4) had little effect on documented clinical symptoms and discussion of risks and benefits of testosterone treatment. However, the percentage of veterans who had ≥ 2 low testosterone levels and gonadotropins tested was higher in the posttemplate period (41%) vs both the pretemplate period and OIG report.
After removing alternative ordering pathways of testosterone, the percentages of veterans who had documented clinical symptoms, discussion of risks and benefits of testosterone, and ≥ 2 low testosterone levels and gonadotropin tests performed were similar in the posttemplate/no alternative ordering pathways vs posttemplate period.
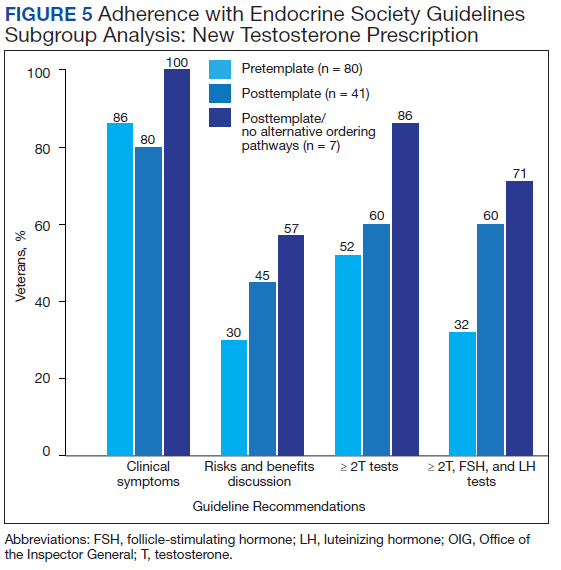
Excluding veterans who had previously received a former testosterone prescription at any time prior to chart review periods, this subgroup analysis resulted in greater adherence to Endocrine Society guidelines for testosterone treatment with introduction of the testosterone order template, particularly after removal of alternative ordering pathway (Figure 5). With the exclusion of veterans who formerly received testosterone prescriptions, the percentages of veterans who had documented clinical symptoms, discussion of risks and benefits, and ≥ 2 low testosterone levels with gonadotropin tests were higher (100%, 57%, and 71%, respectively) in the posttemplate/no alternative ordering pathways period, compared with the pretemplate period (86%, 30%, and 32%, respectively).
Discussion
The 2018 OIG report found that VA practitioners demonstrated poor adherence to evidence-based clinical practice guidelines for testosterone treatment in men with hypogonadism. Based on OIG recommendations, we developed a PADR testosterone ordering template to help HCPs improve practice by better adherence to guidelines for the diagnosis and treatment of hypogonadism in veterans. Before implementation of the PADR template, the percentage of veterans at VAPSHCS who had biochemical confirmation of hypogonadism was higher than that in the OIG report. Activation of the PADR testosterone ordering template (with or without removal of options for alternative ordering pathways of testosterone) resulted only in an improvement of laboratory confirmation and evaluation of etiology of hypogonadism. This is when we reasoned that clinicians may have access to prior records and laboratory testing beyond just the past year, and this information may have influenced their use of the PADR template. Subsequently, with exclusion of veterans who were previously prescribed testosterone, implementation of the PADR testosterone order template improved documentation of symptoms of testosterone deficiency, discussion of risks and benefits of testosterone therapy, and biochemical diagnosis and evaluation of hypogonadism relative to the period before implementation.
The lack of effects of implementing the testosterone order template on documentation of symptoms of testosterone deficiency and discussion of risks and benefits of testosterone therapy may be due to local expertise resulting in the relatively high adherence to these guideline recommendations at VAPSHCS before activation of the template vs that in the OIG report. The template improved documentation of the diagnosis and evaluation of hypogonadism for genuinely new testosterone prescriptions in veterans without a history of testosterone prescriptions; while those with a previous prescription had limited improvement. It is possible that in veterans who had testosterone prescribed previously, HCPs may have assumed or had bias that the diagnosis and evaluation of hypogonadism originally made was adequate. This finding underscores the need to develop strategies for reviewing PADR requests where there is historical testosterone use. Perhaps a clinical team member, such as a clinical pharmacist, with the background and training in guidelines for the evaluation of hypogonadism could review PADR requests in veterans with previous testosterone use.
Removal of alternative ordering pathways for testosterone increased the completion rate of PADR requests and the testosterone ordering template, although the latter was not completed in one-third of veterans. Possible reasons for HCPs’ suboptimal completion of the testosterone template despite the PADR initiation include clinicians’ lack of willingness to read the PADR completely and familiarize themselves with the clinical guidelines due to workload demands of PCPs. In addition there maybe pressure from patients to receive testosterone for age-related symptoms due to heavy marketing. In addition, there may have been pharmacists who reviewed the PADR and approved the incomplete testosterone template. At VAPSHCS there were up to 40 pharmacists during different periods reviewing the testosterone PADRs. Likely, not everyone was completely familiar with this implementation process, and a possible future consideration would be further education to staff pharmacists who are verifying these prescriptions. There were several advantages to using this new testosterone order template when HCPs attempted to order a prescription. First, they were prompted to complete the PADR. Subsequently, a pharmacist reviewed the template and approved or rejected the prescription if the template was incomplete. The completed template served as documentation in the electronic health record for the prescribing HCP. The template was constructed to populate the required laboratory tests for ease of use and documentation. In addition, educational information regarding the symptoms and signs of testosterone deficiency, laboratory tests needed to confirm and evaluate hypogonadism, contraindications to testosterone treatment, and risks and benefits of therapy were incorporated into the template to assist HCPs in understanding the requirements for a complete diagnosis and evaluation. Finally, on completion of the template, HCPs were able to order testosterone via link to various testosterone formulations.
Before its implementation, the PADR testosterone order template was introduced to PCPs and internal medicine residents at 2 case-based conferences aimed at the diagnosis and treatment of male hypogonadism. These conferences were well received and helped launch the testosterone PADR template at VAPSHCS. Similar outreach to HCPs who prescribe testosterone is highly recommended in other VA facilities before implementation of the testosterone ordering template. It is possible that more targeted education to other HCPs would have resulted in greater use of the testosterone ordering template and adherence to clinical practice guidelines.
The VAPSHCS multidisciplinary workgroup was essential for the development, implementation, evaluation, and revision of the PADR and testosterone ordering template. The workgroup met routinely to follow up on the ease of installation in CPRS and discuss technical corrections that were needed. This was an essential for quality improvement, as loopholes in CPRS were identified where the HCP could order testosterone without being prompted to use the new PADR testosterone order template (alternative ordering pathways). The workgroup swiftly informed the IT specialist and HPS team to remove alternative ordering pathways of testosterone. Continuous quality improvement evaluations are highly recommended during implementation of the template in other facilities to accommodate specific local modifications that might be needed.
After February 2020 due to the COVID-19 pandemic, the National VA Pharmacy and Medication Board halted PADR requirements. As a result, further evaluation of the New Testosterone Order template and planned initial assessment of First Renewal Testosterone Order template could not be performed. In addition, due to the COVID-19 pandemic, there was restricted in-person outpatient visits and reduced adjustments to prescribing practices. To address recommendations made in the OIG report, the VAPSHCS testosterone order template was modified into a clinical reminder dialog format by a VA National IT Specialist and HPS team, tested for usability at several VA test sites and approved by the National Clinical Template Workgroup for implementation nationally across all VAs. The National Endocrinology Ambulatory Council Workgroup will ensure that this template is adopted in a similar format when the new electronic health record system Cerner is introduced to the VA.
Conclusions
The creation and implementation of a PADR testosterone order template may be a beneficial approach to improve the diagnosis of hypogonadism and facilitate appropriate use of testosterone therapy in veterans in accordance with established clinical practice guidelines, particularly in veterans without any prior testosterone use. Key future strategies to improve testosterone prescribing should focus on identifying clinical team members, such as a local clinical pharmacist, to review and steward PADR requests to ensure that testosterone is indicated, and treatment is appropriately monitored.
1. Bhasin S, Cunningham GR, Hayes FJ, Matsumoto AM, Snyder PJ, Swerdloff RS, Montori VM; Task Force, Endocrine Society. Testosterone therapy in men with androgen deficiency syndromes: an Endocrine Society clinical practice guideline. J Clin Endocrinol Metab. 2010;95(6):2536-2559. doi:10.1210/jc.2009-2354
2. Grossmann M, Matsumoto AM. A perspective on middle-aged and older men with functional hypogonadism: focus on holistic management. J Clin Endocrinol Metab. 2017;102(3):1067-1075. doi:10.1210/jc.2016-3580
3. Baillargeon J, Urban RJ, Kuo YF, et al. Screening and monitoring in men prescribed testosterone therapy in the US, 2001-2010. Public Health Rep. 2015;130(2):143-152. doi:10.1177/003335491513000207
4. Baillargeon J, Kuo Y, Westra JR, Urban RJ, Goodwin JS. Testosterone prescribing in the United States, 2002-2016. JAMA. 2018;320(2):200-202. doi:10.1001/jama.2018.7999
5. Jasuja GK, Bhasin S, Reisman JI, Berlowitz DR, Rose AJ. Ascertainment of testosterone prescribing practices in the VA. Med Care. 2015;53(9):746-52. doi:10.1097/MLR.0000000000000398
6. Jasuja GK, Bhasin S, Rose AJ. Patterns of testosterone prescription overuse. Curr Opin Endocrinol Diabetes Obes. 2017;24(3):240-245. doi:10.1097/MED.0000000000000336
7. US Department of Veterans Affairs, Office of Inspector General. Office of Healthcare Inspections. Report No. 15-03215-154. Published April 11, 2018. Accessed February 24, 2021. https://www.va.gov/oig/pubs/VAOIG-15-03215-154.pdf
Testosterone treatment is clinically indicated when a patient presents with symptoms and signs and biochemical evidence of testosterone deficiency, ie, male hypogonadism. Laboratory confirmation of hypogonadism requires repeatedly low serum testosterone concentrations; between 8
Recent studies have reported an increase in testosterone prescriptions and raised concerns regarding health care provider (HCP) prescribing practices despite current clinical practice guidelines from major societies, such as the Endocrine Society. In the US from 2001 to 2011, testosterone use among men aged ≥ 40 years increased more than 3-fold in all age groups.3 Subsequently in the years from 2013 to 2016, prescription rates declined perhaps due to the cardiovascular and stroke concerns.4
In the US Department of Veterans Affairs (VA), new testosterone prescriptions across VA medical centers increased from 20,437 in fiscal year (FY) 2009 to 36,394 in FY 2012. Yet only 3.1% of men who received testosterone therapy had 2 or more low morning total or free testosterone concentrations measured; LH and/or FSH levels assessed; and presence of contraindications to therapy documented. Remarkably, 16.5% of these veterans did not have a testosterone level tested prior to being prescribed testosterone. Among veterans who were prescribed testosterone, 1.4% had a diagnosis of prostate cancer, 7.6% had a diagnosis of obstructive sleep apnea (OSA), and 3.5% had elevated hematocrit at baseline.5 These findings raised concerns of whether the diagnosis and etiology of hypogonadism were appropriately established and risks were considered before testosterone treatment was initiated.5,6
To further understand VA prescribing practices of testosterone therapy, a 2018 VA Office of the Inspector General (OIG) report evaluated the initiation and follow-up of testosterone replacement therapy. The OIG randomly sampled and reviewed 1,091 male patients who filled at least 1 outpatient testosterone prescription from VA in FY 2014 and who did not have a prior testosterone prescription in FY 2013. Patients were followed through September 30, 2015. Within 1 year prior to initiating testosterone, only 1.5% had clinical signs and symptoms of testosterone deficiency documented prior to testosterone testing (76% within 18 months of starting testosterone); only 9.1% of veterans had the recommended measurements of 2 low morning testosterone levels; and only 12% had LH and FSH levels measured. Within 3 to 6 months after starting testosterone therapy, only 24% of veterans were assessed for symptom improvement, and 29% to 33% were evaluated for adverse effects, hematocrit levels and adherence to the therapy. The OIG report concluded that VA HCPs were not adhering to guidelines (referencing the Endocrine Society guidelines) when evaluating and treating veterans with testosterone deficiency.7
Considering the OIG recommendations and need to improve current practices among providers, VA Puget Sound Health Care System (VAPSHCS) in Washington established a multidisciplinary workgroup consisting of an endocrinologist, geriatrician, primary care provider (PCP), pharmacists, VA information technology (IT) specialist, and health products support (HPS) clinical team in the spring of 2019 to assess and improve testosterone prescribing practices.
Methods
A testosterone order template was developed, approved by VAPSHCS Pharmacy and Therapeutics Committee, and implemented on July 1, 2019, at VAPSHCS, a 1a medical facility caring for more than 112,000 veterans. Given its potential risks and the propensity for varied prescribing practices, testosterone was designated as a restricted drug requiring a prior authorization drug request (PADR) and required completion of the testosterone order template in the Computerized Patient Record System (CPRS).
Testosterone Order Template
The testosterone order template had 2 components. Completion of the template for new testosterone orders was required to initiate treatment unless the patient had known organic hypogonadism or was a transgender male. The template ensured documentation of defined symptoms and signs of testosterone deficiency; low serum testosterone levels on at least 2 occasions and LH and FSH concentrations; no contraindications to testosterone treatment; discussion of risks and benefits of therapy; and baseline hematocrit (Figure 1). Relevant educational content (eg, risks and benefits of testosterone) was incorporated in the template. The second template was required for the first renewal of testosterone to document adherence to or reason for discontinuation of testosterone; improvement of symptoms and signs; and confirm monitoring hematocrit and testosterone levels during treatment.
Prior to implementation, the PADR template was introduced to HCPs at 2 chief-of-medicine rounds on the diagnosis and evaluation of hypogonadism by a pharmacist and endocrinologist. These educational sessions used case examples and discussions to teach the appropriate use of testosterone therapy in men with hypogonadism. The target audience was PCPs, residents, and other specialists who might prescribe testosterone.
Retrospective Chart Review
To assess the impact of the new testosterone order template on adherence to OIG recommendations, a retrospective chart review was completed comparing the appropriateness of initiating testosterone replacement therapy pretemplate period (July 1 to December 31, 2018) vs posttemplate period (July 1 to December 31, 2019). Inclusion and exclusion criteria were modeled after the 2018 OIG report to allow for comparison with the OIG study population. Eligible veterans in each time period included males who received a new testosterone prescription without having been prescribed testosterone in the previous 12 months. Exclusion criteria included community care network prescriptions (CCNRx); current testosterone prescription from a different VA site; clinic administration of testosterone in the previous 12 months; an organic hypogonadism (ie, Klinefelter syndrome) or gender dysphoria diagnosis; and whether the testosterone prescription was never dispensed (PADR was denied or veteran never had the prescription filled). Veterans who met the inclusion criteria in CPRS were identified by an algorithm developed by the VAPSHCS pharmacoeconomist.
Determining the appropriateness of testosterone prescribing, such as symptoms and laboratory measurements to confirm the diagnosis of hypogonadism, was based on the OIG report and Endocrine Society guidelines. A chart review of the 12 months before testosterone prescribing was completed for each veteran, assessing for documentation of symptoms of testosterone deficiency and laboratory measurements of serum testosterone, LH, and FSH. Also, documentation of a discussion of risks and benefits of testosterone therapy in the 3 months before prescribing was assessed, which matched the timeframe in the VA OIG report.
Interim Analysis
After initial template implementation, the multidisciplinary workgroup reconvened for a preplanned interim analysis in November 2019. The evaluation at this meeting revealed multiple order pathways in CPRS that were not linked to the PADR testosterone order template. Testosterone could be ordered in the generic order dialog, medications by drug class, and medications by alphabet, and endocrinology specialty menus without prompting to complete the testosterone order template or redirection to the restricted drug menu (Figure 2). These alternative testosterone ordering pathways were removed in early December 2019 and additional data collection was conducted for 3 months after discontinuation of alternative order pathways, the posttemplate/no alternative ordering pathways period, from December 7, 2019 to February 29, 2020.
Exclusion of Previous Testosterone Prescriptions Predating Chart Review Period, Subgroup Analysis
In the OIG report and the initial retrospective chart review, only veterans without a testosterone prescription in the previous 12 months were evaluated. To assess whether a previous testosterone prescription influenced completion of the PADR and order template, a further subgroup analysis was conducted that excluded veterans who had a previous testosterone prescription at any time before the chart review periods. Therefore, “new testosterone prescription” refers to a veteran who never had a history of being on testosterone vs “former testosterone prescription,” meaning a patient could have had a previous testosterone prescription > 1 year prior to a new VA testosterone prescription.
Results
One hundred seventy-five veterans with a new testosterone prescription were identified in the pretemplate period; of these 80 (46%) met eligibility criteria; only 20 eligible veterans (25%) had a completed PADR (Figure 3). Ninety-one veterans with a new testosterone prescription were identified in the posttemplate period of which 41 (46%) veterans were eligible; 18 eligible veterans (44%) had a completed PADR, but only 7 (17%) had a completed testosterone order template.
After excluding veterans who had alternative ordering pathways for testosterone, 46 veterans were identified in the posttemplate/no alternative ordering pathways period of which 19 (41%) veterans were eligible. Compared with the posttemplate period, a higher proportion of eligible veterans, 68% (13) had a completed PADR, and 58% (11) had a testosterone order template during the posttemplate/no alternative ordering pathways period.
Compared with the OIG report findings, a similar percentage of veterans at VAPSHCS in the pretemplate period had documented clinical symptoms of testosterone deficiency and documented discussion of risks and benefits of testosterone therapy (Figure 4). However, a higher percentage of veterans had biochemical confirmation of testosterone deficiency with ≥ 2 low testosterone levels and evaluation of LH and FSH levels in the pretemplate period (23%) vs that in the OIG report (2%).
Compared with the pretemplate period, activation of the testosterone ordering template in the posttemplate period (Figure 4) had little effect on documented clinical symptoms and discussion of risks and benefits of testosterone treatment. However, the percentage of veterans who had ≥ 2 low testosterone levels and gonadotropins tested was higher in the posttemplate period (41%) vs both the pretemplate period and OIG report.
After removing alternative ordering pathways of testosterone, the percentages of veterans who had documented clinical symptoms, discussion of risks and benefits of testosterone, and ≥ 2 low testosterone levels and gonadotropin tests performed were similar in the posttemplate/no alternative ordering pathways vs posttemplate period.
Excluding veterans who had previously received a former testosterone prescription at any time prior to chart review periods, this subgroup analysis resulted in greater adherence to Endocrine Society guidelines for testosterone treatment with introduction of the testosterone order template, particularly after removal of alternative ordering pathway (Figure 5). With the exclusion of veterans who formerly received testosterone prescriptions, the percentages of veterans who had documented clinical symptoms, discussion of risks and benefits, and ≥ 2 low testosterone levels with gonadotropin tests were higher (100%, 57%, and 71%, respectively) in the posttemplate/no alternative ordering pathways period, compared with the pretemplate period (86%, 30%, and 32%, respectively).
Discussion
The 2018 OIG report found that VA practitioners demonstrated poor adherence to evidence-based clinical practice guidelines for testosterone treatment in men with hypogonadism. Based on OIG recommendations, we developed a PADR testosterone ordering template to help HCPs improve practice by better adherence to guidelines for the diagnosis and treatment of hypogonadism in veterans. Before implementation of the PADR template, the percentage of veterans at VAPSHCS who had biochemical confirmation of hypogonadism was higher than that in the OIG report. Activation of the PADR testosterone ordering template (with or without removal of options for alternative ordering pathways of testosterone) resulted only in an improvement of laboratory confirmation and evaluation of etiology of hypogonadism. This is when we reasoned that clinicians may have access to prior records and laboratory testing beyond just the past year, and this information may have influenced their use of the PADR template. Subsequently, with exclusion of veterans who were previously prescribed testosterone, implementation of the PADR testosterone order template improved documentation of symptoms of testosterone deficiency, discussion of risks and benefits of testosterone therapy, and biochemical diagnosis and evaluation of hypogonadism relative to the period before implementation.
The lack of effects of implementing the testosterone order template on documentation of symptoms of testosterone deficiency and discussion of risks and benefits of testosterone therapy may be due to local expertise resulting in the relatively high adherence to these guideline recommendations at VAPSHCS before activation of the template vs that in the OIG report. The template improved documentation of the diagnosis and evaluation of hypogonadism for genuinely new testosterone prescriptions in veterans without a history of testosterone prescriptions; while those with a previous prescription had limited improvement. It is possible that in veterans who had testosterone prescribed previously, HCPs may have assumed or had bias that the diagnosis and evaluation of hypogonadism originally made was adequate. This finding underscores the need to develop strategies for reviewing PADR requests where there is historical testosterone use. Perhaps a clinical team member, such as a clinical pharmacist, with the background and training in guidelines for the evaluation of hypogonadism could review PADR requests in veterans with previous testosterone use.
Removal of alternative ordering pathways for testosterone increased the completion rate of PADR requests and the testosterone ordering template, although the latter was not completed in one-third of veterans. Possible reasons for HCPs’ suboptimal completion of the testosterone template despite the PADR initiation include clinicians’ lack of willingness to read the PADR completely and familiarize themselves with the clinical guidelines due to workload demands of PCPs. In addition there maybe pressure from patients to receive testosterone for age-related symptoms due to heavy marketing. In addition, there may have been pharmacists who reviewed the PADR and approved the incomplete testosterone template. At VAPSHCS there were up to 40 pharmacists during different periods reviewing the testosterone PADRs. Likely, not everyone was completely familiar with this implementation process, and a possible future consideration would be further education to staff pharmacists who are verifying these prescriptions. There were several advantages to using this new testosterone order template when HCPs attempted to order a prescription. First, they were prompted to complete the PADR. Subsequently, a pharmacist reviewed the template and approved or rejected the prescription if the template was incomplete. The completed template served as documentation in the electronic health record for the prescribing HCP. The template was constructed to populate the required laboratory tests for ease of use and documentation. In addition, educational information regarding the symptoms and signs of testosterone deficiency, laboratory tests needed to confirm and evaluate hypogonadism, contraindications to testosterone treatment, and risks and benefits of therapy were incorporated into the template to assist HCPs in understanding the requirements for a complete diagnosis and evaluation. Finally, on completion of the template, HCPs were able to order testosterone via link to various testosterone formulations.
Before its implementation, the PADR testosterone order template was introduced to PCPs and internal medicine residents at 2 case-based conferences aimed at the diagnosis and treatment of male hypogonadism. These conferences were well received and helped launch the testosterone PADR template at VAPSHCS. Similar outreach to HCPs who prescribe testosterone is highly recommended in other VA facilities before implementation of the testosterone ordering template. It is possible that more targeted education to other HCPs would have resulted in greater use of the testosterone ordering template and adherence to clinical practice guidelines.
The VAPSHCS multidisciplinary workgroup was essential for the development, implementation, evaluation, and revision of the PADR and testosterone ordering template. The workgroup met routinely to follow up on the ease of installation in CPRS and discuss technical corrections that were needed. This was an essential for quality improvement, as loopholes in CPRS were identified where the HCP could order testosterone without being prompted to use the new PADR testosterone order template (alternative ordering pathways). The workgroup swiftly informed the IT specialist and HPS team to remove alternative ordering pathways of testosterone. Continuous quality improvement evaluations are highly recommended during implementation of the template in other facilities to accommodate specific local modifications that might be needed.
After February 2020 due to the COVID-19 pandemic, the National VA Pharmacy and Medication Board halted PADR requirements. As a result, further evaluation of the New Testosterone Order template and planned initial assessment of First Renewal Testosterone Order template could not be performed. In addition, due to the COVID-19 pandemic, there was restricted in-person outpatient visits and reduced adjustments to prescribing practices. To address recommendations made in the OIG report, the VAPSHCS testosterone order template was modified into a clinical reminder dialog format by a VA National IT Specialist and HPS team, tested for usability at several VA test sites and approved by the National Clinical Template Workgroup for implementation nationally across all VAs. The National Endocrinology Ambulatory Council Workgroup will ensure that this template is adopted in a similar format when the new electronic health record system Cerner is introduced to the VA.
Conclusions
The creation and implementation of a PADR testosterone order template may be a beneficial approach to improve the diagnosis of hypogonadism and facilitate appropriate use of testosterone therapy in veterans in accordance with established clinical practice guidelines, particularly in veterans without any prior testosterone use. Key future strategies to improve testosterone prescribing should focus on identifying clinical team members, such as a local clinical pharmacist, to review and steward PADR requests to ensure that testosterone is indicated, and treatment is appropriately monitored.
1. Bhasin S, Cunningham GR, Hayes FJ, Matsumoto AM, Snyder PJ, Swerdloff RS, Montori VM; Task Force, Endocrine Society. Testosterone therapy in men with androgen deficiency syndromes: an Endocrine Society clinical practice guideline. J Clin Endocrinol Metab. 2010;95(6):2536-2559. doi:10.1210/jc.2009-2354
2. Grossmann M, Matsumoto AM. A perspective on middle-aged and older men with functional hypogonadism: focus on holistic management. J Clin Endocrinol Metab. 2017;102(3):1067-1075. doi:10.1210/jc.2016-3580
3. Baillargeon J, Urban RJ, Kuo YF, et al. Screening and monitoring in men prescribed testosterone therapy in the US, 2001-2010. Public Health Rep. 2015;130(2):143-152. doi:10.1177/003335491513000207
4. Baillargeon J, Kuo Y, Westra JR, Urban RJ, Goodwin JS. Testosterone prescribing in the United States, 2002-2016. JAMA. 2018;320(2):200-202. doi:10.1001/jama.2018.7999
5. Jasuja GK, Bhasin S, Reisman JI, Berlowitz DR, Rose AJ. Ascertainment of testosterone prescribing practices in the VA. Med Care. 2015;53(9):746-52. doi:10.1097/MLR.0000000000000398
6. Jasuja GK, Bhasin S, Rose AJ. Patterns of testosterone prescription overuse. Curr Opin Endocrinol Diabetes Obes. 2017;24(3):240-245. doi:10.1097/MED.0000000000000336
7. US Department of Veterans Affairs, Office of Inspector General. Office of Healthcare Inspections. Report No. 15-03215-154. Published April 11, 2018. Accessed February 24, 2021. https://www.va.gov/oig/pubs/VAOIG-15-03215-154.pdf
Clinical Impact of Initiation of U-500 Insulin vs Continuation of U-100 Insulin in Subjects With Diabetes
More than 70% of Americans are overweight or obese and 1 in 10 has type 2 diabetes mellitus (T2DM). In the last 20 years, the prevalence of obesity and DM has each increased drastically according to the Centers for Disease Control and Prevention.1,2 Thus, an increase in severe insulin-resistant DM is predicted. Severe insulin resistance occurs when insulin doses exceed 200 units per day or 2 units/kg per day.3-5 Treating this condition demands large volumes of U-100 insulin and a high frequency of injections (usually 4-7 per day), which can lead to reduced patient adherence.8-10 Likewise, large injected volumes are more painful and can lead to altered absorption.3,9-11
U-500 insulin (500 units/mL) is 5 times more concentrated than U-100 insulin and has advantages in the management of severe insulin-resistant DM.11-13 Its pharmacokinetic profile is unique, for the clinical effect can last for up to 24 hours.4-6 U-500 can replace basal-bolus and other complex insulin regimens, offering convenient, effective glycemic control with 2 or 3 injections per day.11,14-20 U-500 can also improve the quality of life and adherence compared with formulations that require more frequent injections.7,14,21 Historically, only exceptional or “special” cases were treated with U-500, but demand for concentrated insulins has increased in the last decade as clinicians adjust their care for this growing patient population.17
The purpose of this study was to determine whether a population of subjects with severe insulin-resistant T2DM would benefit from the use of U-500 vs U-100 insulin regimens. The hypothesis was that this population would obtain equal or better glycemic control while achieving improved adherence. Other studies have demonstrated that U-500 yields improvements in glycemic control but also potentially increases hypoglycemic episodes.15-18,22-24 To our knowledge, this study is the first to evaluate the clinical outcomes of subjects with severe insulin-resistant T2DM who changed from U-100 to U-500 vs subjects who remained on high-dose U-100 insulin.
Methods
This was a single-site, retrospective chart review of subjects with T2DM who attended the endocrinology specialty clinic at the James A. Haley Veterans’ Hospital (JAHVA) in Tampa, Florida, between July 2002 and June 2011. The study included a group of subjects using U-500 insulin and a comparison group using U-100 insulin. The study was approved by the JAHVA Research & Development Committee and by the University of South Florida Institutional Review Board.
Inclusion criteria included diagnosis of T2DM, body mass index (BMI) of more than 30, use of U-500 insulin, or > 200 units daily of U-100 insulin. Exclusion criteria included hypoglycemia unawareness, type 1 DM, and use of an insulin pump. A total of 142 subjects met the inclusion criteria (68 in the U-500 group and 74 in the U-100 group).
All study subjects had at least 1 DM education session. U-500 subjects used insulin vials and 1-mL volumetric hypodermal syringes. All U-500 prescriptions were issued electronically in units and volume (U-500 insulin was available exclusively in vials during the time frame from which data were collected). Subjects in the U-100 group used insulin vials or pen devices. Laboratory studies were processed in house by the institution using high-pressure liquid chromatography to determine hemoglobin A1C (Hb A1C) levels. All study subjects required at least 2 Hb A1C measurements over the observed 12 months for inclusion.
Transition to U-500 Insulin
U-500 transition was considered routinely and presented as an option for patients requiring > 200 units of insulin daily. The transition criteria included adherence to medications, follow-up appointments, and glucose monitoring recommendations, and ability to learn and apply insulin self-adjustment instructions. All subjects were given an additional U-500 insulin education session before transition. The endocrinologist calculated all starting doses by reducing the total daily dose by 20%.
Data Collection
Data were collected using the automatic data mining tools within the JAHVA Computerized Patient Record System and confirmed individually by clinical staff. Demographic data included age, race, and sex. Other parameters were weight; BMI; Hb A1C; estimated glomerular filtration rate (eGFR); duration of DM; use of metformin and other oral agents; total daily insulin dose; number of daily injections; prior history of atherosclerotic cardiovascular disease (ASCVD), including coronary artery disease (CAD), cerebrovascular accident (CVA), or peripheral vascular disease (PVD); occurrence of severe hypoglycemia (symptomatic hypoglycemia requiring treatment assistance from another individual) and of new cardiovascular events, classified as CAD, CVA, or PVD.
For the U-500 group, data were collected and analyzed for the 3 months before (baseline) and the 12 months after the initiation of concentrated insulin. For the U-100 group, data were collected and analyzed for the comparable 3 months before (baseline) and the 12 months after the first clinic visit in which the subject started using more than 200 units per day of U-100. Frequency of follow-up visits was individualized according to clinical needs.
Clinical Endpoints
Primary outcomes included changes in Hb A1C from baseline to the following 12 months, and the occurrence of severe hypoglycemia. Secondary outcomes included the occurrence of new ASCVD events during the study, and changes in weight, BMI, and number of injections.
Statistical Analysis
The primary and secondary outcomes were assessed through univariate and multivariate general linear models. Multivariate models were used to compare differences in the variation of Hb A1C over time. Data were incomplete for the Hb A1C in 27 subjects, 6% of the dataset (Each subject had more than one variable or observation). Therefore, a multiple imputation was used to account for the incompleteness on Hb A1C (value substitutions by the mean and by the prior Hb A1C and models were balanced against the unaltered data). A P value of ≤ .05 was used to determine statistical significance. The statistical analyses were performed using IBM SPSS Statistics 21.
Results
Most patients were male (94%) of white race (86%), with a mean age of 57 years and comparable duration of DM (Table 1). Demographics were balanced between the groups, except for weight and BMI, both higher in the U-500 group (P < .001). Use of oral antidiabetic agents was not significantly different between groups, nor were comorbid conditions, with nearly 50% of subjects in each group affected by CKD and ASCVD, of which CAD was the most common (approximately 40% of both groups). Only about one-third of subjects used metformin and/or other oral agents, likely due to the high prevalence of CKD (contraindicating metformin) and high insulin requirements (due to correlation with β cell failure). A subgroup analysis of subjects on metformin did not demonstrate significant differences in risk of severe hypoglycemia or in Hb A1C levels (data not shown).
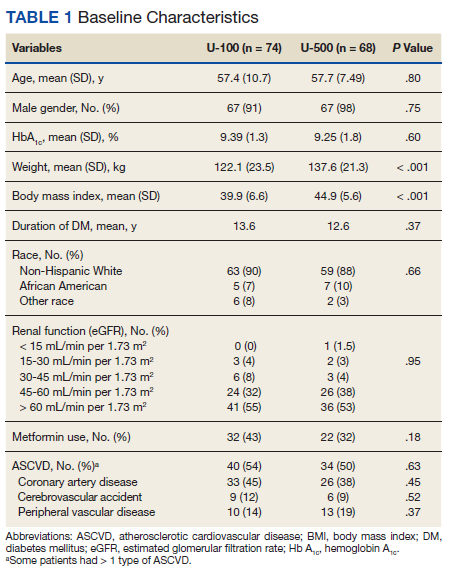
Both groups had similar initial Hb A1C baselines (> 9%) and both improved glycemic control during the study period. However, the Hb A1C reduction was greater in the U-500 group (P= .034), 0.84% vs 0.56% for U-100 and the between-groups difference was 0.4%. (Figure 1, Tables 2 and 3).
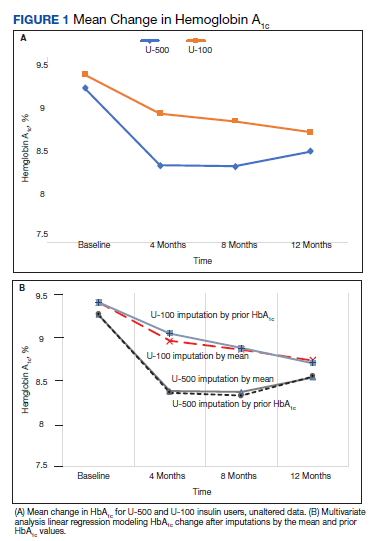
The univariate general linear model shows a statistically significant difference in the levels of Hb A1C within each treatment group, regardless of the imputation strategy. However, the differences were not significant when comparing postintervention Hb A1C means between groups with unaltered data (P = .23), because the U-500 group Hb A1C improvement gap narrowed at the end of study. In the multivariate analysis, irrespective of imputation method, the differences in Hb A1C between group treated with U-100 and U-500 were statistically significant (Table 3).
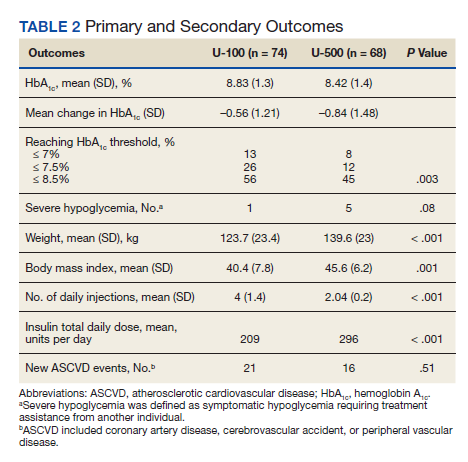
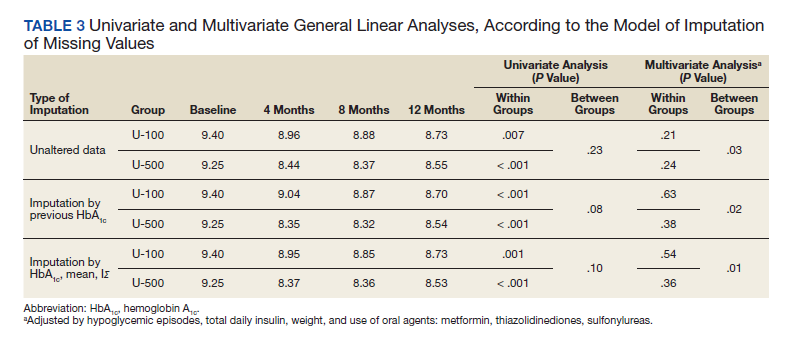
Overall, more subjects in the U-500 group than in the U-100 group achieved Hb A1C levels < 8.5% (56% vs 46%, respectively, P = .003) and the proportion of subjects achieving Hb A1C levels < 7.5% doubled that of the U-100 group (26% vs 12%; Figure 2). Five subjects in the U-500 group experienced severe hypoglycemia, compared with 1 in the U-100 group (P = .08). The total daily insulin dose was significantly higher in the U-500 group (296 units daily) than in the U-100 group (209 units daily) (P < .001) (Table 2). Baseline weight and BMI differences were also significant for the U-500 and U-100 groups (P < .001). Weight gain of approximately 2 kg occurred in both groups, a change that was not statistically significant (P = .79)
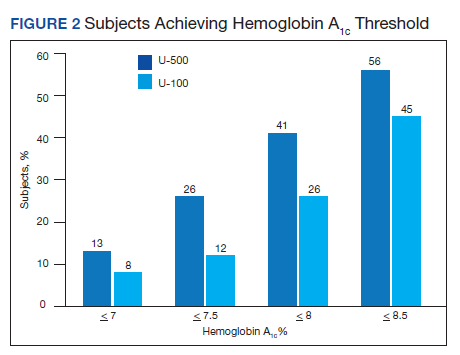
There were 21 new ASCVD events in the U-100 and 16 in the U-500 group (P = .51) and there were no statistically significant differences in the incidence of new CAD, PVD or CVA events. The U-500 group required significantly fewer injections than U-100 insulin users (2 vs 4; P < .001).
Discussion
The purpose of the study was to compare subjects with obesity and T2DM using U-500 concentrated insulin with similarly matched subjects using U-100 insulin. Available studies using U-500 insulin, including prospective trials, have reported the experience after transitioning patients who “failed” U-100 regimens.13-16,18,21-24 This failure is a relative and transient condition that, in theory, could be improved with medical intervention and lifestyle changes. Such changes cannot be easily quantified in a clinical trial or retrospective study without a control group. This study was an attempt to fill this knowledge gap.
The U-500 intervention resulted in a 0.8% overall reduction in Hb A1C and a significant 0.4% reduction compared to subjects using U-100. While both groups had improvement in Hb A1C , U-500 was associated with superior reductions in Hb A1C . This finding confirms prior assertions that U-500, compared with U-100, is associated with larger Hb A1C improvement.14-16
The preintervention and postintervention Hb A1C means were > 8% in both groups. This finding suggests that lowering Hb A1C is challenging, similar to published results demonstrating that Hb A1C levels < 7% are achieved by fewer than one-third of U-500 users.16-18 The explanation for this finding remains elusive, due to the methodologic limitations of a retrospective analysis. A possible explanation is the high prevalence of CKD and ASCVD among the study population, conditions which, according to guidelines justify less aggressive glycemic control efforts.25 Multiple prior studies using retrospective data8,13-16 and 2 prospective trials18,22 demonstrated similar Hb A1C reductions after failure of U-100 regimens.
In this study, U-500 resulted in a nominal increase in the risk of severe hypoglycemic episodes. A detailed review of the events found that most of these patients had preestablished CKD and ASCVD, and half of the subjects with sever hypoglycemic episodes had new vascular events during the study (Appendix). These findings suggest a possible correlation between CKD and ASCVD complications and the risk of severe hypoglycemic events. Pharmacokinetic profiles for U-500 have not been studied in subjects with CKD, but the clinical effect of CKD is likely prolonged by the expected reduction in insulin clearance. Similarly, the frailty associated with preexisting ASCVD, or the related polypharmacy, could be factors increasing the risk of hypoglycemia and deserve further study.
Most of the U-500 subjects used it twice daily in this study, which could have contributed to the higher hypoglycemia rate. In a prospective randomized trial Hood and colleagues reported a rate of symptomatic hypoglycemia exceeding 90% in the 2 study groups, and 8 subjects (of 325 total) had severe hypoglycemia during the 6-month observation. The group assigned to 2 daily injections had a significantly higher rate of hypoglycemic events compared with a group that had 3 injections per day.18 Additional studies are required to ascertain whether U-500, compared with specific U-100 regimens (basal-bolus vs premixed; human vs insulin analogs), results in a higher risk of severe hypoglycemia.
This study also investigated the incidence of new cardiovascular events, and no difference was found between the 2 groups. A longer observation would be required to better assess whether U-500 therapy can reduce the incidence of microvascular and macrovascular complications. The similar incidence of complications is further evidence of the similarity between the 2 studied groups. It was also reassuring to find that weight gains were small and nearly identical in both insulin groups.
Strengths and Limitations
This study has several limitations. Data about hospitalizations for congestive heart failure, amputations, progression of diabetic retinopathy, neuropathy, and nephropathy were not collected for this analysis. As both groups of subjects were relatively small, statistical power to assess outcomes is a concern. Retrospective chart reviews may also be affected by incomplete data collections and multiple biases. No data were available for other hypoglycemic episodes, especially to calculate the rate of the more common forms of hypoglycemia. The period of data analyzed spanned only about 15 months. A longer, longitudinal assessment of the differences between these 2 groups may yield more differences, and clearer results and conclusions. Moreover, the data set had aged before publication of this report; however, the authors think that the analysis and information remain highly clinically relevant. The uncommon use of U-500, and prominence as a “special case” insulin may also lead to a detection bias for severe hypoglycemia in the U-500 group. In contrast, lapses in documentation of hypoglycemia in subjects using U-100 could have occurred. Finally, the differences in total daily dose and body weight among groups were significant and may reflect on important physiologic differences between the 2 groups that may affect the reproducibility of our results.
Nevertheless, this study had notable strengths. Comparing U-500 insulin users with similar subjects using U-100 over a period of time provides head-to-head data with potentially important clinical utility. Also, we collected and analyzed a sizable number of clinically important variables, including cardiovascular risk factors, the occurrence of new cardiovascular events, and prevalence of renal disease. The use of linear regression and multivariate analysis using multiple models also strengthened the results. Previous studies compared the outcomes in subjects using U-500 insulin with only their historical selves.8,13-16,18,19,22-25 Therefore, these studies analyzed the data for preconversion and postconversion of U-500 only and consistently favored U-500. This design in a retrospective study cannot eliminate the selection and/or intervention biases, as the subjects of study had inevitably “failed” prior therapies. Similarly, there is no prospective clinical trial data comparing patients on U-500 with patients on high doses of U-100 insulin. Finally, the patients in our study had high rates of comorbidities, which may have increased the applicability of our results to those of “real-life” patients in the community. To our knowledge, no other study has attempted a similar study design approach either prospectively or retrospectively.
Conclusions
In this population of elderly veterans with severely insulin-resistant T2DM, with a high incidence of CKD and ASCVD, U-500 insulin was associated with significantly greater reductions in Hb A1C than U-100 insulin-based regimens, while requiring fewer injections. No difference was noted in the incidence of new ASCVD events. More studies are needed to assess whether U-500 may increase the risk of severe hypoglycemic episodes.
Acknowledgments
The authors recognize the invaluable help provided by the editorial staff of University of South Florida IMpact, the Intramural Review to Support Research and Scientific Publication, and especially to Richard F. Lockey, MD, who has mentored us in this beautiful journey of scientific writing and for his editorial assistance. A portion of this study preliminary data was presented as an abstract at ENDO 2013, The Endocrine Society Annual meeting in San Francisco, CA, June 15-18, 2013.
Appendix. Severe Hypoglycemic Events
Subject 1: U-500 user, 61-year-old African American male. Hypoglycemia occurred during fasting and was associated with a seizure-like event 9 months after transition to concentrated insulin. He was taken by ambulance to a local hospital. No additional data were obtained. Hb A1C was 8.2% in the month before the episode (lowest of the studied period) and increased to 9.1% in the last segment of the study.
Subject 2: U-500 user, 57-year-old white male. The severe hypoglycemic episode occurred approximately 8 months after transition. His Hb A1C was 5.6% around the time of the event, the lowest of the studied period, and increased to 6.8% over the next 4 months. No other data were available.
Subject 3: U-500 user, 67-year-old white male. The event occurred at home in the morning while fasting, 3 months after transition. He was assisted by his family. Hb A1C was 7.1% 10 weeks after the event and was 7% at the end of the studied period. He had a history of CKD and PVD.
Subject 4: U-500 user, 68-year-old white male. He presented with altered consciousness, hypoglycemia, and elevated troponin levels, which was later confirmed as a non-ST elevation myocardial infarction (NSTEMI), 7 months after transition. Hb A1C during the events was 7.1% and was followed by a 9.3% level 9 weeks later. He had history of CKD and PVD.
Subject 5: U-500 user, 67-year-old white man. Hypoglycemia occurred 6 months after transition to U-500. Hb A1C was 8.4% 2 months prior, and was followed by a 7% during the admission for severe hypoglycemia. 3 months later, his HbA1c rose to 8.2%. He had an extensive history of CAD and had a NSTEMI during the study period.
Subject 6: U-100 user, 65-year-old white man. He was found unconscious in the morning while fasting, 6 months after his first clinic visit. He had CKD and advanced ASCVD with prior CAD, PVD, and CVA. He had also had a recent CVA that had affected his movement and cognition.
1. Hales CM, Carroll MD, Fryar CD, Ogden CL. Prevalence of obesity among adults and youth: United States, 2015–2016. NCHS data brief no. 288. Published October 2017. Accessed January 29, 2021. https://www.cdc.gov/nchs/products/databriefs/db288.htm
2. Centers for Disease Control and Prevention. Diabetes and prediabetes: CDC works to prevent type 2 diabetes and improve the health of all people with diabetes. Updated November 30, 2020. Accessed February 17, 2021. https://www.cdc.gov/chronicdisease/resources/publications/factsheets/diabetes-prediabetes.htm
3. Cochran E, Gorden P. Use of U-500 insulin in the treatment of severe insulin resistance. Insulin. 2008;3(4):211-218 [Published correction appears in Insulin. 2009;4(1):81]. doi:10.1016/S1557-0843(08)80049-8
4. Shrestha RT, Kumar AF, Taddese A, et al. Duration and onset of action of high dose U-500 regular insulin in severely insulin resistant subjects with type 2 diabetes. Endocrinol Diabetes Metab. 2018;1(4):e00041. Published 2018 Sep 10. doi:10.1002/edm2.41
5. Dailey AM, Tannock LR. Extreme insulin resistance: indications and approaches to the use of U-500 insulin in type 2 diabetes mellitus. Curr Diab Rep. 2011;11(2):77-82. doi:10.1007/s11892-010-0167-6
6. de la Peña A, Riddle M, Morrow LA, et al. Pharmacokinetics and pharmacodynamics of high-dose human regular U-500 insulin versus human regular U-100 insulin in healthy obese subjects [published correction appears in Diabetes Care. 2014 Aug;37(8):2414]. Diabetes Care. 2011;34(12):2496-2501. doi:10.2337/dc11-0721
7. Brusko C, Jackson JA, de la Peña A. Comparative properties of U-500 and U-100 regular human insulin. Am J Health Syst Pharm. 2013;70(15):1283-1284. doi:10.2146/130117
8. Dailey AM, Williams S, Taneja D, Tannock LR. Clinical efficacy and patient satisfaction with U-500 insulin use. Diabetes Res Clin Pract. 2010;88(3):259-264. doi:10.1016/j.diabres.2010.02.012
9. Wysham C, Hood RC, Warren ML, Wang T, Morwick TM, Jackson JA. Effect of total daily dose on efficacy, dosing, and safety of 2 dose titration regimens of human regular U-500 insulin in severely insulin-resistant patients with type 2 diabetes. Endocr Pract. 2010;22(6):653-665. doi:10.4158/EP15959.OR
10. Gagnon-Auger M, du Souich P, Baillargeon JP, et al. Dose-dependent delay of the hypoglycemic effect of short-acting insulin analogs in obese subjects with type 2 diabetes: a pharmacokinetic and pharmacodynamic study. Diabetes Care. 2010;33(12):2502-2507. doi:10.2337/dc10-1126
11. Schloot NC, Hood RC, Corrigan SM, Panek RL, Heise T. Concentrated insulins in current clinical practice. Diabetes Res Clin Pract. 2019;148:93-101. doi:10.1016/j.diabres.2018.12.007
12. Lane WS, Cochran EK, Jackson JA, et al. High-dose insulin therapy: is it time for U-500 insulin?. Endocr Pract. 2009;15(1):71-79. doi:10.4158/EP.15.1.71
13. Boldo A, Comi RJ. Clinical experience with U500 insulin: risks and benefits. Endocr Pract. 2012;18(1):56-61. doi:10.4158/EP11163.OR
14. Granata JA, Nawarskas AD, Resch ND, Vigil JM. Evaluating the effect of u-500 insulin therapy on glycemic control in veterans with type 2 diabetes. Clin Diabetes. 2015;33(1):14-19. doi:10.2337/diaclin.33.1.14
15. Eby EL, Zagar AJ, Wang P, et al. Healthcare costs and adherence associated with human regular U-500 versus high-dose U-100 insulin in patients with diabetes. Endocr Pract. 2014;20(7):663-670. doi:10.4158/EP13407.OR
16. Eby EL, Curtis BH, Gelwicks SC, et al. Initiation of human regular U-500 insulin use is associated with improved glycemic control: a real-world US cohort study. BMJ Open Diabetes Res Care. 2015;3(1):e000074. Published 2015 Apr 30. doi:10.1136/bmjdrc-2014-000074
17. Jones P, Idris I. The use of U-500 regular insulin in the management of patients with obesity and insulin resistance. Diabetes Obes Metab. 2013;15(10):882-887. doi:10.1111/dom.12094
18. Hood RC, Arakaki RF, Wysham C, Li YG, Settles JA, Jackson JA. Two treatment approaches for human regular U-500 insulin in patients with type 2 diabetes not achieving adequate glycemic control on high-dose U-100 insulin therapy with or without oral agents: a randomized, titration-to-target clinical trial. Endocr Pract. 2015;21(7):782-793. doi: 10.4158/EP15612.OR
19. Ballani P, Tran MT, Navar MD, Davidson MB. Clinical experience with U-500 regular insulin in obese, markedly insulin-resistant type 2 diabetic patients [published correction appears in Diabetes Care. 2007 Feb;30(2):455]. Diabetes Care. 2006;29(11):2504-2505. doi:10.2337/dc06-1478
20. Davidson MB, Navar MD, Echeverry D, Duran P. U-500 regular insulin: clinical experience and pharmacokinetics in obese, severely insulin-resistant type 2 diabetic patients. Diabetes Care. 2010;33(2):281-283. doi:10.2337/dc09-1490
21. Bulchandani DG, Konrady T, Hamburg MS. Clinical efficacy and patient satisfaction with U-500 insulin pump therapy in patients with type 2 diabetes. Endocr Pract. 2007;13(7):721-725. doi:10.4158/EP.13.7.721
22. Lane WS, Weinrib SL, Rappaport JM, Przestrzelski T. A prospective trial of U500 insulin delivered by Omnipod in patients with type 2 diabetes mellitus and severe insulin resistance [published correction appears in Endocr Pract. 2010 Nov-Dec;16(6):1082]. Endocr Pract. 2010;16(5):778-784. doi:10.4158/EP10014.OR
23. Martin C, Perez-Molinar D, Shah M, Billington C. U500 Disposable Patch Insulin Pump: Results and Discussion of a Veterans Affairs Pilot Study. J Endocr Soc. 2018;2(11):1275-1283. Published 2018 Sep 17. doi:10.1210/js.2018-00198
24. Ziesmer AE, Kelly KC, Guerra PA, George KG, Dunn FL. U500 regular insulin use in insulin-resistant type 2 diabetic veteran patients. Endocr Pract. 2012;18(1):34-38. doi:10.4158/EP11043.OR
25. American Diabetes Association. 6. Glycemic Targets: Standards of Medical Care in Diabetes-2019. Diabetes Care. 2019;42(Suppl 1):S61-S70. doi:10.2337/dc19-S006
More than 70% of Americans are overweight or obese and 1 in 10 has type 2 diabetes mellitus (T2DM). In the last 20 years, the prevalence of obesity and DM has each increased drastically according to the Centers for Disease Control and Prevention.1,2 Thus, an increase in severe insulin-resistant DM is predicted. Severe insulin resistance occurs when insulin doses exceed 200 units per day or 2 units/kg per day.3-5 Treating this condition demands large volumes of U-100 insulin and a high frequency of injections (usually 4-7 per day), which can lead to reduced patient adherence.8-10 Likewise, large injected volumes are more painful and can lead to altered absorption.3,9-11
U-500 insulin (500 units/mL) is 5 times more concentrated than U-100 insulin and has advantages in the management of severe insulin-resistant DM.11-13 Its pharmacokinetic profile is unique, for the clinical effect can last for up to 24 hours.4-6 U-500 can replace basal-bolus and other complex insulin regimens, offering convenient, effective glycemic control with 2 or 3 injections per day.11,14-20 U-500 can also improve the quality of life and adherence compared with formulations that require more frequent injections.7,14,21 Historically, only exceptional or “special” cases were treated with U-500, but demand for concentrated insulins has increased in the last decade as clinicians adjust their care for this growing patient population.17
The purpose of this study was to determine whether a population of subjects with severe insulin-resistant T2DM would benefit from the use of U-500 vs U-100 insulin regimens. The hypothesis was that this population would obtain equal or better glycemic control while achieving improved adherence. Other studies have demonstrated that U-500 yields improvements in glycemic control but also potentially increases hypoglycemic episodes.15-18,22-24 To our knowledge, this study is the first to evaluate the clinical outcomes of subjects with severe insulin-resistant T2DM who changed from U-100 to U-500 vs subjects who remained on high-dose U-100 insulin.
Methods
This was a single-site, retrospective chart review of subjects with T2DM who attended the endocrinology specialty clinic at the James A. Haley Veterans’ Hospital (JAHVA) in Tampa, Florida, between July 2002 and June 2011. The study included a group of subjects using U-500 insulin and a comparison group using U-100 insulin. The study was approved by the JAHVA Research & Development Committee and by the University of South Florida Institutional Review Board.
Inclusion criteria included diagnosis of T2DM, body mass index (BMI) of more than 30, use of U-500 insulin, or > 200 units daily of U-100 insulin. Exclusion criteria included hypoglycemia unawareness, type 1 DM, and use of an insulin pump. A total of 142 subjects met the inclusion criteria (68 in the U-500 group and 74 in the U-100 group).
All study subjects had at least 1 DM education session. U-500 subjects used insulin vials and 1-mL volumetric hypodermal syringes. All U-500 prescriptions were issued electronically in units and volume (U-500 insulin was available exclusively in vials during the time frame from which data were collected). Subjects in the U-100 group used insulin vials or pen devices. Laboratory studies were processed in house by the institution using high-pressure liquid chromatography to determine hemoglobin A1C (Hb A1C) levels. All study subjects required at least 2 Hb A1C measurements over the observed 12 months for inclusion.
Transition to U-500 Insulin
U-500 transition was considered routinely and presented as an option for patients requiring > 200 units of insulin daily. The transition criteria included adherence to medications, follow-up appointments, and glucose monitoring recommendations, and ability to learn and apply insulin self-adjustment instructions. All subjects were given an additional U-500 insulin education session before transition. The endocrinologist calculated all starting doses by reducing the total daily dose by 20%.
Data Collection
Data were collected using the automatic data mining tools within the JAHVA Computerized Patient Record System and confirmed individually by clinical staff. Demographic data included age, race, and sex. Other parameters were weight; BMI; Hb A1C; estimated glomerular filtration rate (eGFR); duration of DM; use of metformin and other oral agents; total daily insulin dose; number of daily injections; prior history of atherosclerotic cardiovascular disease (ASCVD), including coronary artery disease (CAD), cerebrovascular accident (CVA), or peripheral vascular disease (PVD); occurrence of severe hypoglycemia (symptomatic hypoglycemia requiring treatment assistance from another individual) and of new cardiovascular events, classified as CAD, CVA, or PVD.
For the U-500 group, data were collected and analyzed for the 3 months before (baseline) and the 12 months after the initiation of concentrated insulin. For the U-100 group, data were collected and analyzed for the comparable 3 months before (baseline) and the 12 months after the first clinic visit in which the subject started using more than 200 units per day of U-100. Frequency of follow-up visits was individualized according to clinical needs.
Clinical Endpoints
Primary outcomes included changes in Hb A1C from baseline to the following 12 months, and the occurrence of severe hypoglycemia. Secondary outcomes included the occurrence of new ASCVD events during the study, and changes in weight, BMI, and number of injections.
Statistical Analysis
The primary and secondary outcomes were assessed through univariate and multivariate general linear models. Multivariate models were used to compare differences in the variation of Hb A1C over time. Data were incomplete for the Hb A1C in 27 subjects, 6% of the dataset (Each subject had more than one variable or observation). Therefore, a multiple imputation was used to account for the incompleteness on Hb A1C (value substitutions by the mean and by the prior Hb A1C and models were balanced against the unaltered data). A P value of ≤ .05 was used to determine statistical significance. The statistical analyses were performed using IBM SPSS Statistics 21.
Results
Most patients were male (94%) of white race (86%), with a mean age of 57 years and comparable duration of DM (Table 1). Demographics were balanced between the groups, except for weight and BMI, both higher in the U-500 group (P < .001). Use of oral antidiabetic agents was not significantly different between groups, nor were comorbid conditions, with nearly 50% of subjects in each group affected by CKD and ASCVD, of which CAD was the most common (approximately 40% of both groups). Only about one-third of subjects used metformin and/or other oral agents, likely due to the high prevalence of CKD (contraindicating metformin) and high insulin requirements (due to correlation with β cell failure). A subgroup analysis of subjects on metformin did not demonstrate significant differences in risk of severe hypoglycemia or in Hb A1C levels (data not shown).
Both groups had similar initial Hb A1C baselines (> 9%) and both improved glycemic control during the study period. However, the Hb A1C reduction was greater in the U-500 group (P= .034), 0.84% vs 0.56% for U-100 and the between-groups difference was 0.4%. (Figure 1, Tables 2 and 3).
The univariate general linear model shows a statistically significant difference in the levels of Hb A1C within each treatment group, regardless of the imputation strategy. However, the differences were not significant when comparing postintervention Hb A1C means between groups with unaltered data (P = .23), because the U-500 group Hb A1C improvement gap narrowed at the end of study. In the multivariate analysis, irrespective of imputation method, the differences in Hb A1C between group treated with U-100 and U-500 were statistically significant (Table 3).
Overall, more subjects in the U-500 group than in the U-100 group achieved Hb A1C levels < 8.5% (56% vs 46%, respectively, P = .003) and the proportion of subjects achieving Hb A1C levels < 7.5% doubled that of the U-100 group (26% vs 12%; Figure 2). Five subjects in the U-500 group experienced severe hypoglycemia, compared with 1 in the U-100 group (P = .08). The total daily insulin dose was significantly higher in the U-500 group (296 units daily) than in the U-100 group (209 units daily) (P < .001) (Table 2). Baseline weight and BMI differences were also significant for the U-500 and U-100 groups (P < .001). Weight gain of approximately 2 kg occurred in both groups, a change that was not statistically significant (P = .79)
There were 21 new ASCVD events in the U-100 and 16 in the U-500 group (P = .51) and there were no statistically significant differences in the incidence of new CAD, PVD or CVA events. The U-500 group required significantly fewer injections than U-100 insulin users (2 vs 4; P < .001).
Discussion
The purpose of the study was to compare subjects with obesity and T2DM using U-500 concentrated insulin with similarly matched subjects using U-100 insulin. Available studies using U-500 insulin, including prospective trials, have reported the experience after transitioning patients who “failed” U-100 regimens.13-16,18,21-24 This failure is a relative and transient condition that, in theory, could be improved with medical intervention and lifestyle changes. Such changes cannot be easily quantified in a clinical trial or retrospective study without a control group. This study was an attempt to fill this knowledge gap.
The U-500 intervention resulted in a 0.8% overall reduction in Hb A1C and a significant 0.4% reduction compared to subjects using U-100. While both groups had improvement in Hb A1C , U-500 was associated with superior reductions in Hb A1C . This finding confirms prior assertions that U-500, compared with U-100, is associated with larger Hb A1C improvement.14-16
The preintervention and postintervention Hb A1C means were > 8% in both groups. This finding suggests that lowering Hb A1C is challenging, similar to published results demonstrating that Hb A1C levels < 7% are achieved by fewer than one-third of U-500 users.16-18 The explanation for this finding remains elusive, due to the methodologic limitations of a retrospective analysis. A possible explanation is the high prevalence of CKD and ASCVD among the study population, conditions which, according to guidelines justify less aggressive glycemic control efforts.25 Multiple prior studies using retrospective data8,13-16 and 2 prospective trials18,22 demonstrated similar Hb A1C reductions after failure of U-100 regimens.
In this study, U-500 resulted in a nominal increase in the risk of severe hypoglycemic episodes. A detailed review of the events found that most of these patients had preestablished CKD and ASCVD, and half of the subjects with sever hypoglycemic episodes had new vascular events during the study (Appendix). These findings suggest a possible correlation between CKD and ASCVD complications and the risk of severe hypoglycemic events. Pharmacokinetic profiles for U-500 have not been studied in subjects with CKD, but the clinical effect of CKD is likely prolonged by the expected reduction in insulin clearance. Similarly, the frailty associated with preexisting ASCVD, or the related polypharmacy, could be factors increasing the risk of hypoglycemia and deserve further study.
Most of the U-500 subjects used it twice daily in this study, which could have contributed to the higher hypoglycemia rate. In a prospective randomized trial Hood and colleagues reported a rate of symptomatic hypoglycemia exceeding 90% in the 2 study groups, and 8 subjects (of 325 total) had severe hypoglycemia during the 6-month observation. The group assigned to 2 daily injections had a significantly higher rate of hypoglycemic events compared with a group that had 3 injections per day.18 Additional studies are required to ascertain whether U-500, compared with specific U-100 regimens (basal-bolus vs premixed; human vs insulin analogs), results in a higher risk of severe hypoglycemia.
This study also investigated the incidence of new cardiovascular events, and no difference was found between the 2 groups. A longer observation would be required to better assess whether U-500 therapy can reduce the incidence of microvascular and macrovascular complications. The similar incidence of complications is further evidence of the similarity between the 2 studied groups. It was also reassuring to find that weight gains were small and nearly identical in both insulin groups.
Strengths and Limitations
This study has several limitations. Data about hospitalizations for congestive heart failure, amputations, progression of diabetic retinopathy, neuropathy, and nephropathy were not collected for this analysis. As both groups of subjects were relatively small, statistical power to assess outcomes is a concern. Retrospective chart reviews may also be affected by incomplete data collections and multiple biases. No data were available for other hypoglycemic episodes, especially to calculate the rate of the more common forms of hypoglycemia. The period of data analyzed spanned only about 15 months. A longer, longitudinal assessment of the differences between these 2 groups may yield more differences, and clearer results and conclusions. Moreover, the data set had aged before publication of this report; however, the authors think that the analysis and information remain highly clinically relevant. The uncommon use of U-500, and prominence as a “special case” insulin may also lead to a detection bias for severe hypoglycemia in the U-500 group. In contrast, lapses in documentation of hypoglycemia in subjects using U-100 could have occurred. Finally, the differences in total daily dose and body weight among groups were significant and may reflect on important physiologic differences between the 2 groups that may affect the reproducibility of our results.
Nevertheless, this study had notable strengths. Comparing U-500 insulin users with similar subjects using U-100 over a period of time provides head-to-head data with potentially important clinical utility. Also, we collected and analyzed a sizable number of clinically important variables, including cardiovascular risk factors, the occurrence of new cardiovascular events, and prevalence of renal disease. The use of linear regression and multivariate analysis using multiple models also strengthened the results. Previous studies compared the outcomes in subjects using U-500 insulin with only their historical selves.8,13-16,18,19,22-25 Therefore, these studies analyzed the data for preconversion and postconversion of U-500 only and consistently favored U-500. This design in a retrospective study cannot eliminate the selection and/or intervention biases, as the subjects of study had inevitably “failed” prior therapies. Similarly, there is no prospective clinical trial data comparing patients on U-500 with patients on high doses of U-100 insulin. Finally, the patients in our study had high rates of comorbidities, which may have increased the applicability of our results to those of “real-life” patients in the community. To our knowledge, no other study has attempted a similar study design approach either prospectively or retrospectively.
Conclusions
In this population of elderly veterans with severely insulin-resistant T2DM, with a high incidence of CKD and ASCVD, U-500 insulin was associated with significantly greater reductions in Hb A1C than U-100 insulin-based regimens, while requiring fewer injections. No difference was noted in the incidence of new ASCVD events. More studies are needed to assess whether U-500 may increase the risk of severe hypoglycemic episodes.
Acknowledgments
The authors recognize the invaluable help provided by the editorial staff of University of South Florida IMpact, the Intramural Review to Support Research and Scientific Publication, and especially to Richard F. Lockey, MD, who has mentored us in this beautiful journey of scientific writing and for his editorial assistance. A portion of this study preliminary data was presented as an abstract at ENDO 2013, The Endocrine Society Annual meeting in San Francisco, CA, June 15-18, 2013.
Appendix. Severe Hypoglycemic Events
Subject 1: U-500 user, 61-year-old African American male. Hypoglycemia occurred during fasting and was associated with a seizure-like event 9 months after transition to concentrated insulin. He was taken by ambulance to a local hospital. No additional data were obtained. Hb A1C was 8.2% in the month before the episode (lowest of the studied period) and increased to 9.1% in the last segment of the study.
Subject 2: U-500 user, 57-year-old white male. The severe hypoglycemic episode occurred approximately 8 months after transition. His Hb A1C was 5.6% around the time of the event, the lowest of the studied period, and increased to 6.8% over the next 4 months. No other data were available.
Subject 3: U-500 user, 67-year-old white male. The event occurred at home in the morning while fasting, 3 months after transition. He was assisted by his family. Hb A1C was 7.1% 10 weeks after the event and was 7% at the end of the studied period. He had a history of CKD and PVD.
Subject 4: U-500 user, 68-year-old white male. He presented with altered consciousness, hypoglycemia, and elevated troponin levels, which was later confirmed as a non-ST elevation myocardial infarction (NSTEMI), 7 months after transition. Hb A1C during the events was 7.1% and was followed by a 9.3% level 9 weeks later. He had history of CKD and PVD.
Subject 5: U-500 user, 67-year-old white man. Hypoglycemia occurred 6 months after transition to U-500. Hb A1C was 8.4% 2 months prior, and was followed by a 7% during the admission for severe hypoglycemia. 3 months later, his HbA1c rose to 8.2%. He had an extensive history of CAD and had a NSTEMI during the study period.
Subject 6: U-100 user, 65-year-old white man. He was found unconscious in the morning while fasting, 6 months after his first clinic visit. He had CKD and advanced ASCVD with prior CAD, PVD, and CVA. He had also had a recent CVA that had affected his movement and cognition.
1. Hales CM, Carroll MD, Fryar CD, Ogden CL. Prevalence of obesity among adults and youth: United States, 2015–2016. NCHS data brief no. 288. Published October 2017. Accessed January 29, 2021. https://www.cdc.gov/nchs/products/databriefs/db288.htm
2. Centers for Disease Control and Prevention. Diabetes and prediabetes: CDC works to prevent type 2 diabetes and improve the health of all people with diabetes. Updated November 30, 2020. Accessed February 17, 2021. https://www.cdc.gov/chronicdisease/resources/publications/factsheets/diabetes-prediabetes.htm
3. Cochran E, Gorden P. Use of U-500 insulin in the treatment of severe insulin resistance. Insulin. 2008;3(4):211-218 [Published correction appears in Insulin. 2009;4(1):81]. doi:10.1016/S1557-0843(08)80049-8
4. Shrestha RT, Kumar AF, Taddese A, et al. Duration and onset of action of high dose U-500 regular insulin in severely insulin resistant subjects with type 2 diabetes. Endocrinol Diabetes Metab. 2018;1(4):e00041. Published 2018 Sep 10. doi:10.1002/edm2.41
5. Dailey AM, Tannock LR. Extreme insulin resistance: indications and approaches to the use of U-500 insulin in type 2 diabetes mellitus. Curr Diab Rep. 2011;11(2):77-82. doi:10.1007/s11892-010-0167-6
6. de la Peña A, Riddle M, Morrow LA, et al. Pharmacokinetics and pharmacodynamics of high-dose human regular U-500 insulin versus human regular U-100 insulin in healthy obese subjects [published correction appears in Diabetes Care. 2014 Aug;37(8):2414]. Diabetes Care. 2011;34(12):2496-2501. doi:10.2337/dc11-0721
7. Brusko C, Jackson JA, de la Peña A. Comparative properties of U-500 and U-100 regular human insulin. Am J Health Syst Pharm. 2013;70(15):1283-1284. doi:10.2146/130117
8. Dailey AM, Williams S, Taneja D, Tannock LR. Clinical efficacy and patient satisfaction with U-500 insulin use. Diabetes Res Clin Pract. 2010;88(3):259-264. doi:10.1016/j.diabres.2010.02.012
9. Wysham C, Hood RC, Warren ML, Wang T, Morwick TM, Jackson JA. Effect of total daily dose on efficacy, dosing, and safety of 2 dose titration regimens of human regular U-500 insulin in severely insulin-resistant patients with type 2 diabetes. Endocr Pract. 2010;22(6):653-665. doi:10.4158/EP15959.OR
10. Gagnon-Auger M, du Souich P, Baillargeon JP, et al. Dose-dependent delay of the hypoglycemic effect of short-acting insulin analogs in obese subjects with type 2 diabetes: a pharmacokinetic and pharmacodynamic study. Diabetes Care. 2010;33(12):2502-2507. doi:10.2337/dc10-1126
11. Schloot NC, Hood RC, Corrigan SM, Panek RL, Heise T. Concentrated insulins in current clinical practice. Diabetes Res Clin Pract. 2019;148:93-101. doi:10.1016/j.diabres.2018.12.007
12. Lane WS, Cochran EK, Jackson JA, et al. High-dose insulin therapy: is it time for U-500 insulin?. Endocr Pract. 2009;15(1):71-79. doi:10.4158/EP.15.1.71
13. Boldo A, Comi RJ. Clinical experience with U500 insulin: risks and benefits. Endocr Pract. 2012;18(1):56-61. doi:10.4158/EP11163.OR
14. Granata JA, Nawarskas AD, Resch ND, Vigil JM. Evaluating the effect of u-500 insulin therapy on glycemic control in veterans with type 2 diabetes. Clin Diabetes. 2015;33(1):14-19. doi:10.2337/diaclin.33.1.14
15. Eby EL, Zagar AJ, Wang P, et al. Healthcare costs and adherence associated with human regular U-500 versus high-dose U-100 insulin in patients with diabetes. Endocr Pract. 2014;20(7):663-670. doi:10.4158/EP13407.OR
16. Eby EL, Curtis BH, Gelwicks SC, et al. Initiation of human regular U-500 insulin use is associated with improved glycemic control: a real-world US cohort study. BMJ Open Diabetes Res Care. 2015;3(1):e000074. Published 2015 Apr 30. doi:10.1136/bmjdrc-2014-000074
17. Jones P, Idris I. The use of U-500 regular insulin in the management of patients with obesity and insulin resistance. Diabetes Obes Metab. 2013;15(10):882-887. doi:10.1111/dom.12094
18. Hood RC, Arakaki RF, Wysham C, Li YG, Settles JA, Jackson JA. Two treatment approaches for human regular U-500 insulin in patients with type 2 diabetes not achieving adequate glycemic control on high-dose U-100 insulin therapy with or without oral agents: a randomized, titration-to-target clinical trial. Endocr Pract. 2015;21(7):782-793. doi: 10.4158/EP15612.OR
19. Ballani P, Tran MT, Navar MD, Davidson MB. Clinical experience with U-500 regular insulin in obese, markedly insulin-resistant type 2 diabetic patients [published correction appears in Diabetes Care. 2007 Feb;30(2):455]. Diabetes Care. 2006;29(11):2504-2505. doi:10.2337/dc06-1478
20. Davidson MB, Navar MD, Echeverry D, Duran P. U-500 regular insulin: clinical experience and pharmacokinetics in obese, severely insulin-resistant type 2 diabetic patients. Diabetes Care. 2010;33(2):281-283. doi:10.2337/dc09-1490
21. Bulchandani DG, Konrady T, Hamburg MS. Clinical efficacy and patient satisfaction with U-500 insulin pump therapy in patients with type 2 diabetes. Endocr Pract. 2007;13(7):721-725. doi:10.4158/EP.13.7.721
22. Lane WS, Weinrib SL, Rappaport JM, Przestrzelski T. A prospective trial of U500 insulin delivered by Omnipod in patients with type 2 diabetes mellitus and severe insulin resistance [published correction appears in Endocr Pract. 2010 Nov-Dec;16(6):1082]. Endocr Pract. 2010;16(5):778-784. doi:10.4158/EP10014.OR
23. Martin C, Perez-Molinar D, Shah M, Billington C. U500 Disposable Patch Insulin Pump: Results and Discussion of a Veterans Affairs Pilot Study. J Endocr Soc. 2018;2(11):1275-1283. Published 2018 Sep 17. doi:10.1210/js.2018-00198
24. Ziesmer AE, Kelly KC, Guerra PA, George KG, Dunn FL. U500 regular insulin use in insulin-resistant type 2 diabetic veteran patients. Endocr Pract. 2012;18(1):34-38. doi:10.4158/EP11043.OR
25. American Diabetes Association. 6. Glycemic Targets: Standards of Medical Care in Diabetes-2019. Diabetes Care. 2019;42(Suppl 1):S61-S70. doi:10.2337/dc19-S006
Who Receives Care in VA Medical Foster Homes?
New models are needed for delivering long-term care (LTC) that are home-based, cost-effective, and appropriate for older adults with a range of care needs.1,2 In fiscal year (FY) 2015, the US Department of Veterans Affairs (VA) spent $7.4 billion on LTC, accounting for 13% of total VA health care spending. Overall, 71% of LTC spending in FY 2015 was allocated to institutional care.3 Beyond cost, 95% of older adults prefer to remain in community rather than institutional LTC settings, such as nursing homes.4 The COVID-19 pandemic created additional concerns related to the spread of infectious disease, with > 37% of COVID-19 deaths in the United States occurring in nursing homes irrespective of facility quality.5,6
One community-based LTC alternative developed within the VA is the Medical Foster Home (MFH) program. The MFH program is an adult foster care program in which veterans who are unable to live independently receive round-the-clock care in the home of a community-based caregiver.7 MFH caregivers usually have previous experience caring for family, working in a nursing home, or working as a caregiver in another capacity. These caregivers are responsible for providing 24-hour supervision and support to residents in their MFH and can care for up to 3 adults. In the MFH program, VA home-based primary care (HBPC) teams composed of physicians, registered nurses, physical and occupational therapists, social workers, pharmacists, dieticians, and psychologists, provide primary care for MFH veterans and oversee care in the caregiver’s home.
The goal of the VA HBPC program is to improve veterans’ access to medical care and shift LTC services from institutional to noninstitutional settings by providing in-home care for those who are too sick or disabled to go to a clinic for care. On average, veterans pay the MFH caregiver $2,500 out-of-pocket per month for their care.8 In 2016, there were 992 veterans residing in MFHs across the country.9 Since MFH program implementation expanded nationwide in 2008, more than 4,000 veterans have resided in MFHs in 45 states and territories.10
The VA is required to pay for nursing home care for veterans who have a qualifying VA service-connected disability or who meet a specific threshold of disability.11 Currently, the VA is not authorized to pay for MFH care for veterans who meet the eligibility criteria for VA-paid nursing home care. Over the past decade, the VA has introduced and expanded several initiatives and programs to help veterans who require LTC remain in their homes and communities. These include but are not limited to the Veteran Directed Care program, the Choose Home Initiative, and the Caregiver Support Program.12-14 Additionally, attempts have been made to pass legislation to authorize the VA to pay for MFH for veterans’ care whose military benefits include coverage for nursing home care.15 This legislation and VA initiatives are clear signs that the VA is committed to supporting programs such as the MFH program. Given this commitment, demand for the MFH program will likely increase.
Therefore, VA practitioners need to better identify which veterans are currently in the MFH program. While veterans are expected to need nursing home level care to qualify for MFH enrollment, little has been published about the physical and mental health care needs of veterans currently receiving MFH care. One previous study compared the demographics, diagnostic characteristics, and care utilization of MFH veterans with that of veterans receiving LTC in VA community living centers (CLCs), and found that veterans in MFHs had similar levels of frailty and comorbidity and had a higher mean age when compared with veterans in CLCs.16
Our study assessed a sample of veterans living in MFHs and describes these veterans’ clinical and functional characteristics. We used the Minimum Data Set 3.0 (MDS) to complete the assessments to allow comparisons with other populations residing in long-term care.17,18 While MDS assessments are required for Medicare/Medicaid-certified nursing home residents and for residents in VA CLCs, this study was the first attempt to perform in-home MDS data assessments in MFHs. This collection of descriptive clinical data is an important first step in providing VA practitioners with information about the characteristics of veterans currently cared for in MFHs and policymakers with data to think critically about which veterans are willing to pay for the MFH program.
Methods
This study was part of a larger research project assessing the impact of the MFH program on veterans’ outcomes and health care spending as well as factors influencing program growth.7,9,10,16,19-23 We report on the characteristics of veterans staying in MFHs, using data from the MDS, including a clinical assessment of patients’ cognitive, function, and health care–related needs, collected from participants recruited for this study.
Five research nurses were trained to administer the MDS assessment to veterans in MFHs. Data were collected between April 2014 and December 2015 from veterans at MFH sites associated with 4 urban VA medical centers in 4 different Veterans Integrated Service Networks (58 total homes). While the VA medical centers (VAMCs)were urban, many of the MFHs were in rural areas, given that MFHs can be up to 50 miles from the associated VAMC. We selected MFH sites for this study based on MFH program veteran census. Specifically, we identified MFH sites with high veteran enrollment to ensure we would have a sufficiently large sample for participant recruitment.
Veterans who had resided in an MFH for at least 90 days were eligible to participate. Of the 155 veterans mailed a letter of invitation to participate, 92 (59%) completed the in-home MDS assessment. Reasons for not participating included: 13 veterans died prior to data collection, 18 veterans declined to participate, 18 family members or legal guardians of cognitively impaired veterans did not want the veteran to participate, and 14 veterans left the MFH program or were hospitalized at the time of data collection.
Family members and legal guardians who declined participation on behalf of a veteran reported that they felt the veteran was too frail to participate or that participating would be an added burden on the veteran. Based on the census of veterans residing in all MFHs nationally in November 2015 (N = 972), 9.5% of MFH veterans were included in this study.7This study was approved by the VA Central Institutional Review Board (CIRB #12–31), in addition to the local VA research and development review boards where MFH MDS assessments were collected.
Assessment Instrument and Variables
The MDS 3.0 assesses numerous aspects of clinical and functional status. Several resident-level characteristics from the MDS 3.0 were included in this study. The Cognitive Function Scale (CFS) was used to categorize cognitive function. The CFS is a categorical variable that is created from MDS 3.0 data. The CFS integrates self- and staff-reported data to classify individuals as cognitively intact, mildly impaired, moderately impaired, or severely impaired based on respondents’ Brief Interview for Mental Status (BIMS) assessment or staff-reported cognitive function collected as part of the MDS 3.0.24 We explored depression by calculating a mean summary severity score for all respondents from the Patient Health Questionnaire-9 item interview (PHQ-9).25 PHQ-9 summary scores range from 0 to 27, with mean scores of ≤ 4 indicating no or minimal depression, and higher scores corresponding to more severe depression as scores increase. For respondents who were unable to complete the PHQ-9, we calculated mean PHQ Observational Version (PHQ-9-OV) scores.
We included 2 variables to characterize behaviors: wandering frequency and presence and frequency of aggressive behaviors. We summarized aggressive behaviors using the Aggressive and Reactive Behavior Scale, which characterizes whether a resident has none, mild, moderate, or severe behavioral symptoms based on the presence and frequency of physical and verbal behaviors and resistance to care.26,27 We included items that described pain, number of falls since admission or prior assessment, degree of urinary and bowel continence (always continent vs not always continent) and mobility device use to describe respondents’ health conditions and functional status. To characterize pain, we used veteran’s self-reported frequency and intensity of pain experienced in the prior 5 days and classified the experienced pain as none, mild, moderate, or severe. Finally, demographic characteristics included age and gender.
To determine functional status, we included measures of needing help to perform activities of daily living (ADLs). The MDS allows us to understand functional status ranging from ADLs lost early in the trajectory of functional decline (ie, bathing, hygiene) to those lost in the middle (ie, walking, dressing, toileting, transferring) to those lost late in the trajectory of functional decline (ie, bed mobility and eating).28,29 To assess MFH veterans’ independence in mobility, we considered the veteran’s ability to walk without supervision or assistance in the hallway outside of their room, ability to move between their room and hallway, and ability to move throughout the house. Mobility includes use of an assistive device such as a cane, walker, or wheelchair if the veteran can use it without assistance. We summarized dependency in ADLs, using a combined score of dependence in bed mobility, transfer, locomotion on unit, dressing, eating, toilet use, and personal hygiene that ranges from 0 (independent) to 28 (completely dependent).30 Additionally, we created 3-category variables to indicate the degree of dependence in performing ADLs (independent, supervision or assistance, and completely dependent).
Finally, we included diagnoses identified as active to explore differences in neurologic, mood, psychiatric, and chronic disease morbidity. In the MDS 3.0 assessment, an active diagnosis is defined as a diagnosis documented by a licensed independent practitioner in the prior 60 days that has affected the resident or their care in the prior 7 days.
Analysis
We conducted statistical analyses using Stata MP version 15.1 (StataCorp). We summarized demographic characteristics, cognitive function scores, depression scores, pain status, behavioral symptoms, incidence of falls, degree of continence, functional status, and comorbidities, using means and standard deviations for continuous variables and frequencies and proportions for categorical variables.
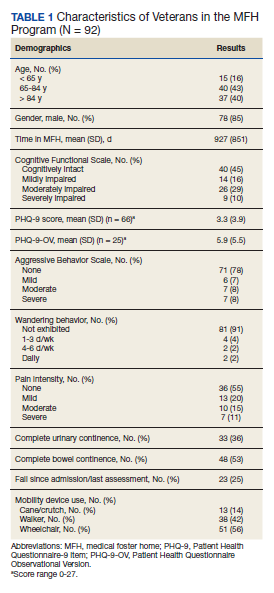
Results
Of the 92 MFH veterans in our sample, 85% were male and 83% were aged ≥ 65 years (Table 1). Veterans had an average length of stay of 927 days at the time of MDS assessment. More than half (55%) of MFH veterans had cognitive impairment (ranging from mild to severe). The mean (SD) depression score was 3.3 (3.9), indicating minimal depression. For veterans who could not complete the depression questionnaire, the mean (SD) staff-assessed depression score was 5.9 (5.5), suggesting mild depression. Overall, 22% of the sample had aggressive behaviors but only 7 were noted to be severe. Few residents had caregiver-reported wandering. Self-reported pain intensity indicated that 45% of the sample had mild, moderate, or severe pain. While more than half the cohort had complete bowel continence (53%), only 36% had complete urinary continence. Use of mobility devices was common, with 56% of residents using a wheelchair, 42% using a walker, and 14% using a cane. One-fourth of veterans had fallen at least once since admission to the MFH.
Of the 11 ADLs assessed, the percentage of MFH veterans requiring assistance with early and mid-loss ADLs ranged from 63% for transferring to 84% for bathing (Table 2). Even for the late-loss ADL of eating, 57% of the MFH cohort required assistance. Overall, MFH veterans had an average ADL dependency score of 11.
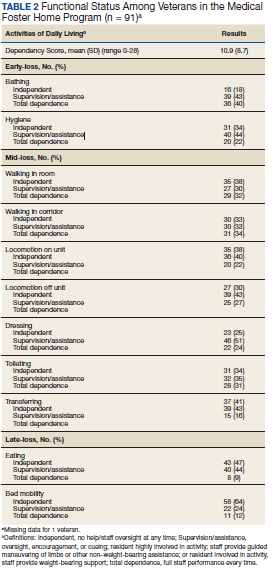
Physicians documented a diagnosis of either Alzheimer disease or non-Alzheimer dementia comorbidity for 65% of the cohort and traumatic brain injury for 9% (Table 3). Based on psychiatric comorbidities recorded in veterans’ health records, over half of MFH residents had depression (52%). Additionally, 1 in 5 MFH veterans had an anxiety disorder diagnosis. Chronic diseases were prevalent among veterans in MFHs, with 33% diagnosed with diabetes mellitus, 30% with asthma, chronic obstructive pulmonary disease, or chronic lung disease, and 16% with heart failure.
Discussion
In this study, we describe the characteristics of veterans receiving LTC in a sample of MFHs. This is the first study to assess veteran health and function across a group of MFHs. To help provide context for the description of MFH residents, we compared demographic characteristics, cognitive impairment, depression, pain, behaviors, functional status, and morbidity of veterans in the MFH program to long-stay residents in community nursing homes (eAppendix 1-3 available at doi:10.12788/fp.0102). A comparison with this reference population suggests that these MFH and nursing home cohorts are similar in terms of age, wandering behavior, incidence of falls, and prevalence of neurologic, psychiatric, and chronic diseases. Compared with nursing home residents, veterans in the MFH cohort had slightly higher mood symptom scores, were more likely to display aggressive behavior, and were more likely to report experiencing moderate and severe pain.
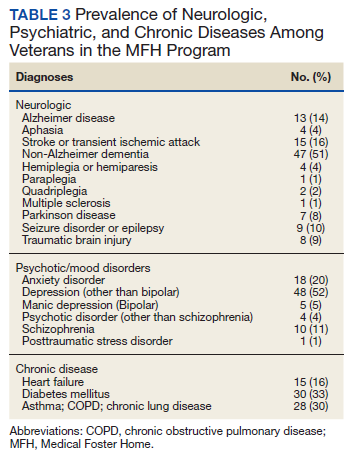
Additionally, MFH veterans displayed a lower level of cognitive impairment, fewer functional impairments, measured by the ADL dependency score, and were less likely to be bowel or bladder incontinent. Despite an overall lower ADL dependency score, a similar proportion of MFH veterans and nursing home residents were totally dependent in performing 7 of 11 ADLs and a higher proportion of MFH veterans were completely dependent for toileting (22% long-stay nursing home vs 31% MFH). The only ADLs for which there was a higher proportion of long-stay nursing home residents who were totally dependent compared with MFH residents were walking in room (54% long-stay nursing home vs 38% MFH), walking in the corridor (57% long-stay nursing home vs 33% MFH), and locomotion off the unit (36% long-stay nursing home vs 22% MFH).
While the rates of total ADL dependence among veterans in MFHs suggest that MFHs are providing care to a subset of veterans with high levels of functional impairment and care needs, MFHs are also providing care to veterans who are more independent in performing ADLs and who resemble low-care nursing home residents. A low-care nursing home resident is broadly defined as an one who does not need assistance performing late-loss ADLs (bed mobility, transferring, toileting, and eating) and who does not have the Resource Utilization Group classification of special rehab or clinically complex.31,32 Due to their overall higher functional capacity, low-care residents, even those with chronic medical care needs, may be more appropriately cared for in less intensive care settings than in nursing homes. About 5% to 30% of long-stay nursing home residents can be classified as low care.31,33-37 Additionally, a majority of newly admitted nursing home patients report a preference for or support community discharge rather than long-stay nursing home care, suggesting that many nursing home residents have the potential and desire to transition to a community-based setting.33
Based on the prevalence of veterans in our sample who are similar to low-care nursing home residents and the national focus on shifting LTC to community-based settings, MFHs may be an ideal setting for both low-care nursing home residents and those seeking community-based alternatives to traditional, institutionalized LTC. Additionally, given that we observed greater behavioral and pain needs and similar rates of comorbidities in MFH veterans relative to long-stay nursing home residents, our results indicate that MFHs also have the capacity to care for veterans with higher care needs who desire community-based LTC.
Previous research identified barriers to program MFH growth that may contribute to referral of veterans with fewer ADL dependencies compared with long-stay nursing home residents. A key barrier to MFH referral is that nursing home referral requires selection of a home, whereas MFH referral involves matching veterans with appropriate caregivers, which requires time to align the veteran’s needs with the right caregiver in the right home.7 Given the rigors of finding a match, VA staff who refer veterans may preferentially refer veterans with greater ADL impairments to nursing homes, assuming that higher levels of care needs will complicate the matching process and reserve MFH referral for only the highest functioning candidates.19 However, the ADL data presented here indicate that many MFH residents with significant levels of ADL dependence are living in MFHs. Meeting the care needs of those who have higher ADL dependencies is possible because MFH coordinators and HBPC providers deliver individual, ongoing education to MFH caregivers about caring for MFH veterans and provide available resources needed to safely care for MFH veterans across the spectrum of ADL dependency.7
Veterans with higher levels of functional dependence may also be referred to nursing homes rather than to MFHs because of payment issues. Independent of the VA, veterans or their families negotiate a contract with their caregiver to pay out-of-pocket for MFH caregiving as well as room and board. Particularly for veterans who have military benefits to cover nursing home care costs, the out-of-pocket payment for veterans with high degrees of functional dependence increase as needs increase. These out-of-pocket payments may serve as a barrier to MFH enrollment. The proposed Long-Term Care Veterans Choice Act, which would allow the VA to pay for MFH care for eligible veterans may address this barrier.15
Another possible explanation for the higher rates of functional independence in the MFH cohort is that veterans with functional impairment are not being referred to MFHs. A previous study of the MFH program found that health care providers were often unaware of the program and as a result did not refer eligible veterans to this alternative LTC option.7 The changes proposed by the Long-Term Care Veterans Choice Act may result in an increase in demand in MFH care and thus increase awareness of the program among VA physicians.15
Limitations
There are several potential limitations in this study. First, there are limits to the generalizability of the MFH sample given that the sample of veterans was not randomly selected and that weights were not applied to account for nonresponse bias. Second, charting requirements in MFHs are less intensive compared with nursing home tracking. While the training for research nurses on how to conduct MDS assessments in MFHs was designed to simulate the process in nursing homes, MDS data were likely impacted by differences in charting practices. In addition, MFH caregivers may report certain items, such as aggressive behaviors, more often because they observe MFH veterans round-the-clock compared with NH caregivers who work in shifts and have a lower caregiver to resident ratio. The current data suggest differences in prevalence of behavioral symptoms.
Future studies should examine whether this reflects differences in the populations served or differences in how MFH caregivers track and manage behavioral symptoms. Third, this study was conducted at only MFH sites associated with 4 VAMCs, thus our findings may not be generalizable to veterans in other areas. Finally, there may be differences in the veterans who agreed to participate in the study compared with those who declined to participate. For example, it is possible that the eligible MFH veterans who declined to participate in this study were more functionally impaired than those who did participate. More than one-third (39%) of the family members of cognitively impaired MFH veterans who did not participate cited concerns about the veteran’s frailty as a primary reason for declining to participate. Consequently, the high level of functional status among veterans included in this study compared to nursing home residents may be in part a result of selection bias from more ADL-impaired veterans declining to participate in the study.
Conclusions
Although the MFH program has provided LTC nationally to veterans for nearly 2 decades, this study is the first to administer in-home MDS assessments to veterans in MFHs, allowing for a detailed description of cognitive, functional, and behavioral characteristics of MFH residents. In this study, we found that veterans currently receiving care in MFHs have a wide range of care needs. Our findings indicate that MFHs are caring for some veterans with high functional impairment as well as those who are completely independent in performing ADLs.
Moreover, these results are a preliminary attempt to assist VA health care providers in determining which veterans can be cared for in an MFH such that they can make informed referrals to this alternative LTC setting. To improve the generalizability of these findings, future studies should collect MDS 3.0 assessments longitudinally from a representative sample of veterans in MFHs. Further research is needed to explore how VA providers make the decision to refer a veteran to an MFH compared to a nursing home. Additionally, the percentage of veterans in this study who reported experiencing pain may indicate the need to identify innovative, integrated pain management programs for home settings.
1. Rowe JW, Fulmer T, Fried L. Preparing for better health and health care for an aging population. JAMA. 2016;316(16):1643. doi:10.1001/jama.2016.12335
2. Reaves E, Musumeci M. Medicaid and long-term services and supports: a primer. kaiser family foundation. Published December 15, 2015. Accessed February 12, 2021. https://www.kff.org/medicaid/report/medicaid-and-long-term-services-and-supports-a-primer
3. Collelo KJ, Panangala SV. Long-term care services for veterans. Congressional Research Service Report No. R44697. Published February 14, 2017. Accessed February 12, 2021. https://fas.org/sgp/crs/misc/R44697.pdf
4. American Association of Retired Persons. Beyond 50.05: a report to the nation on livable communities creating environments for successful aging. Published online 2005. Accessed February 12, 2021. https://assets.aarp.org/rgcenter/il/beyond_50_communities.pdf
5. Kaiser Family Foundation. State data and policy actions to address coronavirus. Updated February 11, 2021. Accessed February 12, 2021. https://www.kff.org/health-costs/issue-brief/state-data-and-policy-actions-to-address-coronavirus/
6. Abrams HR, Loomer L, Gandhi A, Grabowski DC. Characteristics of U.S. nursing homes with COVID-19 Cases. J Am Geriatr Soc. 2020;68(8):1653-1656. doi:10.1111/jgs.16661
7. Haverhals LM, Manheim CE, Jones J, Levy C. Launching medical foster home programs: key components to growing this alternative to nursing home placement. J Hous Elderly. 2017;31(1):14-33. doi:10.1080/01634372.2016.1268556
8. US Department of Veterans Affairs. Medical Foster Home Program Procedures- VHA Directive 1141.02(1). Published August 9, 2017. Accessed February 12, 2021. https://www.va.gov/vhapublications/ViewPublication.asp?pub_ID=5447.
9. Haverhals LM, Manheim CE, Gilman CV, Jones J, Levy C. Caregivers create a veteran-centric community in VHA medical foster homes. J Gerontol Soc Work. 2016;59(6):441-457. doi:10.1080/01634372.2016.1231730
10. Jones J, Haverhals LM, Manheim CE, Levy C. Fostering excellence: an examination of high-enrollment VHA Medical Foster Home programs. Home Health Care Manag Pract. 2017;30(1):16-22. doi:10.1177/1084822317736795
11. US Department of Veterans Affairs. Veterans Health Administration. Veterans Health Benefits Handbook. Published 2017. Accessed February 17, 2021. https://www. va.gov/healthbenefits/vhbh/publications/vhbh_sample_handb ook_2014.pdf
12. Duan-Porter W, Ullman K, Rosebush C, McKenzie L, et al; Evidence Synthesis Program. Risk factors and interventions to prevent or delay long term nursing home placement for adults with impairments. Published May 2019. Accessed March 2, 2021. https://www.hsrd.research.va.gov/publications/esp/nursing-home-delay.pdf
13. US Department of Veterans Affairs. Caregiver Support Program- VHA NOTICE 2020-31. Published October 1, 2020. Accessed February 2, 2021. https://www.va.gov/VHApublications/ViewPublication.asp?pub_ID=9048
14. US Department of Veterans Affairs. Geriatrics and extended care. Published June 10, 2020. Accessed February 22, 2021. https://www.va.gov/geriatrics/pages/Veteran-Directed_Care.asp
15. HR 1527, 116th Cong (2019). Accessed March 1, 2021. congress.gov/bill/116th-congress/house-bill/1527
16. Levy C, Whitfield EA. Medical foster homes: can the adult foster care model substitute for nursing home care? J Am Geriatr Soc. 2016;64(12):2585-2592. doi:10.1111/jgs.14517
17. Saliba D, Buchanan J. Making the investment count: revision of the Minimum Data Set for nursing homes, MDS 3.0. J Am Med Dir Assoc. 2012;13(7):602-610. doi:10.1016/j.jamda.2012.06.002
18. Saliba D, Jones M, Streim J, Ouslander J, Berlowitz D, Buchanan J. Overview of significant changes in the Minimum Data Set for nursing homes version 3.0. J Am Med Dir Assoc. 2012;13(7):595-601. doi:10.1016/j.jamda.2012.06.001
19. Gilman C, Haverhals L, Manheim C, Levy C. A qualitative exploration of veteran and family perspectives on medical foster homes. Home Health Care Serv Q. 2018;37(1):1-24. doi:10.1080/01621424.2017.1419156
20. Levy CR, Alemi F, Williams AE, et al. Shared homes as an alternative to nursing home care: impact of VA’s Medical Foster Home program on hospitalization. Gerontologist. 2016;56(1):62-71. doi:10.1093/geront/gnv092
21. Levy CR, Jones J, Haverhals LM, Nowels CT. A qualitative evaluation of a new community living model: medical foster home placement. J Nurs Educ Pract. 2013;4(1):p162. doi:10.5430/jnep.v4n1p162
22. Levy C, Whitfield EA, Gutman R. Medical foster home is less costly than traditional nursing home care. Health Serv Res. 2019;54(6):1346-1356. doi:10.1111/1475-6773.13195
23. Manheim CE, Haverhals LM, Jones J, Levy CR. Allowing family to be family: end-of-life care in Veterans Affairs medical foster homes. J Soc Work End Life Palliat Care. 2016;12(1-2):104-125. doi:10.1080/15524256.2016.1156603
24. Thomas KS, Dosa D, Wysocki A, Mor V. The Minimum Data Set 3.0 Cognitive Function Scale. Med Care. 2017;55(9):e68-e72. doi:10.1097/MLR.0000000000000334
25. Saliba D, DiFilippo S, Edelen MO, Kroenke K, Buchanan J, Streim J. Testing the PHQ-9 interview and observational versions (PHQ-9 OV) for MDS 3.0. J Am Med Dir Assoc. 2012;13(7):618-625. doi:10.1016/j.jamda.2012.06.003
26. Perlman CM, Hirdes JP. The aggressive behavior scale: a new scale to measure aggression based on the minimum data set. J Am Geriatr Soc. 2008;56(12):2298-2303. doi:10.1111/j.1532-5415.2008.02048.x
27. McCreedy E, Ogarek JA, Thomas KS, Mor V. The minimum data set agitated and reactive behavior scale: measuring behaviors in nursing home residents with dementia. J Am Med Dir Assoc. 2019;20(12):1548-1552. doi:10.1016/j.jamda.2019.08.030
28. Levy CR, Zargoush M, Williams AE, et al. Sequence of functional loss and recovery in nursing homes. Gerontologist. 2016;56(1):52-61. doi:10.1093/geront/gnv099
29. Wysocki A, Thomas KS, Mor V. Functional improvement among short-stay nursing home residents in the MDS 3.0. J Am Med Dir Assoc. 2015;16(6):470-474. doi:10.1016/j.jamda.2014.11.018
30. Morris JN, Pries B, Morris’ S. Scaling ADLs Within the MDS. J Gerontol A Biol Sci Med Sci. 1999;54(11):M546-M553. doi:10.1093/gerona/54.11.m546
31. Mor V, Zinn J, Gozalo P, Feng Z, Intrator O, Grabowski DC. Prospects for transferring nursing home residents to the community. Health Aff (Millwood). 2007;26(6):1762-1771. doi:10.1377/hlthaff.26.6.1762
32. Ikegami N, Morris JN, Fries BE. Low-care cases in long-term care settings: variation among nations. Age Ageing. 1997;26(suppl 2):67-71. doi:10.1093/ageing/26.suppl_2.67
33. Arling G, Kane RL, Cooke V, Lewis T. Targeting residents for transitions from nursing home to community. Health Serv Res. 2010;45(3):691-711. doi:10.1111/j.1475-6773.2010.01105.x
34. Castle NG. Low-care residents in nursing homes: the impact of market characteristics. J Health Soc Policy. 2002;14(3):41-58. doi:10.1300/J045v14n03_03
35. Grando VT, Rantz MJ, Petroski GF, et al. Prevalence and characteristics of nursing homes residents requiring light-care. Res Nurs Health. 2005;28(3):210-219. doi:10.1002/nur.20079
36. Hahn EA, Thomas KS, Hyer K, Andel R, Meng H. Predictors of low-care prevalence in Florida nursing homes: the role of Medicaid waiver programs. Gerontologist. 2011;51(4):495-503. doi:10.1093/geront/gnr020
37. Thomas KS. The relationship between older Americans act in-home services and low-care residents in nursing homes. J Aging Health. 2014;26(2):250-260. doi:10.1177/0898264313513611
New models are needed for delivering long-term care (LTC) that are home-based, cost-effective, and appropriate for older adults with a range of care needs.1,2 In fiscal year (FY) 2015, the US Department of Veterans Affairs (VA) spent $7.4 billion on LTC, accounting for 13% of total VA health care spending. Overall, 71% of LTC spending in FY 2015 was allocated to institutional care.3 Beyond cost, 95% of older adults prefer to remain in community rather than institutional LTC settings, such as nursing homes.4 The COVID-19 pandemic created additional concerns related to the spread of infectious disease, with > 37% of COVID-19 deaths in the United States occurring in nursing homes irrespective of facility quality.5,6
One community-based LTC alternative developed within the VA is the Medical Foster Home (MFH) program. The MFH program is an adult foster care program in which veterans who are unable to live independently receive round-the-clock care in the home of a community-based caregiver.7 MFH caregivers usually have previous experience caring for family, working in a nursing home, or working as a caregiver in another capacity. These caregivers are responsible for providing 24-hour supervision and support to residents in their MFH and can care for up to 3 adults. In the MFH program, VA home-based primary care (HBPC) teams composed of physicians, registered nurses, physical and occupational therapists, social workers, pharmacists, dieticians, and psychologists, provide primary care for MFH veterans and oversee care in the caregiver’s home.
The goal of the VA HBPC program is to improve veterans’ access to medical care and shift LTC services from institutional to noninstitutional settings by providing in-home care for those who are too sick or disabled to go to a clinic for care. On average, veterans pay the MFH caregiver $2,500 out-of-pocket per month for their care.8 In 2016, there were 992 veterans residing in MFHs across the country.9 Since MFH program implementation expanded nationwide in 2008, more than 4,000 veterans have resided in MFHs in 45 states and territories.10
The VA is required to pay for nursing home care for veterans who have a qualifying VA service-connected disability or who meet a specific threshold of disability.11 Currently, the VA is not authorized to pay for MFH care for veterans who meet the eligibility criteria for VA-paid nursing home care. Over the past decade, the VA has introduced and expanded several initiatives and programs to help veterans who require LTC remain in their homes and communities. These include but are not limited to the Veteran Directed Care program, the Choose Home Initiative, and the Caregiver Support Program.12-14 Additionally, attempts have been made to pass legislation to authorize the VA to pay for MFH for veterans’ care whose military benefits include coverage for nursing home care.15 This legislation and VA initiatives are clear signs that the VA is committed to supporting programs such as the MFH program. Given this commitment, demand for the MFH program will likely increase.
Therefore, VA practitioners need to better identify which veterans are currently in the MFH program. While veterans are expected to need nursing home level care to qualify for MFH enrollment, little has been published about the physical and mental health care needs of veterans currently receiving MFH care. One previous study compared the demographics, diagnostic characteristics, and care utilization of MFH veterans with that of veterans receiving LTC in VA community living centers (CLCs), and found that veterans in MFHs had similar levels of frailty and comorbidity and had a higher mean age when compared with veterans in CLCs.16
Our study assessed a sample of veterans living in MFHs and describes these veterans’ clinical and functional characteristics. We used the Minimum Data Set 3.0 (MDS) to complete the assessments to allow comparisons with other populations residing in long-term care.17,18 While MDS assessments are required for Medicare/Medicaid-certified nursing home residents and for residents in VA CLCs, this study was the first attempt to perform in-home MDS data assessments in MFHs. This collection of descriptive clinical data is an important first step in providing VA practitioners with information about the characteristics of veterans currently cared for in MFHs and policymakers with data to think critically about which veterans are willing to pay for the MFH program.
Methods
This study was part of a larger research project assessing the impact of the MFH program on veterans’ outcomes and health care spending as well as factors influencing program growth.7,9,10,16,19-23 We report on the characteristics of veterans staying in MFHs, using data from the MDS, including a clinical assessment of patients’ cognitive, function, and health care–related needs, collected from participants recruited for this study.
Five research nurses were trained to administer the MDS assessment to veterans in MFHs. Data were collected between April 2014 and December 2015 from veterans at MFH sites associated with 4 urban VA medical centers in 4 different Veterans Integrated Service Networks (58 total homes). While the VA medical centers (VAMCs)were urban, many of the MFHs were in rural areas, given that MFHs can be up to 50 miles from the associated VAMC. We selected MFH sites for this study based on MFH program veteran census. Specifically, we identified MFH sites with high veteran enrollment to ensure we would have a sufficiently large sample for participant recruitment.
Veterans who had resided in an MFH for at least 90 days were eligible to participate. Of the 155 veterans mailed a letter of invitation to participate, 92 (59%) completed the in-home MDS assessment. Reasons for not participating included: 13 veterans died prior to data collection, 18 veterans declined to participate, 18 family members or legal guardians of cognitively impaired veterans did not want the veteran to participate, and 14 veterans left the MFH program or were hospitalized at the time of data collection.
Family members and legal guardians who declined participation on behalf of a veteran reported that they felt the veteran was too frail to participate or that participating would be an added burden on the veteran. Based on the census of veterans residing in all MFHs nationally in November 2015 (N = 972), 9.5% of MFH veterans were included in this study.7This study was approved by the VA Central Institutional Review Board (CIRB #12–31), in addition to the local VA research and development review boards where MFH MDS assessments were collected.
Assessment Instrument and Variables
The MDS 3.0 assesses numerous aspects of clinical and functional status. Several resident-level characteristics from the MDS 3.0 were included in this study. The Cognitive Function Scale (CFS) was used to categorize cognitive function. The CFS is a categorical variable that is created from MDS 3.0 data. The CFS integrates self- and staff-reported data to classify individuals as cognitively intact, mildly impaired, moderately impaired, or severely impaired based on respondents’ Brief Interview for Mental Status (BIMS) assessment or staff-reported cognitive function collected as part of the MDS 3.0.24 We explored depression by calculating a mean summary severity score for all respondents from the Patient Health Questionnaire-9 item interview (PHQ-9).25 PHQ-9 summary scores range from 0 to 27, with mean scores of ≤ 4 indicating no or minimal depression, and higher scores corresponding to more severe depression as scores increase. For respondents who were unable to complete the PHQ-9, we calculated mean PHQ Observational Version (PHQ-9-OV) scores.
We included 2 variables to characterize behaviors: wandering frequency and presence and frequency of aggressive behaviors. We summarized aggressive behaviors using the Aggressive and Reactive Behavior Scale, which characterizes whether a resident has none, mild, moderate, or severe behavioral symptoms based on the presence and frequency of physical and verbal behaviors and resistance to care.26,27 We included items that described pain, number of falls since admission or prior assessment, degree of urinary and bowel continence (always continent vs not always continent) and mobility device use to describe respondents’ health conditions and functional status. To characterize pain, we used veteran’s self-reported frequency and intensity of pain experienced in the prior 5 days and classified the experienced pain as none, mild, moderate, or severe. Finally, demographic characteristics included age and gender.
To determine functional status, we included measures of needing help to perform activities of daily living (ADLs). The MDS allows us to understand functional status ranging from ADLs lost early in the trajectory of functional decline (ie, bathing, hygiene) to those lost in the middle (ie, walking, dressing, toileting, transferring) to those lost late in the trajectory of functional decline (ie, bed mobility and eating).28,29 To assess MFH veterans’ independence in mobility, we considered the veteran’s ability to walk without supervision or assistance in the hallway outside of their room, ability to move between their room and hallway, and ability to move throughout the house. Mobility includes use of an assistive device such as a cane, walker, or wheelchair if the veteran can use it without assistance. We summarized dependency in ADLs, using a combined score of dependence in bed mobility, transfer, locomotion on unit, dressing, eating, toilet use, and personal hygiene that ranges from 0 (independent) to 28 (completely dependent).30 Additionally, we created 3-category variables to indicate the degree of dependence in performing ADLs (independent, supervision or assistance, and completely dependent).
Finally, we included diagnoses identified as active to explore differences in neurologic, mood, psychiatric, and chronic disease morbidity. In the MDS 3.0 assessment, an active diagnosis is defined as a diagnosis documented by a licensed independent practitioner in the prior 60 days that has affected the resident or their care in the prior 7 days.
Analysis
We conducted statistical analyses using Stata MP version 15.1 (StataCorp). We summarized demographic characteristics, cognitive function scores, depression scores, pain status, behavioral symptoms, incidence of falls, degree of continence, functional status, and comorbidities, using means and standard deviations for continuous variables and frequencies and proportions for categorical variables.
Results
Of the 92 MFH veterans in our sample, 85% were male and 83% were aged ≥ 65 years (Table 1). Veterans had an average length of stay of 927 days at the time of MDS assessment. More than half (55%) of MFH veterans had cognitive impairment (ranging from mild to severe). The mean (SD) depression score was 3.3 (3.9), indicating minimal depression. For veterans who could not complete the depression questionnaire, the mean (SD) staff-assessed depression score was 5.9 (5.5), suggesting mild depression. Overall, 22% of the sample had aggressive behaviors but only 7 were noted to be severe. Few residents had caregiver-reported wandering. Self-reported pain intensity indicated that 45% of the sample had mild, moderate, or severe pain. While more than half the cohort had complete bowel continence (53%), only 36% had complete urinary continence. Use of mobility devices was common, with 56% of residents using a wheelchair, 42% using a walker, and 14% using a cane. One-fourth of veterans had fallen at least once since admission to the MFH.
Of the 11 ADLs assessed, the percentage of MFH veterans requiring assistance with early and mid-loss ADLs ranged from 63% for transferring to 84% for bathing (Table 2). Even for the late-loss ADL of eating, 57% of the MFH cohort required assistance. Overall, MFH veterans had an average ADL dependency score of 11.
Physicians documented a diagnosis of either Alzheimer disease or non-Alzheimer dementia comorbidity for 65% of the cohort and traumatic brain injury for 9% (Table 3). Based on psychiatric comorbidities recorded in veterans’ health records, over half of MFH residents had depression (52%). Additionally, 1 in 5 MFH veterans had an anxiety disorder diagnosis. Chronic diseases were prevalent among veterans in MFHs, with 33% diagnosed with diabetes mellitus, 30% with asthma, chronic obstructive pulmonary disease, or chronic lung disease, and 16% with heart failure.
Discussion
In this study, we describe the characteristics of veterans receiving LTC in a sample of MFHs. This is the first study to assess veteran health and function across a group of MFHs. To help provide context for the description of MFH residents, we compared demographic characteristics, cognitive impairment, depression, pain, behaviors, functional status, and morbidity of veterans in the MFH program to long-stay residents in community nursing homes (eAppendix 1-3 available at doi:10.12788/fp.0102). A comparison with this reference population suggests that these MFH and nursing home cohorts are similar in terms of age, wandering behavior, incidence of falls, and prevalence of neurologic, psychiatric, and chronic diseases. Compared with nursing home residents, veterans in the MFH cohort had slightly higher mood symptom scores, were more likely to display aggressive behavior, and were more likely to report experiencing moderate and severe pain.
Additionally, MFH veterans displayed a lower level of cognitive impairment, fewer functional impairments, measured by the ADL dependency score, and were less likely to be bowel or bladder incontinent. Despite an overall lower ADL dependency score, a similar proportion of MFH veterans and nursing home residents were totally dependent in performing 7 of 11 ADLs and a higher proportion of MFH veterans were completely dependent for toileting (22% long-stay nursing home vs 31% MFH). The only ADLs for which there was a higher proportion of long-stay nursing home residents who were totally dependent compared with MFH residents were walking in room (54% long-stay nursing home vs 38% MFH), walking in the corridor (57% long-stay nursing home vs 33% MFH), and locomotion off the unit (36% long-stay nursing home vs 22% MFH).
While the rates of total ADL dependence among veterans in MFHs suggest that MFHs are providing care to a subset of veterans with high levels of functional impairment and care needs, MFHs are also providing care to veterans who are more independent in performing ADLs and who resemble low-care nursing home residents. A low-care nursing home resident is broadly defined as an one who does not need assistance performing late-loss ADLs (bed mobility, transferring, toileting, and eating) and who does not have the Resource Utilization Group classification of special rehab or clinically complex.31,32 Due to their overall higher functional capacity, low-care residents, even those with chronic medical care needs, may be more appropriately cared for in less intensive care settings than in nursing homes. About 5% to 30% of long-stay nursing home residents can be classified as low care.31,33-37 Additionally, a majority of newly admitted nursing home patients report a preference for or support community discharge rather than long-stay nursing home care, suggesting that many nursing home residents have the potential and desire to transition to a community-based setting.33
Based on the prevalence of veterans in our sample who are similar to low-care nursing home residents and the national focus on shifting LTC to community-based settings, MFHs may be an ideal setting for both low-care nursing home residents and those seeking community-based alternatives to traditional, institutionalized LTC. Additionally, given that we observed greater behavioral and pain needs and similar rates of comorbidities in MFH veterans relative to long-stay nursing home residents, our results indicate that MFHs also have the capacity to care for veterans with higher care needs who desire community-based LTC.
Previous research identified barriers to program MFH growth that may contribute to referral of veterans with fewer ADL dependencies compared with long-stay nursing home residents. A key barrier to MFH referral is that nursing home referral requires selection of a home, whereas MFH referral involves matching veterans with appropriate caregivers, which requires time to align the veteran’s needs with the right caregiver in the right home.7 Given the rigors of finding a match, VA staff who refer veterans may preferentially refer veterans with greater ADL impairments to nursing homes, assuming that higher levels of care needs will complicate the matching process and reserve MFH referral for only the highest functioning candidates.19 However, the ADL data presented here indicate that many MFH residents with significant levels of ADL dependence are living in MFHs. Meeting the care needs of those who have higher ADL dependencies is possible because MFH coordinators and HBPC providers deliver individual, ongoing education to MFH caregivers about caring for MFH veterans and provide available resources needed to safely care for MFH veterans across the spectrum of ADL dependency.7
Veterans with higher levels of functional dependence may also be referred to nursing homes rather than to MFHs because of payment issues. Independent of the VA, veterans or their families negotiate a contract with their caregiver to pay out-of-pocket for MFH caregiving as well as room and board. Particularly for veterans who have military benefits to cover nursing home care costs, the out-of-pocket payment for veterans with high degrees of functional dependence increase as needs increase. These out-of-pocket payments may serve as a barrier to MFH enrollment. The proposed Long-Term Care Veterans Choice Act, which would allow the VA to pay for MFH care for eligible veterans may address this barrier.15
Another possible explanation for the higher rates of functional independence in the MFH cohort is that veterans with functional impairment are not being referred to MFHs. A previous study of the MFH program found that health care providers were often unaware of the program and as a result did not refer eligible veterans to this alternative LTC option.7 The changes proposed by the Long-Term Care Veterans Choice Act may result in an increase in demand in MFH care and thus increase awareness of the program among VA physicians.15
Limitations
There are several potential limitations in this study. First, there are limits to the generalizability of the MFH sample given that the sample of veterans was not randomly selected and that weights were not applied to account for nonresponse bias. Second, charting requirements in MFHs are less intensive compared with nursing home tracking. While the training for research nurses on how to conduct MDS assessments in MFHs was designed to simulate the process in nursing homes, MDS data were likely impacted by differences in charting practices. In addition, MFH caregivers may report certain items, such as aggressive behaviors, more often because they observe MFH veterans round-the-clock compared with NH caregivers who work in shifts and have a lower caregiver to resident ratio. The current data suggest differences in prevalence of behavioral symptoms.
Future studies should examine whether this reflects differences in the populations served or differences in how MFH caregivers track and manage behavioral symptoms. Third, this study was conducted at only MFH sites associated with 4 VAMCs, thus our findings may not be generalizable to veterans in other areas. Finally, there may be differences in the veterans who agreed to participate in the study compared with those who declined to participate. For example, it is possible that the eligible MFH veterans who declined to participate in this study were more functionally impaired than those who did participate. More than one-third (39%) of the family members of cognitively impaired MFH veterans who did not participate cited concerns about the veteran’s frailty as a primary reason for declining to participate. Consequently, the high level of functional status among veterans included in this study compared to nursing home residents may be in part a result of selection bias from more ADL-impaired veterans declining to participate in the study.
Conclusions
Although the MFH program has provided LTC nationally to veterans for nearly 2 decades, this study is the first to administer in-home MDS assessments to veterans in MFHs, allowing for a detailed description of cognitive, functional, and behavioral characteristics of MFH residents. In this study, we found that veterans currently receiving care in MFHs have a wide range of care needs. Our findings indicate that MFHs are caring for some veterans with high functional impairment as well as those who are completely independent in performing ADLs.
Moreover, these results are a preliminary attempt to assist VA health care providers in determining which veterans can be cared for in an MFH such that they can make informed referrals to this alternative LTC setting. To improve the generalizability of these findings, future studies should collect MDS 3.0 assessments longitudinally from a representative sample of veterans in MFHs. Further research is needed to explore how VA providers make the decision to refer a veteran to an MFH compared to a nursing home. Additionally, the percentage of veterans in this study who reported experiencing pain may indicate the need to identify innovative, integrated pain management programs for home settings.
1. Rowe JW, Fulmer T, Fried L. Preparing for better health and health care for an aging population. JAMA. 2016;316(16):1643. doi:10.1001/jama.2016.12335
2. Reaves E, Musumeci M. Medicaid and long-term services and supports: a primer. kaiser family foundation. Published December 15, 2015. Accessed February 12, 2021. https://www.kff.org/medicaid/report/medicaid-and-long-term-services-and-supports-a-primer
3. Collelo KJ, Panangala SV. Long-term care services for veterans. Congressional Research Service Report No. R44697. Published February 14, 2017. Accessed February 12, 2021. https://fas.org/sgp/crs/misc/R44697.pdf
4. American Association of Retired Persons. Beyond 50.05: a report to the nation on livable communities creating environments for successful aging. Published online 2005. Accessed February 12, 2021. https://assets.aarp.org/rgcenter/il/beyond_50_communities.pdf
5. Kaiser Family Foundation. State data and policy actions to address coronavirus. Updated February 11, 2021. Accessed February 12, 2021. https://www.kff.org/health-costs/issue-brief/state-data-and-policy-actions-to-address-coronavirus/
6. Abrams HR, Loomer L, Gandhi A, Grabowski DC. Characteristics of U.S. nursing homes with COVID-19 Cases. J Am Geriatr Soc. 2020;68(8):1653-1656. doi:10.1111/jgs.16661
7. Haverhals LM, Manheim CE, Jones J, Levy C. Launching medical foster home programs: key components to growing this alternative to nursing home placement. J Hous Elderly. 2017;31(1):14-33. doi:10.1080/01634372.2016.1268556
8. US Department of Veterans Affairs. Medical Foster Home Program Procedures- VHA Directive 1141.02(1). Published August 9, 2017. Accessed February 12, 2021. https://www.va.gov/vhapublications/ViewPublication.asp?pub_ID=5447.
9. Haverhals LM, Manheim CE, Gilman CV, Jones J, Levy C. Caregivers create a veteran-centric community in VHA medical foster homes. J Gerontol Soc Work. 2016;59(6):441-457. doi:10.1080/01634372.2016.1231730
10. Jones J, Haverhals LM, Manheim CE, Levy C. Fostering excellence: an examination of high-enrollment VHA Medical Foster Home programs. Home Health Care Manag Pract. 2017;30(1):16-22. doi:10.1177/1084822317736795
11. US Department of Veterans Affairs. Veterans Health Administration. Veterans Health Benefits Handbook. Published 2017. Accessed February 17, 2021. https://www. va.gov/healthbenefits/vhbh/publications/vhbh_sample_handb ook_2014.pdf
12. Duan-Porter W, Ullman K, Rosebush C, McKenzie L, et al; Evidence Synthesis Program. Risk factors and interventions to prevent or delay long term nursing home placement for adults with impairments. Published May 2019. Accessed March 2, 2021. https://www.hsrd.research.va.gov/publications/esp/nursing-home-delay.pdf
13. US Department of Veterans Affairs. Caregiver Support Program- VHA NOTICE 2020-31. Published October 1, 2020. Accessed February 2, 2021. https://www.va.gov/VHApublications/ViewPublication.asp?pub_ID=9048
14. US Department of Veterans Affairs. Geriatrics and extended care. Published June 10, 2020. Accessed February 22, 2021. https://www.va.gov/geriatrics/pages/Veteran-Directed_Care.asp
15. HR 1527, 116th Cong (2019). Accessed March 1, 2021. congress.gov/bill/116th-congress/house-bill/1527
16. Levy C, Whitfield EA. Medical foster homes: can the adult foster care model substitute for nursing home care? J Am Geriatr Soc. 2016;64(12):2585-2592. doi:10.1111/jgs.14517
17. Saliba D, Buchanan J. Making the investment count: revision of the Minimum Data Set for nursing homes, MDS 3.0. J Am Med Dir Assoc. 2012;13(7):602-610. doi:10.1016/j.jamda.2012.06.002
18. Saliba D, Jones M, Streim J, Ouslander J, Berlowitz D, Buchanan J. Overview of significant changes in the Minimum Data Set for nursing homes version 3.0. J Am Med Dir Assoc. 2012;13(7):595-601. doi:10.1016/j.jamda.2012.06.001
19. Gilman C, Haverhals L, Manheim C, Levy C. A qualitative exploration of veteran and family perspectives on medical foster homes. Home Health Care Serv Q. 2018;37(1):1-24. doi:10.1080/01621424.2017.1419156
20. Levy CR, Alemi F, Williams AE, et al. Shared homes as an alternative to nursing home care: impact of VA’s Medical Foster Home program on hospitalization. Gerontologist. 2016;56(1):62-71. doi:10.1093/geront/gnv092
21. Levy CR, Jones J, Haverhals LM, Nowels CT. A qualitative evaluation of a new community living model: medical foster home placement. J Nurs Educ Pract. 2013;4(1):p162. doi:10.5430/jnep.v4n1p162
22. Levy C, Whitfield EA, Gutman R. Medical foster home is less costly than traditional nursing home care. Health Serv Res. 2019;54(6):1346-1356. doi:10.1111/1475-6773.13195
23. Manheim CE, Haverhals LM, Jones J, Levy CR. Allowing family to be family: end-of-life care in Veterans Affairs medical foster homes. J Soc Work End Life Palliat Care. 2016;12(1-2):104-125. doi:10.1080/15524256.2016.1156603
24. Thomas KS, Dosa D, Wysocki A, Mor V. The Minimum Data Set 3.0 Cognitive Function Scale. Med Care. 2017;55(9):e68-e72. doi:10.1097/MLR.0000000000000334
25. Saliba D, DiFilippo S, Edelen MO, Kroenke K, Buchanan J, Streim J. Testing the PHQ-9 interview and observational versions (PHQ-9 OV) for MDS 3.0. J Am Med Dir Assoc. 2012;13(7):618-625. doi:10.1016/j.jamda.2012.06.003
26. Perlman CM, Hirdes JP. The aggressive behavior scale: a new scale to measure aggression based on the minimum data set. J Am Geriatr Soc. 2008;56(12):2298-2303. doi:10.1111/j.1532-5415.2008.02048.x
27. McCreedy E, Ogarek JA, Thomas KS, Mor V. The minimum data set agitated and reactive behavior scale: measuring behaviors in nursing home residents with dementia. J Am Med Dir Assoc. 2019;20(12):1548-1552. doi:10.1016/j.jamda.2019.08.030
28. Levy CR, Zargoush M, Williams AE, et al. Sequence of functional loss and recovery in nursing homes. Gerontologist. 2016;56(1):52-61. doi:10.1093/geront/gnv099
29. Wysocki A, Thomas KS, Mor V. Functional improvement among short-stay nursing home residents in the MDS 3.0. J Am Med Dir Assoc. 2015;16(6):470-474. doi:10.1016/j.jamda.2014.11.018
30. Morris JN, Pries B, Morris’ S. Scaling ADLs Within the MDS. J Gerontol A Biol Sci Med Sci. 1999;54(11):M546-M553. doi:10.1093/gerona/54.11.m546
31. Mor V, Zinn J, Gozalo P, Feng Z, Intrator O, Grabowski DC. Prospects for transferring nursing home residents to the community. Health Aff (Millwood). 2007;26(6):1762-1771. doi:10.1377/hlthaff.26.6.1762
32. Ikegami N, Morris JN, Fries BE. Low-care cases in long-term care settings: variation among nations. Age Ageing. 1997;26(suppl 2):67-71. doi:10.1093/ageing/26.suppl_2.67
33. Arling G, Kane RL, Cooke V, Lewis T. Targeting residents for transitions from nursing home to community. Health Serv Res. 2010;45(3):691-711. doi:10.1111/j.1475-6773.2010.01105.x
34. Castle NG. Low-care residents in nursing homes: the impact of market characteristics. J Health Soc Policy. 2002;14(3):41-58. doi:10.1300/J045v14n03_03
35. Grando VT, Rantz MJ, Petroski GF, et al. Prevalence and characteristics of nursing homes residents requiring light-care. Res Nurs Health. 2005;28(3):210-219. doi:10.1002/nur.20079
36. Hahn EA, Thomas KS, Hyer K, Andel R, Meng H. Predictors of low-care prevalence in Florida nursing homes: the role of Medicaid waiver programs. Gerontologist. 2011;51(4):495-503. doi:10.1093/geront/gnr020
37. Thomas KS. The relationship between older Americans act in-home services and low-care residents in nursing homes. J Aging Health. 2014;26(2):250-260. doi:10.1177/0898264313513611
Physician Responsiveness to Positive Blood Culture Results at the Minneapolis Veterans Affairs Hospital—Is Anyone Paying Attention?
The US Department of Veterans Affairs (VA) is the largest health care organization in the US, staffing more than 1,200 facilities and servicing about 9 million veterans.1 Identifying VA practices that promote effective health care delivery has the potential to impact thousands of patients every day. The Surgical service at the Minneapolis VA Medical Center (MVAMC) in Minnesota often questioned colleagues whether many of the ordered tests, including blood cultures for patients with suspected infections, were clinically necessary. Despite recommendations for utilizing culture-driven results in choosing appropriate antimicrobials, it was debated whether these additional tests were simply drawn and ignored resulting only in increased costs and venipuncture discomfort for the patient. Thus, the purpose of this quality improvement study was to determine whether positive blood culture results actually influence clinical management at MVAMC.
Background
Accepted best practice when responding to positive blood culture results entails empiric treatment with broad-spectrum antibiotics that subsequently narrows in breadth of coverage once the pathogen has been identified.2-4 This strategy has been labeled deescalation. Despite the acceptance of these standards, surveys of clinician attitudes towards antibiotics showed that 90% of physicians and residents stated they wanted more education on antimicrobials and 80% desired better schooling on antibiotic choices.5,6 Additionally, in an online survey 18% of 402 inpatient and emergency department providers, including residents, fellows, intensive care unit (ICU) and emergency department attending physicians, hospitalists, physician assistants, and nurse practitioners, described a lack of confidence when deescalating antibiotic therapy and 45% reported that they had received training on antimicrobial prescribing that was not fully adequate.7
These surveys hint at a potential gap in provider education or confidence, which may serve as a barrier to ideal care, further confounding other individualized considerations taken into account when deescalating care. These considerations include patient renal toxicity profiles, the potential for missed pathogens not identified in culture results, unknown sources of infection, and the mindset of many providers to remain on broad therapy if the patient’s condition is improving.8-10 A specific barrier to deescalation within the VA is the variance in antimicrobial stewardship practices between facilities. In a recent widespread survey of VA practices, Chou and colleagues identified that only 29 of 130 (22.3%) responding facilities had a formal policy to establish an antimicrobial stewardship program.11
Overcoming these barriers to deescalation through effective stewardship practices can help to promote improved clinical outcomes. Most studies have demonstrated that outcomes of deescalation strategies have equivalent or improved mortalityand equivalent or even decreased length of ICU stay.12-26 Although a 2014 study by Leone and colleagues reported longer overall ICU stay in deescalation treatment groups with equivalent mortality outcomes, newer data do not support these findings.16,20,22
Furthermore, antibiotics can be expensive. Deescalation, particularly in response to positive blood culture results, has been associated with reduced antibiotic cost due to both a decrease in overall antibiotic usage and the utilization of less expensive choices.22,24,26,27 The findings of these individual studies were corroborated in 2013 by a meta-analysis, including 89 additional studies.28 Besides the direct costs of the drugs, the development of regional antibiotic resistance has been labeled as one of the most pressing concerns in public health, and major initiatives have been undertaken to stem its spread.29,30 The majority of clinicians believe that deescalation of antibiotics would reduce antibiotic resistance. Thus, deescalation is widely cited as one of the primary goals in the management of resistance development.5,24,26,28,31,32
Due to the proposed benefits and challenges of implementation, MVAMC instituted a program where the electronic health records (EHR) for all patients with positive blood culture results were reviewed by the on-call infectious disease attending physician to advise the primary care team on antibiotic administration. The MVAMC system for notification of positive blood culture results has 2 components. The first is phone notification to the on-call resident when the positive result of the pathogen identification is noted by the microbiology laboratory staff. Notably, this protocol of phone notification is only performed when identifying the pathogen and not for the subsequent sensitivity profile. The second component occurs each morning when the on-call infectious disease attending physician reviews all positive blood culture results and the current therapy. If the infectious disease attending physician feels some alterations in management are warranted, the physician calls the primary service. Additionally, the primary service may always request a formal consult with the infectious disease team. This quality improvement study was initiated to examine the success of this deescalation/stewardship program to determine whether positive blood culture results influenced clinical management.
Methods
From July 1, 2015 to June 30, 2016, 212 positive blood cultures at the MVAMC were analyzed. Four cases that did not have an antibiotic spectrum score were excluded, leaving 208 cases reviewed. Duplicate blood cultures were excluded from analysis. The microbiology laboratory used the BD Bactec automated blood culture system using the Plus aerobic and Lytic anaerobic media (Becton, Dickinson and Company).
Antibiotic alterations in response to culture results were classified as either deescalation or escalation, using a spectrum score developed by Madaras-Kelly and colleagues.33 These investigators performed a 3-round modified Delphi survey of infectious disease staff of physicians and pharmacists. The resulting consensus spectrum score for each respective antibiotic reflected the relative susceptibilities of various pathogens to antibiotics and the intrinsic resistance of the pathogens. It is a nonlinear scale from 0 to 60 with a score of 0 indicating no antibacterial activity and a score of 60 indicating complete coverage of all critically identified pathogens. For example, a narrow-spectrum antibiotic such as metronidazole received a spectrum score of 4.0 and a broad-spectrum antibiotic such as piperacillin/tazobactam received a 42.3 score.
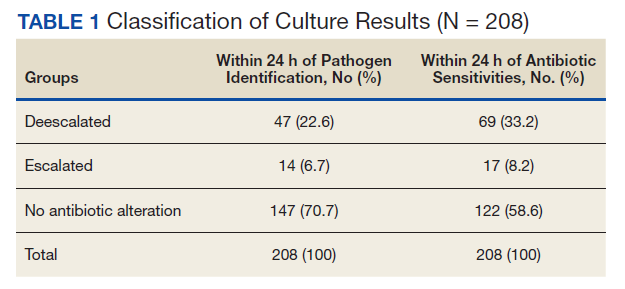
Any decrease in the spectrum score when antibiotics were changed was described as deescalation and an increase was labeled escalation. In cases where multiple antibiotics were used during empiric therapy, the cessation of ≥ 1 antibiotics was classified as a deescalation while the addition of ≥ 1 antibiotics was classified as an escalation.
Madaras-Kelly and colleagues calculated changes in spectrum score and compared them with Delphi participants’ judgments on deescalation with 20 antibiotic regimen vignettes and with non-Delphi steward judgments on deescalation of 300 pneumonia regimen vignettes. Antibiotic spectrum scores were assigned a value for the width of empiric treatment that was compared with the antibiotic spectrum score value derived through antibiotic changes made based on culture results. In the Madaras-Kelly cases, the change in breadth of antibiotic coverage was in agreement with expert classification in 96% of these VA patient cases using VA infectious disease specialists. This margin was noted as being superior to the inter-rater variability between the individual infectious disease specialists.
Data Recording and Analysis
Charts for review were flagged based on positive blood culture results from the microbiology laboratory. EHRs were manually reviewed to determine when antibiotics were started/stopped and when a member of the primary care team, usually a resident, was notified of culture results as documented by the microbiology laboratory personnel. Any alteration in antibiotics that fit the criteria of deescalation or escalation that occurred within 24 hours of notification of either critical laboratory value was recorded. The identity of infectious pathogens and the primary site of infection were not recorded as these data were not within the scope of the purpose of this study. We did not control for possible contaminants within positive blood cultures.
There were 3 time frames considered when determining culture driven alterations to the antibiotic regimen. The first 2 were changes within the 24 hours after notification of either (1) pathogen identification or (2) pathogen sensitivity. These were defined as culture-driven alterations in response to those particular laboratory findings. The third—whole case time frame—spanned from pathogen identification to 24 hours after sensitivity information was recorded. In cases where ≥ 1 antibiotic alteration was noted within a respective time frame, a classification of deescalation or escalation was still assigned. This was done by summing each change in spectrum score that occurred from antibiotic regimen alterations within the time frame, and classifying the net effect on the spectrum of coverage as either deescalation or escalation. Data were recorded in spreadsheet. RStudio 3.5.3 was used for statistical analysis.
Results
Of 208 cases assigned a spectrum score, 47 (22.6%) had the breadth of antibiotic coverage deescalated by the primary care team within 24 hours of pathogen identification with a mean (SD) physician response time of 8.0 (7.3) hours. Fourteen cases (6.7%) had the breadth of antibiotic coverage escalated from pathogen identification with a mean (SD) response time of 8.0 (7.4) hours. When taken together, within 24 hours of pathogen identification from positive blood cultures 61 cases (29.3%) had altered antibiotics, leaving 70.7% of cases unaltered (Tables 1 and 2). In this nonquantitative spectrum score method, deescalations typically involved larger changes in spectrum score than escalations.
Physician notification of pathogen sensitivities resulted in deescalation in 69 cases (33.2%) within 24 hours, with a mean (SD) response time of 10.4 (7) hours. The mean time to deescalation in response to pathogen identification was significantly shorter than the mean time to deescalation in response to sensitivities (P = .049). Broadening of coverage based on sensitivity information was reported for 17 cases (8.2%) within 24 hours, with a mean (SD) response time of 7.6 (6) hours (Table 3). In response to pathogen sensitivity results from positive blood cultures, 58.6% of cases had no antibiotic alterations. Deescalations involved notably larger changes in spectrum score than escalations.
More than half (58.6%) of cases resulted in an antibiotic alteration from empiric treatment when considering the time frame from empiric antibiotics to 24 hours after receiving sensitivity information. These were deemed the whole-case, culture-driven results. In addition to antibiotic alterations that occurred within 24 hours of either pathogen identification or sensitivity information, the whole-case category also considered antibiotic alterations that occurred more than 24 hours after pathogen identification was known and before sensitivity information was available, although this was rare. Some of these patients may have had their antibiotics altered twice, first after pathogen identification and later once sensitivities became available with the net effect recorded as the whole-case administration. Of those that had their antibiotics modified in response to laboratory results, by a ratio of 6.4:1, the change was a deescalation rather than an escalation.
Discussion
The strategy of the infectious disease team at MVAMC is one of deescalation. One challenge of quantifying deescalation was to make a reliable and agreed-upon definition of just what deescalation entails. In 2003, the pharmaceutical company Merck was granted a trademark for the phrase “De-Escalation Therapy” under the international class code 41 for educational and entertainment services. This seemed to correspond to marketing efforts for the antibiotic imipenem/cilastatin. Although the company trademarked the term, it was never defined. The usage of the phrase evolved from a reduction of the dosage of a specific antibiotic to a reduction in the number of antibiotics prescribed to that of monotherapy. The phrase continues to evolve and has now become associated with a change from combination therapy or broad-spectrum antibiotics to monotherapy, switching to an antibiotic that covers fewer pathogens, or even shortening the duration of antibiotic therapy.34 The trademark expired at about the same time the imipenem/cilastatin patent expired. Notably, this drug had initially been marketed for use in empiric antibiotic therapy.35
Barriers
The goal of the stewardship program was not to see a narrowing of the antibiotic spectrum in all patients. Some diseases such as diverticulitis or diabetic foot infections are usually associated with multiple pathogens where relatively broad-spectrum antibiotics seem to be preferred.36,37 Heenen and colleagues reported that infectious disease specialists recommended deescalation in < 50% of cases they examined.38
Comparing different institutions’ deescalation rates can be confusing due to varying definitions, differing patient populations, and health care provider behavior. Thus, the published rates of deescalation range widely from 10 to 70%.2,39,40 In addition to the varied definitions of deescalation, it is challenging to directly compare the rate of deescalation between studies due to institutional variation in empirical broad-spectrum antibiotic usage. A hospital that uses broad-spectrum antibiotics at a higher rate than another has the potential to deescalate more often than one that has low rates of empirical broad-spectrum antibiotic use. Some studies use a conservative definition of deescalation such as narrowing the spectrum of coverage, while others use a more general definition, including both the narrowing of spectrum and/or the discontinuation of antibiotics from empirical therapy.41-45 The more specific and validated definition of deescalation used in this study may allow for standardized comparisons. Another unique feature of this study is that all positive blood cultures were followed, not only those of a particular disease.
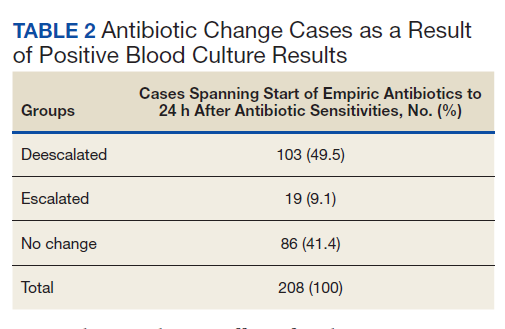
One issue that comes up in all research performed within the VA is how applicable these results are to the general public. Nevertheless, the stewardship program as it is structured at the MVAMC could be applied to other non-VA institutions. We recognize, however, that some smaller hospitals may not have infectious diseases specialists on staff. Despite limited in-house staff, the same daily monitoring can be performed off-site through review of the EHR, thus making this a viable system to more remote VA locations.
While deescalation remains the standard of care, there are many complexities that explain low deescalation rates. Individual considerations that can cause physicians to continue the empirically initiated broad-spectrum coverage include differing renal toxicities, suspecting additional pathogens beyond those documented in testing results, and differential Clostridium difficile risk.46,47 A major concern is the mind-set of many prescribers that streamlining to a different antibiotic or removing antibiotics while the patient is clinically improving on broad empiric therapy represents an unnecessary risk.48,49 These thoughts seem to stem from the old adage, “If it ain’t broke, don’t fix it.”
Due to the challenges in defining deescalation, we elected to use a well-accepted and validated methodology of Madaras-Kelly.33 We recognize the limitations of the methodology, including somewhat differing opinions as to what may constitute breadth and narrowing among clinicians and the somewhat arbitrary assignment of numerical values. This tool was developed to recognize only relative changes in antibiotic spectrum and is not quantitative. A spectrum score of piperacillin/tazobactam of 42.3 could not be construed as 3 times as broad as that of vancomycin at 13. Thus, we did not perform statistical analysis of the magnitude of changes because such analysis would be inconsistent with the intended purpose of the spectrum score method. Additionally, while this method demonstrated reliable classification of appropriate deescalation and escalation in previous studies, a case-by-case review determining appropriateness of antibiotic changes was not performed.
Clinical Response
This quality improvement study was initiated to determine whether positive blood culture results actually affect clinical management at MVAMC. The answer seems to be yes, with blood culture results altering antibiotic administration in about 60% of cases with the predominant change being deescalation. This overall rate of deescalation is toward the higher end of previously documented rates and coincides with the upper bound of the clinically advised deescalation rate described by Heenen and colleagues.38
As noted, the spectrum score is not quantitative. Still, one may be able to contend that the values may provide some insight into the magnitude of the changes in antibiotic selection. Deescalations were on average much larger changes in spectrum than escalations. The larger magnitude of deescalations reflects that when already starting with a very broad spectrum of coverage, it is much easier to get narrower than even broader. Stated another way, when starting therapy using piperacillin/tazobactam at a spectrum score of 42.3 on a 60-point scale, there is much more room for deescalation to 0 than escalation to 60. Additionally, escalations were more likely with much smaller of a spectrum change due to accurate empirical judgment of the suspected pathogens with new findings only necessitating a minor expansion of the spectrum of coverage.
Another finding within this investigation was the statistically significantly shorter response mean (SD) time when deescalating in response to pathogen identification (8 [7.3] h) than to sensitivity profile (10.4 [7] h). Overall when deescalating, the time of each individual response to antibiotic changes was highly irregular. There was no noticeable time point where a change was more likely to occur within the 24 hours after notification of a culture result. This erratic distribution further exemplifies the complexity of deescalation as it underscores the unique nature of each case. The timing of the dosage of previous antibiotics, the health status of the patient, and the individual physician attitudes about the progression and severity of the infection all likely played into this distribution.
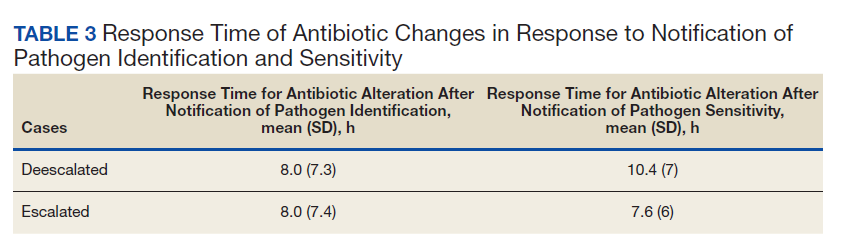
Due to the lack of a regular or even skewed distribution, a Wilcoxon nonparametric rank sum test was performed (P = .049). Although this result was statistically significant, the 2.5-hour time difference is likely clinically irrelevant as both times represent fairly prompt physician responsiveness.50 Nonetheless, it suggests that it was more important to rapidly escalate the breadth of coverage for a patient with a positive blood culture than to deescalate as identified pathogens may have been left untreated with the prescribed antibiotic.
Future Study
Similar studies designed using the spectrum score methodology would allow for more meaningful interinstitutional comparison of antibiotic administration through the use of a unified definition of deescalation and escalation. Comparison of deescalation and escalation rates between hospital systems with similar patient populations with and without prompt infectious disease review and phone notification of blood culture results could further verify the value of such a protocol. It could also help determine which empiric antibiotics may be most effective in individual patient morbidity and mortality outcomes, length of stay, costs, and the development of antibiotic resistance. Chou and colleagues found that only 49 of 130 responding VA facilities had antimicrobial stewardship teams in place with even fewer (29) having a formal policy to establish an antimicrobial stewardship program.11 This significant variation in the practices of VA facilities across the nation underscores the benefit to be gained from implementation of value-added protocols such as daily infectious disease case monitoring and microbiology laboratory phone notification of positive blood culture results as it occurs at MVAMC.
They also noted that systems of patient-level antibiotic review, and the presence of at least one full-time infectious disease physician were both associated with a statistically significant decrease in the use of antimicrobials, corroborating the results of this analysis.11 Adapting the current system of infectious disease specialist review of positive blood culture results to use remote monitoring through the EHR could help to defer some of the cost of needing an in-house specialist while retaining the benefit of the oversite.
Another option for study would be a before and after design to determine whether the program of infectious disease specialist review led to increased use of deescalation strategies similar to studies investigating the efficacy of antimicrobial subcommittee implementation.13,20,23,24,26
Conclusions
This analysis of empiric antibiotic use at the MVAMC indicates promising rates of deescalation. The results indicate that the medical service may be right and that positive blood culture results appear to affect clinical decision making in an appropriate and timely fashion. The VA is the largest health care organization in the US. Thus, identifying and propagating effective stewardship practices on a widespread basis can have a significant effect on the public health of the nation.
These data suggest that the program implemented at the MVAMC of phone notification to the primary care team along with daily infectious disease staff monitoring of blood culture information should be widely adopted at sister institutions using either in-house or remote specialist review.
1. US Department of Veterans Affairs, Veterans Health Administration-About VHA. Updated January 22, 2021. Accessed February 19, 2021. https://www.va.gov/health/aboutvha.asp.
2. Masterton RG. Antibiotic de-escalation. Crit Care Clin. 2011;27(1):149-162. doi:10.1016/j.ccc.2010.09.009
3. Garnacho-Montero J, Gutiérrez-Pizarraya A, Escoresca-Ortega A, et al. De-escalation of empirical therapy is associated with lower mortality in patients with severe sepsis and septic shock. Intensive Care Med. 2014;40(1):32-40. doi:10.1007/s00134-013-3077-7
4. Rhodes A, Evans LE, Alhazzani W, et al. Surviving sepsis campaign: international guidelines for management of sepsis and septic shock: 2016. Intensive Care Med. 2017;43(3):304-377. doi:10.1007/s00134-017-4683-6
5. Srinivasan A, Song X, Richards A, Sinkowitz-Cochran R, Cardo D, Rand C. A survey of knowledge, attitudes, and beliefs of house staff physicians from various specialties concerning antimicrobial use and resistance. Arch Intern Med. 2004;164(13):1451-1456. doi:10.1001/archinte.164.13.1451
6. Stach LM, Hedican EB, Herigon JC, Jackson MA, Newland JG. Clinicians’ attitudes towards an antimicrobial stewardship program at a children’s hospital. J Pediatric Infect Dis Soc. 2012;1(3):190-197. doi:10.1093/jpids/pis045
7. Salsgiver E, Bernstein D, Simon MS, et al. Knowledge, attitudes, and practices regarding antimicrobial use and stewardship among prescribers at acute-care hospitals. Infect Control Hosp Epidemiol. 2018;39(3):316-322. doi:10.1017/ice.2017.317
8. Bamgbola O. Review of vancomycin-induced renal toxicity: an update. Ther Adv Endocrinol Metab. 2016;7(3):136-147. doi:10.1177/2042018816638223
9. Kunni CM, Finland M. Restrictions imposed on antibiotic therapy by renal failure. Arch Intern Med. 1959;104:1030-1050. doi:10.1001/archinte.1959.00270120186021
10. Sartelli M, Catena F, Abu-Zidan FM, et al. Management of intra-abdominal infections: recommendations by the WSES 2016 consensus conference. World J Emerg Surg. 2017;12:22. Published 2017 May 4. doi:10.1186/s13017-017-0132-7
11. Chou AF, Graber CJ, Jones M, et al. Characteristics of antimicrobial stewardship programs at Veterans Affairs hospitals: results of a nationwide survey. Infect Control Hosp Epidemiol. 2016;37(6):647-654. doi:10.1017/ice.2016.26
12. Giantsou E, Liratzopoulos N, Efraimidou E, et al. De-escalation therapy rates are significantly higher by bronchoalveolar lavage than by tracheal aspirate. Intensive Care Med. 2007;33(9):1533-1540. doi:10.1007/s00134-007-0619-x
13. Malani AN, Richards PG, Kapila S, Otto MH, Czerwinski J, Singal B. Clinical and economic outcomes from a community hospital’s antimicrobial stewardship program. Am J Infect Control. 2013;41(2):145-148. doi:10.1016/j.ajic.2012.02.021
14. Souza-Oliveira AC, Cunha TM, Passos LB da S, Lopes GC, Gomes FA, Röder DVD de B. Ventilator-associated pneumonia: the influence of bacterial resistance, prescription errors, and de-escalation of antimicrobial therapy on mortality rates. Brazilian J Infect Dis. 2016;20(5):437-443. doi:10.1016/j.bjid.2016.06.006
15. Kim JW, Chung J, Choi SH, et al. Early use of imipenem/cilastatin and vancomycin followed by de-escalation versus conventional antimicrobials without de-escalation for patients with hospital-acquired pneumonia in a medical ICU: a randomized clinical trial. Crit Care. 2012;16(1):R28. Published 2012 Feb 15. doi:10.1186/cc11197
16. Leone M, Bechis C, Baumstarck K, et al. De-escalation versus continuation of empirical antimicrobial treatment in severe sepsis: a multicenter non-blinded randomized noninferiority trial [published correction appears in Intensive Care Med. 2014 Nov;40(11):1794]. Intensive Care Med. 2014;40(10):1399-1408. doi:10.1007/s00134-014-3411-8
17. Gonzalez L, Cravoisy A, Barraud D, et al. Factors influencing the implementation of antibiotic de-escalation and impact of this strategy in critically ill patients. Crit Care. 2013;17(4):R140. Published 2013 Jul 12. doi:10.1186/cc12819
18. Safdar N, Handelsman J, Maki DG. Does combination antimicrobial therapy reduce mortality in Gram-negative bacteraemia? A meta-analysis. Lancet Infect Dis. 2004;4(8):519-527. doi:10.1016/S1473-3099(04)01108-9
19. Peña C, Suarez C, Ocampo-Sosa A, et al. Effect of adequate single-drug vs combination antimicrobial therapy on mortality in Pseudomonas aeruginosa bloodstream infections: a post hoc analysis of a prospective cohort. Clin Infect Dis. 2013;57(2):208-216. doi:10.1093/cid/cit223
20. Campion M, Scully G. Antibiotic Use in the Intensive Care Unit: Optimization and De-Escalation. J Intensive Care Med. 2018;33(12):647-655. doi:10.1177/0885066618762747
21. Mokart D, Slehofer G, Lambert J, et al. De-escalation of antimicrobial treatment in neutropenic patients with severe sepsis: results from an observational study. Intensive Care Med. 2014;40(1):41-49. doi:10.1007/s00134-013-3148-9
22. Li H, Yang CH, Huang LO, et al. Antibiotics de-escalation in the treatment of ventilator-associated pneumonia in trauma patients: a retrospective study on propensity score matching method. Chin Med J (Engl). 2018;131(10):1151-1157. doi:10.4103/0366-6999.231529
23. Lindsay PJ, Rohailla S, Taggart LR, et al. Antimicrobial stewardship and intensive care unit mortality: a systematic review. Clin Infect Dis. 2019;68(5):748-756. doi:10.1093/cid/ciy550
24. Perez KK, Olsen RJ, Musick WL, et al. Integrating rapid diagnostics and antimicrobial stewardship improves outcomes in patients with antibiotic-resistant Gram-negative bacteremia. J Infect. 2014;69(3):216-225. doi:10.1016/j.jinf.2014.05.005
25. Ikai H, Morimoto T, Shimbo T, Imanaka Y, Koike K. Impact of postgraduate education on physician practice for community-acquired pneumonia. J Eval Clin Pract. 2012;18(2):389-395. doi:10.1111/j.1365-2753.2010.01594.x
26. Ruiz J, Ramirez P, Gordon M, et al. Antimicrobial stewardship programme in critical care medicine: A prospective interventional study. Med Intensiva. 2018;42(5):266-273. doi:10.1016/j.medin.2017.07.002
27. Berild D, Mohseni A, Diep LM, Jensenius M, Ringertz SH. Adjustment of antibiotic treatment according to the results of blood cultures leads to decreased antibiotic use and costs. J Antimicrob Chemother. 2006;57(2):326-330. doi:10.1093/jac/dki463
28. Davey P, Brown E, Charani E, et al. Interventions to improve antibiotic prescribing practices for hospital inpatients. Cochrane Database Syst Rev. 2013;(4):CD003543. Published 2013 Apr 30. doi:10.1002/14651858.CD003543.pub3
29. Centers for Disease Control and Prevention. Antibiotic resistance threats in the United States, 2019. Revised December 2019. Accessed March 2, 2021. https://www.cdc.gov/drugresistance/pdf/threats-report/2019-ar-threats-report-508.pdf
30. O’Neill J. Antimicrobial resistance: tackling a crisis for the health and wealth of nations. Published December 2014. Accessed February 19, 2021. https://amr-review.org/sites/default/files/AMR%20Review%20Paper%20-%20Tackling%20a%20crisis%20for%20the%20health%20and%20wealth%20of%20nations_1.pdf
31. Rhodes A, Evans LE, Alhazzani W, et al. Surviving sepsis campaign: international guidelines for management of sepsis and septic shock: 2016. Intensive Care Med. 2017;43(3):304-377. doi:10.1007/s00134-017-4683-6
32. De Waele JJ, Akova M, Antonelli M, et al. Antimicrobial resistance and antibiotic stewardship programs in the ICU: insistence and persistence in the fight against resistance. A position statement from ESICM/ESCMID/WAAAR round table on multi-drug resistance. Intensive Care Med. 2018;44(2):189-196. doi:10.1007/s00134-017-5036-1
33. Madaras-Kelly K, Jones M, Remington R, Hill N, Huttner B, Samore M. Development of an antibiotic spectrum score based on veterans affairs culture and susceptibility data for the purpose of measuring antibiotic de-escalation: a modified Delphi approach. Infect Control Hosp Epidemiol. 2014;35(9):1103-1113. doi:10.1086/677633
34. Tabah A, Cotta MO, Garnacho-Montero J, et al. A systematic review of the definitions, determinants, and clinical outcomes of antimicrobial de-escalation in the intensive care unit. Clin Infect Dis. 2016;62(8):1009-1017. doi:10.1093/cid/civ1199
35. Primaxin IV. Prescribing information. Merck & Co, Inc; 2001. Accessed February 23, 2021. https://www.merck.com/product/usa/pi_circulars/p/primaxin/primaxin_iv_pi.pdf
36. Coccolini F, Trevisan M, Montori G, et al. Mortality rate and antibiotic resistance in complicated diverticulitis: report of 272 consecutive patients worldwide: a prospective cohort study. Surg Infect (Larchmt). 2017;18(6):716-721. doi:10.1089/sur.2016.283
37. Selva Olid A, Solà I, Barajas-Nava LA, Gianneo OD, Bonfill Cosp X, Lipsky BA. Systemic antibiotics for treating diabetic foot infections. Cochrane Database Syst Rev. 2015;(9):CD009061. Published 2015 Sep 4. doi:10.1002/14651858.CD009061.pub2
38. Heenen S, Jacobs F, Vincent JL. Antibiotic strategies in severe nosocomial sepsis: why do we not de-escalate more often?. Crit Care Med. 2012;40(5):1404-1409. doi:10.1097/CCM.0b013e3182416ecf
39. Morel J, Casoetto J, Jospé R, et al. De-escalation as part of a global strategy of empiric antibiotherapy management. A retrospective study in a medico-surgical intensive care unit. Crit Care. 2010;14(6):R225. doi:10.1186/cc9373
40. Moraes RB, Guillén JA, Zabaleta WJ, Borges FK. De-escalation, adequacy of antibiotic therapy and culture positivity in septic patients: an observational study. Descalonamento, adequação antimicrobiana e positividade de culturas em pacientes sépticos: estudo observacional. Rev Bras Ter Intensiva. 2016;28(3):315-322. doi:10.5935/0103-507X.20160044
41. Khasawneh FA, Karim A, Mahmood T, et al. Antibiotic de-escalation in bacteremic urinary tract infections: potential opportunities and effect on outcome. Infection. 2014;42(5):829-834. doi:10.1007/s15010-014-0639-8
42. Alshareef H, Alfahad W, Albaadani A, Alyazid H, Talib RB. Impact of antibiotic de-escalation on hospitalized patients with urinary tract infections: A retrospective cohort single center study. J Infect Public Health. 2020;13(7):985-990. doi:10.1016/j.jiph.2020.03.004
43. De Waele JJ, Schouten J, Beovic B, Tabah A, Leone M. Antimicrobial de-escalation as part of antimicrobial stewardship in intensive care: no simple answers to simple questions-a viewpoint of experts. Intensive Care Med. 2020;46(2):236-244. doi:10.1007/s00134-019-05871-z
44. Eachempati SR, Hydo LJ, Shou J, Barie PS. Does de-escalation of antibiotic therapy for ventilator-associated pneumonia affect the likelihood of recurrent pneumonia or mortality in critically ill surgical patients?. J Trauma. 2009;66(5):1343-1348. doi:10.1097/TA.0b013e31819dca4e
45. Kollef MH, Morrow LE, Niederman MS, et al. Clinical characteristics and treatment patterns among patients with ventilator-associated pneumonia [published correction appears in Chest. 2006 Jul;130(1):308]. Chest. 2006;129(5):1210-1218. doi:10.1378/chest.129.5.1210
46. Gerding DN, Johnson S, Peterson LR, Mulligan ME, Silva J Jr. Clostridium difficile-associated diarrhea and colitis. Infect Control Hosp Epidemiol. 1995;16(8):459-477. doi:10.1086/648363
47. Pépin J, Saheb N, Coulombe MA, et al. Emergence of fluoroquinolones as the predominant risk factor for Clostridium difficile-associated diarrhea: a cohort study during an epidemic in Quebec. Clin Infect Dis. 2005;41(9):1254-1260. doi:10.1086/496986
48. Seddon MM, Bookstaver PB, Justo JA, et al. Role of Early De-escalation of Antimicrobial Therapy on Risk of Clostridioides difficile Infection Following Enterobacteriaceae Bloodstream Infections. Clin Infect Dis. 2019;69(3):414-420. doi:10.1093/cid/ciy863
49. Livorsi D, Comer A, Matthias MS, Perencevich EN, Bair MJ. Factors influencing antibiotic-prescribing decisions among inpatient physicians: a qualitative investigation. Infect Control Hosp Epidemiol. 2015;36(9):1065-1072. doi:10.1017/ice.2015.136
50. Liu P, Ohl C, Johnson J, Williamson J, Beardsley J, Luther V. Frequency of empiric antibiotic de-escalation in an acute care hospital with an established antimicrobial stewardship program. BMC Infect Dis. 2016;16(1):751. Published 2016 Dec 12. doi:10.1186/s12879-016-2080-3
The US Department of Veterans Affairs (VA) is the largest health care organization in the US, staffing more than 1,200 facilities and servicing about 9 million veterans.1 Identifying VA practices that promote effective health care delivery has the potential to impact thousands of patients every day. The Surgical service at the Minneapolis VA Medical Center (MVAMC) in Minnesota often questioned colleagues whether many of the ordered tests, including blood cultures for patients with suspected infections, were clinically necessary. Despite recommendations for utilizing culture-driven results in choosing appropriate antimicrobials, it was debated whether these additional tests were simply drawn and ignored resulting only in increased costs and venipuncture discomfort for the patient. Thus, the purpose of this quality improvement study was to determine whether positive blood culture results actually influence clinical management at MVAMC.
Background
Accepted best practice when responding to positive blood culture results entails empiric treatment with broad-spectrum antibiotics that subsequently narrows in breadth of coverage once the pathogen has been identified.2-4 This strategy has been labeled deescalation. Despite the acceptance of these standards, surveys of clinician attitudes towards antibiotics showed that 90% of physicians and residents stated they wanted more education on antimicrobials and 80% desired better schooling on antibiotic choices.5,6 Additionally, in an online survey 18% of 402 inpatient and emergency department providers, including residents, fellows, intensive care unit (ICU) and emergency department attending physicians, hospitalists, physician assistants, and nurse practitioners, described a lack of confidence when deescalating antibiotic therapy and 45% reported that they had received training on antimicrobial prescribing that was not fully adequate.7
These surveys hint at a potential gap in provider education or confidence, which may serve as a barrier to ideal care, further confounding other individualized considerations taken into account when deescalating care. These considerations include patient renal toxicity profiles, the potential for missed pathogens not identified in culture results, unknown sources of infection, and the mindset of many providers to remain on broad therapy if the patient’s condition is improving.8-10 A specific barrier to deescalation within the VA is the variance in antimicrobial stewardship practices between facilities. In a recent widespread survey of VA practices, Chou and colleagues identified that only 29 of 130 (22.3%) responding facilities had a formal policy to establish an antimicrobial stewardship program.11
Overcoming these barriers to deescalation through effective stewardship practices can help to promote improved clinical outcomes. Most studies have demonstrated that outcomes of deescalation strategies have equivalent or improved mortalityand equivalent or even decreased length of ICU stay.12-26 Although a 2014 study by Leone and colleagues reported longer overall ICU stay in deescalation treatment groups with equivalent mortality outcomes, newer data do not support these findings.16,20,22
Furthermore, antibiotics can be expensive. Deescalation, particularly in response to positive blood culture results, has been associated with reduced antibiotic cost due to both a decrease in overall antibiotic usage and the utilization of less expensive choices.22,24,26,27 The findings of these individual studies were corroborated in 2013 by a meta-analysis, including 89 additional studies.28 Besides the direct costs of the drugs, the development of regional antibiotic resistance has been labeled as one of the most pressing concerns in public health, and major initiatives have been undertaken to stem its spread.29,30 The majority of clinicians believe that deescalation of antibiotics would reduce antibiotic resistance. Thus, deescalation is widely cited as one of the primary goals in the management of resistance development.5,24,26,28,31,32
Due to the proposed benefits and challenges of implementation, MVAMC instituted a program where the electronic health records (EHR) for all patients with positive blood culture results were reviewed by the on-call infectious disease attending physician to advise the primary care team on antibiotic administration. The MVAMC system for notification of positive blood culture results has 2 components. The first is phone notification to the on-call resident when the positive result of the pathogen identification is noted by the microbiology laboratory staff. Notably, this protocol of phone notification is only performed when identifying the pathogen and not for the subsequent sensitivity profile. The second component occurs each morning when the on-call infectious disease attending physician reviews all positive blood culture results and the current therapy. If the infectious disease attending physician feels some alterations in management are warranted, the physician calls the primary service. Additionally, the primary service may always request a formal consult with the infectious disease team. This quality improvement study was initiated to examine the success of this deescalation/stewardship program to determine whether positive blood culture results influenced clinical management.
Methods
From July 1, 2015 to June 30, 2016, 212 positive blood cultures at the MVAMC were analyzed. Four cases that did not have an antibiotic spectrum score were excluded, leaving 208 cases reviewed. Duplicate blood cultures were excluded from analysis. The microbiology laboratory used the BD Bactec automated blood culture system using the Plus aerobic and Lytic anaerobic media (Becton, Dickinson and Company).
Antibiotic alterations in response to culture results were classified as either deescalation or escalation, using a spectrum score developed by Madaras-Kelly and colleagues.33 These investigators performed a 3-round modified Delphi survey of infectious disease staff of physicians and pharmacists. The resulting consensus spectrum score for each respective antibiotic reflected the relative susceptibilities of various pathogens to antibiotics and the intrinsic resistance of the pathogens. It is a nonlinear scale from 0 to 60 with a score of 0 indicating no antibacterial activity and a score of 60 indicating complete coverage of all critically identified pathogens. For example, a narrow-spectrum antibiotic such as metronidazole received a spectrum score of 4.0 and a broad-spectrum antibiotic such as piperacillin/tazobactam received a 42.3 score.
Any decrease in the spectrum score when antibiotics were changed was described as deescalation and an increase was labeled escalation. In cases where multiple antibiotics were used during empiric therapy, the cessation of ≥ 1 antibiotics was classified as a deescalation while the addition of ≥ 1 antibiotics was classified as an escalation.
Madaras-Kelly and colleagues calculated changes in spectrum score and compared them with Delphi participants’ judgments on deescalation with 20 antibiotic regimen vignettes and with non-Delphi steward judgments on deescalation of 300 pneumonia regimen vignettes. Antibiotic spectrum scores were assigned a value for the width of empiric treatment that was compared with the antibiotic spectrum score value derived through antibiotic changes made based on culture results. In the Madaras-Kelly cases, the change in breadth of antibiotic coverage was in agreement with expert classification in 96% of these VA patient cases using VA infectious disease specialists. This margin was noted as being superior to the inter-rater variability between the individual infectious disease specialists.
Data Recording and Analysis
Charts for review were flagged based on positive blood culture results from the microbiology laboratory. EHRs were manually reviewed to determine when antibiotics were started/stopped and when a member of the primary care team, usually a resident, was notified of culture results as documented by the microbiology laboratory personnel. Any alteration in antibiotics that fit the criteria of deescalation or escalation that occurred within 24 hours of notification of either critical laboratory value was recorded. The identity of infectious pathogens and the primary site of infection were not recorded as these data were not within the scope of the purpose of this study. We did not control for possible contaminants within positive blood cultures.
There were 3 time frames considered when determining culture driven alterations to the antibiotic regimen. The first 2 were changes within the 24 hours after notification of either (1) pathogen identification or (2) pathogen sensitivity. These were defined as culture-driven alterations in response to those particular laboratory findings. The third—whole case time frame—spanned from pathogen identification to 24 hours after sensitivity information was recorded. In cases where ≥ 1 antibiotic alteration was noted within a respective time frame, a classification of deescalation or escalation was still assigned. This was done by summing each change in spectrum score that occurred from antibiotic regimen alterations within the time frame, and classifying the net effect on the spectrum of coverage as either deescalation or escalation. Data were recorded in spreadsheet. RStudio 3.5.3 was used for statistical analysis.
Results
Of 208 cases assigned a spectrum score, 47 (22.6%) had the breadth of antibiotic coverage deescalated by the primary care team within 24 hours of pathogen identification with a mean (SD) physician response time of 8.0 (7.3) hours. Fourteen cases (6.7%) had the breadth of antibiotic coverage escalated from pathogen identification with a mean (SD) response time of 8.0 (7.4) hours. When taken together, within 24 hours of pathogen identification from positive blood cultures 61 cases (29.3%) had altered antibiotics, leaving 70.7% of cases unaltered (Tables 1 and 2). In this nonquantitative spectrum score method, deescalations typically involved larger changes in spectrum score than escalations.
Physician notification of pathogen sensitivities resulted in deescalation in 69 cases (33.2%) within 24 hours, with a mean (SD) response time of 10.4 (7) hours. The mean time to deescalation in response to pathogen identification was significantly shorter than the mean time to deescalation in response to sensitivities (P = .049). Broadening of coverage based on sensitivity information was reported for 17 cases (8.2%) within 24 hours, with a mean (SD) response time of 7.6 (6) hours (Table 3). In response to pathogen sensitivity results from positive blood cultures, 58.6% of cases had no antibiotic alterations. Deescalations involved notably larger changes in spectrum score than escalations.
More than half (58.6%) of cases resulted in an antibiotic alteration from empiric treatment when considering the time frame from empiric antibiotics to 24 hours after receiving sensitivity information. These were deemed the whole-case, culture-driven results. In addition to antibiotic alterations that occurred within 24 hours of either pathogen identification or sensitivity information, the whole-case category also considered antibiotic alterations that occurred more than 24 hours after pathogen identification was known and before sensitivity information was available, although this was rare. Some of these patients may have had their antibiotics altered twice, first after pathogen identification and later once sensitivities became available with the net effect recorded as the whole-case administration. Of those that had their antibiotics modified in response to laboratory results, by a ratio of 6.4:1, the change was a deescalation rather than an escalation.
Discussion
The strategy of the infectious disease team at MVAMC is one of deescalation. One challenge of quantifying deescalation was to make a reliable and agreed-upon definition of just what deescalation entails. In 2003, the pharmaceutical company Merck was granted a trademark for the phrase “De-Escalation Therapy” under the international class code 41 for educational and entertainment services. This seemed to correspond to marketing efforts for the antibiotic imipenem/cilastatin. Although the company trademarked the term, it was never defined. The usage of the phrase evolved from a reduction of the dosage of a specific antibiotic to a reduction in the number of antibiotics prescribed to that of monotherapy. The phrase continues to evolve and has now become associated with a change from combination therapy or broad-spectrum antibiotics to monotherapy, switching to an antibiotic that covers fewer pathogens, or even shortening the duration of antibiotic therapy.34 The trademark expired at about the same time the imipenem/cilastatin patent expired. Notably, this drug had initially been marketed for use in empiric antibiotic therapy.35
Barriers
The goal of the stewardship program was not to see a narrowing of the antibiotic spectrum in all patients. Some diseases such as diverticulitis or diabetic foot infections are usually associated with multiple pathogens where relatively broad-spectrum antibiotics seem to be preferred.36,37 Heenen and colleagues reported that infectious disease specialists recommended deescalation in < 50% of cases they examined.38
Comparing different institutions’ deescalation rates can be confusing due to varying definitions, differing patient populations, and health care provider behavior. Thus, the published rates of deescalation range widely from 10 to 70%.2,39,40 In addition to the varied definitions of deescalation, it is challenging to directly compare the rate of deescalation between studies due to institutional variation in empirical broad-spectrum antibiotic usage. A hospital that uses broad-spectrum antibiotics at a higher rate than another has the potential to deescalate more often than one that has low rates of empirical broad-spectrum antibiotic use. Some studies use a conservative definition of deescalation such as narrowing the spectrum of coverage, while others use a more general definition, including both the narrowing of spectrum and/or the discontinuation of antibiotics from empirical therapy.41-45 The more specific and validated definition of deescalation used in this study may allow for standardized comparisons. Another unique feature of this study is that all positive blood cultures were followed, not only those of a particular disease.
One issue that comes up in all research performed within the VA is how applicable these results are to the general public. Nevertheless, the stewardship program as it is structured at the MVAMC could be applied to other non-VA institutions. We recognize, however, that some smaller hospitals may not have infectious diseases specialists on staff. Despite limited in-house staff, the same daily monitoring can be performed off-site through review of the EHR, thus making this a viable system to more remote VA locations.
While deescalation remains the standard of care, there are many complexities that explain low deescalation rates. Individual considerations that can cause physicians to continue the empirically initiated broad-spectrum coverage include differing renal toxicities, suspecting additional pathogens beyond those documented in testing results, and differential Clostridium difficile risk.46,47 A major concern is the mind-set of many prescribers that streamlining to a different antibiotic or removing antibiotics while the patient is clinically improving on broad empiric therapy represents an unnecessary risk.48,49 These thoughts seem to stem from the old adage, “If it ain’t broke, don’t fix it.”
Due to the challenges in defining deescalation, we elected to use a well-accepted and validated methodology of Madaras-Kelly.33 We recognize the limitations of the methodology, including somewhat differing opinions as to what may constitute breadth and narrowing among clinicians and the somewhat arbitrary assignment of numerical values. This tool was developed to recognize only relative changes in antibiotic spectrum and is not quantitative. A spectrum score of piperacillin/tazobactam of 42.3 could not be construed as 3 times as broad as that of vancomycin at 13. Thus, we did not perform statistical analysis of the magnitude of changes because such analysis would be inconsistent with the intended purpose of the spectrum score method. Additionally, while this method demonstrated reliable classification of appropriate deescalation and escalation in previous studies, a case-by-case review determining appropriateness of antibiotic changes was not performed.
Clinical Response
This quality improvement study was initiated to determine whether positive blood culture results actually affect clinical management at MVAMC. The answer seems to be yes, with blood culture results altering antibiotic administration in about 60% of cases with the predominant change being deescalation. This overall rate of deescalation is toward the higher end of previously documented rates and coincides with the upper bound of the clinically advised deescalation rate described by Heenen and colleagues.38
As noted, the spectrum score is not quantitative. Still, one may be able to contend that the values may provide some insight into the magnitude of the changes in antibiotic selection. Deescalations were on average much larger changes in spectrum than escalations. The larger magnitude of deescalations reflects that when already starting with a very broad spectrum of coverage, it is much easier to get narrower than even broader. Stated another way, when starting therapy using piperacillin/tazobactam at a spectrum score of 42.3 on a 60-point scale, there is much more room for deescalation to 0 than escalation to 60. Additionally, escalations were more likely with much smaller of a spectrum change due to accurate empirical judgment of the suspected pathogens with new findings only necessitating a minor expansion of the spectrum of coverage.
Another finding within this investigation was the statistically significantly shorter response mean (SD) time when deescalating in response to pathogen identification (8 [7.3] h) than to sensitivity profile (10.4 [7] h). Overall when deescalating, the time of each individual response to antibiotic changes was highly irregular. There was no noticeable time point where a change was more likely to occur within the 24 hours after notification of a culture result. This erratic distribution further exemplifies the complexity of deescalation as it underscores the unique nature of each case. The timing of the dosage of previous antibiotics, the health status of the patient, and the individual physician attitudes about the progression and severity of the infection all likely played into this distribution.
Due to the lack of a regular or even skewed distribution, a Wilcoxon nonparametric rank sum test was performed (P = .049). Although this result was statistically significant, the 2.5-hour time difference is likely clinically irrelevant as both times represent fairly prompt physician responsiveness.50 Nonetheless, it suggests that it was more important to rapidly escalate the breadth of coverage for a patient with a positive blood culture than to deescalate as identified pathogens may have been left untreated with the prescribed antibiotic.
Future Study
Similar studies designed using the spectrum score methodology would allow for more meaningful interinstitutional comparison of antibiotic administration through the use of a unified definition of deescalation and escalation. Comparison of deescalation and escalation rates between hospital systems with similar patient populations with and without prompt infectious disease review and phone notification of blood culture results could further verify the value of such a protocol. It could also help determine which empiric antibiotics may be most effective in individual patient morbidity and mortality outcomes, length of stay, costs, and the development of antibiotic resistance. Chou and colleagues found that only 49 of 130 responding VA facilities had antimicrobial stewardship teams in place with even fewer (29) having a formal policy to establish an antimicrobial stewardship program.11 This significant variation in the practices of VA facilities across the nation underscores the benefit to be gained from implementation of value-added protocols such as daily infectious disease case monitoring and microbiology laboratory phone notification of positive blood culture results as it occurs at MVAMC.
They also noted that systems of patient-level antibiotic review, and the presence of at least one full-time infectious disease physician were both associated with a statistically significant decrease in the use of antimicrobials, corroborating the results of this analysis.11 Adapting the current system of infectious disease specialist review of positive blood culture results to use remote monitoring through the EHR could help to defer some of the cost of needing an in-house specialist while retaining the benefit of the oversite.
Another option for study would be a before and after design to determine whether the program of infectious disease specialist review led to increased use of deescalation strategies similar to studies investigating the efficacy of antimicrobial subcommittee implementation.13,20,23,24,26
Conclusions
This analysis of empiric antibiotic use at the MVAMC indicates promising rates of deescalation. The results indicate that the medical service may be right and that positive blood culture results appear to affect clinical decision making in an appropriate and timely fashion. The VA is the largest health care organization in the US. Thus, identifying and propagating effective stewardship practices on a widespread basis can have a significant effect on the public health of the nation.
These data suggest that the program implemented at the MVAMC of phone notification to the primary care team along with daily infectious disease staff monitoring of blood culture information should be widely adopted at sister institutions using either in-house or remote specialist review.
1. US Department of Veterans Affairs, Veterans Health Administration-About VHA. Updated January 22, 2021. Accessed February 19, 2021. https://www.va.gov/health/aboutvha.asp.
2. Masterton RG. Antibiotic de-escalation. Crit Care Clin. 2011;27(1):149-162. doi:10.1016/j.ccc.2010.09.009
3. Garnacho-Montero J, Gutiérrez-Pizarraya A, Escoresca-Ortega A, et al. De-escalation of empirical therapy is associated with lower mortality in patients with severe sepsis and septic shock. Intensive Care Med. 2014;40(1):32-40. doi:10.1007/s00134-013-3077-7
4. Rhodes A, Evans LE, Alhazzani W, et al. Surviving sepsis campaign: international guidelines for management of sepsis and septic shock: 2016. Intensive Care Med. 2017;43(3):304-377. doi:10.1007/s00134-017-4683-6
5. Srinivasan A, Song X, Richards A, Sinkowitz-Cochran R, Cardo D, Rand C. A survey of knowledge, attitudes, and beliefs of house staff physicians from various specialties concerning antimicrobial use and resistance. Arch Intern Med. 2004;164(13):1451-1456. doi:10.1001/archinte.164.13.1451
6. Stach LM, Hedican EB, Herigon JC, Jackson MA, Newland JG. Clinicians’ attitudes towards an antimicrobial stewardship program at a children’s hospital. J Pediatric Infect Dis Soc. 2012;1(3):190-197. doi:10.1093/jpids/pis045
7. Salsgiver E, Bernstein D, Simon MS, et al. Knowledge, attitudes, and practices regarding antimicrobial use and stewardship among prescribers at acute-care hospitals. Infect Control Hosp Epidemiol. 2018;39(3):316-322. doi:10.1017/ice.2017.317
8. Bamgbola O. Review of vancomycin-induced renal toxicity: an update. Ther Adv Endocrinol Metab. 2016;7(3):136-147. doi:10.1177/2042018816638223
9. Kunni CM, Finland M. Restrictions imposed on antibiotic therapy by renal failure. Arch Intern Med. 1959;104:1030-1050. doi:10.1001/archinte.1959.00270120186021
10. Sartelli M, Catena F, Abu-Zidan FM, et al. Management of intra-abdominal infections: recommendations by the WSES 2016 consensus conference. World J Emerg Surg. 2017;12:22. Published 2017 May 4. doi:10.1186/s13017-017-0132-7
11. Chou AF, Graber CJ, Jones M, et al. Characteristics of antimicrobial stewardship programs at Veterans Affairs hospitals: results of a nationwide survey. Infect Control Hosp Epidemiol. 2016;37(6):647-654. doi:10.1017/ice.2016.26
12. Giantsou E, Liratzopoulos N, Efraimidou E, et al. De-escalation therapy rates are significantly higher by bronchoalveolar lavage than by tracheal aspirate. Intensive Care Med. 2007;33(9):1533-1540. doi:10.1007/s00134-007-0619-x
13. Malani AN, Richards PG, Kapila S, Otto MH, Czerwinski J, Singal B. Clinical and economic outcomes from a community hospital’s antimicrobial stewardship program. Am J Infect Control. 2013;41(2):145-148. doi:10.1016/j.ajic.2012.02.021
14. Souza-Oliveira AC, Cunha TM, Passos LB da S, Lopes GC, Gomes FA, Röder DVD de B. Ventilator-associated pneumonia: the influence of bacterial resistance, prescription errors, and de-escalation of antimicrobial therapy on mortality rates. Brazilian J Infect Dis. 2016;20(5):437-443. doi:10.1016/j.bjid.2016.06.006
15. Kim JW, Chung J, Choi SH, et al. Early use of imipenem/cilastatin and vancomycin followed by de-escalation versus conventional antimicrobials without de-escalation for patients with hospital-acquired pneumonia in a medical ICU: a randomized clinical trial. Crit Care. 2012;16(1):R28. Published 2012 Feb 15. doi:10.1186/cc11197
16. Leone M, Bechis C, Baumstarck K, et al. De-escalation versus continuation of empirical antimicrobial treatment in severe sepsis: a multicenter non-blinded randomized noninferiority trial [published correction appears in Intensive Care Med. 2014 Nov;40(11):1794]. Intensive Care Med. 2014;40(10):1399-1408. doi:10.1007/s00134-014-3411-8
17. Gonzalez L, Cravoisy A, Barraud D, et al. Factors influencing the implementation of antibiotic de-escalation and impact of this strategy in critically ill patients. Crit Care. 2013;17(4):R140. Published 2013 Jul 12. doi:10.1186/cc12819
18. Safdar N, Handelsman J, Maki DG. Does combination antimicrobial therapy reduce mortality in Gram-negative bacteraemia? A meta-analysis. Lancet Infect Dis. 2004;4(8):519-527. doi:10.1016/S1473-3099(04)01108-9
19. Peña C, Suarez C, Ocampo-Sosa A, et al. Effect of adequate single-drug vs combination antimicrobial therapy on mortality in Pseudomonas aeruginosa bloodstream infections: a post hoc analysis of a prospective cohort. Clin Infect Dis. 2013;57(2):208-216. doi:10.1093/cid/cit223
20. Campion M, Scully G. Antibiotic Use in the Intensive Care Unit: Optimization and De-Escalation. J Intensive Care Med. 2018;33(12):647-655. doi:10.1177/0885066618762747
21. Mokart D, Slehofer G, Lambert J, et al. De-escalation of antimicrobial treatment in neutropenic patients with severe sepsis: results from an observational study. Intensive Care Med. 2014;40(1):41-49. doi:10.1007/s00134-013-3148-9
22. Li H, Yang CH, Huang LO, et al. Antibiotics de-escalation in the treatment of ventilator-associated pneumonia in trauma patients: a retrospective study on propensity score matching method. Chin Med J (Engl). 2018;131(10):1151-1157. doi:10.4103/0366-6999.231529
23. Lindsay PJ, Rohailla S, Taggart LR, et al. Antimicrobial stewardship and intensive care unit mortality: a systematic review. Clin Infect Dis. 2019;68(5):748-756. doi:10.1093/cid/ciy550
24. Perez KK, Olsen RJ, Musick WL, et al. Integrating rapid diagnostics and antimicrobial stewardship improves outcomes in patients with antibiotic-resistant Gram-negative bacteremia. J Infect. 2014;69(3):216-225. doi:10.1016/j.jinf.2014.05.005
25. Ikai H, Morimoto T, Shimbo T, Imanaka Y, Koike K. Impact of postgraduate education on physician practice for community-acquired pneumonia. J Eval Clin Pract. 2012;18(2):389-395. doi:10.1111/j.1365-2753.2010.01594.x
26. Ruiz J, Ramirez P, Gordon M, et al. Antimicrobial stewardship programme in critical care medicine: A prospective interventional study. Med Intensiva. 2018;42(5):266-273. doi:10.1016/j.medin.2017.07.002
27. Berild D, Mohseni A, Diep LM, Jensenius M, Ringertz SH. Adjustment of antibiotic treatment according to the results of blood cultures leads to decreased antibiotic use and costs. J Antimicrob Chemother. 2006;57(2):326-330. doi:10.1093/jac/dki463
28. Davey P, Brown E, Charani E, et al. Interventions to improve antibiotic prescribing practices for hospital inpatients. Cochrane Database Syst Rev. 2013;(4):CD003543. Published 2013 Apr 30. doi:10.1002/14651858.CD003543.pub3
29. Centers for Disease Control and Prevention. Antibiotic resistance threats in the United States, 2019. Revised December 2019. Accessed March 2, 2021. https://www.cdc.gov/drugresistance/pdf/threats-report/2019-ar-threats-report-508.pdf
30. O’Neill J. Antimicrobial resistance: tackling a crisis for the health and wealth of nations. Published December 2014. Accessed February 19, 2021. https://amr-review.org/sites/default/files/AMR%20Review%20Paper%20-%20Tackling%20a%20crisis%20for%20the%20health%20and%20wealth%20of%20nations_1.pdf
31. Rhodes A, Evans LE, Alhazzani W, et al. Surviving sepsis campaign: international guidelines for management of sepsis and septic shock: 2016. Intensive Care Med. 2017;43(3):304-377. doi:10.1007/s00134-017-4683-6
32. De Waele JJ, Akova M, Antonelli M, et al. Antimicrobial resistance and antibiotic stewardship programs in the ICU: insistence and persistence in the fight against resistance. A position statement from ESICM/ESCMID/WAAAR round table on multi-drug resistance. Intensive Care Med. 2018;44(2):189-196. doi:10.1007/s00134-017-5036-1
33. Madaras-Kelly K, Jones M, Remington R, Hill N, Huttner B, Samore M. Development of an antibiotic spectrum score based on veterans affairs culture and susceptibility data for the purpose of measuring antibiotic de-escalation: a modified Delphi approach. Infect Control Hosp Epidemiol. 2014;35(9):1103-1113. doi:10.1086/677633
34. Tabah A, Cotta MO, Garnacho-Montero J, et al. A systematic review of the definitions, determinants, and clinical outcomes of antimicrobial de-escalation in the intensive care unit. Clin Infect Dis. 2016;62(8):1009-1017. doi:10.1093/cid/civ1199
35. Primaxin IV. Prescribing information. Merck & Co, Inc; 2001. Accessed February 23, 2021. https://www.merck.com/product/usa/pi_circulars/p/primaxin/primaxin_iv_pi.pdf
36. Coccolini F, Trevisan M, Montori G, et al. Mortality rate and antibiotic resistance in complicated diverticulitis: report of 272 consecutive patients worldwide: a prospective cohort study. Surg Infect (Larchmt). 2017;18(6):716-721. doi:10.1089/sur.2016.283
37. Selva Olid A, Solà I, Barajas-Nava LA, Gianneo OD, Bonfill Cosp X, Lipsky BA. Systemic antibiotics for treating diabetic foot infections. Cochrane Database Syst Rev. 2015;(9):CD009061. Published 2015 Sep 4. doi:10.1002/14651858.CD009061.pub2
38. Heenen S, Jacobs F, Vincent JL. Antibiotic strategies in severe nosocomial sepsis: why do we not de-escalate more often?. Crit Care Med. 2012;40(5):1404-1409. doi:10.1097/CCM.0b013e3182416ecf
39. Morel J, Casoetto J, Jospé R, et al. De-escalation as part of a global strategy of empiric antibiotherapy management. A retrospective study in a medico-surgical intensive care unit. Crit Care. 2010;14(6):R225. doi:10.1186/cc9373
40. Moraes RB, Guillén JA, Zabaleta WJ, Borges FK. De-escalation, adequacy of antibiotic therapy and culture positivity in septic patients: an observational study. Descalonamento, adequação antimicrobiana e positividade de culturas em pacientes sépticos: estudo observacional. Rev Bras Ter Intensiva. 2016;28(3):315-322. doi:10.5935/0103-507X.20160044
41. Khasawneh FA, Karim A, Mahmood T, et al. Antibiotic de-escalation in bacteremic urinary tract infections: potential opportunities and effect on outcome. Infection. 2014;42(5):829-834. doi:10.1007/s15010-014-0639-8
42. Alshareef H, Alfahad W, Albaadani A, Alyazid H, Talib RB. Impact of antibiotic de-escalation on hospitalized patients with urinary tract infections: A retrospective cohort single center study. J Infect Public Health. 2020;13(7):985-990. doi:10.1016/j.jiph.2020.03.004
43. De Waele JJ, Schouten J, Beovic B, Tabah A, Leone M. Antimicrobial de-escalation as part of antimicrobial stewardship in intensive care: no simple answers to simple questions-a viewpoint of experts. Intensive Care Med. 2020;46(2):236-244. doi:10.1007/s00134-019-05871-z
44. Eachempati SR, Hydo LJ, Shou J, Barie PS. Does de-escalation of antibiotic therapy for ventilator-associated pneumonia affect the likelihood of recurrent pneumonia or mortality in critically ill surgical patients?. J Trauma. 2009;66(5):1343-1348. doi:10.1097/TA.0b013e31819dca4e
45. Kollef MH, Morrow LE, Niederman MS, et al. Clinical characteristics and treatment patterns among patients with ventilator-associated pneumonia [published correction appears in Chest. 2006 Jul;130(1):308]. Chest. 2006;129(5):1210-1218. doi:10.1378/chest.129.5.1210
46. Gerding DN, Johnson S, Peterson LR, Mulligan ME, Silva J Jr. Clostridium difficile-associated diarrhea and colitis. Infect Control Hosp Epidemiol. 1995;16(8):459-477. doi:10.1086/648363
47. Pépin J, Saheb N, Coulombe MA, et al. Emergence of fluoroquinolones as the predominant risk factor for Clostridium difficile-associated diarrhea: a cohort study during an epidemic in Quebec. Clin Infect Dis. 2005;41(9):1254-1260. doi:10.1086/496986
48. Seddon MM, Bookstaver PB, Justo JA, et al. Role of Early De-escalation of Antimicrobial Therapy on Risk of Clostridioides difficile Infection Following Enterobacteriaceae Bloodstream Infections. Clin Infect Dis. 2019;69(3):414-420. doi:10.1093/cid/ciy863
49. Livorsi D, Comer A, Matthias MS, Perencevich EN, Bair MJ. Factors influencing antibiotic-prescribing decisions among inpatient physicians: a qualitative investigation. Infect Control Hosp Epidemiol. 2015;36(9):1065-1072. doi:10.1017/ice.2015.136
50. Liu P, Ohl C, Johnson J, Williamson J, Beardsley J, Luther V. Frequency of empiric antibiotic de-escalation in an acute care hospital with an established antimicrobial stewardship program. BMC Infect Dis. 2016;16(1):751. Published 2016 Dec 12. doi:10.1186/s12879-016-2080-3
Distribution of Skin-Type Diversity in Photographs in AAD Online Educational Modules
Recent studies have found poor representation of darker skin types (defined as Fitzpatrick skin types V–VI) in dermatology textbooks and online resources.1,2 We sought to evaluate representation of darker skin types in the Basic Dermatology Curriculum of the American Academy of Dermatology (AAD), an online curriculum of 35 lectures that serves as a standard curriculum for dermatologic education, particularly for medical students and residents without a home dermatology program.3 Although core dermatology knowledge was specified as a curricular goal, knowledge of how dermatologic conditions manifest across various skin types was not.3
Methods
Photographs from all Basic Dermatology Curriculum online lectures showing background skin were independently labeled by 3 investigators (B.C., R.F., and G.O.) as light skin (Fitzpatrick types I–IV) or dark skin (Fitzpatrick types V–VI), along with the associated diagnosis. Photographs without visible background skin were excluded (eg, mucous membranes, palms and soles, genitalia, scalp, dermoscopic images). Photographs with indeterminate skin type were evaluated by consensus and excluded if consensus could not be reached. Inter-rater reliability for labeling skin type was determined on an overlapping sample of 24 photographs (Fleiss’s κ, 0.80).
Results
Of 666 included photographs, 104 (15.6%) featured dark skin. Of all photographs of light skin (Fitzpatrick type I–IV), 80.8% were Fitzpatrick types I and II. One-quarter of lectures featured no photographs of dark skin (Figure 1). When the associated diagnoses of photographs were organized into 20 categories, 4 categories—pigmentary disorders, HIV infection, sexually transmitted infections and warts, and papulosquamous eruptions (Figure 2)—each featured 25% or more photographs of dark skin.
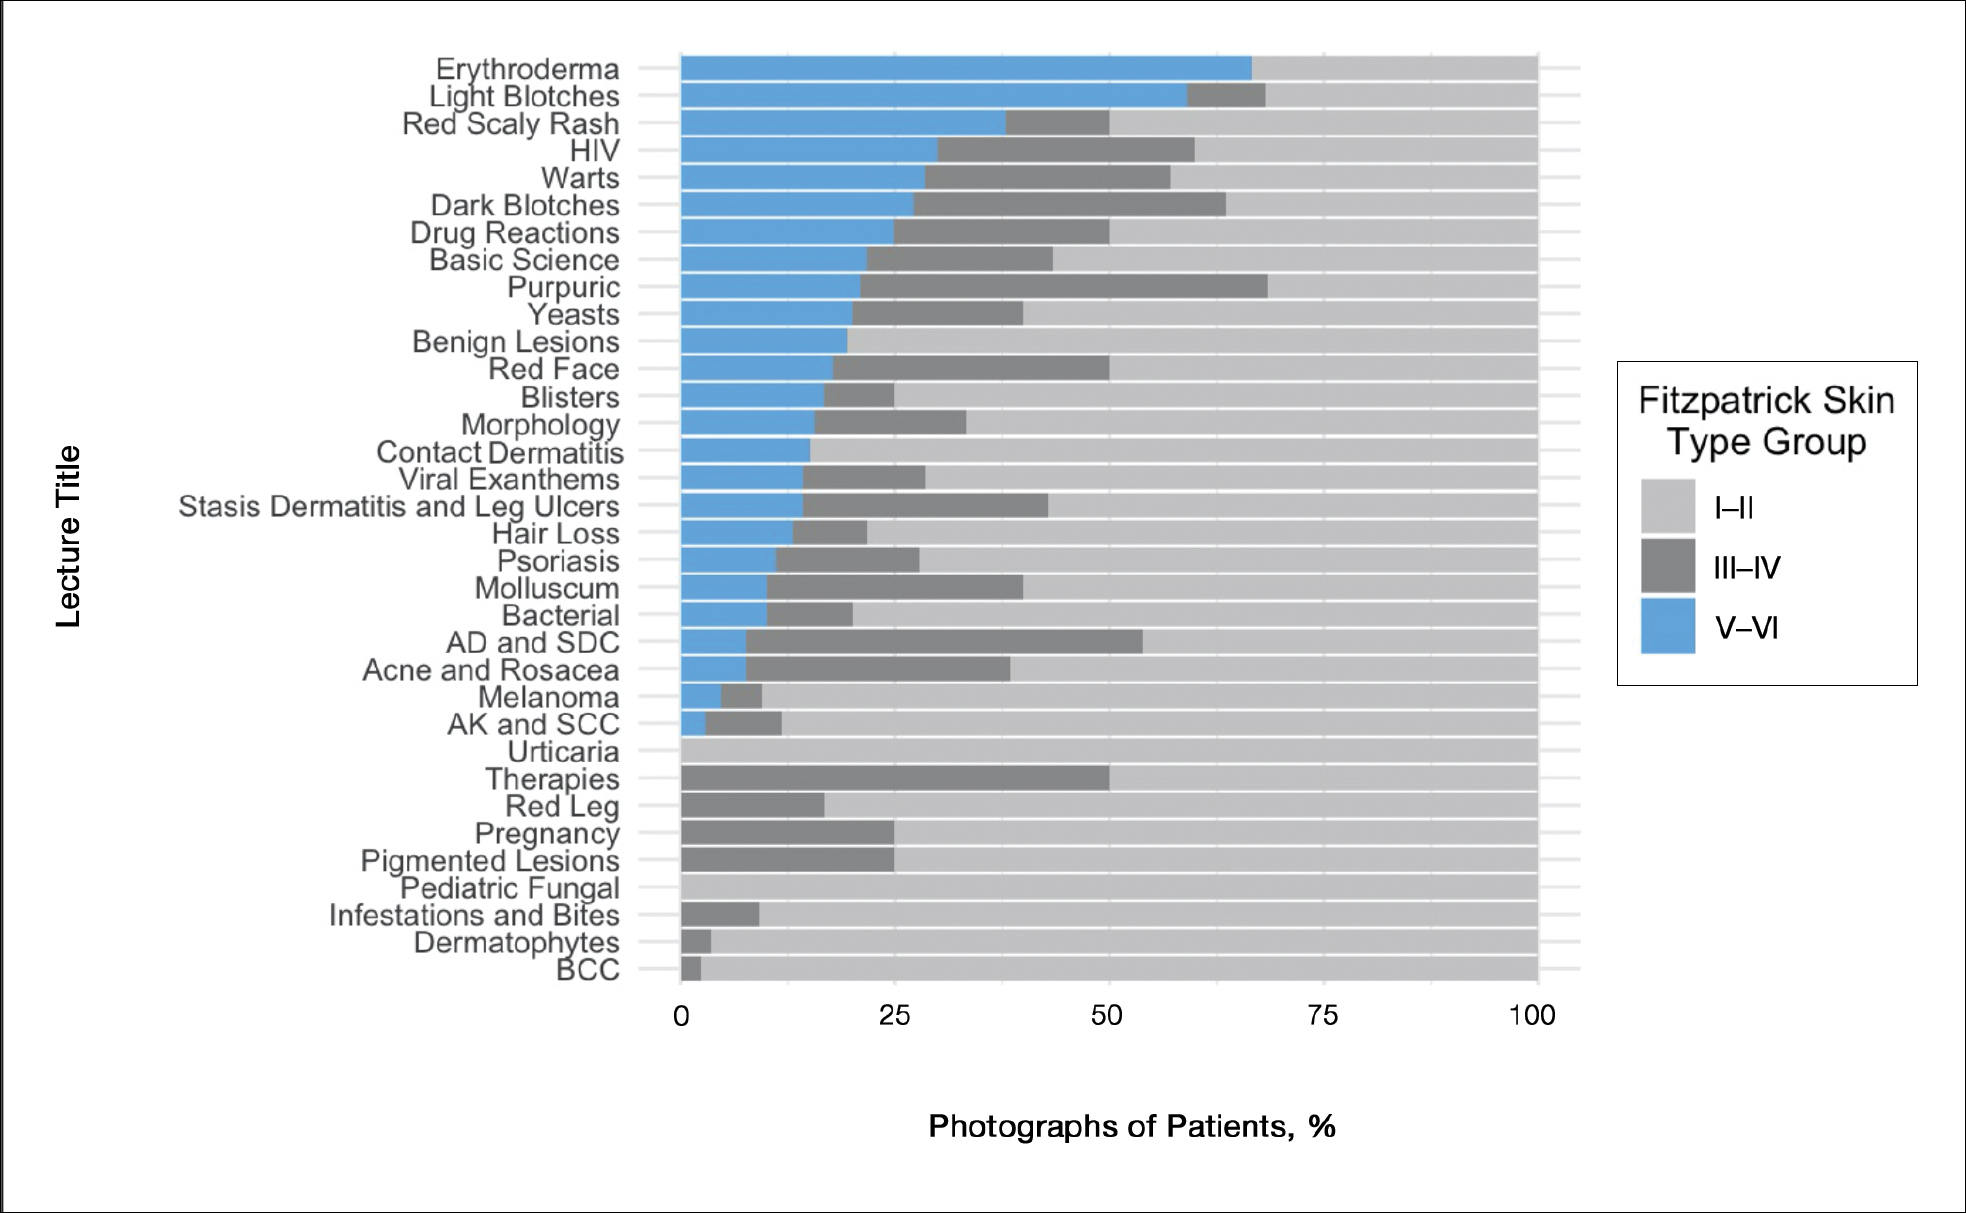
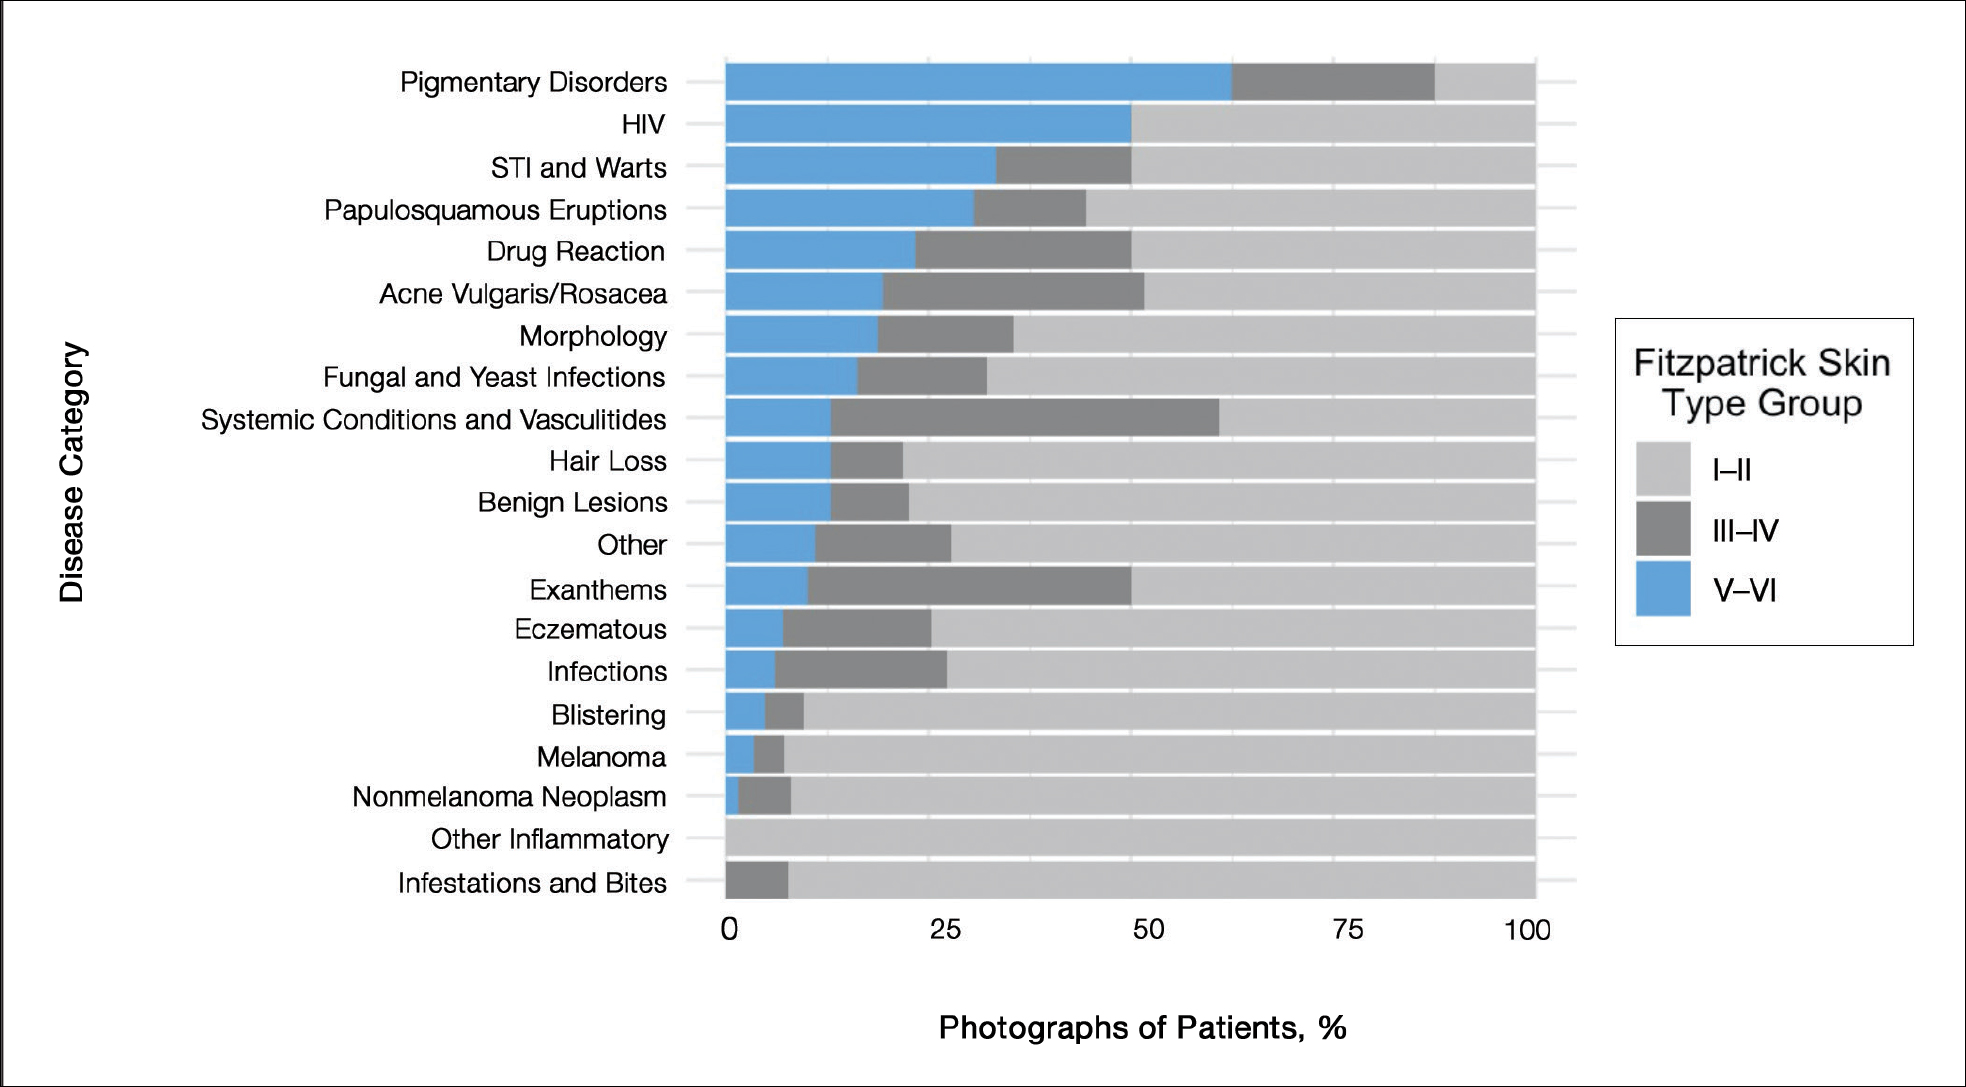
Comment
Our analysis of curricular photographs found dark skin representation in 16% of photographs, mirroring earlier findings in other educational resources.1,2 There was little (<5%) representation of skin cancer in individuals with darker skin, which may merely reflect lower incidence, but there is concern that lack of education about skin cancer might contribute to disparities in care, such as delayed diagnosis.2
For some conditions common in darker-skinned patients, such as acne vulgaris, representation was low; the lecture “Acne vulgaris” featured only 1 photograph of dark skin. In contrast, dark skin types were well represented in photographs of sexually transmitted infections, such as HIV infection, syphilis, and warts, which may suggest bias when dark skin is chosen to represent diseases, as noted in prior findings.1,2
Limitations of this study included individual judgment of skin type and use of the Fitzpatrick scale. Although inter-rater reliability was excellent, the validity of Fitzpatrick classification of skin color is controversial, given that it was intended to describe propensity for sunburn and that types V to VI were added later to describe darker skin.4
Suggestions for Improvement
Given the abundance of resources with depictions of skin of color in teaching materials (eg, Taylor and Kelly’s Dermatology for Skin of Color, Ethnic Dermatology: Principles and Practice) and digital resources (eg, VisualDx [https://www.visualdx.com]), a logical solution might be to add a greater percentage of photographs depicting darker skin from outside resources to address the imbalance. Still, this might be challenging with limited space. Often, there is only room for a single representative photograph. Therefore, greater effort must be made to consistently show how diseases might present variably on different background skin types or, at the least, to create new resources showing greater skin type diversity.
Furthermore, given the lack of representation of skin of color, authors of educational resources can prioritize capturing images of skin pathology presenting in darker skin during their clinical work. Authors who do not have access to a substantial census of patients with darker skin can collaborate with dermatologists who specialize in skin of color to gather such images.
Technical issues include difficulty capturing high-quality images of dermatologic conditions in darker skin because eruptions in these patients might have a narrower range of contrast. Although resources on taking high-quality clinical images are widely available, specific advice for photographing darker skin is lacking and warrants future research.5-7 Collaboration with professional photographers who are experienced with clients with darker skin might be useful in developing guidelines.
Conclusion
Given recent guidance by the AAD to “include common skin disorders and diseases requiring special consideration in people with skin of color” and highlight “current disparities in health outcomes within dermatology,”8 our findings might guide future improvements in curricula.
- Adelekun A, Onyekaba G, Lipoff JB. Skin color in dermatology textbooks: an updated evaluation and analysis. J Am Acad Dermatol. 2021;84:194-196.
- Lester JC, Taylor SC, Chren M‐M. Under‐representation of skin of colour in dermatology images: not just an educational issue. Br J Dermatol. 2019;180:1521-1522.
- Cipriano SD, Dybbro E, Boscardin CK, et al. Online learning in a dermatology clerkship: piloting the new American Academy of Dermatology Medical Student Core Curriculum. J Am Acad Dermatol. 2013;69:267-272.
- Ware OR, Dawson JE, Shinohara MM, et al. Racial limitations of Fitzpatrick skin type. Cutis. 2020;105:77-80.
- Muraco L. Improved medical photography: key tips for creating images of lasting value. JAMA Dermatol. 2020;156:121-123.
- Shainhouse T. Clinical photography best practices. Dermatology Times. May 13, 2016. Accessed January 10, 2021. https://www.dermatologytimes.com/view/clinical-photography-best-practices
- How to take the best photos for teledermatology. VisualDx. Accessed January 10, 2020. https://info.visualdx.com/l/11412/2020-03-31/6h4hdz
- Pritchett EN, Pandya AG, Ferguson NN, et al. Diversity in dermatology: roadmap for improvement. J Am Acad Dermatol. 2018;79:337-341.
Recent studies have found poor representation of darker skin types (defined as Fitzpatrick skin types V–VI) in dermatology textbooks and online resources.1,2 We sought to evaluate representation of darker skin types in the Basic Dermatology Curriculum of the American Academy of Dermatology (AAD), an online curriculum of 35 lectures that serves as a standard curriculum for dermatologic education, particularly for medical students and residents without a home dermatology program.3 Although core dermatology knowledge was specified as a curricular goal, knowledge of how dermatologic conditions manifest across various skin types was not.3
Methods
Photographs from all Basic Dermatology Curriculum online lectures showing background skin were independently labeled by 3 investigators (B.C., R.F., and G.O.) as light skin (Fitzpatrick types I–IV) or dark skin (Fitzpatrick types V–VI), along with the associated diagnosis. Photographs without visible background skin were excluded (eg, mucous membranes, palms and soles, genitalia, scalp, dermoscopic images). Photographs with indeterminate skin type were evaluated by consensus and excluded if consensus could not be reached. Inter-rater reliability for labeling skin type was determined on an overlapping sample of 24 photographs (Fleiss’s κ, 0.80).
Results
Of 666 included photographs, 104 (15.6%) featured dark skin. Of all photographs of light skin (Fitzpatrick type I–IV), 80.8% were Fitzpatrick types I and II. One-quarter of lectures featured no photographs of dark skin (Figure 1). When the associated diagnoses of photographs were organized into 20 categories, 4 categories—pigmentary disorders, HIV infection, sexually transmitted infections and warts, and papulosquamous eruptions (Figure 2)—each featured 25% or more photographs of dark skin.
Comment
Our analysis of curricular photographs found dark skin representation in 16% of photographs, mirroring earlier findings in other educational resources.1,2 There was little (<5%) representation of skin cancer in individuals with darker skin, which may merely reflect lower incidence, but there is concern that lack of education about skin cancer might contribute to disparities in care, such as delayed diagnosis.2
For some conditions common in darker-skinned patients, such as acne vulgaris, representation was low; the lecture “Acne vulgaris” featured only 1 photograph of dark skin. In contrast, dark skin types were well represented in photographs of sexually transmitted infections, such as HIV infection, syphilis, and warts, which may suggest bias when dark skin is chosen to represent diseases, as noted in prior findings.1,2
Limitations of this study included individual judgment of skin type and use of the Fitzpatrick scale. Although inter-rater reliability was excellent, the validity of Fitzpatrick classification of skin color is controversial, given that it was intended to describe propensity for sunburn and that types V to VI were added later to describe darker skin.4
Suggestions for Improvement
Given the abundance of resources with depictions of skin of color in teaching materials (eg, Taylor and Kelly’s Dermatology for Skin of Color, Ethnic Dermatology: Principles and Practice) and digital resources (eg, VisualDx [https://www.visualdx.com]), a logical solution might be to add a greater percentage of photographs depicting darker skin from outside resources to address the imbalance. Still, this might be challenging with limited space. Often, there is only room for a single representative photograph. Therefore, greater effort must be made to consistently show how diseases might present variably on different background skin types or, at the least, to create new resources showing greater skin type diversity.
Furthermore, given the lack of representation of skin of color, authors of educational resources can prioritize capturing images of skin pathology presenting in darker skin during their clinical work. Authors who do not have access to a substantial census of patients with darker skin can collaborate with dermatologists who specialize in skin of color to gather such images.
Technical issues include difficulty capturing high-quality images of dermatologic conditions in darker skin because eruptions in these patients might have a narrower range of contrast. Although resources on taking high-quality clinical images are widely available, specific advice for photographing darker skin is lacking and warrants future research.5-7 Collaboration with professional photographers who are experienced with clients with darker skin might be useful in developing guidelines.
Conclusion
Given recent guidance by the AAD to “include common skin disorders and diseases requiring special consideration in people with skin of color” and highlight “current disparities in health outcomes within dermatology,”8 our findings might guide future improvements in curricula.
- Adelekun A, Onyekaba G, Lipoff JB. Skin color in dermatology textbooks: an updated evaluation and analysis. J Am Acad Dermatol. 2021;84:194-196.
- Lester JC, Taylor SC, Chren M‐M. Under‐representation of skin of colour in dermatology images: not just an educational issue. Br J Dermatol. 2019;180:1521-1522.
- Cipriano SD, Dybbro E, Boscardin CK, et al. Online learning in a dermatology clerkship: piloting the new American Academy of Dermatology Medical Student Core Curriculum. J Am Acad Dermatol. 2013;69:267-272.
- Ware OR, Dawson JE, Shinohara MM, et al. Racial limitations of Fitzpatrick skin type. Cutis. 2020;105:77-80.
- Muraco L. Improved medical photography: key tips for creating images of lasting value. JAMA Dermatol. 2020;156:121-123.
- Shainhouse T. Clinical photography best practices. Dermatology Times. May 13, 2016. Accessed January 10, 2021. https://www.dermatologytimes.com/view/clinical-photography-best-practices
- How to take the best photos for teledermatology. VisualDx. Accessed January 10, 2020. https://info.visualdx.com/l/11412/2020-03-31/6h4hdz
- Pritchett EN, Pandya AG, Ferguson NN, et al. Diversity in dermatology: roadmap for improvement. J Am Acad Dermatol. 2018;79:337-341.
PRACTICE POINTS
- Recent studies have highlighted poor representation of darker skin types in textbooks.
- The Basic Dermatology Curriculum of the American Academy of Dermatology has a low (16%) representation of darker skin types in photographs; more than one-quarter of curriculum lectures had no such images.
- Darker skin types were underrepresented for skin cancers and overrepresented for sexually transmitted infections, raising questions about how photographs were chosen.
- Educators should consider using existing resources of photographs of diverse skin types when designing future curricula.