User login
SHM to Challenge OHRP's Checklist Ruling
Quality improvement (QI) researchers were shocked and dismayed when the Office of Human Research Protections (OHRP) froze a multicenter project investigating the use of checklists to reduce infections in intensive care units (ICU).
Even though this simple intervention had been shown to dramatically cut ICU infection rates, the OHRP opted to halt the study because Johns Hopkins researchers hadn’t run their protocols by the institutional review boards (IRBs) of the 100-plus hospitals participating in the study.
Fearing that this ruling might have a chilling effect on QI studies nationwide, SHM immediately set out to build a coalition of medical organizations to challenge the OHRP’s decision.
SHM is joining several other medical societies to send a letter to Health and Human Services (HHS) Secretary Mike Leavitt to ask him to lift the OHRP’s ban on data collection. In addition, the SHM has posted a letter on its Legislative Action Center Web page (accessible at www.hospitalmedicine.org/beheard) so members can add their voices to the protest.
At Issue
What shocked many was the breadth of the OHRP’s ruling—and the rationale behind it. The OHRP’s problem with the Hopkins study wasn’t that the intervention was harmful—or even risky. The problem was that researchers Pronovost, et al., had published their results in the New England Journal of Medicine in 2006 and hadn’t treated this study as “human subjects research.”1
In general, the OHRP’s goals are laudable, says Robert Wachter, MD, professor and chief of the division of hospital medicine and a professor at the University of California at San Francisco and a former president of the SHM. They want to protect patients.
“I’m not clamoring to get rid of IRBs or to subject unwitting patients to potentially harmful therapies,” Dr. Wachter says. “But it’s crucial to find the right balance between protections built into the research world and allowing people to do quality improvement. This ruling is wrong.”
You want there to constantly be implementation of strategies to improve quality of care and attempts to measurement the impact of those strategies, Dr. Wachter says. “This is the kind of thing that hospitalists should be doing as soon as they wake up in the morning,” he adds.
The checklist at the center of the controversy included five easily implemented procedures that the Centers for Disease Control and Prevention had previously identified as effective in reducing the rate of infections that could result when a central line catheter was inserted. Among the procedures on the checklist were such seemingly commonsense measures as hand washing, cleaning the patient’s skin with chlorhexidine, and using barrier precautions during catheter insertions.
The Hopkins researchers suspected that in the busy ICU environment, these procedures were not routinely followed. Physicians might benefit from a reminder—a checklist.
To determine whether something as simple as a checklist could have an effect on infection rates, researchers from the Johns Hopkins Center for Innovation in Quality Patient Care partnered with 103 hospitals in Michigan that agreed to implement the checklists and keep track of infection rates.
When the researchers compared infection rates before and after the checklists were implemented, they found infections had dropped by two-thirds within the first three months. That’s pretty significant when you consider that each year in ICUs across the nation, there are 80,000 catheter-related bloodstream infections that result in an estimated 28,000 patient deaths.
—Robert Wachter, MD, professor and chief of the division of hospital medicine, University of California, San Francisco
Backlash
The Hopkins researchers figured they wouldn’t have problems with OHRP because they weren’t studying a new, unproven intervention. They were simply trying to discover the impact of providing a checklist of proven procedures.
Just to be on the safe side, though, the researchers presented their plans to the Hopkins IRB, which determined that the study was exempt from review.
So it was a surprise to everyone when the OHRP, acting on an anonymous complaint, weighed in and shut down data collection after ruling that IRBs from each of the 103 hospitals participating in the study would need to separately evaluate and approve the study.
“Most people read about this and their jaws dropped,” Dr. Wachter says. “They couldn’t believe that the federal government would restrict research on the use of a checklist. It’s wacky.”
This is a perfect example of regulatory overreach, Dr. Wachter says.
“It can be challenging to draw the line,” he adds. “But, to me, it defies common sense to say that a program in which we are going to implement a checklist and then collect data to see if it works constitutes research and therefore requires the same amount of patient protection as a study of a new device or a potentially toxic medication.”
What made the OHRP ruling seem even more odd was the fact that another division of the HHS, the Agency for Healthcare Research and Quality, had added Dr. Pronovost’s study to its list of “classic” papers shortly after the research was published.
Making matters worse in many researchers’ minds was the fact the OHRP didn’t stop with this study. An official letter to officials at Johns Hopkins extended the agency’s reach to all Hopkins “quality assurance/quality improvement proposals for which federal funding is being sought.”
The OHRP ordered that these proposals be “examined to determine if IRB review was conducted or if exempt status was not granted inappropriately. If these are not the case, the [principal investigators] for the proposals will be contacted and informed that prospective data collection requires IRB review and that an application for exempt status will not be accepted for these projects.”
And the OHRP went even further. The November letter suggested that even quality assurance/quality improvement studies that included retrospective reviews might be construed as “human subjects research.”
In essence, that means any attempt to evaluate the impact of any type of change in procedures meant to improve quality of care would require IRB scrutiny and—quite likely—patient consents, says Mary Ann Baily, PhD, an associate for ethics and health policy at the Hastings Center in Garrison, N.Y.
“I think it’s very maddening,” Dr. Baily says. “The OHRP has created an impossible situation. Why in heavens name would the OHRP want to tie QI researchers up in knots?”
Despite multiple requests from The Hospitalist, officials at the OHRP declined to comment and clarify the issue.
Some QI researchers see the need for regulation. There should be some oversight, even when it comes to QI, says Lakshmi Halasyamani, MD, vice chair for the department of medicine at St. Joseph Mercy Hospital in Ann Arbor. Mich., and a member of SHM’s Board of Directors. While the intervention involved in the Johns Hopkins case seems relatively benign, this isn’t always the case with QI.
It comes down to evaluating the level of risk to patients, says Dr. Halasyamani. And there needs to be someone, somewhere in the process evaluating the risks to patients of each intervention, Dr. Halasyamani says.
“We shouldn’t be creating a whole new level of bureaucracy that will slow down low risk interventions that could have a huge impact,” she adds. “But, you want someone looking at whether the interventions could have a downside.”
When it’s a low-risk intervention—like the one initiated by the Johns Hopkins researchers—then the forms filled out by patients giving consent for treatment should be enough, Dr. Halasyamani says.
While ethicists and researchers kick these ideas around, others have decided to take some more immediate actions to try to clear the way for research on the low risk interventions.
Dr. Wachter and others are rallying around the Hopkins researchers and orchestrating a letter-writing campaign. “You may ask why we are pushing back so hard to get people to take another look at the OHRP’s ruling on this one study,” he says. “Johns Hopkins has the money and infrastructure to deal with this. They will find a way to get IRB approval from the Michigan hospitals.
“But what about the next time I want to do a quality improvement study, or when one of my residents on a six-month rotation wants to do one? I’m going to say I don’t think you should. It’s going to take a month to get IRB approval and then, potentially, every patient, physician, nurse—basically everyone who comes into contact with the intervention—will need to be consented. The ruling will shut down innovation.” TH
Linda Carroll is a medical journalist based in New Jersey.
Reference
- Pronovost P, Needham D, Berenholtz S, et al. An intervention to decrease catheter-related bloodstream infections in the ICU. N Engl J Med. 2006 Dec 28;355(26):2725-2732. Erratum in: N Engl J Med. 2007 Jun 21;356(25):2660.
Breast Cancer Surgery and Breast Reconstruction
Supplement Editor:
Risal Djohan, MD
Associate Editors:
James E. Zins, MD; David K. Rolston, MD; and Robert Hermann, MD
Contents
Trends in breast cancer screening and diagnosis
Alice Rim, MD; Melanie Chellman-Jeffers, MD; and Alicia Fanning, MD
Overview of breast cancer staging and surgical treatment options
Clarisa Hammer, DO; Alicia Fanning, MD; and Joseph Crowe, MD
Breast reconstruction options following mastectomy
Risal Djohan, MD; Earl Gage, MD; and Steven Bernard, MD
Reconstruction options following breast conservation therapy
Samara Churgin, MD; Raymond Isakov, MD; and Randall Yetman, MD
Options and considerations in the timing of breast reconstruction after mastectomy
Preya Ananthakrishnan, MD, and Armand Lucas, MD
A young woman with fatigue
A 22-year-old woman presents to the clinic for evaluation of fatigue. She has not felt well for the past few years. Her current symptoms include generalized fatigue and diarrhea, characterized as two to three semi-formed, nonbloody bowel movements each day and occasional episodes of watery diarrhea. Her bowel movements are usually precipitated by meals. She consumes a regular diet and has not recognized any intolerance to any particular foods. She denies having any abdominal pain, nausea, vomiting, recent travel, joint pain, rash, or change in the texture of her hair. She has been seen by several internists in her hometown, who have not provided her with a specific diagnosis.
Her medical history is significant for anemia, anxiety, and depression. Menarche occurred at age 16. Her menstrual cycle has been regular, with bleeding noted to be only modest. Her medications include oral contraceptive pills. She has not had previous surgeries.
On examination, she appears well. She is afebrile, weighs 128 lbs, and is 63 inches tall. The physical examination is normal, including a rectal examination and fecal occult blood testing.
Routine laboratory tests are performed. Results:
- White blood cell count 3.88 × 10⁹/L (normal 4.0–11)
- Hemoglobin 10.4 g/dL (normal 12–16)
- Hematocrit 34% (normal 37%–47%)
- Mean corpuscular volume 80.2 fL (normal 80–100)
- Mean corpuscular hemoglobin 24.5 pG (normal 27–34)
- Platelet count 365 × 109/L (normal 150–400)
- Sodium 141 mmol/L (normal 132–148)
- Potassium 4.2 mmol/L (normal 3.5–5.0)
- Chloride 107 mmol/L (normal 98–110)
- Alanine aminotransferase 22 U/L (normal 0–45)
- Glucose 66 mg/dL (normal 65–100)
- Blood urea nitrogen 6 mg/dL (normal 8–25)
- Creatinine 0.6 mg/dL (normal 0.7–1.4)
- Thyroid-stimulating hormone 2.860 mIU/L (normal 0.4–5.5)
- Red blood cell folate 539 ng/mL (normal 257–800)
- Vitamin B12 321 pg/mL (normal 221–700)
- Iron/total iron-binding capacity 21/445 μg/dL (normal 30–140, 210–415)
- Ferritin 5 ng/mL (normal 9–150).
DIFFERENTIAL DIAGNOSIS
1. Which of the following is the most likely cause of her diarrhea?
- Thyroid disease
- Functional bowel disease
- Gluten-sensitive enteropathy (celiac disease)
Given her constellation of symptoms (fatigue, neuropsychiatric changes, iron deficiency anemia, and diarrhea), celiac disease is the most likely diagnosis. Hyperthyroidism can cause diarrhea, but this is unlikely since her thyroid tests are normal. Functional bowel disease is a diagnosis of exclusion and usually has a more chronic, fluctuating course.
CELIAC DISEASE HAS VARIOUS PRESENTATIONS
Celiac disease has various presentations and therefore has been classified into several types1,2:
Classic disease is dominated by symptoms of malabsorption. The diagnosis is established by serologic testing, findings of villous atrophy on biopsy, and improvement of symptoms on a gluten-free diet. However, the presentation of celiac disease has changed, and now atypical presentations are more common in adults (see below). The reason for the change in presentation is not known, but some have hypothesized that it is related to an increase in breast-feeding and the later introduction of cereals into infants’ diets.
Celiac disease with atypical symptoms is characterized by extraintestinal manifestations with few or no gastrointestinal (GI) symptoms. Patients may present with iron-deficiency anemia; osteoporosis or vitamin D deficiency; arthritis; neurologic symptoms such as ataxia, headaches, or depression or anxiety; myocarditis; infertility; or elevated aminotransferase levels. As in classic celiac disease, the diagnosis is established with serologic testing, findings of villous atrophy on biopsy, and improvement of symptoms on a gluten-free diet.
Latent disease includes cases in patients with positive serologic tests but no villous atrophy on biopsy. These patients have no symptoms but may develop symptoms or histologic changes later.
Silent disease refers to cases in patients who have no symptoms but have a positive serologic test and villous atrophy on biopsy. These cases are usually detected via screening of people at high risk, ie, relatives of patients with celiac disease.
It is important that clinicians be aware of the various symptoms and presentations of celiac disease in order to make the diagnosis.
CONFIRMING CELIAC DISEASE
2. Which of the following is used to test for celiac disease?
- Immunoglobulin G (IgG) and immunoglobulin A (IgA) antigliadin antibody testing
- IgA antiendomysial antibody and IgA antitransglutaminase antibody testing
- HLA DQ2/DQ8 testing
The sensitivity of antigliadin antibody testing is only about 70% to 85%, and its specificity is about 70% to 90%. Better serologic tests are those for IgA antiendomysial and antitransglutaminase antibodies, which have sensitivities greater than 90% and specificities greater than 95%.3 HLA DQ2/DQ8 testing has a high sensitivity (> 90%–95%), but because about 30% of the general population also carry these markers, the specificity of this test is not ideal. This test is best used for its negative predictive value—ie, to rule out the diagnosis of celiac disease.
Of note: 1% to 2% of patients with celiac disease have a deficiency of IgA.4 Therefore, if the clinical suspicion for celiac disease is high but the IgA antibody tests are negative or equivocal, IgG antitransglutaminase and IgG antiendomysial antibody tests can help establish the diagnosis. HLA testing in this situation can also help rule out the diagnosis.
CONFIRMING CELIAC DISEASE—CONTINUED
3. What test should be performed next in this patient?
- Upper GI series with small-bowel follow-through
- Esophagogastroduodenoscopy with biopsies
- Small-bowel barium study
- Video capsule endoscopy
Today, the presumptive diagnosis of celiac disease requires positive serologic testing and biopsy results. Esophagogastroduodenoscopy with biopsies should be ordered. Upper GI series and barium studies do not provide a tissue diagnosis. Barium studies and other radiologic tests can be considered if a patient does not have the expected response to a strict gluten-free diet or if one suspects complications of celiac disease, such as GI lymphoma.
Video capsule endoscopy is an emerging tool for diagnosing celiac disease, as suggested in several trials.5 Some findings seen on video capsule endoscopy in patients with celiac disease include mosaicism, nodularity, visible vessels, and loss of mucosal folds. However, the role of this test continues to be investigated, and biopsy is still required to confirm the diagnosis.

WHO SHOULD BE TESTED FOR CELIAC DISEASE?
The reported prevalence of symptomatic celiac disease is about 1 in 1,000 live births in populations of northern European ancestry, ranging from 1 in 250 (in Sweden) to 1 in 4,000 (in Denmark).6 The prevalence appears to be higher in women than in men.7
In a large US study, the prevalence of celiac disease was 1 in 22 in first-degree relatives of celiac patients, 1 in 39 in second-degree relatives, 1 in 56 in patients with either GI symptoms or a condition associated with celiac disease, and 1 in 133 in groups not at risk.8 Another study found that the prevalence of antiendomysial antibodies in US blood donors was as high as 1 in 2,502.
Given that patients with celiac disease may not present with classic symptoms, it has been suggested that the following groups of patients be tested for it1:
- Patients with GI symptoms such as chronic diarrhea, malabsorption, weight loss, or abdominal symptoms
- Patients without diarrhea but with other unexplained signs or symptoms that could be due to celiac disease, such as iron-deficiency anemia, elevated aminotransferase levels, short stature, delayed puberty, or infertility
- Symptomatic patients at high risk for celiac disease. Risk factors include type 1 diabetes or other autoimmune endocrinopathies, first- and second-degree relatives of people with celiac disease, and patients with Turner, Down, or Williams syndromes.
Screening of the general population is not recommended, even in populations at high risk (eg, white people of northern European ancestry).
WHAT CAN CELIAC PATIENTS EAT?
4. Patients with celiac disease should avoid eating which of the following?
- Wheat
- Barley
- Rye
- Oats
Patients with celiac disease should follow a gluten-free diet and should initially eliminate all of these substances.
Some recent studies have suggested that pure oat powder can be tolerated without disease recurrence, although the long-term safety of oat consumption in patients with celiac disease is uncertain.9 It may be reasonable for patients to reintroduce oats when the disease is under control, especially since uncontaminated oats can be obtained from reliable retail or wholesale stores. The definitive diagnosis of celiac disease requires clinical suspicion, serologic tests, biopsy, and documented clinical and histologic improvement after a gluten-free diet is started.
All patients with celiac disease should receive dietary counseling and referral to a nutritionist who is experienced in the treatment of this disease. Because of the significant lifestyle and dietary changes involved in treating this disease, many patients may also benefit from participating in a celiac support group.
COMPLICATIONS OF CELIAC DISEASE
5. What are the complications of untreated celiac disease?
- Anemia
- Osteoporosis
- Intestinal lymphoma
- Infertility
- Neuropsychiatric symptoms
- Rash
All of the above are complications of untreated celiac disease and are often clinical features at presentation. Patients with celiac disease should be tested for anemia and nutritional deficiencies, including iron, folate, calcium, and vitamin D deficiency.
All patients should also undergo dual-energy x-ray absorptiometric scanning. Bone loss is thought to be related to vitamin D deficiency and secondary hyperparathyroidism, and may be partially reversed with a gluten-free diet.
Celiac disease is associated with hyposplenism, so pneumococcal vaccination should be considered. Celiac disease is also frequently associated with the rash of dermatitis herpetiformis, and diagnosis of this rash should prompt an evaluation for celiac disease.
Other associated conditions include Down syndrome, selective IgA deficiency, and other autoimmune diseases such as type 1 diabetes, thyroid disease, and liver disease.
WHAT HAPPENED TO OUR PATIENT?
Our patient tested positive for antiendomysial and antitransglutaminase antibodies and underwent small-bowel biopsy, which confirmed the diagnosis of celiac disease. She was started on a gluten-free diet, and within 2 weeks she noted an improvement in her symptoms of fatigue, GI upset, mood disorders, and difficulty with concentration. She met with a nutritionist who specializes in celiac disease and joined a celiac support group.
However, about 2 months later, her symptoms recurred. She again met with her nutritionist, who confirmed that she was adhering to a gluten-free and lactose-free diet. Even so, when she was tested again for antitransglutaminase antibodies, the titer was elevated. Stool cultures were obtained and were negative. She was started on a course of prednisone, and her symptoms resolved.
WHAT IF PATIENTS DO NOT RESPOND TO TREATMENT?
The most common cause of recurrent symptoms or nonresponse to treatment is noncompliance with the gluten-free diet or inadvertent ingestion of gluten. Patients who do not respond to treatment or who have a period of response but then relapse should be referred back to a nutritionist who specializes in celiac disease.
If a patient continues to have symptoms despite strict adherence to a gluten-free diet, other disorders should be considered, such as concomitant lactose intolerance, small-bowel bacterial overgrowth, pancreatic insufficiency, or irritable bowel syndrome. If these conditions are ruled out, patients can be considered for treatment with prednisone or other immunosuppressive agents. Patients with refractory symptoms are at higher risk of more severe complications of celiac disease, such as intestinal lymphoma, intestinal strictures, and collagenous colitis.
TAKE-HOME POINTS
- Celiac disease classically presents with symptoms of malabsorption, but nonclassic presentations are much more common.
- Celiac disease should be tested for in patients with or without symptoms of mal-absorption and other associated signs or symptoms including unexplained iron-deficiency anemia, infertility, short stature, delayed puberty, or elevated transaminases. Testing should be considered for symptomatic patients with type 1 diabetes or other autoimmune endocrinopathies, first- and second-degree relatives of patients with known disease, and those with certain chromosomal abnormalities.
- Heightened physician awareness is important in the diagnosis of celiac disease.
- Diagnosis depends on serologic testing, biopsy, and clinical improvement on a gluten-free diet.
- Treatment should consist of education about the disease, consultation with a nutritionist experienced in celiac disease, and lifelong adherence to a gluten-free diet. Referral to a celiac support group should be considered.
- Long-term follow-up should include heightened vigilance and awareness of the complications of celiac disease such as osteoporosis, vitamin D deficiency and other nutritional deficiencies, increased risk of malignancy, association with low birth-weight infants and preterm labor, and occurrence of autoimmune disorders.
Acknowledgments: I would like to extend a special thank you to Dr. Walter Henricks, Director, Center for Pathology Informatics, Pathology and Laboratory Medicine, Cleveland Clinic, for providing biopsy slides and interpretation. I would also like to extend thanks to Dr. Derek Abbott, Department of Pathology, Case Western University Hospitals, for his helpful criticisms.
- National Institutes of Health. NIH Consensus Development Conference on Celiac Disease, 2004 Accessed 1/29/2008. http://consensus.nih.gov/2004/2004CeliacDisease118html.htm.
- Rostom A, Murray JA, Kagnoff MF. American Gastroenterological Association (AGA) Institute technical review on the diagnosis and management of celiac disease. Gastroenterology 2006; 131:1981–2002.
- Hellekson K. AHRQ releases practice guidelines for celiac disease screening. Am Fam Phys 2005; 71:1–3.
- Cataldo F, Marino V, Bottaro G, Greco P, Ventura A. Celiac disease and selective immunoglobulin A deficiency. J Pediatr 1997; 131:306–308.
- Kesari A, Bobba RK, Arsura EL. Video capsule endoscopy and celiac disease. Gastrointest Endosc 2005; 62:796–797.
- Branski D, Fasano A, Troncone R. Latest developments in the pathogenesis and treatment of celiac disease. J Pediatr 2006; 149:295–300.
- Rampertab SD, Pooran N, Brar P, Singh P, Green PH. Trends in the presentation of celiac disease. Am J Med 2006; 119 4:355.e9–e14.
- Fasano A, Berti I, Gerarduzzi T, et al. Prevalence of celiac disease in at-risk and not-at-risk groups in the United States: a large multicenter study. Arch Intern Med 2003; 163:286–292.
- Janatuinen EK, Pikkarainen PH, Kemppainen TA, et al. A comparison of diets with and without oats in adults with celiac disease. N Engl J Med 1995; 333:1033–1037.
A 22-year-old woman presents to the clinic for evaluation of fatigue. She has not felt well for the past few years. Her current symptoms include generalized fatigue and diarrhea, characterized as two to three semi-formed, nonbloody bowel movements each day and occasional episodes of watery diarrhea. Her bowel movements are usually precipitated by meals. She consumes a regular diet and has not recognized any intolerance to any particular foods. She denies having any abdominal pain, nausea, vomiting, recent travel, joint pain, rash, or change in the texture of her hair. She has been seen by several internists in her hometown, who have not provided her with a specific diagnosis.
Her medical history is significant for anemia, anxiety, and depression. Menarche occurred at age 16. Her menstrual cycle has been regular, with bleeding noted to be only modest. Her medications include oral contraceptive pills. She has not had previous surgeries.
On examination, she appears well. She is afebrile, weighs 128 lbs, and is 63 inches tall. The physical examination is normal, including a rectal examination and fecal occult blood testing.
Routine laboratory tests are performed. Results:
- White blood cell count 3.88 × 10⁹/L (normal 4.0–11)
- Hemoglobin 10.4 g/dL (normal 12–16)
- Hematocrit 34% (normal 37%–47%)
- Mean corpuscular volume 80.2 fL (normal 80–100)
- Mean corpuscular hemoglobin 24.5 pG (normal 27–34)
- Platelet count 365 × 109/L (normal 150–400)
- Sodium 141 mmol/L (normal 132–148)
- Potassium 4.2 mmol/L (normal 3.5–5.0)
- Chloride 107 mmol/L (normal 98–110)
- Alanine aminotransferase 22 U/L (normal 0–45)
- Glucose 66 mg/dL (normal 65–100)
- Blood urea nitrogen 6 mg/dL (normal 8–25)
- Creatinine 0.6 mg/dL (normal 0.7–1.4)
- Thyroid-stimulating hormone 2.860 mIU/L (normal 0.4–5.5)
- Red blood cell folate 539 ng/mL (normal 257–800)
- Vitamin B12 321 pg/mL (normal 221–700)
- Iron/total iron-binding capacity 21/445 μg/dL (normal 30–140, 210–415)
- Ferritin 5 ng/mL (normal 9–150).
DIFFERENTIAL DIAGNOSIS
1. Which of the following is the most likely cause of her diarrhea?
- Thyroid disease
- Functional bowel disease
- Gluten-sensitive enteropathy (celiac disease)
Given her constellation of symptoms (fatigue, neuropsychiatric changes, iron deficiency anemia, and diarrhea), celiac disease is the most likely diagnosis. Hyperthyroidism can cause diarrhea, but this is unlikely since her thyroid tests are normal. Functional bowel disease is a diagnosis of exclusion and usually has a more chronic, fluctuating course.
CELIAC DISEASE HAS VARIOUS PRESENTATIONS
Celiac disease has various presentations and therefore has been classified into several types1,2:
Classic disease is dominated by symptoms of malabsorption. The diagnosis is established by serologic testing, findings of villous atrophy on biopsy, and improvement of symptoms on a gluten-free diet. However, the presentation of celiac disease has changed, and now atypical presentations are more common in adults (see below). The reason for the change in presentation is not known, but some have hypothesized that it is related to an increase in breast-feeding and the later introduction of cereals into infants’ diets.
Celiac disease with atypical symptoms is characterized by extraintestinal manifestations with few or no gastrointestinal (GI) symptoms. Patients may present with iron-deficiency anemia; osteoporosis or vitamin D deficiency; arthritis; neurologic symptoms such as ataxia, headaches, or depression or anxiety; myocarditis; infertility; or elevated aminotransferase levels. As in classic celiac disease, the diagnosis is established with serologic testing, findings of villous atrophy on biopsy, and improvement of symptoms on a gluten-free diet.
Latent disease includes cases in patients with positive serologic tests but no villous atrophy on biopsy. These patients have no symptoms but may develop symptoms or histologic changes later.
Silent disease refers to cases in patients who have no symptoms but have a positive serologic test and villous atrophy on biopsy. These cases are usually detected via screening of people at high risk, ie, relatives of patients with celiac disease.
It is important that clinicians be aware of the various symptoms and presentations of celiac disease in order to make the diagnosis.
CONFIRMING CELIAC DISEASE
2. Which of the following is used to test for celiac disease?
- Immunoglobulin G (IgG) and immunoglobulin A (IgA) antigliadin antibody testing
- IgA antiendomysial antibody and IgA antitransglutaminase antibody testing
- HLA DQ2/DQ8 testing
The sensitivity of antigliadin antibody testing is only about 70% to 85%, and its specificity is about 70% to 90%. Better serologic tests are those for IgA antiendomysial and antitransglutaminase antibodies, which have sensitivities greater than 90% and specificities greater than 95%.3 HLA DQ2/DQ8 testing has a high sensitivity (> 90%–95%), but because about 30% of the general population also carry these markers, the specificity of this test is not ideal. This test is best used for its negative predictive value—ie, to rule out the diagnosis of celiac disease.
Of note: 1% to 2% of patients with celiac disease have a deficiency of IgA.4 Therefore, if the clinical suspicion for celiac disease is high but the IgA antibody tests are negative or equivocal, IgG antitransglutaminase and IgG antiendomysial antibody tests can help establish the diagnosis. HLA testing in this situation can also help rule out the diagnosis.
CONFIRMING CELIAC DISEASE—CONTINUED
3. What test should be performed next in this patient?
- Upper GI series with small-bowel follow-through
- Esophagogastroduodenoscopy with biopsies
- Small-bowel barium study
- Video capsule endoscopy
Today, the presumptive diagnosis of celiac disease requires positive serologic testing and biopsy results. Esophagogastroduodenoscopy with biopsies should be ordered. Upper GI series and barium studies do not provide a tissue diagnosis. Barium studies and other radiologic tests can be considered if a patient does not have the expected response to a strict gluten-free diet or if one suspects complications of celiac disease, such as GI lymphoma.
Video capsule endoscopy is an emerging tool for diagnosing celiac disease, as suggested in several trials.5 Some findings seen on video capsule endoscopy in patients with celiac disease include mosaicism, nodularity, visible vessels, and loss of mucosal folds. However, the role of this test continues to be investigated, and biopsy is still required to confirm the diagnosis.
WHO SHOULD BE TESTED FOR CELIAC DISEASE?
The reported prevalence of symptomatic celiac disease is about 1 in 1,000 live births in populations of northern European ancestry, ranging from 1 in 250 (in Sweden) to 1 in 4,000 (in Denmark).6 The prevalence appears to be higher in women than in men.7
In a large US study, the prevalence of celiac disease was 1 in 22 in first-degree relatives of celiac patients, 1 in 39 in second-degree relatives, 1 in 56 in patients with either GI symptoms or a condition associated with celiac disease, and 1 in 133 in groups not at risk.8 Another study found that the prevalence of antiendomysial antibodies in US blood donors was as high as 1 in 2,502.
Given that patients with celiac disease may not present with classic symptoms, it has been suggested that the following groups of patients be tested for it1:
- Patients with GI symptoms such as chronic diarrhea, malabsorption, weight loss, or abdominal symptoms
- Patients without diarrhea but with other unexplained signs or symptoms that could be due to celiac disease, such as iron-deficiency anemia, elevated aminotransferase levels, short stature, delayed puberty, or infertility
- Symptomatic patients at high risk for celiac disease. Risk factors include type 1 diabetes or other autoimmune endocrinopathies, first- and second-degree relatives of people with celiac disease, and patients with Turner, Down, or Williams syndromes.
Screening of the general population is not recommended, even in populations at high risk (eg, white people of northern European ancestry).
WHAT CAN CELIAC PATIENTS EAT?
4. Patients with celiac disease should avoid eating which of the following?
- Wheat
- Barley
- Rye
- Oats
Patients with celiac disease should follow a gluten-free diet and should initially eliminate all of these substances.
Some recent studies have suggested that pure oat powder can be tolerated without disease recurrence, although the long-term safety of oat consumption in patients with celiac disease is uncertain.9 It may be reasonable for patients to reintroduce oats when the disease is under control, especially since uncontaminated oats can be obtained from reliable retail or wholesale stores. The definitive diagnosis of celiac disease requires clinical suspicion, serologic tests, biopsy, and documented clinical and histologic improvement after a gluten-free diet is started.
All patients with celiac disease should receive dietary counseling and referral to a nutritionist who is experienced in the treatment of this disease. Because of the significant lifestyle and dietary changes involved in treating this disease, many patients may also benefit from participating in a celiac support group.
COMPLICATIONS OF CELIAC DISEASE
5. What are the complications of untreated celiac disease?
- Anemia
- Osteoporosis
- Intestinal lymphoma
- Infertility
- Neuropsychiatric symptoms
- Rash
All of the above are complications of untreated celiac disease and are often clinical features at presentation. Patients with celiac disease should be tested for anemia and nutritional deficiencies, including iron, folate, calcium, and vitamin D deficiency.
All patients should also undergo dual-energy x-ray absorptiometric scanning. Bone loss is thought to be related to vitamin D deficiency and secondary hyperparathyroidism, and may be partially reversed with a gluten-free diet.
Celiac disease is associated with hyposplenism, so pneumococcal vaccination should be considered. Celiac disease is also frequently associated with the rash of dermatitis herpetiformis, and diagnosis of this rash should prompt an evaluation for celiac disease.
Other associated conditions include Down syndrome, selective IgA deficiency, and other autoimmune diseases such as type 1 diabetes, thyroid disease, and liver disease.
WHAT HAPPENED TO OUR PATIENT?
Our patient tested positive for antiendomysial and antitransglutaminase antibodies and underwent small-bowel biopsy, which confirmed the diagnosis of celiac disease. She was started on a gluten-free diet, and within 2 weeks she noted an improvement in her symptoms of fatigue, GI upset, mood disorders, and difficulty with concentration. She met with a nutritionist who specializes in celiac disease and joined a celiac support group.
However, about 2 months later, her symptoms recurred. She again met with her nutritionist, who confirmed that she was adhering to a gluten-free and lactose-free diet. Even so, when she was tested again for antitransglutaminase antibodies, the titer was elevated. Stool cultures were obtained and were negative. She was started on a course of prednisone, and her symptoms resolved.
WHAT IF PATIENTS DO NOT RESPOND TO TREATMENT?
The most common cause of recurrent symptoms or nonresponse to treatment is noncompliance with the gluten-free diet or inadvertent ingestion of gluten. Patients who do not respond to treatment or who have a period of response but then relapse should be referred back to a nutritionist who specializes in celiac disease.
If a patient continues to have symptoms despite strict adherence to a gluten-free diet, other disorders should be considered, such as concomitant lactose intolerance, small-bowel bacterial overgrowth, pancreatic insufficiency, or irritable bowel syndrome. If these conditions are ruled out, patients can be considered for treatment with prednisone or other immunosuppressive agents. Patients with refractory symptoms are at higher risk of more severe complications of celiac disease, such as intestinal lymphoma, intestinal strictures, and collagenous colitis.
TAKE-HOME POINTS
- Celiac disease classically presents with symptoms of malabsorption, but nonclassic presentations are much more common.
- Celiac disease should be tested for in patients with or without symptoms of mal-absorption and other associated signs or symptoms including unexplained iron-deficiency anemia, infertility, short stature, delayed puberty, or elevated transaminases. Testing should be considered for symptomatic patients with type 1 diabetes or other autoimmune endocrinopathies, first- and second-degree relatives of patients with known disease, and those with certain chromosomal abnormalities.
- Heightened physician awareness is important in the diagnosis of celiac disease.
- Diagnosis depends on serologic testing, biopsy, and clinical improvement on a gluten-free diet.
- Treatment should consist of education about the disease, consultation with a nutritionist experienced in celiac disease, and lifelong adherence to a gluten-free diet. Referral to a celiac support group should be considered.
- Long-term follow-up should include heightened vigilance and awareness of the complications of celiac disease such as osteoporosis, vitamin D deficiency and other nutritional deficiencies, increased risk of malignancy, association with low birth-weight infants and preterm labor, and occurrence of autoimmune disorders.
Acknowledgments: I would like to extend a special thank you to Dr. Walter Henricks, Director, Center for Pathology Informatics, Pathology and Laboratory Medicine, Cleveland Clinic, for providing biopsy slides and interpretation. I would also like to extend thanks to Dr. Derek Abbott, Department of Pathology, Case Western University Hospitals, for his helpful criticisms.
- National Institutes of Health. NIH Consensus Development Conference on Celiac Disease, 2004 Accessed 1/29/2008. http://consensus.nih.gov/2004/2004CeliacDisease118html.htm.
- Rostom A, Murray JA, Kagnoff MF. American Gastroenterological Association (AGA) Institute technical review on the diagnosis and management of celiac disease. Gastroenterology 2006; 131:1981–2002.
- Hellekson K. AHRQ releases practice guidelines for celiac disease screening. Am Fam Phys 2005; 71:1–3.
- Cataldo F, Marino V, Bottaro G, Greco P, Ventura A. Celiac disease and selective immunoglobulin A deficiency. J Pediatr 1997; 131:306–308.
- Kesari A, Bobba RK, Arsura EL. Video capsule endoscopy and celiac disease. Gastrointest Endosc 2005; 62:796–797.
- Branski D, Fasano A, Troncone R. Latest developments in the pathogenesis and treatment of celiac disease. J Pediatr 2006; 149:295–300.
- Rampertab SD, Pooran N, Brar P, Singh P, Green PH. Trends in the presentation of celiac disease. Am J Med 2006; 119 4:355.e9–e14.
- Fasano A, Berti I, Gerarduzzi T, et al. Prevalence of celiac disease in at-risk and not-at-risk groups in the United States: a large multicenter study. Arch Intern Med 2003; 163:286–292.
- Janatuinen EK, Pikkarainen PH, Kemppainen TA, et al. A comparison of diets with and without oats in adults with celiac disease. N Engl J Med 1995; 333:1033–1037.
Should patients on long-term warfarin take aspirin for heart disease?
The literature on this topic is limited, but it suggests that the decision to prescribe aspirin to patients already taking warfarin (Coumadin) should be individualized. On one hand, the cardiovascular benefit of starting or continuing aspirin in patients already on warfarin outweighs the increased risk of bleeding in patients presenting with an acute coronary syndrome or those with mechanical heart valves or coronary stents. However, for patients with stable coronary artery disease or at risk of coronary disease, the benefit of adding aspirin is not substantial, and continuing warfarin alone may be the preferred strategy.
In patients with coronary artery disease, aspirin has been shown to reduce the rate of death due to all causes by about 18% and the rate of vascular events by about 25% to 30%.1,2 Warfarin is at least as effective as aspirin in reducing the rate of future cardiovascular events (especially if the target international normalized ratio [INR] is greater than 2.5), albeit with a higher bleeding risk.3–6
The decision to prescribe or continue aspirin in patients with coronary artery disease who also need long-term anticoagulation with warfarin for an unrelated medical problem, such as pulmonary emboli, requires careful assessment of the individual patient’s bleeding risk and cardiovascular benefit.
ESTIMATING THE BLEEDING RISK FOR PATIENTS ON WARFARIN
In patients taking warfarin, the risk of major bleeding (defined in most studies as hospitalization because of bleeding and requiring transfusion of at least two units of packed red cells, or an intracranial, intraperitoneal, or fatal bleeding episode) is reported to be about 2.0% to 3.8% per person-year.7–11 The risk of major bleeding with aspirin alone is estimated to be 0.13% per person-year,12 but when aspirin is combined with warfarin, the risk increases significantly.13 In a meta-analysis of randomized controlled trials,14 the risk of major bleeding was calculated to be about 1.5 times higher with combination therapy with aspirin and warfarin than with warfarin alone.
The individual’s bleeding risk depends on specific risk factors and the intensity of anticoagulation.15 The outpatient Bleeding Risk Index (BRI) can be used to estimate the bleeding risk for patients on warfarin.16 The BRI includes four risk factors for major bleeding, each scored as 1 point:
- Age 65 or older
- History of gastrointestinal bleeding
- History of stroke
- One or more comorbid conditions—recent myocardial infarction, anemia (hematocrit < 30%), renal impairment (serum creatinine level > 1.5 mg/dL), or diabetes mellitus.
The risk is low if the score is 0, moderate if the score is 1 or 2, and high if the score is 3 or more. In a validation study of the BRI, the rate of major bleeding was found to be 0.8%, 2.5%, and 10.6% per person-year on warfarin in the low, intermediate, and high-risk groups, respectively.17 In addition, compared with patients with a target INR of 2.5, those with a target INR higher than 3.0 have a higher frequency of bleeding episodes.10,15
CONDITIONS IN WHICH ADDING ASPIRIN TO WARFARIN IS FAVORABLE
Acute coronary syndromes
Drugs that inhibit platelet function are the mainstay of medical treatment for acute coronary syndromes. The American College of Cardiology/American Heart Association (ACC/AHA) guidelines recommend that aspirin be started in patients who have an acute myocardial infarction even if they have been receiving warfarin long-term and their INR is in the therapeutic range, especially if a percutaneous coronary intervention is anticipated.4
After percutaneous coronary intervention
In patients who have undergone percutaneous coronary intervention with stent implantation, dual antiplatelet therapy with aspirin and a thienopyridine—ie, clopidogrel (Plavix) or ticlopidine (Ticlid)—is superior to aspirin or warfarin alone in reducing the risk of stent thrombosis and major adverse cardiovascular events such as myocardial infarction or urgent revascularization.18,19 If patients have an indication for long-term anticoagulation, triple therapy with aspirin, warfarin, and clopidogrel or ticlopidine may be considered in order to reduce the likelihood of stent thrombosis.4,20,21 In such patients the INR should be maintained between 2.0 and 3.0 to reduce the risk of bleeding.
The duration of triple therapy is guided by the type of stent used. For bare metal stents, aspirin, clopidogrel or ticlopidine, and warfarin should be given for at least 1 month, after which clopidogrel or ticlopidine may be discontinued. If drug-eluting stents are used, the duration of clopidogrel or ticlopidine therapy should be extended to 1 year or more.4,22
Mechanical heart valves
In patients with mechanical heart valves, the combination of aspirin and warfarin has been shown to decrease the frequency of thromboembolism.23 Guidelines recommend adding aspirin (75 to 100 mg per day) to warfarin in all patients with mechanical valves, especially in patients who have had an embolus while on warfarin therapy or who have a history of cerebrovascular or peripheral vascular disease, a hypercoagulable state, or coronary artery disease.24
CONDITIONS IN WHICH WARFARIN ALONE MAY BE SUFFICIENT
At risk of coronary artery disease
Aspirin therapy is generally recommended as primary prevention for patients whose estimated risk of coronary events is 1.5% per year or higher.25 However, warfarin has also been shown to be effective in the primary prevention of coronary artery disease in men,26 and for patients already taking warfarin, the possible benefit of adding aspirin for primary prevention is outweighed by the increased risk of major bleeding.14 The Medical Research Council directly compared low-intensity warfarin therapy (mean INR 1.47), aspirin, and placebo in a two-by-two factorial study of primary prevention of ischemic heart disease in men.26 Warfarin was more effective than aspirin, and men who received warfarin plus aspirin or warfarin plus placebo had a rate of ischemic heart disease that was 21% lower than those who received aspirin plus placebo or double placebo, and their rate of all-cause mortality was 17% lower. Combining aspirin and warfarin for patients at risk of coronary disease led to a higher rate of major bleeding but no difference in cardiovascular events or all-cause mortality (odds ratio 0.98; 95% confidence interval 0.77–1.25).14
Stable coronary artery disease without mechanical heart valves or stents
Large randomized trials have found warfarin to be effective in secondary prevention of coronary artery disease.4–6 For most patients with stable coronary artery disease (ie, who have had no ischemic events or coronary interventions in the last 6 months) who need anticoagulation because of atrial fibrillation or venous thromboembolism, warfarin alone (target INR 2.0–3.0) should provide satisfactory antithrombotic prophylaxis against both cerebral and myocardial ischemic events.27 The addition of an antiplatelet agent is not required unless a patient has a coronary stent, a mechanical valve, or an excessive thrombotic risk.4,24,27
TAKE-HOME POINTS
For patients receiving warfarin therapy, whether to add or continue aspirin to their treatment is a common clinical question. The risk of bleeding is greater with combination therapy than with warfarin alone. The cardiovascular benefit varies depending on the clinical situation:
- In patients who have had an acute coronary syndrome or who have a coronary stent or mechanical valve, combination therapy is usually recommended because the benefits outweigh the risks.
- In patients with stable coronary artery disease or those without coronary artery disease who are at risk of coronary events, the risks outweigh the benefits. Combination therapy is usually not indicated in these patients.
- Weisman SM, Graham DY. Evaluation of the benefits and risks of low-dose aspirin in the secondary prevention of cardiovascular and cerebrovascular events. Arch Intern Med 2002; 162:2197–2202.
- Antithrombotic Trialists’ Collaboration. Collaborative meta-analysis of randomised trials of antiplatelet therapy for prevention of death, myocardial infarction, and stroke in high risk patients. BMJ 2002; 324:71–86.
- Hurlen M, Abdelnoor M, Smith P, Erikssen J, Arnesen H. Warfarin, aspirin, or both after myocardial infarction. N Engl J Med 2002; 347:969–974.
- Antman EM, Anbe DT, Armstrong PW, et al. ACC/AHA guidelines for the management of patients with ST-elevation myocardial infarction; a report of the American College of Cardiology/American Heart Association Task Force on Practice Guidelines (Committee to Revise the 1999 Guidelines for the Management of patients with acute myocardial infarction). J Am Coll Cardiol 2004; 44:E1–E211.
- Van Es RF, Jonker JJ, Verheugt FW, et al. Antithrombotics in the Secondary Prevention of Events in Coronary Thrombosis-2 (ASPECT-2) Research Group. Aspirin and coumadin after acute coronary syndromes (the ASPECT-2 study): a randomised controlled trial. Lancet 2002; 360:109–113.
- Anand SS, Yusuf S. Oral anticoagulant therapy in patients with coronary artery disease: a meta-analysis. JAMA 1999; 282:2058–2067.
- Schulman S, Granqvist S, Holmstrom M, et al. The duration of oral anticoagulant therapy after a second episode of venous thromboembolism. The Duration of Anticoagulation Trial Study Group. N Engl J Med 1997; 336:393–398.
- Kearon C, Gent M, Hirsh J, et al. A comparison of three months of anticoagulation with extended anticoagulation for a first episode of idiopathic venous thromboembolism. N Engl J Med 1999; 340:901–907.
- Agnelli G, Prandoni P, Santamaria MG, et al. Three months versus one year of oral anticoagulant therapy for idiopathic deep venous thrombosis. Warfarin Optimal Duration Italian Trial Investigators. N Engl J Med 2001; 345:165–169.
- Levine MN, Raskob G, Beyth RJ, Kearon C, Schulman S. Hemorrhagic complications of anticoagulant treatment: the Seventh ACCP Conference on Antithrombotic and Thrombolytic Therapy. Chest 2004; 126 suppl:287S–310S.
- Linkins LA, Choi PT, Douketis JD. Clinical impact of bleeding in patients taking oral anticoagulant therapy for venous thromboembolism: a meta-analysis. Ann Intern Med 2003; 139:893–900.
- McQuaid KR, Laine L. Systematic review and meta-analysis of adverse events of low-dose aspirin and clopidogrel in randomized controlled trials. Am J Med 2006; 119:624–638.
- Rothberg MB, Celestin C, Fiore LD, Lawler E, Cook JR. Warfarin plus aspirin after myocardial infarction or the acute coronary syndrome: meta-analysis with estimates of risk and benefit. Ann Intern Med 2005; 143:241–250.
- Dentali F, Douketis JD, Lim W, Crowther M. Combined aspirin-oral anticoagulant therapy compared with oral anticoagulant therapy alone among patients at risk for cardiovascular disease: a meta-analysis of randomized trials. Arch Intern Med 2007; 167:117–124.
- Hirsh J, Fuster V, Ansell J, Halperin JL. American Heart Association; American College of Cardiology Foundation. American Heart Association/American College of Cardiology Foundation guide to warfarin therapy. Circulation 2003; 107:1692–1711.
- Beyth RJ, Quinn LM, Landefeld CS. Prospective evaluation of an index for predicting the risk of major bleeding in outpatients treated with warfarin. Am J Med 1998; 105:91–99.
- Aspinall SL, DeSanzo BE, Trilli LE, Good CB. Bleeding Risk Index in an anticoagulation clinic. Assessment by indication and implications for care. J Gen Intern Med 2005; 20:1008–1013.
- Mehta SR, Yusuf S, Peters RJ, et al. Clopidogrel in Unstable angina to prevent Recurrent Events trial (CURE) Investigators. Effects of pretreatment with clopidogrel and aspirin followed by long-term therapy in patients undergoing percutaneous coronary intervention: the PCICURE study. Lancet 2001; 358:527–533.
- Bertrand ME, Legrand V, Boland J, et al. Randomized multicenter comparison of conventional anticoagulation versus antiplatelet therapy in unplanned and elective coronary stenting. The Full Anticoagulation versus Aspirin and Ticlopidine (FANTASTIC) study. Circulation 1998; 98:1597–1603.
- Kushner FG, Antman EM. Oral anticoagulation for atrial fibrillation after ST-elevation myocardial infarction: new evidence to guide clinical practice. Circulation 2005; 112:3212–3214.
- Porter A, Konstantino Y, Iakobishvili Z, Shachar L, Battler A, Hasdai D. Short-term triple therapy with aspirin, warfarin, and a thienopyridine among patients undergoing percutaneous coronary intervention. Catheter Cardiovasc Interv 2006; 68:56–61.
- Anderson JL, Adams CD, Antman EM, et al. ACC/AHA 2007 Guidelines for the management of patients with unstable angina/non-ST-elevation myocardial infarction—executive summary. A report of the ACC-AHA Task Force on Practice Guidelines (Writing Committee to Revise the 2002 Guidelines for the Management of Patients With Unstable Angina/Non-ST-Elevation Myocardial Infarction). J Am Coll Cardiol 2007; 50:652–726.
- Turpie AG, Gent M, Laupacis A, et al. A comparison of aspirin with placebo in patients treated with warfarin after heart-valve replacement. N Engl J Med 1993; 329:524–529.
- Bonow RO, Carabello BA, Kanu C, et al. ACC/AHA 2006 guidelines for the management of patients with valvular heart disease: a report of the ACC/AHA Task Force on Practice Guidelines (writing committee to revise the 1998 Guidelines for the Management of Patients With Valvular Heart Disease). Circulation 2006; 114:e84–e231.
- Lauer MS. Clinical practice. Aspirin for primary prevention of coronary events. N Engl J Med 2002; 346:1468–1474.
- The Medical Research Council’s General Practice Research Framework. Thrombosis prevention trial: randomised trial of low-intensity oral anticoagulation with warfarin and low-dose aspirin in the primary prevention of ischaemic heart disease in men at increased risk. Lancet 1998; 351:233–241.
- Fuster V, Ryden LE, Cannom DS, et al. ACC/AHA/ESC guidelines for the management of patients with atrial fibrillation. Circulation 2006; 114:260–335.
The literature on this topic is limited, but it suggests that the decision to prescribe aspirin to patients already taking warfarin (Coumadin) should be individualized. On one hand, the cardiovascular benefit of starting or continuing aspirin in patients already on warfarin outweighs the increased risk of bleeding in patients presenting with an acute coronary syndrome or those with mechanical heart valves or coronary stents. However, for patients with stable coronary artery disease or at risk of coronary disease, the benefit of adding aspirin is not substantial, and continuing warfarin alone may be the preferred strategy.
In patients with coronary artery disease, aspirin has been shown to reduce the rate of death due to all causes by about 18% and the rate of vascular events by about 25% to 30%.1,2 Warfarin is at least as effective as aspirin in reducing the rate of future cardiovascular events (especially if the target international normalized ratio [INR] is greater than 2.5), albeit with a higher bleeding risk.3–6
The decision to prescribe or continue aspirin in patients with coronary artery disease who also need long-term anticoagulation with warfarin for an unrelated medical problem, such as pulmonary emboli, requires careful assessment of the individual patient’s bleeding risk and cardiovascular benefit.
ESTIMATING THE BLEEDING RISK FOR PATIENTS ON WARFARIN
In patients taking warfarin, the risk of major bleeding (defined in most studies as hospitalization because of bleeding and requiring transfusion of at least two units of packed red cells, or an intracranial, intraperitoneal, or fatal bleeding episode) is reported to be about 2.0% to 3.8% per person-year.7–11 The risk of major bleeding with aspirin alone is estimated to be 0.13% per person-year,12 but when aspirin is combined with warfarin, the risk increases significantly.13 In a meta-analysis of randomized controlled trials,14 the risk of major bleeding was calculated to be about 1.5 times higher with combination therapy with aspirin and warfarin than with warfarin alone.
The individual’s bleeding risk depends on specific risk factors and the intensity of anticoagulation.15 The outpatient Bleeding Risk Index (BRI) can be used to estimate the bleeding risk for patients on warfarin.16 The BRI includes four risk factors for major bleeding, each scored as 1 point:
- Age 65 or older
- History of gastrointestinal bleeding
- History of stroke
- One or more comorbid conditions—recent myocardial infarction, anemia (hematocrit < 30%), renal impairment (serum creatinine level > 1.5 mg/dL), or diabetes mellitus.
The risk is low if the score is 0, moderate if the score is 1 or 2, and high if the score is 3 or more. In a validation study of the BRI, the rate of major bleeding was found to be 0.8%, 2.5%, and 10.6% per person-year on warfarin in the low, intermediate, and high-risk groups, respectively.17 In addition, compared with patients with a target INR of 2.5, those with a target INR higher than 3.0 have a higher frequency of bleeding episodes.10,15
CONDITIONS IN WHICH ADDING ASPIRIN TO WARFARIN IS FAVORABLE
Acute coronary syndromes
Drugs that inhibit platelet function are the mainstay of medical treatment for acute coronary syndromes. The American College of Cardiology/American Heart Association (ACC/AHA) guidelines recommend that aspirin be started in patients who have an acute myocardial infarction even if they have been receiving warfarin long-term and their INR is in the therapeutic range, especially if a percutaneous coronary intervention is anticipated.4
After percutaneous coronary intervention
In patients who have undergone percutaneous coronary intervention with stent implantation, dual antiplatelet therapy with aspirin and a thienopyridine—ie, clopidogrel (Plavix) or ticlopidine (Ticlid)—is superior to aspirin or warfarin alone in reducing the risk of stent thrombosis and major adverse cardiovascular events such as myocardial infarction or urgent revascularization.18,19 If patients have an indication for long-term anticoagulation, triple therapy with aspirin, warfarin, and clopidogrel or ticlopidine may be considered in order to reduce the likelihood of stent thrombosis.4,20,21 In such patients the INR should be maintained between 2.0 and 3.0 to reduce the risk of bleeding.
The duration of triple therapy is guided by the type of stent used. For bare metal stents, aspirin, clopidogrel or ticlopidine, and warfarin should be given for at least 1 month, after which clopidogrel or ticlopidine may be discontinued. If drug-eluting stents are used, the duration of clopidogrel or ticlopidine therapy should be extended to 1 year or more.4,22
Mechanical heart valves
In patients with mechanical heart valves, the combination of aspirin and warfarin has been shown to decrease the frequency of thromboembolism.23 Guidelines recommend adding aspirin (75 to 100 mg per day) to warfarin in all patients with mechanical valves, especially in patients who have had an embolus while on warfarin therapy or who have a history of cerebrovascular or peripheral vascular disease, a hypercoagulable state, or coronary artery disease.24
CONDITIONS IN WHICH WARFARIN ALONE MAY BE SUFFICIENT
At risk of coronary artery disease
Aspirin therapy is generally recommended as primary prevention for patients whose estimated risk of coronary events is 1.5% per year or higher.25 However, warfarin has also been shown to be effective in the primary prevention of coronary artery disease in men,26 and for patients already taking warfarin, the possible benefit of adding aspirin for primary prevention is outweighed by the increased risk of major bleeding.14 The Medical Research Council directly compared low-intensity warfarin therapy (mean INR 1.47), aspirin, and placebo in a two-by-two factorial study of primary prevention of ischemic heart disease in men.26 Warfarin was more effective than aspirin, and men who received warfarin plus aspirin or warfarin plus placebo had a rate of ischemic heart disease that was 21% lower than those who received aspirin plus placebo or double placebo, and their rate of all-cause mortality was 17% lower. Combining aspirin and warfarin for patients at risk of coronary disease led to a higher rate of major bleeding but no difference in cardiovascular events or all-cause mortality (odds ratio 0.98; 95% confidence interval 0.77–1.25).14
Stable coronary artery disease without mechanical heart valves or stents
Large randomized trials have found warfarin to be effective in secondary prevention of coronary artery disease.4–6 For most patients with stable coronary artery disease (ie, who have had no ischemic events or coronary interventions in the last 6 months) who need anticoagulation because of atrial fibrillation or venous thromboembolism, warfarin alone (target INR 2.0–3.0) should provide satisfactory antithrombotic prophylaxis against both cerebral and myocardial ischemic events.27 The addition of an antiplatelet agent is not required unless a patient has a coronary stent, a mechanical valve, or an excessive thrombotic risk.4,24,27
TAKE-HOME POINTS
For patients receiving warfarin therapy, whether to add or continue aspirin to their treatment is a common clinical question. The risk of bleeding is greater with combination therapy than with warfarin alone. The cardiovascular benefit varies depending on the clinical situation:
- In patients who have had an acute coronary syndrome or who have a coronary stent or mechanical valve, combination therapy is usually recommended because the benefits outweigh the risks.
- In patients with stable coronary artery disease or those without coronary artery disease who are at risk of coronary events, the risks outweigh the benefits. Combination therapy is usually not indicated in these patients.
- Weisman SM, Graham DY. Evaluation of the benefits and risks of low-dose aspirin in the secondary prevention of cardiovascular and cerebrovascular events. Arch Intern Med 2002; 162:2197–2202.
- Antithrombotic Trialists’ Collaboration. Collaborative meta-analysis of randomised trials of antiplatelet therapy for prevention of death, myocardial infarction, and stroke in high risk patients. BMJ 2002; 324:71–86.
- Hurlen M, Abdelnoor M, Smith P, Erikssen J, Arnesen H. Warfarin, aspirin, or both after myocardial infarction. N Engl J Med 2002; 347:969–974.
- Antman EM, Anbe DT, Armstrong PW, et al. ACC/AHA guidelines for the management of patients with ST-elevation myocardial infarction; a report of the American College of Cardiology/American Heart Association Task Force on Practice Guidelines (Committee to Revise the 1999 Guidelines for the Management of patients with acute myocardial infarction). J Am Coll Cardiol 2004; 44:E1–E211.
- Van Es RF, Jonker JJ, Verheugt FW, et al. Antithrombotics in the Secondary Prevention of Events in Coronary Thrombosis-2 (ASPECT-2) Research Group. Aspirin and coumadin after acute coronary syndromes (the ASPECT-2 study): a randomised controlled trial. Lancet 2002; 360:109–113.
- Anand SS, Yusuf S. Oral anticoagulant therapy in patients with coronary artery disease: a meta-analysis. JAMA 1999; 282:2058–2067.
- Schulman S, Granqvist S, Holmstrom M, et al. The duration of oral anticoagulant therapy after a second episode of venous thromboembolism. The Duration of Anticoagulation Trial Study Group. N Engl J Med 1997; 336:393–398.
- Kearon C, Gent M, Hirsh J, et al. A comparison of three months of anticoagulation with extended anticoagulation for a first episode of idiopathic venous thromboembolism. N Engl J Med 1999; 340:901–907.
- Agnelli G, Prandoni P, Santamaria MG, et al. Three months versus one year of oral anticoagulant therapy for idiopathic deep venous thrombosis. Warfarin Optimal Duration Italian Trial Investigators. N Engl J Med 2001; 345:165–169.
- Levine MN, Raskob G, Beyth RJ, Kearon C, Schulman S. Hemorrhagic complications of anticoagulant treatment: the Seventh ACCP Conference on Antithrombotic and Thrombolytic Therapy. Chest 2004; 126 suppl:287S–310S.
- Linkins LA, Choi PT, Douketis JD. Clinical impact of bleeding in patients taking oral anticoagulant therapy for venous thromboembolism: a meta-analysis. Ann Intern Med 2003; 139:893–900.
- McQuaid KR, Laine L. Systematic review and meta-analysis of adverse events of low-dose aspirin and clopidogrel in randomized controlled trials. Am J Med 2006; 119:624–638.
- Rothberg MB, Celestin C, Fiore LD, Lawler E, Cook JR. Warfarin plus aspirin after myocardial infarction or the acute coronary syndrome: meta-analysis with estimates of risk and benefit. Ann Intern Med 2005; 143:241–250.
- Dentali F, Douketis JD, Lim W, Crowther M. Combined aspirin-oral anticoagulant therapy compared with oral anticoagulant therapy alone among patients at risk for cardiovascular disease: a meta-analysis of randomized trials. Arch Intern Med 2007; 167:117–124.
- Hirsh J, Fuster V, Ansell J, Halperin JL. American Heart Association; American College of Cardiology Foundation. American Heart Association/American College of Cardiology Foundation guide to warfarin therapy. Circulation 2003; 107:1692–1711.
- Beyth RJ, Quinn LM, Landefeld CS. Prospective evaluation of an index for predicting the risk of major bleeding in outpatients treated with warfarin. Am J Med 1998; 105:91–99.
- Aspinall SL, DeSanzo BE, Trilli LE, Good CB. Bleeding Risk Index in an anticoagulation clinic. Assessment by indication and implications for care. J Gen Intern Med 2005; 20:1008–1013.
- Mehta SR, Yusuf S, Peters RJ, et al. Clopidogrel in Unstable angina to prevent Recurrent Events trial (CURE) Investigators. Effects of pretreatment with clopidogrel and aspirin followed by long-term therapy in patients undergoing percutaneous coronary intervention: the PCICURE study. Lancet 2001; 358:527–533.
- Bertrand ME, Legrand V, Boland J, et al. Randomized multicenter comparison of conventional anticoagulation versus antiplatelet therapy in unplanned and elective coronary stenting. The Full Anticoagulation versus Aspirin and Ticlopidine (FANTASTIC) study. Circulation 1998; 98:1597–1603.
- Kushner FG, Antman EM. Oral anticoagulation for atrial fibrillation after ST-elevation myocardial infarction: new evidence to guide clinical practice. Circulation 2005; 112:3212–3214.
- Porter A, Konstantino Y, Iakobishvili Z, Shachar L, Battler A, Hasdai D. Short-term triple therapy with aspirin, warfarin, and a thienopyridine among patients undergoing percutaneous coronary intervention. Catheter Cardiovasc Interv 2006; 68:56–61.
- Anderson JL, Adams CD, Antman EM, et al. ACC/AHA 2007 Guidelines for the management of patients with unstable angina/non-ST-elevation myocardial infarction—executive summary. A report of the ACC-AHA Task Force on Practice Guidelines (Writing Committee to Revise the 2002 Guidelines for the Management of Patients With Unstable Angina/Non-ST-Elevation Myocardial Infarction). J Am Coll Cardiol 2007; 50:652–726.
- Turpie AG, Gent M, Laupacis A, et al. A comparison of aspirin with placebo in patients treated with warfarin after heart-valve replacement. N Engl J Med 1993; 329:524–529.
- Bonow RO, Carabello BA, Kanu C, et al. ACC/AHA 2006 guidelines for the management of patients with valvular heart disease: a report of the ACC/AHA Task Force on Practice Guidelines (writing committee to revise the 1998 Guidelines for the Management of Patients With Valvular Heart Disease). Circulation 2006; 114:e84–e231.
- Lauer MS. Clinical practice. Aspirin for primary prevention of coronary events. N Engl J Med 2002; 346:1468–1474.
- The Medical Research Council’s General Practice Research Framework. Thrombosis prevention trial: randomised trial of low-intensity oral anticoagulation with warfarin and low-dose aspirin in the primary prevention of ischaemic heart disease in men at increased risk. Lancet 1998; 351:233–241.
- Fuster V, Ryden LE, Cannom DS, et al. ACC/AHA/ESC guidelines for the management of patients with atrial fibrillation. Circulation 2006; 114:260–335.
Staphylococcus aureus: The new adventures of a legendary pathogen
Staphylococcus aureus is rearing its ugly head in new and interesting ways, both in the hospital and in the community.
Rates of invasive infections with methicillin-resistant S aureus (MRSA) have been increasing both in the hospital and in the community, a trend that has attracted considerable interest in the lay media. Curiously, the most common community-associated MRSA strain, which up to now has been distinct from hospital-associated MRSA strains, is invading our hospitals. Alarmingly, vancomycin (Vancocin), the drug of last resort for MRSA infections for the past 40 years, does not seem to be as effective as it used to be.
This paper summarizes the changing epidemiology of S aureus, particularly the emergence of MRSA outside of the hospital; reviews the difficulties associated with S aureus bacteremia and its treatment in view of; some changes in vancomycin susceptibility; and appraises the old and new treatment options.
MRSA IS ON THE RISE IN THE HOSPITAL
S aureus, a gram-positive, coagulase-positive bacterium, is one of the leading nosocomial bloodstream pathogens, second only to coagulase-negative staphylococci.1 And the incidence of S aureus infections is increasing. MRSA in particular is increasingly causing infections throughout hospitals, including intensive care units. As of 2004, nearly two-thirds of isolates of S aureus from intensive care units were MRSA.2
MRSA infections are worse than methicillin-susceptible S aureus (MSSA) infections in terms of the rates of death and other undesirable outcomes.3 Several factors may be responsible: MRSA infection may be a marker of severity of illness (sicker patients may be more likely to have MRSA), our treatment for MRSA may not be as effective as it is for MSSA, and the organism may be inherently more virulent.
METHICILLIN RESISTANCE IS ALSO ON THE RISE IN THE COMMUNITY
Community-associated MRSA began emerging clinically about 10 years ago. It was first described in a cohort of children with necrotizing pneumonia in Minnesota, but soon other populations at risk began to emerge, such as residents of correctional facilities, men who had sex with men, competitive athletes (eg, fencers, wrestlers, and football players), and Alaskan natives and other native populations. A common factor in all these groups was close proximity of the members to each other. Later, it began to spread beyond these traditional risk groups into the community at large.
Community-associated MRSA strains have a characteristic pattern of antimicrobial susceptibility (see below). In the laboratory, they grow somewhat faster than health-care-associated MRSA strains, but not as fast as MSSA. They have a strong association with skin and soft-tissue infections: when you see a skin or soft-tissue infection, be it in an outpatient or an inpatient, think about MRSA. Their virulence varies, but rapid onset and progression of illness are quite common. Their most common strain in the United States at present is USA 300.
Case 1: A young woman with necrotizing fasciitis
A 21-year-old college student presented to our service in May 2004 with high fever and severe arm pain, which had been worsening for several days. She had been previously healthy, had not had any contact with the health care system, and had not received any antibiotics.

Her blood cultures were positive for MRSA, as were cultures of the deep tissue of the deltoid muscle and fascia when she underwent emergency surgical debridement. The infection required several additional surgical debridements and removal of one head of her deltoid muscle, but she was fortunate: in the past, some patients with this problem might have undergone radical amputation of the arm or even more extensive surgery. This patient continued to have positive blood cultures 4 days postoperatively, but she ultimately recovered, completing 28 days of daptomycin (Cubicin) therapy at a dose of 6 mg/kg every 24 hours. The last 10 days of daptomycin therapy were given at home via a percutaneous intravenous central catheter.
Comment. The epidemiology of MRSA infections is changing. More patients who have no traditional risk factors, specifically health care contact, are getting MRSA infections. A recent report from the US Centers for Disease Control and Prevention (CDC) indicates that the proportion of patients with invasive disease due to MRSA has doubled since 2001–2002.4 Part of the reason undoubtedly is that MRSA, particularly community-associated MRSA, often carries specific virulence factors that make it more invasive. The CDC estimated that in 2005 there were nearly 100,000 cases of invasive MRSA infection in the United States, and nearly a fifth of these infections resulted in death.
Resistance and virulence factors in community-associated MRSA
Most community-associated MRSA strains carry a mobile genetic element called type IV SCCmec (staphylococcal chromosomal cassettemec) that enhances its antimicrobial resistance. This genetic component was probably borrowed from coagulase-negative staphylococci, in which it is quite common but does not cause as much of a problem. It is now present in a wide range of S aureus strains. Most of the S aureus strains that carry type IV SCCmec are MRSA, but a few MSSA strains do carry it as well.
The potent toxin Panton-Valentine leukocidin is an extracellular product that is detected in fewer than 5% of hospital strains but is more common in community-associated strains. It kills leukocytes by forming pores in the cell membrane and causing skin necrosis in cutaneous infections. It is associated with skin abscesses and rapidly progressive necrotizing pneumonia in MSSA or MRSA.
Epidemiologic differences between community- and health-care-associated MRSA
Patients with community-associated MRSA infections tend to be younger than those who traditionally get health-care-associated MRSA infections: in a study from Naimi et al in 2003, the mean ages were 23 vs 68 years.5 A greater proportion of patients with community-associated MRSA strains are nonwhite.4,5
Most community-associated MRSA infections are of the skin and soft tissue (75% in the series from Naimi et al5), but this pathogen causes other infections as well. Bacteremia of unknown origin has been seen, as has necrotizing pneumonia. Most of the skin and soft-tissue infections are relatively superficial, such as folliculitis or furunculosis, but deeper tissue infections such as necrotizing fasciitis and pyomyositis have also been seen.6
The incidence of community-associated MRSA infections varies greatly by geographic region.7 The northeastern United States has so far been relatively spared, but in Atlanta, Houston, and Los Angeles up to 80% of cases of characteristic skin or soft-tissue infections seen in emergency or outpatient departments are due to community-associated MRSA. Physicians at the Texas Children’s Hospital in Houston assume that all skin or soft-tissue infections are due to community-associated MRSA unless proven otherwise.8
Differences in antibiotic susceptibility
Community-associated MRSA is more susceptible to various antibiotics than health-care-associated MRSA,5 but not by much. Strains are usually susceptible to vancomycin, tetracyclines, trimethoprim-sulfamethoxazole (Bactrim, Septra), and rifampin (Rifadin). Unlike hospital strains, a fair number of community-acquired strains are susceptible to clindamycin (Cleocin) in the laboratory, but with a caveat: some of these clindamycin-susceptible strains actually may harbor the tools for inducible resistance. In fact, they can become resistant to clindamycin even without being exposed to it.
The laboratory test for inducible clindamycin resistance is called the D test. After coating an agar plate with S aureus, the technician places erythromycin and clindamycin disks. If the erythromycin induces clindamycin resistance, the plate is clear of growth around the clindamycin disk except for the portion nearest the erythromycin disk, leaving a characteristic D-shaped area of lucency.
Risk factors for MRSA
Moran et al7 analyzed the risk factors for community-associated MRSA in patients with skin or soft-tissue infections seen in the emergency department. The infection was more likely to be due to community-associated MRSA if the patient was black, had used any antibiotic in the past month, had a history of MRSA infection, or had close contact with a person with a similar infection. Many patients interpreted the infections as spider bites because the lesions tended to have a dark center surrounded by a tender area. These infections were not associated with underlying illness. In some cases, community-associated MRSA skin infections have been associated with tattooing and even manicuring.
However, it is very difficult to distinguish between community-associated MRSA and MSSA skin and soft-tissue infections on the basis of clinical and epidemiologic characteristics. Miller et al9 studied a large group of patients in Los Angeles who were hospitalized with community-associated skin and soft-tissue S aureus infections. All the patients were followed up for 30 days after hospital discharge. Regardless of whether they had MRSA or MSSA, they had similar outcomes. Close contacts of the patients also tended to develop infection.
A key point from this and many other studies: patients were more likely to remain infected if they did not undergo incision and drainage. This key intervention is indicated for any patient who has a skin and soft-tissue infection with an undrained focus of infection.
COMMUNITY-ASSOCIATED MRSA IS INVADING THE HOSPITAL
In a new development, community-associated MRSA strains are now appearing in the hospital. This is not only because patients are bacteremic when they come in: patients in the hospital are getting nosocomial infections due to community-associated MRSA strains.
Seybold et al10 analyzed 116 cases of MRSA bloodstream infections in Atlanta, GA. In 9 (8%) of the cases the patient had not had any contact with the health care system within the past year, and these cases were classified as truly community-associated. Of the remaining 107 cases, 49 (42%) were nosocomial, and the USA 300 strain—the predominant community-associated MRSA strain—accounted for 10 (20%) of the nosocomial cases.
In the recent CDC study of invasive MRSA infections, Klevens et al4 reported that nearly a third of cases of bacteremia were due to community-associated MRSA, and these strains accounted for a greater proportion of cases of cellulitis and endocarditis than did health-care-associated strains.
In a study of hospital-associated MRSA, Maree et al11 found that the percentage of cases in which the bacteria carried the SCCmec type IV marker had increased from less than 20% in 1999 to more than 50% in 2004.
Comment. Suffice it to say that we are surrounded by MRSA. Community-associated MRSA is here to stay. It is even invading our hospitals, and we need to consider this very carefully when choosing antimicrobial therapy.
NAGGING QUESTIONS ABOUT VANCOMYCIN
Case 2: Vancomycin-intermediate S aureus (VISA) bacteremia and endocarditis
In December 2006 we saw a very ill 60-year-old woman who was hospitalized with MRSA bacteremia, pacemaker endocarditis, and superior vena cava thrombosis. Although she was treated with vancomycin and rifampin, her condition worsened, she had a stroke, and she developed renal failure. In a difficult operation, the pacemaker was removed, but the bacteremia persisted. In early February 2007 she underwent another difficult operation in which the superior vena cava clot was debrided, a right atrial clot was removed, and her mitral valve was replaced. Less than 2 weeks later, and despite ongoing vancomycin and rifampin therapy, the MRSA bacteremia recurred.
During the approximately 6 weeks that the patient had been receiving these antibiotics, the minimal inhibitory concentration (MIC) of rifampin against the S aureus isolate increased from less than 1 μg/mL (susceptible) to 2 μg/mL (resistant). The MIC of vancomycin went from 2 μg/mL (susceptible) to 4 μg/mL (intermediately susceptible). Vancomycin and rifampin were discontinued, and daptomycin and gentamicin (Garamycin) therapy were started. (Her daptomycin MIC was 0.5 μg/mL). The patient’s condition stabilized, and she was discharged to a long-term nursing facility. She had no relapse of MRSA bacteremia, but she died in early April of that year.
Is vancomycin becoming less effective? Degrees of vancomycin resistance
Vancomycin has been our stalwart for treating MRSA infections for more than 40 years but it is not working as well as it used to, at least in certain situations.

VRSA (vancomycin-resistant S aureus) is rare. These fully resistant strains probably acquired a resistance mechanism (the vanA operon) from vancomycin-resistant enterococci. Infections tend to occur in patients simultaneously infected with both S aureus and vancomycin-resistant enterococci, giving the bacteria an opportunity to exchange genetic material.
VISA (vancomycin-intermediate S aureus) infections tend to occur in patients like the one described above who have had long-term vancomycin therapy. VISA strains appear to overproduce a matrix that captures vancomycin and keeps it from entering the cell. On electron microscopy, these bacteria have a very thick cell wall.13
Vancomycin tolerance is a state in which the bacteria are “stunned” or kept in check but not killed by vancomycin. That is manifested in the laboratory by a ratio of minimum bactericidal concentration to MIC greater than 32.
hVISA (heteroresistant VISA) is new and worrisome. These organisms have an overall MIC in the susceptible range, but within that population are individual isolates with an MIC that is much higher—in the intermediate or perhaps even in the resistant range.14
Reported rates of hVISA vary from less than 2% to as high as 76%, because the methods for detecting it are still very poorly standardized. The usual automated laboratory tests do not detect hVISA.
hVISA is probably clinically relevant, as evidence is emerging both in vitro and in vivo that the higher the MIC for vancomycin, the worse the clinical outcome.15 hVISA has been associated with failures of therapy in several situations, usually in cases of severe invasive or deep infection, endocarditis, and bacteremia with vertebral osteomyelitis where vancomycin concentrations at the site of infection may be suboptimal.16–19 While most hVISA strains that have been described were resistant to methicillin, some were susceptible.
The E test is emerging as the standard test for hVISA. This test uses a plastic strip that contains gradually increasing concentrations of vancomycin along its length. Placed in the culture dish, the strip inhibits growth of the organism at its high-concentration end but not at its low-concentration end. If the sample contains hVISA, the cutoff is not well defined, with a few colonies growing at higher concentrations.
New definition of vancomycin susceptibility
Recognizing that the MICs for vancomycin have been rising in the last few years, the Clinical and Laboratory Standards Institute last year changed the break points between susceptibility and resistance. The new definitions are:
- Susceptible—an MIC of 2.0 μg/mL or less (formerly 4.0 μg/mL or less)
- Intermediate—4.0 to 8.0 μg/mL (formerly 8.0 to 16 μg/mL)
- Resistant—16 μg/mL or greater (formerly 32 μg/mL or greater).
One should pay attention to the MIC numbers on the laboratory reports, not just to the words “susceptible” or “not susceptible.” If the number is, say, 0.5 μg/mL or less, the organism should really be susceptible. If the number is 1 or 2, it is still in the susceptible range, but those are the organisms that may cause problems later on.
Further, even if the vancomycin MIC is in the susceptible range, higher MICs may affect outcomes. The average duration of MRSA bacteremia on therapy is 8 to 9 days, vs 3 to 4 days with MSSA bacteremia.20,21 But Sakoulas et al15 found that, in MRSA bacteremia, the success rate with vancomycin therapy was 56% if the MIC was 0.5 or lower, compared with 10% if the MIC was 1.0 to 2.0 μg/mL. Examined in another way, the success rate was 50% if the logarithm of killing was 6.27 colony-forming units per mL or greater, 23% if 4.71 to 6.26, and zero if less than 4.71.
Case 3: Prolonged MRSA bacteremia
In the summer of 2006, a 66-year-old woman with a history of gastric bypass and cirrhosis underwent a long stay in the surgical intensive care unit because of a recurrent enterocutaneous fistula and chronic renal insufficiency. On November 5th, she had a positive blood culture for MRSA, which was treated appropriately with vancomycin for 4 weeks. She was discharged to subacute care but came back 2 days later, again with MRSA bacteremia. At that time her Hickman catheter, which had been inserted for total parenteral nutrition because of the enterocutaneous fistula, was removed.
Transthoracic echocardiography revealed no vegetations, but her bacteremia persisted. Her mental status was poor this entire time: she was mute and could barely be awakened. We looked for clots and infected clots; duplex ultrasonographic examinations of all four extremities were negative. Finally, magnetic resonance imaging of her back—performed empirically because of the persistent bacteremia—revealed vertebral osteomyelitis at level T12-L1. We also noticed on serial evaluations that the vancomycin MIC for her organism increased from 0.5 to 2.0 μg/mL, so therapy was changed from vancomycin to daptomycin.
Her bacteremia cleared. Follow-up echocardiography was negative, but she had two subsequent relapses of MRSA bacteremia, one in April 2007 and one before she died in the summer of 2007.
Prolonged bacteremia: Is it vancomycin resistance, or something else?
The MRSA isolates that cause prolonged bacteremia seem to have certain characteristics.22 Higher MICs are probably associated with longer periods of bacteremia. But some genetic components within some strains of S aureus give them a survival advantage. They have less susceptibility to the body’s thrombin-induced platelet microbicidal protein. These isolates are not only associated with prolonged bacteremia: they are also associated with osteomyelitis, deep abscesses, endocarditis, recurrent infection, and increased death rate.22 Clinical laboratories do not test for these genetic components. One wonders whether our patient may have had an isolate with these mutations that gave it a survival advantage.
Do not use vancomycin for MSSA
Avoid using vancomycin for MSSA infections. It has been shown time and time again that MSSA infections do not respond as well to vancomycin as they do to beta-lactam antibiotics, specifically to the semisynthetic penicillins such as oxacillin and nafcillin, and even some of the first-generation cephalosporins. Chang et al23 found that patients with MSSA bacteremia had higher rates of persistent infections, relapse, and bacteriologic failure if they received vancomycin than if they received nafcillin.
Do vancomycin trough levels affect toxicity?
The vancomycin trough levels that we aimed for in the past (5 to 10 μg/mL) were probably too low. Today, we aim for trough levels of 15 to 20 μg/mL, and many physicians are aiming for 20 to 25 μg/mL. Part of the reason is that vancomycin MICs are higher than they used to be: in order to keep the vancomycin level above the MIC for a longer period of time, the vancomycin trough level needs to be higher. In theory, keeping the vancomycin levels above the MIC for longer periods should improve outcomes. Yet Fowler et al22 found that vancomycin trough levels among patients who had persistent MRSA bacteremia were actually higher than trough levels among those in whom the bacteremia resolved, although the difference was not statistically significant.
We measure the vancomycin trough level to make sure it is high enough (and give larger doses if it is not); among adults, peak levels need not be monitored on a routine basis because of the predictable pharmacokinetics of vancomycin.
Vancomycin toxicity can be either idiosyncratic or synergistic. Idiosyncratic toxicity occurs when a patient who has been on vancomycin for a long time develops a fixed rash, not associated with infusion. This is an immunologic phenomenon. It is a rare and very serious situation and may require steroid therapy.
Synergistic toxicity occurs when vancomycin is given with other nephrotoxic agents, notably gentamicin. Vancomycin plus gentamicin equals nephrotoxicity. Vancomycin alone is usually not nephrotoxic, but close monitoring of renal function parameters is warranted with the use of higher doses.24
IN UNEXPLAINED BACTEREMIA, LOOK FOR ENDOCARDITIS
In blood cultures from patients with bacteremia, S aureus is never a contaminant. Even if just one blood culture is positive for S aureus, believe that S aureus is the culprit.
Reports in the 1950s suggested that at least half of patients who had S aureus bacteremia had endocarditis,25 leading to recommendations that all patients with S aureus bacteremia without an obvious primary source of infection should be evaluated for endocarditis. Subsequent estimates were lower, in the range of 15% to 25%.26,27 However, throughout the world S aureus endocarditis continues to have a very high mortality rate: at least a third of patients die.28
Clinical criteria (community acquisition, no primary focus, and metastatic sequelae) were developed to try to predict the risk of endocarditis in bacteremic patients.26 However, these criteria did not work very well. The clinical definition of endocarditis has evolved. The criteria of von Reyn et al29 from 1981 did not use echocardiography as part of the definition, but the 1994 Duke criteria,30 which were refined31 in 2000, use both clinical and echocardiographic parameters.
Stratton et al32 performed transthoracic echocardiography in 14 patients with bacteremia and found 1 patient with cryptic tricuspid infective endocarditis. Bayer et al33 subsequently reported that of 72 patients with bacteremia, 6 (18%) of those who had no clinical findings suggestive of infectious endocarditis had findings on echocardiography that led to changes in their regimen. Adding echocardiography to three clinical risk factors increased the sensitivity of diagnosing endocarditis from 70% to 85% with a specificity of 100% and predictive value of 96%.
The Duke criteria call for transesophageal echocardiography, which is not feasible in some patients, eg, those with cirrhosis and esophageal varices.
S aureus endocarditis has changed over the years as our patient population has changed, and MRSA endocarditis tends to hit some of our most vulnerable patients. In a study by Miro et al34 in 2005, MRSA was the leading pathogen in patients who were diagnosed with S aureus endocarditis in 1990 or later. We will only see these numbers go up. Patients with diabetes tend to have more MRSA, and of diabetic patients with MRSA endocarditis, 30% to 40% die in the hospital.
Indications for surgery
Certain conditions are indications for surgery among patients with endocarditis, and no antibiotic will cure the endocarditis if the patient has one of these conditions, eg:
- Persistent bacteremia during antibiotic therapy
- Recurrent emboli
- Heart failure that cannot be controlled
- Perivalvular or myocardial abscesses
- Large vegetations
- Early prosthetic valve infection
- Certain arrhythmias.
How long should S aureus bacteremia be treated?
In cases of bacteremia in which endocarditis has been ruled out and removable foci of infection (eg, intravascular catheters) have been removed, some evidence indicates that treatment for 2 weeks would be as effective as the 4 to 6 weeks that we would use for endocarditis or other severe or invasive infections.35 The issue is controversial. If the patient has had frequent hospitalizations or a chronic medical condition I would hesitate to treat for less than 4 weeks, even if the infection appears to be associated with a removable focus.
Treatment of endocarditis
In the guidelines for treatment of endocarditis from the American Heart Association and Infectious Diseases Society of America,36 all the recommendations are relatively old and many of them are somewhat empiric—they are not based on evidence from randomized clinical trials. Rather, they are best opinions based on clinical experience and some observational studies over the years.
For MSSA. In cases of native-valve endocarditis, oxacillin (Bactocill), nafcillin (Unipen), or another semisynthetic beta-lactam antibiotic is recommended. For penicillin-allergic patients, we have other options, such as cefazolin (Ancef, Kefzol).
Combination therapy is frequently recommended for native valve endocarditis as well as for prosthetic valve endocarditis, with either rifampin or gentamicin along with a primary agent. There is some evidence that one can clear staphylococcal bacteremia a day or two more quickly by use of combination therapy with nafcillin plus an aminoglycoside than with nafcillin alone.37,38 For MSSA-associated endocarditis, vancomycin does not work as well as beta-lactam antibiotics.39,40
Korzeniowski and Sande37 and Chambers et al38 reported that the mean duration of bacteremia was 3.4 days for patients treated with nafcillin alone and 2.9 days for those treated with nafcillin plus an aminoglycoside. These studies led to consideration of a short course of gentamicin to clear the bacteremia quickly.
With MRSA, bacteremia often requires a week or more to clear. Levine et al21 reported a study in 42 patients, mostly injection-drug users, with right-sided native-valve endocarditis. The median duration of bacteremia was 7 days in patients who received vancomycin alone vs 9 days in those who received vancomycin plus rifampin; however, some patients were bacteremic for up to 27 days. Fever persisted for a median of 7 days, probably partly due to septic pulmonary emboli. Three patients died, and three required valve replacement.
NEW ANTIBIOTICS
Several new antibiotics are active against gram-positive cocci.41–44 However, the majority of them have not been prospectively studied for treating bacteremia or endocarditis.
Quinupristin/dalfopristin (Synercid) has not been formally studied for treatment of MRSA bacteremia or endocarditis. There are a few case reports of its use in these conditions.45 Quinupristin/dalfopristin is bacteriostatic, and its use may be associated with phlebitis, myalgias, and arthralgias.46
Linezolid (Zyvox) is approved for treatment of complicated skin and soft-tissue infections and for hospital-acquired pneumonia. There have been no specific studies of linezolid in the treatment of S aureus bacteremia or endocarditis. However, Shorr et al47 retrospectively looked at the bacteremic patients in five previous studies of linezolid vs vancomycin and found 144 cases of S aureus bacteremia, half of which were due to MRSA. Of 53 assessable patients with MRSA bacteremia, the primary infection was cured in 14 (56%) of the linezolid patients and 13 (46%) of the vancomycin patients.
The oral form is 100% bioavailable. One should avoid concomitant use of serotonin-reuptake inhibitors because of the risk of serotonin syndrome. Adverse effects include altered taste sensation and peripheral neuropathy. There are other potential toxicities, including hematologic changes (thrombocytopenia, leukopenia) and metabolic effects (lactic acidosis), so clinical and laboratory monitoring is important.48 The role of linezolid in the treatment of patients with S aureus bacteremia or endocarditis remains to be defined.
Daptomycin is indicated for complicated skin and soft-tissue infections, bacteremia, and right-sided endocarditis due to S aureus. Fowler et al20 found that daptomycin was not inferior to beta-lactam antibiotics for treatment of MSSA bacteremia and right-sided endocarditis, and for MRSA infections it outperformed vancomycin, but the difference was not statistically significant.
The dosing interval should be increased from once every 24 hours to every 48 hours if the creatinine clearance is 30 mL/minute or less. Adverse effects include myalgia, rhabdomyolysis (rare), and elevations in creatine phosphokinase. Reports of rising MICs during daptomycin therapy, in some cases associated with persistent infection,49 suggest that careful attention be paid to dosing and clinical monitoring.
Tigecycline (Tygacil) is indicated for complicated skin and soft-tissue infections and complicated intra-abdominal infections due to susceptible organisms. It is active against both MSSA and MRSA, but clinical experience with its use in invasive infections is somewhat limited.50 The dose of tigecycline should be reduced in advanced cirrhosis. Adverse effects include nausea and vomiting.
Telavancin, dalbavancin, and oritavancin, investigational parenteral antibiotics that are derivatives of vancomycin, are in clinical trials. The pharmacokinetic activity of these agents is of interest: telavancin is being studied with a once-daily dosing interval and dalbavancin’s half-life allows once-weekly dosing. In a limited trial, dalbavancin was found to be safe and effective in the treatment of catheter-related bloodstream infections.51 None of the antibiotics in this group has been studied for treatment of S aureus endocarditis. Telavancin therapy has been associated with rash, hypokalemia, QT prolongation, and creatinine elevations. Gastrointestinal symptoms have been reported with the use of dalbavancin.
Ceftobiprole, another investigational agent, is the only cephalosporin antibiotic that is active against MRSA. It is given every 12 hours. Adverse effects include nausea and taste disturbance.
Iclaprim is a novel diaminopyrimidine and a dihydrofolate reductase inhibitor. In vitro, it is active against gram-positive bacteria, including MRSA, VISA, and VRSA; clinical investigations at this point are limited to the treatment of skin and soft-tissue infections.
- Wisplinghoff H, Bischoff T, Tallent SM, Seifert H, Wenzel RP, Edmond MB. Nosocomial bloodstream infections in US hospitals: analysis of 24,179 cases from a prospective nationwide surveillance study. Clin Infect Dis 2004; 39:309–371. Erratum in: Clin Infect Dis 2004; 39:1093.
- US Centers for Disease Control and Prevention. National Nosocomial Infections Surveillance (NNIS) System. Campaign to prevent antimicrobial resistance. www.cdc.gov/drugresistance/healthcare/ha/HASlideSet.ppt.
- Blot SI, Vandewoude KH, Hoste EA, Colardyn FA. Outcome and attributable mortality in critically ill patients with bacteremia involving methicillin-susceptible and methicillin-resistant Staphylococcus aureus. Arch Intern Med 2002; 162:2229–2235.
- Klevens RM, Morrison MA, Nadle J, et al; Active Bacterial Core surveillance (ABCs) MRSA Investigators. Invasive methicillin-resistant Staphylococcus aureus infections in the United States. JAMA 2007; 298:1763–1771.
- Naimi TS, LeDell KH, Como-Sabetti K, et al. Comparison of community- and health care-associated methicillin-resistant Staphylococcus aureus infection. JAMA 2003; 290:2976–2984.
- Miller LG, Perdreau-Remington F, Rieg G, et al. Necrotizing fasciitis caused by community-associated methicillin-resistant Staphylococcus aureus in Los Angeles. N Engl J Med 2005; 352:1445–1453.
- Moran GJ, Krishnadasan A, Gorwitz RJ, et al EMERGEncy ID Net Study Group. Methicillin-resistant S. aureus infections among patients in the emergency department. N Engl J Med 2006; 355:666–674.
- Mishaan AM, Mason EO, Martinez-Aquilar G, et al. Emergence of a predominant clone of community-acquired Staphylococcus aureus among children in Houston, Texas. Pediatr Infect Dis J 2005; 24:201–206.
- Miller LG, Perdreau-Remington F, Bayer AS, et al. Clinical and epidemiologic characteristics cannot distinguish community-associated methicillin-resistant Staphylococcus aureus infection from methicillin-susceptible S. aureus infection: a prospective investigation. Clin Infect Dis 2007; 44:471–482.
- Seybold U, Kourbatova EV, Johnson JG, et al. Emergence of community-associated methicillin-resistant Staphylococcus aureus USA300 genotype as a major cause of health care-associated blood stream infections. Clin Infect Dis 2006; 42:647–656.
- Maree CL, Daum RS, Boyle-Vavra S, Matayoshi K, Miller LG. Community-associated methicillin-resistant Staphylococcus aureus isolates causing healthcare-associated infections. Emerg Infect Dis 2007; 13:236–242.
- Liu C, Chambers HF. Staphylococcus aureus with heterogeneous resistance to vancomycin: epidemiology, clinical significance, and critical assessment of diagnostic methods. Antimicrob Agents Chemother 2003; 47:3040–3045.
- Sieradzki K, Roberts RB, Haber SW, Tomasz A. The development of vancomycin resistance in a patient with methicillin-resistant Staphylococcus aureus infection. N Engl J Med 1999; 340:517–523.
- Schwaber MJ, Wright SB, Carmeli Y, et al. Clinical implications of varying degrees of vancomycin susceptibility in methicillin-resistant Staphylococcus aureus bacteremia. Emerg Infect Dis 2003; 9:657–664. Erratum in: Emerg Infect Dis 2004; 10:160.
- Sakoulas G, Moise-Broder PA, Schentag J, Forrest A, Moellering RC, Eliopoulos GM. Relationship of MIC and bactericidal activity to efficacy of vancomycin for treatment of methicillin-resistant Staphylococcus aureus bacteremia. J Clin Microbiol 2004; 42:2398–2402.
- Naimi TS, Anderson D, O’Boyle C, et al. Vancomycin-intermediate Staphylococcus aureus with phenotypic susceptibility to methicillin in a patient with recurrent bacteremia. Clin Infect Dis 2003; 36:1609–1612.
- Moore MR, Perdreau-Remington F, Chambers HF. Vancomycin treatment failure associated with heterogeneous vancomycin-intermediate Staphylococcus aureus in a patient with endocarditis and in the rabbit model of endocarditis. Antimicrob Agents Chemother 2003; 47:1262–1266.
- Charles PG, Ward PB, Johnson PD, Howden BP, Grayson ML. Clinical features associated with bacteremia due to heterogenous vancomycin-intermediate Staphylococcus aureus. Clin Infect Dis 2004; 38:448–451.
- Howden BP, Ward PB, Charles PG, et al. Treatment outcomes for serious infections caused by methicillin-resistant Staphylococcus aureus with reduced vancomycin susceptibility. Clin Infect Dis 2004; 38:521–528.
- Fowler VG, Boucher HW, Corey GR, et al. S. aureus Endocarditis and Bacteremia Study Group. Daptomycin versus standard therapy for bacteremia and endocarditis caused by Staphylococcus aureus. N Engl J Med 2006; 355:653–665.
- Levine DP, Fromm BS, Reddy BR. Slow response to vancomycin or vancomycin plus rifampin in methicillin-resistant Staphylococcus aureus endocarditis. Ann Intern Med 1991; 115:674–680.
- Fowler VG, Sakoulas G, McIntyre LM, et al. Persistent bacteremia due to methicillin-resistant Staphylococcus aureus infection is associated with agr dysfunction and low-level in vitro resistance to thrombin-induced platelet microbicidal protein. J Infect Dis 2004; 190:1140–1149.
- Chang FY, Peacock JE, Musher DM, et al. Staphylococcus aureus bacteremia: recurrence and the impact of antibiotic treatment in a prospective multicenter study. Medicine (Baltimore) 2003; 82:333–339.
- Hidayat LK, Hsu DI, Quist R, Shriner KA, Wong-Beringer A. High-dose vancomycin therapy for methicillin-resistant Staphylococcus aureus infections: efficacy and toxicity. Arch Intern Med 2006; 166:2138–2144.
- Wilson R, Hamburger M. Fifteen years’ experience with staphylococcus septicemia in a large city hospital; analysis of fifty-five cases in the Cincinnati General Hospital 1940 to 1954. Am J Med 1957; 22:437–457.
- Nolan CM, Beaty HN. Staphylococcus aureus bacteremia. Current clinical patterns. Am J Med 1976; 60:495–500.
- Shah M, Watanakunakorn C. Changing patterns of Staphylococcus aureus bacteremia. Am J Med Sci 1979; 278:115–121.
- Fowler VG, Miro JM, Hoen B, et al ICE Investigators. Staphylococcus aureus endocarditis: a consequence of medical progress. JAMA 2005; 293:3012–3021. Erratum in: JAMA 2005; 294:900.
- Von Reyn CF, Levy BS, Arbeit RD, Friedland G, Crumpacker CS. Infective endocarditis: an analysis based on strict case definition. Ann Intern Med 1981; 94:505–518.
- Durack DT, Lukes AS, Bright DK. New criteria for diagnosis of infective endocarditis: utilization of specific echocardiographic findings. Duke Endocarditis Service. Am J Med 1994; 96:200–209.
- Li JS, Sexton DJ, Mick N, et al. Proposed modifications to the Duke criteria for the diagnosis of infective endocarditis. Clin Infect Dis 2000; 30:633–638.
- Stratton JR, Werner JA, Pearlman AS, Janko CL, Kliman S, Jackson MC. Bacteremia and the heart. Serial echocardiographic findings in 80 patients with documented or suspected bacteremia. Am J Med 1982; 73:851–858.
- Bayer AS, Lam K, Ginzton L, Normal DC, Chiu CY, Ward JI. Staphylococcus aureus bacteremia. Clinical, serologic, and echocardiographic findings in patients with and without endocarditis. Arch Intern Med 1987; 147:457–462.
- Miro JM, Anguera I, Cabell CH, et al International Collaboration on Endocarditis Merged Database Study Group. Staphylococcus aureus native valve infective endocarditis: report of 566 episodes from the International Collaboration on Endocarditis Merged Database. Clin Infect Dis 2005; 41:507–514. Erratum in: Clin Infect Dis 2005; 41:1075–1077.
- Jernigan JA, Farr BM. Short-course therapy of catheter-related Staphylococcus aureus bacteremia: a meta-analysis. Ann Intern Med 1993; 119:304–311.
- Baddour LM, Wilson WR, Bayer AS, et al. Infective endocarditis: diagnosis, antimicrobial therapy, and management of complications: a statement for healthcare professionals from the Committee on Rheumatic Fever, Endocarditis, and Kawasaki Disease, Council on Cardiovascular Disease in the Young, and the Councils on Clinical Cardiology, Stroke, and Cardiovascular Surgery and Anesthesia, American Heart Association: endorsed by the Infectious Diseases Society of America. Circulation 2005; 111:e394–e434. Erratum in: Circulation 2005; 112:2373. Circulation 2007; 115:e408.
- Korzeniowski O, Sande MA. Combination antimicrobial therapy for Staphylococcus aureus endocarditis in patients addicted to parenteral drugs and in nonaddicts: a prospective study. Ann Intern Med 1982; 97:496–503.
- Chambers HF, Korzeniowski OM, Sande MA. Staphylococcus aureus endocarditis: clinical manifestations in addicts and nonaddicts. Medicine (Baltimore) 1983; 62:170–177.
- Gentry CA, Rodvold KA, Novak RM, Hershow RC, Naderer OJ. Retrospective evaluation of therapies for Staphylococcus aureus endocarditis. Pharmacotherapy 1997; 17:990–997.
- Small PM, Chambers HF. Vancomycin for Staphylococcus aureus endocarditis in intravenous drug users. Antimicrob Agents Chemother 1990; 34:1227–1231.
- Eliopoulos GM. Quinupristin-dalfopristin and linezolid: evidence and opinion. Clin Infect Dis 2003; 36:473–481.
- Rybak MJ. Therapeutic options for Gram-positive infections. J Hosp Infect 2001; 49 suppl A:S25–S32.
- Micek ST. Alternatives to vancomycin for the treatment of methicillin-resistant Staphylococcus aureus infections. Clin Infect Dis 2007; 45 suppl 3:S184–S190.
- Appelbaum PC, Jacobs MR. Recently approved and investigational antibiotics for treatment of severe infections caused by Gram-positive bacteria. Curr Opin Microbiol 2005; 8:510–517.
- Drew RH, Perfect JR, Srinath L, Kirkimilis E, Dowzicky M, Talbot GH for the Synercid Emergency-Use Study Group. Treatment of methicillin-resistant Staphylococcus aureus infections with quinupristin-dalfopristin in patients intolerant of or failing prior therapy. J Antimicrob Chemother 2000; 46:775–784.
- Lamb HM, Figgitt DP, Faulds D. Quinupristin/dalfopristin: a review of its use in the management of serious gram-positive infections. Drugs 1999; 58:1061–1097.
- Shorr AF, Kunkel MJ, Kollef M. Linezolid versus vancomycin for Staphylococcus aureus bacteraemia: pooled analysis of randomized studies. J Antimicrob Chemother 2005; 56:923–929.
- Bishop E, Melvani S, Howden BP, Charles PG, Grayson ML. Good clinical outcomes but high rates of adverse reactions during linezolid therapy for serious infections: a proposed protocol for monitoring therapy in complex patients. Antimicrob Agents Chemother 2006; 50:1599–1602.
- Boucher HW, Sakoulas G. Perspectives on daptomycin resistance, with emphasis on resistance in Staphylococcus aureus. Clin Infect Dis 2007; 45:601–608.
- Munoz-Price LS, Lolans K, Quinn JP. Four cases of invasive methicillin-resistant Staphylococcus aureus (MRSA) infections treated with tigecycline. Scand J Infect Dis 2006; 38:1081–1084.
- Raad I, Darouiche R, Vazquez J, et al. Efficacy and safety of weekly dalbavancin therapy for catheter-related bloodstream infection caused by gram-positive pathogens. Clin Infect Dis 2005; 40:374–80.
Staphylococcus aureus is rearing its ugly head in new and interesting ways, both in the hospital and in the community.
Rates of invasive infections with methicillin-resistant S aureus (MRSA) have been increasing both in the hospital and in the community, a trend that has attracted considerable interest in the lay media. Curiously, the most common community-associated MRSA strain, which up to now has been distinct from hospital-associated MRSA strains, is invading our hospitals. Alarmingly, vancomycin (Vancocin), the drug of last resort for MRSA infections for the past 40 years, does not seem to be as effective as it used to be.
This paper summarizes the changing epidemiology of S aureus, particularly the emergence of MRSA outside of the hospital; reviews the difficulties associated with S aureus bacteremia and its treatment in view of; some changes in vancomycin susceptibility; and appraises the old and new treatment options.
MRSA IS ON THE RISE IN THE HOSPITAL
S aureus, a gram-positive, coagulase-positive bacterium, is one of the leading nosocomial bloodstream pathogens, second only to coagulase-negative staphylococci.1 And the incidence of S aureus infections is increasing. MRSA in particular is increasingly causing infections throughout hospitals, including intensive care units. As of 2004, nearly two-thirds of isolates of S aureus from intensive care units were MRSA.2
MRSA infections are worse than methicillin-susceptible S aureus (MSSA) infections in terms of the rates of death and other undesirable outcomes.3 Several factors may be responsible: MRSA infection may be a marker of severity of illness (sicker patients may be more likely to have MRSA), our treatment for MRSA may not be as effective as it is for MSSA, and the organism may be inherently more virulent.
METHICILLIN RESISTANCE IS ALSO ON THE RISE IN THE COMMUNITY
Community-associated MRSA began emerging clinically about 10 years ago. It was first described in a cohort of children with necrotizing pneumonia in Minnesota, but soon other populations at risk began to emerge, such as residents of correctional facilities, men who had sex with men, competitive athletes (eg, fencers, wrestlers, and football players), and Alaskan natives and other native populations. A common factor in all these groups was close proximity of the members to each other. Later, it began to spread beyond these traditional risk groups into the community at large.
Community-associated MRSA strains have a characteristic pattern of antimicrobial susceptibility (see below). In the laboratory, they grow somewhat faster than health-care-associated MRSA strains, but not as fast as MSSA. They have a strong association with skin and soft-tissue infections: when you see a skin or soft-tissue infection, be it in an outpatient or an inpatient, think about MRSA. Their virulence varies, but rapid onset and progression of illness are quite common. Their most common strain in the United States at present is USA 300.
Case 1: A young woman with necrotizing fasciitis
A 21-year-old college student presented to our service in May 2004 with high fever and severe arm pain, which had been worsening for several days. She had been previously healthy, had not had any contact with the health care system, and had not received any antibiotics.
Her blood cultures were positive for MRSA, as were cultures of the deep tissue of the deltoid muscle and fascia when she underwent emergency surgical debridement. The infection required several additional surgical debridements and removal of one head of her deltoid muscle, but she was fortunate: in the past, some patients with this problem might have undergone radical amputation of the arm or even more extensive surgery. This patient continued to have positive blood cultures 4 days postoperatively, but she ultimately recovered, completing 28 days of daptomycin (Cubicin) therapy at a dose of 6 mg/kg every 24 hours. The last 10 days of daptomycin therapy were given at home via a percutaneous intravenous central catheter.
Comment. The epidemiology of MRSA infections is changing. More patients who have no traditional risk factors, specifically health care contact, are getting MRSA infections. A recent report from the US Centers for Disease Control and Prevention (CDC) indicates that the proportion of patients with invasive disease due to MRSA has doubled since 2001–2002.4 Part of the reason undoubtedly is that MRSA, particularly community-associated MRSA, often carries specific virulence factors that make it more invasive. The CDC estimated that in 2005 there were nearly 100,000 cases of invasive MRSA infection in the United States, and nearly a fifth of these infections resulted in death.
Resistance and virulence factors in community-associated MRSA
Most community-associated MRSA strains carry a mobile genetic element called type IV SCCmec (staphylococcal chromosomal cassettemec) that enhances its antimicrobial resistance. This genetic component was probably borrowed from coagulase-negative staphylococci, in which it is quite common but does not cause as much of a problem. It is now present in a wide range of S aureus strains. Most of the S aureus strains that carry type IV SCCmec are MRSA, but a few MSSA strains do carry it as well.
The potent toxin Panton-Valentine leukocidin is an extracellular product that is detected in fewer than 5% of hospital strains but is more common in community-associated strains. It kills leukocytes by forming pores in the cell membrane and causing skin necrosis in cutaneous infections. It is associated with skin abscesses and rapidly progressive necrotizing pneumonia in MSSA or MRSA.
Epidemiologic differences between community- and health-care-associated MRSA
Patients with community-associated MRSA infections tend to be younger than those who traditionally get health-care-associated MRSA infections: in a study from Naimi et al in 2003, the mean ages were 23 vs 68 years.5 A greater proportion of patients with community-associated MRSA strains are nonwhite.4,5
Most community-associated MRSA infections are of the skin and soft tissue (75% in the series from Naimi et al5), but this pathogen causes other infections as well. Bacteremia of unknown origin has been seen, as has necrotizing pneumonia. Most of the skin and soft-tissue infections are relatively superficial, such as folliculitis or furunculosis, but deeper tissue infections such as necrotizing fasciitis and pyomyositis have also been seen.6
The incidence of community-associated MRSA infections varies greatly by geographic region.7 The northeastern United States has so far been relatively spared, but in Atlanta, Houston, and Los Angeles up to 80% of cases of characteristic skin or soft-tissue infections seen in emergency or outpatient departments are due to community-associated MRSA. Physicians at the Texas Children’s Hospital in Houston assume that all skin or soft-tissue infections are due to community-associated MRSA unless proven otherwise.8
Differences in antibiotic susceptibility
Community-associated MRSA is more susceptible to various antibiotics than health-care-associated MRSA,5 but not by much. Strains are usually susceptible to vancomycin, tetracyclines, trimethoprim-sulfamethoxazole (Bactrim, Septra), and rifampin (Rifadin). Unlike hospital strains, a fair number of community-acquired strains are susceptible to clindamycin (Cleocin) in the laboratory, but with a caveat: some of these clindamycin-susceptible strains actually may harbor the tools for inducible resistance. In fact, they can become resistant to clindamycin even without being exposed to it.
The laboratory test for inducible clindamycin resistance is called the D test. After coating an agar plate with S aureus, the technician places erythromycin and clindamycin disks. If the erythromycin induces clindamycin resistance, the plate is clear of growth around the clindamycin disk except for the portion nearest the erythromycin disk, leaving a characteristic D-shaped area of lucency.
Risk factors for MRSA
Moran et al7 analyzed the risk factors for community-associated MRSA in patients with skin or soft-tissue infections seen in the emergency department. The infection was more likely to be due to community-associated MRSA if the patient was black, had used any antibiotic in the past month, had a history of MRSA infection, or had close contact with a person with a similar infection. Many patients interpreted the infections as spider bites because the lesions tended to have a dark center surrounded by a tender area. These infections were not associated with underlying illness. In some cases, community-associated MRSA skin infections have been associated with tattooing and even manicuring.
However, it is very difficult to distinguish between community-associated MRSA and MSSA skin and soft-tissue infections on the basis of clinical and epidemiologic characteristics. Miller et al9 studied a large group of patients in Los Angeles who were hospitalized with community-associated skin and soft-tissue S aureus infections. All the patients were followed up for 30 days after hospital discharge. Regardless of whether they had MRSA or MSSA, they had similar outcomes. Close contacts of the patients also tended to develop infection.
A key point from this and many other studies: patients were more likely to remain infected if they did not undergo incision and drainage. This key intervention is indicated for any patient who has a skin and soft-tissue infection with an undrained focus of infection.
COMMUNITY-ASSOCIATED MRSA IS INVADING THE HOSPITAL
In a new development, community-associated MRSA strains are now appearing in the hospital. This is not only because patients are bacteremic when they come in: patients in the hospital are getting nosocomial infections due to community-associated MRSA strains.
Seybold et al10 analyzed 116 cases of MRSA bloodstream infections in Atlanta, GA. In 9 (8%) of the cases the patient had not had any contact with the health care system within the past year, and these cases were classified as truly community-associated. Of the remaining 107 cases, 49 (42%) were nosocomial, and the USA 300 strain—the predominant community-associated MRSA strain—accounted for 10 (20%) of the nosocomial cases.
In the recent CDC study of invasive MRSA infections, Klevens et al4 reported that nearly a third of cases of bacteremia were due to community-associated MRSA, and these strains accounted for a greater proportion of cases of cellulitis and endocarditis than did health-care-associated strains.
In a study of hospital-associated MRSA, Maree et al11 found that the percentage of cases in which the bacteria carried the SCCmec type IV marker had increased from less than 20% in 1999 to more than 50% in 2004.
Comment. Suffice it to say that we are surrounded by MRSA. Community-associated MRSA is here to stay. It is even invading our hospitals, and we need to consider this very carefully when choosing antimicrobial therapy.
NAGGING QUESTIONS ABOUT VANCOMYCIN
Case 2: Vancomycin-intermediate S aureus (VISA) bacteremia and endocarditis
In December 2006 we saw a very ill 60-year-old woman who was hospitalized with MRSA bacteremia, pacemaker endocarditis, and superior vena cava thrombosis. Although she was treated with vancomycin and rifampin, her condition worsened, she had a stroke, and she developed renal failure. In a difficult operation, the pacemaker was removed, but the bacteremia persisted. In early February 2007 she underwent another difficult operation in which the superior vena cava clot was debrided, a right atrial clot was removed, and her mitral valve was replaced. Less than 2 weeks later, and despite ongoing vancomycin and rifampin therapy, the MRSA bacteremia recurred.
During the approximately 6 weeks that the patient had been receiving these antibiotics, the minimal inhibitory concentration (MIC) of rifampin against the S aureus isolate increased from less than 1 μg/mL (susceptible) to 2 μg/mL (resistant). The MIC of vancomycin went from 2 μg/mL (susceptible) to 4 μg/mL (intermediately susceptible). Vancomycin and rifampin were discontinued, and daptomycin and gentamicin (Garamycin) therapy were started. (Her daptomycin MIC was 0.5 μg/mL). The patient’s condition stabilized, and she was discharged to a long-term nursing facility. She had no relapse of MRSA bacteremia, but she died in early April of that year.
Is vancomycin becoming less effective? Degrees of vancomycin resistance
Vancomycin has been our stalwart for treating MRSA infections for more than 40 years but it is not working as well as it used to, at least in certain situations.
VRSA (vancomycin-resistant S aureus) is rare. These fully resistant strains probably acquired a resistance mechanism (the vanA operon) from vancomycin-resistant enterococci. Infections tend to occur in patients simultaneously infected with both S aureus and vancomycin-resistant enterococci, giving the bacteria an opportunity to exchange genetic material.
VISA (vancomycin-intermediate S aureus) infections tend to occur in patients like the one described above who have had long-term vancomycin therapy. VISA strains appear to overproduce a matrix that captures vancomycin and keeps it from entering the cell. On electron microscopy, these bacteria have a very thick cell wall.13
Vancomycin tolerance is a state in which the bacteria are “stunned” or kept in check but not killed by vancomycin. That is manifested in the laboratory by a ratio of minimum bactericidal concentration to MIC greater than 32.
hVISA (heteroresistant VISA) is new and worrisome. These organisms have an overall MIC in the susceptible range, but within that population are individual isolates with an MIC that is much higher—in the intermediate or perhaps even in the resistant range.14
Reported rates of hVISA vary from less than 2% to as high as 76%, because the methods for detecting it are still very poorly standardized. The usual automated laboratory tests do not detect hVISA.
hVISA is probably clinically relevant, as evidence is emerging both in vitro and in vivo that the higher the MIC for vancomycin, the worse the clinical outcome.15 hVISA has been associated with failures of therapy in several situations, usually in cases of severe invasive or deep infection, endocarditis, and bacteremia with vertebral osteomyelitis where vancomycin concentrations at the site of infection may be suboptimal.16–19 While most hVISA strains that have been described were resistant to methicillin, some were susceptible.
The E test is emerging as the standard test for hVISA. This test uses a plastic strip that contains gradually increasing concentrations of vancomycin along its length. Placed in the culture dish, the strip inhibits growth of the organism at its high-concentration end but not at its low-concentration end. If the sample contains hVISA, the cutoff is not well defined, with a few colonies growing at higher concentrations.
New definition of vancomycin susceptibility
Recognizing that the MICs for vancomycin have been rising in the last few years, the Clinical and Laboratory Standards Institute last year changed the break points between susceptibility and resistance. The new definitions are:
- Susceptible—an MIC of 2.0 μg/mL or less (formerly 4.0 μg/mL or less)
- Intermediate—4.0 to 8.0 μg/mL (formerly 8.0 to 16 μg/mL)
- Resistant—16 μg/mL or greater (formerly 32 μg/mL or greater).
One should pay attention to the MIC numbers on the laboratory reports, not just to the words “susceptible” or “not susceptible.” If the number is, say, 0.5 μg/mL or less, the organism should really be susceptible. If the number is 1 or 2, it is still in the susceptible range, but those are the organisms that may cause problems later on.
Further, even if the vancomycin MIC is in the susceptible range, higher MICs may affect outcomes. The average duration of MRSA bacteremia on therapy is 8 to 9 days, vs 3 to 4 days with MSSA bacteremia.20,21 But Sakoulas et al15 found that, in MRSA bacteremia, the success rate with vancomycin therapy was 56% if the MIC was 0.5 or lower, compared with 10% if the MIC was 1.0 to 2.0 μg/mL. Examined in another way, the success rate was 50% if the logarithm of killing was 6.27 colony-forming units per mL or greater, 23% if 4.71 to 6.26, and zero if less than 4.71.
Case 3: Prolonged MRSA bacteremia
In the summer of 2006, a 66-year-old woman with a history of gastric bypass and cirrhosis underwent a long stay in the surgical intensive care unit because of a recurrent enterocutaneous fistula and chronic renal insufficiency. On November 5th, she had a positive blood culture for MRSA, which was treated appropriately with vancomycin for 4 weeks. She was discharged to subacute care but came back 2 days later, again with MRSA bacteremia. At that time her Hickman catheter, which had been inserted for total parenteral nutrition because of the enterocutaneous fistula, was removed.
Transthoracic echocardiography revealed no vegetations, but her bacteremia persisted. Her mental status was poor this entire time: she was mute and could barely be awakened. We looked for clots and infected clots; duplex ultrasonographic examinations of all four extremities were negative. Finally, magnetic resonance imaging of her back—performed empirically because of the persistent bacteremia—revealed vertebral osteomyelitis at level T12-L1. We also noticed on serial evaluations that the vancomycin MIC for her organism increased from 0.5 to 2.0 μg/mL, so therapy was changed from vancomycin to daptomycin.
Her bacteremia cleared. Follow-up echocardiography was negative, but she had two subsequent relapses of MRSA bacteremia, one in April 2007 and one before she died in the summer of 2007.
Prolonged bacteremia: Is it vancomycin resistance, or something else?
The MRSA isolates that cause prolonged bacteremia seem to have certain characteristics.22 Higher MICs are probably associated with longer periods of bacteremia. But some genetic components within some strains of S aureus give them a survival advantage. They have less susceptibility to the body’s thrombin-induced platelet microbicidal protein. These isolates are not only associated with prolonged bacteremia: they are also associated with osteomyelitis, deep abscesses, endocarditis, recurrent infection, and increased death rate.22 Clinical laboratories do not test for these genetic components. One wonders whether our patient may have had an isolate with these mutations that gave it a survival advantage.
Do not use vancomycin for MSSA
Avoid using vancomycin for MSSA infections. It has been shown time and time again that MSSA infections do not respond as well to vancomycin as they do to beta-lactam antibiotics, specifically to the semisynthetic penicillins such as oxacillin and nafcillin, and even some of the first-generation cephalosporins. Chang et al23 found that patients with MSSA bacteremia had higher rates of persistent infections, relapse, and bacteriologic failure if they received vancomycin than if they received nafcillin.
Do vancomycin trough levels affect toxicity?
The vancomycin trough levels that we aimed for in the past (5 to 10 μg/mL) were probably too low. Today, we aim for trough levels of 15 to 20 μg/mL, and many physicians are aiming for 20 to 25 μg/mL. Part of the reason is that vancomycin MICs are higher than they used to be: in order to keep the vancomycin level above the MIC for a longer period of time, the vancomycin trough level needs to be higher. In theory, keeping the vancomycin levels above the MIC for longer periods should improve outcomes. Yet Fowler et al22 found that vancomycin trough levels among patients who had persistent MRSA bacteremia were actually higher than trough levels among those in whom the bacteremia resolved, although the difference was not statistically significant.
We measure the vancomycin trough level to make sure it is high enough (and give larger doses if it is not); among adults, peak levels need not be monitored on a routine basis because of the predictable pharmacokinetics of vancomycin.
Vancomycin toxicity can be either idiosyncratic or synergistic. Idiosyncratic toxicity occurs when a patient who has been on vancomycin for a long time develops a fixed rash, not associated with infusion. This is an immunologic phenomenon. It is a rare and very serious situation and may require steroid therapy.
Synergistic toxicity occurs when vancomycin is given with other nephrotoxic agents, notably gentamicin. Vancomycin plus gentamicin equals nephrotoxicity. Vancomycin alone is usually not nephrotoxic, but close monitoring of renal function parameters is warranted with the use of higher doses.24
IN UNEXPLAINED BACTEREMIA, LOOK FOR ENDOCARDITIS
In blood cultures from patients with bacteremia, S aureus is never a contaminant. Even if just one blood culture is positive for S aureus, believe that S aureus is the culprit.
Reports in the 1950s suggested that at least half of patients who had S aureus bacteremia had endocarditis,25 leading to recommendations that all patients with S aureus bacteremia without an obvious primary source of infection should be evaluated for endocarditis. Subsequent estimates were lower, in the range of 15% to 25%.26,27 However, throughout the world S aureus endocarditis continues to have a very high mortality rate: at least a third of patients die.28
Clinical criteria (community acquisition, no primary focus, and metastatic sequelae) were developed to try to predict the risk of endocarditis in bacteremic patients.26 However, these criteria did not work very well. The clinical definition of endocarditis has evolved. The criteria of von Reyn et al29 from 1981 did not use echocardiography as part of the definition, but the 1994 Duke criteria,30 which were refined31 in 2000, use both clinical and echocardiographic parameters.
Stratton et al32 performed transthoracic echocardiography in 14 patients with bacteremia and found 1 patient with cryptic tricuspid infective endocarditis. Bayer et al33 subsequently reported that of 72 patients with bacteremia, 6 (18%) of those who had no clinical findings suggestive of infectious endocarditis had findings on echocardiography that led to changes in their regimen. Adding echocardiography to three clinical risk factors increased the sensitivity of diagnosing endocarditis from 70% to 85% with a specificity of 100% and predictive value of 96%.
The Duke criteria call for transesophageal echocardiography, which is not feasible in some patients, eg, those with cirrhosis and esophageal varices.
S aureus endocarditis has changed over the years as our patient population has changed, and MRSA endocarditis tends to hit some of our most vulnerable patients. In a study by Miro et al34 in 2005, MRSA was the leading pathogen in patients who were diagnosed with S aureus endocarditis in 1990 or later. We will only see these numbers go up. Patients with diabetes tend to have more MRSA, and of diabetic patients with MRSA endocarditis, 30% to 40% die in the hospital.
Indications for surgery
Certain conditions are indications for surgery among patients with endocarditis, and no antibiotic will cure the endocarditis if the patient has one of these conditions, eg:
- Persistent bacteremia during antibiotic therapy
- Recurrent emboli
- Heart failure that cannot be controlled
- Perivalvular or myocardial abscesses
- Large vegetations
- Early prosthetic valve infection
- Certain arrhythmias.
How long should S aureus bacteremia be treated?
In cases of bacteremia in which endocarditis has been ruled out and removable foci of infection (eg, intravascular catheters) have been removed, some evidence indicates that treatment for 2 weeks would be as effective as the 4 to 6 weeks that we would use for endocarditis or other severe or invasive infections.35 The issue is controversial. If the patient has had frequent hospitalizations or a chronic medical condition I would hesitate to treat for less than 4 weeks, even if the infection appears to be associated with a removable focus.
Treatment of endocarditis
In the guidelines for treatment of endocarditis from the American Heart Association and Infectious Diseases Society of America,36 all the recommendations are relatively old and many of them are somewhat empiric—they are not based on evidence from randomized clinical trials. Rather, they are best opinions based on clinical experience and some observational studies over the years.
For MSSA. In cases of native-valve endocarditis, oxacillin (Bactocill), nafcillin (Unipen), or another semisynthetic beta-lactam antibiotic is recommended. For penicillin-allergic patients, we have other options, such as cefazolin (Ancef, Kefzol).
Combination therapy is frequently recommended for native valve endocarditis as well as for prosthetic valve endocarditis, with either rifampin or gentamicin along with a primary agent. There is some evidence that one can clear staphylococcal bacteremia a day or two more quickly by use of combination therapy with nafcillin plus an aminoglycoside than with nafcillin alone.37,38 For MSSA-associated endocarditis, vancomycin does not work as well as beta-lactam antibiotics.39,40
Korzeniowski and Sande37 and Chambers et al38 reported that the mean duration of bacteremia was 3.4 days for patients treated with nafcillin alone and 2.9 days for those treated with nafcillin plus an aminoglycoside. These studies led to consideration of a short course of gentamicin to clear the bacteremia quickly.
With MRSA, bacteremia often requires a week or more to clear. Levine et al21 reported a study in 42 patients, mostly injection-drug users, with right-sided native-valve endocarditis. The median duration of bacteremia was 7 days in patients who received vancomycin alone vs 9 days in those who received vancomycin plus rifampin; however, some patients were bacteremic for up to 27 days. Fever persisted for a median of 7 days, probably partly due to septic pulmonary emboli. Three patients died, and three required valve replacement.
NEW ANTIBIOTICS
Several new antibiotics are active against gram-positive cocci.41–44 However, the majority of them have not been prospectively studied for treating bacteremia or endocarditis.
Quinupristin/dalfopristin (Synercid) has not been formally studied for treatment of MRSA bacteremia or endocarditis. There are a few case reports of its use in these conditions.45 Quinupristin/dalfopristin is bacteriostatic, and its use may be associated with phlebitis, myalgias, and arthralgias.46
Linezolid (Zyvox) is approved for treatment of complicated skin and soft-tissue infections and for hospital-acquired pneumonia. There have been no specific studies of linezolid in the treatment of S aureus bacteremia or endocarditis. However, Shorr et al47 retrospectively looked at the bacteremic patients in five previous studies of linezolid vs vancomycin and found 144 cases of S aureus bacteremia, half of which were due to MRSA. Of 53 assessable patients with MRSA bacteremia, the primary infection was cured in 14 (56%) of the linezolid patients and 13 (46%) of the vancomycin patients.
The oral form is 100% bioavailable. One should avoid concomitant use of serotonin-reuptake inhibitors because of the risk of serotonin syndrome. Adverse effects include altered taste sensation and peripheral neuropathy. There are other potential toxicities, including hematologic changes (thrombocytopenia, leukopenia) and metabolic effects (lactic acidosis), so clinical and laboratory monitoring is important.48 The role of linezolid in the treatment of patients with S aureus bacteremia or endocarditis remains to be defined.
Daptomycin is indicated for complicated skin and soft-tissue infections, bacteremia, and right-sided endocarditis due to S aureus. Fowler et al20 found that daptomycin was not inferior to beta-lactam antibiotics for treatment of MSSA bacteremia and right-sided endocarditis, and for MRSA infections it outperformed vancomycin, but the difference was not statistically significant.
The dosing interval should be increased from once every 24 hours to every 48 hours if the creatinine clearance is 30 mL/minute or less. Adverse effects include myalgia, rhabdomyolysis (rare), and elevations in creatine phosphokinase. Reports of rising MICs during daptomycin therapy, in some cases associated with persistent infection,49 suggest that careful attention be paid to dosing and clinical monitoring.
Tigecycline (Tygacil) is indicated for complicated skin and soft-tissue infections and complicated intra-abdominal infections due to susceptible organisms. It is active against both MSSA and MRSA, but clinical experience with its use in invasive infections is somewhat limited.50 The dose of tigecycline should be reduced in advanced cirrhosis. Adverse effects include nausea and vomiting.
Telavancin, dalbavancin, and oritavancin, investigational parenteral antibiotics that are derivatives of vancomycin, are in clinical trials. The pharmacokinetic activity of these agents is of interest: telavancin is being studied with a once-daily dosing interval and dalbavancin’s half-life allows once-weekly dosing. In a limited trial, dalbavancin was found to be safe and effective in the treatment of catheter-related bloodstream infections.51 None of the antibiotics in this group has been studied for treatment of S aureus endocarditis. Telavancin therapy has been associated with rash, hypokalemia, QT prolongation, and creatinine elevations. Gastrointestinal symptoms have been reported with the use of dalbavancin.
Ceftobiprole, another investigational agent, is the only cephalosporin antibiotic that is active against MRSA. It is given every 12 hours. Adverse effects include nausea and taste disturbance.
Iclaprim is a novel diaminopyrimidine and a dihydrofolate reductase inhibitor. In vitro, it is active against gram-positive bacteria, including MRSA, VISA, and VRSA; clinical investigations at this point are limited to the treatment of skin and soft-tissue infections.
- Wisplinghoff H, Bischoff T, Tallent SM, Seifert H, Wenzel RP, Edmond MB. Nosocomial bloodstream infections in US hospitals: analysis of 24,179 cases from a prospective nationwide surveillance study. Clin Infect Dis 2004; 39:309–371. Erratum in: Clin Infect Dis 2004; 39:1093.
- US Centers for Disease Control and Prevention. National Nosocomial Infections Surveillance (NNIS) System. Campaign to prevent antimicrobial resistance. www.cdc.gov/drugresistance/healthcare/ha/HASlideSet.ppt.
- Blot SI, Vandewoude KH, Hoste EA, Colardyn FA. Outcome and attributable mortality in critically ill patients with bacteremia involving methicillin-susceptible and methicillin-resistant Staphylococcus aureus. Arch Intern Med 2002; 162:2229–2235.
- Klevens RM, Morrison MA, Nadle J, et al; Active Bacterial Core surveillance (ABCs) MRSA Investigators. Invasive methicillin-resistant Staphylococcus aureus infections in the United States. JAMA 2007; 298:1763–1771.
- Naimi TS, LeDell KH, Como-Sabetti K, et al. Comparison of community- and health care-associated methicillin-resistant Staphylococcus aureus infection. JAMA 2003; 290:2976–2984.
- Miller LG, Perdreau-Remington F, Rieg G, et al. Necrotizing fasciitis caused by community-associated methicillin-resistant Staphylococcus aureus in Los Angeles. N Engl J Med 2005; 352:1445–1453.
- Moran GJ, Krishnadasan A, Gorwitz RJ, et al EMERGEncy ID Net Study Group. Methicillin-resistant S. aureus infections among patients in the emergency department. N Engl J Med 2006; 355:666–674.
- Mishaan AM, Mason EO, Martinez-Aquilar G, et al. Emergence of a predominant clone of community-acquired Staphylococcus aureus among children in Houston, Texas. Pediatr Infect Dis J 2005; 24:201–206.
- Miller LG, Perdreau-Remington F, Bayer AS, et al. Clinical and epidemiologic characteristics cannot distinguish community-associated methicillin-resistant Staphylococcus aureus infection from methicillin-susceptible S. aureus infection: a prospective investigation. Clin Infect Dis 2007; 44:471–482.
- Seybold U, Kourbatova EV, Johnson JG, et al. Emergence of community-associated methicillin-resistant Staphylococcus aureus USA300 genotype as a major cause of health care-associated blood stream infections. Clin Infect Dis 2006; 42:647–656.
- Maree CL, Daum RS, Boyle-Vavra S, Matayoshi K, Miller LG. Community-associated methicillin-resistant Staphylococcus aureus isolates causing healthcare-associated infections. Emerg Infect Dis 2007; 13:236–242.
- Liu C, Chambers HF. Staphylococcus aureus with heterogeneous resistance to vancomycin: epidemiology, clinical significance, and critical assessment of diagnostic methods. Antimicrob Agents Chemother 2003; 47:3040–3045.
- Sieradzki K, Roberts RB, Haber SW, Tomasz A. The development of vancomycin resistance in a patient with methicillin-resistant Staphylococcus aureus infection. N Engl J Med 1999; 340:517–523.
- Schwaber MJ, Wright SB, Carmeli Y, et al. Clinical implications of varying degrees of vancomycin susceptibility in methicillin-resistant Staphylococcus aureus bacteremia. Emerg Infect Dis 2003; 9:657–664. Erratum in: Emerg Infect Dis 2004; 10:160.
- Sakoulas G, Moise-Broder PA, Schentag J, Forrest A, Moellering RC, Eliopoulos GM. Relationship of MIC and bactericidal activity to efficacy of vancomycin for treatment of methicillin-resistant Staphylococcus aureus bacteremia. J Clin Microbiol 2004; 42:2398–2402.
- Naimi TS, Anderson D, O’Boyle C, et al. Vancomycin-intermediate Staphylococcus aureus with phenotypic susceptibility to methicillin in a patient with recurrent bacteremia. Clin Infect Dis 2003; 36:1609–1612.
- Moore MR, Perdreau-Remington F, Chambers HF. Vancomycin treatment failure associated with heterogeneous vancomycin-intermediate Staphylococcus aureus in a patient with endocarditis and in the rabbit model of endocarditis. Antimicrob Agents Chemother 2003; 47:1262–1266.
- Charles PG, Ward PB, Johnson PD, Howden BP, Grayson ML. Clinical features associated with bacteremia due to heterogenous vancomycin-intermediate Staphylococcus aureus. Clin Infect Dis 2004; 38:448–451.
- Howden BP, Ward PB, Charles PG, et al. Treatment outcomes for serious infections caused by methicillin-resistant Staphylococcus aureus with reduced vancomycin susceptibility. Clin Infect Dis 2004; 38:521–528.
- Fowler VG, Boucher HW, Corey GR, et al. S. aureus Endocarditis and Bacteremia Study Group. Daptomycin versus standard therapy for bacteremia and endocarditis caused by Staphylococcus aureus. N Engl J Med 2006; 355:653–665.
- Levine DP, Fromm BS, Reddy BR. Slow response to vancomycin or vancomycin plus rifampin in methicillin-resistant Staphylococcus aureus endocarditis. Ann Intern Med 1991; 115:674–680.
- Fowler VG, Sakoulas G, McIntyre LM, et al. Persistent bacteremia due to methicillin-resistant Staphylococcus aureus infection is associated with agr dysfunction and low-level in vitro resistance to thrombin-induced platelet microbicidal protein. J Infect Dis 2004; 190:1140–1149.
- Chang FY, Peacock JE, Musher DM, et al. Staphylococcus aureus bacteremia: recurrence and the impact of antibiotic treatment in a prospective multicenter study. Medicine (Baltimore) 2003; 82:333–339.
- Hidayat LK, Hsu DI, Quist R, Shriner KA, Wong-Beringer A. High-dose vancomycin therapy for methicillin-resistant Staphylococcus aureus infections: efficacy and toxicity. Arch Intern Med 2006; 166:2138–2144.
- Wilson R, Hamburger M. Fifteen years’ experience with staphylococcus septicemia in a large city hospital; analysis of fifty-five cases in the Cincinnati General Hospital 1940 to 1954. Am J Med 1957; 22:437–457.
- Nolan CM, Beaty HN. Staphylococcus aureus bacteremia. Current clinical patterns. Am J Med 1976; 60:495–500.
- Shah M, Watanakunakorn C. Changing patterns of Staphylococcus aureus bacteremia. Am J Med Sci 1979; 278:115–121.
- Fowler VG, Miro JM, Hoen B, et al ICE Investigators. Staphylococcus aureus endocarditis: a consequence of medical progress. JAMA 2005; 293:3012–3021. Erratum in: JAMA 2005; 294:900.
- Von Reyn CF, Levy BS, Arbeit RD, Friedland G, Crumpacker CS. Infective endocarditis: an analysis based on strict case definition. Ann Intern Med 1981; 94:505–518.
- Durack DT, Lukes AS, Bright DK. New criteria for diagnosis of infective endocarditis: utilization of specific echocardiographic findings. Duke Endocarditis Service. Am J Med 1994; 96:200–209.
- Li JS, Sexton DJ, Mick N, et al. Proposed modifications to the Duke criteria for the diagnosis of infective endocarditis. Clin Infect Dis 2000; 30:633–638.
- Stratton JR, Werner JA, Pearlman AS, Janko CL, Kliman S, Jackson MC. Bacteremia and the heart. Serial echocardiographic findings in 80 patients with documented or suspected bacteremia. Am J Med 1982; 73:851–858.
- Bayer AS, Lam K, Ginzton L, Normal DC, Chiu CY, Ward JI. Staphylococcus aureus bacteremia. Clinical, serologic, and echocardiographic findings in patients with and without endocarditis. Arch Intern Med 1987; 147:457–462.
- Miro JM, Anguera I, Cabell CH, et al International Collaboration on Endocarditis Merged Database Study Group. Staphylococcus aureus native valve infective endocarditis: report of 566 episodes from the International Collaboration on Endocarditis Merged Database. Clin Infect Dis 2005; 41:507–514. Erratum in: Clin Infect Dis 2005; 41:1075–1077.
- Jernigan JA, Farr BM. Short-course therapy of catheter-related Staphylococcus aureus bacteremia: a meta-analysis. Ann Intern Med 1993; 119:304–311.
- Baddour LM, Wilson WR, Bayer AS, et al. Infective endocarditis: diagnosis, antimicrobial therapy, and management of complications: a statement for healthcare professionals from the Committee on Rheumatic Fever, Endocarditis, and Kawasaki Disease, Council on Cardiovascular Disease in the Young, and the Councils on Clinical Cardiology, Stroke, and Cardiovascular Surgery and Anesthesia, American Heart Association: endorsed by the Infectious Diseases Society of America. Circulation 2005; 111:e394–e434. Erratum in: Circulation 2005; 112:2373. Circulation 2007; 115:e408.
- Korzeniowski O, Sande MA. Combination antimicrobial therapy for Staphylococcus aureus endocarditis in patients addicted to parenteral drugs and in nonaddicts: a prospective study. Ann Intern Med 1982; 97:496–503.
- Chambers HF, Korzeniowski OM, Sande MA. Staphylococcus aureus endocarditis: clinical manifestations in addicts and nonaddicts. Medicine (Baltimore) 1983; 62:170–177.
- Gentry CA, Rodvold KA, Novak RM, Hershow RC, Naderer OJ. Retrospective evaluation of therapies for Staphylococcus aureus endocarditis. Pharmacotherapy 1997; 17:990–997.
- Small PM, Chambers HF. Vancomycin for Staphylococcus aureus endocarditis in intravenous drug users. Antimicrob Agents Chemother 1990; 34:1227–1231.
- Eliopoulos GM. Quinupristin-dalfopristin and linezolid: evidence and opinion. Clin Infect Dis 2003; 36:473–481.
- Rybak MJ. Therapeutic options for Gram-positive infections. J Hosp Infect 2001; 49 suppl A:S25–S32.
- Micek ST. Alternatives to vancomycin for the treatment of methicillin-resistant Staphylococcus aureus infections. Clin Infect Dis 2007; 45 suppl 3:S184–S190.
- Appelbaum PC, Jacobs MR. Recently approved and investigational antibiotics for treatment of severe infections caused by Gram-positive bacteria. Curr Opin Microbiol 2005; 8:510–517.
- Drew RH, Perfect JR, Srinath L, Kirkimilis E, Dowzicky M, Talbot GH for the Synercid Emergency-Use Study Group. Treatment of methicillin-resistant Staphylococcus aureus infections with quinupristin-dalfopristin in patients intolerant of or failing prior therapy. J Antimicrob Chemother 2000; 46:775–784.
- Lamb HM, Figgitt DP, Faulds D. Quinupristin/dalfopristin: a review of its use in the management of serious gram-positive infections. Drugs 1999; 58:1061–1097.
- Shorr AF, Kunkel MJ, Kollef M. Linezolid versus vancomycin for Staphylococcus aureus bacteraemia: pooled analysis of randomized studies. J Antimicrob Chemother 2005; 56:923–929.
- Bishop E, Melvani S, Howden BP, Charles PG, Grayson ML. Good clinical outcomes but high rates of adverse reactions during linezolid therapy for serious infections: a proposed protocol for monitoring therapy in complex patients. Antimicrob Agents Chemother 2006; 50:1599–1602.
- Boucher HW, Sakoulas G. Perspectives on daptomycin resistance, with emphasis on resistance in Staphylococcus aureus. Clin Infect Dis 2007; 45:601–608.
- Munoz-Price LS, Lolans K, Quinn JP. Four cases of invasive methicillin-resistant Staphylococcus aureus (MRSA) infections treated with tigecycline. Scand J Infect Dis 2006; 38:1081–1084.
- Raad I, Darouiche R, Vazquez J, et al. Efficacy and safety of weekly dalbavancin therapy for catheter-related bloodstream infection caused by gram-positive pathogens. Clin Infect Dis 2005; 40:374–80.
KEY POINTS
- Community-associated MRSA infections tend to affect patients younger than those who traditionally get hospital-associated MRSA infections. Most of these infections are of the skin and soft tissues, but this pathogen can also affect deeper tissues, and bacteremia and necrotizing pneumonia have been reported.
- For patients with skin and soft-tissue infections due to MRSA, incision and drainage rather than antibiotic therapy is often the key intervention.
- Vancomycin has been our stalwart for treating MRSA infections for more than 40 years, but it is not working as well as it used to, at least in certain situations. Vancomycin should not be used to treat infections due to methicillin-susceptible S aureus.
- Needed are better understanding of the factors that influence persistent S aureus bacteremia, well-controlled, prospective studies, and continued antibiotic development.
Emerging Challenges in the Management of HIV and Hepatitis C Virus Coinfection in Veterans
Poly-L-lactic Acid for the Treatment of Trauma-Induced Facial Lipoatrophy and Asymmetry
Trolamine-Containing Topical Emulsion: Clinical Applications in Dermatology
Vaccine update: New CDC recommendations from 2007
The year 2007 was rather calm, compared to the 3 previous years in regards to new vaccines and vaccine recommendations. Although no breakthrough vaccine products came onto the market in 2007, there were new recommendations and licensure for new age groups for existing vaccines and a recall of some lots of Hib vaccines.
Meningococcal vaccine
Recommendations on the use of the quadrivalent meningococcal conjugate vaccine (MCV4) have evolved since its licensure in 2005 for use in persons 11 to 55 years of age. The first set of recommendations focused on universal vaccination of preteens, aged 11 to 12, those entering high school who had not received the vaccine previously, and others at risk for meningococcal disease including college freshmen living in dormitories.1 The MCV4 was preferred to the older polysaccharide vaccine (MPSV4) which was recommended only for children aged 2 to 10 and adults over age 55 at increased risk.
In 2007, the CDC changed 2 of the 2005 recommendations:
- The first, in August, simplified the recommendations for teens, making MCV4 universally recommended for all those aged 11 to 18 at the earliest opportunity.2
- The second, in December, followed FDA approval for use of MCV4 in children aged 2 to 10 years. The CDC now recommends MCV4 as the preferred vaccine in this age group for those at risk (TABLE 1).3
TABLE 1
Populations at increased risk for meningococcal disease who should receive quadrivalent meningococcal conjugate vaccine
|
If someone at ongoing risk for meningococcal disease has been previously vaccinated with MPSV4, they should be revaccinated 3 years later with MCV4. It is not known if repeat doses of MCV4 will be needed, and if so, after what amount of time.
The MCV4 has been linked to Guillain-Barré syndrome (GBS), and a history of GBS is a precaution for its use. For those with a history of GBS who need protection against meningococcal infection, MPSV4 is an alternative.
Hepatitis A vaccine
Widespread use of inactivated hepatitis A vaccine (HAV), first licensed in 1995, has markedly reduced the incidence of hepatitis A infection (FIGURE). Recommendations for its use have been periodically revised; current recommendations include universal vaccination of all children at age 12 to 23 months, catch-up vaccination in older children in areas of high prevalence, and vaccination of those at increased risk for hepatitis A including travelers to endemic areas, users of illicit drugs and men who have sex with men.4
FIGURE
Reduction in incidence of hepatitis A infection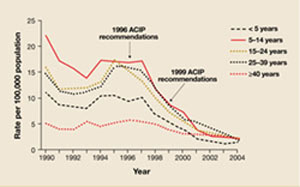
Source: Prevention of hepatitis A through active or passive immunization: recommendations of the Advisory Committee on Immunization Practices. MMWR Recomm Rep 2006; 55(RR-07).
For those unvaccinated who are acutely exposed to hepatitis A virus and those traveling to areas of high prevalence who do not have time to complete the 2 doses of HAV, the only prevention available until recently has been IG. This has now changed and HAV can be used in both groups. The new recommendation for postexposure prophylaxis is that either a single dose of HAV or use of IG is acceptable.5 At ages 12 months to 40 years, vaccine is preferred. For those over age 40, IG is preferred but vaccine is acceptable. For children less than 12 months, the immune suppressed, and those with chronic liver disease, IG should be used.
Those traveling or working in countries with high rates of hepatitis A can be protected with either HAV or IG. A single dose of HAV is sufficient for healthy people, with a second dose at the recommended interval to complete the series. Those under age 12 months, those who choose not to receive the vaccine, and those who are allergic to the vaccine should be offered IG. Both IG and HAV should be considered for individuals who plan to travel within 2 weeks of the first HAV dose; those over age 40, the immune compromised, and those with chronic liver disease or other chronic medical conditions.
Live attenuated influenza vaccine
FluMist, the live attenuated influenza vaccine (LAIV), which is administered as an intranasal spray, is now approved for use among those 2 to 4 years of age.6 Previously, the LAIV was approved only for healthy, non pregnant persons, 5 to 49 years of age. The LAIV may actually be the preferred product in children as it has been shown to prevent more influenza illness than the trivalent inactivated vaccine (TIV). The LAIV should not be used in anyone with a condition listed in TABLE 2 and should not be administered to children under age 5 who have recurrent wheezing.
FluMist has also been modified in several advantageous ways:
- The dose in the sprayer is now 0.2 mL (previously 0.5 mL). One half of the dose should be administered in each nostril.
- The product no longer has to be stored frozen; it should be kept at 35° to 46°F.
- When 2 doses are needed in children under age 9 being vaccinated for the first time, the interval between doses is now 4 weeks (previously 6 weeks).
TABLE 2
LAIV (FluMist) should not be used in these groups
|
Children under age 9 years who receive only 1 dose of vaccine (either TIV or LAIV) the first year they are vaccinated should receive 2 doses the next year.6 If they fail to receive 2 doses in the next year, only a single dose is recommended after that. This is a slight modification of the previous recommendation that only 1 dose was recommended in this situation.7
Alternative schedule for combined hepatitis A and B vaccine
The FDA approved an alternate, 4-dose schedule for the combined hepatitis A and hepatitis B vaccine (Twinrix): at 0, 7, 21 days, and 12 months.8 It was previously approved only for a 3-dose schedule: at 0, 1, and 6 months. The new alternative schedule allows greater protection for travelers who need to depart in less than a month’s time.
Merck recalls some lots of Hib vaccine
On December 11, 2007, Merck announced a voluntary recall of specific lots of Haemophilus influenza type b (Hib) conjugate vaccine products: 10 lots of a monovalent Hib vaccine, PedvaxHIB, and 2 lots of a combined hepatitis B/Hib vaccine, Comvax.
Consult Merck’s Web site for the lots involved and for instructions on returning vaccine (www.merckvaccines. com/PCHRecall.pdf). The recall was prompted by concern about equipment sterility, although no vaccine has been shown to be contaminated. Children vaccinated with Merck products do not need to be revaccinated or obtain any special follow-up.
Shortage expected. It is unknown when Merck will resume production, but it is not anticipated until at least late in 2008. Other Hib-containing products are produced by Sanofi Pasteur but the supply of these products will not make up for the expected shortage.
Interim recommendations. The recall resulted in interim recommendations from the CDC.9 These recommendations are complicated because the dosing schedule for Hib vaccine differs by the product and the age of receipt of first vaccine when children are not on schedule. TABLE 3 lists the Hib-containing products, the recommended primary series schedule, and booster dose.
TABLE 3
Hib products
| PRIMARY SERIES | BOOSTER | |||
|---|---|---|---|---|
| Merck Products | ||||
| PedvaxHIB | Monovalent Hib vaccine | 2, 4 months | 12–15 months* | |
| Comvax | Combined Hib/hepatitis B vaccine | 2, 4 months | 12–15 months* | |
| Sanofi Pasteur products | ||||
| ActHIB | Monovalent hib vaccine | 2, 4, 6 months | 12–15 months* | |
| TriHIBit | DTaP/Hib vaccine | Not licensed for this age group | 15–18 months* | |
| * Can follow a primary series of any product or serve as the only dose for a child up to 59 months, not previously immunized. | ||||
The main points are:
- Defer the booster dose at age 12 to 15 months until the shortage is resolved, except for high-risk children.
- High-risk children, who should continue to receive the booster at ages 12 to 15 months, include those with asplenia, sickle cell disease, HIV infection, and certain other immune deficiencies and cancers, and American Indian/Alaskan Native children.
- Physicians should keep track of children who have the booster deferred so they can be vaccinated when the supply improves.
- Non-recalled lots of PedvaxHIB and Comvax in the CDC stockpile will be prioritized to providers who care for predominantly American Indian/Alaskan Native children, who are at markedly in creased risk of Hib infection.
- If a child has received only 1 dose of PedvaxHIB or Comvax, their primary series can be completed with ActHIB, but 3 total doses are needed.
Children through age 59 months who are behind schedule should complete a primary series according to published recommendations.10 Physicians should call their local health department if they have any questions about what to do in a specific case.
1. CDC. Prevention and control of meningococcal disease: recommendations of the Advisory Committee on Immunization Practices (ACIP). MMWR Recomm Rep 2005;54(RR-7):1-21.
2. CDC. Revised recommendations of the Advisory Committee on Immunization Practices to vaccinate all persons aged 11-18 years with meningococcal conjugate vaccine. MMWR Morb Mortal Wkly Rep 2007;56:794-795.
3. CDC. Recommendation from the Advisory Committee on Immunization Practices (ACIP) for use of quadrivalent meningococcal conjugate vaccine (MCV4) in children aged 2-10 years at increased risk for invasive meningococcal disease. MMWR Morb Mortal Wkly Rep 2007;56:1265-1266.
4. CDC. Update: prevention of hepatitis A after exposure to hepatitis A virus and in international travelers. Updated recommendations of the ACIP. MMWR Morb Mortal Wkly Rep 2007;56:1080-1084.
5. Advisory Committee on Immunization Practices (ACIP), Fiore AE, Wasley A, Bell BP. Prevention of hepatitis A through active or passive immunization: recommendations of the Advisory Committee on Immunization Practices (ACIP). MMWR Recomm Rep 2006;55(RR-07):1-23.
6. CDC. Expansion of use of live attenuated influenza vaccine to children aged 2-4 years and other Flu-Mist changes for the 2007-2008 influenza season. MMWR Morb Mortal Wkly Rep 2007;56:1217-1219.
7. Fiore AE, Shay DK, Haber P, et al. Advisory Committee on Immunization Practices (ACIP), Centers for Disease Control and Prevention (CDC). Prevention and control of influenza: recommendations of the Advisory Committee on Immunization Practices (ACIP), 2007. MMWR Recomm Rep 2007;56(RR-6):1-54.
8. CDC. FDA approval of an alternate dosing schedule for a combined hepatitis A and B vaccine (Twinrix). MMWR Morb Mortal Wkly Rep 2007;56:1057.-
9. CDC. Interim recommendations for the use of Haemophilus influenza Type b (Hib) conjugate vaccines related to the recall of certain lots of Hib-containing vaccines (PedvaxHIB and Comvax). MMWR Morb Mortal Wkly Rep 2007;56:1318-1320.
10. CDC. Catch-up immunization schedule for persons aged 4 months-18 years who start late or are more than one month behind. Available at www.cdc.gov/vaccines/recs/schedules/downloads/child/2007/child-schedule-color-print.pdf. Accessed February 11, 2008.
The year 2007 was rather calm, compared to the 3 previous years in regards to new vaccines and vaccine recommendations. Although no breakthrough vaccine products came onto the market in 2007, there were new recommendations and licensure for new age groups for existing vaccines and a recall of some lots of Hib vaccines.
Meningococcal vaccine
Recommendations on the use of the quadrivalent meningococcal conjugate vaccine (MCV4) have evolved since its licensure in 2005 for use in persons 11 to 55 years of age. The first set of recommendations focused on universal vaccination of preteens, aged 11 to 12, those entering high school who had not received the vaccine previously, and others at risk for meningococcal disease including college freshmen living in dormitories.1 The MCV4 was preferred to the older polysaccharide vaccine (MPSV4) which was recommended only for children aged 2 to 10 and adults over age 55 at increased risk.
In 2007, the CDC changed 2 of the 2005 recommendations:
- The first, in August, simplified the recommendations for teens, making MCV4 universally recommended for all those aged 11 to 18 at the earliest opportunity.2
- The second, in December, followed FDA approval for use of MCV4 in children aged 2 to 10 years. The CDC now recommends MCV4 as the preferred vaccine in this age group for those at risk (TABLE 1).3
TABLE 1
Populations at increased risk for meningococcal disease who should receive quadrivalent meningococcal conjugate vaccine
|
If someone at ongoing risk for meningococcal disease has been previously vaccinated with MPSV4, they should be revaccinated 3 years later with MCV4. It is not known if repeat doses of MCV4 will be needed, and if so, after what amount of time.
The MCV4 has been linked to Guillain-Barré syndrome (GBS), and a history of GBS is a precaution for its use. For those with a history of GBS who need protection against meningococcal infection, MPSV4 is an alternative.
Hepatitis A vaccine
Widespread use of inactivated hepatitis A vaccine (HAV), first licensed in 1995, has markedly reduced the incidence of hepatitis A infection (FIGURE). Recommendations for its use have been periodically revised; current recommendations include universal vaccination of all children at age 12 to 23 months, catch-up vaccination in older children in areas of high prevalence, and vaccination of those at increased risk for hepatitis A including travelers to endemic areas, users of illicit drugs and men who have sex with men.4
FIGURE
Reduction in incidence of hepatitis A infection
Source: Prevention of hepatitis A through active or passive immunization: recommendations of the Advisory Committee on Immunization Practices. MMWR Recomm Rep 2006; 55(RR-07).
For those unvaccinated who are acutely exposed to hepatitis A virus and those traveling to areas of high prevalence who do not have time to complete the 2 doses of HAV, the only prevention available until recently has been IG. This has now changed and HAV can be used in both groups. The new recommendation for postexposure prophylaxis is that either a single dose of HAV or use of IG is acceptable.5 At ages 12 months to 40 years, vaccine is preferred. For those over age 40, IG is preferred but vaccine is acceptable. For children less than 12 months, the immune suppressed, and those with chronic liver disease, IG should be used.
Those traveling or working in countries with high rates of hepatitis A can be protected with either HAV or IG. A single dose of HAV is sufficient for healthy people, with a second dose at the recommended interval to complete the series. Those under age 12 months, those who choose not to receive the vaccine, and those who are allergic to the vaccine should be offered IG. Both IG and HAV should be considered for individuals who plan to travel within 2 weeks of the first HAV dose; those over age 40, the immune compromised, and those with chronic liver disease or other chronic medical conditions.
Live attenuated influenza vaccine
FluMist, the live attenuated influenza vaccine (LAIV), which is administered as an intranasal spray, is now approved for use among those 2 to 4 years of age.6 Previously, the LAIV was approved only for healthy, non pregnant persons, 5 to 49 years of age. The LAIV may actually be the preferred product in children as it has been shown to prevent more influenza illness than the trivalent inactivated vaccine (TIV). The LAIV should not be used in anyone with a condition listed in TABLE 2 and should not be administered to children under age 5 who have recurrent wheezing.
FluMist has also been modified in several advantageous ways:
- The dose in the sprayer is now 0.2 mL (previously 0.5 mL). One half of the dose should be administered in each nostril.
- The product no longer has to be stored frozen; it should be kept at 35° to 46°F.
- When 2 doses are needed in children under age 9 being vaccinated for the first time, the interval between doses is now 4 weeks (previously 6 weeks).
TABLE 2
LAIV (FluMist) should not be used in these groups
|
Children under age 9 years who receive only 1 dose of vaccine (either TIV or LAIV) the first year they are vaccinated should receive 2 doses the next year.6 If they fail to receive 2 doses in the next year, only a single dose is recommended after that. This is a slight modification of the previous recommendation that only 1 dose was recommended in this situation.7
Alternative schedule for combined hepatitis A and B vaccine
The FDA approved an alternate, 4-dose schedule for the combined hepatitis A and hepatitis B vaccine (Twinrix): at 0, 7, 21 days, and 12 months.8 It was previously approved only for a 3-dose schedule: at 0, 1, and 6 months. The new alternative schedule allows greater protection for travelers who need to depart in less than a month’s time.
Merck recalls some lots of Hib vaccine
On December 11, 2007, Merck announced a voluntary recall of specific lots of Haemophilus influenza type b (Hib) conjugate vaccine products: 10 lots of a monovalent Hib vaccine, PedvaxHIB, and 2 lots of a combined hepatitis B/Hib vaccine, Comvax.
Consult Merck’s Web site for the lots involved and for instructions on returning vaccine (www.merckvaccines. com/PCHRecall.pdf). The recall was prompted by concern about equipment sterility, although no vaccine has been shown to be contaminated. Children vaccinated with Merck products do not need to be revaccinated or obtain any special follow-up.
Shortage expected. It is unknown when Merck will resume production, but it is not anticipated until at least late in 2008. Other Hib-containing products are produced by Sanofi Pasteur but the supply of these products will not make up for the expected shortage.
Interim recommendations. The recall resulted in interim recommendations from the CDC.9 These recommendations are complicated because the dosing schedule for Hib vaccine differs by the product and the age of receipt of first vaccine when children are not on schedule. TABLE 3 lists the Hib-containing products, the recommended primary series schedule, and booster dose.
TABLE 3
Hib products
| PRIMARY SERIES | BOOSTER | |||
|---|---|---|---|---|
| Merck Products | ||||
| PedvaxHIB | Monovalent Hib vaccine | 2, 4 months | 12–15 months* | |
| Comvax | Combined Hib/hepatitis B vaccine | 2, 4 months | 12–15 months* | |
| Sanofi Pasteur products | ||||
| ActHIB | Monovalent hib vaccine | 2, 4, 6 months | 12–15 months* | |
| TriHIBit | DTaP/Hib vaccine | Not licensed for this age group | 15–18 months* | |
| * Can follow a primary series of any product or serve as the only dose for a child up to 59 months, not previously immunized. | ||||
The main points are:
- Defer the booster dose at age 12 to 15 months until the shortage is resolved, except for high-risk children.
- High-risk children, who should continue to receive the booster at ages 12 to 15 months, include those with asplenia, sickle cell disease, HIV infection, and certain other immune deficiencies and cancers, and American Indian/Alaskan Native children.
- Physicians should keep track of children who have the booster deferred so they can be vaccinated when the supply improves.
- Non-recalled lots of PedvaxHIB and Comvax in the CDC stockpile will be prioritized to providers who care for predominantly American Indian/Alaskan Native children, who are at markedly in creased risk of Hib infection.
- If a child has received only 1 dose of PedvaxHIB or Comvax, their primary series can be completed with ActHIB, but 3 total doses are needed.
Children through age 59 months who are behind schedule should complete a primary series according to published recommendations.10 Physicians should call their local health department if they have any questions about what to do in a specific case.
1. CDC. Prevention and control of meningococcal disease: recommendations of the Advisory Committee on Immunization Practices (ACIP). MMWR Recomm Rep 2005;54(RR-7):1-21.
2. CDC. Revised recommendations of the Advisory Committee on Immunization Practices to vaccinate all persons aged 11-18 years with meningococcal conjugate vaccine. MMWR Morb Mortal Wkly Rep 2007;56:794-795.
3. CDC. Recommendation from the Advisory Committee on Immunization Practices (ACIP) for use of quadrivalent meningococcal conjugate vaccine (MCV4) in children aged 2-10 years at increased risk for invasive meningococcal disease. MMWR Morb Mortal Wkly Rep 2007;56:1265-1266.
4. CDC. Update: prevention of hepatitis A after exposure to hepatitis A virus and in international travelers. Updated recommendations of the ACIP. MMWR Morb Mortal Wkly Rep 2007;56:1080-1084.
5. Advisory Committee on Immunization Practices (ACIP), Fiore AE, Wasley A, Bell BP. Prevention of hepatitis A through active or passive immunization: recommendations of the Advisory Committee on Immunization Practices (ACIP). MMWR Recomm Rep 2006;55(RR-07):1-23.
6. CDC. Expansion of use of live attenuated influenza vaccine to children aged 2-4 years and other Flu-Mist changes for the 2007-2008 influenza season. MMWR Morb Mortal Wkly Rep 2007;56:1217-1219.
7. Fiore AE, Shay DK, Haber P, et al. Advisory Committee on Immunization Practices (ACIP), Centers for Disease Control and Prevention (CDC). Prevention and control of influenza: recommendations of the Advisory Committee on Immunization Practices (ACIP), 2007. MMWR Recomm Rep 2007;56(RR-6):1-54.
8. CDC. FDA approval of an alternate dosing schedule for a combined hepatitis A and B vaccine (Twinrix). MMWR Morb Mortal Wkly Rep 2007;56:1057.-
9. CDC. Interim recommendations for the use of Haemophilus influenza Type b (Hib) conjugate vaccines related to the recall of certain lots of Hib-containing vaccines (PedvaxHIB and Comvax). MMWR Morb Mortal Wkly Rep 2007;56:1318-1320.
10. CDC. Catch-up immunization schedule for persons aged 4 months-18 years who start late or are more than one month behind. Available at www.cdc.gov/vaccines/recs/schedules/downloads/child/2007/child-schedule-color-print.pdf. Accessed February 11, 2008.
Getting patients to exercise more: A systematic review of underserved populations
- Use focused, brief (2–3 minute) physical activity counseling with patients (B).
- Have large-print, easy-to-understand program materials available to supplement your discussion (B). Provide patients with a simple written plan of their physical activity goals (B). Focus on a limited number of concepts to avoid information overload (B).
- Address patients’ financial and logistical barriers to participation and adherence (B).
- Encourage flexibility in patients’ choices for exercise, and incorporate cultural adaptations (such as preferences for music, dance, or group activities) where appropriate (B).
- Use trained support staff, preferably representing the community of interest, to promote physical activity in your patients (B).
Strength of recommendation (SOR)
- Good-quality patient-oriented evidence
- Inconsistent or limited-quality patient-oriented evidence
- Consensus, usual practice, opinion, disease-oriented evidence, case series
Fewer than half of all Americans get sufficient physical activity, defined as 30 minutes or more per day, at least 5 times per week.1 The need to increase physical activity applies particularly to underserved populations: they are even less likely to get enough physical activity, and are thus even more likely to suffer greater burden of disease.2,3
The purpose of this systematic review was to assess clinical trials of clinician-initiated counseling interventions for promoting physical activity in under-served populations. We define under-served populations as individuals from minority ethnic backgrounds (such as African Americans, Hispanics, and Asian Americans), or vulnerable populations such as people with low educational attainment, low income, lack of insurance, or those residing in rural communities.
Primary care interventions are linked to a change in habits
Primary care physicians can have a significant impact on their patients’ physical activity. Individuals with a regular primary care physician are more likely to report attempts to change their physical activity habits.4 However, underserved populations are more likely to have inconsistent access to medical care, which may contribute to their greater risk of conditions linked to inadequate physical activity, such as diabetes, hypertension, and obesity.
Only about 25% of patients in primary care settings report receiving any counseling on physical activity.5 Those who are middle-aged or have a baccalaureate degree or higher are more likely to report such advice; African Americans and foreign-born immigrants are less likely to report it.
A study by Taira et al6 examined the relationship between patient income and discussion of health risk behaviors. Low-income patients were more likely to be obese and smoke than high-income patients; however, physicians were less likely to discuss diet and exercise with low-income patients. Among all the patients with whom some discussion occurred in this study, low-income patients were much more likely to attempt to change behavior based on physician advice than were high-income patients.
Clinical trials within7,8 and outside the US9-11 support the potential value of physical activity counseling in primary care. In these studies, as little as 3 to 5 minutes of patient-clinician communication about physical activity was linked to short-term improvement in patients’ exercise habits. As few as 2 or 3 office visits over 6 months were associated with increases in patients’ physical activity levels up to 1 year later. Other features that contributed to their success included having a brief (<3 minutes) counseling component for clinicians, supplementing the counseling with a written exercise prescription, having follow-up contact, and tailoring the counseling to patients’ needs and concerns.
These results are promising for primary care clinicians, whose longitudinal relationships with their patients afford them repeated opportunities to intervene to promote physical activity.
Few studies have focused on the underserved
A review by Taylor et al2 of physical activity interventions in low-income, ethnic minority, or disabled populations identified 14 community-based studies, mostly with quasi-experimental “pre/post” study designs. Ten studies included ethnic minorities, but physical activity was documented in just 2 studies at baseline, and these 2 studies did not include any postintervention follow-up. None of the 10 interventions was conducted in a primary care setting.
Another recent review12 found that studies that were ethnically inclusive placed greater emphasis on involving communities and building coalitions right from study inception, and they tailored messages (and messengers) that were culturally specific. Several of these studies showed better outcomes among ethnic minority participants than the white participants they sampled.
Taken together, previous reviews have examined the effectiveness of primary care interventions for the general population,13,14 as well as community-based programs for underserved populations.2 However, little information exists about effective physical activity counseling strategies for underserved groups in primary care.
Methods
Looking for studies in underserved populations
We conducted a systematic review of the literature involving clinical trials in the US, looking for trials where counseling interventions are initiated by primary care clinicians, and that assessed behavioral change related to physical activity.
Inclusion criteria
TABLE 1 shows the inclusion criteria and search terms for the literature review. We searched Ovid, Medline, CINAHL, PsycINFO, PubMed, Cochrane, and HealthSTAR for studies published between 1966 and 2005. We also searched bibliographies of retrieved articles, and contacted experts in the field in an effort to obtain other relevant data.
The principal investigator (JKC) reviewed titles and abstracts of all potentially relevant articles to determine whether they met eligibility criteria. Studies that met the criteria were retrieved and abstracted.
Using these predefined criteria, data were extracted from each eligible article. Studies were also rated according to the Strength of Recommendation Taxonomy (SORT), because of its emphasis on patient-oriented outcomes and the quality, quantity, and consistency of evidence.15
TABLE 1
Inclusion criteria and search terms
| For inclusion, studies must have: | ||
| ||
| The key terms used for the literature search were: | ||
| ambulatory care | health communication | program evaluation |
| behavioral interventions | health promotion | socioeconomic factors |
| behavior therapy | intervention studies | underserved populations |
| body mass index | obesity | urban populations |
| community health | outpatient clinic | weight control |
| exercise | physical activity | weight loss |
| family physicians | poverty | weight management |
| health behavior change | primary health care | |
Results
6 of 8 studies report increases in physical activity
We reviewed a total of 253 titles and abstracts. Eight studies16-23 met our inclusion criteria. We were not able to locate any clinical trials that both 1) examined the effect of primary care clinician counseling on physical activity outcomes, and 2) had a study population focused on an underserved group. TABLE 2 (available at www.jfponline.com) shows the characteristics of these 8 studies.
Although we sought trials that defined “primary care clinician” as a professional—such as MD, nurse practitioner (NP), or physician assistant (PA)—who provides longitudinal primary health care, several of these studies considered dieticians, exercise physiologists, or health care workers as primary care clinicians.
Only 1 study20 examined physical activity counseling with an intervention that incorporated a follow-up visit by the primary care clinician, and looked at the long-term effect on physical activity as an outcome. Thus, the degree to which the clinician’s counseling influenced the physical activity outcome in these studies is unclear.
Identifying underserved groups
Information on race or ethnicity (which tended to be reported as a single variable), level of education, and income of participants was reported in the demographic data of all studies’ results, but relationships between these variables and physical activity outcomes were not consistently reported. One study23 stratified participants by race/ethnicity and health center; 2 studies16,21 reported analyses and findings for participants according to ethnicity, income, and educational level, as that was their focus.
Overall, however, it is not clear to what extent the interventions succeeded for various underserved groups, even if they were included as participants.
Study designs and the nature of exercise interventions
Seven16,18-23 of these studies (88%) were randomized controlled trials; the unit of randomization and control group varied. Trials were conducted at 1 or multiple (up to 11) primary care sites. Use of more than 1 method to recruit participants—such as mailings, use of office staff to promote/recruit, advertising, and community announcements—tended to be most effective.
Intervention types included phone and mail interventions,17-23 computer-based interventions,18,19,21 visits from a community health worker,22,23 group classes,16,22,23 directly supervised physical activity sessions,16,22,23 clinician counseling,16-23 and prescription protocols (eg, written, guided action plans).17-23 Those delivering the intervention varied, and included primary care physicians,17-23 nurse practitioners or physician assistants,17-19,23,23 nutritionists,16 exercise physiologists,16 community health educators,20,22,23 and other study personnel.19,21 Specific elements of interventions that were likely to contribute to patients’ success included addressing financial or environmental/safety issues for exercise,16 use of trained office staff to provide exercise counseling,18-20,23 and offering flexibility in choice by tailoring the goals and plans to the patients’ needs and interests.17-23
The “dose” of clinician counseling varied from very brief (1 to 3 minutes of direct contact on 1 occasion) to more extended (>5 minutes of direct counseling over repeated intervals). Duration of follow-up for the 8 studies ranged from 4 months to 2 years.
Several studies designed their interventions to make the clinician counseling brief,17-20,23 in order to enhance feasibility for busy primary care settings. Three studies16,21,22 described strategies they used for tailoring the intervention to a specific culture, or for addressing issues of literacy for the written materials. Two studies16,22 reported that their study staffs were ethnically or culturally representative of the targeted population.
The difficulty of maintaining adherence to physical activity
Three studies18,19,21 reported having difficulty with attrition among their minority participants; they did not, however, include information specific to minorities in their physical activity outcomes. Studies with highest retention rates (>80%) tended to specifically address barriers to participation, including cultural issues, or they used a “lead-in” period.16,20,21,23
The studies with the best adherence and retention among black and Hispanic participants, and those participants with low educational attainment,16,21 used baseline qualitative data regarding management of health behaviors when they designed their interventions. For example, 1 study16 mentioned cultural adaptations derived from prior qualitative work—such as using program materials that extensively depicted African American individuals, families, and community settings—and using language in the intervention reflecting social values and situations relevant to African Americans.
How exercise data were reported
Six of the 8 (75%) studies16,17,19,20,22,23 reported some improvement in short-term physical activity outcomes (TABLE 2, available at www.jfponline.com); however, there was considerable heterogeneity in how these studies measured physical activity outcomes. All 8 incorporated a self-report measure of physical activity, such as the Patient-centered Assessment and Counseling for Exercise (PACE),17-19 Paffenbarger Physical Activity Questionnaire (PPAQ),17 7-day Physical Activity Recall (PAR),17,20,21,23 and other self-report recall measures to assess physical activity. (A RESOURCE LIST of these instruments is available at www.jfponline.com.) Two studies also measured “states of change,”17,20 but these states were not consistently defined.
Three studies17,20,23 included objective measures of physical activity, such as accelerometers; in these studies, there was not substantial variance in physical activity outcomes between the objective and subjective measures.
Discussion
More study needed in the underserved
This review reflects in part the difficult task of designing and implementing realistic interventions for the underserved in primary care. However, interventions must be replicated in these populations before we can necessarily assume that findings from other trials are generalizable, due to issues of access, financial resources, health literacy, beliefs, cultural differences, self-efficacy, and other logistic barriers to traditional care that disproportionately affect underserved groups.
Integrate known personal, social, and environmental factors
Several studies24-26 have explored the social, demographic, and environmental factors associated with physical activity in minority populations. These studies shed light on the reasons why clinical trials that focus on white, affluent, educated populations might not be generalizable to underserved groups.
To be maximally effective, any interventions for promoting physical activity in the underserved need to find ways to address any cultural or financial barriers, and incorporate factors associated with success. For example, among African American and Hispanic women, having lower “social role strain,” higher attendance at religious services, and a greater feeling that one’s neighborhood was safe were all associated with increased likelihood of exercise.24-26 Such studies suggest that differences in beliefs, resources, self-efficacy, prior experience, and competing life demands can all contribute to promoting physical activity in some underserved groups. Practically, such findings encourage clinicians to work with patients to help them identify sources of social support and positive influences on their health, and help them articulate internal strengths and personal attributes to succeed in behavioral change.
Despite the variations in training or means of communication in the studies we identified, 2 studies used interventions that were successful at explicitly anticipated and addressed barriers to physical activity.16,21 These 2 studies also had interventionists who represented the communities of interest, and they used cultural adaptations to promote exercise where appropriate. Thus, limited data suggest that some primary care–based programs improve physical activity in underserved patients, but the effects of communication from the primary care clinician on physical activity is lacking, consistent with other work in the field.12,27
Promising strategies include office prompts, brief counseling
Primary care clinicians face many time pressures, fiscal constraints, administrative burdens, and competing priorities; these make addressing health promotion behaviors such as physical activity quite difficult. These issues are magnified for clinicians practicing in medically underserved areas. Despite these many challenges, promising opportunities do exist.
On a systems level, practice-based systems to manage chronic diseases have been successfully developed and implemented in the primary care setting; such systems can be tested to promote physical activity, as well. These practice-based approaches include patient registry data, office prompts, and other electronic systems to promote clinician counseling. For example, studies in this review using computer-based programs in primary care offices were feasible and effective.18,19,21
Bodenheimer28 has argued for a redesign of primary care systems to more effectively address chronic conditions rather than acute care needs. Several health care systems have successfully implemented the pillars of such a redesign imperative, and they have shown convincingly the promise of addressing competing priorities, physician competence and confidence, motivation, and durability in improving patient self-management.28
At the level of the clinician-patient relationship, data suggest that patient physical activity can be increased (at least in the short term) by counseling that:
- is brief (5 minutes or less)17-20,23
- is focused/goal-oriented17-23
- is molded to the patient’s specific health needs17-23
- is delivered over multiple contacts (whether it be office visits, telephone, or group sessions)17-23
- contains a written plan to achieve goals.17-23
We do not know what “dose-response” relationship exists for primary care clinician communication with patients over the long term, and what effect repeated counseling would have on long-term sustainability of physical activity levels. This is even less clear for underserved groups. It is also unknown to what extent collaborative links with community programs might increase physical activity when added to primary care–based counseling. Future research should evaluate the optimal “dose-response” to the interventions, the effect of repeated visits and continuity of care, and the effect of community-based referrals for physical activity programs for underserved populations in primary care.
Limitations of this review
Because our inclusion criteria were strict, we omitted potentially meaningful studies that were less directly relevant to our aims. For example, there has been substantial creative community-based work with underserved populations in the US to promote physical activity, and many innovations have been designed by researchers outside the US. Results from these programs and trials should be incorporated into primary care settings working with underserved populations.
Another limitation is that our definition of “underserved” is not the only possible definition. The most marginalized underserved groups with the least access to the health care system (such as the uninsured or homeless) were more likely to be omitted from our results, because we wanted to examine physical activity programs among patients in primary care settings.
Finally, this review did not address the need to understand the connection between sustained improvements in physical activity and patient-oriented health outcomes for underserved populations.
Conclusion
Information on exercise counseling interventions in primary care for the underserved is limited: these groups have not been included in the majority of clinical trials of physical activity thus far. Physical activity interventions need to be replicated in underserved populations before we can assume their results are generalizable. Though characteristics of existing studies show promise, future research on physical activity in underserved populations should assess the effect of practice-based systems on reducing barriers and promoting physical activity, the dose-response effect of clinician counseling on physical activity outcomes, and the effect of the physician-patient relationship and continuity of care on physical activity outcomes.
Funding
This study was supported by grant 1R25CA102618 from the National Cancer Institute.
Correspondence
Jennifer K. Carroll, MD, MPH, University of Rochester School of Medicine, Family Medicine Research Programs, 1381 South Avenue, Rochester, NY 14620; jennifer_carroll@urmc.rochester.edu
1. Centers for Disease Control and Prevention. Prevalence of physical activity, including lifestyle activities among adults—United States, 2000-2001. MMWR Morb Mortal Wkly Rep 2003;52:764-769.
2. Taylor WC, Baranowski T, Young DR. Physical activity interventions in low-income, ethnic minority, and populations with disability. Am J Prev Med 1998;15:334-343.
3. Crespo CJ, Smit E, Andersen RE, Carter-Pokras O, Ainsworth BE. Race/ethnicity, social class and their relation to physical inactivity during leisure time: results from the Third National Health and Nutrition Examination Survey, 1988-1994. Am J Prev Med 2000;18:46-53.
4. Mainous AG, Diaz VA, Koopman RJ, Everett CJ. Having a regular physician and attempted weight loss after screening for hypertension or hypercholesterolemia. Int J Obes (Lond) 2005;29:223-227.
5. Honda K. Factors underlying variation in receipt of physician advice on diet and exercise: Applications of the behavioral model of health care utilization. Am J Health Promot 2004;18:370-377.
6. Taira DA, Safran DG, Seto TB, Rogers WH, Tarlov AR. The relationship between patient income and physician discussion of health risk behaviors. JAMA 1997;278:1412-1417.
7. Burton LC, Paglia MJ, German PS, Shapiro S, Damiano AM. The effect among older persons of a general preventive visit on three health behaviors: smoking, excessive alcohol drinking, and sedentary lifestyle. The Medicare Preventive Services research Team. Prev Med 1995;24:492-497.
8. Norris SL, Grothaus LC, Buchner DM, Pratt M. Effectiveness of physician-based assessment and counseling for exercise in a staff model HMO. Prev Med 2000;30:513-523.
9. Swinburn BA, Walter LG, Arroll B, Tilyard MW, Russell DG. The green prescription study: a randomized controlled trial of written exercise advice provided by general practitioners. Am J Public Health 1998;88:288-291.
10. Imperial Cancer Research Fund OXCHECK Study Group. Effectiveness of health checks conducted by nurses in primary care: final results of the OXCHECK study. BMJ 1995;310:1099-1104.
11. Bull FC, Kreuter MW, Scharff DP. Effects of tailored, personalized and general health messages on physical activity. Patient Educ Couns 1999;36:181-192.
12. Yancey AK, Kumanyika SK, Ponce NA, McCarthy WM, Fielding JE. Population-based interventions engaging communities of color in healthy eating and active living: a review. Prev Chron Dis 2004;1:1-18.
13. Eden KB, Orleans CT, Mulrow CD, Pender NJ, Teutsch SM. Does counseling by clinicians improve physical activity? A summary of the evidence for the US Preventive Services Task Force. Ann Intern Med 2002;137:208-215.
14. Eakin EG, Glasgow RE, Riley KM. Review of primary care-based physical activity intervention studies: effectiveness and implications for practice and future research. J Fam Pract 2000;49:158-168.
15. Ebell Mh, Siwek J, Weiss BD, et al. Simplifying the language of evidence to improve patient care: Strength of recommendation taxonomy (SORT): a patient-centered approach to grading evidence in medical literature. J Fam Pract 2004;53:111-120.
16. Agurs-Collins TD, Kumanyika SK, Ten Have TR, Adams-Campbell LL. A randomized controlled trial of weight reduction and exercise for diabetes management in older African-American subjects. Diabetes Care 1997;20:1503-1511.
17. Calfas KJ, Long BJ, Sallis JF, Wooten WJ, Pratt M, Patrick K. A controlled trial of physician counseling to promote the adoption of physical activity. Prev Med 1996;25:225-233.
18. Calfas KJ, Sallis JF, Zabinski MF, et al. Preliminary evaluation of a multi-component program for nutrition and physical activity change in primary care: PACE+ for adults. Prev Med 2002;34:153-161.
19. Patrick K, Sallis JF, Prochaska JJ, et al. A multicomponent program for nutrition and physical activity change in primary care: PACE+ for adolescents. Arch Pediatr Adolesc Med 2001;155:940-946.
20. Pinto BM, Goldstein MG, Ashba J, Sciamanna CN, Jette A. Randomized controlled trial of physical activity counseling for older primary care patients. Am J Prev Med 2005;29:247-255.
21. Staten LK, Gregory-Mercado KY, Ranger-Moore J, et al. Provider counseling, health education, and community health workers: The arizona WISEWOMAN project. J Womens Health (Larchmt) 2004;13:547-556.
22. Saelens BE, Sallis JF, Wilfley DE, Patrick K, Cella JA, Buchta R. Behavioral weight control for overweight adolescents initiated in primary care. Obesity Res 2002;10:22-32.
23. Writing Group for the Activity Counseling Trial Research Group. Effects of physical activity counseling in primary care: The activity counseling Trial: A randomized controlled trial. JAMA 2001;286:677-687.
24. Wilbur J, Chandler PJ, Dancy B, Lee H. Correlates of physical activity in urban Midwestern Latinas. Am J Prev Med 2003;25:69-76.
25. Wilbur J, Chandler PJ, Dancy B, Lee H. Correlates of physical activity in urban Midwestern African-American women. Am J Prev Med 2003;25:45-52.
26. Rohm YD, Voorhees CC. Personal, social, and environmental correlates of physical activity in urban african-american women. Am J Prev Med 2003;25:38-44.
27. Yancey AK. Building capacity to prevent and control chronic disease in underserved communities: Expanding the wisdom of WISEWOMAN in intervening at the environmental level. J Womens Health (Larchmt) 2004;13:644-649.
28. Bodenheimer T, Wagner EH, Grumbach K. Improving primary care for patients with chronic illness: The chronic care model, Part 2. JAMA 2002;288:1909-1914.
- Use focused, brief (2–3 minute) physical activity counseling with patients (B).
- Have large-print, easy-to-understand program materials available to supplement your discussion (B). Provide patients with a simple written plan of their physical activity goals (B). Focus on a limited number of concepts to avoid information overload (B).
- Address patients’ financial and logistical barriers to participation and adherence (B).
- Encourage flexibility in patients’ choices for exercise, and incorporate cultural adaptations (such as preferences for music, dance, or group activities) where appropriate (B).
- Use trained support staff, preferably representing the community of interest, to promote physical activity in your patients (B).
Strength of recommendation (SOR)
- Good-quality patient-oriented evidence
- Inconsistent or limited-quality patient-oriented evidence
- Consensus, usual practice, opinion, disease-oriented evidence, case series
Fewer than half of all Americans get sufficient physical activity, defined as 30 minutes or more per day, at least 5 times per week.1 The need to increase physical activity applies particularly to underserved populations: they are even less likely to get enough physical activity, and are thus even more likely to suffer greater burden of disease.2,3
The purpose of this systematic review was to assess clinical trials of clinician-initiated counseling interventions for promoting physical activity in under-served populations. We define under-served populations as individuals from minority ethnic backgrounds (such as African Americans, Hispanics, and Asian Americans), or vulnerable populations such as people with low educational attainment, low income, lack of insurance, or those residing in rural communities.
Primary care interventions are linked to a change in habits
Primary care physicians can have a significant impact on their patients’ physical activity. Individuals with a regular primary care physician are more likely to report attempts to change their physical activity habits.4 However, underserved populations are more likely to have inconsistent access to medical care, which may contribute to their greater risk of conditions linked to inadequate physical activity, such as diabetes, hypertension, and obesity.
Only about 25% of patients in primary care settings report receiving any counseling on physical activity.5 Those who are middle-aged or have a baccalaureate degree or higher are more likely to report such advice; African Americans and foreign-born immigrants are less likely to report it.
A study by Taira et al6 examined the relationship between patient income and discussion of health risk behaviors. Low-income patients were more likely to be obese and smoke than high-income patients; however, physicians were less likely to discuss diet and exercise with low-income patients. Among all the patients with whom some discussion occurred in this study, low-income patients were much more likely to attempt to change behavior based on physician advice than were high-income patients.
Clinical trials within7,8 and outside the US9-11 support the potential value of physical activity counseling in primary care. In these studies, as little as 3 to 5 minutes of patient-clinician communication about physical activity was linked to short-term improvement in patients’ exercise habits. As few as 2 or 3 office visits over 6 months were associated with increases in patients’ physical activity levels up to 1 year later. Other features that contributed to their success included having a brief (<3 minutes) counseling component for clinicians, supplementing the counseling with a written exercise prescription, having follow-up contact, and tailoring the counseling to patients’ needs and concerns.
These results are promising for primary care clinicians, whose longitudinal relationships with their patients afford them repeated opportunities to intervene to promote physical activity.
Few studies have focused on the underserved
A review by Taylor et al2 of physical activity interventions in low-income, ethnic minority, or disabled populations identified 14 community-based studies, mostly with quasi-experimental “pre/post” study designs. Ten studies included ethnic minorities, but physical activity was documented in just 2 studies at baseline, and these 2 studies did not include any postintervention follow-up. None of the 10 interventions was conducted in a primary care setting.
Another recent review12 found that studies that were ethnically inclusive placed greater emphasis on involving communities and building coalitions right from study inception, and they tailored messages (and messengers) that were culturally specific. Several of these studies showed better outcomes among ethnic minority participants than the white participants they sampled.
Taken together, previous reviews have examined the effectiveness of primary care interventions for the general population,13,14 as well as community-based programs for underserved populations.2 However, little information exists about effective physical activity counseling strategies for underserved groups in primary care.
Methods
Looking for studies in underserved populations
We conducted a systematic review of the literature involving clinical trials in the US, looking for trials where counseling interventions are initiated by primary care clinicians, and that assessed behavioral change related to physical activity.
Inclusion criteria
TABLE 1 shows the inclusion criteria and search terms for the literature review. We searched Ovid, Medline, CINAHL, PsycINFO, PubMed, Cochrane, and HealthSTAR for studies published between 1966 and 2005. We also searched bibliographies of retrieved articles, and contacted experts in the field in an effort to obtain other relevant data.
The principal investigator (JKC) reviewed titles and abstracts of all potentially relevant articles to determine whether they met eligibility criteria. Studies that met the criteria were retrieved and abstracted.
Using these predefined criteria, data were extracted from each eligible article. Studies were also rated according to the Strength of Recommendation Taxonomy (SORT), because of its emphasis on patient-oriented outcomes and the quality, quantity, and consistency of evidence.15
TABLE 1
Inclusion criteria and search terms
| For inclusion, studies must have: | ||
| ||
| The key terms used for the literature search were: | ||
| ambulatory care | health communication | program evaluation |
| behavioral interventions | health promotion | socioeconomic factors |
| behavior therapy | intervention studies | underserved populations |
| body mass index | obesity | urban populations |
| community health | outpatient clinic | weight control |
| exercise | physical activity | weight loss |
| family physicians | poverty | weight management |
| health behavior change | primary health care | |
Results
6 of 8 studies report increases in physical activity
We reviewed a total of 253 titles and abstracts. Eight studies16-23 met our inclusion criteria. We were not able to locate any clinical trials that both 1) examined the effect of primary care clinician counseling on physical activity outcomes, and 2) had a study population focused on an underserved group. TABLE 2 (available at www.jfponline.com) shows the characteristics of these 8 studies.
Although we sought trials that defined “primary care clinician” as a professional—such as MD, nurse practitioner (NP), or physician assistant (PA)—who provides longitudinal primary health care, several of these studies considered dieticians, exercise physiologists, or health care workers as primary care clinicians.
Only 1 study20 examined physical activity counseling with an intervention that incorporated a follow-up visit by the primary care clinician, and looked at the long-term effect on physical activity as an outcome. Thus, the degree to which the clinician’s counseling influenced the physical activity outcome in these studies is unclear.
Identifying underserved groups
Information on race or ethnicity (which tended to be reported as a single variable), level of education, and income of participants was reported in the demographic data of all studies’ results, but relationships between these variables and physical activity outcomes were not consistently reported. One study23 stratified participants by race/ethnicity and health center; 2 studies16,21 reported analyses and findings for participants according to ethnicity, income, and educational level, as that was their focus.
Overall, however, it is not clear to what extent the interventions succeeded for various underserved groups, even if they were included as participants.
Study designs and the nature of exercise interventions
Seven16,18-23 of these studies (88%) were randomized controlled trials; the unit of randomization and control group varied. Trials were conducted at 1 or multiple (up to 11) primary care sites. Use of more than 1 method to recruit participants—such as mailings, use of office staff to promote/recruit, advertising, and community announcements—tended to be most effective.
Intervention types included phone and mail interventions,17-23 computer-based interventions,18,19,21 visits from a community health worker,22,23 group classes,16,22,23 directly supervised physical activity sessions,16,22,23 clinician counseling,16-23 and prescription protocols (eg, written, guided action plans).17-23 Those delivering the intervention varied, and included primary care physicians,17-23 nurse practitioners or physician assistants,17-19,23,23 nutritionists,16 exercise physiologists,16 community health educators,20,22,23 and other study personnel.19,21 Specific elements of interventions that were likely to contribute to patients’ success included addressing financial or environmental/safety issues for exercise,16 use of trained office staff to provide exercise counseling,18-20,23 and offering flexibility in choice by tailoring the goals and plans to the patients’ needs and interests.17-23
The “dose” of clinician counseling varied from very brief (1 to 3 minutes of direct contact on 1 occasion) to more extended (>5 minutes of direct counseling over repeated intervals). Duration of follow-up for the 8 studies ranged from 4 months to 2 years.
Several studies designed their interventions to make the clinician counseling brief,17-20,23 in order to enhance feasibility for busy primary care settings. Three studies16,21,22 described strategies they used for tailoring the intervention to a specific culture, or for addressing issues of literacy for the written materials. Two studies16,22 reported that their study staffs were ethnically or culturally representative of the targeted population.
The difficulty of maintaining adherence to physical activity
Three studies18,19,21 reported having difficulty with attrition among their minority participants; they did not, however, include information specific to minorities in their physical activity outcomes. Studies with highest retention rates (>80%) tended to specifically address barriers to participation, including cultural issues, or they used a “lead-in” period.16,20,21,23
The studies with the best adherence and retention among black and Hispanic participants, and those participants with low educational attainment,16,21 used baseline qualitative data regarding management of health behaviors when they designed their interventions. For example, 1 study16 mentioned cultural adaptations derived from prior qualitative work—such as using program materials that extensively depicted African American individuals, families, and community settings—and using language in the intervention reflecting social values and situations relevant to African Americans.
How exercise data were reported
Six of the 8 (75%) studies16,17,19,20,22,23 reported some improvement in short-term physical activity outcomes (TABLE 2, available at www.jfponline.com); however, there was considerable heterogeneity in how these studies measured physical activity outcomes. All 8 incorporated a self-report measure of physical activity, such as the Patient-centered Assessment and Counseling for Exercise (PACE),17-19 Paffenbarger Physical Activity Questionnaire (PPAQ),17 7-day Physical Activity Recall (PAR),17,20,21,23 and other self-report recall measures to assess physical activity. (A RESOURCE LIST of these instruments is available at www.jfponline.com.) Two studies also measured “states of change,”17,20 but these states were not consistently defined.
Three studies17,20,23 included objective measures of physical activity, such as accelerometers; in these studies, there was not substantial variance in physical activity outcomes between the objective and subjective measures.
Discussion
More study needed in the underserved
This review reflects in part the difficult task of designing and implementing realistic interventions for the underserved in primary care. However, interventions must be replicated in these populations before we can necessarily assume that findings from other trials are generalizable, due to issues of access, financial resources, health literacy, beliefs, cultural differences, self-efficacy, and other logistic barriers to traditional care that disproportionately affect underserved groups.
Integrate known personal, social, and environmental factors
Several studies24-26 have explored the social, demographic, and environmental factors associated with physical activity in minority populations. These studies shed light on the reasons why clinical trials that focus on white, affluent, educated populations might not be generalizable to underserved groups.
To be maximally effective, any interventions for promoting physical activity in the underserved need to find ways to address any cultural or financial barriers, and incorporate factors associated with success. For example, among African American and Hispanic women, having lower “social role strain,” higher attendance at religious services, and a greater feeling that one’s neighborhood was safe were all associated with increased likelihood of exercise.24-26 Such studies suggest that differences in beliefs, resources, self-efficacy, prior experience, and competing life demands can all contribute to promoting physical activity in some underserved groups. Practically, such findings encourage clinicians to work with patients to help them identify sources of social support and positive influences on their health, and help them articulate internal strengths and personal attributes to succeed in behavioral change.
Despite the variations in training or means of communication in the studies we identified, 2 studies used interventions that were successful at explicitly anticipated and addressed barriers to physical activity.16,21 These 2 studies also had interventionists who represented the communities of interest, and they used cultural adaptations to promote exercise where appropriate. Thus, limited data suggest that some primary care–based programs improve physical activity in underserved patients, but the effects of communication from the primary care clinician on physical activity is lacking, consistent with other work in the field.12,27
Promising strategies include office prompts, brief counseling
Primary care clinicians face many time pressures, fiscal constraints, administrative burdens, and competing priorities; these make addressing health promotion behaviors such as physical activity quite difficult. These issues are magnified for clinicians practicing in medically underserved areas. Despite these many challenges, promising opportunities do exist.
On a systems level, practice-based systems to manage chronic diseases have been successfully developed and implemented in the primary care setting; such systems can be tested to promote physical activity, as well. These practice-based approaches include patient registry data, office prompts, and other electronic systems to promote clinician counseling. For example, studies in this review using computer-based programs in primary care offices were feasible and effective.18,19,21
Bodenheimer28 has argued for a redesign of primary care systems to more effectively address chronic conditions rather than acute care needs. Several health care systems have successfully implemented the pillars of such a redesign imperative, and they have shown convincingly the promise of addressing competing priorities, physician competence and confidence, motivation, and durability in improving patient self-management.28
At the level of the clinician-patient relationship, data suggest that patient physical activity can be increased (at least in the short term) by counseling that:
- is brief (5 minutes or less)17-20,23
- is focused/goal-oriented17-23
- is molded to the patient’s specific health needs17-23
- is delivered over multiple contacts (whether it be office visits, telephone, or group sessions)17-23
- contains a written plan to achieve goals.17-23
We do not know what “dose-response” relationship exists for primary care clinician communication with patients over the long term, and what effect repeated counseling would have on long-term sustainability of physical activity levels. This is even less clear for underserved groups. It is also unknown to what extent collaborative links with community programs might increase physical activity when added to primary care–based counseling. Future research should evaluate the optimal “dose-response” to the interventions, the effect of repeated visits and continuity of care, and the effect of community-based referrals for physical activity programs for underserved populations in primary care.
Limitations of this review
Because our inclusion criteria were strict, we omitted potentially meaningful studies that were less directly relevant to our aims. For example, there has been substantial creative community-based work with underserved populations in the US to promote physical activity, and many innovations have been designed by researchers outside the US. Results from these programs and trials should be incorporated into primary care settings working with underserved populations.
Another limitation is that our definition of “underserved” is not the only possible definition. The most marginalized underserved groups with the least access to the health care system (such as the uninsured or homeless) were more likely to be omitted from our results, because we wanted to examine physical activity programs among patients in primary care settings.
Finally, this review did not address the need to understand the connection between sustained improvements in physical activity and patient-oriented health outcomes for underserved populations.
Conclusion
Information on exercise counseling interventions in primary care for the underserved is limited: these groups have not been included in the majority of clinical trials of physical activity thus far. Physical activity interventions need to be replicated in underserved populations before we can assume their results are generalizable. Though characteristics of existing studies show promise, future research on physical activity in underserved populations should assess the effect of practice-based systems on reducing barriers and promoting physical activity, the dose-response effect of clinician counseling on physical activity outcomes, and the effect of the physician-patient relationship and continuity of care on physical activity outcomes.
Funding
This study was supported by grant 1R25CA102618 from the National Cancer Institute.
Correspondence
Jennifer K. Carroll, MD, MPH, University of Rochester School of Medicine, Family Medicine Research Programs, 1381 South Avenue, Rochester, NY 14620; jennifer_carroll@urmc.rochester.edu
1. Centers for Disease Control and Prevention. Prevalence of physical activity, including lifestyle activities among adults—United States, 2000-2001. MMWR Morb Mortal Wkly Rep 2003;52:764-769.
2. Taylor WC, Baranowski T, Young DR. Physical activity interventions in low-income, ethnic minority, and populations with disability. Am J Prev Med 1998;15:334-343.
3. Crespo CJ, Smit E, Andersen RE, Carter-Pokras O, Ainsworth BE. Race/ethnicity, social class and their relation to physical inactivity during leisure time: results from the Third National Health and Nutrition Examination Survey, 1988-1994. Am J Prev Med 2000;18:46-53.
4. Mainous AG, Diaz VA, Koopman RJ, Everett CJ. Having a regular physician and attempted weight loss after screening for hypertension or hypercholesterolemia. Int J Obes (Lond) 2005;29:223-227.
5. Honda K. Factors underlying variation in receipt of physician advice on diet and exercise: Applications of the behavioral model of health care utilization. Am J Health Promot 2004;18:370-377.
6. Taira DA, Safran DG, Seto TB, Rogers WH, Tarlov AR. The relationship between patient income and physician discussion of health risk behaviors. JAMA 1997;278:1412-1417.
7. Burton LC, Paglia MJ, German PS, Shapiro S, Damiano AM. The effect among older persons of a general preventive visit on three health behaviors: smoking, excessive alcohol drinking, and sedentary lifestyle. The Medicare Preventive Services research Team. Prev Med 1995;24:492-497.
8. Norris SL, Grothaus LC, Buchner DM, Pratt M. Effectiveness of physician-based assessment and counseling for exercise in a staff model HMO. Prev Med 2000;30:513-523.
9. Swinburn BA, Walter LG, Arroll B, Tilyard MW, Russell DG. The green prescription study: a randomized controlled trial of written exercise advice provided by general practitioners. Am J Public Health 1998;88:288-291.
10. Imperial Cancer Research Fund OXCHECK Study Group. Effectiveness of health checks conducted by nurses in primary care: final results of the OXCHECK study. BMJ 1995;310:1099-1104.
11. Bull FC, Kreuter MW, Scharff DP. Effects of tailored, personalized and general health messages on physical activity. Patient Educ Couns 1999;36:181-192.
12. Yancey AK, Kumanyika SK, Ponce NA, McCarthy WM, Fielding JE. Population-based interventions engaging communities of color in healthy eating and active living: a review. Prev Chron Dis 2004;1:1-18.
13. Eden KB, Orleans CT, Mulrow CD, Pender NJ, Teutsch SM. Does counseling by clinicians improve physical activity? A summary of the evidence for the US Preventive Services Task Force. Ann Intern Med 2002;137:208-215.
14. Eakin EG, Glasgow RE, Riley KM. Review of primary care-based physical activity intervention studies: effectiveness and implications for practice and future research. J Fam Pract 2000;49:158-168.
15. Ebell Mh, Siwek J, Weiss BD, et al. Simplifying the language of evidence to improve patient care: Strength of recommendation taxonomy (SORT): a patient-centered approach to grading evidence in medical literature. J Fam Pract 2004;53:111-120.
16. Agurs-Collins TD, Kumanyika SK, Ten Have TR, Adams-Campbell LL. A randomized controlled trial of weight reduction and exercise for diabetes management in older African-American subjects. Diabetes Care 1997;20:1503-1511.
17. Calfas KJ, Long BJ, Sallis JF, Wooten WJ, Pratt M, Patrick K. A controlled trial of physician counseling to promote the adoption of physical activity. Prev Med 1996;25:225-233.
18. Calfas KJ, Sallis JF, Zabinski MF, et al. Preliminary evaluation of a multi-component program for nutrition and physical activity change in primary care: PACE+ for adults. Prev Med 2002;34:153-161.
19. Patrick K, Sallis JF, Prochaska JJ, et al. A multicomponent program for nutrition and physical activity change in primary care: PACE+ for adolescents. Arch Pediatr Adolesc Med 2001;155:940-946.
20. Pinto BM, Goldstein MG, Ashba J, Sciamanna CN, Jette A. Randomized controlled trial of physical activity counseling for older primary care patients. Am J Prev Med 2005;29:247-255.
21. Staten LK, Gregory-Mercado KY, Ranger-Moore J, et al. Provider counseling, health education, and community health workers: The arizona WISEWOMAN project. J Womens Health (Larchmt) 2004;13:547-556.
22. Saelens BE, Sallis JF, Wilfley DE, Patrick K, Cella JA, Buchta R. Behavioral weight control for overweight adolescents initiated in primary care. Obesity Res 2002;10:22-32.
23. Writing Group for the Activity Counseling Trial Research Group. Effects of physical activity counseling in primary care: The activity counseling Trial: A randomized controlled trial. JAMA 2001;286:677-687.
24. Wilbur J, Chandler PJ, Dancy B, Lee H. Correlates of physical activity in urban Midwestern Latinas. Am J Prev Med 2003;25:69-76.
25. Wilbur J, Chandler PJ, Dancy B, Lee H. Correlates of physical activity in urban Midwestern African-American women. Am J Prev Med 2003;25:45-52.
26. Rohm YD, Voorhees CC. Personal, social, and environmental correlates of physical activity in urban african-american women. Am J Prev Med 2003;25:38-44.
27. Yancey AK. Building capacity to prevent and control chronic disease in underserved communities: Expanding the wisdom of WISEWOMAN in intervening at the environmental level. J Womens Health (Larchmt) 2004;13:644-649.
28. Bodenheimer T, Wagner EH, Grumbach K. Improving primary care for patients with chronic illness: The chronic care model, Part 2. JAMA 2002;288:1909-1914.