User login
For Some Inpatients with Cirrhosis, Liver Transplant Is the only Cure

Bilal Hameed, MD, assistant professor of medicine in the Division of Gastroenterology at the University of California San Francisco, reviewed a wide range of serious and life-threatening medical complications resulting from cirrhosis during the annual UCSF Management of the Hospitalized Patient conference.
Recurring complications of cirrhosis can include ascites, acute variceal and portal hypertensive bleeds, hepatic encephalopathy, bacterial peritonitis, acute renal failure, sepsis, and a host of other infections. In many cases, options for treatment are limited as the patient develops decompensated cirrhosis.
Poor prognosis makes it important to urge these patients to get on a liver transplantation list, sooner rather than later, Dr. Hameed told hospitalists attending his small-group session. “Liver transplantation has changed this field,” he said. “Call us to see if your patient might be a candidate.”
Unlike kidney and some other transplant lists, where patients must wait for their turn, liver transplants are assigned based on need, as reflected in the patient’s Model for End-Stage Liver Disease (MELD) score, an objective clinical scale derived from blood values.
“Patients do really well on transplants, with 60% survival at 10 years,” he said. He also noted patients with advanced, decompensated disease who do not find a place on the transplant list might instead be candidates for palliative care or hospice referral.
Many conditions, such as infections, can still be managed with timely treatment, returning the patient back to baseline. “The risk of infection is very high. Starting antibiotics early can help,” Dr. Hameed said.
And for conditions where fluid volume is an issue, including spontaneous bacterial peritonitis, hypernatremia, or intrinsic renal disease, albumin is recommended as the evidence-based treatment of choice. “Please don’t over-transfuse these patients,” he said.
Jeannie Yip, MD, a nocturnist at Kaiser Foundation Hospital in Oakland, Calif., said that she frequently admits these kinds of patients to her hospital. For her, Dr. Hameed’s albumin recommendation was the most important lesson.
“I was still using IV fluids in patients coming in with volume depletion, to rule out acute renal failure. It’s always a dilemma if you have a hypotensive patient with low sodium and low blood pressure, who tells you: ‘I haven’t eaten for a week,’” she explained. “It’s been hard for me not to give them fluids. But after listening to this talk, I see that I should give albumin, instead.” TH

New melphalan formulation denied approval
![]()
Photo by Chad McNeeley
The US Food and Drug Administration (FDA) has said that, at present, it cannot approve a propylene glycol-free melphalan formulation (Evomela) for use in patients with multiple myeloma (MM).
Spectrum Pharmaceuticals is seeking approval for Evomela as a high-dose conditioning treatment for MM patients undergoing hematopoietic stem cell transplant (HSCT) and for palliative treatment in MM patients for whom oral therapy is not appropriate.
The FDA issued a Complete Response Letter stating that the new drug application (NDA) for Evomela cannot be approved in its present form.
However, the FDA did not identify any clinical deficiency in the NDA package.
“We will work swiftly with the FDA to address the Complete Response Letter,” said Rajesh C. Shrotriya, MD, chairman and chief executive officer of Spectrum Pharmaceuticals. “We remain committed to bringing Evomela to the market for patients and plan to work closely with the FDA.”
About Evomela
Evomela is a Captisol-enabled, propylene glycol-free melphalan formulation. This formulation eliminates the need to use a propylene glycol-containing custom diluent, which is required with other intravenous melphalan formulations and has been reported to cause renal and cardiac side effects.
The use of Captisol technology to reformulate melphalan is reported to improve the drug’s stability, extending its use time to 5 hours. This is anticipated to simplify preparation and administration logistics and allow for slower infusion rates and longer administration durations for pre-transplant chemotherapy.
Captisol is a patent-protected, chemically modified cyclodextrin with a structure designed to optimize the solubility and stability of drugs.
Spectrum Pharmaceuticals gained global development and commercialization rights to Evomela from Ligand Pharmaceuticals Incorporated in March 2013. Spectrum assumed responsibility for completing the pivotal phase 2 clinical trial and was responsible for filing the NDA. Spectrum filed the NDA in December 2014, and the FDA accepted the application the following March.
The FDA has granted Evomela orphan drug designation for use as a high-dose conditioning regimen for MM patients undergoing HSCT.
Phase 2 study
Researchers have evaluated Evomela in a phase 2, multicenter trial. Initial results from this trial (phase 2a) were published in Bone Marrow Transplantation in June 2014. Phase 2b results were published in Biology of Blood and Marrow Transplantation last month.
The latest publication includes data on 61 patients. Fifty-six had newly diagnosed MM, and 5 had relapsed MM following prior HSCT. The patients received Evomela at 200 mg/m2 given as 2 doses on Day -3 and Day -2 prior to HSCT (Day 0).
Efficacy was assessed by clinical response at Day +100. According to investigator assessment, the overall response rate was 95%, and the complete response (CR) rate was 31%.
According to independent pathology review, the overall response rate was 100%, and the CR rate was 21%. The lower rate of confirmed CRs in the independent review was due to missing data.
All 5 patients who had previously relapsed from a prior HSCT responded to Evomela.
All patients in the study achieved myeloablation with a median of 5 days post-HSCT. All patients had successful neutrophil and platelet engraftment at a median of 12 days and 13 days post-HSCT, respectively.
Treatment-related mortality was 0%, and non-hematologic adverse events were mostly grade 1 and 2 in severity. The incidence of grade 3 mucositis and grade 3 stomatitis were 10% and 5%, respectively, with no grade 4 mucositis or stomatitis reported.
Twenty percent of patients experienced treatment-emergent serious adverse events, most of which were grade 3 and consisted of events commonly reported in patients undergoing myeloablative chemotherapy. No new safety signals were identified. ![]()
FDA advisory committee recommends approval of gout drug lesinurad, with caveats
This article was updated on 10/27/15.
Members of the Food and Drug Administration’s Arthritis Advisory Committee have voted in favor of recommending approval of the investigational uricosuric drug lesinurad at 200 mg daily for the proposed indication of treatment of hyperuricemia associated with gout in combination with a xanthine oxidase inhibitor, such as allopurinol or febuxostat.
The committee’s 10-4 vote on recommending approval came with much discussion over the benefit-to-risk analysis of lesinurad. Members voted 14-0 that the data in the four pivotal phase III trials submitted to the FDA contained enough evidence of a clinically meaningful beneficial effect of lesinurad in combination with a xanthine oxidase inhibitor (XOI) in the treatment of hyperuricemia associated with gout. However, committee members were much less certain of lesinurad’s safety profile, which indicated a narrow therapeutic index, and voted 7-6 in favor of adequate safety data to support approval, with 1 abstention.
Lesinurad 200 mg daily lowered serum uric acid (sUA) levels 1.1-1.3 mg/dL on top of what is already achieved with an XOI in its pivotal phase III trials, but it did not consistently improve patient outcomes, such as reducing gout flares, resolving tophi, and improving Health Assessment Questionnaire-Disability Index scores.
The FDA and the developer of lesinurad, Ardea Biosciences, agreed before the advisory committee meeting not to consider a 400-mg dose of the drug for marketing because it was associated with an increased incidence of renal adverse events (including serious renal AEs, serum creatinine elevations, and kidney stone AEs), compared with placebo. Although, lesinurad 200 mg was not associated with an increased incidence of serious renal or kidney stone AEs, it was associated with a smaller increase in the incidence of overall renal AE and serum creatinine elevations, which suggested dose-dependent toxicity. An imbalance in major adverse cardiovascular event incidence and exposure-adjusted incidence also was observed with lesinurad 400 mg, compared with 200 mg or placebo, although there were a small number of events.
Overall, the average concentration of lesinurad in the studies was higher with 400 mg, compared with 200 mg, but the exposure for the two doses was largely overlapping, raising questions about whether the safety profile of the 200-mg dose will be consistent if used in a larger population with more variability, the FDA said.
Two of the four pivotal phase III clinical trials of lesinurad involved patients who had been taking at least 300 mg/day allopurinol (200 mg/day in patients with estimated creatinine clearance (CrCl) of less than 60 mL/min at baseline) for at least 8 weeks and still had a sUA level of 6.5 mg/dL or greater at the screening visit (and greater than 6.0 mg/dL at the day 7 visit) and also had at least two gout flares in the preceding 12 months. They were randomized to receive placebo, lesinurad 200 mg, or lesinurad 400 mg daily in addition to their background allopurinol for 12 months.
The third study involved the same doses of lesinurad and placebo over a 12-month time frame but instead had lesinurad added on to a background of febuxostat 80 mg and required that sUA had to be at least 8 mg/dL in patients not taking urate lowering therapy (ULT) and at least 6 mg/dL in patients who were on ULT previously. Patients also had to have at least one measurable tophus on the hands/wrists and/or feet/ankles at least 5 mm in width and up to 20 mm in length.
The fourth study was a 6-month study of lesinurad 400 mg monotherapy, compared with placebo, in subjects with gout who had intolerance or contraindication to treatment with an XOI.
Committee members who voted in favor of recommending approval called for postmarketing studies that showed that the drug did indeed improve clinical outcomes such as reducing gout flares and resolution of tophi; long-term safety studies of renal and cardiovascular adverse events, including studies in patients with comorbidities commonly occurring in patients with gout; and structured, specific guidance to providers on who should receive the drug and how prescribers should handle increases in serum creatinine levels during treatment.
Lesinurad inhibits the function of multiple carrier proteins that transport uric acid in the renal proximal tubule epithelium, including uric acid transporter 1 (URAT1) and organic anion transporters 1, 3 and 4.
The FDA is not obligated to follow the recommendations of its advisory committee panels.
NCCN unveils 'Evidence Blocks' to facilitate treatment discussions
SAN FRANCISCO – The National Comprehensive Cancer Network (NCCN) has introduced an easy-to-use visual tool called Evidence Blocks to help physicians and patients compare various treatment options and individualize the selection among them.
“This information can serve as a starting point for shared decision making between the patient and health care team based on individual patients’ value systems,” chief executive officer Dr. Robert W. Carlson said at the NCCN Annual Congress: Hematologic Malignancies, where the tool was unveiled in a session and related press conference.

The first two NCCN guidelines to incorporate the Evidence Blocks – those for multiple myeloma and chronic myelogenous leukemia – were released at the same time. The organization hopes to incorporate them into all of its guidelines by early 2017, he said.
Development of the Evidence Blocks
The NCCN developed the Evidence Blocks to address requests from various stakeholders, according to Dr. Carlson. Guideline users wanted to know more about the rationale behind recommended therapies, asked for inclusion of information on costs, and sought an aid that would allow patients to make decisions based on their individual values.
“The patient perception of value is what should be most important to us,” he commented. “But even among patients, the concept of value differs greatly from patient to patient,” based on factors such as age, comorbidities, treatment goals, and health insurance coverage.
Each Evidence Block graphically displays five measures of information on a recommended therapy: efficacy, safety, quality of the evidence supporting the recommendation, consistency of the evidence supporting the recommendation, and affordability. Each column in the block represents one measure.
Blue shading indicates panelists’ average numeric score for the therapy on that measure rounded to the nearest integer, ranging from 1 (least favorable) to 5 (most favorable). Therefore, the more shading a therapy has, the more favorable its score.
The Evidence Blocks are added to the guidelines and aligned vertically on pages. “This display of the information graphically allows for very efficient scanning of multiple options for therapy. Comparisons across several regimens can be done very quickly and intuitively,” Dr. Carlson noted.
“We believe that the presentation of this type of information allows the health care provider and patient to make their own judgments of the value of specific interventions,” he added.
The affordability measure has generated the most discussion among panelists and stakeholders, according to Dr. Carlson. For this measure, panelists estimated the total cost of care for a therapy, including the costs of drugs, administration, required supportive care, toxicity monitoring, and care associated with management of toxicity. Scores range from very expensive to very inexpensive.
“We don’t use a dollar amount. Rather, it’s sort of what’s the total cost to society, if you will, of the medical intervention part of this,” he explained. “It’s important to understand that these estimates are not necessarily what a patient would pay because many patients have insurance programs that cover all of this cost.… However, we felt it was important to give patients as well as providers an estimate of what the overall magnitude of expense is because there are patients who have huge deductibles, there’s the doughnut hole within Medicare, and there are patients who have no insurance.”
The Evidence Blocks may help address a “conspiracy of silence” between physicians and patients when it comes to discussing treatment costs, whereby neither party wants to bring up this thorny issue, according to Dr. Carlson. “The Evidence Blocks demystify the discussion of cost because the affordability issue is there in front of you. So it gives people permission to talk about cost and affordability.”
It should be relatively easy to teach patients to use the Evidence Blocks. “I think you’ll find your patients will actually be interested in this and that they will not have as much difficulty interpreting this as you think they will, because the patient advocacy groups and the patient advocates that we have spoken with about this, they get this almost instantly,” he said.
Oncologist perspective
There is a critical need for tools such as the Evidence Blocks in making treatment decisions today, according to Dr. George Somlo, professor in the department of medical oncology and therapeutics research at the City of Hope Comprehensive Cancer Center in Duarte, Calif., and also a member of the NCCN multiple myeloma and breast cancer guideline panels.

Treatment options for multiple myeloma, as for many cancers, have exploded in the past few decades, he noted. “How do you go from making sense of having two drugs with a very poor outcome predicted to having literally dozens of agents approved and used in combination, and in essence being at the verge of curing patients with multiple myeloma?”
Dr. Somlo agreed that inclusion of costs in the Evidence Blocks would likely be beneficial as a conversation starter, recalling, “I’ve had patients who did not fill their prescription for a potentially curative medication because they were worried about the $2,500 or $3,500 copay.”
Patient-physician discussion will be important when it comes to using information from the new tool, he said. For example, in the NCCN guideline for multiple myeloma, some of the first-line regimens have identical Evidence Blocks; thus, consideration of factors such as comorbidities will become important.
“This kind of evidence-based scoring system can guide that kind of discussion with the patient and can tailor the individual therapeutic regimens,” he concluded.
Patient perspective
Breast cancer survivor Marta Nichols, who is vice president of investor relations at GoDaddy and a member of the California Breast Cancer Research Council based in San Francisco, welcomed the Evidence Blocks as a tool that will allow patients to make more informed decisions according to what matters most to them.
Only 33 years old at diagnosis, she and her husband had just begun to think about starting a family. “So my primary concern coming into my physician’s office was my fertility and what impact the treatment would have on my fertility. Certainly most physicians are concerned with efficacy – they want to see you survive. My concern was not just surviving, but also thriving and being able to give birth to children down the line,” she explained.
Patients today are overwhelmed not only by their cancer diagnosis, but also by the many treatment options and the new emphasis on shared decision making, Ms. Nichols noted. And that’s where the Evidence Blocks can make a difference.
“When I was diagnosed, it would have been hugely helpful for me to have information laid out in this very clear and systematic way… It would have given us the ability to make a much more informed decision,” she commented.

Multiple myeloma survivor Donald B. Orosco, who is president and chief financial officer of Orosco & Associates and owner of Monterey (Calif.) Speed and Sport, agreed, noting that his priorities when given the diagnosis more than two decades ago at age 47 differed somewhat.
“I adopted the feeling early on that I probably wasn’t going to see a cure for the disease in my lifetime, but I could accept that,” he elaborated. “I just said ‘Really, I’m interested in quality-of-life issues. I’d like to see my kids go into high school or possibly college.’ So I adopted [an approach of] trying to find something for me that would keep me alive and give me a relatively comfortable quality of life, that would allow me to continue to race cars or do whatever I had to do.”
Dr. Carlson, Dr. Somlo, Ms. Nichols, and Mr. Orosco disclosed no relevant conflicts of interest.
SAN FRANCISCO – The National Comprehensive Cancer Network (NCCN) has introduced an easy-to-use visual tool called Evidence Blocks to help physicians and patients compare various treatment options and individualize the selection among them.
“This information can serve as a starting point for shared decision making between the patient and health care team based on individual patients’ value systems,” chief executive officer Dr. Robert W. Carlson said at the NCCN Annual Congress: Hematologic Malignancies, where the tool was unveiled in a session and related press conference.
The first two NCCN guidelines to incorporate the Evidence Blocks – those for multiple myeloma and chronic myelogenous leukemia – were released at the same time. The organization hopes to incorporate them into all of its guidelines by early 2017, he said.
Development of the Evidence Blocks
The NCCN developed the Evidence Blocks to address requests from various stakeholders, according to Dr. Carlson. Guideline users wanted to know more about the rationale behind recommended therapies, asked for inclusion of information on costs, and sought an aid that would allow patients to make decisions based on their individual values.
“The patient perception of value is what should be most important to us,” he commented. “But even among patients, the concept of value differs greatly from patient to patient,” based on factors such as age, comorbidities, treatment goals, and health insurance coverage.
Each Evidence Block graphically displays five measures of information on a recommended therapy: efficacy, safety, quality of the evidence supporting the recommendation, consistency of the evidence supporting the recommendation, and affordability. Each column in the block represents one measure.
Blue shading indicates panelists’ average numeric score for the therapy on that measure rounded to the nearest integer, ranging from 1 (least favorable) to 5 (most favorable). Therefore, the more shading a therapy has, the more favorable its score.
The Evidence Blocks are added to the guidelines and aligned vertically on pages. “This display of the information graphically allows for very efficient scanning of multiple options for therapy. Comparisons across several regimens can be done very quickly and intuitively,” Dr. Carlson noted.
“We believe that the presentation of this type of information allows the health care provider and patient to make their own judgments of the value of specific interventions,” he added.
The affordability measure has generated the most discussion among panelists and stakeholders, according to Dr. Carlson. For this measure, panelists estimated the total cost of care for a therapy, including the costs of drugs, administration, required supportive care, toxicity monitoring, and care associated with management of toxicity. Scores range from very expensive to very inexpensive.
“We don’t use a dollar amount. Rather, it’s sort of what’s the total cost to society, if you will, of the medical intervention part of this,” he explained. “It’s important to understand that these estimates are not necessarily what a patient would pay because many patients have insurance programs that cover all of this cost.… However, we felt it was important to give patients as well as providers an estimate of what the overall magnitude of expense is because there are patients who have huge deductibles, there’s the doughnut hole within Medicare, and there are patients who have no insurance.”
The Evidence Blocks may help address a “conspiracy of silence” between physicians and patients when it comes to discussing treatment costs, whereby neither party wants to bring up this thorny issue, according to Dr. Carlson. “The Evidence Blocks demystify the discussion of cost because the affordability issue is there in front of you. So it gives people permission to talk about cost and affordability.”
It should be relatively easy to teach patients to use the Evidence Blocks. “I think you’ll find your patients will actually be interested in this and that they will not have as much difficulty interpreting this as you think they will, because the patient advocacy groups and the patient advocates that we have spoken with about this, they get this almost instantly,” he said.
Oncologist perspective
There is a critical need for tools such as the Evidence Blocks in making treatment decisions today, according to Dr. George Somlo, professor in the department of medical oncology and therapeutics research at the City of Hope Comprehensive Cancer Center in Duarte, Calif., and also a member of the NCCN multiple myeloma and breast cancer guideline panels.
Treatment options for multiple myeloma, as for many cancers, have exploded in the past few decades, he noted. “How do you go from making sense of having two drugs with a very poor outcome predicted to having literally dozens of agents approved and used in combination, and in essence being at the verge of curing patients with multiple myeloma?”
Dr. Somlo agreed that inclusion of costs in the Evidence Blocks would likely be beneficial as a conversation starter, recalling, “I’ve had patients who did not fill their prescription for a potentially curative medication because they were worried about the $2,500 or $3,500 copay.”
Patient-physician discussion will be important when it comes to using information from the new tool, he said. For example, in the NCCN guideline for multiple myeloma, some of the first-line regimens have identical Evidence Blocks; thus, consideration of factors such as comorbidities will become important.
“This kind of evidence-based scoring system can guide that kind of discussion with the patient and can tailor the individual therapeutic regimens,” he concluded.
Patient perspective
Breast cancer survivor Marta Nichols, who is vice president of investor relations at GoDaddy and a member of the California Breast Cancer Research Council based in San Francisco, welcomed the Evidence Blocks as a tool that will allow patients to make more informed decisions according to what matters most to them.
Only 33 years old at diagnosis, she and her husband had just begun to think about starting a family. “So my primary concern coming into my physician’s office was my fertility and what impact the treatment would have on my fertility. Certainly most physicians are concerned with efficacy – they want to see you survive. My concern was not just surviving, but also thriving and being able to give birth to children down the line,” she explained.
Patients today are overwhelmed not only by their cancer diagnosis, but also by the many treatment options and the new emphasis on shared decision making, Ms. Nichols noted. And that’s where the Evidence Blocks can make a difference.
“When I was diagnosed, it would have been hugely helpful for me to have information laid out in this very clear and systematic way… It would have given us the ability to make a much more informed decision,” she commented.
Multiple myeloma survivor Donald B. Orosco, who is president and chief financial officer of Orosco & Associates and owner of Monterey (Calif.) Speed and Sport, agreed, noting that his priorities when given the diagnosis more than two decades ago at age 47 differed somewhat.
“I adopted the feeling early on that I probably wasn’t going to see a cure for the disease in my lifetime, but I could accept that,” he elaborated. “I just said ‘Really, I’m interested in quality-of-life issues. I’d like to see my kids go into high school or possibly college.’ So I adopted [an approach of] trying to find something for me that would keep me alive and give me a relatively comfortable quality of life, that would allow me to continue to race cars or do whatever I had to do.”
Dr. Carlson, Dr. Somlo, Ms. Nichols, and Mr. Orosco disclosed no relevant conflicts of interest.
AT NCCN ANNUAL CONGRESS: HEMATOLOGIC MALIGNANCIES

ORBIT Score Predicts Bleeding Risk in AF Patients
NEW YORK - The five-factor ORBIT bleeding score accurately predicts major bleeding risk in patients with atrial fibrillation (AF) who are taking oral anticoagulants (OACs), researchers report.
"The ORBIT score highlights modifiable factors that increase bleeding risk and can help providers identify high-risk AF patients for closer monitoring," Dr. Emily C. O'Brien, from Duke Clinical Research Institute, Durham, North Carolina, said by email. "Along with clinical judgment, the ORBIT score can be used to give an estimate of bleeding risk for any AF patient considering OAC treatment."
Two existing bleeding scores - HAS-BLED and ATRIA - are based on small numbers of events and have shown inconsistent performance. They also may require elements that are not available for all OAC users, the researchers wrote.
Dr. O'Brien's team developed a five-element bleeding score and compared its performance with those of HAS-BLED and ATRIA using data from the ORBIT-AF and ROCKET-AF studies.
The numerical score included the five strongest predictors of bleeding:
-Older age (75 years and above): one point
-Reduced hemoglobin, hematocrit, or history of anemia: two points
-Bleeding history: two points
-Insufficient kidney function (eGFR below 60 mL/min/1.73 m2): one point
-Treatment with an antiplatelet agent: one point
Observed bleeding rates in the ORBIT-AF participants increased with increasing ORBIT bleeding score: from 2.4 per 100 patient-years in the low-risk group (scores 0-2) to 4.7 per 100 patient-years in the medium-risk group (score 3) to 8.1 per 100 patient-years in the high-risk group (scores 4-7), according to the Sept. 30 European Heart Journal online report.
In both the ORBIT-AF and ROCKET-AF cohorts, the ORBIT bleeding score showed better discrimination than the HAS-BLED and ATRIA scores.
Model calibration analysis also showed superior calibration for the ORBIT bleeding score. The HAS-BLED score showed relatively poor calibration for low-risk score strata, whereas the ATRIA score showed poor calibration for most risk groups.
"The ORBIT score is a simple, useful tool that predicts bleeding as well as other, more complicated scores and can be used in any AF patient regardless of the type of OAC he or she is taking," Dr. O'Brien said.
"For chronic conditions like AF, periodic assessment of risk for adverse events is important to support clinical decision-making," Dr. O'Brien explained. "Risk factors may
change over time particularly as patients get older. Therefore, incorporating new data on these factors into longitudinal risk assessment provides an optimal framework for ongoing AF management."
"While bleeding risk estimation can be helpful in identifying high-risk AF patients for closer monitoring, it is important to note that prior work has demonstrated a net clinical benefit of OAC even in patients with high estimated bleeding risk," the researchers wrote. "Further, while risk scores provide important information to the clinician for estimating risk of adverse events, they represent only one consideration relevant to therapeutic decision making."
Janssen Scientific Affairs sponsors ORBIT-AF; the Agency for Healthcare Research and Quality partially supported this research. Ten coauthors reported relevant relationships.
Emerging evidence is resolving questions in CML management
SAN FRANCISCO – “We really have an embarrassment of riches in chronic myelogenous leukemia, and the question is, which patients get which drugs? That’s really the major question that drives clinical care right now,” Dr. Jerald P. Radich, chair of the NCCN guidelines panel for chronic myelogenous leukemia (CML), told attendees of the National Comprehensive Cancer Network 10th Annual Congress: Hematologic Malignancies.

He discussed a variety of setting-specific quandaries in disease management and recent evidence from trials that is helping to provide some answers. He also reviewed some of the finer points of the NCCN’s CML guidelines, a new version of which was released at the congress.
How do you choose front-line therapy?
Tyrosine kinase inhibitors (TKIs) have dramatically improved the prognosis of CML, according to Dr. Radich, who is a member of the clinical research division, Fred Hutchinson Cancer Research Center, and an associate professor in the medical oncology division, University of Washington, both in Seattle.
Today, three TKIs—imatinib (Gleevec) and the second-generation agents nilotinib (Tasigna) and dasatinib (Sprycel)—are approved by the Food and Drug Administration as front-line therapy.
The 8-year data from the IRIS trial (International Randomized Study of Interferon Vs STI571), which tested imatinib in patients with newly diagnosed chronic-phase CML, showed that event-free survival was 81% and overall survival was 85% (Blood. 2009;114:462. Abstract 1126). “No matter how you slice it, these patients have done fantastically well,” Dr. Radich said.
The two other, newer therapies, nilotinib and dasatinib, have yielded significantly better short-term cytogenetic response and major molecular response rates in numerous trials. “But curiously enough, if you look at overall survival, there is no difference,” he commented. “We don’t know why the short-term efficacy of the second generations hasn’t translated into long-term efficacy yet.”
In the guidelines, the three front-line TKIs are nearly identical with respect to their Evidence Blocks, a new tool added to facilitate treatment comparisons and decision making.
But specific toxicities differ across the agents, which may tilt the decision one way or another. “If somebody has a history of really bad atherosclerotic events previously, then imatinib is probably not the best drug for them. If somebody has a history of pulmonary issues, then dasatinib may not be the best drug for them. And if somebody has diabetes, nilotinib probably isn’t the best drug for them,” Dr. Radich elaborated.
Costs for the three drugs are the same at present, he said. But imatinib will likely become available as a generic next year, which may make that drug the most attractive from the financial perspective.
When do you switch therapies?
There is some debate about how long to persevere with a front-line therapy when monitoring suggests the response is suboptimal, according to Dr. Radich.
Data have identified the BCR-ABL1 transcript level at 3 months to be a good predictor of long-term survival (J Clin Oncol. 2012;30:232-8). “We in the NCCN have said at 3 months or 6 months, you should consider changing [if the response is suboptimal]. You don’t have to, but you should consider changing because there are some other [therapies] that get rid of that,” he said.
However, he cautioned, a true assessment of response hinges critically on patients’ compliance with therapy. Studies using electronic monitors hidden in the caps of pill bottles suggest that even though the majority of patients say they take their TKI daily, only about 15% actually do.
Studies out of Europe and Australia have shown that some patients with a suboptimal response will have progression to accelerated phase/blast crisis in the interim between 3 months and 6 months, Dr. Radich noted. “So if you think that your patient is really, really religiously taking their drug, and if they still have not responded very well at 3 months, that might be an indication that you can consider changing therapy.”
Which second-line TKI should patients get?
The options for second-line TKI therapy include nilotinib and dasatinib, as well as bosutinib (Bosulif) and ponatinib (Iclusig).
About half of patients who experience progression on or become resistant to their first-line TKI have mutations, according to Dr. Radich. Here, a mutational analysis is warranted as the second-line agents differ somewhat with respect to the mutations they act against, which may guide the choice of agent. And toxicity profile may again dictate drugs that can and can’t be used for a specific patient.
Patients who have genuine resistance are unlikely to achieve a cure although they may have a cytogenetic response. “Most of us think that resistance might be forever and if we have a patient who has genuinely become resistant, you don’t need to transplant them necessarily [right away]. But that’s the time you have to have a conversation about doing transplantation and start doing HLA typing and the like,” he said.
Data suggest that the cytogenetic response to second-line therapy at 3 months predicts how patients will fare longer term (ASH 2008. Abstract 332).
“That ends up being a pretty good time point because if you have a patient who’s resistant and you start the search for a donor, for an HLA match, the median time to finding a donor is about 4 months,” Dr. Radich commented. “So a practical point is if you have to switch to a second-generation drug, you start a search. You find a donor, you evaluate again. If the patient had a great response, you say fine, we’re going to follow you; if they don’t, that’s a good time to move to transplant.”
In the guidelines, the Evidence Blocks for second-line (and later-line) therapies generally show what one might expect from clinical practice, Dr. Radich said. “As you march from primary therapy to secondary therapy to tertiary therapy, what happens? You all know, toxicity increases in those settings, efficacy goes down. And that’s exactly what happens here. And if you match up all these drugs, we say there is no difference in which one you pick.”
Can you discontinue therapy?
“The other issue that is really driving a lot of CML strategy these days is the issue of discontinuation,” Dr. Radich commented. Conventional belief has been that TKIs do not eliminate CML stem cells; therefore, patients will need to be on therapy lifelong.
“Turns out, like many things, we were wrong,” he said. “There have been a number of studies now showing that if you are PCR negative for a number of years and get off therapy, about 60% of patients will relapse usually within the first 3 months, but about 40% of patients will actually remain negative for BCR-ABL up to 2-3 years.”
“Now the good part is that all the patients pretty much who have relapse and get put back on drug go back to getting a response; they don’t go into complete molecular remission, however. And the reason that we worry that all these patients should still be [discontinued] on a clinical trial as opposed to doing it at home is we don’t know the long-term consequences of this,” Dr. Radich said.
A period of unopposed BCR-ABL activity may allow emergence of resistant clones that take years to become clinically evident, he noted. In fact, data from Hiroshima survivors show that CML can have “an amazing dormancy,” possibly 70 years.
“So I think you have to approach any discontinuation with some caution. The risk is probably very low, but it’s actually probably a number,” he said. The guidelines therefore recommend that in patients whose disease is responding to TKIs, discontinuation should be undertaken only in a clinical trial.
“How this weighs in, I think, is if you look at CMR [complete molecular response] rates, they are higher with second-generations than with imatinib. So if you have a patient who you some day want to get to a discontinuation trial, a younger person who wants to have children and the like, then second-generations might be your best option for getting them there,” Dr. Radich proposed.
Take-home message
The guidelines, with all of their algorithms and the new Evidence Blocks, are helpful but do not replace clinical wisdom and experience, Dr. Radich asserted in closing.
“You have to kind of use your clinical judgment, and that trumps everything else,” he said. “The other thing that’s important is all of you have different experiences with using these drugs, and nothing replaces that. If you are someone who uses drug A all the time, you know how to anticipate the complications, you know what to look for. It’s a lot better [to use that drug] than just jumping to drug C when you have never used it or have little experience, because really experience is the main thing.”
Dr. Radich disclosed that he has consulting and/or research funding relationships with Ariad Pharmaceuticals, Gilead Sciences, and Novartis.
SAN FRANCISCO – “We really have an embarrassment of riches in chronic myelogenous leukemia, and the question is, which patients get which drugs? That’s really the major question that drives clinical care right now,” Dr. Jerald P. Radich, chair of the NCCN guidelines panel for chronic myelogenous leukemia (CML), told attendees of the National Comprehensive Cancer Network 10th Annual Congress: Hematologic Malignancies.
He discussed a variety of setting-specific quandaries in disease management and recent evidence from trials that is helping to provide some answers. He also reviewed some of the finer points of the NCCN’s CML guidelines, a new version of which was released at the congress.
How do you choose front-line therapy?
Tyrosine kinase inhibitors (TKIs) have dramatically improved the prognosis of CML, according to Dr. Radich, who is a member of the clinical research division, Fred Hutchinson Cancer Research Center, and an associate professor in the medical oncology division, University of Washington, both in Seattle.
Today, three TKIs—imatinib (Gleevec) and the second-generation agents nilotinib (Tasigna) and dasatinib (Sprycel)—are approved by the Food and Drug Administration as front-line therapy.
The 8-year data from the IRIS trial (International Randomized Study of Interferon Vs STI571), which tested imatinib in patients with newly diagnosed chronic-phase CML, showed that event-free survival was 81% and overall survival was 85% (Blood. 2009;114:462. Abstract 1126). “No matter how you slice it, these patients have done fantastically well,” Dr. Radich said.
The two other, newer therapies, nilotinib and dasatinib, have yielded significantly better short-term cytogenetic response and major molecular response rates in numerous trials. “But curiously enough, if you look at overall survival, there is no difference,” he commented. “We don’t know why the short-term efficacy of the second generations hasn’t translated into long-term efficacy yet.”
In the guidelines, the three front-line TKIs are nearly identical with respect to their Evidence Blocks, a new tool added to facilitate treatment comparisons and decision making.
But specific toxicities differ across the agents, which may tilt the decision one way or another. “If somebody has a history of really bad atherosclerotic events previously, then imatinib is probably not the best drug for them. If somebody has a history of pulmonary issues, then dasatinib may not be the best drug for them. And if somebody has diabetes, nilotinib probably isn’t the best drug for them,” Dr. Radich elaborated.
Costs for the three drugs are the same at present, he said. But imatinib will likely become available as a generic next year, which may make that drug the most attractive from the financial perspective.
When do you switch therapies?
There is some debate about how long to persevere with a front-line therapy when monitoring suggests the response is suboptimal, according to Dr. Radich.
Data have identified the BCR-ABL1 transcript level at 3 months to be a good predictor of long-term survival (J Clin Oncol. 2012;30:232-8). “We in the NCCN have said at 3 months or 6 months, you should consider changing [if the response is suboptimal]. You don’t have to, but you should consider changing because there are some other [therapies] that get rid of that,” he said.
However, he cautioned, a true assessment of response hinges critically on patients’ compliance with therapy. Studies using electronic monitors hidden in the caps of pill bottles suggest that even though the majority of patients say they take their TKI daily, only about 15% actually do.
Studies out of Europe and Australia have shown that some patients with a suboptimal response will have progression to accelerated phase/blast crisis in the interim between 3 months and 6 months, Dr. Radich noted. “So if you think that your patient is really, really religiously taking their drug, and if they still have not responded very well at 3 months, that might be an indication that you can consider changing therapy.”
Which second-line TKI should patients get?
The options for second-line TKI therapy include nilotinib and dasatinib, as well as bosutinib (Bosulif) and ponatinib (Iclusig).
About half of patients who experience progression on or become resistant to their first-line TKI have mutations, according to Dr. Radich. Here, a mutational analysis is warranted as the second-line agents differ somewhat with respect to the mutations they act against, which may guide the choice of agent. And toxicity profile may again dictate drugs that can and can’t be used for a specific patient.
Patients who have genuine resistance are unlikely to achieve a cure although they may have a cytogenetic response. “Most of us think that resistance might be forever and if we have a patient who has genuinely become resistant, you don’t need to transplant them necessarily [right away]. But that’s the time you have to have a conversation about doing transplantation and start doing HLA typing and the like,” he said.
Data suggest that the cytogenetic response to second-line therapy at 3 months predicts how patients will fare longer term (ASH 2008. Abstract 332).
“That ends up being a pretty good time point because if you have a patient who’s resistant and you start the search for a donor, for an HLA match, the median time to finding a donor is about 4 months,” Dr. Radich commented. “So a practical point is if you have to switch to a second-generation drug, you start a search. You find a donor, you evaluate again. If the patient had a great response, you say fine, we’re going to follow you; if they don’t, that’s a good time to move to transplant.”
In the guidelines, the Evidence Blocks for second-line (and later-line) therapies generally show what one might expect from clinical practice, Dr. Radich said. “As you march from primary therapy to secondary therapy to tertiary therapy, what happens? You all know, toxicity increases in those settings, efficacy goes down. And that’s exactly what happens here. And if you match up all these drugs, we say there is no difference in which one you pick.”
Can you discontinue therapy?
“The other issue that is really driving a lot of CML strategy these days is the issue of discontinuation,” Dr. Radich commented. Conventional belief has been that TKIs do not eliminate CML stem cells; therefore, patients will need to be on therapy lifelong.
“Turns out, like many things, we were wrong,” he said. “There have been a number of studies now showing that if you are PCR negative for a number of years and get off therapy, about 60% of patients will relapse usually within the first 3 months, but about 40% of patients will actually remain negative for BCR-ABL up to 2-3 years.”
“Now the good part is that all the patients pretty much who have relapse and get put back on drug go back to getting a response; they don’t go into complete molecular remission, however. And the reason that we worry that all these patients should still be [discontinued] on a clinical trial as opposed to doing it at home is we don’t know the long-term consequences of this,” Dr. Radich said.
A period of unopposed BCR-ABL activity may allow emergence of resistant clones that take years to become clinically evident, he noted. In fact, data from Hiroshima survivors show that CML can have “an amazing dormancy,” possibly 70 years.
“So I think you have to approach any discontinuation with some caution. The risk is probably very low, but it’s actually probably a number,” he said. The guidelines therefore recommend that in patients whose disease is responding to TKIs, discontinuation should be undertaken only in a clinical trial.
“How this weighs in, I think, is if you look at CMR [complete molecular response] rates, they are higher with second-generations than with imatinib. So if you have a patient who you some day want to get to a discontinuation trial, a younger person who wants to have children and the like, then second-generations might be your best option for getting them there,” Dr. Radich proposed.
Take-home message
The guidelines, with all of their algorithms and the new Evidence Blocks, are helpful but do not replace clinical wisdom and experience, Dr. Radich asserted in closing.
“You have to kind of use your clinical judgment, and that trumps everything else,” he said. “The other thing that’s important is all of you have different experiences with using these drugs, and nothing replaces that. If you are someone who uses drug A all the time, you know how to anticipate the complications, you know what to look for. It’s a lot better [to use that drug] than just jumping to drug C when you have never used it or have little experience, because really experience is the main thing.”
Dr. Radich disclosed that he has consulting and/or research funding relationships with Ariad Pharmaceuticals, Gilead Sciences, and Novartis.
EXPERT ANALYSIS FROM NCCN ANNUAL CONGRESS: HEMATOLOGIC MALIGNANCIES

Mental health care is ‘Code Black’
The initial explanation for why the teenager needed to be admitted seemed very flimsy to me. Finally, the office pediatrician came clean. The girl is an honor roll student, high achieving but currently overwhelmed by events in her life. She cannot handle being at home, but there is nowhere else for her to go for the weekend. Come Monday morning, the primary care physician (PCP) has arranged for her acceptance into a local mental health facility where she could get the care she needs. The prognosis was excellent. Her entire future could be markedly improved with just a little help getting through these current troubles. I thought about the patient down the hall. My partner had admitted her 2 days ago for acute-on-chronic abdominal pain, shortly after her third normal CT scan in 6 months. I strongly doubted that that patient had any more business being in a hospital than this latest admission – except, of course, for all the profit the hospital was making on the imaging. On reflection, I decided the PCP’s request no longer seemed so out of place.
The latest emergency department drama on TV has a tagline, “In the ER when there are more patients than resources, it’s called Code Black.” It contains scenes of mopping up bloody floors in the trauma bay. I’ve worked in an ED that was a major portal into a nearby pediatric mental health facility. The major traumas I cared for didn’t bleed from their life-threatening emotional wounds. Multiple times per week, children from across the city were brought in for evaluation. A few needed a toxicology work-up for ingestions. A few more needed some glue or sutures for very superficial self-inflicted forearm lacerations. Mostly I provided a medical screening before getting those teenagers moved as quickly as possible to a team of specialists who could help them. In some parts of this country that can take days.

On Oct. 5, 2015, California’s governor signed a state law permitting physician-assisted suicide. It is now the fifth state allowing that option. The pros and cons have been endlessly debated by ethicists. A brief Google search can find the philosophical arguments. I recommend a June 22, 2015, New Yorker article entitled, “The Death Treatment” by Rachel Aviv to provide a broad narrative perspective. Oregon’s Death With Dignity Act was passed 20 years ago, so it provides some scientific data. There are now 100 deaths per year under that Oregon act. The state also has 700 suicides yearly. So the leading method of suicide in Oregon, by a wide margin, continues to be used by people who are not terminally ill. That was the method of choice recently for my cousin. There was nothing dignified about it. My favorite actor, Robin Williams, in the movie “World’s Greatest Dad,” had the line, “If you’re that depressed, reach out to someone, and remember suicide is a permanent solution to temporary problems.” Five years later he took his own life.
I do enjoy debating the nuances of physician-assisted suicide with other ethicists, but I don’t confuse those academic exercises with addressing the real world problem of endemic suicide. Nationwide, there are 41,000 suicides each year, with about 5,000 in the 15- to 24-year age group. In comparison, 10,000 children annually will get cancer, but only 1,250 children will die of it. There will be about 900 pediatric recipients of lifesaving heart or liver transplants. With all this wealth, knowledge, and technology, the United States should be able to provide better treatment of mental illness. Parity of mental health services became law under President Clinton in 1996, repeated as law under President Bush in 2008, and affirmed again under President Obama. But those political promises have yet to bear fruit in real life. The system remains overloaded. For the sake of the children and young adults, pediatricians must promote expansion of mental health services.
Dr. Powell is a pediatric hospitalist and clinical ethics consultant living in St. Louis. Dr. Powell said he had no relevant financial disclosures or conflicts of interest.
The initial explanation for why the teenager needed to be admitted seemed very flimsy to me. Finally, the office pediatrician came clean. The girl is an honor roll student, high achieving but currently overwhelmed by events in her life. She cannot handle being at home, but there is nowhere else for her to go for the weekend. Come Monday morning, the primary care physician (PCP) has arranged for her acceptance into a local mental health facility where she could get the care she needs. The prognosis was excellent. Her entire future could be markedly improved with just a little help getting through these current troubles. I thought about the patient down the hall. My partner had admitted her 2 days ago for acute-on-chronic abdominal pain, shortly after her third normal CT scan in 6 months. I strongly doubted that that patient had any more business being in a hospital than this latest admission – except, of course, for all the profit the hospital was making on the imaging. On reflection, I decided the PCP’s request no longer seemed so out of place.
The latest emergency department drama on TV has a tagline, “In the ER when there are more patients than resources, it’s called Code Black.” It contains scenes of mopping up bloody floors in the trauma bay. I’ve worked in an ED that was a major portal into a nearby pediatric mental health facility. The major traumas I cared for didn’t bleed from their life-threatening emotional wounds. Multiple times per week, children from across the city were brought in for evaluation. A few needed a toxicology work-up for ingestions. A few more needed some glue or sutures for very superficial self-inflicted forearm lacerations. Mostly I provided a medical screening before getting those teenagers moved as quickly as possible to a team of specialists who could help them. In some parts of this country that can take days.
On Oct. 5, 2015, California’s governor signed a state law permitting physician-assisted suicide. It is now the fifth state allowing that option. The pros and cons have been endlessly debated by ethicists. A brief Google search can find the philosophical arguments. I recommend a June 22, 2015, New Yorker article entitled, “The Death Treatment” by Rachel Aviv to provide a broad narrative perspective. Oregon’s Death With Dignity Act was passed 20 years ago, so it provides some scientific data. There are now 100 deaths per year under that Oregon act. The state also has 700 suicides yearly. So the leading method of suicide in Oregon, by a wide margin, continues to be used by people who are not terminally ill. That was the method of choice recently for my cousin. There was nothing dignified about it. My favorite actor, Robin Williams, in the movie “World’s Greatest Dad,” had the line, “If you’re that depressed, reach out to someone, and remember suicide is a permanent solution to temporary problems.” Five years later he took his own life.
I do enjoy debating the nuances of physician-assisted suicide with other ethicists, but I don’t confuse those academic exercises with addressing the real world problem of endemic suicide. Nationwide, there are 41,000 suicides each year, with about 5,000 in the 15- to 24-year age group. In comparison, 10,000 children annually will get cancer, but only 1,250 children will die of it. There will be about 900 pediatric recipients of lifesaving heart or liver transplants. With all this wealth, knowledge, and technology, the United States should be able to provide better treatment of mental illness. Parity of mental health services became law under President Clinton in 1996, repeated as law under President Bush in 2008, and affirmed again under President Obama. But those political promises have yet to bear fruit in real life. The system remains overloaded. For the sake of the children and young adults, pediatricians must promote expansion of mental health services.
Dr. Powell is a pediatric hospitalist and clinical ethics consultant living in St. Louis. Dr. Powell said he had no relevant financial disclosures or conflicts of interest.
ADHD treatment – beyond medications
While it is well established that medications can be an important aspect of treatment for youth who meet the criteria for attention-deficit/hyperactivity disorder (ADHD), too often clinicians neglect to address important nonpharmacologic interventions that have increasingly been shown to be effective. This column is devoted to reviewing some of the many components of a treatment plan other than medications that could be utilized to provide a more comprehensive and wellness-informed approach to children who struggle with ADHD symptoms.
Case summary
Ethan is a 7-year-old boy who presents with his parents for an ADHD evaluation. The pediatrician conducts the evaluation according to American Academy of Pediatrics guidelines, which include the use of rating scales from multiple sources. The outcome of the assessment is that Ethan does indeed meet criteria for ADHD and his symptoms are causing impairment in his school work, home environment, and interactions with his peers. Treatment is recommended.
Discussion

It is easy to rely exclusively on medications when the focus of the evaluation is solely about symptoms. When clinicians expand their view to assess various domains of wellness and health promotion, however, several other potential avenues for intervention often become apparent. Asking about sleep routines, nutrition, participation in the arts and music, physical activity, reading, and screen time – among other things – can reveal the following specific areas that require guidance and support:
• Exercise. Children today are increasingly sedentary, and there is increasing evidence that physical activity is inversely related to several ADHD behaviors (J Am Acad Child Adolesc Psychiatry. 2015 Jul;54:565-70). Counsel families about the importance of exercise and try to help the family develop a plan that includes the provision for regular physical activity. Joining sports teams may be particularly useful as it ensures that regular exercise takes place and offers some additional benefits inherent in playing with a team.
• Screen time. Although there has been active discussion lately about what constitutes “too much” screen time, it is clear that many children well exceed even the most liberal thresholds. Furthermore, there is increasing evidence that excessive screen time can lead to worsening attention problems over time (Pediatrics. 2004;113:708-13). One technique that can be effective, especially for younger children, is to have them “earn” their screen time by engaging in other activities such as reading or exercise.
• Nutrition. Apart from any specific deficiency states, research shows that a healthier diet in general is associated with lower levels of behavioral problems. With regard to ADHD, one aspect that is often worth investigating specifically is whether the child gets a nutritious breakfast each morning that can help keep attentional skills optimal.
• Musical training. Some intriguing new research is showing links between brain maturation and musical training, and in some of the very regions of the brain that have been implicated in ADHD (J Am Acad Child Adolesc Psychiatry. 2014;53:1153-61).
• Omega-3s. A meta-analysis demonstrated that omega-3 supplementation can improve ADHD symptoms (J Am Acad Child Adolesc Psychiatry. 2011 Oct;50:991-1000). While the optimal dose remains under investigation, there is some evidence that improved response was related to higher eicosapentaenoic acid doses.
• Skills training. To some degree, many skills associated with ADHD (disorganization, forgetfulness, distractibility) can be specifically taught with techniques such as mindfulness (J Atten Disord. 2015 Feb;19[2]:147-57). Having families work with counselors who have specific training in ADHD can be a very useful part of treatment and can help teach important lifelong skills. Parent behavioral therapy also can be effective around many behaviors such as defiance and aggression that accompany ADHD.
Case follow-up
The pediatrician decides to enhance her assessment by inquiring about many domains of wellness, and she discovers that Ethan has chronic problems getting to sleep, and he spends many hours each day playing video games to the exclusion of physical activity. She offers some strategies to improve these areas while the family investigates working with a counselor who has specific expertise in enhancing cognitive skills. Initial improvements are encouraging, and the family decides to pursue these avenues further while delaying medication treatment, at least for now.
By keeping in mind these important other treatment domains, pediatricians can avoid the trap of overrelying on medications as the sole method of treatment while encouraging techniques that will provide long-term benefits in overall health and wellness.
Dr. Rettew is an associate professor of psychiatry and pediatrics at the University of Vermont, Burlington. Dr. Rettew said he has no relevant financial disclosures. Follow him on Twitter @pedipsych. E-mail him at pdnews@frontlinemedcom.com.
While it is well established that medications can be an important aspect of treatment for youth who meet the criteria for attention-deficit/hyperactivity disorder (ADHD), too often clinicians neglect to address important nonpharmacologic interventions that have increasingly been shown to be effective. This column is devoted to reviewing some of the many components of a treatment plan other than medications that could be utilized to provide a more comprehensive and wellness-informed approach to children who struggle with ADHD symptoms.
Case summary
Ethan is a 7-year-old boy who presents with his parents for an ADHD evaluation. The pediatrician conducts the evaluation according to American Academy of Pediatrics guidelines, which include the use of rating scales from multiple sources. The outcome of the assessment is that Ethan does indeed meet criteria for ADHD and his symptoms are causing impairment in his school work, home environment, and interactions with his peers. Treatment is recommended.
Discussion
It is easy to rely exclusively on medications when the focus of the evaluation is solely about symptoms. When clinicians expand their view to assess various domains of wellness and health promotion, however, several other potential avenues for intervention often become apparent. Asking about sleep routines, nutrition, participation in the arts and music, physical activity, reading, and screen time – among other things – can reveal the following specific areas that require guidance and support:
• Exercise. Children today are increasingly sedentary, and there is increasing evidence that physical activity is inversely related to several ADHD behaviors (J Am Acad Child Adolesc Psychiatry. 2015 Jul;54:565-70). Counsel families about the importance of exercise and try to help the family develop a plan that includes the provision for regular physical activity. Joining sports teams may be particularly useful as it ensures that regular exercise takes place and offers some additional benefits inherent in playing with a team.
• Screen time. Although there has been active discussion lately about what constitutes “too much” screen time, it is clear that many children well exceed even the most liberal thresholds. Furthermore, there is increasing evidence that excessive screen time can lead to worsening attention problems over time (Pediatrics. 2004;113:708-13). One technique that can be effective, especially for younger children, is to have them “earn” their screen time by engaging in other activities such as reading or exercise.
• Nutrition. Apart from any specific deficiency states, research shows that a healthier diet in general is associated with lower levels of behavioral problems. With regard to ADHD, one aspect that is often worth investigating specifically is whether the child gets a nutritious breakfast each morning that can help keep attentional skills optimal.
• Musical training. Some intriguing new research is showing links between brain maturation and musical training, and in some of the very regions of the brain that have been implicated in ADHD (J Am Acad Child Adolesc Psychiatry. 2014;53:1153-61).
• Omega-3s. A meta-analysis demonstrated that omega-3 supplementation can improve ADHD symptoms (J Am Acad Child Adolesc Psychiatry. 2011 Oct;50:991-1000). While the optimal dose remains under investigation, there is some evidence that improved response was related to higher eicosapentaenoic acid doses.
• Skills training. To some degree, many skills associated with ADHD (disorganization, forgetfulness, distractibility) can be specifically taught with techniques such as mindfulness (J Atten Disord. 2015 Feb;19[2]:147-57). Having families work with counselors who have specific training in ADHD can be a very useful part of treatment and can help teach important lifelong skills. Parent behavioral therapy also can be effective around many behaviors such as defiance and aggression that accompany ADHD.
Case follow-up
The pediatrician decides to enhance her assessment by inquiring about many domains of wellness, and she discovers that Ethan has chronic problems getting to sleep, and he spends many hours each day playing video games to the exclusion of physical activity. She offers some strategies to improve these areas while the family investigates working with a counselor who has specific expertise in enhancing cognitive skills. Initial improvements are encouraging, and the family decides to pursue these avenues further while delaying medication treatment, at least for now.
By keeping in mind these important other treatment domains, pediatricians can avoid the trap of overrelying on medications as the sole method of treatment while encouraging techniques that will provide long-term benefits in overall health and wellness.
Dr. Rettew is an associate professor of psychiatry and pediatrics at the University of Vermont, Burlington. Dr. Rettew said he has no relevant financial disclosures. Follow him on Twitter @pedipsych. E-mail him at pdnews@frontlinemedcom.com.

FDA approves trabectedin for some advanced soft tissue sarcomas
The Food and Drug Administration has approved trabectedin for the treatment of advanced or unresectable liposarcomas and leiomyosarcomas that have been previously treated with anthracycline-based regimens.
Approval is based on improvements in progression-free survival in a trial of 518 participants with metastatic or recurrent leiomyosarcoma or liposarcoma, randomly assigned to receive either trabectedin (345 patients) or dacarbazine (173 patients). Median progression-free survival was 4.2 months for those in the trabectedin arm, compared with 1.5 months for those in the dacarbazine arm, according to an Oct. 23 statement issued by the FDA.
The most common side effects for those in the trabectedin arm were nausea, fatigue, vomiting, diarrhea, constipation, decreased appetite, dyspnea, headache, peripheral edema, neutropenia, thrombocytopenia, anemia, elevated liver enzymes, and decreases in albumin.
The drug label carries a warning of the risk of neutropenic sepsis, rhabdomyolysis, hepatotoxicity, extravasation, tissue necrosis, and cardiomyopathy. Women should be advised of potential risks to a developing fetus, and those who are breastfeeding should not take trabectedin, the FDA said.
Trabectedin, an alkylating drug, is marketed as Yondelis by Janssen Products of Raritan, N.J.
The label is available on the FDA website at drugsatfda.
lnikolaides@frontlinemedcom.com
On Twitter @NikolaidesLaura
Louisiana goes two for one on controlled substance prescriptions
In 2013, enough controlled substances were prescribed in Louisiana – 2006.2 prescriptions per 1,000 population – that each and every person in the state could have received two, according to a report from the Centers for Disease Control and Prevention.
The combined prescribing rate for opioids, benzodiazepines, and stimulants in Louisiana topped the eight states included in the CDC report, with West Virginia in second at 1,695.7 prescriptions per 1,000. At the low end, California was the only one of the eight states where the average controlled substance prescription rate was less than one per person, but just barely at 994.8 per 1,000 people, followed by Idaho at 1,292.3 per 1,000, according to the CDC investigators in a Morbidity and Mortality Weekly Report Surveillance Summary (2015 Oct;64[SS09]:1-14).
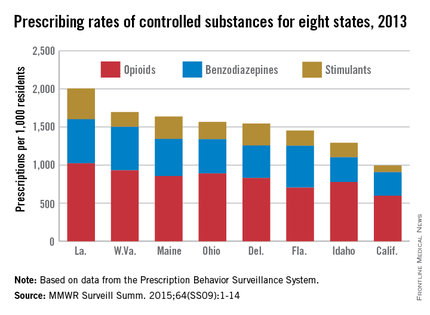
Of the three categories of controlled substances, opioids were by far the most commonly prescribed. At 1,021.7 prescriptions per 1,000 people, the opioid prescription rate in Louisiana was greater than the total controlled substance prescription rate in California. West Virginia had the second highest rate at 929.3, and California had the lowest at 596.3.
Prescription rates for stimulants and benzodiazepines were highest in Louisiana at 403.9 and 580.6 per 1,000 people, respectively. Maine had the next-highest stimulant prescription rate at 293.9, and West Virginia had the second-highest benzodiazepine prescription rate at 572.1. California had the lowest rate in both categories at 87.7 and 310.8, respectively.
Women received opioids and benzodiazepines at much higher rates than did men in every state, but stimulant-prescribing rates were higher for men in five states.
Opioid use was highest in people aged 55-64 years, though use spiked dramatically past the age of 25. People in Louisiana aged 55-64 receiving opioids had the highest controlled substance prescription rate of any measured age group, at 1,715.7 per 1,000 people. Benzodiazepine use was most common in people over 65 years, and stimulant prescriptions were highest in people younger than 18, likely because of the prevalence of childhood attention-deficit/hyperactivity disorder, the CDC investigators said.
The MMWR report used data collected by the Prescription Behavior Surveillance System. The eight states were included because they submitted data to the Prescription Behavior Surveillance System in time for the report, and they represent about one-quarter of the U.S. population.
In 2013, enough controlled substances were prescribed in Louisiana – 2006.2 prescriptions per 1,000 population – that each and every person in the state could have received two, according to a report from the Centers for Disease Control and Prevention.
The combined prescribing rate for opioids, benzodiazepines, and stimulants in Louisiana topped the eight states included in the CDC report, with West Virginia in second at 1,695.7 prescriptions per 1,000. At the low end, California was the only one of the eight states where the average controlled substance prescription rate was less than one per person, but just barely at 994.8 per 1,000 people, followed by Idaho at 1,292.3 per 1,000, according to the CDC investigators in a Morbidity and Mortality Weekly Report Surveillance Summary (2015 Oct;64[SS09]:1-14).
Of the three categories of controlled substances, opioids were by far the most commonly prescribed. At 1,021.7 prescriptions per 1,000 people, the opioid prescription rate in Louisiana was greater than the total controlled substance prescription rate in California. West Virginia had the second highest rate at 929.3, and California had the lowest at 596.3.
Prescription rates for stimulants and benzodiazepines were highest in Louisiana at 403.9 and 580.6 per 1,000 people, respectively. Maine had the next-highest stimulant prescription rate at 293.9, and West Virginia had the second-highest benzodiazepine prescription rate at 572.1. California had the lowest rate in both categories at 87.7 and 310.8, respectively.
Women received opioids and benzodiazepines at much higher rates than did men in every state, but stimulant-prescribing rates were higher for men in five states.
Opioid use was highest in people aged 55-64 years, though use spiked dramatically past the age of 25. People in Louisiana aged 55-64 receiving opioids had the highest controlled substance prescription rate of any measured age group, at 1,715.7 per 1,000 people. Benzodiazepine use was most common in people over 65 years, and stimulant prescriptions were highest in people younger than 18, likely because of the prevalence of childhood attention-deficit/hyperactivity disorder, the CDC investigators said.
The MMWR report used data collected by the Prescription Behavior Surveillance System. The eight states were included because they submitted data to the Prescription Behavior Surveillance System in time for the report, and they represent about one-quarter of the U.S. population.
FROM MORBIDITY AND MORTALITY WEEKLY REPORT
