User login
Detecting and managing device leads inadvertently placed in the left ventricle
Although rare, inadvertent placement of a pacemaker or defibrillator lead in the left ventricle can have serious consequences, including arterial thromboembolism and aortic or mitral valve damage or infection.1–4
This article discusses situations in which lead malpositioning is likely to occur, how to prevent it, how to detect and correct it immediately, and how to manage cases discovered long after implantation.
RARE, BUT LIKELY UNDERREPORTED
In 2011, Rodriguez et al1 reviewed 56 reported cases in which an endocardial lead had been mistakenly placed in the left ventricle. A few more cases have been reported since then, but some cases are not reported, so how often this occurs is unknown.
A large single-center retrospective study2 reported a 3.4% incidence of inadvertent lead placement in the left side of the heart, including the cardiac veins.
HOW LEADS CAN END UP IN THE WRONG PLACE
Risk factors for lead malpositioning include abnormal thoracic anatomy, underlying congenital heart disease, and operator inexperience.2
Normally, in single- and double-lead systems, leads are inserted into a cephalic, subclavian, or axillary vein and advanced into the right atrium, right ventricle, or both. However, pacing, sensing, and defibrillation leads have inadvertently been placed in the left ventricular endocardium and even on the epicardial surface.
Leads can end up inside the left ventricle by passing through an unrecognized atrial septal defect, patent foramen ovale, or ventricular septal defect, or by perforating the interventricular septum. Another route into the left ventricle is by gaining vascular access through the axillary or subclavian artery and advancing the lead retrograde across the aortic valve.
Epicardial lead placement may result from perforating the right ventricle5 or inadvertent positioning within the main coronary sinus or in a cardiac vein.
PREVENTION IS THE BEST MANAGEMENT
The best way to manage lead malpositioning is to prevent it in the first place.
Make sure you are in a vein, not an artery! If you are working from the patient’s left side, you should see the guidewire cross the midline on fluoroscopy. Working from either the left or the right side, you can ensure that the guidewire is in the venous system by advancing it into the inferior vena cava and then all the way below the diaphragm (best seen on anteroposterior views). These observations help avoid lead placement in the left ventricle by an inadvertent retrograde aortic approach.
Suspect that you are taking the wrong route to the heart (ie, through the arterial system) if, in the anteroposterior view, the guidewire bends as it approaches the left spinal border. This sign suggests that you are going backwards through the ascending aorta and bumping up against the aortic cusps. Occasionally, the wire may pass through the aortic valve without resistance and bending. Additional advancement toward the left chest wall will make contact with the left ventricular endocardium and may result in ventricular ectopy. Placement in the left ventricle is best seen in the left anterior oblique projection; the lead will cross the spine or its distal end will point toward the spine in progressive projections from farther to the left.
Make sure you are in the right ventricle. Even if you have gone through the venous system, you are not home free. Advancing the lead into the right ventricular outflow tract (best seen in the right anterior oblique projection) is a key step in avoiding lead misplacement. In the right ventricular outflow tract, the lead tip should move freely; if it does not, it may be in the coronary sinus or middle cardiac vein.
If a lead passes through a patent foramen ovale or septal defect to the left atrium, a left anterior oblique view should also demonstrate movement toward or beyond the spine. If the lead passes beyond the left heart border, a position in a pulmonary vein is possible. This is often associated with loss of a recordable intracardiac electrogram. A position in a right pulmonary vein is possible but very, very unlikely. If a lead passes through a patent foramen ovale or septal defect to the left ventricle, it will point toward the spine in left anterior oblique projections. (See “Postoperative detection by chest radiography.”)
Ventricular paced QRS complexes should show a left bundle branch pattern on electrocardiography (ECG), not a right bundle branch pattern (more about this below). However, when inserting a pacemaker, the sterile field includes the front of the chest and therefore lead V1 is usually omitted, depriving the operator of valuable information.
Fortunately, operators may fluoroscopically view leads intended for the right ventricle in left anterior oblique projections. We recommend beginning at 40° left anterior oblique. In this view, septally positioned right ventricular leads may appear to abut the spine. A right ventricular position is confirmed in a steeper left anterior oblique projection, where the lead should be seen to be away from the spine.4
POSTOPERATIVE DETECTION BY ECG
Careful evaluation of the 12-lead electrocardiogram during ventricular pacing is important for confirming correct lead placement. If ventricular pacing is absent, eg, if the device fires only if the natural heart rate drops below a set number and the heart happens to be firing on its own when you happen to be looking at it, programming the device to pace the right ventricle 10 beats per minute faster than the intrinsic heart rate usually suffices. Temporarily disabling atrial pacing and cardiac venous pacing in biventricular devices facilitates interpretation of the paced QRS complex.
Bundle branch block patterns
The typical morphology for paced events originating from the right ventricle has a left bundle branch block pattern, ie, a dominant S wave in leads V1 and V2. Nevertheless, many patients with a safely placed lead in the right ventricle can also demonstrate right bundle branch morphology during pacing,6 ie, a dominant R wave in leads V1 and V2.

Klein et al7 reported on 8 patients who had features of right bundle branch block in leads V1 and V2 and noted that placing these leads 1 interspace lower eliminated the right bundle branch block appearance. The utility of this maneuver is demonstrated in Figure 1.
Almehairi et al8 demonstrated transition to a left bundle branch block-like pattern in V1 in 14 of 26 patients after leads V1 and V2 were moved to the fifth intercostal space. Moving these leads to the sixth intercostal space produced a left bundle branch block-like pattern in all the remaining patients. Additional study is needed to validate this precordial mapping technique.9


Although the Coman and Trohman algorithm suggests that a frontal plane axis of −90° to –180° is specific for left ventricular pacing,6 other reports have identified this axis in the presence of true right ventricular pacing.6,9–12 Therefore, Barold and Giudici9 argue that a frontal plane axis in the right superior quadrant has limited diagnostic value.
POSTOPERATIVE DETECTION BY CHEST RADIOGRAPHY

A lead in the left ventricle may be a subtle finding on an anteroposterior or posteroanterior chest radiograph. The definitive view is the lateral projection, which is also true during intraoperative fluoroscopy.13–15 The tip of a malpositioned left-ventricular lead is characteristically seen farther posterior (toward the spine) in the cardiac silhouette on the lateral view (Figure 3).2 If the lead is properly positioned, the general direction of the middle to distal portion should be away from the spine.
ECHOCARDIOGRAPHY TO CONFIRM

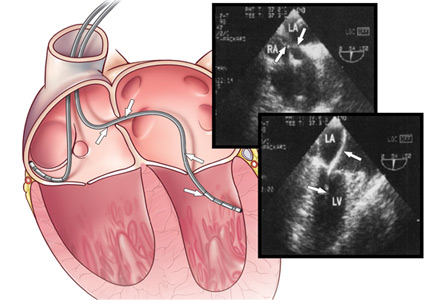
Two-dimensional echocardiography can help to confirm left ventricular placement via an atrial septal defect, patent foramen ovale, or perforation of the interventricular septum.16,17
Three-dimensional echocardiography can facilitate cardiac venous lead placement and assess the impact of right ventricular lead placement on tricuspid valve function.18,19 In one case report, 3-dimensional echocardiography provided a definitive diagnosis of interventricular septal perforation when findings on computed tomography (CT) were indeterminate.20
CT AND MRI: LIMITED ROLES
When echocardiographic findings are equivocal, CT can help diagnose lead perforation. Electrocardiogram-triggered cardiac CT can help visualize lead positions and potential lead perforation. Unfortunately, the precise location of the lead tip (and the diagnosis) can be missed due to streaking (“star”) artifacts and acoustic shadowing from the metallic lead.21–26 Because of these limitations, as well as radiation exposure and high costs, CT should be used sparingly, if at all, for diagnosing lead malposition.
Technological advances and the increasing use of magnetic resonance imaging (MRI) in clinical practice have led to the development of “MRI-conditional” cardiac implantable electronic devices (ie, safe for undergoing MRI), as well as more lenient regulation of MRI in patients with nonconditional devices.27,28 Although the widely held opinion that patients with a pacemaker or implantable cardioverter defibrillator are not eligible to undergo MRI has largely been abandoned, it seems unlikely that cardiac MRI will become a pivotal tool in assessing lead malposition.
MANAGING MALPOSITIONED LEADS
Inadvertent left ventricular lead placement provides a nidus for thrombus formation. When inadvertent left ventricular lead malposition is identified acutely, correction of the lead position should be performed immediately by an experienced electrophysiologist.
Treatment of left ventricular lead misplacement discovered late after implantation includes lead removal or chronic anticoagulation with warfarin to prevent thromboemboli.
Long-term anticoagulation
No thromboembolic events have been reported2 in patients with lead malposition who take warfarin and maintain an international normalized ratio of 2.5 to 3.5.
Antiplatelet agents are not enough by themselves.16
The use of direct oral anticoagulants has not been explored in this setting. Use of dabigatran in patients with mechanical heart valves was associated with increased rates of thromboembolic and bleeding complications compared with warfarin.29 Based on these results and an overall lack of evidence, we do not recommend substituting a direct oral anticoagulant for warfarin in the setting of malpositioned left ventricular leads.
Late percutaneous removal
Late lead removal is most appropriate if cardiac surgery is planned for other reasons. Although percutaneous extraction of a malpositioned left ventricular lead was first described over 25 years ago,13 the safety of this procedure remains uncertain.
Kosmidou et al17 reported two cases of percutaneous removal of inadvertent transarterial leads employing standard interventional cardiology methods for cerebral embolic protection. Distal embolic filter wires were deployed in the left and right internal carotid arteries. A covered stent was deployed at the arterial entry site simultaneously with lead removal, providing immediate and effective hemostasis. Similar protection should be considered during transvenous access and extraction via an atrial septal or patent foramen ovale.
Nevertheless, not even transesophageal echocardiography can reliably exclude adhered thrombi, and the risk of embolization of fibrous adhesions or thrombi has been cited as a pivotal contraindication to percutaneous lead extraction regardless of modality.16
- Rodriguez Y, Baltodano P, Tower A, Martinez C, Carrillo R. Management of symptomatic inadvertently placed endocardial leads in the left ventricle. Pacing Clin Electrophysiol 2011; 34:1192–1200.
- Ohlow MA, Roos M, Lauer B, Von Korn H, Geller JC. Incidence, predictors, and outcome of inadvertent malposition of transvenous pacing or defibrillation lead in the left heart. Europace 2016; 18:1049–1054.
- Madias C, Trohman RG. Cardiac resynchronization therapy: the state of the art. Expert Rev Cardiovasc Ther 2014; 12:573–587.
- Trohman RG. To the editor—comment on six uneventful years with a pacing lead in the left ventricle. Heart Rhythm 2013; 10:e81.
- Cossú SF. Unusual placement of a coronary sinus lead for resynchronization therapy resulting in late lead fracture. J Innovations Cardiac Rhythm Manage 2013; 4:1148–1153.
- Coman JA, Trohman RG. Incidence and electrocardiographic localization of safe right bundle branch block configurations during permanent ventricular pacing. Am J Cardiol 1995; 76:781–784.
- Klein HO, Beker B, Sareli P, DiSegni E, Dean H, Kaplinsky E. Unusual QRS morphology associated with transvenous pacemakers. The pseudo RBBB pattern. Chest 1985; 87:517–521.
- Almehairi M, Enriquez A, Redfearn D, et al. Right bundle branch block-like pattern during ventricular pacing: a surface electrocardiographic mapping technique to locate the ventricular lead. Can J Cardiol 2015; 31:1019–1024.
- Barold SS, Giudici MC. Renewed interest in the significance of the tall R wave in ECG lead V1 during right ventricular pacing. Expert Rev Med Devices 2016; 13:611–613.
- Almehairi M, Ali FS, Enriquez A, et al. Electrocardiographic algorithms to predict true right ventricular pacing in the presence of right bundle branch block-like pattern. Int J Cardiol 2014; 172:e403–e405.
- Tzeis S, Andrikopoulos G, Weigand S, et al. Right bundle branch block-like pattern during uncomplicated right ventricular pacing and the effect of pacing site. Am J Cardiol 2016; 117:935–939.
- Hemminger EJ, Criley JM. Right ventricular enlargement mimicking electrocardiographic left ventricular pacing. J Electrocardiol 2006; 39:180–182.
- Furman S. Chest PA and lateral. Pacing Clin Electrophysiol 1993; 16:953.
- Trohman RG, Wilkoff BL, Byrne T, Cook S. Successful percutaneous extraction of a chronic left ventricular pacing lead. Pacing Clin Electrophysiol 1991; 14:1448–1451.
- Trohman RG, Kim MH, Pinski SL. Cardiac pacing: the state of the art. Lancet 2004; 364:1701–1719.
- Van Gelder BM, Bracke FA, Oto A, et al. Diagnosis and management of inadvertently placed pacing and ICD leads in the left ventricle: a multicenter experience and review of the literature. Pacing Clin Electrophysiol 2000; 23:877–883.
- Kosmidou I, Karmpaliotis D, Kandzari DE, Dan D. Inadvertent transarterial lead placement in the left ventricle and aortic cusp: percutaneous lead removal with carotid embolic protection and stent graft placement. Indian Pacing Electrophysiol J 2012; 12:269–273.
- Villanueva FS, Heinsimer JA, Burkman MH, Fananapazir L,
- Halvorsen RA Jr, Chen JT. Echocardiographic detection of perforation of the cardiac ventricular septum by a permanent pacemaker lead. Am J Cardiol 1987; 59:370–371.
- Döring M, Braunschweig F, Eitel C, et al. Individually tailored left ventricular lead placement: lessons from multimodality integration between three-dimensional echocardiography and coronary sinus angiogram. Europace 2013; 15:718–727.
- Mediratta A, Addetia K, Yamat M, et al. 3D echocardiographic location of implantable device leads and mechanism of associated tricuspid regurgitation. JACC Cardiovasc Imaging 2014; 7:337–347.
- Daher IN, Saeed M, Schwarz ER, Agoston I, Rahman MA, Ahmad M. Live three-dimensional echocardiography in diagnosis of interventricular septal perforation by pacemaker lead. Echocardiography 2006; 23:428–429.
- Mak GS, Truong QA. Cardiac CT: imaging of and through cardiac devices. Curr Cardiovasc Imaging Rep 2012; 5:328–336.
- Henrikson CA, Leng CT, Yuh DD, Brinker JA. Computed tomography to assess possible cardiac lead perforation. Pacing Clin Electrophysiol 2006; 29:509–511.
- Hirschl DA, Jain VR, Spindola-Franco H, Gross JN, Haramati LB. Prevalence and characterization of asymptomatic pacemaker and ICD lead perforation on CT. Pacing Clin Electrophysiol 2007; 30:28–32.
- Pang BJ, Lui EH, Joshi SB, et al. Pacing and implantable cardioverter defibrillator lead perforation as assessed by multiplanar reformatted ECG-gated cardiac computed tomography and clinical correlates. Pacing Clin Electrophysiol 2014; 37:537–545.
- Lanzman RS, Winter J, Blondin D, et al. Where does it lead? Imaging features of cardiovascular implantable electronic devices on chest radiograph and CT. Korean J Radiol 2011; 12:611–619.
- van der Graaf AW, Bhagirath P, Götte MJ. MRI and cardiac implantable electronic devices; current status and required safety conditions. Neth Heart J 2014; 22:269–276.
- European Society of Cardiology (ESC), European Heart Rhythm Association (EHRA); Brignole M, Auricchio A, Baron-Esquivias G, et al. 2013 ESC guidelines on cardiac pacing and cardiac resynchronization therapy: the Task Force on cardiac pacing and resynchronization therapy of the European Society of Cardiology (ESC). Developed in collaboration with the European Heart Rhythm Association (EHRA). Europace 2013; 15:1070–1118.
- Eikelboom JW, Connolly SJ, Brueckmann M, et al; RE-ALIGN Investigators. Dabigatran versus warfarin in patients with mechanical heart valves. N Engl J Med 2013; 369:1206–1214.
Although rare, inadvertent placement of a pacemaker or defibrillator lead in the left ventricle can have serious consequences, including arterial thromboembolism and aortic or mitral valve damage or infection.1–4
This article discusses situations in which lead malpositioning is likely to occur, how to prevent it, how to detect and correct it immediately, and how to manage cases discovered long after implantation.
RARE, BUT LIKELY UNDERREPORTED
In 2011, Rodriguez et al1 reviewed 56 reported cases in which an endocardial lead had been mistakenly placed in the left ventricle. A few more cases have been reported since then, but some cases are not reported, so how often this occurs is unknown.
A large single-center retrospective study2 reported a 3.4% incidence of inadvertent lead placement in the left side of the heart, including the cardiac veins.
HOW LEADS CAN END UP IN THE WRONG PLACE
Risk factors for lead malpositioning include abnormal thoracic anatomy, underlying congenital heart disease, and operator inexperience.2
Normally, in single- and double-lead systems, leads are inserted into a cephalic, subclavian, or axillary vein and advanced into the right atrium, right ventricle, or both. However, pacing, sensing, and defibrillation leads have inadvertently been placed in the left ventricular endocardium and even on the epicardial surface.
Leads can end up inside the left ventricle by passing through an unrecognized atrial septal defect, patent foramen ovale, or ventricular septal defect, or by perforating the interventricular septum. Another route into the left ventricle is by gaining vascular access through the axillary or subclavian artery and advancing the lead retrograde across the aortic valve.
Epicardial lead placement may result from perforating the right ventricle5 or inadvertent positioning within the main coronary sinus or in a cardiac vein.
PREVENTION IS THE BEST MANAGEMENT
The best way to manage lead malpositioning is to prevent it in the first place.
Make sure you are in a vein, not an artery! If you are working from the patient’s left side, you should see the guidewire cross the midline on fluoroscopy. Working from either the left or the right side, you can ensure that the guidewire is in the venous system by advancing it into the inferior vena cava and then all the way below the diaphragm (best seen on anteroposterior views). These observations help avoid lead placement in the left ventricle by an inadvertent retrograde aortic approach.
Suspect that you are taking the wrong route to the heart (ie, through the arterial system) if, in the anteroposterior view, the guidewire bends as it approaches the left spinal border. This sign suggests that you are going backwards through the ascending aorta and bumping up against the aortic cusps. Occasionally, the wire may pass through the aortic valve without resistance and bending. Additional advancement toward the left chest wall will make contact with the left ventricular endocardium and may result in ventricular ectopy. Placement in the left ventricle is best seen in the left anterior oblique projection; the lead will cross the spine or its distal end will point toward the spine in progressive projections from farther to the left.
Make sure you are in the right ventricle. Even if you have gone through the venous system, you are not home free. Advancing the lead into the right ventricular outflow tract (best seen in the right anterior oblique projection) is a key step in avoiding lead misplacement. In the right ventricular outflow tract, the lead tip should move freely; if it does not, it may be in the coronary sinus or middle cardiac vein.
If a lead passes through a patent foramen ovale or septal defect to the left atrium, a left anterior oblique view should also demonstrate movement toward or beyond the spine. If the lead passes beyond the left heart border, a position in a pulmonary vein is possible. This is often associated with loss of a recordable intracardiac electrogram. A position in a right pulmonary vein is possible but very, very unlikely. If a lead passes through a patent foramen ovale or septal defect to the left ventricle, it will point toward the spine in left anterior oblique projections. (See “Postoperative detection by chest radiography.”)
Ventricular paced QRS complexes should show a left bundle branch pattern on electrocardiography (ECG), not a right bundle branch pattern (more about this below). However, when inserting a pacemaker, the sterile field includes the front of the chest and therefore lead V1 is usually omitted, depriving the operator of valuable information.
Fortunately, operators may fluoroscopically view leads intended for the right ventricle in left anterior oblique projections. We recommend beginning at 40° left anterior oblique. In this view, septally positioned right ventricular leads may appear to abut the spine. A right ventricular position is confirmed in a steeper left anterior oblique projection, where the lead should be seen to be away from the spine.4
POSTOPERATIVE DETECTION BY ECG
Careful evaluation of the 12-lead electrocardiogram during ventricular pacing is important for confirming correct lead placement. If ventricular pacing is absent, eg, if the device fires only if the natural heart rate drops below a set number and the heart happens to be firing on its own when you happen to be looking at it, programming the device to pace the right ventricle 10 beats per minute faster than the intrinsic heart rate usually suffices. Temporarily disabling atrial pacing and cardiac venous pacing in biventricular devices facilitates interpretation of the paced QRS complex.
Bundle branch block patterns
The typical morphology for paced events originating from the right ventricle has a left bundle branch block pattern, ie, a dominant S wave in leads V1 and V2. Nevertheless, many patients with a safely placed lead in the right ventricle can also demonstrate right bundle branch morphology during pacing,6 ie, a dominant R wave in leads V1 and V2.
Klein et al7 reported on 8 patients who had features of right bundle branch block in leads V1 and V2 and noted that placing these leads 1 interspace lower eliminated the right bundle branch block appearance. The utility of this maneuver is demonstrated in Figure 1.
Almehairi et al8 demonstrated transition to a left bundle branch block-like pattern in V1 in 14 of 26 patients after leads V1 and V2 were moved to the fifth intercostal space. Moving these leads to the sixth intercostal space produced a left bundle branch block-like pattern in all the remaining patients. Additional study is needed to validate this precordial mapping technique.9
Although the Coman and Trohman algorithm suggests that a frontal plane axis of −90° to –180° is specific for left ventricular pacing,6 other reports have identified this axis in the presence of true right ventricular pacing.6,9–12 Therefore, Barold and Giudici9 argue that a frontal plane axis in the right superior quadrant has limited diagnostic value.
POSTOPERATIVE DETECTION BY CHEST RADIOGRAPHY
A lead in the left ventricle may be a subtle finding on an anteroposterior or posteroanterior chest radiograph. The definitive view is the lateral projection, which is also true during intraoperative fluoroscopy.13–15 The tip of a malpositioned left-ventricular lead is characteristically seen farther posterior (toward the spine) in the cardiac silhouette on the lateral view (Figure 3).2 If the lead is properly positioned, the general direction of the middle to distal portion should be away from the spine.
ECHOCARDIOGRAPHY TO CONFIRM
Two-dimensional echocardiography can help to confirm left ventricular placement via an atrial septal defect, patent foramen ovale, or perforation of the interventricular septum.16,17
Three-dimensional echocardiography can facilitate cardiac venous lead placement and assess the impact of right ventricular lead placement on tricuspid valve function.18,19 In one case report, 3-dimensional echocardiography provided a definitive diagnosis of interventricular septal perforation when findings on computed tomography (CT) were indeterminate.20
CT AND MRI: LIMITED ROLES
When echocardiographic findings are equivocal, CT can help diagnose lead perforation. Electrocardiogram-triggered cardiac CT can help visualize lead positions and potential lead perforation. Unfortunately, the precise location of the lead tip (and the diagnosis) can be missed due to streaking (“star”) artifacts and acoustic shadowing from the metallic lead.21–26 Because of these limitations, as well as radiation exposure and high costs, CT should be used sparingly, if at all, for diagnosing lead malposition.
Technological advances and the increasing use of magnetic resonance imaging (MRI) in clinical practice have led to the development of “MRI-conditional” cardiac implantable electronic devices (ie, safe for undergoing MRI), as well as more lenient regulation of MRI in patients with nonconditional devices.27,28 Although the widely held opinion that patients with a pacemaker or implantable cardioverter defibrillator are not eligible to undergo MRI has largely been abandoned, it seems unlikely that cardiac MRI will become a pivotal tool in assessing lead malposition.
MANAGING MALPOSITIONED LEADS
Inadvertent left ventricular lead placement provides a nidus for thrombus formation. When inadvertent left ventricular lead malposition is identified acutely, correction of the lead position should be performed immediately by an experienced electrophysiologist.
Treatment of left ventricular lead misplacement discovered late after implantation includes lead removal or chronic anticoagulation with warfarin to prevent thromboemboli.
Long-term anticoagulation
No thromboembolic events have been reported2 in patients with lead malposition who take warfarin and maintain an international normalized ratio of 2.5 to 3.5.
Antiplatelet agents are not enough by themselves.16
The use of direct oral anticoagulants has not been explored in this setting. Use of dabigatran in patients with mechanical heart valves was associated with increased rates of thromboembolic and bleeding complications compared with warfarin.29 Based on these results and an overall lack of evidence, we do not recommend substituting a direct oral anticoagulant for warfarin in the setting of malpositioned left ventricular leads.
Late percutaneous removal
Late lead removal is most appropriate if cardiac surgery is planned for other reasons. Although percutaneous extraction of a malpositioned left ventricular lead was first described over 25 years ago,13 the safety of this procedure remains uncertain.
Kosmidou et al17 reported two cases of percutaneous removal of inadvertent transarterial leads employing standard interventional cardiology methods for cerebral embolic protection. Distal embolic filter wires were deployed in the left and right internal carotid arteries. A covered stent was deployed at the arterial entry site simultaneously with lead removal, providing immediate and effective hemostasis. Similar protection should be considered during transvenous access and extraction via an atrial septal or patent foramen ovale.
Nevertheless, not even transesophageal echocardiography can reliably exclude adhered thrombi, and the risk of embolization of fibrous adhesions or thrombi has been cited as a pivotal contraindication to percutaneous lead extraction regardless of modality.16
- Rodriguez Y, Baltodano P, Tower A, Martinez C, Carrillo R. Management of symptomatic inadvertently placed endocardial leads in the left ventricle. Pacing Clin Electrophysiol 2011; 34:1192–1200.
- Ohlow MA, Roos M, Lauer B, Von Korn H, Geller JC. Incidence, predictors, and outcome of inadvertent malposition of transvenous pacing or defibrillation lead in the left heart. Europace 2016; 18:1049–1054.
- Madias C, Trohman RG. Cardiac resynchronization therapy: the state of the art. Expert Rev Cardiovasc Ther 2014; 12:573–587.
- Trohman RG. To the editor—comment on six uneventful years with a pacing lead in the left ventricle. Heart Rhythm 2013; 10:e81.
- Cossú SF. Unusual placement of a coronary sinus lead for resynchronization therapy resulting in late lead fracture. J Innovations Cardiac Rhythm Manage 2013; 4:1148–1153.
- Coman JA, Trohman RG. Incidence and electrocardiographic localization of safe right bundle branch block configurations during permanent ventricular pacing. Am J Cardiol 1995; 76:781–784.
- Klein HO, Beker B, Sareli P, DiSegni E, Dean H, Kaplinsky E. Unusual QRS morphology associated with transvenous pacemakers. The pseudo RBBB pattern. Chest 1985; 87:517–521.
- Almehairi M, Enriquez A, Redfearn D, et al. Right bundle branch block-like pattern during ventricular pacing: a surface electrocardiographic mapping technique to locate the ventricular lead. Can J Cardiol 2015; 31:1019–1024.
- Barold SS, Giudici MC. Renewed interest in the significance of the tall R wave in ECG lead V1 during right ventricular pacing. Expert Rev Med Devices 2016; 13:611–613.
- Almehairi M, Ali FS, Enriquez A, et al. Electrocardiographic algorithms to predict true right ventricular pacing in the presence of right bundle branch block-like pattern. Int J Cardiol 2014; 172:e403–e405.
- Tzeis S, Andrikopoulos G, Weigand S, et al. Right bundle branch block-like pattern during uncomplicated right ventricular pacing and the effect of pacing site. Am J Cardiol 2016; 117:935–939.
- Hemminger EJ, Criley JM. Right ventricular enlargement mimicking electrocardiographic left ventricular pacing. J Electrocardiol 2006; 39:180–182.
- Furman S. Chest PA and lateral. Pacing Clin Electrophysiol 1993; 16:953.
- Trohman RG, Wilkoff BL, Byrne T, Cook S. Successful percutaneous extraction of a chronic left ventricular pacing lead. Pacing Clin Electrophysiol 1991; 14:1448–1451.
- Trohman RG, Kim MH, Pinski SL. Cardiac pacing: the state of the art. Lancet 2004; 364:1701–1719.
- Van Gelder BM, Bracke FA, Oto A, et al. Diagnosis and management of inadvertently placed pacing and ICD leads in the left ventricle: a multicenter experience and review of the literature. Pacing Clin Electrophysiol 2000; 23:877–883.
- Kosmidou I, Karmpaliotis D, Kandzari DE, Dan D. Inadvertent transarterial lead placement in the left ventricle and aortic cusp: percutaneous lead removal with carotid embolic protection and stent graft placement. Indian Pacing Electrophysiol J 2012; 12:269–273.
- Villanueva FS, Heinsimer JA, Burkman MH, Fananapazir L,
- Halvorsen RA Jr, Chen JT. Echocardiographic detection of perforation of the cardiac ventricular septum by a permanent pacemaker lead. Am J Cardiol 1987; 59:370–371.
- Döring M, Braunschweig F, Eitel C, et al. Individually tailored left ventricular lead placement: lessons from multimodality integration between three-dimensional echocardiography and coronary sinus angiogram. Europace 2013; 15:718–727.
- Mediratta A, Addetia K, Yamat M, et al. 3D echocardiographic location of implantable device leads and mechanism of associated tricuspid regurgitation. JACC Cardiovasc Imaging 2014; 7:337–347.
- Daher IN, Saeed M, Schwarz ER, Agoston I, Rahman MA, Ahmad M. Live three-dimensional echocardiography in diagnosis of interventricular septal perforation by pacemaker lead. Echocardiography 2006; 23:428–429.
- Mak GS, Truong QA. Cardiac CT: imaging of and through cardiac devices. Curr Cardiovasc Imaging Rep 2012; 5:328–336.
- Henrikson CA, Leng CT, Yuh DD, Brinker JA. Computed tomography to assess possible cardiac lead perforation. Pacing Clin Electrophysiol 2006; 29:509–511.
- Hirschl DA, Jain VR, Spindola-Franco H, Gross JN, Haramati LB. Prevalence and characterization of asymptomatic pacemaker and ICD lead perforation on CT. Pacing Clin Electrophysiol 2007; 30:28–32.
- Pang BJ, Lui EH, Joshi SB, et al. Pacing and implantable cardioverter defibrillator lead perforation as assessed by multiplanar reformatted ECG-gated cardiac computed tomography and clinical correlates. Pacing Clin Electrophysiol 2014; 37:537–545.
- Lanzman RS, Winter J, Blondin D, et al. Where does it lead? Imaging features of cardiovascular implantable electronic devices on chest radiograph and CT. Korean J Radiol 2011; 12:611–619.
- van der Graaf AW, Bhagirath P, Götte MJ. MRI and cardiac implantable electronic devices; current status and required safety conditions. Neth Heart J 2014; 22:269–276.
- European Society of Cardiology (ESC), European Heart Rhythm Association (EHRA); Brignole M, Auricchio A, Baron-Esquivias G, et al. 2013 ESC guidelines on cardiac pacing and cardiac resynchronization therapy: the Task Force on cardiac pacing and resynchronization therapy of the European Society of Cardiology (ESC). Developed in collaboration with the European Heart Rhythm Association (EHRA). Europace 2013; 15:1070–1118.
- Eikelboom JW, Connolly SJ, Brueckmann M, et al; RE-ALIGN Investigators. Dabigatran versus warfarin in patients with mechanical heart valves. N Engl J Med 2013; 369:1206–1214.
KEY POINTS
- During device implantation, fluoroscopy in progressively lateral left anterior oblique views should be used to ensure correct lead position.
- After implantation, malposition can almost always be detected promptly by examining a 12-lead electrocardiogram for the paced QRS morphology and by lateral chest radiography.
- Echocardiography and computed tomography may enhance diagnostic accuracy and clarify equivocal findings.
- Late surgical correction of a malpositioned lead is best done when a patient is undergoing cardiac surgery for other reasons.
- Long-term warfarin therapy is recommended to prevent thromboembolism if malpositioning cannot be corrected.
A New Year’s transition and looking forward

Dr. Cosgrove took the leadership reins of the Clinic in 2004, the same year Dr. Mihaljevic joined the Department of Cardiothoracic Surgery. Under Dr. Cosgrove’s leadership the Clinic has grown in size, scope of practice, and international impact. His support of education has contributed enormously to the maturation of the Cleveland Clinic Lerner College of Medicine, the continued successes of our sizeable postgraduate education training program, and many other activities including our CME Center and the Cleveland Clinic Journal of Medicine. His willingness to recognize and continue to subsidize the Journal as an educational vehicle, with no direct marketing intent, has permitted the Journal to thrive in the international medical education space as a leading purveyor of sound, practical, evidence-based medical information. I speak for our editorial staff, authors, and readers when I say, “Thank you, Toby, for your support, trust, and belief in our educational mission.”
Dr. Mihaljevic is also a notable cardiothoracic surgeon, widely recognized for his skills and expertise in innovative minimally invasive and robotic-assisted cardiac valve surgery. He has returned to our Cleveland campus after several years as CEO of Cleveland Clinic Abu Dhabi. We welcome him back in his new role.
As Cleveland Clinic leadership undergoes an expected smooth transition, healthcare in the United States seems perpetually stuck trying to balance the response to a plethora of scientific and clinical advances, the rapid technologic changes in healthcare delivery systems, the cost-profit distribution within and external to expanding healthcare systems, and divergent social and political pressures. Advances in molecular medicine are changing the diagnosis and therapy of cancers and inflammatory diseases. Personalized precision medicine is evolving from the abstract to the tangible. Surgical advances on a true macro scale are leading to deliverable, effective treatments of the metabolic manifestations of diabetes, while microscopic, intravascular, and minimally invasive approaches are transforming the management of patients with structural and infiltrative disease. Understanding of the microbiome may well lead to better management of cardiovascular and inflammatory diseases. There have been advances in tissue scaffolding as well as gene and cell replacement techniques that may soon transform the therapy of several diseases. These advances provide cause for intellectual and clinical enthusiasm.
And yet, the environment in which we live and practice is increasingly divided and divisive socially and politically. Medicine has lost much of its luster. Burnout and early retirement are adversely affecting the physician workforce. The current model of financial support for medical education in the United States is being reevaluated, without a clear effective alternative. Costs of healthcare are rising at unsustainable rates, and swathes of our vulnerable, elderly, and young middle-class population are faced with serious challenges in getting and maintaining medical care because it is inaccessible and unaffordable. Even for patients of comfortable financial means, acquiring health insurance is not an activity for the weak of heart (and that weakness might be interpreted in the future as a pre-existing condition).
Who will pay for the exciting innovations I noted above, and who will deliver them? As reimbursement is shrinking, the time demands for physician electronic charting and communications with insurance companies are increasing. More physicians are employed and controlled by healthcare systems. How many will have the time and updated knowledge to discuss the appropriateness and clinical implications of these therapies between the phone calls begging for insurance company approval of coverage and payment?
As corporate taxes appear on the brink of being reduced, we can hope that this corporate financial benefit will translate to reduced drug and device costs and more affordable insurance for our more vulnerable populations. But this is not certain.
I have concerns as to how clinical science and healthcare delivery can move forward in an environment in which federal directives now prohibit our most respected federal research agencies from using such terms as “vulnerable” (populations) and “evidence-based” to justify their proposals for budgetary support for their ongoing work in population disease health and disease management.1 Even a short time spent in the hallways or emergency rooms of any of our safety-net hospitals reveals the strain that acute and chronic illness is imposing on the social fabric of families, society, and the often underfunded infrastructure of this aspect of our healthcare system. Who will be in the position to empathetically and objectively assess the value of translating these ongoing efforts in discovery to implementation?
Basic stem cell and genetic research is also under ongoing scrutiny. There remains legitimate fear that ultimate policy decisions will not be made by fully informed scientists and ethicists. The ongoing “dialogue” in the United States around climate change and global warming does not give me confidence that our current government policy-makers are up to the task of objectively dealing with these more nuanced and emotionally charged issues, particularly while avoiding the expression of any evidence-based rationales.
In 2016, the world lost the iconic musical poet Leonard Cohen. Hopefully, he got it right when he wrote:
Ring the bells that still can ring
Forget your perfect offering
There is a crack in everything
That’s how the light gets in
—“Anthem”; 1992
I and the rest of our editorial team wish you, our readers, a healthy and peaceful 2018. I am optimistic that we can all find or create at least some light.
- Sun LH, Eilperin J. CDC gets list of forbidden words: fetus, transgender, diversity. The Washington Post December 15, 2017.
Dr. Cosgrove took the leadership reins of the Clinic in 2004, the same year Dr. Mihaljevic joined the Department of Cardiothoracic Surgery. Under Dr. Cosgrove’s leadership the Clinic has grown in size, scope of practice, and international impact. His support of education has contributed enormously to the maturation of the Cleveland Clinic Lerner College of Medicine, the continued successes of our sizeable postgraduate education training program, and many other activities including our CME Center and the Cleveland Clinic Journal of Medicine. His willingness to recognize and continue to subsidize the Journal as an educational vehicle, with no direct marketing intent, has permitted the Journal to thrive in the international medical education space as a leading purveyor of sound, practical, evidence-based medical information. I speak for our editorial staff, authors, and readers when I say, “Thank you, Toby, for your support, trust, and belief in our educational mission.”
Dr. Mihaljevic is also a notable cardiothoracic surgeon, widely recognized for his skills and expertise in innovative minimally invasive and robotic-assisted cardiac valve surgery. He has returned to our Cleveland campus after several years as CEO of Cleveland Clinic Abu Dhabi. We welcome him back in his new role.
As Cleveland Clinic leadership undergoes an expected smooth transition, healthcare in the United States seems perpetually stuck trying to balance the response to a plethora of scientific and clinical advances, the rapid technologic changes in healthcare delivery systems, the cost-profit distribution within and external to expanding healthcare systems, and divergent social and political pressures. Advances in molecular medicine are changing the diagnosis and therapy of cancers and inflammatory diseases. Personalized precision medicine is evolving from the abstract to the tangible. Surgical advances on a true macro scale are leading to deliverable, effective treatments of the metabolic manifestations of diabetes, while microscopic, intravascular, and minimally invasive approaches are transforming the management of patients with structural and infiltrative disease. Understanding of the microbiome may well lead to better management of cardiovascular and inflammatory diseases. There have been advances in tissue scaffolding as well as gene and cell replacement techniques that may soon transform the therapy of several diseases. These advances provide cause for intellectual and clinical enthusiasm.
And yet, the environment in which we live and practice is increasingly divided and divisive socially and politically. Medicine has lost much of its luster. Burnout and early retirement are adversely affecting the physician workforce. The current model of financial support for medical education in the United States is being reevaluated, without a clear effective alternative. Costs of healthcare are rising at unsustainable rates, and swathes of our vulnerable, elderly, and young middle-class population are faced with serious challenges in getting and maintaining medical care because it is inaccessible and unaffordable. Even for patients of comfortable financial means, acquiring health insurance is not an activity for the weak of heart (and that weakness might be interpreted in the future as a pre-existing condition).
Who will pay for the exciting innovations I noted above, and who will deliver them? As reimbursement is shrinking, the time demands for physician electronic charting and communications with insurance companies are increasing. More physicians are employed and controlled by healthcare systems. How many will have the time and updated knowledge to discuss the appropriateness and clinical implications of these therapies between the phone calls begging for insurance company approval of coverage and payment?
As corporate taxes appear on the brink of being reduced, we can hope that this corporate financial benefit will translate to reduced drug and device costs and more affordable insurance for our more vulnerable populations. But this is not certain.
I have concerns as to how clinical science and healthcare delivery can move forward in an environment in which federal directives now prohibit our most respected federal research agencies from using such terms as “vulnerable” (populations) and “evidence-based” to justify their proposals for budgetary support for their ongoing work in population disease health and disease management.1 Even a short time spent in the hallways or emergency rooms of any of our safety-net hospitals reveals the strain that acute and chronic illness is imposing on the social fabric of families, society, and the often underfunded infrastructure of this aspect of our healthcare system. Who will be in the position to empathetically and objectively assess the value of translating these ongoing efforts in discovery to implementation?
Basic stem cell and genetic research is also under ongoing scrutiny. There remains legitimate fear that ultimate policy decisions will not be made by fully informed scientists and ethicists. The ongoing “dialogue” in the United States around climate change and global warming does not give me confidence that our current government policy-makers are up to the task of objectively dealing with these more nuanced and emotionally charged issues, particularly while avoiding the expression of any evidence-based rationales.
In 2016, the world lost the iconic musical poet Leonard Cohen. Hopefully, he got it right when he wrote:
Ring the bells that still can ring
Forget your perfect offering
There is a crack in everything
That’s how the light gets in
—“Anthem”; 1992
I and the rest of our editorial team wish you, our readers, a healthy and peaceful 2018. I am optimistic that we can all find or create at least some light.
- Sun LH, Eilperin J. CDC gets list of forbidden words: fetus, transgender, diversity. The Washington Post December 15, 2017.
- Sun LH, Eilperin J. CDC gets list of forbidden words: fetus, transgender, diversity. The Washington Post December 15, 2017.

High users of healthcare: Strategies to improve care, reduce costs
Emergency departments are not primary care clinics, but some patients use them that way. This relatively small group of patients consumes a disproportionate share of healthcare at great cost, earning them the label of “high users.” Mostly poor and often burdened with mental illness and addiction, they are not necessarily sicker than other patients, and they do not enjoy better outcomes from the extra money spent on them. (Another subset of high users, those with end-stage chronic disease, is outside the scope of this review.)
Herein lies an opportunity. If—and this is a big if—we could manage their care in a systematic way instead of haphazardly, proactively instead of reactively, with continuity of care instead of episodically, and in a way that is convenient for the patient, we might be able to improve quality and save money.
A DISPROPORTIONATE SHARE OF COSTS
In the United States in 2012, the 5% of the population who were the highest users were responsible for 50% of healthcare costs.1 The mean cost per person in this group was more than $43,000 annually. The top 1% of users accounted for nearly 23% of all expenditures, averaging nearly $98,000 per patient per year—10 times more than the average yearly cost per patient.
CARE IS OFTEN INAPPROPRIATE AND UNNECESSARY
In addition to being disproportionately expensive, the care that these patients receive is often inappropriate and unnecessary for the severity of their disease.
A 2007–2009 study2 of 1,969 patients who had visited the emergency department 10 or more times in a year found they received more than twice as many computed tomography (CT) scans as a control group of infrequent users (< 3 visits/year). This occurred even though they were not as sick as infrequent users, based on significantly lower hospital admission rates (11.1% vs 17.9%; P < .001) and mortality rates (0.7% vs 1.5%; P < .002).2
This inverse relationship between emergency department use and illness severity was even more exaggerated at the upper extreme of the use curve. The highest users (> 29 visits to the emergency department in a year) had the lowest triage acuity and hospital admission rates but the highest number of CT scans. Charges per visit were lower among frequent users, but total charges rose steadily with increasing emergency department use, accounting for significantly more costs per year.2
We believe that one reason these patients receive more medical care than necessary is because their medical records are too large and complex for the average physician to distill effectively in a 20-minute physician-patient encounter. Physicians therefore simply order more tests, procedures, and admissions, which are often medically unnecessary and redundant.
WHAT DRIVES HIGH COST?
Mental illness and chemical dependence
Drug addiction, mental illness, and poverty frequently accompany (and influence) high-use behavior, particularly in patients without end-stage diseases.
Szekendi et al,3 in a study of 28,291 patients who had been admitted at least 5 times in a year in a Chicago health system, found that these high users were 2 to 3 times more likely to suffer from comorbid depression (40% vs 13%), psychosis (18% vs 5%), recreational drug dependence (20% vs 7%), and alcohol abuse (16% vs 7%) than non-high-use hospitalized patients.3
Mercer et al4 conducted a study at Duke University Medical Center, Durham, NC, aimed at reducing emergency department visits and hospital admissions among 24 of its highest users. They found that 23 (96%) were either addicted to drugs or mentally ill, and 20 (83%) suffered from chronic pain.4
Drug abuse among high users is becoming even more relevant as the opioid epidemic worsens. Given that most patients requiring high levels of care suffer from chronic pain and many of them develop an opioid addiction while treating their pain, physicians have a moral imperative to reduce the prevalence of drug abuse in this population.
Low socioeconomic status
Low socioeconomic status is an important factor among high users, as it is highly associated with greater disease severity, which usually increases cost without any guarantee of an associated increase in quality. Data suggest that patients of low socioeconomic status are twice as likely to require urgent emergency department visits, 4 times as likely to require admission to the hospital, and, importantly, about half as likely to use ambulatory care compared with patients of higher socioeconomic status.5 While this pattern of low-quality, high-cost spending in acute care settings reflects spending in the healthcare system at large, the pattern is greatly exaggerated among high users.
Lost to follow-up
Low socioeconomic status also complicates communication and follow-up. In a 2013 study, physician researchers in St. Paul, MN, documented attempts to interview 64 recently discharged high users. They could not reach 47 (73%) of them, for reasons largely attributable to low socioeconomic status, such as disconnected phone lines and changes in address.6
Clearly, the usual contact methods for follow-up care after discharge, such as phone calls and mailings, are unlikely to be effective in coordinating the outpatient care of these individuals.
Additionally, we must find ways of making primary care more convenient, gaining our patients’ trust, and finding ways to engage patients in follow-up without relying on traditional means of communication.
Do high users have medical insurance?
Surprisingly, most high users of the emergency department have health insurance. The Chicago health system study3 found that most (72.4%) of their high users had either Medicare or private health insurance, while 27.6% had either Medicaid or no insurance (compared with 21.6% in the general population). Other studies also found that most of the frequent emergency department users are insured,7 although the overall percentage who rely on publicly paid insurance is greater than in the population at large.
Many prefer acute care over primary care
Although one might think that high users go to the emergency department because they have nowhere else to go for care, a report published in 2013 by Kangovi et al5 suggests another reason—they prefer the emergency department.5 They interviewed 40 urban patients of low socioeconomic status who consistently cited the 24-hour, no-appointment-necessary structure of the emergency department as an advantage over primary care. The flexibility of emergency access to healthcare makes sense if one reflects on how difficult it is for even high-functioning individuals to schedule and keep medical appointments.
Specific reasons for preferring the emergency department included the following:
Affordability. Even if their insurance fully paid for visits to their primary care physicians, the primary care physician was likely to refer them to specialists, whose visits required a copay, and which required taking another day off of work. The emergency department is cheaper for the patient and it is a “one-stop shop.” Patients appreciated the emergency department guarantee of seeing a physician regardless of proof of insurance, a policy not guaranteed in primary care and specialist offices.
Accessibility. For those without a car, public transportation and even patient transportation services are inconvenient and unreliable, whereas emergency medical services will take you to the emergency department.
Accommodations. Although medical centers may tout their same-day appointments, often same-day appointments are all that they have—and you have no choice about the time. You have to call first thing in the morning and stay on hold for a long time, and then when you finally get through, all the same-day appointments are gone.
Availability. Patients said they often had a hard time getting timely medical advice from their primary care physicians. When they could get through to their primary care physicians on the phone, they would be told to go to the emergency department.
Acceptability. Men, especially, feel they need to be very sick indeed to seek medical care, so going to the emergency department is more acceptable.
Trust in the provider. For reasons that were not entirely clear, patients felt that acute care providers were more trustworthy, competent, and compassionate than primary care physicians.5
None of these reasons for using the emergency department has anything to do with disease severity, which supports the findings that high users of the emergency department were not as sick as their normal-use peers.2
QUALITY IMPROVEMENT AND COST-REDUCTION STRATEGIES
Efforts are being made to reduce the cost of healthcare for high users while improving the quality of their care. Promising strategies focus on coordinating care management, creating individualized patient care plans, and improving the components and instructions of discharge summaries.
Care management organizations
A care management organization (CMO) model has emerged as a strategy for quality improvement and cost reduction in the high-use population. In this model, social workers, health coaches, nurses, mid-level providers, and physicians collaborate on designing individualized care plans to meet the specific needs of patients.
Teams typically work in stepwise fashion, first identifying and engaging patients at high risk of poor outcomes and unnecessary care, often using sophisticated quantitative, risk-prediction tools. Then, they perform health assessments and identify potential interventions aimed at preventing expensive acute-care medical interventions. Third, they work with patients to rapidly identify and effectively respond to changes in their conditions and direct them to the most appropriate medical setting, typically primary or urgent care.
Effective models
In 1998, the Camden (NJ) Coalition of Healthcare Providers established a model for CMO care plans. Starting with the first 36 patients enrolled in the program, hospital admissions and emergency department visits were cut by 47% (from 62 to 37 per month), and collective hospital costs were cut by 56% (from $1.2 million to about $500,000 per month).8 It should be noted that this was a small, nonrandomized study and these preliminary numbers did not take into account the cost of outpatient physician visits or new medications. Thus, how much money this program actually saves is not clear.
Similar programs have had similar results. A nurse-led care coordination program in Doylestown, PA, showed an impressive 25% reduction in annual mortality and a 36% reduction in overall costs during a 10-year period.9
A program in Atlantic City, NJ, combined the typical CMO model with a primary care clinic to provide high users with unlimited access, while paying its providers in a capitation model (as opposed to fee for service). It achieved a 40% reduction in yearly emergency department visits and hospital admissions.8
Patient care plans
Individualized patient care plans for high users are among the most promising tools for reducing costs and improving quality in this group. They are low-cost and relatively easy to implement. The goal of these care plans is to provide practitioners with a concise care summary to help them make rational and consistent medical decisions.
Typically, a care plan is written by an interdisciplinary committee composed of physicians, nurses, and social workers. It is based on the patient’s pertinent medical and psychiatric history, which may include recent imaging results or other relevant diagnostic tests. It provides suggestions for managing complex chronic issues, such as drug abuse, that lead to high use of healthcare resources.
These care plans provide a rational and prespecified approach to workup and management, typically including a narcotic prescription protocol, regardless of the setting or the number of providers who see the patient. Practitioners guided by effective care plans are much more likely to effectively navigate a complex patient encounter as opposed to looking through extensive medical notes and hoping to find relevant information.
Effective models
Data show these plans can be effective. For example, Regions Hospital in St. Paul, MN, implemented patient care plans in 2010. During the first 4 months, hospital admissions in the first 94 patients were reduced by 67%.10
A study of high users at Duke University Medical Center reported similar results. One year after starting care plans, inpatient admissions had decreased by 50.5%, readmissions had decreased by 51.5%, and variable direct costs per admission were reduced by 35.8%. Paradoxically, emergency department visits went up, but this anomaly was driven by 134 visits incurred by a single dialysis patient. After removing this patient from the data, emergency department visits were relatively stable.4
Better discharge summaries
Although improving discharge summaries is not a novel concept, changing the summary from a historical document to a proactive discharge plan has the potential to prevent readmissions and promote a durable de-escalation in care acuity.
For example, when moving a patient to a subacute care facility, providing a concise summary of which treatments worked and which did not, a list of comorbidities, and a list of medications and strategies to consider, can help the next providers to better target their plan of care. Studies have shown that nearly half of discharge statements lack important information on treatments and tests.11
Improvement can be as simple as encouraging practitioners to construct their summaries in an “if-then” format. Instead of noting for instance that “Mr. Smith was treated for pneumonia with antibiotics and discharged to a rehab facility,” the following would be more useful: “Family would like to see if Mr. Smith can get back to his functional baseline after his acute pneumonia. If he clinically does not do well over the next 1 to 2 weeks and has a poor quality of life, then family would like to pursue hospice.”
In addition to shifting the philosophy, we believe that providing timely discharge summaries is a fundamental, high-yield aspect of ensuring their effectiveness. As an example, patients being discharged to a skilled nursing facility should have a discharge summary completed and in hand before leaving the hospital.
Evidence suggests that timely writing of discharge summaries improves their quality. In a retrospective cohort study published in 2012, discharge summaries created more than 24 hours after discharge were less likely to include important plan-of-care components.12
FUTURE NEEDS
Randomized trials
Although initial results have been promising for the strategies outlined above, much of the apparent cost reduction of these interventions may be at least partially related to the study design as opposed to the interventions themselves.
For example, Hong et al13 examined 18 of the more promising CMOs that had reported initial cost savings. Of these, only 4 had conducted randomized controlled trials. When broken down further, the initial cost reduction reported by most of these randomized controlled trials was generated primarily by small subgroups.14
These results, however, do not necessarily reflect an inherent failure in the system. We contend that they merely demonstrate that CMOs and care plan administrators need to be more selective about whom they enroll, either by targeting patients at the extremes of the usage curve or by identifying patient characteristics and usage parameters amenable to cost reduction and quality improvement strategies.
Better social infrastructure
Although patient care plans and CMOs have been effective in managing high users, we believe that the most promising quality improvement and cost-reduction strategy involves redirecting much of the expensive healthcare spending to the social determinants of health (eg, homelessness, mental illness, low socioeconomic status).
 spent on healthcare and social service")
Among developed countries, the United States has the highest healthcare spending and the lowest social service spending as a percentage of its gross domestic product (Figure 1).15 Although seemingly discouraging, these data can actually be interpreted as hopeful, as they support the notion that the inefficiencies of our current system are not part of an inescapable reality, but rather reflect a system that has evolved uniquely in this country.
Using the available social programs
Exemplifying this medical and social services balance is a high user who visited her local emergency department 450 times in 1 year for reasons primarily related to homelessness.16 Each time, the medical system (as it is currently designed to do) applied a short-term medical solution to this patient’s problems and discharged her home, ie, back to the street.
But this patient’s high use was really a manifestation of a deeper social issue: homelessness. When the medical staff eventually noted how much this lack of stable shelter was contributing to her pattern of use, she was referred to appropriate social resources and provided with the housing she needed. Her hospital visits decreased from 450 to 12 in the subsequent year, amounting to a huge cost reduction and a clear improvement in her quality of life.
Similar encouraging results have resulted when available social programs are applied to the high-use population at large, which is particularly reassuring given this population’s preponderance of low socioeconomic status, mental illness, and homelessness. (The prevalence of homelessness is roughly 20%, depending on the definition of a high user).
New York Medicaid, for example, has a housing program that provides stable shelter outside of acute care medical settings for patients at a rate as low as $50 per day, compared with area hospital costs that often exceed $2,200 daily.17 A similar program in Westchester County, NY, reported a 45.9% reduction in inpatient costs and a 15.4% reduction in emergency department visits among 61 of its highest users after 2 years of enrollment.17
Need to reform privacy laws
Although legally daunting, reform of the Health Insurance Portability and Accountability Act (HIPAA) and other privacy laws in favor of a more open model of information sharing, particularly for high-risk patients, holds great opportunity for quality improvement. For patients who obtain their care from several healthcare facilities, the documentation is often inscrutable. If some of the HIPAA regulations and other patient privacy laws were exchanged for rules more akin to the current model of narcotic prescription tracking, for example, physicians would be better equipped to provide safe, organized, and efficient medical care for high-use patients.
Need to reform the system
A fundamental flaw in our healthcare system, which is largely based on a fee-for-service model, is that it was not designed for patients who use the system at the highest frequency and greatest cost. Also, it does not account for the psychosocial factors that beset many high-use patients. As such, it is imperative for the safety of our patients as well as the viability of the healthcare system that we change our historical way of thinking and reform this system that provides high users with care that is high-cost, low-quality, and not patient-centered.
IMPROVING QUALITY, REDUCING COST
High users of emergency services are a medically and socially complex group, predominantly characterized by low socioeconomic status and high rates of mental illness and drug dependency. Despite their increased healthcare use, they do not have better outcomes even though they are not sicker. Improving those outcomes requires both medical and social efforts.
Among the effective medical efforts are strategies aimed at creating individualized patient care plans, using coordinated care teams, and improving discharge summaries. Addressing patients’ social factors, such as homelessness, is more difficult, but healthcare systems can help patients navigate the available social programs. These strategies are part of a comprehensive care plan that can help reduce the cost and improve the quality of healthcare for high users.
- Cohen SB; Agency for Healthcare Research and Quality. Statistical Brief #359. The concentration of health care expenditures and related expenses for costly medical conditions, 2009. http://meps.ahrq.gov/mepsweb/data_files/publications/st359/stat359.pdf. Accessed December 18, 2017.
- Oostema J, Troost J, Schurr K, Waller R. High and low frequency emergency department users: a comparative analysis of morbidity, diagnostic testing, and health care costs. Ann Emerg Med 2011; 58:S225. Abstract 142.
- Szekendi MK, Williams MV, Carrier D, Hensley L, Thomas S, Cerese J. The characteristics of patients frequently admitted to academic medical centers in the United States. J Hosp Med 2015; 10:563–568.
- Mercer T, Bae J, Kipnes J, Velazquez M, Thomas S, Setji N. The highest utilizers of care: individualized care plans to coordinate care, improve healthcare service utilization, and reduce costs at an academic tertiary care center. J Hosp Med 2015; 10:419–424.
- Kangovi S, Barg FK, Carter T, Long JA, Shannon R, Grande D. Understanding why patients of low socioeconomic status prefer hospitals over ambulatory care. Health Aff (Millwood) 2013; 32:1196–1203.
- Melander I, Winkelman T, Hilger R. Analysis of high utilizers’ experience with specialized care plans. J Hosp Med 2014; 9(suppl 2):Abstract 229.
- LaCalle EJ, Rabin EJ, Genes NG. High-frequency users of emergency department care. J Emerg Med 2013; 44:1167–1173.
- Gawande A. The Hot Spotters. The New Yorker 2011. www.newyorker.com/magazine/2011/01/24/the-hot-spotters. Accessed December 18, 2017.
- Coburn KD, Marcantonio S, Lazansky R, Keller M, Davis N. Effect of a community-based nursing intervention on mortality in chronically ill older adults: a randomized controlled trial. PLoS Med 2012; 9:e1001265.
- Hilger R, Melander I, Winkelman T. Is specialized care plan work sustainable? A follow-up on healthpartners’ experience with patients who are high-utilizers. Society of Hospital Medicine Annual Meeting, Las Vegas, NV. March 24-27, 2014. www.shmabstracts.com/abstract/is-specialized-care-plan-work-sustainable-a-followup-on-healthpartners-experience-with-patients-who-are-highutilizers. Accessed December 18, 2017.
- Kripalani S, LeFevre F, Phillips CO, Williams MV, Basaviah P, Baker DW. Deficits in communication and information transfer between hospital-based and primary care physicians: implications for patient safety and continuity of care. JAMA 2007; 297:831–841.
- Kind AJ, Thorpe CT, Sattin JA, Walz SE, Smith MA. Provider characteristics, clinical-work processes and their relationship to discharge summary quality for sub-acute care patients. J Gen Intern Med 2012; 27:78–84.
- Hong CS, Siegel AL, Ferris TG. Caring for high-need, high-cost patients: what makes for a successful care management program? Issue Brief (Commonwealth Fund) 2014; 19:1–19.
- Williams B. Limited effects of care management for high utilizers on total healthcare costs. Am J Managed Care 2015; 21:e244–e246.
- Organization for Economic Co-operation and Development. Health at a Glance 2009: OECD Indicators. Paris, France: OECD Publishing; 2009.
- Emeche U. Is a strategy focused on super-utilizers equal to the task of health care system transformation? Yes. Ann Fam Med 2015; 13:6–7.
- Burns J. Do we overspend on healthcare, underspend on social needs? Managed Care. http://ghli.yale.edu/news/do-we-overspend-health-care-underspend-social-needs. Accessed December 18, 2017.
Emergency departments are not primary care clinics, but some patients use them that way. This relatively small group of patients consumes a disproportionate share of healthcare at great cost, earning them the label of “high users.” Mostly poor and often burdened with mental illness and addiction, they are not necessarily sicker than other patients, and they do not enjoy better outcomes from the extra money spent on them. (Another subset of high users, those with end-stage chronic disease, is outside the scope of this review.)
Herein lies an opportunity. If—and this is a big if—we could manage their care in a systematic way instead of haphazardly, proactively instead of reactively, with continuity of care instead of episodically, and in a way that is convenient for the patient, we might be able to improve quality and save money.
A DISPROPORTIONATE SHARE OF COSTS
In the United States in 2012, the 5% of the population who were the highest users were responsible for 50% of healthcare costs.1 The mean cost per person in this group was more than $43,000 annually. The top 1% of users accounted for nearly 23% of all expenditures, averaging nearly $98,000 per patient per year—10 times more than the average yearly cost per patient.
CARE IS OFTEN INAPPROPRIATE AND UNNECESSARY
In addition to being disproportionately expensive, the care that these patients receive is often inappropriate and unnecessary for the severity of their disease.
A 2007–2009 study2 of 1,969 patients who had visited the emergency department 10 or more times in a year found they received more than twice as many computed tomography (CT) scans as a control group of infrequent users (< 3 visits/year). This occurred even though they were not as sick as infrequent users, based on significantly lower hospital admission rates (11.1% vs 17.9%; P < .001) and mortality rates (0.7% vs 1.5%; P < .002).2
This inverse relationship between emergency department use and illness severity was even more exaggerated at the upper extreme of the use curve. The highest users (> 29 visits to the emergency department in a year) had the lowest triage acuity and hospital admission rates but the highest number of CT scans. Charges per visit were lower among frequent users, but total charges rose steadily with increasing emergency department use, accounting for significantly more costs per year.2
We believe that one reason these patients receive more medical care than necessary is because their medical records are too large and complex for the average physician to distill effectively in a 20-minute physician-patient encounter. Physicians therefore simply order more tests, procedures, and admissions, which are often medically unnecessary and redundant.
WHAT DRIVES HIGH COST?
Mental illness and chemical dependence
Drug addiction, mental illness, and poverty frequently accompany (and influence) high-use behavior, particularly in patients without end-stage diseases.
Szekendi et al,3 in a study of 28,291 patients who had been admitted at least 5 times in a year in a Chicago health system, found that these high users were 2 to 3 times more likely to suffer from comorbid depression (40% vs 13%), psychosis (18% vs 5%), recreational drug dependence (20% vs 7%), and alcohol abuse (16% vs 7%) than non-high-use hospitalized patients.3
Mercer et al4 conducted a study at Duke University Medical Center, Durham, NC, aimed at reducing emergency department visits and hospital admissions among 24 of its highest users. They found that 23 (96%) were either addicted to drugs or mentally ill, and 20 (83%) suffered from chronic pain.4
Drug abuse among high users is becoming even more relevant as the opioid epidemic worsens. Given that most patients requiring high levels of care suffer from chronic pain and many of them develop an opioid addiction while treating their pain, physicians have a moral imperative to reduce the prevalence of drug abuse in this population.
Low socioeconomic status
Low socioeconomic status is an important factor among high users, as it is highly associated with greater disease severity, which usually increases cost without any guarantee of an associated increase in quality. Data suggest that patients of low socioeconomic status are twice as likely to require urgent emergency department visits, 4 times as likely to require admission to the hospital, and, importantly, about half as likely to use ambulatory care compared with patients of higher socioeconomic status.5 While this pattern of low-quality, high-cost spending in acute care settings reflects spending in the healthcare system at large, the pattern is greatly exaggerated among high users.
Lost to follow-up
Low socioeconomic status also complicates communication and follow-up. In a 2013 study, physician researchers in St. Paul, MN, documented attempts to interview 64 recently discharged high users. They could not reach 47 (73%) of them, for reasons largely attributable to low socioeconomic status, such as disconnected phone lines and changes in address.6
Clearly, the usual contact methods for follow-up care after discharge, such as phone calls and mailings, are unlikely to be effective in coordinating the outpatient care of these individuals.
Additionally, we must find ways of making primary care more convenient, gaining our patients’ trust, and finding ways to engage patients in follow-up without relying on traditional means of communication.
Do high users have medical insurance?
Surprisingly, most high users of the emergency department have health insurance. The Chicago health system study3 found that most (72.4%) of their high users had either Medicare or private health insurance, while 27.6% had either Medicaid or no insurance (compared with 21.6% in the general population). Other studies also found that most of the frequent emergency department users are insured,7 although the overall percentage who rely on publicly paid insurance is greater than in the population at large.
Many prefer acute care over primary care
Although one might think that high users go to the emergency department because they have nowhere else to go for care, a report published in 2013 by Kangovi et al5 suggests another reason—they prefer the emergency department.5 They interviewed 40 urban patients of low socioeconomic status who consistently cited the 24-hour, no-appointment-necessary structure of the emergency department as an advantage over primary care. The flexibility of emergency access to healthcare makes sense if one reflects on how difficult it is for even high-functioning individuals to schedule and keep medical appointments.
Specific reasons for preferring the emergency department included the following:
Affordability. Even if their insurance fully paid for visits to their primary care physicians, the primary care physician was likely to refer them to specialists, whose visits required a copay, and which required taking another day off of work. The emergency department is cheaper for the patient and it is a “one-stop shop.” Patients appreciated the emergency department guarantee of seeing a physician regardless of proof of insurance, a policy not guaranteed in primary care and specialist offices.
Accessibility. For those without a car, public transportation and even patient transportation services are inconvenient and unreliable, whereas emergency medical services will take you to the emergency department.
Accommodations. Although medical centers may tout their same-day appointments, often same-day appointments are all that they have—and you have no choice about the time. You have to call first thing in the morning and stay on hold for a long time, and then when you finally get through, all the same-day appointments are gone.
Availability. Patients said they often had a hard time getting timely medical advice from their primary care physicians. When they could get through to their primary care physicians on the phone, they would be told to go to the emergency department.
Acceptability. Men, especially, feel they need to be very sick indeed to seek medical care, so going to the emergency department is more acceptable.
Trust in the provider. For reasons that were not entirely clear, patients felt that acute care providers were more trustworthy, competent, and compassionate than primary care physicians.5
None of these reasons for using the emergency department has anything to do with disease severity, which supports the findings that high users of the emergency department were not as sick as their normal-use peers.2
QUALITY IMPROVEMENT AND COST-REDUCTION STRATEGIES
Efforts are being made to reduce the cost of healthcare for high users while improving the quality of their care. Promising strategies focus on coordinating care management, creating individualized patient care plans, and improving the components and instructions of discharge summaries.
Care management organizations
A care management organization (CMO) model has emerged as a strategy for quality improvement and cost reduction in the high-use population. In this model, social workers, health coaches, nurses, mid-level providers, and physicians collaborate on designing individualized care plans to meet the specific needs of patients.
Teams typically work in stepwise fashion, first identifying and engaging patients at high risk of poor outcomes and unnecessary care, often using sophisticated quantitative, risk-prediction tools. Then, they perform health assessments and identify potential interventions aimed at preventing expensive acute-care medical interventions. Third, they work with patients to rapidly identify and effectively respond to changes in their conditions and direct them to the most appropriate medical setting, typically primary or urgent care.
Effective models
In 1998, the Camden (NJ) Coalition of Healthcare Providers established a model for CMO care plans. Starting with the first 36 patients enrolled in the program, hospital admissions and emergency department visits were cut by 47% (from 62 to 37 per month), and collective hospital costs were cut by 56% (from $1.2 million to about $500,000 per month).8 It should be noted that this was a small, nonrandomized study and these preliminary numbers did not take into account the cost of outpatient physician visits or new medications. Thus, how much money this program actually saves is not clear.
Similar programs have had similar results. A nurse-led care coordination program in Doylestown, PA, showed an impressive 25% reduction in annual mortality and a 36% reduction in overall costs during a 10-year period.9
A program in Atlantic City, NJ, combined the typical CMO model with a primary care clinic to provide high users with unlimited access, while paying its providers in a capitation model (as opposed to fee for service). It achieved a 40% reduction in yearly emergency department visits and hospital admissions.8
Patient care plans
Individualized patient care plans for high users are among the most promising tools for reducing costs and improving quality in this group. They are low-cost and relatively easy to implement. The goal of these care plans is to provide practitioners with a concise care summary to help them make rational and consistent medical decisions.
Typically, a care plan is written by an interdisciplinary committee composed of physicians, nurses, and social workers. It is based on the patient’s pertinent medical and psychiatric history, which may include recent imaging results or other relevant diagnostic tests. It provides suggestions for managing complex chronic issues, such as drug abuse, that lead to high use of healthcare resources.
These care plans provide a rational and prespecified approach to workup and management, typically including a narcotic prescription protocol, regardless of the setting or the number of providers who see the patient. Practitioners guided by effective care plans are much more likely to effectively navigate a complex patient encounter as opposed to looking through extensive medical notes and hoping to find relevant information.
Effective models
Data show these plans can be effective. For example, Regions Hospital in St. Paul, MN, implemented patient care plans in 2010. During the first 4 months, hospital admissions in the first 94 patients were reduced by 67%.10
A study of high users at Duke University Medical Center reported similar results. One year after starting care plans, inpatient admissions had decreased by 50.5%, readmissions had decreased by 51.5%, and variable direct costs per admission were reduced by 35.8%. Paradoxically, emergency department visits went up, but this anomaly was driven by 134 visits incurred by a single dialysis patient. After removing this patient from the data, emergency department visits were relatively stable.4
Better discharge summaries
Although improving discharge summaries is not a novel concept, changing the summary from a historical document to a proactive discharge plan has the potential to prevent readmissions and promote a durable de-escalation in care acuity.
For example, when moving a patient to a subacute care facility, providing a concise summary of which treatments worked and which did not, a list of comorbidities, and a list of medications and strategies to consider, can help the next providers to better target their plan of care. Studies have shown that nearly half of discharge statements lack important information on treatments and tests.11
Improvement can be as simple as encouraging practitioners to construct their summaries in an “if-then” format. Instead of noting for instance that “Mr. Smith was treated for pneumonia with antibiotics and discharged to a rehab facility,” the following would be more useful: “Family would like to see if Mr. Smith can get back to his functional baseline after his acute pneumonia. If he clinically does not do well over the next 1 to 2 weeks and has a poor quality of life, then family would like to pursue hospice.”
In addition to shifting the philosophy, we believe that providing timely discharge summaries is a fundamental, high-yield aspect of ensuring their effectiveness. As an example, patients being discharged to a skilled nursing facility should have a discharge summary completed and in hand before leaving the hospital.
Evidence suggests that timely writing of discharge summaries improves their quality. In a retrospective cohort study published in 2012, discharge summaries created more than 24 hours after discharge were less likely to include important plan-of-care components.12
FUTURE NEEDS
Randomized trials
Although initial results have been promising for the strategies outlined above, much of the apparent cost reduction of these interventions may be at least partially related to the study design as opposed to the interventions themselves.
For example, Hong et al13 examined 18 of the more promising CMOs that had reported initial cost savings. Of these, only 4 had conducted randomized controlled trials. When broken down further, the initial cost reduction reported by most of these randomized controlled trials was generated primarily by small subgroups.14
These results, however, do not necessarily reflect an inherent failure in the system. We contend that they merely demonstrate that CMOs and care plan administrators need to be more selective about whom they enroll, either by targeting patients at the extremes of the usage curve or by identifying patient characteristics and usage parameters amenable to cost reduction and quality improvement strategies.
Better social infrastructure
Although patient care plans and CMOs have been effective in managing high users, we believe that the most promising quality improvement and cost-reduction strategy involves redirecting much of the expensive healthcare spending to the social determinants of health (eg, homelessness, mental illness, low socioeconomic status).
Among developed countries, the United States has the highest healthcare spending and the lowest social service spending as a percentage of its gross domestic product (Figure 1).15 Although seemingly discouraging, these data can actually be interpreted as hopeful, as they support the notion that the inefficiencies of our current system are not part of an inescapable reality, but rather reflect a system that has evolved uniquely in this country.
Using the available social programs
Exemplifying this medical and social services balance is a high user who visited her local emergency department 450 times in 1 year for reasons primarily related to homelessness.16 Each time, the medical system (as it is currently designed to do) applied a short-term medical solution to this patient’s problems and discharged her home, ie, back to the street.
But this patient’s high use was really a manifestation of a deeper social issue: homelessness. When the medical staff eventually noted how much this lack of stable shelter was contributing to her pattern of use, she was referred to appropriate social resources and provided with the housing she needed. Her hospital visits decreased from 450 to 12 in the subsequent year, amounting to a huge cost reduction and a clear improvement in her quality of life.
Similar encouraging results have resulted when available social programs are applied to the high-use population at large, which is particularly reassuring given this population’s preponderance of low socioeconomic status, mental illness, and homelessness. (The prevalence of homelessness is roughly 20%, depending on the definition of a high user).
New York Medicaid, for example, has a housing program that provides stable shelter outside of acute care medical settings for patients at a rate as low as $50 per day, compared with area hospital costs that often exceed $2,200 daily.17 A similar program in Westchester County, NY, reported a 45.9% reduction in inpatient costs and a 15.4% reduction in emergency department visits among 61 of its highest users after 2 years of enrollment.17
Need to reform privacy laws
Although legally daunting, reform of the Health Insurance Portability and Accountability Act (HIPAA) and other privacy laws in favor of a more open model of information sharing, particularly for high-risk patients, holds great opportunity for quality improvement. For patients who obtain their care from several healthcare facilities, the documentation is often inscrutable. If some of the HIPAA regulations and other patient privacy laws were exchanged for rules more akin to the current model of narcotic prescription tracking, for example, physicians would be better equipped to provide safe, organized, and efficient medical care for high-use patients.
Need to reform the system
A fundamental flaw in our healthcare system, which is largely based on a fee-for-service model, is that it was not designed for patients who use the system at the highest frequency and greatest cost. Also, it does not account for the psychosocial factors that beset many high-use patients. As such, it is imperative for the safety of our patients as well as the viability of the healthcare system that we change our historical way of thinking and reform this system that provides high users with care that is high-cost, low-quality, and not patient-centered.
IMPROVING QUALITY, REDUCING COST
High users of emergency services are a medically and socially complex group, predominantly characterized by low socioeconomic status and high rates of mental illness and drug dependency. Despite their increased healthcare use, they do not have better outcomes even though they are not sicker. Improving those outcomes requires both medical and social efforts.
Among the effective medical efforts are strategies aimed at creating individualized patient care plans, using coordinated care teams, and improving discharge summaries. Addressing patients’ social factors, such as homelessness, is more difficult, but healthcare systems can help patients navigate the available social programs. These strategies are part of a comprehensive care plan that can help reduce the cost and improve the quality of healthcare for high users.
- Cohen SB; Agency for Healthcare Research and Quality. Statistical Brief #359. The concentration of health care expenditures and related expenses for costly medical conditions, 2009. http://meps.ahrq.gov/mepsweb/data_files/publications/st359/stat359.pdf. Accessed December 18, 2017.
- Oostema J, Troost J, Schurr K, Waller R. High and low frequency emergency department users: a comparative analysis of morbidity, diagnostic testing, and health care costs. Ann Emerg Med 2011; 58:S225. Abstract 142.
- Szekendi MK, Williams MV, Carrier D, Hensley L, Thomas S, Cerese J. The characteristics of patients frequently admitted to academic medical centers in the United States. J Hosp Med 2015; 10:563–568.
- Mercer T, Bae J, Kipnes J, Velazquez M, Thomas S, Setji N. The highest utilizers of care: individualized care plans to coordinate care, improve healthcare service utilization, and reduce costs at an academic tertiary care center. J Hosp Med 2015; 10:419–424.
- Kangovi S, Barg FK, Carter T, Long JA, Shannon R, Grande D. Understanding why patients of low socioeconomic status prefer hospitals over ambulatory care. Health Aff (Millwood) 2013; 32:1196–1203.
- Melander I, Winkelman T, Hilger R. Analysis of high utilizers’ experience with specialized care plans. J Hosp Med 2014; 9(suppl 2):Abstract 229.
- LaCalle EJ, Rabin EJ, Genes NG. High-frequency users of emergency department care. J Emerg Med 2013; 44:1167–1173.
- Gawande A. The Hot Spotters. The New Yorker 2011. www.newyorker.com/magazine/2011/01/24/the-hot-spotters. Accessed December 18, 2017.
- Coburn KD, Marcantonio S, Lazansky R, Keller M, Davis N. Effect of a community-based nursing intervention on mortality in chronically ill older adults: a randomized controlled trial. PLoS Med 2012; 9:e1001265.
- Hilger R, Melander I, Winkelman T. Is specialized care plan work sustainable? A follow-up on healthpartners’ experience with patients who are high-utilizers. Society of Hospital Medicine Annual Meeting, Las Vegas, NV. March 24-27, 2014. www.shmabstracts.com/abstract/is-specialized-care-plan-work-sustainable-a-followup-on-healthpartners-experience-with-patients-who-are-highutilizers. Accessed December 18, 2017.
- Kripalani S, LeFevre F, Phillips CO, Williams MV, Basaviah P, Baker DW. Deficits in communication and information transfer between hospital-based and primary care physicians: implications for patient safety and continuity of care. JAMA 2007; 297:831–841.
- Kind AJ, Thorpe CT, Sattin JA, Walz SE, Smith MA. Provider characteristics, clinical-work processes and their relationship to discharge summary quality for sub-acute care patients. J Gen Intern Med 2012; 27:78–84.
- Hong CS, Siegel AL, Ferris TG. Caring for high-need, high-cost patients: what makes for a successful care management program? Issue Brief (Commonwealth Fund) 2014; 19:1–19.
- Williams B. Limited effects of care management for high utilizers on total healthcare costs. Am J Managed Care 2015; 21:e244–e246.
- Organization for Economic Co-operation and Development. Health at a Glance 2009: OECD Indicators. Paris, France: OECD Publishing; 2009.
- Emeche U. Is a strategy focused on super-utilizers equal to the task of health care system transformation? Yes. Ann Fam Med 2015; 13:6–7.
- Burns J. Do we overspend on healthcare, underspend on social needs? Managed Care. http://ghli.yale.edu/news/do-we-overspend-health-care-underspend-social-needs. Accessed December 18, 2017.
KEY POINTS
- The top 5% of the population in terms of healthcare use account for 50% of costs. The top 1% account for 23% of all expenditures and cost 10 times more per year than the average patient.
- Drug addiction, mental illness, and poverty often accompany and underlie high-use behavior, particularly in patients without end-stage medical conditions.
- Comprehensive patient care plans and care management organizations are among the most effective strategies for cost reduction and quality improvement.

Drug price increases far outpaced inflation in 2015
The retail price for a set of 768 prescription drugs rose by 6.4% in 2015, while the general inflation rate increased by just 0.1%, according to the AARP Public Policy Institute and the PRIME Institute at the University of Minnesota in Minneapolis.
One year, of course, does not make a trend, but how about 10 years? The average increase in the price of the “market basket” of 768 drugs widely used by older Americans has exceeded the rate of inflation every year since the AARP started tracking costs in 2004. This is “attributable entirely to drug price growth among brand name and specialty drugs, which more than offset often substantial price decreases among generic drugs,” Leigh Purvis of AARP and Stephen Schondelmeyer, PharmD, PhD, of the Prime Institute, said in an Rx Price Watch report.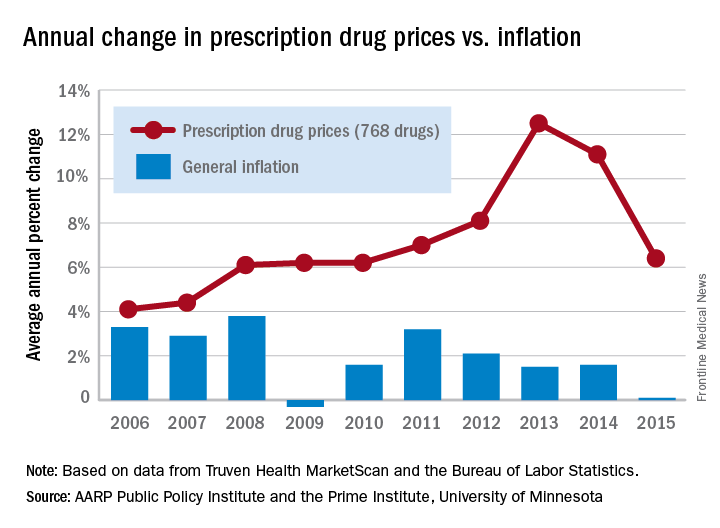
In terms of actual cost, however, the specialty drugs were far ahead of the other two segments. The average cost of a year of treatment with a specialty drug was more than $52,000 in 2015, which was nine times higher than the brand-name drugs ($5,800) and 100 times higher than the generics ($523), they said.
The Rx Price Watch reports are based on retail-level prescription prices from the Truven Health MarketScan Research Databases. The general inflation rate is based on the Consumer Price Index–All Urban Consumers for All Items, which is measured by the Bureau of Labor Statistics.
Majority of influenza-related deaths among hospitalized patients occur after discharge
SAN DIEGO – Over half of hospitalized, influenza-related deaths occurred within 30 days of discharge, according to a study presented at an annual scientific meeting on infectious diseases.
As physicians and pharmaceutical companies attempt to measure the burden of seasonal influenza, discharged patients are currently not considered as much as they should be, according to investigators.
Among 968 deceased patients studied, 444 (46%) died in hospital, while 524 (54%) died within 30 days of discharge.
Investigators conducted a retrospective study of 15,562 patients hospitalized for influenza-related cases between 2014 and 2015, as recorded in Influenza-Associated Hospitalizations Surveillance (FluSurv-NET), a database of the Centers for Disease Control and Prevention.
The majority of the studied patients were women (55%) and the majority were white.
Those who died were more likely to have been admitted to the hospital immediately after influenza onset, with 26% of those who died after discharge and 22% of those who died in hospital having been admitted the same day. In contrast, 13% of those who lived past 30 days were admitted immediately after onset.
A total of 46% of those who died after hospitalization had a length of stay longer than 1 week, compared to 15% of those who lived.
Among patients who died after discharge, 356 (68%) died within 2 weeks of discharge, with the highest number of deaths occurring within the first few days, according to presenter Craig McGowan of the Influenza Division of the CDC in Atlanta.
Age also seemed to be a possible mortality predictor, according to Mr. McGowan and his fellow investigators. “Those who died were more likely to be elderly, and those who died after discharge were even more likely to be 85 [years or older] than those who died during their influenza-related hospitalizations,” said Mr. McGowan, who added that patients aged 85 years and older made up more than half of those who died after discharge.
Patients who died in hospital were significantly more likely to have influenza listed as a cause of death. Overall, influenza-related and non–influenza-related respiratory issues were the two most common causes of death listed on death certificates of patients who died during hospitalization or within 14 days of discharge, while cardiovascular or other symptoms were listed for those who died between 15 and 30 days after discharge.
Admission and discharge locations among patients who did not die were almost 80% from a private residence to a private residence, while observations of those who died revealed a different pattern. “Those individuals who died after discharge were almost evenly split between admission from a nursing home or a private residence,” Mr. McGowan said. “Those who were admitted from the nursing home were almost exclusively discharged to either hospice care or back to a nursing home.”
Mr. McGowan noted rehospitalization to be a significant factor among those who died, with 34% of deaths occurring back in the hospital after initial discharge.
Influenza testing of studied patients was given at clinicians’ discretion, which may make the sample not generalizable to the overall influenza population, and the investigators included only bivariate associations, which means there were likely confounding effects that could not be accounted for.
Mr. McGowan and his fellow investigators plan to expand their research by determining underlying causes of death in these patients, to create more accurate estimates of influenza-associated mortality.
Mr. McGowan reported no relevant financial disclosures.
ezimmerman@frontlinemedcom.com
SOURCE: McGowan, C., et al., ID Week 2017, Abstract 951.
AT IDWEEK 2017
Key clinical point:
Major finding: Among patients who died with confirmed influenza, 46% died in hospital, while 54% died within 30 days of discharge.
Data source: Retrospective study of 15,562 influenza patients hospitalized or within 30 days of discharge between 2014 and 2015, recorded in Influenza-Associated Hospitalizations Surveillance (FluSurv-NET).
Disclosures: Mr. McGowen reported no relevant financial disclosures.
GERD linked to upper aerodigestive tract cancers in elderly
The risk for gastroesophageal reflux disease and cancer of the larynx, tonsils, and other areas of the upper aerodigestive tract was strongly associated in a longitudinal-based population study of the U.S. elderly population.
A total of 13,805 cases involving gastroesophageal reflux disease (GERD) and malignancies of the upper aerodigestive tract (UADT) and 13,805 GERD cases with no UADT from the National Cancer Institute’s Surveillance, Epidemiology and End Results (SEER)-Medicare linked database in patients aged 66 years and older from 2003 through 2011 were examined. Only those who had no malignancy before they were diagnosed with GERD were included in the study, which was published in JAMA Otolaryngology–Head & Neck Surgery (doi: 10.1001/jamaoto.2017.2561.
Lead author Charles A. Riley, MD, of Tulane University in New Orleans, and his coauthors noted that previous studies had drawn conflicting conclusions about the link between GERD and UADT malignancies. To their knowledge, this is the first study to investigate UADT malignancies specifically in the elderly in the United States.
“The increased relative risk for laryngeal and pharyngeal cancers in this population suggests an opportunity for earlier detection and intervention,” Dr. Riley and his colleagues said.
For the study, they calculated the adjusted odds ratios (aOR) of cancer in six areas of the UADT in patients with GERD vs. patients who never had GERD: larynx (2.86), hypopharynx (2.54), oropharynx (2.47), tonsil (2.14), nasopharynx (2.04), and paranasal sinuses (1.40).
The study also evaluated the relative risk of malignancy with GERD and without GERD. “These data suggest that elderly patients with GERD in the United States are 3.47, 3.23, 2.88, and 2.37 times as likely as those without GERD to be diagnosed with laryngeal, hypopharyngeal, oropharyngeal and tonsillar cancers, respectively,” Dr. Riley and his associates wrote.
These findings may point to a need for a paradigm shift like that which led to the use of screening esophagogastroduodenoscopy for patients at risk of Barrett esophagus and esophageal cancer. “A similar screening platform may benefit those patients at higher risk for the development of malignancy of the UADT, though further research is necessary,” they said.
Dr. Riley and his coauthors reported having no financial disclosures.
Source: Riley C et al. JAMA Otolaryngol Head Neck Surg. 2017 Dec 21. doi: 10.1001/jamaoto.2017.2561.
FROM JAMA OTOLARYNGOLOGY
Key clinical point: Gastroesophageal reflux disease (GERD) is associated with malignancies of the upper aerodigestive tract (UADT) in U.S. patients aged 66 years and older.
Major finding: GERD was associated with a 2.86 adjusted odds ratio for developing malignancy of the larynx.
Data source: 13,805 cases with UADT malignancies and 13.805 cases without disease from the National Cancer Institute’s Surveillance, Epidemiology and End Results-Medicare linked database queried from January 2003 to December 2011.
Disclosures: Dr. Riley and his coauthors reported having no financial disclosures.
Source: Riley C et al. JAMA Otolaryngol Head Neck Surg. 2017 Dec 21. doi: 10.1001/jamaoto.2017.2561.
Project improves noninvasive IUC alternatives
Editor’s note: The Society of Hospital Medicine’s (SHM’s) Physician in Training Committee launched a scholarship program in 2015 for medical students to help transform health care and revolutionize patient care. The program has been expanded for the 2017-18 year, offering two options for students to receive funding and engage in scholarly work during their first, second and third years of medical school. As a part of the longitudinal (18-month) program, recipients are required to write about their experience on a monthly basis.
It truly has been a rewarding experience participating in a quality improvement project and I am excited to see what the future holds. Our project, “Reducing CAUTI with Noninvasive UC Alternatives and Measure-vention,” aimed to combat catheter associated urinary tract infections, with a three-pronged approach: by reducing UC placement, performing proper maintenance of IUC, and ensuring prompt removal of unnecessary UC.

To date, our project has demonstrated qualitative success. Specifically, we have implemented a pipeline to perform “measure-vention,” or real-time monitoring and correction of defects. The surgical care intensive unit (SICU) was identified as an appropriate candidate for a pilot partnership due to its high utilization of UC. A daily report of patients with UC is generated and then checked against the EMR for UC necessity. Subsequently, we contact the unit RN for details and physicians for removal orders, when possible. Simultaneously, this enables us to reinforce our management bundle in real time. This protocol is being effectively implemented in the SICU and we are hoping to expand to other units as well. Quantitative data collection is still ongoing and hopefully forthcoming.
Previous CAUTI reduction efforts have had variable and partial success. We are very excited to have improved noninvasive IUC alternatives that address staff concerns about incontinence workload, urine output monitoring, and patient comfort. We hope to protect our patients from harm and eventually publicize our experience to help other health care facilities reduce IUC use and CAUTI.
It has been a rewarding experience to participate in a quality improvement project and I am enjoying the challenges of collaborating with a diverse team of medical professionals to improve the patient experience.
Victor Ekuta is a third-year medical student at UC San Diego.
Editor’s note: The Society of Hospital Medicine’s (SHM’s) Physician in Training Committee launched a scholarship program in 2015 for medical students to help transform health care and revolutionize patient care. The program has been expanded for the 2017-18 year, offering two options for students to receive funding and engage in scholarly work during their first, second and third years of medical school. As a part of the longitudinal (18-month) program, recipients are required to write about their experience on a monthly basis.
It truly has been a rewarding experience participating in a quality improvement project and I am excited to see what the future holds. Our project, “Reducing CAUTI with Noninvasive UC Alternatives and Measure-vention,” aimed to combat catheter associated urinary tract infections, with a three-pronged approach: by reducing UC placement, performing proper maintenance of IUC, and ensuring prompt removal of unnecessary UC.
To date, our project has demonstrated qualitative success. Specifically, we have implemented a pipeline to perform “measure-vention,” or real-time monitoring and correction of defects. The surgical care intensive unit (SICU) was identified as an appropriate candidate for a pilot partnership due to its high utilization of UC. A daily report of patients with UC is generated and then checked against the EMR for UC necessity. Subsequently, we contact the unit RN for details and physicians for removal orders, when possible. Simultaneously, this enables us to reinforce our management bundle in real time. This protocol is being effectively implemented in the SICU and we are hoping to expand to other units as well. Quantitative data collection is still ongoing and hopefully forthcoming.
Previous CAUTI reduction efforts have had variable and partial success. We are very excited to have improved noninvasive IUC alternatives that address staff concerns about incontinence workload, urine output monitoring, and patient comfort. We hope to protect our patients from harm and eventually publicize our experience to help other health care facilities reduce IUC use and CAUTI.
It has been a rewarding experience to participate in a quality improvement project and I am enjoying the challenges of collaborating with a diverse team of medical professionals to improve the patient experience.
Victor Ekuta is a third-year medical student at UC San Diego.

Daratumumab looks good in light chain amyloidosis
ATLANTA – In patients with previously treated immunoglobulin light chain (AL) amyloidosis, daratumumab monotherapy produced deep, rapid hematologic responses, based on initial results from a phase 2 trial.
So far, the response rate is about twice the rate seen with daratumumab in relapsed/refractory multiple myeloma, Murielle Roussel, MD, of IUCT-Oncopole, Toulouse, France, said at the annual meeting of the American Society of Hematology. “We observed deep and rapid clonal responses, even after the first infusion.”

“Daratumumab also had a good safety profile characterized by nonsevere adverse events after initial infusion. There was only one drug-related serious adverse event, grade 3 lymphopenia,” she said.
In a second study, the risk for daratumumab infusion reactions was low when patients received a prophylactic regimen initiated about an hour before daratumumab infusion.
Daratumumab, a novel, fully humanized IgG1-kappa monoclonal antibody with high affinity for CD38, is approved for treating relapsed/refractory multiple myeloma. In AL amyloidosis, as in myeloma, monoclonal light chains nearly always originate from plasma cells that consistently express CD38.
Data from small studies indicate that daratumumab effectively treats AL amyloidosis. To further evaluate safety and efficacy, 36 adults with previously treated disease received 28-day cycles of daratumumab (16 mg/kg IV) weekly for two cycles and then every other week for four cycles. Most patients had received three prior lines of therapy, about two-thirds had cardiac involvement (median baseline NT-proBNP 1,118 ng/L; range, 60-6,825), and about 60% had renal involvement.
At data cutoff in mid-November 2017, fifteen patients had completed all six treatment cycles. Three stopped treatment because of progression. Two died, one of progressive cardiac amyloidosis and one of unrelated lung cancer.
Eleven patients had grade 1-2 infusion reactions at first injection. Among 17 grade 3 or higher adverse events, only lymphopenia was deemed treatment related.
At 6 months, 15 of 32 evaluable patients (44%) had a very good partial response (VGPR; at least a 40% drop in baseline difference in involved and uninvolved free light chains (dFLC). Another 16% had a partial response, and 41% did not respond.
Patients with durable responses tended to have about a 70% drop in dFLC after the first daratumumab dose. Baseline variables did not seem to predict durability of response, Dr. Roussel said. “Further studies in amyloidosis are warranted in relapsed or refractory patients and also in the frontline setting.”
The second trial focused on preventing infusion reactions to daratumumab. In early trials of daratumumab for relapsed/recalcitrant multiple myeloma, patients developed moderate to severe bronchospasm, laryngeal or pulmonary edema, hypoxia, and hypertension, noted Vaishali Sanchorawala, MD, of Boston Medical Center. Since those trials, prophylactic therapies have been used to reduce the risk of infusion reactions.
Dr. Sanchorawala’s study enrolled 12 patients with previously treated AL amyloidosis and cardiac biomarker stage II or stage III disease. About 60% of patients were refractory to their last treatment. Median NT-proBNP level was 1,357 pg/mL (range, 469-3,962), median urine protein excretion was 0.44 g (0-10.1), and median dFLC was 105 mg/dL (3.8-854).
Patients received 16 mg/kg daratumumab IV weekly for 8 weeks, then every 2 weeks for 16 weeks, and then every 4 weeks for up to 24 months. About an hour before infusion, they received acetaminophen, diphenhydramine, loratadine famotidine, montelukast, and methylprednisolone (100 mg for two infusions; 60 mg thereafter). Ondansetron also was added to control mild nausea and vomiting. Two hours into the infusion, patients received diphenhydramine, famotidine, and methylprednisolone (40 mg). They received methylprednisolone (20 mg) and montelukast 1-2 days after the first two infusions, after which montelukast was optional. All received prophylactic acyclovir.
At the Nov. 15, 2017 data cutoff, 11 patients remained on study and one left after disease progressed. This patient’s disease was refractory to many prior therapies and had a complete response to autologous stem cell transplant, said Dr. Sanchorawala.
There were no grade 3-4 infusion reactions. Nine evaluable patients at 3 months had two complete hematologic responses, six VGPRs (at least a 65% drop in dFLC), and one partial response. One-third had at least a 30% improvement in NT-proBNP at 3 months, as did three of four evaluable patients at 6 months. About half had least a 30% drop in urine protein excretion at 6 months.
First infusions lasted a median of 7 hours, making them doable during a clinic day if bloods are drawn beforehand, Dr. Sanchorawala said. Second and subsequent infusions took about 4 hours.
“Preliminary data suggest a rapid hematologic response after one dose of daratumumab and high rates of response at 3 and 6 months, ” she concluded. “Since the plasma cell clone is so low in amyloidosis, single-agent daratumumab has a very positive, strong effect. We may not need to combine other agents with this therapy.”
Both presentations sparked substantial interest during the discussion period after the presentations, especially because daratumumab was given as monotherapy. “This would be a new indication for daratumumab,” said session moderator Dan Vogl, MD, director of the Abramson Cancer Center Clinical Research Unit, University of Pennsylvania, Philadelphia.
Janssen makes daratumumab and provided partial funding for both studies. Dr. Sanchorawala had no conflicts of interest. Dr. Roussel disclosed honoraria and research funding from Janssen.
SOURCES: Sanchorawala V et al. ASH 2017 Abstract 507; Roussel M et al. ASH 2017 Abstract 508.
ATLANTA – In patients with previously treated immunoglobulin light chain (AL) amyloidosis, daratumumab monotherapy produced deep, rapid hematologic responses, based on initial results from a phase 2 trial.
So far, the response rate is about twice the rate seen with daratumumab in relapsed/refractory multiple myeloma, Murielle Roussel, MD, of IUCT-Oncopole, Toulouse, France, said at the annual meeting of the American Society of Hematology. “We observed deep and rapid clonal responses, even after the first infusion.”
“Daratumumab also had a good safety profile characterized by nonsevere adverse events after initial infusion. There was only one drug-related serious adverse event, grade 3 lymphopenia,” she said.
In a second study, the risk for daratumumab infusion reactions was low when patients received a prophylactic regimen initiated about an hour before daratumumab infusion.
Daratumumab, a novel, fully humanized IgG1-kappa monoclonal antibody with high affinity for CD38, is approved for treating relapsed/refractory multiple myeloma. In AL amyloidosis, as in myeloma, monoclonal light chains nearly always originate from plasma cells that consistently express CD38.
Data from small studies indicate that daratumumab effectively treats AL amyloidosis. To further evaluate safety and efficacy, 36 adults with previously treated disease received 28-day cycles of daratumumab (16 mg/kg IV) weekly for two cycles and then every other week for four cycles. Most patients had received three prior lines of therapy, about two-thirds had cardiac involvement (median baseline NT-proBNP 1,118 ng/L; range, 60-6,825), and about 60% had renal involvement.
At data cutoff in mid-November 2017, fifteen patients had completed all six treatment cycles. Three stopped treatment because of progression. Two died, one of progressive cardiac amyloidosis and one of unrelated lung cancer.
Eleven patients had grade 1-2 infusion reactions at first injection. Among 17 grade 3 or higher adverse events, only lymphopenia was deemed treatment related.
At 6 months, 15 of 32 evaluable patients (44%) had a very good partial response (VGPR; at least a 40% drop in baseline difference in involved and uninvolved free light chains (dFLC). Another 16% had a partial response, and 41% did not respond.
Patients with durable responses tended to have about a 70% drop in dFLC after the first daratumumab dose. Baseline variables did not seem to predict durability of response, Dr. Roussel said. “Further studies in amyloidosis are warranted in relapsed or refractory patients and also in the frontline setting.”
The second trial focused on preventing infusion reactions to daratumumab. In early trials of daratumumab for relapsed/recalcitrant multiple myeloma, patients developed moderate to severe bronchospasm, laryngeal or pulmonary edema, hypoxia, and hypertension, noted Vaishali Sanchorawala, MD, of Boston Medical Center. Since those trials, prophylactic therapies have been used to reduce the risk of infusion reactions.
Dr. Sanchorawala’s study enrolled 12 patients with previously treated AL amyloidosis and cardiac biomarker stage II or stage III disease. About 60% of patients were refractory to their last treatment. Median NT-proBNP level was 1,357 pg/mL (range, 469-3,962), median urine protein excretion was 0.44 g (0-10.1), and median dFLC was 105 mg/dL (3.8-854).
Patients received 16 mg/kg daratumumab IV weekly for 8 weeks, then every 2 weeks for 16 weeks, and then every 4 weeks for up to 24 months. About an hour before infusion, they received acetaminophen, diphenhydramine, loratadine famotidine, montelukast, and methylprednisolone (100 mg for two infusions; 60 mg thereafter). Ondansetron also was added to control mild nausea and vomiting. Two hours into the infusion, patients received diphenhydramine, famotidine, and methylprednisolone (40 mg). They received methylprednisolone (20 mg) and montelukast 1-2 days after the first two infusions, after which montelukast was optional. All received prophylactic acyclovir.
At the Nov. 15, 2017 data cutoff, 11 patients remained on study and one left after disease progressed. This patient’s disease was refractory to many prior therapies and had a complete response to autologous stem cell transplant, said Dr. Sanchorawala.
There were no grade 3-4 infusion reactions. Nine evaluable patients at 3 months had two complete hematologic responses, six VGPRs (at least a 65% drop in dFLC), and one partial response. One-third had at least a 30% improvement in NT-proBNP at 3 months, as did three of four evaluable patients at 6 months. About half had least a 30% drop in urine protein excretion at 6 months.
First infusions lasted a median of 7 hours, making them doable during a clinic day if bloods are drawn beforehand, Dr. Sanchorawala said. Second and subsequent infusions took about 4 hours.
“Preliminary data suggest a rapid hematologic response after one dose of daratumumab and high rates of response at 3 and 6 months, ” she concluded. “Since the plasma cell clone is so low in amyloidosis, single-agent daratumumab has a very positive, strong effect. We may not need to combine other agents with this therapy.”
Both presentations sparked substantial interest during the discussion period after the presentations, especially because daratumumab was given as monotherapy. “This would be a new indication for daratumumab,” said session moderator Dan Vogl, MD, director of the Abramson Cancer Center Clinical Research Unit, University of Pennsylvania, Philadelphia.
Janssen makes daratumumab and provided partial funding for both studies. Dr. Sanchorawala had no conflicts of interest. Dr. Roussel disclosed honoraria and research funding from Janssen.
SOURCES: Sanchorawala V et al. ASH 2017 Abstract 507; Roussel M et al. ASH 2017 Abstract 508.
REPORTING FROM ASH 2017
Key clinical point: Major finding: Rates of very good partial response or complete response were 44% and 33%, respectively, at 6 months.
Data source: Two phase 2 trials of daratumumab monotherapy in patients with previously treated light chain amyloidosis (NCT02816476 [36 patients] and NCT02841033 [12 patients]).
Disclosures: Janssen makes daratumumab and provided partial funding for both studies. Dr. Roussel disclosed honoraria and research funding from Janssen. Dr. Sanchorawala had no conflicts of interest.
Sources: Sanchorawala V et al. ASH 2017 Abstract 507; Roussel M et al. ASH 2017 Abstract 508.
2018 Directory of VA and DoD Facilities

January 2018 Digital Edition
Click here to access the January 2018 Digital Edition.
Table of Contents
- Impact of Drug Shortages on Patient Safety and Pharmacy Operation Costs
- Pulmonary Mucormycosis in a Patient With Uncontrolled Diabetes
- Pilot Inpatient Pain Pharmacist Consult Service at the West Palm Beach VAMC
- The Right, and Now the Wrong of 2017
- Risk Factors Associated With Multidrug-Resistant Pneumonia in Nonhospitalized Patients
- Major General David N.W. Grant: An Early Leader in Air Force Medicine