User login
Recommendations on the Use of Ultrasound Guidance for Adult Lumbar Puncture: A Position Statement of the Society of Hospital Medicine
Approximately 400,000 lumbar punctures (LPs) are performed in the United States annually for either diagnostic workup or therapeutic relief.1 Lumbar punctures are increasingly being performed in the United States, with an estimated 97,000 LPs performed on Medicare fee-for-service beneficiaries in 2011 alone, which is an increase of approximately 4,000 LPs in the same population from 1991.2 Approximately 273,612 LPs were performed on hospitalized patients in the United States in 2010,1 and the inpatient hospital setting is the most common site for LPs.2,3
Many LPs are referred to radiologists who have access to imaging guidance to aid with needle insertion.2 However, referrals to radiology delay performance of LPs, and delayed diagnosis of acute bacterial meningitis, the most common yet serious condition for which LPs are performed, is associated with increased morbidity and mortality.4-8 Furthermore, although initiating empiric antibiotic treatment for suspected acute bacterial meningitis is recommended in some cases, doing so routinely can cause false-negative cerebrospinal fluid (CSF) culture results, complicating decisions about de-escalation and duration of antibiotics that could have been safely avoided by promptly performing an LP.9
Delaying the performance of LP has been associated with increased mortality.10 Demonstration of proficiency in performance of lumbar puncture is considered a core competency for hospitalists,11 and with the increasing availability of point-of-care ultrasound, hospitalists can use ultrasound to guide performance of LPs at the bedside.12 However, 30% of patients requiring LP in emergency departments have difficult-to-palpate lumbar spine landmarks,13 and lumbar puncture performed based on palpation of landmarks alone has been reported to fail or be traumatic in 28% of patients.14 Use of ultrasound guidance for lumbar puncture has been shown in randomized controlled trials to improve procedural success rates, while reducing the time to successful LP, needle passes, patient pain scores, and risk of a traumatic LP.15-17
The purpose of this position statement is to review the literature and present consensus-based recommendations on the performance of ultrasound-guided LP in adult patients. This position statement does not mandate that hospitalists use ultrasound guidance for LP, nor does it establish ultrasound guidance as the standard of care for LP. Similar to previously published Society of Hospital Medicine (SHM) position statements,12,18,19 this document presents recommendations with supporting evidence for the clinical outcomes, techniques, and training for using ultrasound guidance for LP. A manuscript describing the technique of ultrasound guidance for LPs has been previously published by some of the authors of this position statement.20
METHODS
Detailed methods are described in Appendix 1. The SHM Point-of-care Ultrasound (POCUS) Task Force was assembled to carry out this guideline development project under the direction of the SHM Board of Directors, Director of Education, and Education Committee. All expert panel members were physicians or advanced practice providers with expertise in POCUS. Expert panel members were divided into working group members, external peer reviewers, and a methodologist. All Task Force members were required to disclose any potential conflicts of interests (Appendix 2). The literature search was conducted in two independent phases. The first phase included literature searches conducted by the six working group members themselves. Key clinical questions and draft recommendations were then prepared. A systematic literature search was conducted by a medical librarian based on the findings of the initial literature search and draft recommendations. The Medline, Embase, CINAHL, and Cochrane medical databases were searched from 1975 to December 2015 initially. Google Scholar was also searched without limiters. Updated searches were conducted in November 2016, January 2018, and October 2018. The search strings are included in Appendix 3. All article abstracts were first screened for relevance by at least two members of the working group. Full-text versions of screened articles were reviewed, and articles on the use of ultrasound to guide LP were selected. In addition, the following article types were excluded: non-English language, nonhuman, age <18 years, meeting abstracts, meeting posters, narrative reviews, case reports, letters, and editorials. Moreover, studies focusing on the use of ultrasound guidance for spinal nerve root injections, regional anesthesia, and assessment of lumbar spine anatomy alone were excluded. All relevant systematic reviews, meta-analyses, randomized controlled trials, and observational studies of ultrasound-guided LP were screened and selected. Final article selection was based on working group consensus, and the selected literature was incorporated into the draft recommendations.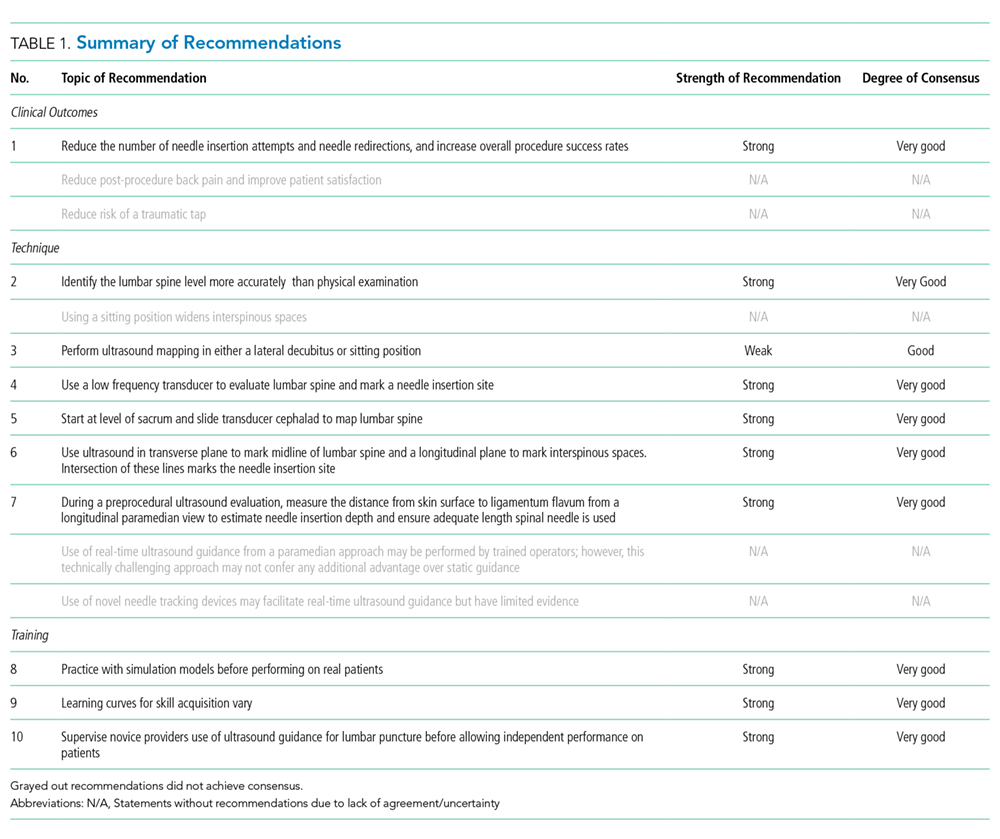
The Research and Development (RAND) Appropriateness Method that required panel judgment and consensus was used.21 The 27 voting members of the SHM POCUS Task Force reviewed and voted on the draft recommendations considering the following five transforming factors: (1) Problem priority and importance, (2) Level of quality of evidence, (3) Benefit/harm balance, (4) Benefit/burden balance, and (5) Certainty/concerns about PEAF (Preferences/Equity/Acceptability/Feasibility). Panel members participated in two rounds of electronic voting using an internet-based electronic data collection tool (REDCap™) in February 2018 and April 2018 (Appendix 4). Voting on appropriateness was conducted using a 9-point Likert scale. The three zones of the 9-point Likert scale were inappropriate (1-3 points), uncertain (4-6 points), and appropriate (7-9 points). The degree of consensus was assessed using the RAND algorithm (Appendix Figure 1 and Table 1). Establishing a recommendation required at least 70% agreement that a recommendation was “appropriate.” A strong recommendation required 80% of the votes within one integer of the median, following the RAND rules. Disagreement was defined as >30% of panelists voting outside of the zone of the median.
Recommendations were classified as strong or weak/conditional based on preset rules defining the panel’s level of consensus, which determined the wording of each recommendation (Table 2). The revised consensus-based recommendations underwent internal and external reviews by POCUS experts from different subspecialties. The final review of this position statement was performed by members of the SHM POCUS Task Force, SHM Education Committee, and SHM Executive Committee. The SHM Executive Committee endorsed this position statement in June 2018 before submission to the Journal of Hospital Medicine.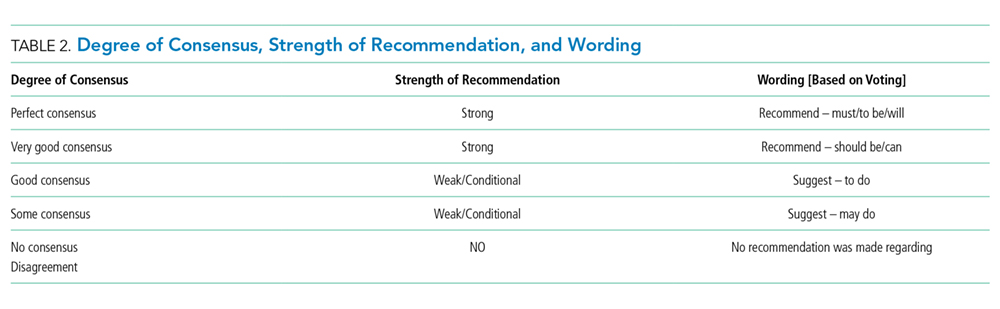
RESULTS
Literature Search
A total of 4,389 references were pooled from four different sources: a search by a certified medical librarian in December 2015 (3,212 citations) that was updated in November 2016 (380 citations), January 2018 (282 citations), and October 2018 (274 citations); working group members’ personal bibliographies and searches (31 citations); and a search focusing on ultrasound-guided LP training (210 citations). A total of 232 full-text articles were reviewed, and the final selection included 77 articles that were abstracted into a data table and incorporated into the draft recommendations. Details of the literature search strategy are presented in Appendix 3.
RECOMMENDATIONS
Four domains (clinical outcomes, technique, training, and knowledge gaps) with 16 draft recommendations were generated based on a review of the literature. Selected references were abstracted and assigned to each draft recommendation. Rationales for each recommendation were drafted citing supporting evidence. After two rounds of panel voting, five recommendations did not achieve agreement based on the RAND rules, one recommendation was combined with another recommendation during peer review, and 10 statements received final approval. The degree of consensus based on the median score and the dispersion of voting around the median are shown in Appendix 5. Nine statements were approved as strong recommendations, and one was approved as a conditional recommendation. Therefore, the final recommendation count was 10. The strength of the recommendation and degree of consensus for each recommendation are summarized in Table 1.
Terminology
LP is a procedure in which a spinal needle is introduced into the subarachnoid space for the purpose of collecting CSF for diagnostic evaluation and/or therapeutic relief.
Throughout this document, the phrases “ultrasound-guided” and “ultrasound guidance” refer to the use of ultrasound to mark a needle insertion site immediately before performing the procedure. This is also known as static ultrasound guidance. Real-time or dynamic ultrasound guidance refers to direct visualization of the needle tip as it traverses through the skin and soft tissues to reach the ligamentum flavum. Any reference to real-time ultrasound guidance is explicitly stated.
Clinical outcomes
1) When ultrasound equipment is available, along with providers who are appropriately trained to use it, we recommend that ultrasound guidance should be used for site selection of LPs to reduce the number of needle insertion attempts and needle redirections and increase the overall procedure success rates, especially in patients who are obese or have difficult-to-palpate landmarks.
Rationale. LPs have historically been performed by selecting a needle insertion site based on palpation of anatomical landmarks. However, an estimated 30% of patients requiring LP in emergency departments have lumbar spine landmarks that are difficult to palpate, most commonly due to obesity.13 Furthermore, lumbar puncture performed based on palpation of landmarks alone has been reported to fail in 28% of patients.14
Ultrasound can be used at the bedside to elucidate the lumbar spine anatomy to guide performance of LP or epidural catheterization. Since the early 2000s, randomized studies comparing the use of ultrasound guidance (ultrasound-guided) versus anatomical landmarks (landmark-guided) to map the lumbar spine for epidural catheterization have emerged. It is important to recognize that the exact same ultrasound technique is used for site marking of LP, epidural catheterization, and spinal anesthesia—the key difference is how deep the needle tip is inserted. Therefore, data from these three ultrasound-guided procedures are often pooled. Currently, at least 33 randomized controlled studies comparing ultrasound-guided vs landmark-guided site selection for LP, epidural catheterization, or spinal anesthesia have been published.22-49 We present three meta-analyses below that pooled data primarily from randomized controlled studies comparing ultrasound-guided vs landmark-guided site selection for LP or spinal anesthesia.
In 2013, Shaikh et al. published the first meta-analysis with 14 randomized controlled studies comparing ultrasound-guided vs landmark-guided site selection for LP (n = 5) or epidural catheterization (n = 9). The pooled data showed that use of ultrasound guidance decreased the proportion of failed procedures (risk ratio 0.21, 95% CI 0.10-0.43) with an absolute risk reduction of 6.3% (95% CI 4.1%-8.4%) and a number needed to treat of 16 (95% CI 12-25) to prevent one failed procedure. In addition, the use of ultrasound reduced the mean number of attempts by 0.44 (95% CI 0.24-0.64) and reduced the mean number of needle redirections by 1.00 (95% CI 0.75-1.24). The reduction in risk of a failed procedure was similar for LPs (risk ratio 0.19 [95% CI 0.07-0.56]) and epidural catheterizations (risk ratio 0.23 [95% CI 0.09-0.60]).16
A similar meta-analysis published by Perlas et al. in 2016 included a total of 31 studies, both randomized controlled and cohort studies, evaluating the use of ultrasound guidance for LP, spinal anesthesia, and epidural catheterization.50 The goal of this systematic review and meta-analysis was to establish clinical practice recommendations. The authors concluded (1) the data consistently suggest that ultrasound is more accurate than palpation for lumbar interspace identification, (2) ultrasound allows accurate measurement of the needle insertion depth to reach the epidural space with a mean difference of <3 mm compared with the actual needle insertion depth, and (3) ultrasound increases the efficacy of lumbar epidural or spinal anesthesia by decreasing the mean number of needle passes for success by 0.75 (95% CI 0.44-1.07) and reducing the risk of a failed procedure (risk ratio 0.51 [95% CI 0.32-0.80]), both in patients with normal surface anatomy and in those with technically difficult surface anatomy due to obesity, scoliosis, or previous spine surgery.
Compared to the two earlier meta-analyses that included studies of both LP and spinal anesthesia procedures, the meta-analysis conducted by Gottlieb et al. in 2018 pooled data from 12 randomized controlled studies of ultrasound guidance for LPs only. For the primary outcome, pooled data from both adult and pediatric studies demonstrated higher procedural success rates with ultrasound-guided vs landmark-guided LPs (90% vs 81%) with an odds ratio of 2.1 (95% CI 0.66-7.44) in favor of ultrasound; however, there were no statistically significant differences when the adult and pediatric subgroups were analyzed separately, probably due to underpowering. For the secondary outcomes, data from the adult subgroup showed that use of ultrasound guidance was associated with fewer traumatic LPs (OR 0.28, 95% CI 0.14-0.59), shorter time to procedural success (adjusted mean difference –3.03 minutes, 95% CI –3.54 to –2.52), fewer number of needle passes (adjusted mean difference –0.81 passes, 95% CI –1.57 to –0.05), and lower patient pain scores (adjusted mean difference –2.53, 95% CI –3.89 to –1.17).
At least 12 randomized controlled studies have been published comparing the use of ultrasound guidance vs landmarks for the performance of LP or spinal anesthesia in adult patients, which were not included in the abovementioned meta-analyses. These individual studies demonstrated similar benefits of using ultrasound guidance: reduced needle insertion attempts, reduced needle redirections, and increased overall procedural success rates.17,31,37,40,41,43-49
It is important to recognize that four randomized controlled studies did not demonstrate any benefits of ultrasound guidance on the number of attempts or procedural success rates,23,33,41,51 and three of these studies were included in the abovementioned meta-analyses.23,33,51 Limitations of these negative studies include potential selection bias, inadequate sample sizes, and varying levels of operator skills in procedures, ultrasound guidance, or both. One study included emergency medicine residents as operators with varying degrees of ultrasound skills, and more importantly, patient enrollment occurred by convenience sampling, which may have introduced selection bias. Furthermore, most of the patients were not obese (median BMI of 27 kg/m2), and it is unclear why 10 years lapsed from data collection until publication.33 Another study with three experienced anesthesiologists as operators performing spinal anesthesia enrolled only patients who were not obese (mean BMI of 29 kg/m2) and had easily palpable bony landmarks—two patient characteristics associated with the least benefit of using ultrasound guidance in other studies.23 Another negative study had one experienced anesthesiologist marking obstetric patients with ultrasound, but junior residents performing the actual procedure in the absence of the anesthesiologist who had marked the patient.41
In general, the greatest benefit of using ultrasound guidance for LP has been demonstrated in obese patients.24,32,34,35,52,53 Benefits have been shown in specific obese patient populations, including obstetric,31,54,55 orthopedic,24,56,57 and emergency department patients.30
By increasing the procedural success rates with the use of ultrasound at the bedside, fewer patients may be referred to interventional radiology for fluoroscopic-guided LP, decreasing the patient exposure to ionizing radiation. A randomized study (n = 112) that compared site marking with ultrasound guidance versus fluoroscopic guidance for epidural steroid injections found the two techniques to be equivalent with respect to mean procedure time, number of needle insertion attempts, or needle passes.58 Another randomized study found that the performance time of ultrasound guidance was two minutes shorter (P < .05) than fluoroscopic guidance.59
Techniques
2) We recommend that ultrasound should be used to more accurately identify the lumbar spine level than physical examination in both obese and nonobese patients.
Rationale. Traditionally, an imaginary line connecting the iliac crests (intercristal line, Tuffier’s line, or Jacoby’s line) was considered to identify the L4 vertebra or the L4-L5 interspinous space in the midline; however, studies have revealed this traditional landmark to be much less accurate than previously thought. In general, palpating the iliac crests to mark the intercristal line identifies an interspinous space that is one space cephalad (ie, the L2-L3 interspinous space) but can range from L1-L2 to L4-L5.46,60-64 If an LP is inadvertently performed in the L1-L2 interspinous space, the risk of spinal cord injury is higher than that when performed in a more distal interspinous space.
A study by Margarido et al. with 45 patients with a mean BMI of 30 kg/m2 found that the intercristal line was located above the L4-L5 interspinous space in 100% of patients. More importantly, the intercristal line was above L2-L3 in 36% of patients and above L1-L2 in 4% of patients. It is important to note that patients with scoliosis or previous spine surgery were excluded from this study, and all examinations were performed by two experienced anesthesiologists with patients in a sitting position—all factors that would favor accurate palpation and marking of the iliac crests.60
In a study of nonobese patients (mean BMI 28 kg/m2) undergoing spinal anesthesia, Duniec et al. compared the lumbar level identified by palpation versus ultrasound and found discordance between the two techniques in 36% of patients; 18% were one space too cephalad, 16% were one space too caudal, and 2% were off by two interspinous spaces.61 Another study found discordance in 64% of patients (mean BMI 28 kg/m2) when comparing the interspinous level where spinal anesthesia had been performed by palpation versus a post-procedural ultrasound examination. This study revealed that the interspinous space was more cephalad in 50% of patients with 6% of punctures performed in the L1-L2 interspace.62 A similar study compared the accuracy of palpation vs ultrasound to identify the L3-L4 interspinous space in obese (mean BMI 34 kg/m2) versus nonobese (mean BMI 27 kg/m2) patients. This study found marking a space above L3-L4 in 51% of obese and 40% of nonobese patients and marking of the L1-L2 interspace in 7% of obese and 4% of nonobese patients.64
A study comparing palpation vs ultrasound found that 68% of obese patients with a BMI of >30 kg/m2 had difficult-to-palpate lumbar spine landmarks, but with the use of ultrasound, landmarks were identified in 76% of all patients, including obese and nonobese, with difficult-to-palpate landmarks.65
3) We suggest using ultrasound for selecting and marking a needle insertion site just before performing LPs in either a lateral decubitus or sitting position. The patient should remain in the same position after marking the needle insertion site.
Rationale. Ultrasound mapping of the lumbar spine can be performed in either a lateral decubitus or sitting position. Selecting and marking a needle insertion site should be performed at the bedside just before performing the procedure. The patient must remain in the same position in the interim between marking and inserting the needle, as a slight change in position can alter the needle trajectory, lowering the LP success rate. Although performing LPs in a lateral decubitus position has the advantage of accurately measuring the opening pressure, misalignment of the shoulder and pelvic girdles and bowing of the bed in a lateral decubitus position may lower LP success rates.
One randomized study comparing ultrasound-guided spinal anesthesia in a lateral decubitus versus sitting position found no difference in the number of needle insertion attempts or measurement of the skin-dura distance; however, the needle insertion depth was 0.73 cm greater in a lateral decubitus vs sitting position (P = .002).66 Procedural success rates of LP with ultrasound guidance have not been directly compared in a sitting versus lateral decubitus position, although the overall procedural success rates were higher in one study that allowed the operator to choose either sitting or lateral decubitus position when ultrasound was used.32
4) We recommend that a low-frequency transducer, preferably a curvilinear array transducer, should be used to evaluate the lumbar spine and mark a needle insertion site in most patients. A high-frequency linear array transducer may be used in nonobese patients.
Rationale. Low-frequency transducers emit sound waves that penetrate deep tissues, allowing visualization of bones and ligaments of the lumbar spine. A high-frequency linear transducer offers better resolution but shallower penetration to approximately 6-9 cm, limiting its use for site marking in overweight and obese patients. In obese patients, the ligamentum flavum is often deeper than 6 cm, which requires a low-frequency transducer to be visualized.
Most of the randomized controlled studies demonstrating benefits of using ultrasound guidance compared with landmark guidance for performance of LP, epidural anesthesia, or spinal anesthesia have used a low-frequency, curvilinear transducer.22,24,26-28,31,34-36,39,43-45,67 Two randomized controlled trials used a high-frequency linear transducer for site marking of lumbar procedures.30,32,37 Using a high-frequency linear transducer has been described in real-time, ultrasound-guided LPs, the advantage being better needle visualization with a linear transducer.29 Detection of blood vessels by color flow Doppler may be another advantage of using a high-frequency linear transducer, although a study by Grau et al. showed that use of color flow Doppler with a low-frequency curvilinear transducer permitted visualization of interspinous vessels as small as 0.5 mm in size.68
5) We recommend that ultrasound should be used to map the lumbar spine, starting at the level of the sacrum and sliding the transducer cephalad, sequentially identifying the lumbar spine interspaces.Rationale. Although no studies have directly compared different ultrasound scanning protocols to map the lumbar spine, starting at the level of the sacrum and sliding the transducer cephalad to sequentially identify the lumbar interspinous spaces is the most commonly described technique in studies demonstrating improved clinical outcomes with the use of ultrasound.24,31,34,37,39,40,45,56,57,67 Because the sacrum can be easily recognized, identifying it first is most beneficial in patients with few or no palpable landmarks.
All five lumbar spinous processes and interspinous spaces can be mapped from the sacrum using either a midline or a paramedian approach, and the widest interspinous space can be selected. In a midline approach, either a transverse or a longitudinal view is obtained. The transducer is centered on the sacrum and slid cephalad from L5 to L1 to identify each spinous process and interspinous space. In a paramedian approach, longitudinal paramedian views are obtained from the L5–sacrum interspace to the L1–L2 interspace, and each interspinous space is identified as the transducer is slid cephalad. Both these approaches are effective for mapping the lumbar spine. Whether the entire lumbar spine is mapped, and whether a midline or a paramedian approach is utilized, will depend on the operator’s preference.
6) We recommend that ultrasound should be used in a transverse plane to mark the midline of the lumbar spine and a longitudinal plane to mark the interspinous spaces. The intersection of these two lines marks the needle insertion site.
Rationale. The most common technique described in comparative studies of ultrasound vs landmarks includes visualization of the lumbar spine in two planes, a transverse plane to identify the midline and a longitudinal plane to identify the interspinous spaces. The majority of randomized controlled studies that demonstrated a reduction in the number of needle insertion attempts and an increase in the procedural success rates have used this technique (see Clinical Outcomes).22,24,28,32,35-37,43,44 Marking the midline and interspinous space(s) for LP may be performed in any order, starting with either the transverse or longitudinal plane first.
The midline of the spine is marked by placing the transducer in a transverse plane over the lumbar spine, centering over the spinous processes that have a distinct hyperechoic tip and a prominent acoustic shadow deep to the bone, and drawing a line perpendicular to the center of the transducer delineating the midline. The midline should be marked over a minimum of two or three spinous processes.
To identify the interspinous spaces, the transducer is aligned longitudinally over the midline. The transducer is slid along the midline to identify the widest interspinous space. Once the transducer is centered over the widest interspinous space, a line perpendicular to the center of the transducer is drawn to mark the interspinous space. The intersection of the lines marking the spinal midline and the selected interspinous space identifies the needle entry point.
To visualize the ligamentum flavum from a paramedian view, the transducer is oriented longitudinally over the midline, slid approximately 1 cm laterally, and tilted approximately 15 degrees aiming the ultrasound beam toward the midline. The skin–ligamentum flavum distance is most reliably measured from a paramedian view. Alternatively, in some patients, the ligamentum flavum may be visualized in the midline and the depth can be measured.
7) We recommend that ultrasound should be used during a preprocedural evaluation to measure the distance from the skin surface to the ligamentum flavum from a longitudinal paramedian view to estimate the needle insertion depth and ensure that a spinal needle of adequate length is used.
Rationale. The distance from the skin to the ligamentum flavum can be measured using ultrasound during preprocedural planning. Knowing the depth to the ligamentum flavum preprocedurally allows the operator to procure a spinal needle of adequate length, anticipate the insertion depth before CSF can be obtained, determine the depth to which a local anesthetic will need to be injected, and decide whether the anticipated difficulty of the procedure warrants referral to or consultation with another specialist.
The skin–ligamentum flavum distance can be measured from a transverse midline view or a longitudinal paramedian view. A longitudinal paramedian view provides an unobstructed view of the ligamentum flavum due to less shadowing from bony structures compared with a midline view. Several studies have demonstrated a strong correlation between the skin–ligamentum flavum distance measured by ultrasound and the actual needle insertion depth in both midline and paramedian views.28,34,36,53,54,57,69,70
A meta-analysis that included 13 comparative studies evaluating the correlation between ultrasound-measured depth and actual needle insertion depth to reach the epidural or intrathecal space consistently demonstrated a strong correlation between the measured and actual depth.50 A few studies have reported near-perfect Pearson correlation coefficients of 0.98.55,71,72 The pooled correlation was 0.91 (95% CI 0.87-0.94). All studies measured the depth from the skin to the ventral side of the ligamentum flavum or the intrathecal space from either a longitudinal paramedian view (n = 4) or a transverse midline view (n = 9). Eight of the more recent studies evaluated the accuracy of the ultrasound measurements and found the depth measurements by ultrasound to be accurate within 1-13 mm of the actual needle insertion depth, with seven of the eight studies reporting a mean difference of ≤3 mm.50
Measurement of the distance between the skin and the ligamentum flavum generally underestimates the needle insertion depth. One study reported that measurement of the skin–ligamentum flavum distance underestimates the needle insertion depth by 7.6 mm to obtain CSF, whereas measurement of the skin–posterior longitudinal ligament distance overestimates the needle insertion depth by 2.5 mm.57 A well-accepted contributor to underestimation of the depth measurements using ultrasound is compression of the skin and soft tissues by the transducer, and therefore, pressure on the skin must be released before freezing an image and measuring the depth to the subarachnoid space.
Training
8) We recommend that novices should undergo simulation-based training, where available, before attempting ultrasound-guided LPs on actual patients.
Rationale. Similar to training for other bedside procedures, dedicated training sessions, including didactics, supervised practice on patients, and simulation-based practice, should be considered when teaching novices to perform ultrasound-guided LP. Simulation-based training facilitates acquisition of knowledge and skills to perform invasive bedside procedures, including LP.73 Simulation-based training has been commonly incorporated into procedure training for trainees using an immersive experience, such as a “boot camp,”74-77 or a standardized curriculum,78,79 and has demonstrated improvements in post-course procedural knowledge, technical skills, and operator confidence. Two of these studies included training in the use of ultrasound guidance for LP. These studies showed that simulation-based practice improved skill acquisition and confidence.80,81 Simulation using novel computer software may improve skill acquisition in the use of ultrasound guidance for LP.82
9) We recommend that training in ultrasound-guided LPs should be adapted based on prior ultrasound experience, as learning curves will vary.Rationale. The learning curve to achieve competency in the use of ultrasound guidance for LP has not been well studied. The rate of attaining competency in identifying lumbar spine structures using ultrasound will vary by provider based on prior skills in ultrasound-guided procedures.83 Thus, providers with prior ultrasound experience may require less training than those without such experience to achieve competency. However, extensive experience in performing landmark-guided LPs does not necessarily translate into rapid acquisition of skills to perform the procedure with ultrasound guidance. A study of practicing anesthesiologists with no prior ultrasound experience demonstrated that 20 supervised trials of ultrasound-guided spinal anesthesia were insufficient to achieve competency.84 Although minimums may be a necessary step to gain competence, using them as a sole means to define competence does not account for variable learning curves.12 Based on a national survey of 21 hospitalist procedure experts, the mean current vs suggested minimums for initial and ongoing hospital privileging for LPs were 1.8 vs 6.9 and 2.2 vs 4.6 annually in one report.85
A fundamental question that needs to be answered is how to define competency in the use of ultrasound guidance for LP, including the specific skills and knowledge that must be mastered. At a minimum, providers must be able to identify lumbar spinous processes and distinguish them from the sacrum, identify the lumbar interspinous spaces and their corresponding levels, and estimate the depth from the skin to the ligamentum flavum from the midline and paramedian planes. Novice operators may benefit from practicing lumbar spine mapping of nonobese patients using a high-frequency linear transducer that generates high-resolution images and facilitates recognition of lumbar spine structures.
10) We recommend that novice providers should be supervised when performing ultrasound-guided LPs before performing the procedure independently on patients.
Rationale: Demonstration of competency in the use of ultrasound to identify lumbar spine anatomy should be achieved before routinely performing the procedure independently on patients.18 All providers will require a variable period of supervised practice to demonstrate the appropriate technique, followed by a period of unsupervised practice before competency is achieved. Supervised practice with guidance and feedback has been shown to significantly improve providers’ ability to delineate lumbar spine anatomy.86
KNOWLEDGE GAPS
The process of producing these guidelines revealed areas of uncertainty and important gaps in the literature regarding the use of ultrasound guidance for LP.
First, it is unclear whether the use of ultrasound guidance for LP reduces postprocedural back pain and whether it improves patient satisfaction. Several studies have evaluated postprocedural back pain28,30,32,33,52 and patient satisfaction28,29,33,51 with the use of ultrasound guidance, but these studies have found inconsistent results. Some of these results were probably due to insufficient statistical power or confounding variables. Furthermore, benefits have been demonstrated in certain subgroups, such as overweight patients or those with anatomical abnormalities, as was found in two studies.52,87 Use of ultrasound guidance for spinal anesthesia has been shown to reduce postprocedural headache28 and improve patient satisfaction51, although similar benefit has not been demonstrated in patients undergoing LP.
Second, the effect of using ultrasound guidance on the frequency of traumatic LPs is an area of uncertainty. A “traumatic tap” is defined as an inadvertent puncture of an epidural vein during passage of the spinal needle through the dura. It remains difficult to discern in these studies whether red blood cells detected in the CSF resulted from puncture of an epidural vein or from needle trauma of the skin and soft tissues. Despite this uncertainty, at least seven randomized controlled studies have assessed the effect of ultrasound guidance on traumatic LPs. The meta-analysis by Shaikh et al. included five randomized controlled studies that assessed the effect of ultrasound guidance on the reporting of traumatic taps. The study found a reduced risk of traumatic taps (risk ratio 0.27 [95% CI 0.11-0.67]), an absolute risk reduction of 5.9% (95% CI 2.3%-9.5%), and a number needed to treat of 17 (95% CI 11-44) to prevent one traumatic tap.16 Similarly, the meta-analysis by Gottlieb et al. showed a lower risk of traumatic taps among adults undergoing LP with ultrasound guidance in five randomized controlled studies with an odds ratio of 0.28 (95% CI 0.14-0.59). The meta-analysis by Gottlieb et al. included two adult studies that were not included by Shaikh et al.
Third, several important questions about the technique of ultrasound-guided LP remain unanswered. In addition to the static technique, a dynamic technique with real-time needle tracking has been described to perform ultrasound-guided LP, epidural catheterization, and spinal anesthesia. A pilot study by Grau et al. found that ultrasound used either statically or dynamically had fewer insertion attempts and needle redirections than use of landmarks alone.29 Three other pilot studies showed successful spinal anesthesia in almost all patients88-90 and one large study demonstrated successful spinal anesthesia with real-time ultrasound guidance in 97 of 100 patients with a median of three needle passes.91 Furthermore, a few industry-sponsored studies with small numbers of patients have described the use of novel needle tracking systems that facilitate needle visualization during real-time ultrasound-guided LP.92,93 However, to our knowledge, no comparative studies of static versus dynamic guidance using novel needle tracking systems in human subjects have been published, and any potential role for these novel needle tracking systems has not yet been defined.
Finally, the effects of using ultrasound guidance on clinical decision-making, timeliness, and cost-effectiveness of LP have not yet been explored but could have important clinical practice implications.
CONCLUSION
Randomized controlled trials have demonstrated that using ultrasound guidance for LPs can reduce the number of needle insertion attempts and needle redirections and increase the overall procedural success rates. Ultrasound can more accurately identify the lumbar spine level than physical examination in both obese and nonobese patients, although the greatest benefit of using ultrasound guidance for LPs has been shown in obese patients.
Ultrasound permits assessment of the interspinous space width and measurement of the ligamentum flavum depth to select an optimal needle insertion site and adequate length spinal needle. Although the use of real-time ultrasound guidance has been described, the use of static ultrasound guidance for LP site marking remains the standard technique.
Acknowledgments
The authors thank all the members of the Society of Hospital Medicine Point-of-care Ultrasound Task Force and the Education Committee members for their time and dedication to develop these guidelines.
Collaborators from Society of Hospital Medicine Point-of-care Ultrasound Task Force: Saaid Abdel-Ghani, Robert Arntfield, Jeffrey Bates, Anjali Bhagra, Michael Blaivas, Daniel Brotman, Carolina Candotti, Richard Hoppmann, Susan Hunt, Trevor P. Jensen, Paul Mayo, Benji Mathews, Satyen Nichani, Vicki Noble, Martin Perez, Nitin Puri, Aliaksei Pustavoitau, Kreegan Reierson, Sophia Rodgers, Kirk Spencer, Vivek Tayal, David Tierney
SHM Point-of-care Ultrasound Task Force: CHAIRS: Nilam Soni, Ricardo Franco-Sadud, Jeff Bates. WORKING GROUPS: Thoracentesis Working Group: Ria Dancel (chair), Daniel Schnobrich, Nitin Puri. Vascular Access Working Group: Ricardo Franco (chair), Benji Matthews, Saaid Abdel-Ghani, Sophia Rodgers, Martin Perez, Daniel Schnobrich. Paracentesis Working Group: Joel Cho (chair), Benji Matthews, Kreegan Reierson, Anjali Bhagra, Trevor P. Jensen Lumbar Puncture Working Group: Nilam J. Soni (chair), Ricardo Franco, Gerard Salame, Josh Lenchus, Venkat Kalidindi, Ketino Kobaidze. Credentialing Working Group: Brian P Lucas (chair), David Tierney, Trevor P. Jensen PEER REVIEWERS: Robert Arntfield, Michael Blaivas, Richard Hoppmann, Paul Mayo, Vicki Noble, Aliaksei Pustavoitau, Kirk Spencer, Vivek Tayal. METHODOLOGIST: Mahmoud El Barbary. LIBRARIAN: Loretta Grikis. SOCIETY OF HOSPITAL MEDICINE EDUCATION COMMITTEE: Daniel Brotman (past chair), Satyen Nichani (current chair), Susan Hunt. SOCIETY OF HOSPITAL MEDICINE STAFF: Nick Marzano.
Disclosures
The authors have nothing to disclose.
Funding
Brian P Lucas: Department of Veterans Affairs, Veterans Health Administration, Office of Research and Development and Dartmouth SYNERGY, National Institutes of Health, National Center for Translational Science (UL1TR001086). Nilam Soni: Department of Veterans Affairs, Quality Enhancement Research Initiative (QUERI) Partnered Evaluation Initiative Grant (HX002263-01A1).
Disclaimer
The contents of this publication do not represent the views of the U.S. Department of Veterans Affairs or the United States Government.
1. Wolfe KS, Kress JP. Risk of procedural hemorrhage. Chest. 2016;150(1):237-246. https://doi.org/10.1016/j.chest.2016.01.023.
2. Kroll H, Duszak R, Jr, Nsiah E, et al. Trends in lumbar puncture over 2 decades: a dramatic shift to radiology. AJR Am J Roentgenol. 2015;204(1):15-19. https://doi.org/10.2214/AJR.14.12622.
3. Vickers A, Donnelly JP, Moore JX, Wang HE. 263EMF epidemiology of lumbar punctures in hospitalized patients in United States. Ann Emerg Med. 2017;70(4):S104. https://doi.org/10.1016/j.annemergmed.2017.07.241.
4. Køster-Rasmussen R, Korshin A, Meyer CN. Antibiotic treatment delay and outcome in acute bacterial meningitis. J Infect. 2008;57(6):449-454. https://doi.org/10.1016/j.jinf.2008.09.033.
5. Aronin SI, Peduzzi P, Quagliarello VJ. Community-acquired bacterial meningitis: risk stratification for adverse clinical outcome and effect of antibiotic timing. Ann Intern Med. 1998;129(11):862-869. https://doi.org/10.7326/0003-4819-129-11_Part_1-199812010-00004.
6. Lepur D, Barsić B. Community-acquired bacterial meningitis in adults: antibiotic timing in disease course and outcome. Infection. 2007;35(4):225-231. https://doi.org/10.1007/s15010-007-6202-0.
7. Proulx N, Fréchette D, Toye B, Chan J, Kravcik S. Delays in the administration of antibiotics are associated with mortality from adult acute bacterial meningitis. QJM. 2005;98(4):291-298. https://doi.org/10.1093/qjmed/hci047.
8. Auburtin M, Wolff M, Charpentier J, et al. Detrimental role of delayed antibiotic administration and penicillin-nonsusceptible strains in adult intensive care unit patients with pneumococcal meningitis: the PNEUMOREA prospective multicenter study. Crit Care Med. 2006;34(11):2758-2765. https://doi.org/10.1097/01.CCM.0000239434.26669.65.
9. Michael B, Menezes BF, Cunniffe J, et al. Effect of delayed lumbar punctures on the diagnosis of acute bacterial meningitis in adults. Emerg Med J. 2010;27(6):433-438. https://doi.org/10.1136/emj.2009.075598.
10. Glimåker M, Johansson B, Grindborg Ö, et al. Adult bacterial meningitis: earlier treatment and improved outcome following guideline revision promoting prompt lumbar puncture. Clin Infect Dis. 2015;60(8):1162-1169. https://doi.org/10.1093/cid/civ011.
11. Nichani S, Crocker J, Fitterman N, Lukela M. Updating the core competencies in hospital medicine--2017 Revision: introduction and methodology. J Hosp Med. 2017;12(4):283-287. https://doi.org/10.12788/jhm.2715.
12. Soni NJ, Schnobrich D, Matthews BK, et al. Point-of-care ultrasound for hospitalists: a position statement of the Society of Hospital Medicine. J Hosp Med. 2019;14:E1-E6. https://doi.org/10.12788/jhm.3079.
13. Shah KH, McGillicuddy D, Spear J, Edlow JA. Predicting difficult and traumatic lumbar punctures. Am J Emerg Med. 2007;25(6):608-611. https://doi.org/10.1016/j.ajem.2006.11.025.
14. Williams P, Tait G, Wijeratne T. Success rate of elective lumbar puncture at a major Melbourne neurology unit. Surg Neurol Int. 2018;9:12. https://doi.org/10.4103/sni.sni_426_17.
15. Gottlieb M, Holladay D, Peksa GD. Ultrasound-assisted lumbar punctures: a systematic review and meta-analysis. Acad Emerg Med. 2018;26(1). https://doi.org/10.1111/acem.13558.
16. Shaikh F, Brzezinski J, Alexander S, et al. Ultrasound imaging for lumbar punctures and epidural catheterisations: systematic review and meta-analysis. BMJ. 2013;346:f1720. https://doi.org/10.1136/bmj.f1720.
17. Perlas A, Chaparro LE, Chin KJ. Lumbar neuraxial ultrasound for spinal and epidural anesthesia: a systematic review and meta-analysis. Reg Anesth Pain Med. 2016;41(2):251-260. https://doi.org/10.1097/AAP.0000000000000184.
18. Lucas BP, Tierney DM, Jensen TP, et al. Credentialing of hospitalists in ultrasound-guided bedside procedures: a position statement of the Society of Hospital Medicine. J Hosp Med. 2018;13(2):117-125. https://doi.org/10.12788/jhm.2917.
19. Dancel R, Schnobrich D, Puri N, et al. Recommendations on the use of ultrasound guidance for adult thoracentesis: a position statement of the Society of Hospital Medicine. J Hosp Med. 2018;13(2):126-135. https://doi.org/10.12788/jhm.2940.
20. Soni NJ, Franco-Sadud R, Schnobrich D, et al. Ultrasound guidance for lumbar puncture. Neurol Clin Pract. 2016;6(4):358-368. https://doi.org/10.1212/CPJ.0000000000000265.
21. Fitch K, Bernstein SJ, Aguilar MD, Burnand B, LaCalle JR. The Rand/UCLA Appropriateness Method User’s Manual. Santa Monica, CA: Rand Corp; 2001.
22. Abdelhamid SA, Mansour MA. Ultrasound-guided intrathecal anesthesia: does scanning help? Egypt J Anaesth. 2013;29(4):389-394. https://doi.org/10.1016/j.egja.2013.06.003.
23. Ansari T, Yousef A, El Gamassy A, Fayez M. Ultrasound-guided spinal anaesthesia in obstetrics: is there an advantage over the landmark technique in patients with easily palpable spines? Int J Obstet Anesth. 2014;23(3):213-216. https://doi.org/10.1016/j.ijoa.2014.03.001.
24. Chin KJ, Perlas A, Chan V, et al. Ultrasound imaging facilitates spinal anesthesia in adults with difficult surface anatomic landmarks. Anesthesiology. 2011;115(1):94-101. https://doi.org/10.1097/ALN.0b013e31821a8ad4.
25. Cho YC, Koo DH, Oh SK, et al. Comparison of ultrasound-assisted lumbar puncture with lumbar puncture using palpation of landmarks in aged patients in an emergency center. J Korean Soc Emerg Med. 2009;20(3):304.
26. Grau T, Leipold RW, Conradi R, Martin E. Ultrasound control for presumed difficult epidural puncture. Acta Anaesthesiol Scand. 2001;45(6):766-771. https://doi.org/10.1034/j.1399-6576.2001.045006766.x.
27. Grau T, Leipold RW, Conradi R, Martin E, Motsch J. Ultrasound imaging facilitates localization of the epidural space during combined spinal and epidural anesthesia. Reg Anesth Pain Med. 2001;26(1):64-67. https://doi.org/10.1053/rapm.2001.19633.
28. Grau T, Leipold RW, Conradi R, Martin E, Motsch J. Efficacy of ultrasound imaging in obstetric epidural anesthesia. J Clin Anesth. 2002;14(3):169-175. https://doi.org/10.1016/S0952-8180(01)00378-6.
29. Grau T, Leipold RW, Fatehi S, Martin E, Motsch J. Real-time ultrasonic observation of combined spinal-epidural anaesthesia. Eur J Anaesthesiol. 2004;21(1):25-31. https://doi.org/10.1017/S026502150400105X.
30. Mofidi M, Mohammadi M, Saidi H, et al. Ultrasound guided lumbar puncture in emergency department: time saving and less complications. J Res Med Sci. 2013;18(4):303-307. PubMed
31. Nassar M, Abdelazim IA. Pre-puncture ultrasound guided epidural insertion before vaginal delivery. J Clin Monit Comput. 2015;29(5):573-577. https://doi.org/10.1007/s10877-014-9634-y.
32. Nomura JT, Leech SJ, Shenbagamurthi S, et al. A randomized controlled trial of ultrasound-assisted lumbar puncture. J Ultrasound Med. 2007;26(10):1341-1348. https://doi.org/10.7863/jum.2007.26.10.1341.
33. Peterson MA, Pisupati D, Heyming TW, Abele JA, Lewis RJ. Ultrasound for routine lumbar puncture. Acad Emerg Med. 2014;21(2):130-136. https://doi.org/10.1111/acem.12305.
34. Sahin T, Balaban O, Sahin L, Solak M, Toker K. A randomized controlled trial of preinsertion ultrasound guidance for spinal anaesthesia in pregnancy: outcomes among obese and lean parturients: ultrasound for spinal anesthesia in pregnancy. J Anesth. 2014;28(3):413-419. https://doi.org/10.1007/s00540-013-1726-1.
35. Wang Q, Yin C, Wang TL. Ultrasound facilitates identification of combined spinal-epidural puncture in obese parturients. Chin Med J (Engl). 2012;125(21):3840-3843. PubMed
36. Vallejo MC, Phelps AL, Singh S, Orebaugh SL, Sah N. Ultrasound decreases the failed labor epidural rate in resident trainees. Int J Obstet Anesth. 2010;19(4):373-378. https://doi.org/10.1016/j.ijoa.2010.04.002.
37. Darrieutort-Laffite C, Bart G, Planche L, et al. Usefulness of a pre-procedure ultrasound scanning of the lumbar spine before epidural injection in patients with a presumed difficult puncture: a randomized controlled trial. Joint Bone Spine. 2015;82(5):356-361. https://doi.org/10.1016/j.jbspin.2015.02.001.
38. Vosko MR, Brunner C, Schreiber S. Lumbar puncture with ultrasound study (lupus study)-international prospective randomized multicentre trial. Int J Stroke. 2017;12(1):22. https://doi.org/10.1055/s-0037-1606991.
39. Urfalioğlu A, Bilal B, Öksüz G, et al. Comparison of the landmark and ultrasound methods in cesarean sections performed under spinal anesthesia on obese pregnants. J Matern Fetal Neonatal Med. 2017;30(9):1051-1056. https://doi.org/10.1080/14767058.2016.1199677.
40. Tawfik MM, Atallah MM, Elkharboutly WS, Allakkany NS, Abdelkhalek M. Does preprocedural ultrasound increase the first-pass success rate of epidural catheterization before cesarean delivery? A randomized controlled trial. Anesth Analg. 2017;124(3):851-856. https://doi.org/10.1213/ANE.0000000000001325.
41. Turkstra TP, Marmai KL, Armstrong KP, Kumar K, Singh SI. Preprocedural ultrasound assessment does not improve trainee performance of spinal anesthesia for obstetrical patients: a randomized controlled trial. J Clin Anesth. 2017;37:21-24. https://doi.org/10.1016/j.jclinane.2016.10.034.
42. Chong SE, Mohd Nikman A, Saedah A, et al. Real-time ultrasound-guided paramedian spinal anaesthesia: evaluation of the efficacy and the success rate of single needle pass. Br J Anaesth. 2017;118(5):799-801. https://doi.org/10.1093/bja/aex108.
43. Creaney M, Mullane D, Casby C, Tan T. Ultrasound to identify the lumbar space in women with impalpable bony landmarks presenting for elective caesarean delivery under spinal anaesthesia: a randomised trial. Int J Obstet Anesth. 2016;28:12-16. https://doi.org/10.1016/j.ijoa.2016.07.007.
44. Ekinci M, Alici HA, Ahiskalioglu A, et al. The use of ultrasound in planned cesarean delivery under spinal anesthesia for patients having nonprominent anatomic landmarks. J Clin Anesth. 2017;37:82-85. https://doi.org/10.1016/j.jclinane.2016.10.014.
45. Perna P, Gioia A, Ragazzi R, Volta CA, Innamorato M. Can pre-procedure neuroaxial ultrasound improve the identification of the potential epidural space when compared with anatomical landmarks? A prospective randomized study. Minerva Anestesiol. 2017;83(1):41-49. https://doi.org/10.23736/S0375-9393.16.11399-9.
46. Chin A, Crooke B, Heywood L, et al. A randomised controlled trial comparing needle movements during combined spinal-epidural anaesthesia with and without ultrasound assistance. Anaesthesia. 2018;73(4):466-473. https://doi.org/10.1111/anae.14206.
47. Dhanger S, Vinayagam S, Vaidhyanathan B, Rajesh IJ, Tripathy DK. Comparison of landmark versus pre-procedural ultrasonography-assisted midline approach for identification of subarachnoid space in elective caesarean section: a randomised controlled trial. Indian J Anaesth. 2018;62(4):280-284. https://doi.org/10.4103/ija.IJA_488_17.
48. Evans DP, Tozer J, Joyce M, Vitto MJ. Comparison of ultrasound-guided and landmark-based lumbar punctures in inexperienced resident physicians. J Ultrasound Med. 2019;38(3):613-620. https://doi.org/10.1002/jum.14728.
49. Srinivasan KK, Leo AM, Iohom G, Loughnane F, Lee PJ. Pre-procedure ultrasound-guided paramedian spinal anaesthesia at L5-S1: is this better than landmark-guided midline approach? A randomised controlled trial. Indian J Anaesth. 2018;62(1):53-60. https://doi.org/10.4103/ija.IJA_448_17.
50. Perlas A, Chaparro LE, Chin KJ. Lumbar neuraxial ultrasound for spinal and epidural anesthesia: a systematic review and meta-analysis. Reg Anesth Pain Med. 2016;41(2):251-260. https://doi.org/10.1097/AAP.0000000000000184.
51. Lim YC, Choo CY, Tan KT. A randomised controlled trial of ultrasound-assisted spinal anaesthesia. Anaesth Intensive Care. 2014;42(2):191-198. https://doi.org/10.1177/0310057X1404200205.
52. Honarbakhsh S, Osman C, Teo JTH, Gabriel C. Ultrasound-guided lumbar puncture as a diagnostic aid to reduce number of attempts and complication rates. Ultrasound. 2013;21(4):170-175. https://doi.org/10.1177/1742271X13504332.
53. Sahota JS, Carvalho JC, Balki M, Fanning N, Arzola C. Ultrasound estimates for midline epidural punctures in the obese parturient: paramedian sagittal oblique is comparable to transverse median plane. Anesth Analg. 2013;116(4):829-835. https://doi.org/10.1213/ANE.0b013e31827f55f0.
54. Balki M, Lee Y, Halpern S, Carvalho JC. Ultrasound imaging of the lumbar spine in the transverse plane: the correlation between estimated and actual depth to the epidural space in obese parturients. Anesth Analg. 2009;108(6):1876-1881. https://doi.org/10.1213/ane.0b013e3181a323f6.
55. Wallace DH, Currie JM, Gilstrap LC, Santos R. Indirect sonographic guidance for epidural anesthesia in obese pregnant patients. Reg Anesth. 1992;17(4):233-236. PubMed
56. Srinivasan KK, Iohom G, Loughnane F, Lee PJ. Conventional landmark-guided midline versus preprocedure ultrasound-guided paramedian techniques in spinal anesthesia. Anesth Analg. 2015;21(4):1089-1096. https://doi.org/10.1213/ANE.0000000000000911.
57. Chin KJ, Perlas A, Singh M, et al. An ultrasound-assisted approach facilitates spinal anesthesia for total joint arthroplasty. Can J Anaesth. 2009;56(9):643-650. https://doi.org/10.1007/s12630-009-9132-8.
58. Evansa I, Logina I, Vanags I, Borgeat A. Ultrasound versus fluoroscopic-guided epidural steroid injections in patients with degenerative spinal diseases: a randomised study. Eur J Anaesthesiol. 2015;32(4):262-268. https://doi.org/10.1097/EJA.0000000000000103.
59. Park Y, Lee JH, Park KD, et al. Ultrasound-guided vs fluoroscopy-guided caudal epidural steroid injection for the treatment of unilateral lower lumbar radicular pain: a prospective, randomized, single-blind clinical study. Am J Phys Med Rehabil. 2013;92(7):575-586. https://doi.org/10.1097/PHM.0b013e318292356b.
60. Margarido CB, Mikhael R, Arzola C, Balki M, Carvalho JC. The intercristal line determined by palpation is not a reliable anatomical landmark for neuraxial anesthesia. Can J Anaesth. 2011;58(3):262-266. https://doi.org/10.1007/s12630-010-9432-z.
61. Duniec L, Nowakowski P, Kosson D, Łazowski T. Anatomical landmarks based assessment of intravertebral space level for lumbar puncture is misleading in more than 30%. Anaesthesiol Intensive Ther. 2013;45(1):1-6. https://doi.org/10.5603/AIT.2013.0001.
62. Schlotterbeck H, Schaeffer R, Dow WA, et al. Ultrasonographic control of the puncture level for lumbar neuraxial block in obstetric anaesthesia. Br J Anaesth. 2008;100(2):230-234. https://doi.org/10.1093/bja/aem371.
63. Whitty R, Moore M, Macarthur A. Identification of the lumbar interspinous spaces: palpation versus ultrasound. Anesth Analg. 2008;106(2):538-540, table of contents. https://doi.org/10.1213/ane.0b013e31816069d9.
64. Locks Gde F, Almeida MC, Pereira AA. Use of the ultrasound to determine the level of lumbar puncture in pregnant women. Rev Bras Anestesiol. 2010;60(1):13-19. https://doi.org/10.1016/S0034-7094(10)70002-7.
65. Stiffler KA, Jwayyed S, Wilber ST, Robinson A. The use of ultrasound to identify pertinent landmarks for lumbar puncture. Am J Emerg Med. 2007;25(3):331-334. https://doi.org/10.1016/j.ajem.2006.07.010.
66. Gulay U, Meltem T, Nadir SS, Aysin A. Ultrasound-guided evaluation of the lumbar subarachnoid space in lateral and sitting positions in pregnant patients to receive elective cesarean operation. Pak J Med Sci. 2015;31(1):76-81. https://doi.org/10.12669/pjms.311.5647.
67. Kawaguchi R, Yamauchi M, Sugino S, Yamakage M. Ultrasound-aided ipsilateral-dominant epidural block for total hip arthroplasty: a randomised controlled single-blind study. Eur J Anaesthesiol. 2011;28(2):137-140. https://doi.org/10.1097/EJA.0b013e3283423457.
68. Grau T, Leipold RW, Horter J, Martin E, Motsch J. Colour Doppler imaging of the interspinous and epidural space. Eur J Anaesthesiol. 2001;18(11):706-712. https://doi.org/10.1097/00003643-200111000-00002.
69. Arzola C, Davies S, Rofaeel A, Carvalho JC. Ultrasound using the transverse approach to the lumbar spine provides reliable landmarks for labor epidurals. Anesth Analg. 2007;104(5):1188-92, tables of contents. https://doi.org/10.1213/01.ane.0000250912.66057.41.
70. Chauhan AK, Bhatia R, Agrawal S. Lumbar epidural depth using transverse ultrasound scan and its correlation with loss of resistance technique: a prospective observational study in Indian population. Saudi J Anaesth. 2018;12(2):279-282. https://doi.org/10.4103/sja.SJA_679_17.
71. Gnaho A, Nguyen V, Villevielle T, et al. Assessing the depth of the subarachnoid space by ultrasound. Rev Bras Anestesiol. 2012;62(4):520-530. https://doi.org/10.1016/S0034-7094(12)70150-2.
72. Cork RC, Kryc JJ, Vaughan RW. Ultrasonic localization of the lumbar epidural space. Anesthesiology. 1980;52(6):513-516. https://doi.org/10.1097/00000542-198006000-00013.
73. Barsuk JH, Cohen ER, Caprio T, et al. Simulation-based education with mastery learning improves residents’ lumbar puncture skills. Neurology. 2012;79(2):132-137. https://doi.org/10.1212/WNL.0b013e31825dd39d.
74. Lenchus J, Issenberg SB, Murphy D, et al. A blended approach to invasive bedside procedural instruction. Med Teach. 2011;33(2):116-123. https://doi.org/10.3109/0142159X.2010.509412.
75. Wayne DB, Cohen ER, Singer BD, et al. Progress toward improving medical school graduates’ skills via a “boot camp” curriculum. Simul Healthc. 2014;9(1):33-39. https://doi.org/10.1097/SIH.0000000000000001.
76. Cohen ER, Barsuk JH, Moazed F, et al. Making July safer: simulation-based mastery learning during intern boot camp. Acad Med. 2013;88(2):233-239. https://doi.org/10.1097/ACM.0b013e31827bfc0a.
77. Martin R, Gannon D, Riggle J, et al. A comprehensive workshop using simulation to train internal medicine residents in bedside procedures performed by internists. Chest. 2012;142(4):545A. https://doi.org/10.1378/chest.1390093.
78. Lenchus JD. End of the “see one, do one, teach one” era: the next generation of invasive bedside procedural instruction. J Am Osteopath Assoc. 2010;110(6):340-346. PubMed
79. Mourad M, Ranji S, Sliwka D. A randomized controlled trial of the impact of a teaching procedure service on the training of internal medicine residents. J Grad Med Educ. 2012;4(2):170-175. https://doi.org/10.4300/JGME-D-11-00136.1.
80. Restrepo CG, Baker MD, Pruitt CM, Gullett JP, Pigott DC. Ability of pediatric emergency medicine physicians to identify anatomic landmarks with the assistance of ultrasound prior to lumbar puncture in a simulated obese model. Pediatr Emerg Care. 2015;31(1):15-19. https://doi.org/10.1097/PEC.0000000000000330.
81. VanderWielen BA, Harris R, Galgon RE, VanderWielen LM, Schroeder KM. Teaching sonoanatomy to anesthesia faculty and residents: utility of hands-on gel phantom and instructional video training models. J Clin Anesth. 2015;27(3):188-194. https://doi.org/10.1016/j.jclinane.2014.07.007.
82. Keri Z, Sydor D, Ungi T, et al. Computerized training system for ultrasound-guided lumbar puncture on abnormal spine models: a randomized controlled trial. Can J Anaesth. 2015;62(7):777-784. https://doi.org/10.1007/s12630-015-0367-2.
83. Deacon AJ, Melhuishi NS, Terblanche NC. CUSUM method for construction of trainee spinal ultrasound learning curves following standardised teaching. Anaesth Intensive Care. 2014;42(4):480-486. https://doi.org/10.1177/0310057X1404200409.
84. Margarido CB, Arzola C, Balki M, Carvalho JC. Anesthesiologists’ learning curves for ultrasound assessment of the lumbar spine. Can J Anaesth. 2010;57(2):120-126. https://doi.org/10.1007/s12630-009-9219-2.
85. Jensen TP, Soni NJ, Tierney DM, Lucas BP. Hospital privileging practices for bedside procedures: a survey of hospitalist experts. J Hosp Med. 2017;12(10):836-839. https://doi.org/10.12788/jhm.2837.
86. Terblanche NC, Arzola C, Wills KE, et al. Standardised training program in spinal ultrasound for epidural insertion: protocol driven versus non-protocol driven teaching approach. Anaesth Intensive Care. 2014;42(4):460-466. https://doi.org/10.1177/0310057X1404200406.
87. Mofidi M, Mohammadi M, Saidi H, et al. Ultrasound guided lumbar puncture in emergency department: time saving and less complications. J Res Med Sci. 2013;18(4):303-307. PubMed
88. Karmakar MK, Li X, Ho AM, Kwok WH, Chui PT. Real-time ultrasound-guided paramedian epidural access: evaluation of a novel in-plane technique. Br J Anaesth. 2009;102(6):845-854. https://doi.org/10.1093/bja/aep079.
89. Tran D, Kamani AA, Al-Attas E, et al. Single-operator real-time ultrasound-guidance to aim and insert a lumbar epidural needle. Can J Anaesth. 2010;57(4):313-321. https://doi.org/10.1007/s12630-009-9252-1.
90. Liu Y, Qian W, Ke XJ, Mei W. Real-time ultrasound-guided spinal anesthesia using a new paramedian transverse approach. Curr Med Sci. 2018;38(5):910-913. https://doi.org/10.1007/s11596-018-1961-7.
91. Conroy PH, Luyet C, McCartney CJ, McHardy PG. Real-time ultrasound-guided spinal anaesthesia: a prospective observational study of a new approach. Anesthesiol Res Pract. 2013;2013:525818. https://doi.org/10.1155/2013/525818.
92. Brinkmann S, Tang R, Sawka A, Vaghadia H. Single-operator real-time ultrasound-guided spinal injection using SonixGPS™: a case series. Can J Anaesth. 2013;60(9):896-901. https://doi.org/10.1007/s12630-013-9984-9.
93. Niazi AU, Chin KJ, Jin R, Chan VW. Real-time ultrasound-guided spinal anesthesia using the SonixGPS ultrasound guidance system: a feasibility study. Acta Anaesthesiol Scand. 2014;58(7):875-881. https://doi.org/10.1111/aas.12353.
Approximately 400,000 lumbar punctures (LPs) are performed in the United States annually for either diagnostic workup or therapeutic relief.1 Lumbar punctures are increasingly being performed in the United States, with an estimated 97,000 LPs performed on Medicare fee-for-service beneficiaries in 2011 alone, which is an increase of approximately 4,000 LPs in the same population from 1991.2 Approximately 273,612 LPs were performed on hospitalized patients in the United States in 2010,1 and the inpatient hospital setting is the most common site for LPs.2,3
Many LPs are referred to radiologists who have access to imaging guidance to aid with needle insertion.2 However, referrals to radiology delay performance of LPs, and delayed diagnosis of acute bacterial meningitis, the most common yet serious condition for which LPs are performed, is associated with increased morbidity and mortality.4-8 Furthermore, although initiating empiric antibiotic treatment for suspected acute bacterial meningitis is recommended in some cases, doing so routinely can cause false-negative cerebrospinal fluid (CSF) culture results, complicating decisions about de-escalation and duration of antibiotics that could have been safely avoided by promptly performing an LP.9
Delaying the performance of LP has been associated with increased mortality.10 Demonstration of proficiency in performance of lumbar puncture is considered a core competency for hospitalists,11 and with the increasing availability of point-of-care ultrasound, hospitalists can use ultrasound to guide performance of LPs at the bedside.12 However, 30% of patients requiring LP in emergency departments have difficult-to-palpate lumbar spine landmarks,13 and lumbar puncture performed based on palpation of landmarks alone has been reported to fail or be traumatic in 28% of patients.14 Use of ultrasound guidance for lumbar puncture has been shown in randomized controlled trials to improve procedural success rates, while reducing the time to successful LP, needle passes, patient pain scores, and risk of a traumatic LP.15-17
The purpose of this position statement is to review the literature and present consensus-based recommendations on the performance of ultrasound-guided LP in adult patients. This position statement does not mandate that hospitalists use ultrasound guidance for LP, nor does it establish ultrasound guidance as the standard of care for LP. Similar to previously published Society of Hospital Medicine (SHM) position statements,12,18,19 this document presents recommendations with supporting evidence for the clinical outcomes, techniques, and training for using ultrasound guidance for LP. A manuscript describing the technique of ultrasound guidance for LPs has been previously published by some of the authors of this position statement.20
METHODS
Detailed methods are described in Appendix 1. The SHM Point-of-care Ultrasound (POCUS) Task Force was assembled to carry out this guideline development project under the direction of the SHM Board of Directors, Director of Education, and Education Committee. All expert panel members were physicians or advanced practice providers with expertise in POCUS. Expert panel members were divided into working group members, external peer reviewers, and a methodologist. All Task Force members were required to disclose any potential conflicts of interests (Appendix 2). The literature search was conducted in two independent phases. The first phase included literature searches conducted by the six working group members themselves. Key clinical questions and draft recommendations were then prepared. A systematic literature search was conducted by a medical librarian based on the findings of the initial literature search and draft recommendations. The Medline, Embase, CINAHL, and Cochrane medical databases were searched from 1975 to December 2015 initially. Google Scholar was also searched without limiters. Updated searches were conducted in November 2016, January 2018, and October 2018. The search strings are included in Appendix 3. All article abstracts were first screened for relevance by at least two members of the working group. Full-text versions of screened articles were reviewed, and articles on the use of ultrasound to guide LP were selected. In addition, the following article types were excluded: non-English language, nonhuman, age <18 years, meeting abstracts, meeting posters, narrative reviews, case reports, letters, and editorials. Moreover, studies focusing on the use of ultrasound guidance for spinal nerve root injections, regional anesthesia, and assessment of lumbar spine anatomy alone were excluded. All relevant systematic reviews, meta-analyses, randomized controlled trials, and observational studies of ultrasound-guided LP were screened and selected. Final article selection was based on working group consensus, and the selected literature was incorporated into the draft recommendations.
The Research and Development (RAND) Appropriateness Method that required panel judgment and consensus was used.21 The 27 voting members of the SHM POCUS Task Force reviewed and voted on the draft recommendations considering the following five transforming factors: (1) Problem priority and importance, (2) Level of quality of evidence, (3) Benefit/harm balance, (4) Benefit/burden balance, and (5) Certainty/concerns about PEAF (Preferences/Equity/Acceptability/Feasibility). Panel members participated in two rounds of electronic voting using an internet-based electronic data collection tool (REDCap™) in February 2018 and April 2018 (Appendix 4). Voting on appropriateness was conducted using a 9-point Likert scale. The three zones of the 9-point Likert scale were inappropriate (1-3 points), uncertain (4-6 points), and appropriate (7-9 points). The degree of consensus was assessed using the RAND algorithm (Appendix Figure 1 and Table 1). Establishing a recommendation required at least 70% agreement that a recommendation was “appropriate.” A strong recommendation required 80% of the votes within one integer of the median, following the RAND rules. Disagreement was defined as >30% of panelists voting outside of the zone of the median.
Recommendations were classified as strong or weak/conditional based on preset rules defining the panel’s level of consensus, which determined the wording of each recommendation (Table 2). The revised consensus-based recommendations underwent internal and external reviews by POCUS experts from different subspecialties. The final review of this position statement was performed by members of the SHM POCUS Task Force, SHM Education Committee, and SHM Executive Committee. The SHM Executive Committee endorsed this position statement in June 2018 before submission to the Journal of Hospital Medicine.
RESULTS
Literature Search
A total of 4,389 references were pooled from four different sources: a search by a certified medical librarian in December 2015 (3,212 citations) that was updated in November 2016 (380 citations), January 2018 (282 citations), and October 2018 (274 citations); working group members’ personal bibliographies and searches (31 citations); and a search focusing on ultrasound-guided LP training (210 citations). A total of 232 full-text articles were reviewed, and the final selection included 77 articles that were abstracted into a data table and incorporated into the draft recommendations. Details of the literature search strategy are presented in Appendix 3.
RECOMMENDATIONS
Four domains (clinical outcomes, technique, training, and knowledge gaps) with 16 draft recommendations were generated based on a review of the literature. Selected references were abstracted and assigned to each draft recommendation. Rationales for each recommendation were drafted citing supporting evidence. After two rounds of panel voting, five recommendations did not achieve agreement based on the RAND rules, one recommendation was combined with another recommendation during peer review, and 10 statements received final approval. The degree of consensus based on the median score and the dispersion of voting around the median are shown in Appendix 5. Nine statements were approved as strong recommendations, and one was approved as a conditional recommendation. Therefore, the final recommendation count was 10. The strength of the recommendation and degree of consensus for each recommendation are summarized in Table 1.
Terminology
LP is a procedure in which a spinal needle is introduced into the subarachnoid space for the purpose of collecting CSF for diagnostic evaluation and/or therapeutic relief.
Throughout this document, the phrases “ultrasound-guided” and “ultrasound guidance” refer to the use of ultrasound to mark a needle insertion site immediately before performing the procedure. This is also known as static ultrasound guidance. Real-time or dynamic ultrasound guidance refers to direct visualization of the needle tip as it traverses through the skin and soft tissues to reach the ligamentum flavum. Any reference to real-time ultrasound guidance is explicitly stated.
Clinical outcomes
1) When ultrasound equipment is available, along with providers who are appropriately trained to use it, we recommend that ultrasound guidance should be used for site selection of LPs to reduce the number of needle insertion attempts and needle redirections and increase the overall procedure success rates, especially in patients who are obese or have difficult-to-palpate landmarks.
Rationale. LPs have historically been performed by selecting a needle insertion site based on palpation of anatomical landmarks. However, an estimated 30% of patients requiring LP in emergency departments have lumbar spine landmarks that are difficult to palpate, most commonly due to obesity.13 Furthermore, lumbar puncture performed based on palpation of landmarks alone has been reported to fail in 28% of patients.14
Ultrasound can be used at the bedside to elucidate the lumbar spine anatomy to guide performance of LP or epidural catheterization. Since the early 2000s, randomized studies comparing the use of ultrasound guidance (ultrasound-guided) versus anatomical landmarks (landmark-guided) to map the lumbar spine for epidural catheterization have emerged. It is important to recognize that the exact same ultrasound technique is used for site marking of LP, epidural catheterization, and spinal anesthesia—the key difference is how deep the needle tip is inserted. Therefore, data from these three ultrasound-guided procedures are often pooled. Currently, at least 33 randomized controlled studies comparing ultrasound-guided vs landmark-guided site selection for LP, epidural catheterization, or spinal anesthesia have been published.22-49 We present three meta-analyses below that pooled data primarily from randomized controlled studies comparing ultrasound-guided vs landmark-guided site selection for LP or spinal anesthesia.
In 2013, Shaikh et al. published the first meta-analysis with 14 randomized controlled studies comparing ultrasound-guided vs landmark-guided site selection for LP (n = 5) or epidural catheterization (n = 9). The pooled data showed that use of ultrasound guidance decreased the proportion of failed procedures (risk ratio 0.21, 95% CI 0.10-0.43) with an absolute risk reduction of 6.3% (95% CI 4.1%-8.4%) and a number needed to treat of 16 (95% CI 12-25) to prevent one failed procedure. In addition, the use of ultrasound reduced the mean number of attempts by 0.44 (95% CI 0.24-0.64) and reduced the mean number of needle redirections by 1.00 (95% CI 0.75-1.24). The reduction in risk of a failed procedure was similar for LPs (risk ratio 0.19 [95% CI 0.07-0.56]) and epidural catheterizations (risk ratio 0.23 [95% CI 0.09-0.60]).16
A similar meta-analysis published by Perlas et al. in 2016 included a total of 31 studies, both randomized controlled and cohort studies, evaluating the use of ultrasound guidance for LP, spinal anesthesia, and epidural catheterization.50 The goal of this systematic review and meta-analysis was to establish clinical practice recommendations. The authors concluded (1) the data consistently suggest that ultrasound is more accurate than palpation for lumbar interspace identification, (2) ultrasound allows accurate measurement of the needle insertion depth to reach the epidural space with a mean difference of <3 mm compared with the actual needle insertion depth, and (3) ultrasound increases the efficacy of lumbar epidural or spinal anesthesia by decreasing the mean number of needle passes for success by 0.75 (95% CI 0.44-1.07) and reducing the risk of a failed procedure (risk ratio 0.51 [95% CI 0.32-0.80]), both in patients with normal surface anatomy and in those with technically difficult surface anatomy due to obesity, scoliosis, or previous spine surgery.
Compared to the two earlier meta-analyses that included studies of both LP and spinal anesthesia procedures, the meta-analysis conducted by Gottlieb et al. in 2018 pooled data from 12 randomized controlled studies of ultrasound guidance for LPs only. For the primary outcome, pooled data from both adult and pediatric studies demonstrated higher procedural success rates with ultrasound-guided vs landmark-guided LPs (90% vs 81%) with an odds ratio of 2.1 (95% CI 0.66-7.44) in favor of ultrasound; however, there were no statistically significant differences when the adult and pediatric subgroups were analyzed separately, probably due to underpowering. For the secondary outcomes, data from the adult subgroup showed that use of ultrasound guidance was associated with fewer traumatic LPs (OR 0.28, 95% CI 0.14-0.59), shorter time to procedural success (adjusted mean difference –3.03 minutes, 95% CI –3.54 to –2.52), fewer number of needle passes (adjusted mean difference –0.81 passes, 95% CI –1.57 to –0.05), and lower patient pain scores (adjusted mean difference –2.53, 95% CI –3.89 to –1.17).
At least 12 randomized controlled studies have been published comparing the use of ultrasound guidance vs landmarks for the performance of LP or spinal anesthesia in adult patients, which were not included in the abovementioned meta-analyses. These individual studies demonstrated similar benefits of using ultrasound guidance: reduced needle insertion attempts, reduced needle redirections, and increased overall procedural success rates.17,31,37,40,41,43-49
It is important to recognize that four randomized controlled studies did not demonstrate any benefits of ultrasound guidance on the number of attempts or procedural success rates,23,33,41,51 and three of these studies were included in the abovementioned meta-analyses.23,33,51 Limitations of these negative studies include potential selection bias, inadequate sample sizes, and varying levels of operator skills in procedures, ultrasound guidance, or both. One study included emergency medicine residents as operators with varying degrees of ultrasound skills, and more importantly, patient enrollment occurred by convenience sampling, which may have introduced selection bias. Furthermore, most of the patients were not obese (median BMI of 27 kg/m2), and it is unclear why 10 years lapsed from data collection until publication.33 Another study with three experienced anesthesiologists as operators performing spinal anesthesia enrolled only patients who were not obese (mean BMI of 29 kg/m2) and had easily palpable bony landmarks—two patient characteristics associated with the least benefit of using ultrasound guidance in other studies.23 Another negative study had one experienced anesthesiologist marking obstetric patients with ultrasound, but junior residents performing the actual procedure in the absence of the anesthesiologist who had marked the patient.41
In general, the greatest benefit of using ultrasound guidance for LP has been demonstrated in obese patients.24,32,34,35,52,53 Benefits have been shown in specific obese patient populations, including obstetric,31,54,55 orthopedic,24,56,57 and emergency department patients.30
By increasing the procedural success rates with the use of ultrasound at the bedside, fewer patients may be referred to interventional radiology for fluoroscopic-guided LP, decreasing the patient exposure to ionizing radiation. A randomized study (n = 112) that compared site marking with ultrasound guidance versus fluoroscopic guidance for epidural steroid injections found the two techniques to be equivalent with respect to mean procedure time, number of needle insertion attempts, or needle passes.58 Another randomized study found that the performance time of ultrasound guidance was two minutes shorter (P < .05) than fluoroscopic guidance.59
Techniques
2) We recommend that ultrasound should be used to more accurately identify the lumbar spine level than physical examination in both obese and nonobese patients.
Rationale. Traditionally, an imaginary line connecting the iliac crests (intercristal line, Tuffier’s line, or Jacoby’s line) was considered to identify the L4 vertebra or the L4-L5 interspinous space in the midline; however, studies have revealed this traditional landmark to be much less accurate than previously thought. In general, palpating the iliac crests to mark the intercristal line identifies an interspinous space that is one space cephalad (ie, the L2-L3 interspinous space) but can range from L1-L2 to L4-L5.46,60-64 If an LP is inadvertently performed in the L1-L2 interspinous space, the risk of spinal cord injury is higher than that when performed in a more distal interspinous space.
A study by Margarido et al. with 45 patients with a mean BMI of 30 kg/m2 found that the intercristal line was located above the L4-L5 interspinous space in 100% of patients. More importantly, the intercristal line was above L2-L3 in 36% of patients and above L1-L2 in 4% of patients. It is important to note that patients with scoliosis or previous spine surgery were excluded from this study, and all examinations were performed by two experienced anesthesiologists with patients in a sitting position—all factors that would favor accurate palpation and marking of the iliac crests.60
In a study of nonobese patients (mean BMI 28 kg/m2) undergoing spinal anesthesia, Duniec et al. compared the lumbar level identified by palpation versus ultrasound and found discordance between the two techniques in 36% of patients; 18% were one space too cephalad, 16% were one space too caudal, and 2% were off by two interspinous spaces.61 Another study found discordance in 64% of patients (mean BMI 28 kg/m2) when comparing the interspinous level where spinal anesthesia had been performed by palpation versus a post-procedural ultrasound examination. This study revealed that the interspinous space was more cephalad in 50% of patients with 6% of punctures performed in the L1-L2 interspace.62 A similar study compared the accuracy of palpation vs ultrasound to identify the L3-L4 interspinous space in obese (mean BMI 34 kg/m2) versus nonobese (mean BMI 27 kg/m2) patients. This study found marking a space above L3-L4 in 51% of obese and 40% of nonobese patients and marking of the L1-L2 interspace in 7% of obese and 4% of nonobese patients.64
A study comparing palpation vs ultrasound found that 68% of obese patients with a BMI of >30 kg/m2 had difficult-to-palpate lumbar spine landmarks, but with the use of ultrasound, landmarks were identified in 76% of all patients, including obese and nonobese, with difficult-to-palpate landmarks.65
3) We suggest using ultrasound for selecting and marking a needle insertion site just before performing LPs in either a lateral decubitus or sitting position. The patient should remain in the same position after marking the needle insertion site.
Rationale. Ultrasound mapping of the lumbar spine can be performed in either a lateral decubitus or sitting position. Selecting and marking a needle insertion site should be performed at the bedside just before performing the procedure. The patient must remain in the same position in the interim between marking and inserting the needle, as a slight change in position can alter the needle trajectory, lowering the LP success rate. Although performing LPs in a lateral decubitus position has the advantage of accurately measuring the opening pressure, misalignment of the shoulder and pelvic girdles and bowing of the bed in a lateral decubitus position may lower LP success rates.
One randomized study comparing ultrasound-guided spinal anesthesia in a lateral decubitus versus sitting position found no difference in the number of needle insertion attempts or measurement of the skin-dura distance; however, the needle insertion depth was 0.73 cm greater in a lateral decubitus vs sitting position (P = .002).66 Procedural success rates of LP with ultrasound guidance have not been directly compared in a sitting versus lateral decubitus position, although the overall procedural success rates were higher in one study that allowed the operator to choose either sitting or lateral decubitus position when ultrasound was used.32
4) We recommend that a low-frequency transducer, preferably a curvilinear array transducer, should be used to evaluate the lumbar spine and mark a needle insertion site in most patients. A high-frequency linear array transducer may be used in nonobese patients.
Rationale. Low-frequency transducers emit sound waves that penetrate deep tissues, allowing visualization of bones and ligaments of the lumbar spine. A high-frequency linear transducer offers better resolution but shallower penetration to approximately 6-9 cm, limiting its use for site marking in overweight and obese patients. In obese patients, the ligamentum flavum is often deeper than 6 cm, which requires a low-frequency transducer to be visualized.
Most of the randomized controlled studies demonstrating benefits of using ultrasound guidance compared with landmark guidance for performance of LP, epidural anesthesia, or spinal anesthesia have used a low-frequency, curvilinear transducer.22,24,26-28,31,34-36,39,43-45,67 Two randomized controlled trials used a high-frequency linear transducer for site marking of lumbar procedures.30,32,37 Using a high-frequency linear transducer has been described in real-time, ultrasound-guided LPs, the advantage being better needle visualization with a linear transducer.29 Detection of blood vessels by color flow Doppler may be another advantage of using a high-frequency linear transducer, although a study by Grau et al. showed that use of color flow Doppler with a low-frequency curvilinear transducer permitted visualization of interspinous vessels as small as 0.5 mm in size.68
5) We recommend that ultrasound should be used to map the lumbar spine, starting at the level of the sacrum and sliding the transducer cephalad, sequentially identifying the lumbar spine interspaces.Rationale. Although no studies have directly compared different ultrasound scanning protocols to map the lumbar spine, starting at the level of the sacrum and sliding the transducer cephalad to sequentially identify the lumbar interspinous spaces is the most commonly described technique in studies demonstrating improved clinical outcomes with the use of ultrasound.24,31,34,37,39,40,45,56,57,67 Because the sacrum can be easily recognized, identifying it first is most beneficial in patients with few or no palpable landmarks.
All five lumbar spinous processes and interspinous spaces can be mapped from the sacrum using either a midline or a paramedian approach, and the widest interspinous space can be selected. In a midline approach, either a transverse or a longitudinal view is obtained. The transducer is centered on the sacrum and slid cephalad from L5 to L1 to identify each spinous process and interspinous space. In a paramedian approach, longitudinal paramedian views are obtained from the L5–sacrum interspace to the L1–L2 interspace, and each interspinous space is identified as the transducer is slid cephalad. Both these approaches are effective for mapping the lumbar spine. Whether the entire lumbar spine is mapped, and whether a midline or a paramedian approach is utilized, will depend on the operator’s preference.
6) We recommend that ultrasound should be used in a transverse plane to mark the midline of the lumbar spine and a longitudinal plane to mark the interspinous spaces. The intersection of these two lines marks the needle insertion site.
Rationale. The most common technique described in comparative studies of ultrasound vs landmarks includes visualization of the lumbar spine in two planes, a transverse plane to identify the midline and a longitudinal plane to identify the interspinous spaces. The majority of randomized controlled studies that demonstrated a reduction in the number of needle insertion attempts and an increase in the procedural success rates have used this technique (see Clinical Outcomes).22,24,28,32,35-37,43,44 Marking the midline and interspinous space(s) for LP may be performed in any order, starting with either the transverse or longitudinal plane first.
The midline of the spine is marked by placing the transducer in a transverse plane over the lumbar spine, centering over the spinous processes that have a distinct hyperechoic tip and a prominent acoustic shadow deep to the bone, and drawing a line perpendicular to the center of the transducer delineating the midline. The midline should be marked over a minimum of two or three spinous processes.
To identify the interspinous spaces, the transducer is aligned longitudinally over the midline. The transducer is slid along the midline to identify the widest interspinous space. Once the transducer is centered over the widest interspinous space, a line perpendicular to the center of the transducer is drawn to mark the interspinous space. The intersection of the lines marking the spinal midline and the selected interspinous space identifies the needle entry point.
To visualize the ligamentum flavum from a paramedian view, the transducer is oriented longitudinally over the midline, slid approximately 1 cm laterally, and tilted approximately 15 degrees aiming the ultrasound beam toward the midline. The skin–ligamentum flavum distance is most reliably measured from a paramedian view. Alternatively, in some patients, the ligamentum flavum may be visualized in the midline and the depth can be measured.
7) We recommend that ultrasound should be used during a preprocedural evaluation to measure the distance from the skin surface to the ligamentum flavum from a longitudinal paramedian view to estimate the needle insertion depth and ensure that a spinal needle of adequate length is used.
Rationale. The distance from the skin to the ligamentum flavum can be measured using ultrasound during preprocedural planning. Knowing the depth to the ligamentum flavum preprocedurally allows the operator to procure a spinal needle of adequate length, anticipate the insertion depth before CSF can be obtained, determine the depth to which a local anesthetic will need to be injected, and decide whether the anticipated difficulty of the procedure warrants referral to or consultation with another specialist.
The skin–ligamentum flavum distance can be measured from a transverse midline view or a longitudinal paramedian view. A longitudinal paramedian view provides an unobstructed view of the ligamentum flavum due to less shadowing from bony structures compared with a midline view. Several studies have demonstrated a strong correlation between the skin–ligamentum flavum distance measured by ultrasound and the actual needle insertion depth in both midline and paramedian views.28,34,36,53,54,57,69,70
A meta-analysis that included 13 comparative studies evaluating the correlation between ultrasound-measured depth and actual needle insertion depth to reach the epidural or intrathecal space consistently demonstrated a strong correlation between the measured and actual depth.50 A few studies have reported near-perfect Pearson correlation coefficients of 0.98.55,71,72 The pooled correlation was 0.91 (95% CI 0.87-0.94). All studies measured the depth from the skin to the ventral side of the ligamentum flavum or the intrathecal space from either a longitudinal paramedian view (n = 4) or a transverse midline view (n = 9). Eight of the more recent studies evaluated the accuracy of the ultrasound measurements and found the depth measurements by ultrasound to be accurate within 1-13 mm of the actual needle insertion depth, with seven of the eight studies reporting a mean difference of ≤3 mm.50
Measurement of the distance between the skin and the ligamentum flavum generally underestimates the needle insertion depth. One study reported that measurement of the skin–ligamentum flavum distance underestimates the needle insertion depth by 7.6 mm to obtain CSF, whereas measurement of the skin–posterior longitudinal ligament distance overestimates the needle insertion depth by 2.5 mm.57 A well-accepted contributor to underestimation of the depth measurements using ultrasound is compression of the skin and soft tissues by the transducer, and therefore, pressure on the skin must be released before freezing an image and measuring the depth to the subarachnoid space.
Training
8) We recommend that novices should undergo simulation-based training, where available, before attempting ultrasound-guided LPs on actual patients.
Rationale. Similar to training for other bedside procedures, dedicated training sessions, including didactics, supervised practice on patients, and simulation-based practice, should be considered when teaching novices to perform ultrasound-guided LP. Simulation-based training facilitates acquisition of knowledge and skills to perform invasive bedside procedures, including LP.73 Simulation-based training has been commonly incorporated into procedure training for trainees using an immersive experience, such as a “boot camp,”74-77 or a standardized curriculum,78,79 and has demonstrated improvements in post-course procedural knowledge, technical skills, and operator confidence. Two of these studies included training in the use of ultrasound guidance for LP. These studies showed that simulation-based practice improved skill acquisition and confidence.80,81 Simulation using novel computer software may improve skill acquisition in the use of ultrasound guidance for LP.82
9) We recommend that training in ultrasound-guided LPs should be adapted based on prior ultrasound experience, as learning curves will vary.Rationale. The learning curve to achieve competency in the use of ultrasound guidance for LP has not been well studied. The rate of attaining competency in identifying lumbar spine structures using ultrasound will vary by provider based on prior skills in ultrasound-guided procedures.83 Thus, providers with prior ultrasound experience may require less training than those without such experience to achieve competency. However, extensive experience in performing landmark-guided LPs does not necessarily translate into rapid acquisition of skills to perform the procedure with ultrasound guidance. A study of practicing anesthesiologists with no prior ultrasound experience demonstrated that 20 supervised trials of ultrasound-guided spinal anesthesia were insufficient to achieve competency.84 Although minimums may be a necessary step to gain competence, using them as a sole means to define competence does not account for variable learning curves.12 Based on a national survey of 21 hospitalist procedure experts, the mean current vs suggested minimums for initial and ongoing hospital privileging for LPs were 1.8 vs 6.9 and 2.2 vs 4.6 annually in one report.85
A fundamental question that needs to be answered is how to define competency in the use of ultrasound guidance for LP, including the specific skills and knowledge that must be mastered. At a minimum, providers must be able to identify lumbar spinous processes and distinguish them from the sacrum, identify the lumbar interspinous spaces and their corresponding levels, and estimate the depth from the skin to the ligamentum flavum from the midline and paramedian planes. Novice operators may benefit from practicing lumbar spine mapping of nonobese patients using a high-frequency linear transducer that generates high-resolution images and facilitates recognition of lumbar spine structures.
10) We recommend that novice providers should be supervised when performing ultrasound-guided LPs before performing the procedure independently on patients.
Rationale: Demonstration of competency in the use of ultrasound to identify lumbar spine anatomy should be achieved before routinely performing the procedure independently on patients.18 All providers will require a variable period of supervised practice to demonstrate the appropriate technique, followed by a period of unsupervised practice before competency is achieved. Supervised practice with guidance and feedback has been shown to significantly improve providers’ ability to delineate lumbar spine anatomy.86
KNOWLEDGE GAPS
The process of producing these guidelines revealed areas of uncertainty and important gaps in the literature regarding the use of ultrasound guidance for LP.
First, it is unclear whether the use of ultrasound guidance for LP reduces postprocedural back pain and whether it improves patient satisfaction. Several studies have evaluated postprocedural back pain28,30,32,33,52 and patient satisfaction28,29,33,51 with the use of ultrasound guidance, but these studies have found inconsistent results. Some of these results were probably due to insufficient statistical power or confounding variables. Furthermore, benefits have been demonstrated in certain subgroups, such as overweight patients or those with anatomical abnormalities, as was found in two studies.52,87 Use of ultrasound guidance for spinal anesthesia has been shown to reduce postprocedural headache28 and improve patient satisfaction51, although similar benefit has not been demonstrated in patients undergoing LP.
Second, the effect of using ultrasound guidance on the frequency of traumatic LPs is an area of uncertainty. A “traumatic tap” is defined as an inadvertent puncture of an epidural vein during passage of the spinal needle through the dura. It remains difficult to discern in these studies whether red blood cells detected in the CSF resulted from puncture of an epidural vein or from needle trauma of the skin and soft tissues. Despite this uncertainty, at least seven randomized controlled studies have assessed the effect of ultrasound guidance on traumatic LPs. The meta-analysis by Shaikh et al. included five randomized controlled studies that assessed the effect of ultrasound guidance on the reporting of traumatic taps. The study found a reduced risk of traumatic taps (risk ratio 0.27 [95% CI 0.11-0.67]), an absolute risk reduction of 5.9% (95% CI 2.3%-9.5%), and a number needed to treat of 17 (95% CI 11-44) to prevent one traumatic tap.16 Similarly, the meta-analysis by Gottlieb et al. showed a lower risk of traumatic taps among adults undergoing LP with ultrasound guidance in five randomized controlled studies with an odds ratio of 0.28 (95% CI 0.14-0.59). The meta-analysis by Gottlieb et al. included two adult studies that were not included by Shaikh et al.
Third, several important questions about the technique of ultrasound-guided LP remain unanswered. In addition to the static technique, a dynamic technique with real-time needle tracking has been described to perform ultrasound-guided LP, epidural catheterization, and spinal anesthesia. A pilot study by Grau et al. found that ultrasound used either statically or dynamically had fewer insertion attempts and needle redirections than use of landmarks alone.29 Three other pilot studies showed successful spinal anesthesia in almost all patients88-90 and one large study demonstrated successful spinal anesthesia with real-time ultrasound guidance in 97 of 100 patients with a median of three needle passes.91 Furthermore, a few industry-sponsored studies with small numbers of patients have described the use of novel needle tracking systems that facilitate needle visualization during real-time ultrasound-guided LP.92,93 However, to our knowledge, no comparative studies of static versus dynamic guidance using novel needle tracking systems in human subjects have been published, and any potential role for these novel needle tracking systems has not yet been defined.
Finally, the effects of using ultrasound guidance on clinical decision-making, timeliness, and cost-effectiveness of LP have not yet been explored but could have important clinical practice implications.
CONCLUSION
Randomized controlled trials have demonstrated that using ultrasound guidance for LPs can reduce the number of needle insertion attempts and needle redirections and increase the overall procedural success rates. Ultrasound can more accurately identify the lumbar spine level than physical examination in both obese and nonobese patients, although the greatest benefit of using ultrasound guidance for LPs has been shown in obese patients.
Ultrasound permits assessment of the interspinous space width and measurement of the ligamentum flavum depth to select an optimal needle insertion site and adequate length spinal needle. Although the use of real-time ultrasound guidance has been described, the use of static ultrasound guidance for LP site marking remains the standard technique.
Acknowledgments
The authors thank all the members of the Society of Hospital Medicine Point-of-care Ultrasound Task Force and the Education Committee members for their time and dedication to develop these guidelines.
Collaborators from Society of Hospital Medicine Point-of-care Ultrasound Task Force: Saaid Abdel-Ghani, Robert Arntfield, Jeffrey Bates, Anjali Bhagra, Michael Blaivas, Daniel Brotman, Carolina Candotti, Richard Hoppmann, Susan Hunt, Trevor P. Jensen, Paul Mayo, Benji Mathews, Satyen Nichani, Vicki Noble, Martin Perez, Nitin Puri, Aliaksei Pustavoitau, Kreegan Reierson, Sophia Rodgers, Kirk Spencer, Vivek Tayal, David Tierney
SHM Point-of-care Ultrasound Task Force: CHAIRS: Nilam Soni, Ricardo Franco-Sadud, Jeff Bates. WORKING GROUPS: Thoracentesis Working Group: Ria Dancel (chair), Daniel Schnobrich, Nitin Puri. Vascular Access Working Group: Ricardo Franco (chair), Benji Matthews, Saaid Abdel-Ghani, Sophia Rodgers, Martin Perez, Daniel Schnobrich. Paracentesis Working Group: Joel Cho (chair), Benji Matthews, Kreegan Reierson, Anjali Bhagra, Trevor P. Jensen Lumbar Puncture Working Group: Nilam J. Soni (chair), Ricardo Franco, Gerard Salame, Josh Lenchus, Venkat Kalidindi, Ketino Kobaidze. Credentialing Working Group: Brian P Lucas (chair), David Tierney, Trevor P. Jensen PEER REVIEWERS: Robert Arntfield, Michael Blaivas, Richard Hoppmann, Paul Mayo, Vicki Noble, Aliaksei Pustavoitau, Kirk Spencer, Vivek Tayal. METHODOLOGIST: Mahmoud El Barbary. LIBRARIAN: Loretta Grikis. SOCIETY OF HOSPITAL MEDICINE EDUCATION COMMITTEE: Daniel Brotman (past chair), Satyen Nichani (current chair), Susan Hunt. SOCIETY OF HOSPITAL MEDICINE STAFF: Nick Marzano.
Disclosures
The authors have nothing to disclose.
Funding
Brian P Lucas: Department of Veterans Affairs, Veterans Health Administration, Office of Research and Development and Dartmouth SYNERGY, National Institutes of Health, National Center for Translational Science (UL1TR001086). Nilam Soni: Department of Veterans Affairs, Quality Enhancement Research Initiative (QUERI) Partnered Evaluation Initiative Grant (HX002263-01A1).
Disclaimer
The contents of this publication do not represent the views of the U.S. Department of Veterans Affairs or the United States Government.
Approximately 400,000 lumbar punctures (LPs) are performed in the United States annually for either diagnostic workup or therapeutic relief.1 Lumbar punctures are increasingly being performed in the United States, with an estimated 97,000 LPs performed on Medicare fee-for-service beneficiaries in 2011 alone, which is an increase of approximately 4,000 LPs in the same population from 1991.2 Approximately 273,612 LPs were performed on hospitalized patients in the United States in 2010,1 and the inpatient hospital setting is the most common site for LPs.2,3
Many LPs are referred to radiologists who have access to imaging guidance to aid with needle insertion.2 However, referrals to radiology delay performance of LPs, and delayed diagnosis of acute bacterial meningitis, the most common yet serious condition for which LPs are performed, is associated with increased morbidity and mortality.4-8 Furthermore, although initiating empiric antibiotic treatment for suspected acute bacterial meningitis is recommended in some cases, doing so routinely can cause false-negative cerebrospinal fluid (CSF) culture results, complicating decisions about de-escalation and duration of antibiotics that could have been safely avoided by promptly performing an LP.9
Delaying the performance of LP has been associated with increased mortality.10 Demonstration of proficiency in performance of lumbar puncture is considered a core competency for hospitalists,11 and with the increasing availability of point-of-care ultrasound, hospitalists can use ultrasound to guide performance of LPs at the bedside.12 However, 30% of patients requiring LP in emergency departments have difficult-to-palpate lumbar spine landmarks,13 and lumbar puncture performed based on palpation of landmarks alone has been reported to fail or be traumatic in 28% of patients.14 Use of ultrasound guidance for lumbar puncture has been shown in randomized controlled trials to improve procedural success rates, while reducing the time to successful LP, needle passes, patient pain scores, and risk of a traumatic LP.15-17
The purpose of this position statement is to review the literature and present consensus-based recommendations on the performance of ultrasound-guided LP in adult patients. This position statement does not mandate that hospitalists use ultrasound guidance for LP, nor does it establish ultrasound guidance as the standard of care for LP. Similar to previously published Society of Hospital Medicine (SHM) position statements,12,18,19 this document presents recommendations with supporting evidence for the clinical outcomes, techniques, and training for using ultrasound guidance for LP. A manuscript describing the technique of ultrasound guidance for LPs has been previously published by some of the authors of this position statement.20
METHODS
Detailed methods are described in Appendix 1. The SHM Point-of-care Ultrasound (POCUS) Task Force was assembled to carry out this guideline development project under the direction of the SHM Board of Directors, Director of Education, and Education Committee. All expert panel members were physicians or advanced practice providers with expertise in POCUS. Expert panel members were divided into working group members, external peer reviewers, and a methodologist. All Task Force members were required to disclose any potential conflicts of interests (Appendix 2). The literature search was conducted in two independent phases. The first phase included literature searches conducted by the six working group members themselves. Key clinical questions and draft recommendations were then prepared. A systematic literature search was conducted by a medical librarian based on the findings of the initial literature search and draft recommendations. The Medline, Embase, CINAHL, and Cochrane medical databases were searched from 1975 to December 2015 initially. Google Scholar was also searched without limiters. Updated searches were conducted in November 2016, January 2018, and October 2018. The search strings are included in Appendix 3. All article abstracts were first screened for relevance by at least two members of the working group. Full-text versions of screened articles were reviewed, and articles on the use of ultrasound to guide LP were selected. In addition, the following article types were excluded: non-English language, nonhuman, age <18 years, meeting abstracts, meeting posters, narrative reviews, case reports, letters, and editorials. Moreover, studies focusing on the use of ultrasound guidance for spinal nerve root injections, regional anesthesia, and assessment of lumbar spine anatomy alone were excluded. All relevant systematic reviews, meta-analyses, randomized controlled trials, and observational studies of ultrasound-guided LP were screened and selected. Final article selection was based on working group consensus, and the selected literature was incorporated into the draft recommendations.
The Research and Development (RAND) Appropriateness Method that required panel judgment and consensus was used.21 The 27 voting members of the SHM POCUS Task Force reviewed and voted on the draft recommendations considering the following five transforming factors: (1) Problem priority and importance, (2) Level of quality of evidence, (3) Benefit/harm balance, (4) Benefit/burden balance, and (5) Certainty/concerns about PEAF (Preferences/Equity/Acceptability/Feasibility). Panel members participated in two rounds of electronic voting using an internet-based electronic data collection tool (REDCap™) in February 2018 and April 2018 (Appendix 4). Voting on appropriateness was conducted using a 9-point Likert scale. The three zones of the 9-point Likert scale were inappropriate (1-3 points), uncertain (4-6 points), and appropriate (7-9 points). The degree of consensus was assessed using the RAND algorithm (Appendix Figure 1 and Table 1). Establishing a recommendation required at least 70% agreement that a recommendation was “appropriate.” A strong recommendation required 80% of the votes within one integer of the median, following the RAND rules. Disagreement was defined as >30% of panelists voting outside of the zone of the median.
Recommendations were classified as strong or weak/conditional based on preset rules defining the panel’s level of consensus, which determined the wording of each recommendation (Table 2). The revised consensus-based recommendations underwent internal and external reviews by POCUS experts from different subspecialties. The final review of this position statement was performed by members of the SHM POCUS Task Force, SHM Education Committee, and SHM Executive Committee. The SHM Executive Committee endorsed this position statement in June 2018 before submission to the Journal of Hospital Medicine.
RESULTS
Literature Search
A total of 4,389 references were pooled from four different sources: a search by a certified medical librarian in December 2015 (3,212 citations) that was updated in November 2016 (380 citations), January 2018 (282 citations), and October 2018 (274 citations); working group members’ personal bibliographies and searches (31 citations); and a search focusing on ultrasound-guided LP training (210 citations). A total of 232 full-text articles were reviewed, and the final selection included 77 articles that were abstracted into a data table and incorporated into the draft recommendations. Details of the literature search strategy are presented in Appendix 3.
RECOMMENDATIONS
Four domains (clinical outcomes, technique, training, and knowledge gaps) with 16 draft recommendations were generated based on a review of the literature. Selected references were abstracted and assigned to each draft recommendation. Rationales for each recommendation were drafted citing supporting evidence. After two rounds of panel voting, five recommendations did not achieve agreement based on the RAND rules, one recommendation was combined with another recommendation during peer review, and 10 statements received final approval. The degree of consensus based on the median score and the dispersion of voting around the median are shown in Appendix 5. Nine statements were approved as strong recommendations, and one was approved as a conditional recommendation. Therefore, the final recommendation count was 10. The strength of the recommendation and degree of consensus for each recommendation are summarized in Table 1.
Terminology
LP is a procedure in which a spinal needle is introduced into the subarachnoid space for the purpose of collecting CSF for diagnostic evaluation and/or therapeutic relief.
Throughout this document, the phrases “ultrasound-guided” and “ultrasound guidance” refer to the use of ultrasound to mark a needle insertion site immediately before performing the procedure. This is also known as static ultrasound guidance. Real-time or dynamic ultrasound guidance refers to direct visualization of the needle tip as it traverses through the skin and soft tissues to reach the ligamentum flavum. Any reference to real-time ultrasound guidance is explicitly stated.
Clinical outcomes
1) When ultrasound equipment is available, along with providers who are appropriately trained to use it, we recommend that ultrasound guidance should be used for site selection of LPs to reduce the number of needle insertion attempts and needle redirections and increase the overall procedure success rates, especially in patients who are obese or have difficult-to-palpate landmarks.
Rationale. LPs have historically been performed by selecting a needle insertion site based on palpation of anatomical landmarks. However, an estimated 30% of patients requiring LP in emergency departments have lumbar spine landmarks that are difficult to palpate, most commonly due to obesity.13 Furthermore, lumbar puncture performed based on palpation of landmarks alone has been reported to fail in 28% of patients.14
Ultrasound can be used at the bedside to elucidate the lumbar spine anatomy to guide performance of LP or epidural catheterization. Since the early 2000s, randomized studies comparing the use of ultrasound guidance (ultrasound-guided) versus anatomical landmarks (landmark-guided) to map the lumbar spine for epidural catheterization have emerged. It is important to recognize that the exact same ultrasound technique is used for site marking of LP, epidural catheterization, and spinal anesthesia—the key difference is how deep the needle tip is inserted. Therefore, data from these three ultrasound-guided procedures are often pooled. Currently, at least 33 randomized controlled studies comparing ultrasound-guided vs landmark-guided site selection for LP, epidural catheterization, or spinal anesthesia have been published.22-49 We present three meta-analyses below that pooled data primarily from randomized controlled studies comparing ultrasound-guided vs landmark-guided site selection for LP or spinal anesthesia.
In 2013, Shaikh et al. published the first meta-analysis with 14 randomized controlled studies comparing ultrasound-guided vs landmark-guided site selection for LP (n = 5) or epidural catheterization (n = 9). The pooled data showed that use of ultrasound guidance decreased the proportion of failed procedures (risk ratio 0.21, 95% CI 0.10-0.43) with an absolute risk reduction of 6.3% (95% CI 4.1%-8.4%) and a number needed to treat of 16 (95% CI 12-25) to prevent one failed procedure. In addition, the use of ultrasound reduced the mean number of attempts by 0.44 (95% CI 0.24-0.64) and reduced the mean number of needle redirections by 1.00 (95% CI 0.75-1.24). The reduction in risk of a failed procedure was similar for LPs (risk ratio 0.19 [95% CI 0.07-0.56]) and epidural catheterizations (risk ratio 0.23 [95% CI 0.09-0.60]).16
A similar meta-analysis published by Perlas et al. in 2016 included a total of 31 studies, both randomized controlled and cohort studies, evaluating the use of ultrasound guidance for LP, spinal anesthesia, and epidural catheterization.50 The goal of this systematic review and meta-analysis was to establish clinical practice recommendations. The authors concluded (1) the data consistently suggest that ultrasound is more accurate than palpation for lumbar interspace identification, (2) ultrasound allows accurate measurement of the needle insertion depth to reach the epidural space with a mean difference of <3 mm compared with the actual needle insertion depth, and (3) ultrasound increases the efficacy of lumbar epidural or spinal anesthesia by decreasing the mean number of needle passes for success by 0.75 (95% CI 0.44-1.07) and reducing the risk of a failed procedure (risk ratio 0.51 [95% CI 0.32-0.80]), both in patients with normal surface anatomy and in those with technically difficult surface anatomy due to obesity, scoliosis, or previous spine surgery.
Compared to the two earlier meta-analyses that included studies of both LP and spinal anesthesia procedures, the meta-analysis conducted by Gottlieb et al. in 2018 pooled data from 12 randomized controlled studies of ultrasound guidance for LPs only. For the primary outcome, pooled data from both adult and pediatric studies demonstrated higher procedural success rates with ultrasound-guided vs landmark-guided LPs (90% vs 81%) with an odds ratio of 2.1 (95% CI 0.66-7.44) in favor of ultrasound; however, there were no statistically significant differences when the adult and pediatric subgroups were analyzed separately, probably due to underpowering. For the secondary outcomes, data from the adult subgroup showed that use of ultrasound guidance was associated with fewer traumatic LPs (OR 0.28, 95% CI 0.14-0.59), shorter time to procedural success (adjusted mean difference –3.03 minutes, 95% CI –3.54 to –2.52), fewer number of needle passes (adjusted mean difference –0.81 passes, 95% CI –1.57 to –0.05), and lower patient pain scores (adjusted mean difference –2.53, 95% CI –3.89 to –1.17).
At least 12 randomized controlled studies have been published comparing the use of ultrasound guidance vs landmarks for the performance of LP or spinal anesthesia in adult patients, which were not included in the abovementioned meta-analyses. These individual studies demonstrated similar benefits of using ultrasound guidance: reduced needle insertion attempts, reduced needle redirections, and increased overall procedural success rates.17,31,37,40,41,43-49
It is important to recognize that four randomized controlled studies did not demonstrate any benefits of ultrasound guidance on the number of attempts or procedural success rates,23,33,41,51 and three of these studies were included in the abovementioned meta-analyses.23,33,51 Limitations of these negative studies include potential selection bias, inadequate sample sizes, and varying levels of operator skills in procedures, ultrasound guidance, or both. One study included emergency medicine residents as operators with varying degrees of ultrasound skills, and more importantly, patient enrollment occurred by convenience sampling, which may have introduced selection bias. Furthermore, most of the patients were not obese (median BMI of 27 kg/m2), and it is unclear why 10 years lapsed from data collection until publication.33 Another study with three experienced anesthesiologists as operators performing spinal anesthesia enrolled only patients who were not obese (mean BMI of 29 kg/m2) and had easily palpable bony landmarks—two patient characteristics associated with the least benefit of using ultrasound guidance in other studies.23 Another negative study had one experienced anesthesiologist marking obstetric patients with ultrasound, but junior residents performing the actual procedure in the absence of the anesthesiologist who had marked the patient.41
In general, the greatest benefit of using ultrasound guidance for LP has been demonstrated in obese patients.24,32,34,35,52,53 Benefits have been shown in specific obese patient populations, including obstetric,31,54,55 orthopedic,24,56,57 and emergency department patients.30
By increasing the procedural success rates with the use of ultrasound at the bedside, fewer patients may be referred to interventional radiology for fluoroscopic-guided LP, decreasing the patient exposure to ionizing radiation. A randomized study (n = 112) that compared site marking with ultrasound guidance versus fluoroscopic guidance for epidural steroid injections found the two techniques to be equivalent with respect to mean procedure time, number of needle insertion attempts, or needle passes.58 Another randomized study found that the performance time of ultrasound guidance was two minutes shorter (P < .05) than fluoroscopic guidance.59
Techniques
2) We recommend that ultrasound should be used to more accurately identify the lumbar spine level than physical examination in both obese and nonobese patients.
Rationale. Traditionally, an imaginary line connecting the iliac crests (intercristal line, Tuffier’s line, or Jacoby’s line) was considered to identify the L4 vertebra or the L4-L5 interspinous space in the midline; however, studies have revealed this traditional landmark to be much less accurate than previously thought. In general, palpating the iliac crests to mark the intercristal line identifies an interspinous space that is one space cephalad (ie, the L2-L3 interspinous space) but can range from L1-L2 to L4-L5.46,60-64 If an LP is inadvertently performed in the L1-L2 interspinous space, the risk of spinal cord injury is higher than that when performed in a more distal interspinous space.
A study by Margarido et al. with 45 patients with a mean BMI of 30 kg/m2 found that the intercristal line was located above the L4-L5 interspinous space in 100% of patients. More importantly, the intercristal line was above L2-L3 in 36% of patients and above L1-L2 in 4% of patients. It is important to note that patients with scoliosis or previous spine surgery were excluded from this study, and all examinations were performed by two experienced anesthesiologists with patients in a sitting position—all factors that would favor accurate palpation and marking of the iliac crests.60
In a study of nonobese patients (mean BMI 28 kg/m2) undergoing spinal anesthesia, Duniec et al. compared the lumbar level identified by palpation versus ultrasound and found discordance between the two techniques in 36% of patients; 18% were one space too cephalad, 16% were one space too caudal, and 2% were off by two interspinous spaces.61 Another study found discordance in 64% of patients (mean BMI 28 kg/m2) when comparing the interspinous level where spinal anesthesia had been performed by palpation versus a post-procedural ultrasound examination. This study revealed that the interspinous space was more cephalad in 50% of patients with 6% of punctures performed in the L1-L2 interspace.62 A similar study compared the accuracy of palpation vs ultrasound to identify the L3-L4 interspinous space in obese (mean BMI 34 kg/m2) versus nonobese (mean BMI 27 kg/m2) patients. This study found marking a space above L3-L4 in 51% of obese and 40% of nonobese patients and marking of the L1-L2 interspace in 7% of obese and 4% of nonobese patients.64
A study comparing palpation vs ultrasound found that 68% of obese patients with a BMI of >30 kg/m2 had difficult-to-palpate lumbar spine landmarks, but with the use of ultrasound, landmarks were identified in 76% of all patients, including obese and nonobese, with difficult-to-palpate landmarks.65
3) We suggest using ultrasound for selecting and marking a needle insertion site just before performing LPs in either a lateral decubitus or sitting position. The patient should remain in the same position after marking the needle insertion site.
Rationale. Ultrasound mapping of the lumbar spine can be performed in either a lateral decubitus or sitting position. Selecting and marking a needle insertion site should be performed at the bedside just before performing the procedure. The patient must remain in the same position in the interim between marking and inserting the needle, as a slight change in position can alter the needle trajectory, lowering the LP success rate. Although performing LPs in a lateral decubitus position has the advantage of accurately measuring the opening pressure, misalignment of the shoulder and pelvic girdles and bowing of the bed in a lateral decubitus position may lower LP success rates.
One randomized study comparing ultrasound-guided spinal anesthesia in a lateral decubitus versus sitting position found no difference in the number of needle insertion attempts or measurement of the skin-dura distance; however, the needle insertion depth was 0.73 cm greater in a lateral decubitus vs sitting position (P = .002).66 Procedural success rates of LP with ultrasound guidance have not been directly compared in a sitting versus lateral decubitus position, although the overall procedural success rates were higher in one study that allowed the operator to choose either sitting or lateral decubitus position when ultrasound was used.32
4) We recommend that a low-frequency transducer, preferably a curvilinear array transducer, should be used to evaluate the lumbar spine and mark a needle insertion site in most patients. A high-frequency linear array transducer may be used in nonobese patients.
Rationale. Low-frequency transducers emit sound waves that penetrate deep tissues, allowing visualization of bones and ligaments of the lumbar spine. A high-frequency linear transducer offers better resolution but shallower penetration to approximately 6-9 cm, limiting its use for site marking in overweight and obese patients. In obese patients, the ligamentum flavum is often deeper than 6 cm, which requires a low-frequency transducer to be visualized.
Most of the randomized controlled studies demonstrating benefits of using ultrasound guidance compared with landmark guidance for performance of LP, epidural anesthesia, or spinal anesthesia have used a low-frequency, curvilinear transducer.22,24,26-28,31,34-36,39,43-45,67 Two randomized controlled trials used a high-frequency linear transducer for site marking of lumbar procedures.30,32,37 Using a high-frequency linear transducer has been described in real-time, ultrasound-guided LPs, the advantage being better needle visualization with a linear transducer.29 Detection of blood vessels by color flow Doppler may be another advantage of using a high-frequency linear transducer, although a study by Grau et al. showed that use of color flow Doppler with a low-frequency curvilinear transducer permitted visualization of interspinous vessels as small as 0.5 mm in size.68
5) We recommend that ultrasound should be used to map the lumbar spine, starting at the level of the sacrum and sliding the transducer cephalad, sequentially identifying the lumbar spine interspaces.Rationale. Although no studies have directly compared different ultrasound scanning protocols to map the lumbar spine, starting at the level of the sacrum and sliding the transducer cephalad to sequentially identify the lumbar interspinous spaces is the most commonly described technique in studies demonstrating improved clinical outcomes with the use of ultrasound.24,31,34,37,39,40,45,56,57,67 Because the sacrum can be easily recognized, identifying it first is most beneficial in patients with few or no palpable landmarks.
All five lumbar spinous processes and interspinous spaces can be mapped from the sacrum using either a midline or a paramedian approach, and the widest interspinous space can be selected. In a midline approach, either a transverse or a longitudinal view is obtained. The transducer is centered on the sacrum and slid cephalad from L5 to L1 to identify each spinous process and interspinous space. In a paramedian approach, longitudinal paramedian views are obtained from the L5–sacrum interspace to the L1–L2 interspace, and each interspinous space is identified as the transducer is slid cephalad. Both these approaches are effective for mapping the lumbar spine. Whether the entire lumbar spine is mapped, and whether a midline or a paramedian approach is utilized, will depend on the operator’s preference.
6) We recommend that ultrasound should be used in a transverse plane to mark the midline of the lumbar spine and a longitudinal plane to mark the interspinous spaces. The intersection of these two lines marks the needle insertion site.
Rationale. The most common technique described in comparative studies of ultrasound vs landmarks includes visualization of the lumbar spine in two planes, a transverse plane to identify the midline and a longitudinal plane to identify the interspinous spaces. The majority of randomized controlled studies that demonstrated a reduction in the number of needle insertion attempts and an increase in the procedural success rates have used this technique (see Clinical Outcomes).22,24,28,32,35-37,43,44 Marking the midline and interspinous space(s) for LP may be performed in any order, starting with either the transverse or longitudinal plane first.
The midline of the spine is marked by placing the transducer in a transverse plane over the lumbar spine, centering over the spinous processes that have a distinct hyperechoic tip and a prominent acoustic shadow deep to the bone, and drawing a line perpendicular to the center of the transducer delineating the midline. The midline should be marked over a minimum of two or three spinous processes.
To identify the interspinous spaces, the transducer is aligned longitudinally over the midline. The transducer is slid along the midline to identify the widest interspinous space. Once the transducer is centered over the widest interspinous space, a line perpendicular to the center of the transducer is drawn to mark the interspinous space. The intersection of the lines marking the spinal midline and the selected interspinous space identifies the needle entry point.
To visualize the ligamentum flavum from a paramedian view, the transducer is oriented longitudinally over the midline, slid approximately 1 cm laterally, and tilted approximately 15 degrees aiming the ultrasound beam toward the midline. The skin–ligamentum flavum distance is most reliably measured from a paramedian view. Alternatively, in some patients, the ligamentum flavum may be visualized in the midline and the depth can be measured.
7) We recommend that ultrasound should be used during a preprocedural evaluation to measure the distance from the skin surface to the ligamentum flavum from a longitudinal paramedian view to estimate the needle insertion depth and ensure that a spinal needle of adequate length is used.
Rationale. The distance from the skin to the ligamentum flavum can be measured using ultrasound during preprocedural planning. Knowing the depth to the ligamentum flavum preprocedurally allows the operator to procure a spinal needle of adequate length, anticipate the insertion depth before CSF can be obtained, determine the depth to which a local anesthetic will need to be injected, and decide whether the anticipated difficulty of the procedure warrants referral to or consultation with another specialist.
The skin–ligamentum flavum distance can be measured from a transverse midline view or a longitudinal paramedian view. A longitudinal paramedian view provides an unobstructed view of the ligamentum flavum due to less shadowing from bony structures compared with a midline view. Several studies have demonstrated a strong correlation between the skin–ligamentum flavum distance measured by ultrasound and the actual needle insertion depth in both midline and paramedian views.28,34,36,53,54,57,69,70
A meta-analysis that included 13 comparative studies evaluating the correlation between ultrasound-measured depth and actual needle insertion depth to reach the epidural or intrathecal space consistently demonstrated a strong correlation between the measured and actual depth.50 A few studies have reported near-perfect Pearson correlation coefficients of 0.98.55,71,72 The pooled correlation was 0.91 (95% CI 0.87-0.94). All studies measured the depth from the skin to the ventral side of the ligamentum flavum or the intrathecal space from either a longitudinal paramedian view (n = 4) or a transverse midline view (n = 9). Eight of the more recent studies evaluated the accuracy of the ultrasound measurements and found the depth measurements by ultrasound to be accurate within 1-13 mm of the actual needle insertion depth, with seven of the eight studies reporting a mean difference of ≤3 mm.50
Measurement of the distance between the skin and the ligamentum flavum generally underestimates the needle insertion depth. One study reported that measurement of the skin–ligamentum flavum distance underestimates the needle insertion depth by 7.6 mm to obtain CSF, whereas measurement of the skin–posterior longitudinal ligament distance overestimates the needle insertion depth by 2.5 mm.57 A well-accepted contributor to underestimation of the depth measurements using ultrasound is compression of the skin and soft tissues by the transducer, and therefore, pressure on the skin must be released before freezing an image and measuring the depth to the subarachnoid space.
Training
8) We recommend that novices should undergo simulation-based training, where available, before attempting ultrasound-guided LPs on actual patients.
Rationale. Similar to training for other bedside procedures, dedicated training sessions, including didactics, supervised practice on patients, and simulation-based practice, should be considered when teaching novices to perform ultrasound-guided LP. Simulation-based training facilitates acquisition of knowledge and skills to perform invasive bedside procedures, including LP.73 Simulation-based training has been commonly incorporated into procedure training for trainees using an immersive experience, such as a “boot camp,”74-77 or a standardized curriculum,78,79 and has demonstrated improvements in post-course procedural knowledge, technical skills, and operator confidence. Two of these studies included training in the use of ultrasound guidance for LP. These studies showed that simulation-based practice improved skill acquisition and confidence.80,81 Simulation using novel computer software may improve skill acquisition in the use of ultrasound guidance for LP.82
9) We recommend that training in ultrasound-guided LPs should be adapted based on prior ultrasound experience, as learning curves will vary.Rationale. The learning curve to achieve competency in the use of ultrasound guidance for LP has not been well studied. The rate of attaining competency in identifying lumbar spine structures using ultrasound will vary by provider based on prior skills in ultrasound-guided procedures.83 Thus, providers with prior ultrasound experience may require less training than those without such experience to achieve competency. However, extensive experience in performing landmark-guided LPs does not necessarily translate into rapid acquisition of skills to perform the procedure with ultrasound guidance. A study of practicing anesthesiologists with no prior ultrasound experience demonstrated that 20 supervised trials of ultrasound-guided spinal anesthesia were insufficient to achieve competency.84 Although minimums may be a necessary step to gain competence, using them as a sole means to define competence does not account for variable learning curves.12 Based on a national survey of 21 hospitalist procedure experts, the mean current vs suggested minimums for initial and ongoing hospital privileging for LPs were 1.8 vs 6.9 and 2.2 vs 4.6 annually in one report.85
A fundamental question that needs to be answered is how to define competency in the use of ultrasound guidance for LP, including the specific skills and knowledge that must be mastered. At a minimum, providers must be able to identify lumbar spinous processes and distinguish them from the sacrum, identify the lumbar interspinous spaces and their corresponding levels, and estimate the depth from the skin to the ligamentum flavum from the midline and paramedian planes. Novice operators may benefit from practicing lumbar spine mapping of nonobese patients using a high-frequency linear transducer that generates high-resolution images and facilitates recognition of lumbar spine structures.
10) We recommend that novice providers should be supervised when performing ultrasound-guided LPs before performing the procedure independently on patients.
Rationale: Demonstration of competency in the use of ultrasound to identify lumbar spine anatomy should be achieved before routinely performing the procedure independently on patients.18 All providers will require a variable period of supervised practice to demonstrate the appropriate technique, followed by a period of unsupervised practice before competency is achieved. Supervised practice with guidance and feedback has been shown to significantly improve providers’ ability to delineate lumbar spine anatomy.86
KNOWLEDGE GAPS
The process of producing these guidelines revealed areas of uncertainty and important gaps in the literature regarding the use of ultrasound guidance for LP.
First, it is unclear whether the use of ultrasound guidance for LP reduces postprocedural back pain and whether it improves patient satisfaction. Several studies have evaluated postprocedural back pain28,30,32,33,52 and patient satisfaction28,29,33,51 with the use of ultrasound guidance, but these studies have found inconsistent results. Some of these results were probably due to insufficient statistical power or confounding variables. Furthermore, benefits have been demonstrated in certain subgroups, such as overweight patients or those with anatomical abnormalities, as was found in two studies.52,87 Use of ultrasound guidance for spinal anesthesia has been shown to reduce postprocedural headache28 and improve patient satisfaction51, although similar benefit has not been demonstrated in patients undergoing LP.
Second, the effect of using ultrasound guidance on the frequency of traumatic LPs is an area of uncertainty. A “traumatic tap” is defined as an inadvertent puncture of an epidural vein during passage of the spinal needle through the dura. It remains difficult to discern in these studies whether red blood cells detected in the CSF resulted from puncture of an epidural vein or from needle trauma of the skin and soft tissues. Despite this uncertainty, at least seven randomized controlled studies have assessed the effect of ultrasound guidance on traumatic LPs. The meta-analysis by Shaikh et al. included five randomized controlled studies that assessed the effect of ultrasound guidance on the reporting of traumatic taps. The study found a reduced risk of traumatic taps (risk ratio 0.27 [95% CI 0.11-0.67]), an absolute risk reduction of 5.9% (95% CI 2.3%-9.5%), and a number needed to treat of 17 (95% CI 11-44) to prevent one traumatic tap.16 Similarly, the meta-analysis by Gottlieb et al. showed a lower risk of traumatic taps among adults undergoing LP with ultrasound guidance in five randomized controlled studies with an odds ratio of 0.28 (95% CI 0.14-0.59). The meta-analysis by Gottlieb et al. included two adult studies that were not included by Shaikh et al.
Third, several important questions about the technique of ultrasound-guided LP remain unanswered. In addition to the static technique, a dynamic technique with real-time needle tracking has been described to perform ultrasound-guided LP, epidural catheterization, and spinal anesthesia. A pilot study by Grau et al. found that ultrasound used either statically or dynamically had fewer insertion attempts and needle redirections than use of landmarks alone.29 Three other pilot studies showed successful spinal anesthesia in almost all patients88-90 and one large study demonstrated successful spinal anesthesia with real-time ultrasound guidance in 97 of 100 patients with a median of three needle passes.91 Furthermore, a few industry-sponsored studies with small numbers of patients have described the use of novel needle tracking systems that facilitate needle visualization during real-time ultrasound-guided LP.92,93 However, to our knowledge, no comparative studies of static versus dynamic guidance using novel needle tracking systems in human subjects have been published, and any potential role for these novel needle tracking systems has not yet been defined.
Finally, the effects of using ultrasound guidance on clinical decision-making, timeliness, and cost-effectiveness of LP have not yet been explored but could have important clinical practice implications.
CONCLUSION
Randomized controlled trials have demonstrated that using ultrasound guidance for LPs can reduce the number of needle insertion attempts and needle redirections and increase the overall procedural success rates. Ultrasound can more accurately identify the lumbar spine level than physical examination in both obese and nonobese patients, although the greatest benefit of using ultrasound guidance for LPs has been shown in obese patients.
Ultrasound permits assessment of the interspinous space width and measurement of the ligamentum flavum depth to select an optimal needle insertion site and adequate length spinal needle. Although the use of real-time ultrasound guidance has been described, the use of static ultrasound guidance for LP site marking remains the standard technique.
Acknowledgments
The authors thank all the members of the Society of Hospital Medicine Point-of-care Ultrasound Task Force and the Education Committee members for their time and dedication to develop these guidelines.
Collaborators from Society of Hospital Medicine Point-of-care Ultrasound Task Force: Saaid Abdel-Ghani, Robert Arntfield, Jeffrey Bates, Anjali Bhagra, Michael Blaivas, Daniel Brotman, Carolina Candotti, Richard Hoppmann, Susan Hunt, Trevor P. Jensen, Paul Mayo, Benji Mathews, Satyen Nichani, Vicki Noble, Martin Perez, Nitin Puri, Aliaksei Pustavoitau, Kreegan Reierson, Sophia Rodgers, Kirk Spencer, Vivek Tayal, David Tierney
SHM Point-of-care Ultrasound Task Force: CHAIRS: Nilam Soni, Ricardo Franco-Sadud, Jeff Bates. WORKING GROUPS: Thoracentesis Working Group: Ria Dancel (chair), Daniel Schnobrich, Nitin Puri. Vascular Access Working Group: Ricardo Franco (chair), Benji Matthews, Saaid Abdel-Ghani, Sophia Rodgers, Martin Perez, Daniel Schnobrich. Paracentesis Working Group: Joel Cho (chair), Benji Matthews, Kreegan Reierson, Anjali Bhagra, Trevor P. Jensen Lumbar Puncture Working Group: Nilam J. Soni (chair), Ricardo Franco, Gerard Salame, Josh Lenchus, Venkat Kalidindi, Ketino Kobaidze. Credentialing Working Group: Brian P Lucas (chair), David Tierney, Trevor P. Jensen PEER REVIEWERS: Robert Arntfield, Michael Blaivas, Richard Hoppmann, Paul Mayo, Vicki Noble, Aliaksei Pustavoitau, Kirk Spencer, Vivek Tayal. METHODOLOGIST: Mahmoud El Barbary. LIBRARIAN: Loretta Grikis. SOCIETY OF HOSPITAL MEDICINE EDUCATION COMMITTEE: Daniel Brotman (past chair), Satyen Nichani (current chair), Susan Hunt. SOCIETY OF HOSPITAL MEDICINE STAFF: Nick Marzano.
Disclosures
The authors have nothing to disclose.
Funding
Brian P Lucas: Department of Veterans Affairs, Veterans Health Administration, Office of Research and Development and Dartmouth SYNERGY, National Institutes of Health, National Center for Translational Science (UL1TR001086). Nilam Soni: Department of Veterans Affairs, Quality Enhancement Research Initiative (QUERI) Partnered Evaluation Initiative Grant (HX002263-01A1).
Disclaimer
The contents of this publication do not represent the views of the U.S. Department of Veterans Affairs or the United States Government.
1. Wolfe KS, Kress JP. Risk of procedural hemorrhage. Chest. 2016;150(1):237-246. https://doi.org/10.1016/j.chest.2016.01.023.
2. Kroll H, Duszak R, Jr, Nsiah E, et al. Trends in lumbar puncture over 2 decades: a dramatic shift to radiology. AJR Am J Roentgenol. 2015;204(1):15-19. https://doi.org/10.2214/AJR.14.12622.
3. Vickers A, Donnelly JP, Moore JX, Wang HE. 263EMF epidemiology of lumbar punctures in hospitalized patients in United States. Ann Emerg Med. 2017;70(4):S104. https://doi.org/10.1016/j.annemergmed.2017.07.241.
4. Køster-Rasmussen R, Korshin A, Meyer CN. Antibiotic treatment delay and outcome in acute bacterial meningitis. J Infect. 2008;57(6):449-454. https://doi.org/10.1016/j.jinf.2008.09.033.
5. Aronin SI, Peduzzi P, Quagliarello VJ. Community-acquired bacterial meningitis: risk stratification for adverse clinical outcome and effect of antibiotic timing. Ann Intern Med. 1998;129(11):862-869. https://doi.org/10.7326/0003-4819-129-11_Part_1-199812010-00004.
6. Lepur D, Barsić B. Community-acquired bacterial meningitis in adults: antibiotic timing in disease course and outcome. Infection. 2007;35(4):225-231. https://doi.org/10.1007/s15010-007-6202-0.
7. Proulx N, Fréchette D, Toye B, Chan J, Kravcik S. Delays in the administration of antibiotics are associated with mortality from adult acute bacterial meningitis. QJM. 2005;98(4):291-298. https://doi.org/10.1093/qjmed/hci047.
8. Auburtin M, Wolff M, Charpentier J, et al. Detrimental role of delayed antibiotic administration and penicillin-nonsusceptible strains in adult intensive care unit patients with pneumococcal meningitis: the PNEUMOREA prospective multicenter study. Crit Care Med. 2006;34(11):2758-2765. https://doi.org/10.1097/01.CCM.0000239434.26669.65.
9. Michael B, Menezes BF, Cunniffe J, et al. Effect of delayed lumbar punctures on the diagnosis of acute bacterial meningitis in adults. Emerg Med J. 2010;27(6):433-438. https://doi.org/10.1136/emj.2009.075598.
10. Glimåker M, Johansson B, Grindborg Ö, et al. Adult bacterial meningitis: earlier treatment and improved outcome following guideline revision promoting prompt lumbar puncture. Clin Infect Dis. 2015;60(8):1162-1169. https://doi.org/10.1093/cid/civ011.
11. Nichani S, Crocker J, Fitterman N, Lukela M. Updating the core competencies in hospital medicine--2017 Revision: introduction and methodology. J Hosp Med. 2017;12(4):283-287. https://doi.org/10.12788/jhm.2715.
12. Soni NJ, Schnobrich D, Matthews BK, et al. Point-of-care ultrasound for hospitalists: a position statement of the Society of Hospital Medicine. J Hosp Med. 2019;14:E1-E6. https://doi.org/10.12788/jhm.3079.
13. Shah KH, McGillicuddy D, Spear J, Edlow JA. Predicting difficult and traumatic lumbar punctures. Am J Emerg Med. 2007;25(6):608-611. https://doi.org/10.1016/j.ajem.2006.11.025.
14. Williams P, Tait G, Wijeratne T. Success rate of elective lumbar puncture at a major Melbourne neurology unit. Surg Neurol Int. 2018;9:12. https://doi.org/10.4103/sni.sni_426_17.
15. Gottlieb M, Holladay D, Peksa GD. Ultrasound-assisted lumbar punctures: a systematic review and meta-analysis. Acad Emerg Med. 2018;26(1). https://doi.org/10.1111/acem.13558.
16. Shaikh F, Brzezinski J, Alexander S, et al. Ultrasound imaging for lumbar punctures and epidural catheterisations: systematic review and meta-analysis. BMJ. 2013;346:f1720. https://doi.org/10.1136/bmj.f1720.
17. Perlas A, Chaparro LE, Chin KJ. Lumbar neuraxial ultrasound for spinal and epidural anesthesia: a systematic review and meta-analysis. Reg Anesth Pain Med. 2016;41(2):251-260. https://doi.org/10.1097/AAP.0000000000000184.
18. Lucas BP, Tierney DM, Jensen TP, et al. Credentialing of hospitalists in ultrasound-guided bedside procedures: a position statement of the Society of Hospital Medicine. J Hosp Med. 2018;13(2):117-125. https://doi.org/10.12788/jhm.2917.
19. Dancel R, Schnobrich D, Puri N, et al. Recommendations on the use of ultrasound guidance for adult thoracentesis: a position statement of the Society of Hospital Medicine. J Hosp Med. 2018;13(2):126-135. https://doi.org/10.12788/jhm.2940.
20. Soni NJ, Franco-Sadud R, Schnobrich D, et al. Ultrasound guidance for lumbar puncture. Neurol Clin Pract. 2016;6(4):358-368. https://doi.org/10.1212/CPJ.0000000000000265.
21. Fitch K, Bernstein SJ, Aguilar MD, Burnand B, LaCalle JR. The Rand/UCLA Appropriateness Method User’s Manual. Santa Monica, CA: Rand Corp; 2001.
22. Abdelhamid SA, Mansour MA. Ultrasound-guided intrathecal anesthesia: does scanning help? Egypt J Anaesth. 2013;29(4):389-394. https://doi.org/10.1016/j.egja.2013.06.003.
23. Ansari T, Yousef A, El Gamassy A, Fayez M. Ultrasound-guided spinal anaesthesia in obstetrics: is there an advantage over the landmark technique in patients with easily palpable spines? Int J Obstet Anesth. 2014;23(3):213-216. https://doi.org/10.1016/j.ijoa.2014.03.001.
24. Chin KJ, Perlas A, Chan V, et al. Ultrasound imaging facilitates spinal anesthesia in adults with difficult surface anatomic landmarks. Anesthesiology. 2011;115(1):94-101. https://doi.org/10.1097/ALN.0b013e31821a8ad4.
25. Cho YC, Koo DH, Oh SK, et al. Comparison of ultrasound-assisted lumbar puncture with lumbar puncture using palpation of landmarks in aged patients in an emergency center. J Korean Soc Emerg Med. 2009;20(3):304.
26. Grau T, Leipold RW, Conradi R, Martin E. Ultrasound control for presumed difficult epidural puncture. Acta Anaesthesiol Scand. 2001;45(6):766-771. https://doi.org/10.1034/j.1399-6576.2001.045006766.x.
27. Grau T, Leipold RW, Conradi R, Martin E, Motsch J. Ultrasound imaging facilitates localization of the epidural space during combined spinal and epidural anesthesia. Reg Anesth Pain Med. 2001;26(1):64-67. https://doi.org/10.1053/rapm.2001.19633.
28. Grau T, Leipold RW, Conradi R, Martin E, Motsch J. Efficacy of ultrasound imaging in obstetric epidural anesthesia. J Clin Anesth. 2002;14(3):169-175. https://doi.org/10.1016/S0952-8180(01)00378-6.
29. Grau T, Leipold RW, Fatehi S, Martin E, Motsch J. Real-time ultrasonic observation of combined spinal-epidural anaesthesia. Eur J Anaesthesiol. 2004;21(1):25-31. https://doi.org/10.1017/S026502150400105X.
30. Mofidi M, Mohammadi M, Saidi H, et al. Ultrasound guided lumbar puncture in emergency department: time saving and less complications. J Res Med Sci. 2013;18(4):303-307. PubMed
31. Nassar M, Abdelazim IA. Pre-puncture ultrasound guided epidural insertion before vaginal delivery. J Clin Monit Comput. 2015;29(5):573-577. https://doi.org/10.1007/s10877-014-9634-y.
32. Nomura JT, Leech SJ, Shenbagamurthi S, et al. A randomized controlled trial of ultrasound-assisted lumbar puncture. J Ultrasound Med. 2007;26(10):1341-1348. https://doi.org/10.7863/jum.2007.26.10.1341.
33. Peterson MA, Pisupati D, Heyming TW, Abele JA, Lewis RJ. Ultrasound for routine lumbar puncture. Acad Emerg Med. 2014;21(2):130-136. https://doi.org/10.1111/acem.12305.
34. Sahin T, Balaban O, Sahin L, Solak M, Toker K. A randomized controlled trial of preinsertion ultrasound guidance for spinal anaesthesia in pregnancy: outcomes among obese and lean parturients: ultrasound for spinal anesthesia in pregnancy. J Anesth. 2014;28(3):413-419. https://doi.org/10.1007/s00540-013-1726-1.
35. Wang Q, Yin C, Wang TL. Ultrasound facilitates identification of combined spinal-epidural puncture in obese parturients. Chin Med J (Engl). 2012;125(21):3840-3843. PubMed
36. Vallejo MC, Phelps AL, Singh S, Orebaugh SL, Sah N. Ultrasound decreases the failed labor epidural rate in resident trainees. Int J Obstet Anesth. 2010;19(4):373-378. https://doi.org/10.1016/j.ijoa.2010.04.002.
37. Darrieutort-Laffite C, Bart G, Planche L, et al. Usefulness of a pre-procedure ultrasound scanning of the lumbar spine before epidural injection in patients with a presumed difficult puncture: a randomized controlled trial. Joint Bone Spine. 2015;82(5):356-361. https://doi.org/10.1016/j.jbspin.2015.02.001.
38. Vosko MR, Brunner C, Schreiber S. Lumbar puncture with ultrasound study (lupus study)-international prospective randomized multicentre trial. Int J Stroke. 2017;12(1):22. https://doi.org/10.1055/s-0037-1606991.
39. Urfalioğlu A, Bilal B, Öksüz G, et al. Comparison of the landmark and ultrasound methods in cesarean sections performed under spinal anesthesia on obese pregnants. J Matern Fetal Neonatal Med. 2017;30(9):1051-1056. https://doi.org/10.1080/14767058.2016.1199677.
40. Tawfik MM, Atallah MM, Elkharboutly WS, Allakkany NS, Abdelkhalek M. Does preprocedural ultrasound increase the first-pass success rate of epidural catheterization before cesarean delivery? A randomized controlled trial. Anesth Analg. 2017;124(3):851-856. https://doi.org/10.1213/ANE.0000000000001325.
41. Turkstra TP, Marmai KL, Armstrong KP, Kumar K, Singh SI. Preprocedural ultrasound assessment does not improve trainee performance of spinal anesthesia for obstetrical patients: a randomized controlled trial. J Clin Anesth. 2017;37:21-24. https://doi.org/10.1016/j.jclinane.2016.10.034.
42. Chong SE, Mohd Nikman A, Saedah A, et al. Real-time ultrasound-guided paramedian spinal anaesthesia: evaluation of the efficacy and the success rate of single needle pass. Br J Anaesth. 2017;118(5):799-801. https://doi.org/10.1093/bja/aex108.
43. Creaney M, Mullane D, Casby C, Tan T. Ultrasound to identify the lumbar space in women with impalpable bony landmarks presenting for elective caesarean delivery under spinal anaesthesia: a randomised trial. Int J Obstet Anesth. 2016;28:12-16. https://doi.org/10.1016/j.ijoa.2016.07.007.
44. Ekinci M, Alici HA, Ahiskalioglu A, et al. The use of ultrasound in planned cesarean delivery under spinal anesthesia for patients having nonprominent anatomic landmarks. J Clin Anesth. 2017;37:82-85. https://doi.org/10.1016/j.jclinane.2016.10.014.
45. Perna P, Gioia A, Ragazzi R, Volta CA, Innamorato M. Can pre-procedure neuroaxial ultrasound improve the identification of the potential epidural space when compared with anatomical landmarks? A prospective randomized study. Minerva Anestesiol. 2017;83(1):41-49. https://doi.org/10.23736/S0375-9393.16.11399-9.
46. Chin A, Crooke B, Heywood L, et al. A randomised controlled trial comparing needle movements during combined spinal-epidural anaesthesia with and without ultrasound assistance. Anaesthesia. 2018;73(4):466-473. https://doi.org/10.1111/anae.14206.
47. Dhanger S, Vinayagam S, Vaidhyanathan B, Rajesh IJ, Tripathy DK. Comparison of landmark versus pre-procedural ultrasonography-assisted midline approach for identification of subarachnoid space in elective caesarean section: a randomised controlled trial. Indian J Anaesth. 2018;62(4):280-284. https://doi.org/10.4103/ija.IJA_488_17.
48. Evans DP, Tozer J, Joyce M, Vitto MJ. Comparison of ultrasound-guided and landmark-based lumbar punctures in inexperienced resident physicians. J Ultrasound Med. 2019;38(3):613-620. https://doi.org/10.1002/jum.14728.
49. Srinivasan KK, Leo AM, Iohom G, Loughnane F, Lee PJ. Pre-procedure ultrasound-guided paramedian spinal anaesthesia at L5-S1: is this better than landmark-guided midline approach? A randomised controlled trial. Indian J Anaesth. 2018;62(1):53-60. https://doi.org/10.4103/ija.IJA_448_17.
50. Perlas A, Chaparro LE, Chin KJ. Lumbar neuraxial ultrasound for spinal and epidural anesthesia: a systematic review and meta-analysis. Reg Anesth Pain Med. 2016;41(2):251-260. https://doi.org/10.1097/AAP.0000000000000184.
51. Lim YC, Choo CY, Tan KT. A randomised controlled trial of ultrasound-assisted spinal anaesthesia. Anaesth Intensive Care. 2014;42(2):191-198. https://doi.org/10.1177/0310057X1404200205.
52. Honarbakhsh S, Osman C, Teo JTH, Gabriel C. Ultrasound-guided lumbar puncture as a diagnostic aid to reduce number of attempts and complication rates. Ultrasound. 2013;21(4):170-175. https://doi.org/10.1177/1742271X13504332.
53. Sahota JS, Carvalho JC, Balki M, Fanning N, Arzola C. Ultrasound estimates for midline epidural punctures in the obese parturient: paramedian sagittal oblique is comparable to transverse median plane. Anesth Analg. 2013;116(4):829-835. https://doi.org/10.1213/ANE.0b013e31827f55f0.
54. Balki M, Lee Y, Halpern S, Carvalho JC. Ultrasound imaging of the lumbar spine in the transverse plane: the correlation between estimated and actual depth to the epidural space in obese parturients. Anesth Analg. 2009;108(6):1876-1881. https://doi.org/10.1213/ane.0b013e3181a323f6.
55. Wallace DH, Currie JM, Gilstrap LC, Santos R. Indirect sonographic guidance for epidural anesthesia in obese pregnant patients. Reg Anesth. 1992;17(4):233-236. PubMed
56. Srinivasan KK, Iohom G, Loughnane F, Lee PJ. Conventional landmark-guided midline versus preprocedure ultrasound-guided paramedian techniques in spinal anesthesia. Anesth Analg. 2015;21(4):1089-1096. https://doi.org/10.1213/ANE.0000000000000911.
57. Chin KJ, Perlas A, Singh M, et al. An ultrasound-assisted approach facilitates spinal anesthesia for total joint arthroplasty. Can J Anaesth. 2009;56(9):643-650. https://doi.org/10.1007/s12630-009-9132-8.
58. Evansa I, Logina I, Vanags I, Borgeat A. Ultrasound versus fluoroscopic-guided epidural steroid injections in patients with degenerative spinal diseases: a randomised study. Eur J Anaesthesiol. 2015;32(4):262-268. https://doi.org/10.1097/EJA.0000000000000103.
59. Park Y, Lee JH, Park KD, et al. Ultrasound-guided vs fluoroscopy-guided caudal epidural steroid injection for the treatment of unilateral lower lumbar radicular pain: a prospective, randomized, single-blind clinical study. Am J Phys Med Rehabil. 2013;92(7):575-586. https://doi.org/10.1097/PHM.0b013e318292356b.
60. Margarido CB, Mikhael R, Arzola C, Balki M, Carvalho JC. The intercristal line determined by palpation is not a reliable anatomical landmark for neuraxial anesthesia. Can J Anaesth. 2011;58(3):262-266. https://doi.org/10.1007/s12630-010-9432-z.
61. Duniec L, Nowakowski P, Kosson D, Łazowski T. Anatomical landmarks based assessment of intravertebral space level for lumbar puncture is misleading in more than 30%. Anaesthesiol Intensive Ther. 2013;45(1):1-6. https://doi.org/10.5603/AIT.2013.0001.
62. Schlotterbeck H, Schaeffer R, Dow WA, et al. Ultrasonographic control of the puncture level for lumbar neuraxial block in obstetric anaesthesia. Br J Anaesth. 2008;100(2):230-234. https://doi.org/10.1093/bja/aem371.
63. Whitty R, Moore M, Macarthur A. Identification of the lumbar interspinous spaces: palpation versus ultrasound. Anesth Analg. 2008;106(2):538-540, table of contents. https://doi.org/10.1213/ane.0b013e31816069d9.
64. Locks Gde F, Almeida MC, Pereira AA. Use of the ultrasound to determine the level of lumbar puncture in pregnant women. Rev Bras Anestesiol. 2010;60(1):13-19. https://doi.org/10.1016/S0034-7094(10)70002-7.
65. Stiffler KA, Jwayyed S, Wilber ST, Robinson A. The use of ultrasound to identify pertinent landmarks for lumbar puncture. Am J Emerg Med. 2007;25(3):331-334. https://doi.org/10.1016/j.ajem.2006.07.010.
66. Gulay U, Meltem T, Nadir SS, Aysin A. Ultrasound-guided evaluation of the lumbar subarachnoid space in lateral and sitting positions in pregnant patients to receive elective cesarean operation. Pak J Med Sci. 2015;31(1):76-81. https://doi.org/10.12669/pjms.311.5647.
67. Kawaguchi R, Yamauchi M, Sugino S, Yamakage M. Ultrasound-aided ipsilateral-dominant epidural block for total hip arthroplasty: a randomised controlled single-blind study. Eur J Anaesthesiol. 2011;28(2):137-140. https://doi.org/10.1097/EJA.0b013e3283423457.
68. Grau T, Leipold RW, Horter J, Martin E, Motsch J. Colour Doppler imaging of the interspinous and epidural space. Eur J Anaesthesiol. 2001;18(11):706-712. https://doi.org/10.1097/00003643-200111000-00002.
69. Arzola C, Davies S, Rofaeel A, Carvalho JC. Ultrasound using the transverse approach to the lumbar spine provides reliable landmarks for labor epidurals. Anesth Analg. 2007;104(5):1188-92, tables of contents. https://doi.org/10.1213/01.ane.0000250912.66057.41.
70. Chauhan AK, Bhatia R, Agrawal S. Lumbar epidural depth using transverse ultrasound scan and its correlation with loss of resistance technique: a prospective observational study in Indian population. Saudi J Anaesth. 2018;12(2):279-282. https://doi.org/10.4103/sja.SJA_679_17.
71. Gnaho A, Nguyen V, Villevielle T, et al. Assessing the depth of the subarachnoid space by ultrasound. Rev Bras Anestesiol. 2012;62(4):520-530. https://doi.org/10.1016/S0034-7094(12)70150-2.
72. Cork RC, Kryc JJ, Vaughan RW. Ultrasonic localization of the lumbar epidural space. Anesthesiology. 1980;52(6):513-516. https://doi.org/10.1097/00000542-198006000-00013.
73. Barsuk JH, Cohen ER, Caprio T, et al. Simulation-based education with mastery learning improves residents’ lumbar puncture skills. Neurology. 2012;79(2):132-137. https://doi.org/10.1212/WNL.0b013e31825dd39d.
74. Lenchus J, Issenberg SB, Murphy D, et al. A blended approach to invasive bedside procedural instruction. Med Teach. 2011;33(2):116-123. https://doi.org/10.3109/0142159X.2010.509412.
75. Wayne DB, Cohen ER, Singer BD, et al. Progress toward improving medical school graduates’ skills via a “boot camp” curriculum. Simul Healthc. 2014;9(1):33-39. https://doi.org/10.1097/SIH.0000000000000001.
76. Cohen ER, Barsuk JH, Moazed F, et al. Making July safer: simulation-based mastery learning during intern boot camp. Acad Med. 2013;88(2):233-239. https://doi.org/10.1097/ACM.0b013e31827bfc0a.
77. Martin R, Gannon D, Riggle J, et al. A comprehensive workshop using simulation to train internal medicine residents in bedside procedures performed by internists. Chest. 2012;142(4):545A. https://doi.org/10.1378/chest.1390093.
78. Lenchus JD. End of the “see one, do one, teach one” era: the next generation of invasive bedside procedural instruction. J Am Osteopath Assoc. 2010;110(6):340-346. PubMed
79. Mourad M, Ranji S, Sliwka D. A randomized controlled trial of the impact of a teaching procedure service on the training of internal medicine residents. J Grad Med Educ. 2012;4(2):170-175. https://doi.org/10.4300/JGME-D-11-00136.1.
80. Restrepo CG, Baker MD, Pruitt CM, Gullett JP, Pigott DC. Ability of pediatric emergency medicine physicians to identify anatomic landmarks with the assistance of ultrasound prior to lumbar puncture in a simulated obese model. Pediatr Emerg Care. 2015;31(1):15-19. https://doi.org/10.1097/PEC.0000000000000330.
81. VanderWielen BA, Harris R, Galgon RE, VanderWielen LM, Schroeder KM. Teaching sonoanatomy to anesthesia faculty and residents: utility of hands-on gel phantom and instructional video training models. J Clin Anesth. 2015;27(3):188-194. https://doi.org/10.1016/j.jclinane.2014.07.007.
82. Keri Z, Sydor D, Ungi T, et al. Computerized training system for ultrasound-guided lumbar puncture on abnormal spine models: a randomized controlled trial. Can J Anaesth. 2015;62(7):777-784. https://doi.org/10.1007/s12630-015-0367-2.
83. Deacon AJ, Melhuishi NS, Terblanche NC. CUSUM method for construction of trainee spinal ultrasound learning curves following standardised teaching. Anaesth Intensive Care. 2014;42(4):480-486. https://doi.org/10.1177/0310057X1404200409.
84. Margarido CB, Arzola C, Balki M, Carvalho JC. Anesthesiologists’ learning curves for ultrasound assessment of the lumbar spine. Can J Anaesth. 2010;57(2):120-126. https://doi.org/10.1007/s12630-009-9219-2.
85. Jensen TP, Soni NJ, Tierney DM, Lucas BP. Hospital privileging practices for bedside procedures: a survey of hospitalist experts. J Hosp Med. 2017;12(10):836-839. https://doi.org/10.12788/jhm.2837.
86. Terblanche NC, Arzola C, Wills KE, et al. Standardised training program in spinal ultrasound for epidural insertion: protocol driven versus non-protocol driven teaching approach. Anaesth Intensive Care. 2014;42(4):460-466. https://doi.org/10.1177/0310057X1404200406.
87. Mofidi M, Mohammadi M, Saidi H, et al. Ultrasound guided lumbar puncture in emergency department: time saving and less complications. J Res Med Sci. 2013;18(4):303-307. PubMed
88. Karmakar MK, Li X, Ho AM, Kwok WH, Chui PT. Real-time ultrasound-guided paramedian epidural access: evaluation of a novel in-plane technique. Br J Anaesth. 2009;102(6):845-854. https://doi.org/10.1093/bja/aep079.
89. Tran D, Kamani AA, Al-Attas E, et al. Single-operator real-time ultrasound-guidance to aim and insert a lumbar epidural needle. Can J Anaesth. 2010;57(4):313-321. https://doi.org/10.1007/s12630-009-9252-1.
90. Liu Y, Qian W, Ke XJ, Mei W. Real-time ultrasound-guided spinal anesthesia using a new paramedian transverse approach. Curr Med Sci. 2018;38(5):910-913. https://doi.org/10.1007/s11596-018-1961-7.
91. Conroy PH, Luyet C, McCartney CJ, McHardy PG. Real-time ultrasound-guided spinal anaesthesia: a prospective observational study of a new approach. Anesthesiol Res Pract. 2013;2013:525818. https://doi.org/10.1155/2013/525818.
92. Brinkmann S, Tang R, Sawka A, Vaghadia H. Single-operator real-time ultrasound-guided spinal injection using SonixGPS™: a case series. Can J Anaesth. 2013;60(9):896-901. https://doi.org/10.1007/s12630-013-9984-9.
93. Niazi AU, Chin KJ, Jin R, Chan VW. Real-time ultrasound-guided spinal anesthesia using the SonixGPS ultrasound guidance system: a feasibility study. Acta Anaesthesiol Scand. 2014;58(7):875-881. https://doi.org/10.1111/aas.12353.
1. Wolfe KS, Kress JP. Risk of procedural hemorrhage. Chest. 2016;150(1):237-246. https://doi.org/10.1016/j.chest.2016.01.023.
2. Kroll H, Duszak R, Jr, Nsiah E, et al. Trends in lumbar puncture over 2 decades: a dramatic shift to radiology. AJR Am J Roentgenol. 2015;204(1):15-19. https://doi.org/10.2214/AJR.14.12622.
3. Vickers A, Donnelly JP, Moore JX, Wang HE. 263EMF epidemiology of lumbar punctures in hospitalized patients in United States. Ann Emerg Med. 2017;70(4):S104. https://doi.org/10.1016/j.annemergmed.2017.07.241.
4. Køster-Rasmussen R, Korshin A, Meyer CN. Antibiotic treatment delay and outcome in acute bacterial meningitis. J Infect. 2008;57(6):449-454. https://doi.org/10.1016/j.jinf.2008.09.033.
5. Aronin SI, Peduzzi P, Quagliarello VJ. Community-acquired bacterial meningitis: risk stratification for adverse clinical outcome and effect of antibiotic timing. Ann Intern Med. 1998;129(11):862-869. https://doi.org/10.7326/0003-4819-129-11_Part_1-199812010-00004.
6. Lepur D, Barsić B. Community-acquired bacterial meningitis in adults: antibiotic timing in disease course and outcome. Infection. 2007;35(4):225-231. https://doi.org/10.1007/s15010-007-6202-0.
7. Proulx N, Fréchette D, Toye B, Chan J, Kravcik S. Delays in the administration of antibiotics are associated with mortality from adult acute bacterial meningitis. QJM. 2005;98(4):291-298. https://doi.org/10.1093/qjmed/hci047.
8. Auburtin M, Wolff M, Charpentier J, et al. Detrimental role of delayed antibiotic administration and penicillin-nonsusceptible strains in adult intensive care unit patients with pneumococcal meningitis: the PNEUMOREA prospective multicenter study. Crit Care Med. 2006;34(11):2758-2765. https://doi.org/10.1097/01.CCM.0000239434.26669.65.
9. Michael B, Menezes BF, Cunniffe J, et al. Effect of delayed lumbar punctures on the diagnosis of acute bacterial meningitis in adults. Emerg Med J. 2010;27(6):433-438. https://doi.org/10.1136/emj.2009.075598.
10. Glimåker M, Johansson B, Grindborg Ö, et al. Adult bacterial meningitis: earlier treatment and improved outcome following guideline revision promoting prompt lumbar puncture. Clin Infect Dis. 2015;60(8):1162-1169. https://doi.org/10.1093/cid/civ011.
11. Nichani S, Crocker J, Fitterman N, Lukela M. Updating the core competencies in hospital medicine--2017 Revision: introduction and methodology. J Hosp Med. 2017;12(4):283-287. https://doi.org/10.12788/jhm.2715.
12. Soni NJ, Schnobrich D, Matthews BK, et al. Point-of-care ultrasound for hospitalists: a position statement of the Society of Hospital Medicine. J Hosp Med. 2019;14:E1-E6. https://doi.org/10.12788/jhm.3079.
13. Shah KH, McGillicuddy D, Spear J, Edlow JA. Predicting difficult and traumatic lumbar punctures. Am J Emerg Med. 2007;25(6):608-611. https://doi.org/10.1016/j.ajem.2006.11.025.
14. Williams P, Tait G, Wijeratne T. Success rate of elective lumbar puncture at a major Melbourne neurology unit. Surg Neurol Int. 2018;9:12. https://doi.org/10.4103/sni.sni_426_17.
15. Gottlieb M, Holladay D, Peksa GD. Ultrasound-assisted lumbar punctures: a systematic review and meta-analysis. Acad Emerg Med. 2018;26(1). https://doi.org/10.1111/acem.13558.
16. Shaikh F, Brzezinski J, Alexander S, et al. Ultrasound imaging for lumbar punctures and epidural catheterisations: systematic review and meta-analysis. BMJ. 2013;346:f1720. https://doi.org/10.1136/bmj.f1720.
17. Perlas A, Chaparro LE, Chin KJ. Lumbar neuraxial ultrasound for spinal and epidural anesthesia: a systematic review and meta-analysis. Reg Anesth Pain Med. 2016;41(2):251-260. https://doi.org/10.1097/AAP.0000000000000184.
18. Lucas BP, Tierney DM, Jensen TP, et al. Credentialing of hospitalists in ultrasound-guided bedside procedures: a position statement of the Society of Hospital Medicine. J Hosp Med. 2018;13(2):117-125. https://doi.org/10.12788/jhm.2917.
19. Dancel R, Schnobrich D, Puri N, et al. Recommendations on the use of ultrasound guidance for adult thoracentesis: a position statement of the Society of Hospital Medicine. J Hosp Med. 2018;13(2):126-135. https://doi.org/10.12788/jhm.2940.
20. Soni NJ, Franco-Sadud R, Schnobrich D, et al. Ultrasound guidance for lumbar puncture. Neurol Clin Pract. 2016;6(4):358-368. https://doi.org/10.1212/CPJ.0000000000000265.
21. Fitch K, Bernstein SJ, Aguilar MD, Burnand B, LaCalle JR. The Rand/UCLA Appropriateness Method User’s Manual. Santa Monica, CA: Rand Corp; 2001.
22. Abdelhamid SA, Mansour MA. Ultrasound-guided intrathecal anesthesia: does scanning help? Egypt J Anaesth. 2013;29(4):389-394. https://doi.org/10.1016/j.egja.2013.06.003.
23. Ansari T, Yousef A, El Gamassy A, Fayez M. Ultrasound-guided spinal anaesthesia in obstetrics: is there an advantage over the landmark technique in patients with easily palpable spines? Int J Obstet Anesth. 2014;23(3):213-216. https://doi.org/10.1016/j.ijoa.2014.03.001.
24. Chin KJ, Perlas A, Chan V, et al. Ultrasound imaging facilitates spinal anesthesia in adults with difficult surface anatomic landmarks. Anesthesiology. 2011;115(1):94-101. https://doi.org/10.1097/ALN.0b013e31821a8ad4.
25. Cho YC, Koo DH, Oh SK, et al. Comparison of ultrasound-assisted lumbar puncture with lumbar puncture using palpation of landmarks in aged patients in an emergency center. J Korean Soc Emerg Med. 2009;20(3):304.
26. Grau T, Leipold RW, Conradi R, Martin E. Ultrasound control for presumed difficult epidural puncture. Acta Anaesthesiol Scand. 2001;45(6):766-771. https://doi.org/10.1034/j.1399-6576.2001.045006766.x.
27. Grau T, Leipold RW, Conradi R, Martin E, Motsch J. Ultrasound imaging facilitates localization of the epidural space during combined spinal and epidural anesthesia. Reg Anesth Pain Med. 2001;26(1):64-67. https://doi.org/10.1053/rapm.2001.19633.
28. Grau T, Leipold RW, Conradi R, Martin E, Motsch J. Efficacy of ultrasound imaging in obstetric epidural anesthesia. J Clin Anesth. 2002;14(3):169-175. https://doi.org/10.1016/S0952-8180(01)00378-6.
29. Grau T, Leipold RW, Fatehi S, Martin E, Motsch J. Real-time ultrasonic observation of combined spinal-epidural anaesthesia. Eur J Anaesthesiol. 2004;21(1):25-31. https://doi.org/10.1017/S026502150400105X.
30. Mofidi M, Mohammadi M, Saidi H, et al. Ultrasound guided lumbar puncture in emergency department: time saving and less complications. J Res Med Sci. 2013;18(4):303-307. PubMed
31. Nassar M, Abdelazim IA. Pre-puncture ultrasound guided epidural insertion before vaginal delivery. J Clin Monit Comput. 2015;29(5):573-577. https://doi.org/10.1007/s10877-014-9634-y.
32. Nomura JT, Leech SJ, Shenbagamurthi S, et al. A randomized controlled trial of ultrasound-assisted lumbar puncture. J Ultrasound Med. 2007;26(10):1341-1348. https://doi.org/10.7863/jum.2007.26.10.1341.
33. Peterson MA, Pisupati D, Heyming TW, Abele JA, Lewis RJ. Ultrasound for routine lumbar puncture. Acad Emerg Med. 2014;21(2):130-136. https://doi.org/10.1111/acem.12305.
34. Sahin T, Balaban O, Sahin L, Solak M, Toker K. A randomized controlled trial of preinsertion ultrasound guidance for spinal anaesthesia in pregnancy: outcomes among obese and lean parturients: ultrasound for spinal anesthesia in pregnancy. J Anesth. 2014;28(3):413-419. https://doi.org/10.1007/s00540-013-1726-1.
35. Wang Q, Yin C, Wang TL. Ultrasound facilitates identification of combined spinal-epidural puncture in obese parturients. Chin Med J (Engl). 2012;125(21):3840-3843. PubMed
36. Vallejo MC, Phelps AL, Singh S, Orebaugh SL, Sah N. Ultrasound decreases the failed labor epidural rate in resident trainees. Int J Obstet Anesth. 2010;19(4):373-378. https://doi.org/10.1016/j.ijoa.2010.04.002.
37. Darrieutort-Laffite C, Bart G, Planche L, et al. Usefulness of a pre-procedure ultrasound scanning of the lumbar spine before epidural injection in patients with a presumed difficult puncture: a randomized controlled trial. Joint Bone Spine. 2015;82(5):356-361. https://doi.org/10.1016/j.jbspin.2015.02.001.
38. Vosko MR, Brunner C, Schreiber S. Lumbar puncture with ultrasound study (lupus study)-international prospective randomized multicentre trial. Int J Stroke. 2017;12(1):22. https://doi.org/10.1055/s-0037-1606991.
39. Urfalioğlu A, Bilal B, Öksüz G, et al. Comparison of the landmark and ultrasound methods in cesarean sections performed under spinal anesthesia on obese pregnants. J Matern Fetal Neonatal Med. 2017;30(9):1051-1056. https://doi.org/10.1080/14767058.2016.1199677.
40. Tawfik MM, Atallah MM, Elkharboutly WS, Allakkany NS, Abdelkhalek M. Does preprocedural ultrasound increase the first-pass success rate of epidural catheterization before cesarean delivery? A randomized controlled trial. Anesth Analg. 2017;124(3):851-856. https://doi.org/10.1213/ANE.0000000000001325.
41. Turkstra TP, Marmai KL, Armstrong KP, Kumar K, Singh SI. Preprocedural ultrasound assessment does not improve trainee performance of spinal anesthesia for obstetrical patients: a randomized controlled trial. J Clin Anesth. 2017;37:21-24. https://doi.org/10.1016/j.jclinane.2016.10.034.
42. Chong SE, Mohd Nikman A, Saedah A, et al. Real-time ultrasound-guided paramedian spinal anaesthesia: evaluation of the efficacy and the success rate of single needle pass. Br J Anaesth. 2017;118(5):799-801. https://doi.org/10.1093/bja/aex108.
43. Creaney M, Mullane D, Casby C, Tan T. Ultrasound to identify the lumbar space in women with impalpable bony landmarks presenting for elective caesarean delivery under spinal anaesthesia: a randomised trial. Int J Obstet Anesth. 2016;28:12-16. https://doi.org/10.1016/j.ijoa.2016.07.007.
44. Ekinci M, Alici HA, Ahiskalioglu A, et al. The use of ultrasound in planned cesarean delivery under spinal anesthesia for patients having nonprominent anatomic landmarks. J Clin Anesth. 2017;37:82-85. https://doi.org/10.1016/j.jclinane.2016.10.014.
45. Perna P, Gioia A, Ragazzi R, Volta CA, Innamorato M. Can pre-procedure neuroaxial ultrasound improve the identification of the potential epidural space when compared with anatomical landmarks? A prospective randomized study. Minerva Anestesiol. 2017;83(1):41-49. https://doi.org/10.23736/S0375-9393.16.11399-9.
46. Chin A, Crooke B, Heywood L, et al. A randomised controlled trial comparing needle movements during combined spinal-epidural anaesthesia with and without ultrasound assistance. Anaesthesia. 2018;73(4):466-473. https://doi.org/10.1111/anae.14206.
47. Dhanger S, Vinayagam S, Vaidhyanathan B, Rajesh IJ, Tripathy DK. Comparison of landmark versus pre-procedural ultrasonography-assisted midline approach for identification of subarachnoid space in elective caesarean section: a randomised controlled trial. Indian J Anaesth. 2018;62(4):280-284. https://doi.org/10.4103/ija.IJA_488_17.
48. Evans DP, Tozer J, Joyce M, Vitto MJ. Comparison of ultrasound-guided and landmark-based lumbar punctures in inexperienced resident physicians. J Ultrasound Med. 2019;38(3):613-620. https://doi.org/10.1002/jum.14728.
49. Srinivasan KK, Leo AM, Iohom G, Loughnane F, Lee PJ. Pre-procedure ultrasound-guided paramedian spinal anaesthesia at L5-S1: is this better than landmark-guided midline approach? A randomised controlled trial. Indian J Anaesth. 2018;62(1):53-60. https://doi.org/10.4103/ija.IJA_448_17.
50. Perlas A, Chaparro LE, Chin KJ. Lumbar neuraxial ultrasound for spinal and epidural anesthesia: a systematic review and meta-analysis. Reg Anesth Pain Med. 2016;41(2):251-260. https://doi.org/10.1097/AAP.0000000000000184.
51. Lim YC, Choo CY, Tan KT. A randomised controlled trial of ultrasound-assisted spinal anaesthesia. Anaesth Intensive Care. 2014;42(2):191-198. https://doi.org/10.1177/0310057X1404200205.
52. Honarbakhsh S, Osman C, Teo JTH, Gabriel C. Ultrasound-guided lumbar puncture as a diagnostic aid to reduce number of attempts and complication rates. Ultrasound. 2013;21(4):170-175. https://doi.org/10.1177/1742271X13504332.
53. Sahota JS, Carvalho JC, Balki M, Fanning N, Arzola C. Ultrasound estimates for midline epidural punctures in the obese parturient: paramedian sagittal oblique is comparable to transverse median plane. Anesth Analg. 2013;116(4):829-835. https://doi.org/10.1213/ANE.0b013e31827f55f0.
54. Balki M, Lee Y, Halpern S, Carvalho JC. Ultrasound imaging of the lumbar spine in the transverse plane: the correlation between estimated and actual depth to the epidural space in obese parturients. Anesth Analg. 2009;108(6):1876-1881. https://doi.org/10.1213/ane.0b013e3181a323f6.
55. Wallace DH, Currie JM, Gilstrap LC, Santos R. Indirect sonographic guidance for epidural anesthesia in obese pregnant patients. Reg Anesth. 1992;17(4):233-236. PubMed
56. Srinivasan KK, Iohom G, Loughnane F, Lee PJ. Conventional landmark-guided midline versus preprocedure ultrasound-guided paramedian techniques in spinal anesthesia. Anesth Analg. 2015;21(4):1089-1096. https://doi.org/10.1213/ANE.0000000000000911.
57. Chin KJ, Perlas A, Singh M, et al. An ultrasound-assisted approach facilitates spinal anesthesia for total joint arthroplasty. Can J Anaesth. 2009;56(9):643-650. https://doi.org/10.1007/s12630-009-9132-8.
58. Evansa I, Logina I, Vanags I, Borgeat A. Ultrasound versus fluoroscopic-guided epidural steroid injections in patients with degenerative spinal diseases: a randomised study. Eur J Anaesthesiol. 2015;32(4):262-268. https://doi.org/10.1097/EJA.0000000000000103.
59. Park Y, Lee JH, Park KD, et al. Ultrasound-guided vs fluoroscopy-guided caudal epidural steroid injection for the treatment of unilateral lower lumbar radicular pain: a prospective, randomized, single-blind clinical study. Am J Phys Med Rehabil. 2013;92(7):575-586. https://doi.org/10.1097/PHM.0b013e318292356b.
60. Margarido CB, Mikhael R, Arzola C, Balki M, Carvalho JC. The intercristal line determined by palpation is not a reliable anatomical landmark for neuraxial anesthesia. Can J Anaesth. 2011;58(3):262-266. https://doi.org/10.1007/s12630-010-9432-z.
61. Duniec L, Nowakowski P, Kosson D, Łazowski T. Anatomical landmarks based assessment of intravertebral space level for lumbar puncture is misleading in more than 30%. Anaesthesiol Intensive Ther. 2013;45(1):1-6. https://doi.org/10.5603/AIT.2013.0001.
62. Schlotterbeck H, Schaeffer R, Dow WA, et al. Ultrasonographic control of the puncture level for lumbar neuraxial block in obstetric anaesthesia. Br J Anaesth. 2008;100(2):230-234. https://doi.org/10.1093/bja/aem371.
63. Whitty R, Moore M, Macarthur A. Identification of the lumbar interspinous spaces: palpation versus ultrasound. Anesth Analg. 2008;106(2):538-540, table of contents. https://doi.org/10.1213/ane.0b013e31816069d9.
64. Locks Gde F, Almeida MC, Pereira AA. Use of the ultrasound to determine the level of lumbar puncture in pregnant women. Rev Bras Anestesiol. 2010;60(1):13-19. https://doi.org/10.1016/S0034-7094(10)70002-7.
65. Stiffler KA, Jwayyed S, Wilber ST, Robinson A. The use of ultrasound to identify pertinent landmarks for lumbar puncture. Am J Emerg Med. 2007;25(3):331-334. https://doi.org/10.1016/j.ajem.2006.07.010.
66. Gulay U, Meltem T, Nadir SS, Aysin A. Ultrasound-guided evaluation of the lumbar subarachnoid space in lateral and sitting positions in pregnant patients to receive elective cesarean operation. Pak J Med Sci. 2015;31(1):76-81. https://doi.org/10.12669/pjms.311.5647.
67. Kawaguchi R, Yamauchi M, Sugino S, Yamakage M. Ultrasound-aided ipsilateral-dominant epidural block for total hip arthroplasty: a randomised controlled single-blind study. Eur J Anaesthesiol. 2011;28(2):137-140. https://doi.org/10.1097/EJA.0b013e3283423457.
68. Grau T, Leipold RW, Horter J, Martin E, Motsch J. Colour Doppler imaging of the interspinous and epidural space. Eur J Anaesthesiol. 2001;18(11):706-712. https://doi.org/10.1097/00003643-200111000-00002.
69. Arzola C, Davies S, Rofaeel A, Carvalho JC. Ultrasound using the transverse approach to the lumbar spine provides reliable landmarks for labor epidurals. Anesth Analg. 2007;104(5):1188-92, tables of contents. https://doi.org/10.1213/01.ane.0000250912.66057.41.
70. Chauhan AK, Bhatia R, Agrawal S. Lumbar epidural depth using transverse ultrasound scan and its correlation with loss of resistance technique: a prospective observational study in Indian population. Saudi J Anaesth. 2018;12(2):279-282. https://doi.org/10.4103/sja.SJA_679_17.
71. Gnaho A, Nguyen V, Villevielle T, et al. Assessing the depth of the subarachnoid space by ultrasound. Rev Bras Anestesiol. 2012;62(4):520-530. https://doi.org/10.1016/S0034-7094(12)70150-2.
72. Cork RC, Kryc JJ, Vaughan RW. Ultrasonic localization of the lumbar epidural space. Anesthesiology. 1980;52(6):513-516. https://doi.org/10.1097/00000542-198006000-00013.
73. Barsuk JH, Cohen ER, Caprio T, et al. Simulation-based education with mastery learning improves residents’ lumbar puncture skills. Neurology. 2012;79(2):132-137. https://doi.org/10.1212/WNL.0b013e31825dd39d.
74. Lenchus J, Issenberg SB, Murphy D, et al. A blended approach to invasive bedside procedural instruction. Med Teach. 2011;33(2):116-123. https://doi.org/10.3109/0142159X.2010.509412.
75. Wayne DB, Cohen ER, Singer BD, et al. Progress toward improving medical school graduates’ skills via a “boot camp” curriculum. Simul Healthc. 2014;9(1):33-39. https://doi.org/10.1097/SIH.0000000000000001.
76. Cohen ER, Barsuk JH, Moazed F, et al. Making July safer: simulation-based mastery learning during intern boot camp. Acad Med. 2013;88(2):233-239. https://doi.org/10.1097/ACM.0b013e31827bfc0a.
77. Martin R, Gannon D, Riggle J, et al. A comprehensive workshop using simulation to train internal medicine residents in bedside procedures performed by internists. Chest. 2012;142(4):545A. https://doi.org/10.1378/chest.1390093.
78. Lenchus JD. End of the “see one, do one, teach one” era: the next generation of invasive bedside procedural instruction. J Am Osteopath Assoc. 2010;110(6):340-346. PubMed
79. Mourad M, Ranji S, Sliwka D. A randomized controlled trial of the impact of a teaching procedure service on the training of internal medicine residents. J Grad Med Educ. 2012;4(2):170-175. https://doi.org/10.4300/JGME-D-11-00136.1.
80. Restrepo CG, Baker MD, Pruitt CM, Gullett JP, Pigott DC. Ability of pediatric emergency medicine physicians to identify anatomic landmarks with the assistance of ultrasound prior to lumbar puncture in a simulated obese model. Pediatr Emerg Care. 2015;31(1):15-19. https://doi.org/10.1097/PEC.0000000000000330.
81. VanderWielen BA, Harris R, Galgon RE, VanderWielen LM, Schroeder KM. Teaching sonoanatomy to anesthesia faculty and residents: utility of hands-on gel phantom and instructional video training models. J Clin Anesth. 2015;27(3):188-194. https://doi.org/10.1016/j.jclinane.2014.07.007.
82. Keri Z, Sydor D, Ungi T, et al. Computerized training system for ultrasound-guided lumbar puncture on abnormal spine models: a randomized controlled trial. Can J Anaesth. 2015;62(7):777-784. https://doi.org/10.1007/s12630-015-0367-2.
83. Deacon AJ, Melhuishi NS, Terblanche NC. CUSUM method for construction of trainee spinal ultrasound learning curves following standardised teaching. Anaesth Intensive Care. 2014;42(4):480-486. https://doi.org/10.1177/0310057X1404200409.
84. Margarido CB, Arzola C, Balki M, Carvalho JC. Anesthesiologists’ learning curves for ultrasound assessment of the lumbar spine. Can J Anaesth. 2010;57(2):120-126. https://doi.org/10.1007/s12630-009-9219-2.
85. Jensen TP, Soni NJ, Tierney DM, Lucas BP. Hospital privileging practices for bedside procedures: a survey of hospitalist experts. J Hosp Med. 2017;12(10):836-839. https://doi.org/10.12788/jhm.2837.
86. Terblanche NC, Arzola C, Wills KE, et al. Standardised training program in spinal ultrasound for epidural insertion: protocol driven versus non-protocol driven teaching approach. Anaesth Intensive Care. 2014;42(4):460-466. https://doi.org/10.1177/0310057X1404200406.
87. Mofidi M, Mohammadi M, Saidi H, et al. Ultrasound guided lumbar puncture in emergency department: time saving and less complications. J Res Med Sci. 2013;18(4):303-307. PubMed
88. Karmakar MK, Li X, Ho AM, Kwok WH, Chui PT. Real-time ultrasound-guided paramedian epidural access: evaluation of a novel in-plane technique. Br J Anaesth. 2009;102(6):845-854. https://doi.org/10.1093/bja/aep079.
89. Tran D, Kamani AA, Al-Attas E, et al. Single-operator real-time ultrasound-guidance to aim and insert a lumbar epidural needle. Can J Anaesth. 2010;57(4):313-321. https://doi.org/10.1007/s12630-009-9252-1.
90. Liu Y, Qian W, Ke XJ, Mei W. Real-time ultrasound-guided spinal anesthesia using a new paramedian transverse approach. Curr Med Sci. 2018;38(5):910-913. https://doi.org/10.1007/s11596-018-1961-7.
91. Conroy PH, Luyet C, McCartney CJ, McHardy PG. Real-time ultrasound-guided spinal anaesthesia: a prospective observational study of a new approach. Anesthesiol Res Pract. 2013;2013:525818. https://doi.org/10.1155/2013/525818.
92. Brinkmann S, Tang R, Sawka A, Vaghadia H. Single-operator real-time ultrasound-guided spinal injection using SonixGPS™: a case series. Can J Anaesth. 2013;60(9):896-901. https://doi.org/10.1007/s12630-013-9984-9.
93. Niazi AU, Chin KJ, Jin R, Chan VW. Real-time ultrasound-guided spinal anesthesia using the SonixGPS ultrasound guidance system: a feasibility study. Acta Anaesthesiol Scand. 2014;58(7):875-881. https://doi.org/10.1111/aas.12353.
© 2019 Society of Hospital Medicine
Ultrasound Guidance for Lumbar Puncture: A Consideration, Not an Obligation
Recognizing the increasingly important role of point-of-care ultrasound (POCUS) in advancing clinical care, the Society of Hospital Medicine (SHM) has published a valuable series of position statements to guide hospitalists and administrators on the safe and effective use of POCUS.1 In this issue of the Journal of Hospital Medicine, Soni et al. present a series of consensus-based recommendations on ultrasound guidance for lumbar puncture (LP).2 Among these are the recommendations that ultrasound “should be used” to map the lumbar spine and to select an appropriate puncture site to reduce insertion attempts, reduce needle redirections, and increase overall procedural success.
At first glance, the recommendations appear definitive. However, not immediately obvious is the authors’ clarification that “This position statement does not mandate that hospitalists use ultrasound guidance for LP, nor does it establish ultrasound guidance as the standard of care for LP.” Even with the authors’ caveat, this nuance may not be readily apparent to the readers who review only the executive summary of the guidelines or who omit the context provided in the background of the position statement.
The directive language of this position statement may be a result of an unmerited amplification. The SHM POCUS Task Force employed the Research and Development Appropriateness Method to quantify the degree of consensus and the strength of the recommendation assigned,3 reaching “very good” consensus for each of the recommendations espoused in its position statement. Procedurally, this implies that ≥80% of the 27 voting members rated each published recommendation statement as “appropriate”. Using wording assigned a priori by the committee to each level of consensus, appropriateness became magnified to the declaration “should be used”. In this manner, the strength of the recommendations in this position statement is not necessarily based on the experts’ convictions related to ultrasound-guided LP, nor the strength of the supporting evidence.
In the case of ultrasound-guided LP, we might choose different descriptors than “appropriate” or “should be used”. The evidence base for ultrasound guidance for LP, though growing, may be insufficient as a foundation to a position statement and is certainly insufficient to create a new standard of care for hospitalists. Although the SHM POCUS Task Force completed a thoughtful literature review, no systematic approach (eg, GRADE methodology4) was used to rate the quality of evidence. Furthermore, the literature reviewed was drawn predominantly from anesthesia and emergency medicine sources—not readily generalizable to the hospitalist. Notably, these studies examined all neuraxial procedures (most commonly epidural and spinal anesthesia), which employ different techniques and tools than LP and are performed by clinicians with vastly different procedural training backgrounds than most hospitalists. Altogether, this creates the potential for a gap between true evidence quality and the strength of recommendation.
At a high level, although the technique for ultrasound mapping of the lumbar spine may be similar, the use of ultrasound has been less well studied specifically for LP. When considering LP alone, the available literature is inadequate to recommend uniform ultrasound guidance. A 2018 meta-analysis by Gottlieb et al. included 12 studies focusing only on LP, totaling N = 957 patients.5 This showed some favorability of ultrasound guidance, with a success rate of 90% using ultrasound, 81.4% with a landmark-based approach, and an odds ratio of 2.22 favoring ultrasound guidance (95% CI: 1.03-4.77). Unfortunately, when focusing only on adult patients, the advantage of POCUS diminished, with 91.4% success in the ultrasound group, 87.7% success in the landmark group, and a nonsignificant odds ratio of 2.10 (95% CI: 0.66-7.44).
Unequivocally, POCUS has established itself as a transformative technology for the guidance of invasive bedside procedures, bringing increased procedural success, improved safety, and decreased complication rates.6 For some procedures, particularly central venous catheterization, ultrasound guidance is a clear standard of care.7,8 For LP, the greatest benefit has been observed in patients with anticipated procedural challenges, most commonly obese patients in whom landmarks are not easily palpable.9 Moreover, the harms ultrasound seeks to prevent are substantially different. The primary risk of deferring ultrasound guidance for LP is most often a failed procedure, whereas for other common ultrasound-guided procedures, the harms may include significant vascular injury, pneumothorax, or bowel perforation. Differences in the relative harms make risk-benefit assessments harder to quantify and studies harder to carry out.
Sonographic guidance for LP has a role in clinical practice and should always be considered. However, at present, there exist no guidelines in any other specialty regarding the routine use of ultrasound-guided LP, including anesthesia, emergency medicine, neurology, or interventional radiology.10-15 As a result, a conservative interpretation of the POCUS Task Force’s findings would be to consider the use of ultrasound guidance for LP in patients where landmark identification is particularly challenging, but not to consider it a standard requirement for accreditation, training, or practice as of yet. Saying “more studies are required” can be a cop-out in some cases, but in this situation, the old adage does seem to apply.
We have great respect for the work of the SHM POCUS Task Force in advancing the use of POCUS in hospital medicine. Though ultrasound is not currently mandated as a care standard for the performance of LP, we all can agree that POCUS does confer advantages for this procedure, particularly in a well-selected patient population. To continue to provide care of the highest quality, hospitalists must be encouraged to elevate their practice with POCUS and be supported with the equipment, training, credentialing, and quality assurance structures necessary to integrate bedside ultrasound safely and effectively into their diagnostic and procedural practice.
Disclosures
No conflicts of interest to disclose.
Funding
None.
1. Soni NJ, Schnobrich D, Matthews BK, et al. Point-of-care ultrasound for hospitalists: a position statement of the society of hospital medicine [published online ahead of print June 10, 2019]. J Hosp Med. 2019;14(10):591-601. https://doi.org/10.12788/jhm.3079.
2. Soni NJ, Franco-Sadud R, Dobaidze K, et al. Recommendations on the use of ultrasound guidance for adult lumbar puncture: a position statement of the society of hospital medicine. J Hosp Med. 2018;13(2):126-135. https://doi.org/10.12788/jhm.2940.
3. Fitch, K, Bernstein SJ, Aguilar MD et al. The RAND/UCLA appropriateness method user’s manual. Santa Monica, CA: RAND Corporation, 2001.
4. Guyatt GH, Oxman AD, Vist GE, et al. GRADE: An emerging consensus on rating quality of evidence and strength of recommendations. BMJ. 2008;334(7650):924-926. PubMed
5. Gottlieb M, Holladay D, Peksa GD. Ultrasound-assisted lumbar punctures: a systematic review and meta-analysis. Acad Emerg Med. 2019;26(1):85-96. https://doi.org/10.1111/acem.13558.
6. Moore CL, Copel JA. Point of care ultrasonography. N Engl J Med. 2011;364(8):749-757. https://doi.org/10.1056/NEJMra0909487.
7. Shojania K, Duncan B, McDonald K, Wachter RM. Making health care safer: a critical analysis of patient safety practices. Rockville, MD: Agency for Healthcare Research and Quality, 2001. Evidence Report/Technology Assessment No. 43; AHRQ publication 01-E058. PubMed
8. Brass P, Hellmich M, Kolodziej L, Schick G, Smith AF. Ultrasound guidance versus anatomical landmarks for internal jugular vein catherization. Cochrane Database Syst Rev. 2015;Art. No.: 1:CD006962. https://doi.org/10.1002/14651858.CD006962.pub2.
9. Peterson MA, Pisupati D, Heyming TW, Abele JA, Lewis RJ. Ultrasound for routine lumbar puncture. Acad Emerg Med. 2014;21(2):130-136. https://doi.org/10.1111/acem.12305.
10. American College of Emergency Physicians. Ultrasound guidelines: emergency, point-of-care, and clinical ultrasound guidelines in medicine. Ann Emerg Med. 2017;69(5):e27-e54. https://doi.org/10.1016/j.annemergmed.2016.08.457.
11. Neal JM, Brull R, Horn JL, et al. The Second American Society of Regional Anesthesia and Pain Medicine Evidence-Based Medicine Assessment of Ultrasound-Guided Regional Anesthesia: executive summary. Reg Anesth Pain Med. 2016;41(2):181-194. doi: 10.1097/AAP.0000000000000331.
12. Practice guidelines for obstetric anesthesia: an updated report by the American Society of Anesthesiologists Task Force on Obstetric Anesthesia and the Society for Obstetric Anesthesia and Perinatology. Anesthesiology. 2016;124(2):270-300. doi: 10.1097/ALN.0000000000000935.
13. Engelborghs S, Sebastiaan E, Struyfs H, et al. Consensus guidelines for lumbar puncture in patients with neurological diseases. Alzheimers Dement. 2017;8:111-126. doi: 10.1016/j.dadm.2017.04.007.
14. American College of Radiology. ACR-SPR-SRU Practice Parameter for the Performing and Interpreting Diagnostic Ultrasound Examinations. 2017; Available at https://www.acr.org/-/media/ACR/Files/Practice-Parameters/us-perf-interpret.pdf. Accessed April 15, 2019.
15. American College of Radiology. ACR-AIUM-SPR-SRU Practice Parameter for the Performance of an Ultrasound Examination of the Neonatal and Infant Spine. 2016/ Available at https://www.acr.org/-/media/ACR/Files/Practice-Parameters/US-NeonatalSpine.pdf. Accessed April 15, 2019.
Recognizing the increasingly important role of point-of-care ultrasound (POCUS) in advancing clinical care, the Society of Hospital Medicine (SHM) has published a valuable series of position statements to guide hospitalists and administrators on the safe and effective use of POCUS.1 In this issue of the Journal of Hospital Medicine, Soni et al. present a series of consensus-based recommendations on ultrasound guidance for lumbar puncture (LP).2 Among these are the recommendations that ultrasound “should be used” to map the lumbar spine and to select an appropriate puncture site to reduce insertion attempts, reduce needle redirections, and increase overall procedural success.
At first glance, the recommendations appear definitive. However, not immediately obvious is the authors’ clarification that “This position statement does not mandate that hospitalists use ultrasound guidance for LP, nor does it establish ultrasound guidance as the standard of care for LP.” Even with the authors’ caveat, this nuance may not be readily apparent to the readers who review only the executive summary of the guidelines or who omit the context provided in the background of the position statement.
The directive language of this position statement may be a result of an unmerited amplification. The SHM POCUS Task Force employed the Research and Development Appropriateness Method to quantify the degree of consensus and the strength of the recommendation assigned,3 reaching “very good” consensus for each of the recommendations espoused in its position statement. Procedurally, this implies that ≥80% of the 27 voting members rated each published recommendation statement as “appropriate”. Using wording assigned a priori by the committee to each level of consensus, appropriateness became magnified to the declaration “should be used”. In this manner, the strength of the recommendations in this position statement is not necessarily based on the experts’ convictions related to ultrasound-guided LP, nor the strength of the supporting evidence.
In the case of ultrasound-guided LP, we might choose different descriptors than “appropriate” or “should be used”. The evidence base for ultrasound guidance for LP, though growing, may be insufficient as a foundation to a position statement and is certainly insufficient to create a new standard of care for hospitalists. Although the SHM POCUS Task Force completed a thoughtful literature review, no systematic approach (eg, GRADE methodology4) was used to rate the quality of evidence. Furthermore, the literature reviewed was drawn predominantly from anesthesia and emergency medicine sources—not readily generalizable to the hospitalist. Notably, these studies examined all neuraxial procedures (most commonly epidural and spinal anesthesia), which employ different techniques and tools than LP and are performed by clinicians with vastly different procedural training backgrounds than most hospitalists. Altogether, this creates the potential for a gap between true evidence quality and the strength of recommendation.
At a high level, although the technique for ultrasound mapping of the lumbar spine may be similar, the use of ultrasound has been less well studied specifically for LP. When considering LP alone, the available literature is inadequate to recommend uniform ultrasound guidance. A 2018 meta-analysis by Gottlieb et al. included 12 studies focusing only on LP, totaling N = 957 patients.5 This showed some favorability of ultrasound guidance, with a success rate of 90% using ultrasound, 81.4% with a landmark-based approach, and an odds ratio of 2.22 favoring ultrasound guidance (95% CI: 1.03-4.77). Unfortunately, when focusing only on adult patients, the advantage of POCUS diminished, with 91.4% success in the ultrasound group, 87.7% success in the landmark group, and a nonsignificant odds ratio of 2.10 (95% CI: 0.66-7.44).
Unequivocally, POCUS has established itself as a transformative technology for the guidance of invasive bedside procedures, bringing increased procedural success, improved safety, and decreased complication rates.6 For some procedures, particularly central venous catheterization, ultrasound guidance is a clear standard of care.7,8 For LP, the greatest benefit has been observed in patients with anticipated procedural challenges, most commonly obese patients in whom landmarks are not easily palpable.9 Moreover, the harms ultrasound seeks to prevent are substantially different. The primary risk of deferring ultrasound guidance for LP is most often a failed procedure, whereas for other common ultrasound-guided procedures, the harms may include significant vascular injury, pneumothorax, or bowel perforation. Differences in the relative harms make risk-benefit assessments harder to quantify and studies harder to carry out.
Sonographic guidance for LP has a role in clinical practice and should always be considered. However, at present, there exist no guidelines in any other specialty regarding the routine use of ultrasound-guided LP, including anesthesia, emergency medicine, neurology, or interventional radiology.10-15 As a result, a conservative interpretation of the POCUS Task Force’s findings would be to consider the use of ultrasound guidance for LP in patients where landmark identification is particularly challenging, but not to consider it a standard requirement for accreditation, training, or practice as of yet. Saying “more studies are required” can be a cop-out in some cases, but in this situation, the old adage does seem to apply.
We have great respect for the work of the SHM POCUS Task Force in advancing the use of POCUS in hospital medicine. Though ultrasound is not currently mandated as a care standard for the performance of LP, we all can agree that POCUS does confer advantages for this procedure, particularly in a well-selected patient population. To continue to provide care of the highest quality, hospitalists must be encouraged to elevate their practice with POCUS and be supported with the equipment, training, credentialing, and quality assurance structures necessary to integrate bedside ultrasound safely and effectively into their diagnostic and procedural practice.
Disclosures
No conflicts of interest to disclose.
Funding
None.
Recognizing the increasingly important role of point-of-care ultrasound (POCUS) in advancing clinical care, the Society of Hospital Medicine (SHM) has published a valuable series of position statements to guide hospitalists and administrators on the safe and effective use of POCUS.1 In this issue of the Journal of Hospital Medicine, Soni et al. present a series of consensus-based recommendations on ultrasound guidance for lumbar puncture (LP).2 Among these are the recommendations that ultrasound “should be used” to map the lumbar spine and to select an appropriate puncture site to reduce insertion attempts, reduce needle redirections, and increase overall procedural success.
At first glance, the recommendations appear definitive. However, not immediately obvious is the authors’ clarification that “This position statement does not mandate that hospitalists use ultrasound guidance for LP, nor does it establish ultrasound guidance as the standard of care for LP.” Even with the authors’ caveat, this nuance may not be readily apparent to the readers who review only the executive summary of the guidelines or who omit the context provided in the background of the position statement.
The directive language of this position statement may be a result of an unmerited amplification. The SHM POCUS Task Force employed the Research and Development Appropriateness Method to quantify the degree of consensus and the strength of the recommendation assigned,3 reaching “very good” consensus for each of the recommendations espoused in its position statement. Procedurally, this implies that ≥80% of the 27 voting members rated each published recommendation statement as “appropriate”. Using wording assigned a priori by the committee to each level of consensus, appropriateness became magnified to the declaration “should be used”. In this manner, the strength of the recommendations in this position statement is not necessarily based on the experts’ convictions related to ultrasound-guided LP, nor the strength of the supporting evidence.
In the case of ultrasound-guided LP, we might choose different descriptors than “appropriate” or “should be used”. The evidence base for ultrasound guidance for LP, though growing, may be insufficient as a foundation to a position statement and is certainly insufficient to create a new standard of care for hospitalists. Although the SHM POCUS Task Force completed a thoughtful literature review, no systematic approach (eg, GRADE methodology4) was used to rate the quality of evidence. Furthermore, the literature reviewed was drawn predominantly from anesthesia and emergency medicine sources—not readily generalizable to the hospitalist. Notably, these studies examined all neuraxial procedures (most commonly epidural and spinal anesthesia), which employ different techniques and tools than LP and are performed by clinicians with vastly different procedural training backgrounds than most hospitalists. Altogether, this creates the potential for a gap between true evidence quality and the strength of recommendation.
At a high level, although the technique for ultrasound mapping of the lumbar spine may be similar, the use of ultrasound has been less well studied specifically for LP. When considering LP alone, the available literature is inadequate to recommend uniform ultrasound guidance. A 2018 meta-analysis by Gottlieb et al. included 12 studies focusing only on LP, totaling N = 957 patients.5 This showed some favorability of ultrasound guidance, with a success rate of 90% using ultrasound, 81.4% with a landmark-based approach, and an odds ratio of 2.22 favoring ultrasound guidance (95% CI: 1.03-4.77). Unfortunately, when focusing only on adult patients, the advantage of POCUS diminished, with 91.4% success in the ultrasound group, 87.7% success in the landmark group, and a nonsignificant odds ratio of 2.10 (95% CI: 0.66-7.44).
Unequivocally, POCUS has established itself as a transformative technology for the guidance of invasive bedside procedures, bringing increased procedural success, improved safety, and decreased complication rates.6 For some procedures, particularly central venous catheterization, ultrasound guidance is a clear standard of care.7,8 For LP, the greatest benefit has been observed in patients with anticipated procedural challenges, most commonly obese patients in whom landmarks are not easily palpable.9 Moreover, the harms ultrasound seeks to prevent are substantially different. The primary risk of deferring ultrasound guidance for LP is most often a failed procedure, whereas for other common ultrasound-guided procedures, the harms may include significant vascular injury, pneumothorax, or bowel perforation. Differences in the relative harms make risk-benefit assessments harder to quantify and studies harder to carry out.
Sonographic guidance for LP has a role in clinical practice and should always be considered. However, at present, there exist no guidelines in any other specialty regarding the routine use of ultrasound-guided LP, including anesthesia, emergency medicine, neurology, or interventional radiology.10-15 As a result, a conservative interpretation of the POCUS Task Force’s findings would be to consider the use of ultrasound guidance for LP in patients where landmark identification is particularly challenging, but not to consider it a standard requirement for accreditation, training, or practice as of yet. Saying “more studies are required” can be a cop-out in some cases, but in this situation, the old adage does seem to apply.
We have great respect for the work of the SHM POCUS Task Force in advancing the use of POCUS in hospital medicine. Though ultrasound is not currently mandated as a care standard for the performance of LP, we all can agree that POCUS does confer advantages for this procedure, particularly in a well-selected patient population. To continue to provide care of the highest quality, hospitalists must be encouraged to elevate their practice with POCUS and be supported with the equipment, training, credentialing, and quality assurance structures necessary to integrate bedside ultrasound safely and effectively into their diagnostic and procedural practice.
Disclosures
No conflicts of interest to disclose.
Funding
None.
1. Soni NJ, Schnobrich D, Matthews BK, et al. Point-of-care ultrasound for hospitalists: a position statement of the society of hospital medicine [published online ahead of print June 10, 2019]. J Hosp Med. 2019;14(10):591-601. https://doi.org/10.12788/jhm.3079.
2. Soni NJ, Franco-Sadud R, Dobaidze K, et al. Recommendations on the use of ultrasound guidance for adult lumbar puncture: a position statement of the society of hospital medicine. J Hosp Med. 2018;13(2):126-135. https://doi.org/10.12788/jhm.2940.
3. Fitch, K, Bernstein SJ, Aguilar MD et al. The RAND/UCLA appropriateness method user’s manual. Santa Monica, CA: RAND Corporation, 2001.
4. Guyatt GH, Oxman AD, Vist GE, et al. GRADE: An emerging consensus on rating quality of evidence and strength of recommendations. BMJ. 2008;334(7650):924-926. PubMed
5. Gottlieb M, Holladay D, Peksa GD. Ultrasound-assisted lumbar punctures: a systematic review and meta-analysis. Acad Emerg Med. 2019;26(1):85-96. https://doi.org/10.1111/acem.13558.
6. Moore CL, Copel JA. Point of care ultrasonography. N Engl J Med. 2011;364(8):749-757. https://doi.org/10.1056/NEJMra0909487.
7. Shojania K, Duncan B, McDonald K, Wachter RM. Making health care safer: a critical analysis of patient safety practices. Rockville, MD: Agency for Healthcare Research and Quality, 2001. Evidence Report/Technology Assessment No. 43; AHRQ publication 01-E058. PubMed
8. Brass P, Hellmich M, Kolodziej L, Schick G, Smith AF. Ultrasound guidance versus anatomical landmarks for internal jugular vein catherization. Cochrane Database Syst Rev. 2015;Art. No.: 1:CD006962. https://doi.org/10.1002/14651858.CD006962.pub2.
9. Peterson MA, Pisupati D, Heyming TW, Abele JA, Lewis RJ. Ultrasound for routine lumbar puncture. Acad Emerg Med. 2014;21(2):130-136. https://doi.org/10.1111/acem.12305.
10. American College of Emergency Physicians. Ultrasound guidelines: emergency, point-of-care, and clinical ultrasound guidelines in medicine. Ann Emerg Med. 2017;69(5):e27-e54. https://doi.org/10.1016/j.annemergmed.2016.08.457.
11. Neal JM, Brull R, Horn JL, et al. The Second American Society of Regional Anesthesia and Pain Medicine Evidence-Based Medicine Assessment of Ultrasound-Guided Regional Anesthesia: executive summary. Reg Anesth Pain Med. 2016;41(2):181-194. doi: 10.1097/AAP.0000000000000331.
12. Practice guidelines for obstetric anesthesia: an updated report by the American Society of Anesthesiologists Task Force on Obstetric Anesthesia and the Society for Obstetric Anesthesia and Perinatology. Anesthesiology. 2016;124(2):270-300. doi: 10.1097/ALN.0000000000000935.
13. Engelborghs S, Sebastiaan E, Struyfs H, et al. Consensus guidelines for lumbar puncture in patients with neurological diseases. Alzheimers Dement. 2017;8:111-126. doi: 10.1016/j.dadm.2017.04.007.
14. American College of Radiology. ACR-SPR-SRU Practice Parameter for the Performing and Interpreting Diagnostic Ultrasound Examinations. 2017; Available at https://www.acr.org/-/media/ACR/Files/Practice-Parameters/us-perf-interpret.pdf. Accessed April 15, 2019.
15. American College of Radiology. ACR-AIUM-SPR-SRU Practice Parameter for the Performance of an Ultrasound Examination of the Neonatal and Infant Spine. 2016/ Available at https://www.acr.org/-/media/ACR/Files/Practice-Parameters/US-NeonatalSpine.pdf. Accessed April 15, 2019.
1. Soni NJ, Schnobrich D, Matthews BK, et al. Point-of-care ultrasound for hospitalists: a position statement of the society of hospital medicine [published online ahead of print June 10, 2019]. J Hosp Med. 2019;14(10):591-601. https://doi.org/10.12788/jhm.3079.
2. Soni NJ, Franco-Sadud R, Dobaidze K, et al. Recommendations on the use of ultrasound guidance for adult lumbar puncture: a position statement of the society of hospital medicine. J Hosp Med. 2018;13(2):126-135. https://doi.org/10.12788/jhm.2940.
3. Fitch, K, Bernstein SJ, Aguilar MD et al. The RAND/UCLA appropriateness method user’s manual. Santa Monica, CA: RAND Corporation, 2001.
4. Guyatt GH, Oxman AD, Vist GE, et al. GRADE: An emerging consensus on rating quality of evidence and strength of recommendations. BMJ. 2008;334(7650):924-926. PubMed
5. Gottlieb M, Holladay D, Peksa GD. Ultrasound-assisted lumbar punctures: a systematic review and meta-analysis. Acad Emerg Med. 2019;26(1):85-96. https://doi.org/10.1111/acem.13558.
6. Moore CL, Copel JA. Point of care ultrasonography. N Engl J Med. 2011;364(8):749-757. https://doi.org/10.1056/NEJMra0909487.
7. Shojania K, Duncan B, McDonald K, Wachter RM. Making health care safer: a critical analysis of patient safety practices. Rockville, MD: Agency for Healthcare Research and Quality, 2001. Evidence Report/Technology Assessment No. 43; AHRQ publication 01-E058. PubMed
8. Brass P, Hellmich M, Kolodziej L, Schick G, Smith AF. Ultrasound guidance versus anatomical landmarks for internal jugular vein catherization. Cochrane Database Syst Rev. 2015;Art. No.: 1:CD006962. https://doi.org/10.1002/14651858.CD006962.pub2.
9. Peterson MA, Pisupati D, Heyming TW, Abele JA, Lewis RJ. Ultrasound for routine lumbar puncture. Acad Emerg Med. 2014;21(2):130-136. https://doi.org/10.1111/acem.12305.
10. American College of Emergency Physicians. Ultrasound guidelines: emergency, point-of-care, and clinical ultrasound guidelines in medicine. Ann Emerg Med. 2017;69(5):e27-e54. https://doi.org/10.1016/j.annemergmed.2016.08.457.
11. Neal JM, Brull R, Horn JL, et al. The Second American Society of Regional Anesthesia and Pain Medicine Evidence-Based Medicine Assessment of Ultrasound-Guided Regional Anesthesia: executive summary. Reg Anesth Pain Med. 2016;41(2):181-194. doi: 10.1097/AAP.0000000000000331.
12. Practice guidelines for obstetric anesthesia: an updated report by the American Society of Anesthesiologists Task Force on Obstetric Anesthesia and the Society for Obstetric Anesthesia and Perinatology. Anesthesiology. 2016;124(2):270-300. doi: 10.1097/ALN.0000000000000935.
13. Engelborghs S, Sebastiaan E, Struyfs H, et al. Consensus guidelines for lumbar puncture in patients with neurological diseases. Alzheimers Dement. 2017;8:111-126. doi: 10.1016/j.dadm.2017.04.007.
14. American College of Radiology. ACR-SPR-SRU Practice Parameter for the Performing and Interpreting Diagnostic Ultrasound Examinations. 2017; Available at https://www.acr.org/-/media/ACR/Files/Practice-Parameters/us-perf-interpret.pdf. Accessed April 15, 2019.
15. American College of Radiology. ACR-AIUM-SPR-SRU Practice Parameter for the Performance of an Ultrasound Examination of the Neonatal and Infant Spine. 2016/ Available at https://www.acr.org/-/media/ACR/Files/Practice-Parameters/US-NeonatalSpine.pdf. Accessed April 15, 2019.
© 2019 Society of Hospital Medicine
Improving Respiratory Rate Accuracy in the Hospital: A Quality Improvement Initiative
Respiratory rate (RR) is an essential vital sign that is routinely measured for hospitalized adults. It is a strong predictor of adverse events.1,2 Therefore, RR is a key component of several widely used risk prediction scores, including the systemic inflammatory response syndrome (SIRS).3
Despite its clinical utility, RR is inaccurately measured.4-7 One reason for the inaccurate measurement of RR is that RR measurement, in contrast to that of other vital signs, is not automated. The gold-standard technique for measuring RR is the visual assessment of a resting patient. Thus, RR measurement is perceived as time-consuming. Clinical staff instead frequently approximate RR through brief observation.8-11
Given its clinical importance and widespread inaccuracy, we conducted a quality improvement (QI) initiative to improve RR accuracy.
METHODS
Design and Setting
We conducted an interdisciplinary QI initiative by using the plan–do–study–act (PDSA) methodology from July 2017 to February 2018. The initiative was set in a single adult 28-bed medical inpatient unit of a large, urban, safety-net hospital consisting of general internal medicine and hematology/oncology patients. Routine vital sign measurements on this unit occur at four- or six-hour intervals per physician orders and are performed by patient-care assistants (PCAs) who are nonregistered nursing support staff. PCAs use a vital signs cart equipped with automated tools to measure vital signs except for RR, which is manually assessed. PCAs are trained on vital sign measurements during a two-day onboarding orientation and four to six weeks of on-the-job training by experienced PCAs. PCAs are directly supervised by nursing operations managers. Formal continuing education programs for PCAs or performance audits of their clinical duties did not exist prior to our QI initiative.
Intervention
Intervention development addressing several important barriers and workflow inefficiencies was based on the direct observation of PCA workflow and information gathering by engaging stakeholders, including PCAs, nursing operations management, nursing leadership, and hospital administration (PDSA cycles 1-7 in Table). Our modified PCA vital sign workflow incorporated RR measurement during the approximate 30 seconds needed to complete automated blood pressure measurement as previously described.12 Nursing administration purchased three stopwatches (each $5 US) to attach to vital signs carts. One investigator (NK) participated in two monthly one-hour meetings, and three investigators (NK, KB, and SD) participated in 19 daily 15-minute huddles to conduct stakeholder engagement and educate and retrain PCAs on proper technique (total of 6.75 hours).
Evaluation
The primary aim of this QI initiative was to improve RR accuracy, which was evaluated using two distinct but complementary analyses: the prospective comparison of PCA-recorded RRs with gold-standard recorded RRs and the retrospective comparison of RRs recorded in electronic health records (EHR) on the intervention unit versus two control units. The secondary aims were to examine time to complete vital sign measurement and to assess whether the intervention was associated with a reduction in the incidence of SIRS specifically due to tachypnea.
Respiratory Rate Accuracy
PCA-recorded RRs were considered accurate if the RR was within ±2 breaths of a gold-standard RR measurement performed by a trained study member (NK or KB). We conducted gold-standard RR measurements for 100 observations pre- and postintervention within 30 minutes of PCA measurement to avoid Hawthorne bias.
We assessed the variability of recorded RRs in the EHR for all patients in the intervention unit as a proxy for accuracy. We hypothesized on the basis of prior research that improving the accuracy of RR measurement would increase the variability and normality of distribution in RRs.13 This is an approach that we have employed previously.7 The EHR cohort included consecutive hospitalizations by patients who were admitted to either the intervention unit or to one of two nonintervention general medicine inpatient units that served as concurrent controls. We grouped hospitalizations into a preintervention phase from March 1, 2017-July 22, 2017, a planning phase from July 23, 2017-December 3, 2017, and a postintervention phase from December 21, 2017-February 28, 2018. Hospitalizations during the two-week teaching phase from December 3, 2017-December 21, 2017 were excluded. We excluded vital signs obtained in the emergency department or in a location different from the patient’s admission unit. We qualitatively assessed RR distribution using histograms as we have done previously.7
We examined the distributions of RRs recorded in the EHR before and after intervention by individual PCAs on the intervention floor to assess for fidelity and adherence in the PCA uptake of the intervention.
Time
We compared the time to complete vital sign measurement among convenience samples of 50 unique observations pre- and postintervention using the Wilcoxon rank sum test.
SIRS Incidence
Since we hypothesized that improved RR accuracy would reduce falsely elevated RRs but have no impact on the other three SIRS criteria, we assessed changes in tachypnea-specific SIRS incidence, which was defined a priori as the presence of exactly two concurrent SIRS criteria, one of which was an elevated RR.3 We examined changes using a difference-in-differences approach with three different units of analysis (per vital sign measurement, hospital-day, and hospitalization; see footnote for Appendix Table 1 for methodological details. All analyses were conducted using STATA 12.0 (StataCorp, College Station, Texas).
RESULTS
Respiratory Rate Accuracy
Prior to the intervention, the median PCA RR was 18 (IQR 18-20) versus 12 (IQR 12-18) for the gold-standard RR (Appendix Figure 1), with only 36% of PCA measurements considered accurate. After the intervention, the median PCA-recorded RR was 14 (IQR 15-20) versus 14 (IQR 14-20) for the gold-standard RR and a RR accuracy of 58% (P < .001).
For our analyses on RR distribution using EHR data, we included 143,447 unique RRs (Appendix Table 2). After the intervention, the normality of the distribution of RRs on the intervention unit had increased, whereas those of RRs on the control units remained qualitatively similar pre- and postintervention (Appendix Figure 2).
Notable differences existed among the 11 individual PCAs (Figure) despite observing increased variability in PCA-recorded RRs postintervention. Some PCAs (numbers 2, 7, and 10) shifted their narrow RR interquartile range lower by several breaths/minute, whereas most other PCAs had a reduced median RR and widened interquartile range.
Time
Before the intervention, the median time to complete vital sign measurements was 2:36 (IQR 2:04-3:20). After the intervention, the time to complete vital signs decreased to 1:55 (IQR, 1:40-2:22; P < .001), which was 41 less seconds on average per vital sign set.
SIRS Incidence
The intervention was associated with a 3.3% reduction (95% CI, –6.4% to –0.005%) in tachypnea-specific SIRS incidence per hospital-day and a 7.8% reduction (95% CI, –13.5% to –2.2%) per hospitalization (Appendix Table 1). We also observed a modest reduction in overall SIRS incidence after the intervention (2.9% less per vital sign check, 4.6% less per hospital-day, and 3.2% less per hospitalization), although these reductions were not statistically significant.
DISCUSSION
Our QI initiative improved the absolute RR accuracy by 22%, saved PCAs 41 seconds on average per vital sign measurement, and decreased the absolute proportion of hospitalizations with tachypnea-specific SIRS by 7.8%. Our intervention is a novel, interdisciplinary, low-cost, low-effort, low-tech approach that addressed known challenges to accurate RR measurement,8,9,11 as well as the key barriers identified in our initial PDSA cycles. Our approach includes adding a time-keeping device to vital sign carts and standardizing a PCA vital sign workflow with increased efficiency. Lastly, this intervention is potentially scalable because stakeholder engagement, education, and retraining of the entire PCA staff for the unit required only 6.75 hours.
While our primary goal was to improve RR accuracy, our QI initiative also improved vital sign efficiency. By extrapolating our findings to an eight-hour PCA shift caring for eight patients who require vital sign checks every four hours, we estimated that our intervention would save approximately 16:24 minutes per PCA shift. This newfound time could be repurposed for other patient-care tasks or could be spent ensuring the accuracy of other vital signs given that accurate monitoring may be neglected because of time constraints.11 Additionally, the improvement in RR accuracy reduced falsely elevated RRs and thus lowered SIRS incidence specifically due to tachypnea. Given that EHR-based sepsis alerts are often based on SIRS criteria, improved RR accuracy may also improve alarm fatigue by reducing the rate of false-positive alerts.14
This initiative is not without limitations. Generalizability to other hospitals and even other units within the same hospital is uncertain. However, because this initiative was conducted within a safety-net hospital, we anticipate at least similar, if not increased, success in better-resourced hospitals. Second, the long-term durability of our intervention is unclear, although EHR RR variability remained steady for two months after our intervention (data not shown).
To ensure long-term sustainability and further improve RR accuracy, future PDSA cycles could include electing a PCA “vital signs champion” to reiterate the importance of RRs in clinical decision-making and ensure adherence to the modified workflow. Nursing champions act as persuasive change agents that disseminate and implement healthcare change,15 which may also be true of PCA champions. Additionally, future PDSA cycles can obviate the need for labor-intensive manual audits by leveraging EHR-based auditing to target education and retraining interventions to PCAs with minimal RR variability to optimize workflow adherence.
In conclusion, through a multipronged QI initiative we improved RR accuracy, increased the efficiency of vital sign measurement, and decreased SIRS incidence specifically due to tachypnea by reducing the number of falsely elevated RRs. This novel, low-cost, low-effort, low-tech approach can readily be implemented and disseminated in hospital inpatient settings.
Acknowledgments
The authors would like to acknowledge the meaningful contributions of Mr. Sudarshaan Pathak, RN, Ms. Shirly Koduvathu, RN, and Ms. Judy Herrington MSN, RN in this multidisciplinary initiative. We thank Mr. Christopher McKintosh, RN for his support in data acquisition. Lastly, the authors would like to acknowledge all of the patient-care assistants involved in this QI initiative.
Disclosures
Dr. Makam reports grants from NIA/NIH, during the conduct of the study. All other authors have nothing to disclose.
Funding
This work is supported in part by the Agency for Healthcare Research and Quality-funded UT Southwestern Center for Patient-Centered Outcomes Research (R24HS022418). OKN is funded by the National Heart, Lung, and Blood Institute (K23HL133441), and ANM is funded by the National Institute on Aging (K23AG052603).
1. Fieselmann JF, Hendryx MS, Helms CM, Wakefield DS. Respiratory rate predicts cardiopulmonary arrest for internal medicine inpatients. J Gen Intern Med. 1993;8(7):354-360. https://doi.org/10.1007/BF02600071.
2. Hodgetts TJ, Kenward G, Vlachonikolis IG, Payne S, Castle N. The identification of risk factors for cardiac arrest and formulation of activation criteria to alert a medical emergency team. Resuscitation. 2002;54(2):125-131. https://doi.org/10.1016/S0300-9572(02)00100-4.
3. Bone RC, Sibbald WJ, Sprung CL. The ACCP-SCCM consensus conference on sepsis and organ failure. Chest. 1992;101(6):1481-1483.
4. Lovett PB, Buchwald JM, Sturmann K, Bijur P. The vexatious vital: neither clinical measurements by nurses nor an electronic monitor provides accurate measurements of respiratory rate in triage. Ann Emerg Med. 2005;45(1):68-76. https://doi.org/10.1016/j.annemergmed.2004.06.016.
5. Chen J, Hillman K, Bellomo R, et al. The impact of introducing medical emergency team system on the documentations of vital signs. Resuscitation. 2009;80(1):35-43. https://doi.org/10.1016/j.resuscitation.2008.10.009.
6. Leuvan CH, Mitchell I. Missed opportunities? An observational study of vital sign measurements. Crit Care Resusc. 2008;10(2):111-115.
7. Badawy J, Nguyen OK, Clark C, Halm EA, Makam AN. Is everyone really breathing 20 times a minute? Assessing epidemiology and variation in recorded respiratory rate in hospitalised adults. BMJ Qual Saf. 2017;26(10):832-836. https://doi.org/10.1136/bmjqs-2017-006671.
8. Chua WL, Mackey S, Ng EK, Liaw SY. Front line nurses’ experiences with deteriorating ward patients: a qualitative study. Int Nurs Rev. 2013;60(4):501-509. https://doi.org/10.1111/inr.12061.
9. De Meester K, Van Bogaert P, Clarke SP, Bossaert L. In-hospital mortality after serious adverse events on medical and surgical nursing units: a mixed methods study. J Clin Nurs. 2013;22(15-16):2308-2317. https://doi.org/10.1111/j.1365-2702.2012.04154.x.
10. Cheng AC, Black JF, Buising KL. Respiratory rate: the neglected vital sign. Med J Aust. 2008;189(9):531. https://doi.org/10.5694/j.1326-5377.2008.tb02163.x.
11. Mok W, Wang W, Cooper S, Ang EN, Liaw SY. Attitudes towards vital signs monitoring in the detection of clinical deterioration: scale development and survey of ward nurses. Int J Qual Health Care. 2015;27(3):207-213. https://doi.org/10.1093/intqhc/mzv019.
12. Keshvani N, Berger K, Nguyen OK, Makam AN. Roadmap for improving the accuracy of respiratory rate measurements. BMJ Qual Saf. 2018;27(8):e5. https://doi.org/10.1136/bmjqs-2017-007516.
13. Semler MW, Stover DG, Copland AP, et al. Flash mob research: a single-day, multicenter, resident-directed study of respiratory rate. Chest. 2013;143(6):1740-1744. https://doi.org/10.1378/chest.12-1837.
14. Makam AN, Nguyen OK, Auerbach AD. Diagnostic accuracy and effectiveness of automated electronic sepsis alert systems: a systematic review. J Hosp Med. 2015;10(6):396-402. https://doi.org/10.1002/jhm.2347.
15. Ploeg J, Skelly J, Rowan M, et al. The role of nursing best practice champions in diffusing practice guidelines: a mixed methods study. Worldviews Evid Based Nurs. 2010;7(4):238-251. https://doi.org/10.1111/j.1741-6787.2010.00202.x.
Respiratory rate (RR) is an essential vital sign that is routinely measured for hospitalized adults. It is a strong predictor of adverse events.1,2 Therefore, RR is a key component of several widely used risk prediction scores, including the systemic inflammatory response syndrome (SIRS).3
Despite its clinical utility, RR is inaccurately measured.4-7 One reason for the inaccurate measurement of RR is that RR measurement, in contrast to that of other vital signs, is not automated. The gold-standard technique for measuring RR is the visual assessment of a resting patient. Thus, RR measurement is perceived as time-consuming. Clinical staff instead frequently approximate RR through brief observation.8-11
Given its clinical importance and widespread inaccuracy, we conducted a quality improvement (QI) initiative to improve RR accuracy.
METHODS
Design and Setting
We conducted an interdisciplinary QI initiative by using the plan–do–study–act (PDSA) methodology from July 2017 to February 2018. The initiative was set in a single adult 28-bed medical inpatient unit of a large, urban, safety-net hospital consisting of general internal medicine and hematology/oncology patients. Routine vital sign measurements on this unit occur at four- or six-hour intervals per physician orders and are performed by patient-care assistants (PCAs) who are nonregistered nursing support staff. PCAs use a vital signs cart equipped with automated tools to measure vital signs except for RR, which is manually assessed. PCAs are trained on vital sign measurements during a two-day onboarding orientation and four to six weeks of on-the-job training by experienced PCAs. PCAs are directly supervised by nursing operations managers. Formal continuing education programs for PCAs or performance audits of their clinical duties did not exist prior to our QI initiative.
Intervention
Intervention development addressing several important barriers and workflow inefficiencies was based on the direct observation of PCA workflow and information gathering by engaging stakeholders, including PCAs, nursing operations management, nursing leadership, and hospital administration (PDSA cycles 1-7 in Table). Our modified PCA vital sign workflow incorporated RR measurement during the approximate 30 seconds needed to complete automated blood pressure measurement as previously described.12 Nursing administration purchased three stopwatches (each $5 US) to attach to vital signs carts. One investigator (NK) participated in two monthly one-hour meetings, and three investigators (NK, KB, and SD) participated in 19 daily 15-minute huddles to conduct stakeholder engagement and educate and retrain PCAs on proper technique (total of 6.75 hours).
Evaluation
The primary aim of this QI initiative was to improve RR accuracy, which was evaluated using two distinct but complementary analyses: the prospective comparison of PCA-recorded RRs with gold-standard recorded RRs and the retrospective comparison of RRs recorded in electronic health records (EHR) on the intervention unit versus two control units. The secondary aims were to examine time to complete vital sign measurement and to assess whether the intervention was associated with a reduction in the incidence of SIRS specifically due to tachypnea.
Respiratory Rate Accuracy
PCA-recorded RRs were considered accurate if the RR was within ±2 breaths of a gold-standard RR measurement performed by a trained study member (NK or KB). We conducted gold-standard RR measurements for 100 observations pre- and postintervention within 30 minutes of PCA measurement to avoid Hawthorne bias.
We assessed the variability of recorded RRs in the EHR for all patients in the intervention unit as a proxy for accuracy. We hypothesized on the basis of prior research that improving the accuracy of RR measurement would increase the variability and normality of distribution in RRs.13 This is an approach that we have employed previously.7 The EHR cohort included consecutive hospitalizations by patients who were admitted to either the intervention unit or to one of two nonintervention general medicine inpatient units that served as concurrent controls. We grouped hospitalizations into a preintervention phase from March 1, 2017-July 22, 2017, a planning phase from July 23, 2017-December 3, 2017, and a postintervention phase from December 21, 2017-February 28, 2018. Hospitalizations during the two-week teaching phase from December 3, 2017-December 21, 2017 were excluded. We excluded vital signs obtained in the emergency department or in a location different from the patient’s admission unit. We qualitatively assessed RR distribution using histograms as we have done previously.7
We examined the distributions of RRs recorded in the EHR before and after intervention by individual PCAs on the intervention floor to assess for fidelity and adherence in the PCA uptake of the intervention.
Time
We compared the time to complete vital sign measurement among convenience samples of 50 unique observations pre- and postintervention using the Wilcoxon rank sum test.
SIRS Incidence
Since we hypothesized that improved RR accuracy would reduce falsely elevated RRs but have no impact on the other three SIRS criteria, we assessed changes in tachypnea-specific SIRS incidence, which was defined a priori as the presence of exactly two concurrent SIRS criteria, one of which was an elevated RR.3 We examined changes using a difference-in-differences approach with three different units of analysis (per vital sign measurement, hospital-day, and hospitalization; see footnote for Appendix Table 1 for methodological details. All analyses were conducted using STATA 12.0 (StataCorp, College Station, Texas).
RESULTS
Respiratory Rate Accuracy
Prior to the intervention, the median PCA RR was 18 (IQR 18-20) versus 12 (IQR 12-18) for the gold-standard RR (Appendix Figure 1), with only 36% of PCA measurements considered accurate. After the intervention, the median PCA-recorded RR was 14 (IQR 15-20) versus 14 (IQR 14-20) for the gold-standard RR and a RR accuracy of 58% (P < .001).
For our analyses on RR distribution using EHR data, we included 143,447 unique RRs (Appendix Table 2). After the intervention, the normality of the distribution of RRs on the intervention unit had increased, whereas those of RRs on the control units remained qualitatively similar pre- and postintervention (Appendix Figure 2).
Notable differences existed among the 11 individual PCAs (Figure) despite observing increased variability in PCA-recorded RRs postintervention. Some PCAs (numbers 2, 7, and 10) shifted their narrow RR interquartile range lower by several breaths/minute, whereas most other PCAs had a reduced median RR and widened interquartile range.
Time
Before the intervention, the median time to complete vital sign measurements was 2:36 (IQR 2:04-3:20). After the intervention, the time to complete vital signs decreased to 1:55 (IQR, 1:40-2:22; P < .001), which was 41 less seconds on average per vital sign set.
SIRS Incidence
The intervention was associated with a 3.3% reduction (95% CI, –6.4% to –0.005%) in tachypnea-specific SIRS incidence per hospital-day and a 7.8% reduction (95% CI, –13.5% to –2.2%) per hospitalization (Appendix Table 1). We also observed a modest reduction in overall SIRS incidence after the intervention (2.9% less per vital sign check, 4.6% less per hospital-day, and 3.2% less per hospitalization), although these reductions were not statistically significant.
DISCUSSION
Our QI initiative improved the absolute RR accuracy by 22%, saved PCAs 41 seconds on average per vital sign measurement, and decreased the absolute proportion of hospitalizations with tachypnea-specific SIRS by 7.8%. Our intervention is a novel, interdisciplinary, low-cost, low-effort, low-tech approach that addressed known challenges to accurate RR measurement,8,9,11 as well as the key barriers identified in our initial PDSA cycles. Our approach includes adding a time-keeping device to vital sign carts and standardizing a PCA vital sign workflow with increased efficiency. Lastly, this intervention is potentially scalable because stakeholder engagement, education, and retraining of the entire PCA staff for the unit required only 6.75 hours.
While our primary goal was to improve RR accuracy, our QI initiative also improved vital sign efficiency. By extrapolating our findings to an eight-hour PCA shift caring for eight patients who require vital sign checks every four hours, we estimated that our intervention would save approximately 16:24 minutes per PCA shift. This newfound time could be repurposed for other patient-care tasks or could be spent ensuring the accuracy of other vital signs given that accurate monitoring may be neglected because of time constraints.11 Additionally, the improvement in RR accuracy reduced falsely elevated RRs and thus lowered SIRS incidence specifically due to tachypnea. Given that EHR-based sepsis alerts are often based on SIRS criteria, improved RR accuracy may also improve alarm fatigue by reducing the rate of false-positive alerts.14
This initiative is not without limitations. Generalizability to other hospitals and even other units within the same hospital is uncertain. However, because this initiative was conducted within a safety-net hospital, we anticipate at least similar, if not increased, success in better-resourced hospitals. Second, the long-term durability of our intervention is unclear, although EHR RR variability remained steady for two months after our intervention (data not shown).
To ensure long-term sustainability and further improve RR accuracy, future PDSA cycles could include electing a PCA “vital signs champion” to reiterate the importance of RRs in clinical decision-making and ensure adherence to the modified workflow. Nursing champions act as persuasive change agents that disseminate and implement healthcare change,15 which may also be true of PCA champions. Additionally, future PDSA cycles can obviate the need for labor-intensive manual audits by leveraging EHR-based auditing to target education and retraining interventions to PCAs with minimal RR variability to optimize workflow adherence.
In conclusion, through a multipronged QI initiative we improved RR accuracy, increased the efficiency of vital sign measurement, and decreased SIRS incidence specifically due to tachypnea by reducing the number of falsely elevated RRs. This novel, low-cost, low-effort, low-tech approach can readily be implemented and disseminated in hospital inpatient settings.
Acknowledgments
The authors would like to acknowledge the meaningful contributions of Mr. Sudarshaan Pathak, RN, Ms. Shirly Koduvathu, RN, and Ms. Judy Herrington MSN, RN in this multidisciplinary initiative. We thank Mr. Christopher McKintosh, RN for his support in data acquisition. Lastly, the authors would like to acknowledge all of the patient-care assistants involved in this QI initiative.
Disclosures
Dr. Makam reports grants from NIA/NIH, during the conduct of the study. All other authors have nothing to disclose.
Funding
This work is supported in part by the Agency for Healthcare Research and Quality-funded UT Southwestern Center for Patient-Centered Outcomes Research (R24HS022418). OKN is funded by the National Heart, Lung, and Blood Institute (K23HL133441), and ANM is funded by the National Institute on Aging (K23AG052603).
Respiratory rate (RR) is an essential vital sign that is routinely measured for hospitalized adults. It is a strong predictor of adverse events.1,2 Therefore, RR is a key component of several widely used risk prediction scores, including the systemic inflammatory response syndrome (SIRS).3
Despite its clinical utility, RR is inaccurately measured.4-7 One reason for the inaccurate measurement of RR is that RR measurement, in contrast to that of other vital signs, is not automated. The gold-standard technique for measuring RR is the visual assessment of a resting patient. Thus, RR measurement is perceived as time-consuming. Clinical staff instead frequently approximate RR through brief observation.8-11
Given its clinical importance and widespread inaccuracy, we conducted a quality improvement (QI) initiative to improve RR accuracy.
METHODS
Design and Setting
We conducted an interdisciplinary QI initiative by using the plan–do–study–act (PDSA) methodology from July 2017 to February 2018. The initiative was set in a single adult 28-bed medical inpatient unit of a large, urban, safety-net hospital consisting of general internal medicine and hematology/oncology patients. Routine vital sign measurements on this unit occur at four- or six-hour intervals per physician orders and are performed by patient-care assistants (PCAs) who are nonregistered nursing support staff. PCAs use a vital signs cart equipped with automated tools to measure vital signs except for RR, which is manually assessed. PCAs are trained on vital sign measurements during a two-day onboarding orientation and four to six weeks of on-the-job training by experienced PCAs. PCAs are directly supervised by nursing operations managers. Formal continuing education programs for PCAs or performance audits of their clinical duties did not exist prior to our QI initiative.
Intervention
Intervention development addressing several important barriers and workflow inefficiencies was based on the direct observation of PCA workflow and information gathering by engaging stakeholders, including PCAs, nursing operations management, nursing leadership, and hospital administration (PDSA cycles 1-7 in Table). Our modified PCA vital sign workflow incorporated RR measurement during the approximate 30 seconds needed to complete automated blood pressure measurement as previously described.12 Nursing administration purchased three stopwatches (each $5 US) to attach to vital signs carts. One investigator (NK) participated in two monthly one-hour meetings, and three investigators (NK, KB, and SD) participated in 19 daily 15-minute huddles to conduct stakeholder engagement and educate and retrain PCAs on proper technique (total of 6.75 hours).
Evaluation
The primary aim of this QI initiative was to improve RR accuracy, which was evaluated using two distinct but complementary analyses: the prospective comparison of PCA-recorded RRs with gold-standard recorded RRs and the retrospective comparison of RRs recorded in electronic health records (EHR) on the intervention unit versus two control units. The secondary aims were to examine time to complete vital sign measurement and to assess whether the intervention was associated with a reduction in the incidence of SIRS specifically due to tachypnea.
Respiratory Rate Accuracy
PCA-recorded RRs were considered accurate if the RR was within ±2 breaths of a gold-standard RR measurement performed by a trained study member (NK or KB). We conducted gold-standard RR measurements for 100 observations pre- and postintervention within 30 minutes of PCA measurement to avoid Hawthorne bias.
We assessed the variability of recorded RRs in the EHR for all patients in the intervention unit as a proxy for accuracy. We hypothesized on the basis of prior research that improving the accuracy of RR measurement would increase the variability and normality of distribution in RRs.13 This is an approach that we have employed previously.7 The EHR cohort included consecutive hospitalizations by patients who were admitted to either the intervention unit or to one of two nonintervention general medicine inpatient units that served as concurrent controls. We grouped hospitalizations into a preintervention phase from March 1, 2017-July 22, 2017, a planning phase from July 23, 2017-December 3, 2017, and a postintervention phase from December 21, 2017-February 28, 2018. Hospitalizations during the two-week teaching phase from December 3, 2017-December 21, 2017 were excluded. We excluded vital signs obtained in the emergency department or in a location different from the patient’s admission unit. We qualitatively assessed RR distribution using histograms as we have done previously.7
We examined the distributions of RRs recorded in the EHR before and after intervention by individual PCAs on the intervention floor to assess for fidelity and adherence in the PCA uptake of the intervention.
Time
We compared the time to complete vital sign measurement among convenience samples of 50 unique observations pre- and postintervention using the Wilcoxon rank sum test.
SIRS Incidence
Since we hypothesized that improved RR accuracy would reduce falsely elevated RRs but have no impact on the other three SIRS criteria, we assessed changes in tachypnea-specific SIRS incidence, which was defined a priori as the presence of exactly two concurrent SIRS criteria, one of which was an elevated RR.3 We examined changes using a difference-in-differences approach with three different units of analysis (per vital sign measurement, hospital-day, and hospitalization; see footnote for Appendix Table 1 for methodological details. All analyses were conducted using STATA 12.0 (StataCorp, College Station, Texas).
RESULTS
Respiratory Rate Accuracy
Prior to the intervention, the median PCA RR was 18 (IQR 18-20) versus 12 (IQR 12-18) for the gold-standard RR (Appendix Figure 1), with only 36% of PCA measurements considered accurate. After the intervention, the median PCA-recorded RR was 14 (IQR 15-20) versus 14 (IQR 14-20) for the gold-standard RR and a RR accuracy of 58% (P < .001).
For our analyses on RR distribution using EHR data, we included 143,447 unique RRs (Appendix Table 2). After the intervention, the normality of the distribution of RRs on the intervention unit had increased, whereas those of RRs on the control units remained qualitatively similar pre- and postintervention (Appendix Figure 2).
Notable differences existed among the 11 individual PCAs (Figure) despite observing increased variability in PCA-recorded RRs postintervention. Some PCAs (numbers 2, 7, and 10) shifted their narrow RR interquartile range lower by several breaths/minute, whereas most other PCAs had a reduced median RR and widened interquartile range.
Time
Before the intervention, the median time to complete vital sign measurements was 2:36 (IQR 2:04-3:20). After the intervention, the time to complete vital signs decreased to 1:55 (IQR, 1:40-2:22; P < .001), which was 41 less seconds on average per vital sign set.
SIRS Incidence
The intervention was associated with a 3.3% reduction (95% CI, –6.4% to –0.005%) in tachypnea-specific SIRS incidence per hospital-day and a 7.8% reduction (95% CI, –13.5% to –2.2%) per hospitalization (Appendix Table 1). We also observed a modest reduction in overall SIRS incidence after the intervention (2.9% less per vital sign check, 4.6% less per hospital-day, and 3.2% less per hospitalization), although these reductions were not statistically significant.
DISCUSSION
Our QI initiative improved the absolute RR accuracy by 22%, saved PCAs 41 seconds on average per vital sign measurement, and decreased the absolute proportion of hospitalizations with tachypnea-specific SIRS by 7.8%. Our intervention is a novel, interdisciplinary, low-cost, low-effort, low-tech approach that addressed known challenges to accurate RR measurement,8,9,11 as well as the key barriers identified in our initial PDSA cycles. Our approach includes adding a time-keeping device to vital sign carts and standardizing a PCA vital sign workflow with increased efficiency. Lastly, this intervention is potentially scalable because stakeholder engagement, education, and retraining of the entire PCA staff for the unit required only 6.75 hours.
While our primary goal was to improve RR accuracy, our QI initiative also improved vital sign efficiency. By extrapolating our findings to an eight-hour PCA shift caring for eight patients who require vital sign checks every four hours, we estimated that our intervention would save approximately 16:24 minutes per PCA shift. This newfound time could be repurposed for other patient-care tasks or could be spent ensuring the accuracy of other vital signs given that accurate monitoring may be neglected because of time constraints.11 Additionally, the improvement in RR accuracy reduced falsely elevated RRs and thus lowered SIRS incidence specifically due to tachypnea. Given that EHR-based sepsis alerts are often based on SIRS criteria, improved RR accuracy may also improve alarm fatigue by reducing the rate of false-positive alerts.14
This initiative is not without limitations. Generalizability to other hospitals and even other units within the same hospital is uncertain. However, because this initiative was conducted within a safety-net hospital, we anticipate at least similar, if not increased, success in better-resourced hospitals. Second, the long-term durability of our intervention is unclear, although EHR RR variability remained steady for two months after our intervention (data not shown).
To ensure long-term sustainability and further improve RR accuracy, future PDSA cycles could include electing a PCA “vital signs champion” to reiterate the importance of RRs in clinical decision-making and ensure adherence to the modified workflow. Nursing champions act as persuasive change agents that disseminate and implement healthcare change,15 which may also be true of PCA champions. Additionally, future PDSA cycles can obviate the need for labor-intensive manual audits by leveraging EHR-based auditing to target education and retraining interventions to PCAs with minimal RR variability to optimize workflow adherence.
In conclusion, through a multipronged QI initiative we improved RR accuracy, increased the efficiency of vital sign measurement, and decreased SIRS incidence specifically due to tachypnea by reducing the number of falsely elevated RRs. This novel, low-cost, low-effort, low-tech approach can readily be implemented and disseminated in hospital inpatient settings.
Acknowledgments
The authors would like to acknowledge the meaningful contributions of Mr. Sudarshaan Pathak, RN, Ms. Shirly Koduvathu, RN, and Ms. Judy Herrington MSN, RN in this multidisciplinary initiative. We thank Mr. Christopher McKintosh, RN for his support in data acquisition. Lastly, the authors would like to acknowledge all of the patient-care assistants involved in this QI initiative.
Disclosures
Dr. Makam reports grants from NIA/NIH, during the conduct of the study. All other authors have nothing to disclose.
Funding
This work is supported in part by the Agency for Healthcare Research and Quality-funded UT Southwestern Center for Patient-Centered Outcomes Research (R24HS022418). OKN is funded by the National Heart, Lung, and Blood Institute (K23HL133441), and ANM is funded by the National Institute on Aging (K23AG052603).
1. Fieselmann JF, Hendryx MS, Helms CM, Wakefield DS. Respiratory rate predicts cardiopulmonary arrest for internal medicine inpatients. J Gen Intern Med. 1993;8(7):354-360. https://doi.org/10.1007/BF02600071.
2. Hodgetts TJ, Kenward G, Vlachonikolis IG, Payne S, Castle N. The identification of risk factors for cardiac arrest and formulation of activation criteria to alert a medical emergency team. Resuscitation. 2002;54(2):125-131. https://doi.org/10.1016/S0300-9572(02)00100-4.
3. Bone RC, Sibbald WJ, Sprung CL. The ACCP-SCCM consensus conference on sepsis and organ failure. Chest. 1992;101(6):1481-1483.
4. Lovett PB, Buchwald JM, Sturmann K, Bijur P. The vexatious vital: neither clinical measurements by nurses nor an electronic monitor provides accurate measurements of respiratory rate in triage. Ann Emerg Med. 2005;45(1):68-76. https://doi.org/10.1016/j.annemergmed.2004.06.016.
5. Chen J, Hillman K, Bellomo R, et al. The impact of introducing medical emergency team system on the documentations of vital signs. Resuscitation. 2009;80(1):35-43. https://doi.org/10.1016/j.resuscitation.2008.10.009.
6. Leuvan CH, Mitchell I. Missed opportunities? An observational study of vital sign measurements. Crit Care Resusc. 2008;10(2):111-115.
7. Badawy J, Nguyen OK, Clark C, Halm EA, Makam AN. Is everyone really breathing 20 times a minute? Assessing epidemiology and variation in recorded respiratory rate in hospitalised adults. BMJ Qual Saf. 2017;26(10):832-836. https://doi.org/10.1136/bmjqs-2017-006671.
8. Chua WL, Mackey S, Ng EK, Liaw SY. Front line nurses’ experiences with deteriorating ward patients: a qualitative study. Int Nurs Rev. 2013;60(4):501-509. https://doi.org/10.1111/inr.12061.
9. De Meester K, Van Bogaert P, Clarke SP, Bossaert L. In-hospital mortality after serious adverse events on medical and surgical nursing units: a mixed methods study. J Clin Nurs. 2013;22(15-16):2308-2317. https://doi.org/10.1111/j.1365-2702.2012.04154.x.
10. Cheng AC, Black JF, Buising KL. Respiratory rate: the neglected vital sign. Med J Aust. 2008;189(9):531. https://doi.org/10.5694/j.1326-5377.2008.tb02163.x.
11. Mok W, Wang W, Cooper S, Ang EN, Liaw SY. Attitudes towards vital signs monitoring in the detection of clinical deterioration: scale development and survey of ward nurses. Int J Qual Health Care. 2015;27(3):207-213. https://doi.org/10.1093/intqhc/mzv019.
12. Keshvani N, Berger K, Nguyen OK, Makam AN. Roadmap for improving the accuracy of respiratory rate measurements. BMJ Qual Saf. 2018;27(8):e5. https://doi.org/10.1136/bmjqs-2017-007516.
13. Semler MW, Stover DG, Copland AP, et al. Flash mob research: a single-day, multicenter, resident-directed study of respiratory rate. Chest. 2013;143(6):1740-1744. https://doi.org/10.1378/chest.12-1837.
14. Makam AN, Nguyen OK, Auerbach AD. Diagnostic accuracy and effectiveness of automated electronic sepsis alert systems: a systematic review. J Hosp Med. 2015;10(6):396-402. https://doi.org/10.1002/jhm.2347.
15. Ploeg J, Skelly J, Rowan M, et al. The role of nursing best practice champions in diffusing practice guidelines: a mixed methods study. Worldviews Evid Based Nurs. 2010;7(4):238-251. https://doi.org/10.1111/j.1741-6787.2010.00202.x.
1. Fieselmann JF, Hendryx MS, Helms CM, Wakefield DS. Respiratory rate predicts cardiopulmonary arrest for internal medicine inpatients. J Gen Intern Med. 1993;8(7):354-360. https://doi.org/10.1007/BF02600071.
2. Hodgetts TJ, Kenward G, Vlachonikolis IG, Payne S, Castle N. The identification of risk factors for cardiac arrest and formulation of activation criteria to alert a medical emergency team. Resuscitation. 2002;54(2):125-131. https://doi.org/10.1016/S0300-9572(02)00100-4.
3. Bone RC, Sibbald WJ, Sprung CL. The ACCP-SCCM consensus conference on sepsis and organ failure. Chest. 1992;101(6):1481-1483.
4. Lovett PB, Buchwald JM, Sturmann K, Bijur P. The vexatious vital: neither clinical measurements by nurses nor an electronic monitor provides accurate measurements of respiratory rate in triage. Ann Emerg Med. 2005;45(1):68-76. https://doi.org/10.1016/j.annemergmed.2004.06.016.
5. Chen J, Hillman K, Bellomo R, et al. The impact of introducing medical emergency team system on the documentations of vital signs. Resuscitation. 2009;80(1):35-43. https://doi.org/10.1016/j.resuscitation.2008.10.009.
6. Leuvan CH, Mitchell I. Missed opportunities? An observational study of vital sign measurements. Crit Care Resusc. 2008;10(2):111-115.
7. Badawy J, Nguyen OK, Clark C, Halm EA, Makam AN. Is everyone really breathing 20 times a minute? Assessing epidemiology and variation in recorded respiratory rate in hospitalised adults. BMJ Qual Saf. 2017;26(10):832-836. https://doi.org/10.1136/bmjqs-2017-006671.
8. Chua WL, Mackey S, Ng EK, Liaw SY. Front line nurses’ experiences with deteriorating ward patients: a qualitative study. Int Nurs Rev. 2013;60(4):501-509. https://doi.org/10.1111/inr.12061.
9. De Meester K, Van Bogaert P, Clarke SP, Bossaert L. In-hospital mortality after serious adverse events on medical and surgical nursing units: a mixed methods study. J Clin Nurs. 2013;22(15-16):2308-2317. https://doi.org/10.1111/j.1365-2702.2012.04154.x.
10. Cheng AC, Black JF, Buising KL. Respiratory rate: the neglected vital sign. Med J Aust. 2008;189(9):531. https://doi.org/10.5694/j.1326-5377.2008.tb02163.x.
11. Mok W, Wang W, Cooper S, Ang EN, Liaw SY. Attitudes towards vital signs monitoring in the detection of clinical deterioration: scale development and survey of ward nurses. Int J Qual Health Care. 2015;27(3):207-213. https://doi.org/10.1093/intqhc/mzv019.
12. Keshvani N, Berger K, Nguyen OK, Makam AN. Roadmap for improving the accuracy of respiratory rate measurements. BMJ Qual Saf. 2018;27(8):e5. https://doi.org/10.1136/bmjqs-2017-007516.
13. Semler MW, Stover DG, Copland AP, et al. Flash mob research: a single-day, multicenter, resident-directed study of respiratory rate. Chest. 2013;143(6):1740-1744. https://doi.org/10.1378/chest.12-1837.
14. Makam AN, Nguyen OK, Auerbach AD. Diagnostic accuracy and effectiveness of automated electronic sepsis alert systems: a systematic review. J Hosp Med. 2015;10(6):396-402. https://doi.org/10.1002/jhm.2347.
15. Ploeg J, Skelly J, Rowan M, et al. The role of nursing best practice champions in diffusing practice guidelines: a mixed methods study. Worldviews Evid Based Nurs. 2010;7(4):238-251. https://doi.org/10.1111/j.1741-6787.2010.00202.x.
© 2019 Society of Hospital Medicine
Adverse Events Experienced by Patients Hospitalized without Definite Medical Acuity: A Retrospective Cohort Study
Evidence exists that physicians consider what may be called “social” or “nonmedical” factors (lack of social support or barriers to access) in hospital admission decision-making and that patients are hospitalized even in the absence of a level of medical acuity warranting admission.1-3 Although hospitalization is associated with the risk of adverse events (AEs),4 whether this risk is related to the medical acuity of admission remains unclear. Our study sought to quantify the AEs experienced by patients hospitalized without definite medical acuity compared with those experienced by patients hospitalized with a definite medically appropriate indication for admission.
METHODS
Setting and Database Used for Analysis
This study was conducted at an urban, safety-net, public teaching hospital. At our site, calls for medical admissions are always answered by a hospital medicine attending physician (“triage physician”) who works collaboratively with the referring physician to facilitate appropriate disposition. Many of these discussions occur via telephone, but the triage physician may also assess the patient directly if needed. This study involved 24 triage physicians who directly assessed the patient in 65% of the cases.
At the time of each admission call, the triage physician logs the following information into a central triage database: date and time of call, patient location, reason for admission, assessment of appropriateness for medical floor, contributing factors to admission decision-making, and patient disposition.
Admission Appropriateness Group Designation
To be considered for inclusion in this study, calls must have originated from the emergency department and resulted in admission to the general medicine floor on either a resident teaching or hospitalist service from February 1, 2018 to June 1, 2018. This time frame was selected to avoid the start of a new academic cycle in late June that may confound AE rates.
The designation of appropriateness was determined by the triage physician’s logged response to triage database questions at the time of the admission call. Of the 748 admissions meeting inclusion criteria, 513 (68.6%) were considered definitely appropriate on the basis of the triage physician’s response to the question “Based ONLY on the medical reason for hospitalization, in your opinion, how appropriate is this admission to the medicine floor service?” Furthermore, 169 (22.6%) were considered without definite medical acuity on the basis of the triage physician’s indication that “severity of medical problems alone may not require inpatient hospitalization” (Appendix Figure 1).
Study Design
Following a retrospective cohort study design, we systematically sampled 150 admissions from those “admitted without definite medical acuity” to create the exposure group and 150 from the “definitely medically appropriate” admissions to create the nonexposure group. Our sampling method involved selecting every third record until reaching the target sample size. This method and group sizes were determined prior to beginning data collection. Given the expected incidence of 33% AEs in the unexposed group (consistent with previous reports of AEs using the trigger tool5), we anticipated that a total sample size of 300 would be appropriate to capture a relative risk of at least 1.5 with 80% power and 95% confidence level.
Chart review was performed to capture patient demographics, admission characteristics, and hospitalization outcomes. We captured emergency severity index (ESI)6, a validated, reliable triage assessment score assigned by our emergency department, as a measurement of acute illness and calculated the Charlson comorbidity index (CCI)7 as a measurement of chronic comorbidity.
Identification of Adverse Events
We measured AEs by using the Institute for Healthcare Improvement Global Trigger Tool,8,9 which is estimated to identify up to 10 times more AEs than other methods, such as voluntary reporting.5 This protocol includes 28 triggers in the Cares and Medication Modules that serve as indicators that an AE may have occurred. The presence of a trigger is not necessarily an AE but a clue for further analysis. Two investigators (AS and CS) independently systematically searched for the presence of triggers within each patient chart. Trigger identification prompted in-depth analysis to confirm the occurrence of an AE and to characterize its severity by using the National Coordinating Council for Medication Error Reporting and Prevention categorization.10 An AE was coded when independent reviewers identified evidence of a preventable or nonpreventable “noxious and unintended event occurring in association with medical care.”9 By definition, any AEs identified were patient harms. Findings were reviewed weekly to ensure agreement, and discrepancies were adjudicated by a third investigator (MB).
All study data were collected by using REDCap electronic data capture tools hosted at the University of Washington.11 The University of Washington Institutional Review Board granted approval for this study.
Study Outcome and Statistical Analysis
The primary outcome was AEs per group with results calculated in three ways: AEs per 1,000 patient-days, AEs per 100 admissions, and percent of admissions with an AE. The risk ratio (RR) for the percent of admissions with an AE and the incidence rate ratio (IRR) for AEs per 1,000 patient-days were calculated for the comparison of significance.
Other data were analyzed by using Pearson’s chi square for categorical data, Student t test for normally distributed quantitative data, and Wilcoxon rank-sum (Mann–Whitney) for the length of stay (due to skew). Analyses were conducted using STATA (version 15.1, College Station, TX).
This work follows standards for reporting observational students as outlined in the STROBE statement.12
RESULTS
Patient Demographics
Both groups were predominantly white/non-Hispanic, male, and English-speaking (Table 1). More patients without definite medical acuity were covered by public insurance (78.9% vs 69.8%, P = .010) and discharged to homelessness (34.8% vs 22.6%, P = .041).
Measures of Illness
Patients considered definitely medically appropriate had lower ESI scores, indicative of more acute presentation, than those without definite medical acuity (2.73 [95% CI 2.64-2.81] vs 2.87 [95% CI 2.78-2.95], P = .026). There was no difference in CCI scores (Table 1).
Reason for Admission and Outcomes
Admissions considered definitely medically appropriate more frequently had an identified diagnosis/syndrome (66% vs 53%) or objective measurement (8.7% vs 2.7%) listed as the reason for admission, whereas patients admitted without definite medical acuity more freuqently had undifferentiated symptoms (34.7% vs 24%) or other/disposition (6% vs 1.3%) listed. The most common factors that triage physicians cited as contributing to the decision to admit patients without definite medical acuity included homelessness (34%), lack of outpatient social support (32%), and substance use disorder (25%). More details are available in Appendix Tables 1 and 2.
Admissions without definite medical acuity were longer than those with definite medical acuity (6.6 vs 6.0 days, P = .038), but there was no difference in emergency department readmissions within 48 hours or hospital readmissions within 30 days (Table 1).
Adverse Events
We identified 76 AEs in 41 admissions without definite medical acuity (range 0-10 AEs per admission) and 63 AEs in 44 definitely medically appropriate admissions (range 0-4 AEs per admission). The percentage of admissions with AE (27.3% vs 29.3%; RR 0.93, 95% CI 0.65-1.34, P = .70) and the rate of AE/1,000 patient-days (76.8 vs 70.4; IRR 1.09, 95% CI 0.77-1.55, P = .61) did not show statistically significant differences. The distribution of AE severity was similar between the two groups (Table 2). Most identified AEs caused temporary harm to the patient and were rated at severity levels E or F. Severe AEs, including at least one level I (patient death), occurred in both groups. The complete listing of positive triggers leading to adverse event identification by group and severity is available in Appendix Table 3.
DISCUSSION
By using a robust, standardized method, we found that patients admitted without definite medical acuity experienced the same number of inpatient AEs as patients admitted for definitely medically appropriate reasons. While the groups were relatively similar overall in terms of demographics and chronic comorbidity, we found evidence of social vulnerability in the group admitted without definite medical acuity in the form of increased rates of homelessness, triage physician concern regarding the lack of outpatient social support, and disposition-related reasons for admission. That both groups suffered harm―including patient death―while admitted to the hospital is striking, in particular for those patients who were admitted because of the lack of suitable outpatient options.
The potential limitations to the generalizability of this work include the single-site, safety-net setting and the use of individual physician determination of admission appropriateness. The proportion of admissions without definite medical acuity reported here is similar to that reported by previously published admission decision-making studies,2,3 and the rate of AEs observed is similar to rates measured in other studies using the trigger tool methodology.5,13 These similarities suggest some commonality across settings. Our study treats triage physician assessment as the marker of difference in defining the two groups and is an inherently subjective assessment that is reflective of real-world, holistic decision-making. Notably, the triage physician assessment was corroborated by corresponding differences in the ESI score, an acute triage assessment completed by a clinician outside of our team.
This study adds foundational knowledge to the risk/benefit discussion surrounding the decision to admit. Physician admission decisions are likely influenced by concern for the safety of vulnerable patients. Our results suggest that considering the risk of hospitalization itself in this decision-making remains important.
1. Mushlin AI, Appel FA. Extramedical factors in the decision to hospitalize medical patients. Am J Public Health. 1976;66(2):170-172. https://doi.org/10.2105/AJPH.66.2.170.
2. Lewis Hunter AE, Spatz ES, Bernstein SL, Rosenthal MS. Factors influencing hospital admission of noncritically ill patients presenting to the emergency department: a cross-sectional study. J Gen Intern Med. 2016;31(1):37-44. https://doi.org/10.1007/s11606-015-3438-8.
3. Pope I, Burn H, Ismail SA, Harris T, McCoy D. A qualitative study exploring the factors influencing admission to hospital from the emergency department. BMJ Open. 2017;7(8):e011543. https://doi.org/10.1136/bmjopen-2016-011543.
4. Levinson DR. Adverse Events in Hospitals: National Incidence among Medicare Beneficiaries. 2010. https://oig.hhs.gov/oei/reports/oei-06-09-00090.pdf. Accessed May 20, 2019.
5. Classen DC, Resar R, Griffin F, et al. ‘Global trigger tool’ shows that adverse events in hospitals may be ten times greater than previously measured. Health Aff (Millwood). 2011;30(4):581-589. https://doi.org/10.1377/hlthaff.2011.0190.
6. Wuerz RC, Milne LW, Eitel DR, Travers D, Gilboy N. Reliability and validity of a new five-level triage instrument. Acad Emerg Med. 2000;7(3):236-242.https://doi.org/10.1111/j.1553-2712.2000.tb01066.x.
7. Charlson ME, Pompei P, Ales KL, MacKenzie CR. A new method of classifying prognostic comorbidity in longitudinal studies: development and validation. J Chron Dis. 1987;40:373-383. https://doi.org/10.1016/0021-9681(87)90171-8.
8. Resar RK, Rozich JD, Classen D. Methodology and rationale for the measurement of harm with trigger tools. Qual Saf Health Care. 2003;12(2):ii39-ii45. https://doi.org/10.1136/qhc.12.suppl_2.ii39.
9. Griffen FA, Resar RK. IHI Global Trigger Tool for Measuring Adverse Events (Second Edition). Cambridge, Massachusetts: Institute for Healthcare Improvement; 2009.
10. National Coordinating Council for Medication Error Reporting and Prevention (NCC MERP) Index for Categorizing Errors. https://www.nccmerp.org/types-medication-errors Accessed May 20, 2019.
11. Harris PA, Taylor R, Thielke R, Payne J, Gonzalez N, Conde JG. Research electronic data capture (REDCap)--a metadata-driven methodology and workflow process for providing translational research informatics support. J Biomed Inform. 2009;42(2):377-381. https://doi.org/10.1016/j.jbi.2008.08.010.
12. von Elm E, Altman DG, Egger M, Pocock SJ, Gøtzsche PC, Vandenbroucke JP. The Strengthening the Reporting of Observational Studies in Epidemiology (STROBE) statement: guidelines for reporting observational studies. Ann Intern Med. 2007;147(8):573-577.
13. Kennerly DA, Kudyakov R, da Graca B, et al. Characterization of adverse events detected in a large health care delivery system using an enhanced global trigger tool over a five-year interval. Health Serv Res. 2014;49(5):1407-1425. https://doi.org/10.1111/1475-6773.12163.
Evidence exists that physicians consider what may be called “social” or “nonmedical” factors (lack of social support or barriers to access) in hospital admission decision-making and that patients are hospitalized even in the absence of a level of medical acuity warranting admission.1-3 Although hospitalization is associated with the risk of adverse events (AEs),4 whether this risk is related to the medical acuity of admission remains unclear. Our study sought to quantify the AEs experienced by patients hospitalized without definite medical acuity compared with those experienced by patients hospitalized with a definite medically appropriate indication for admission.
METHODS
Setting and Database Used for Analysis
This study was conducted at an urban, safety-net, public teaching hospital. At our site, calls for medical admissions are always answered by a hospital medicine attending physician (“triage physician”) who works collaboratively with the referring physician to facilitate appropriate disposition. Many of these discussions occur via telephone, but the triage physician may also assess the patient directly if needed. This study involved 24 triage physicians who directly assessed the patient in 65% of the cases.
At the time of each admission call, the triage physician logs the following information into a central triage database: date and time of call, patient location, reason for admission, assessment of appropriateness for medical floor, contributing factors to admission decision-making, and patient disposition.
Admission Appropriateness Group Designation
To be considered for inclusion in this study, calls must have originated from the emergency department and resulted in admission to the general medicine floor on either a resident teaching or hospitalist service from February 1, 2018 to June 1, 2018. This time frame was selected to avoid the start of a new academic cycle in late June that may confound AE rates.
The designation of appropriateness was determined by the triage physician’s logged response to triage database questions at the time of the admission call. Of the 748 admissions meeting inclusion criteria, 513 (68.6%) were considered definitely appropriate on the basis of the triage physician’s response to the question “Based ONLY on the medical reason for hospitalization, in your opinion, how appropriate is this admission to the medicine floor service?” Furthermore, 169 (22.6%) were considered without definite medical acuity on the basis of the triage physician’s indication that “severity of medical problems alone may not require inpatient hospitalization” (Appendix Figure 1).
Study Design
Following a retrospective cohort study design, we systematically sampled 150 admissions from those “admitted without definite medical acuity” to create the exposure group and 150 from the “definitely medically appropriate” admissions to create the nonexposure group. Our sampling method involved selecting every third record until reaching the target sample size. This method and group sizes were determined prior to beginning data collection. Given the expected incidence of 33% AEs in the unexposed group (consistent with previous reports of AEs using the trigger tool5), we anticipated that a total sample size of 300 would be appropriate to capture a relative risk of at least 1.5 with 80% power and 95% confidence level.
Chart review was performed to capture patient demographics, admission characteristics, and hospitalization outcomes. We captured emergency severity index (ESI)6, a validated, reliable triage assessment score assigned by our emergency department, as a measurement of acute illness and calculated the Charlson comorbidity index (CCI)7 as a measurement of chronic comorbidity.
Identification of Adverse Events
We measured AEs by using the Institute for Healthcare Improvement Global Trigger Tool,8,9 which is estimated to identify up to 10 times more AEs than other methods, such as voluntary reporting.5 This protocol includes 28 triggers in the Cares and Medication Modules that serve as indicators that an AE may have occurred. The presence of a trigger is not necessarily an AE but a clue for further analysis. Two investigators (AS and CS) independently systematically searched for the presence of triggers within each patient chart. Trigger identification prompted in-depth analysis to confirm the occurrence of an AE and to characterize its severity by using the National Coordinating Council for Medication Error Reporting and Prevention categorization.10 An AE was coded when independent reviewers identified evidence of a preventable or nonpreventable “noxious and unintended event occurring in association with medical care.”9 By definition, any AEs identified were patient harms. Findings were reviewed weekly to ensure agreement, and discrepancies were adjudicated by a third investigator (MB).
All study data were collected by using REDCap electronic data capture tools hosted at the University of Washington.11 The University of Washington Institutional Review Board granted approval for this study.
Study Outcome and Statistical Analysis
The primary outcome was AEs per group with results calculated in three ways: AEs per 1,000 patient-days, AEs per 100 admissions, and percent of admissions with an AE. The risk ratio (RR) for the percent of admissions with an AE and the incidence rate ratio (IRR) for AEs per 1,000 patient-days were calculated for the comparison of significance.
Other data were analyzed by using Pearson’s chi square for categorical data, Student t test for normally distributed quantitative data, and Wilcoxon rank-sum (Mann–Whitney) for the length of stay (due to skew). Analyses were conducted using STATA (version 15.1, College Station, TX).
This work follows standards for reporting observational students as outlined in the STROBE statement.12
RESULTS
Patient Demographics
Both groups were predominantly white/non-Hispanic, male, and English-speaking (Table 1). More patients without definite medical acuity were covered by public insurance (78.9% vs 69.8%, P = .010) and discharged to homelessness (34.8% vs 22.6%, P = .041).
Measures of Illness
Patients considered definitely medically appropriate had lower ESI scores, indicative of more acute presentation, than those without definite medical acuity (2.73 [95% CI 2.64-2.81] vs 2.87 [95% CI 2.78-2.95], P = .026). There was no difference in CCI scores (Table 1).
Reason for Admission and Outcomes
Admissions considered definitely medically appropriate more frequently had an identified diagnosis/syndrome (66% vs 53%) or objective measurement (8.7% vs 2.7%) listed as the reason for admission, whereas patients admitted without definite medical acuity more freuqently had undifferentiated symptoms (34.7% vs 24%) or other/disposition (6% vs 1.3%) listed. The most common factors that triage physicians cited as contributing to the decision to admit patients without definite medical acuity included homelessness (34%), lack of outpatient social support (32%), and substance use disorder (25%). More details are available in Appendix Tables 1 and 2.
Admissions without definite medical acuity were longer than those with definite medical acuity (6.6 vs 6.0 days, P = .038), but there was no difference in emergency department readmissions within 48 hours or hospital readmissions within 30 days (Table 1).
Adverse Events
We identified 76 AEs in 41 admissions without definite medical acuity (range 0-10 AEs per admission) and 63 AEs in 44 definitely medically appropriate admissions (range 0-4 AEs per admission). The percentage of admissions with AE (27.3% vs 29.3%; RR 0.93, 95% CI 0.65-1.34, P = .70) and the rate of AE/1,000 patient-days (76.8 vs 70.4; IRR 1.09, 95% CI 0.77-1.55, P = .61) did not show statistically significant differences. The distribution of AE severity was similar between the two groups (Table 2). Most identified AEs caused temporary harm to the patient and were rated at severity levels E or F. Severe AEs, including at least one level I (patient death), occurred in both groups. The complete listing of positive triggers leading to adverse event identification by group and severity is available in Appendix Table 3.
DISCUSSION
By using a robust, standardized method, we found that patients admitted without definite medical acuity experienced the same number of inpatient AEs as patients admitted for definitely medically appropriate reasons. While the groups were relatively similar overall in terms of demographics and chronic comorbidity, we found evidence of social vulnerability in the group admitted without definite medical acuity in the form of increased rates of homelessness, triage physician concern regarding the lack of outpatient social support, and disposition-related reasons for admission. That both groups suffered harm―including patient death―while admitted to the hospital is striking, in particular for those patients who were admitted because of the lack of suitable outpatient options.
The potential limitations to the generalizability of this work include the single-site, safety-net setting and the use of individual physician determination of admission appropriateness. The proportion of admissions without definite medical acuity reported here is similar to that reported by previously published admission decision-making studies,2,3 and the rate of AEs observed is similar to rates measured in other studies using the trigger tool methodology.5,13 These similarities suggest some commonality across settings. Our study treats triage physician assessment as the marker of difference in defining the two groups and is an inherently subjective assessment that is reflective of real-world, holistic decision-making. Notably, the triage physician assessment was corroborated by corresponding differences in the ESI score, an acute triage assessment completed by a clinician outside of our team.
This study adds foundational knowledge to the risk/benefit discussion surrounding the decision to admit. Physician admission decisions are likely influenced by concern for the safety of vulnerable patients. Our results suggest that considering the risk of hospitalization itself in this decision-making remains important.
Evidence exists that physicians consider what may be called “social” or “nonmedical” factors (lack of social support or barriers to access) in hospital admission decision-making and that patients are hospitalized even in the absence of a level of medical acuity warranting admission.1-3 Although hospitalization is associated with the risk of adverse events (AEs),4 whether this risk is related to the medical acuity of admission remains unclear. Our study sought to quantify the AEs experienced by patients hospitalized without definite medical acuity compared with those experienced by patients hospitalized with a definite medically appropriate indication for admission.
METHODS
Setting and Database Used for Analysis
This study was conducted at an urban, safety-net, public teaching hospital. At our site, calls for medical admissions are always answered by a hospital medicine attending physician (“triage physician”) who works collaboratively with the referring physician to facilitate appropriate disposition. Many of these discussions occur via telephone, but the triage physician may also assess the patient directly if needed. This study involved 24 triage physicians who directly assessed the patient in 65% of the cases.
At the time of each admission call, the triage physician logs the following information into a central triage database: date and time of call, patient location, reason for admission, assessment of appropriateness for medical floor, contributing factors to admission decision-making, and patient disposition.
Admission Appropriateness Group Designation
To be considered for inclusion in this study, calls must have originated from the emergency department and resulted in admission to the general medicine floor on either a resident teaching or hospitalist service from February 1, 2018 to June 1, 2018. This time frame was selected to avoid the start of a new academic cycle in late June that may confound AE rates.
The designation of appropriateness was determined by the triage physician’s logged response to triage database questions at the time of the admission call. Of the 748 admissions meeting inclusion criteria, 513 (68.6%) were considered definitely appropriate on the basis of the triage physician’s response to the question “Based ONLY on the medical reason for hospitalization, in your opinion, how appropriate is this admission to the medicine floor service?” Furthermore, 169 (22.6%) were considered without definite medical acuity on the basis of the triage physician’s indication that “severity of medical problems alone may not require inpatient hospitalization” (Appendix Figure 1).
Study Design
Following a retrospective cohort study design, we systematically sampled 150 admissions from those “admitted without definite medical acuity” to create the exposure group and 150 from the “definitely medically appropriate” admissions to create the nonexposure group. Our sampling method involved selecting every third record until reaching the target sample size. This method and group sizes were determined prior to beginning data collection. Given the expected incidence of 33% AEs in the unexposed group (consistent with previous reports of AEs using the trigger tool5), we anticipated that a total sample size of 300 would be appropriate to capture a relative risk of at least 1.5 with 80% power and 95% confidence level.
Chart review was performed to capture patient demographics, admission characteristics, and hospitalization outcomes. We captured emergency severity index (ESI)6, a validated, reliable triage assessment score assigned by our emergency department, as a measurement of acute illness and calculated the Charlson comorbidity index (CCI)7 as a measurement of chronic comorbidity.
Identification of Adverse Events
We measured AEs by using the Institute for Healthcare Improvement Global Trigger Tool,8,9 which is estimated to identify up to 10 times more AEs than other methods, such as voluntary reporting.5 This protocol includes 28 triggers in the Cares and Medication Modules that serve as indicators that an AE may have occurred. The presence of a trigger is not necessarily an AE but a clue for further analysis. Two investigators (AS and CS) independently systematically searched for the presence of triggers within each patient chart. Trigger identification prompted in-depth analysis to confirm the occurrence of an AE and to characterize its severity by using the National Coordinating Council for Medication Error Reporting and Prevention categorization.10 An AE was coded when independent reviewers identified evidence of a preventable or nonpreventable “noxious and unintended event occurring in association with medical care.”9 By definition, any AEs identified were patient harms. Findings were reviewed weekly to ensure agreement, and discrepancies were adjudicated by a third investigator (MB).
All study data were collected by using REDCap electronic data capture tools hosted at the University of Washington.11 The University of Washington Institutional Review Board granted approval for this study.
Study Outcome and Statistical Analysis
The primary outcome was AEs per group with results calculated in three ways: AEs per 1,000 patient-days, AEs per 100 admissions, and percent of admissions with an AE. The risk ratio (RR) for the percent of admissions with an AE and the incidence rate ratio (IRR) for AEs per 1,000 patient-days were calculated for the comparison of significance.
Other data were analyzed by using Pearson’s chi square for categorical data, Student t test for normally distributed quantitative data, and Wilcoxon rank-sum (Mann–Whitney) for the length of stay (due to skew). Analyses were conducted using STATA (version 15.1, College Station, TX).
This work follows standards for reporting observational students as outlined in the STROBE statement.12
RESULTS
Patient Demographics
Both groups were predominantly white/non-Hispanic, male, and English-speaking (Table 1). More patients without definite medical acuity were covered by public insurance (78.9% vs 69.8%, P = .010) and discharged to homelessness (34.8% vs 22.6%, P = .041).
Measures of Illness
Patients considered definitely medically appropriate had lower ESI scores, indicative of more acute presentation, than those without definite medical acuity (2.73 [95% CI 2.64-2.81] vs 2.87 [95% CI 2.78-2.95], P = .026). There was no difference in CCI scores (Table 1).
Reason for Admission and Outcomes
Admissions considered definitely medically appropriate more frequently had an identified diagnosis/syndrome (66% vs 53%) or objective measurement (8.7% vs 2.7%) listed as the reason for admission, whereas patients admitted without definite medical acuity more freuqently had undifferentiated symptoms (34.7% vs 24%) or other/disposition (6% vs 1.3%) listed. The most common factors that triage physicians cited as contributing to the decision to admit patients without definite medical acuity included homelessness (34%), lack of outpatient social support (32%), and substance use disorder (25%). More details are available in Appendix Tables 1 and 2.
Admissions without definite medical acuity were longer than those with definite medical acuity (6.6 vs 6.0 days, P = .038), but there was no difference in emergency department readmissions within 48 hours or hospital readmissions within 30 days (Table 1).
Adverse Events
We identified 76 AEs in 41 admissions without definite medical acuity (range 0-10 AEs per admission) and 63 AEs in 44 definitely medically appropriate admissions (range 0-4 AEs per admission). The percentage of admissions with AE (27.3% vs 29.3%; RR 0.93, 95% CI 0.65-1.34, P = .70) and the rate of AE/1,000 patient-days (76.8 vs 70.4; IRR 1.09, 95% CI 0.77-1.55, P = .61) did not show statistically significant differences. The distribution of AE severity was similar between the two groups (Table 2). Most identified AEs caused temporary harm to the patient and were rated at severity levels E or F. Severe AEs, including at least one level I (patient death), occurred in both groups. The complete listing of positive triggers leading to adverse event identification by group and severity is available in Appendix Table 3.
DISCUSSION
By using a robust, standardized method, we found that patients admitted without definite medical acuity experienced the same number of inpatient AEs as patients admitted for definitely medically appropriate reasons. While the groups were relatively similar overall in terms of demographics and chronic comorbidity, we found evidence of social vulnerability in the group admitted without definite medical acuity in the form of increased rates of homelessness, triage physician concern regarding the lack of outpatient social support, and disposition-related reasons for admission. That both groups suffered harm―including patient death―while admitted to the hospital is striking, in particular for those patients who were admitted because of the lack of suitable outpatient options.
The potential limitations to the generalizability of this work include the single-site, safety-net setting and the use of individual physician determination of admission appropriateness. The proportion of admissions without definite medical acuity reported here is similar to that reported by previously published admission decision-making studies,2,3 and the rate of AEs observed is similar to rates measured in other studies using the trigger tool methodology.5,13 These similarities suggest some commonality across settings. Our study treats triage physician assessment as the marker of difference in defining the two groups and is an inherently subjective assessment that is reflective of real-world, holistic decision-making. Notably, the triage physician assessment was corroborated by corresponding differences in the ESI score, an acute triage assessment completed by a clinician outside of our team.
This study adds foundational knowledge to the risk/benefit discussion surrounding the decision to admit. Physician admission decisions are likely influenced by concern for the safety of vulnerable patients. Our results suggest that considering the risk of hospitalization itself in this decision-making remains important.
1. Mushlin AI, Appel FA. Extramedical factors in the decision to hospitalize medical patients. Am J Public Health. 1976;66(2):170-172. https://doi.org/10.2105/AJPH.66.2.170.
2. Lewis Hunter AE, Spatz ES, Bernstein SL, Rosenthal MS. Factors influencing hospital admission of noncritically ill patients presenting to the emergency department: a cross-sectional study. J Gen Intern Med. 2016;31(1):37-44. https://doi.org/10.1007/s11606-015-3438-8.
3. Pope I, Burn H, Ismail SA, Harris T, McCoy D. A qualitative study exploring the factors influencing admission to hospital from the emergency department. BMJ Open. 2017;7(8):e011543. https://doi.org/10.1136/bmjopen-2016-011543.
4. Levinson DR. Adverse Events in Hospitals: National Incidence among Medicare Beneficiaries. 2010. https://oig.hhs.gov/oei/reports/oei-06-09-00090.pdf. Accessed May 20, 2019.
5. Classen DC, Resar R, Griffin F, et al. ‘Global trigger tool’ shows that adverse events in hospitals may be ten times greater than previously measured. Health Aff (Millwood). 2011;30(4):581-589. https://doi.org/10.1377/hlthaff.2011.0190.
6. Wuerz RC, Milne LW, Eitel DR, Travers D, Gilboy N. Reliability and validity of a new five-level triage instrument. Acad Emerg Med. 2000;7(3):236-242.https://doi.org/10.1111/j.1553-2712.2000.tb01066.x.
7. Charlson ME, Pompei P, Ales KL, MacKenzie CR. A new method of classifying prognostic comorbidity in longitudinal studies: development and validation. J Chron Dis. 1987;40:373-383. https://doi.org/10.1016/0021-9681(87)90171-8.
8. Resar RK, Rozich JD, Classen D. Methodology and rationale for the measurement of harm with trigger tools. Qual Saf Health Care. 2003;12(2):ii39-ii45. https://doi.org/10.1136/qhc.12.suppl_2.ii39.
9. Griffen FA, Resar RK. IHI Global Trigger Tool for Measuring Adverse Events (Second Edition). Cambridge, Massachusetts: Institute for Healthcare Improvement; 2009.
10. National Coordinating Council for Medication Error Reporting and Prevention (NCC MERP) Index for Categorizing Errors. https://www.nccmerp.org/types-medication-errors Accessed May 20, 2019.
11. Harris PA, Taylor R, Thielke R, Payne J, Gonzalez N, Conde JG. Research electronic data capture (REDCap)--a metadata-driven methodology and workflow process for providing translational research informatics support. J Biomed Inform. 2009;42(2):377-381. https://doi.org/10.1016/j.jbi.2008.08.010.
12. von Elm E, Altman DG, Egger M, Pocock SJ, Gøtzsche PC, Vandenbroucke JP. The Strengthening the Reporting of Observational Studies in Epidemiology (STROBE) statement: guidelines for reporting observational studies. Ann Intern Med. 2007;147(8):573-577.
13. Kennerly DA, Kudyakov R, da Graca B, et al. Characterization of adverse events detected in a large health care delivery system using an enhanced global trigger tool over a five-year interval. Health Serv Res. 2014;49(5):1407-1425. https://doi.org/10.1111/1475-6773.12163.
1. Mushlin AI, Appel FA. Extramedical factors in the decision to hospitalize medical patients. Am J Public Health. 1976;66(2):170-172. https://doi.org/10.2105/AJPH.66.2.170.
2. Lewis Hunter AE, Spatz ES, Bernstein SL, Rosenthal MS. Factors influencing hospital admission of noncritically ill patients presenting to the emergency department: a cross-sectional study. J Gen Intern Med. 2016;31(1):37-44. https://doi.org/10.1007/s11606-015-3438-8.
3. Pope I, Burn H, Ismail SA, Harris T, McCoy D. A qualitative study exploring the factors influencing admission to hospital from the emergency department. BMJ Open. 2017;7(8):e011543. https://doi.org/10.1136/bmjopen-2016-011543.
4. Levinson DR. Adverse Events in Hospitals: National Incidence among Medicare Beneficiaries. 2010. https://oig.hhs.gov/oei/reports/oei-06-09-00090.pdf. Accessed May 20, 2019.
5. Classen DC, Resar R, Griffin F, et al. ‘Global trigger tool’ shows that adverse events in hospitals may be ten times greater than previously measured. Health Aff (Millwood). 2011;30(4):581-589. https://doi.org/10.1377/hlthaff.2011.0190.
6. Wuerz RC, Milne LW, Eitel DR, Travers D, Gilboy N. Reliability and validity of a new five-level triage instrument. Acad Emerg Med. 2000;7(3):236-242.https://doi.org/10.1111/j.1553-2712.2000.tb01066.x.
7. Charlson ME, Pompei P, Ales KL, MacKenzie CR. A new method of classifying prognostic comorbidity in longitudinal studies: development and validation. J Chron Dis. 1987;40:373-383. https://doi.org/10.1016/0021-9681(87)90171-8.
8. Resar RK, Rozich JD, Classen D. Methodology and rationale for the measurement of harm with trigger tools. Qual Saf Health Care. 2003;12(2):ii39-ii45. https://doi.org/10.1136/qhc.12.suppl_2.ii39.
9. Griffen FA, Resar RK. IHI Global Trigger Tool for Measuring Adverse Events (Second Edition). Cambridge, Massachusetts: Institute for Healthcare Improvement; 2009.
10. National Coordinating Council for Medication Error Reporting and Prevention (NCC MERP) Index for Categorizing Errors. https://www.nccmerp.org/types-medication-errors Accessed May 20, 2019.
11. Harris PA, Taylor R, Thielke R, Payne J, Gonzalez N, Conde JG. Research electronic data capture (REDCap)--a metadata-driven methodology and workflow process for providing translational research informatics support. J Biomed Inform. 2009;42(2):377-381. https://doi.org/10.1016/j.jbi.2008.08.010.
12. von Elm E, Altman DG, Egger M, Pocock SJ, Gøtzsche PC, Vandenbroucke JP. The Strengthening the Reporting of Observational Studies in Epidemiology (STROBE) statement: guidelines for reporting observational studies. Ann Intern Med. 2007;147(8):573-577.
13. Kennerly DA, Kudyakov R, da Graca B, et al. Characterization of adverse events detected in a large health care delivery system using an enhanced global trigger tool over a five-year interval. Health Serv Res. 2014;49(5):1407-1425. https://doi.org/10.1111/1475-6773.12163.
© 2020 Society of Hospital Medicine
Breathing New Life into Vital Sign Measurement
As you review the electronic health record before rounds in the morning, you notice a red exclamation mark in the chart of a patient who was admitted two days ago for an acute chronic obstructive pulmonary disease (COPD) exacerbation. The patient’s respiratory rate (RR) this morning is recorded at 24 breaths per minute (bpm). His RR last evening was 16 bpm and he remains on two liters per minute of supplemental oxygen. No one has notified you that he is getting worse, but you stop by the room to confirm that he is clinically stable.
During rounds, the resident states “The respiratory rate is recorded as 24 bpm, which is high, but I never trust the respiratory rate.” You silently agree and confirm your mistrust of the recorded RR.
Elevated RR has been associated with numerous poor outcomes, including mortality after myocardial infarction1 and death and readmission after acute COPD exacerbation.2 Furthermore, RR is used in models to predict mortality and intensive care unit admission,3 as well as in models to identify and predict mortality from sepsis.4 Recorded RRs are frequency inaccurate,5 and medical staff lack confidence in recorded RR values.6 Based on this evidence, you feel justified in your mistrust of recorded RR values. You might even believe that until a high-tech RR monitoring system is invented and implemented at your hospital, human error will forever prevent you from knowing your patients’ true RRs.
However, there is hope. In this issue of the Journal of Hospital Medicine, Keshvani et al.7 describe a successful quality improvement project where they employed plan–do–study–act methodology in a single inpatient unit to improve the accuracy of recorded RR. Before their project, only 36% of RR measurements were accurate, and there was considerable heterogeneity in the RR measurement technique. To address this problem, an interdisciplinary team of patient care assistants (PCAs), nurses, physicians, and hospital administration developed a plan to identify barriers, improve workflow, and educate stakeholders in RR recording.
The authors created a low-cost, “low-tech” intervention that consisted of training and educating PCAs on the correct technique and the importance of RR measurement, modifying workflow to incorporate RR measurement into a 30-second period of automated blood pressure measurement, and adding stopwatches to the vital sign carts. The RR measurements obtained by PCAs were compared with the RR measurements obtained by trained team members to assess for accuracy. PCA-obtained RR measurements were also compared with two control units, both before and after the intervention. Secondary outcomes included time to complete vital sign measurements and the incidence of systemic inflammatory response syndrome (SIRS)
The intervention improved the accuracy of PCA-obtained RRs from 36% to 58% and decreased the median RR from 18 to 14 breaths per minute. The implementation also resulted in a more normal distribution of RR in the intervention unit compared with the control unit. Interestingly, this intervention did not increase the time spent in obtaining vital signs—in fact, the time to complete vital signs decreased from a median of 2:26 to 1:55 minutes. In addition, tachypnea-specific SIRS incidence was reduced by 7.8% per hospitalization. An important implication of this finding is that reducing the false-positive rate of SIRS could possibly decrease unnecessary testing, medical interventions, and alert fatigue.
This project shows that meaningful interventions need not be expensive or overly technologic to have very real clinical effects. It would be very easy for a system to advocate for funding to purchase advanced monitors that purport to remove human error from the situation rather than trying first to improve human performance. Certainly, there is a role for advanced technologies—but improvement need not wait for, or be completely predicated on, these new technologies. The first barrier often expressed when evaluating a potential improvement initiative is that “we don’t have time for that”. This project demonstrates that innovations to improve care can also benefit the care team and improve workflow. Certainly, this project is not definitive and should be replicated elsewhere, but it is an important first step.
In an era where technology is expanding rapidly and the pace of innovation is breathtaking, we have an obligation to ensure that we are getting the basics right. Further, we must not take core tasks—such as vital signs, physical examination, and medication reconciliation—for granted, nor should we accept that they are as they will be. We discuss and debate the merits of advanced imaging, artificial intelligence, and machine learning—which are certainly exciting advances—but we must occasionally pause, breathe, and examine our practice to make sure that we do not overlook things that are truly vital to our patients’ care.
Disclosures
The authors have nothing to disclose.
1. Barthel P, Wensel R, Bauer A, et al. Respiratory rate predicts outcome after acute myocardial infarction: a prospective cohort study. Eur Heart J. 2013;34(22):1644-1650. https://doi.org/10.1093/eurheartj/ehs420.
2. Flattet Y, Garin N, Serratrice J, Arnaud P, Stirnemann J, Carballo S. Determining prognosis in acute exacerbation of COPD. Int J Chron Obstruct Pulmon Dis. 2017;12:467-475. https://doi.org/10.2147/COPD.S122382.
3. Subbe CP, Kruger M, Rutherford P, Gemmel L. Validation of a modified early warning score in medical admissions. QJM. 2001;94(10):521-526. https://doi.org/10.1093/qjmed/94.10.521.
4. Seymour CW, Liu VX, Iwashyna TJ, et al. Assessment of clinical criteria for sepsis: for the third international consensus definitions for sepsis and septic shock (sepsis-3). JAMA. 2016;315(8):762-774. https://doi.org/10.1001/jama.2016.0288.
5. Badawy J, Nguyen OK, Clark C, Halm EA, Makam AN. Is everyone really breathing 20 times a minute? Assessing epidemiology and variation in recorded respiratory rate in hospitalised adults. BMJ Qual Saf. 2017;26(10):832-836. https://doi.org/10.1136/bmjqs-2017-006671.
6. Philip K, Richardson R, Cohen M. Staff perceptions of respiratory rate measurement in a general hospital. Br J Nurs. 2013;22(10):570-574. https://doi.org/10.12968/bjon.2013.22.10.570.
7. Keshvani N, Berger K, Gupta A, DePaola S, Nguyen O, Makam A. Improving respiratory rate accuracy in the hospital: a quality improvement initiative [published online ahead of print June 10, 2019]. J Hosp Med. 2019;14(11):673-677. https://doi.org/10.12788/jhm.3232.
As you review the electronic health record before rounds in the morning, you notice a red exclamation mark in the chart of a patient who was admitted two days ago for an acute chronic obstructive pulmonary disease (COPD) exacerbation. The patient’s respiratory rate (RR) this morning is recorded at 24 breaths per minute (bpm). His RR last evening was 16 bpm and he remains on two liters per minute of supplemental oxygen. No one has notified you that he is getting worse, but you stop by the room to confirm that he is clinically stable.
During rounds, the resident states “The respiratory rate is recorded as 24 bpm, which is high, but I never trust the respiratory rate.” You silently agree and confirm your mistrust of the recorded RR.
Elevated RR has been associated with numerous poor outcomes, including mortality after myocardial infarction1 and death and readmission after acute COPD exacerbation.2 Furthermore, RR is used in models to predict mortality and intensive care unit admission,3 as well as in models to identify and predict mortality from sepsis.4 Recorded RRs are frequency inaccurate,5 and medical staff lack confidence in recorded RR values.6 Based on this evidence, you feel justified in your mistrust of recorded RR values. You might even believe that until a high-tech RR monitoring system is invented and implemented at your hospital, human error will forever prevent you from knowing your patients’ true RRs.
However, there is hope. In this issue of the Journal of Hospital Medicine, Keshvani et al.7 describe a successful quality improvement project where they employed plan–do–study–act methodology in a single inpatient unit to improve the accuracy of recorded RR. Before their project, only 36% of RR measurements were accurate, and there was considerable heterogeneity in the RR measurement technique. To address this problem, an interdisciplinary team of patient care assistants (PCAs), nurses, physicians, and hospital administration developed a plan to identify barriers, improve workflow, and educate stakeholders in RR recording.
The authors created a low-cost, “low-tech” intervention that consisted of training and educating PCAs on the correct technique and the importance of RR measurement, modifying workflow to incorporate RR measurement into a 30-second period of automated blood pressure measurement, and adding stopwatches to the vital sign carts. The RR measurements obtained by PCAs were compared with the RR measurements obtained by trained team members to assess for accuracy. PCA-obtained RR measurements were also compared with two control units, both before and after the intervention. Secondary outcomes included time to complete vital sign measurements and the incidence of systemic inflammatory response syndrome (SIRS)
The intervention improved the accuracy of PCA-obtained RRs from 36% to 58% and decreased the median RR from 18 to 14 breaths per minute. The implementation also resulted in a more normal distribution of RR in the intervention unit compared with the control unit. Interestingly, this intervention did not increase the time spent in obtaining vital signs—in fact, the time to complete vital signs decreased from a median of 2:26 to 1:55 minutes. In addition, tachypnea-specific SIRS incidence was reduced by 7.8% per hospitalization. An important implication of this finding is that reducing the false-positive rate of SIRS could possibly decrease unnecessary testing, medical interventions, and alert fatigue.
This project shows that meaningful interventions need not be expensive or overly technologic to have very real clinical effects. It would be very easy for a system to advocate for funding to purchase advanced monitors that purport to remove human error from the situation rather than trying first to improve human performance. Certainly, there is a role for advanced technologies—but improvement need not wait for, or be completely predicated on, these new technologies. The first barrier often expressed when evaluating a potential improvement initiative is that “we don’t have time for that”. This project demonstrates that innovations to improve care can also benefit the care team and improve workflow. Certainly, this project is not definitive and should be replicated elsewhere, but it is an important first step.
In an era where technology is expanding rapidly and the pace of innovation is breathtaking, we have an obligation to ensure that we are getting the basics right. Further, we must not take core tasks—such as vital signs, physical examination, and medication reconciliation—for granted, nor should we accept that they are as they will be. We discuss and debate the merits of advanced imaging, artificial intelligence, and machine learning—which are certainly exciting advances—but we must occasionally pause, breathe, and examine our practice to make sure that we do not overlook things that are truly vital to our patients’ care.
Disclosures
The authors have nothing to disclose.
As you review the electronic health record before rounds in the morning, you notice a red exclamation mark in the chart of a patient who was admitted two days ago for an acute chronic obstructive pulmonary disease (COPD) exacerbation. The patient’s respiratory rate (RR) this morning is recorded at 24 breaths per minute (bpm). His RR last evening was 16 bpm and he remains on two liters per minute of supplemental oxygen. No one has notified you that he is getting worse, but you stop by the room to confirm that he is clinically stable.
During rounds, the resident states “The respiratory rate is recorded as 24 bpm, which is high, but I never trust the respiratory rate.” You silently agree and confirm your mistrust of the recorded RR.
Elevated RR has been associated with numerous poor outcomes, including mortality after myocardial infarction1 and death and readmission after acute COPD exacerbation.2 Furthermore, RR is used in models to predict mortality and intensive care unit admission,3 as well as in models to identify and predict mortality from sepsis.4 Recorded RRs are frequency inaccurate,5 and medical staff lack confidence in recorded RR values.6 Based on this evidence, you feel justified in your mistrust of recorded RR values. You might even believe that until a high-tech RR monitoring system is invented and implemented at your hospital, human error will forever prevent you from knowing your patients’ true RRs.
However, there is hope. In this issue of the Journal of Hospital Medicine, Keshvani et al.7 describe a successful quality improvement project where they employed plan–do–study–act methodology in a single inpatient unit to improve the accuracy of recorded RR. Before their project, only 36% of RR measurements were accurate, and there was considerable heterogeneity in the RR measurement technique. To address this problem, an interdisciplinary team of patient care assistants (PCAs), nurses, physicians, and hospital administration developed a plan to identify barriers, improve workflow, and educate stakeholders in RR recording.
The authors created a low-cost, “low-tech” intervention that consisted of training and educating PCAs on the correct technique and the importance of RR measurement, modifying workflow to incorporate RR measurement into a 30-second period of automated blood pressure measurement, and adding stopwatches to the vital sign carts. The RR measurements obtained by PCAs were compared with the RR measurements obtained by trained team members to assess for accuracy. PCA-obtained RR measurements were also compared with two control units, both before and after the intervention. Secondary outcomes included time to complete vital sign measurements and the incidence of systemic inflammatory response syndrome (SIRS)
The intervention improved the accuracy of PCA-obtained RRs from 36% to 58% and decreased the median RR from 18 to 14 breaths per minute. The implementation also resulted in a more normal distribution of RR in the intervention unit compared with the control unit. Interestingly, this intervention did not increase the time spent in obtaining vital signs—in fact, the time to complete vital signs decreased from a median of 2:26 to 1:55 minutes. In addition, tachypnea-specific SIRS incidence was reduced by 7.8% per hospitalization. An important implication of this finding is that reducing the false-positive rate of SIRS could possibly decrease unnecessary testing, medical interventions, and alert fatigue.
This project shows that meaningful interventions need not be expensive or overly technologic to have very real clinical effects. It would be very easy for a system to advocate for funding to purchase advanced monitors that purport to remove human error from the situation rather than trying first to improve human performance. Certainly, there is a role for advanced technologies—but improvement need not wait for, or be completely predicated on, these new technologies. The first barrier often expressed when evaluating a potential improvement initiative is that “we don’t have time for that”. This project demonstrates that innovations to improve care can also benefit the care team and improve workflow. Certainly, this project is not definitive and should be replicated elsewhere, but it is an important first step.
In an era where technology is expanding rapidly and the pace of innovation is breathtaking, we have an obligation to ensure that we are getting the basics right. Further, we must not take core tasks—such as vital signs, physical examination, and medication reconciliation—for granted, nor should we accept that they are as they will be. We discuss and debate the merits of advanced imaging, artificial intelligence, and machine learning—which are certainly exciting advances—but we must occasionally pause, breathe, and examine our practice to make sure that we do not overlook things that are truly vital to our patients’ care.
Disclosures
The authors have nothing to disclose.
1. Barthel P, Wensel R, Bauer A, et al. Respiratory rate predicts outcome after acute myocardial infarction: a prospective cohort study. Eur Heart J. 2013;34(22):1644-1650. https://doi.org/10.1093/eurheartj/ehs420.
2. Flattet Y, Garin N, Serratrice J, Arnaud P, Stirnemann J, Carballo S. Determining prognosis in acute exacerbation of COPD. Int J Chron Obstruct Pulmon Dis. 2017;12:467-475. https://doi.org/10.2147/COPD.S122382.
3. Subbe CP, Kruger M, Rutherford P, Gemmel L. Validation of a modified early warning score in medical admissions. QJM. 2001;94(10):521-526. https://doi.org/10.1093/qjmed/94.10.521.
4. Seymour CW, Liu VX, Iwashyna TJ, et al. Assessment of clinical criteria for sepsis: for the third international consensus definitions for sepsis and septic shock (sepsis-3). JAMA. 2016;315(8):762-774. https://doi.org/10.1001/jama.2016.0288.
5. Badawy J, Nguyen OK, Clark C, Halm EA, Makam AN. Is everyone really breathing 20 times a minute? Assessing epidemiology and variation in recorded respiratory rate in hospitalised adults. BMJ Qual Saf. 2017;26(10):832-836. https://doi.org/10.1136/bmjqs-2017-006671.
6. Philip K, Richardson R, Cohen M. Staff perceptions of respiratory rate measurement in a general hospital. Br J Nurs. 2013;22(10):570-574. https://doi.org/10.12968/bjon.2013.22.10.570.
7. Keshvani N, Berger K, Gupta A, DePaola S, Nguyen O, Makam A. Improving respiratory rate accuracy in the hospital: a quality improvement initiative [published online ahead of print June 10, 2019]. J Hosp Med. 2019;14(11):673-677. https://doi.org/10.12788/jhm.3232.
1. Barthel P, Wensel R, Bauer A, et al. Respiratory rate predicts outcome after acute myocardial infarction: a prospective cohort study. Eur Heart J. 2013;34(22):1644-1650. https://doi.org/10.1093/eurheartj/ehs420.
2. Flattet Y, Garin N, Serratrice J, Arnaud P, Stirnemann J, Carballo S. Determining prognosis in acute exacerbation of COPD. Int J Chron Obstruct Pulmon Dis. 2017;12:467-475. https://doi.org/10.2147/COPD.S122382.
3. Subbe CP, Kruger M, Rutherford P, Gemmel L. Validation of a modified early warning score in medical admissions. QJM. 2001;94(10):521-526. https://doi.org/10.1093/qjmed/94.10.521.
4. Seymour CW, Liu VX, Iwashyna TJ, et al. Assessment of clinical criteria for sepsis: for the third international consensus definitions for sepsis and septic shock (sepsis-3). JAMA. 2016;315(8):762-774. https://doi.org/10.1001/jama.2016.0288.
5. Badawy J, Nguyen OK, Clark C, Halm EA, Makam AN. Is everyone really breathing 20 times a minute? Assessing epidemiology and variation in recorded respiratory rate in hospitalised adults. BMJ Qual Saf. 2017;26(10):832-836. https://doi.org/10.1136/bmjqs-2017-006671.
6. Philip K, Richardson R, Cohen M. Staff perceptions of respiratory rate measurement in a general hospital. Br J Nurs. 2013;22(10):570-574. https://doi.org/10.12968/bjon.2013.22.10.570.
7. Keshvani N, Berger K, Gupta A, DePaola S, Nguyen O, Makam A. Improving respiratory rate accuracy in the hospital: a quality improvement initiative [published online ahead of print June 10, 2019]. J Hosp Med. 2019;14(11):673-677. https://doi.org/10.12788/jhm.3232.
© 2019 Society of Hospital Medicine
Varicella vaccine delivers doubled benefit to children
than those in unvaccinated children.
The benefit became largely apparent after children received the second vaccination in the recommended series, and persisted throughout childhood, Sheila Weinmann, PhD, of Kaiser Permanente Northern California, Oakland, and colleagues said.*
The analysis included 6.37 million children in the Kaiser Permanente database, 50% of whom were vaccinated for all or some of the study period stretching from 2003 to 2014. Overall, the crude lab-confirmed herpes zoster (HZ) incidence rate was 74/100,000 person-years. When stratified by vaccine status, the crude rate of HZ among vaccinated children was 78% lower than among unvaccinated children (38 vs. 170 cases per 100,000 person years).
Herpes zoster was more common among girls than boys and up to six times more common in immunosuppressed children than in nonimmunosuppressed children.
The authors also found that unvaccinated children benefited from the high rate of vaccination around them. Although the HZ rate was always lower among vaccinated children, the rate among unvaccinated children fell sharply after 2007.
“The trend of decreasing HZ incidence among children who were unvaccinated is likely due to a lack of primary VZV [varicella-zoster virus] infection resulting from herd immunity in a highly vaccinated population,” Dr. Weinmann and her associates said.
There was some variability among age groups, especially among the youngest who were not fully vaccinated.
“In the group aged 1-2 years, the confirmation-adjusted HZ rate among children who were vaccinated was 70% higher than among those who were unvaccinated,” the authors said. In the “older groups, HZ rates were significantly higher in children who were unvaccinated than in those who were vaccinated,” the researchers noted.
The highest incidence was among vaccinated 1-year-olds, who had a 140% higher risk of HZ than did unvaccinated 1-year-olds. But this risk elevation disappeared by age 2 years. For everyone else, aged 2-17 years, the rate of HZ remained significantly lower in vaccinated children.
“Among the small number of children vaccinated at 11 months of age (for whom the vaccine is not recommended), the HZ incidence rate was significantly higher than in children vaccinated at 1 year of age and older. Similarly, children who contract wild-type varicella infection at younger than 1 year of age also have a higher risk of HZ (relative risk, 13.5). The immature adaptive T-cell response in children less than 1 year of age appears less able to contain VZV as a latent infection, compared with older children.
“Our findings for 11-month-olds who were vaccinated should be interpreted with caution because this population included only three cases of HZ and could have included children participating in a prelicensure study with a vaccine formulation different from Varivax,” Dr. Weinmann and her associates said.
Dr. Weinmann and her associates reported no relevant financial disclosures. The study was supported by the Centers for Disease Control and Prevention.
SOURCE: Weinmann S et al. Pediatrics. 2019 Jun 10. doi: 10.1542/peds.2018-2917.
* This article was updated 6/14/2019
The finding of a 78% lower incidence of zoster in varicella-vaccinated children is nothing short of “remarkable,” Anne A Gershon, MD, wrote in an accompanying editorial.
But the benefit could be in jeopardy, as parents question the safety and effectiveness of all vaccines, she wrote.
“That the varicella vaccine prevents not only varicella but zoster as well is an exciting dual benefit from the varicella vaccine, further improving the health of children by immunization,” Dr. Gershon said. “Additional studies will be necessary to show the mechanism for the protection against zoster (viral, immunologic, or both), how long this benefit lasts, and whether additional doses of some form of VZV [varicella-zoster virus] vaccine will be more useful.”
But, she suggested, in a time when cases of clinical varicella are dwindling, so is public awareness of the vaccine’s benefit. Clinical varicella is worse for adults than it is for children.
“Efforts to immunize all children against chickenpox must continue to be made to protect our population from wild-type VZV. Fortunately, antiviral therapy is also available for individuals who are unvaccinated and develop varicella or zoster, but immunization is, as usual, preferable,” Dr. Gershon concluded.
Dr. Gershon, a pediatric infectious disease specialist, is a professor of pediatrics at Columbia University, New York. She wrote a commentary to accompany the article by Weinmann et al. (Pediatrics. 2019 Jun 10. doi: 10.1542/peds.2018-3561). Dr. Gershon had no relevant financial disclosures. The commentary was funded by the National Institutes of Health.
The finding of a 78% lower incidence of zoster in varicella-vaccinated children is nothing short of “remarkable,” Anne A Gershon, MD, wrote in an accompanying editorial.
But the benefit could be in jeopardy, as parents question the safety and effectiveness of all vaccines, she wrote.
“That the varicella vaccine prevents not only varicella but zoster as well is an exciting dual benefit from the varicella vaccine, further improving the health of children by immunization,” Dr. Gershon said. “Additional studies will be necessary to show the mechanism for the protection against zoster (viral, immunologic, or both), how long this benefit lasts, and whether additional doses of some form of VZV [varicella-zoster virus] vaccine will be more useful.”
But, she suggested, in a time when cases of clinical varicella are dwindling, so is public awareness of the vaccine’s benefit. Clinical varicella is worse for adults than it is for children.
“Efforts to immunize all children against chickenpox must continue to be made to protect our population from wild-type VZV. Fortunately, antiviral therapy is also available for individuals who are unvaccinated and develop varicella or zoster, but immunization is, as usual, preferable,” Dr. Gershon concluded.
Dr. Gershon, a pediatric infectious disease specialist, is a professor of pediatrics at Columbia University, New York. She wrote a commentary to accompany the article by Weinmann et al. (Pediatrics. 2019 Jun 10. doi: 10.1542/peds.2018-3561). Dr. Gershon had no relevant financial disclosures. The commentary was funded by the National Institutes of Health.
The finding of a 78% lower incidence of zoster in varicella-vaccinated children is nothing short of “remarkable,” Anne A Gershon, MD, wrote in an accompanying editorial.
But the benefit could be in jeopardy, as parents question the safety and effectiveness of all vaccines, she wrote.
“That the varicella vaccine prevents not only varicella but zoster as well is an exciting dual benefit from the varicella vaccine, further improving the health of children by immunization,” Dr. Gershon said. “Additional studies will be necessary to show the mechanism for the protection against zoster (viral, immunologic, or both), how long this benefit lasts, and whether additional doses of some form of VZV [varicella-zoster virus] vaccine will be more useful.”
But, she suggested, in a time when cases of clinical varicella are dwindling, so is public awareness of the vaccine’s benefit. Clinical varicella is worse for adults than it is for children.
“Efforts to immunize all children against chickenpox must continue to be made to protect our population from wild-type VZV. Fortunately, antiviral therapy is also available for individuals who are unvaccinated and develop varicella or zoster, but immunization is, as usual, preferable,” Dr. Gershon concluded.
Dr. Gershon, a pediatric infectious disease specialist, is a professor of pediatrics at Columbia University, New York. She wrote a commentary to accompany the article by Weinmann et al. (Pediatrics. 2019 Jun 10. doi: 10.1542/peds.2018-3561). Dr. Gershon had no relevant financial disclosures. The commentary was funded by the National Institutes of Health.
than those in unvaccinated children.
The benefit became largely apparent after children received the second vaccination in the recommended series, and persisted throughout childhood, Sheila Weinmann, PhD, of Kaiser Permanente Northern California, Oakland, and colleagues said.*
The analysis included 6.37 million children in the Kaiser Permanente database, 50% of whom were vaccinated for all or some of the study period stretching from 2003 to 2014. Overall, the crude lab-confirmed herpes zoster (HZ) incidence rate was 74/100,000 person-years. When stratified by vaccine status, the crude rate of HZ among vaccinated children was 78% lower than among unvaccinated children (38 vs. 170 cases per 100,000 person years).
Herpes zoster was more common among girls than boys and up to six times more common in immunosuppressed children than in nonimmunosuppressed children.
The authors also found that unvaccinated children benefited from the high rate of vaccination around them. Although the HZ rate was always lower among vaccinated children, the rate among unvaccinated children fell sharply after 2007.
“The trend of decreasing HZ incidence among children who were unvaccinated is likely due to a lack of primary VZV [varicella-zoster virus] infection resulting from herd immunity in a highly vaccinated population,” Dr. Weinmann and her associates said.
There was some variability among age groups, especially among the youngest who were not fully vaccinated.
“In the group aged 1-2 years, the confirmation-adjusted HZ rate among children who were vaccinated was 70% higher than among those who were unvaccinated,” the authors said. In the “older groups, HZ rates were significantly higher in children who were unvaccinated than in those who were vaccinated,” the researchers noted.
The highest incidence was among vaccinated 1-year-olds, who had a 140% higher risk of HZ than did unvaccinated 1-year-olds. But this risk elevation disappeared by age 2 years. For everyone else, aged 2-17 years, the rate of HZ remained significantly lower in vaccinated children.
“Among the small number of children vaccinated at 11 months of age (for whom the vaccine is not recommended), the HZ incidence rate was significantly higher than in children vaccinated at 1 year of age and older. Similarly, children who contract wild-type varicella infection at younger than 1 year of age also have a higher risk of HZ (relative risk, 13.5). The immature adaptive T-cell response in children less than 1 year of age appears less able to contain VZV as a latent infection, compared with older children.
“Our findings for 11-month-olds who were vaccinated should be interpreted with caution because this population included only three cases of HZ and could have included children participating in a prelicensure study with a vaccine formulation different from Varivax,” Dr. Weinmann and her associates said.
Dr. Weinmann and her associates reported no relevant financial disclosures. The study was supported by the Centers for Disease Control and Prevention.
SOURCE: Weinmann S et al. Pediatrics. 2019 Jun 10. doi: 10.1542/peds.2018-2917.
* This article was updated 6/14/2019
than those in unvaccinated children.
The benefit became largely apparent after children received the second vaccination in the recommended series, and persisted throughout childhood, Sheila Weinmann, PhD, of Kaiser Permanente Northern California, Oakland, and colleagues said.*
The analysis included 6.37 million children in the Kaiser Permanente database, 50% of whom were vaccinated for all or some of the study period stretching from 2003 to 2014. Overall, the crude lab-confirmed herpes zoster (HZ) incidence rate was 74/100,000 person-years. When stratified by vaccine status, the crude rate of HZ among vaccinated children was 78% lower than among unvaccinated children (38 vs. 170 cases per 100,000 person years).
Herpes zoster was more common among girls than boys and up to six times more common in immunosuppressed children than in nonimmunosuppressed children.
The authors also found that unvaccinated children benefited from the high rate of vaccination around them. Although the HZ rate was always lower among vaccinated children, the rate among unvaccinated children fell sharply after 2007.
“The trend of decreasing HZ incidence among children who were unvaccinated is likely due to a lack of primary VZV [varicella-zoster virus] infection resulting from herd immunity in a highly vaccinated population,” Dr. Weinmann and her associates said.
There was some variability among age groups, especially among the youngest who were not fully vaccinated.
“In the group aged 1-2 years, the confirmation-adjusted HZ rate among children who were vaccinated was 70% higher than among those who were unvaccinated,” the authors said. In the “older groups, HZ rates were significantly higher in children who were unvaccinated than in those who were vaccinated,” the researchers noted.
The highest incidence was among vaccinated 1-year-olds, who had a 140% higher risk of HZ than did unvaccinated 1-year-olds. But this risk elevation disappeared by age 2 years. For everyone else, aged 2-17 years, the rate of HZ remained significantly lower in vaccinated children.
“Among the small number of children vaccinated at 11 months of age (for whom the vaccine is not recommended), the HZ incidence rate was significantly higher than in children vaccinated at 1 year of age and older. Similarly, children who contract wild-type varicella infection at younger than 1 year of age also have a higher risk of HZ (relative risk, 13.5). The immature adaptive T-cell response in children less than 1 year of age appears less able to contain VZV as a latent infection, compared with older children.
“Our findings for 11-month-olds who were vaccinated should be interpreted with caution because this population included only three cases of HZ and could have included children participating in a prelicensure study with a vaccine formulation different from Varivax,” Dr. Weinmann and her associates said.
Dr. Weinmann and her associates reported no relevant financial disclosures. The study was supported by the Centers for Disease Control and Prevention.
SOURCE: Weinmann S et al. Pediatrics. 2019 Jun 10. doi: 10.1542/peds.2018-2917.
* This article was updated 6/14/2019
FROM PEDIATRICS
Key clinical point: Varicella vaccine is preventing pediatric zoster among children aged 2-17 years.
Major finding: Varicella-vaccinated children have a 78% lower incidence of pediatric zoster than do unvaccinated children.
Study details: The population-based cohort study included more than 6.3 million children.
Disclosures: Dr. Weinmann and her associates reported no relevant financial disclosures. The study was supported by the Centers for Disease Control and Prevention.
Source: Weinmann S et al. Pediatrics. 2019. doi: 10.1542/peds.2018-2917.

Less Is More When It Comes to Ketorolac for Pain
A 46-year-old man with no significant medical history presents to the emergency department (ED) with right flank pain and nausea. CT reveals a 5-mm ureteral stone with no obstruction or hydronephrosis. You are planning to start him on IV ketorolac for pain. What is the most appropriate dose?
Ketorolac tromethamine is a highly effective NSAID. As a nonopiate analgesic, it is often the first choice for the treatment of acute pain in the flank, abdomen, musculoskeletal system, or head.2 While it is not associated with euphoria, withdrawal effects, or respiratory depression (like its opiate analgesic counterparts), ketorolac carries an FDA black-box warning for gastrointestinal, cardiovascular, renal, and bleeding risks.3
NSAIDs are known to have a “ceiling dose” at which maximum analgesic benefit is achieved; higher doses will not provide further pain relief. Higher doses of ketorolac may be used when the anti-inflammatory effects of NSAIDs are desired, but they are likely to cause more adverse effects.4 Available data describe the ceiling dose of ketorolac as 10 mg across dosage forms—yet the majority of research and most health care providers in current practice use higher doses (20 to 60 mg).4,5 The FDA-approved labeling provides for a maximum dose of 60 mg/d.3
In one recent study, ketorolac was prescribed above its ceiling dose in at least 97% of patients who received IV doses and at least 96% of those who received intramuscular (IM) doses in a US ED.6 If 10 mg of ketorolac is an effective analgesic dose, current practice exceeds the label recommendation to use the lowest effective dose. This study sought to determine the comparative efficacy of 3 different doses of IV ketorolac for acute pain management in an ED.
STUDY SUMMARY
10 mg of ketorolac is enough for pain
This randomized double-blind trial evaluated the effectiveness of ketorolac in 240 adult patients (ages 18 to 65) presenting to an ED with acute flank, abdominal, musculoskeletal, or headache pain.1 Acute pain was defined as onset within the past 30 days.
Patients were randomly assigned to receive either 10, 15, or 30 mg of IV ketorolac in 10 mL of normal saline. A pharmacist prepared the medication in identical syringes, which were delivered in a blinded manner to the nurses caring for the patients. Pain (measured using a 0-to-10 scale), vital signs, and adverse effects were assessed at baseline and at 15, 30, 60, 90, and 120 minutes. If patients were still in pain at 30 minutes, IV morphine (0.1 mg/kg) was offered. The primary outcome was a numerical pain score at 30 minutes after ketorolac administration; secondary outcomes included the occurrence of adverse events and the use of rescue
The treatment groups were similar in terms of demographics and baseline vital signs. Mean age was 39 to 42. Across the 3 groups, 36% to 40% of patients had abdominal pain, 26% to 39% had flank pain, 20% to 26% had musculoskeletal pain, and 1% to 11% had headache pain. Patients had experienced pain for an average of 1.5 to 3.5 days.
Continue to: Baseline pain scores...
Baseline pain scores were similar for all 3 groups (7.5-7.8 on a 10-point scale). In the intention-to-treat analysis, all 3 doses of ketorolac decreased pain significantly at 30 minutes, with no difference between the groups: mean pain scores postintervention were 5.1 for the 10- and 15-mg group and 4.8 for the 30-mg group. There was no difference between the groups at any other time intervals. There was also no difference between groups in the number of patients who needed rescue medication at 30 minutes (4 patients in the 10-mg group, 3 patients in the 15-mg group, and 4 patients in the 30-mg group). In addition, adverse events (eg, dizziness, nausea, headache, itching, flushing) did not differ between the groups.
WHAT’S NEW
10 mg is just as effective as 30 mg
This trial confirms that a low dose of IV ketorolac is just as effective as higher doses for acute pain control.
CAVEATS
2-hour limit; no look at long-term effects
It isn’t known whether the higher dose would have provided greater pain relief beyond the 120 minutes evaluated in this trial, or if alternative dosage forms (oral or IM) would result in different outcomes. This study was not designed to compare serious long-term adverse effects such as bleeding, renal impairment, or cardiovascular events. Additionally, this study was not powered to look at specific therapeutic indications or anti-inflammatory response.
CHALLENGES TO IMPLEMENTATION
10-mg single-dose vial not readily available
Ketorolac tromethamine for injection is available in the United States in 15-, 30-, and 60-mg single-dose vials. Because a 10-mg dose is not available as a single-dose vial, it would need to be specially prepared (as it was in this study). However, this study should reassure providers that using the lowest available dose (eg, 15 mg IV if that is what is available) will relieve acute pain as well as higher doses will. CR
ACKNOWLEDGEMENT
The PURLs Surveillance System was supported in part by Grant Number UL1RR024999 from the National Center For Research Resources, a Clinical Translational Science Award to the University of Chicago. The content is solely the responsibility of the authors and does not necessarily represent the official views of the National Center For Research Resources or the National Institutes of Health.
Copyright © 2019. The Family Physicians Inquiries Network. All rights reserved.
Reprinted with permission from the Family Physicians Inquiries Network and The Journal of Family Practice (2019;68[1]:41-42).
1. Motov S, Yasavolian M, Likourezos A, et al. Comparison of intravenous ketorolac at three single-dose regimens for treating acute pain in the emergency department: a randomized controlled trial. Ann Emerg Med. 2017; 70:177-184.
2. Buckley MM, Brogden RN. Ketorolac: a review of its pharmacodynamic and pharmacokinetic properties, and therapeutic potential. Drugs. 1990;39: 86-109.
3. Ketorolac tromethamine [package insert]. Bedford, OH: Bedford Laboratories; 2009.
4. Catapano MS. The analgesic efficacy of ketorolac for acute pain. J Emerg Med. 1996;14:67-75.
5. García Rodríguez LA, Cattaruzzi C, Troncon MG, et al. Risk of hospitalization for upper gastrointestinal tract bleeding associated with ketorolac, other nonsteroidal anti-inflammatory drugs, calcium antagonists, and other antihypertensive drugs. Arch Intern Med. 1998;158:33-39.
6. Soleyman-Zomalan E, Motov S, Likourezos A, et al. Patterns of ketorolac dosing by emergency physicians. World J Emerg Med. 2017;8:43-46.
A 46-year-old man with no significant medical history presents to the emergency department (ED) with right flank pain and nausea. CT reveals a 5-mm ureteral stone with no obstruction or hydronephrosis. You are planning to start him on IV ketorolac for pain. What is the most appropriate dose?
Ketorolac tromethamine is a highly effective NSAID. As a nonopiate analgesic, it is often the first choice for the treatment of acute pain in the flank, abdomen, musculoskeletal system, or head.2 While it is not associated with euphoria, withdrawal effects, or respiratory depression (like its opiate analgesic counterparts), ketorolac carries an FDA black-box warning for gastrointestinal, cardiovascular, renal, and bleeding risks.3
NSAIDs are known to have a “ceiling dose” at which maximum analgesic benefit is achieved; higher doses will not provide further pain relief. Higher doses of ketorolac may be used when the anti-inflammatory effects of NSAIDs are desired, but they are likely to cause more adverse effects.4 Available data describe the ceiling dose of ketorolac as 10 mg across dosage forms—yet the majority of research and most health care providers in current practice use higher doses (20 to 60 mg).4,5 The FDA-approved labeling provides for a maximum dose of 60 mg/d.3
In one recent study, ketorolac was prescribed above its ceiling dose in at least 97% of patients who received IV doses and at least 96% of those who received intramuscular (IM) doses in a US ED.6 If 10 mg of ketorolac is an effective analgesic dose, current practice exceeds the label recommendation to use the lowest effective dose. This study sought to determine the comparative efficacy of 3 different doses of IV ketorolac for acute pain management in an ED.
STUDY SUMMARY
10 mg of ketorolac is enough for pain
This randomized double-blind trial evaluated the effectiveness of ketorolac in 240 adult patients (ages 18 to 65) presenting to an ED with acute flank, abdominal, musculoskeletal, or headache pain.1 Acute pain was defined as onset within the past 30 days.
Patients were randomly assigned to receive either 10, 15, or 30 mg of IV ketorolac in 10 mL of normal saline. A pharmacist prepared the medication in identical syringes, which were delivered in a blinded manner to the nurses caring for the patients. Pain (measured using a 0-to-10 scale), vital signs, and adverse effects were assessed at baseline and at 15, 30, 60, 90, and 120 minutes. If patients were still in pain at 30 minutes, IV morphine (0.1 mg/kg) was offered. The primary outcome was a numerical pain score at 30 minutes after ketorolac administration; secondary outcomes included the occurrence of adverse events and the use of rescue
The treatment groups were similar in terms of demographics and baseline vital signs. Mean age was 39 to 42. Across the 3 groups, 36% to 40% of patients had abdominal pain, 26% to 39% had flank pain, 20% to 26% had musculoskeletal pain, and 1% to 11% had headache pain. Patients had experienced pain for an average of 1.5 to 3.5 days.
Continue to: Baseline pain scores...
Baseline pain scores were similar for all 3 groups (7.5-7.8 on a 10-point scale). In the intention-to-treat analysis, all 3 doses of ketorolac decreased pain significantly at 30 minutes, with no difference between the groups: mean pain scores postintervention were 5.1 for the 10- and 15-mg group and 4.8 for the 30-mg group. There was no difference between the groups at any other time intervals. There was also no difference between groups in the number of patients who needed rescue medication at 30 minutes (4 patients in the 10-mg group, 3 patients in the 15-mg group, and 4 patients in the 30-mg group). In addition, adverse events (eg, dizziness, nausea, headache, itching, flushing) did not differ between the groups.
WHAT’S NEW
10 mg is just as effective as 30 mg
This trial confirms that a low dose of IV ketorolac is just as effective as higher doses for acute pain control.
CAVEATS
2-hour limit; no look at long-term effects
It isn’t known whether the higher dose would have provided greater pain relief beyond the 120 minutes evaluated in this trial, or if alternative dosage forms (oral or IM) would result in different outcomes. This study was not designed to compare serious long-term adverse effects such as bleeding, renal impairment, or cardiovascular events. Additionally, this study was not powered to look at specific therapeutic indications or anti-inflammatory response.
CHALLENGES TO IMPLEMENTATION
10-mg single-dose vial not readily available
Ketorolac tromethamine for injection is available in the United States in 15-, 30-, and 60-mg single-dose vials. Because a 10-mg dose is not available as a single-dose vial, it would need to be specially prepared (as it was in this study). However, this study should reassure providers that using the lowest available dose (eg, 15 mg IV if that is what is available) will relieve acute pain as well as higher doses will. CR
ACKNOWLEDGEMENT
The PURLs Surveillance System was supported in part by Grant Number UL1RR024999 from the National Center For Research Resources, a Clinical Translational Science Award to the University of Chicago. The content is solely the responsibility of the authors and does not necessarily represent the official views of the National Center For Research Resources or the National Institutes of Health.
Copyright © 2019. The Family Physicians Inquiries Network. All rights reserved.
Reprinted with permission from the Family Physicians Inquiries Network and The Journal of Family Practice (2019;68[1]:41-42).
A 46-year-old man with no significant medical history presents to the emergency department (ED) with right flank pain and nausea. CT reveals a 5-mm ureteral stone with no obstruction or hydronephrosis. You are planning to start him on IV ketorolac for pain. What is the most appropriate dose?
Ketorolac tromethamine is a highly effective NSAID. As a nonopiate analgesic, it is often the first choice for the treatment of acute pain in the flank, abdomen, musculoskeletal system, or head.2 While it is not associated with euphoria, withdrawal effects, or respiratory depression (like its opiate analgesic counterparts), ketorolac carries an FDA black-box warning for gastrointestinal, cardiovascular, renal, and bleeding risks.3
NSAIDs are known to have a “ceiling dose” at which maximum analgesic benefit is achieved; higher doses will not provide further pain relief. Higher doses of ketorolac may be used when the anti-inflammatory effects of NSAIDs are desired, but they are likely to cause more adverse effects.4 Available data describe the ceiling dose of ketorolac as 10 mg across dosage forms—yet the majority of research and most health care providers in current practice use higher doses (20 to 60 mg).4,5 The FDA-approved labeling provides for a maximum dose of 60 mg/d.3
In one recent study, ketorolac was prescribed above its ceiling dose in at least 97% of patients who received IV doses and at least 96% of those who received intramuscular (IM) doses in a US ED.6 If 10 mg of ketorolac is an effective analgesic dose, current practice exceeds the label recommendation to use the lowest effective dose. This study sought to determine the comparative efficacy of 3 different doses of IV ketorolac for acute pain management in an ED.
STUDY SUMMARY
10 mg of ketorolac is enough for pain
This randomized double-blind trial evaluated the effectiveness of ketorolac in 240 adult patients (ages 18 to 65) presenting to an ED with acute flank, abdominal, musculoskeletal, or headache pain.1 Acute pain was defined as onset within the past 30 days.
Patients were randomly assigned to receive either 10, 15, or 30 mg of IV ketorolac in 10 mL of normal saline. A pharmacist prepared the medication in identical syringes, which were delivered in a blinded manner to the nurses caring for the patients. Pain (measured using a 0-to-10 scale), vital signs, and adverse effects were assessed at baseline and at 15, 30, 60, 90, and 120 minutes. If patients were still in pain at 30 minutes, IV morphine (0.1 mg/kg) was offered. The primary outcome was a numerical pain score at 30 minutes after ketorolac administration; secondary outcomes included the occurrence of adverse events and the use of rescue
The treatment groups were similar in terms of demographics and baseline vital signs. Mean age was 39 to 42. Across the 3 groups, 36% to 40% of patients had abdominal pain, 26% to 39% had flank pain, 20% to 26% had musculoskeletal pain, and 1% to 11% had headache pain. Patients had experienced pain for an average of 1.5 to 3.5 days.
Continue to: Baseline pain scores...
Baseline pain scores were similar for all 3 groups (7.5-7.8 on a 10-point scale). In the intention-to-treat analysis, all 3 doses of ketorolac decreased pain significantly at 30 minutes, with no difference between the groups: mean pain scores postintervention were 5.1 for the 10- and 15-mg group and 4.8 for the 30-mg group. There was no difference between the groups at any other time intervals. There was also no difference between groups in the number of patients who needed rescue medication at 30 minutes (4 patients in the 10-mg group, 3 patients in the 15-mg group, and 4 patients in the 30-mg group). In addition, adverse events (eg, dizziness, nausea, headache, itching, flushing) did not differ between the groups.
WHAT’S NEW
10 mg is just as effective as 30 mg
This trial confirms that a low dose of IV ketorolac is just as effective as higher doses for acute pain control.
CAVEATS
2-hour limit; no look at long-term effects
It isn’t known whether the higher dose would have provided greater pain relief beyond the 120 minutes evaluated in this trial, or if alternative dosage forms (oral or IM) would result in different outcomes. This study was not designed to compare serious long-term adverse effects such as bleeding, renal impairment, or cardiovascular events. Additionally, this study was not powered to look at specific therapeutic indications or anti-inflammatory response.
CHALLENGES TO IMPLEMENTATION
10-mg single-dose vial not readily available
Ketorolac tromethamine for injection is available in the United States in 15-, 30-, and 60-mg single-dose vials. Because a 10-mg dose is not available as a single-dose vial, it would need to be specially prepared (as it was in this study). However, this study should reassure providers that using the lowest available dose (eg, 15 mg IV if that is what is available) will relieve acute pain as well as higher doses will. CR
ACKNOWLEDGEMENT
The PURLs Surveillance System was supported in part by Grant Number UL1RR024999 from the National Center For Research Resources, a Clinical Translational Science Award to the University of Chicago. The content is solely the responsibility of the authors and does not necessarily represent the official views of the National Center For Research Resources or the National Institutes of Health.
Copyright © 2019. The Family Physicians Inquiries Network. All rights reserved.
Reprinted with permission from the Family Physicians Inquiries Network and The Journal of Family Practice (2019;68[1]:41-42).
1. Motov S, Yasavolian M, Likourezos A, et al. Comparison of intravenous ketorolac at three single-dose regimens for treating acute pain in the emergency department: a randomized controlled trial. Ann Emerg Med. 2017; 70:177-184.
2. Buckley MM, Brogden RN. Ketorolac: a review of its pharmacodynamic and pharmacokinetic properties, and therapeutic potential. Drugs. 1990;39: 86-109.
3. Ketorolac tromethamine [package insert]. Bedford, OH: Bedford Laboratories; 2009.
4. Catapano MS. The analgesic efficacy of ketorolac for acute pain. J Emerg Med. 1996;14:67-75.
5. García Rodríguez LA, Cattaruzzi C, Troncon MG, et al. Risk of hospitalization for upper gastrointestinal tract bleeding associated with ketorolac, other nonsteroidal anti-inflammatory drugs, calcium antagonists, and other antihypertensive drugs. Arch Intern Med. 1998;158:33-39.
6. Soleyman-Zomalan E, Motov S, Likourezos A, et al. Patterns of ketorolac dosing by emergency physicians. World J Emerg Med. 2017;8:43-46.
1. Motov S, Yasavolian M, Likourezos A, et al. Comparison of intravenous ketorolac at three single-dose regimens for treating acute pain in the emergency department: a randomized controlled trial. Ann Emerg Med. 2017; 70:177-184.
2. Buckley MM, Brogden RN. Ketorolac: a review of its pharmacodynamic and pharmacokinetic properties, and therapeutic potential. Drugs. 1990;39: 86-109.
3. Ketorolac tromethamine [package insert]. Bedford, OH: Bedford Laboratories; 2009.
4. Catapano MS. The analgesic efficacy of ketorolac for acute pain. J Emerg Med. 1996;14:67-75.
5. García Rodríguez LA, Cattaruzzi C, Troncon MG, et al. Risk of hospitalization for upper gastrointestinal tract bleeding associated with ketorolac, other nonsteroidal anti-inflammatory drugs, calcium antagonists, and other antihypertensive drugs. Arch Intern Med. 1998;158:33-39.
6. Soleyman-Zomalan E, Motov S, Likourezos A, et al. Patterns of ketorolac dosing by emergency physicians. World J Emerg Med. 2017;8:43-46.

Estimated prevalence of OSA in the Americas stands at 170 million
, results from a novel epidemiologic analysis showed.

“I would not have thought that there are 170 million people in the Americas with clinically important sleep apnea based on our conservative estimates,” the study’s first author, Atul Malhotra, MD, said in an interview in advance of the annual meeting of the Associated Professional Sleep Societies. “Even if we restrict the conversation to moderate to severe sleep apnea, we still see 81 million people afflicted in the Americas alone. We have recently estimated almost 1 billion patients afflicted with OSA worldwide.”
In an effort to estimate the Americas’ prevalence of adult OSA using existing data from epidemiologic studies, Dr. Malhotra, director of sleep medicine at the University of California, San Diego, senior author Adam V. Benjafield, PhD, and their colleagues contacted authors of important analyses on the topic following an exhaustive review of the literature. For countries where no measurement had been made, they used publicly available data to obtain estimates of age, sex, race, and body mass index. Next, they developed an algorithm to match countries without prevalence estimates with countries from which OSA epidemiologic studies exist. “The situation was complicated given the variable age of the existing studies, the differences in technology used (e.g., nasal pressure vs. thermistor), the changing scoring criteria, and other sources of variability,” the researchers wrote in their abstract.
Dr. Malhotra reported on data from 38 of 40 countries in the Americas. Drawing from American Academy of Sleep Medicine 2012 criteria and using what they characterized as a “somewhat conservative” approach, the researchers estimated the prevalence of adult OSA in the Americas to be 170 million, or 37% of the population. In addition, they estimate that 81 million adults, or 18% of the population, suffer from moderate to severe OSA based on an apnea hypopnea index of 15 or more per hour. The countries with the greatest burden of OSA are the United States (54 million), Brazil (49 million), and Colombia (11 million).
“The findings will hopefully help to raise awareness about the disease but also encourage a strategic conversation regarding how best to address this large burden,” Dr. Malhotra said. “We are unaware of prior efforts to estimate OSA prevalence on a large scale.”
He acknowledged certain limitations of the study, including that the methods, equipment, definitions, and criteria used in existing studies in the medial literature varied widely. “We did our best to harmonize these methods across studies but obviously we can’t change the equipment that was used in previous studies,” he said. “Thus, we view our findings as an estimate requiring further efforts to corroborate.”
The research stemmed from an academic/industry partnership with ResMed, which provided a donation the UCSD Sleep Medicine Center. Dr. Malhotra reported having no financial disclosures. Dr. Benjafield is an employee of ResMed, a medical equipment company that specializes in sleep-related breathing devices.
SOURCE: Malhotra A et al. SLEEP 2019, Abstract 0477.
, results from a novel epidemiologic analysis showed.
“I would not have thought that there are 170 million people in the Americas with clinically important sleep apnea based on our conservative estimates,” the study’s first author, Atul Malhotra, MD, said in an interview in advance of the annual meeting of the Associated Professional Sleep Societies. “Even if we restrict the conversation to moderate to severe sleep apnea, we still see 81 million people afflicted in the Americas alone. We have recently estimated almost 1 billion patients afflicted with OSA worldwide.”
In an effort to estimate the Americas’ prevalence of adult OSA using existing data from epidemiologic studies, Dr. Malhotra, director of sleep medicine at the University of California, San Diego, senior author Adam V. Benjafield, PhD, and their colleagues contacted authors of important analyses on the topic following an exhaustive review of the literature. For countries where no measurement had been made, they used publicly available data to obtain estimates of age, sex, race, and body mass index. Next, they developed an algorithm to match countries without prevalence estimates with countries from which OSA epidemiologic studies exist. “The situation was complicated given the variable age of the existing studies, the differences in technology used (e.g., nasal pressure vs. thermistor), the changing scoring criteria, and other sources of variability,” the researchers wrote in their abstract.
Dr. Malhotra reported on data from 38 of 40 countries in the Americas. Drawing from American Academy of Sleep Medicine 2012 criteria and using what they characterized as a “somewhat conservative” approach, the researchers estimated the prevalence of adult OSA in the Americas to be 170 million, or 37% of the population. In addition, they estimate that 81 million adults, or 18% of the population, suffer from moderate to severe OSA based on an apnea hypopnea index of 15 or more per hour. The countries with the greatest burden of OSA are the United States (54 million), Brazil (49 million), and Colombia (11 million).
“The findings will hopefully help to raise awareness about the disease but also encourage a strategic conversation regarding how best to address this large burden,” Dr. Malhotra said. “We are unaware of prior efforts to estimate OSA prevalence on a large scale.”
He acknowledged certain limitations of the study, including that the methods, equipment, definitions, and criteria used in existing studies in the medial literature varied widely. “We did our best to harmonize these methods across studies but obviously we can’t change the equipment that was used in previous studies,” he said. “Thus, we view our findings as an estimate requiring further efforts to corroborate.”
The research stemmed from an academic/industry partnership with ResMed, which provided a donation the UCSD Sleep Medicine Center. Dr. Malhotra reported having no financial disclosures. Dr. Benjafield is an employee of ResMed, a medical equipment company that specializes in sleep-related breathing devices.
SOURCE: Malhotra A et al. SLEEP 2019, Abstract 0477.
, results from a novel epidemiologic analysis showed.
“I would not have thought that there are 170 million people in the Americas with clinically important sleep apnea based on our conservative estimates,” the study’s first author, Atul Malhotra, MD, said in an interview in advance of the annual meeting of the Associated Professional Sleep Societies. “Even if we restrict the conversation to moderate to severe sleep apnea, we still see 81 million people afflicted in the Americas alone. We have recently estimated almost 1 billion patients afflicted with OSA worldwide.”
In an effort to estimate the Americas’ prevalence of adult OSA using existing data from epidemiologic studies, Dr. Malhotra, director of sleep medicine at the University of California, San Diego, senior author Adam V. Benjafield, PhD, and their colleagues contacted authors of important analyses on the topic following an exhaustive review of the literature. For countries where no measurement had been made, they used publicly available data to obtain estimates of age, sex, race, and body mass index. Next, they developed an algorithm to match countries without prevalence estimates with countries from which OSA epidemiologic studies exist. “The situation was complicated given the variable age of the existing studies, the differences in technology used (e.g., nasal pressure vs. thermistor), the changing scoring criteria, and other sources of variability,” the researchers wrote in their abstract.
Dr. Malhotra reported on data from 38 of 40 countries in the Americas. Drawing from American Academy of Sleep Medicine 2012 criteria and using what they characterized as a “somewhat conservative” approach, the researchers estimated the prevalence of adult OSA in the Americas to be 170 million, or 37% of the population. In addition, they estimate that 81 million adults, or 18% of the population, suffer from moderate to severe OSA based on an apnea hypopnea index of 15 or more per hour. The countries with the greatest burden of OSA are the United States (54 million), Brazil (49 million), and Colombia (11 million).
“The findings will hopefully help to raise awareness about the disease but also encourage a strategic conversation regarding how best to address this large burden,” Dr. Malhotra said. “We are unaware of prior efforts to estimate OSA prevalence on a large scale.”
He acknowledged certain limitations of the study, including that the methods, equipment, definitions, and criteria used in existing studies in the medial literature varied widely. “We did our best to harmonize these methods across studies but obviously we can’t change the equipment that was used in previous studies,” he said. “Thus, we view our findings as an estimate requiring further efforts to corroborate.”
The research stemmed from an academic/industry partnership with ResMed, which provided a donation the UCSD Sleep Medicine Center. Dr. Malhotra reported having no financial disclosures. Dr. Benjafield is an employee of ResMed, a medical equipment company that specializes in sleep-related breathing devices.
SOURCE: Malhotra A et al. SLEEP 2019, Abstract 0477.
REPORTING FROM SLEEP 2019
Key clinical point: The large burden of OSA in the Americas has not been widely appreciated.
Major finding: The estimated prevalence of adult OSA in the Americas is 170 million, or 37% of the population.
Study details: An analysis of epidemiologic studies that included data on 38 countries in the Americas.
Disclosures: The research stemmed from an academic/industry partnership with ResMed, a medical equipment company that specializes in sleep-related breathing devices, which provided a donation the UCSD Sleep Medicine Center. Dr. Malhotra reported having no financial disclosures. Dr. Benjafield is an employee of ResMed.
Source: Malhotra A et al. SLEEP 2019, Abstract 0477.

Immunotherapy drug teplizumab may stall onset of type 1 diabetes
, according to research presented at the annual scientific sessions of the American Diabetes Association.
In this study, 76 first-degree relatives of individuals with type 1 diabetes – who did not themselves have the disease but were considered at high risk because of antibodies and abnormal glucose tolerance tests – were randomized to a single two-week outpatient course of intravenous teplizumab or saline placebo. The patients, of whom 72% were 18 years of age or younger, were followed for a median of 745 days and had twice-yearly oral glucose tolerance testing.
Overall, 43% of the 44 patients who received teplizumab were diagnosed with type 1 diabetes during the course of the study, compared with 72% of the 32 who received the placebo. The treatment was associated with a 59% reduction in the hazard ratio for type 1 diabetes, even after adjusting for age, the results of a second oral glucose-tolerance testing before randomization, or the presence of anti-GAD65 antibodies.
The median time to diagnosis was 48.4 months in the teplizumab group and 24.4 months in the placebo group. The greatest effect was seen in the first year after randomization, during which only 7% of the teplizumab group were diagnosed with type 1 diabetes, compared with 44% of the placebo group. The findings were published simultaneously in the New England Journal of Medicine.
“The delay of progression to type 1 diabetes is of clinical importance, particularly for children, in whom the diagnosis is associated with adverse outcomes, and given the challenges of daily management of the condition,” said Dr. Kevan C. Herold, professor of immunobiology and medicine at Yale University, New Haven, Conn., and coauthors.
There were significantly more adverse events in the teplizumab group, compared with placebo, with three-quarters of the 20 grade 3 adverse events being lymphopenia during the first 30 days. In all but one participant, however, the lymphopenia resolved by day 45. Participants receiving teplizumab also reported a higher incidence of dermatologic adverse events, such as a spontaneously-resolving rash that was experienced by just over one-third of the group.
The researchers also looked for evidence of T-cell unresponsiveness, which has been previously seen in patients with new-onset type 1 diabetes who received treatment with teplizumab. They noted an increase in a particular type of CD8+ T cell associated with T-cell unresponsiveness at months 3 and 6 in participants treated with teplizumab.
Teplizumab is an Fc receptor-nonbinding monoclonal antibody that has been shown to reduce the loss of beta-cell function in patients with type 1 diabetes (Diabetes. 2013 Nov;62(11):3766-74).
The study was supported by the National Institutes of Health, the Juvenile Diabetes Research Foundation, and the American Diabetes Association, with the study drug and additional site monitoring provided by MacroGenics. Eight authors declared grants, personal fees, and other support from private industry, with one also declaring income and stock options from MacroGenics.
SOURCE: Herold K et al. NEJM. 2019 Jun 9. doi: 10.1056/NEJMoa1902226*
*Correction, 6/9/2019: An earlier version of this story misstated the doi number for the journal article. The number is 10.1056/NEJMoa1902226.
While the results of this trial are striking, there are several caveats that are important to note. The trial did show a significant delay in the onset of type 1 diabetes – with the greatest preventive benefit in the first year of the trial – but these results do not necessarily mean that immune modulation represents a potential cure.
They do, however, provide indirect evidence of the pathogenesis of beta-cell destruction and the potential for newer biologic agents to alter the course of this.
The study also was small and involved only a 2-week course of the treatment. As such, there are still questions to be answered about the duration of treatment, longer-term side effects, sub-groups of patients who may respond differently to treatment, and the longer clinical course of those who do respond to treatment.
Julie R. Ingelfinger, MD, is deputy editor of the New England Journal of Medicine, and Clifford J. Rosen, MD, is from the Maine Medical Center Research Institute and is associate editor of the journal. Their comments are adapted from an accompanying editorial (NEJM 2019, Jun 9. doi: 10.1056/NEJMe1907458). No conflicts of interest were declared.
While the results of this trial are striking, there are several caveats that are important to note. The trial did show a significant delay in the onset of type 1 diabetes – with the greatest preventive benefit in the first year of the trial – but these results do not necessarily mean that immune modulation represents a potential cure.
They do, however, provide indirect evidence of the pathogenesis of beta-cell destruction and the potential for newer biologic agents to alter the course of this.
The study also was small and involved only a 2-week course of the treatment. As such, there are still questions to be answered about the duration of treatment, longer-term side effects, sub-groups of patients who may respond differently to treatment, and the longer clinical course of those who do respond to treatment.
Julie R. Ingelfinger, MD, is deputy editor of the New England Journal of Medicine, and Clifford J. Rosen, MD, is from the Maine Medical Center Research Institute and is associate editor of the journal. Their comments are adapted from an accompanying editorial (NEJM 2019, Jun 9. doi: 10.1056/NEJMe1907458). No conflicts of interest were declared.
While the results of this trial are striking, there are several caveats that are important to note. The trial did show a significant delay in the onset of type 1 diabetes – with the greatest preventive benefit in the first year of the trial – but these results do not necessarily mean that immune modulation represents a potential cure.
They do, however, provide indirect evidence of the pathogenesis of beta-cell destruction and the potential for newer biologic agents to alter the course of this.
The study also was small and involved only a 2-week course of the treatment. As such, there are still questions to be answered about the duration of treatment, longer-term side effects, sub-groups of patients who may respond differently to treatment, and the longer clinical course of those who do respond to treatment.
Julie R. Ingelfinger, MD, is deputy editor of the New England Journal of Medicine, and Clifford J. Rosen, MD, is from the Maine Medical Center Research Institute and is associate editor of the journal. Their comments are adapted from an accompanying editorial (NEJM 2019, Jun 9. doi: 10.1056/NEJMe1907458). No conflicts of interest were declared.
, according to research presented at the annual scientific sessions of the American Diabetes Association.
In this study, 76 first-degree relatives of individuals with type 1 diabetes – who did not themselves have the disease but were considered at high risk because of antibodies and abnormal glucose tolerance tests – were randomized to a single two-week outpatient course of intravenous teplizumab or saline placebo. The patients, of whom 72% were 18 years of age or younger, were followed for a median of 745 days and had twice-yearly oral glucose tolerance testing.
Overall, 43% of the 44 patients who received teplizumab were diagnosed with type 1 diabetes during the course of the study, compared with 72% of the 32 who received the placebo. The treatment was associated with a 59% reduction in the hazard ratio for type 1 diabetes, even after adjusting for age, the results of a second oral glucose-tolerance testing before randomization, or the presence of anti-GAD65 antibodies.
The median time to diagnosis was 48.4 months in the teplizumab group and 24.4 months in the placebo group. The greatest effect was seen in the first year after randomization, during which only 7% of the teplizumab group were diagnosed with type 1 diabetes, compared with 44% of the placebo group. The findings were published simultaneously in the New England Journal of Medicine.
“The delay of progression to type 1 diabetes is of clinical importance, particularly for children, in whom the diagnosis is associated with adverse outcomes, and given the challenges of daily management of the condition,” said Dr. Kevan C. Herold, professor of immunobiology and medicine at Yale University, New Haven, Conn., and coauthors.
There were significantly more adverse events in the teplizumab group, compared with placebo, with three-quarters of the 20 grade 3 adverse events being lymphopenia during the first 30 days. In all but one participant, however, the lymphopenia resolved by day 45. Participants receiving teplizumab also reported a higher incidence of dermatologic adverse events, such as a spontaneously-resolving rash that was experienced by just over one-third of the group.
The researchers also looked for evidence of T-cell unresponsiveness, which has been previously seen in patients with new-onset type 1 diabetes who received treatment with teplizumab. They noted an increase in a particular type of CD8+ T cell associated with T-cell unresponsiveness at months 3 and 6 in participants treated with teplizumab.
Teplizumab is an Fc receptor-nonbinding monoclonal antibody that has been shown to reduce the loss of beta-cell function in patients with type 1 diabetes (Diabetes. 2013 Nov;62(11):3766-74).
The study was supported by the National Institutes of Health, the Juvenile Diabetes Research Foundation, and the American Diabetes Association, with the study drug and additional site monitoring provided by MacroGenics. Eight authors declared grants, personal fees, and other support from private industry, with one also declaring income and stock options from MacroGenics.
SOURCE: Herold K et al. NEJM. 2019 Jun 9. doi: 10.1056/NEJMoa1902226*
*Correction, 6/9/2019: An earlier version of this story misstated the doi number for the journal article. The number is 10.1056/NEJMoa1902226.
, according to research presented at the annual scientific sessions of the American Diabetes Association.
In this study, 76 first-degree relatives of individuals with type 1 diabetes – who did not themselves have the disease but were considered at high risk because of antibodies and abnormal glucose tolerance tests – were randomized to a single two-week outpatient course of intravenous teplizumab or saline placebo. The patients, of whom 72% were 18 years of age or younger, were followed for a median of 745 days and had twice-yearly oral glucose tolerance testing.
Overall, 43% of the 44 patients who received teplizumab were diagnosed with type 1 diabetes during the course of the study, compared with 72% of the 32 who received the placebo. The treatment was associated with a 59% reduction in the hazard ratio for type 1 diabetes, even after adjusting for age, the results of a second oral glucose-tolerance testing before randomization, or the presence of anti-GAD65 antibodies.
The median time to diagnosis was 48.4 months in the teplizumab group and 24.4 months in the placebo group. The greatest effect was seen in the first year after randomization, during which only 7% of the teplizumab group were diagnosed with type 1 diabetes, compared with 44% of the placebo group. The findings were published simultaneously in the New England Journal of Medicine.
“The delay of progression to type 1 diabetes is of clinical importance, particularly for children, in whom the diagnosis is associated with adverse outcomes, and given the challenges of daily management of the condition,” said Dr. Kevan C. Herold, professor of immunobiology and medicine at Yale University, New Haven, Conn., and coauthors.
There were significantly more adverse events in the teplizumab group, compared with placebo, with three-quarters of the 20 grade 3 adverse events being lymphopenia during the first 30 days. In all but one participant, however, the lymphopenia resolved by day 45. Participants receiving teplizumab also reported a higher incidence of dermatologic adverse events, such as a spontaneously-resolving rash that was experienced by just over one-third of the group.
The researchers also looked for evidence of T-cell unresponsiveness, which has been previously seen in patients with new-onset type 1 diabetes who received treatment with teplizumab. They noted an increase in a particular type of CD8+ T cell associated with T-cell unresponsiveness at months 3 and 6 in participants treated with teplizumab.
Teplizumab is an Fc receptor-nonbinding monoclonal antibody that has been shown to reduce the loss of beta-cell function in patients with type 1 diabetes (Diabetes. 2013 Nov;62(11):3766-74).
The study was supported by the National Institutes of Health, the Juvenile Diabetes Research Foundation, and the American Diabetes Association, with the study drug and additional site monitoring provided by MacroGenics. Eight authors declared grants, personal fees, and other support from private industry, with one also declaring income and stock options from MacroGenics.
SOURCE: Herold K et al. NEJM. 2019 Jun 9. doi: 10.1056/NEJMoa1902226*
*Correction, 6/9/2019: An earlier version of this story misstated the doi number for the journal article. The number is 10.1056/NEJMoa1902226.
REPORTING FROM ADA 2019
Key clinical point: Teplizumab may delay the onset of type 1 diabetes in individuals at risk.
Major finding: Templizumab treatment was associated with a 59% lower hazard ratio for the diagnosis of type 1 diabetes.
Study details: Phase 2, randomized, double-blind, placebo-controlled trial in 76 participants.
Disclosures: The study was supported by the National Institutes of Health, the Juvenile Diabetes Research Foundation, and the American Diabetes Association, with the study drug and additional site monitoring provided by MacroGenics. Eight authors declared grants, personal fees, and other support from private industry, with one also declaring income and stock options from MacroGenics.
Source: Herold K et al. NEJM 2019, June 9. DOI: 10.1065/NEJMoa1902226.
Survival exceeds 90% in transplant for SCD
FORT LAUDERDALE, FLA. — A multicenter pilot study of a prophylactic regimen for both matched sibling donor and unrelated donor bone marrow transplantation in adults with severe sickle cell disease has found similar overall and event-free survival rates between the two approaches, exceeding 90% and 85%, respectively, at one year, according to preliminary results presented at the annual meeting of the Foundation for Sickle Cell Disease Research.
The results have led to a Phase 2 single-arm, multicenter trial, known as STRIDE , to evaluate a reduced toxicity preparative regimen consisting of busulfan (13.2 mg/kg), fludarabine (175 mg/m 2 ) and antithymocyte globulin (ATG, 6 mg/kg) and cyclosporine or tacrolimus and methotrexate for graft-vs-host disease (GVHD) prophylaxis in adults with sickle cell disease (SCD), said Lakshmanan Krishnamurti, MD, of Children’s Healthcare of Atlanta/Emory University. “The data are similar with 91% overall survival and 86% event-free survival,” he said.
The pilot study, published recently ( Am J Hematol. 2019;94:446-54 ), indicated the effectiveness of non-myeloablative conditioning in SCD patients with matched-sibling bone marrow transplant (BMT), with a higher intensity regimen of busulfan/fludarabine/ATG effective in unrelated donor BMT for other conditions, Dr. Krishnamurti said.
The pilot study also found that three-year event-free survival (EFS) of 82%, and statistically significant improvements in pain and health-related quality of life.
STRIDE is the first comparative study of BMT vs. standard of care in severe SCD, Dr. Krishnamurti added. The primary endpoint is overall survival at two years after biologic assignment, with longer-term outcomes including survival at three to 10 years post-hematopoietic stem cell transplantation (HSCT), and impact of BMT on sickle-related events, organ function, health-related quality of life and chronic pain.
The pilot study included 22 patients between the ages of 17 and 36 who had BMT at eight centers. Seventeen patients received marrow from a sibling-matched donor and five patients received marrow from an unrelated donor.
Dr. Krishnamurti referenced a recent study out of France that showed chimerism levels after transplant may be a determining physiological factor for outcomes (Haematologica. doi:10.3324/haematol.2018.213207 ). “So if chimerism is stable, somewhere in the 25% to 50% or better range, and hemoglobin levels are improved, this decrease hemolysis,” he said. “This is very important in understanding how to manage these patients.”
That study showed that rates of chronic GVHD up to 10 years post-transplant have steadily improved over the past three decades in patients with SCD who’ve had BMT, Dr. Krishnamurti noted. “But chronic GVHD is higher in patients age 16 to 30 vs. patients 15 and younger,” he said, “so that’s the reason to consider transplantation sooner in patients who have a matched sibling donor.”
The French study shows that BMT with sibling-matched donors has excellent outcomes in young children, Dr. Krishnamurti said. “Outcomes for adults with transplantation is becoming similar to that in children,” he added. “Age is an important predictor of outcomes and the risk for progressive morbidity-impaired quality of life and risk of mortality still exists in adults with sickle cell disease.”
The bottom line, he said, is that patients and caregivers must be given the opportunity to consider transplantation as an option at younger ages.
Dr. Krishnamurti did not disclose any financial relationships.
SOURCE: Krishnamurti L et al. FSCDR 2019
FORT LAUDERDALE, FLA. — A multicenter pilot study of a prophylactic regimen for both matched sibling donor and unrelated donor bone marrow transplantation in adults with severe sickle cell disease has found similar overall and event-free survival rates between the two approaches, exceeding 90% and 85%, respectively, at one year, according to preliminary results presented at the annual meeting of the Foundation for Sickle Cell Disease Research.
The results have led to a Phase 2 single-arm, multicenter trial, known as STRIDE , to evaluate a reduced toxicity preparative regimen consisting of busulfan (13.2 mg/kg), fludarabine (175 mg/m 2 ) and antithymocyte globulin (ATG, 6 mg/kg) and cyclosporine or tacrolimus and methotrexate for graft-vs-host disease (GVHD) prophylaxis in adults with sickle cell disease (SCD), said Lakshmanan Krishnamurti, MD, of Children’s Healthcare of Atlanta/Emory University. “The data are similar with 91% overall survival and 86% event-free survival,” he said.
The pilot study, published recently ( Am J Hematol. 2019;94:446-54 ), indicated the effectiveness of non-myeloablative conditioning in SCD patients with matched-sibling bone marrow transplant (BMT), with a higher intensity regimen of busulfan/fludarabine/ATG effective in unrelated donor BMT for other conditions, Dr. Krishnamurti said.
The pilot study also found that three-year event-free survival (EFS) of 82%, and statistically significant improvements in pain and health-related quality of life.
STRIDE is the first comparative study of BMT vs. standard of care in severe SCD, Dr. Krishnamurti added. The primary endpoint is overall survival at two years after biologic assignment, with longer-term outcomes including survival at three to 10 years post-hematopoietic stem cell transplantation (HSCT), and impact of BMT on sickle-related events, organ function, health-related quality of life and chronic pain.
The pilot study included 22 patients between the ages of 17 and 36 who had BMT at eight centers. Seventeen patients received marrow from a sibling-matched donor and five patients received marrow from an unrelated donor.
Dr. Krishnamurti referenced a recent study out of France that showed chimerism levels after transplant may be a determining physiological factor for outcomes (Haematologica. doi:10.3324/haematol.2018.213207 ). “So if chimerism is stable, somewhere in the 25% to 50% or better range, and hemoglobin levels are improved, this decrease hemolysis,” he said. “This is very important in understanding how to manage these patients.”
That study showed that rates of chronic GVHD up to 10 years post-transplant have steadily improved over the past three decades in patients with SCD who’ve had BMT, Dr. Krishnamurti noted. “But chronic GVHD is higher in patients age 16 to 30 vs. patients 15 and younger,” he said, “so that’s the reason to consider transplantation sooner in patients who have a matched sibling donor.”
The French study shows that BMT with sibling-matched donors has excellent outcomes in young children, Dr. Krishnamurti said. “Outcomes for adults with transplantation is becoming similar to that in children,” he added. “Age is an important predictor of outcomes and the risk for progressive morbidity-impaired quality of life and risk of mortality still exists in adults with sickle cell disease.”
The bottom line, he said, is that patients and caregivers must be given the opportunity to consider transplantation as an option at younger ages.
Dr. Krishnamurti did not disclose any financial relationships.
SOURCE: Krishnamurti L et al. FSCDR 2019
FORT LAUDERDALE, FLA. — A multicenter pilot study of a prophylactic regimen for both matched sibling donor and unrelated donor bone marrow transplantation in adults with severe sickle cell disease has found similar overall and event-free survival rates between the two approaches, exceeding 90% and 85%, respectively, at one year, according to preliminary results presented at the annual meeting of the Foundation for Sickle Cell Disease Research.
The results have led to a Phase 2 single-arm, multicenter trial, known as STRIDE , to evaluate a reduced toxicity preparative regimen consisting of busulfan (13.2 mg/kg), fludarabine (175 mg/m 2 ) and antithymocyte globulin (ATG, 6 mg/kg) and cyclosporine or tacrolimus and methotrexate for graft-vs-host disease (GVHD) prophylaxis in adults with sickle cell disease (SCD), said Lakshmanan Krishnamurti, MD, of Children’s Healthcare of Atlanta/Emory University. “The data are similar with 91% overall survival and 86% event-free survival,” he said.
The pilot study, published recently ( Am J Hematol. 2019;94:446-54 ), indicated the effectiveness of non-myeloablative conditioning in SCD patients with matched-sibling bone marrow transplant (BMT), with a higher intensity regimen of busulfan/fludarabine/ATG effective in unrelated donor BMT for other conditions, Dr. Krishnamurti said.
The pilot study also found that three-year event-free survival (EFS) of 82%, and statistically significant improvements in pain and health-related quality of life.
STRIDE is the first comparative study of BMT vs. standard of care in severe SCD, Dr. Krishnamurti added. The primary endpoint is overall survival at two years after biologic assignment, with longer-term outcomes including survival at three to 10 years post-hematopoietic stem cell transplantation (HSCT), and impact of BMT on sickle-related events, organ function, health-related quality of life and chronic pain.
The pilot study included 22 patients between the ages of 17 and 36 who had BMT at eight centers. Seventeen patients received marrow from a sibling-matched donor and five patients received marrow from an unrelated donor.
Dr. Krishnamurti referenced a recent study out of France that showed chimerism levels after transplant may be a determining physiological factor for outcomes (Haematologica. doi:10.3324/haematol.2018.213207 ). “So if chimerism is stable, somewhere in the 25% to 50% or better range, and hemoglobin levels are improved, this decrease hemolysis,” he said. “This is very important in understanding how to manage these patients.”
That study showed that rates of chronic GVHD up to 10 years post-transplant have steadily improved over the past three decades in patients with SCD who’ve had BMT, Dr. Krishnamurti noted. “But chronic GVHD is higher in patients age 16 to 30 vs. patients 15 and younger,” he said, “so that’s the reason to consider transplantation sooner in patients who have a matched sibling donor.”
The French study shows that BMT with sibling-matched donors has excellent outcomes in young children, Dr. Krishnamurti said. “Outcomes for adults with transplantation is becoming similar to that in children,” he added. “Age is an important predictor of outcomes and the risk for progressive morbidity-impaired quality of life and risk of mortality still exists in adults with sickle cell disease.”
The bottom line, he said, is that patients and caregivers must be given the opportunity to consider transplantation as an option at younger ages.
Dr. Krishnamurti did not disclose any financial relationships.
SOURCE: Krishnamurti L et al. FSCDR 2019
REPORTING FROM FSCDR 2019