User login
Bringing you the latest news, research and reviews, exclusive interviews, podcasts, quizzes, and more.
gambling
compulsive behaviors
ammunition
assault rifle
black jack
Boko Haram
bondage
child abuse
cocaine
Daech
drug paraphernalia
explosion
gun
human trafficking
ISIL
ISIS
Islamic caliphate
Islamic state
mixed martial arts
MMA
molestation
national rifle association
NRA
nsfw
pedophile
pedophilia
poker
porn
pornography
psychedelic drug
recreational drug
sex slave rings
slot machine
terrorism
terrorist
Texas hold 'em
UFC
substance abuse
abuseed
abuseer
abusees
abuseing
abusely
abuses
aeolus
aeolused
aeoluser
aeoluses
aeolusing
aeolusly
aeoluss
ahole
aholeed
aholeer
aholees
aholeing
aholely
aholes
alcohol
alcoholed
alcoholer
alcoholes
alcoholing
alcoholly
alcohols
allman
allmaned
allmaner
allmanes
allmaning
allmanly
allmans
alted
altes
alting
altly
alts
analed
analer
anales
analing
anally
analprobe
analprobeed
analprobeer
analprobees
analprobeing
analprobely
analprobes
anals
anilingus
anilingused
anilinguser
anilinguses
anilingusing
anilingusly
anilinguss
anus
anused
anuser
anuses
anusing
anusly
anuss
areola
areolaed
areolaer
areolaes
areolaing
areolaly
areolas
areole
areoleed
areoleer
areolees
areoleing
areolely
areoles
arian
arianed
arianer
arianes
arianing
arianly
arians
aryan
aryaned
aryaner
aryanes
aryaning
aryanly
aryans
asiaed
asiaer
asiaes
asiaing
asialy
asias
ass
ass hole
ass lick
ass licked
ass licker
ass lickes
ass licking
ass lickly
ass licks
assbang
assbanged
assbangeded
assbangeder
assbangedes
assbangeding
assbangedly
assbangeds
assbanger
assbanges
assbanging
assbangly
assbangs
assbangsed
assbangser
assbangses
assbangsing
assbangsly
assbangss
assed
asser
asses
assesed
asseser
asseses
assesing
assesly
assess
assfuck
assfucked
assfucker
assfuckered
assfuckerer
assfuckeres
assfuckering
assfuckerly
assfuckers
assfuckes
assfucking
assfuckly
assfucks
asshat
asshated
asshater
asshates
asshating
asshatly
asshats
assholeed
assholeer
assholees
assholeing
assholely
assholes
assholesed
assholeser
assholeses
assholesing
assholesly
assholess
assing
assly
assmaster
assmastered
assmasterer
assmasteres
assmastering
assmasterly
assmasters
assmunch
assmunched
assmuncher
assmunches
assmunching
assmunchly
assmunchs
asss
asswipe
asswipeed
asswipeer
asswipees
asswipeing
asswipely
asswipes
asswipesed
asswipeser
asswipeses
asswipesing
asswipesly
asswipess
azz
azzed
azzer
azzes
azzing
azzly
azzs
babeed
babeer
babees
babeing
babely
babes
babesed
babeser
babeses
babesing
babesly
babess
ballsac
ballsaced
ballsacer
ballsaces
ballsacing
ballsack
ballsacked
ballsacker
ballsackes
ballsacking
ballsackly
ballsacks
ballsacly
ballsacs
ballsed
ballser
ballses
ballsing
ballsly
ballss
barf
barfed
barfer
barfes
barfing
barfly
barfs
bastard
bastarded
bastarder
bastardes
bastarding
bastardly
bastards
bastardsed
bastardser
bastardses
bastardsing
bastardsly
bastardss
bawdy
bawdyed
bawdyer
bawdyes
bawdying
bawdyly
bawdys
beaner
beanered
beanerer
beaneres
beanering
beanerly
beaners
beardedclam
beardedclamed
beardedclamer
beardedclames
beardedclaming
beardedclamly
beardedclams
beastiality
beastialityed
beastialityer
beastialityes
beastialitying
beastialityly
beastialitys
beatch
beatched
beatcher
beatches
beatching
beatchly
beatchs
beater
beatered
beaterer
beateres
beatering
beaterly
beaters
beered
beerer
beeres
beering
beerly
beeyotch
beeyotched
beeyotcher
beeyotches
beeyotching
beeyotchly
beeyotchs
beotch
beotched
beotcher
beotches
beotching
beotchly
beotchs
biatch
biatched
biatcher
biatches
biatching
biatchly
biatchs
big tits
big titsed
big titser
big titses
big titsing
big titsly
big titss
bigtits
bigtitsed
bigtitser
bigtitses
bigtitsing
bigtitsly
bigtitss
bimbo
bimboed
bimboer
bimboes
bimboing
bimboly
bimbos
bisexualed
bisexualer
bisexuales
bisexualing
bisexually
bisexuals
bitch
bitched
bitcheded
bitcheder
bitchedes
bitcheding
bitchedly
bitcheds
bitcher
bitches
bitchesed
bitcheser
bitcheses
bitchesing
bitchesly
bitchess
bitching
bitchly
bitchs
bitchy
bitchyed
bitchyer
bitchyes
bitchying
bitchyly
bitchys
bleached
bleacher
bleaches
bleaching
bleachly
bleachs
blow job
blow jobed
blow jober
blow jobes
blow jobing
blow jobly
blow jobs
blowed
blower
blowes
blowing
blowjob
blowjobed
blowjober
blowjobes
blowjobing
blowjobly
blowjobs
blowjobsed
blowjobser
blowjobses
blowjobsing
blowjobsly
blowjobss
blowly
blows
boink
boinked
boinker
boinkes
boinking
boinkly
boinks
bollock
bollocked
bollocker
bollockes
bollocking
bollockly
bollocks
bollocksed
bollockser
bollockses
bollocksing
bollocksly
bollockss
bollok
bolloked
bolloker
bollokes
bolloking
bollokly
bolloks
boner
bonered
bonerer
boneres
bonering
bonerly
boners
bonersed
bonerser
bonerses
bonersing
bonersly
bonerss
bong
bonged
bonger
bonges
bonging
bongly
bongs
boob
boobed
boober
boobes
boobies
boobiesed
boobieser
boobieses
boobiesing
boobiesly
boobiess
boobing
boobly
boobs
boobsed
boobser
boobses
boobsing
boobsly
boobss
booby
boobyed
boobyer
boobyes
boobying
boobyly
boobys
booger
boogered
boogerer
boogeres
boogering
boogerly
boogers
bookie
bookieed
bookieer
bookiees
bookieing
bookiely
bookies
bootee
booteeed
booteeer
booteees
booteeing
booteely
bootees
bootie
bootieed
bootieer
bootiees
bootieing
bootiely
booties
booty
bootyed
bootyer
bootyes
bootying
bootyly
bootys
boozeed
boozeer
boozees
boozeing
boozely
boozer
boozered
boozerer
boozeres
boozering
boozerly
boozers
boozes
boozy
boozyed
boozyer
boozyes
boozying
boozyly
boozys
bosomed
bosomer
bosomes
bosoming
bosomly
bosoms
bosomy
bosomyed
bosomyer
bosomyes
bosomying
bosomyly
bosomys
bugger
buggered
buggerer
buggeres
buggering
buggerly
buggers
bukkake
bukkakeed
bukkakeer
bukkakees
bukkakeing
bukkakely
bukkakes
bull shit
bull shited
bull shiter
bull shites
bull shiting
bull shitly
bull shits
bullshit
bullshited
bullshiter
bullshites
bullshiting
bullshitly
bullshits
bullshitsed
bullshitser
bullshitses
bullshitsing
bullshitsly
bullshitss
bullshitted
bullshitteded
bullshitteder
bullshittedes
bullshitteding
bullshittedly
bullshitteds
bullturds
bullturdsed
bullturdser
bullturdses
bullturdsing
bullturdsly
bullturdss
bung
bunged
bunger
bunges
bunging
bungly
bungs
busty
bustyed
bustyer
bustyes
bustying
bustyly
bustys
butt
butt fuck
butt fucked
butt fucker
butt fuckes
butt fucking
butt fuckly
butt fucks
butted
buttes
buttfuck
buttfucked
buttfucker
buttfuckered
buttfuckerer
buttfuckeres
buttfuckering
buttfuckerly
buttfuckers
buttfuckes
buttfucking
buttfuckly
buttfucks
butting
buttly
buttplug
buttpluged
buttpluger
buttpluges
buttpluging
buttplugly
buttplugs
butts
caca
cacaed
cacaer
cacaes
cacaing
cacaly
cacas
cahone
cahoneed
cahoneer
cahonees
cahoneing
cahonely
cahones
cameltoe
cameltoeed
cameltoeer
cameltoees
cameltoeing
cameltoely
cameltoes
carpetmuncher
carpetmunchered
carpetmuncherer
carpetmuncheres
carpetmunchering
carpetmuncherly
carpetmunchers
cawk
cawked
cawker
cawkes
cawking
cawkly
cawks
chinc
chinced
chincer
chinces
chincing
chincly
chincs
chincsed
chincser
chincses
chincsing
chincsly
chincss
chink
chinked
chinker
chinkes
chinking
chinkly
chinks
chode
chodeed
chodeer
chodees
chodeing
chodely
chodes
chodesed
chodeser
chodeses
chodesing
chodesly
chodess
clit
clited
cliter
clites
cliting
clitly
clitoris
clitorised
clitoriser
clitorises
clitorising
clitorisly
clitoriss
clitorus
clitorused
clitoruser
clitoruses
clitorusing
clitorusly
clitoruss
clits
clitsed
clitser
clitses
clitsing
clitsly
clitss
clitty
clittyed
clittyer
clittyes
clittying
clittyly
clittys
cocain
cocaine
cocained
cocaineed
cocaineer
cocainees
cocaineing
cocainely
cocainer
cocaines
cocaining
cocainly
cocains
cock
cock sucker
cock suckered
cock suckerer
cock suckeres
cock suckering
cock suckerly
cock suckers
cockblock
cockblocked
cockblocker
cockblockes
cockblocking
cockblockly
cockblocks
cocked
cocker
cockes
cockholster
cockholstered
cockholsterer
cockholsteres
cockholstering
cockholsterly
cockholsters
cocking
cockknocker
cockknockered
cockknockerer
cockknockeres
cockknockering
cockknockerly
cockknockers
cockly
cocks
cocksed
cockser
cockses
cocksing
cocksly
cocksmoker
cocksmokered
cocksmokerer
cocksmokeres
cocksmokering
cocksmokerly
cocksmokers
cockss
cocksucker
cocksuckered
cocksuckerer
cocksuckeres
cocksuckering
cocksuckerly
cocksuckers
coital
coitaled
coitaler
coitales
coitaling
coitally
coitals
commie
commieed
commieer
commiees
commieing
commiely
commies
condomed
condomer
condomes
condoming
condomly
condoms
coon
cooned
cooner
coones
cooning
coonly
coons
coonsed
coonser
coonses
coonsing
coonsly
coonss
corksucker
corksuckered
corksuckerer
corksuckeres
corksuckering
corksuckerly
corksuckers
cracked
crackwhore
crackwhoreed
crackwhoreer
crackwhorees
crackwhoreing
crackwhorely
crackwhores
crap
craped
craper
crapes
craping
craply
crappy
crappyed
crappyer
crappyes
crappying
crappyly
crappys
cum
cumed
cumer
cumes
cuming
cumly
cummin
cummined
cumminer
cummines
cumming
cumminged
cumminger
cumminges
cumminging
cummingly
cummings
cummining
cumminly
cummins
cums
cumshot
cumshoted
cumshoter
cumshotes
cumshoting
cumshotly
cumshots
cumshotsed
cumshotser
cumshotses
cumshotsing
cumshotsly
cumshotss
cumslut
cumsluted
cumsluter
cumslutes
cumsluting
cumslutly
cumsluts
cumstain
cumstained
cumstainer
cumstaines
cumstaining
cumstainly
cumstains
cunilingus
cunilingused
cunilinguser
cunilinguses
cunilingusing
cunilingusly
cunilinguss
cunnilingus
cunnilingused
cunnilinguser
cunnilinguses
cunnilingusing
cunnilingusly
cunnilinguss
cunny
cunnyed
cunnyer
cunnyes
cunnying
cunnyly
cunnys
cunt
cunted
cunter
cuntes
cuntface
cuntfaceed
cuntfaceer
cuntfacees
cuntfaceing
cuntfacely
cuntfaces
cunthunter
cunthuntered
cunthunterer
cunthunteres
cunthuntering
cunthunterly
cunthunters
cunting
cuntlick
cuntlicked
cuntlicker
cuntlickered
cuntlickerer
cuntlickeres
cuntlickering
cuntlickerly
cuntlickers
cuntlickes
cuntlicking
cuntlickly
cuntlicks
cuntly
cunts
cuntsed
cuntser
cuntses
cuntsing
cuntsly
cuntss
dago
dagoed
dagoer
dagoes
dagoing
dagoly
dagos
dagosed
dagoser
dagoses
dagosing
dagosly
dagoss
dammit
dammited
dammiter
dammites
dammiting
dammitly
dammits
damn
damned
damneded
damneder
damnedes
damneding
damnedly
damneds
damner
damnes
damning
damnit
damnited
damniter
damnites
damniting
damnitly
damnits
damnly
damns
dick
dickbag
dickbaged
dickbager
dickbages
dickbaging
dickbagly
dickbags
dickdipper
dickdippered
dickdipperer
dickdipperes
dickdippering
dickdipperly
dickdippers
dicked
dicker
dickes
dickface
dickfaceed
dickfaceer
dickfacees
dickfaceing
dickfacely
dickfaces
dickflipper
dickflippered
dickflipperer
dickflipperes
dickflippering
dickflipperly
dickflippers
dickhead
dickheaded
dickheader
dickheades
dickheading
dickheadly
dickheads
dickheadsed
dickheadser
dickheadses
dickheadsing
dickheadsly
dickheadss
dicking
dickish
dickished
dickisher
dickishes
dickishing
dickishly
dickishs
dickly
dickripper
dickrippered
dickripperer
dickripperes
dickrippering
dickripperly
dickrippers
dicks
dicksipper
dicksippered
dicksipperer
dicksipperes
dicksippering
dicksipperly
dicksippers
dickweed
dickweeded
dickweeder
dickweedes
dickweeding
dickweedly
dickweeds
dickwhipper
dickwhippered
dickwhipperer
dickwhipperes
dickwhippering
dickwhipperly
dickwhippers
dickzipper
dickzippered
dickzipperer
dickzipperes
dickzippering
dickzipperly
dickzippers
diddle
diddleed
diddleer
diddlees
diddleing
diddlely
diddles
dike
dikeed
dikeer
dikees
dikeing
dikely
dikes
dildo
dildoed
dildoer
dildoes
dildoing
dildoly
dildos
dildosed
dildoser
dildoses
dildosing
dildosly
dildoss
diligaf
diligafed
diligafer
diligafes
diligafing
diligafly
diligafs
dillweed
dillweeded
dillweeder
dillweedes
dillweeding
dillweedly
dillweeds
dimwit
dimwited
dimwiter
dimwites
dimwiting
dimwitly
dimwits
dingle
dingleed
dingleer
dinglees
dingleing
dinglely
dingles
dipship
dipshiped
dipshiper
dipshipes
dipshiping
dipshiply
dipships
dizzyed
dizzyer
dizzyes
dizzying
dizzyly
dizzys
doggiestyleed
doggiestyleer
doggiestylees
doggiestyleing
doggiestylely
doggiestyles
doggystyleed
doggystyleer
doggystylees
doggystyleing
doggystylely
doggystyles
dong
donged
donger
donges
donging
dongly
dongs
doofus
doofused
doofuser
doofuses
doofusing
doofusly
doofuss
doosh
dooshed
doosher
dooshes
dooshing
dooshly
dooshs
dopeyed
dopeyer
dopeyes
dopeying
dopeyly
dopeys
douchebag
douchebaged
douchebager
douchebages
douchebaging
douchebagly
douchebags
douchebagsed
douchebagser
douchebagses
douchebagsing
douchebagsly
douchebagss
doucheed
doucheer
douchees
doucheing
douchely
douches
douchey
doucheyed
doucheyer
doucheyes
doucheying
doucheyly
doucheys
drunk
drunked
drunker
drunkes
drunking
drunkly
drunks
dumass
dumassed
dumasser
dumasses
dumassing
dumassly
dumasss
dumbass
dumbassed
dumbasser
dumbasses
dumbassesed
dumbasseser
dumbasseses
dumbassesing
dumbassesly
dumbassess
dumbassing
dumbassly
dumbasss
dummy
dummyed
dummyer
dummyes
dummying
dummyly
dummys
dyke
dykeed
dykeer
dykees
dykeing
dykely
dykes
dykesed
dykeser
dykeses
dykesing
dykesly
dykess
erotic
eroticed
eroticer
erotices
eroticing
eroticly
erotics
extacy
extacyed
extacyer
extacyes
extacying
extacyly
extacys
extasy
extasyed
extasyer
extasyes
extasying
extasyly
extasys
fack
facked
facker
fackes
facking
fackly
facks
fag
faged
fager
fages
fagg
fagged
faggeded
faggeder
faggedes
faggeding
faggedly
faggeds
fagger
fagges
fagging
faggit
faggited
faggiter
faggites
faggiting
faggitly
faggits
faggly
faggot
faggoted
faggoter
faggotes
faggoting
faggotly
faggots
faggs
faging
fagly
fagot
fagoted
fagoter
fagotes
fagoting
fagotly
fagots
fags
fagsed
fagser
fagses
fagsing
fagsly
fagss
faig
faiged
faiger
faiges
faiging
faigly
faigs
faigt
faigted
faigter
faigtes
faigting
faigtly
faigts
fannybandit
fannybandited
fannybanditer
fannybandites
fannybanditing
fannybanditly
fannybandits
farted
farter
fartes
farting
fartknocker
fartknockered
fartknockerer
fartknockeres
fartknockering
fartknockerly
fartknockers
fartly
farts
felch
felched
felcher
felchered
felcherer
felcheres
felchering
felcherly
felchers
felches
felching
felchinged
felchinger
felchinges
felchinging
felchingly
felchings
felchly
felchs
fellate
fellateed
fellateer
fellatees
fellateing
fellately
fellates
fellatio
fellatioed
fellatioer
fellatioes
fellatioing
fellatioly
fellatios
feltch
feltched
feltcher
feltchered
feltcherer
feltcheres
feltchering
feltcherly
feltchers
feltches
feltching
feltchly
feltchs
feom
feomed
feomer
feomes
feoming
feomly
feoms
fisted
fisteded
fisteder
fistedes
fisteding
fistedly
fisteds
fisting
fistinged
fistinger
fistinges
fistinging
fistingly
fistings
fisty
fistyed
fistyer
fistyes
fistying
fistyly
fistys
floozy
floozyed
floozyer
floozyes
floozying
floozyly
floozys
foad
foaded
foader
foades
foading
foadly
foads
fondleed
fondleer
fondlees
fondleing
fondlely
fondles
foobar
foobared
foobarer
foobares
foobaring
foobarly
foobars
freex
freexed
freexer
freexes
freexing
freexly
freexs
frigg
frigga
friggaed
friggaer
friggaes
friggaing
friggaly
friggas
frigged
frigger
frigges
frigging
friggly
friggs
fubar
fubared
fubarer
fubares
fubaring
fubarly
fubars
fuck
fuckass
fuckassed
fuckasser
fuckasses
fuckassing
fuckassly
fuckasss
fucked
fuckeded
fuckeder
fuckedes
fuckeding
fuckedly
fuckeds
fucker
fuckered
fuckerer
fuckeres
fuckering
fuckerly
fuckers
fuckes
fuckface
fuckfaceed
fuckfaceer
fuckfacees
fuckfaceing
fuckfacely
fuckfaces
fuckin
fuckined
fuckiner
fuckines
fucking
fuckinged
fuckinger
fuckinges
fuckinging
fuckingly
fuckings
fuckining
fuckinly
fuckins
fuckly
fucknugget
fucknuggeted
fucknuggeter
fucknuggetes
fucknuggeting
fucknuggetly
fucknuggets
fucknut
fucknuted
fucknuter
fucknutes
fucknuting
fucknutly
fucknuts
fuckoff
fuckoffed
fuckoffer
fuckoffes
fuckoffing
fuckoffly
fuckoffs
fucks
fucksed
fuckser
fuckses
fucksing
fucksly
fuckss
fucktard
fucktarded
fucktarder
fucktardes
fucktarding
fucktardly
fucktards
fuckup
fuckuped
fuckuper
fuckupes
fuckuping
fuckuply
fuckups
fuckwad
fuckwaded
fuckwader
fuckwades
fuckwading
fuckwadly
fuckwads
fuckwit
fuckwited
fuckwiter
fuckwites
fuckwiting
fuckwitly
fuckwits
fudgepacker
fudgepackered
fudgepackerer
fudgepackeres
fudgepackering
fudgepackerly
fudgepackers
fuk
fuked
fuker
fukes
fuking
fukly
fuks
fvck
fvcked
fvcker
fvckes
fvcking
fvckly
fvcks
fxck
fxcked
fxcker
fxckes
fxcking
fxckly
fxcks
gae
gaeed
gaeer
gaees
gaeing
gaely
gaes
gai
gaied
gaier
gaies
gaiing
gaily
gais
ganja
ganjaed
ganjaer
ganjaes
ganjaing
ganjaly
ganjas
gayed
gayer
gayes
gaying
gayly
gays
gaysed
gayser
gayses
gaysing
gaysly
gayss
gey
geyed
geyer
geyes
geying
geyly
geys
gfc
gfced
gfcer
gfces
gfcing
gfcly
gfcs
gfy
gfyed
gfyer
gfyes
gfying
gfyly
gfys
ghay
ghayed
ghayer
ghayes
ghaying
ghayly
ghays
ghey
gheyed
gheyer
gheyes
gheying
gheyly
gheys
gigolo
gigoloed
gigoloer
gigoloes
gigoloing
gigololy
gigolos
goatse
goatseed
goatseer
goatsees
goatseing
goatsely
goatses
godamn
godamned
godamner
godamnes
godamning
godamnit
godamnited
godamniter
godamnites
godamniting
godamnitly
godamnits
godamnly
godamns
goddam
goddamed
goddamer
goddames
goddaming
goddamly
goddammit
goddammited
goddammiter
goddammites
goddammiting
goddammitly
goddammits
goddamn
goddamned
goddamner
goddamnes
goddamning
goddamnly
goddamns
goddams
goldenshower
goldenshowered
goldenshowerer
goldenshoweres
goldenshowering
goldenshowerly
goldenshowers
gonad
gonaded
gonader
gonades
gonading
gonadly
gonads
gonadsed
gonadser
gonadses
gonadsing
gonadsly
gonadss
gook
gooked
gooker
gookes
gooking
gookly
gooks
gooksed
gookser
gookses
gooksing
gooksly
gookss
gringo
gringoed
gringoer
gringoes
gringoing
gringoly
gringos
gspot
gspoted
gspoter
gspotes
gspoting
gspotly
gspots
gtfo
gtfoed
gtfoer
gtfoes
gtfoing
gtfoly
gtfos
guido
guidoed
guidoer
guidoes
guidoing
guidoly
guidos
handjob
handjobed
handjober
handjobes
handjobing
handjobly
handjobs
hard on
hard oned
hard oner
hard ones
hard oning
hard only
hard ons
hardknight
hardknighted
hardknighter
hardknightes
hardknighting
hardknightly
hardknights
hebe
hebeed
hebeer
hebees
hebeing
hebely
hebes
heeb
heebed
heeber
heebes
heebing
heebly
heebs
hell
helled
heller
helles
helling
hellly
hells
hemp
hemped
hemper
hempes
hemping
hemply
hemps
heroined
heroiner
heroines
heroining
heroinly
heroins
herp
herped
herper
herpes
herpesed
herpeser
herpeses
herpesing
herpesly
herpess
herping
herply
herps
herpy
herpyed
herpyer
herpyes
herpying
herpyly
herpys
hitler
hitlered
hitlerer
hitleres
hitlering
hitlerly
hitlers
hived
hiver
hives
hiving
hivly
hivs
hobag
hobaged
hobager
hobages
hobaging
hobagly
hobags
homey
homeyed
homeyer
homeyes
homeying
homeyly
homeys
homo
homoed
homoer
homoes
homoey
homoeyed
homoeyer
homoeyes
homoeying
homoeyly
homoeys
homoing
homoly
homos
honky
honkyed
honkyer
honkyes
honkying
honkyly
honkys
hooch
hooched
hoocher
hooches
hooching
hoochly
hoochs
hookah
hookahed
hookaher
hookahes
hookahing
hookahly
hookahs
hooker
hookered
hookerer
hookeres
hookering
hookerly
hookers
hoor
hoored
hoorer
hoores
hooring
hoorly
hoors
hootch
hootched
hootcher
hootches
hootching
hootchly
hootchs
hooter
hootered
hooterer
hooteres
hootering
hooterly
hooters
hootersed
hooterser
hooterses
hootersing
hootersly
hooterss
horny
hornyed
hornyer
hornyes
hornying
hornyly
hornys
houstoned
houstoner
houstones
houstoning
houstonly
houstons
hump
humped
humpeded
humpeder
humpedes
humpeding
humpedly
humpeds
humper
humpes
humping
humpinged
humpinger
humpinges
humpinging
humpingly
humpings
humply
humps
husbanded
husbander
husbandes
husbanding
husbandly
husbands
hussy
hussyed
hussyer
hussyes
hussying
hussyly
hussys
hymened
hymener
hymenes
hymening
hymenly
hymens
inbred
inbreded
inbreder
inbredes
inbreding
inbredly
inbreds
incest
incested
incester
incestes
incesting
incestly
incests
injun
injuned
injuner
injunes
injuning
injunly
injuns
jackass
jackassed
jackasser
jackasses
jackassing
jackassly
jackasss
jackhole
jackholeed
jackholeer
jackholees
jackholeing
jackholely
jackholes
jackoff
jackoffed
jackoffer
jackoffes
jackoffing
jackoffly
jackoffs
jap
japed
japer
japes
japing
japly
japs
japsed
japser
japses
japsing
japsly
japss
jerkoff
jerkoffed
jerkoffer
jerkoffes
jerkoffing
jerkoffly
jerkoffs
jerks
jism
jismed
jismer
jismes
jisming
jismly
jisms
jiz
jized
jizer
jizes
jizing
jizly
jizm
jizmed
jizmer
jizmes
jizming
jizmly
jizms
jizs
jizz
jizzed
jizzeded
jizzeder
jizzedes
jizzeding
jizzedly
jizzeds
jizzer
jizzes
jizzing
jizzly
jizzs
junkie
junkieed
junkieer
junkiees
junkieing
junkiely
junkies
junky
junkyed
junkyer
junkyes
junkying
junkyly
junkys
kike
kikeed
kikeer
kikees
kikeing
kikely
kikes
kikesed
kikeser
kikeses
kikesing
kikesly
kikess
killed
killer
killes
killing
killly
kills
kinky
kinkyed
kinkyer
kinkyes
kinkying
kinkyly
kinkys
kkk
kkked
kkker
kkkes
kkking
kkkly
kkks
klan
klaned
klaner
klanes
klaning
klanly
klans
knobend
knobended
knobender
knobendes
knobending
knobendly
knobends
kooch
kooched
koocher
kooches
koochesed
koocheser
koocheses
koochesing
koochesly
koochess
kooching
koochly
koochs
kootch
kootched
kootcher
kootches
kootching
kootchly
kootchs
kraut
krauted
krauter
krautes
krauting
krautly
krauts
kyke
kykeed
kykeer
kykees
kykeing
kykely
kykes
lech
leched
lecher
leches
leching
lechly
lechs
leper
lepered
leperer
leperes
lepering
leperly
lepers
lesbiansed
lesbianser
lesbianses
lesbiansing
lesbiansly
lesbianss
lesbo
lesboed
lesboer
lesboes
lesboing
lesboly
lesbos
lesbosed
lesboser
lesboses
lesbosing
lesbosly
lesboss
lez
lezbianed
lezbianer
lezbianes
lezbianing
lezbianly
lezbians
lezbiansed
lezbianser
lezbianses
lezbiansing
lezbiansly
lezbianss
lezbo
lezboed
lezboer
lezboes
lezboing
lezboly
lezbos
lezbosed
lezboser
lezboses
lezbosing
lezbosly
lezboss
lezed
lezer
lezes
lezing
lezly
lezs
lezzie
lezzieed
lezzieer
lezziees
lezzieing
lezziely
lezzies
lezziesed
lezzieser
lezzieses
lezziesing
lezziesly
lezziess
lezzy
lezzyed
lezzyer
lezzyes
lezzying
lezzyly
lezzys
lmaoed
lmaoer
lmaoes
lmaoing
lmaoly
lmaos
lmfao
lmfaoed
lmfaoer
lmfaoes
lmfaoing
lmfaoly
lmfaos
loined
loiner
loines
loining
loinly
loins
loinsed
loinser
loinses
loinsing
loinsly
loinss
lubeed
lubeer
lubees
lubeing
lubely
lubes
lusty
lustyed
lustyer
lustyes
lustying
lustyly
lustys
massa
massaed
massaer
massaes
massaing
massaly
massas
masterbate
masterbateed
masterbateer
masterbatees
masterbateing
masterbately
masterbates
masterbating
masterbatinged
masterbatinger
masterbatinges
masterbatinging
masterbatingly
masterbatings
masterbation
masterbationed
masterbationer
masterbationes
masterbationing
masterbationly
masterbations
masturbate
masturbateed
masturbateer
masturbatees
masturbateing
masturbately
masturbates
masturbating
masturbatinged
masturbatinger
masturbatinges
masturbatinging
masturbatingly
masturbatings
masturbation
masturbationed
masturbationer
masturbationes
masturbationing
masturbationly
masturbations
methed
mether
methes
mething
methly
meths
militaryed
militaryer
militaryes
militarying
militaryly
militarys
mofo
mofoed
mofoer
mofoes
mofoing
mofoly
mofos
molest
molested
molester
molestes
molesting
molestly
molests
moolie
moolieed
moolieer
mooliees
moolieing
mooliely
moolies
moron
moroned
moroner
morones
moroning
moronly
morons
motherfucka
motherfuckaed
motherfuckaer
motherfuckaes
motherfuckaing
motherfuckaly
motherfuckas
motherfucker
motherfuckered
motherfuckerer
motherfuckeres
motherfuckering
motherfuckerly
motherfuckers
motherfucking
motherfuckinged
motherfuckinger
motherfuckinges
motherfuckinging
motherfuckingly
motherfuckings
mtherfucker
mtherfuckered
mtherfuckerer
mtherfuckeres
mtherfuckering
mtherfuckerly
mtherfuckers
mthrfucker
mthrfuckered
mthrfuckerer
mthrfuckeres
mthrfuckering
mthrfuckerly
mthrfuckers
mthrfucking
mthrfuckinged
mthrfuckinger
mthrfuckinges
mthrfuckinging
mthrfuckingly
mthrfuckings
muff
muffdiver
muffdivered
muffdiverer
muffdiveres
muffdivering
muffdiverly
muffdivers
muffed
muffer
muffes
muffing
muffly
muffs
murdered
murderer
murderes
murdering
murderly
murders
muthafuckaz
muthafuckazed
muthafuckazer
muthafuckazes
muthafuckazing
muthafuckazly
muthafuckazs
muthafucker
muthafuckered
muthafuckerer
muthafuckeres
muthafuckering
muthafuckerly
muthafuckers
mutherfucker
mutherfuckered
mutherfuckerer
mutherfuckeres
mutherfuckering
mutherfuckerly
mutherfuckers
mutherfucking
mutherfuckinged
mutherfuckinger
mutherfuckinges
mutherfuckinging
mutherfuckingly
mutherfuckings
muthrfucking
muthrfuckinged
muthrfuckinger
muthrfuckinges
muthrfuckinging
muthrfuckingly
muthrfuckings
nad
naded
nader
nades
nading
nadly
nads
nadsed
nadser
nadses
nadsing
nadsly
nadss
nakeded
nakeder
nakedes
nakeding
nakedly
nakeds
napalm
napalmed
napalmer
napalmes
napalming
napalmly
napalms
nappy
nappyed
nappyer
nappyes
nappying
nappyly
nappys
nazi
nazied
nazier
nazies
naziing
nazily
nazis
nazism
nazismed
nazismer
nazismes
nazisming
nazismly
nazisms
negro
negroed
negroer
negroes
negroing
negroly
negros
nigga
niggaed
niggaer
niggaes
niggah
niggahed
niggaher
niggahes
niggahing
niggahly
niggahs
niggaing
niggaly
niggas
niggased
niggaser
niggases
niggasing
niggasly
niggass
niggaz
niggazed
niggazer
niggazes
niggazing
niggazly
niggazs
nigger
niggered
niggerer
niggeres
niggering
niggerly
niggers
niggersed
niggerser
niggerses
niggersing
niggersly
niggerss
niggle
niggleed
niggleer
nigglees
niggleing
nigglely
niggles
niglet
nigleted
nigleter
nigletes
nigleting
nigletly
niglets
nimrod
nimroded
nimroder
nimrodes
nimroding
nimrodly
nimrods
ninny
ninnyed
ninnyer
ninnyes
ninnying
ninnyly
ninnys
nooky
nookyed
nookyer
nookyes
nookying
nookyly
nookys
nuccitelli
nuccitellied
nuccitellier
nuccitellies
nuccitelliing
nuccitellily
nuccitellis
nympho
nymphoed
nymphoer
nymphoes
nymphoing
nympholy
nymphos
opium
opiumed
opiumer
opiumes
opiuming
opiumly
opiums
orgies
orgiesed
orgieser
orgieses
orgiesing
orgiesly
orgiess
orgy
orgyed
orgyer
orgyes
orgying
orgyly
orgys
paddy
paddyed
paddyer
paddyes
paddying
paddyly
paddys
paki
pakied
pakier
pakies
pakiing
pakily
pakis
pantie
pantieed
pantieer
pantiees
pantieing
pantiely
panties
pantiesed
pantieser
pantieses
pantiesing
pantiesly
pantiess
panty
pantyed
pantyer
pantyes
pantying
pantyly
pantys
pastie
pastieed
pastieer
pastiees
pastieing
pastiely
pasties
pasty
pastyed
pastyer
pastyes
pastying
pastyly
pastys
pecker
peckered
peckerer
peckeres
peckering
peckerly
peckers
pedo
pedoed
pedoer
pedoes
pedoing
pedoly
pedophile
pedophileed
pedophileer
pedophilees
pedophileing
pedophilely
pedophiles
pedophilia
pedophiliac
pedophiliaced
pedophiliacer
pedophiliaces
pedophiliacing
pedophiliacly
pedophiliacs
pedophiliaed
pedophiliaer
pedophiliaes
pedophiliaing
pedophilialy
pedophilias
pedos
penial
penialed
penialer
peniales
penialing
penially
penials
penile
penileed
penileer
penilees
penileing
penilely
peniles
penis
penised
peniser
penises
penising
penisly
peniss
perversion
perversioned
perversioner
perversiones
perversioning
perversionly
perversions
peyote
peyoteed
peyoteer
peyotees
peyoteing
peyotely
peyotes
phuck
phucked
phucker
phuckes
phucking
phuckly
phucks
pillowbiter
pillowbitered
pillowbiterer
pillowbiteres
pillowbitering
pillowbiterly
pillowbiters
pimp
pimped
pimper
pimpes
pimping
pimply
pimps
pinko
pinkoed
pinkoer
pinkoes
pinkoing
pinkoly
pinkos
pissed
pisseded
pisseder
pissedes
pisseding
pissedly
pisseds
pisser
pisses
pissing
pissly
pissoff
pissoffed
pissoffer
pissoffes
pissoffing
pissoffly
pissoffs
pisss
polack
polacked
polacker
polackes
polacking
polackly
polacks
pollock
pollocked
pollocker
pollockes
pollocking
pollockly
pollocks
poon
pooned
pooner
poones
pooning
poonly
poons
poontang
poontanged
poontanger
poontanges
poontanging
poontangly
poontangs
porn
porned
porner
pornes
porning
pornly
porno
pornoed
pornoer
pornoes
pornography
pornographyed
pornographyer
pornographyes
pornographying
pornographyly
pornographys
pornoing
pornoly
pornos
porns
prick
pricked
pricker
prickes
pricking
prickly
pricks
prig
priged
priger
priges
priging
prigly
prigs
prostitute
prostituteed
prostituteer
prostitutees
prostituteing
prostitutely
prostitutes
prude
prudeed
prudeer
prudees
prudeing
prudely
prudes
punkass
punkassed
punkasser
punkasses
punkassing
punkassly
punkasss
punky
punkyed
punkyer
punkyes
punkying
punkyly
punkys
puss
pussed
pusser
pusses
pussies
pussiesed
pussieser
pussieses
pussiesing
pussiesly
pussiess
pussing
pussly
pusss
pussy
pussyed
pussyer
pussyes
pussying
pussyly
pussypounder
pussypoundered
pussypounderer
pussypounderes
pussypoundering
pussypounderly
pussypounders
pussys
puto
putoed
putoer
putoes
putoing
putoly
putos
queaf
queafed
queafer
queafes
queafing
queafly
queafs
queef
queefed
queefer
queefes
queefing
queefly
queefs
queer
queered
queerer
queeres
queering
queerly
queero
queeroed
queeroer
queeroes
queeroing
queeroly
queeros
queers
queersed
queerser
queerses
queersing
queersly
queerss
quicky
quickyed
quickyer
quickyes
quickying
quickyly
quickys
quim
quimed
quimer
quimes
quiming
quimly
quims
racy
racyed
racyer
racyes
racying
racyly
racys
rape
raped
rapeded
rapeder
rapedes
rapeding
rapedly
rapeds
rapeed
rapeer
rapees
rapeing
rapely
raper
rapered
raperer
raperes
rapering
raperly
rapers
rapes
rapist
rapisted
rapister
rapistes
rapisting
rapistly
rapists
raunch
raunched
rauncher
raunches
raunching
raunchly
raunchs
rectus
rectused
rectuser
rectuses
rectusing
rectusly
rectuss
reefer
reefered
reeferer
reeferes
reefering
reeferly
reefers
reetard
reetarded
reetarder
reetardes
reetarding
reetardly
reetards
reich
reiched
reicher
reiches
reiching
reichly
reichs
retard
retarded
retardeded
retardeder
retardedes
retardeding
retardedly
retardeds
retarder
retardes
retarding
retardly
retards
rimjob
rimjobed
rimjober
rimjobes
rimjobing
rimjobly
rimjobs
ritard
ritarded
ritarder
ritardes
ritarding
ritardly
ritards
rtard
rtarded
rtarder
rtardes
rtarding
rtardly
rtards
rum
rumed
rumer
rumes
ruming
rumly
rump
rumped
rumper
rumpes
rumping
rumply
rumprammer
rumprammered
rumprammerer
rumprammeres
rumprammering
rumprammerly
rumprammers
rumps
rums
ruski
ruskied
ruskier
ruskies
ruskiing
ruskily
ruskis
sadism
sadismed
sadismer
sadismes
sadisming
sadismly
sadisms
sadist
sadisted
sadister
sadistes
sadisting
sadistly
sadists
scag
scaged
scager
scages
scaging
scagly
scags
scantily
scantilyed
scantilyer
scantilyes
scantilying
scantilyly
scantilys
schlong
schlonged
schlonger
schlonges
schlonging
schlongly
schlongs
scrog
scroged
scroger
scroges
scroging
scrogly
scrogs
scrot
scrote
scroted
scroteed
scroteer
scrotees
scroteing
scrotely
scroter
scrotes
scroting
scrotly
scrots
scrotum
scrotumed
scrotumer
scrotumes
scrotuming
scrotumly
scrotums
scrud
scruded
scruder
scrudes
scruding
scrudly
scruds
scum
scumed
scumer
scumes
scuming
scumly
scums
seaman
seamaned
seamaner
seamanes
seamaning
seamanly
seamans
seamen
seamened
seamener
seamenes
seamening
seamenly
seamens
seduceed
seduceer
seducees
seduceing
seducely
seduces
semen
semened
semener
semenes
semening
semenly
semens
shamedame
shamedameed
shamedameer
shamedamees
shamedameing
shamedamely
shamedames
shit
shite
shiteater
shiteatered
shiteaterer
shiteateres
shiteatering
shiteaterly
shiteaters
shited
shiteed
shiteer
shitees
shiteing
shitely
shiter
shites
shitface
shitfaceed
shitfaceer
shitfacees
shitfaceing
shitfacely
shitfaces
shithead
shitheaded
shitheader
shitheades
shitheading
shitheadly
shitheads
shithole
shitholeed
shitholeer
shitholees
shitholeing
shitholely
shitholes
shithouse
shithouseed
shithouseer
shithousees
shithouseing
shithousely
shithouses
shiting
shitly
shits
shitsed
shitser
shitses
shitsing
shitsly
shitss
shitt
shitted
shitteded
shitteder
shittedes
shitteding
shittedly
shitteds
shitter
shittered
shitterer
shitteres
shittering
shitterly
shitters
shittes
shitting
shittly
shitts
shitty
shittyed
shittyer
shittyes
shittying
shittyly
shittys
shiz
shized
shizer
shizes
shizing
shizly
shizs
shooted
shooter
shootes
shooting
shootly
shoots
sissy
sissyed
sissyer
sissyes
sissying
sissyly
sissys
skag
skaged
skager
skages
skaging
skagly
skags
skank
skanked
skanker
skankes
skanking
skankly
skanks
slave
slaveed
slaveer
slavees
slaveing
slavely
slaves
sleaze
sleazeed
sleazeer
sleazees
sleazeing
sleazely
sleazes
sleazy
sleazyed
sleazyer
sleazyes
sleazying
sleazyly
sleazys
slut
slutdumper
slutdumpered
slutdumperer
slutdumperes
slutdumpering
slutdumperly
slutdumpers
sluted
sluter
slutes
sluting
slutkiss
slutkissed
slutkisser
slutkisses
slutkissing
slutkissly
slutkisss
slutly
sluts
slutsed
slutser
slutses
slutsing
slutsly
slutss
smegma
smegmaed
smegmaer
smegmaes
smegmaing
smegmaly
smegmas
smut
smuted
smuter
smutes
smuting
smutly
smuts
smutty
smuttyed
smuttyer
smuttyes
smuttying
smuttyly
smuttys
snatch
snatched
snatcher
snatches
snatching
snatchly
snatchs
sniper
snipered
sniperer
sniperes
snipering
sniperly
snipers
snort
snorted
snorter
snortes
snorting
snortly
snorts
snuff
snuffed
snuffer
snuffes
snuffing
snuffly
snuffs
sodom
sodomed
sodomer
sodomes
sodoming
sodomly
sodoms
spic
spiced
spicer
spices
spicing
spick
spicked
spicker
spickes
spicking
spickly
spicks
spicly
spics
spik
spoof
spoofed
spoofer
spoofes
spoofing
spoofly
spoofs
spooge
spoogeed
spoogeer
spoogees
spoogeing
spoogely
spooges
spunk
spunked
spunker
spunkes
spunking
spunkly
spunks
steamyed
steamyer
steamyes
steamying
steamyly
steamys
stfu
stfued
stfuer
stfues
stfuing
stfuly
stfus
stiffy
stiffyed
stiffyer
stiffyes
stiffying
stiffyly
stiffys
stoneded
stoneder
stonedes
stoneding
stonedly
stoneds
stupided
stupider
stupides
stupiding
stupidly
stupids
suckeded
suckeder
suckedes
suckeding
suckedly
suckeds
sucker
suckes
sucking
suckinged
suckinger
suckinges
suckinging
suckingly
suckings
suckly
sucks
sumofabiatch
sumofabiatched
sumofabiatcher
sumofabiatches
sumofabiatching
sumofabiatchly
sumofabiatchs
tard
tarded
tarder
tardes
tarding
tardly
tards
tawdry
tawdryed
tawdryer
tawdryes
tawdrying
tawdryly
tawdrys
teabagging
teabagginged
teabagginger
teabagginges
teabagginging
teabaggingly
teabaggings
terd
terded
terder
terdes
terding
terdly
terds
teste
testee
testeed
testeeed
testeeer
testeees
testeeing
testeely
testeer
testees
testeing
testely
testes
testesed
testeser
testeses
testesing
testesly
testess
testicle
testicleed
testicleer
testiclees
testicleing
testiclely
testicles
testis
testised
testiser
testises
testising
testisly
testiss
thrusted
thruster
thrustes
thrusting
thrustly
thrusts
thug
thuged
thuger
thuges
thuging
thugly
thugs
tinkle
tinkleed
tinkleer
tinklees
tinkleing
tinklely
tinkles
tit
tited
titer
tites
titfuck
titfucked
titfucker
titfuckes
titfucking
titfuckly
titfucks
titi
titied
titier
tities
titiing
titily
titing
titis
titly
tits
titsed
titser
titses
titsing
titsly
titss
tittiefucker
tittiefuckered
tittiefuckerer
tittiefuckeres
tittiefuckering
tittiefuckerly
tittiefuckers
titties
tittiesed
tittieser
tittieses
tittiesing
tittiesly
tittiess
titty
tittyed
tittyer
tittyes
tittyfuck
tittyfucked
tittyfucker
tittyfuckered
tittyfuckerer
tittyfuckeres
tittyfuckering
tittyfuckerly
tittyfuckers
tittyfuckes
tittyfucking
tittyfuckly
tittyfucks
tittying
tittyly
tittys
toke
tokeed
tokeer
tokees
tokeing
tokely
tokes
toots
tootsed
tootser
tootses
tootsing
tootsly
tootss
tramp
tramped
tramper
trampes
tramping
tramply
tramps
transsexualed
transsexualer
transsexuales
transsexualing
transsexually
transsexuals
trashy
trashyed
trashyer
trashyes
trashying
trashyly
trashys
tubgirl
tubgirled
tubgirler
tubgirles
tubgirling
tubgirlly
tubgirls
turd
turded
turder
turdes
turding
turdly
turds
tush
tushed
tusher
tushes
tushing
tushly
tushs
twat
twated
twater
twates
twating
twatly
twats
twatsed
twatser
twatses
twatsing
twatsly
twatss
undies
undiesed
undieser
undieses
undiesing
undiesly
undiess
unweded
unweder
unwedes
unweding
unwedly
unweds
uzi
uzied
uzier
uzies
uziing
uzily
uzis
vag
vaged
vager
vages
vaging
vagly
vags
valium
valiumed
valiumer
valiumes
valiuming
valiumly
valiums
venous
virgined
virginer
virgines
virgining
virginly
virgins
vixen
vixened
vixener
vixenes
vixening
vixenly
vixens
vodkaed
vodkaer
vodkaes
vodkaing
vodkaly
vodkas
voyeur
voyeured
voyeurer
voyeures
voyeuring
voyeurly
voyeurs
vulgar
vulgared
vulgarer
vulgares
vulgaring
vulgarly
vulgars
wang
wanged
wanger
wanges
wanging
wangly
wangs
wank
wanked
wanker
wankered
wankerer
wankeres
wankering
wankerly
wankers
wankes
wanking
wankly
wanks
wazoo
wazooed
wazooer
wazooes
wazooing
wazooly
wazoos
wedgie
wedgieed
wedgieer
wedgiees
wedgieing
wedgiely
wedgies
weeded
weeder
weedes
weeding
weedly
weeds
weenie
weenieed
weenieer
weeniees
weenieing
weeniely
weenies
weewee
weeweeed
weeweeer
weeweees
weeweeing
weeweely
weewees
weiner
weinered
weinerer
weineres
weinering
weinerly
weiners
weirdo
weirdoed
weirdoer
weirdoes
weirdoing
weirdoly
weirdos
wench
wenched
wencher
wenches
wenching
wenchly
wenchs
wetback
wetbacked
wetbacker
wetbackes
wetbacking
wetbackly
wetbacks
whitey
whiteyed
whiteyer
whiteyes
whiteying
whiteyly
whiteys
whiz
whized
whizer
whizes
whizing
whizly
whizs
whoralicious
whoralicioused
whoraliciouser
whoraliciouses
whoraliciousing
whoraliciously
whoraliciouss
whore
whorealicious
whorealicioused
whorealiciouser
whorealiciouses
whorealiciousing
whorealiciously
whorealiciouss
whored
whoreded
whoreder
whoredes
whoreding
whoredly
whoreds
whoreed
whoreer
whorees
whoreface
whorefaceed
whorefaceer
whorefacees
whorefaceing
whorefacely
whorefaces
whorehopper
whorehoppered
whorehopperer
whorehopperes
whorehoppering
whorehopperly
whorehoppers
whorehouse
whorehouseed
whorehouseer
whorehousees
whorehouseing
whorehousely
whorehouses
whoreing
whorely
whores
whoresed
whoreser
whoreses
whoresing
whoresly
whoress
whoring
whoringed
whoringer
whoringes
whoringing
whoringly
whorings
wigger
wiggered
wiggerer
wiggeres
wiggering
wiggerly
wiggers
woody
woodyed
woodyer
woodyes
woodying
woodyly
woodys
wop
woped
woper
wopes
woping
woply
wops
wtf
wtfed
wtfer
wtfes
wtfing
wtfly
wtfs
xxx
xxxed
xxxer
xxxes
xxxing
xxxly
xxxs
yeasty
yeastyed
yeastyer
yeastyes
yeastying
yeastyly
yeastys
yobbo
yobboed
yobboer
yobboes
yobboing
yobboly
yobbos
zoophile
zoophileed
zoophileer
zoophilees
zoophileing
zoophilely
zoophiles
anal
ass
ass lick
balls
ballsac
bisexual
bleach
causas
cheap
cost of miracles
cunt
display network stats
fart
fda and death
fda AND warn
fda AND warning
fda AND warns
feom
fuck
gfc
humira AND expensive
illegal
madvocate
masturbation
nuccitelli
overdose
porn
shit
snort
texarkana
Bipolar depression
Depression
adolescent depression
adolescent major depressive disorder
adolescent schizophrenia
adolescent with major depressive disorder
animals
autism
baby
brexpiprazole
child
child bipolar
child depression
child schizophrenia
children with bipolar disorder
children with depression
children with major depressive disorder
compulsive behaviors
cure
elderly bipolar
elderly depression
elderly major depressive disorder
elderly schizophrenia
elderly with dementia
first break
first episode
gambling
gaming
geriatric depression
geriatric major depressive disorder
geriatric schizophrenia
infant
kid
major depressive disorder
major depressive disorder in adolescents
major depressive disorder in children
parenting
pediatric
pediatric bipolar
pediatric depression
pediatric major depressive disorder
pediatric schizophrenia
pregnancy
pregnant
rexulti
skin care
teen
wine
section[contains(@class, 'nav-hidden')]
footer[@id='footer']
div[contains(@class, 'pane-node-field-article-topics')]
section[contains(@class, 'footer-nav-section-wrapper')]
section[contains(@class, 'content-row')]
div[contains(@class, 'panel-pane pane-article-read-next')]
A peer-reviewed clinical journal serving healthcare professionals working with the Department of Veterans Affairs, the Department of Defense, and the Public Health Service.
Outcomes After Prolonged ICU Stays in Postoperative Cardiac Surgery Patients
Prolonged intensive care unit (ICU) stays, variably defined as > 48 h to > 14 days, are a known complication of cardiac surgery.1-8 Prolonged stays are associated with higher resource utilization and higher mortality.2,3,9-12 Although there are several cardiac surgery risk models that can be used preoperatively to identify patients at risk for prolonged ICU stay, factors that influence outcomes for patients who experience prolonged ICU stays are poorly understood.2,13-19 Little information is available to inform discussions between health care practitioners (HCPs) and patients throughout a prolonged ICU stay, especially those ≥ 7 days.
As cardiac surgical complexity, patient age, and preexisting comorbidities have increased over time, so has the need to provide patients and HCPs with data to inform decision making, enhance prognostication, and set realistic expectations at varying time intervals during prolonged ICU stay. The purpose of this study was to evaluate short- and long-term outcomes in cardiac surgery patients after prolonged ICU stays at relevant time intervals (7, 14, 21, and 28 days) and to determine factors that may predict a patient’s outcome after a prolonged ICU stay.
Methods
The University of Michigan Health System Institutional Review Board approved this study and waived informed consent. We merged the University of Michigan Medical Center Society of Thoracic Surgeons (STS) database, which is updated periodically with late mortality, with elements of the electronic health record (EHR). Adult patients were included if they had cardiac surgery at the University of Michigan between January 2, 2001, and December 31, 2011. Late mortality was updated through December 1, 2014. Data are presented as frequency (%), mean (SD), and median (IQR) as appropriate. Bivariate comparisons between survivors and nonsurvivors were done with χ2 or Fisher exact test for categorical data, Student t test for continuous normally distributed data, and Wilcoxon rank sum test for continuous not normally distributed data. To determine factors associated with operative mortality (death within 30 days of surgery or hospital discharge, whichever occurred later), we used logistic regression with forward selection. All available factors were initially entered in the models.
Separate logistic models were created based on all data available at days 7, 14, 21, and 28. Final models consisted of factors with statistically significant P values (< .05) and adjusted odds ratios (AORs) with 95% CIs that excluded 1. To determine factors associated with late mortality, we used a Cox proportional hazard model, which used data available at discharge and STS complications. As these complications did not include their timing, they could only be used in models created at discharge and not for days 7, 14, 21, and 28 models. Final models consisted of factors with P values < .05 and 95% CIs of the AORs or the hazard ratios (HRs) that excluded 1. As the EHR did not start recording data until January 2, 2004, and its capture of data remained incomplete for several years, rather than imputing these missing data or excluding these patients, we chose to create an extra categorical level for each factor to represent missing data. For continuous factors with missing data, we first converted the continuous data to terciles and the missing data became the fourth level.20,21
The discrimination of the logistic models were determined by the c-statistic and for the Cox proportional hazards model with the Harrell concordance index (C index). Time trends were assessed with the Cochran-Armitage trend test. P < .05 was deemed statistically significant. Statistics were calculated with SPSS versions 21-23 or SAS 9.4.
Results
Of 8309 admissions to the ICU after cardiac surgery, 1174 (14%) had ICU stays ≥ 7 days, 386 (5%) ≥ 14 days, 201 (2%) ≥ 21 days, and 80 (0.9%) ≥ 28 days. The prolonged ICU study population was mostly male, White race, with a mean (SD) age of 62 (14) years. Patients had a variety of comorbidities, most notably 61% had hypertension and half had heart failure. Valve surgery (55%) was the most common procedure (n = 651). Twenty-nine percent required > 1 procedure (eAppendix 1).
The operative mortality 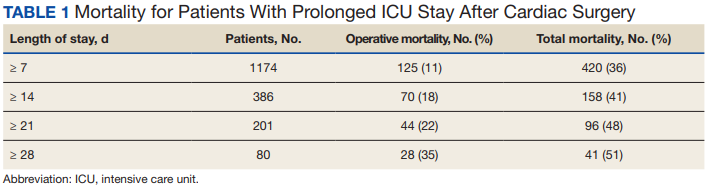
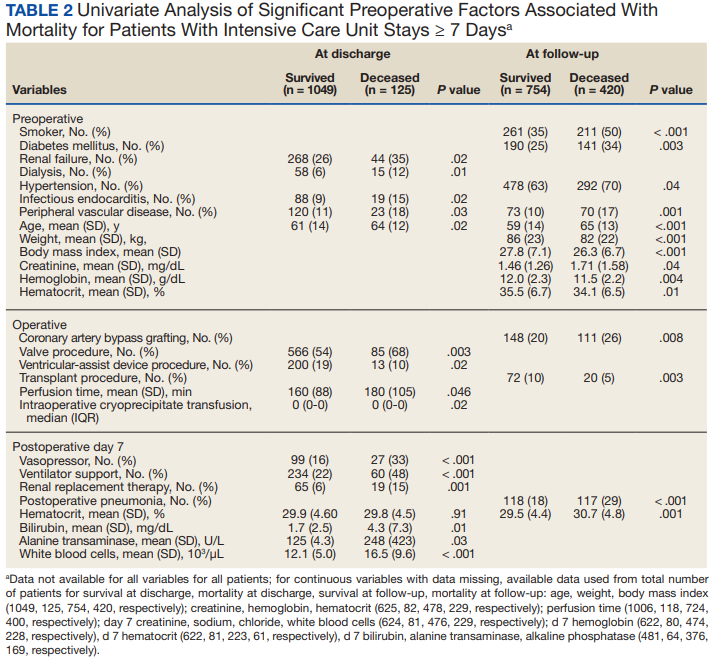
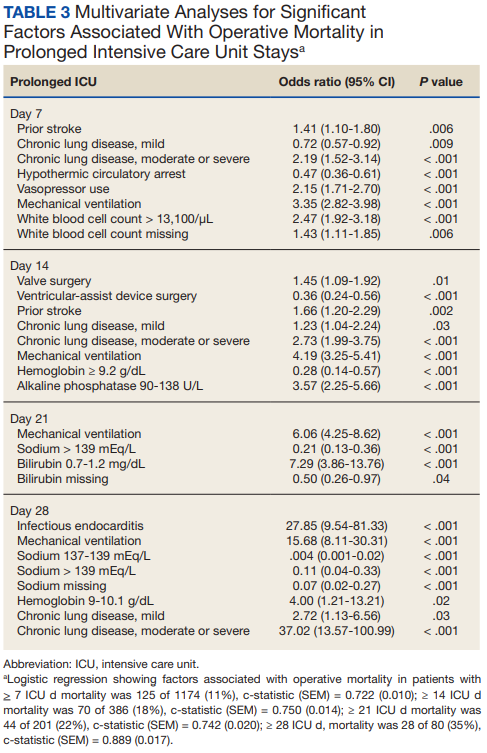
Using multivariable logistic regression to adjust for factors associated with mortality, we found that receiving mechanical ventilation on the day of analysis was associated with increased operative mortality with AOR increasing from 3.35 (95% CI, 2.82-3.98) for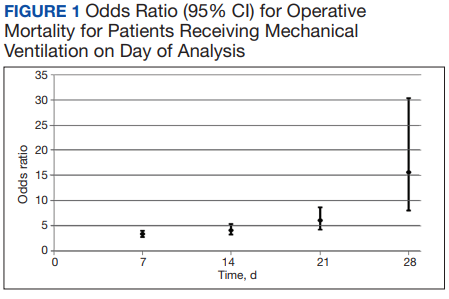
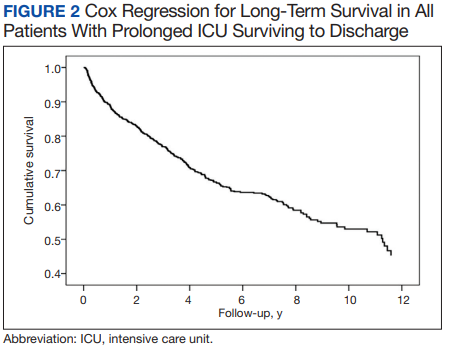

After multivariable Cox regression to adjust for confounders, we found that each postoperative week was associated with a 7% higher hazard of dying (HR, 1.07; 95% CI, 1.07-1.07; P < .001). Postoperative pneumonia was also associated with increased hazard of dying (HR, 1.59; 95% CI, 1.27-1.99; P < .001), 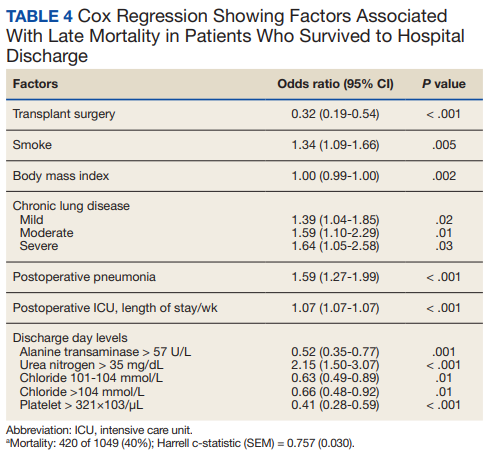
Discussion
We found that operative mortality increased the longer the patient stayed in the ICU, ranging from 11% for ≥ 7 days to 35% for ≥ 28 days. We further found that in ICU survivors, median (IQR) survival was 10.7 (0.7) years. While previous studies have evaluated prolonged ICU stays, they have been limited by studying limited subpopulations, such as patients who are dependent on dialysis or octogenarians, or used a single cutoff to define prolonged ICU stays, variably defined from > 48 hours to > 14 days.2-7,9-12,22 Our study is similar to others that used ≥ 2 cutoffs.1,8 However, our study was novel by providing 4 cutoffs to improve temporal prediction of hospital outcomes. Unlike a study by Ryan and colleagues, which found no increase in mortality with longer stay (43.5% for ≥ 14 days and 45% for ≥ 28 days), our study findings are similar to those of Yu and colleagues (11.1% mortality for prolonged ICU stays of 1 to 2 weeks, 26.6% for 2 to 4 weeks, and 31% for > 4 weeks) and others (8%, 3 to 14 days; 40%, >14 days; 10%, 1 to 2 weeks; 25.7% > 2 weeks) in finding a progressively increased hospital mortality with longer ICU stays.1,4,5,8 These differences may be related to different ICU populations or to improvements in care since Ryan and colleagues study was conducted.
Fewer studies have evaluated factors associated with mortality in cardiac surgery prolonged ICU stay patients. Our study is similar to other studies that evaluated risk factors by finding associations between a variety of comorbidities and process of care associated with both operative and long-term mortality; however, comparison between these studies is limited by the varying factors analyzed.1,3,5,6,8,9,11 We found that mechanical ventilation on days 7, 14, 21, and 28 was strongly associated with operative mortality, similar to noncardiac surgery patients and cardiac surgery patients.6,23,24 While we found several processes of care, such as catecholamine use and transfusions to be associated with mortality, which is similar to other studies, notably, we did not find an association between renal replacement therapy and mortality.1,25 While there is an association between renal replacement therapy and mortality in ICU patients, its status in cardiac surgery patients with prolonged ICU stays is less clear.26 While Ryan and colleagues found an association between renal replacement therapy and hospital mortality in patients staying ≥ 14 days, they did not find it in patients staying ≥.
28 days.1 Other studies of prolonged ICU stays for cardiac surgery patients have also failed to find an association between renal replacement therapy and mortality.5,6,9 Importantly, practice that expedites liberation from mechanical ventilation, such as fast tracking, daily spontaneous breathing trials, extubation to noninvasive respiratory support, and pulmonary rehabilitation may all have potential to limit mechanical ventilation duration and improve hospital survival and deserve further study.27-29Median (IQR) survival in hospital survivors was 10.7 (0.7) years, which is generally better than previously reported, but similar to that reported by Silberman and colleagues.2,4,6,8,11,12 Differences between these studies may relate to different patient populations within the cardiac surgery ICUs, definitions of prolonged ICU stays, or eras of care. Further study is needed to clarify these discrepancies. We found that cardiac transplantation and obesity were associated with the least risk of dying, while smoking, lung disease, and postoperative pneumonia were independently associated with increased hazard of dying. The obesity paradox, where obesity is protective, has been previously observed in cardiac surgery patients.30
Strengths and Limitations
There are several limitations of this study. This is a single center study, and our patient population and processes of care may differ from other centers, limiting its generalizability. Notably, we do fewer coronary bypass operations and more aortic reconstructions and ventricular assist device insertions than do many other centers. Second, we did not have laboratory values for about one-third of patients (preceded EHR implementation). However, we were able to compensate for this by binning values and including missing data as an extra bin.20,21
The main strength of this study is that we were able to combine disparate records to assess a large number of potential factors associated with both operative and long-term mortality. This produced models that had good to very good discrimination. By producing models at 7, 14, 21, and 28 days to predict operative mortality and a model at discharge, it may help to provide objective data to facilitate conversations with patients and their families. However, further studies to externally validate these models should be conducted.
Conclusions
We found that longer prolonged ICU stays are associated with both operative and late mortality. Receiving mechanical ventilation on days 7, 14, 21, or 28 was strongly associated with operative mortality.
1. Ryan TA, Rady MY, Bashour A, Leventhal M, Lytle B, Starr NJ. Predictors of outcome in cardiac surgical patients with prolonged intensive care stay. Chest. 1997;112(4):1035-1042. doi:10.1378/chest.112.4.1035
2. Hein OV, Birnbaum J, Wernecke K, England M, Konertz W, Spies C. Prolonged intensive care unit stay in cardiac surgery: risk factors and long-term-survival. Ann Thorac Surg. 2006;81(3):880-885. doi:10.1016/j.athoracsur.2005.09.077
3. Mahesh B, Choong CK, Goldsmith K, Gerrard C, Nashef SA, Vuylsteke A. Prolonged stay in intensive care unit is a powerful predictor of adverse outcomes after cardiac operations. Ann Thoracic Surg. 2012;94(1):109-116. doi:10.1016/j.athoracsur.2012.02.010
4. Silberman S, Bitran D, Fink D, Tauber R, Merin O. Very prolonged stay in the intensive care unit after cardiac operations: early results and late survival. Ann Thorac Surg. 2013;96(1):15-21. doi:10.1016/j.athoracsur.2013.01.103
5. Lapar DJ, Gillen JR, Crosby IK, et al. Predictors of operative mortality in cardiac surgical patients with prolonged intensive care unit duration. J Am Coll Surg. 2013;216(6):1116-1123. doi:10.1016/j.jamcollsurg.2013.02.028
6. Manji RA, Arora RC, Singal RK, et al. Long-term outcome and predictors of noninstitutionalized survival subsequent to prolonged intensive care unit stay after cardiac surgical procedures. Ann Thorac Surg. 2016;101(1):56-63. doi:10.1016/j.athoracsur.2015.07.004
7. Augustin P, Tanaka S, Chhor V, et al. Prognosis of prolonged intensive care unit stay after aortic valve replacement for severe aortic stenosis in octogenarians. J Cardiothorac Vasc Anesth. 2016;30(6):1555-1561. doi:10.1053/j.jvca.2016.07.029
8. Yu PJ, Cassiere HA, Fishbein J, Esposito RA, Hartman AR. Outcomes of patients with prolonged intensive care unit stay after cardiac surgery. J Cardiothorac Vasc Anesth. 2016;30(6):1550-1554. doi:10.1053/j.jvca.2016.03.145
9. Bashour CA, Yared JP, Ryan TA, et al. Long-term survival and functional capacity in cardiac surgery patients after prolonged intensive care. Crit Care Med. 2000;28(12):3847-3853. doi:10.1097/00003246-200012000-00018
10. Isgro F, Skuras JA, Kiessling AH, Lehmann A, Saggau W. Survival and quality of life after a long-term intensive care stay. Thorac Cardiovasc Surg. 2002;50(2):95-99. doi:10.1055/s-2002-26693
11. Williams MR, Wellner RB, Hartnett EA, Hartnett EA, Thornton B, Kavarana MN, Mahapatra R, Oz MC Sladen R. Long-term survival and quality of life in cardiac surgical patients with prolonged intensive care unit length of stay. Ann Thorac Surg. 2002;73(5):1472-1478.
12. Lagercrantz E, Lindblom D, Sartipy U. Survival and quality of life in cardiac surgery patients with prolonged intensive care. Ann Thorac Surg. 2010;89:490-495. doi:10.1016/s0003-4975(02)03464-1
13. Edwards FH, Clark RE, Schwartz M. Coronary artery bypass grafting: the Society of Thoracic Surgeons National Database experience. Ann Thorac Surg. 1994;57(1):12-19. doi:10.1016/0003-4975(94)90358-1
14. Lawrence DR, Valencia O, Smith EE, Murday A, Treasure T. Parsonnet score is a good predictor of the duration of intensive care unit stay following cardiac surgery. Heart. 2000;83(4):429-432. doi:10.1136/heart.83.4.429
15. Janssen DP, Noyez L, Wouters C, Brouwer RM. Preoperative prediction of prolonged stay in the intensive care unit for coronary bypass surgery. Eur J Cardiothorac Surg. 2004;25(2):203-207. doi:10.1016/j.ejcts.2003.11.005
16. Nilsson J, Algotsson L, Hoglund P, Luhrs C, Brandt J. EuroSCORE predicts intensive care unit stay and costs of open heart surgery. Ann Thorac Surg. 2004;78(5):1528-1534. doi:10.1016/j.athoracsur.2004.04.060
17. Ghotkar SV, Grayson AD, Fabri BM, Dihmis WC, Pullan DM. Preoperative calculation of risk for prolonged intensive care unit stay following coronary artery bypass grafting. J Cardiothorac Surg. 2006;1:14. doi:10.1186/1749-8090-1-1418. Messaoudi N, Decocker J, Stockman BA, Bossaert LL, Rodrigus IE. Is EuroSCORE useful in the prediction of extended intensive care unit stay after cardiac surgery? Eur J Cardiothoracic Surg. 2009;36(1):35-39. doi:10.1016/j.ejcts.2009.02.007
19. Ettema RG, Peelen LM, Schuurmans MJ, Nierich AP, Kalkman CJ, Moons KG. Prediction models for prolonged intensive care unit stay after cardiac surgery: systematic review and validation study. Circulation. 2010;122(7):682-689. doi:10.1161/CIRCULATIONAHA.109.926808
20. Engoren M. Does erythrocyte blood transfusion prevent acute kidney injury? Propensity-matched case control analysis. Anesthesiology. 2010;113(5):1126-1133. doi:10.1097/ALN.0b013e181f70f56
21. UK National Centre for Research Methods. Minimising the effect of missing data. Revised July 22, 2011. Accessed June 28, 2022. www.restore.ac.uk/srme/www/fac/soc/wie/research-new/srme/modules/mod3/9/index.html.
22. Leontyev S, Davierwala PM, Gaube LM, et al. Outcomes of dialysis-dependent patients after cardiac operations in a single-center experience of 483 patients. Ann Thorac Surg. 2017;103(4):1270-1276. doi:10.1016/j.athoracsur.2016.07.05223. Freundlich RE, Maile MD, Sferra JJ, Jewell ES, Kheterpal S, Engoren M. Complications associated with mortality in the National Surgical Quality Improvement Program Database. Anesth Analg. 2018;127(1):55-62. doi:10.1213/ANE.0000000000002799
24. Freundlich RE, Maile MD, Hajjar MM, et al. Years of life lost after complications of coronary artery bypass operations. Ann Thorac Surg. 2017;103(6):1893-1899. doi:10.1016/j.athoracsur.2016.09.048
25. Koch CG, Li L, Sessler DI, et al. Duration of red-cell storage and complications after cardiac surgery. N Engl J Med. 2008;358(12):1229-1239. doi:10.1056/NEJMoa070403
26. Truche AS, Ragey SP, Souweine B, et al. ICU survival and need of renal replacement therapy with respect to AKI duration in critically ill patients. Ann Intensive Care. 2018;8(1):127. doi:10.1186/s13613-018-0467-6
27. Kollef MH, Shapiro SD, Silver P, et al. A randomized, controlled trial of protocol-directed versus physician-directed weaning from mechanical ventilation. Crit Care Med. 1997;25(4):567-574. doi:10.1097/00003246-199704000-00004
28. McWilliams D, Weblin J, Atkins G, et al. Enhancing rehabilitation of mechanically ventilated patients in the intensive care unit: a quality improvement project. J Crit Care. 2015;30(1):13-18. doi:10.1016/j.jcrc.2014.09.018
29. Hernandez G, Vaquero C, Gonzalez P, et al. Effect of postextubation high-flow nasal cannula vs conventional oxygen therapy on reintubation in low-risk patients: a randomized clinical trial. JAMA. 2016;315(13):1354-1361. doi:10.1001/jama.2016.2711
30. Schwann TA, Ramira PS, Engoren MC, et al. Evidence and temporality of the obesity paradox in coronary bypass surgery: an analysis of cause-specific mortality. Eur J Cardiothorac Surg. 2018;54(5):896-903. doi:10.1093/ejcts/ezy207
Prolonged intensive care unit (ICU) stays, variably defined as > 48 h to > 14 days, are a known complication of cardiac surgery.1-8 Prolonged stays are associated with higher resource utilization and higher mortality.2,3,9-12 Although there are several cardiac surgery risk models that can be used preoperatively to identify patients at risk for prolonged ICU stay, factors that influence outcomes for patients who experience prolonged ICU stays are poorly understood.2,13-19 Little information is available to inform discussions between health care practitioners (HCPs) and patients throughout a prolonged ICU stay, especially those ≥ 7 days.
As cardiac surgical complexity, patient age, and preexisting comorbidities have increased over time, so has the need to provide patients and HCPs with data to inform decision making, enhance prognostication, and set realistic expectations at varying time intervals during prolonged ICU stay. The purpose of this study was to evaluate short- and long-term outcomes in cardiac surgery patients after prolonged ICU stays at relevant time intervals (7, 14, 21, and 28 days) and to determine factors that may predict a patient’s outcome after a prolonged ICU stay.
Methods
The University of Michigan Health System Institutional Review Board approved this study and waived informed consent. We merged the University of Michigan Medical Center Society of Thoracic Surgeons (STS) database, which is updated periodically with late mortality, with elements of the electronic health record (EHR). Adult patients were included if they had cardiac surgery at the University of Michigan between January 2, 2001, and December 31, 2011. Late mortality was updated through December 1, 2014. Data are presented as frequency (%), mean (SD), and median (IQR) as appropriate. Bivariate comparisons between survivors and nonsurvivors were done with χ2 or Fisher exact test for categorical data, Student t test for continuous normally distributed data, and Wilcoxon rank sum test for continuous not normally distributed data. To determine factors associated with operative mortality (death within 30 days of surgery or hospital discharge, whichever occurred later), we used logistic regression with forward selection. All available factors were initially entered in the models.
Separate logistic models were created based on all data available at days 7, 14, 21, and 28. Final models consisted of factors with statistically significant P values (< .05) and adjusted odds ratios (AORs) with 95% CIs that excluded 1. To determine factors associated with late mortality, we used a Cox proportional hazard model, which used data available at discharge and STS complications. As these complications did not include their timing, they could only be used in models created at discharge and not for days 7, 14, 21, and 28 models. Final models consisted of factors with P values < .05 and 95% CIs of the AORs or the hazard ratios (HRs) that excluded 1. As the EHR did not start recording data until January 2, 2004, and its capture of data remained incomplete for several years, rather than imputing these missing data or excluding these patients, we chose to create an extra categorical level for each factor to represent missing data. For continuous factors with missing data, we first converted the continuous data to terciles and the missing data became the fourth level.20,21
The discrimination of the logistic models were determined by the c-statistic and for the Cox proportional hazards model with the Harrell concordance index (C index). Time trends were assessed with the Cochran-Armitage trend test. P < .05 was deemed statistically significant. Statistics were calculated with SPSS versions 21-23 or SAS 9.4.
Results
Of 8309 admissions to the ICU after cardiac surgery, 1174 (14%) had ICU stays ≥ 7 days, 386 (5%) ≥ 14 days, 201 (2%) ≥ 21 days, and 80 (0.9%) ≥ 28 days. The prolonged ICU study population was mostly male, White race, with a mean (SD) age of 62 (14) years. Patients had a variety of comorbidities, most notably 61% had hypertension and half had heart failure. Valve surgery (55%) was the most common procedure (n = 651). Twenty-nine percent required > 1 procedure (eAppendix 1).
The operative mortality
Using multivariable logistic regression to adjust for factors associated with mortality, we found that receiving mechanical ventilation on the day of analysis was associated with increased operative mortality with AOR increasing from 3.35 (95% CI, 2.82-3.98) for
After multivariable Cox regression to adjust for confounders, we found that each postoperative week was associated with a 7% higher hazard of dying (HR, 1.07; 95% CI, 1.07-1.07; P < .001). Postoperative pneumonia was also associated with increased hazard of dying (HR, 1.59; 95% CI, 1.27-1.99; P < .001),
Discussion
We found that operative mortality increased the longer the patient stayed in the ICU, ranging from 11% for ≥ 7 days to 35% for ≥ 28 days. We further found that in ICU survivors, median (IQR) survival was 10.7 (0.7) years. While previous studies have evaluated prolonged ICU stays, they have been limited by studying limited subpopulations, such as patients who are dependent on dialysis or octogenarians, or used a single cutoff to define prolonged ICU stays, variably defined from > 48 hours to > 14 days.2-7,9-12,22 Our study is similar to others that used ≥ 2 cutoffs.1,8 However, our study was novel by providing 4 cutoffs to improve temporal prediction of hospital outcomes. Unlike a study by Ryan and colleagues, which found no increase in mortality with longer stay (43.5% for ≥ 14 days and 45% for ≥ 28 days), our study findings are similar to those of Yu and colleagues (11.1% mortality for prolonged ICU stays of 1 to 2 weeks, 26.6% for 2 to 4 weeks, and 31% for > 4 weeks) and others (8%, 3 to 14 days; 40%, >14 days; 10%, 1 to 2 weeks; 25.7% > 2 weeks) in finding a progressively increased hospital mortality with longer ICU stays.1,4,5,8 These differences may be related to different ICU populations or to improvements in care since Ryan and colleagues study was conducted.
Fewer studies have evaluated factors associated with mortality in cardiac surgery prolonged ICU stay patients. Our study is similar to other studies that evaluated risk factors by finding associations between a variety of comorbidities and process of care associated with both operative and long-term mortality; however, comparison between these studies is limited by the varying factors analyzed.1,3,5,6,8,9,11 We found that mechanical ventilation on days 7, 14, 21, and 28 was strongly associated with operative mortality, similar to noncardiac surgery patients and cardiac surgery patients.6,23,24 While we found several processes of care, such as catecholamine use and transfusions to be associated with mortality, which is similar to other studies, notably, we did not find an association between renal replacement therapy and mortality.1,25 While there is an association between renal replacement therapy and mortality in ICU patients, its status in cardiac surgery patients with prolonged ICU stays is less clear.26 While Ryan and colleagues found an association between renal replacement therapy and hospital mortality in patients staying ≥ 14 days, they did not find it in patients staying ≥.
28 days.1 Other studies of prolonged ICU stays for cardiac surgery patients have also failed to find an association between renal replacement therapy and mortality.5,6,9 Importantly, practice that expedites liberation from mechanical ventilation, such as fast tracking, daily spontaneous breathing trials, extubation to noninvasive respiratory support, and pulmonary rehabilitation may all have potential to limit mechanical ventilation duration and improve hospital survival and deserve further study.27-29Median (IQR) survival in hospital survivors was 10.7 (0.7) years, which is generally better than previously reported, but similar to that reported by Silberman and colleagues.2,4,6,8,11,12 Differences between these studies may relate to different patient populations within the cardiac surgery ICUs, definitions of prolonged ICU stays, or eras of care. Further study is needed to clarify these discrepancies. We found that cardiac transplantation and obesity were associated with the least risk of dying, while smoking, lung disease, and postoperative pneumonia were independently associated with increased hazard of dying. The obesity paradox, where obesity is protective, has been previously observed in cardiac surgery patients.30
Strengths and Limitations
There are several limitations of this study. This is a single center study, and our patient population and processes of care may differ from other centers, limiting its generalizability. Notably, we do fewer coronary bypass operations and more aortic reconstructions and ventricular assist device insertions than do many other centers. Second, we did not have laboratory values for about one-third of patients (preceded EHR implementation). However, we were able to compensate for this by binning values and including missing data as an extra bin.20,21
The main strength of this study is that we were able to combine disparate records to assess a large number of potential factors associated with both operative and long-term mortality. This produced models that had good to very good discrimination. By producing models at 7, 14, 21, and 28 days to predict operative mortality and a model at discharge, it may help to provide objective data to facilitate conversations with patients and their families. However, further studies to externally validate these models should be conducted.
Conclusions
We found that longer prolonged ICU stays are associated with both operative and late mortality. Receiving mechanical ventilation on days 7, 14, 21, or 28 was strongly associated with operative mortality.
Prolonged intensive care unit (ICU) stays, variably defined as > 48 h to > 14 days, are a known complication of cardiac surgery.1-8 Prolonged stays are associated with higher resource utilization and higher mortality.2,3,9-12 Although there are several cardiac surgery risk models that can be used preoperatively to identify patients at risk for prolonged ICU stay, factors that influence outcomes for patients who experience prolonged ICU stays are poorly understood.2,13-19 Little information is available to inform discussions between health care practitioners (HCPs) and patients throughout a prolonged ICU stay, especially those ≥ 7 days.
As cardiac surgical complexity, patient age, and preexisting comorbidities have increased over time, so has the need to provide patients and HCPs with data to inform decision making, enhance prognostication, and set realistic expectations at varying time intervals during prolonged ICU stay. The purpose of this study was to evaluate short- and long-term outcomes in cardiac surgery patients after prolonged ICU stays at relevant time intervals (7, 14, 21, and 28 days) and to determine factors that may predict a patient’s outcome after a prolonged ICU stay.
Methods
The University of Michigan Health System Institutional Review Board approved this study and waived informed consent. We merged the University of Michigan Medical Center Society of Thoracic Surgeons (STS) database, which is updated periodically with late mortality, with elements of the electronic health record (EHR). Adult patients were included if they had cardiac surgery at the University of Michigan between January 2, 2001, and December 31, 2011. Late mortality was updated through December 1, 2014. Data are presented as frequency (%), mean (SD), and median (IQR) as appropriate. Bivariate comparisons between survivors and nonsurvivors were done with χ2 or Fisher exact test for categorical data, Student t test for continuous normally distributed data, and Wilcoxon rank sum test for continuous not normally distributed data. To determine factors associated with operative mortality (death within 30 days of surgery or hospital discharge, whichever occurred later), we used logistic regression with forward selection. All available factors were initially entered in the models.
Separate logistic models were created based on all data available at days 7, 14, 21, and 28. Final models consisted of factors with statistically significant P values (< .05) and adjusted odds ratios (AORs) with 95% CIs that excluded 1. To determine factors associated with late mortality, we used a Cox proportional hazard model, which used data available at discharge and STS complications. As these complications did not include their timing, they could only be used in models created at discharge and not for days 7, 14, 21, and 28 models. Final models consisted of factors with P values < .05 and 95% CIs of the AORs or the hazard ratios (HRs) that excluded 1. As the EHR did not start recording data until January 2, 2004, and its capture of data remained incomplete for several years, rather than imputing these missing data or excluding these patients, we chose to create an extra categorical level for each factor to represent missing data. For continuous factors with missing data, we first converted the continuous data to terciles and the missing data became the fourth level.20,21
The discrimination of the logistic models were determined by the c-statistic and for the Cox proportional hazards model with the Harrell concordance index (C index). Time trends were assessed with the Cochran-Armitage trend test. P < .05 was deemed statistically significant. Statistics were calculated with SPSS versions 21-23 or SAS 9.4.
Results
Of 8309 admissions to the ICU after cardiac surgery, 1174 (14%) had ICU stays ≥ 7 days, 386 (5%) ≥ 14 days, 201 (2%) ≥ 21 days, and 80 (0.9%) ≥ 28 days. The prolonged ICU study population was mostly male, White race, with a mean (SD) age of 62 (14) years. Patients had a variety of comorbidities, most notably 61% had hypertension and half had heart failure. Valve surgery (55%) was the most common procedure (n = 651). Twenty-nine percent required > 1 procedure (eAppendix 1).
The operative mortality
Using multivariable logistic regression to adjust for factors associated with mortality, we found that receiving mechanical ventilation on the day of analysis was associated with increased operative mortality with AOR increasing from 3.35 (95% CI, 2.82-3.98) for
After multivariable Cox regression to adjust for confounders, we found that each postoperative week was associated with a 7% higher hazard of dying (HR, 1.07; 95% CI, 1.07-1.07; P < .001). Postoperative pneumonia was also associated with increased hazard of dying (HR, 1.59; 95% CI, 1.27-1.99; P < .001),
Discussion
We found that operative mortality increased the longer the patient stayed in the ICU, ranging from 11% for ≥ 7 days to 35% for ≥ 28 days. We further found that in ICU survivors, median (IQR) survival was 10.7 (0.7) years. While previous studies have evaluated prolonged ICU stays, they have been limited by studying limited subpopulations, such as patients who are dependent on dialysis or octogenarians, or used a single cutoff to define prolonged ICU stays, variably defined from > 48 hours to > 14 days.2-7,9-12,22 Our study is similar to others that used ≥ 2 cutoffs.1,8 However, our study was novel by providing 4 cutoffs to improve temporal prediction of hospital outcomes. Unlike a study by Ryan and colleagues, which found no increase in mortality with longer stay (43.5% for ≥ 14 days and 45% for ≥ 28 days), our study findings are similar to those of Yu and colleagues (11.1% mortality for prolonged ICU stays of 1 to 2 weeks, 26.6% for 2 to 4 weeks, and 31% for > 4 weeks) and others (8%, 3 to 14 days; 40%, >14 days; 10%, 1 to 2 weeks; 25.7% > 2 weeks) in finding a progressively increased hospital mortality with longer ICU stays.1,4,5,8 These differences may be related to different ICU populations or to improvements in care since Ryan and colleagues study was conducted.
Fewer studies have evaluated factors associated with mortality in cardiac surgery prolonged ICU stay patients. Our study is similar to other studies that evaluated risk factors by finding associations between a variety of comorbidities and process of care associated with both operative and long-term mortality; however, comparison between these studies is limited by the varying factors analyzed.1,3,5,6,8,9,11 We found that mechanical ventilation on days 7, 14, 21, and 28 was strongly associated with operative mortality, similar to noncardiac surgery patients and cardiac surgery patients.6,23,24 While we found several processes of care, such as catecholamine use and transfusions to be associated with mortality, which is similar to other studies, notably, we did not find an association between renal replacement therapy and mortality.1,25 While there is an association between renal replacement therapy and mortality in ICU patients, its status in cardiac surgery patients with prolonged ICU stays is less clear.26 While Ryan and colleagues found an association between renal replacement therapy and hospital mortality in patients staying ≥ 14 days, they did not find it in patients staying ≥.
28 days.1 Other studies of prolonged ICU stays for cardiac surgery patients have also failed to find an association between renal replacement therapy and mortality.5,6,9 Importantly, practice that expedites liberation from mechanical ventilation, such as fast tracking, daily spontaneous breathing trials, extubation to noninvasive respiratory support, and pulmonary rehabilitation may all have potential to limit mechanical ventilation duration and improve hospital survival and deserve further study.27-29Median (IQR) survival in hospital survivors was 10.7 (0.7) years, which is generally better than previously reported, but similar to that reported by Silberman and colleagues.2,4,6,8,11,12 Differences between these studies may relate to different patient populations within the cardiac surgery ICUs, definitions of prolonged ICU stays, or eras of care. Further study is needed to clarify these discrepancies. We found that cardiac transplantation and obesity were associated with the least risk of dying, while smoking, lung disease, and postoperative pneumonia were independently associated with increased hazard of dying. The obesity paradox, where obesity is protective, has been previously observed in cardiac surgery patients.30
Strengths and Limitations
There are several limitations of this study. This is a single center study, and our patient population and processes of care may differ from other centers, limiting its generalizability. Notably, we do fewer coronary bypass operations and more aortic reconstructions and ventricular assist device insertions than do many other centers. Second, we did not have laboratory values for about one-third of patients (preceded EHR implementation). However, we were able to compensate for this by binning values and including missing data as an extra bin.20,21
The main strength of this study is that we were able to combine disparate records to assess a large number of potential factors associated with both operative and long-term mortality. This produced models that had good to very good discrimination. By producing models at 7, 14, 21, and 28 days to predict operative mortality and a model at discharge, it may help to provide objective data to facilitate conversations with patients and their families. However, further studies to externally validate these models should be conducted.
Conclusions
We found that longer prolonged ICU stays are associated with both operative and late mortality. Receiving mechanical ventilation on days 7, 14, 21, or 28 was strongly associated with operative mortality.
1. Ryan TA, Rady MY, Bashour A, Leventhal M, Lytle B, Starr NJ. Predictors of outcome in cardiac surgical patients with prolonged intensive care stay. Chest. 1997;112(4):1035-1042. doi:10.1378/chest.112.4.1035
2. Hein OV, Birnbaum J, Wernecke K, England M, Konertz W, Spies C. Prolonged intensive care unit stay in cardiac surgery: risk factors and long-term-survival. Ann Thorac Surg. 2006;81(3):880-885. doi:10.1016/j.athoracsur.2005.09.077
3. Mahesh B, Choong CK, Goldsmith K, Gerrard C, Nashef SA, Vuylsteke A. Prolonged stay in intensive care unit is a powerful predictor of adverse outcomes after cardiac operations. Ann Thoracic Surg. 2012;94(1):109-116. doi:10.1016/j.athoracsur.2012.02.010
4. Silberman S, Bitran D, Fink D, Tauber R, Merin O. Very prolonged stay in the intensive care unit after cardiac operations: early results and late survival. Ann Thorac Surg. 2013;96(1):15-21. doi:10.1016/j.athoracsur.2013.01.103
5. Lapar DJ, Gillen JR, Crosby IK, et al. Predictors of operative mortality in cardiac surgical patients with prolonged intensive care unit duration. J Am Coll Surg. 2013;216(6):1116-1123. doi:10.1016/j.jamcollsurg.2013.02.028
6. Manji RA, Arora RC, Singal RK, et al. Long-term outcome and predictors of noninstitutionalized survival subsequent to prolonged intensive care unit stay after cardiac surgical procedures. Ann Thorac Surg. 2016;101(1):56-63. doi:10.1016/j.athoracsur.2015.07.004
7. Augustin P, Tanaka S, Chhor V, et al. Prognosis of prolonged intensive care unit stay after aortic valve replacement for severe aortic stenosis in octogenarians. J Cardiothorac Vasc Anesth. 2016;30(6):1555-1561. doi:10.1053/j.jvca.2016.07.029
8. Yu PJ, Cassiere HA, Fishbein J, Esposito RA, Hartman AR. Outcomes of patients with prolonged intensive care unit stay after cardiac surgery. J Cardiothorac Vasc Anesth. 2016;30(6):1550-1554. doi:10.1053/j.jvca.2016.03.145
9. Bashour CA, Yared JP, Ryan TA, et al. Long-term survival and functional capacity in cardiac surgery patients after prolonged intensive care. Crit Care Med. 2000;28(12):3847-3853. doi:10.1097/00003246-200012000-00018
10. Isgro F, Skuras JA, Kiessling AH, Lehmann A, Saggau W. Survival and quality of life after a long-term intensive care stay. Thorac Cardiovasc Surg. 2002;50(2):95-99. doi:10.1055/s-2002-26693
11. Williams MR, Wellner RB, Hartnett EA, Hartnett EA, Thornton B, Kavarana MN, Mahapatra R, Oz MC Sladen R. Long-term survival and quality of life in cardiac surgical patients with prolonged intensive care unit length of stay. Ann Thorac Surg. 2002;73(5):1472-1478.
12. Lagercrantz E, Lindblom D, Sartipy U. Survival and quality of life in cardiac surgery patients with prolonged intensive care. Ann Thorac Surg. 2010;89:490-495. doi:10.1016/s0003-4975(02)03464-1
13. Edwards FH, Clark RE, Schwartz M. Coronary artery bypass grafting: the Society of Thoracic Surgeons National Database experience. Ann Thorac Surg. 1994;57(1):12-19. doi:10.1016/0003-4975(94)90358-1
14. Lawrence DR, Valencia O, Smith EE, Murday A, Treasure T. Parsonnet score is a good predictor of the duration of intensive care unit stay following cardiac surgery. Heart. 2000;83(4):429-432. doi:10.1136/heart.83.4.429
15. Janssen DP, Noyez L, Wouters C, Brouwer RM. Preoperative prediction of prolonged stay in the intensive care unit for coronary bypass surgery. Eur J Cardiothorac Surg. 2004;25(2):203-207. doi:10.1016/j.ejcts.2003.11.005
16. Nilsson J, Algotsson L, Hoglund P, Luhrs C, Brandt J. EuroSCORE predicts intensive care unit stay and costs of open heart surgery. Ann Thorac Surg. 2004;78(5):1528-1534. doi:10.1016/j.athoracsur.2004.04.060
17. Ghotkar SV, Grayson AD, Fabri BM, Dihmis WC, Pullan DM. Preoperative calculation of risk for prolonged intensive care unit stay following coronary artery bypass grafting. J Cardiothorac Surg. 2006;1:14. doi:10.1186/1749-8090-1-1418. Messaoudi N, Decocker J, Stockman BA, Bossaert LL, Rodrigus IE. Is EuroSCORE useful in the prediction of extended intensive care unit stay after cardiac surgery? Eur J Cardiothoracic Surg. 2009;36(1):35-39. doi:10.1016/j.ejcts.2009.02.007
19. Ettema RG, Peelen LM, Schuurmans MJ, Nierich AP, Kalkman CJ, Moons KG. Prediction models for prolonged intensive care unit stay after cardiac surgery: systematic review and validation study. Circulation. 2010;122(7):682-689. doi:10.1161/CIRCULATIONAHA.109.926808
20. Engoren M. Does erythrocyte blood transfusion prevent acute kidney injury? Propensity-matched case control analysis. Anesthesiology. 2010;113(5):1126-1133. doi:10.1097/ALN.0b013e181f70f56
21. UK National Centre for Research Methods. Minimising the effect of missing data. Revised July 22, 2011. Accessed June 28, 2022. www.restore.ac.uk/srme/www/fac/soc/wie/research-new/srme/modules/mod3/9/index.html.
22. Leontyev S, Davierwala PM, Gaube LM, et al. Outcomes of dialysis-dependent patients after cardiac operations in a single-center experience of 483 patients. Ann Thorac Surg. 2017;103(4):1270-1276. doi:10.1016/j.athoracsur.2016.07.05223. Freundlich RE, Maile MD, Sferra JJ, Jewell ES, Kheterpal S, Engoren M. Complications associated with mortality in the National Surgical Quality Improvement Program Database. Anesth Analg. 2018;127(1):55-62. doi:10.1213/ANE.0000000000002799
24. Freundlich RE, Maile MD, Hajjar MM, et al. Years of life lost after complications of coronary artery bypass operations. Ann Thorac Surg. 2017;103(6):1893-1899. doi:10.1016/j.athoracsur.2016.09.048
25. Koch CG, Li L, Sessler DI, et al. Duration of red-cell storage and complications after cardiac surgery. N Engl J Med. 2008;358(12):1229-1239. doi:10.1056/NEJMoa070403
26. Truche AS, Ragey SP, Souweine B, et al. ICU survival and need of renal replacement therapy with respect to AKI duration in critically ill patients. Ann Intensive Care. 2018;8(1):127. doi:10.1186/s13613-018-0467-6
27. Kollef MH, Shapiro SD, Silver P, et al. A randomized, controlled trial of protocol-directed versus physician-directed weaning from mechanical ventilation. Crit Care Med. 1997;25(4):567-574. doi:10.1097/00003246-199704000-00004
28. McWilliams D, Weblin J, Atkins G, et al. Enhancing rehabilitation of mechanically ventilated patients in the intensive care unit: a quality improvement project. J Crit Care. 2015;30(1):13-18. doi:10.1016/j.jcrc.2014.09.018
29. Hernandez G, Vaquero C, Gonzalez P, et al. Effect of postextubation high-flow nasal cannula vs conventional oxygen therapy on reintubation in low-risk patients: a randomized clinical trial. JAMA. 2016;315(13):1354-1361. doi:10.1001/jama.2016.2711
30. Schwann TA, Ramira PS, Engoren MC, et al. Evidence and temporality of the obesity paradox in coronary bypass surgery: an analysis of cause-specific mortality. Eur J Cardiothorac Surg. 2018;54(5):896-903. doi:10.1093/ejcts/ezy207
1. Ryan TA, Rady MY, Bashour A, Leventhal M, Lytle B, Starr NJ. Predictors of outcome in cardiac surgical patients with prolonged intensive care stay. Chest. 1997;112(4):1035-1042. doi:10.1378/chest.112.4.1035
2. Hein OV, Birnbaum J, Wernecke K, England M, Konertz W, Spies C. Prolonged intensive care unit stay in cardiac surgery: risk factors and long-term-survival. Ann Thorac Surg. 2006;81(3):880-885. doi:10.1016/j.athoracsur.2005.09.077
3. Mahesh B, Choong CK, Goldsmith K, Gerrard C, Nashef SA, Vuylsteke A. Prolonged stay in intensive care unit is a powerful predictor of adverse outcomes after cardiac operations. Ann Thoracic Surg. 2012;94(1):109-116. doi:10.1016/j.athoracsur.2012.02.010
4. Silberman S, Bitran D, Fink D, Tauber R, Merin O. Very prolonged stay in the intensive care unit after cardiac operations: early results and late survival. Ann Thorac Surg. 2013;96(1):15-21. doi:10.1016/j.athoracsur.2013.01.103
5. Lapar DJ, Gillen JR, Crosby IK, et al. Predictors of operative mortality in cardiac surgical patients with prolonged intensive care unit duration. J Am Coll Surg. 2013;216(6):1116-1123. doi:10.1016/j.jamcollsurg.2013.02.028
6. Manji RA, Arora RC, Singal RK, et al. Long-term outcome and predictors of noninstitutionalized survival subsequent to prolonged intensive care unit stay after cardiac surgical procedures. Ann Thorac Surg. 2016;101(1):56-63. doi:10.1016/j.athoracsur.2015.07.004
7. Augustin P, Tanaka S, Chhor V, et al. Prognosis of prolonged intensive care unit stay after aortic valve replacement for severe aortic stenosis in octogenarians. J Cardiothorac Vasc Anesth. 2016;30(6):1555-1561. doi:10.1053/j.jvca.2016.07.029
8. Yu PJ, Cassiere HA, Fishbein J, Esposito RA, Hartman AR. Outcomes of patients with prolonged intensive care unit stay after cardiac surgery. J Cardiothorac Vasc Anesth. 2016;30(6):1550-1554. doi:10.1053/j.jvca.2016.03.145
9. Bashour CA, Yared JP, Ryan TA, et al. Long-term survival and functional capacity in cardiac surgery patients after prolonged intensive care. Crit Care Med. 2000;28(12):3847-3853. doi:10.1097/00003246-200012000-00018
10. Isgro F, Skuras JA, Kiessling AH, Lehmann A, Saggau W. Survival and quality of life after a long-term intensive care stay. Thorac Cardiovasc Surg. 2002;50(2):95-99. doi:10.1055/s-2002-26693
11. Williams MR, Wellner RB, Hartnett EA, Hartnett EA, Thornton B, Kavarana MN, Mahapatra R, Oz MC Sladen R. Long-term survival and quality of life in cardiac surgical patients with prolonged intensive care unit length of stay. Ann Thorac Surg. 2002;73(5):1472-1478.
12. Lagercrantz E, Lindblom D, Sartipy U. Survival and quality of life in cardiac surgery patients with prolonged intensive care. Ann Thorac Surg. 2010;89:490-495. doi:10.1016/s0003-4975(02)03464-1
13. Edwards FH, Clark RE, Schwartz M. Coronary artery bypass grafting: the Society of Thoracic Surgeons National Database experience. Ann Thorac Surg. 1994;57(1):12-19. doi:10.1016/0003-4975(94)90358-1
14. Lawrence DR, Valencia O, Smith EE, Murday A, Treasure T. Parsonnet score is a good predictor of the duration of intensive care unit stay following cardiac surgery. Heart. 2000;83(4):429-432. doi:10.1136/heart.83.4.429
15. Janssen DP, Noyez L, Wouters C, Brouwer RM. Preoperative prediction of prolonged stay in the intensive care unit for coronary bypass surgery. Eur J Cardiothorac Surg. 2004;25(2):203-207. doi:10.1016/j.ejcts.2003.11.005
16. Nilsson J, Algotsson L, Hoglund P, Luhrs C, Brandt J. EuroSCORE predicts intensive care unit stay and costs of open heart surgery. Ann Thorac Surg. 2004;78(5):1528-1534. doi:10.1016/j.athoracsur.2004.04.060
17. Ghotkar SV, Grayson AD, Fabri BM, Dihmis WC, Pullan DM. Preoperative calculation of risk for prolonged intensive care unit stay following coronary artery bypass grafting. J Cardiothorac Surg. 2006;1:14. doi:10.1186/1749-8090-1-1418. Messaoudi N, Decocker J, Stockman BA, Bossaert LL, Rodrigus IE. Is EuroSCORE useful in the prediction of extended intensive care unit stay after cardiac surgery? Eur J Cardiothoracic Surg. 2009;36(1):35-39. doi:10.1016/j.ejcts.2009.02.007
19. Ettema RG, Peelen LM, Schuurmans MJ, Nierich AP, Kalkman CJ, Moons KG. Prediction models for prolonged intensive care unit stay after cardiac surgery: systematic review and validation study. Circulation. 2010;122(7):682-689. doi:10.1161/CIRCULATIONAHA.109.926808
20. Engoren M. Does erythrocyte blood transfusion prevent acute kidney injury? Propensity-matched case control analysis. Anesthesiology. 2010;113(5):1126-1133. doi:10.1097/ALN.0b013e181f70f56
21. UK National Centre for Research Methods. Minimising the effect of missing data. Revised July 22, 2011. Accessed June 28, 2022. www.restore.ac.uk/srme/www/fac/soc/wie/research-new/srme/modules/mod3/9/index.html.
22. Leontyev S, Davierwala PM, Gaube LM, et al. Outcomes of dialysis-dependent patients after cardiac operations in a single-center experience of 483 patients. Ann Thorac Surg. 2017;103(4):1270-1276. doi:10.1016/j.athoracsur.2016.07.05223. Freundlich RE, Maile MD, Sferra JJ, Jewell ES, Kheterpal S, Engoren M. Complications associated with mortality in the National Surgical Quality Improvement Program Database. Anesth Analg. 2018;127(1):55-62. doi:10.1213/ANE.0000000000002799
24. Freundlich RE, Maile MD, Hajjar MM, et al. Years of life lost after complications of coronary artery bypass operations. Ann Thorac Surg. 2017;103(6):1893-1899. doi:10.1016/j.athoracsur.2016.09.048
25. Koch CG, Li L, Sessler DI, et al. Duration of red-cell storage and complications after cardiac surgery. N Engl J Med. 2008;358(12):1229-1239. doi:10.1056/NEJMoa070403
26. Truche AS, Ragey SP, Souweine B, et al. ICU survival and need of renal replacement therapy with respect to AKI duration in critically ill patients. Ann Intensive Care. 2018;8(1):127. doi:10.1186/s13613-018-0467-6
27. Kollef MH, Shapiro SD, Silver P, et al. A randomized, controlled trial of protocol-directed versus physician-directed weaning from mechanical ventilation. Crit Care Med. 1997;25(4):567-574. doi:10.1097/00003246-199704000-00004
28. McWilliams D, Weblin J, Atkins G, et al. Enhancing rehabilitation of mechanically ventilated patients in the intensive care unit: a quality improvement project. J Crit Care. 2015;30(1):13-18. doi:10.1016/j.jcrc.2014.09.018
29. Hernandez G, Vaquero C, Gonzalez P, et al. Effect of postextubation high-flow nasal cannula vs conventional oxygen therapy on reintubation in low-risk patients: a randomized clinical trial. JAMA. 2016;315(13):1354-1361. doi:10.1001/jama.2016.2711
30. Schwann TA, Ramira PS, Engoren MC, et al. Evidence and temporality of the obesity paradox in coronary bypass surgery: an analysis of cause-specific mortality. Eur J Cardiothorac Surg. 2018;54(5):896-903. doi:10.1093/ejcts/ezy207
Analysis affirms that giving birth protects against endometrial cancer
Compared with having no children, the risk reduction for endometrial cancer was 21% with having one child, 38% with having two, and 51% with having three, Gunn-Helen Moen, MSc, PhD, a research fellow at the University of Queensland Institute for Molecular Bioscience in St. Lucia, Australia, and the senior author of the study, said in an email.

In the United States, the prevalence of endometrial cancer is 25.7 per 100,000 women per year, with a lifetime risk of 2.8%.
Multiple observational studies have linked giving birth to risk of endometrial cancer. For the new study, Dr. Moen and her team assessed various risk factors related to ovulation and reproductive function using Mendelian randomization, an epidemiological technique that deploys genetic variants to detect cause-and-effect relationships between potentially modifiable risk factors and health outcomes in observational data.
The researcher published their findings in BMC Medicine.
Leverage genetic data
The study used detailed genetic and health data from the UK Biobank, a databank with more than half a million participants. Genetic variants related to some of the risk factors were used to assess whether the variants make people more likely to develop endometrial cancer.
Genomewide significant single-nucleotide polymorphisms (SNPs) related to number of live births, age at menopause and menarche, and body mass index (BMI) had been identified in previous studies, the researchers reported. They conducted genomewide association analyses of the databank to identify SNPs associated with years ovulating, years using the contraceptive pill, and age at last live birth.
The MR analysis showed a potential causal effect for the number of live births (inverse variance–weighted odds ratio, 0.537) and number of years ovulating (IVW OR, 1.051), in addition to known risk factors of BMI, age at menarche, and age at menopause.
A further multivariable MR analysis showed that number of births had a negative causal effect on endometrial cancer risk (OR, 0.783), independent of the causal effect of known risk factors such as BMI, age at menarche and age at menopause.
Reported limitations included being unable to perform MR analyses on some factors, such as oral contraceptive use, because of a lack of valid genetic instruments. The researchers could not perform an age adjustment at diagnosis because of a lack of data.
In addition, the genetic data came exclusively from White women of European ancestry.
‘A personal choice’
Other investigators have hypothesized that the protective effect of childbirth may be caused by shedding of malignant and premalignant endometrial cells during and after childbirth and exposure to high levels of progesterone in late stages of pregnancy, the research team noted.
Dr. Moen said, based on the results, physicians might consider number of childbirths in assessing a patient’s risk of endometrial cancer.
However, Britton Trabert, MSPH, MS, PhD, an epidemiologist and assistant professor of obstetrics and gynecology at the University of Utah, Salt Lake City, said it’s unlikely the findings will affect clinical practice given that they “largely replicate well-characterized endometrial cancer risk associations.”
“Pregnancy and childbirth are a personal choice and is not largely regarded as a modifiable factor for cancer prevention,” said Dr. Trabert, who was not involved in the study.
The study’s investigators reported funding from the governments of Australia, Norway and the United Kingdom and the British Heart Foundation. No financial conflicts of interest were reported. Dr. Trabert reported no relevant financial interests.
Compared with having no children, the risk reduction for endometrial cancer was 21% with having one child, 38% with having two, and 51% with having three, Gunn-Helen Moen, MSc, PhD, a research fellow at the University of Queensland Institute for Molecular Bioscience in St. Lucia, Australia, and the senior author of the study, said in an email.
In the United States, the prevalence of endometrial cancer is 25.7 per 100,000 women per year, with a lifetime risk of 2.8%.
Multiple observational studies have linked giving birth to risk of endometrial cancer. For the new study, Dr. Moen and her team assessed various risk factors related to ovulation and reproductive function using Mendelian randomization, an epidemiological technique that deploys genetic variants to detect cause-and-effect relationships between potentially modifiable risk factors and health outcomes in observational data.
The researcher published their findings in BMC Medicine.
Leverage genetic data
The study used detailed genetic and health data from the UK Biobank, a databank with more than half a million participants. Genetic variants related to some of the risk factors were used to assess whether the variants make people more likely to develop endometrial cancer.
Genomewide significant single-nucleotide polymorphisms (SNPs) related to number of live births, age at menopause and menarche, and body mass index (BMI) had been identified in previous studies, the researchers reported. They conducted genomewide association analyses of the databank to identify SNPs associated with years ovulating, years using the contraceptive pill, and age at last live birth.
The MR analysis showed a potential causal effect for the number of live births (inverse variance–weighted odds ratio, 0.537) and number of years ovulating (IVW OR, 1.051), in addition to known risk factors of BMI, age at menarche, and age at menopause.
A further multivariable MR analysis showed that number of births had a negative causal effect on endometrial cancer risk (OR, 0.783), independent of the causal effect of known risk factors such as BMI, age at menarche and age at menopause.
Reported limitations included being unable to perform MR analyses on some factors, such as oral contraceptive use, because of a lack of valid genetic instruments. The researchers could not perform an age adjustment at diagnosis because of a lack of data.
In addition, the genetic data came exclusively from White women of European ancestry.
‘A personal choice’
Other investigators have hypothesized that the protective effect of childbirth may be caused by shedding of malignant and premalignant endometrial cells during and after childbirth and exposure to high levels of progesterone in late stages of pregnancy, the research team noted.
Dr. Moen said, based on the results, physicians might consider number of childbirths in assessing a patient’s risk of endometrial cancer.
However, Britton Trabert, MSPH, MS, PhD, an epidemiologist and assistant professor of obstetrics and gynecology at the University of Utah, Salt Lake City, said it’s unlikely the findings will affect clinical practice given that they “largely replicate well-characterized endometrial cancer risk associations.”
“Pregnancy and childbirth are a personal choice and is not largely regarded as a modifiable factor for cancer prevention,” said Dr. Trabert, who was not involved in the study.
The study’s investigators reported funding from the governments of Australia, Norway and the United Kingdom and the British Heart Foundation. No financial conflicts of interest were reported. Dr. Trabert reported no relevant financial interests.
Compared with having no children, the risk reduction for endometrial cancer was 21% with having one child, 38% with having two, and 51% with having three, Gunn-Helen Moen, MSc, PhD, a research fellow at the University of Queensland Institute for Molecular Bioscience in St. Lucia, Australia, and the senior author of the study, said in an email.
In the United States, the prevalence of endometrial cancer is 25.7 per 100,000 women per year, with a lifetime risk of 2.8%.
Multiple observational studies have linked giving birth to risk of endometrial cancer. For the new study, Dr. Moen and her team assessed various risk factors related to ovulation and reproductive function using Mendelian randomization, an epidemiological technique that deploys genetic variants to detect cause-and-effect relationships between potentially modifiable risk factors and health outcomes in observational data.
The researcher published their findings in BMC Medicine.
Leverage genetic data
The study used detailed genetic and health data from the UK Biobank, a databank with more than half a million participants. Genetic variants related to some of the risk factors were used to assess whether the variants make people more likely to develop endometrial cancer.
Genomewide significant single-nucleotide polymorphisms (SNPs) related to number of live births, age at menopause and menarche, and body mass index (BMI) had been identified in previous studies, the researchers reported. They conducted genomewide association analyses of the databank to identify SNPs associated with years ovulating, years using the contraceptive pill, and age at last live birth.
The MR analysis showed a potential causal effect for the number of live births (inverse variance–weighted odds ratio, 0.537) and number of years ovulating (IVW OR, 1.051), in addition to known risk factors of BMI, age at menarche, and age at menopause.
A further multivariable MR analysis showed that number of births had a negative causal effect on endometrial cancer risk (OR, 0.783), independent of the causal effect of known risk factors such as BMI, age at menarche and age at menopause.
Reported limitations included being unable to perform MR analyses on some factors, such as oral contraceptive use, because of a lack of valid genetic instruments. The researchers could not perform an age adjustment at diagnosis because of a lack of data.
In addition, the genetic data came exclusively from White women of European ancestry.
‘A personal choice’
Other investigators have hypothesized that the protective effect of childbirth may be caused by shedding of malignant and premalignant endometrial cells during and after childbirth and exposure to high levels of progesterone in late stages of pregnancy, the research team noted.
Dr. Moen said, based on the results, physicians might consider number of childbirths in assessing a patient’s risk of endometrial cancer.
However, Britton Trabert, MSPH, MS, PhD, an epidemiologist and assistant professor of obstetrics and gynecology at the University of Utah, Salt Lake City, said it’s unlikely the findings will affect clinical practice given that they “largely replicate well-characterized endometrial cancer risk associations.”
“Pregnancy and childbirth are a personal choice and is not largely regarded as a modifiable factor for cancer prevention,” said Dr. Trabert, who was not involved in the study.
The study’s investigators reported funding from the governments of Australia, Norway and the United Kingdom and the British Heart Foundation. No financial conflicts of interest were reported. Dr. Trabert reported no relevant financial interests.
FROM BMC MEDICINE
Tirzepatide cuts BP during obesity treatment
CHICAGO – compared with placebo, while causing modest increases in heart rate, in a prespecified substudy of the SURMOUNT-1 trial.
“The large effects on ambulatory 24-hour blood pressure raise the possibility that there may be important long-term benefits of [tirzepatide] on the complications of obesity,” said James A. de Lemos, MD, during a presentation at the American Heart Association scientific sessions.

“The findings are concordant with the [previously reported] office-based measurements, and the blood pressure reductions provide further evidence for the potential benefits of tirzepatide on cardiovascular health and outcomes,” said Dr. de Lemos, a cardiologist and professor at the University of Texas Southwestern Medical Center, Dallas.
The substudy included 600 of the 2,539 people enrolled in SURMOUNT-1, the first of two pivotal trials for tirzepatide (Mounjaro) in people without diabetes but with obesity or overweight (body mass index of 27-29 kg/m2) plus at least one weight-related complication. The primary endpoints of SURMOUNT-1 were the percent change in weight from baseline to 72 weeks on treatment with either of three different weekly injected doses of tirzepatide, compared with control subjects who received placebo, and the percentage of enrolled subjects achieving at least 5% loss in baseline weight, compared with the controls.
Tirzepatide treatment led to significant increases in both results, compared with controls, with the highest dose tested, 15 mg/week, resulting in an average 20.9% drop in weight from baseline after 72 weeks of treatment, and 91% of enrolled subjects on that dose achieving the 5% weight-loss threshold during the same time frame, in results published in 2022 in the New England Journal of Medicine.
24-hour ambulatory pressures from 494 people
The substudy enrolled 600 of the SURMOUNT-1 participants and involved 24-hour ambulatory BP and heart rate measurements at entry and after 36 weeks on treatment. Full results were available for 494 of these people. The substudy included only study participants who entered with a BP of less than 140/90 mm Hg. Enrollment in SURMOUNT-1 overall excluded people with a BP of 160/100 mm Hg or higher. The average BP among all enrolled participants was about 123/80 mm Hg, while heart rates averaged about 73 beats per minute.
Systolic BP measured with the ambulatory monitor fell from baseline by an average of 5.6, 8.8, and 6.2 mm Hg in the people who received tirzepatide in weekly doses of 5, 10, or 15 mg, respectively, and rose by an average 1.8 mm Hg among the controls, Dr. de Lemos reported. Diastolic BP dropped among the tirzepatide recipients by an average of 1.5, 2.4, and 0.0 mm Hg in the three ascending tirzepatide treatment arms, and rose by an average 0.5 mm Hg among the controls. All of the differences between the intervention groups and the controls were significant except for the change in diastolic BP among participants who received 15 mg of tirzepatide weekly.
The results showed that 36 weeks on tirzepatide treatment was associated with “arguably clinically meaningful” reductions in systolic and diastolic BPs, Dr. de Lemos said. “There is a lot of optimism that this will translate into clinical benefits.” He also noted that, “within the limits of cross-study comparisons, the blood pressure changes look favorable, compared with the single-incretin mechanism GLP-1 [glucagonlike peptide–1] receptor agonists.”
Heart rate fell by an average 1.8 bpm in the controls, and rose by an average 0.3, 0.5, and 3.6 bpm among the three groups receiving ascending weekly tirzepatide doses, effects that were “consistent with what’s been seen with the GLP-1 receptor agonists,” noted Dr. de Lemos.
Tirzepatide is known as a “twincretin” because it shares this GLP-1 receptor agonism and also has a second incretin agonist activity, to the receptor for the glucose-dependent insulinotropic polypeptide.
Lowering of blood pressure plateaus
Changes in BP over time during the 72 weeks on treatment, data first presented in the original report, showed that average systolic pressure in the people who received tirzepatide fell sharply during the first 24 weeks on treatment, and then leveled out with little further change over time. Furthermore, all three tirzepatide doses produced roughly similar systolic BP reductions. Changes in diastolic pressure over time showed a mostly similar pattern of reduction, although a modest ongoing decrease in average diastolic pressure continued beyond 24 weeks.
This pattern of a plateau in BP reduction has been seen before in studies using other treatments to produce weight loss, including bariatric surgery, said Naveed Sattar, MBChB, PhD, professor of metabolic medicine at the University of Glasgow, who was not involved in SURMOUNT-1. He attributed the plateau in BP reduction among tirzepatide-treated people to them hitting a wall in their BP nadir based on homeostatic limits. Dr. Sattar noted that most enrolled participants had normal BPs at entry based on the reported study averages.
“It’s hard to go lower, but the blood pressure reduction may be larger in people who start at higher pressure levels,” Dr. Sattar said in an interview.

Another inferred cap on BP reductions in the trial hypothesizes that the individual clinicians who managed the enrolled patients may have cut back on other BP-lowering agents as the pressures of the tirzepatide recipients fell to relatively low levels, suggested Darren McGuire, MD, a cardiologist and professor at UT Southwestern Medical Center, who also was not involved in the SURMOUNT-1 study.
Incretin agonists as antihypertensive drugs
The substantial BP-lowering seen with tirzepatide, as well as with other incretin agonist agents, suggests a new way to think about BP control in people with overweight or obesity, Dr. Sattar said.
“Until now, we haven’t had tools where people lose so much weight. Now that we have these tools [incretin agonists as well as bariatric surgery], we see substantial blood pressure reductions. It makes you think we should use weight-loss agents to lower blood pressure rather than a beta-blocker or angiotensin-converting enzyme inhibitor; then we’d also produce all the other benefits from weight loss,” Dr. Sattar suggested.
Dr. de Lemos said he sees signals that the BP reductions caused by tirzepatide and the GLP-1 receptor agonists may go beyond just weight-loss effects.
“There appears to be a larger blood pressure reduction than anticipated based on the change in weight,” he said during his presentation. “GLP-1 is active in most vascular tissues, so these [receptor agonist] agents likely have vascular or cardiac effects, or even effects on other tissues that may affect blood pressure.”
Heart rate increases were usually modest
The experiences with GLP-1 receptor agonists also suggest that the heart rate increases seen with tirzepatide treatment in SURMOUNT-1 will not have long-term effects. “The [Food and Drug Administration] mandated this heart rate substudy to make sure that the increase in heart rate was not larger than what would be anticipated” with a GLP-1 receptor agonist, Dr. de Lemos explained.
SURMOUNT-1 had a treatment-stopping rule to prevent a person’s heart rate from rising beyond 10 bpm from baseline. “Trivial numbers” of patients experienced a heart rate increase of this magnitude, he said. If used in routine practice, Dr. de Lemos said that he would closely investigate a patient with a heart rate increase greater than 10 mm Hg. The average increase seen with the highest dose, about 4 bpm above baseline, would generally not be concerning.
Tirzepatide received U.S. marketing approval from the FDA in May 2022 for treating people with type 2 diabetes. In October 2022, the FDA gave tirzepatide “Fast Track” designation for the pending application for approval of an indication to treat people with overweight or obesity who match the entry criteria for SURMOUNT-1 and for the second pivotal trial for this indication, SURMOUNT-2. According to a statement from Eli Lilly, the company that is developing and markets tirzepatide (Mounjaro), the FDA’s decision on the obesity indication will remain pending until the SURMOUNT-2 results are available, which the company expects will occur in 2023.
SURMOUNT-1 and SURMOUNT-2 were sponsored by Lilly, the company that markets tirzepatide. Dr. de Lemos has been a consultant to Lilly as well as to Amgen, AstraZeneca, Janssen, Novo Nordisk, Ortho, Quidel Cardiovascular, and Regeneron. Dr. Sattar has financial ties to Lilly, Afimmune, Amgen, AstraZeneca, Boehringer Ingelheim, Hammi, Merck Sharpe & Dohme, Novartis, Novo Nordisk, Pfizer, Roche, and Sanofi-Aventis. Dr. McGuire has ties to Lilly as well as to Altimmune, Applied Therapeutics, Bayer, Boehringer Ingelheim, CSL Behring, Lexicon, Merck, Metavant, Novo Nordisk, and Sanofi.
CHICAGO – compared with placebo, while causing modest increases in heart rate, in a prespecified substudy of the SURMOUNT-1 trial.
“The large effects on ambulatory 24-hour blood pressure raise the possibility that there may be important long-term benefits of [tirzepatide] on the complications of obesity,” said James A. de Lemos, MD, during a presentation at the American Heart Association scientific sessions.
“The findings are concordant with the [previously reported] office-based measurements, and the blood pressure reductions provide further evidence for the potential benefits of tirzepatide on cardiovascular health and outcomes,” said Dr. de Lemos, a cardiologist and professor at the University of Texas Southwestern Medical Center, Dallas.
The substudy included 600 of the 2,539 people enrolled in SURMOUNT-1, the first of two pivotal trials for tirzepatide (Mounjaro) in people without diabetes but with obesity or overweight (body mass index of 27-29 kg/m2) plus at least one weight-related complication. The primary endpoints of SURMOUNT-1 were the percent change in weight from baseline to 72 weeks on treatment with either of three different weekly injected doses of tirzepatide, compared with control subjects who received placebo, and the percentage of enrolled subjects achieving at least 5% loss in baseline weight, compared with the controls.
Tirzepatide treatment led to significant increases in both results, compared with controls, with the highest dose tested, 15 mg/week, resulting in an average 20.9% drop in weight from baseline after 72 weeks of treatment, and 91% of enrolled subjects on that dose achieving the 5% weight-loss threshold during the same time frame, in results published in 2022 in the New England Journal of Medicine.
24-hour ambulatory pressures from 494 people
The substudy enrolled 600 of the SURMOUNT-1 participants and involved 24-hour ambulatory BP and heart rate measurements at entry and after 36 weeks on treatment. Full results were available for 494 of these people. The substudy included only study participants who entered with a BP of less than 140/90 mm Hg. Enrollment in SURMOUNT-1 overall excluded people with a BP of 160/100 mm Hg or higher. The average BP among all enrolled participants was about 123/80 mm Hg, while heart rates averaged about 73 beats per minute.
Systolic BP measured with the ambulatory monitor fell from baseline by an average of 5.6, 8.8, and 6.2 mm Hg in the people who received tirzepatide in weekly doses of 5, 10, or 15 mg, respectively, and rose by an average 1.8 mm Hg among the controls, Dr. de Lemos reported. Diastolic BP dropped among the tirzepatide recipients by an average of 1.5, 2.4, and 0.0 mm Hg in the three ascending tirzepatide treatment arms, and rose by an average 0.5 mm Hg among the controls. All of the differences between the intervention groups and the controls were significant except for the change in diastolic BP among participants who received 15 mg of tirzepatide weekly.
The results showed that 36 weeks on tirzepatide treatment was associated with “arguably clinically meaningful” reductions in systolic and diastolic BPs, Dr. de Lemos said. “There is a lot of optimism that this will translate into clinical benefits.” He also noted that, “within the limits of cross-study comparisons, the blood pressure changes look favorable, compared with the single-incretin mechanism GLP-1 [glucagonlike peptide–1] receptor agonists.”
Heart rate fell by an average 1.8 bpm in the controls, and rose by an average 0.3, 0.5, and 3.6 bpm among the three groups receiving ascending weekly tirzepatide doses, effects that were “consistent with what’s been seen with the GLP-1 receptor agonists,” noted Dr. de Lemos.
Tirzepatide is known as a “twincretin” because it shares this GLP-1 receptor agonism and also has a second incretin agonist activity, to the receptor for the glucose-dependent insulinotropic polypeptide.
Lowering of blood pressure plateaus
Changes in BP over time during the 72 weeks on treatment, data first presented in the original report, showed that average systolic pressure in the people who received tirzepatide fell sharply during the first 24 weeks on treatment, and then leveled out with little further change over time. Furthermore, all three tirzepatide doses produced roughly similar systolic BP reductions. Changes in diastolic pressure over time showed a mostly similar pattern of reduction, although a modest ongoing decrease in average diastolic pressure continued beyond 24 weeks.
This pattern of a plateau in BP reduction has been seen before in studies using other treatments to produce weight loss, including bariatric surgery, said Naveed Sattar, MBChB, PhD, professor of metabolic medicine at the University of Glasgow, who was not involved in SURMOUNT-1. He attributed the plateau in BP reduction among tirzepatide-treated people to them hitting a wall in their BP nadir based on homeostatic limits. Dr. Sattar noted that most enrolled participants had normal BPs at entry based on the reported study averages.
“It’s hard to go lower, but the blood pressure reduction may be larger in people who start at higher pressure levels,” Dr. Sattar said in an interview.
Another inferred cap on BP reductions in the trial hypothesizes that the individual clinicians who managed the enrolled patients may have cut back on other BP-lowering agents as the pressures of the tirzepatide recipients fell to relatively low levels, suggested Darren McGuire, MD, a cardiologist and professor at UT Southwestern Medical Center, who also was not involved in the SURMOUNT-1 study.
Incretin agonists as antihypertensive drugs
The substantial BP-lowering seen with tirzepatide, as well as with other incretin agonist agents, suggests a new way to think about BP control in people with overweight or obesity, Dr. Sattar said.
“Until now, we haven’t had tools where people lose so much weight. Now that we have these tools [incretin agonists as well as bariatric surgery], we see substantial blood pressure reductions. It makes you think we should use weight-loss agents to lower blood pressure rather than a beta-blocker or angiotensin-converting enzyme inhibitor; then we’d also produce all the other benefits from weight loss,” Dr. Sattar suggested.
Dr. de Lemos said he sees signals that the BP reductions caused by tirzepatide and the GLP-1 receptor agonists may go beyond just weight-loss effects.
“There appears to be a larger blood pressure reduction than anticipated based on the change in weight,” he said during his presentation. “GLP-1 is active in most vascular tissues, so these [receptor agonist] agents likely have vascular or cardiac effects, or even effects on other tissues that may affect blood pressure.”
Heart rate increases were usually modest
The experiences with GLP-1 receptor agonists also suggest that the heart rate increases seen with tirzepatide treatment in SURMOUNT-1 will not have long-term effects. “The [Food and Drug Administration] mandated this heart rate substudy to make sure that the increase in heart rate was not larger than what would be anticipated” with a GLP-1 receptor agonist, Dr. de Lemos explained.
SURMOUNT-1 had a treatment-stopping rule to prevent a person’s heart rate from rising beyond 10 bpm from baseline. “Trivial numbers” of patients experienced a heart rate increase of this magnitude, he said. If used in routine practice, Dr. de Lemos said that he would closely investigate a patient with a heart rate increase greater than 10 mm Hg. The average increase seen with the highest dose, about 4 bpm above baseline, would generally not be concerning.
Tirzepatide received U.S. marketing approval from the FDA in May 2022 for treating people with type 2 diabetes. In October 2022, the FDA gave tirzepatide “Fast Track” designation for the pending application for approval of an indication to treat people with overweight or obesity who match the entry criteria for SURMOUNT-1 and for the second pivotal trial for this indication, SURMOUNT-2. According to a statement from Eli Lilly, the company that is developing and markets tirzepatide (Mounjaro), the FDA’s decision on the obesity indication will remain pending until the SURMOUNT-2 results are available, which the company expects will occur in 2023.
SURMOUNT-1 and SURMOUNT-2 were sponsored by Lilly, the company that markets tirzepatide. Dr. de Lemos has been a consultant to Lilly as well as to Amgen, AstraZeneca, Janssen, Novo Nordisk, Ortho, Quidel Cardiovascular, and Regeneron. Dr. Sattar has financial ties to Lilly, Afimmune, Amgen, AstraZeneca, Boehringer Ingelheim, Hammi, Merck Sharpe & Dohme, Novartis, Novo Nordisk, Pfizer, Roche, and Sanofi-Aventis. Dr. McGuire has ties to Lilly as well as to Altimmune, Applied Therapeutics, Bayer, Boehringer Ingelheim, CSL Behring, Lexicon, Merck, Metavant, Novo Nordisk, and Sanofi.
CHICAGO – compared with placebo, while causing modest increases in heart rate, in a prespecified substudy of the SURMOUNT-1 trial.
“The large effects on ambulatory 24-hour blood pressure raise the possibility that there may be important long-term benefits of [tirzepatide] on the complications of obesity,” said James A. de Lemos, MD, during a presentation at the American Heart Association scientific sessions.
“The findings are concordant with the [previously reported] office-based measurements, and the blood pressure reductions provide further evidence for the potential benefits of tirzepatide on cardiovascular health and outcomes,” said Dr. de Lemos, a cardiologist and professor at the University of Texas Southwestern Medical Center, Dallas.
The substudy included 600 of the 2,539 people enrolled in SURMOUNT-1, the first of two pivotal trials for tirzepatide (Mounjaro) in people without diabetes but with obesity or overweight (body mass index of 27-29 kg/m2) plus at least one weight-related complication. The primary endpoints of SURMOUNT-1 were the percent change in weight from baseline to 72 weeks on treatment with either of three different weekly injected doses of tirzepatide, compared with control subjects who received placebo, and the percentage of enrolled subjects achieving at least 5% loss in baseline weight, compared with the controls.
Tirzepatide treatment led to significant increases in both results, compared with controls, with the highest dose tested, 15 mg/week, resulting in an average 20.9% drop in weight from baseline after 72 weeks of treatment, and 91% of enrolled subjects on that dose achieving the 5% weight-loss threshold during the same time frame, in results published in 2022 in the New England Journal of Medicine.
24-hour ambulatory pressures from 494 people
The substudy enrolled 600 of the SURMOUNT-1 participants and involved 24-hour ambulatory BP and heart rate measurements at entry and after 36 weeks on treatment. Full results were available for 494 of these people. The substudy included only study participants who entered with a BP of less than 140/90 mm Hg. Enrollment in SURMOUNT-1 overall excluded people with a BP of 160/100 mm Hg or higher. The average BP among all enrolled participants was about 123/80 mm Hg, while heart rates averaged about 73 beats per minute.
Systolic BP measured with the ambulatory monitor fell from baseline by an average of 5.6, 8.8, and 6.2 mm Hg in the people who received tirzepatide in weekly doses of 5, 10, or 15 mg, respectively, and rose by an average 1.8 mm Hg among the controls, Dr. de Lemos reported. Diastolic BP dropped among the tirzepatide recipients by an average of 1.5, 2.4, and 0.0 mm Hg in the three ascending tirzepatide treatment arms, and rose by an average 0.5 mm Hg among the controls. All of the differences between the intervention groups and the controls were significant except for the change in diastolic BP among participants who received 15 mg of tirzepatide weekly.
The results showed that 36 weeks on tirzepatide treatment was associated with “arguably clinically meaningful” reductions in systolic and diastolic BPs, Dr. de Lemos said. “There is a lot of optimism that this will translate into clinical benefits.” He also noted that, “within the limits of cross-study comparisons, the blood pressure changes look favorable, compared with the single-incretin mechanism GLP-1 [glucagonlike peptide–1] receptor agonists.”
Heart rate fell by an average 1.8 bpm in the controls, and rose by an average 0.3, 0.5, and 3.6 bpm among the three groups receiving ascending weekly tirzepatide doses, effects that were “consistent with what’s been seen with the GLP-1 receptor agonists,” noted Dr. de Lemos.
Tirzepatide is known as a “twincretin” because it shares this GLP-1 receptor agonism and also has a second incretin agonist activity, to the receptor for the glucose-dependent insulinotropic polypeptide.
Lowering of blood pressure plateaus
Changes in BP over time during the 72 weeks on treatment, data first presented in the original report, showed that average systolic pressure in the people who received tirzepatide fell sharply during the first 24 weeks on treatment, and then leveled out with little further change over time. Furthermore, all three tirzepatide doses produced roughly similar systolic BP reductions. Changes in diastolic pressure over time showed a mostly similar pattern of reduction, although a modest ongoing decrease in average diastolic pressure continued beyond 24 weeks.
This pattern of a plateau in BP reduction has been seen before in studies using other treatments to produce weight loss, including bariatric surgery, said Naveed Sattar, MBChB, PhD, professor of metabolic medicine at the University of Glasgow, who was not involved in SURMOUNT-1. He attributed the plateau in BP reduction among tirzepatide-treated people to them hitting a wall in their BP nadir based on homeostatic limits. Dr. Sattar noted that most enrolled participants had normal BPs at entry based on the reported study averages.
“It’s hard to go lower, but the blood pressure reduction may be larger in people who start at higher pressure levels,” Dr. Sattar said in an interview.
Another inferred cap on BP reductions in the trial hypothesizes that the individual clinicians who managed the enrolled patients may have cut back on other BP-lowering agents as the pressures of the tirzepatide recipients fell to relatively low levels, suggested Darren McGuire, MD, a cardiologist and professor at UT Southwestern Medical Center, who also was not involved in the SURMOUNT-1 study.
Incretin agonists as antihypertensive drugs
The substantial BP-lowering seen with tirzepatide, as well as with other incretin agonist agents, suggests a new way to think about BP control in people with overweight or obesity, Dr. Sattar said.
“Until now, we haven’t had tools where people lose so much weight. Now that we have these tools [incretin agonists as well as bariatric surgery], we see substantial blood pressure reductions. It makes you think we should use weight-loss agents to lower blood pressure rather than a beta-blocker or angiotensin-converting enzyme inhibitor; then we’d also produce all the other benefits from weight loss,” Dr. Sattar suggested.
Dr. de Lemos said he sees signals that the BP reductions caused by tirzepatide and the GLP-1 receptor agonists may go beyond just weight-loss effects.
“There appears to be a larger blood pressure reduction than anticipated based on the change in weight,” he said during his presentation. “GLP-1 is active in most vascular tissues, so these [receptor agonist] agents likely have vascular or cardiac effects, or even effects on other tissues that may affect blood pressure.”
Heart rate increases were usually modest
The experiences with GLP-1 receptor agonists also suggest that the heart rate increases seen with tirzepatide treatment in SURMOUNT-1 will not have long-term effects. “The [Food and Drug Administration] mandated this heart rate substudy to make sure that the increase in heart rate was not larger than what would be anticipated” with a GLP-1 receptor agonist, Dr. de Lemos explained.
SURMOUNT-1 had a treatment-stopping rule to prevent a person’s heart rate from rising beyond 10 bpm from baseline. “Trivial numbers” of patients experienced a heart rate increase of this magnitude, he said. If used in routine practice, Dr. de Lemos said that he would closely investigate a patient with a heart rate increase greater than 10 mm Hg. The average increase seen with the highest dose, about 4 bpm above baseline, would generally not be concerning.
Tirzepatide received U.S. marketing approval from the FDA in May 2022 for treating people with type 2 diabetes. In October 2022, the FDA gave tirzepatide “Fast Track” designation for the pending application for approval of an indication to treat people with overweight or obesity who match the entry criteria for SURMOUNT-1 and for the second pivotal trial for this indication, SURMOUNT-2. According to a statement from Eli Lilly, the company that is developing and markets tirzepatide (Mounjaro), the FDA’s decision on the obesity indication will remain pending until the SURMOUNT-2 results are available, which the company expects will occur in 2023.
SURMOUNT-1 and SURMOUNT-2 were sponsored by Lilly, the company that markets tirzepatide. Dr. de Lemos has been a consultant to Lilly as well as to Amgen, AstraZeneca, Janssen, Novo Nordisk, Ortho, Quidel Cardiovascular, and Regeneron. Dr. Sattar has financial ties to Lilly, Afimmune, Amgen, AstraZeneca, Boehringer Ingelheim, Hammi, Merck Sharpe & Dohme, Novartis, Novo Nordisk, Pfizer, Roche, and Sanofi-Aventis. Dr. McGuire has ties to Lilly as well as to Altimmune, Applied Therapeutics, Bayer, Boehringer Ingelheim, CSL Behring, Lexicon, Merck, Metavant, Novo Nordisk, and Sanofi.
AT AHA 2022
Statins boost glycemia slightly, but CVD benefits prevail
CHICAGO – A new, expanded meta-analysis confirmed the long-known effect that statin treatment has on raising blood glucose levels and causing incident diabetes, but it also documented that these effects are small and any risk they pose to statin users is dwarfed by the cholesterol-lowering effect of statins and their ability to reduce risk for atherosclerotic cardiovascular disease (ASCVD).

This meta-analysis of 23 trials with a total of more than 150,000 participants showed that statin therapy significantly increased the risk for new-onset diabetes and worsening glycemia, driven by a “very small but generalized increase in glucose,” with a greater effect from high-intensity statin regimens and a similar but somewhat more muted effect from low- and moderate-intensity statin treatment, David Preiss, MBChB, PhD, reported at the American Heart Association scientific sessions.
Dr. Preiss also stressed that despite this, “the cardiovascular benefits of statin therapy remain substantial and profound” in people regardless of whether they have diabetes, prediabetes, or normoglycemia when they start statin treatment, noting that the impact of even high-intensity statin treatment is “absolutely tiny” increases in hemoglobin A1c and blood glucose.
“This does not detract from the substantial benefit of statin treatment,” declared Dr. Preiss, a metabolic medicine specialist and endocrinologist at Oxford (England) University.
Small glycemia increases ‘nudge’ some into diabetes
The data Dr. Preiss reported showed that high-intensity statin treatment (atorvastatin at a daily dose of at least 40 mg, or rosuvastatin at a daily dose of at least 20 mg) led to an average increase in A1c levels of 0.08 percentage points among people without diabetes when their treatment began and 0.24 percentage points among people already diagnosed with diabetes. Blood glucose levels rose by an average of 0.04 mmol/L (less than 1 mg/d) in those without diabetes, and by an average 0.22 mmol/L (about 4 mg/dL) in those with diabetes. People who received low- or moderate-intensity statin regimens had significant but smaller increases.
“We’re not talking about people going from no diabetes to frank diabetes. We’re talking about [statins] nudging a very small number of people across a diabetes threshold,” an A1c of 6.5% that is set somewhat arbitrarily based on an increased risk for developing retinopathy, Dr. Preiss said. ”A person just needs to lose a [daily] can of Coke’s worth of weight to eliminate any apparent diabetes risk,” he noted.
Benefit outweighs risks by three- to sevenfold
Dr. Preiss presented two other examples of what his findings showed to illustrate the relatively small risk posed by statin therapy compared with its potential benefits. Treating 10,000 people for 5 years with a high-intensity statin regimen in those with established ASCVD (secondary prevention) would result in an increment of 150 extra people developing diabetes because of the hyperglycemic effect of statins, compared with an expected prevention of 1,000 ASCVD events. Among 10,000 people at high ASCVD risk and taking a high-intensity statin regimen for primary prevention 5 years of treatment would result in roughly 130 extra cases of incident diabetes while preventing about 500 ASCVD events.
In addition, applying the new risk estimates to the people included in the UK Biobank database, whose median A1c is 5.5%, showed that a high-intensity statin regimen could be expected to raise the prevalence of those with an A1c of 6.5% or greater from 4.5% to 5.7%.
Several preventive cardiologists who heard the report and were not involved with the analysis agreed with Dr. Preiss that the benefits of statin treatment substantially offset this confirmed hyperglycemic effect.
Risk ‘more than counterbalanced by benefit’
“He clearly showed that the small hyperglycemia risk posed by statin use is more than counterbalanced by its benefit for reducing ASCVD events,” commented Neil J. Stone, MD, a cardiologist and professor of medicine at Northwestern University, Chicago. “I agree that, for those with prediabetes who are on the road to diabetes with or without a statin, the small increase in glucose with a statin should not dissuade statin usage because the benefit is so large. Rather, it should focus efforts to improve diet, increase physical activity, and keep weight controlled.”

Dr. Stone also noted in an interview that in the JUPITER trial, which examined the effects of a daily 20-mg dose of rosuvastatin (Crestor), a high-intensity regimen, study participants with diabetes risk factors who were assigned to rosuvastatin had an onset of diabetes that was earlier than people assigned to placebo by only about 5.4 weeks, yet this group had evidence of significant benefit.

“I agree with Dr. Preiss that the benefits of statins in reducing heart attack, stroke, and cardiovascular death far outweigh their modest effects on glycemia,” commented Brendan M. Everett, MD, a cardiologist and preventive medicine specialist at Brigham and Women’s Hospital in Boston. “This is particularly true for those with preexisting prediabetes or diabetes, who have an elevated risk of atherosclerotic events and thus stand to derive more significant benefit from statins. The benefits of lowering LDL cholesterol with a statin for preventing seriously morbid, and potentially fatal, cardiovascular events far outweigh the extremely modest, or even negligible, increases in the risk of diabetes that could be seen with the extremely small increases in A1c,” Dr. Everett said in an interview.
The new findings “reaffirm that there is a increased risk [from statins] but the most important point is that it is a very, very tiny difference in A1c,” commented Marc S. Sabatine, MD, a cardiologist and professor at Harvard Medical School, Boston. “These data have been known for quite some time, but this analysis was done in a more rigorous way.” The finding of “a small increase in risk for diabetes is really because diabetes has a biochemical threshold and statin treatment nudges some people a little past a line that is semi-arbitrary. It’s important to be cognizant of this, but it in no way dissuades me from treating patients aggressively with statins to reduce their ASCVD risk. I would monitor their A1c levels, and if they go higher and can’t be controlled with lifestyle we have plenty of medications that can control it,” he said in an interview.
No difference by statin type
The meta-analysis used data from 13 placebo-controlled statin trials that together involved 123,940 participants and had an average 4.3 years of follow-up, and four trials that compared one statin with another and collectively involved 30,734 participants with an average 4.9 years of follow-up.
The analyses showed that high-intensity statin treatment increased the rate of incident diabetes by a significant 36% relative to controls and increased the rate of worsening glycemia by a significant 24% compared with controls. Low- or moderate-intensity statin regimens increased incident diabetes by a significant 10% and raised the incidence of worsening glycemia by a significant 10% compared with controls, Dr. Preiss reported.
These effects did not significantly differ by type of statin (the study included people treated with atorvastatin, fluvastatin, lovastatin, pravastatin, rosuvastatin, and simvastatin), nor across a variety of subgroups based on age, sex, race, body mass index, diabetes risk, renal function, cholesterol levels, or cardiovascular disease. The effect was also consistent regardless of the duration of treatment.
Dr. Preiss also downplayed the magnitude of the apparent difference in risk posed by high-intensity and less intense statin regimens. “I suspect the apparent heterogeneity is true, but not quite as big as what we see,” he said.
The mechanisms by which statins have this effect remain unclear, but evidence suggests that it may be a direct effect of the main action of statins, inhibition of the HMG-CoA reductase enzyme.
The study received no commercial funding. Dr. Preiss and Dr. Stone had no disclosures. Dr. Everett has been a consultant to Eli Lilly, Gilead, Ipsen, Janssen, and Provention. Dr. Sabatine has been a consultant to Althera, Amgen, Anthos Therapeutics, AstraZeneca, Beren Therapeutics, Bristol-Myers Squibb, DalCor, Dr Reddy’s Laboratories, Fibrogen, Intarcia, Merck, Moderna, Novo Nordisk, and Silence Therapeutics.
CHICAGO – A new, expanded meta-analysis confirmed the long-known effect that statin treatment has on raising blood glucose levels and causing incident diabetes, but it also documented that these effects are small and any risk they pose to statin users is dwarfed by the cholesterol-lowering effect of statins and their ability to reduce risk for atherosclerotic cardiovascular disease (ASCVD).
This meta-analysis of 23 trials with a total of more than 150,000 participants showed that statin therapy significantly increased the risk for new-onset diabetes and worsening glycemia, driven by a “very small but generalized increase in glucose,” with a greater effect from high-intensity statin regimens and a similar but somewhat more muted effect from low- and moderate-intensity statin treatment, David Preiss, MBChB, PhD, reported at the American Heart Association scientific sessions.
Dr. Preiss also stressed that despite this, “the cardiovascular benefits of statin therapy remain substantial and profound” in people regardless of whether they have diabetes, prediabetes, or normoglycemia when they start statin treatment, noting that the impact of even high-intensity statin treatment is “absolutely tiny” increases in hemoglobin A1c and blood glucose.
“This does not detract from the substantial benefit of statin treatment,” declared Dr. Preiss, a metabolic medicine specialist and endocrinologist at Oxford (England) University.
Small glycemia increases ‘nudge’ some into diabetes
The data Dr. Preiss reported showed that high-intensity statin treatment (atorvastatin at a daily dose of at least 40 mg, or rosuvastatin at a daily dose of at least 20 mg) led to an average increase in A1c levels of 0.08 percentage points among people without diabetes when their treatment began and 0.24 percentage points among people already diagnosed with diabetes. Blood glucose levels rose by an average of 0.04 mmol/L (less than 1 mg/d) in those without diabetes, and by an average 0.22 mmol/L (about 4 mg/dL) in those with diabetes. People who received low- or moderate-intensity statin regimens had significant but smaller increases.
“We’re not talking about people going from no diabetes to frank diabetes. We’re talking about [statins] nudging a very small number of people across a diabetes threshold,” an A1c of 6.5% that is set somewhat arbitrarily based on an increased risk for developing retinopathy, Dr. Preiss said. ”A person just needs to lose a [daily] can of Coke’s worth of weight to eliminate any apparent diabetes risk,” he noted.
Benefit outweighs risks by three- to sevenfold
Dr. Preiss presented two other examples of what his findings showed to illustrate the relatively small risk posed by statin therapy compared with its potential benefits. Treating 10,000 people for 5 years with a high-intensity statin regimen in those with established ASCVD (secondary prevention) would result in an increment of 150 extra people developing diabetes because of the hyperglycemic effect of statins, compared with an expected prevention of 1,000 ASCVD events. Among 10,000 people at high ASCVD risk and taking a high-intensity statin regimen for primary prevention 5 years of treatment would result in roughly 130 extra cases of incident diabetes while preventing about 500 ASCVD events.
In addition, applying the new risk estimates to the people included in the UK Biobank database, whose median A1c is 5.5%, showed that a high-intensity statin regimen could be expected to raise the prevalence of those with an A1c of 6.5% or greater from 4.5% to 5.7%.
Several preventive cardiologists who heard the report and were not involved with the analysis agreed with Dr. Preiss that the benefits of statin treatment substantially offset this confirmed hyperglycemic effect.
Risk ‘more than counterbalanced by benefit’
“He clearly showed that the small hyperglycemia risk posed by statin use is more than counterbalanced by its benefit for reducing ASCVD events,” commented Neil J. Stone, MD, a cardiologist and professor of medicine at Northwestern University, Chicago. “I agree that, for those with prediabetes who are on the road to diabetes with or without a statin, the small increase in glucose with a statin should not dissuade statin usage because the benefit is so large. Rather, it should focus efforts to improve diet, increase physical activity, and keep weight controlled.”
Dr. Stone also noted in an interview that in the JUPITER trial, which examined the effects of a daily 20-mg dose of rosuvastatin (Crestor), a high-intensity regimen, study participants with diabetes risk factors who were assigned to rosuvastatin had an onset of diabetes that was earlier than people assigned to placebo by only about 5.4 weeks, yet this group had evidence of significant benefit.
“I agree with Dr. Preiss that the benefits of statins in reducing heart attack, stroke, and cardiovascular death far outweigh their modest effects on glycemia,” commented Brendan M. Everett, MD, a cardiologist and preventive medicine specialist at Brigham and Women’s Hospital in Boston. “This is particularly true for those with preexisting prediabetes or diabetes, who have an elevated risk of atherosclerotic events and thus stand to derive more significant benefit from statins. The benefits of lowering LDL cholesterol with a statin for preventing seriously morbid, and potentially fatal, cardiovascular events far outweigh the extremely modest, or even negligible, increases in the risk of diabetes that could be seen with the extremely small increases in A1c,” Dr. Everett said in an interview.
The new findings “reaffirm that there is a increased risk [from statins] but the most important point is that it is a very, very tiny difference in A1c,” commented Marc S. Sabatine, MD, a cardiologist and professor at Harvard Medical School, Boston. “These data have been known for quite some time, but this analysis was done in a more rigorous way.” The finding of “a small increase in risk for diabetes is really because diabetes has a biochemical threshold and statin treatment nudges some people a little past a line that is semi-arbitrary. It’s important to be cognizant of this, but it in no way dissuades me from treating patients aggressively with statins to reduce their ASCVD risk. I would monitor their A1c levels, and if they go higher and can’t be controlled with lifestyle we have plenty of medications that can control it,” he said in an interview.
No difference by statin type
The meta-analysis used data from 13 placebo-controlled statin trials that together involved 123,940 participants and had an average 4.3 years of follow-up, and four trials that compared one statin with another and collectively involved 30,734 participants with an average 4.9 years of follow-up.
The analyses showed that high-intensity statin treatment increased the rate of incident diabetes by a significant 36% relative to controls and increased the rate of worsening glycemia by a significant 24% compared with controls. Low- or moderate-intensity statin regimens increased incident diabetes by a significant 10% and raised the incidence of worsening glycemia by a significant 10% compared with controls, Dr. Preiss reported.
These effects did not significantly differ by type of statin (the study included people treated with atorvastatin, fluvastatin, lovastatin, pravastatin, rosuvastatin, and simvastatin), nor across a variety of subgroups based on age, sex, race, body mass index, diabetes risk, renal function, cholesterol levels, or cardiovascular disease. The effect was also consistent regardless of the duration of treatment.
Dr. Preiss also downplayed the magnitude of the apparent difference in risk posed by high-intensity and less intense statin regimens. “I suspect the apparent heterogeneity is true, but not quite as big as what we see,” he said.
The mechanisms by which statins have this effect remain unclear, but evidence suggests that it may be a direct effect of the main action of statins, inhibition of the HMG-CoA reductase enzyme.
The study received no commercial funding. Dr. Preiss and Dr. Stone had no disclosures. Dr. Everett has been a consultant to Eli Lilly, Gilead, Ipsen, Janssen, and Provention. Dr. Sabatine has been a consultant to Althera, Amgen, Anthos Therapeutics, AstraZeneca, Beren Therapeutics, Bristol-Myers Squibb, DalCor, Dr Reddy’s Laboratories, Fibrogen, Intarcia, Merck, Moderna, Novo Nordisk, and Silence Therapeutics.
CHICAGO – A new, expanded meta-analysis confirmed the long-known effect that statin treatment has on raising blood glucose levels and causing incident diabetes, but it also documented that these effects are small and any risk they pose to statin users is dwarfed by the cholesterol-lowering effect of statins and their ability to reduce risk for atherosclerotic cardiovascular disease (ASCVD).
This meta-analysis of 23 trials with a total of more than 150,000 participants showed that statin therapy significantly increased the risk for new-onset diabetes and worsening glycemia, driven by a “very small but generalized increase in glucose,” with a greater effect from high-intensity statin regimens and a similar but somewhat more muted effect from low- and moderate-intensity statin treatment, David Preiss, MBChB, PhD, reported at the American Heart Association scientific sessions.
Dr. Preiss also stressed that despite this, “the cardiovascular benefits of statin therapy remain substantial and profound” in people regardless of whether they have diabetes, prediabetes, or normoglycemia when they start statin treatment, noting that the impact of even high-intensity statin treatment is “absolutely tiny” increases in hemoglobin A1c and blood glucose.
“This does not detract from the substantial benefit of statin treatment,” declared Dr. Preiss, a metabolic medicine specialist and endocrinologist at Oxford (England) University.
Small glycemia increases ‘nudge’ some into diabetes
The data Dr. Preiss reported showed that high-intensity statin treatment (atorvastatin at a daily dose of at least 40 mg, or rosuvastatin at a daily dose of at least 20 mg) led to an average increase in A1c levels of 0.08 percentage points among people without diabetes when their treatment began and 0.24 percentage points among people already diagnosed with diabetes. Blood glucose levels rose by an average of 0.04 mmol/L (less than 1 mg/d) in those without diabetes, and by an average 0.22 mmol/L (about 4 mg/dL) in those with diabetes. People who received low- or moderate-intensity statin regimens had significant but smaller increases.
“We’re not talking about people going from no diabetes to frank diabetes. We’re talking about [statins] nudging a very small number of people across a diabetes threshold,” an A1c of 6.5% that is set somewhat arbitrarily based on an increased risk for developing retinopathy, Dr. Preiss said. ”A person just needs to lose a [daily] can of Coke’s worth of weight to eliminate any apparent diabetes risk,” he noted.
Benefit outweighs risks by three- to sevenfold
Dr. Preiss presented two other examples of what his findings showed to illustrate the relatively small risk posed by statin therapy compared with its potential benefits. Treating 10,000 people for 5 years with a high-intensity statin regimen in those with established ASCVD (secondary prevention) would result in an increment of 150 extra people developing diabetes because of the hyperglycemic effect of statins, compared with an expected prevention of 1,000 ASCVD events. Among 10,000 people at high ASCVD risk and taking a high-intensity statin regimen for primary prevention 5 years of treatment would result in roughly 130 extra cases of incident diabetes while preventing about 500 ASCVD events.
In addition, applying the new risk estimates to the people included in the UK Biobank database, whose median A1c is 5.5%, showed that a high-intensity statin regimen could be expected to raise the prevalence of those with an A1c of 6.5% or greater from 4.5% to 5.7%.
Several preventive cardiologists who heard the report and were not involved with the analysis agreed with Dr. Preiss that the benefits of statin treatment substantially offset this confirmed hyperglycemic effect.
Risk ‘more than counterbalanced by benefit’
“He clearly showed that the small hyperglycemia risk posed by statin use is more than counterbalanced by its benefit for reducing ASCVD events,” commented Neil J. Stone, MD, a cardiologist and professor of medicine at Northwestern University, Chicago. “I agree that, for those with prediabetes who are on the road to diabetes with or without a statin, the small increase in glucose with a statin should not dissuade statin usage because the benefit is so large. Rather, it should focus efforts to improve diet, increase physical activity, and keep weight controlled.”
Dr. Stone also noted in an interview that in the JUPITER trial, which examined the effects of a daily 20-mg dose of rosuvastatin (Crestor), a high-intensity regimen, study participants with diabetes risk factors who were assigned to rosuvastatin had an onset of diabetes that was earlier than people assigned to placebo by only about 5.4 weeks, yet this group had evidence of significant benefit.
“I agree with Dr. Preiss that the benefits of statins in reducing heart attack, stroke, and cardiovascular death far outweigh their modest effects on glycemia,” commented Brendan M. Everett, MD, a cardiologist and preventive medicine specialist at Brigham and Women’s Hospital in Boston. “This is particularly true for those with preexisting prediabetes or diabetes, who have an elevated risk of atherosclerotic events and thus stand to derive more significant benefit from statins. The benefits of lowering LDL cholesterol with a statin for preventing seriously morbid, and potentially fatal, cardiovascular events far outweigh the extremely modest, or even negligible, increases in the risk of diabetes that could be seen with the extremely small increases in A1c,” Dr. Everett said in an interview.
The new findings “reaffirm that there is a increased risk [from statins] but the most important point is that it is a very, very tiny difference in A1c,” commented Marc S. Sabatine, MD, a cardiologist and professor at Harvard Medical School, Boston. “These data have been known for quite some time, but this analysis was done in a more rigorous way.” The finding of “a small increase in risk for diabetes is really because diabetes has a biochemical threshold and statin treatment nudges some people a little past a line that is semi-arbitrary. It’s important to be cognizant of this, but it in no way dissuades me from treating patients aggressively with statins to reduce their ASCVD risk. I would monitor their A1c levels, and if they go higher and can’t be controlled with lifestyle we have plenty of medications that can control it,” he said in an interview.
No difference by statin type
The meta-analysis used data from 13 placebo-controlled statin trials that together involved 123,940 participants and had an average 4.3 years of follow-up, and four trials that compared one statin with another and collectively involved 30,734 participants with an average 4.9 years of follow-up.
The analyses showed that high-intensity statin treatment increased the rate of incident diabetes by a significant 36% relative to controls and increased the rate of worsening glycemia by a significant 24% compared with controls. Low- or moderate-intensity statin regimens increased incident diabetes by a significant 10% and raised the incidence of worsening glycemia by a significant 10% compared with controls, Dr. Preiss reported.
These effects did not significantly differ by type of statin (the study included people treated with atorvastatin, fluvastatin, lovastatin, pravastatin, rosuvastatin, and simvastatin), nor across a variety of subgroups based on age, sex, race, body mass index, diabetes risk, renal function, cholesterol levels, or cardiovascular disease. The effect was also consistent regardless of the duration of treatment.
Dr. Preiss also downplayed the magnitude of the apparent difference in risk posed by high-intensity and less intense statin regimens. “I suspect the apparent heterogeneity is true, but not quite as big as what we see,” he said.
The mechanisms by which statins have this effect remain unclear, but evidence suggests that it may be a direct effect of the main action of statins, inhibition of the HMG-CoA reductase enzyme.
The study received no commercial funding. Dr. Preiss and Dr. Stone had no disclosures. Dr. Everett has been a consultant to Eli Lilly, Gilead, Ipsen, Janssen, and Provention. Dr. Sabatine has been a consultant to Althera, Amgen, Anthos Therapeutics, AstraZeneca, Beren Therapeutics, Bristol-Myers Squibb, DalCor, Dr Reddy’s Laboratories, Fibrogen, Intarcia, Merck, Moderna, Novo Nordisk, and Silence Therapeutics.
AT AHA 2022
Nutrition for cognition: A missed opportunity in U.S. seniors?
, new research shows. Researchers assessed the memory function of more than 3,500 persons who used SNAP or did not use SNAP over a period of 20 years. They found that those who didn’t use the food benefits program experienced 2 more years of cognitive aging compared with program users.
Of the 3,555 individuals included in the study, all were eligible to use the benefits, but only 559 did, leaving 2,996 participants who did not take advantage of the program.
Low program participation levels translate into a missed opportunity to prevent dementia, said study investigator Adina Zeki Al Hazzouri, PhD, assistant professor of epidemiology at the Columbia Aging Center at Columbia University Mailman School of Public Health in New York.
She said that prior research has shown that stigma may prevent older Americans from using SNAP. “Educational programs are needed to reduce the stigma that the public holds towards SNAP use,” she said.
Policy change could increase usage among older individuals, Dr. Zeki Al Hazzouri noted. Such changes could include simplifying enrollment and reporting procedures, shortening recertification periods, and increasing benefit levels.
The study was published online in Neurology.
Memory preservation
Dr. Zeki Al Hazzouri and her team assessed respondents from the Health and Retirement Study (HRS), a representative sample of Americans aged 50 and older. All respondents who were eligible to participate in SNAP in 1996 were followed every 2 years until 2016.
At each assessment, HRS respondents completed memory tests, including immediate and delayed word recall. For those who were too impaired to complete the interview, proxy informants – typically, their spouses or family members – assessed the memory and cognition of their family members using validated instruments, such as the 16-item Informant Questionnaire for Cognitive Decline.
Investigators used a validated memory function composite score, which is benchmarked against the memory assessments and evaluations of the Aging, Demographics, and Memory Study (ADAMS) cohort.
The team found that compared with nonusers, SNAP users were more likely to be women, Black, and born in the southern United States. They were less likely to be married and had more chronic conditions, such as high blood pressure, diabetes, cancer, heart problems, psychiatric problems, and arthritis.
One important study limitation was that SNAP use was measured only once during the study, the investigators noted. Ideally, Dr. Zeki Al Hazzouri said, future research would examine cumulative SNAP use history and explore the pathways that might account for the association between SNAP use and memory decline.
While findings suggest that there were no significant differences in baseline memory function between SNAP users and nonusers, users experienced approximately 2 fewer years of cognitive aging over a 10-year period than those who didn’t use the program.
Dr. Zeki Al Hazzouri speculated that SNAP benefits may slow cognitive aging by contributing to overall brain health and that, in comparison with nonusers, SNAP users absorb more nutrients, which promote neuronal integrity.
The investigators theorized that SNAP benefits may reduce stress from financial hardship, which has been linked to premature cognitive aging in other research.
“SNAP may also increase the purchasing power and investment in other health preserving behaviors, but also resulting in better access to care, which may in turn result in better disease management and management of risk factors for cognitive function,” the investigators wrote.
An underutilized program
In an accompanying editorial, Steven Albert, PhD, Philip B. Hallen Endowed Chair in Community Health and Social Justice at the University of Pittsburgh, noted that in 2020, among households with people aged 50 and older in the United States, more than 9 million Americans experienced food insecurity.
Furthermore, he pointed out, research from 2018 showed that 71% of people aged 60 and older who met income eligibility for SNAP did not participate in the program. “SNAP is an underutilized food security program involving substantial income supplements for older people with low incomes.
“Against the backdrop of so many failures of pharmacotherapy for dementia and the so far inexorable increase in the prevalence of dementia due to population aging, are we missing an opportunity to support cognitive health by failing to enroll the 14 million Americans who are over age 60 and eligible for SNAP but who do not participate?” Dr. Albert asked. He suggested that it would be helpful to determine this through a randomized promotion trial.
The study was funded by the National Institute on Aging. The authors reported no relevant financial relationships.
A version of this article first appeared on Medscape.com.
, new research shows. Researchers assessed the memory function of more than 3,500 persons who used SNAP or did not use SNAP over a period of 20 years. They found that those who didn’t use the food benefits program experienced 2 more years of cognitive aging compared with program users.
Of the 3,555 individuals included in the study, all were eligible to use the benefits, but only 559 did, leaving 2,996 participants who did not take advantage of the program.
Low program participation levels translate into a missed opportunity to prevent dementia, said study investigator Adina Zeki Al Hazzouri, PhD, assistant professor of epidemiology at the Columbia Aging Center at Columbia University Mailman School of Public Health in New York.
She said that prior research has shown that stigma may prevent older Americans from using SNAP. “Educational programs are needed to reduce the stigma that the public holds towards SNAP use,” she said.
Policy change could increase usage among older individuals, Dr. Zeki Al Hazzouri noted. Such changes could include simplifying enrollment and reporting procedures, shortening recertification periods, and increasing benefit levels.
The study was published online in Neurology.
Memory preservation
Dr. Zeki Al Hazzouri and her team assessed respondents from the Health and Retirement Study (HRS), a representative sample of Americans aged 50 and older. All respondents who were eligible to participate in SNAP in 1996 were followed every 2 years until 2016.
At each assessment, HRS respondents completed memory tests, including immediate and delayed word recall. For those who were too impaired to complete the interview, proxy informants – typically, their spouses or family members – assessed the memory and cognition of their family members using validated instruments, such as the 16-item Informant Questionnaire for Cognitive Decline.
Investigators used a validated memory function composite score, which is benchmarked against the memory assessments and evaluations of the Aging, Demographics, and Memory Study (ADAMS) cohort.
The team found that compared with nonusers, SNAP users were more likely to be women, Black, and born in the southern United States. They were less likely to be married and had more chronic conditions, such as high blood pressure, diabetes, cancer, heart problems, psychiatric problems, and arthritis.
One important study limitation was that SNAP use was measured only once during the study, the investigators noted. Ideally, Dr. Zeki Al Hazzouri said, future research would examine cumulative SNAP use history and explore the pathways that might account for the association between SNAP use and memory decline.
While findings suggest that there were no significant differences in baseline memory function between SNAP users and nonusers, users experienced approximately 2 fewer years of cognitive aging over a 10-year period than those who didn’t use the program.
Dr. Zeki Al Hazzouri speculated that SNAP benefits may slow cognitive aging by contributing to overall brain health and that, in comparison with nonusers, SNAP users absorb more nutrients, which promote neuronal integrity.
The investigators theorized that SNAP benefits may reduce stress from financial hardship, which has been linked to premature cognitive aging in other research.
“SNAP may also increase the purchasing power and investment in other health preserving behaviors, but also resulting in better access to care, which may in turn result in better disease management and management of risk factors for cognitive function,” the investigators wrote.
An underutilized program
In an accompanying editorial, Steven Albert, PhD, Philip B. Hallen Endowed Chair in Community Health and Social Justice at the University of Pittsburgh, noted that in 2020, among households with people aged 50 and older in the United States, more than 9 million Americans experienced food insecurity.
Furthermore, he pointed out, research from 2018 showed that 71% of people aged 60 and older who met income eligibility for SNAP did not participate in the program. “SNAP is an underutilized food security program involving substantial income supplements for older people with low incomes.
“Against the backdrop of so many failures of pharmacotherapy for dementia and the so far inexorable increase in the prevalence of dementia due to population aging, are we missing an opportunity to support cognitive health by failing to enroll the 14 million Americans who are over age 60 and eligible for SNAP but who do not participate?” Dr. Albert asked. He suggested that it would be helpful to determine this through a randomized promotion trial.
The study was funded by the National Institute on Aging. The authors reported no relevant financial relationships.
A version of this article first appeared on Medscape.com.
, new research shows. Researchers assessed the memory function of more than 3,500 persons who used SNAP or did not use SNAP over a period of 20 years. They found that those who didn’t use the food benefits program experienced 2 more years of cognitive aging compared with program users.
Of the 3,555 individuals included in the study, all were eligible to use the benefits, but only 559 did, leaving 2,996 participants who did not take advantage of the program.
Low program participation levels translate into a missed opportunity to prevent dementia, said study investigator Adina Zeki Al Hazzouri, PhD, assistant professor of epidemiology at the Columbia Aging Center at Columbia University Mailman School of Public Health in New York.
She said that prior research has shown that stigma may prevent older Americans from using SNAP. “Educational programs are needed to reduce the stigma that the public holds towards SNAP use,” she said.
Policy change could increase usage among older individuals, Dr. Zeki Al Hazzouri noted. Such changes could include simplifying enrollment and reporting procedures, shortening recertification periods, and increasing benefit levels.
The study was published online in Neurology.
Memory preservation
Dr. Zeki Al Hazzouri and her team assessed respondents from the Health and Retirement Study (HRS), a representative sample of Americans aged 50 and older. All respondents who were eligible to participate in SNAP in 1996 were followed every 2 years until 2016.
At each assessment, HRS respondents completed memory tests, including immediate and delayed word recall. For those who were too impaired to complete the interview, proxy informants – typically, their spouses or family members – assessed the memory and cognition of their family members using validated instruments, such as the 16-item Informant Questionnaire for Cognitive Decline.
Investigators used a validated memory function composite score, which is benchmarked against the memory assessments and evaluations of the Aging, Demographics, and Memory Study (ADAMS) cohort.
The team found that compared with nonusers, SNAP users were more likely to be women, Black, and born in the southern United States. They were less likely to be married and had more chronic conditions, such as high blood pressure, diabetes, cancer, heart problems, psychiatric problems, and arthritis.
One important study limitation was that SNAP use was measured only once during the study, the investigators noted. Ideally, Dr. Zeki Al Hazzouri said, future research would examine cumulative SNAP use history and explore the pathways that might account for the association between SNAP use and memory decline.
While findings suggest that there were no significant differences in baseline memory function between SNAP users and nonusers, users experienced approximately 2 fewer years of cognitive aging over a 10-year period than those who didn’t use the program.
Dr. Zeki Al Hazzouri speculated that SNAP benefits may slow cognitive aging by contributing to overall brain health and that, in comparison with nonusers, SNAP users absorb more nutrients, which promote neuronal integrity.
The investigators theorized that SNAP benefits may reduce stress from financial hardship, which has been linked to premature cognitive aging in other research.
“SNAP may also increase the purchasing power and investment in other health preserving behaviors, but also resulting in better access to care, which may in turn result in better disease management and management of risk factors for cognitive function,” the investigators wrote.
An underutilized program
In an accompanying editorial, Steven Albert, PhD, Philip B. Hallen Endowed Chair in Community Health and Social Justice at the University of Pittsburgh, noted that in 2020, among households with people aged 50 and older in the United States, more than 9 million Americans experienced food insecurity.
Furthermore, he pointed out, research from 2018 showed that 71% of people aged 60 and older who met income eligibility for SNAP did not participate in the program. “SNAP is an underutilized food security program involving substantial income supplements for older people with low incomes.
“Against the backdrop of so many failures of pharmacotherapy for dementia and the so far inexorable increase in the prevalence of dementia due to population aging, are we missing an opportunity to support cognitive health by failing to enroll the 14 million Americans who are over age 60 and eligible for SNAP but who do not participate?” Dr. Albert asked. He suggested that it would be helpful to determine this through a randomized promotion trial.
The study was funded by the National Institute on Aging. The authors reported no relevant financial relationships.
A version of this article first appeared on Medscape.com.
From Neurology
The body of evidence for Paxlovid therapy
Dear Colleagues,
We have a mismatch. The evidence supporting treatment for Paxlovid is compelling for people aged 60 or over, but the older patients in the United States are much less likely to be treated. Not only was there a randomized, placebo-controlled trial of high-risk patients which showed 89% reduction of hospitalizations and deaths (median age, 45), but there have been multiple real-world effectiveness studies subsequently published that have partitioned the benefit for age 65 or older, such as the ones from Israel and Hong Kong (age 60+). Overall, the real-world effectiveness in the first month after treatment is at least as good, if not better, than in the high-risk randomized trial.
We’re doing the current survey to find out, but the most likely reasons include (1) lack of confidence of benefit; (2) medication interactions; and (3) concerns over rebound.
Let me address each of these briefly. The lack of confidence in benefit stems from the fact that the initial high-risk trial was in unvaccinated individuals. That concern can now be put aside because all of the several real-world studies confirming the protective benefit against hospitalizations and deaths are in people who have been vaccinated, and a significant proportion received booster shots.
The potential medication interactions due to the ritonavir component of the Paxlovid drug combination, attributable to its cytochrome P450 3A4 inhibition, have been unduly emphasized. There are many drug-interaction checkers for Paxlovid, but this one from the University of Liverpool is user friendly, color- and icon-coded, and shows that the vast majority of interactions can be sidestepped by discontinuing the medication of concern for the length of the Paxlovid treatment, 5 days. The simple chart is provided in my recent substack newsletter.
As far as rebound, this problem has unfortunately been exaggerated because of lack of prospective systematic studies and appreciation that a positive test of clinical symptom rebound can occur without Paxlovid. There are soon to be multiple reports that the incidence of Paxlovid rebound is fairly low, in the range of 10%. That concern should not be a reason to withhold treatment.
Now the plot thickens. A new preprint report from the Veterans Health Administration, the largest health care system in the United States, looks at 90-day outcomes of about 9,000 Paxlovid-treated patients and approximately 47,000 controls. Not only was there a 26% reduction in long COVID, but of the breakdown of 12 organs/systems and symptoms, 10 of 12 were significantly reduced with Paxlovid, including pulmonary embolism, deep vein thrombosis, and neurocognitive impairment. There was also a 48% reduction in death and a 30% reduction in hospitalizations after the first 30 days. I have reviewed all of these data and put them in context in a recent newsletter. A key point is that the magnitude of benefit was unaffected by vaccination or booster status, or prior COVID infections, or unvaccinated status. Also, it was the same for men and women, as well as for age > 70 and age < 60. These findings all emphasize a new reason to be using Paxlovid therapy, and if replicated, Paxlovid may even be indicated for younger patients (who are at low risk for hospitalizations and deaths but at increased risk for long COVID).
In summary, for older patients, we should be thinking of why we should be using Paxlovid rather than the reason not to treat. We’ll be interested in the survey results to understand the mismatch better, and we look forward to your ideas and feedback to make better use of this treatment for the people who need it the most.
Sincerely yours, Eric J. Topol, MD
Dr. Topol reports no conflicts of interest with Pfizer; he receives no honoraria or speaker fees, does not serve in an advisory role, and has no financial association with the company.
A version of this article first appeared on Medscape.com.
Dear Colleagues,
We have a mismatch. The evidence supporting treatment for Paxlovid is compelling for people aged 60 or over, but the older patients in the United States are much less likely to be treated. Not only was there a randomized, placebo-controlled trial of high-risk patients which showed 89% reduction of hospitalizations and deaths (median age, 45), but there have been multiple real-world effectiveness studies subsequently published that have partitioned the benefit for age 65 or older, such as the ones from Israel and Hong Kong (age 60+). Overall, the real-world effectiveness in the first month after treatment is at least as good, if not better, than in the high-risk randomized trial.
We’re doing the current survey to find out, but the most likely reasons include (1) lack of confidence of benefit; (2) medication interactions; and (3) concerns over rebound.
Let me address each of these briefly. The lack of confidence in benefit stems from the fact that the initial high-risk trial was in unvaccinated individuals. That concern can now be put aside because all of the several real-world studies confirming the protective benefit against hospitalizations and deaths are in people who have been vaccinated, and a significant proportion received booster shots.
The potential medication interactions due to the ritonavir component of the Paxlovid drug combination, attributable to its cytochrome P450 3A4 inhibition, have been unduly emphasized. There are many drug-interaction checkers for Paxlovid, but this one from the University of Liverpool is user friendly, color- and icon-coded, and shows that the vast majority of interactions can be sidestepped by discontinuing the medication of concern for the length of the Paxlovid treatment, 5 days. The simple chart is provided in my recent substack newsletter.
As far as rebound, this problem has unfortunately been exaggerated because of lack of prospective systematic studies and appreciation that a positive test of clinical symptom rebound can occur without Paxlovid. There are soon to be multiple reports that the incidence of Paxlovid rebound is fairly low, in the range of 10%. That concern should not be a reason to withhold treatment.
Now the plot thickens. A new preprint report from the Veterans Health Administration, the largest health care system in the United States, looks at 90-day outcomes of about 9,000 Paxlovid-treated patients and approximately 47,000 controls. Not only was there a 26% reduction in long COVID, but of the breakdown of 12 organs/systems and symptoms, 10 of 12 were significantly reduced with Paxlovid, including pulmonary embolism, deep vein thrombosis, and neurocognitive impairment. There was also a 48% reduction in death and a 30% reduction in hospitalizations after the first 30 days. I have reviewed all of these data and put them in context in a recent newsletter. A key point is that the magnitude of benefit was unaffected by vaccination or booster status, or prior COVID infections, or unvaccinated status. Also, it was the same for men and women, as well as for age > 70 and age < 60. These findings all emphasize a new reason to be using Paxlovid therapy, and if replicated, Paxlovid may even be indicated for younger patients (who are at low risk for hospitalizations and deaths but at increased risk for long COVID).
In summary, for older patients, we should be thinking of why we should be using Paxlovid rather than the reason not to treat. We’ll be interested in the survey results to understand the mismatch better, and we look forward to your ideas and feedback to make better use of this treatment for the people who need it the most.
Sincerely yours, Eric J. Topol, MD
Dr. Topol reports no conflicts of interest with Pfizer; he receives no honoraria or speaker fees, does not serve in an advisory role, and has no financial association with the company.
A version of this article first appeared on Medscape.com.
Dear Colleagues,
We have a mismatch. The evidence supporting treatment for Paxlovid is compelling for people aged 60 or over, but the older patients in the United States are much less likely to be treated. Not only was there a randomized, placebo-controlled trial of high-risk patients which showed 89% reduction of hospitalizations and deaths (median age, 45), but there have been multiple real-world effectiveness studies subsequently published that have partitioned the benefit for age 65 or older, such as the ones from Israel and Hong Kong (age 60+). Overall, the real-world effectiveness in the first month after treatment is at least as good, if not better, than in the high-risk randomized trial.
We’re doing the current survey to find out, but the most likely reasons include (1) lack of confidence of benefit; (2) medication interactions; and (3) concerns over rebound.
Let me address each of these briefly. The lack of confidence in benefit stems from the fact that the initial high-risk trial was in unvaccinated individuals. That concern can now be put aside because all of the several real-world studies confirming the protective benefit against hospitalizations and deaths are in people who have been vaccinated, and a significant proportion received booster shots.
The potential medication interactions due to the ritonavir component of the Paxlovid drug combination, attributable to its cytochrome P450 3A4 inhibition, have been unduly emphasized. There are many drug-interaction checkers for Paxlovid, but this one from the University of Liverpool is user friendly, color- and icon-coded, and shows that the vast majority of interactions can be sidestepped by discontinuing the medication of concern for the length of the Paxlovid treatment, 5 days. The simple chart is provided in my recent substack newsletter.
As far as rebound, this problem has unfortunately been exaggerated because of lack of prospective systematic studies and appreciation that a positive test of clinical symptom rebound can occur without Paxlovid. There are soon to be multiple reports that the incidence of Paxlovid rebound is fairly low, in the range of 10%. That concern should not be a reason to withhold treatment.
Now the plot thickens. A new preprint report from the Veterans Health Administration, the largest health care system in the United States, looks at 90-day outcomes of about 9,000 Paxlovid-treated patients and approximately 47,000 controls. Not only was there a 26% reduction in long COVID, but of the breakdown of 12 organs/systems and symptoms, 10 of 12 were significantly reduced with Paxlovid, including pulmonary embolism, deep vein thrombosis, and neurocognitive impairment. There was also a 48% reduction in death and a 30% reduction in hospitalizations after the first 30 days. I have reviewed all of these data and put them in context in a recent newsletter. A key point is that the magnitude of benefit was unaffected by vaccination or booster status, or prior COVID infections, or unvaccinated status. Also, it was the same for men and women, as well as for age > 70 and age < 60. These findings all emphasize a new reason to be using Paxlovid therapy, and if replicated, Paxlovid may even be indicated for younger patients (who are at low risk for hospitalizations and deaths but at increased risk for long COVID).
In summary, for older patients, we should be thinking of why we should be using Paxlovid rather than the reason not to treat. We’ll be interested in the survey results to understand the mismatch better, and we look forward to your ideas and feedback to make better use of this treatment for the people who need it the most.
Sincerely yours, Eric J. Topol, MD
Dr. Topol reports no conflicts of interest with Pfizer; he receives no honoraria or speaker fees, does not serve in an advisory role, and has no financial association with the company.
A version of this article first appeared on Medscape.com.
Repeat COVID infection doubles mortality risk
Getting COVID-19 a second time doubles a person’s chance of dying and triples the likelihood of being hospitalized in the next 6 months, a new study found.
Vaccination and booster status did not improve survival or hospitalization rates among people who were infected more than once.
“Reinfection with COVID-19 increases the risk of both acute outcomes and long COVID,” study author Ziyad Al-Aly, MD, told Reuters. “This was evident in unvaccinated, vaccinated and boosted people.”
The study was published in the journal Nature Medicine.
Researchers analyzed U.S. Department of Veterans Affairs data, including 443,588 people with a first infection of SARS-CoV-2, 40,947 people who were infected two or more times, and 5.3 million people who had not been infected with coronavirus, whose data served as the control group.
“During the past few months, there’s been an air of invincibility among people who have had COVID-19 or their vaccinations and boosters, and especially among people who have had an infection and also received vaccines; some people started to [refer] to these individuals as having a sort of superimmunity to the virus,” Dr. Al-Aly said in a press release from Washington University in St. Louis. “Without ambiguity, our research showed that getting an infection a second, third or fourth time contributes to additional health risks in the acute phase, meaning the first 30 days after infection, and in the months beyond, meaning the long COVID phase.”
Being infected with COVID-19 more than once also dramatically increased the risk of developing lung problems, heart conditions, or brain conditions. The heightened risks persisted for 6 months.
Researchers said a limitation of their study was that data primarily came from White males.
An expert not involved in the study told Reuters that the Veterans Affairs population does not reflect the general population. Patients at VA health facilities are generally older with more than normal health complications, said John Moore, PhD, a professor of microbiology and immunology at Weill Cornell Medicine, New York.
Dr. Al-Aly encouraged people to be vigilant as they plan for the holiday season, Reuters reported.
“We had started seeing a lot of patients coming to the clinic with an air of invincibility,” he told Reuters. “They wondered, ‘Does getting a reinfection really matter?’ The answer is yes, it absolutely does.”
A version of this article first appeared on WebMD.com.
Getting COVID-19 a second time doubles a person’s chance of dying and triples the likelihood of being hospitalized in the next 6 months, a new study found.
Vaccination and booster status did not improve survival or hospitalization rates among people who were infected more than once.
“Reinfection with COVID-19 increases the risk of both acute outcomes and long COVID,” study author Ziyad Al-Aly, MD, told Reuters. “This was evident in unvaccinated, vaccinated and boosted people.”
The study was published in the journal Nature Medicine.
Researchers analyzed U.S. Department of Veterans Affairs data, including 443,588 people with a first infection of SARS-CoV-2, 40,947 people who were infected two or more times, and 5.3 million people who had not been infected with coronavirus, whose data served as the control group.
“During the past few months, there’s been an air of invincibility among people who have had COVID-19 or their vaccinations and boosters, and especially among people who have had an infection and also received vaccines; some people started to [refer] to these individuals as having a sort of superimmunity to the virus,” Dr. Al-Aly said in a press release from Washington University in St. Louis. “Without ambiguity, our research showed that getting an infection a second, third or fourth time contributes to additional health risks in the acute phase, meaning the first 30 days after infection, and in the months beyond, meaning the long COVID phase.”
Being infected with COVID-19 more than once also dramatically increased the risk of developing lung problems, heart conditions, or brain conditions. The heightened risks persisted for 6 months.
Researchers said a limitation of their study was that data primarily came from White males.
An expert not involved in the study told Reuters that the Veterans Affairs population does not reflect the general population. Patients at VA health facilities are generally older with more than normal health complications, said John Moore, PhD, a professor of microbiology and immunology at Weill Cornell Medicine, New York.
Dr. Al-Aly encouraged people to be vigilant as they plan for the holiday season, Reuters reported.
“We had started seeing a lot of patients coming to the clinic with an air of invincibility,” he told Reuters. “They wondered, ‘Does getting a reinfection really matter?’ The answer is yes, it absolutely does.”
A version of this article first appeared on WebMD.com.
Getting COVID-19 a second time doubles a person’s chance of dying and triples the likelihood of being hospitalized in the next 6 months, a new study found.
Vaccination and booster status did not improve survival or hospitalization rates among people who were infected more than once.
“Reinfection with COVID-19 increases the risk of both acute outcomes and long COVID,” study author Ziyad Al-Aly, MD, told Reuters. “This was evident in unvaccinated, vaccinated and boosted people.”
The study was published in the journal Nature Medicine.
Researchers analyzed U.S. Department of Veterans Affairs data, including 443,588 people with a first infection of SARS-CoV-2, 40,947 people who were infected two or more times, and 5.3 million people who had not been infected with coronavirus, whose data served as the control group.
“During the past few months, there’s been an air of invincibility among people who have had COVID-19 or their vaccinations and boosters, and especially among people who have had an infection and also received vaccines; some people started to [refer] to these individuals as having a sort of superimmunity to the virus,” Dr. Al-Aly said in a press release from Washington University in St. Louis. “Without ambiguity, our research showed that getting an infection a second, third or fourth time contributes to additional health risks in the acute phase, meaning the first 30 days after infection, and in the months beyond, meaning the long COVID phase.”
Being infected with COVID-19 more than once also dramatically increased the risk of developing lung problems, heart conditions, or brain conditions. The heightened risks persisted for 6 months.
Researchers said a limitation of their study was that data primarily came from White males.
An expert not involved in the study told Reuters that the Veterans Affairs population does not reflect the general population. Patients at VA health facilities are generally older with more than normal health complications, said John Moore, PhD, a professor of microbiology and immunology at Weill Cornell Medicine, New York.
Dr. Al-Aly encouraged people to be vigilant as they plan for the holiday season, Reuters reported.
“We had started seeing a lot of patients coming to the clinic with an air of invincibility,” he told Reuters. “They wondered, ‘Does getting a reinfection really matter?’ The answer is yes, it absolutely does.”
A version of this article first appeared on WebMD.com.
FROM NATURE MEDICINE
These doctors earn less but say it’s worth it
Earning a huge salary was never a top priority for Sarah Ramer, MD, a nephrologist at the James J. Peters Veterans Affairs Medical Center in New York. That was obvious even when she was still a medical student, since she opted for an extra academic year to get a masters degree in clinical research methods.
After doing a combined internal medicine/pediatric residency, Dr. Ramer completed two fellowships, one in adult nephrology and one in palliative care.
“Every extra year that you spend in training is another year you’re not making a salary as an attending, so by doing 7 years in residency and a fellowship, I was not building my net worth the way some physicians do,” she says.
When Dr. Ramer, now 41, was ready to enter the job market in 2019, she had two offers on the table – one at a large, urban, research-intense medical center that included some clinical work combined with research and that paid $105,000, and one as a clinical nephrologist at a smaller suburban medical center with a $230,000 salary and a $20,000 performance bonus.
She took the first job, because she liked the idea of being ensured of having time to perform research, and she hoped to qualify for a career development grant from the National Institutes of Health.
Over the next few months, Dr. Ramer was diagnosed with cancer and the pandemic began ravaging the country. She considered taking a leave of absence from her job, but since she had only recently started at the job, taking a medical leave would mean she’d get only 50% of her salary, which would have left her with just over $50,000 to cover her mortgage, student loans, and other expenses.
“Financially, it would have been disastrous for me to go on leave at that time,” she says. “Things happen, but that’s something I didn’t consider when I decided to take a very low-paying job.”
Dr. Ramer has completed cancer treatment and has moved on to her current role at the VA medical center, where she is earning less than she would have made at the suburban medical center but more than twice as much as she did at the urban research hospital.
Lifestyle trade-offs
While Dr. Ramer’s salary is nearly four times that of the average American worker, it’s only about 60% of what the average physician earns. That works for Dr. Ramer, who has never put much value in material possessions. She has lived in the same working-class New Jersey neighborhood for more than a decade and drives a 2010 Hyundai Elantra.
“I need a new kitchen and new bathrooms in my apartment,” she says. “I’m still working on that. I have a good cushion, but I need to build up my emergency fund before I start spending money on home renovations.”
Such trade-offs are common among physicians who’ve chosen to work in a rural area, at a Medicaid practice, or in public health.
For Sean Kissel, MD, 30, a family physician in northern Utah, it’s about the lifestyle afforded by his role, which has earned him between $190,000 and $230,000 over the past few years. “I have no on-call shifts,” he says. “So, when I’m done, I’m done. I don’t have to work weekends or holidays, and I have dinner with my kids every night.”
According to the 2022 Medscape physician compensation report, physicians earned an average of $339,000 annually last year. Primary care physicians took home an average of $260,000, compared with $368,000 for specialists. The disparity in physician income was even greater when broken down by specialty. Plastic surgeons earned the most ($576,000), and public health and preventive medicine physicians earned the least ($243,000).
Still, that study found that physician salaries were up across every specialty, ranging from a 1% increase for critical care physicians to a 13% jump for otolaryngologists.
Scaling back
While private-pay physicians tend to make more than peers who work in community or government health clinics, they may have to work longer hours or face pressure to see more patients, which can decrease the quality of care they provide.
A recent study, published in JAMA Health Forum, found that most health systems base physician pay on the number of patients seen. That’s the case for more than 80% of primary care physicians and more than 90% of specialists, according to the study.
Given that landscape, a growing number of physicians are opting for a “lifestyle” practice – accepting lower compensation in order to see a limited number of patients or work only a few days per week, says Stu Schaff, the founder and lead adviser of Contract Medicine, a consulting firm that helps physicians understand, evaluate, and negotiate their employment contracts. Mr. Schaff concedes that most of the doctors who fall into this category are winding down their careers or have a high-earning spouse with a salary that offsets their lower income.
Other physicians move into administrative roles within a hospital or health center. Such positions typically involve seeing fewer patients and may pay less, but they also have more traditional hours, which can be appealing, Mr. Schaff says.
“Those folks might still do patient care 1 or 2 days a week, or even less,” he says. “They’re still physicians. They’re still using their physician expertise, but they’re not practicing at the same level or generating the same level of income as they might in a full-time clinical position.”
Cost of living matters
Dr. Kissel says that while he may take home less than the typical physician, he still makes enough to comfortably cover his expenses, including his student loan payments. Still, when new acquaintances learn he’s a physician, they often assume he’s earning much more.
“People assume most of us make mid-$300,000’s or low $400,000’s, and that’s true for some family doctors, but not for all,” he notes. “I like what I do. I’m in a good place, and we are happy with our life.”
Plus, Dr. Kissel may benefit from living in Utah, where the lower cost of living may allow him to stretch his salary further. Although salaries are typically higher in the most expensive states in the United States, compared with states that have a lower cost of living, those higher salaries aren’t always enough to make up the difference.
A recent WalletHub analysis found that New York, California, and Massachusetts were among the states with the lowest average annual wage when adjusted for the cost of living, while South Dakota, Indiana, and Wisconsin had the highest average wage after the adjustment.
“Even if a physician is in a lower-paying specialty or location, they’re still well-paid relative to the average U.S. citizen,” Mr. Schaff says. “When we talk about specialties that pay less, we’re still talking – if you’re full-time – about a six-figure income.”
Location, location, location
To combat a provider shortage, rural health centers have been increasing the pay doctors receive. Nevertheless, many physicians are opting not to live in a community where they have no connection.
“I think there has to be a tie to the community for a physician to want to be here,” says Scott Crouch, chief executive officer at Ozarks Community Health Center, Bolivar, Missouri. “NHSC [National Health Service Corps] can help some, but it’s not the draw it once was.”
Physicians and dentists who interview at the Ozarks Community Health Center often like the facilities and the area but don’t want to live in a rustic locale. “Most medical schools are in bigger cities,” Mr. Crouch says. “So it’s hard to get them into a rural environment.”
In some cases, physicians opt to go the community health route but choose to work in a city, even if it means they’re going to earn less. That was the case for Kevin King, MD, 33, a general pediatrician at St. John’s Community Health Center, Los Angeles. Dr. King knew he wanted to work in a community health center after completing a residency at a Medicaid clinic.
A rewarding career
“I find my work very rewarding,” Dr. King says. “Working in Medicaid can be difficult, and there are many barriers to care. It’s a lot more work to get things done, but the rewards come from the patients.”
That said, Dr. King adds he wouldn’t have been able to take this job without access to a loan forgiveness program that helps him manage his student-loan debt. “Without that, I’d probably have to find work in a private-pay population, making more money,” he says. “Loan forgiveness allowed me to choose this career path.”
Dr. King says he earns between $150,000 and $200,000 annually. That’s significantly less than the $243,000 median pediatrician salary in Los Angeles, according to Salary.com. Still, Dr. King says he wouldn’t trade his job for a more lucrative one.
“In medicine, there are so many different career paths you can take after residency training,” he says. “Finding one that brings you joy in what you do every day is more valuable than any amount of money.”
A version of this article first appeared on Medscape.com.
Earning a huge salary was never a top priority for Sarah Ramer, MD, a nephrologist at the James J. Peters Veterans Affairs Medical Center in New York. That was obvious even when she was still a medical student, since she opted for an extra academic year to get a masters degree in clinical research methods.
After doing a combined internal medicine/pediatric residency, Dr. Ramer completed two fellowships, one in adult nephrology and one in palliative care.
“Every extra year that you spend in training is another year you’re not making a salary as an attending, so by doing 7 years in residency and a fellowship, I was not building my net worth the way some physicians do,” she says.
When Dr. Ramer, now 41, was ready to enter the job market in 2019, she had two offers on the table – one at a large, urban, research-intense medical center that included some clinical work combined with research and that paid $105,000, and one as a clinical nephrologist at a smaller suburban medical center with a $230,000 salary and a $20,000 performance bonus.
She took the first job, because she liked the idea of being ensured of having time to perform research, and she hoped to qualify for a career development grant from the National Institutes of Health.
Over the next few months, Dr. Ramer was diagnosed with cancer and the pandemic began ravaging the country. She considered taking a leave of absence from her job, but since she had only recently started at the job, taking a medical leave would mean she’d get only 50% of her salary, which would have left her with just over $50,000 to cover her mortgage, student loans, and other expenses.
“Financially, it would have been disastrous for me to go on leave at that time,” she says. “Things happen, but that’s something I didn’t consider when I decided to take a very low-paying job.”
Dr. Ramer has completed cancer treatment and has moved on to her current role at the VA medical center, where she is earning less than she would have made at the suburban medical center but more than twice as much as she did at the urban research hospital.
Lifestyle trade-offs
While Dr. Ramer’s salary is nearly four times that of the average American worker, it’s only about 60% of what the average physician earns. That works for Dr. Ramer, who has never put much value in material possessions. She has lived in the same working-class New Jersey neighborhood for more than a decade and drives a 2010 Hyundai Elantra.
“I need a new kitchen and new bathrooms in my apartment,” she says. “I’m still working on that. I have a good cushion, but I need to build up my emergency fund before I start spending money on home renovations.”
Such trade-offs are common among physicians who’ve chosen to work in a rural area, at a Medicaid practice, or in public health.
For Sean Kissel, MD, 30, a family physician in northern Utah, it’s about the lifestyle afforded by his role, which has earned him between $190,000 and $230,000 over the past few years. “I have no on-call shifts,” he says. “So, when I’m done, I’m done. I don’t have to work weekends or holidays, and I have dinner with my kids every night.”
According to the 2022 Medscape physician compensation report, physicians earned an average of $339,000 annually last year. Primary care physicians took home an average of $260,000, compared with $368,000 for specialists. The disparity in physician income was even greater when broken down by specialty. Plastic surgeons earned the most ($576,000), and public health and preventive medicine physicians earned the least ($243,000).
Still, that study found that physician salaries were up across every specialty, ranging from a 1% increase for critical care physicians to a 13% jump for otolaryngologists.
Scaling back
While private-pay physicians tend to make more than peers who work in community or government health clinics, they may have to work longer hours or face pressure to see more patients, which can decrease the quality of care they provide.
A recent study, published in JAMA Health Forum, found that most health systems base physician pay on the number of patients seen. That’s the case for more than 80% of primary care physicians and more than 90% of specialists, according to the study.
Given that landscape, a growing number of physicians are opting for a “lifestyle” practice – accepting lower compensation in order to see a limited number of patients or work only a few days per week, says Stu Schaff, the founder and lead adviser of Contract Medicine, a consulting firm that helps physicians understand, evaluate, and negotiate their employment contracts. Mr. Schaff concedes that most of the doctors who fall into this category are winding down their careers or have a high-earning spouse with a salary that offsets their lower income.
Other physicians move into administrative roles within a hospital or health center. Such positions typically involve seeing fewer patients and may pay less, but they also have more traditional hours, which can be appealing, Mr. Schaff says.
“Those folks might still do patient care 1 or 2 days a week, or even less,” he says. “They’re still physicians. They’re still using their physician expertise, but they’re not practicing at the same level or generating the same level of income as they might in a full-time clinical position.”
Cost of living matters
Dr. Kissel says that while he may take home less than the typical physician, he still makes enough to comfortably cover his expenses, including his student loan payments. Still, when new acquaintances learn he’s a physician, they often assume he’s earning much more.
“People assume most of us make mid-$300,000’s or low $400,000’s, and that’s true for some family doctors, but not for all,” he notes. “I like what I do. I’m in a good place, and we are happy with our life.”
Plus, Dr. Kissel may benefit from living in Utah, where the lower cost of living may allow him to stretch his salary further. Although salaries are typically higher in the most expensive states in the United States, compared with states that have a lower cost of living, those higher salaries aren’t always enough to make up the difference.
A recent WalletHub analysis found that New York, California, and Massachusetts were among the states with the lowest average annual wage when adjusted for the cost of living, while South Dakota, Indiana, and Wisconsin had the highest average wage after the adjustment.
“Even if a physician is in a lower-paying specialty or location, they’re still well-paid relative to the average U.S. citizen,” Mr. Schaff says. “When we talk about specialties that pay less, we’re still talking – if you’re full-time – about a six-figure income.”
Location, location, location
To combat a provider shortage, rural health centers have been increasing the pay doctors receive. Nevertheless, many physicians are opting not to live in a community where they have no connection.
“I think there has to be a tie to the community for a physician to want to be here,” says Scott Crouch, chief executive officer at Ozarks Community Health Center, Bolivar, Missouri. “NHSC [National Health Service Corps] can help some, but it’s not the draw it once was.”
Physicians and dentists who interview at the Ozarks Community Health Center often like the facilities and the area but don’t want to live in a rustic locale. “Most medical schools are in bigger cities,” Mr. Crouch says. “So it’s hard to get them into a rural environment.”
In some cases, physicians opt to go the community health route but choose to work in a city, even if it means they’re going to earn less. That was the case for Kevin King, MD, 33, a general pediatrician at St. John’s Community Health Center, Los Angeles. Dr. King knew he wanted to work in a community health center after completing a residency at a Medicaid clinic.
A rewarding career
“I find my work very rewarding,” Dr. King says. “Working in Medicaid can be difficult, and there are many barriers to care. It’s a lot more work to get things done, but the rewards come from the patients.”
That said, Dr. King adds he wouldn’t have been able to take this job without access to a loan forgiveness program that helps him manage his student-loan debt. “Without that, I’d probably have to find work in a private-pay population, making more money,” he says. “Loan forgiveness allowed me to choose this career path.”
Dr. King says he earns between $150,000 and $200,000 annually. That’s significantly less than the $243,000 median pediatrician salary in Los Angeles, according to Salary.com. Still, Dr. King says he wouldn’t trade his job for a more lucrative one.
“In medicine, there are so many different career paths you can take after residency training,” he says. “Finding one that brings you joy in what you do every day is more valuable than any amount of money.”
A version of this article first appeared on Medscape.com.
Earning a huge salary was never a top priority for Sarah Ramer, MD, a nephrologist at the James J. Peters Veterans Affairs Medical Center in New York. That was obvious even when she was still a medical student, since she opted for an extra academic year to get a masters degree in clinical research methods.
After doing a combined internal medicine/pediatric residency, Dr. Ramer completed two fellowships, one in adult nephrology and one in palliative care.
“Every extra year that you spend in training is another year you’re not making a salary as an attending, so by doing 7 years in residency and a fellowship, I was not building my net worth the way some physicians do,” she says.
When Dr. Ramer, now 41, was ready to enter the job market in 2019, she had two offers on the table – one at a large, urban, research-intense medical center that included some clinical work combined with research and that paid $105,000, and one as a clinical nephrologist at a smaller suburban medical center with a $230,000 salary and a $20,000 performance bonus.
She took the first job, because she liked the idea of being ensured of having time to perform research, and she hoped to qualify for a career development grant from the National Institutes of Health.
Over the next few months, Dr. Ramer was diagnosed with cancer and the pandemic began ravaging the country. She considered taking a leave of absence from her job, but since she had only recently started at the job, taking a medical leave would mean she’d get only 50% of her salary, which would have left her with just over $50,000 to cover her mortgage, student loans, and other expenses.
“Financially, it would have been disastrous for me to go on leave at that time,” she says. “Things happen, but that’s something I didn’t consider when I decided to take a very low-paying job.”
Dr. Ramer has completed cancer treatment and has moved on to her current role at the VA medical center, where she is earning less than she would have made at the suburban medical center but more than twice as much as she did at the urban research hospital.
Lifestyle trade-offs
While Dr. Ramer’s salary is nearly four times that of the average American worker, it’s only about 60% of what the average physician earns. That works for Dr. Ramer, who has never put much value in material possessions. She has lived in the same working-class New Jersey neighborhood for more than a decade and drives a 2010 Hyundai Elantra.
“I need a new kitchen and new bathrooms in my apartment,” she says. “I’m still working on that. I have a good cushion, but I need to build up my emergency fund before I start spending money on home renovations.”
Such trade-offs are common among physicians who’ve chosen to work in a rural area, at a Medicaid practice, or in public health.
For Sean Kissel, MD, 30, a family physician in northern Utah, it’s about the lifestyle afforded by his role, which has earned him between $190,000 and $230,000 over the past few years. “I have no on-call shifts,” he says. “So, when I’m done, I’m done. I don’t have to work weekends or holidays, and I have dinner with my kids every night.”
According to the 2022 Medscape physician compensation report, physicians earned an average of $339,000 annually last year. Primary care physicians took home an average of $260,000, compared with $368,000 for specialists. The disparity in physician income was even greater when broken down by specialty. Plastic surgeons earned the most ($576,000), and public health and preventive medicine physicians earned the least ($243,000).
Still, that study found that physician salaries were up across every specialty, ranging from a 1% increase for critical care physicians to a 13% jump for otolaryngologists.
Scaling back
While private-pay physicians tend to make more than peers who work in community or government health clinics, they may have to work longer hours or face pressure to see more patients, which can decrease the quality of care they provide.
A recent study, published in JAMA Health Forum, found that most health systems base physician pay on the number of patients seen. That’s the case for more than 80% of primary care physicians and more than 90% of specialists, according to the study.
Given that landscape, a growing number of physicians are opting for a “lifestyle” practice – accepting lower compensation in order to see a limited number of patients or work only a few days per week, says Stu Schaff, the founder and lead adviser of Contract Medicine, a consulting firm that helps physicians understand, evaluate, and negotiate their employment contracts. Mr. Schaff concedes that most of the doctors who fall into this category are winding down their careers or have a high-earning spouse with a salary that offsets their lower income.
Other physicians move into administrative roles within a hospital or health center. Such positions typically involve seeing fewer patients and may pay less, but they also have more traditional hours, which can be appealing, Mr. Schaff says.
“Those folks might still do patient care 1 or 2 days a week, or even less,” he says. “They’re still physicians. They’re still using their physician expertise, but they’re not practicing at the same level or generating the same level of income as they might in a full-time clinical position.”
Cost of living matters
Dr. Kissel says that while he may take home less than the typical physician, he still makes enough to comfortably cover his expenses, including his student loan payments. Still, when new acquaintances learn he’s a physician, they often assume he’s earning much more.
“People assume most of us make mid-$300,000’s or low $400,000’s, and that’s true for some family doctors, but not for all,” he notes. “I like what I do. I’m in a good place, and we are happy with our life.”
Plus, Dr. Kissel may benefit from living in Utah, where the lower cost of living may allow him to stretch his salary further. Although salaries are typically higher in the most expensive states in the United States, compared with states that have a lower cost of living, those higher salaries aren’t always enough to make up the difference.
A recent WalletHub analysis found that New York, California, and Massachusetts were among the states with the lowest average annual wage when adjusted for the cost of living, while South Dakota, Indiana, and Wisconsin had the highest average wage after the adjustment.
“Even if a physician is in a lower-paying specialty or location, they’re still well-paid relative to the average U.S. citizen,” Mr. Schaff says. “When we talk about specialties that pay less, we’re still talking – if you’re full-time – about a six-figure income.”
Location, location, location
To combat a provider shortage, rural health centers have been increasing the pay doctors receive. Nevertheless, many physicians are opting not to live in a community where they have no connection.
“I think there has to be a tie to the community for a physician to want to be here,” says Scott Crouch, chief executive officer at Ozarks Community Health Center, Bolivar, Missouri. “NHSC [National Health Service Corps] can help some, but it’s not the draw it once was.”
Physicians and dentists who interview at the Ozarks Community Health Center often like the facilities and the area but don’t want to live in a rustic locale. “Most medical schools are in bigger cities,” Mr. Crouch says. “So it’s hard to get them into a rural environment.”
In some cases, physicians opt to go the community health route but choose to work in a city, even if it means they’re going to earn less. That was the case for Kevin King, MD, 33, a general pediatrician at St. John’s Community Health Center, Los Angeles. Dr. King knew he wanted to work in a community health center after completing a residency at a Medicaid clinic.
A rewarding career
“I find my work very rewarding,” Dr. King says. “Working in Medicaid can be difficult, and there are many barriers to care. It’s a lot more work to get things done, but the rewards come from the patients.”
That said, Dr. King adds he wouldn’t have been able to take this job without access to a loan forgiveness program that helps him manage his student-loan debt. “Without that, I’d probably have to find work in a private-pay population, making more money,” he says. “Loan forgiveness allowed me to choose this career path.”
Dr. King says he earns between $150,000 and $200,000 annually. That’s significantly less than the $243,000 median pediatrician salary in Los Angeles, according to Salary.com. Still, Dr. King says he wouldn’t trade his job for a more lucrative one.
“In medicine, there are so many different career paths you can take after residency training,” he says. “Finding one that brings you joy in what you do every day is more valuable than any amount of money.”
A version of this article first appeared on Medscape.com.
Which exercise is best for bone health?
An 18-year-old woman with Crohn’s disease (diagnosed 3 years ago) came to my office for advice regarding management of osteoporosis. Her bone density was low for her age, and she had three low-impact fractures of her long bones in the preceding 4 years.
Loss of weight after the onset of Crohn’s disease, subsequent loss of periods, inflammation associated with her underlying diagnosis, and early treatment with glucocorticoids (known to have deleterious effects on bone) were believed to have caused osteoporosis in this young woman.
A few months previously, she was switched to a medication that doesn’t impair bone health and glucocorticoids were discontinued; her weight began to improve, and her Crohn’s disease was now in remission. Her menses had resumed about 3 months before her visit to my clinic after a prolonged period without periods. She was on calcium and vitamin D supplements, with normal levels of vitamin D.
Many factors determine bone health including (but not limited to) genetics, nutritional status, exercise activity (with mechanical loading of bones), macro- and micronutrient intake, hormonal status, chronic inflammation and other disease states, and medication use.
Exercise certainly has beneficial effects on bone. Bone-loading activities increase bone formation through the activation of certain cells in bone called osteocytes, which serve as mechanosensors and sense bone loading. Osteocytes make a hormone called sclerostin, which typically inhibits bone formation. When osteocytes sense bone-loading activities, sclerostin secretion reduces, allowing for increased bone formation.
Consistent with this, investigators in Canada have demonstrated greater increases in bone density and strength in schoolchildren who engage in moderate to vigorous physical activity, particularly bone-loading exercise, during the school day, compared with those who don’t (J Bone Miner Res. 2007 Mar;22[3]:434-46; J Bone Miner Res. 2017 Jul;32[7]:1525-36). In females, normal levels of estrogen seem necessary for osteocytes to bring about these effects after bone-loading activities. This is probably one of several reasons why athletes who lose their periods (indicative of low estrogen levels) and develop low bone density with an increased risk for fracture even when they are still at a normal weight (J Clin Endocrinol Metab. 2018 Jun 1;103[6]:2392-402; Med Sci Sports Exerc. 2015 Aug;47[8]:1577-86).
One concern around prescribing bone-loading activity or exercise to persons with osteoporosis is whether it would increase the risk for fracture from the impact on fragile bone. The extent of bone loading safe for fragile bone can be difficult to determine. Furthermore, excessive exercise may worsen bone health by causing weight loss or loss of periods in women. Very careful monitoring may be necessary to ensure that energy balance is maintained. Therefore, the nature and volume of exercise should be discussed with one’s doctor or physical therapist as well as a dietitian (if the patient is seeing one).
In patients with osteoporosis, high-impact activities such as jumping; repetitive impact activities such as running or jogging; and bending and twisting activities such as touching one’s toes, golf, tennis, and bowling aren’t recommended because they increase the risk for fracture. Even yoga poses should be discussed, because some may increase the risk for compression fractures of the vertebrae in the spine.
Strength and resistance training are generally believed to be good for bones. Strength training involves activities that build muscle strength and mass. Resistance training builds muscle strength, mass, and endurance by making muscles work against some form of resistance. Such activities include weight training with free weights or weight machines, use of resistance bands, and use of one’s own body to strengthen major muscle groups (such as through push-ups, squats, lunges, and gluteus maximus extension).
Some amount of weight-bearing aerobic training is also recommended, including walking, low-impact aerobics, the elliptical, and stair-climbing. Non–weight-bearing activities, such as swimming and cycling, typically don’t contribute to improving bone density.
In older individuals with osteoporosis, agility exercises are particularly useful to reduce the fall risk (J Am Geriatr Soc. 2004 May;52[5]:657-65; CMAJ. 2002 Oct 29;167[9]:997-1004). These can be structured to improve hand-eye coordination, foot-eye coordination, static and dynamic balance, and reaction time. Agility exercises with resistance training help improve bone density in older women.
An optimal exercise regimen includes a combination of strength and resistance training; weight-bearing aerobic training; and exercises that build flexibility, stability, and balance. A doctor, physical therapist, or trainer with expertise in the right combination of exercises should be consulted to ensure optimal effects on bone and general health.
In those at risk for overexercising to the point that they start to lose weight or lose their periods, and certainly in all women with disordered eating patterns, a dietitian should be part of the decision team to ensure that energy balance is maintained. In this group, particularly in very-low-weight women with eating disorders, exercise activity is often limited until they reach a healthier weight, and ideally after their menses resume.
For my patient with Crohn’s disease, I recommended that she see a physical therapist and a dietitian for guidance about a graded increase in exercise activity and an exercise regimen that would work best for her. I assess her bone density annually using dual-energy x-ray absorptiometry. Her bone density has gradually improved with the combination of weight gain, resumption of menses, medications for Crohn’s disease that do not affect bone deleteriously, remission of Crohn’s disease, and her exercise regimen.
Dr. Misra is chief of the division of pediatric endocrinology at Mass General Hospital for Children and professor in the department of pediatrics at Harvard Medical School, both in Boston. She reported conflicts of interest with AbbVie, Sanofi, and Ipsen.
A version of this article first appeared on Medscape.com.
An 18-year-old woman with Crohn’s disease (diagnosed 3 years ago) came to my office for advice regarding management of osteoporosis. Her bone density was low for her age, and she had three low-impact fractures of her long bones in the preceding 4 years.
Loss of weight after the onset of Crohn’s disease, subsequent loss of periods, inflammation associated with her underlying diagnosis, and early treatment with glucocorticoids (known to have deleterious effects on bone) were believed to have caused osteoporosis in this young woman.
A few months previously, she was switched to a medication that doesn’t impair bone health and glucocorticoids were discontinued; her weight began to improve, and her Crohn’s disease was now in remission. Her menses had resumed about 3 months before her visit to my clinic after a prolonged period without periods. She was on calcium and vitamin D supplements, with normal levels of vitamin D.
Many factors determine bone health including (but not limited to) genetics, nutritional status, exercise activity (with mechanical loading of bones), macro- and micronutrient intake, hormonal status, chronic inflammation and other disease states, and medication use.
Exercise certainly has beneficial effects on bone. Bone-loading activities increase bone formation through the activation of certain cells in bone called osteocytes, which serve as mechanosensors and sense bone loading. Osteocytes make a hormone called sclerostin, which typically inhibits bone formation. When osteocytes sense bone-loading activities, sclerostin secretion reduces, allowing for increased bone formation.
Consistent with this, investigators in Canada have demonstrated greater increases in bone density and strength in schoolchildren who engage in moderate to vigorous physical activity, particularly bone-loading exercise, during the school day, compared with those who don’t (J Bone Miner Res. 2007 Mar;22[3]:434-46; J Bone Miner Res. 2017 Jul;32[7]:1525-36). In females, normal levels of estrogen seem necessary for osteocytes to bring about these effects after bone-loading activities. This is probably one of several reasons why athletes who lose their periods (indicative of low estrogen levels) and develop low bone density with an increased risk for fracture even when they are still at a normal weight (J Clin Endocrinol Metab. 2018 Jun 1;103[6]:2392-402; Med Sci Sports Exerc. 2015 Aug;47[8]:1577-86).
One concern around prescribing bone-loading activity or exercise to persons with osteoporosis is whether it would increase the risk for fracture from the impact on fragile bone. The extent of bone loading safe for fragile bone can be difficult to determine. Furthermore, excessive exercise may worsen bone health by causing weight loss or loss of periods in women. Very careful monitoring may be necessary to ensure that energy balance is maintained. Therefore, the nature and volume of exercise should be discussed with one’s doctor or physical therapist as well as a dietitian (if the patient is seeing one).
In patients with osteoporosis, high-impact activities such as jumping; repetitive impact activities such as running or jogging; and bending and twisting activities such as touching one’s toes, golf, tennis, and bowling aren’t recommended because they increase the risk for fracture. Even yoga poses should be discussed, because some may increase the risk for compression fractures of the vertebrae in the spine.
Strength and resistance training are generally believed to be good for bones. Strength training involves activities that build muscle strength and mass. Resistance training builds muscle strength, mass, and endurance by making muscles work against some form of resistance. Such activities include weight training with free weights or weight machines, use of resistance bands, and use of one’s own body to strengthen major muscle groups (such as through push-ups, squats, lunges, and gluteus maximus extension).
Some amount of weight-bearing aerobic training is also recommended, including walking, low-impact aerobics, the elliptical, and stair-climbing. Non–weight-bearing activities, such as swimming and cycling, typically don’t contribute to improving bone density.
In older individuals with osteoporosis, agility exercises are particularly useful to reduce the fall risk (J Am Geriatr Soc. 2004 May;52[5]:657-65; CMAJ. 2002 Oct 29;167[9]:997-1004). These can be structured to improve hand-eye coordination, foot-eye coordination, static and dynamic balance, and reaction time. Agility exercises with resistance training help improve bone density in older women.
An optimal exercise regimen includes a combination of strength and resistance training; weight-bearing aerobic training; and exercises that build flexibility, stability, and balance. A doctor, physical therapist, or trainer with expertise in the right combination of exercises should be consulted to ensure optimal effects on bone and general health.
In those at risk for overexercising to the point that they start to lose weight or lose their periods, and certainly in all women with disordered eating patterns, a dietitian should be part of the decision team to ensure that energy balance is maintained. In this group, particularly in very-low-weight women with eating disorders, exercise activity is often limited until they reach a healthier weight, and ideally after their menses resume.
For my patient with Crohn’s disease, I recommended that she see a physical therapist and a dietitian for guidance about a graded increase in exercise activity and an exercise regimen that would work best for her. I assess her bone density annually using dual-energy x-ray absorptiometry. Her bone density has gradually improved with the combination of weight gain, resumption of menses, medications for Crohn’s disease that do not affect bone deleteriously, remission of Crohn’s disease, and her exercise regimen.
Dr. Misra is chief of the division of pediatric endocrinology at Mass General Hospital for Children and professor in the department of pediatrics at Harvard Medical School, both in Boston. She reported conflicts of interest with AbbVie, Sanofi, and Ipsen.
A version of this article first appeared on Medscape.com.
An 18-year-old woman with Crohn’s disease (diagnosed 3 years ago) came to my office for advice regarding management of osteoporosis. Her bone density was low for her age, and she had three low-impact fractures of her long bones in the preceding 4 years.
Loss of weight after the onset of Crohn’s disease, subsequent loss of periods, inflammation associated with her underlying diagnosis, and early treatment with glucocorticoids (known to have deleterious effects on bone) were believed to have caused osteoporosis in this young woman.
A few months previously, she was switched to a medication that doesn’t impair bone health and glucocorticoids were discontinued; her weight began to improve, and her Crohn’s disease was now in remission. Her menses had resumed about 3 months before her visit to my clinic after a prolonged period without periods. She was on calcium and vitamin D supplements, with normal levels of vitamin D.
Many factors determine bone health including (but not limited to) genetics, nutritional status, exercise activity (with mechanical loading of bones), macro- and micronutrient intake, hormonal status, chronic inflammation and other disease states, and medication use.
Exercise certainly has beneficial effects on bone. Bone-loading activities increase bone formation through the activation of certain cells in bone called osteocytes, which serve as mechanosensors and sense bone loading. Osteocytes make a hormone called sclerostin, which typically inhibits bone formation. When osteocytes sense bone-loading activities, sclerostin secretion reduces, allowing for increased bone formation.
Consistent with this, investigators in Canada have demonstrated greater increases in bone density and strength in schoolchildren who engage in moderate to vigorous physical activity, particularly bone-loading exercise, during the school day, compared with those who don’t (J Bone Miner Res. 2007 Mar;22[3]:434-46; J Bone Miner Res. 2017 Jul;32[7]:1525-36). In females, normal levels of estrogen seem necessary for osteocytes to bring about these effects after bone-loading activities. This is probably one of several reasons why athletes who lose their periods (indicative of low estrogen levels) and develop low bone density with an increased risk for fracture even when they are still at a normal weight (J Clin Endocrinol Metab. 2018 Jun 1;103[6]:2392-402; Med Sci Sports Exerc. 2015 Aug;47[8]:1577-86).
One concern around prescribing bone-loading activity or exercise to persons with osteoporosis is whether it would increase the risk for fracture from the impact on fragile bone. The extent of bone loading safe for fragile bone can be difficult to determine. Furthermore, excessive exercise may worsen bone health by causing weight loss or loss of periods in women. Very careful monitoring may be necessary to ensure that energy balance is maintained. Therefore, the nature and volume of exercise should be discussed with one’s doctor or physical therapist as well as a dietitian (if the patient is seeing one).
In patients with osteoporosis, high-impact activities such as jumping; repetitive impact activities such as running or jogging; and bending and twisting activities such as touching one’s toes, golf, tennis, and bowling aren’t recommended because they increase the risk for fracture. Even yoga poses should be discussed, because some may increase the risk for compression fractures of the vertebrae in the spine.
Strength and resistance training are generally believed to be good for bones. Strength training involves activities that build muscle strength and mass. Resistance training builds muscle strength, mass, and endurance by making muscles work against some form of resistance. Such activities include weight training with free weights or weight machines, use of resistance bands, and use of one’s own body to strengthen major muscle groups (such as through push-ups, squats, lunges, and gluteus maximus extension).
Some amount of weight-bearing aerobic training is also recommended, including walking, low-impact aerobics, the elliptical, and stair-climbing. Non–weight-bearing activities, such as swimming and cycling, typically don’t contribute to improving bone density.
In older individuals with osteoporosis, agility exercises are particularly useful to reduce the fall risk (J Am Geriatr Soc. 2004 May;52[5]:657-65; CMAJ. 2002 Oct 29;167[9]:997-1004). These can be structured to improve hand-eye coordination, foot-eye coordination, static and dynamic balance, and reaction time. Agility exercises with resistance training help improve bone density in older women.
An optimal exercise regimen includes a combination of strength and resistance training; weight-bearing aerobic training; and exercises that build flexibility, stability, and balance. A doctor, physical therapist, or trainer with expertise in the right combination of exercises should be consulted to ensure optimal effects on bone and general health.
In those at risk for overexercising to the point that they start to lose weight or lose their periods, and certainly in all women with disordered eating patterns, a dietitian should be part of the decision team to ensure that energy balance is maintained. In this group, particularly in very-low-weight women with eating disorders, exercise activity is often limited until they reach a healthier weight, and ideally after their menses resume.
For my patient with Crohn’s disease, I recommended that she see a physical therapist and a dietitian for guidance about a graded increase in exercise activity and an exercise regimen that would work best for her. I assess her bone density annually using dual-energy x-ray absorptiometry. Her bone density has gradually improved with the combination of weight gain, resumption of menses, medications for Crohn’s disease that do not affect bone deleteriously, remission of Crohn’s disease, and her exercise regimen.
Dr. Misra is chief of the division of pediatric endocrinology at Mass General Hospital for Children and professor in the department of pediatrics at Harvard Medical School, both in Boston. She reported conflicts of interest with AbbVie, Sanofi, and Ipsen.
A version of this article first appeared on Medscape.com.
Chronic stress, especially race related, may hasten cancer death
The American folk hero John Henry pitted his hammer against a mechanical steam drill, only to die of exhaustion after winning the battle. In the legend, John Henry was African American, and it’s a fitting metaphor, according to Justin Xavier Moore, PhD.
It’s a metaphor for accumulated stress over a lifetime, also known as allostatic load. Though it affects everyone, Black, Indigenous, and people of color experience it in excess. “It serves as a symbolism for the plight of African Americans within the United States, that regardless of all the triumph and trying to overcompensate and work just as hard as your counterpart, it oftentimes leads to this overtaxing or exhaustion because your competitor has an unfair advantage. You have Jim Crow laws in the South. We have the history of slavery. We have individuals of racial subgroups that are exposed daily to microaggressions, racial discrimination, stereotypes, redlining, all of these different issues that basically reduce to systemic racism,” said Dr. Moore, who is an assistant professor of medicine at the Medical College of Georgia, Augusta.
Dr. Moore is also a coauthor of a new study published online in SSM–Population Health, which examined the association between increased allostatic load and cancer outcomes among participants in the National Health and Nutrition Examination Survey (NHANES) and the National Death Index. They found that both non-Hispanic Black and non-Hispanic White adults with high allostatic load had about a doubled risk of cancer death.
To determine allostatic load, the researchers looked at nine factors collected in NHANES: abnormal values of BMI, diastolic blood pressure, glycohemoglobin, systolic blood pressure, total cholesterol, serum triglycerides, serum albumin, serum creatinine, and C-reactive protein. “The fact that we’re looking at cardiovascular, metabolic and immune function, all in one gives us a better risk assessment for morbidity and mortality. Allostatic load has actually been associated with cardiovascular disease. I think we are one of the first studies to actually look at whether allostatic load is associated with cancer mortality,” said Dr. Moore.
Previous research coauthored by Dr. Moore showed 20-year old African Americans have an allostatic load comparable with that seen in 30-year-old non-Hispanic Whites. That can lead to a proinflammatory state that might be causing increased cancer risk. But stress isn’t a simple concept to pin down, Dr. Moore said. “One of the founding fathers of public health research and epidemiology, Paracelsus, [said] ‘the dose makes the poison.’ ”
In this case, it means that not all stress is bad. Exercise is good stress. “Your heart rate goes up, you compete, and then it comes back down. That’s healthy. But then there’s those stressful situations like dealing with a horrible job, and a boss that may just be overdemanding. Deadlines, and not having a work-life balance. Too much stress, in this case, can cause cancer death,” Dr. Moore said.
In the study, both non-Hispanic Black adults and non-Hispanic White adults heightened risk of cancer death when dealing with high allostatic load, even though the cause of stress may be different. “It’s almost like the cause of the stress does not matter as much. There are millions of Americans that live in environments that are not conducive to their health. The fact of the matter is that because of racial discrimination, because all these different biases, African Americans may have higher allostatic load, which they did on an average, but high allostatic load for even White people is associated with dying from cancer,” Dr. Moore said.
After adjustment, the (adjusted subdistributed hazard ratio, 1.14; 95% CI, 1.04-1.26). After stratification by age, high allostatic load was associated with an 80% increased risk of cancer death among adults (SHR, 1.80; 95% CI, 1.35-2.41). Non-Hispanic White adults had a 95% increased risk (SHR, 1.95; 95% CI, 1.22-3.12), non-Hispanic Black adults had a twofold increased risk (SHR, 1.06; 95% CI, 1.27-3.34), and Hispanic adults had a 36% increased risk.
Dr. Moore has no relevant financial disclosures.
The American folk hero John Henry pitted his hammer against a mechanical steam drill, only to die of exhaustion after winning the battle. In the legend, John Henry was African American, and it’s a fitting metaphor, according to Justin Xavier Moore, PhD.
It’s a metaphor for accumulated stress over a lifetime, also known as allostatic load. Though it affects everyone, Black, Indigenous, and people of color experience it in excess. “It serves as a symbolism for the plight of African Americans within the United States, that regardless of all the triumph and trying to overcompensate and work just as hard as your counterpart, it oftentimes leads to this overtaxing or exhaustion because your competitor has an unfair advantage. You have Jim Crow laws in the South. We have the history of slavery. We have individuals of racial subgroups that are exposed daily to microaggressions, racial discrimination, stereotypes, redlining, all of these different issues that basically reduce to systemic racism,” said Dr. Moore, who is an assistant professor of medicine at the Medical College of Georgia, Augusta.
Dr. Moore is also a coauthor of a new study published online in SSM–Population Health, which examined the association between increased allostatic load and cancer outcomes among participants in the National Health and Nutrition Examination Survey (NHANES) and the National Death Index. They found that both non-Hispanic Black and non-Hispanic White adults with high allostatic load had about a doubled risk of cancer death.
To determine allostatic load, the researchers looked at nine factors collected in NHANES: abnormal values of BMI, diastolic blood pressure, glycohemoglobin, systolic blood pressure, total cholesterol, serum triglycerides, serum albumin, serum creatinine, and C-reactive protein. “The fact that we’re looking at cardiovascular, metabolic and immune function, all in one gives us a better risk assessment for morbidity and mortality. Allostatic load has actually been associated with cardiovascular disease. I think we are one of the first studies to actually look at whether allostatic load is associated with cancer mortality,” said Dr. Moore.
Previous research coauthored by Dr. Moore showed 20-year old African Americans have an allostatic load comparable with that seen in 30-year-old non-Hispanic Whites. That can lead to a proinflammatory state that might be causing increased cancer risk. But stress isn’t a simple concept to pin down, Dr. Moore said. “One of the founding fathers of public health research and epidemiology, Paracelsus, [said] ‘the dose makes the poison.’ ”
In this case, it means that not all stress is bad. Exercise is good stress. “Your heart rate goes up, you compete, and then it comes back down. That’s healthy. But then there’s those stressful situations like dealing with a horrible job, and a boss that may just be overdemanding. Deadlines, and not having a work-life balance. Too much stress, in this case, can cause cancer death,” Dr. Moore said.
In the study, both non-Hispanic Black adults and non-Hispanic White adults heightened risk of cancer death when dealing with high allostatic load, even though the cause of stress may be different. “It’s almost like the cause of the stress does not matter as much. There are millions of Americans that live in environments that are not conducive to their health. The fact of the matter is that because of racial discrimination, because all these different biases, African Americans may have higher allostatic load, which they did on an average, but high allostatic load for even White people is associated with dying from cancer,” Dr. Moore said.
After adjustment, the (adjusted subdistributed hazard ratio, 1.14; 95% CI, 1.04-1.26). After stratification by age, high allostatic load was associated with an 80% increased risk of cancer death among adults (SHR, 1.80; 95% CI, 1.35-2.41). Non-Hispanic White adults had a 95% increased risk (SHR, 1.95; 95% CI, 1.22-3.12), non-Hispanic Black adults had a twofold increased risk (SHR, 1.06; 95% CI, 1.27-3.34), and Hispanic adults had a 36% increased risk.
Dr. Moore has no relevant financial disclosures.
The American folk hero John Henry pitted his hammer against a mechanical steam drill, only to die of exhaustion after winning the battle. In the legend, John Henry was African American, and it’s a fitting metaphor, according to Justin Xavier Moore, PhD.
It’s a metaphor for accumulated stress over a lifetime, also known as allostatic load. Though it affects everyone, Black, Indigenous, and people of color experience it in excess. “It serves as a symbolism for the plight of African Americans within the United States, that regardless of all the triumph and trying to overcompensate and work just as hard as your counterpart, it oftentimes leads to this overtaxing or exhaustion because your competitor has an unfair advantage. You have Jim Crow laws in the South. We have the history of slavery. We have individuals of racial subgroups that are exposed daily to microaggressions, racial discrimination, stereotypes, redlining, all of these different issues that basically reduce to systemic racism,” said Dr. Moore, who is an assistant professor of medicine at the Medical College of Georgia, Augusta.
Dr. Moore is also a coauthor of a new study published online in SSM–Population Health, which examined the association between increased allostatic load and cancer outcomes among participants in the National Health and Nutrition Examination Survey (NHANES) and the National Death Index. They found that both non-Hispanic Black and non-Hispanic White adults with high allostatic load had about a doubled risk of cancer death.
To determine allostatic load, the researchers looked at nine factors collected in NHANES: abnormal values of BMI, diastolic blood pressure, glycohemoglobin, systolic blood pressure, total cholesterol, serum triglycerides, serum albumin, serum creatinine, and C-reactive protein. “The fact that we’re looking at cardiovascular, metabolic and immune function, all in one gives us a better risk assessment for morbidity and mortality. Allostatic load has actually been associated with cardiovascular disease. I think we are one of the first studies to actually look at whether allostatic load is associated with cancer mortality,” said Dr. Moore.
Previous research coauthored by Dr. Moore showed 20-year old African Americans have an allostatic load comparable with that seen in 30-year-old non-Hispanic Whites. That can lead to a proinflammatory state that might be causing increased cancer risk. But stress isn’t a simple concept to pin down, Dr. Moore said. “One of the founding fathers of public health research and epidemiology, Paracelsus, [said] ‘the dose makes the poison.’ ”
In this case, it means that not all stress is bad. Exercise is good stress. “Your heart rate goes up, you compete, and then it comes back down. That’s healthy. But then there’s those stressful situations like dealing with a horrible job, and a boss that may just be overdemanding. Deadlines, and not having a work-life balance. Too much stress, in this case, can cause cancer death,” Dr. Moore said.
In the study, both non-Hispanic Black adults and non-Hispanic White adults heightened risk of cancer death when dealing with high allostatic load, even though the cause of stress may be different. “It’s almost like the cause of the stress does not matter as much. There are millions of Americans that live in environments that are not conducive to their health. The fact of the matter is that because of racial discrimination, because all these different biases, African Americans may have higher allostatic load, which they did on an average, but high allostatic load for even White people is associated with dying from cancer,” Dr. Moore said.
After adjustment, the (adjusted subdistributed hazard ratio, 1.14; 95% CI, 1.04-1.26). After stratification by age, high allostatic load was associated with an 80% increased risk of cancer death among adults (SHR, 1.80; 95% CI, 1.35-2.41). Non-Hispanic White adults had a 95% increased risk (SHR, 1.95; 95% CI, 1.22-3.12), non-Hispanic Black adults had a twofold increased risk (SHR, 1.06; 95% CI, 1.27-3.34), and Hispanic adults had a 36% increased risk.
Dr. Moore has no relevant financial disclosures.
FROM SSM–POPULATION HEALTH