User login
Implementing the Quadruple Aim in Behavioral Health Care
From the Milwaukee County Behavioral Health Division, Milwaukee, WI.
Abstract
Objective: Implementation of the Quadruple Aim of health care must begin with a clearly articulated set of concepts, or core domains (CDs), that comprise each aim. These CDs can then be operationalized with existing or new measures. If aligned to the organization’s mission and strategic goals, these CDs have the potential to focus quality improvement activities and reduce measurement burden. This article represents the efforts of a publicly funded behavioral health system to operationalize the Quadruple Aim through the development of CDs.
Methods: Various stakeholders across the organization were consulted on their perceptions of the Quadruple Aim and the CDs they believed should support it. Then, a review of existing literature on core metrics for health care and population health was completed, summarized, and integrated with the stakeholder feedback.
Results: These efforts led to the development and adoption of 15 CDs, with an accompanying literature review and set of recommendations of new and existing measures for each domain.
Conclusions: It is possible to create a comprehensive yet economical set of CDs and attendant measures that can be implemented in a staged, scalable, enterprise manner. It is hoped that the process articulated here, and the accompanying literature review, may be of some benefit to other public or government-run health systems in their own quality improvement journey to operationalize the Quadruple Aim by developing a set of CDs.
Keywords: quality measures; quality improvement; adult behavioral health.
First articulated in 2008, the Triple Aim proposes that health care systems should simultaneously seek to improve the patient’s experience of care, improve the health of populations, and reduce the per capita costs of care for populations.1 More recently, some have argued that health care provider burnout can deleteriously impact the attainment of the Triple Aim and have therefore advocated for an expanded focus to include a fourth Aim, the work life quality of the staff.2 Milwaukee County Behavioral Health Division (BHD), a publicly funded, county-based behavioral health care system in Milwaukee, Wisconsin, recently adopted the Quadruple Aim as the framework by which it will organize its quality activities.
Although originally developed for medical organizations, BHD believes that the Quadruple Aim has strong applicability to county-level behavioral health services. Many county-based behavioral health divisions provide a variety of programs to large segments of the county based on financial eligibility and/or clinical need, and thus often have responsibilities to populations or subpopulations, rather than programs. County health divisions, such as Milwaukee County’s Department of Health and Human Services, are often asked to improve outcomes and client experience of care with neutral growth budgets and less reliance on taxes to fund programs, while simultaneously attracting and retaining competent staff.
Crucial to the effective implementation of the Quadruple Aim, however, is a clear set of population- level measures that help organizations assess their progress.3 Unfortunately, as some authors have noted, evaluation of the Quadruple Aim remains a challenge because the “concepts of (population) health, quality of care and costs are not unanimously defined and measures for these concepts are under construction.”4 Several authors have provided some guidance to assist in the development of a set of measures that effectively capture the elements of the Quadruple Aim.5,6 However, the recent rapid proliferation of quality measures in health care7,8 has been both burdensome and costly for providers.9,10 Any measures adopted should not only be as meaningful as possible with regards to assessing progress towards the basic aims of health care, but should also be parsimonious, to limit measurement burden for providers (and patients) and focus attention on important issues.11,12
To select the most effective, parsimonious set of measures possible, one must first select a set of key foci from among the many possible areas of focus that the core measure is intended to represent. The core domains (CDs), if appropriately consistent with the strategic goals of the organization, provide a mechanism to orient the efforts of the organization at every level and help every staff member of the organization understand how his or her work impacts the progress towards these goals.11 The CDs, therefore, represent the opportunity to affect a greater integration of efforts across the organization toward these shared aims, creating uniformity of purpose at every level. Further, increasing organizational attention on the CDs can also help to reduce measurement burden by streamlining and focusing the data capture processes on the most valuable elements of quality and health, and discarding other extraneous measures (albeit not at the expense of other reporting requirements).11 The remainder of this article describes the CDs selected by BHD to assess its progress toward implementation of the Quadruple Aim and are organized by the Aim which they best represent.
Methods
To effectively implement the Quadruple Aim at BHD, it was necessary to clearly define the subpopulation of focus for our efforts.6 In this case, the subpopulation of interest was defined as all adult clients (18 years and older) who received at least 1 service encounter within a specified time frame from a program that BHD either operated or contracted with to provide care. Services provided by the BHD network include everything from psychiatric inpatient services to mental health and addiction treatment and care management. A limited array of social services, including housing and employment services, is also available to eligible consumers. BHD is the county-run behavioral health provider for individuals who are uninsured or underinsured in Milwaukee County, a demographically diverse, primarily urban county of approximately 950,000 people located in Wisconsin. Approximately 15,000 adults receive services at BHD each year.
This work began by obtaining executive sponsorship for the project, in this case from the Chief Operations Officer and Executive Medical Director of BHD. With their backing, an initial review of the literature produced a preliminary set of possible domains, for which we created working definitions. We then made a list of key stakeholders throughout BHD to whom we needed to present the idea of the Quadruple Aim, and the CDs under each Aim, to secure their support. These stakeholders, which included individuals involved in quality activities, program managers, and executive leadership, were strategically selected based on their relative influence within the organization. A set of brief presentations and handouts explaining the project were then developed and shared at different focus groups with these stakeholders over the course of 6 months. These focus groups served to not only educate the organization about the Quadruple Aim and the CDs but afforded participants an opportunity to provide feedback as well.
During the focus groups, we asked participants which domains they believed were most important (were “core”) when operationalizing the Quadruple Aim. The focus groups provided feedback on the domain definitions, feedback that was used to develop uniform, mutually agreed upon definitions for the CDs that were generalizable to all departments at BHD, regardless of the focus of their services within the continuum of care or the continuum of age. This was a crucial step, as it will eventually enable BHD to aggregate data across departments, even if there are minor discrepancies in the specific items they use to assess the CDs. Comments from the focus groups ultimately resulted in a truncated list of domains and definitions, which, coupled with the literature review, resulted in our final set of CDs.
During our review of the literature, we also looked for items that we felt could best represent each CD in the briefest, most meaningful way. (These items were not meant to supersede existing data, but to provide examples that could be implemented with existing data or recommendations that could be utilized in the absence of existing data.) During this process, we made every effort to make use of existing data-reporting requirements. For example, if we had a state mandate to collect data on housing status, we attempted to leverage this required data point to represent the CD related to housing. In other cases, we attempted to utilize claims or other administrative data to operationalize the CD, such as in the cost-of-care metric articulated in the section the Third Aim. For CDs for which no data existed or were insufficient, we emphasized the use of single- versus multi-item scales. For example, if we found a single-item global assessment of quality of life that had good psychometric properties relative to its longer parent scale, we selected the single item. This approach to item selection allowed us to create the most efficient, parsimonious set of measures possible, which we believed would enable us to comprehensively assess all the CDs with the least amount of burden to staff and clients. These items were presented at stakeholder focus groups, during which we asked for comments on the existing measures in their program or department and gave them the opportunity to comment on the new recommended measures.
A working definition is provided for each CD, followed by a brief review of the research base supporting its inclusion in the final list. The item(s) selected by BHD to represent each CD and the source of the item(s) are then supplied. These items were based either on measures currently collected because of existing reporting mandates or, in the case where extant measures were not available, on new items that demonstrated acceptable psychometric properties in the research literature. The CDs and items are organized by the Aim they best represent. A full list of the CDs by Quadruple Aim and items by CD is provided in the Appendix of the online version of this article. This article concludes with a brief summary of this effort and a discussion of how staff will utilize these items at different levels throughout the BHD system.
The First Aim: Population Health
Health Outcomes
Deaths. This can be defined as the cause of death, as determined by the medical examiner’s office (where appropriate) or as the age at time of death. This CD can also be reported as proportion of deaths considered premature (eg, before age 75) or calculated as total years of potential life lost.
Brief review and suggested item(s). Rates and causes of premature mortality are critical foci for the County Health Rankings & Roadmaps,13 the Institute for Healthcare Improvement’s “Guide to Measuring the Triple Aim,”6 the Centers for Disease Control and Prevention’s “Community Health Assessment for Population Health Improvement,”14 and the Institute of Medicine’s (IOM) “Vital Signs: Core Metrics for Health and Health Care Progress.”11 There is ample evidence that individuals with serious mental illness are at increased risk of early mortality relative to the general population,15-18 and this risk applies to those with substance use disorders as well.15,19-20 BHD tracks all deaths that occur while patients are receiving BHD-funded, community-based services.
Self-Reported Health and Well-Being. This CD asks patients to rate their current physical and mental health status, as well as their overall quality of life.
Brief review and suggested item(s): Self-rated physical health. Premature mortality among individuals with behavioral health issues appears to be due, in large part, to their increased vulnerability to the development of medical comorbidities.16,21 A single self-rating question has demonstrated considerable sensitivity to premature mortality,22,23 with predictive properties up to a decade prior to death.24,25 Further, self-rated health has been associated with subsequent functional decline,26,27 acute service utilization,28,29 and overall health care costs.28
Brief review and suggested item(s): Self-rated mental health. Mental health disorders are associated with significant disability worldwide,30 and comorbid mental health issues can exacerbate the course of other medical problems. For example, depression is associated with increased rates of mortality among individuals with diabetes and31 cardiovascular disease,32 as well as with rates of overall mortality,33 and psychiatric comorbidity is associated with longer lengths of stay and higher costs among patients hospitalized for medical problems.34 Research has found that a single-item measure of self-rated mental health is associated with the presence of psychiatric diagnoses, psychiatric symptoms, and subsequent depression and serious mental illness up to 1 year post-assessment.35,36 There is even evidence that self-rated mental health may be more strongly associated with self-ratings of overall health than self-ratings of physical health.37
Brief review and suggested item(s): Self-rated quality of life. Quality of life is a critical component of the recovery journey and overall health.38 For example, the County Health Rankings & Roadmaps lists “quality of life” as 1 of its key “health outcomes” in its County Health Rankings.13 As some authors have noted, quality of life is often inferred from other “objective” recovery domains, such as employment, health status, or housing status. However, there is evidence that these objective domains are functionally distinct from the inherently subjective construct of quality of life.39 This has led other authors to conclude that these domains should be assessed separately when evaluating outcomes.40 Single-item quality of life assessments have been used in research with individuals with cancer,41 adults with disabilities,42 patients with cystic fibrosis,43 and children with epilepsy.44 For this effort, BHD selected the first global quality of life item from the World Health Organization’s WHOQOL-BREF quality of life assessment,45 an item used in other quality of life research.46
Health Factors
Substance Use. This CD is a composite of 4 different types of substance use, any recent heavy alcohol use (defined as 5 or more drinks in one sitting), any recent drug use, any recent prescription drug abuse, and any recent tobacco use.
Brief review and suggested item(s). As noted, substance use disorders confer an increased risk for early mortality15,19 and are significantly implicated in disease disability burden worldwide.30 Substance use has also been associated with both the onset47,48 and exacerbation of mental health diagnoses.49-51 Further, substance use appears to heighten the risk of violence in the general population52 and especially among those with a co-occurring mental illness.53,54 The County Health Rankings & Roadmaps list alcohol and drug use as key behaviors to address to improve the overall health of a given county,13 and the Centers for Medicare & Medicaid Services (CMS) has endorsed initiation and engagement in addiction treatment as one of the measures in its Adult Core Set.55
Tobacco use continues to be one of the most significant risk factors for early mortality worldwide, and evidence indicates that it is associated with a lower life expectancy of nearly 10 years.56 Unfortunately, rates of tobacco use are even higher among those with severe mental illness relative to the general population, and their rates of smoking cessation are lower.57,58 Tobacco use is a significant risk factor for the high rates of early mortality in individuals with severe mental illness.18 Further, a recent meta-analysis noted that, relative to those who continued to smoke, those who ceased smoking had reduced rates of psychological distress and increased quality of life rankings.59 Reducing tobacco use is one of the key components of the County Health Rankings & Roadmaps, and medication assistance with smoking and tobacco use cessation is also listed in the CMS Adult Core Set.13,55
An accumulating body of evidence suggests that single-item measures can adequately detect alcohol60-62 and drug use disorders.60-64 McNeely and colleagues recently developed and tested a brief 4-item screen, the Tobacco, Alcohol, Prescription medication, and other Substance use (TAPS) tool.65,66 Preliminary evidence suggests that the TAPS tool can effectively identify the presence of problematic and disordered use of tobacco, alcohol, prescription medications, and other drugs.65-67 BHD will use the 4 items from the TAPS tool to represent its substance use CD.
Education/Employment Status. This CD assesses the proportion of BHD members who have completed high school, who are in some type of educational or training program, or who are engaged in some type of employment activity (defined as full-time, part-time, supported, sheltered workshop, or as a full-time homemaker).
Brief review and suggested item(s). Research indicates that unemployment is a risk factor for mortality, even after controlling for other risk factors (eg, age, sex, socioeconomic status [SES], health).68 Unemployment is associated with poorer physical and mental health in the general population and among those with disabilities.69-71 Promisingly, evidence suggests that gaining employment or re-employment is associated with better health,72 even for individuals with substance use disorders73 or moderate74 to severe mental health disorders.75-78 Some authors have even proposed that, above and beyond the associated health benefits, employment may also help to realize a modest cost savings due to reduced service utilization and disability.79,80 Employment is a core tenet in the Substance Abuse and Mental Health Services Administration’s (SAMHSA’s) model of recovery,81 and is also listed as an important recovery goal for individuals with behavioral health issues.82 BHD collects data on employment status on all the patients it serves as part of its state-mandated reporting requirements and will use this item in the CD data set.83
Living Situation. This is measured as the proportion of people who live in permanent, supportive, stable housing; it may also be measured as the percentage of the population living with severe housing problems or who are homeless.
Brief review and suggested item(s). Housing problems can be conceptualized as 3 inter-related components: conditions within the home, neighborhood conditions, and housing affordability, each of which can contribute uniquely to poorer physical and mental health of individuals and families84 and to educational outcomes for children.85,86 Further, individuals who are homeless have a standardized mortality ratio 2 to 5 times that of the general population,87-89 even after controlling for low income status,90 and some evidence suggests these rates are even higher among unsheltered versus sheltered homeless individuals.91 Interventions to improve the condition of housing have demonstrated positive impacts on both physical and mental health,92 and a recent study found that individuals receiving housing assistance in the form of public housing or multifamily housing from the Department of Housing and Urban Development had better self-rated physical and mental health relative to individuals on the wait list for housing assistance.93 Moreover, the provision of housing has been shown to promote reductions in substance use and health service utilization among homeless individuals with substance use disorders.94 Rog and colleagues reviewed the literature on permanent supportive housing for individuals with substance use or mental health disorders who were homeless or disabled, and found that provision of housing led to reduced rates of homelessness, emergency department (ED) and inpatient utilization and increased consumer satisfaction.95
Importantly, evidence suggests that housing is viewed as facilitative of recovery. For example, in a recent qualitative study of homeless individuals with mental illness, housing was seen as a critical first step in recovery, providing a sense of security, increasing feelings of personal independence and autonomy, improving perceptions of health and well-being, and affording a stable environment to rebuild relationships with important others.96 BHD collects data on housing status on all the patients it serves as part of its state-mandated reporting requirements and will utilize this item in the CD data set.83
Social Relationships. This is defined as recent interactions with family, supportive networks (formal and informal), and other recovery services.
Brief review and suggested item(s). Research has long established that social relationships have a significant impact on health, including rates of mortality as well as physical and mental health morbidity.97-99 Social connectedness is another of the pillars supporting an individual’s recovery in SAMHSA’s formulation. Several reviews of the recovery literature38,82 support its importance to the recovery process and inclusion in any assessment of holistic recovery. Social support has been shown to promote recovery among individuals with severe mental illness100-102 and substance use disorders,103 and may mitigate the progression of chronic, life-threatening physical illnesses.97 For the purposes of BHD’s CD data set, the social support question from the “100 Million Healthier Lives Common Questionnaire for Adults” will be used to assess individuals’ perceived adequacy of social support.104
Legal Involvement. Defined as involvement with the civil or criminal justice system, including arrests, imprisonment, or detainment.
Brief review and suggested item(s). Involvement in the criminal justice system is both disruptive for the individual in recovery and expensive to the larger health care system.105 Individuals with substance use106 and severe mental health disorders107 are over-represented in the prison system, and evidence suggests that general physical and mental health declines while individuals are in prison.108,109 Perhaps even more concerning, numerous studies have demonstrated an increase in mortality rates for individuals recently released from prison relative to the general population, particularly during the period immediately following release.108-110 This relationship may even persist long term.111 Further, research indicates that individuals recently released from prison have increased emergency care and hospital utilization.112,113
Incarceration can have significant impacts on the health of the broader community as well. For example, research has found an association between parental incarceration to rates of infant mortality,114 increased behavioral and developmental problems of children of incarcerated parents,115,116 lower rates of child support payments,117 and poorer cardiovascular health of female partners of incarcerated individuals.118 Formerly incarcerated individuals experience slower wage growth as well.119 However, evidence also indicates that engagement in mental health120 and substance abuse121 treatment can reduce the likelihood of subsequent recidivism. As part of its state-mandated reporting, BHD is required to provide information on the criminal justice system involvement of its clients in the previous 6 months, including whether they have been jailed or imprisoned,83 and this will function as its measure of legal involvement in its CD data set.
Socioeconomic Status. Socioeconomic status is the social standing or class of an individual or group. It is often measured as a combination of education, income, and occupation. It can also be defined subjectively, such as one’s evaluation of status relative to similar others or based on an individual’s interpretation of her or his financial needs.
Brief review and suggested item(s). A large body of evidence supports the existence of a robust relationship between lower SES and poor health, including mortality and chronic medical diseases,122-124 as well as mental illness.125-127 Although previous research has examined this relationship using objective indicators of SES (eg, income, education level, occupation), there has recently been an increased interest in exploring the relationship of subjective SES with health indices. Subjective SES is generally assessed by asking individuals to rate themselves relative to others in the society in which they live, in terms of wealth, occupation, educational level, or other indicators of social status. Evidence suggests that subjective SES is associated with objective measures of SES,128-130 and relates to measures of physical and mental health as well, even after controlling for objective SES.130-135 BHD will be using a modified version of the Subject SES Scale,131,135 which is deployed in the “100 Million Healthier Lives Common Questionnaire for Adults.”104
Acute Service Use. This is defined as an admission to a medical or psychiatric emergency room or to a medical or psychiatric hospital or to a detoxification facility.
Brief review and suggested item(s). The CMS Adult Core Set includes “plan all cause readmissions” as a key quality metric.55 Hospital readmissions are also endorsed by the National Committee on Quality Assurance as one of its Health Effectiveness Data and Information Set (HEDIS) measures and by the National Quality Forum. Readmissions, despite their widespread endorsement, are a somewhat controversial measure. Although readmissions are costly to the health care system,136 the relationship between readmissions and quality is inconsistent. For example, Krumholz and colleagues137 found differential rates of readmission for the same patient discharged from 2 different hospitals, which were categorized based on previous readmission rates, suggesting that hospitals do have different levels of performance even when treating the same patient. However, other data indicate that 30-day, all-cause, risk-standardized readmission rates are not associated with hospital 30-day, all-cause, risk-standardized mortality rates.138
Chin and colleague found that readmissions to the hospital that occurred more than 7 days post-discharge were likely due to community- and household-related factors, rather than hospital-related quality factors.139 Transitional care interventions that have successfully reduced 30-day readmission rates are most often multicomponent and focus not just on hospital-based interventions (eg, discharge planning, education) but on follow-up care in the community by formal supports (eg, in-home visits, telephone calls, outpatient clinic appointments, case management) and informal supports (eg, family and friends).140-143 Further, qualitative evidence suggests that some individuals perceive psychiatric hospitalizations to be the result of insufficient resources or unsuccessful attempts to maintain their stability in the community.144 Thus, unplanned or avoidable hospital readmissions may represent a failure of the continuum of care not only from the perspective of the health care system, but from the patient perspective as well.
Frequent or nonurgent use of EDs is conceptually similar to excessive or avoidable inpatient utilization in several ways. For example, overuse of EDs is costly, with some estimates suggesting that it is responsible for up to $38 billion in wasteful spending each year.145 Individuals with frequent ED visits have a greater disease burden146 and an increased risk of mortality compared to nonfrequent users.147 Research suggests that individuals who visit the ED for non-urgent issues do so because of perceived difficulties associated with accessing primary care, and the convenience of EDs relative to primary care.148-150 Moreover, similar to the hospital readmission literature discussed earlier, successful strategies to reduce high rates of ED utilization generally focus on continuum of care interventions, such as provision of case management services.151-155
This evidence implies that frequent ED utilization and hospital readmissions may not be a fundamental issue of quality (or lack thereof) in hospitals or EDs but rather a lack of, or ineffectual, transitional and continuum of care strategies and services. To underscore this point, some authors have argued that a system that is excessively crisis-oriented hinders recovery because it is reactive rather than proactive, predicated on the notion that one’s condition must deteriorate to receive care.156
Although some organizations may have access to claims data or may function as self-contained health systems (eg, the Veterans Health Administration [VHA] ), others may not have access to such data. In the absence of claims data, patient self-report of service utilization has been used as a proxy for actual agency records.157 Although concordance between medical and/or agency records and patient self-report has been variable,157 evidence generally suggests that rates of agreement are higher the shorter the recall time interval.158,159 BHD does not have access to comprehensive claims data and has therefore chosen to use 5 dichotomously scored (yes/no) questions—related to medical inpatient, medical ED, psychiatric inpatient, psychiatric ED, and detoxification use in the last 30 days—to represent the CD of acute service utilization.
The Second Aim: Quality of Care
Safety
Safety is defined as avoiding injuries to patients from the care that is intended to help them.
Brief review and suggested item(s). As noted in “Crossing the Quality Chasm,” the IOM’s seminal document, “the health care environment should be safe for all patients, in all of its processes, all the time.”160 The landmark Harvard Medical Practice Study in 1991 found that adverse events occurred in nearly 4% of all hospital admissions and, among these, over a quarter were due to negligence.161 Other estimates of adverse events range as high as 17%.162 Indeed, a recent article by Makary and Daniel estimated that medical errors may be the third leading cause of death in the United States.163 Unfortunately, research on safety in the mental health field has lagged behind that of physical health,164 with evidence indicating that research in nonhospital settings in mental health care may be particularly scarce.165 In a study of adverse events that occurred in psychiatric inpatient units in the VHA system between 2015 and 2016, Mills and colleagues found that of the 87 root cause analysis reports, suicide attempts were the most frequent, and, among safety events, falls were the most frequently reported, followed by medication events.166 Another report on data collected from psychiatric inpatient units in the VHA revealed that nearly one-fifth of patients experienced a safety event, over half of which were deemed preventable.167 These numbers likely represent an underestimation of the true volume of safety events, as another study by the same research group found that less than 40% of safety events described in patient medical records were documented in the incident reporting system.168 BHD will utilize the total number of complaints and incident reports submitted within a given time frame as its “safety” metric in the CD data set.
Wait Time for Service
The CD is defined as the length of time between the date a patient first contacted BHD for services and the date of their first clinical service.
Brief review and suggested item(s). “Timeliness” was listed among the 6 aims for improvement in “Crossing the Quality Chasm” in 2001, and it remains no less relevant today.160 For example, evidence indicates that access to primary care is inversely related to avoidable hospitalizations.169 One study found that, of patients hospitalized for cardiovascular problems, those who had difficulty accessing routine care post discharge had higher 30-day readmission rates.170 Among VHA patients, longer wait times are associated with more avoidable hospitalizations and higher rates of mortality.171 Longer wait times appear to decrease the likelihood of attending a first appointment for individuals with substance use172,173 and mental health disorders.174 Importantly, longer wait times are associated with lower ratings of the patient experience of care, including perceptions of the quality of and satisfaction with care,175 and may be associated with worse outcomes for individuals in early intervention for psychosis treatment.176 For the purposes of the CD data set, BHD will monitor the length of time between the date a patient first contacted BHD for services and the date of their first clinical service.
Patient Satisfaction
Patient satisfaction is defined as the degree of patients’ satisfaction with the care they have received.
Brief review and suggested item(s). Research has consistently demonstrated the relationship of the patient’s experience of care to a variety of safety and clinical effectiveness measures in medical health care,177 and the therapeutic alliance is one of the most consistent predictors of outcomes in behavioral health, regardless of therapeutic modality.178 Patient satisfaction is a commonly assessed aspect of the patient experience of care. Patient satisfaction scores have been correlated with patient adherence to recommended treatment regimens, care quality, and health outcomes.179 For example, Aiken et al found that patient satisfaction with hospital care was associated with higher ratings of the quality and safety of nursing care in these hospitals.180 Increased satisfaction with inpatient care has been associated with lower 30-day readmission rates for patients with acute myocardial infarction, heart failure, and pneumonia,181 and patients with schizophrenia who reported higher treatment satisfaction also reported better quality of life.182,183 Many satisfaction survey options exist to evaluate this CD, including the Consumer Assessment of Healthcare Providers and Systems and the Client Satisfaction Questionnaire; BHD will utilize an outpatient behavioral health survey from a third-party vendor.
The Third Aim: Cost of Care
Cost of Care
This can be defined as the average cost to provide care per patient per month.
Brief review and suggested item(s). Per capita cost, or rather, the total cost of providing care to a circumscribed population divided by the total population, has been espoused as an important metric for the Triple Aim and the County Health Rankings.6,13 Indeed, between 1960 and 2016, per capita expenditures for health care have grown 70-fold, and the percent of the national gross domestic product accounted for by health expenditures has more than tripled (5.0% to 17.9%).184 One of the more common metrics deployed for assessing health care cost is the per capita per month cost, or rather, the per member per month cost of the predefined population for a given health care system.6,185,186 In fact, some authors have proposed that cost of care can be used not only to track efficient resource allocation, but can also be a proxy for a healthier population as well (ie, as health improves, individuals use fewer and less-expensive services, thus costing the system less).187 To assess this metric, BHD will calculate the total amount billed for patient care provided within BHD’s health network each month (irrespective of funding source) and then divide this sum by the number of members served each month. Although this measure does not account for care received at other health care facilities outside BHD’s provider network, nor does it include all the overhead costs associated with the care provided by BHD itself, it is consistent with the claims-based approach used or recommended by other authors.6,188
The Fourth Aim: Staff Well-being
Staff Quality of Work Life
This can be defined as the quality of the work life of health care clinicians and staff.
Brief review and suggested item(s). Some authors have suggested that the Triple Aim framework is incomplete and have proffered compelling arguments that provider well-being and the quality of work life constitutes a fourth aim.2 Provider burnout is prevalent in both medical2,189 and behavioral health care.190,191 Burnout among health care professionals has been associated with higher rates of perceived medical errors,192 lower patient satisfaction scores,189,193 lower rates of provider empathy,194 more negative attitudes towards patients,195 and poorer staff mental and physical health.191
Burnout is also associated with higher rates of absenteeism, turnover intentions, and turnover.190,191,196,197 However, burnout is not the only predictor of staff turnover; for example, turnover rates are a useful proxy for staff quality of work life for several reasons.198 First, turnover is associated with substantial direct and indirect costs, including lost productivity, increased errors, and lost revenue and recruitment costs, with some turnover cost estimates as high as $17 billion for physicians and $14 billion for nurses annually.199-201 Second, research indicates that staff turnover can have a deleterious impact on implementation of evidence-based interventions.202-205 Finally, consistent with the philosophy of utilizing existing data sources for the CD measures, turnover can be relatively easily extracted from administrative data for operated or contracted programs, and its collection does not place any additional burden on staff. As a large behavioral health system that is both a provider and payer of care, BHD will therefore examine the turnover rates of its internal administrative and clinical staff as well as the turnover of staff in its contracted provider network as its measures for the Staff Quality of Work Life CD.
Clinical Implications
These metrics can be deployed at any level of the organization. Clinicians may use 1 or more of the measures to track the recovery of individual clients, or in aggregate for their entire caseload. Similarly, managers can use these measures to assess the overall effectiveness of the programs for which they are responsible. Executive leaders can evaluate the impact of several programs or the system of care on the health of a subpopulation of clients with a specific condition, or for all their enrolled members. Further, not all measures need be utilized for every dashboard or evaluative effort. The benefit of a comprehensive set of measures lies in their flexibility—1 or more of the measures may be selected depending on the project being implemented or the interests of the stakeholder.
It is important to note that many of the CDs (and their accompanying measures) are aligned to/consistent with social determinants of health.206,207 Evidence suggests that social determinants make substantial contributions to the overall health of individuals and populations and may even account for a greater proportion of variance in health outcomes than health care itself.208 The measures articulated here, therefore, can be used to assess whether and how effectively care provision has addressed these social determinants, as well as the relative impact their resolution may have on other health outcomes (eg, mortality, self-rated health).
These measures can also be used to stratify clients by clinical severity or degree of socioeconomic deprivation. The ability to adjust for risk has many applications in health care, particularly when organizations are attempting to implement value-based purchasing models, such as pay-for-performance contracts or other alternative payment models (population health-based payment models).209 Indeed, once fully implemented, the CDs and measures will enable BHD to more effectively build and execute different conceptual models of “value” (see references 210 and 211 for examples). We will be able to assess the progress our clients have made in care, the cost associated with that degree of improvement, the experience of those clients receiving that care, and the clinical and social variables that may influence the relative degree of improvement (or lack thereof). Thus, the CDs provide a conceptual and data-driven foundation for the Quadruple Aim and any quality initiatives that either catalyze or augment its implementation.
Conclusion
This article provides an overview of the CDs selected by BHD to help organize, focus, advance, and track its quality efforts within the framework of the Quadruple Aim. Although items aligned to each of these CDs are offered, the CDs themselves have been broadly conceptualized such that they can flexibly admit a variety of possible items and/or assessments to operationalize each CD and thus have potential applicability to other behavioral health systems, particularly public systems that have state-mandated and other data reporting requirements.
Bearing in mind the burden that growing data collection requirements can have on the provision of quality care and staff work satisfaction and burnout,10,212 the CDs (and the items selected to represent each) are designed with “strategic parsimony” in mind. Although the CDs are inclusive in that they cover care quality, cost of care, staff quality of life, and general population health, only CDs and items undergirded by a solid evidence base and high value with regards to BHD’s mission and values, as determined by key stakeholders, were selected. Moreover, BHD attempted to make use of existing data collection and reporting mandates when selecting the final pool of items to reduce the measurement burden on staff and clients. Thus, the final set of CDs and items are designed to be comprehensive yet economical.
The CDs are deeply interrelated. Although each CD may be individually viewed as a valuable metric, improvements in any 1 CD will impact the others (eg, increasing care quality should impact population health, increasing staff quality of life should impact the quality of care). Moreover, this idea of interrelatedness acknowledges the need to view health systems and the populations they serve holistically, in that improvement is not simply the degree of change in any given metric (whether individually or collectively), but rather something more entirely. The concepts of value, quality, and health are complex, multidimensional, and dynamic, and the CDs that comprise these concepts should not be considered independently from one another. The CDs (and items) offered in this article are scalable in that they can be used at different levels of an organization depending on the question or stakeholder, and can be used individually or in combination with one another. Moreover, they are adaptable to a variety of risk-adjusted program, population health, and value-based evaluation models. It is hoped that the process articulated here, and the accompanying literature review, may benefit other public or government-run health systems in their own quality journey to operationalize the Quadruple Aim by developing a set of CDs.
Corresponding author: Walter Matthew Drymalski, PhD; walter.drymalski@milwaukeecountywi.gov.
Financial disclosures: None.
1. Berwick DM, Nolan TW, Whittington J. The Triple Aim: Care, health, and cost. Health Aff (Millwood). 2008;27(3):759-769.
2. Bodenheimer T, Sinsky C. From Triple to Quadruple Aim: Care of the patient requires care of the provider. Ann Fam Med. 2014;12(6):573-576.
3. Whittington JW, Nolan K, Lewis N, Torres T. Pursuing the Triple Aim: The first 7 years. Milbank Q. 2015;93(2):263-300.
4. Hendrikx RJP, Drewes HW, Spreeuwenberg M, et al. Which Triple Aim related measures are being used to evaluate population management initiatives? An international comparative analysis. Health Policy. 2016;120(5):471-485.
5. Kassler WJ, Howerton M, Thompson A, et al. Population Health Measurement at Centers for Medicare & Medicaid Services: Bridging the gap between public health and clinical quality. Popul Health Manag. 2017;20(3):173-180.
6. Stiefel MC, Nolan K. A Guide to Measuring the Triple Aim: Population health, experience of care, and per capita cost. IHI Innovation Series white paper. Institute for Healthcare Improvement; 2012.
7. Panzer RJ, Gitomer RS, Greene WH, et al. Increasing demands for quality measurement. JAMA. 2013;310(18):1971-1980.
8. Schuster MA, Onorato SE, Meltzer DO. Measuring the cost of quality measurement: a missing link in quality strategy. JAMA. 2017;318(13):1219-1220.
9. Casalino LP, Gans D, Weber R, et al. US physician practices spend more than $15.4 billion annually to report quality measures. Health Aff (Millwood). 2016;35(3):401-406.
10. Rao SK, Kimball AB, Lehrhoff SR, et al. The impact of administrative burden on academic physicians: results of a hospital-wide physician survey. Acad Med. 2017;92(2):237-243.
11. Institute of Medicine. Vital signs: Core metrics for health and health care progress. National Academies Press; 2015.
12. Meyer GS, Nelson EC, Pryor DB, et al. More quality measures versus measuring what matters: a call for balance and parsimony: Table 1. BMJ Qual Saf. 2012;21(11):964-968.
13. County Health Rankings. Measures & data sources. County Health Rankings & Roadmaps. Accessed January 11, 2021. https://www.countyhealthrankings.org/explore-health-rankings/measures-data-sources
14. U.S. Centers for Disease Control and Prevention. Community Health Assessment for population health improvement: Resource of most frequently recommended health outcomes and determinants. Office of Surveillance, Epidemiology, and Laboratory Services; 2013.
15. Chang C-K, Hayes RD, Perera G, et al. Life expectancy at birth for people with serious mental illness and other major disorders from a secondary mental health care case register in London. PLoS One. 2011;6(5):e19590.
16. De Hert M, Correll CU, Bobes J, et al. Physical illness in patients with severe mental disorders. I. Prevalence, impact of medications and disparities in health care. World Psychiatry. 2011;10(1):52-77.
17. Druss BG, Zhao L, Von Esenwein S, Morrato EH, Marcus SC. Understanding excess mortality in persons with mental illness: 17-year follow up of a nationally representative US survey. Med Care. 2011;49(6):599-604.
18. National Association of State Mental Health Program Directors, (NASMHPD) Medical Directors Council. Morbidity and mortality in people with serious mental illness. National Association of State Mental Health Program Directors, (NASMHPD) Medical Directors Council; 2006.
19. Nordentoft M, Wahlbeck K, Hällgren J, et al. Excess mortality, causes of death and life expectancy in 270,770 patients with recent onset of mental disorders in Denmark, Finland and Sweden. PLoS One. 2013;8(1):e55176.
20. Griswold MG, Fullman N, Hawley C, et al. Alcohol use and burden for 195 countries and territories, 1990–2016: a systematic analysis for the Global Burden of Disease Study 2016. Lancet. 2018;392(10152):1015-1035.
21. Walker ER, Druss BG. A public health perspective on mental and medical comorbidity. JAMA. 2016;316(10):1104-1105.
22. DeSalvo KB, Bloser N, Reynolds K, et al. Mortality prediction with a single general self-rated health question: a meta-analysis. J Gen Intern Med. 2005;21(3):267-275.
23. Mavaddat N, Parker RA, Sanderson S, et al. Relationship of self-rated health with fatal and non-fatal outcomes in cardiovascular disease: a systematic review and meta-analysis. PLoS One. 2014;9(7):e103509.
24. Lima-Costa MF, Cesar CC, Chor D, Proietti FA. Self-rated health compared with objectively measured health status as a tool for mortality risk screening in older adults: 10-year follow-up of the Bambui Cohort Study of Aging. Am J Epidemiol. 2012;175(3):228-235.
25. Stenholm S, Pentti J, Kawachi I, et al. Self-rated health in the last 12 years of life compared to matched surviving controls: the Health and Retirement Study. PLoS One. 2014;9(9):e107879.
26. Lee Y. The predictive value of self-assessed general, physical, and mental health on functional decline and mortality in older adults. J Epidemiol Community Health. 2000;54(2):123-129.
27. Tomioka K, Kurumatani N, Hosoi H. Self-rated health predicts decline in instrumental activities of daily living among high-functioning community-dwelling older people. Age Ageing. 2017;46(2):265-270.
28. DeSalvo KB, Jones TM, Peabody J, et al. Health care expenditure prediction with a single item, self-rated health measure. Med Care. 2009;47(4):440-447.
29. Farkas J, Kosnik M, Flezar M, Suskovic S, Lainscak M. Self-rated health predicts acute exacerbations and hospitalizations in patients with COPD. Chest. 2010;138(2):323-330.
30. Whiteford HA, Degenhardt L, Rehm J, et al. Global burden of disease attributable to mental and substance use disorders: findings from the Global Burden of Disease Study 2010. Lancet. 2013;382(9904):1575-1586.
31. Park M, Katon WJ, Wolf FM. Depression and risk of mortality in individuals with diabetes: a meta-analysis and systematic review. Gen Hosp Psychiatry. 2013;35(3):217-225.
32. Hare DL, Toukhsati SR, Johansson P, Jaarsma T. Depression and cardiovascular disease: a clinical review. Eur Heart J. 2014;35(21):1365-1372.
33. Cuijpers P, Schoevers RA. Increased mortality in depressive disorders: a review. Curr Psychiatry Rep. 2004;6(6):430-437.
34. Jansen L, van Schijndel M, van Waarde J, van Busschbach J. Health-economic outcomes in hospital patients with medical-psychiatric comorbidity: a systematic review and meta-analysis. PLoS One. 2018;13(3):e0194029.
35. Ahmad F, Jhajj AK, Stewart DE, et al. Single item measures of self-rated mental health: a scoping review. BMC Health Serv Res. 2014;14:398.
36. McAlpine DD, McCreedy E, Alang S. The meaning and predictive value of self-rated mental health among persons with a mental health problem. J Health Soc Behav. 2018;59(2):200-214.
37. Levinson D, Kaplan G. What does self-rated mental health represent? J Public Health Res. 2014;3(3):287.
38. Leamy M, Bird V, Boutillier CL, et al. Conceptual framework for personal recovery in mental health: systematic review and narrative synthesis. Br J Psychiatry. 2011;199(6):445-452.
39. Smith KW, Avis NE, Assmann SF. Distinguishing between quality of life and health status in quality of life research: a meta-analysis. Qual Life Res. 1999;8(5):447-459.
40. Hamming JF, De Vries J. Measuring quality of life. Br J Surg. 2007;94(8):923-924.
41. Singh JA, Satele D, Pattabasavaiah S, et al. Normative data and clinically significant effect sizes for single-item numerical linear analogue self-assessment (LASA) scales. Health Qual Life Outcomes. 2014;12(1):187.
42. Siebens HC, Tsukerman D, Adkins RH, et al. Correlates of a single-item quality-of-life measure in people aging with disabilities. Am J Phys Med Rehabil. 2015;94(12):1065-1074.
43. Yohannes AM, Dodd M, Morris J, Webb K. Reliability and validity of a single item measure of quality of life scale for adult patients with cystic fibrosis. Health Qual Life Outcomes. 2011;9(1):105.
44. Conway L, Widjaja E, Smith ML. Single-item measure for assessing quality of life in children with drug-resistant epilepsy. Epilepsia Open. 2018;3(1):46-54.
45. Skevington SM, Lofty M, O’Connell KA. The World Health Organization’s WHOQOL-BREF quality of life assessment: psychometric properties and results of the international field trial. Qual Life Res. 2004;13:299-310.
46. Atroszko PA, Baginska P, Mokosinska M, et al. Validity and reliability of single-item self-report measures of general quality of life, general health and sleep quality. In: CER Comparative European Research Conference: Research Track. Vol 2. Sciemcee Publishing; 2015:207-211.
47. Beaulieu S, Saury S, Sareen J, et al.
48. Marconi A, Di Forti M, Lewis CM, et al. Meta-analysis of the association between the level of cannabis use and risk of psychosis. Schizophr Bull. 2016;42(5):1262-1269.
49. Baker AL, Hiles SA, Thornton LK, et al. A systematic review of psychological interventions for excessive alcohol consumption among people with psychotic disorders. Acta Psychiatr Scand. 2012;126(4):243-255.
50. Baker AL, Hides L, Lubman DI. Treatment of cannabis use among people with psychotic or depressive disorders: a systematic review. J Clin Psychiatry. 2010;71(3):247-254.
51. Berenz EC, Coffey SF. Treatment of co-occurring posttraumatic stress disorder and substance use disorders. Curr Psychiatry Rep. 2012;14(5):469-477.
52. Pickard H, Fazel S. Substance abuse as a risk factor for violence in mental illness: some implications for forensic psychiatric practice and clinical ethics. Curr Opin Psychiatry. 2013;26(4):349-354.
53. Fazel S, Gulati G, Linsell L, Geddes JR, Grann M. Schizophrenia and violence: systematic review and meta-analysis. PLoS Med. 2009;6(8):e1000120.
54. Van Dorn R, Volavka J, Johnson N. Mental disorder and violence: Is there a relationship beyond substance use? Soc Psychiatry Psychiatr Epidemiol. 2012;47(3):487-503.
55. Centers for Medicare & Medicaid Services. 2019 Core set of adult health care quality measures for Medicaid (adult core set). Adult health care quality measures. Accessed January 11, 2021. https://www.medicaid.gov/medicaid/quality-of-care/performance-measurement/adult-core-set/index.html.
56. Jha P, Peto R. Global effects of smoking, of quitting, and of taxing tobacco. N Engl J Med. 2014;370(1):60-68.
57. Lê Cook B, Wayne GF, Kafali EN, et al. Trends in smoking among adults with mental illness and association between mental health treatment and smoking cessation. JAMA. 2014;311(2):172-182.
58. Smith PH, Mazure CM, McKee SA. Smoking and mental illness in the US population. Tob Control. 2014;23(0):e147-e153.
59. Taylor G, McNeill A, Girling A, et al. Change in mental health after smoking cessation: systematic review and meta-analysis. BMJ. 2014;348:g1151.
60. McNeely J, Cleland CM, Strauss SM, et al. Validation of self-administered single-item screening questions (SISQs) for unhealthy alcohol and drug use in primary care patients. J Gen Intern Med. 2015;30(12):1757-1764.
61. Saitz R, Cheng DM, Allensworth-Davies D, et al. The ability of single screening questions for unhealthy alcohol and other drug use to identify substance dependence in primary care. J Stud Alcohol Drugs. 2014;75(1):153-157.
62. Smith PC, Schmidt SM, Allensworth-Davies D, Saitz R. Primary care validation of a single-question alcohol screening test. J Gen Intern Med. 2009;24(7):783-788.
63. Dawson DA, Compton WM, Grant BF. Frequency of 5+/4+ drinks as a screener for drug use and drug-use disorders. J Stud Alcohol Drugs. 2010;71(5):751-760.
64. Smith PC, Schmidt SM, Allensworth-Davies D, Saitz R. A single-question screening test for drug use in primary care. Arch Intern Med. 2010;170(13):1155-1160.
65. McNeely J, Strauss SM, Saitz R, et al. A brief patient self-administered substance use screening tool for primary care: two-site validation study of the Substance Use Brief Screen (SUBS). Am J Med. 2015;128(7):784.e9-784.e19.
66. McNeely J, Wu L-T, Subramaniam G, et al. Performance of the Tobacco, Alcohol, Prescription medication, and other Substance use (TAPS) tool for substance use screening in primary care patients. Ann Intern Med. 2016;165(10):690-699.
67. Gryczynski J, McNeely J, Wu L-T, et al. Validation of the TAPS-1: a four-item screening tool to identify unhealthy substance use in primary care. J Gen Intern Med. 2017;32(9):990-996.
68. Roelfs DJ, Shor E, Davidson KW, Schwartz JE. Losing life and livelihood: a systematic review and meta-analysis of unemployment and all-cause mortality. Soc Sci Med. 2011;72(6):840-854.
69. McKee-Ryan F, Song Z, Wanberg CR, Kinicki AJ. Psychological and physical well-being during unemployment: a meta-analytic study. J Appl Psychol. 2005;90(1):53-76.
70. Zhang S, Bhavsar V. Unemployment as a risk factor for mental illness: combining social and psychiatric literature. Adv Appl Sociol. 2013;03(02):131-136.
71. Goodman N. The impact of employment on the health status and health care costs of working-age people with disabilities. The Lead Center. November 2015. Accessed January 11, 2021. http://www.leadcenter.org/system/files/resource/downloadable_version/impact_of_employment_health_status_health_care_costs_0.pdf
72. Hergenrather KC, Zeglin RJ, McGuire-Kuletz M, Rhodes SD. Employment as a social determinant of health: a systematic review of longitudinal studies exploring the relationship between employment status and physical health. Rehabil Res Policy Educ. 2015;29(1):2-26.
73. Walton MT, Hall MT. The effects of employment interventions on addiction treatment outcomes: a review of the literature. J Soc Work Pract Addict. 2016;16(4):358-384.
74. Schuring M, Robroek SJ, Burdorf A. The benefits of paid employment among persons with common mental health problems: evidence for the selection and causation mechanism. Scand J Work Environ Health. 2017;43(6):540-549.
75. Burns T, Catty J, White S, et al. The impact of supported employment and working on clinical and social functioning: results of an international study of individual placement and support. Schizophr Bull. 2009;35(5):949-958.
76. Kilian R, Lauber C, Kalkan R, et al. The relationships between employment, clinical status, and psychiatric hospitalisation in patients with schizophrenia receiving either IPS or a conventional vocational rehabilitation programme. Soc Psychiatry Psychiatr Epidemiol. 2012;47(9):1381-1389.
77. Marwaha S, Johnson S. Schizophrenia and employment. Soc Psychiatry Psychiatr Epidemiol. 2004;39(5):337-349.
78. Mueser KT, Drake RE, Bond GR. Recent advances in supported employment for people with serious mental illness. Curr Opin Psychiatry. 2016;29(3):196-201.
79. Bush PW, Drake RE, Xie H, et al. The long-term impact of employment on mental health service use and costs for persons with severe mental illness. Psychiatr Serv. 2009;60(8):1024-1031.
80. Drake RE, Skinner JS, Bond GR, Goldman HH. Social security and mental illness: reducing disability with supported employment. Health Aff (Millwood). 2009;28(3):761-770.
81. Substance Abuse and Mental Health Services Administration. SAMHSA’s working definition of recovery. Substance Abuse and Mental Health Services Administration. Published 2012. Accessed January 11, 2021. https://store.samhsa.gov/system/files/pep12-recdef.pdf
82. Drake RE, Whitley R. Recovery and severe mental illness: description and analysis. Can J Psychiatry. 2014;59(5):236-242.
83. Wisconsin Department of Health Services. PPS Mental Health Module Handbook. Published 2018. Accessed January 11, 2021. https://www.dhs.wisconsin.gov/publications/p02182.pdf
84. Robert Wood Johnson Foundation. Housing and Health. How does housing affect health? May 1, 2011. Accessed January 11, 2021. https://www.rwjf.org/en/library/research/2011/05/housing-and-health.html
85. Cunningham MK, MacDonald G. Housing as a platform for improving education outcomes among low-income children. Urban Institute. May 2012. Accessed January 11, 2021. https://www.urban.org/sites/default/files/publication/25331/412554-Housing-as-a-Platform-for-Improving-Education-Outcomes-among-Low-Income-Children.PDF
86. Friedman D. Social impact of poor housing. ECOTEC. March 2010. Accessed January 11, 2021. https://southdevonrural.co.uk/userfiles/file/JC-JC13-Social-impact-of-poor-housing.pdf
87. Fazel S, Geddes JR, Kushel M. The health of homeless people in high-income countries: descriptive epidemiology, health consequences, and clinical and policy recommendations. Lancet Lond Engl. 2014;384(9953):1529-1540.
88. Nusselder WJ, Slockers MT, Krol L, et al. Mortality and life expectancy in homeless men and women in Rotterdam: 2001–2010. PLoS One. 2013;8(10):e73979.
89. O’Connell JJ. Premature mortality in homeless populations: a review of the literature. National Health Care for the Homeless Council. Published 2005. Accessed April 23, 2019. http://sbdww.org/wp-content/uploads/2011/04/PrematureMortalityFinal.pdf
90. Hwang SW, Wilkins R, Tjepkema M, et al. Mortality among residents of shelters, rooming houses, and hotels in Canada: 11 year follow-up study. BMJ. 2009;339:b4036.
91. Roncarati JS, Baggett TP, O’Connell JJ, et al. Mortality among unsheltered homeless adults in Boston, Massachusetts, 2000-2009. JAMA Intern Med. 2018;178(9):1242-1248.
92. Thomson H, Thomas S, Sellstrom E, Petticrew M. Housing improvements for health and associated socio-economic outcomes. Cochrane Database Syst Rev. 2013;(2):CD008657.
93. Fenelon A, Mayne P, Simon AE, et al. Housing assistance programs and adult health in the United States. Am J Public Health. 2017;107(4):571-578.
94. Fitzpatrick-Lewis D, Ganann R, Krishnaratne S, et al. Effectiveness of interventions to improve the health and housing status of homeless people: a rapid systematic review. BMC Public Health. 2011;11(1):638.
95. Rog DJ, Marshall T, Dougherty RH, et al. Permanent supportive housing: assessing the evidence. Psychiatr Serv. 2014;65(3):287-294.
96. Kirst M, Zerger S, Wise Harris D, et al. The promise of recovery: narratives of hope among homeless individuals with mental illness participating in a Housing First randomised controlled trial in Toronto, Canada: Table 1. BMJ Open. 2014;4(3):e004379.
97. Cohen S, Janicki-Deverts D. Can we improve our physical health by altering our social networks? Perspect Psychol Sci. 2009;4(4):375-378.
98. House JS, Landis KR, Umberson D. Social relationships and health. Science. 1988;241(4865):540-545.
99. Kawachi I, Berkman LF. Social ties and mental health. J Urban Health. 2001;78(3):458-467.
100. Schön U-K, Denhov A, Topor A. Social relationships as a decisive factor in recovering from severe mental illness. Int J Soc Psychiatry. 2009;55(4):336-347.
101. Soundy A, Stubbs B, Roskell C, et al. Identifying the facilitators and processes which influence recovery in individuals with schizophrenia: a systematic review and thematic synthesis. J Ment Health. 2015;24(2):103-110.
102. Tew J, Ramon S, Slade M, et al. Social factors and recovery from mental health difficulties: a review of the evidence. Br J Soc Work. 2012;42(3):443-460.
103. Moos RH. Theory-based processes that promote the remission of substance use disorders. Clin Psychol Rev. 2007;27(5):537-551.
104. Stiefel MC, Riley CL, Roy B, et al. 100 Million Healthier Lives Measurement System: Progress to date. Institute for Healthcare Improvement; 2016:41. Accessed January 11, 2021. http://www.100mlives.org
105. Swanson JW, Frisman LK, Robertson AG, et al. Costs of criminal justice involvement among persons with serious mental illness in Connecticut. Psychiatr Serv. 2013;64(7):630-637.
106. Fazel S, Bains P, Doll H. Substance abuse and dependence in prisoners: a systematic review. Addiction. 2006;101(2):181-191.
107. Fazel S, Seewald K. Severe mental illness in 33 588 prisoners worldwide: systematic review and meta-regression analysis. Br J Psychiatry. 2012;200(05):364-373.
108. Fazel S, Baillargeon J. The health of prisoners. Lancet. 2011;377(9769):956-965.
109. Wildeman C, Wang EA. Mass incarceration, public health, and widening inequality in the USA. Lancet. 2017;389(10077):1464-1474.
110. Zlodre J, Fazel S. All-cause and external mortality in released prisoners: systematic review and meta-analysis. Am J Public Health. 2012;102(12):e67-e75.
111. Massoglia M, Pridemore WA. Incarceration and health. Annu Rev Sociol. 2015;41:291-310.
112. Kouyoumdjian FG, Cheng SY, Fung K, et al. The health care utilization of people in prison and after prison release: a population-based cohort study in Ontario, Canada. PLoS One. 2018;13(8):e0201592.
113. Winkelman TNA, Genao I, Wildeman C, Wang EA. Emergency department and hospital use among adolescents with justice system involvement. Pediatrics. 2017;140(5):e20171144.
114. Wildeman C. Imprisonment and infant mortality. Soc Prob. 2012;59:228-257.
115. Geller A, Cooper CE, Garfinkel I, et al. Beyond absenteeism: father incarceration and child development. Demography. 2012;49(1):49-76.
116. Turney K. Stress proliferation across generations? Examining the relationship between parental incarceration and childhood health. J Health Soc Behav. 2014;55(3):302-319.
117. Geller A, Garfinkel I, Western B. Paternal incarceration and support for children in fragile families. Demography. 2011;48(1):25-47.
118. Lee H, Wildeman C, Wang EA, et al. A heavy burden: the cardiovascular health consequences of having a family member incarcerated. Am J Public Health. 2014;104(3):421-427.
119. Western B. The impact of incarceration on wage mobility and inequality. Am Sociol Rev. 2002;67(4):526-546.
120. Constantine R, Andel R, Petrila J, et al. Characteristics and experiences of adults with a serious mental illness who were involved in the criminal justice system. Psychiatr Serv. 2010;61(5):451-457.
121. Garnick DW, Horgan CM, Acevedo A, et al. Criminal justice outcomes after engagement in outpatient substance abuse treatment. J Subst Abuse Treat. 2014;46(3):295-305.
122. Adler NE, Ostrove JM. Socioeconomic status and health: what we know and what we don’t. Ann N Y Acad Sci. 1999;896(1):3-15.
123. Luo Y, Waite LJ. The impact of childhood and adult SES on physical, mental, and cognitive well-being in later life. J Gerontol Ser B. 2005;60(2):S93-S101.
124. Mackenbach JP, Stirbu I, Roskam A-JR, et al. Socioeconomic inequalities in health in 22 European countries. N Engl J Med. 2008;358(23):2468-2481.
125. Hudson CG. Socioeconomic status and mental illness: tests of the social causation and selection hypotheses. Am J Orthopsychiatry. 2005;75(1):3-18.
126. McLaughlin KA, Breslau J, Green JG, et al. Childhood socio-economic status and the onset, persistence, and severity of DSM-IV mental disorders in a US national sample. Soc Sci Med. 2011;73(7):1088-1096.
127. Muntaner C. Socioeconomic position and major mental disorders. Epidemiol Rev. 2004;26(1):53-62.
128. Präg P, Mills MC, Wittek R. Subjective socioeconomic status and health in cross-national comparison. Soc Sci Med. 2016;149:84-92.
129. Shaked D, Williams M, Evans MK, Zonderman AB. Indicators of subjective social status: differential associations across race and sex. SSM Popul Health. 2016;2:700-707.
130. Singh-Manoux A, Adler NE, Marmot MG. Subjective social status: its determinants and its association with measures of ill-health in the Whitehall II study. Soc Sci Med. 2003;56(6):1321-1333.
131. Adler NE, Epel ES, Castellazzo G, Ickovics JR. Relationship of subjective and objective social status with psychological and physiological functioning: preliminary data in healthy, white women. Health Psychol. 2000;19(6):586-592.
132. Cundiff JM, Matthews KA. Is subjective social status a unique correlate of physical health? A meta-analysis. Health Psychol. 2017;36(12):1109-1125.
133. Demakakos P, Biddulph JP, de Oliveira C, et al. Subjective social status and mortality: The English Longitudinal Study of Ageing. Eur J Epidemiol. 2018;33(8):729-739.
134. Quon EC, McGrath JJ. Subjective socioeconomic status and adolescent health: a meta-analysis. Health Psychol. 2014;33(5):433-447.
135. Scott KM, Al-Hamzawi AO, Andrade LH, et al. Associations between subjective social status and DSM-IV mental disorders: Results from the World Mental Health Surveys. JAMA Psychiatry. 2014;71(12):1400-1408.
136. Jencks SF, Williams MV, Coleman EA. Rehospitalizations among patients in the Medicare Fee-for-Service Program. N Engl J Med. 2009;360(14):1418-1428.
137. Krumholz HM, Wang K, Lin Z, et al. Hospital-readmission risk—Isolating hospital effects from patient effects. N Engl J Med. 2017;377(11):1055-1064.
138. Krumholz HM, Lin Z, Keenan PS, et al. Relationship of hospital performance with readmission and mortality rates for patients hospitalized with acute myocardial infarction, heart failure, or pneumonia. JAMA. 2013;309(6):587-593.
139. Chin DL, Bang H, Manickam RN, Romano PS. Rethinking thirty-day hospital readmissions: Shorter intervals might be better indicators of quality of care. Health Aff (Millwood). 2016;35(10):1867-1875.
140. Feltner C, Jones CD, Cené CW, et al. Transitional care interventions to prevent readmissions for persons with heart failure: a systematic review and meta-analysis. Ann Intern Med. 2014;160(11):774-784.
141. Hudon C, Chouinard M-C, Lambert M, et al. Effectiveness of case management interventions for frequent users of healthcare services: a scoping review. BMJ Open. 2016;6(9):e012353.
142. Kripalani S, Theobald CN, Anctil B, Vasilevskis EE. Reducing hospital readmission: current strategies and future directions. Annu Rev Med. 2014;65:471-485.
143. Verhaegh KJ, MacNeil-Vroomen JL, Eslami S, et al. Transitional care interventions prevent hospital readmissions for adults with chronic illnesses. Health Aff (Millwood). 2014;33(9):1531-1539.
144. Duhig M, Gunasekara I, Patterson S. Understanding readmission to psychiatric hospital in Australia from the service users’ perspective: a qualitative study. Health Soc Care Community. 2017;25(1):75-82.
145. New England Healthcare Institute. A matter of urgency: Reducing emergency department overuse. Published 2010. Accessed January 11, 2021. https://www.nehi.net/writable/publication_files/file/nehi_ed_overuse_issue_brief_032610finaledits.pdf
146. Billings J, Raven MC. Dispelling an urban legend: Frequent emergency department users have substantial burden of disease. Health Aff (Millwood). 2013;32(12):2099-2108.
147. Moe J, Kirkland S, Ospina MB, et al. Mortality, admission rates and outpatient use among frequent users of emergency departments: a systematic review. Emerg Med J. 2016;33(3):230-236.
148. Carret MLV, Fassa ACG, Domingues MR. Inappropriate use of emergency services: a systematic review of prevalence and associated factors. Cad Saúde Pública. 2009;25(1):7-28.
149. Durand A-C, Palazzolo S, Tanti-Hardouin N, et al. Nonurgent patients in emergency departments: rational or irresponsible consumers? Perceptions of professionals and patients. BMC Res Notes. 2012;5(1):525.
150. Uscher-Pines L, Pines J, Kellermann A, et al. Deciding to visit the emergency department for non-urgent conditions: a systematic review of the literature. Am J Manag Care. 2013;19(1):47-59.
151. Kumar GS, Klein R. Effectiveness of case management strategies in reducing emergency department visits in frequent user patient populations: a systematic review. J Emerg Med. 2013;44(3):717-729.
152. Moe J, Kirkland SW, Rawe E, et al. Effectiveness of interventions to decrease emergency department visits by adult frequent users: a systematic review. Acad Emerg Med. 2017;24(1):40-52.
153. Raven MC, Kushel M, Ko MJ, et al. The effectiveness of emergency department visit reduction programs: a systematic review. Ann Emerg Med. 2016;68(4):467-483.e15.
154. Soril LJJ, Leggett LE, Lorenzetti DL, et al. Reducing frequent visits to the emergency department: a systematic review of interventions. PLoS One. 2015;10(4):e0123660.
155. Van den Heede K, Van de Voorde C. Interventions to reduce emergency department utilisation: a review of reviews. Health Policy. 2016;120(12):1337-1349.
156. Onken SJ, Dumont JM, Ridgway P, et al. Mental health recovery: What helps and what hinders? October 2002. Accessed January 11, 2021. https://www.nasmhpd.org/sites/default/files//MHSIPReport%281%29.pdf
157. Leggett LE, Khadaroo RG, Holroyd-Leduc J, et al. Measuring resource utilization. Medicine (Baltimore). 2016;95(10):e2759.
158. Bhandari A, Wagner T. Self-reported utilization of health care services: improving measurement and accuracy. Med Care Res Rev. 2006;63(2):217-235.
159. Short ME, Goetzel RZ, Pei X, et al. How accurate are self-reports? An analysis of self-reported healthcare utilization and absence when compared to administrative data. J Occup Environ Med. 2009;51(7):786-796.
160. Institute of Medicine. Crossing the Quality Chasm: A New Health System for the 21st Century. National Academies Press; 2001.
161. Brennan TA, Leape LL, Laird NM, et al. Incidence of adverse events and negligence in hospitalized patients. Results of the Harvard Medical Practice Study I. N Engl J Med. 1991;324(6):370-376.
162. Rafter N, Hickey A, Condell S, et al. Adverse events in healthcare: learning from mistakes. QJM. 2015;108(4):273-277.
163. Makary MA, Daniel M. Medical error—the third leading cause of death in the US. BMJ. 2016;3(353):i2139.
164. D’Lima D, Crawford MJ, Darzi A, Archer S. Patient safety and quality of care in mental health: A world of its own? BJPsych Bull. 2017;41(5):241-243.
165. Maidment ID, Lelliott P, Paton C. Medication errors in mental healthcare: a systematic review. Qual Saf Health Care. 2006;15(6):409-413.
166. Mills PD, Watts BV, Shiner B, Hemphill RR. Adverse events occurring on mental health units. Gen Hosp Psychiatry. 2018;50:63-68.
167. Marcus SC, Hermann RC, Frankel MR, Cullen SW. Safety of psychiatric inpatients at the Veterans Health Administration. Psychiatr Serv. 2017;69(2):204-210.
168. Reilly CA, Cullen SW, Watts BV, et al. How well do incident reporting systems work on inpatient psychiatric units? Jt Comm J Qual Patient Saf. 2019;45:63-69.
169. Rosano A, Loha CA, Falvo R, et al. The relationship between avoidable hospitalization and accessibility to primary care: a systematic review. Eur J Public Health. 2013;23(3):356-360.
170. Dupre ME, Xu H, Granger BB, et al. Access to routine care and risks for 30-day readmission in patients with cardiovascular disease. Am Heart J. 2018;196:9-17.
171. Pizer SD, Prentice JC. What are the consequences of waiting for health care in the veteran population? J Gen Intern Med. 2011;26(S2):676-682.
172. Festinger DS, Lamb RJ, Kirby KC, Marlowe DB. The accelerated intake: a method for increasing initial attendance to outpatient cocaine treatment. J Appl Behav Anal. 1996;29(3):387-389.
173. Festinger DS, Lamb RJ, Marlowe DB, Kirby KC. From telephone to office: intake attendance as a function of appointment delay. Addict Behav. 2002;27(1):131-137.
174. Gallucci G, Swartz W, Hackerman F. Brief reports: Impact of the wait for an initial appointment on the rate of kept appointments at a mental health center. Psychiatr Serv. 2005;56(3):344-346.
175. Bleustein C, Rothschild DB, Valen A, et al. Wait times, patient satisfaction scores, and the perception of care. Am J Manag Care. 2014;20(5):393-400.
176. Reichert A, Jacobs R. The impact of waiting time on patient outcomes: Evidence from early intervention in psychosis services in England. Health Econ. 2018;27(11):1772-1787.
177. Doyle C, Lennox L, Bell D. A systematic review of evidence on the links between patient experience and clinical safety and effectiveness. BMJ Open. 2013;3(1):e001570.
178. Horvath AO, Del Re AC, Flückiger C, Symonds D. Alliance in individual psychotherapy. Psychotherapy. 2011;48(1):9-16.
179. Farley H, Enguidanos ER, Coletti CM, et al. Patient satisfaction surveys and quality of care: an information paper. Ann Emerg Med. 2014;64(4):351-357.
180. Aiken LH, Sermeus W, Van den Heede K, et al. Patient safety, satisfaction, and quality of hospital care: cross sectional surveys of nurses and patients in 12 countries in Europe and the United States. BMJ. 2012;344:e1717.
181. Boulding W, Glickman SW, Manary MP, Schulman KA, Staelin R. Relationship between patient satisfaction with inpatient care and hospital readmission within 30 days. Am J Manag Care. 2011;17(1):41-48.
182. Rohland BM, Langbehn DR, Rohrer JE. Relationship between service effectiveness and satisfaction among persons receiving Medicaid mental health services. Psychiatr Serv. 2000;51(2):248-250.
183. Zendjidjian X-Y, Baumstarck K, Auquier P, et al. Satisfaction of hospitalized psychiatry patients: Why should clinicians care? Patient Prefer Adherence. 2014;8:575-583.
184. Centers for Medicare & Medicaid Services. National health expenditures; aggregate and per capita amounts, annual percent change and percent distribution: Calendar years 1960-2016. National Health Expenditure Data. https://www.cms.gov/research-statistics-data-and-systems/statistics-trends-and-reports/nationalhealthexpenddata/nationalhealthaccountshistorical.html. Published 2018. Accessed August 21, 2018.
185. DuBard CA. Running the numbers. N C Med J. 2016;77(4):297-300.
186. Peikes D, Chen A, Schore J, Brown R. Effects of care coordination on hospitalization, quality of care, and health care expenditures among Medicare beneficiaries: 15 randomized trials. JAMA. 2009;301(6):603-618.
187. Seow H-Y, Sibley LM. Developing a dashboard to help measure and achieve the triple aim: A population-based cohort study. BMC Health Serv Res. 2014;14(1):363.
188. Lee VS, Kawamoto K, Hess R, et al. Implementation of a value-driven outcomes program to identify high variability in clinical costs and outcomes and association with reduced cost and improved quality. JAMA. 2016;316(10):1061.
189. Dyrbye LN, Shanafelt TD, Sinsky CA, et al. Burnout among health care professionals: A call to explore and address this underrecognized threat to safe, high-quality care discussion paper. National Academy of Medicine. July 5, 2017. Accessed January 11, 2021. https://nam.edu/burnout-among-health-care-professionals-a-call-to-explore-and-address-this-underrecognized-threat-to-safe-high-quality-care/
190. Johnson J, Hall LH, Berzins K, et al. Mental healthcare staff well-being and burnout: a narrative review of trends, causes, implications, and recommendations for future interventions. Int J Ment Health Nurs. 2018;27(1):20-32.
191. Morse G, Salyers MP, Rollins AL, et al. Burnout in mental health services: a review of the problem and its remediation. Adm Policy Ment Health. 2012;39(5):341-352.
192. Hall LH, Johnson J, Watt I, et al. Healthcare staff wellbeing, burnout, and patient safety: a systematic review. PLoS One. 2016;11(7):e0159015.
193. Garman AN, Corrigan PW, Morris S. Staff burnout and patient satisfaction: evidence of relationships at the care unit level. J Occup Health Psychol. 2002;7(3):235-241.
194. Wilkinson H, Whittington R, Perry L, Eames C. Examining the relationship between burnout and empathy in healthcare professionals: a systematic review. Burn Res. 2017;6:18-29.
195. Holmqvist R, Jeanneau M. Burnout and psychiatric staff’s feelings towards patients. Psychiatry Res. 2006;145(2-3):207-213.
196. Leiter MP, Maslach C. Nurse turnover: the mediating role of burnout. J Nurs Manag. 2009;17(3):331-339.
197. Zhang Y, Feng X. The relationship between job satisfaction, burnout, and turnover intention among physicians from urban state-owned medical institutions in Hubei, China: a cross-sectional study. BMC Health Serv Res. 2011;11(1):235.
198. Halter M, Boiko O, Pelone F, et al. The determinants and consequences of adult nursing staff turnover: a systematic review of systematic reviews. BMC Health Serv Res. 2017;17(1):824.
199. Hamidi MS, Bohman B, Sandborg C, et al. Estimating institutional physician turnover attributable to self-reported burnout and associated financial burden: a case study. BMC Health Serv Res. 2018;18(1):851.
200. National Taskforce for Humanity in Healthcare. The business case for humanity in healthcare position paper. April 2018. Accessed January 11, 2021. https://www.vocera.com/public/pdf/NTHBusinessCase_final003.pdf
201. Waldman JD, Kelly F, Arora S, Smith HL. The shocking cost of turnover in health care. Health Care Manage Rev. 2004;29(1):2-7.
202. Brunette MF, Asher D, Whitley R, et al. Implementation of integrated dual disorders treatment: a qualitative analysis of facilitators and barriers. Psychiatr Serv. 2008;59(9):989-995.
203. Mancini AD, Moser LL, Whitley R, et al. Assertive community treatment: facilitators and barriers to implementation in routine mental health settings. Psychiatr Serv. 2009;60(2):189-195.
204. Rollins AL, Salyers MP, Tsai J, Lydick JM. Staff turnover in statewide implementation of ACT: Relationship with ACT fidelity and other team characteristics. Adm Policy Ment Health. 2010;37(5):417-426.
205. Woltmann EM, Whitley R, McHugo GJ, et al. The role of staff turnover in the implementation of evidence-based practices in mental health care. Psychiatr Serv. 2008;59(7):732-737.
206. Alegría M, NeMoyer A, Falgàs Bagué I, et al. Social determinants of mental health: Where we are and where we need to go. Curr Psychiatry Rep. 2018;20(11):95.
207. Daniel H, Bornstein SS, Kane GC. Addressing social determinants to improve patient care and promote health equity: an American College of Physicians position paper. Ann Intern Med. 2018;168(8):577-578.
208. Park H, Roubal AM, Jovaag A, Gennuso KP, Catlin BB. Relative contributions of a set of health factors to selected health outcomes. Am J Prev Med. 2015;49(6):961-969.
209. Ash AS, Mick EO, Ellis RP, et al. Social determinants of health in managed care payment formulas. JAMA Intern Med. 2017;177(10):1424.
210. de Beurs E, Warmerdam EH, Oudejans SCC, et al. Treatment outcome, duration, and costs: a comparison of performance indicators using data from eight mental health care providers in the Netherlands. Adm Policy Ment Health. 2018;45(2):212-223.
211. Dunbar-Rees R. Paying for what matters most: the future of outcomes-based payments in healthcare. Future Healthc J. 2018;5(2):98-102.
212. Woolhandler S, Himmelstein DU. Administrative work consumes one-sixth of U.S. physicians’ working hours and lowers their career satisfaction. Int J Health Serv. 2014;44(4):635-642.
From the Milwaukee County Behavioral Health Division, Milwaukee, WI.
Abstract
Objective: Implementation of the Quadruple Aim of health care must begin with a clearly articulated set of concepts, or core domains (CDs), that comprise each aim. These CDs can then be operationalized with existing or new measures. If aligned to the organization’s mission and strategic goals, these CDs have the potential to focus quality improvement activities and reduce measurement burden. This article represents the efforts of a publicly funded behavioral health system to operationalize the Quadruple Aim through the development of CDs.
Methods: Various stakeholders across the organization were consulted on their perceptions of the Quadruple Aim and the CDs they believed should support it. Then, a review of existing literature on core metrics for health care and population health was completed, summarized, and integrated with the stakeholder feedback.
Results: These efforts led to the development and adoption of 15 CDs, with an accompanying literature review and set of recommendations of new and existing measures for each domain.
Conclusions: It is possible to create a comprehensive yet economical set of CDs and attendant measures that can be implemented in a staged, scalable, enterprise manner. It is hoped that the process articulated here, and the accompanying literature review, may be of some benefit to other public or government-run health systems in their own quality improvement journey to operationalize the Quadruple Aim by developing a set of CDs.
Keywords: quality measures; quality improvement; adult behavioral health.
First articulated in 2008, the Triple Aim proposes that health care systems should simultaneously seek to improve the patient’s experience of care, improve the health of populations, and reduce the per capita costs of care for populations.1 More recently, some have argued that health care provider burnout can deleteriously impact the attainment of the Triple Aim and have therefore advocated for an expanded focus to include a fourth Aim, the work life quality of the staff.2 Milwaukee County Behavioral Health Division (BHD), a publicly funded, county-based behavioral health care system in Milwaukee, Wisconsin, recently adopted the Quadruple Aim as the framework by which it will organize its quality activities.
Although originally developed for medical organizations, BHD believes that the Quadruple Aim has strong applicability to county-level behavioral health services. Many county-based behavioral health divisions provide a variety of programs to large segments of the county based on financial eligibility and/or clinical need, and thus often have responsibilities to populations or subpopulations, rather than programs. County health divisions, such as Milwaukee County’s Department of Health and Human Services, are often asked to improve outcomes and client experience of care with neutral growth budgets and less reliance on taxes to fund programs, while simultaneously attracting and retaining competent staff.
Crucial to the effective implementation of the Quadruple Aim, however, is a clear set of population- level measures that help organizations assess their progress.3 Unfortunately, as some authors have noted, evaluation of the Quadruple Aim remains a challenge because the “concepts of (population) health, quality of care and costs are not unanimously defined and measures for these concepts are under construction.”4 Several authors have provided some guidance to assist in the development of a set of measures that effectively capture the elements of the Quadruple Aim.5,6 However, the recent rapid proliferation of quality measures in health care7,8 has been both burdensome and costly for providers.9,10 Any measures adopted should not only be as meaningful as possible with regards to assessing progress towards the basic aims of health care, but should also be parsimonious, to limit measurement burden for providers (and patients) and focus attention on important issues.11,12
To select the most effective, parsimonious set of measures possible, one must first select a set of key foci from among the many possible areas of focus that the core measure is intended to represent. The core domains (CDs), if appropriately consistent with the strategic goals of the organization, provide a mechanism to orient the efforts of the organization at every level and help every staff member of the organization understand how his or her work impacts the progress towards these goals.11 The CDs, therefore, represent the opportunity to affect a greater integration of efforts across the organization toward these shared aims, creating uniformity of purpose at every level. Further, increasing organizational attention on the CDs can also help to reduce measurement burden by streamlining and focusing the data capture processes on the most valuable elements of quality and health, and discarding other extraneous measures (albeit not at the expense of other reporting requirements).11 The remainder of this article describes the CDs selected by BHD to assess its progress toward implementation of the Quadruple Aim and are organized by the Aim which they best represent.
Methods
To effectively implement the Quadruple Aim at BHD, it was necessary to clearly define the subpopulation of focus for our efforts.6 In this case, the subpopulation of interest was defined as all adult clients (18 years and older) who received at least 1 service encounter within a specified time frame from a program that BHD either operated or contracted with to provide care. Services provided by the BHD network include everything from psychiatric inpatient services to mental health and addiction treatment and care management. A limited array of social services, including housing and employment services, is also available to eligible consumers. BHD is the county-run behavioral health provider for individuals who are uninsured or underinsured in Milwaukee County, a demographically diverse, primarily urban county of approximately 950,000 people located in Wisconsin. Approximately 15,000 adults receive services at BHD each year.
This work began by obtaining executive sponsorship for the project, in this case from the Chief Operations Officer and Executive Medical Director of BHD. With their backing, an initial review of the literature produced a preliminary set of possible domains, for which we created working definitions. We then made a list of key stakeholders throughout BHD to whom we needed to present the idea of the Quadruple Aim, and the CDs under each Aim, to secure their support. These stakeholders, which included individuals involved in quality activities, program managers, and executive leadership, were strategically selected based on their relative influence within the organization. A set of brief presentations and handouts explaining the project were then developed and shared at different focus groups with these stakeholders over the course of 6 months. These focus groups served to not only educate the organization about the Quadruple Aim and the CDs but afforded participants an opportunity to provide feedback as well.
During the focus groups, we asked participants which domains they believed were most important (were “core”) when operationalizing the Quadruple Aim. The focus groups provided feedback on the domain definitions, feedback that was used to develop uniform, mutually agreed upon definitions for the CDs that were generalizable to all departments at BHD, regardless of the focus of their services within the continuum of care or the continuum of age. This was a crucial step, as it will eventually enable BHD to aggregate data across departments, even if there are minor discrepancies in the specific items they use to assess the CDs. Comments from the focus groups ultimately resulted in a truncated list of domains and definitions, which, coupled with the literature review, resulted in our final set of CDs.
During our review of the literature, we also looked for items that we felt could best represent each CD in the briefest, most meaningful way. (These items were not meant to supersede existing data, but to provide examples that could be implemented with existing data or recommendations that could be utilized in the absence of existing data.) During this process, we made every effort to make use of existing data-reporting requirements. For example, if we had a state mandate to collect data on housing status, we attempted to leverage this required data point to represent the CD related to housing. In other cases, we attempted to utilize claims or other administrative data to operationalize the CD, such as in the cost-of-care metric articulated in the section the Third Aim. For CDs for which no data existed or were insufficient, we emphasized the use of single- versus multi-item scales. For example, if we found a single-item global assessment of quality of life that had good psychometric properties relative to its longer parent scale, we selected the single item. This approach to item selection allowed us to create the most efficient, parsimonious set of measures possible, which we believed would enable us to comprehensively assess all the CDs with the least amount of burden to staff and clients. These items were presented at stakeholder focus groups, during which we asked for comments on the existing measures in their program or department and gave them the opportunity to comment on the new recommended measures.
A working definition is provided for each CD, followed by a brief review of the research base supporting its inclusion in the final list. The item(s) selected by BHD to represent each CD and the source of the item(s) are then supplied. These items were based either on measures currently collected because of existing reporting mandates or, in the case where extant measures were not available, on new items that demonstrated acceptable psychometric properties in the research literature. The CDs and items are organized by the Aim they best represent. A full list of the CDs by Quadruple Aim and items by CD is provided in the Appendix of the online version of this article. This article concludes with a brief summary of this effort and a discussion of how staff will utilize these items at different levels throughout the BHD system.
The First Aim: Population Health
Health Outcomes
Deaths. This can be defined as the cause of death, as determined by the medical examiner’s office (where appropriate) or as the age at time of death. This CD can also be reported as proportion of deaths considered premature (eg, before age 75) or calculated as total years of potential life lost.
Brief review and suggested item(s). Rates and causes of premature mortality are critical foci for the County Health Rankings & Roadmaps,13 the Institute for Healthcare Improvement’s “Guide to Measuring the Triple Aim,”6 the Centers for Disease Control and Prevention’s “Community Health Assessment for Population Health Improvement,”14 and the Institute of Medicine’s (IOM) “Vital Signs: Core Metrics for Health and Health Care Progress.”11 There is ample evidence that individuals with serious mental illness are at increased risk of early mortality relative to the general population,15-18 and this risk applies to those with substance use disorders as well.15,19-20 BHD tracks all deaths that occur while patients are receiving BHD-funded, community-based services.
Self-Reported Health and Well-Being. This CD asks patients to rate their current physical and mental health status, as well as their overall quality of life.
Brief review and suggested item(s): Self-rated physical health. Premature mortality among individuals with behavioral health issues appears to be due, in large part, to their increased vulnerability to the development of medical comorbidities.16,21 A single self-rating question has demonstrated considerable sensitivity to premature mortality,22,23 with predictive properties up to a decade prior to death.24,25 Further, self-rated health has been associated with subsequent functional decline,26,27 acute service utilization,28,29 and overall health care costs.28
Brief review and suggested item(s): Self-rated mental health. Mental health disorders are associated with significant disability worldwide,30 and comorbid mental health issues can exacerbate the course of other medical problems. For example, depression is associated with increased rates of mortality among individuals with diabetes and31 cardiovascular disease,32 as well as with rates of overall mortality,33 and psychiatric comorbidity is associated with longer lengths of stay and higher costs among patients hospitalized for medical problems.34 Research has found that a single-item measure of self-rated mental health is associated with the presence of psychiatric diagnoses, psychiatric symptoms, and subsequent depression and serious mental illness up to 1 year post-assessment.35,36 There is even evidence that self-rated mental health may be more strongly associated with self-ratings of overall health than self-ratings of physical health.37
Brief review and suggested item(s): Self-rated quality of life. Quality of life is a critical component of the recovery journey and overall health.38 For example, the County Health Rankings & Roadmaps lists “quality of life” as 1 of its key “health outcomes” in its County Health Rankings.13 As some authors have noted, quality of life is often inferred from other “objective” recovery domains, such as employment, health status, or housing status. However, there is evidence that these objective domains are functionally distinct from the inherently subjective construct of quality of life.39 This has led other authors to conclude that these domains should be assessed separately when evaluating outcomes.40 Single-item quality of life assessments have been used in research with individuals with cancer,41 adults with disabilities,42 patients with cystic fibrosis,43 and children with epilepsy.44 For this effort, BHD selected the first global quality of life item from the World Health Organization’s WHOQOL-BREF quality of life assessment,45 an item used in other quality of life research.46
Health Factors
Substance Use. This CD is a composite of 4 different types of substance use, any recent heavy alcohol use (defined as 5 or more drinks in one sitting), any recent drug use, any recent prescription drug abuse, and any recent tobacco use.
Brief review and suggested item(s). As noted, substance use disorders confer an increased risk for early mortality15,19 and are significantly implicated in disease disability burden worldwide.30 Substance use has also been associated with both the onset47,48 and exacerbation of mental health diagnoses.49-51 Further, substance use appears to heighten the risk of violence in the general population52 and especially among those with a co-occurring mental illness.53,54 The County Health Rankings & Roadmaps list alcohol and drug use as key behaviors to address to improve the overall health of a given county,13 and the Centers for Medicare & Medicaid Services (CMS) has endorsed initiation and engagement in addiction treatment as one of the measures in its Adult Core Set.55
Tobacco use continues to be one of the most significant risk factors for early mortality worldwide, and evidence indicates that it is associated with a lower life expectancy of nearly 10 years.56 Unfortunately, rates of tobacco use are even higher among those with severe mental illness relative to the general population, and their rates of smoking cessation are lower.57,58 Tobacco use is a significant risk factor for the high rates of early mortality in individuals with severe mental illness.18 Further, a recent meta-analysis noted that, relative to those who continued to smoke, those who ceased smoking had reduced rates of psychological distress and increased quality of life rankings.59 Reducing tobacco use is one of the key components of the County Health Rankings & Roadmaps, and medication assistance with smoking and tobacco use cessation is also listed in the CMS Adult Core Set.13,55
An accumulating body of evidence suggests that single-item measures can adequately detect alcohol60-62 and drug use disorders.60-64 McNeely and colleagues recently developed and tested a brief 4-item screen, the Tobacco, Alcohol, Prescription medication, and other Substance use (TAPS) tool.65,66 Preliminary evidence suggests that the TAPS tool can effectively identify the presence of problematic and disordered use of tobacco, alcohol, prescription medications, and other drugs.65-67 BHD will use the 4 items from the TAPS tool to represent its substance use CD.
Education/Employment Status. This CD assesses the proportion of BHD members who have completed high school, who are in some type of educational or training program, or who are engaged in some type of employment activity (defined as full-time, part-time, supported, sheltered workshop, or as a full-time homemaker).
Brief review and suggested item(s). Research indicates that unemployment is a risk factor for mortality, even after controlling for other risk factors (eg, age, sex, socioeconomic status [SES], health).68 Unemployment is associated with poorer physical and mental health in the general population and among those with disabilities.69-71 Promisingly, evidence suggests that gaining employment or re-employment is associated with better health,72 even for individuals with substance use disorders73 or moderate74 to severe mental health disorders.75-78 Some authors have even proposed that, above and beyond the associated health benefits, employment may also help to realize a modest cost savings due to reduced service utilization and disability.79,80 Employment is a core tenet in the Substance Abuse and Mental Health Services Administration’s (SAMHSA’s) model of recovery,81 and is also listed as an important recovery goal for individuals with behavioral health issues.82 BHD collects data on employment status on all the patients it serves as part of its state-mandated reporting requirements and will use this item in the CD data set.83
Living Situation. This is measured as the proportion of people who live in permanent, supportive, stable housing; it may also be measured as the percentage of the population living with severe housing problems or who are homeless.
Brief review and suggested item(s). Housing problems can be conceptualized as 3 inter-related components: conditions within the home, neighborhood conditions, and housing affordability, each of which can contribute uniquely to poorer physical and mental health of individuals and families84 and to educational outcomes for children.85,86 Further, individuals who are homeless have a standardized mortality ratio 2 to 5 times that of the general population,87-89 even after controlling for low income status,90 and some evidence suggests these rates are even higher among unsheltered versus sheltered homeless individuals.91 Interventions to improve the condition of housing have demonstrated positive impacts on both physical and mental health,92 and a recent study found that individuals receiving housing assistance in the form of public housing or multifamily housing from the Department of Housing and Urban Development had better self-rated physical and mental health relative to individuals on the wait list for housing assistance.93 Moreover, the provision of housing has been shown to promote reductions in substance use and health service utilization among homeless individuals with substance use disorders.94 Rog and colleagues reviewed the literature on permanent supportive housing for individuals with substance use or mental health disorders who were homeless or disabled, and found that provision of housing led to reduced rates of homelessness, emergency department (ED) and inpatient utilization and increased consumer satisfaction.95
Importantly, evidence suggests that housing is viewed as facilitative of recovery. For example, in a recent qualitative study of homeless individuals with mental illness, housing was seen as a critical first step in recovery, providing a sense of security, increasing feelings of personal independence and autonomy, improving perceptions of health and well-being, and affording a stable environment to rebuild relationships with important others.96 BHD collects data on housing status on all the patients it serves as part of its state-mandated reporting requirements and will utilize this item in the CD data set.83
Social Relationships. This is defined as recent interactions with family, supportive networks (formal and informal), and other recovery services.
Brief review and suggested item(s). Research has long established that social relationships have a significant impact on health, including rates of mortality as well as physical and mental health morbidity.97-99 Social connectedness is another of the pillars supporting an individual’s recovery in SAMHSA’s formulation. Several reviews of the recovery literature38,82 support its importance to the recovery process and inclusion in any assessment of holistic recovery. Social support has been shown to promote recovery among individuals with severe mental illness100-102 and substance use disorders,103 and may mitigate the progression of chronic, life-threatening physical illnesses.97 For the purposes of BHD’s CD data set, the social support question from the “100 Million Healthier Lives Common Questionnaire for Adults” will be used to assess individuals’ perceived adequacy of social support.104
Legal Involvement. Defined as involvement with the civil or criminal justice system, including arrests, imprisonment, or detainment.
Brief review and suggested item(s). Involvement in the criminal justice system is both disruptive for the individual in recovery and expensive to the larger health care system.105 Individuals with substance use106 and severe mental health disorders107 are over-represented in the prison system, and evidence suggests that general physical and mental health declines while individuals are in prison.108,109 Perhaps even more concerning, numerous studies have demonstrated an increase in mortality rates for individuals recently released from prison relative to the general population, particularly during the period immediately following release.108-110 This relationship may even persist long term.111 Further, research indicates that individuals recently released from prison have increased emergency care and hospital utilization.112,113
Incarceration can have significant impacts on the health of the broader community as well. For example, research has found an association between parental incarceration to rates of infant mortality,114 increased behavioral and developmental problems of children of incarcerated parents,115,116 lower rates of child support payments,117 and poorer cardiovascular health of female partners of incarcerated individuals.118 Formerly incarcerated individuals experience slower wage growth as well.119 However, evidence also indicates that engagement in mental health120 and substance abuse121 treatment can reduce the likelihood of subsequent recidivism. As part of its state-mandated reporting, BHD is required to provide information on the criminal justice system involvement of its clients in the previous 6 months, including whether they have been jailed or imprisoned,83 and this will function as its measure of legal involvement in its CD data set.
Socioeconomic Status. Socioeconomic status is the social standing or class of an individual or group. It is often measured as a combination of education, income, and occupation. It can also be defined subjectively, such as one’s evaluation of status relative to similar others or based on an individual’s interpretation of her or his financial needs.
Brief review and suggested item(s). A large body of evidence supports the existence of a robust relationship between lower SES and poor health, including mortality and chronic medical diseases,122-124 as well as mental illness.125-127 Although previous research has examined this relationship using objective indicators of SES (eg, income, education level, occupation), there has recently been an increased interest in exploring the relationship of subjective SES with health indices. Subjective SES is generally assessed by asking individuals to rate themselves relative to others in the society in which they live, in terms of wealth, occupation, educational level, or other indicators of social status. Evidence suggests that subjective SES is associated with objective measures of SES,128-130 and relates to measures of physical and mental health as well, even after controlling for objective SES.130-135 BHD will be using a modified version of the Subject SES Scale,131,135 which is deployed in the “100 Million Healthier Lives Common Questionnaire for Adults.”104
Acute Service Use. This is defined as an admission to a medical or psychiatric emergency room or to a medical or psychiatric hospital or to a detoxification facility.
Brief review and suggested item(s). The CMS Adult Core Set includes “plan all cause readmissions” as a key quality metric.55 Hospital readmissions are also endorsed by the National Committee on Quality Assurance as one of its Health Effectiveness Data and Information Set (HEDIS) measures and by the National Quality Forum. Readmissions, despite their widespread endorsement, are a somewhat controversial measure. Although readmissions are costly to the health care system,136 the relationship between readmissions and quality is inconsistent. For example, Krumholz and colleagues137 found differential rates of readmission for the same patient discharged from 2 different hospitals, which were categorized based on previous readmission rates, suggesting that hospitals do have different levels of performance even when treating the same patient. However, other data indicate that 30-day, all-cause, risk-standardized readmission rates are not associated with hospital 30-day, all-cause, risk-standardized mortality rates.138
Chin and colleague found that readmissions to the hospital that occurred more than 7 days post-discharge were likely due to community- and household-related factors, rather than hospital-related quality factors.139 Transitional care interventions that have successfully reduced 30-day readmission rates are most often multicomponent and focus not just on hospital-based interventions (eg, discharge planning, education) but on follow-up care in the community by formal supports (eg, in-home visits, telephone calls, outpatient clinic appointments, case management) and informal supports (eg, family and friends).140-143 Further, qualitative evidence suggests that some individuals perceive psychiatric hospitalizations to be the result of insufficient resources or unsuccessful attempts to maintain their stability in the community.144 Thus, unplanned or avoidable hospital readmissions may represent a failure of the continuum of care not only from the perspective of the health care system, but from the patient perspective as well.
Frequent or nonurgent use of EDs is conceptually similar to excessive or avoidable inpatient utilization in several ways. For example, overuse of EDs is costly, with some estimates suggesting that it is responsible for up to $38 billion in wasteful spending each year.145 Individuals with frequent ED visits have a greater disease burden146 and an increased risk of mortality compared to nonfrequent users.147 Research suggests that individuals who visit the ED for non-urgent issues do so because of perceived difficulties associated with accessing primary care, and the convenience of EDs relative to primary care.148-150 Moreover, similar to the hospital readmission literature discussed earlier, successful strategies to reduce high rates of ED utilization generally focus on continuum of care interventions, such as provision of case management services.151-155
This evidence implies that frequent ED utilization and hospital readmissions may not be a fundamental issue of quality (or lack thereof) in hospitals or EDs but rather a lack of, or ineffectual, transitional and continuum of care strategies and services. To underscore this point, some authors have argued that a system that is excessively crisis-oriented hinders recovery because it is reactive rather than proactive, predicated on the notion that one’s condition must deteriorate to receive care.156
Although some organizations may have access to claims data or may function as self-contained health systems (eg, the Veterans Health Administration [VHA] ), others may not have access to such data. In the absence of claims data, patient self-report of service utilization has been used as a proxy for actual agency records.157 Although concordance between medical and/or agency records and patient self-report has been variable,157 evidence generally suggests that rates of agreement are higher the shorter the recall time interval.158,159 BHD does not have access to comprehensive claims data and has therefore chosen to use 5 dichotomously scored (yes/no) questions—related to medical inpatient, medical ED, psychiatric inpatient, psychiatric ED, and detoxification use in the last 30 days—to represent the CD of acute service utilization.
The Second Aim: Quality of Care
Safety
Safety is defined as avoiding injuries to patients from the care that is intended to help them.
Brief review and suggested item(s). As noted in “Crossing the Quality Chasm,” the IOM’s seminal document, “the health care environment should be safe for all patients, in all of its processes, all the time.”160 The landmark Harvard Medical Practice Study in 1991 found that adverse events occurred in nearly 4% of all hospital admissions and, among these, over a quarter were due to negligence.161 Other estimates of adverse events range as high as 17%.162 Indeed, a recent article by Makary and Daniel estimated that medical errors may be the third leading cause of death in the United States.163 Unfortunately, research on safety in the mental health field has lagged behind that of physical health,164 with evidence indicating that research in nonhospital settings in mental health care may be particularly scarce.165 In a study of adverse events that occurred in psychiatric inpatient units in the VHA system between 2015 and 2016, Mills and colleagues found that of the 87 root cause analysis reports, suicide attempts were the most frequent, and, among safety events, falls were the most frequently reported, followed by medication events.166 Another report on data collected from psychiatric inpatient units in the VHA revealed that nearly one-fifth of patients experienced a safety event, over half of which were deemed preventable.167 These numbers likely represent an underestimation of the true volume of safety events, as another study by the same research group found that less than 40% of safety events described in patient medical records were documented in the incident reporting system.168 BHD will utilize the total number of complaints and incident reports submitted within a given time frame as its “safety” metric in the CD data set.
Wait Time for Service
The CD is defined as the length of time between the date a patient first contacted BHD for services and the date of their first clinical service.
Brief review and suggested item(s). “Timeliness” was listed among the 6 aims for improvement in “Crossing the Quality Chasm” in 2001, and it remains no less relevant today.160 For example, evidence indicates that access to primary care is inversely related to avoidable hospitalizations.169 One study found that, of patients hospitalized for cardiovascular problems, those who had difficulty accessing routine care post discharge had higher 30-day readmission rates.170 Among VHA patients, longer wait times are associated with more avoidable hospitalizations and higher rates of mortality.171 Longer wait times appear to decrease the likelihood of attending a first appointment for individuals with substance use172,173 and mental health disorders.174 Importantly, longer wait times are associated with lower ratings of the patient experience of care, including perceptions of the quality of and satisfaction with care,175 and may be associated with worse outcomes for individuals in early intervention for psychosis treatment.176 For the purposes of the CD data set, BHD will monitor the length of time between the date a patient first contacted BHD for services and the date of their first clinical service.
Patient Satisfaction
Patient satisfaction is defined as the degree of patients’ satisfaction with the care they have received.
Brief review and suggested item(s). Research has consistently demonstrated the relationship of the patient’s experience of care to a variety of safety and clinical effectiveness measures in medical health care,177 and the therapeutic alliance is one of the most consistent predictors of outcomes in behavioral health, regardless of therapeutic modality.178 Patient satisfaction is a commonly assessed aspect of the patient experience of care. Patient satisfaction scores have been correlated with patient adherence to recommended treatment regimens, care quality, and health outcomes.179 For example, Aiken et al found that patient satisfaction with hospital care was associated with higher ratings of the quality and safety of nursing care in these hospitals.180 Increased satisfaction with inpatient care has been associated with lower 30-day readmission rates for patients with acute myocardial infarction, heart failure, and pneumonia,181 and patients with schizophrenia who reported higher treatment satisfaction also reported better quality of life.182,183 Many satisfaction survey options exist to evaluate this CD, including the Consumer Assessment of Healthcare Providers and Systems and the Client Satisfaction Questionnaire; BHD will utilize an outpatient behavioral health survey from a third-party vendor.
The Third Aim: Cost of Care
Cost of Care
This can be defined as the average cost to provide care per patient per month.
Brief review and suggested item(s). Per capita cost, or rather, the total cost of providing care to a circumscribed population divided by the total population, has been espoused as an important metric for the Triple Aim and the County Health Rankings.6,13 Indeed, between 1960 and 2016, per capita expenditures for health care have grown 70-fold, and the percent of the national gross domestic product accounted for by health expenditures has more than tripled (5.0% to 17.9%).184 One of the more common metrics deployed for assessing health care cost is the per capita per month cost, or rather, the per member per month cost of the predefined population for a given health care system.6,185,186 In fact, some authors have proposed that cost of care can be used not only to track efficient resource allocation, but can also be a proxy for a healthier population as well (ie, as health improves, individuals use fewer and less-expensive services, thus costing the system less).187 To assess this metric, BHD will calculate the total amount billed for patient care provided within BHD’s health network each month (irrespective of funding source) and then divide this sum by the number of members served each month. Although this measure does not account for care received at other health care facilities outside BHD’s provider network, nor does it include all the overhead costs associated with the care provided by BHD itself, it is consistent with the claims-based approach used or recommended by other authors.6,188
The Fourth Aim: Staff Well-being
Staff Quality of Work Life
This can be defined as the quality of the work life of health care clinicians and staff.
Brief review and suggested item(s). Some authors have suggested that the Triple Aim framework is incomplete and have proffered compelling arguments that provider well-being and the quality of work life constitutes a fourth aim.2 Provider burnout is prevalent in both medical2,189 and behavioral health care.190,191 Burnout among health care professionals has been associated with higher rates of perceived medical errors,192 lower patient satisfaction scores,189,193 lower rates of provider empathy,194 more negative attitudes towards patients,195 and poorer staff mental and physical health.191
Burnout is also associated with higher rates of absenteeism, turnover intentions, and turnover.190,191,196,197 However, burnout is not the only predictor of staff turnover; for example, turnover rates are a useful proxy for staff quality of work life for several reasons.198 First, turnover is associated with substantial direct and indirect costs, including lost productivity, increased errors, and lost revenue and recruitment costs, with some turnover cost estimates as high as $17 billion for physicians and $14 billion for nurses annually.199-201 Second, research indicates that staff turnover can have a deleterious impact on implementation of evidence-based interventions.202-205 Finally, consistent with the philosophy of utilizing existing data sources for the CD measures, turnover can be relatively easily extracted from administrative data for operated or contracted programs, and its collection does not place any additional burden on staff. As a large behavioral health system that is both a provider and payer of care, BHD will therefore examine the turnover rates of its internal administrative and clinical staff as well as the turnover of staff in its contracted provider network as its measures for the Staff Quality of Work Life CD.
Clinical Implications
These metrics can be deployed at any level of the organization. Clinicians may use 1 or more of the measures to track the recovery of individual clients, or in aggregate for their entire caseload. Similarly, managers can use these measures to assess the overall effectiveness of the programs for which they are responsible. Executive leaders can evaluate the impact of several programs or the system of care on the health of a subpopulation of clients with a specific condition, or for all their enrolled members. Further, not all measures need be utilized for every dashboard or evaluative effort. The benefit of a comprehensive set of measures lies in their flexibility—1 or more of the measures may be selected depending on the project being implemented or the interests of the stakeholder.
It is important to note that many of the CDs (and their accompanying measures) are aligned to/consistent with social determinants of health.206,207 Evidence suggests that social determinants make substantial contributions to the overall health of individuals and populations and may even account for a greater proportion of variance in health outcomes than health care itself.208 The measures articulated here, therefore, can be used to assess whether and how effectively care provision has addressed these social determinants, as well as the relative impact their resolution may have on other health outcomes (eg, mortality, self-rated health).
These measures can also be used to stratify clients by clinical severity or degree of socioeconomic deprivation. The ability to adjust for risk has many applications in health care, particularly when organizations are attempting to implement value-based purchasing models, such as pay-for-performance contracts or other alternative payment models (population health-based payment models).209 Indeed, once fully implemented, the CDs and measures will enable BHD to more effectively build and execute different conceptual models of “value” (see references 210 and 211 for examples). We will be able to assess the progress our clients have made in care, the cost associated with that degree of improvement, the experience of those clients receiving that care, and the clinical and social variables that may influence the relative degree of improvement (or lack thereof). Thus, the CDs provide a conceptual and data-driven foundation for the Quadruple Aim and any quality initiatives that either catalyze or augment its implementation.
Conclusion
This article provides an overview of the CDs selected by BHD to help organize, focus, advance, and track its quality efforts within the framework of the Quadruple Aim. Although items aligned to each of these CDs are offered, the CDs themselves have been broadly conceptualized such that they can flexibly admit a variety of possible items and/or assessments to operationalize each CD and thus have potential applicability to other behavioral health systems, particularly public systems that have state-mandated and other data reporting requirements.
Bearing in mind the burden that growing data collection requirements can have on the provision of quality care and staff work satisfaction and burnout,10,212 the CDs (and the items selected to represent each) are designed with “strategic parsimony” in mind. Although the CDs are inclusive in that they cover care quality, cost of care, staff quality of life, and general population health, only CDs and items undergirded by a solid evidence base and high value with regards to BHD’s mission and values, as determined by key stakeholders, were selected. Moreover, BHD attempted to make use of existing data collection and reporting mandates when selecting the final pool of items to reduce the measurement burden on staff and clients. Thus, the final set of CDs and items are designed to be comprehensive yet economical.
The CDs are deeply interrelated. Although each CD may be individually viewed as a valuable metric, improvements in any 1 CD will impact the others (eg, increasing care quality should impact population health, increasing staff quality of life should impact the quality of care). Moreover, this idea of interrelatedness acknowledges the need to view health systems and the populations they serve holistically, in that improvement is not simply the degree of change in any given metric (whether individually or collectively), but rather something more entirely. The concepts of value, quality, and health are complex, multidimensional, and dynamic, and the CDs that comprise these concepts should not be considered independently from one another. The CDs (and items) offered in this article are scalable in that they can be used at different levels of an organization depending on the question or stakeholder, and can be used individually or in combination with one another. Moreover, they are adaptable to a variety of risk-adjusted program, population health, and value-based evaluation models. It is hoped that the process articulated here, and the accompanying literature review, may benefit other public or government-run health systems in their own quality journey to operationalize the Quadruple Aim by developing a set of CDs.
Corresponding author: Walter Matthew Drymalski, PhD; walter.drymalski@milwaukeecountywi.gov.
Financial disclosures: None.
1. Berwick DM, Nolan TW, Whittington J. The Triple Aim: Care, health, and cost. Health Aff (Millwood). 2008;27(3):759-769.
2. Bodenheimer T, Sinsky C. From Triple to Quadruple Aim: Care of the patient requires care of the provider. Ann Fam Med. 2014;12(6):573-576.
3. Whittington JW, Nolan K, Lewis N, Torres T. Pursuing the Triple Aim: The first 7 years. Milbank Q. 2015;93(2):263-300.
4. Hendrikx RJP, Drewes HW, Spreeuwenberg M, et al. Which Triple Aim related measures are being used to evaluate population management initiatives? An international comparative analysis. Health Policy. 2016;120(5):471-485.
5. Kassler WJ, Howerton M, Thompson A, et al. Population Health Measurement at Centers for Medicare & Medicaid Services: Bridging the gap between public health and clinical quality. Popul Health Manag. 2017;20(3):173-180.
6. Stiefel MC, Nolan K. A Guide to Measuring the Triple Aim: Population health, experience of care, and per capita cost. IHI Innovation Series white paper. Institute for Healthcare Improvement; 2012.
7. Panzer RJ, Gitomer RS, Greene WH, et al. Increasing demands for quality measurement. JAMA. 2013;310(18):1971-1980.
8. Schuster MA, Onorato SE, Meltzer DO. Measuring the cost of quality measurement: a missing link in quality strategy. JAMA. 2017;318(13):1219-1220.
9. Casalino LP, Gans D, Weber R, et al. US physician practices spend more than $15.4 billion annually to report quality measures. Health Aff (Millwood). 2016;35(3):401-406.
10. Rao SK, Kimball AB, Lehrhoff SR, et al. The impact of administrative burden on academic physicians: results of a hospital-wide physician survey. Acad Med. 2017;92(2):237-243.
11. Institute of Medicine. Vital signs: Core metrics for health and health care progress. National Academies Press; 2015.
12. Meyer GS, Nelson EC, Pryor DB, et al. More quality measures versus measuring what matters: a call for balance and parsimony: Table 1. BMJ Qual Saf. 2012;21(11):964-968.
13. County Health Rankings. Measures & data sources. County Health Rankings & Roadmaps. Accessed January 11, 2021. https://www.countyhealthrankings.org/explore-health-rankings/measures-data-sources
14. U.S. Centers for Disease Control and Prevention. Community Health Assessment for population health improvement: Resource of most frequently recommended health outcomes and determinants. Office of Surveillance, Epidemiology, and Laboratory Services; 2013.
15. Chang C-K, Hayes RD, Perera G, et al. Life expectancy at birth for people with serious mental illness and other major disorders from a secondary mental health care case register in London. PLoS One. 2011;6(5):e19590.
16. De Hert M, Correll CU, Bobes J, et al. Physical illness in patients with severe mental disorders. I. Prevalence, impact of medications and disparities in health care. World Psychiatry. 2011;10(1):52-77.
17. Druss BG, Zhao L, Von Esenwein S, Morrato EH, Marcus SC. Understanding excess mortality in persons with mental illness: 17-year follow up of a nationally representative US survey. Med Care. 2011;49(6):599-604.
18. National Association of State Mental Health Program Directors, (NASMHPD) Medical Directors Council. Morbidity and mortality in people with serious mental illness. National Association of State Mental Health Program Directors, (NASMHPD) Medical Directors Council; 2006.
19. Nordentoft M, Wahlbeck K, Hällgren J, et al. Excess mortality, causes of death and life expectancy in 270,770 patients with recent onset of mental disorders in Denmark, Finland and Sweden. PLoS One. 2013;8(1):e55176.
20. Griswold MG, Fullman N, Hawley C, et al. Alcohol use and burden for 195 countries and territories, 1990–2016: a systematic analysis for the Global Burden of Disease Study 2016. Lancet. 2018;392(10152):1015-1035.
21. Walker ER, Druss BG. A public health perspective on mental and medical comorbidity. JAMA. 2016;316(10):1104-1105.
22. DeSalvo KB, Bloser N, Reynolds K, et al. Mortality prediction with a single general self-rated health question: a meta-analysis. J Gen Intern Med. 2005;21(3):267-275.
23. Mavaddat N, Parker RA, Sanderson S, et al. Relationship of self-rated health with fatal and non-fatal outcomes in cardiovascular disease: a systematic review and meta-analysis. PLoS One. 2014;9(7):e103509.
24. Lima-Costa MF, Cesar CC, Chor D, Proietti FA. Self-rated health compared with objectively measured health status as a tool for mortality risk screening in older adults: 10-year follow-up of the Bambui Cohort Study of Aging. Am J Epidemiol. 2012;175(3):228-235.
25. Stenholm S, Pentti J, Kawachi I, et al. Self-rated health in the last 12 years of life compared to matched surviving controls: the Health and Retirement Study. PLoS One. 2014;9(9):e107879.
26. Lee Y. The predictive value of self-assessed general, physical, and mental health on functional decline and mortality in older adults. J Epidemiol Community Health. 2000;54(2):123-129.
27. Tomioka K, Kurumatani N, Hosoi H. Self-rated health predicts decline in instrumental activities of daily living among high-functioning community-dwelling older people. Age Ageing. 2017;46(2):265-270.
28. DeSalvo KB, Jones TM, Peabody J, et al. Health care expenditure prediction with a single item, self-rated health measure. Med Care. 2009;47(4):440-447.
29. Farkas J, Kosnik M, Flezar M, Suskovic S, Lainscak M. Self-rated health predicts acute exacerbations and hospitalizations in patients with COPD. Chest. 2010;138(2):323-330.
30. Whiteford HA, Degenhardt L, Rehm J, et al. Global burden of disease attributable to mental and substance use disorders: findings from the Global Burden of Disease Study 2010. Lancet. 2013;382(9904):1575-1586.
31. Park M, Katon WJ, Wolf FM. Depression and risk of mortality in individuals with diabetes: a meta-analysis and systematic review. Gen Hosp Psychiatry. 2013;35(3):217-225.
32. Hare DL, Toukhsati SR, Johansson P, Jaarsma T. Depression and cardiovascular disease: a clinical review. Eur Heart J. 2014;35(21):1365-1372.
33. Cuijpers P, Schoevers RA. Increased mortality in depressive disorders: a review. Curr Psychiatry Rep. 2004;6(6):430-437.
34. Jansen L, van Schijndel M, van Waarde J, van Busschbach J. Health-economic outcomes in hospital patients with medical-psychiatric comorbidity: a systematic review and meta-analysis. PLoS One. 2018;13(3):e0194029.
35. Ahmad F, Jhajj AK, Stewart DE, et al. Single item measures of self-rated mental health: a scoping review. BMC Health Serv Res. 2014;14:398.
36. McAlpine DD, McCreedy E, Alang S. The meaning and predictive value of self-rated mental health among persons with a mental health problem. J Health Soc Behav. 2018;59(2):200-214.
37. Levinson D, Kaplan G. What does self-rated mental health represent? J Public Health Res. 2014;3(3):287.
38. Leamy M, Bird V, Boutillier CL, et al. Conceptual framework for personal recovery in mental health: systematic review and narrative synthesis. Br J Psychiatry. 2011;199(6):445-452.
39. Smith KW, Avis NE, Assmann SF. Distinguishing between quality of life and health status in quality of life research: a meta-analysis. Qual Life Res. 1999;8(5):447-459.
40. Hamming JF, De Vries J. Measuring quality of life. Br J Surg. 2007;94(8):923-924.
41. Singh JA, Satele D, Pattabasavaiah S, et al. Normative data and clinically significant effect sizes for single-item numerical linear analogue self-assessment (LASA) scales. Health Qual Life Outcomes. 2014;12(1):187.
42. Siebens HC, Tsukerman D, Adkins RH, et al. Correlates of a single-item quality-of-life measure in people aging with disabilities. Am J Phys Med Rehabil. 2015;94(12):1065-1074.
43. Yohannes AM, Dodd M, Morris J, Webb K. Reliability and validity of a single item measure of quality of life scale for adult patients with cystic fibrosis. Health Qual Life Outcomes. 2011;9(1):105.
44. Conway L, Widjaja E, Smith ML. Single-item measure for assessing quality of life in children with drug-resistant epilepsy. Epilepsia Open. 2018;3(1):46-54.
45. Skevington SM, Lofty M, O’Connell KA. The World Health Organization’s WHOQOL-BREF quality of life assessment: psychometric properties and results of the international field trial. Qual Life Res. 2004;13:299-310.
46. Atroszko PA, Baginska P, Mokosinska M, et al. Validity and reliability of single-item self-report measures of general quality of life, general health and sleep quality. In: CER Comparative European Research Conference: Research Track. Vol 2. Sciemcee Publishing; 2015:207-211.
47. Beaulieu S, Saury S, Sareen J, et al.
48. Marconi A, Di Forti M, Lewis CM, et al. Meta-analysis of the association between the level of cannabis use and risk of psychosis. Schizophr Bull. 2016;42(5):1262-1269.
49. Baker AL, Hiles SA, Thornton LK, et al. A systematic review of psychological interventions for excessive alcohol consumption among people with psychotic disorders. Acta Psychiatr Scand. 2012;126(4):243-255.
50. Baker AL, Hides L, Lubman DI. Treatment of cannabis use among people with psychotic or depressive disorders: a systematic review. J Clin Psychiatry. 2010;71(3):247-254.
51. Berenz EC, Coffey SF. Treatment of co-occurring posttraumatic stress disorder and substance use disorders. Curr Psychiatry Rep. 2012;14(5):469-477.
52. Pickard H, Fazel S. Substance abuse as a risk factor for violence in mental illness: some implications for forensic psychiatric practice and clinical ethics. Curr Opin Psychiatry. 2013;26(4):349-354.
53. Fazel S, Gulati G, Linsell L, Geddes JR, Grann M. Schizophrenia and violence: systematic review and meta-analysis. PLoS Med. 2009;6(8):e1000120.
54. Van Dorn R, Volavka J, Johnson N. Mental disorder and violence: Is there a relationship beyond substance use? Soc Psychiatry Psychiatr Epidemiol. 2012;47(3):487-503.
55. Centers for Medicare & Medicaid Services. 2019 Core set of adult health care quality measures for Medicaid (adult core set). Adult health care quality measures. Accessed January 11, 2021. https://www.medicaid.gov/medicaid/quality-of-care/performance-measurement/adult-core-set/index.html.
56. Jha P, Peto R. Global effects of smoking, of quitting, and of taxing tobacco. N Engl J Med. 2014;370(1):60-68.
57. Lê Cook B, Wayne GF, Kafali EN, et al. Trends in smoking among adults with mental illness and association between mental health treatment and smoking cessation. JAMA. 2014;311(2):172-182.
58. Smith PH, Mazure CM, McKee SA. Smoking and mental illness in the US population. Tob Control. 2014;23(0):e147-e153.
59. Taylor G, McNeill A, Girling A, et al. Change in mental health after smoking cessation: systematic review and meta-analysis. BMJ. 2014;348:g1151.
60. McNeely J, Cleland CM, Strauss SM, et al. Validation of self-administered single-item screening questions (SISQs) for unhealthy alcohol and drug use in primary care patients. J Gen Intern Med. 2015;30(12):1757-1764.
61. Saitz R, Cheng DM, Allensworth-Davies D, et al. The ability of single screening questions for unhealthy alcohol and other drug use to identify substance dependence in primary care. J Stud Alcohol Drugs. 2014;75(1):153-157.
62. Smith PC, Schmidt SM, Allensworth-Davies D, Saitz R. Primary care validation of a single-question alcohol screening test. J Gen Intern Med. 2009;24(7):783-788.
63. Dawson DA, Compton WM, Grant BF. Frequency of 5+/4+ drinks as a screener for drug use and drug-use disorders. J Stud Alcohol Drugs. 2010;71(5):751-760.
64. Smith PC, Schmidt SM, Allensworth-Davies D, Saitz R. A single-question screening test for drug use in primary care. Arch Intern Med. 2010;170(13):1155-1160.
65. McNeely J, Strauss SM, Saitz R, et al. A brief patient self-administered substance use screening tool for primary care: two-site validation study of the Substance Use Brief Screen (SUBS). Am J Med. 2015;128(7):784.e9-784.e19.
66. McNeely J, Wu L-T, Subramaniam G, et al. Performance of the Tobacco, Alcohol, Prescription medication, and other Substance use (TAPS) tool for substance use screening in primary care patients. Ann Intern Med. 2016;165(10):690-699.
67. Gryczynski J, McNeely J, Wu L-T, et al. Validation of the TAPS-1: a four-item screening tool to identify unhealthy substance use in primary care. J Gen Intern Med. 2017;32(9):990-996.
68. Roelfs DJ, Shor E, Davidson KW, Schwartz JE. Losing life and livelihood: a systematic review and meta-analysis of unemployment and all-cause mortality. Soc Sci Med. 2011;72(6):840-854.
69. McKee-Ryan F, Song Z, Wanberg CR, Kinicki AJ. Psychological and physical well-being during unemployment: a meta-analytic study. J Appl Psychol. 2005;90(1):53-76.
70. Zhang S, Bhavsar V. Unemployment as a risk factor for mental illness: combining social and psychiatric literature. Adv Appl Sociol. 2013;03(02):131-136.
71. Goodman N. The impact of employment on the health status and health care costs of working-age people with disabilities. The Lead Center. November 2015. Accessed January 11, 2021. http://www.leadcenter.org/system/files/resource/downloadable_version/impact_of_employment_health_status_health_care_costs_0.pdf
72. Hergenrather KC, Zeglin RJ, McGuire-Kuletz M, Rhodes SD. Employment as a social determinant of health: a systematic review of longitudinal studies exploring the relationship between employment status and physical health. Rehabil Res Policy Educ. 2015;29(1):2-26.
73. Walton MT, Hall MT. The effects of employment interventions on addiction treatment outcomes: a review of the literature. J Soc Work Pract Addict. 2016;16(4):358-384.
74. Schuring M, Robroek SJ, Burdorf A. The benefits of paid employment among persons with common mental health problems: evidence for the selection and causation mechanism. Scand J Work Environ Health. 2017;43(6):540-549.
75. Burns T, Catty J, White S, et al. The impact of supported employment and working on clinical and social functioning: results of an international study of individual placement and support. Schizophr Bull. 2009;35(5):949-958.
76. Kilian R, Lauber C, Kalkan R, et al. The relationships between employment, clinical status, and psychiatric hospitalisation in patients with schizophrenia receiving either IPS or a conventional vocational rehabilitation programme. Soc Psychiatry Psychiatr Epidemiol. 2012;47(9):1381-1389.
77. Marwaha S, Johnson S. Schizophrenia and employment. Soc Psychiatry Psychiatr Epidemiol. 2004;39(5):337-349.
78. Mueser KT, Drake RE, Bond GR. Recent advances in supported employment for people with serious mental illness. Curr Opin Psychiatry. 2016;29(3):196-201.
79. Bush PW, Drake RE, Xie H, et al. The long-term impact of employment on mental health service use and costs for persons with severe mental illness. Psychiatr Serv. 2009;60(8):1024-1031.
80. Drake RE, Skinner JS, Bond GR, Goldman HH. Social security and mental illness: reducing disability with supported employment. Health Aff (Millwood). 2009;28(3):761-770.
81. Substance Abuse and Mental Health Services Administration. SAMHSA’s working definition of recovery. Substance Abuse and Mental Health Services Administration. Published 2012. Accessed January 11, 2021. https://store.samhsa.gov/system/files/pep12-recdef.pdf
82. Drake RE, Whitley R. Recovery and severe mental illness: description and analysis. Can J Psychiatry. 2014;59(5):236-242.
83. Wisconsin Department of Health Services. PPS Mental Health Module Handbook. Published 2018. Accessed January 11, 2021. https://www.dhs.wisconsin.gov/publications/p02182.pdf
84. Robert Wood Johnson Foundation. Housing and Health. How does housing affect health? May 1, 2011. Accessed January 11, 2021. https://www.rwjf.org/en/library/research/2011/05/housing-and-health.html
85. Cunningham MK, MacDonald G. Housing as a platform for improving education outcomes among low-income children. Urban Institute. May 2012. Accessed January 11, 2021. https://www.urban.org/sites/default/files/publication/25331/412554-Housing-as-a-Platform-for-Improving-Education-Outcomes-among-Low-Income-Children.PDF
86. Friedman D. Social impact of poor housing. ECOTEC. March 2010. Accessed January 11, 2021. https://southdevonrural.co.uk/userfiles/file/JC-JC13-Social-impact-of-poor-housing.pdf
87. Fazel S, Geddes JR, Kushel M. The health of homeless people in high-income countries: descriptive epidemiology, health consequences, and clinical and policy recommendations. Lancet Lond Engl. 2014;384(9953):1529-1540.
88. Nusselder WJ, Slockers MT, Krol L, et al. Mortality and life expectancy in homeless men and women in Rotterdam: 2001–2010. PLoS One. 2013;8(10):e73979.
89. O’Connell JJ. Premature mortality in homeless populations: a review of the literature. National Health Care for the Homeless Council. Published 2005. Accessed April 23, 2019. http://sbdww.org/wp-content/uploads/2011/04/PrematureMortalityFinal.pdf
90. Hwang SW, Wilkins R, Tjepkema M, et al. Mortality among residents of shelters, rooming houses, and hotels in Canada: 11 year follow-up study. BMJ. 2009;339:b4036.
91. Roncarati JS, Baggett TP, O’Connell JJ, et al. Mortality among unsheltered homeless adults in Boston, Massachusetts, 2000-2009. JAMA Intern Med. 2018;178(9):1242-1248.
92. Thomson H, Thomas S, Sellstrom E, Petticrew M. Housing improvements for health and associated socio-economic outcomes. Cochrane Database Syst Rev. 2013;(2):CD008657.
93. Fenelon A, Mayne P, Simon AE, et al. Housing assistance programs and adult health in the United States. Am J Public Health. 2017;107(4):571-578.
94. Fitzpatrick-Lewis D, Ganann R, Krishnaratne S, et al. Effectiveness of interventions to improve the health and housing status of homeless people: a rapid systematic review. BMC Public Health. 2011;11(1):638.
95. Rog DJ, Marshall T, Dougherty RH, et al. Permanent supportive housing: assessing the evidence. Psychiatr Serv. 2014;65(3):287-294.
96. Kirst M, Zerger S, Wise Harris D, et al. The promise of recovery: narratives of hope among homeless individuals with mental illness participating in a Housing First randomised controlled trial in Toronto, Canada: Table 1. BMJ Open. 2014;4(3):e004379.
97. Cohen S, Janicki-Deverts D. Can we improve our physical health by altering our social networks? Perspect Psychol Sci. 2009;4(4):375-378.
98. House JS, Landis KR, Umberson D. Social relationships and health. Science. 1988;241(4865):540-545.
99. Kawachi I, Berkman LF. Social ties and mental health. J Urban Health. 2001;78(3):458-467.
100. Schön U-K, Denhov A, Topor A. Social relationships as a decisive factor in recovering from severe mental illness. Int J Soc Psychiatry. 2009;55(4):336-347.
101. Soundy A, Stubbs B, Roskell C, et al. Identifying the facilitators and processes which influence recovery in individuals with schizophrenia: a systematic review and thematic synthesis. J Ment Health. 2015;24(2):103-110.
102. Tew J, Ramon S, Slade M, et al. Social factors and recovery from mental health difficulties: a review of the evidence. Br J Soc Work. 2012;42(3):443-460.
103. Moos RH. Theory-based processes that promote the remission of substance use disorders. Clin Psychol Rev. 2007;27(5):537-551.
104. Stiefel MC, Riley CL, Roy B, et al. 100 Million Healthier Lives Measurement System: Progress to date. Institute for Healthcare Improvement; 2016:41. Accessed January 11, 2021. http://www.100mlives.org
105. Swanson JW, Frisman LK, Robertson AG, et al. Costs of criminal justice involvement among persons with serious mental illness in Connecticut. Psychiatr Serv. 2013;64(7):630-637.
106. Fazel S, Bains P, Doll H. Substance abuse and dependence in prisoners: a systematic review. Addiction. 2006;101(2):181-191.
107. Fazel S, Seewald K. Severe mental illness in 33 588 prisoners worldwide: systematic review and meta-regression analysis. Br J Psychiatry. 2012;200(05):364-373.
108. Fazel S, Baillargeon J. The health of prisoners. Lancet. 2011;377(9769):956-965.
109. Wildeman C, Wang EA. Mass incarceration, public health, and widening inequality in the USA. Lancet. 2017;389(10077):1464-1474.
110. Zlodre J, Fazel S. All-cause and external mortality in released prisoners: systematic review and meta-analysis. Am J Public Health. 2012;102(12):e67-e75.
111. Massoglia M, Pridemore WA. Incarceration and health. Annu Rev Sociol. 2015;41:291-310.
112. Kouyoumdjian FG, Cheng SY, Fung K, et al. The health care utilization of people in prison and after prison release: a population-based cohort study in Ontario, Canada. PLoS One. 2018;13(8):e0201592.
113. Winkelman TNA, Genao I, Wildeman C, Wang EA. Emergency department and hospital use among adolescents with justice system involvement. Pediatrics. 2017;140(5):e20171144.
114. Wildeman C. Imprisonment and infant mortality. Soc Prob. 2012;59:228-257.
115. Geller A, Cooper CE, Garfinkel I, et al. Beyond absenteeism: father incarceration and child development. Demography. 2012;49(1):49-76.
116. Turney K. Stress proliferation across generations? Examining the relationship between parental incarceration and childhood health. J Health Soc Behav. 2014;55(3):302-319.
117. Geller A, Garfinkel I, Western B. Paternal incarceration and support for children in fragile families. Demography. 2011;48(1):25-47.
118. Lee H, Wildeman C, Wang EA, et al. A heavy burden: the cardiovascular health consequences of having a family member incarcerated. Am J Public Health. 2014;104(3):421-427.
119. Western B. The impact of incarceration on wage mobility and inequality. Am Sociol Rev. 2002;67(4):526-546.
120. Constantine R, Andel R, Petrila J, et al. Characteristics and experiences of adults with a serious mental illness who were involved in the criminal justice system. Psychiatr Serv. 2010;61(5):451-457.
121. Garnick DW, Horgan CM, Acevedo A, et al. Criminal justice outcomes after engagement in outpatient substance abuse treatment. J Subst Abuse Treat. 2014;46(3):295-305.
122. Adler NE, Ostrove JM. Socioeconomic status and health: what we know and what we don’t. Ann N Y Acad Sci. 1999;896(1):3-15.
123. Luo Y, Waite LJ. The impact of childhood and adult SES on physical, mental, and cognitive well-being in later life. J Gerontol Ser B. 2005;60(2):S93-S101.
124. Mackenbach JP, Stirbu I, Roskam A-JR, et al. Socioeconomic inequalities in health in 22 European countries. N Engl J Med. 2008;358(23):2468-2481.
125. Hudson CG. Socioeconomic status and mental illness: tests of the social causation and selection hypotheses. Am J Orthopsychiatry. 2005;75(1):3-18.
126. McLaughlin KA, Breslau J, Green JG, et al. Childhood socio-economic status and the onset, persistence, and severity of DSM-IV mental disorders in a US national sample. Soc Sci Med. 2011;73(7):1088-1096.
127. Muntaner C. Socioeconomic position and major mental disorders. Epidemiol Rev. 2004;26(1):53-62.
128. Präg P, Mills MC, Wittek R. Subjective socioeconomic status and health in cross-national comparison. Soc Sci Med. 2016;149:84-92.
129. Shaked D, Williams M, Evans MK, Zonderman AB. Indicators of subjective social status: differential associations across race and sex. SSM Popul Health. 2016;2:700-707.
130. Singh-Manoux A, Adler NE, Marmot MG. Subjective social status: its determinants and its association with measures of ill-health in the Whitehall II study. Soc Sci Med. 2003;56(6):1321-1333.
131. Adler NE, Epel ES, Castellazzo G, Ickovics JR. Relationship of subjective and objective social status with psychological and physiological functioning: preliminary data in healthy, white women. Health Psychol. 2000;19(6):586-592.
132. Cundiff JM, Matthews KA. Is subjective social status a unique correlate of physical health? A meta-analysis. Health Psychol. 2017;36(12):1109-1125.
133. Demakakos P, Biddulph JP, de Oliveira C, et al. Subjective social status and mortality: The English Longitudinal Study of Ageing. Eur J Epidemiol. 2018;33(8):729-739.
134. Quon EC, McGrath JJ. Subjective socioeconomic status and adolescent health: a meta-analysis. Health Psychol. 2014;33(5):433-447.
135. Scott KM, Al-Hamzawi AO, Andrade LH, et al. Associations between subjective social status and DSM-IV mental disorders: Results from the World Mental Health Surveys. JAMA Psychiatry. 2014;71(12):1400-1408.
136. Jencks SF, Williams MV, Coleman EA. Rehospitalizations among patients in the Medicare Fee-for-Service Program. N Engl J Med. 2009;360(14):1418-1428.
137. Krumholz HM, Wang K, Lin Z, et al. Hospital-readmission risk—Isolating hospital effects from patient effects. N Engl J Med. 2017;377(11):1055-1064.
138. Krumholz HM, Lin Z, Keenan PS, et al. Relationship of hospital performance with readmission and mortality rates for patients hospitalized with acute myocardial infarction, heart failure, or pneumonia. JAMA. 2013;309(6):587-593.
139. Chin DL, Bang H, Manickam RN, Romano PS. Rethinking thirty-day hospital readmissions: Shorter intervals might be better indicators of quality of care. Health Aff (Millwood). 2016;35(10):1867-1875.
140. Feltner C, Jones CD, Cené CW, et al. Transitional care interventions to prevent readmissions for persons with heart failure: a systematic review and meta-analysis. Ann Intern Med. 2014;160(11):774-784.
141. Hudon C, Chouinard M-C, Lambert M, et al. Effectiveness of case management interventions for frequent users of healthcare services: a scoping review. BMJ Open. 2016;6(9):e012353.
142. Kripalani S, Theobald CN, Anctil B, Vasilevskis EE. Reducing hospital readmission: current strategies and future directions. Annu Rev Med. 2014;65:471-485.
143. Verhaegh KJ, MacNeil-Vroomen JL, Eslami S, et al. Transitional care interventions prevent hospital readmissions for adults with chronic illnesses. Health Aff (Millwood). 2014;33(9):1531-1539.
144. Duhig M, Gunasekara I, Patterson S. Understanding readmission to psychiatric hospital in Australia from the service users’ perspective: a qualitative study. Health Soc Care Community. 2017;25(1):75-82.
145. New England Healthcare Institute. A matter of urgency: Reducing emergency department overuse. Published 2010. Accessed January 11, 2021. https://www.nehi.net/writable/publication_files/file/nehi_ed_overuse_issue_brief_032610finaledits.pdf
146. Billings J, Raven MC. Dispelling an urban legend: Frequent emergency department users have substantial burden of disease. Health Aff (Millwood). 2013;32(12):2099-2108.
147. Moe J, Kirkland S, Ospina MB, et al. Mortality, admission rates and outpatient use among frequent users of emergency departments: a systematic review. Emerg Med J. 2016;33(3):230-236.
148. Carret MLV, Fassa ACG, Domingues MR. Inappropriate use of emergency services: a systematic review of prevalence and associated factors. Cad Saúde Pública. 2009;25(1):7-28.
149. Durand A-C, Palazzolo S, Tanti-Hardouin N, et al. Nonurgent patients in emergency departments: rational or irresponsible consumers? Perceptions of professionals and patients. BMC Res Notes. 2012;5(1):525.
150. Uscher-Pines L, Pines J, Kellermann A, et al. Deciding to visit the emergency department for non-urgent conditions: a systematic review of the literature. Am J Manag Care. 2013;19(1):47-59.
151. Kumar GS, Klein R. Effectiveness of case management strategies in reducing emergency department visits in frequent user patient populations: a systematic review. J Emerg Med. 2013;44(3):717-729.
152. Moe J, Kirkland SW, Rawe E, et al. Effectiveness of interventions to decrease emergency department visits by adult frequent users: a systematic review. Acad Emerg Med. 2017;24(1):40-52.
153. Raven MC, Kushel M, Ko MJ, et al. The effectiveness of emergency department visit reduction programs: a systematic review. Ann Emerg Med. 2016;68(4):467-483.e15.
154. Soril LJJ, Leggett LE, Lorenzetti DL, et al. Reducing frequent visits to the emergency department: a systematic review of interventions. PLoS One. 2015;10(4):e0123660.
155. Van den Heede K, Van de Voorde C. Interventions to reduce emergency department utilisation: a review of reviews. Health Policy. 2016;120(12):1337-1349.
156. Onken SJ, Dumont JM, Ridgway P, et al. Mental health recovery: What helps and what hinders? October 2002. Accessed January 11, 2021. https://www.nasmhpd.org/sites/default/files//MHSIPReport%281%29.pdf
157. Leggett LE, Khadaroo RG, Holroyd-Leduc J, et al. Measuring resource utilization. Medicine (Baltimore). 2016;95(10):e2759.
158. Bhandari A, Wagner T. Self-reported utilization of health care services: improving measurement and accuracy. Med Care Res Rev. 2006;63(2):217-235.
159. Short ME, Goetzel RZ, Pei X, et al. How accurate are self-reports? An analysis of self-reported healthcare utilization and absence when compared to administrative data. J Occup Environ Med. 2009;51(7):786-796.
160. Institute of Medicine. Crossing the Quality Chasm: A New Health System for the 21st Century. National Academies Press; 2001.
161. Brennan TA, Leape LL, Laird NM, et al. Incidence of adverse events and negligence in hospitalized patients. Results of the Harvard Medical Practice Study I. N Engl J Med. 1991;324(6):370-376.
162. Rafter N, Hickey A, Condell S, et al. Adverse events in healthcare: learning from mistakes. QJM. 2015;108(4):273-277.
163. Makary MA, Daniel M. Medical error—the third leading cause of death in the US. BMJ. 2016;3(353):i2139.
164. D’Lima D, Crawford MJ, Darzi A, Archer S. Patient safety and quality of care in mental health: A world of its own? BJPsych Bull. 2017;41(5):241-243.
165. Maidment ID, Lelliott P, Paton C. Medication errors in mental healthcare: a systematic review. Qual Saf Health Care. 2006;15(6):409-413.
166. Mills PD, Watts BV, Shiner B, Hemphill RR. Adverse events occurring on mental health units. Gen Hosp Psychiatry. 2018;50:63-68.
167. Marcus SC, Hermann RC, Frankel MR, Cullen SW. Safety of psychiatric inpatients at the Veterans Health Administration. Psychiatr Serv. 2017;69(2):204-210.
168. Reilly CA, Cullen SW, Watts BV, et al. How well do incident reporting systems work on inpatient psychiatric units? Jt Comm J Qual Patient Saf. 2019;45:63-69.
169. Rosano A, Loha CA, Falvo R, et al. The relationship between avoidable hospitalization and accessibility to primary care: a systematic review. Eur J Public Health. 2013;23(3):356-360.
170. Dupre ME, Xu H, Granger BB, et al. Access to routine care and risks for 30-day readmission in patients with cardiovascular disease. Am Heart J. 2018;196:9-17.
171. Pizer SD, Prentice JC. What are the consequences of waiting for health care in the veteran population? J Gen Intern Med. 2011;26(S2):676-682.
172. Festinger DS, Lamb RJ, Kirby KC, Marlowe DB. The accelerated intake: a method for increasing initial attendance to outpatient cocaine treatment. J Appl Behav Anal. 1996;29(3):387-389.
173. Festinger DS, Lamb RJ, Marlowe DB, Kirby KC. From telephone to office: intake attendance as a function of appointment delay. Addict Behav. 2002;27(1):131-137.
174. Gallucci G, Swartz W, Hackerman F. Brief reports: Impact of the wait for an initial appointment on the rate of kept appointments at a mental health center. Psychiatr Serv. 2005;56(3):344-346.
175. Bleustein C, Rothschild DB, Valen A, et al. Wait times, patient satisfaction scores, and the perception of care. Am J Manag Care. 2014;20(5):393-400.
176. Reichert A, Jacobs R. The impact of waiting time on patient outcomes: Evidence from early intervention in psychosis services in England. Health Econ. 2018;27(11):1772-1787.
177. Doyle C, Lennox L, Bell D. A systematic review of evidence on the links between patient experience and clinical safety and effectiveness. BMJ Open. 2013;3(1):e001570.
178. Horvath AO, Del Re AC, Flückiger C, Symonds D. Alliance in individual psychotherapy. Psychotherapy. 2011;48(1):9-16.
179. Farley H, Enguidanos ER, Coletti CM, et al. Patient satisfaction surveys and quality of care: an information paper. Ann Emerg Med. 2014;64(4):351-357.
180. Aiken LH, Sermeus W, Van den Heede K, et al. Patient safety, satisfaction, and quality of hospital care: cross sectional surveys of nurses and patients in 12 countries in Europe and the United States. BMJ. 2012;344:e1717.
181. Boulding W, Glickman SW, Manary MP, Schulman KA, Staelin R. Relationship between patient satisfaction with inpatient care and hospital readmission within 30 days. Am J Manag Care. 2011;17(1):41-48.
182. Rohland BM, Langbehn DR, Rohrer JE. Relationship between service effectiveness and satisfaction among persons receiving Medicaid mental health services. Psychiatr Serv. 2000;51(2):248-250.
183. Zendjidjian X-Y, Baumstarck K, Auquier P, et al. Satisfaction of hospitalized psychiatry patients: Why should clinicians care? Patient Prefer Adherence. 2014;8:575-583.
184. Centers for Medicare & Medicaid Services. National health expenditures; aggregate and per capita amounts, annual percent change and percent distribution: Calendar years 1960-2016. National Health Expenditure Data. https://www.cms.gov/research-statistics-data-and-systems/statistics-trends-and-reports/nationalhealthexpenddata/nationalhealthaccountshistorical.html. Published 2018. Accessed August 21, 2018.
185. DuBard CA. Running the numbers. N C Med J. 2016;77(4):297-300.
186. Peikes D, Chen A, Schore J, Brown R. Effects of care coordination on hospitalization, quality of care, and health care expenditures among Medicare beneficiaries: 15 randomized trials. JAMA. 2009;301(6):603-618.
187. Seow H-Y, Sibley LM. Developing a dashboard to help measure and achieve the triple aim: A population-based cohort study. BMC Health Serv Res. 2014;14(1):363.
188. Lee VS, Kawamoto K, Hess R, et al. Implementation of a value-driven outcomes program to identify high variability in clinical costs and outcomes and association with reduced cost and improved quality. JAMA. 2016;316(10):1061.
189. Dyrbye LN, Shanafelt TD, Sinsky CA, et al. Burnout among health care professionals: A call to explore and address this underrecognized threat to safe, high-quality care discussion paper. National Academy of Medicine. July 5, 2017. Accessed January 11, 2021. https://nam.edu/burnout-among-health-care-professionals-a-call-to-explore-and-address-this-underrecognized-threat-to-safe-high-quality-care/
190. Johnson J, Hall LH, Berzins K, et al. Mental healthcare staff well-being and burnout: a narrative review of trends, causes, implications, and recommendations for future interventions. Int J Ment Health Nurs. 2018;27(1):20-32.
191. Morse G, Salyers MP, Rollins AL, et al. Burnout in mental health services: a review of the problem and its remediation. Adm Policy Ment Health. 2012;39(5):341-352.
192. Hall LH, Johnson J, Watt I, et al. Healthcare staff wellbeing, burnout, and patient safety: a systematic review. PLoS One. 2016;11(7):e0159015.
193. Garman AN, Corrigan PW, Morris S. Staff burnout and patient satisfaction: evidence of relationships at the care unit level. J Occup Health Psychol. 2002;7(3):235-241.
194. Wilkinson H, Whittington R, Perry L, Eames C. Examining the relationship between burnout and empathy in healthcare professionals: a systematic review. Burn Res. 2017;6:18-29.
195. Holmqvist R, Jeanneau M. Burnout and psychiatric staff’s feelings towards patients. Psychiatry Res. 2006;145(2-3):207-213.
196. Leiter MP, Maslach C. Nurse turnover: the mediating role of burnout. J Nurs Manag. 2009;17(3):331-339.
197. Zhang Y, Feng X. The relationship between job satisfaction, burnout, and turnover intention among physicians from urban state-owned medical institutions in Hubei, China: a cross-sectional study. BMC Health Serv Res. 2011;11(1):235.
198. Halter M, Boiko O, Pelone F, et al. The determinants and consequences of adult nursing staff turnover: a systematic review of systematic reviews. BMC Health Serv Res. 2017;17(1):824.
199. Hamidi MS, Bohman B, Sandborg C, et al. Estimating institutional physician turnover attributable to self-reported burnout and associated financial burden: a case study. BMC Health Serv Res. 2018;18(1):851.
200. National Taskforce for Humanity in Healthcare. The business case for humanity in healthcare position paper. April 2018. Accessed January 11, 2021. https://www.vocera.com/public/pdf/NTHBusinessCase_final003.pdf
201. Waldman JD, Kelly F, Arora S, Smith HL. The shocking cost of turnover in health care. Health Care Manage Rev. 2004;29(1):2-7.
202. Brunette MF, Asher D, Whitley R, et al. Implementation of integrated dual disorders treatment: a qualitative analysis of facilitators and barriers. Psychiatr Serv. 2008;59(9):989-995.
203. Mancini AD, Moser LL, Whitley R, et al. Assertive community treatment: facilitators and barriers to implementation in routine mental health settings. Psychiatr Serv. 2009;60(2):189-195.
204. Rollins AL, Salyers MP, Tsai J, Lydick JM. Staff turnover in statewide implementation of ACT: Relationship with ACT fidelity and other team characteristics. Adm Policy Ment Health. 2010;37(5):417-426.
205. Woltmann EM, Whitley R, McHugo GJ, et al. The role of staff turnover in the implementation of evidence-based practices in mental health care. Psychiatr Serv. 2008;59(7):732-737.
206. Alegría M, NeMoyer A, Falgàs Bagué I, et al. Social determinants of mental health: Where we are and where we need to go. Curr Psychiatry Rep. 2018;20(11):95.
207. Daniel H, Bornstein SS, Kane GC. Addressing social determinants to improve patient care and promote health equity: an American College of Physicians position paper. Ann Intern Med. 2018;168(8):577-578.
208. Park H, Roubal AM, Jovaag A, Gennuso KP, Catlin BB. Relative contributions of a set of health factors to selected health outcomes. Am J Prev Med. 2015;49(6):961-969.
209. Ash AS, Mick EO, Ellis RP, et al. Social determinants of health in managed care payment formulas. JAMA Intern Med. 2017;177(10):1424.
210. de Beurs E, Warmerdam EH, Oudejans SCC, et al. Treatment outcome, duration, and costs: a comparison of performance indicators using data from eight mental health care providers in the Netherlands. Adm Policy Ment Health. 2018;45(2):212-223.
211. Dunbar-Rees R. Paying for what matters most: the future of outcomes-based payments in healthcare. Future Healthc J. 2018;5(2):98-102.
212. Woolhandler S, Himmelstein DU. Administrative work consumes one-sixth of U.S. physicians’ working hours and lowers their career satisfaction. Int J Health Serv. 2014;44(4):635-642.
A Preoperative Transthoracic Echocardiography Protocol to Reduce Time to Hip Fracture Surgery
From Dignity Health Methodist Hospital of Sacramento Family Medicine Residency Program, Sacramento, CA (Dr. Oldach); Nationwide Children’s Hospital, Columbus, OH (Dr. Irwin); OhioHealth Research Institute, Columbus, OH (Dr. Pershing); Department of Clinical Transformation, OhioHealth, Columbus, OH (Dr. Zigmont and Dr. Gascon); and Department of Geriatrics, OhioHealth, Columbus, OH (Dr. Skully).
Abstract
Objective: An interdisciplinary committee was formed to identify factors contributing to surgical delays in urgent hip fracture repair at an urban, level 1 trauma center, with the goal of reducing preoperative time to less than 24 hours. Surgical optimization was identified as a primary, modifiable factor, as surgeons were reluctant to clear patients for surgery without cardiac consultation. Preoperative transthoracic echocardiogram (TTE) was recommended as a safe alternative to cardiac consultation in most patients.
Methods: A retrospective review was conducted for patients who underwent urgent hip fracture repair between January 2010 and April 2014 (n = 316). Time to medical optimization, time to surgery, hospital length of stay, and anesthesia induction were compared for 3 patient groups of interest: those who received (1) neither TTE nor cardiology consultation (ie, direct to surgery); (2) a preoperative TTE; or (3) preoperative cardiac consultation.
Results: There were significant between-group differences in medical optimization time (P = 0.001) and mean time to surgery (P < 0.001) when comparing the 3 groups of interest. Patients in the preoperative cardiac consult group had the longest times, followed by the TTE and direct-to-surgery groups. There were no differences in the type of induction agent used across treatment groups when stratifying by ejection fraction.
Conclusion: Preoperative TTE allows for decreased preoperative time compared to a cardiology consultation. It provides an easily implemented inter-departmental, intra-institutional intervention to decrease preoperative time in patients presenting with hip fractures.
Keywords: surgical delay; preoperative risk stratification; process improvement.
Hip fractures are common, expensive, and associated with poor outcomes.1,2 Ample literature suggests that morbidity, mortality, and cost of care may be reduced by minimizing surgical delays.3-5 While individual reports indicate mixed evidence, in a 2010 meta-analysis, surgery within 72 hours was associated with significant reductions in pneumonia and pressure sores, as well as a 19% reduction in all-cause mortality through 1 year.6 Additional reviews suggest evidence of improved patient outcomes (pain, length of stay, non-union, and/or mortality) when surgery occurs early, within 12 to 72 hours after injury.4,6,7 Regardless of the definition of “early surgery” used, surgical delay remains a challenge, often due to organizational factors, including admission day of the week and hospital staffing, and patient characteristics, such as comorbidities, echocardiographic findings, age, and insurance status.7-9
Among factors that contribute to surgical delays, the need for preoperative cardiovascular risk stratification is significantly modifiable.10 The American College of Cardiology (ACC)/American Heart Association (AHA) Task Force risk stratification framework for preoperative cardiac testing assists clinicians in determining surgical urgency, active cardiac conditions, cardiovascular risk factors, and functional capacity of each patient, and is well established for low- or intermediate-risk patients.11 Specifically, metabolic equivalents (METs) measurements are used to identify medically stable patients with good or excellent functional capacity versus poor or unknown functional status. Patients with ≥ 4 METs may proceed to surgery without further testing; patients with < 4 METs may either proceed with planned surgery or undergo additional testing. Patients with a perceived increased risk profile who require urgent or semi-urgent hip fracture repair may be confounded by disagreement about required preoperative cardiac testing.
At OhioHealth Grant Medical Center (GMC), an urban, level 1 trauma center, the consideration of further preoperative noninvasive testing frequently contributed to surgical delays. In 2009, hip fracture patients arriving to the emergency department (ED) waited an average of 51 hours before being transferred to the operating room (OR) for surgery. Presuming prompt surgery is both desirable and feasible, the Grant Hip Fracture Management Committee (GHFMC) was developed in order to expedite surgeries in hip fracture patients. The GHFMC recommended a preoperative hip fracture protocol, and the outcomes from protocol implementation are described in this article.
Methods
This study was approved by the OhioHealth Institutional Review Board, with a waiver of the informed consent requirement. Medical records from patients treated at GMC during the time period between January 2010 and April 2014 (ie, following implementation of GHFMC recommendations) were retrospectively reviewed to identify the extent to which the use of preoperative transthoracic echocardiography (TTE) reduced average time to surgery and total length of stay, compared to cardiac consultation. This chart review included 316 participants and was used to identify primary induction agent utilized, time to medical optimization, time to surgery, and total length of hospital stay.
Intervention
The GHFMC conducted a 9-month quality improvement project to decrease ED-to-OR time to less than 24 hours for hip fracture patients. The multidisciplinary committee consisted of physicians from orthopedic surgery, anesthesia, hospital medicine, and geriatrics, along with key administrators and nurse outcomes managers. While there is lack of complete clarity surrounding optimal surgical timing, the committee decided that surgery within 24 hours would be beneficial for the majority of patients and therefore was considered a prudent goal.
Based on identified barriers that contributed to surgical delays, several process improvement strategies were implemented, including admitting patients to the hospitalist service, engaging the orthopedic trauma team, and implementing pre- and postoperative protocols and order sets (eg, ED and pain management order sets). Specific emphasis was placed on establishing guidelines for determining medical optimization. In the absence of established guidelines, medical optimization was determined at the discretion of the attending physician. The necessity of preoperative cardiac assessment was based, in part, on physician concerns about determining safe anesthesia protocols and hemodynamically managing patients who may have occult heart disease, specifically those patients with low functional capacity (< 4 METs) and/or inability to accurately communicate their medical history.
Many hip fractures result from a fall, and it may be unclear whether the fall causing a fracture was purely mechanical or indicative of a distinct acute or chronic illness. As a result, many patients received cardiac consultations, with or without pharmacologic stress testing, adding another 24 to 36 hours to preoperative time. As invasive preoperative cardiac procedures generally result in surgical delays without improving outcomes,11 the committee recommended that clinicians reserve preoperative cardiac consultation for patients with active cardiac conditions.
In lieu of cardiac consultation, the committee suggested preoperative TTE. While use of TTE has not been shown to improve preoperative risk stratification in routine noncardiac surgeries, it has been shown to provide clinically useful information in patients at high risk for cardiac complications.11 There was consensus for incorporating preoperative TTE for several reasons: (1) the patients with hip fractures were not “routine,” and often did not have a reliable medical history; (2) a large percentage of patients had cardiac risk factors; (3) patients with undiagnosed aortic stenosis, severe left ventricular dysfunction, or severe pulmonary hypertension would likely have altered intraoperative fluid management; and (4) in supplanting cardiac consultations, TTE would likely expedite patients’ ED-to-OR times. Therefore, the GHFMC created a recommendation of ordering urgent TTE for patients who were unable to exercise at ≥ 4 METs but needed urgent hip fracture surgery.
In order to evaluate the success of the new protocol, the ED-to-OR times were calculated for a cohort of patients who underwent surgery for hip fracture following algorithm implementation.
Participants
A chart review was conducted for patients admitted to GMC between January 2010 and April 2014 for operative treatment of a hip fracture. Exclusion criteria included lack of radiologist-diagnosed hip fracture, periprosthetic hip fracture, or multiple traumas. Electronic patient charts were reviewed by investigators (KI and BO) using a standardized, electronic abstraction form for 3 groups of patients who (1) proceeded directly to planned surgery without TTE or cardiac consultation (direct-to-surgery group); (2) received preoperative TTE but not a cardiac consultation (TTE-only group); or (3) received preoperative cardiac consultation (cardiac consult group).
Measures
Demographics, comorbid conditions, MET score, anesthesia protocol, and in-hospital morbidity and mortality were extracted from medical charts. Medical optimization time was determined by the latest time stamp of 1 of the following: time that the final consulting specialist stated that the patient was stable for surgery; time that the hospitalist described the patient as being ready for surgery; time that the TTE report was certified by the reading cardiologist; or time that the hospitalist described the outcome of completed preoperative risk stratification. Time elapsed prior to medical optimization, surgery, and discharge were calculated using differences between the patient’s arrival date and time at the ED, first recorded time of medical optimization, surgical start time (from the surgical report), and discharge time, respectively.
To assess whether the TTE protocol may have affected anesthesia selection, the induction agent (etomidate or propofol) was abstracted from anesthesia reports and stratified by the ejection fraction of each patient: very low (≤ 35%), low (36%–50%), or normal (> 50%). Patients without an echocardiogram report were assumed to have a normal ejection fraction for this analysis.
Analysis
Descriptive statistics were produced using mean and standard deviation (SD) for continuous variables and frequency and percentage for categorical variables. To determine whether statistically significant differences existed between the 3 groups, the Kruskal-Wallis test was used to compare skewed continuous variables, and Pearson’s chi-square test was used to compare categorical variables. Due to differences in baseline patient characteristics across the 3 treatment groups, inverse probability weights were used to adjust for group differences (using a multinomial logit treatment model) while comparing differences in outcome variables. This modeling strategy does not rely on any assumptions for the distribution of the outcome variable. Covariates were considered for inclusion in the treatment or outcome model if they were significantly associated (P < 0.05) with the group variable. Additionally, anesthetic agent (etomidate or propofol) was compared across the treatment groups after stratifying by ejection fraction to identify whether any differences existed in anesthesia regimen. Patients who were prescribed more than 1 anesthetic agent (n = 2) or an agent that was not of interest were removed from the analysis (n = 13). Stata (version 14) was used for analysis. All other missing data with respect to the tested variables were omitted in the analysis for that variable. Any disagreements about abstraction were resolved through consensus between the investigators.
Results
A total of 316 cases met inclusion criteria, including 108 direct-to-surgery patients, 143 preoperative TTE patients, and 65 cardiac consult patients. Patient demographics and preoperative characteristics are shown in Table 1. The average age for all patients was 76.5 years of age (SD, 12.89; IQR, 34-97); however, direct-to-surgery patients were significantly (P < 0.001) younger (71.2 years; SD, 14.2; interquartile range [IQR], 34-95 years) than TTE-only patients (79.0 years; SD, 11.5; IQR, 35-97 years) and cardiac consult patients (79.57 years; SD, 10.63; IQR, 49-97 years). The majority of patients were female (69.9%) and experienced a fall prior to admission (94%). Almost three-fourths of patients had 1 or more cardiac risk factors (73.7%), including history of congestive heart failure (CHF; 19%), coronary artery disease (CAD; 26.3%), chronic obstructive pulmonary disease (COPD; 19.3%), or aortic stenosis (AS; 3.5%). Due to between-group differences in these comorbid conditions, confounding factors were adjusted for in subsequent analyses.

As shown in Table 2, before adjustment for confounding factors, there were significant between-group differences in medical optimization time for patients in all 3 groups. After adjustment for treatment differences using age and number of comorbid diseases, and medical optimization time differences using age and COPD, fewer between-group differences were statistically significant. Patients who received a cardiac consult had an 18.44-hour longer medical optimization time compared to patients who went directly to surgery (29.136 vs 10.696 hours; P = 0.001). Optimization remained approximately 5 hours longer for the TTE-only group than for the direct-to-surgery group; however, this difference was not significant (P = 0.075).

When comparing differences in ED-to-OR time for the 3 groups after adjusting the probability of treatment for age and the number of comorbid conditions, and adjusting the probability of ED-to-OR time for age, COPD, and CHF, significant differences remained in ED-to-OR times across all groups. Specifically, patients in the direct-to-surgery group experienced the shortest time (mean, 20.64 hours), compared to patients in the TTE-only group (mean, 26.32; P = 0.04) or patients in the cardiac consult group (mean, 36.08; P < 0.001). TTE-only patients had a longer time of 5.68 hours, compared to the direct-to-surgery group, and patients in the preoperative cardiac consult group were on average 15.44 hours longer than the direct-to-surgery group.
When comparing differences in the length of stay for the 3 groups before statistical adjustments, differences were observed; however, after removing the confounding factors related to treatment (age and CAD) and the outcome (age and the number of comorbid conditions), there were no statistically significant differences in the length of stay for the 3 groups. Average length of stay was 131 hours for direct-to-surgery patients, 142 hours for TTE-only patients, and 141 hours for cardiac consult patients.
The use of different anesthetic agents was compared for patients in the 3 groups. The majority of patients in the study (87.7%) were given propofol, and there were no differences after stratifying by ejection fraction (Table 3).

Discussion
The GHFMC was created to reduce surgical delays for hip fracture. Medical optimization was considered a primary, modifiable factor given that surgeons were reluctant to proceed without a cardiac consult. To address this gap, the committee recommended a preoperative TTE for patients with low or unknown functional status. This threshold provides a quick and easy method for stratifying patients who previously required risk stratification by a cardiologist, which often resulted in surgery delays.
In their recommendations for implementation of hip fracture quality improvement projects, the Geriatric Fracture Center emphasizes the importance of multidisciplinary physician leadership along with standardization of approach across patients.12 This recommendation is supported by increasing evidence that orthogeriatric collaborations are associated with decreased mortality and length of stay.13 The GHFMC and subsequent interventions reflect this approach, allowing for collaboration to identify cross-disciplinary procedural barriers to care. In our institution, addressing identified procedural barriers to care was associated with a reduction in the average time to surgery from 51 hours to 25.3 hours.
Multiple approaches have been attempted to decrease presurgical time in hip fracture patients in various settings. Prehospital interventions, such as providing ambulances with checklists and ability to bypass the ED, have not been shown to decrease time to surgery for hip fracture patients, though similar strategies have been successful in other conditions, such as stroke.14,15 In-hospital procedures, such as implementation of a hip fracture protocol and reduction of preoperative interventions, have more consistently been found to decrease time to surgery and in-hospital mortality.16,17 However, reduced delays have not been found universally. Luttrell and Nana found that preoperative TTE resulted in approximately 30.8-hour delays from the ED to OR, compared to patients who did not receive a preoperative TTE.18 However, in that study hospitalists used TTE at their own discretion, and there may have been confounding factors contributing to delays. When used as part of a protocol targeting patients with poor or unknown functional capacity, we believe that preoperative TTE results in modest surgical delays yet provides clinically useful information about each patient.
ACC/AHA preoperative guidelines were updated after we implemented our intervention and now recommend that patients with poor or unknown functional capacity in whom stress testing will not influence care proceed to surgery “according to guideline-directed medical care.”11 While routine use of preoperative evaluation of left ventricular function is not recommended, assessing left ventricular function may be reasonable for patients with heart failure with a change in clinical status. Guidelines also recommend that patients with clinically suspected valvular stenosis undergo preoperative echocardiography.11
Limitations
This study has several limitations. First, due to resource limitations, a substantial period of time elapsed between implementation of the new protocol and the analysis of the data set. That is, the hip fracture protocol assessed in this paper occurred from January 2010 through April 2014, and final analysis of the data set occurred in April 2020. This limitation precludes our ability to formally assess any pre- or post-protocol changes in patient outcomes. Second, randomization was not used to create groups that were balanced in differing health characteristics (ie, patients with noncardiac-related surgeries, patients in different age groups); however, the use of inverse probability treatment regression analysis was a way to statistically address these between-group differences. Moreover, this study is limited by the factors that were measured; unmeasured factors cannot be accounted for. Third, health care providers working at the hospital during this time were aware of the goal to decrease presurgical time, possibly creating exaggerated effects compared to a blinded trial. Finally, although this intervention is likely translatable to other centers, these results represent the experiences of a single level 1 trauma center and may not be replicable elsewhere.
Conclusion
Preoperative TTE in lieu of cardiac consultation has several advantages. First, it requires interdepartmental collaboration for implementation, but can be implemented through a single hospital or hospital system. Unlike prehospital interventions, preoperative urgent TTE for patients with low functional capacity does not require the support of emergency medical technicians, ambulance services, or other hospitals in the region. Second, while costs are associated with TTE, they are offset by a reduction in expensive consultations with specialists, surgical delays, and longer lengths of stay. Third, despite likely increased ED-to-OR times compared to no intervention, urgent TTE decreases time to surgery compared with cardiology consultation. Prior to the GHFMC, the ED-to-OR time at our institution was 51 hours. In contrast, the mean time following the GHFMC-led protocol was less than half that, at 25.3 hours (SD, 19.1 hours). In fact, nearly two-thirds (65.2%) of the patients evaluated in this study underwent surgery within 24 hours of admission. This improvement in presurgical time was attributed, in part, to the implementation of preoperative TTE over cardiology consultations.
Acknowledgments: The authors thank Jenny Williams, RN, who was instrumental in obtaining the data set for analysis, and Shauna Ayres, MPH, from the OhioHealth Research Institute, who provided writing and technical assistance.
Corresponding author: Robert Skully, MD, OhioHealth Family Medicine Grant, 290 East Town St., Columbus, OH 43215; robert.skully@ohiohealth.com.
Funding: This work was supported by the OhioHealth Summer Research Externship Program.
Financial disclosures: None.
1. Brauer CA, Coca-Perraillon M, Cutler DM, Rosen AB. Incidence and mortality of hip fractures in the United States. JAMA. 2009;302:1573-1579.
2. Lewiecki EM, Wright NC, Curtis JR, et al. Hip fracture trends in the United States 2002 to 2015. Osteoporos Int. 2018;29:717-722.
3. Colais P, Di Martino M, Fusco D, et al. The effect of early surgery after hip fracture on 1-year mortality. BMC Geriatr. 2015;15:141.
4. Nyholm AM, Gromov K, Palm H, et al. Time to surgery is associated with thirty-day and ninety-day mortality after proximal femoral fracture: a retrospective observational study on prospectively collected data from the Danish Fracture Database Collaborators. J Bone Joint Surg Am. 2015;97:1333-1339.
5. Judd KT, Christianson E. Expedited operative care of hip fractures results in significantly lower cost of treatment. Iowa Orthop J. 2015;35:62-64.
6. Simunovic N, Devereaux PJ, Sprague S, et al. Effect of early surgery after hip fracture on mortality and complications: systematic review and meta-analysis. CMAJ. 2010;182:1609-1616.
7. Ryan DJ, Yoshihara H, Yoneoka D, et al. Delay in hip fracture surgery: an analysis of patient-specific and hospital-specific risk factors. J Orthop Trauma. 2015;29:343-348.
8. Ricci WM, Brandt A, McAndrew C, Gardner MJ. Factors affecting delay to surgery and length of stay for patients with hip fracture. J Orthop Trauma. 2015;29:e109-e114.
9. Hagino T, Ochiai S, Senga S, et al. Efficacy of early surgery and causes of surgical delay in patients with hip fracture. J Orthop. 2015;12:142-146.
10. Rafiq A, Sklyar E, Bella JN. Cardiac evaluation and monitoring of patients undergoing noncardiac surgery. Health Serv Insights. 2017;9:1178632916686074.
11. Fleisher LA, Fleischmann KE, Auerbach AD, et al. 2014 ACC/AHA guideline on perioperative cardiovascular evaluation and management of patients undergoing noncardiac surgery: a report of the American College of Cardiology/American Heart Association Task Force on Practice Guidelines. J Am Coll Cardiol. 2014;64:e77-e137.
12. Basu N, Natour M, Mounasamy V, Kates SL. Geriatric hip fracture management: keys to providing a successful program. Eur J Trauma Emerg Surg. 2016;42:565-569.
13. Grigoryan KV, Javedan H, Rudolph JL. Orthogeriatric care models and outcomes in hip fracture patients: a systematic review and meta-analysis. J Orthop Trauma. 2014;28:e49-e55.
14. Tai YJ, Yan B. Minimising time to treatment: targeted strategies to minimise time to thrombolysis for acute ischaemic stroke. Intern Med J. 2013;43:1176-1182.
15. Larsson G, Stromberg RU, Rogmark C, Nilsdotter A. Prehospital fast track care for patients with hip fracture: Impact on time to surgery, hospital stay, post-operative complications and mortality a randomised, controlled trial. Injury. 2016;47:881-886.
16. Bohm E, Loucks L, Wittmeier K, et al. Reduced time to surgery improves mortality and length of stay following hip fracture: results from an intervention study in a Canadian health authority. Can J Surg. 2015;58:257-263.
17. Ventura C, Trombetti S, Pioli G, et al. Impact of multidisciplinary hip fracture program on timing of surgery in elderly patients. Osteoporos Int J. 2014;25:2591-2597.
18. Luttrell K, Nana A. Effect of preoperative transthoracic echocardiogram on mortality and surgical timing in elderly adults with hip fracture. J Am Geriatr Soc. 2015;63:2505-2509.
From Dignity Health Methodist Hospital of Sacramento Family Medicine Residency Program, Sacramento, CA (Dr. Oldach); Nationwide Children’s Hospital, Columbus, OH (Dr. Irwin); OhioHealth Research Institute, Columbus, OH (Dr. Pershing); Department of Clinical Transformation, OhioHealth, Columbus, OH (Dr. Zigmont and Dr. Gascon); and Department of Geriatrics, OhioHealth, Columbus, OH (Dr. Skully).
Abstract
Objective: An interdisciplinary committee was formed to identify factors contributing to surgical delays in urgent hip fracture repair at an urban, level 1 trauma center, with the goal of reducing preoperative time to less than 24 hours. Surgical optimization was identified as a primary, modifiable factor, as surgeons were reluctant to clear patients for surgery without cardiac consultation. Preoperative transthoracic echocardiogram (TTE) was recommended as a safe alternative to cardiac consultation in most patients.
Methods: A retrospective review was conducted for patients who underwent urgent hip fracture repair between January 2010 and April 2014 (n = 316). Time to medical optimization, time to surgery, hospital length of stay, and anesthesia induction were compared for 3 patient groups of interest: those who received (1) neither TTE nor cardiology consultation (ie, direct to surgery); (2) a preoperative TTE; or (3) preoperative cardiac consultation.
Results: There were significant between-group differences in medical optimization time (P = 0.001) and mean time to surgery (P < 0.001) when comparing the 3 groups of interest. Patients in the preoperative cardiac consult group had the longest times, followed by the TTE and direct-to-surgery groups. There were no differences in the type of induction agent used across treatment groups when stratifying by ejection fraction.
Conclusion: Preoperative TTE allows for decreased preoperative time compared to a cardiology consultation. It provides an easily implemented inter-departmental, intra-institutional intervention to decrease preoperative time in patients presenting with hip fractures.
Keywords: surgical delay; preoperative risk stratification; process improvement.
Hip fractures are common, expensive, and associated with poor outcomes.1,2 Ample literature suggests that morbidity, mortality, and cost of care may be reduced by minimizing surgical delays.3-5 While individual reports indicate mixed evidence, in a 2010 meta-analysis, surgery within 72 hours was associated with significant reductions in pneumonia and pressure sores, as well as a 19% reduction in all-cause mortality through 1 year.6 Additional reviews suggest evidence of improved patient outcomes (pain, length of stay, non-union, and/or mortality) when surgery occurs early, within 12 to 72 hours after injury.4,6,7 Regardless of the definition of “early surgery” used, surgical delay remains a challenge, often due to organizational factors, including admission day of the week and hospital staffing, and patient characteristics, such as comorbidities, echocardiographic findings, age, and insurance status.7-9
Among factors that contribute to surgical delays, the need for preoperative cardiovascular risk stratification is significantly modifiable.10 The American College of Cardiology (ACC)/American Heart Association (AHA) Task Force risk stratification framework for preoperative cardiac testing assists clinicians in determining surgical urgency, active cardiac conditions, cardiovascular risk factors, and functional capacity of each patient, and is well established for low- or intermediate-risk patients.11 Specifically, metabolic equivalents (METs) measurements are used to identify medically stable patients with good or excellent functional capacity versus poor or unknown functional status. Patients with ≥ 4 METs may proceed to surgery without further testing; patients with < 4 METs may either proceed with planned surgery or undergo additional testing. Patients with a perceived increased risk profile who require urgent or semi-urgent hip fracture repair may be confounded by disagreement about required preoperative cardiac testing.
At OhioHealth Grant Medical Center (GMC), an urban, level 1 trauma center, the consideration of further preoperative noninvasive testing frequently contributed to surgical delays. In 2009, hip fracture patients arriving to the emergency department (ED) waited an average of 51 hours before being transferred to the operating room (OR) for surgery. Presuming prompt surgery is both desirable and feasible, the Grant Hip Fracture Management Committee (GHFMC) was developed in order to expedite surgeries in hip fracture patients. The GHFMC recommended a preoperative hip fracture protocol, and the outcomes from protocol implementation are described in this article.
Methods
This study was approved by the OhioHealth Institutional Review Board, with a waiver of the informed consent requirement. Medical records from patients treated at GMC during the time period between January 2010 and April 2014 (ie, following implementation of GHFMC recommendations) were retrospectively reviewed to identify the extent to which the use of preoperative transthoracic echocardiography (TTE) reduced average time to surgery and total length of stay, compared to cardiac consultation. This chart review included 316 participants and was used to identify primary induction agent utilized, time to medical optimization, time to surgery, and total length of hospital stay.
Intervention
The GHFMC conducted a 9-month quality improvement project to decrease ED-to-OR time to less than 24 hours for hip fracture patients. The multidisciplinary committee consisted of physicians from orthopedic surgery, anesthesia, hospital medicine, and geriatrics, along with key administrators and nurse outcomes managers. While there is lack of complete clarity surrounding optimal surgical timing, the committee decided that surgery within 24 hours would be beneficial for the majority of patients and therefore was considered a prudent goal.
Based on identified barriers that contributed to surgical delays, several process improvement strategies were implemented, including admitting patients to the hospitalist service, engaging the orthopedic trauma team, and implementing pre- and postoperative protocols and order sets (eg, ED and pain management order sets). Specific emphasis was placed on establishing guidelines for determining medical optimization. In the absence of established guidelines, medical optimization was determined at the discretion of the attending physician. The necessity of preoperative cardiac assessment was based, in part, on physician concerns about determining safe anesthesia protocols and hemodynamically managing patients who may have occult heart disease, specifically those patients with low functional capacity (< 4 METs) and/or inability to accurately communicate their medical history.
Many hip fractures result from a fall, and it may be unclear whether the fall causing a fracture was purely mechanical or indicative of a distinct acute or chronic illness. As a result, many patients received cardiac consultations, with or without pharmacologic stress testing, adding another 24 to 36 hours to preoperative time. As invasive preoperative cardiac procedures generally result in surgical delays without improving outcomes,11 the committee recommended that clinicians reserve preoperative cardiac consultation for patients with active cardiac conditions.
In lieu of cardiac consultation, the committee suggested preoperative TTE. While use of TTE has not been shown to improve preoperative risk stratification in routine noncardiac surgeries, it has been shown to provide clinically useful information in patients at high risk for cardiac complications.11 There was consensus for incorporating preoperative TTE for several reasons: (1) the patients with hip fractures were not “routine,” and often did not have a reliable medical history; (2) a large percentage of patients had cardiac risk factors; (3) patients with undiagnosed aortic stenosis, severe left ventricular dysfunction, or severe pulmonary hypertension would likely have altered intraoperative fluid management; and (4) in supplanting cardiac consultations, TTE would likely expedite patients’ ED-to-OR times. Therefore, the GHFMC created a recommendation of ordering urgent TTE for patients who were unable to exercise at ≥ 4 METs but needed urgent hip fracture surgery.
In order to evaluate the success of the new protocol, the ED-to-OR times were calculated for a cohort of patients who underwent surgery for hip fracture following algorithm implementation.
Participants
A chart review was conducted for patients admitted to GMC between January 2010 and April 2014 for operative treatment of a hip fracture. Exclusion criteria included lack of radiologist-diagnosed hip fracture, periprosthetic hip fracture, or multiple traumas. Electronic patient charts were reviewed by investigators (KI and BO) using a standardized, electronic abstraction form for 3 groups of patients who (1) proceeded directly to planned surgery without TTE or cardiac consultation (direct-to-surgery group); (2) received preoperative TTE but not a cardiac consultation (TTE-only group); or (3) received preoperative cardiac consultation (cardiac consult group).
Measures
Demographics, comorbid conditions, MET score, anesthesia protocol, and in-hospital morbidity and mortality were extracted from medical charts. Medical optimization time was determined by the latest time stamp of 1 of the following: time that the final consulting specialist stated that the patient was stable for surgery; time that the hospitalist described the patient as being ready for surgery; time that the TTE report was certified by the reading cardiologist; or time that the hospitalist described the outcome of completed preoperative risk stratification. Time elapsed prior to medical optimization, surgery, and discharge were calculated using differences between the patient’s arrival date and time at the ED, first recorded time of medical optimization, surgical start time (from the surgical report), and discharge time, respectively.
To assess whether the TTE protocol may have affected anesthesia selection, the induction agent (etomidate or propofol) was abstracted from anesthesia reports and stratified by the ejection fraction of each patient: very low (≤ 35%), low (36%–50%), or normal (> 50%). Patients without an echocardiogram report were assumed to have a normal ejection fraction for this analysis.
Analysis
Descriptive statistics were produced using mean and standard deviation (SD) for continuous variables and frequency and percentage for categorical variables. To determine whether statistically significant differences existed between the 3 groups, the Kruskal-Wallis test was used to compare skewed continuous variables, and Pearson’s chi-square test was used to compare categorical variables. Due to differences in baseline patient characteristics across the 3 treatment groups, inverse probability weights were used to adjust for group differences (using a multinomial logit treatment model) while comparing differences in outcome variables. This modeling strategy does not rely on any assumptions for the distribution of the outcome variable. Covariates were considered for inclusion in the treatment or outcome model if they were significantly associated (P < 0.05) with the group variable. Additionally, anesthetic agent (etomidate or propofol) was compared across the treatment groups after stratifying by ejection fraction to identify whether any differences existed in anesthesia regimen. Patients who were prescribed more than 1 anesthetic agent (n = 2) or an agent that was not of interest were removed from the analysis (n = 13). Stata (version 14) was used for analysis. All other missing data with respect to the tested variables were omitted in the analysis for that variable. Any disagreements about abstraction were resolved through consensus between the investigators.
Results
A total of 316 cases met inclusion criteria, including 108 direct-to-surgery patients, 143 preoperative TTE patients, and 65 cardiac consult patients. Patient demographics and preoperative characteristics are shown in Table 1. The average age for all patients was 76.5 years of age (SD, 12.89; IQR, 34-97); however, direct-to-surgery patients were significantly (P < 0.001) younger (71.2 years; SD, 14.2; interquartile range [IQR], 34-95 years) than TTE-only patients (79.0 years; SD, 11.5; IQR, 35-97 years) and cardiac consult patients (79.57 years; SD, 10.63; IQR, 49-97 years). The majority of patients were female (69.9%) and experienced a fall prior to admission (94%). Almost three-fourths of patients had 1 or more cardiac risk factors (73.7%), including history of congestive heart failure (CHF; 19%), coronary artery disease (CAD; 26.3%), chronic obstructive pulmonary disease (COPD; 19.3%), or aortic stenosis (AS; 3.5%). Due to between-group differences in these comorbid conditions, confounding factors were adjusted for in subsequent analyses.
As shown in Table 2, before adjustment for confounding factors, there were significant between-group differences in medical optimization time for patients in all 3 groups. After adjustment for treatment differences using age and number of comorbid diseases, and medical optimization time differences using age and COPD, fewer between-group differences were statistically significant. Patients who received a cardiac consult had an 18.44-hour longer medical optimization time compared to patients who went directly to surgery (29.136 vs 10.696 hours; P = 0.001). Optimization remained approximately 5 hours longer for the TTE-only group than for the direct-to-surgery group; however, this difference was not significant (P = 0.075).
When comparing differences in ED-to-OR time for the 3 groups after adjusting the probability of treatment for age and the number of comorbid conditions, and adjusting the probability of ED-to-OR time for age, COPD, and CHF, significant differences remained in ED-to-OR times across all groups. Specifically, patients in the direct-to-surgery group experienced the shortest time (mean, 20.64 hours), compared to patients in the TTE-only group (mean, 26.32; P = 0.04) or patients in the cardiac consult group (mean, 36.08; P < 0.001). TTE-only patients had a longer time of 5.68 hours, compared to the direct-to-surgery group, and patients in the preoperative cardiac consult group were on average 15.44 hours longer than the direct-to-surgery group.
When comparing differences in the length of stay for the 3 groups before statistical adjustments, differences were observed; however, after removing the confounding factors related to treatment (age and CAD) and the outcome (age and the number of comorbid conditions), there were no statistically significant differences in the length of stay for the 3 groups. Average length of stay was 131 hours for direct-to-surgery patients, 142 hours for TTE-only patients, and 141 hours for cardiac consult patients.
The use of different anesthetic agents was compared for patients in the 3 groups. The majority of patients in the study (87.7%) were given propofol, and there were no differences after stratifying by ejection fraction (Table 3).
Discussion
The GHFMC was created to reduce surgical delays for hip fracture. Medical optimization was considered a primary, modifiable factor given that surgeons were reluctant to proceed without a cardiac consult. To address this gap, the committee recommended a preoperative TTE for patients with low or unknown functional status. This threshold provides a quick and easy method for stratifying patients who previously required risk stratification by a cardiologist, which often resulted in surgery delays.
In their recommendations for implementation of hip fracture quality improvement projects, the Geriatric Fracture Center emphasizes the importance of multidisciplinary physician leadership along with standardization of approach across patients.12 This recommendation is supported by increasing evidence that orthogeriatric collaborations are associated with decreased mortality and length of stay.13 The GHFMC and subsequent interventions reflect this approach, allowing for collaboration to identify cross-disciplinary procedural barriers to care. In our institution, addressing identified procedural barriers to care was associated with a reduction in the average time to surgery from 51 hours to 25.3 hours.
Multiple approaches have been attempted to decrease presurgical time in hip fracture patients in various settings. Prehospital interventions, such as providing ambulances with checklists and ability to bypass the ED, have not been shown to decrease time to surgery for hip fracture patients, though similar strategies have been successful in other conditions, such as stroke.14,15 In-hospital procedures, such as implementation of a hip fracture protocol and reduction of preoperative interventions, have more consistently been found to decrease time to surgery and in-hospital mortality.16,17 However, reduced delays have not been found universally. Luttrell and Nana found that preoperative TTE resulted in approximately 30.8-hour delays from the ED to OR, compared to patients who did not receive a preoperative TTE.18 However, in that study hospitalists used TTE at their own discretion, and there may have been confounding factors contributing to delays. When used as part of a protocol targeting patients with poor or unknown functional capacity, we believe that preoperative TTE results in modest surgical delays yet provides clinically useful information about each patient.
ACC/AHA preoperative guidelines were updated after we implemented our intervention and now recommend that patients with poor or unknown functional capacity in whom stress testing will not influence care proceed to surgery “according to guideline-directed medical care.”11 While routine use of preoperative evaluation of left ventricular function is not recommended, assessing left ventricular function may be reasonable for patients with heart failure with a change in clinical status. Guidelines also recommend that patients with clinically suspected valvular stenosis undergo preoperative echocardiography.11
Limitations
This study has several limitations. First, due to resource limitations, a substantial period of time elapsed between implementation of the new protocol and the analysis of the data set. That is, the hip fracture protocol assessed in this paper occurred from January 2010 through April 2014, and final analysis of the data set occurred in April 2020. This limitation precludes our ability to formally assess any pre- or post-protocol changes in patient outcomes. Second, randomization was not used to create groups that were balanced in differing health characteristics (ie, patients with noncardiac-related surgeries, patients in different age groups); however, the use of inverse probability treatment regression analysis was a way to statistically address these between-group differences. Moreover, this study is limited by the factors that were measured; unmeasured factors cannot be accounted for. Third, health care providers working at the hospital during this time were aware of the goal to decrease presurgical time, possibly creating exaggerated effects compared to a blinded trial. Finally, although this intervention is likely translatable to other centers, these results represent the experiences of a single level 1 trauma center and may not be replicable elsewhere.
Conclusion
Preoperative TTE in lieu of cardiac consultation has several advantages. First, it requires interdepartmental collaboration for implementation, but can be implemented through a single hospital or hospital system. Unlike prehospital interventions, preoperative urgent TTE for patients with low functional capacity does not require the support of emergency medical technicians, ambulance services, or other hospitals in the region. Second, while costs are associated with TTE, they are offset by a reduction in expensive consultations with specialists, surgical delays, and longer lengths of stay. Third, despite likely increased ED-to-OR times compared to no intervention, urgent TTE decreases time to surgery compared with cardiology consultation. Prior to the GHFMC, the ED-to-OR time at our institution was 51 hours. In contrast, the mean time following the GHFMC-led protocol was less than half that, at 25.3 hours (SD, 19.1 hours). In fact, nearly two-thirds (65.2%) of the patients evaluated in this study underwent surgery within 24 hours of admission. This improvement in presurgical time was attributed, in part, to the implementation of preoperative TTE over cardiology consultations.
Acknowledgments: The authors thank Jenny Williams, RN, who was instrumental in obtaining the data set for analysis, and Shauna Ayres, MPH, from the OhioHealth Research Institute, who provided writing and technical assistance.
Corresponding author: Robert Skully, MD, OhioHealth Family Medicine Grant, 290 East Town St., Columbus, OH 43215; robert.skully@ohiohealth.com.
Funding: This work was supported by the OhioHealth Summer Research Externship Program.
Financial disclosures: None.
1. Brauer CA, Coca-Perraillon M, Cutler DM, Rosen AB. Incidence and mortality of hip fractures in the United States. JAMA. 2009;302:1573-1579.
2. Lewiecki EM, Wright NC, Curtis JR, et al. Hip fracture trends in the United States 2002 to 2015. Osteoporos Int. 2018;29:717-722.
3. Colais P, Di Martino M, Fusco D, et al. The effect of early surgery after hip fracture on 1-year mortality. BMC Geriatr. 2015;15:141.
4. Nyholm AM, Gromov K, Palm H, et al. Time to surgery is associated with thirty-day and ninety-day mortality after proximal femoral fracture: a retrospective observational study on prospectively collected data from the Danish Fracture Database Collaborators. J Bone Joint Surg Am. 2015;97:1333-1339.
5. Judd KT, Christianson E. Expedited operative care of hip fractures results in significantly lower cost of treatment. Iowa Orthop J. 2015;35:62-64.
6. Simunovic N, Devereaux PJ, Sprague S, et al. Effect of early surgery after hip fracture on mortality and complications: systematic review and meta-analysis. CMAJ. 2010;182:1609-1616.
7. Ryan DJ, Yoshihara H, Yoneoka D, et al. Delay in hip fracture surgery: an analysis of patient-specific and hospital-specific risk factors. J Orthop Trauma. 2015;29:343-348.
8. Ricci WM, Brandt A, McAndrew C, Gardner MJ. Factors affecting delay to surgery and length of stay for patients with hip fracture. J Orthop Trauma. 2015;29:e109-e114.
9. Hagino T, Ochiai S, Senga S, et al. Efficacy of early surgery and causes of surgical delay in patients with hip fracture. J Orthop. 2015;12:142-146.
10. Rafiq A, Sklyar E, Bella JN. Cardiac evaluation and monitoring of patients undergoing noncardiac surgery. Health Serv Insights. 2017;9:1178632916686074.
11. Fleisher LA, Fleischmann KE, Auerbach AD, et al. 2014 ACC/AHA guideline on perioperative cardiovascular evaluation and management of patients undergoing noncardiac surgery: a report of the American College of Cardiology/American Heart Association Task Force on Practice Guidelines. J Am Coll Cardiol. 2014;64:e77-e137.
12. Basu N, Natour M, Mounasamy V, Kates SL. Geriatric hip fracture management: keys to providing a successful program. Eur J Trauma Emerg Surg. 2016;42:565-569.
13. Grigoryan KV, Javedan H, Rudolph JL. Orthogeriatric care models and outcomes in hip fracture patients: a systematic review and meta-analysis. J Orthop Trauma. 2014;28:e49-e55.
14. Tai YJ, Yan B. Minimising time to treatment: targeted strategies to minimise time to thrombolysis for acute ischaemic stroke. Intern Med J. 2013;43:1176-1182.
15. Larsson G, Stromberg RU, Rogmark C, Nilsdotter A. Prehospital fast track care for patients with hip fracture: Impact on time to surgery, hospital stay, post-operative complications and mortality a randomised, controlled trial. Injury. 2016;47:881-886.
16. Bohm E, Loucks L, Wittmeier K, et al. Reduced time to surgery improves mortality and length of stay following hip fracture: results from an intervention study in a Canadian health authority. Can J Surg. 2015;58:257-263.
17. Ventura C, Trombetti S, Pioli G, et al. Impact of multidisciplinary hip fracture program on timing of surgery in elderly patients. Osteoporos Int J. 2014;25:2591-2597.
18. Luttrell K, Nana A. Effect of preoperative transthoracic echocardiogram on mortality and surgical timing in elderly adults with hip fracture. J Am Geriatr Soc. 2015;63:2505-2509.
A Multi-Membership Approach for Attributing Patient-Level Outcomes to Providers in an Inpatient Setting
From Banner Health Corporation, Phoenix, AZ.
Background: Health care providers are routinely incentivized with pay-for-performance (P4P) metrics to increase the quality of care. In an inpatient setting, P4P models typically measure quality by attributing each patient’s outcome to a single provider even though many providers routinely care for the patient. This study investigates a new attribution approach aiming to distribute each outcome across all providers who provided care.
Methods: The methodology relies on a multi-membership model and is demonstrated in the Banner Health system using 3 clinical outcome measures (length of stay, 30-day readmissions, and mortality) and responses to 3 survey questions that measure a patient’s perception of their care. The new approach is compared to the “standard” method, which attributes each patient to only 1 provider.
Results: When ranking by clinical outcomes, both methods were concordant 72.1% to 82.1% of the time for top-half/bottom-half rankings, with a median percentile difference between 7 and 15. When ranking by survey scores, there was more agreement, with concordance between 84.1% and 86.6% and a median percentile difference between 11 and 13. Last, Pearson correlation coefficients of the paired percentiles ranged from 0.56 to 0.78.
Conclusion: The new approach provides a fairer solution when measuring provider performance.
Keywords: patient attribution; PAMM; PAPR; random effect model; pay for performance.
Providers practicing in hospitals are routinely evaluated based on their performance and, in many cases, are financially incentivized for a better-than-average performance within a pay-for-performance (P4P) model. The use of P4P models is based on the belief that they will “improve, motivate, and enhance providers to pursue aggressively and ultimately achieve the quality performance targets thus decreasing the number of medical errors with less malpractice events.”1 Although P4P models continue to be a movement in health care, they have been challenging to implement.
One concern involves the general quality of implementation, such as defining metrics and targets, setting payout amounts, managing technology and market conditions, and gauging the level of transparency to the provider.2 Another challenge, and the focus of this project, are concerns around measuring performance to avoid perceptions of unfairness. This concern can be minimized if the attribution is handled in a fairer way, by spreading it across all providers who affected the outcome, both in a positive or negative direction.3
To implement these models, the performance of providers needs to be measured and tracked periodically. This requires linking, or attributing, a patient’s outcome to a provider, which is almost always the attending or discharging provider (ie, a single provider).3 In this single-provider attribution approach, one provider will receive all the credit (good or bad) for their respective patients’ outcomes, even though the provider may have seen the patient only a fraction of the time during the hospitalization. Attributing outcomes—for example, length of stay (LOS), readmission rate, mortality rate, net promoter score (NPS)—using this approach reduces the validity of metrics designed to measure provider performance, especially in a rotating provider environment where many providers interact with and care for a patient. For example, the quality of providers’ interpersonal skills and competence were among the strongest determinants of patient satisfaction,4 but it is not credible that this is solely based on the last provider during a hospitalization.
Proportionally distributing the attribution of an outcome has been used successfully in other contexts. Typically, a statistical modeling approach using a multi-membership framework is used because it can handle the sometimes-complicated relationships within the hierarchy. It also allows for auxiliary variables to be introduced, which can help explain and control for exogenous effects.5-7 For example, in the education setting, standardized testing is administered to students at defined years of schooling: at grades 4, 8, and 10, for instance. The progress of students, measured as the academic gains between test years, are proportionally attributed to all the teachers who the student has had between the test years. These partial attributions are combined to evaluate an overall teacher performance.8,9
Although the multi-membership framework has been used in other industries, it has yet to be applied in measuring provider performance. The purpose of this project is to investigate the impact of using a multi-provider approach compared to the standard single-provider approach. The findings may lead to modifications in the way a provider’s performance is measured and, thus, how providers are compensated. A similar study investigated the impact of proportionally distributing patients’ outcomes across all rotating providers using a weighting method based on billing practices to measure the partial impact of each provider.3
This study is different in 2 fundamental ways. First, attribution is weighted based on the number of clinically documented interactions (via clinical notes) between a patient and all rotating providers during the hospitalization. Second, performance is measured via multi-membership models, which can estimate the effect (both positive and negative) that a provider has on an outcome, even when caring for a patient a fraction of the time during the hospitalization.
Methods
Setting
Banner Health is a non-profit, multi-hospital health care system across 6 states in the western United States that is uniquely positioned to study provider quality attribution models. It not only has a large number of providers and serves a broad patient population, but Banner Health also uses an instance of Cerner (Kansas City, MO), an enterprise-level electronic health record (EHR) system that connects all its facilities and allows for advanced analytics across its system.
For this study, we included only general medicine and surgery patients admitted and discharged from the inpatient setting between January 1, 2018, and December 31, 2018, who were between 18 and 89 years old at admission, and who had a LOS between 1 and 14 days. Visit- and patient-level data were collected from Cerner, while outcome data, and corresponding expected outcome data, were obtained from Premier, Inc. (Charlotte, NC) using their CareScience methodologies.10 To measure patient experience, response data were extracted from post-discharge surveys administered by InMoment (Salt Lake City, UT).
Provider Attribution Models
Provider Attribution by Physician of Record (PAPR). In the standard approach, denoted here as the PAPR model, 1 provider—typically the attending or discharging provider, which may be the same person—is attributed to the entire hospitalization. This provider is responsible for the patient’s care, and all patient outcomes are aggregated and attributed to the provider to gauge his or her performance. The PAPR model is the most popular form of attribution across many health care systems and is routinely used for P4P incentives.
In this study, the discharging provider was used when attributing hospitalizations using the PAPR model. Providers responsible for fewer than 12 discharges in the calendar year were excluded. Because of the directness of this type of attribution, the performance of 1 provider does not account for the performance of the other rotating providers during hospitalizations.
Provider Attribution by Multiple Membership (PAMM). In contrast, we introduce another attribution approach here that is designed to assign partial attribution to each provider who cares for the patient during the hospitalization. To aggregate the partial attributions, and possibly control for any exogenous or risk-based factors, a multiple-membership, or multi-member (MM), model is used. The MM model can measure the effect of a provider on an outcome even when the patient-to-provider relationship is complex, such as in a rotating provider environment.8
The purpose of this study is to compare attribution models and to determine whether there are meaningful differences between them. Therefore, for comparison purposes, the same discharging providers using the PAPR approach are eligible for the PAMM approach, so that both attribution models are using the same set of providers. All other providers are excluded because their performance would not be comparable to the PAPR approach.
While there are many ways to document provider-to-patient interactions, 2 methods are available in almost all health care systems. The first method is to link a provider’s billing charges to each patient-day combination. This approach limits the attribution to 1 provider per patient per day because multiple rotating providers cannot charge for the same patient-day combination.3 However, many providers interact with a patient on the same day, so using this approach excludes non-billed provider-to-patient interactions.
The second method, which was used in this study, relies on documented clinical notes within the EHR to determine how attribution is shared. In this approach, attribution is weighted based on the authorship of 3 types of eligible clinical notes: admitting history/physical notes (during admission), progress notes (during subsequent days), and discharge summary notes (during final discharge). This will (likely) result in many providers being linked to a patient on each day, which better reflects the clinical setting (Figure). Recently, clinical notes were used to attribute care of patients in an inpatient setting, and it was found that this approach provides a reliable way of tracking interactions and assigning ownership.11

The provider-level attribution weights are based on the share of authorships of eligible note types. Specifically, for each provider j, let aij be the total count of eligible note types for hospitalization i authored by provider j, and let ai be the overall total count of eligible note types for hospitalization i. Then the attribution weight is
(Eq. 1)

for hospitalization i and provider j. Note that ∑jwij = 1: in other words, the total attribution, summed across all providers, is constrained to be 1 for each hospitalization.
Patient Outcomes
Outcomes were chosen based on their routine use in health care systems as standards when evaluating provider performance. This study included 6 outcomes: inpatient LOS, inpatient mortality, 30-day inpatient readmission, and patient responses from 3 survey questions. These outcomes can be collected without any manual chart reviews, and therefore are viewed as objective outcomes of provider performance.
Each outcome was aggregated for each provider using both attribution methods independently. For the PAPR method, observed-to-expected (OE) indices for LOS, mortality, and readmissions were calculated along with average patient survey scores. For the PAMM method, provider-level random effects from the fitted models were used. In both cases, the calculated measures were used for ranking purposes when determining top (or bottom) providers for each outcome.
Individual Provider Metrics for the PAPR Method
Inpatient LOS Index. Hospital inpatient LOS was measured as the number of days between admission date and discharge date. For each hospital visit, an expected LOS was determined using Premier’s CareScience Analytics (CSA) risk-adjustment methodology.10 The CSA methodology for LOS incorporates a patient’s clinical history, demographics, and visit-related administrative information.
Let nj be the number of hospitalizations attributed to provider j. Let oij and eij be the observed and expected LOS, respectively, for hospitalization i = 1,…,nj attributed to provider j. Then the inpatient LOS index for provider j is Lj = ∑ioij⁄∑ieij.
Inpatient Mortality Index. Inpatient mortality was defined as the death of the patient during hospitalization. For each hospitalization, an expected mortality probability was determined using Premier’s CSA risk-adjustment methodology.10 The CSA methodology for mortality incorporates a patient’s demographics and comorbidities.
Just as before, let nj be the number of hospitalizations attributed to provider j. Let mij = 1 if the patient died during hospitalization i = 1, … , nj attributed to provider j; mij = 0 otherwise. Let pij(m) be the corresponding expected mortality probability. Then the inpatient mortality index for provider j is Mj = ∑imij⁄∑ipij(m).
30-Day Inpatient Readmission Index. A 30-day inpatient readmission was defined as the event when a patient is discharged and readmits back into the inpatient setting within 30 days. The inclusion criteria defined by the Centers for Medicare and Medicaid Services (CMS) all-cause hospital-wide readmission measure was used and, consequently, planned readmissions were excluded.12 Readmissions could occur at any Banner hospital, including the same hospital. For each hospital visit, an expected readmission probability was derived using Premier’s CSA risk-adjustment methodology.10 The CSA methodology for readmissions incorporates a patient’s clinical history, demographics, and visit-related administrative information.
Let nj be the number of hospitalizations attributed to provider j. Let rij = 1 if the patient had a readmission following hospitalization i = 1, … , nj attributed to provider j; rij = 0 otherwise. Let pij(r) be the corresponding expected readmission probability. Then the 30-day inpatient readmission index for provider j is Rj = ∑irij ⁄∑ipij(r).
Patient Survey Scores. The satisfaction of the patient’s experience during hospitalization was measured via post-discharge surveys administered by InMoment. Two survey questions were selected because they related directly to a provider’s interaction with the patient: “My interactions with doctors were excellent” (Doctor) and “I received the best possible care” (Care). A third question, “I would recommend this hospital to my family and friends,” was selected as a proxy measure of the overall experience and, in the aggregate, is referred to as the net promoter score (NPS).13,14 The responses were measured on an 11-point Likert scale, ranging from “Strongly Disagree” (0) to “Strongly Agree” (10); “N/A” or missing responses were excluded.
The Likert responses were coded to 3 discrete values as follows: if the value was between 0 and 6, then -1 (ie, detractor); between 7 and 8 (ie, neutral), then 0; otherwise 1 (ie, promoter). Averaging these coded responses results in a patient survey score for each question. Specifically, let nj be the number of hospitalizations attributed to provider j in which the patient responded to the survey question. Let sij ∈{−1, 0, 1} be the coded response linked to hospitalization i = 1, … , nj attributed to provider j. Then the patient experience score for provider j is Sj = ∑isij⁄nj.
Handling Ties in Provider Performance Measures. Because ties can occur in the PAPR approach for all measures, a tie-breaking strategy is needed. For LOS indices, ties are less likely because their numerator is strictly greater than 0, and expected LOS values are typically distinct enough. Indeed, no ties were found in this study for LOS indices. However, mortality and readmission indices can routinely result in ties when the best possible index is achieved, such as 0 deaths or readmissions among attributed hospitalizations. To help differentiate between those indices in the PAPR approach, the total estimated risk (denominator) was utilized as a secondary scoring criterion.
Mortality and readmission metrics were addressed by sorting first by the outcome (mortality index), and second by the denominator (total estimated risk). For example, if provider A has the same mortality rate as provider B, then provider A would be ranked higher if the denominator was larger, indicating a higher risk for mortality.
Similarly, it was very common for providers to have the same overall average rating for a survey question. Therefore, the denominator (number of respondents) was used to break ties. However, the denominator sorting was bidirectional. For example, if the tied score was positive (more promoters than detractors) for providers A and B, then provider A would be ranked higher if the denominator was larger. Conversely, if the tied score between providers A and B was neutral or negative (more detractors than promoters), then provider A would be ranked lower if the denominator was larger.
Individual Provider Metrics for the PAMM Method
For the PAMM method, model-based metrics were derived using a MM model.8 Specifically, let J be the number of rotating providers in a health care system. Let Yi be an outcome of interest from hospitalization i, X1i, …, Xpi be fixed effects or covariates, and ß1, …, ßp be the coefficients for the respective covariates. Then the generalized MM statistical model is
(Eq. 2)

where g(μi ) is a link function between the mean of the outcome, μi, and its linear predictor, ß0, is the marginal intercept, wij represents the attribution weight of provider j on hospitalization i (described in Equation 1), and γj represents the random effect of provider j on the outcome with γj~N(0,σγ2).
For the mortality and readmission binary outcomes, logistic regression was performed using a logit link function, with the corresponding expected probability as the only fixed covariate. The expected probabilities were first converted into odds and then log-transformed before entering the model. For LOS, Poisson regression was performed using a log link function with the log-transformed expected LOS as the only fixed covariate. For coded patient experience responses, an ordered logistic regression was performed using a cumulative logit link function (no fixed effects were added).
MM Model-based Metrics. Each fitted MM model produces a predicted random effect for each provider. The provider-specific random effects can be interpreted as the unobserved influence of each provider on the outcome after controlling for any fixed effect included in the model. Therefore, the provider-specific random effects were used to evaluate the relative provider performance, which is analogous to the individual provider-level metrics used in the PAPR method.
Measuring provider performance using a MM model is more flexible and robust to outliers compared to the standard approach using OE indices or simple averages. First, although not investigated here, the effect of patient-, visit-, provider-, and/or temporal-level covariates can be controlled when evaluating provider performance. For example, a patient’s socioeconomic status, a provider’s workload, and seasonal factors can be added to the MM model. These external factors are not accounted for in OE indices.
Another advantage of using predicted random effects is the concept of “shrinkage.” The process of estimating random effects inherently accounts for small sample sizes (when providers do not treat a large enough sample of patients) and/or when there is a large ratio of patient variance to provider variance (for instance, when patient outcome variability is much higher compared to provider performance variability). In both cases, the estimation of the random effect is pulled ever closer to 0, signaling that the provider performance is closer to the population average. See Henderson15 and Mood16 for further details.
In contrast, OE indices can result in unreliable estimates when a provider has not cared for many patients. This is especially prevalent when the outcome is binary with a low probability of occurring, such as mortality. Indeed, provider-level mortality OE indices are routinely 0 when the patient counts are low, which skews performance rankings unfairly. Finally, OE indices also ignore the magnitude of the variance of an outcome between providers and patients, which can be large.
Comparison Methodology
In this study, we seek to compare the 2 methods of attribution, PAPR and PAMM, to determine whether there are meaningful differences between them when measuring provider performance. Using retrospective data described in the next section, each attribution method was used independently to derive provider-level metrics. To assess relative performance, percentiles were assigned to each provider based on their metric values so that, in the end, there were 2 percentile ranks for each provider for each metric.
Using these paired percentiles, we derived the following measures of concordance, similar to Herzke, Michtalik3: (1) the percent concordance measure—defined as the number of providers who landed in the top half (greater than the median) or bottom half under both attribution models—divided by the total number of providers; (2) the median of the absolute difference in percentiles under both attribution models; and (3) the Pearson correlation coefficient of the paired provider ranks. The first measure is a global measure of concordance between the 2 approaches and would be expected to be 50% by chance. The second measure gauges how an individual provider’s rank is affected by the change in attribution methodologies. The third measure is a statistical measure of linear correlation of the paired percentiles and was not included in the Herzke, Michtalik3 study.
All statistical analyses were performed on SAS (version 9.4; Cary, NC) and the MM models were fitted using PROC GLIMMIX with the EFFECT statement. The Banner Health Institutional Review Board approved this study.
Results
Descriptive Statistics
A total of

Multi-Membership Model Results
Table 3 displays the results after independently fitting MM models to each of the 3 clinical outcomes. Along with a marginal intercept, the only covariate in each model was the corresponding expected value after a transformation. This was added to use the same information that is typically used in OE indices, therefore allowing for a proper comparison between the 2 attribution methods. The provider-level variance represents the between-provider variation and measures the amount of influence providers have on the corresponding outcome after controlling for any covariates in the model. A provider-level variance of 0 would indicate that providers do not have any influence on the outcome. While the mortality and readmission model results can be compared to each other, the LOS model cannot given its different scale and transformation altogether.

The results in Table 3 suggest that each expected value covariate is highly correlated with its corresponding outcome, which is the anticipated conclusion given that they are constructed in this fashion. The estimated provider-level variances indicate that, after including an expected value in the model, providers have less of an influence on a patient’s LOS and likelihood of being readmitted. On the other hand, the results suggest that providers have much more influence on the likelihood of a patient dying in the hospital, even after controlling for an expected mortality covariate.

Table 4 shows the results after independently fitting MM-ordered logistic models to each of the 3 survey questions. The similar provider-level variances suggest that providers have the same influence on the patient’s perception of the quality of their interactions with the doctor (Doctor), the quality of the care they received (Care), and their likelihood to recommend a friend or family member to the hospital (NPS).

Comparison Results Between Both Attribution Methods
Table 5 compares the 2 attribution methods when ranking providers based on their performance on each outcome measure. The comparison metrics gauge how well the 2 methods agree overall (percent concordance), agree at the provider level (absolute percentile difference and interquartile range [IQR]), and how the paired percentiles linearly correlate to each other (Pearson correlation coefficient).
 Approach vs a Multi-Membership (PAMM) Approach")
LOS, by a small margin, had the lowest concordance of clinical outcomes (72.1%), followed by mortality (75.9%) and readmissions (82.1%). Generally, the survey scores had higher percent concordance than the clinical outcome measures, with Doctor at 84.1%, Care at 85.9%, and NPS having the highest percent concordance at 86.6%. Given that by chance the percent concordance is expected to be 50%, there was notable discordance, especially with the clinical outcome measures. Using LOS performance as an example, one attribution methodology would rank a provider in the top half or bottom half, while the other attribution methodology would rank the same provider exactly the opposite way about 28% of the time.
The median absolute percentile difference between the 2 methods was more modest (between 7 and 15). Still, there were some providers whose performance ranking was heavily impacted by the attribution methodology that was used. This was especially true when evaluating performance for certain clinical measures, where the attribution method that was used could change the provider performance percentile by up to 90 levels.
The paired percentiles were positively correlated when ranking performance using any of the 6 measures. This suggests that both methodologies assess performance generally in the same direction, irrespective of the methodology and measure. We did not investigate more complex correlation measures and left this for future research.
It should be noted that ties occurred much more frequently with the PAPR method than when using PAMM and therefore required tie-breaking rules to be designed. Given the nature of OE indices, PAPR methodology is especially sensitive to ties whenever the measure includes counting the number of events (for example, mortality and readmissions) and whenever there are many providers with very few attributed patients. On the other hand, using the PAMM method is much more robust against ties given that the summation of all the weighted attributed outcomes will rarely result in ties, even with a nominal set of providers.
Discussion
In this study, the PAMM methodology was introduced and was used to assess relative provider performance on 3 clinical outcome measures and 3 patient survey scores. The new approach aims to distribute each outcome among all providers who provided care for a patient in an inpatient setting. Clinical notes were used to account for patient-to-provider interactions, and fitted MM statistical models were used to compute the effects that each provider had on each outcome. The provider effect was introduced as a random effect, and the set of predicted random effects was used to rank the performance of each provider.
The PAMM approach was compared to the more traditional methodology, PAPR, where each patient is attributed to only 1 provider: the discharging physician in this study. Using this approach, OE indices of clinical outcomes and averages of survey scores were used to rank the performance of each provider. This approach resulted in many ties, which were broken based on the number of hospitalizations, although other tie-breaking methods may be used in practice.
Both methodologies showed modest concordance with each other for the clinical outcomes, but higher concordance for the patient survey scores. This was also true when using the Pearson correlation coefficient to assess agreement. The 1 outcome measure that showed the least concordance and least linear correlation between methods was LOS, which would suggest that LOS performance is more sensitive to the attribution methodology that is used. However, it was the least concordant by a small margin.
Furthermore, although the medians of the absolute percentile differences were small, there were some providers who had large deviations, suggesting that some providers would move from being shown as high-performers to low-performers and vice versa based on the chosen attribution method. We investigated examples of this and determined that the root cause was the difference in effective sample sizes for a provider. For the PAPR method, the effective sample size is simply the number of hospitalizations attributed to the provider. For the PAMM method, the effective sample size is the sum of all non-zero weights across all hospitalizations where the provider cared for a patient. By and large, the PAMM methodology provides more information of the provider effect on an outcome than the PAPR approach because every provider-patient interaction is considered. For example, providers who do not routinely discharge patients, but often care for patients, will have rankings that differ dramatically between the 2 methods.
The PAMM methodology has many statistical advantages that were not fully utilized in this comparative study. For example, we did not include any covariates in the MM models except for the expected value of the outcome, when it was available. Still, it is known that other covariates can impact an outcome as well, such as the patient’s age, socioeconomic indicators, existing chronic conditions, and severity of hospitalization, which can be added to the MM models as fixed effects. In this way, the PAMM approach can control for these other covariates, which are typically outside of the control of providers but typically ignored using OE indices. Therefore, using the PAMM approach would provide a fairer comparison of provider performance.
Using the PAMM method, most providers had a large sample size to assess their performance once all the weighted interactions were included. Still, there were a few who did not care for many patients for a variety of reasons. In these scenarios, MM models “borrow” strength from other providers to produce a more robust predicted provider effect by using a weighted average between the overall population trend and the specific provider outcomes (see Rao and Molina17). As a result, PAMM is a more suitable approach when the sample sizes of patients attributed to providers can be small.
One of the most interesting findings of this study was the relative size of the provider-level variance to the size of the fixed effect in each model (Table 3). Except for mortality, these variances suggest that there is a small difference in performance from one provider to another. However, these should be interpreted as the variance when only 1 provider is involved in the care of a patient. When multiple providers are involved, using basic statistical theory, the overall provider-level variance will be σγ2 ∑wij2 (see Equation 2). For example, the estimated variance among providers for LOS was 0.03 (on a log scale), but, using the scenario in the Figure, the overall provider-level variance for this hospitalization will be 0.03 (0.3752 + 0.1252 + 0.52) = 0.012. Hence, the combined effect of providers on LOS is less than would be expected. Indeed, as more providers are involved with a patient’s care, the more their combined influence on an outcome is diluted.
In this study, the PAMM approach placed an equal weight on all provider-patient interactions via clinical note authorship, but that may not be optimal in some settings. For example, it may make more sense to set a higher weight on the provider who admitted or discharged the patient while placing less (or 0) weight on all other interactions. In the extreme, if the full weight were placed on 1 provider interaction (eg, during discharge, then the MM model would be reduced to a one-way random effects model. The flexibility of weighting interactions is a feature of the PAMM approach, but any weighting framework must be transparent to the providers before implementation.
Conclusion
This study demonstrates that the PAMM approach is a feasible option within a large health care organization. For P4P programs to be successful, providers must be able to trust that their performance will be fairly assessed and that all provider-patient interactions are captured to provide a full comparison amongst their peers. The PAMM methodology is one solution to spread the positive (and negative) outcomes across all providers who cared for a patient and therefore, if implemented, would add trust and fairness when measuring and assessing provider performance.
Acknowledgments: The authors thank Barrie Bradley for his support in the initial stages of this research and Dr. Syed Ismail Jafri for his help and support on the standard approaches of assessing and measuring provider performances.
Corresponding author: Rachel Ginn, MS, Banner Health Corporation, 2901 N. Central Ave., Phoenix, AZ 85012; rachel.ginn@gmail.com.
Financial disclosures: None.
1. Abduljawad A, Al-Assaf AF. Incentives for better performance in health care. Sultan Qaboos Univ Med J. 2011;11:201-206.
2. Milstein R, Schreyoegg J. Pay for performance in the inpatient sector: a review of 34 P4P programs in 14 OECD countries. Health Policy. 2016;120:1125-1140.
3. Herzke CA, Michtalik HJ, Durkin N, et al. A method for attributing patient-level metrics to rotating providers in an inpatient setting. J Hosp Med. 2018;13:470-475.
4. Batbaatar E, Dorjdagva J, Luvsannyam A, Savino MM, Amenta P. Determinants of patient satisfaction: a systematic review. Perspect Public Health. 2017;137:89-101.
5. Ballou D, Sanders W, Wright P. Controlling for student background in value-added assessment of teachers. J Educ Behav Stat. 2004;29:37-65.
6. Hill PW, Goldstein H. Multilevel modeling of educational data with cross-classification and missing identification for units. J Educ Behav Stat. 1998;23:117-128.
7. Rasbash J, Browne WJ. Handbook of Multilevel Analysis. Springer; 2007.
8. Brown WJ, Goldstein H, Rasbash J. Multiple membership multiple classification (MMMC) models. Statistical Modeling. 2001;1:103-124.
9. Sanders WL, Horn SP. The Tennessee Value-Added Assessment System (TVAAS)—mixed-model methodology in educational assessment. J Pers Eval Educ. 1994;8:299-311.
10. Kroch EA, Duan M. CareScience Risk Assessment Model: Hospital Performance Measurement. Premier, Inc., 2008. http://www.ahrq.gov/qual/mortality/KrochRisk.htm
11. Schumacher DJ, Wu DTY, Meganathan K, et al. A feasibility study to attribute patients to primary interns on inpatient ward teams using electronic health record data. Acad Med. 2019;94:1376-1383.
12. Simoes J, Krumholz HM, Lin Z. Hospital-level 30-day risk-standardized readmission measure. Centers for Medicare & Medicaid Services, 2018. https://www.cms.gov/Medicare/Quality-Initiatives-Patient-Assessment-Instruments/HospitalQualityInits/Downloads/Hospital-Wide-All-Cause-Readmission-Updates.zip
13. Krol MW, de Boer D, Delnoij DM, Rademakers JJDJM. The Net Promoter Score: an asset to patient experience surveys? Health Expect. 2015;18:3099-3109.
14. Doyle C, Lennox L, Bell D. A systematic review of evidence on the links between patient experience and clinical safety and effectiveness. BMJ Open. 2013;3:e001570.
15. Henderson CR. Sire evaluation and genetic trends. J Anim Sci. 1973;1973:10-41.
16. Mood AM. Introduction to the Theory of Statistics. McGraw-Hill; 1950:xiii, 433-xiii.
17. Rao JNK, Molina I. Small Area Estimation. Wiley; 2015.
From Banner Health Corporation, Phoenix, AZ.
Background: Health care providers are routinely incentivized with pay-for-performance (P4P) metrics to increase the quality of care. In an inpatient setting, P4P models typically measure quality by attributing each patient’s outcome to a single provider even though many providers routinely care for the patient. This study investigates a new attribution approach aiming to distribute each outcome across all providers who provided care.
Methods: The methodology relies on a multi-membership model and is demonstrated in the Banner Health system using 3 clinical outcome measures (length of stay, 30-day readmissions, and mortality) and responses to 3 survey questions that measure a patient’s perception of their care. The new approach is compared to the “standard” method, which attributes each patient to only 1 provider.
Results: When ranking by clinical outcomes, both methods were concordant 72.1% to 82.1% of the time for top-half/bottom-half rankings, with a median percentile difference between 7 and 15. When ranking by survey scores, there was more agreement, with concordance between 84.1% and 86.6% and a median percentile difference between 11 and 13. Last, Pearson correlation coefficients of the paired percentiles ranged from 0.56 to 0.78.
Conclusion: The new approach provides a fairer solution when measuring provider performance.
Keywords: patient attribution; PAMM; PAPR; random effect model; pay for performance.
Providers practicing in hospitals are routinely evaluated based on their performance and, in many cases, are financially incentivized for a better-than-average performance within a pay-for-performance (P4P) model. The use of P4P models is based on the belief that they will “improve, motivate, and enhance providers to pursue aggressively and ultimately achieve the quality performance targets thus decreasing the number of medical errors with less malpractice events.”1 Although P4P models continue to be a movement in health care, they have been challenging to implement.
One concern involves the general quality of implementation, such as defining metrics and targets, setting payout amounts, managing technology and market conditions, and gauging the level of transparency to the provider.2 Another challenge, and the focus of this project, are concerns around measuring performance to avoid perceptions of unfairness. This concern can be minimized if the attribution is handled in a fairer way, by spreading it across all providers who affected the outcome, both in a positive or negative direction.3
To implement these models, the performance of providers needs to be measured and tracked periodically. This requires linking, or attributing, a patient’s outcome to a provider, which is almost always the attending or discharging provider (ie, a single provider).3 In this single-provider attribution approach, one provider will receive all the credit (good or bad) for their respective patients’ outcomes, even though the provider may have seen the patient only a fraction of the time during the hospitalization. Attributing outcomes—for example, length of stay (LOS), readmission rate, mortality rate, net promoter score (NPS)—using this approach reduces the validity of metrics designed to measure provider performance, especially in a rotating provider environment where many providers interact with and care for a patient. For example, the quality of providers’ interpersonal skills and competence were among the strongest determinants of patient satisfaction,4 but it is not credible that this is solely based on the last provider during a hospitalization.
Proportionally distributing the attribution of an outcome has been used successfully in other contexts. Typically, a statistical modeling approach using a multi-membership framework is used because it can handle the sometimes-complicated relationships within the hierarchy. It also allows for auxiliary variables to be introduced, which can help explain and control for exogenous effects.5-7 For example, in the education setting, standardized testing is administered to students at defined years of schooling: at grades 4, 8, and 10, for instance. The progress of students, measured as the academic gains between test years, are proportionally attributed to all the teachers who the student has had between the test years. These partial attributions are combined to evaluate an overall teacher performance.8,9
Although the multi-membership framework has been used in other industries, it has yet to be applied in measuring provider performance. The purpose of this project is to investigate the impact of using a multi-provider approach compared to the standard single-provider approach. The findings may lead to modifications in the way a provider’s performance is measured and, thus, how providers are compensated. A similar study investigated the impact of proportionally distributing patients’ outcomes across all rotating providers using a weighting method based on billing practices to measure the partial impact of each provider.3
This study is different in 2 fundamental ways. First, attribution is weighted based on the number of clinically documented interactions (via clinical notes) between a patient and all rotating providers during the hospitalization. Second, performance is measured via multi-membership models, which can estimate the effect (both positive and negative) that a provider has on an outcome, even when caring for a patient a fraction of the time during the hospitalization.
Methods
Setting
Banner Health is a non-profit, multi-hospital health care system across 6 states in the western United States that is uniquely positioned to study provider quality attribution models. It not only has a large number of providers and serves a broad patient population, but Banner Health also uses an instance of Cerner (Kansas City, MO), an enterprise-level electronic health record (EHR) system that connects all its facilities and allows for advanced analytics across its system.
For this study, we included only general medicine and surgery patients admitted and discharged from the inpatient setting between January 1, 2018, and December 31, 2018, who were between 18 and 89 years old at admission, and who had a LOS between 1 and 14 days. Visit- and patient-level data were collected from Cerner, while outcome data, and corresponding expected outcome data, were obtained from Premier, Inc. (Charlotte, NC) using their CareScience methodologies.10 To measure patient experience, response data were extracted from post-discharge surveys administered by InMoment (Salt Lake City, UT).
Provider Attribution Models
Provider Attribution by Physician of Record (PAPR). In the standard approach, denoted here as the PAPR model, 1 provider—typically the attending or discharging provider, which may be the same person—is attributed to the entire hospitalization. This provider is responsible for the patient’s care, and all patient outcomes are aggregated and attributed to the provider to gauge his or her performance. The PAPR model is the most popular form of attribution across many health care systems and is routinely used for P4P incentives.
In this study, the discharging provider was used when attributing hospitalizations using the PAPR model. Providers responsible for fewer than 12 discharges in the calendar year were excluded. Because of the directness of this type of attribution, the performance of 1 provider does not account for the performance of the other rotating providers during hospitalizations.
Provider Attribution by Multiple Membership (PAMM). In contrast, we introduce another attribution approach here that is designed to assign partial attribution to each provider who cares for the patient during the hospitalization. To aggregate the partial attributions, and possibly control for any exogenous or risk-based factors, a multiple-membership, or multi-member (MM), model is used. The MM model can measure the effect of a provider on an outcome even when the patient-to-provider relationship is complex, such as in a rotating provider environment.8
The purpose of this study is to compare attribution models and to determine whether there are meaningful differences between them. Therefore, for comparison purposes, the same discharging providers using the PAPR approach are eligible for the PAMM approach, so that both attribution models are using the same set of providers. All other providers are excluded because their performance would not be comparable to the PAPR approach.
While there are many ways to document provider-to-patient interactions, 2 methods are available in almost all health care systems. The first method is to link a provider’s billing charges to each patient-day combination. This approach limits the attribution to 1 provider per patient per day because multiple rotating providers cannot charge for the same patient-day combination.3 However, many providers interact with a patient on the same day, so using this approach excludes non-billed provider-to-patient interactions.
The second method, which was used in this study, relies on documented clinical notes within the EHR to determine how attribution is shared. In this approach, attribution is weighted based on the authorship of 3 types of eligible clinical notes: admitting history/physical notes (during admission), progress notes (during subsequent days), and discharge summary notes (during final discharge). This will (likely) result in many providers being linked to a patient on each day, which better reflects the clinical setting (Figure). Recently, clinical notes were used to attribute care of patients in an inpatient setting, and it was found that this approach provides a reliable way of tracking interactions and assigning ownership.11
The provider-level attribution weights are based on the share of authorships of eligible note types. Specifically, for each provider j, let aij be the total count of eligible note types for hospitalization i authored by provider j, and let ai be the overall total count of eligible note types for hospitalization i. Then the attribution weight is
(Eq. 1)
for hospitalization i and provider j. Note that ∑jwij = 1: in other words, the total attribution, summed across all providers, is constrained to be 1 for each hospitalization.
Patient Outcomes
Outcomes were chosen based on their routine use in health care systems as standards when evaluating provider performance. This study included 6 outcomes: inpatient LOS, inpatient mortality, 30-day inpatient readmission, and patient responses from 3 survey questions. These outcomes can be collected without any manual chart reviews, and therefore are viewed as objective outcomes of provider performance.
Each outcome was aggregated for each provider using both attribution methods independently. For the PAPR method, observed-to-expected (OE) indices for LOS, mortality, and readmissions were calculated along with average patient survey scores. For the PAMM method, provider-level random effects from the fitted models were used. In both cases, the calculated measures were used for ranking purposes when determining top (or bottom) providers for each outcome.
Individual Provider Metrics for the PAPR Method
Inpatient LOS Index. Hospital inpatient LOS was measured as the number of days between admission date and discharge date. For each hospital visit, an expected LOS was determined using Premier’s CareScience Analytics (CSA) risk-adjustment methodology.10 The CSA methodology for LOS incorporates a patient’s clinical history, demographics, and visit-related administrative information.
Let nj be the number of hospitalizations attributed to provider j. Let oij and eij be the observed and expected LOS, respectively, for hospitalization i = 1,…,nj attributed to provider j. Then the inpatient LOS index for provider j is Lj = ∑ioij⁄∑ieij.
Inpatient Mortality Index. Inpatient mortality was defined as the death of the patient during hospitalization. For each hospitalization, an expected mortality probability was determined using Premier’s CSA risk-adjustment methodology.10 The CSA methodology for mortality incorporates a patient’s demographics and comorbidities.
Just as before, let nj be the number of hospitalizations attributed to provider j. Let mij = 1 if the patient died during hospitalization i = 1, … , nj attributed to provider j; mij = 0 otherwise. Let pij(m) be the corresponding expected mortality probability. Then the inpatient mortality index for provider j is Mj = ∑imij⁄∑ipij(m).
30-Day Inpatient Readmission Index. A 30-day inpatient readmission was defined as the event when a patient is discharged and readmits back into the inpatient setting within 30 days. The inclusion criteria defined by the Centers for Medicare and Medicaid Services (CMS) all-cause hospital-wide readmission measure was used and, consequently, planned readmissions were excluded.12 Readmissions could occur at any Banner hospital, including the same hospital. For each hospital visit, an expected readmission probability was derived using Premier’s CSA risk-adjustment methodology.10 The CSA methodology for readmissions incorporates a patient’s clinical history, demographics, and visit-related administrative information.
Let nj be the number of hospitalizations attributed to provider j. Let rij = 1 if the patient had a readmission following hospitalization i = 1, … , nj attributed to provider j; rij = 0 otherwise. Let pij(r) be the corresponding expected readmission probability. Then the 30-day inpatient readmission index for provider j is Rj = ∑irij ⁄∑ipij(r).
Patient Survey Scores. The satisfaction of the patient’s experience during hospitalization was measured via post-discharge surveys administered by InMoment. Two survey questions were selected because they related directly to a provider’s interaction with the patient: “My interactions with doctors were excellent” (Doctor) and “I received the best possible care” (Care). A third question, “I would recommend this hospital to my family and friends,” was selected as a proxy measure of the overall experience and, in the aggregate, is referred to as the net promoter score (NPS).13,14 The responses were measured on an 11-point Likert scale, ranging from “Strongly Disagree” (0) to “Strongly Agree” (10); “N/A” or missing responses were excluded.
The Likert responses were coded to 3 discrete values as follows: if the value was between 0 and 6, then -1 (ie, detractor); between 7 and 8 (ie, neutral), then 0; otherwise 1 (ie, promoter). Averaging these coded responses results in a patient survey score for each question. Specifically, let nj be the number of hospitalizations attributed to provider j in which the patient responded to the survey question. Let sij ∈{−1, 0, 1} be the coded response linked to hospitalization i = 1, … , nj attributed to provider j. Then the patient experience score for provider j is Sj = ∑isij⁄nj.
Handling Ties in Provider Performance Measures. Because ties can occur in the PAPR approach for all measures, a tie-breaking strategy is needed. For LOS indices, ties are less likely because their numerator is strictly greater than 0, and expected LOS values are typically distinct enough. Indeed, no ties were found in this study for LOS indices. However, mortality and readmission indices can routinely result in ties when the best possible index is achieved, such as 0 deaths or readmissions among attributed hospitalizations. To help differentiate between those indices in the PAPR approach, the total estimated risk (denominator) was utilized as a secondary scoring criterion.
Mortality and readmission metrics were addressed by sorting first by the outcome (mortality index), and second by the denominator (total estimated risk). For example, if provider A has the same mortality rate as provider B, then provider A would be ranked higher if the denominator was larger, indicating a higher risk for mortality.
Similarly, it was very common for providers to have the same overall average rating for a survey question. Therefore, the denominator (number of respondents) was used to break ties. However, the denominator sorting was bidirectional. For example, if the tied score was positive (more promoters than detractors) for providers A and B, then provider A would be ranked higher if the denominator was larger. Conversely, if the tied score between providers A and B was neutral or negative (more detractors than promoters), then provider A would be ranked lower if the denominator was larger.
Individual Provider Metrics for the PAMM Method
For the PAMM method, model-based metrics were derived using a MM model.8 Specifically, let J be the number of rotating providers in a health care system. Let Yi be an outcome of interest from hospitalization i, X1i, …, Xpi be fixed effects or covariates, and ß1, …, ßp be the coefficients for the respective covariates. Then the generalized MM statistical model is
(Eq. 2)
where g(μi ) is a link function between the mean of the outcome, μi, and its linear predictor, ß0, is the marginal intercept, wij represents the attribution weight of provider j on hospitalization i (described in Equation 1), and γj represents the random effect of provider j on the outcome with γj~N(0,σγ2).
For the mortality and readmission binary outcomes, logistic regression was performed using a logit link function, with the corresponding expected probability as the only fixed covariate. The expected probabilities were first converted into odds and then log-transformed before entering the model. For LOS, Poisson regression was performed using a log link function with the log-transformed expected LOS as the only fixed covariate. For coded patient experience responses, an ordered logistic regression was performed using a cumulative logit link function (no fixed effects were added).
MM Model-based Metrics. Each fitted MM model produces a predicted random effect for each provider. The provider-specific random effects can be interpreted as the unobserved influence of each provider on the outcome after controlling for any fixed effect included in the model. Therefore, the provider-specific random effects were used to evaluate the relative provider performance, which is analogous to the individual provider-level metrics used in the PAPR method.
Measuring provider performance using a MM model is more flexible and robust to outliers compared to the standard approach using OE indices or simple averages. First, although not investigated here, the effect of patient-, visit-, provider-, and/or temporal-level covariates can be controlled when evaluating provider performance. For example, a patient’s socioeconomic status, a provider’s workload, and seasonal factors can be added to the MM model. These external factors are not accounted for in OE indices.
Another advantage of using predicted random effects is the concept of “shrinkage.” The process of estimating random effects inherently accounts for small sample sizes (when providers do not treat a large enough sample of patients) and/or when there is a large ratio of patient variance to provider variance (for instance, when patient outcome variability is much higher compared to provider performance variability). In both cases, the estimation of the random effect is pulled ever closer to 0, signaling that the provider performance is closer to the population average. See Henderson15 and Mood16 for further details.
In contrast, OE indices can result in unreliable estimates when a provider has not cared for many patients. This is especially prevalent when the outcome is binary with a low probability of occurring, such as mortality. Indeed, provider-level mortality OE indices are routinely 0 when the patient counts are low, which skews performance rankings unfairly. Finally, OE indices also ignore the magnitude of the variance of an outcome between providers and patients, which can be large.
Comparison Methodology
In this study, we seek to compare the 2 methods of attribution, PAPR and PAMM, to determine whether there are meaningful differences between them when measuring provider performance. Using retrospective data described in the next section, each attribution method was used independently to derive provider-level metrics. To assess relative performance, percentiles were assigned to each provider based on their metric values so that, in the end, there were 2 percentile ranks for each provider for each metric.
Using these paired percentiles, we derived the following measures of concordance, similar to Herzke, Michtalik3: (1) the percent concordance measure—defined as the number of providers who landed in the top half (greater than the median) or bottom half under both attribution models—divided by the total number of providers; (2) the median of the absolute difference in percentiles under both attribution models; and (3) the Pearson correlation coefficient of the paired provider ranks. The first measure is a global measure of concordance between the 2 approaches and would be expected to be 50% by chance. The second measure gauges how an individual provider’s rank is affected by the change in attribution methodologies. The third measure is a statistical measure of linear correlation of the paired percentiles and was not included in the Herzke, Michtalik3 study.
All statistical analyses were performed on SAS (version 9.4; Cary, NC) and the MM models were fitted using PROC GLIMMIX with the EFFECT statement. The Banner Health Institutional Review Board approved this study.
Results
Descriptive Statistics
A total of
Multi-Membership Model Results
Table 3 displays the results after independently fitting MM models to each of the 3 clinical outcomes. Along with a marginal intercept, the only covariate in each model was the corresponding expected value after a transformation. This was added to use the same information that is typically used in OE indices, therefore allowing for a proper comparison between the 2 attribution methods. The provider-level variance represents the between-provider variation and measures the amount of influence providers have on the corresponding outcome after controlling for any covariates in the model. A provider-level variance of 0 would indicate that providers do not have any influence on the outcome. While the mortality and readmission model results can be compared to each other, the LOS model cannot given its different scale and transformation altogether.
The results in Table 3 suggest that each expected value covariate is highly correlated with its corresponding outcome, which is the anticipated conclusion given that they are constructed in this fashion. The estimated provider-level variances indicate that, after including an expected value in the model, providers have less of an influence on a patient’s LOS and likelihood of being readmitted. On the other hand, the results suggest that providers have much more influence on the likelihood of a patient dying in the hospital, even after controlling for an expected mortality covariate.
Table 4 shows the results after independently fitting MM-ordered logistic models to each of the 3 survey questions. The similar provider-level variances suggest that providers have the same influence on the patient’s perception of the quality of their interactions with the doctor (Doctor), the quality of the care they received (Care), and their likelihood to recommend a friend or family member to the hospital (NPS).
Comparison Results Between Both Attribution Methods
Table 5 compares the 2 attribution methods when ranking providers based on their performance on each outcome measure. The comparison metrics gauge how well the 2 methods agree overall (percent concordance), agree at the provider level (absolute percentile difference and interquartile range [IQR]), and how the paired percentiles linearly correlate to each other (Pearson correlation coefficient).
LOS, by a small margin, had the lowest concordance of clinical outcomes (72.1%), followed by mortality (75.9%) and readmissions (82.1%). Generally, the survey scores had higher percent concordance than the clinical outcome measures, with Doctor at 84.1%, Care at 85.9%, and NPS having the highest percent concordance at 86.6%. Given that by chance the percent concordance is expected to be 50%, there was notable discordance, especially with the clinical outcome measures. Using LOS performance as an example, one attribution methodology would rank a provider in the top half or bottom half, while the other attribution methodology would rank the same provider exactly the opposite way about 28% of the time.
The median absolute percentile difference between the 2 methods was more modest (between 7 and 15). Still, there were some providers whose performance ranking was heavily impacted by the attribution methodology that was used. This was especially true when evaluating performance for certain clinical measures, where the attribution method that was used could change the provider performance percentile by up to 90 levels.
The paired percentiles were positively correlated when ranking performance using any of the 6 measures. This suggests that both methodologies assess performance generally in the same direction, irrespective of the methodology and measure. We did not investigate more complex correlation measures and left this for future research.
It should be noted that ties occurred much more frequently with the PAPR method than when using PAMM and therefore required tie-breaking rules to be designed. Given the nature of OE indices, PAPR methodology is especially sensitive to ties whenever the measure includes counting the number of events (for example, mortality and readmissions) and whenever there are many providers with very few attributed patients. On the other hand, using the PAMM method is much more robust against ties given that the summation of all the weighted attributed outcomes will rarely result in ties, even with a nominal set of providers.
Discussion
In this study, the PAMM methodology was introduced and was used to assess relative provider performance on 3 clinical outcome measures and 3 patient survey scores. The new approach aims to distribute each outcome among all providers who provided care for a patient in an inpatient setting. Clinical notes were used to account for patient-to-provider interactions, and fitted MM statistical models were used to compute the effects that each provider had on each outcome. The provider effect was introduced as a random effect, and the set of predicted random effects was used to rank the performance of each provider.
The PAMM approach was compared to the more traditional methodology, PAPR, where each patient is attributed to only 1 provider: the discharging physician in this study. Using this approach, OE indices of clinical outcomes and averages of survey scores were used to rank the performance of each provider. This approach resulted in many ties, which were broken based on the number of hospitalizations, although other tie-breaking methods may be used in practice.
Both methodologies showed modest concordance with each other for the clinical outcomes, but higher concordance for the patient survey scores. This was also true when using the Pearson correlation coefficient to assess agreement. The 1 outcome measure that showed the least concordance and least linear correlation between methods was LOS, which would suggest that LOS performance is more sensitive to the attribution methodology that is used. However, it was the least concordant by a small margin.
Furthermore, although the medians of the absolute percentile differences were small, there were some providers who had large deviations, suggesting that some providers would move from being shown as high-performers to low-performers and vice versa based on the chosen attribution method. We investigated examples of this and determined that the root cause was the difference in effective sample sizes for a provider. For the PAPR method, the effective sample size is simply the number of hospitalizations attributed to the provider. For the PAMM method, the effective sample size is the sum of all non-zero weights across all hospitalizations where the provider cared for a patient. By and large, the PAMM methodology provides more information of the provider effect on an outcome than the PAPR approach because every provider-patient interaction is considered. For example, providers who do not routinely discharge patients, but often care for patients, will have rankings that differ dramatically between the 2 methods.
The PAMM methodology has many statistical advantages that were not fully utilized in this comparative study. For example, we did not include any covariates in the MM models except for the expected value of the outcome, when it was available. Still, it is known that other covariates can impact an outcome as well, such as the patient’s age, socioeconomic indicators, existing chronic conditions, and severity of hospitalization, which can be added to the MM models as fixed effects. In this way, the PAMM approach can control for these other covariates, which are typically outside of the control of providers but typically ignored using OE indices. Therefore, using the PAMM approach would provide a fairer comparison of provider performance.
Using the PAMM method, most providers had a large sample size to assess their performance once all the weighted interactions were included. Still, there were a few who did not care for many patients for a variety of reasons. In these scenarios, MM models “borrow” strength from other providers to produce a more robust predicted provider effect by using a weighted average between the overall population trend and the specific provider outcomes (see Rao and Molina17). As a result, PAMM is a more suitable approach when the sample sizes of patients attributed to providers can be small.
One of the most interesting findings of this study was the relative size of the provider-level variance to the size of the fixed effect in each model (Table 3). Except for mortality, these variances suggest that there is a small difference in performance from one provider to another. However, these should be interpreted as the variance when only 1 provider is involved in the care of a patient. When multiple providers are involved, using basic statistical theory, the overall provider-level variance will be σγ2 ∑wij2 (see Equation 2). For example, the estimated variance among providers for LOS was 0.03 (on a log scale), but, using the scenario in the Figure, the overall provider-level variance for this hospitalization will be 0.03 (0.3752 + 0.1252 + 0.52) = 0.012. Hence, the combined effect of providers on LOS is less than would be expected. Indeed, as more providers are involved with a patient’s care, the more their combined influence on an outcome is diluted.
In this study, the PAMM approach placed an equal weight on all provider-patient interactions via clinical note authorship, but that may not be optimal in some settings. For example, it may make more sense to set a higher weight on the provider who admitted or discharged the patient while placing less (or 0) weight on all other interactions. In the extreme, if the full weight were placed on 1 provider interaction (eg, during discharge, then the MM model would be reduced to a one-way random effects model. The flexibility of weighting interactions is a feature of the PAMM approach, but any weighting framework must be transparent to the providers before implementation.
Conclusion
This study demonstrates that the PAMM approach is a feasible option within a large health care organization. For P4P programs to be successful, providers must be able to trust that their performance will be fairly assessed and that all provider-patient interactions are captured to provide a full comparison amongst their peers. The PAMM methodology is one solution to spread the positive (and negative) outcomes across all providers who cared for a patient and therefore, if implemented, would add trust and fairness when measuring and assessing provider performance.
Acknowledgments: The authors thank Barrie Bradley for his support in the initial stages of this research and Dr. Syed Ismail Jafri for his help and support on the standard approaches of assessing and measuring provider performances.
Corresponding author: Rachel Ginn, MS, Banner Health Corporation, 2901 N. Central Ave., Phoenix, AZ 85012; rachel.ginn@gmail.com.
Financial disclosures: None.
1. Abduljawad A, Al-Assaf AF. Incentives for better performance in health care. Sultan Qaboos Univ Med J. 2011;11:201-206.
2. Milstein R, Schreyoegg J. Pay for performance in the inpatient sector: a review of 34 P4P programs in 14 OECD countries. Health Policy. 2016;120:1125-1140.
3. Herzke CA, Michtalik HJ, Durkin N, et al. A method for attributing patient-level metrics to rotating providers in an inpatient setting. J Hosp Med. 2018;13:470-475.
4. Batbaatar E, Dorjdagva J, Luvsannyam A, Savino MM, Amenta P. Determinants of patient satisfaction: a systematic review. Perspect Public Health. 2017;137:89-101.
5. Ballou D, Sanders W, Wright P. Controlling for student background in value-added assessment of teachers. J Educ Behav Stat. 2004;29:37-65.
6. Hill PW, Goldstein H. Multilevel modeling of educational data with cross-classification and missing identification for units. J Educ Behav Stat. 1998;23:117-128.
7. Rasbash J, Browne WJ. Handbook of Multilevel Analysis. Springer; 2007.
8. Brown WJ, Goldstein H, Rasbash J. Multiple membership multiple classification (MMMC) models. Statistical Modeling. 2001;1:103-124.
9. Sanders WL, Horn SP. The Tennessee Value-Added Assessment System (TVAAS)—mixed-model methodology in educational assessment. J Pers Eval Educ. 1994;8:299-311.
10. Kroch EA, Duan M. CareScience Risk Assessment Model: Hospital Performance Measurement. Premier, Inc., 2008. http://www.ahrq.gov/qual/mortality/KrochRisk.htm
11. Schumacher DJ, Wu DTY, Meganathan K, et al. A feasibility study to attribute patients to primary interns on inpatient ward teams using electronic health record data. Acad Med. 2019;94:1376-1383.
12. Simoes J, Krumholz HM, Lin Z. Hospital-level 30-day risk-standardized readmission measure. Centers for Medicare & Medicaid Services, 2018. https://www.cms.gov/Medicare/Quality-Initiatives-Patient-Assessment-Instruments/HospitalQualityInits/Downloads/Hospital-Wide-All-Cause-Readmission-Updates.zip
13. Krol MW, de Boer D, Delnoij DM, Rademakers JJDJM. The Net Promoter Score: an asset to patient experience surveys? Health Expect. 2015;18:3099-3109.
14. Doyle C, Lennox L, Bell D. A systematic review of evidence on the links between patient experience and clinical safety and effectiveness. BMJ Open. 2013;3:e001570.
15. Henderson CR. Sire evaluation and genetic trends. J Anim Sci. 1973;1973:10-41.
16. Mood AM. Introduction to the Theory of Statistics. McGraw-Hill; 1950:xiii, 433-xiii.
17. Rao JNK, Molina I. Small Area Estimation. Wiley; 2015.
Pharmacists’ Bleed Risk Tool and Treatment Preferences Prior to Initiating Anticoagulation in Patients With Nonvalvular Atrial Fibrillation: A Cross-Sectional Survey
From Nova Southeastern University College of Pharmacy, Fort Lauderdale, FL.
Abstract
- Objective: To determine pharmacists’ preferences in bleed risk tool (BRT) usage and gastroprotection when bleed risk was lower than or equal to stroke risk in patients with nonvalvular atrial fibrillation and who were candidates for oral anticoagulation therapy (warfarin or direct oral anticoagulants [DOACs]).
- Methods: A survey consisting of 4 domains (demographics, clinical experience, BRT usage, and treatment preferences based on cases where bleed risk was lower than or equal to stroke risk) was developed. The anonymous survey was disseminated via REDCap software to members of the American College of Clinical Pharmacy ambulatory care and cardiology Practice-based Research Networks. Descriptive statistics were calculated for all study variables and inferential statistics were employed as necessary.
- Results: Of 165 BRT users, 97% preferred HAS-BLED. When bleed risk was lower than stroke risk, 151 respondents chose either DOACs (65%) or warfarin (35%); 15% added gastroprotection. When bleed risk was equal to stroke risk, 141 respondents chose DOACs (50%), warfarin (45%), or aspirin (5%); 40% added gastroprotection.
- Conclusion: In addition to BRT usage, pharmacists were judicious in their recommendation to add gastroprotection and would consider doing so if there was a specific indication. As more than 80% of extracranial bleeds are gastrointestinal bleeds and most BRTs are nonspecific for predicting these bleeds, randomized, prospective studies stratified by HAS-BLED and stroke risk scores are needed to provide further guidance on the efficacy and safety of oral anticoagulation therapy with or without gastroprotection.
Keywords: NVAF; gastroprotection; proton pump inhibitors; warfarin; oral anticoagulants.
Management of patients with nonvalvular atrial fibrillation (NVAF) with oral anticoagulation therapy (OACT) requires constant attention to maintain a balance between preventing strokes and minimizing bleeds. Several validated bleed risk tools (BRTs) available for use in NVAF patients include HAS-BLED, HEMORR2HAGES, ATRIA, and mOBRI.1,2 A high bleed risk score is not a contraindication to OACT, but, prior to and throughout therapy, bleed risk should be assessed and modifiable risk factors addressed.3 While intraluminal gastrointestinal (GI) bleeds are not considered a critical bleed site, they are a common complication of chronic OACT and can result in hemodynamic compromise and permanent discontinuation of therapy.4,5 In 3233 patients with nonvariceal upper GI bleeds (2005-2016), the adjusted odds ratio of hospital admission, transfusion, and re-bleeding while on OACT (warfarin, heparin, or apixaban) was 3.48, 2.53, and 2.26, respectively.6 Addition of acid-suppressive therapy with a proton pump inhibitor (PPI) or histamine-2 receptor antagonist (H2RA) in NVAF patients at increased risk for upper GI bleeds and receiving OACT may result in fewer bleeds.7,8
Pharmacists play an integral part in managing patients on warfarin,9-11 and data on their role in managing patients receiving direct oral anticoagulants (DOACs) are increasing.12-16 Inpatient pharmacists actively participate in multidisciplinary collaborative teams and use clinical decision-support systems or enhanced monitoring to ensure safe prescribing of high-risk medications.12,15,16 Pharmacist-managed, outpatient-based anticoagulation services in patients on warfarin were associated with lower rates of bleeding and thromboembolic events and lower health care utilization versus routine care.17 However, it is unclear how pharmacists manage patients who are candidates for OACT but who may be at increased risk for upper GI bleeds. Using a US-based survey, the investigators sought to determine pharmacists’ preferences in BRT usage and gastroprotection when bleed risk was lower than or equal to stroke risk.
Methods
This cross-sectional study was conducted after receiving approval by Nova Southeastern University’s Institutional Review Board. The survey consisted of 16 items divided into 4 domains: demographics, clinical experience, use of BRTs, and treatment preferences based on cases where bleed risk was lower than or equal to stroke risk (Figure 1). Queries were multiple choice and allowed for free-text input when “Other” was selected. Licensed pharmacists ≥ 18 years of age who routinely provided care to patients with NVAF were eligible to participate in the study. Participants who reported using a BRT (users) completed all study domains, while participants who reported not using a BRT (nonusers) completed domains 1 through 3 only.

An invitation containing the survey link was sent to the American College of Clinical Pharmacy ambulatory care (n = 2237) and cardiology (n = 1318) pharmacists listed in the organization’s Practice-based Research Networks. The survey was administered in the United States between April and June 2016 via Research Electronic Data Capture (REDCap) software, a secure Web application for building and managing online surveys designed to support data collection for research studies.18
Survey responses were downloaded, and data were analyzed using NCSS 2019 Statistical Software, LLC (Kaysville, UT). Descriptive statistics were calculated for all study variables. Demographic and clinical experience data for the group that used a BRT versus the group that did not were compared using Pearson’s chi-square, ANOVA, or the Cochran-Armitage test for trends. Logistic regression with hierarchical forward selection with switching was used to identify predictors of drug selection and use of gastroprotection.
Results
Of 230 respondents who completed the survey (response rate 6.5%), 165 (72%) used a BRT and 65 (28%) did not. No significant differences were found for age, gender, duration in clinical practice, the percentage of time spent in patient care, or practice specialty between users and nonusers (Table). The median age of users was 32 years; 68% were females; the median duration in clinical practice was 6 years; 75% of their time was spent in clinical practice; and clinical settings included ambulatory care, cardiology, and internal medicine. A significant difference was found for practice region between users versus nonusers (P = 0.014). Respondents who managed more than 200 NVAF patients per year used a BRT more often than those who managed fewer than 100 NVAF patients per year (P = 0.001).

Of those who used a BRT, 97% utilized the HAS-BLED tool (n = 160). The remainder used HEMORR2HAGES (n = 3), ATRIA (n = 1), and mOBRI (n = 1). Reasons for choosing HAS-BLED included “familiarity/ease-of-use,” “preference by institution/clinical team,” and the fact that it was a “validated tool for NVAF.”
When bleed risk was lower than stroke risk, 151 of 165 users (92%) chose a treatment option (Figure 2). Of those, 65% chose a DOAC and 35% chose warfarin. Fourteen respondents chose “other” and explained that they “would initiate OACT after weighing patient factors and preferences.” When a DOAC was selected, 9% (n = 9) chose PPI co-therapy and 4% (n = 4) chose a H2RA. When warfarin was selected, 13% (n = 7) chose PPI co-therapy and 4% (n = 2) chose a H2RA. Respondents who chose gastroprotection did not provide reasons for doing so, but those who did not add it explained that they “would add gastroprotection only if patient is also on an NSAID or has a history of GI bleed” or cited “patient preference.” Specific to warfarin, some respondents would not add gastroprotection, as anticoagulation with warfarin is “easily reversed.”
")
When bleed risk was equal to stroke risk, 141 of 165 users (85%) chose a treatment option (Figure 3). Fifty percent chose DOACs, 45% chose warfarin, and 5% chose aspirin.
")
Of respondents who selected either a DOAC or warfarin, 38% (n = 50) also added gastroprotection (Figure 3). When a DOAC was selected, 34% (n = 24) favored PPI co-therapy and 7% (n = 5) chose a H2RA. When warfarin was selected, 19% (n = 12) favored PPI co-therapy, while 13% (n = 8) chose a H2RA. Rationale for choosing gastroprotection, regardless of OACT selection, included “stroke is more devastating, so if patient wants to continue treatment, but knew risks of bleeding were similar, would recommend gastroprotection to help minimize bleeding risk” and “patient-specific consideration.” Rationales for not choosing gastroprotection included “would add gastroprotection only if patient is on dual antiplatelet therapy or has another indication”; “in most patients, stroke risk outweighs bleed risk so no need for gastroprotection unless there is a stated reason”; “would use apixaban as has lowest bleeding rate of all DOACs in clinical trials”; and “gastroprotection has not been shown to be beneficial in large scale trials.”
Eight respondents chose aspirin because it was “easy and relatively low cost.” Twenty-four respondents chose “other” and explained that the choice of OACT depended on patient preference after they had discussed stroke and bleed risk with the patient and/or determined the etiology driving bleed risk.
Discussion
This is the first national survey exploring US pharmacists’ preferences in BRT usage and treatment based on bleed risk. Pharmacists preferred the HAS-BLED tool and considered patient-specific factors and evidence-based data when weighing the risk-benefit of OACT with or without gastroprotective therapy.
Similar to our findings, where three-quarters of pharmacists used a BRT, a recent Medscape/American College of Cardiology (ACC) survey reported that 74% of cardiologists used a BRT (eg, HAS-BLED) always/most of the time or sometimes to assess a patient’s overall risk of bleeding prior to initiating DOAC therapy; 27% never or rarely used a bleed risk score before prescribing DOACs.19 Although reasons for BRT preference were not provided, they may be similar to those reported by our respondents (ie, familiarity/ease-of-use). In both surveys, rationales for not using a BRT were not obtained, but possible reasons include lack of confidence with bleed risk calculators,20 inconsistent implementation of comprehensive assessments (stroke risk, bleed risk, and medication-related issues prior to decision-making),21 and nonspecific guideline recommendations.22
More recently, a network meta-analysis found that HAS-BLED and HEMORR2HAGES had modest but balanced sensitivity (
Although more than 80% of extracranial bleeds are GI bleeds,24 most BRTs are nonspecific for predicting GI bleeds. Indeed, one respondent used a spreadsheet with several BRTs to maximize treatment guidance for patients with multiple risk factors for strokes and bleeds. A comprehensive approach to determining factors that increase bleed risk should be adopted. These factors include age (HAS-BLED, HEMORR2HAGES, mOBRI, ATRIA); anemia (mOBRI, HEMORR2HAGES, ATRIA); hepatic/renal disease (HAS-BLED, HEMORR2HAGES, ATRIA, mOBRI); concomitant medications/alcohol use, including NSAIDs, corticosteroids, and antiplatelet therapy (HAS-BLED, HEMORR2HAGES); bleed history/rebleeding risk (HEMORR2HAGES, HAS-BLED, ATRIA); and GI bleeds (mOBRI).1,2 Additional risk factors for GI bleeds include being a tobacco smoker and/or being infected with Helicobacter pylori. A prospective cohort study that analyzed data from questionnaires completed by 99,359 individuals from the Copenhagen General Population Study reported that the multivariable adjusted hazard ratio for current smokers versus never smokers was 2.20 (95% CI, 1.84-2.62) for GI bleeds.25 Presence of H pylori should be investigated, with a subsequent eradication regimen implemented, as patients with warfarin-associated upper GI bleeds who were H pylori-positive had lower HAS-BLED scores versus those who were negative.26
When bleed risk was lower than stroke risk (eg, HAS-BLED < 3, CHA2DS2VASc ≥ 1), respondents appropriately initiated therapy with an OAC (predominantly apixaban); a small proportion also added gastroprotection. If the patient did not have any other GI bleed risk factors (eg, a previous GI bleed or on chronic antiplatelet or NSAID therapy), the choice of OACT depended on the attributes of each OAC and patient preference.27 Selection of warfarin was appropriate if cost, formulary restrictions, and availability of an inexpensive reversal agent were important concerns to patients and/or their health care providers. Rivaroxaban was selected because of its once-daily dosing and low risk for GI bleeding.
The recently published ARISTOPHANES study provides evidence that apixaban is an appropriate choice in patients with a HAS-BLED score < 3. In this retrospective observational study, more than 70% of patients received standard doses of DOACs (apixaban 5 mg, dabigatran 150 mg, or rivaroxaban 20 mg) and about 20% had a bleeding history, about 30% were on PPIs, less than 25% were on NSAIDs, and about 40% had a HAS-BLED score < 3. The study found that apixaban was more effective (reduced rates of ischemic or hemorrhagic strokes/systemic embolism) and safer (reduced rates of major GI bleed or intracranial bleed) than warfarin.28 Dabigatran and rivaroxaban were also more effective than warfarin for stroke prevention and had a lower risk for major intracranial bleed risk; while the risk of major GI bleed was similar between dabigatran and warfarin, major GI bleed risk was higher for rivaroxaban. When compared with each other, the 3 DOACs were effective at stroke prevention, with apixaban more effective than dabigatran and rivaroxaban; similar efficacy was noted for dabigatran versus rivaroxaban. Apixaban was associated with fewer GI bleeds versus dabigatran and rivaroxaban, but with similar intracranial bleed risks; dabigatran was associated with fewer GI bleeds but similar intracranial bleed risks versus rivaroxaban.28 Efficacy and safety findings from a subgroup analysis based on HAS-BLED scores < 3 and ≥ 3 were generally consistent with the main results.
When bleed risk was equal to stroke risk, the difficulty was determining how OACT in a patient at high stroke risk (CHA2DS2VASc score ≥ 2) and high bleed risk (HAS-BLED score ≥ 3) should be managed.
Another important finding was pharmacists’ uncertainty as to the effectiveness of PPIs in preventing GI bleeds in combination with DOACs. The data are conflicting. A meta-analysis of older studies (2007-2015) showed that PPIs (but not H2RAs) reduced the risk of upper GI bleeds in patients on warfarin but not for dabigatran
Limitations
Limitations of our survey included an overall low response rate,
Conclusion
In addition to applying BRTs in the management of NVAF patients, pharmacists considered patient-specific variables, prescriber preferences, and evidence-based guidance when recommending OACT with or without gastroprotection. To avoid suboptimal patient management, busy pharmacists should be granted time to attend continuing education programs describing optimal OACT selection and formulation of individualized, evidence-based plans to address modifiable risk factors for bleeding, including the appropriate use of gastroprotection. Randomized, prospective, long-term studies stratified by HAS-BLED and CHA2DS2VASc scores are needed to further clarify efficacy, safety, and cost-effectiveness of OACT, with and without PPIs, in patients who may be at risk for upper GI bleeds.
Acknowledgments:
Corresponding author: Devada Singh-Franco, PharmD, CDE, Nova Southeastern University College of Pharmacy, 3200 S University Drive, Fort Lauderdale, FL 33328; singh@nova.edu
Disclosures: None.
Funding: The study was supported by Nova Southeastern University’s Health Professions Division Internal Research Grant.
1. Apostolakis S, Lane DA, Guo Y, et al. Performance of the HEMORR2HAGES, ATRIA, and HAS-BLED bleeding risk–prediction scores in patients with atrial fibrillation undergoing anticoagulation. J Am Coll Cardiol. 2012;60:861-867.
2. Chang G, Xie Q, Ma L, et al. Accuracy of HAS-BLED and other bleeding risk assessment tools in predicting major bleeding events in atrial fibrillation: A network meta-analysis. J Thromb Haemost. 2020;18:791-801.
3. Ding WY, Harrison SL, Lane DA, Lip GYH. Considerations when choosing an appropriate bleeding risk assessment tool for patients with atrial fibrillation. J Thromb Haemost. 2020;18:788-790.
4. Lauffenburger JC, Rhoney DH, Farley JF, et al. Predictors of gastrointestinal bleeding among patients with atrial fibrillation after initiating dabigatran therapy. Pharmacotherapy. 2015;35:560-568.
5. Tomaselli GF, Mahaffey KW, Cuker A, et al. 2020 ACC Expert Consensus Decision Pathway on Management of Bleeding in Patients on Oral Anticoagulants: A Report of the American College of Cardiology Solution Set Oversight Committee. J Am Coll Cardiol. 2020;76:594-622.
6. Taha A, McCloskey C, Craigen T, Angerson W. Antiplatelet versus anticoagulant effects in non-variceal upper gastrointestinal bleeding. Gut. 2019;68(suppl 2):A152.
7. Chan EW, Lau WC, Leung WK, et al. Prevention of dabigatran-related gastrointestinal bleeding with gastroprotective agents: A population-based study. Gastroenterology. 2015;149:586-595.
8. Ray WA, Chung CP, Murray KT, et al. Association of oral anticoagulants and proton pump inhibitor cotherapy with hospitalization for upper gastrointestinal tract bleeding. JAMA. 2018;320:2221-2230.
9. Brunetti L, Lee S-M, Doherty N, et al. Impact of warfarin discharge education program on hospital readmission and treatment costs. Int J Clin Pharm. 2018;40:721-729.
10. Hasan SS, Kow CS, Curley LE, et al. Economic evaluation of prescribing conventional and newer oral anticoagulants in older adults. Expert Rev Pharmacoecon Outcomes Res. 2018;18:371-377.
11. Phelps E, Delate T, Witt DM, et al. Effect of increased time in the therapeutic range on atrial fibrillation outcomes within a centralized anticoagulation service. Thromb Res. 2018;163:54-59.
12. Ahuja T, Raco V, Papadopoulos J, Green D. Antithrombotic stewardship: Assessing use of computerized clinical decision support tools to enhance safe prescribing of direct oral anticoagulants in hospitalized patients. J Patient Saf. 2018 Sep 25. [Epub ahead of print]
13. Leef GC, Perino AC, Askari M, et al. Appropriateness of direct oral anticoagulant dosing in patients with atrial fibrillation: Insights from the Veterans Health Administration. J Pharm Pract. 2020;33:647-653.
14. Papastergiou J, Kheir N, Ladova K, et al. Pharmacists’ confidence when providing pharmaceutical care on anticoagulants, a multinational survey. Int J Clin Pharm. 2017;39:1282-1290.
15. Perlman A, Horwitz E, Hirsh-Raccah B, et al. Clinical pharmacist led hospital-wide direct oral anticoagulant stewardship program. Isr J Health Policy Res. 2019;8:19.
16. Uppuluri EM, McComb MN, Shapiro NL. Implementation of a direct oral anticoagulation screening service at a large academic medical center provided by a pharmacist-managed antithrombosis clinic as a method to expand antithrombotic stewardship efforts. J Pharm Pract. 2020;33:271-275.
17. Manzoor BS, Cheng W-H, Lee JC, et al. Quality of pharmacist-managed anticoagulation therapy in long-term ambulatory settings: A systematic review. Ann Pharmacother. 2017;51:1122-1137.
18. Harris PA, Taylor R, Thielke R, et al. Research Electronic Data Capture (REDCap)—A metadata-driven methodology and workflow process for providing translational research informatics support. J Biomed Inform. 2009;42:377-381.
19. Brooks M. AF management: Are clinicians in agreement? Medscape. May 30, 2019. Accessed December 29, 2020. https://www.medscape.com/viewarticle/913386
20. Amroze A, Mazor K, Crawford S, et al. Survey of confidence in use of stroke and bleeding risk calculators, knowledge of anticoagulants, and comfort with prescription of anticoagulation in challenging scenarios: SUPPORT-AF II study. J Thromb Thrombolysis. 2019;48:629-637.
21. Wang Y, Bajorek B. Decision-making around antithrombotics for stroke prevention in atrial fibrillation: the health professionals’ views. Int J Clin Pharm. 2016;38:985-995.
22. January CT, Wann LS, Alpert JS, et al. 2014 AHA/ACC/HRS guideline for the management of patients with atrial fibrillation: a report of the American College of Cardiology/American Heart Association Task Force on Practice Guidelines and the Heart Rhythm Society. Circulation. 2014;130:e199-e267.
23. January CT, Wann LS, Calkins H, et al. 2019 AHA/ACC/HRS Focused Update of the 2014 AHA/ACC/HRS Guideline for the Management of Patients With Atrial Fibrillation: A Report of the American College of Cardiology/American Heart Association Task Force on Clinical Practice Guidelines and the Heart Rhythm Society. J Am Coll Cardiol. 2019;74:104-132.
24. Anghel L, Sascu R, Trifan A, et al. Non-vitamin K antagonist oral anticoagulants and the gastrointestinal bleeding risk in real-world studies. J Clin Med. 2020;9:1398.
25. Langsted A, Nordestgaard BG. Smoking is associated with increased risk of major bleeding: a prospective cohort study. Thromb Haemost. 2019;119:39-47.
26. Faye AS, Hung KW, Cheng K, et al. HAS-BLED scores underestimate gastrointestinal bleeding risk among those with H. pylori. Am J Gastroenterol. 2019;114:S364.
27. Fawzy AM, Yang W-Y, Lip GY. Safety of direct oral anticoagulants in real-world clinical practice: translating the trials to everyday clinical management. Expert Opin Drug Saf. 2019;18:187-209.
28. Lip GYH, Keshishian A, Li X, et al. Effectiveness and safety of oral anticoagulants among nonvalvular atrial fibrillation patients. Stroke. 2018;49:2933-2944.
29. Abraham NS, Singh S, Alexander GC, et al. Comparative risk of gastrointestinal bleeding with dabigatran, rivaroxaban, and warfarin: population based cohort study. BMJ. 2015;350:h1857.
30. Holster IL, Valkhoff VE, Kuipers EJ, Tjwa E. New oral anticoagulants increase risk for gastrointestinal bleeding: a systematic review and meta-analysis. Gastroenterology. 2013;145:105-112.
31. Sherwood MW, Nessel CC, Hellkamp AS, et al. Gastrointestinal bleeding in patients with atrial fibrillation treated with rivaroxaban or warfarin: ROCKET AF Trial. J Am Coll Cardiol. 2015;66:2271-2281.
32. Di Minno A, Spadarella G, Spadarella E, et al. Gastrointestinal bleeding in patients receiving oral anticoagulation: Current treatment and pharmacological perspectives. Thromb Res. 2015;136:1074-1081.
33. Abraham NS, Hlatky MA, Antman EM, et al. ACCF/ACG/AHA 2010 Expert Consensus Document on the Concomitant Use of Proton Pump Inhibitors and Thienopyridines: A Focused Update of the ACCF/ACG/AHA 2008 Expert Consensus Document on Reducing the Gastrointestinal Risks of Antiplatelet Therapy and NSAID Use. Circulation. 2010;122:2619-2633.
34. Bhatt DL, Scheiman J, Abraham NS, et al. ACCF/ACG/AHA 2008 expert consensus document on reducing the gastrointestinal risks of antiplatelet therapy and NSAID use: a report of the American College of Cardiology Foundation Task Force on Clinical Expert Consensus Documents. J Am Coll Cardiol. 2008;52:1502-1517.
35. Lanza FL, Chan FK, Quigley EM. Guidelines for prevention of NSAID-related ulcer complications. Am J Gastroenterol. 2009;104:728-738.
36. Bang CS, Joo MK, Kim BW, et al. The role of acid suppressants in the prevention of anticoagulant-related gastrointestinal bleeding: a systematic review and meta-analysis. Gut Liver. 2020;14:57-66.
37. Farrell B, Pottie K, Thompson W, et al. Deprescribing proton pump inhibitors: Evidence-based clinical practice guideline. Can Fam Physician. 2017;63:354-364.
38. Fossmark R, Martinsen TC, Waldum HL. Adverse effects of proton pump inhibitors—evidence and plausibility. Int J Mol Sci. 2019;20:5203.
39. Haastrup PF, Thompson W, Sondergaard J, Jarbol DE. Side effects of long-term proton pump inhibitor use: A review. Basic Clin Pharmacol Toxicol. 2018;123:114-121.
40. Wong JM, Maddox TM, Kennedy K, Shaw RE. Comparing major bleeding risk in outpatients with atrial fibrillation or flutter by oral anticoagulant type (from the National Cardiovascular Disease Registry’s Practice Innovation and Clinical Excellence Registry). Am J Cardiol. 2020;125:1500-1507.
41. Nagata N, Niikura R, Aoki T, et al. Effect of proton-pump inhibitors on the risk of lower gastrointestinal bleeding associated with NSAIDs, aspirin, clopidogrel, and warfarin. J Gastroenterol. 2015;50:1079-1086.
From Nova Southeastern University College of Pharmacy, Fort Lauderdale, FL.
Abstract
- Objective: To determine pharmacists’ preferences in bleed risk tool (BRT) usage and gastroprotection when bleed risk was lower than or equal to stroke risk in patients with nonvalvular atrial fibrillation and who were candidates for oral anticoagulation therapy (warfarin or direct oral anticoagulants [DOACs]).
- Methods: A survey consisting of 4 domains (demographics, clinical experience, BRT usage, and treatment preferences based on cases where bleed risk was lower than or equal to stroke risk) was developed. The anonymous survey was disseminated via REDCap software to members of the American College of Clinical Pharmacy ambulatory care and cardiology Practice-based Research Networks. Descriptive statistics were calculated for all study variables and inferential statistics were employed as necessary.
- Results: Of 165 BRT users, 97% preferred HAS-BLED. When bleed risk was lower than stroke risk, 151 respondents chose either DOACs (65%) or warfarin (35%); 15% added gastroprotection. When bleed risk was equal to stroke risk, 141 respondents chose DOACs (50%), warfarin (45%), or aspirin (5%); 40% added gastroprotection.
- Conclusion: In addition to BRT usage, pharmacists were judicious in their recommendation to add gastroprotection and would consider doing so if there was a specific indication. As more than 80% of extracranial bleeds are gastrointestinal bleeds and most BRTs are nonspecific for predicting these bleeds, randomized, prospective studies stratified by HAS-BLED and stroke risk scores are needed to provide further guidance on the efficacy and safety of oral anticoagulation therapy with or without gastroprotection.
Keywords: NVAF; gastroprotection; proton pump inhibitors; warfarin; oral anticoagulants.
Management of patients with nonvalvular atrial fibrillation (NVAF) with oral anticoagulation therapy (OACT) requires constant attention to maintain a balance between preventing strokes and minimizing bleeds. Several validated bleed risk tools (BRTs) available for use in NVAF patients include HAS-BLED, HEMORR2HAGES, ATRIA, and mOBRI.1,2 A high bleed risk score is not a contraindication to OACT, but, prior to and throughout therapy, bleed risk should be assessed and modifiable risk factors addressed.3 While intraluminal gastrointestinal (GI) bleeds are not considered a critical bleed site, they are a common complication of chronic OACT and can result in hemodynamic compromise and permanent discontinuation of therapy.4,5 In 3233 patients with nonvariceal upper GI bleeds (2005-2016), the adjusted odds ratio of hospital admission, transfusion, and re-bleeding while on OACT (warfarin, heparin, or apixaban) was 3.48, 2.53, and 2.26, respectively.6 Addition of acid-suppressive therapy with a proton pump inhibitor (PPI) or histamine-2 receptor antagonist (H2RA) in NVAF patients at increased risk for upper GI bleeds and receiving OACT may result in fewer bleeds.7,8
Pharmacists play an integral part in managing patients on warfarin,9-11 and data on their role in managing patients receiving direct oral anticoagulants (DOACs) are increasing.12-16 Inpatient pharmacists actively participate in multidisciplinary collaborative teams and use clinical decision-support systems or enhanced monitoring to ensure safe prescribing of high-risk medications.12,15,16 Pharmacist-managed, outpatient-based anticoagulation services in patients on warfarin were associated with lower rates of bleeding and thromboembolic events and lower health care utilization versus routine care.17 However, it is unclear how pharmacists manage patients who are candidates for OACT but who may be at increased risk for upper GI bleeds. Using a US-based survey, the investigators sought to determine pharmacists’ preferences in BRT usage and gastroprotection when bleed risk was lower than or equal to stroke risk.
Methods
This cross-sectional study was conducted after receiving approval by Nova Southeastern University’s Institutional Review Board. The survey consisted of 16 items divided into 4 domains: demographics, clinical experience, use of BRTs, and treatment preferences based on cases where bleed risk was lower than or equal to stroke risk (Figure 1). Queries were multiple choice and allowed for free-text input when “Other” was selected. Licensed pharmacists ≥ 18 years of age who routinely provided care to patients with NVAF were eligible to participate in the study. Participants who reported using a BRT (users) completed all study domains, while participants who reported not using a BRT (nonusers) completed domains 1 through 3 only.
An invitation containing the survey link was sent to the American College of Clinical Pharmacy ambulatory care (n = 2237) and cardiology (n = 1318) pharmacists listed in the organization’s Practice-based Research Networks. The survey was administered in the United States between April and June 2016 via Research Electronic Data Capture (REDCap) software, a secure Web application for building and managing online surveys designed to support data collection for research studies.18
Survey responses were downloaded, and data were analyzed using NCSS 2019 Statistical Software, LLC (Kaysville, UT). Descriptive statistics were calculated for all study variables. Demographic and clinical experience data for the group that used a BRT versus the group that did not were compared using Pearson’s chi-square, ANOVA, or the Cochran-Armitage test for trends. Logistic regression with hierarchical forward selection with switching was used to identify predictors of drug selection and use of gastroprotection.
Results
Of 230 respondents who completed the survey (response rate 6.5%), 165 (72%) used a BRT and 65 (28%) did not. No significant differences were found for age, gender, duration in clinical practice, the percentage of time spent in patient care, or practice specialty between users and nonusers (Table). The median age of users was 32 years; 68% were females; the median duration in clinical practice was 6 years; 75% of their time was spent in clinical practice; and clinical settings included ambulatory care, cardiology, and internal medicine. A significant difference was found for practice region between users versus nonusers (P = 0.014). Respondents who managed more than 200 NVAF patients per year used a BRT more often than those who managed fewer than 100 NVAF patients per year (P = 0.001).
Of those who used a BRT, 97% utilized the HAS-BLED tool (n = 160). The remainder used HEMORR2HAGES (n = 3), ATRIA (n = 1), and mOBRI (n = 1). Reasons for choosing HAS-BLED included “familiarity/ease-of-use,” “preference by institution/clinical team,” and the fact that it was a “validated tool for NVAF.”
When bleed risk was lower than stroke risk, 151 of 165 users (92%) chose a treatment option (Figure 2). Of those, 65% chose a DOAC and 35% chose warfarin. Fourteen respondents chose “other” and explained that they “would initiate OACT after weighing patient factors and preferences.” When a DOAC was selected, 9% (n = 9) chose PPI co-therapy and 4% (n = 4) chose a H2RA. When warfarin was selected, 13% (n = 7) chose PPI co-therapy and 4% (n = 2) chose a H2RA. Respondents who chose gastroprotection did not provide reasons for doing so, but those who did not add it explained that they “would add gastroprotection only if patient is also on an NSAID or has a history of GI bleed” or cited “patient preference.” Specific to warfarin, some respondents would not add gastroprotection, as anticoagulation with warfarin is “easily reversed.”
When bleed risk was equal to stroke risk, 141 of 165 users (85%) chose a treatment option (Figure 3). Fifty percent chose DOACs, 45% chose warfarin, and 5% chose aspirin.
Of respondents who selected either a DOAC or warfarin, 38% (n = 50) also added gastroprotection (Figure 3). When a DOAC was selected, 34% (n = 24) favored PPI co-therapy and 7% (n = 5) chose a H2RA. When warfarin was selected, 19% (n = 12) favored PPI co-therapy, while 13% (n = 8) chose a H2RA. Rationale for choosing gastroprotection, regardless of OACT selection, included “stroke is more devastating, so if patient wants to continue treatment, but knew risks of bleeding were similar, would recommend gastroprotection to help minimize bleeding risk” and “patient-specific consideration.” Rationales for not choosing gastroprotection included “would add gastroprotection only if patient is on dual antiplatelet therapy or has another indication”; “in most patients, stroke risk outweighs bleed risk so no need for gastroprotection unless there is a stated reason”; “would use apixaban as has lowest bleeding rate of all DOACs in clinical trials”; and “gastroprotection has not been shown to be beneficial in large scale trials.”
Eight respondents chose aspirin because it was “easy and relatively low cost.” Twenty-four respondents chose “other” and explained that the choice of OACT depended on patient preference after they had discussed stroke and bleed risk with the patient and/or determined the etiology driving bleed risk.
Discussion
This is the first national survey exploring US pharmacists’ preferences in BRT usage and treatment based on bleed risk. Pharmacists preferred the HAS-BLED tool and considered patient-specific factors and evidence-based data when weighing the risk-benefit of OACT with or without gastroprotective therapy.
Similar to our findings, where three-quarters of pharmacists used a BRT, a recent Medscape/American College of Cardiology (ACC) survey reported that 74% of cardiologists used a BRT (eg, HAS-BLED) always/most of the time or sometimes to assess a patient’s overall risk of bleeding prior to initiating DOAC therapy; 27% never or rarely used a bleed risk score before prescribing DOACs.19 Although reasons for BRT preference were not provided, they may be similar to those reported by our respondents (ie, familiarity/ease-of-use). In both surveys, rationales for not using a BRT were not obtained, but possible reasons include lack of confidence with bleed risk calculators,20 inconsistent implementation of comprehensive assessments (stroke risk, bleed risk, and medication-related issues prior to decision-making),21 and nonspecific guideline recommendations.22
More recently, a network meta-analysis found that HAS-BLED and HEMORR2HAGES had modest but balanced sensitivity (
Although more than 80% of extracranial bleeds are GI bleeds,24 most BRTs are nonspecific for predicting GI bleeds. Indeed, one respondent used a spreadsheet with several BRTs to maximize treatment guidance for patients with multiple risk factors for strokes and bleeds. A comprehensive approach to determining factors that increase bleed risk should be adopted. These factors include age (HAS-BLED, HEMORR2HAGES, mOBRI, ATRIA); anemia (mOBRI, HEMORR2HAGES, ATRIA); hepatic/renal disease (HAS-BLED, HEMORR2HAGES, ATRIA, mOBRI); concomitant medications/alcohol use, including NSAIDs, corticosteroids, and antiplatelet therapy (HAS-BLED, HEMORR2HAGES); bleed history/rebleeding risk (HEMORR2HAGES, HAS-BLED, ATRIA); and GI bleeds (mOBRI).1,2 Additional risk factors for GI bleeds include being a tobacco smoker and/or being infected with Helicobacter pylori. A prospective cohort study that analyzed data from questionnaires completed by 99,359 individuals from the Copenhagen General Population Study reported that the multivariable adjusted hazard ratio for current smokers versus never smokers was 2.20 (95% CI, 1.84-2.62) for GI bleeds.25 Presence of H pylori should be investigated, with a subsequent eradication regimen implemented, as patients with warfarin-associated upper GI bleeds who were H pylori-positive had lower HAS-BLED scores versus those who were negative.26
When bleed risk was lower than stroke risk (eg, HAS-BLED < 3, CHA2DS2VASc ≥ 1), respondents appropriately initiated therapy with an OAC (predominantly apixaban); a small proportion also added gastroprotection. If the patient did not have any other GI bleed risk factors (eg, a previous GI bleed or on chronic antiplatelet or NSAID therapy), the choice of OACT depended on the attributes of each OAC and patient preference.27 Selection of warfarin was appropriate if cost, formulary restrictions, and availability of an inexpensive reversal agent were important concerns to patients and/or their health care providers. Rivaroxaban was selected because of its once-daily dosing and low risk for GI bleeding.
The recently published ARISTOPHANES study provides evidence that apixaban is an appropriate choice in patients with a HAS-BLED score < 3. In this retrospective observational study, more than 70% of patients received standard doses of DOACs (apixaban 5 mg, dabigatran 150 mg, or rivaroxaban 20 mg) and about 20% had a bleeding history, about 30% were on PPIs, less than 25% were on NSAIDs, and about 40% had a HAS-BLED score < 3. The study found that apixaban was more effective (reduced rates of ischemic or hemorrhagic strokes/systemic embolism) and safer (reduced rates of major GI bleed or intracranial bleed) than warfarin.28 Dabigatran and rivaroxaban were also more effective than warfarin for stroke prevention and had a lower risk for major intracranial bleed risk; while the risk of major GI bleed was similar between dabigatran and warfarin, major GI bleed risk was higher for rivaroxaban. When compared with each other, the 3 DOACs were effective at stroke prevention, with apixaban more effective than dabigatran and rivaroxaban; similar efficacy was noted for dabigatran versus rivaroxaban. Apixaban was associated with fewer GI bleeds versus dabigatran and rivaroxaban, but with similar intracranial bleed risks; dabigatran was associated with fewer GI bleeds but similar intracranial bleed risks versus rivaroxaban.28 Efficacy and safety findings from a subgroup analysis based on HAS-BLED scores < 3 and ≥ 3 were generally consistent with the main results.
When bleed risk was equal to stroke risk, the difficulty was determining how OACT in a patient at high stroke risk (CHA2DS2VASc score ≥ 2) and high bleed risk (HAS-BLED score ≥ 3) should be managed.
Another important finding was pharmacists’ uncertainty as to the effectiveness of PPIs in preventing GI bleeds in combination with DOACs. The data are conflicting. A meta-analysis of older studies (2007-2015) showed that PPIs (but not H2RAs) reduced the risk of upper GI bleeds in patients on warfarin but not for dabigatran
Limitations
Limitations of our survey included an overall low response rate,
Conclusion
In addition to applying BRTs in the management of NVAF patients, pharmacists considered patient-specific variables, prescriber preferences, and evidence-based guidance when recommending OACT with or without gastroprotection. To avoid suboptimal patient management, busy pharmacists should be granted time to attend continuing education programs describing optimal OACT selection and formulation of individualized, evidence-based plans to address modifiable risk factors for bleeding, including the appropriate use of gastroprotection. Randomized, prospective, long-term studies stratified by HAS-BLED and CHA2DS2VASc scores are needed to further clarify efficacy, safety, and cost-effectiveness of OACT, with and without PPIs, in patients who may be at risk for upper GI bleeds.
Acknowledgments:
Corresponding author: Devada Singh-Franco, PharmD, CDE, Nova Southeastern University College of Pharmacy, 3200 S University Drive, Fort Lauderdale, FL 33328; singh@nova.edu
Disclosures: None.
Funding: The study was supported by Nova Southeastern University’s Health Professions Division Internal Research Grant.
1. Apostolakis S, Lane DA, Guo Y, et al. Performance of the HEMORR2HAGES, ATRIA, and HAS-BLED bleeding risk–prediction scores in patients with atrial fibrillation undergoing anticoagulation. J Am Coll Cardiol. 2012;60:861-867.
2. Chang G, Xie Q, Ma L, et al. Accuracy of HAS-BLED and other bleeding risk assessment tools in predicting major bleeding events in atrial fibrillation: A network meta-analysis. J Thromb Haemost. 2020;18:791-801.
3. Ding WY, Harrison SL, Lane DA, Lip GYH. Considerations when choosing an appropriate bleeding risk assessment tool for patients with atrial fibrillation. J Thromb Haemost. 2020;18:788-790.
4. Lauffenburger JC, Rhoney DH, Farley JF, et al. Predictors of gastrointestinal bleeding among patients with atrial fibrillation after initiating dabigatran therapy. Pharmacotherapy. 2015;35:560-568.
5. Tomaselli GF, Mahaffey KW, Cuker A, et al. 2020 ACC Expert Consensus Decision Pathway on Management of Bleeding in Patients on Oral Anticoagulants: A Report of the American College of Cardiology Solution Set Oversight Committee. J Am Coll Cardiol. 2020;76:594-622.
6. Taha A, McCloskey C, Craigen T, Angerson W. Antiplatelet versus anticoagulant effects in non-variceal upper gastrointestinal bleeding. Gut. 2019;68(suppl 2):A152.
7. Chan EW, Lau WC, Leung WK, et al. Prevention of dabigatran-related gastrointestinal bleeding with gastroprotective agents: A population-based study. Gastroenterology. 2015;149:586-595.
8. Ray WA, Chung CP, Murray KT, et al. Association of oral anticoagulants and proton pump inhibitor cotherapy with hospitalization for upper gastrointestinal tract bleeding. JAMA. 2018;320:2221-2230.
9. Brunetti L, Lee S-M, Doherty N, et al. Impact of warfarin discharge education program on hospital readmission and treatment costs. Int J Clin Pharm. 2018;40:721-729.
10. Hasan SS, Kow CS, Curley LE, et al. Economic evaluation of prescribing conventional and newer oral anticoagulants in older adults. Expert Rev Pharmacoecon Outcomes Res. 2018;18:371-377.
11. Phelps E, Delate T, Witt DM, et al. Effect of increased time in the therapeutic range on atrial fibrillation outcomes within a centralized anticoagulation service. Thromb Res. 2018;163:54-59.
12. Ahuja T, Raco V, Papadopoulos J, Green D. Antithrombotic stewardship: Assessing use of computerized clinical decision support tools to enhance safe prescribing of direct oral anticoagulants in hospitalized patients. J Patient Saf. 2018 Sep 25. [Epub ahead of print]
13. Leef GC, Perino AC, Askari M, et al. Appropriateness of direct oral anticoagulant dosing in patients with atrial fibrillation: Insights from the Veterans Health Administration. J Pharm Pract. 2020;33:647-653.
14. Papastergiou J, Kheir N, Ladova K, et al. Pharmacists’ confidence when providing pharmaceutical care on anticoagulants, a multinational survey. Int J Clin Pharm. 2017;39:1282-1290.
15. Perlman A, Horwitz E, Hirsh-Raccah B, et al. Clinical pharmacist led hospital-wide direct oral anticoagulant stewardship program. Isr J Health Policy Res. 2019;8:19.
16. Uppuluri EM, McComb MN, Shapiro NL. Implementation of a direct oral anticoagulation screening service at a large academic medical center provided by a pharmacist-managed antithrombosis clinic as a method to expand antithrombotic stewardship efforts. J Pharm Pract. 2020;33:271-275.
17. Manzoor BS, Cheng W-H, Lee JC, et al. Quality of pharmacist-managed anticoagulation therapy in long-term ambulatory settings: A systematic review. Ann Pharmacother. 2017;51:1122-1137.
18. Harris PA, Taylor R, Thielke R, et al. Research Electronic Data Capture (REDCap)—A metadata-driven methodology and workflow process for providing translational research informatics support. J Biomed Inform. 2009;42:377-381.
19. Brooks M. AF management: Are clinicians in agreement? Medscape. May 30, 2019. Accessed December 29, 2020. https://www.medscape.com/viewarticle/913386
20. Amroze A, Mazor K, Crawford S, et al. Survey of confidence in use of stroke and bleeding risk calculators, knowledge of anticoagulants, and comfort with prescription of anticoagulation in challenging scenarios: SUPPORT-AF II study. J Thromb Thrombolysis. 2019;48:629-637.
21. Wang Y, Bajorek B. Decision-making around antithrombotics for stroke prevention in atrial fibrillation: the health professionals’ views. Int J Clin Pharm. 2016;38:985-995.
22. January CT, Wann LS, Alpert JS, et al. 2014 AHA/ACC/HRS guideline for the management of patients with atrial fibrillation: a report of the American College of Cardiology/American Heart Association Task Force on Practice Guidelines and the Heart Rhythm Society. Circulation. 2014;130:e199-e267.
23. January CT, Wann LS, Calkins H, et al. 2019 AHA/ACC/HRS Focused Update of the 2014 AHA/ACC/HRS Guideline for the Management of Patients With Atrial Fibrillation: A Report of the American College of Cardiology/American Heart Association Task Force on Clinical Practice Guidelines and the Heart Rhythm Society. J Am Coll Cardiol. 2019;74:104-132.
24. Anghel L, Sascu R, Trifan A, et al. Non-vitamin K antagonist oral anticoagulants and the gastrointestinal bleeding risk in real-world studies. J Clin Med. 2020;9:1398.
25. Langsted A, Nordestgaard BG. Smoking is associated with increased risk of major bleeding: a prospective cohort study. Thromb Haemost. 2019;119:39-47.
26. Faye AS, Hung KW, Cheng K, et al. HAS-BLED scores underestimate gastrointestinal bleeding risk among those with H. pylori. Am J Gastroenterol. 2019;114:S364.
27. Fawzy AM, Yang W-Y, Lip GY. Safety of direct oral anticoagulants in real-world clinical practice: translating the trials to everyday clinical management. Expert Opin Drug Saf. 2019;18:187-209.
28. Lip GYH, Keshishian A, Li X, et al. Effectiveness and safety of oral anticoagulants among nonvalvular atrial fibrillation patients. Stroke. 2018;49:2933-2944.
29. Abraham NS, Singh S, Alexander GC, et al. Comparative risk of gastrointestinal bleeding with dabigatran, rivaroxaban, and warfarin: population based cohort study. BMJ. 2015;350:h1857.
30. Holster IL, Valkhoff VE, Kuipers EJ, Tjwa E. New oral anticoagulants increase risk for gastrointestinal bleeding: a systematic review and meta-analysis. Gastroenterology. 2013;145:105-112.
31. Sherwood MW, Nessel CC, Hellkamp AS, et al. Gastrointestinal bleeding in patients with atrial fibrillation treated with rivaroxaban or warfarin: ROCKET AF Trial. J Am Coll Cardiol. 2015;66:2271-2281.
32. Di Minno A, Spadarella G, Spadarella E, et al. Gastrointestinal bleeding in patients receiving oral anticoagulation: Current treatment and pharmacological perspectives. Thromb Res. 2015;136:1074-1081.
33. Abraham NS, Hlatky MA, Antman EM, et al. ACCF/ACG/AHA 2010 Expert Consensus Document on the Concomitant Use of Proton Pump Inhibitors and Thienopyridines: A Focused Update of the ACCF/ACG/AHA 2008 Expert Consensus Document on Reducing the Gastrointestinal Risks of Antiplatelet Therapy and NSAID Use. Circulation. 2010;122:2619-2633.
34. Bhatt DL, Scheiman J, Abraham NS, et al. ACCF/ACG/AHA 2008 expert consensus document on reducing the gastrointestinal risks of antiplatelet therapy and NSAID use: a report of the American College of Cardiology Foundation Task Force on Clinical Expert Consensus Documents. J Am Coll Cardiol. 2008;52:1502-1517.
35. Lanza FL, Chan FK, Quigley EM. Guidelines for prevention of NSAID-related ulcer complications. Am J Gastroenterol. 2009;104:728-738.
36. Bang CS, Joo MK, Kim BW, et al. The role of acid suppressants in the prevention of anticoagulant-related gastrointestinal bleeding: a systematic review and meta-analysis. Gut Liver. 2020;14:57-66.
37. Farrell B, Pottie K, Thompson W, et al. Deprescribing proton pump inhibitors: Evidence-based clinical practice guideline. Can Fam Physician. 2017;63:354-364.
38. Fossmark R, Martinsen TC, Waldum HL. Adverse effects of proton pump inhibitors—evidence and plausibility. Int J Mol Sci. 2019;20:5203.
39. Haastrup PF, Thompson W, Sondergaard J, Jarbol DE. Side effects of long-term proton pump inhibitor use: A review. Basic Clin Pharmacol Toxicol. 2018;123:114-121.
40. Wong JM, Maddox TM, Kennedy K, Shaw RE. Comparing major bleeding risk in outpatients with atrial fibrillation or flutter by oral anticoagulant type (from the National Cardiovascular Disease Registry’s Practice Innovation and Clinical Excellence Registry). Am J Cardiol. 2020;125:1500-1507.
41. Nagata N, Niikura R, Aoki T, et al. Effect of proton-pump inhibitors on the risk of lower gastrointestinal bleeding associated with NSAIDs, aspirin, clopidogrel, and warfarin. J Gastroenterol. 2015;50:1079-1086.

Noninvasive Ventilation Use Among Medicare Beneficiaries at the End of Life
Study Overview
Objective. To examine the trend of noninvasive and invasive mechanical ventilation at the end of life from 2000 to 2017.
Design. Observational population-based cohort study.
Setting and participants. The study was a population-based cohort study to examine the use of noninvasive and invasive mechanical ventilation among decedents. The study included a random 20% sample of Medicare beneficiaries older than 65 years who were hospitalized in the last 30 days of life and died between January 1, 2000, and December 31, 2017, except for the period October 1, 2015, to December 31, 2015, when the transition from International Classification of Diseases, Ninth Revision (ICD-9) to ICD-10 occurred. Beneficiaries with the primary admitting diagnosis of cardiac arrest or with preexisting tracheostomy were excluded because of expected requirements for ventilatory support. The sample included a total of 2,470,735 Medicare beneficiaries; mean age was 82.2 years, and 54.8% were female. Primary admitting diagnosis codes were used to identify 3 subcohorts: congestive heart failure, chronic obstructive pulmonary disease, and cancer; a fourth subcohort of dementia was identified using the primary admitting diagnosis code or the first 9 secondary diagnosis codes.
Main outcome measures. The study used procedure codes to identify the use of noninvasive ventilation, invasive mechanical ventilation, or none among decedents who were hospitalized in the last 30 days of life. Descriptive statistics to characterize variables by year of hospitalization and ventilatory support were calculated, and the rates of noninvasive and invasive mechanical ventilation use were tabulated. Other outcomes of interest include site of death (in-hospital death), hospice enrollment at death, and hospice enrollment in the last 3 days of life as measures of end-of- life care use. Multivariable logistic regressions were used to examine noninvasive and invasive mechanical ventilation use among decedents, and time trends were examined, with the pattern of use in year 2000 as reference. Subgroup analysis with the subcohort of patients with different diagnoses were conducted to examine trends.
Main results. From 2000 to 2017, 16.3% of decedents had invasive mechanical ventilation, 3.7% had noninvasive ventilation, and 1.0% had both noninvasive and invasive ventilation during their hospital stay. Compared to the reference year 2000, there was a 9-fold increase in noninvasive ventilation use, from 0.8% to 7.1% in 2017, and invasive mechanical ventilation use also increased slightly, from 15.0% to 18.5%. Compared to year 2000, decedents were 2.63 times and 1.04 times (adjusted odds ratio [OR]) more likely to receive noninvasive ventilation and invasive mechanical ventilation, respectively, in 2005, 7.87 times and 1.39 times more likely in 2011, and 11.84 times and 1.63 times more likely in 2017.
Subgroup analysis showed that for congestive heart failure and chronic obstructive pulmonary disease, the increase in noninvasive ventilation use mirrored the trend observed for the overall population, but the use of invasive mechanical ventilation did not increase from 2000 to 2017, with a rate of use of 11.1% versus 7.8% (adjusted OR, 1.07; 95% confidence interval [CI], 0.95-1.19) for congestive heart failure and 17.4% vs 13.2% (OR 1.03, 95% CI, 0.88-1.21) for chronic obstructive pulmonary disease. For the cancer and dementia subgroups, the increase in noninvasive ventilation use from 2000 to 2017 was accompanied by an increase in the use of invasive mechanical ventilation, with a rate of 6.2% versus 7.4% (OR, 1.40; 95% CI, 1.26-1.55) for decedents with cancer and a rate of 5.7% versus 6.2% (OR, 1.28; 95% CI, 1.17-1.41) for decedents with dementia. For other measures of end-of-life care, noninvasive ventilation use when compared to invasive mechanical ventilation use was associated with lower rates of in-hospital (acute care) deaths (50.3% vs 76.7%), hospice enrollment in the last 3 days of life (late hospice enrollment; 57.7% vs 63.0%), and higher rates of hospice enrollment at death (41.3% vs 20.0%).
Conclusion. There was an increase in the use of noninvasive ventilation from 2000 through 2017 among Medicare beneficiaries who died. The findings also suggest that the use of invasive mechanical ventilation did not increase among decedents with congestive heart failure and chronic obstructive pulmonary disease but increased among decedents with cancer and dementia.
Commentary
Noninvasive ventilation offers an alternative to invasive mechanical ventilation for providing ventilatory support for respiratory failure, and may offer benefits as it could avert adverse effects associated with invasive mechanical ventilation, particularly in the management of respiratory failure due to congestive heart failure and chronic obstructive pulmonary disease.1 There is evidence for potential benefits of use of noninvasive ventilation in other clinical scenarios, such as pneumonia in older adults with comorbidities, though its clinical utility is not as well established for other diseases.2
As noninvasive ventilation is introduced into clinical practice, it is not surprising that over the period of the study (2000 to 2017) that its use increased substantially. Advance directives that involve discussion of life-sustaining treatments, including in scenarios with respiratory failure, may also result in physician orders that specify whether an individual desires invasive mechanical ventilation versus other medical treatments, including noninvasive ventilation.3,4 By examining the temporal trends of use of noninvasive and invasive ventilation, this study reveals that invasive mechanical ventilation use among decedents with dementia and cancer has increased, despite increases in the use of noninvasive ventilation. It is important to understand further what would explain these temporal trends and whether the use of noninvasive and also invasive mechanical ventilation at the end of life represents appropriate care with clear goals or whether it may represent overuse. It is also less clear in the end-of-life care scenario what the goals of treatment with noninvasive ventilation would be, especially if it does not avert the use of invasive mechanical ventilation.
The study includes decedents only, thus limiting the ability to draw conclusions about clinically appropriate care.5 Further studies should examine a cohort of patients who have serious and life-threatening illness to examine the trends and potential effects of noninvasive ventilation on outcomes and utilization, as individuals who have improved and survived would not be included in this present decedent cohort.
Applications for Clinical Practice
This study highlights changes in the use of noninvasive and invasive ventilation over time and the different trends seen among subgroups with different diagnoses. For older adults with serious comorbid illness such as dementia, it is especially important to have discussions on advance directives so that care at the end of life is concordant with the patient’s wishes and that unnecessary, burdensome care can be averted. Further studies to understand and define the appropriate use of noninvasive and invasive mechanical ventilation for older adults with significant comorbidities who have serious, life-threatening illness are needed to ensure appropriate clinical treatment at the end of life.
–William W. Hung, MD, MPH
1. Lindenauer PK, Stefan MS, Shieh M et al. Outcomes associated with invasive and noninvasive ventilation a mong patients hospitalized with exacerbations of chronic obstructive pulmonary disease. JAMA Intern Med. 2014;174:1982-993.
2. Johnson CS, Frei CR, Metersky ML, et al. Non-invasive mechanical ventilation and mortality in elderly immunocompromised patients hospitalized with pneumonia: a retrospective cohort study. BMC Pulm Med. 2014;14:7. Published 2014 Jan 27. doi:10.1186/1471-2466-14-7
3. Lee R, Brumbeck L, Sathitratanacheewin S, et al. Association of physician orders for life-sustaining treatment with icu admission among patients hospitalized near the end of life. JAMA. 2020;323:950-60.
4. Bomba P, Kemp M, Black J. POLST: An improvement over traditional advance directives. Cleveland Clinic J Med. 2012;79:457-464.
5. Duncan I, Ahmed T, Dove H, Maxwell TL. Medicare cost at end of life. Am J Hosp Palliat Care. 2019;36:705-710.
Study Overview
Objective. To examine the trend of noninvasive and invasive mechanical ventilation at the end of life from 2000 to 2017.
Design. Observational population-based cohort study.
Setting and participants. The study was a population-based cohort study to examine the use of noninvasive and invasive mechanical ventilation among decedents. The study included a random 20% sample of Medicare beneficiaries older than 65 years who were hospitalized in the last 30 days of life and died between January 1, 2000, and December 31, 2017, except for the period October 1, 2015, to December 31, 2015, when the transition from International Classification of Diseases, Ninth Revision (ICD-9) to ICD-10 occurred. Beneficiaries with the primary admitting diagnosis of cardiac arrest or with preexisting tracheostomy were excluded because of expected requirements for ventilatory support. The sample included a total of 2,470,735 Medicare beneficiaries; mean age was 82.2 years, and 54.8% were female. Primary admitting diagnosis codes were used to identify 3 subcohorts: congestive heart failure, chronic obstructive pulmonary disease, and cancer; a fourth subcohort of dementia was identified using the primary admitting diagnosis code or the first 9 secondary diagnosis codes.
Main outcome measures. The study used procedure codes to identify the use of noninvasive ventilation, invasive mechanical ventilation, or none among decedents who were hospitalized in the last 30 days of life. Descriptive statistics to characterize variables by year of hospitalization and ventilatory support were calculated, and the rates of noninvasive and invasive mechanical ventilation use were tabulated. Other outcomes of interest include site of death (in-hospital death), hospice enrollment at death, and hospice enrollment in the last 3 days of life as measures of end-of- life care use. Multivariable logistic regressions were used to examine noninvasive and invasive mechanical ventilation use among decedents, and time trends were examined, with the pattern of use in year 2000 as reference. Subgroup analysis with the subcohort of patients with different diagnoses were conducted to examine trends.
Main results. From 2000 to 2017, 16.3% of decedents had invasive mechanical ventilation, 3.7% had noninvasive ventilation, and 1.0% had both noninvasive and invasive ventilation during their hospital stay. Compared to the reference year 2000, there was a 9-fold increase in noninvasive ventilation use, from 0.8% to 7.1% in 2017, and invasive mechanical ventilation use also increased slightly, from 15.0% to 18.5%. Compared to year 2000, decedents were 2.63 times and 1.04 times (adjusted odds ratio [OR]) more likely to receive noninvasive ventilation and invasive mechanical ventilation, respectively, in 2005, 7.87 times and 1.39 times more likely in 2011, and 11.84 times and 1.63 times more likely in 2017.
Subgroup analysis showed that for congestive heart failure and chronic obstructive pulmonary disease, the increase in noninvasive ventilation use mirrored the trend observed for the overall population, but the use of invasive mechanical ventilation did not increase from 2000 to 2017, with a rate of use of 11.1% versus 7.8% (adjusted OR, 1.07; 95% confidence interval [CI], 0.95-1.19) for congestive heart failure and 17.4% vs 13.2% (OR 1.03, 95% CI, 0.88-1.21) for chronic obstructive pulmonary disease. For the cancer and dementia subgroups, the increase in noninvasive ventilation use from 2000 to 2017 was accompanied by an increase in the use of invasive mechanical ventilation, with a rate of 6.2% versus 7.4% (OR, 1.40; 95% CI, 1.26-1.55) for decedents with cancer and a rate of 5.7% versus 6.2% (OR, 1.28; 95% CI, 1.17-1.41) for decedents with dementia. For other measures of end-of-life care, noninvasive ventilation use when compared to invasive mechanical ventilation use was associated with lower rates of in-hospital (acute care) deaths (50.3% vs 76.7%), hospice enrollment in the last 3 days of life (late hospice enrollment; 57.7% vs 63.0%), and higher rates of hospice enrollment at death (41.3% vs 20.0%).
Conclusion. There was an increase in the use of noninvasive ventilation from 2000 through 2017 among Medicare beneficiaries who died. The findings also suggest that the use of invasive mechanical ventilation did not increase among decedents with congestive heart failure and chronic obstructive pulmonary disease but increased among decedents with cancer and dementia.
Commentary
Noninvasive ventilation offers an alternative to invasive mechanical ventilation for providing ventilatory support for respiratory failure, and may offer benefits as it could avert adverse effects associated with invasive mechanical ventilation, particularly in the management of respiratory failure due to congestive heart failure and chronic obstructive pulmonary disease.1 There is evidence for potential benefits of use of noninvasive ventilation in other clinical scenarios, such as pneumonia in older adults with comorbidities, though its clinical utility is not as well established for other diseases.2
As noninvasive ventilation is introduced into clinical practice, it is not surprising that over the period of the study (2000 to 2017) that its use increased substantially. Advance directives that involve discussion of life-sustaining treatments, including in scenarios with respiratory failure, may also result in physician orders that specify whether an individual desires invasive mechanical ventilation versus other medical treatments, including noninvasive ventilation.3,4 By examining the temporal trends of use of noninvasive and invasive ventilation, this study reveals that invasive mechanical ventilation use among decedents with dementia and cancer has increased, despite increases in the use of noninvasive ventilation. It is important to understand further what would explain these temporal trends and whether the use of noninvasive and also invasive mechanical ventilation at the end of life represents appropriate care with clear goals or whether it may represent overuse. It is also less clear in the end-of-life care scenario what the goals of treatment with noninvasive ventilation would be, especially if it does not avert the use of invasive mechanical ventilation.
The study includes decedents only, thus limiting the ability to draw conclusions about clinically appropriate care.5 Further studies should examine a cohort of patients who have serious and life-threatening illness to examine the trends and potential effects of noninvasive ventilation on outcomes and utilization, as individuals who have improved and survived would not be included in this present decedent cohort.
Applications for Clinical Practice
This study highlights changes in the use of noninvasive and invasive ventilation over time and the different trends seen among subgroups with different diagnoses. For older adults with serious comorbid illness such as dementia, it is especially important to have discussions on advance directives so that care at the end of life is concordant with the patient’s wishes and that unnecessary, burdensome care can be averted. Further studies to understand and define the appropriate use of noninvasive and invasive mechanical ventilation for older adults with significant comorbidities who have serious, life-threatening illness are needed to ensure appropriate clinical treatment at the end of life.
–William W. Hung, MD, MPH
1. Lindenauer PK, Stefan MS, Shieh M et al. Outcomes associated with invasive and noninvasive ventilation a mong patients hospitalized with exacerbations of chronic obstructive pulmonary disease. JAMA Intern Med. 2014;174:1982-993.
2. Johnson CS, Frei CR, Metersky ML, et al. Non-invasive mechanical ventilation and mortality in elderly immunocompromised patients hospitalized with pneumonia: a retrospective cohort study. BMC Pulm Med. 2014;14:7. Published 2014 Jan 27. doi:10.1186/1471-2466-14-7
3. Lee R, Brumbeck L, Sathitratanacheewin S, et al. Association of physician orders for life-sustaining treatment with icu admission among patients hospitalized near the end of life. JAMA. 2020;323:950-60.
4. Bomba P, Kemp M, Black J. POLST: An improvement over traditional advance directives. Cleveland Clinic J Med. 2012;79:457-464.
5. Duncan I, Ahmed T, Dove H, Maxwell TL. Medicare cost at end of life. Am J Hosp Palliat Care. 2019;36:705-710.
Biggest challenges practices faced from COVID last year: MGMA
according to a December 2020 report from the Medical Group Management Association.
The report was assembled from the results of weekly Stat polls by MGMA, which consists of 15,000 group practices representing more than 350,000 physicians. During the course of the year, more than 4,800 practice leaders were surveyed, but the individual polls had far fewer respondents.
The 2020 data represents snapshots from different points in the developing public health crisis. Still, much of what practices experienced earlier in the pandemic continues to apply, and it’s likely to persist this year as long as the coronavirus spreads and its toll deepens.
One top-line conclusion of the report: the economic pain felt by practices has resulted in layoffs, furloughs, and/or reduced compensation for providers and staff.
In the May 19 weekly survey, 82% of respondents said some or all of their providers’ compensation had been affected by the crisis. About 62% said every provider had been affected. Provider compensation was cut in several ways, including reduced hours and salaries, reduced or eliminated bonuses, and lower allowances for continuing medical education.
About 61% of health care leaders said in the June 26 poll that their own compensation had decreased.
In the following week’s survey, one in three managers said their organization had reduced staff compensation. Nearly all of the respondents in this category predicted the salary reductions would be temporary.
As of March 17, early in the pandemic, 40% of health care leaders said they were experiencing staff shortages. An April 21 poll found that 53% of health care leaders were taking steps to address their providers’ and staffers’ mental health.
“The mental and emotional toll on everyone continues to be a concern, as public health authorities continue to report alarming numbers of new [COVID-19] cases, hospitalizations, and deaths,” MGMA commented.
Telehealth and remote monitoring
Nearly all of the health care leaders surveyed on March 31 reported that their practices had expanded telehealth access because of COVID-19. The percentage of patient visits handled remotely had dropped substantially by the fall, according to a Harvard University/Commonwealth Fund/Phreesia survey. Still, it remains significantly higher than it was before the pandemic.
“At the end of 2020, telemedicine continues to play a vital role in everyday practice operations and long-term planning,” the MGMA report said. One indication of this, the association said, is that health care leaders are recognizing new best practices in specialty telemedicine, such as pediatrics and ob.gyn.
According to an April 28 poll, the top three coding/billing challenges for telehealth and telephone visits amid COVID-19 were inconsistent payer rules, pay parity and accuracy, and documentation of virtual visits.
While the Centers for Medicare & Medicaid Services has loosened its regulations to allow reimbursement of telehealth in all locations and at the same level as in-person visits, most of those changes will not last beyond the public health crisis without new legislation.
More health care leaders are considering the use of remote patient monitoring, MGMA said, but only 21% of practices offered such services as of Sept. 15. The report drew a connection between these plans and the current challenge of deferred care.
In the July 21 poll, 87% of health care leaders reported that safety concerns were the top reason that patients deferred care amid COVID-19. The MGMA report quoted JaeLynn Williams, CEO of Air Methods, which provides helicopter ambulance services, as saying that many people are staying home even when they face life-threatening conditions such as chest pain, drug symptoms, inflamed appendix, and gallbladder pain.
Operational issues
Overall, MGMA said, practices that have taken a financial risk have done better during the pandemic than fee-for-service practices because their monthly capitation revenue has continued unabated. In contrast, “most groups’ struggles to sustain visits and procedures meant less revenue and lower compensation,” the report said.
In the August 18 survey, one in three health care leaders reported their practices were changing their operational metrics and how often they looked at those measures because of the pandemic. “Practice managers are asking for dashboard data in weeks instead of months to measure the drop in charges and forecast the resulting change in collections,” MGMA noted. “The type of data practice managers are asking for has also changed.”
Among the new metrics that practices are interested in, according to an MGMA article, are measures that track telehealth visits, the productivity of staff working at home, and the number of ancillary services and procedures that new patients might need based on historical data.
Nearly all health care leaders surveyed on Aug. 11 said the cost of obtaining personal protective equipment had increased during 2020. MGMA said it expects this situation to worsen if the pandemic lasts through the summer of 2021.
While everyone is talking about the botched launch of the COVID-19 vaccination campaign, there were also problems with flu vaccination in 2020. In the Sept. 25 poll, 34% of health care leaders reported their practices were experiencing delays in getting the flu vaccine.
Looking ahead
Looking further ahead, the report recommended that practices make plans to boost staff morale by restoring bonuses.
In addition, MGMA suggested that physician groups reassess their space needs. “The equation is simple – fewer nonclinical staff members at your facility means you should repurpose that office space or consider finding a better fit for your new real estate needs in 2021.”
Finally, MGMA noted that the practices expanding rather than contracting their business are those increasing their value-based revenues by taking on more risk. For those groups, “growing the patient panel can help [them] seek better rates in contract negotiations.”
A version of this article first appeared on Medscape.com.
PCPs play a small part in low-value care spending
according to a brief report published online Jan. 18 in Annals of Internal Medicine.
However, one expert said there are better ways to curb low-value care than focusing on which specialties are guilty of the practice.
Analyzing a 20% random sample of Medicare Part B claims, Aaron Baum, PhD, with the Icahn School of Medicine at Mount Sinai, New York, and colleagues found that the services primary care physicians performed or ordered made up on average 8.3% of the low-value care their patients received (interquartile range, 3.9%-15.1%; 95th percentile, 35.6%) and their referrals made up 15.4% (IQR, 6.3%-26.4%; 95th percentile, 44.6%).
By specialty, cardiology had the worst record with 27% of all spending on low-value services ($1.8 billion) attributed to that specialty. Yet, of the 25 highest-spending specialties in the report, 12 of them were associated with 1% or less than 1% each of all low-value spending, indicating the waste was widely distributed.
Dr. Baum said in an interview that though there are some PCPs guilty of high spending on low-value services, overall, most primary care physicians’ low-value services add up to only 0.3% of Part B spending. He noted that Part B spending is about one-third of all Medicare spending.
Primary care is often thought to be at the core of care management and spending and PCPs are often seen as the gatekeepers, but this analysis suggests that efforts to make big differences in curtailing low-value spending might be more effective elsewhere.
“There’s only so much spending you can reduce by changing primary care physicians’ services that they directly perform,” Dr. Baum said.
Low-value care is costly, can be harmful
Mark Fendrick, MD, director of the University of Michigan’s Center for Value-Based Insurance Design in Ann Arbor, said in an interview that the report adds confirmation to previous research that has consistently shown low-value care is “extremely common, very costly, and provided by primary care providers and specialists alike.” He noted that it can also be harmful.
“The math is simple,” he said. “If we want to improve coverage and lower patient costs for essential services like visits, diagnostic tests, and drugs, we have to reduce spending on those services that do not make Americans any healthier.”
The study ranked 31 clinical services judged to be low value by physician societies, Medicare and clinical guidelines, and their use among beneficiaries enrolled between 2007 and 2014. Here’s how the top six low-value services compare.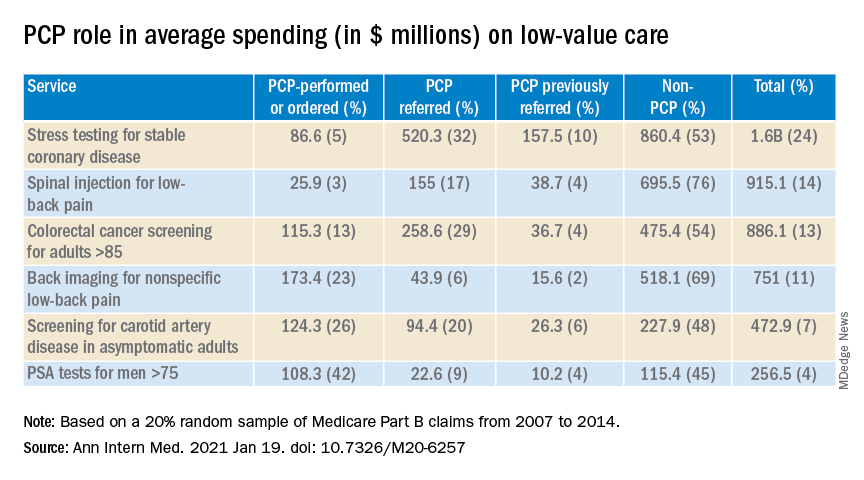
Dr. Fendrick said a weakness of the paper is the years of the data (2007-2014). Some of the criteria around low-value care have changed since then. The age that a prostate-specific antigen test becomes low-value is now 70 years, for instance, instead of 75. He added that some of the figures attributed to non-PCP providers appear out of date.
Dr. Fendrick said, “I understand that there are Medicare patients who end up at a gastroenterologist or surgeon’s office to get colorectal cancer screening, but it would be very hard for me to believe that half of stress tests and over half of colon cancer screening over [age] 85 [years] and half of PSA for people over 75 did not have some type of referring clinicians involved. I certainly don’t think that would be the case in 2020-2021.”
Dr. Baum said those years were the latest years available for the data points needed for this analysis, but he and his colleagues were working to update the data for future publication.
Dr. Fendrick said not much has changed in recent years in terms of waste on low-value care, even with campaigns such as Choosing Wisely dedicated to identifying low-value services or procedures in each specialty.
“I believe there’s not a particular group of clinicians one way or the other who are actually doing any better now than they were 7 years ago,” he said. He would rather focus less on which specialties are associated with the most low-value care and more on the underlying policies that encourage low-value care.
“If you’re going to get paid for doing a stress test and get paid nothing or significantly less if you don’t, the incentives are in the wrong direction,” he said.
Dr. Fendrick said the pandemic era provides an opportunity to eliminate low-value care because use of those services has dropped drastically as resources have been diverted to COVID-19 patients and many services have been delayed or canceled.
He said he has been pushing an approach that providers should be paid more after the pandemic “to do the things we want them to do.”
As an example, he said, instead of paying $886 million on colonoscopies for people over the age of 85, “why don’t we put a policy in place that would make it better for patients by lowering cost sharing and better for providers by paying them more to do the service on the people who need it as opposed to the people who don’t?”
The research was funded by the American Board of Family Medicine Foundation. Dr. Baum and a coauthor reported receiving personal fees from American Board of Family Medicine Foundation during the conduct of the study. Another coauthor reported receiving personal fees from Collective Health, HealthRight 360, PLOS Medicine, and the New England Journal of Medicine, outside the submitted work. Dr. Fendrick disclosed no relevant financial relationships.
A version of this article first appeared on Medscape.com.
How do you answer patients’ emails?
The pandemic has isolated our patients to an unprecedented degree, forcing them to find other ways to communicate with us, including email.

Responses varied all over the map. Some refuse the medium entirely. “I politely say that I don’t practice dermatology via email,” said one. “Please schedule a teledermatology appointment and I’d be happy to help.”
Others are ambivalent: “I do email with some patients who have complex situations or quick questions, but if it gets out of hand then I let them know someone will call to make an appointment.” Another office treats them as a one-way street: “We set up one account to receive patients’ emails, but we tell them clearly that we don’t respond ... my staff or I call them back.”
Still others have assimilated it completely. “Patients email through the portal and my MA routes [them] to me. I answer questions and the MA responds ... staff loves it because it’s so much faster than the phone.”
A 1998 study in JAMA was more scientifically designed, but basically reached the same conclusion. The authors found “a striking lack of consensus” on how to deal with patient emails: 50% responded to them, but 31% of responders refused to give advice without seeing the patient, while 59% offered a diagnosis, and a third of that group went on to provide specific advice about therapy. In response to a follow-up questionnaire, 28% said that they tended not to answer any patient emails, 24% said they usually replied with a standard message, and 24% said they answer each request individually. The authors concluded that “standards for physician response to unsolicited patient emails are needed.”
Indeed, my own unscientific survey suggests that, more than 20 years later, there is still nothing resembling a consensus on this issue. In the interim, several groups, including the American Medical Informatics Association and the American Medical Association have proposed standards, but none have been generally accepted. Until that happens, it seems prudent for each individual practice to adopt its own guidelines. For ideas, take a look at the proposals from the groups I mentioned, plus any others you can find. When you’re done, consider running your list past your attorney to make sure you haven’t forgotten anything, and that there are no unique requirements in your state.
Your guidelines may be very simple (if you decide never to answer any queries) or very complex, depending on your situation and personal philosophy. But all guidelines should cover such issues as authentication of correspondents, informed consent, licensing jurisdiction (if you receive emails from states in which you are not licensed), and of course, confidentiality.
Contrary to popular belief, HIPAA does not prohibit email communication with patients, nor require that it be encrypted. The HIPAA website specifically says: “Patients may initiate communications with a provider using email. If this situation occurs, the health care provider can assume (unless the patient has explicitly stated otherwise) that e-mail communications are acceptable to the individual.”
Still, if you are not comfortable with unencrypted communication, encryption software can be added to your practice’s email system. Proofpoint, Tumbleweed, Zix, and many other vendors sell encryption packages. (As always, I have no financial interest in any product or enterprise mentioned in this column.)
Another option is web-based messaging: Patients enter your website and send a message using an electronic template that you design. A designated staffer will be notified by regular email when messages are received, and can post a reply on a page that can only be accessed by the patient. Besides enhancing privacy and security, you can state your guidelines in plain English to preclude any misunderstanding of what you will and will not address online.
Web-based messaging services can be freestanding or incorporated into existing secure websites. Medfusion and klara are among the leading vendors of secure messaging services.
The important thing is to make a firm decision on how you want to deal with emails, and stick with that method. And follow your guidelines.
Dr. Eastern practices dermatology and dermatologic surgery in Belleville, N.J. He is the author of numerous articles and textbook chapters, and is a longtime monthly columnist for Dermatology News. Write to him at dermnews@mdedge.com.
The pandemic has isolated our patients to an unprecedented degree, forcing them to find other ways to communicate with us, including email.
Responses varied all over the map. Some refuse the medium entirely. “I politely say that I don’t practice dermatology via email,” said one. “Please schedule a teledermatology appointment and I’d be happy to help.”
Others are ambivalent: “I do email with some patients who have complex situations or quick questions, but if it gets out of hand then I let them know someone will call to make an appointment.” Another office treats them as a one-way street: “We set up one account to receive patients’ emails, but we tell them clearly that we don’t respond ... my staff or I call them back.”
Still others have assimilated it completely. “Patients email through the portal and my MA routes [them] to me. I answer questions and the MA responds ... staff loves it because it’s so much faster than the phone.”
A 1998 study in JAMA was more scientifically designed, but basically reached the same conclusion. The authors found “a striking lack of consensus” on how to deal with patient emails: 50% responded to them, but 31% of responders refused to give advice without seeing the patient, while 59% offered a diagnosis, and a third of that group went on to provide specific advice about therapy. In response to a follow-up questionnaire, 28% said that they tended not to answer any patient emails, 24% said they usually replied with a standard message, and 24% said they answer each request individually. The authors concluded that “standards for physician response to unsolicited patient emails are needed.”
Indeed, my own unscientific survey suggests that, more than 20 years later, there is still nothing resembling a consensus on this issue. In the interim, several groups, including the American Medical Informatics Association and the American Medical Association have proposed standards, but none have been generally accepted. Until that happens, it seems prudent for each individual practice to adopt its own guidelines. For ideas, take a look at the proposals from the groups I mentioned, plus any others you can find. When you’re done, consider running your list past your attorney to make sure you haven’t forgotten anything, and that there are no unique requirements in your state.
Your guidelines may be very simple (if you decide never to answer any queries) or very complex, depending on your situation and personal philosophy. But all guidelines should cover such issues as authentication of correspondents, informed consent, licensing jurisdiction (if you receive emails from states in which you are not licensed), and of course, confidentiality.
Contrary to popular belief, HIPAA does not prohibit email communication with patients, nor require that it be encrypted. The HIPAA website specifically says: “Patients may initiate communications with a provider using email. If this situation occurs, the health care provider can assume (unless the patient has explicitly stated otherwise) that e-mail communications are acceptable to the individual.”
Still, if you are not comfortable with unencrypted communication, encryption software can be added to your practice’s email system. Proofpoint, Tumbleweed, Zix, and many other vendors sell encryption packages. (As always, I have no financial interest in any product or enterprise mentioned in this column.)
Another option is web-based messaging: Patients enter your website and send a message using an electronic template that you design. A designated staffer will be notified by regular email when messages are received, and can post a reply on a page that can only be accessed by the patient. Besides enhancing privacy and security, you can state your guidelines in plain English to preclude any misunderstanding of what you will and will not address online.
Web-based messaging services can be freestanding or incorporated into existing secure websites. Medfusion and klara are among the leading vendors of secure messaging services.
The important thing is to make a firm decision on how you want to deal with emails, and stick with that method. And follow your guidelines.
Dr. Eastern practices dermatology and dermatologic surgery in Belleville, N.J. He is the author of numerous articles and textbook chapters, and is a longtime monthly columnist for Dermatology News. Write to him at dermnews@mdedge.com.

How to predict successful colonoscopy malpractice lawsuits
Malpractice lawsuits related to colonoscopy continue to pose challenges for practitioners, and a new analysis reveals that errors related to sedation are more likely to be awarded to plaintiffs. Primary care physicians and surgeons are often codefendants, which emphasizes the importance of interdisciplinary care in colonoscopy.

Cases involving informed consent were more likely to be ruled for the defendant, while those tied to medication error favored the plaintiff, according to an analysis of cases from the Westlaw legal database. The study, led by Krishan S. Patel and Sushil Ahlawat of Rutgers New Jersey Medical School, Newark, was published in the Journal of Clinical Gastroenterology.
According to the authors, 55% of physicians face a malpractice suit at some point in their careers, and gastroenterology ranks as the sixth most common specialty named in malpractice suits. Every year, about 13% of gastroenterologists confront malpractice allegations, and colonoscopy is the most common reason.
The researchers searched the Westlaw legal database for malpractice cases involving colonoscopy or sigmoidoscopy, identifying 305 cases between 1980 and 2017. The average patient age was 54.9 years, and 52.8% of cases were brought by female patients. The most cases were from New York (21.0%), followed by California (13.4%), Pennsylvania (13.1%), Massachusetts (12.5%), and New Jersey (7.9%). Gastroenterologists were named in 71.1% of cases, internists in 25.6%, and surgeons in 14.8%.
A little more than half (51.8%) of cases were ruled in favor of the defendant, and 25% for the plaintiff; 17% were settled, and 6% had a mixed outcome. Payouts ranged from $30,000 to $500,000,000, with a median of $995,000.
There were multiple causes of litigation listed in 83.6% of cases. The most frequent causes were delayed treatment (65.9%), delayed diagnosis (65.6%), procedural error/negligence (44.3%), and failure to refer/reorder tests (25.6%).
Of 135 cases alleging procedural negligence, 90 (67%) named perforation. Among 79 cases that cited a failure to refer and order appropriate tests, 97% claimed the defendant missed a cancerous lesion. In cases alleging missed cancers, 31% were in the cecum, and 23% in the anus.
A logistic regression analysis of factors associated with a verdict for the defendant found “lack of informed consent” to be an independent predictor of defendant verdict (odds ratio, 4.05; P = .004). “Medication error” was associated with reduced defendant success (OR, 0.17; P=.023). There were nonsignificant trends between reduced odds of a verdict for the defendant and lawsuits that named “delay in diagnosis” (OR, 0.35; P = .060) and “failure to refer” (OR, 0.51; P = .074).
The authors sound a dire note about the number of malpractice suits brought against gastroenterologists, but Lawrence Kosinski, MD, is more sanguine. He notes that gastroenterologists have low insurance premiums, compared with other specialties, but recognizes that colonoscopies are a significant source of risk.
Dr. Kosinski, who is chief medical officer at SonarMD and formerly a managing partner at the Illinois Gastroenterology Group, said in an interview that the study is revealing. “It comes out in the article: Acts of omission are more dangerous to the physician than acts of commission. Not finding that cancer, not acting on that malignant polyp, not pursuing it, is much more likely to get you in trouble than taking it off and perforating a colon,” said Dr. Kosinski, who was not involved in the study.
To gastroenterologists seeking to reduce their risks, he offered advice: You shouldn’t assume that the patient has read the information provided. Risks of anesthesia and the procedure should be directly communicated. It’s also important to document the procedure, including pictures of the cecum and rectal retroflexion. Finally, don’t rush. “This isn’t a race. Clean the colon, make sure you don’t miss something. If that person pops up in 3 years with a cancer, someone may go after you,” said Dr. Kosinski.
No source of funding was disclosed. Dr. Kosinski has no relevant financial disclosures.
Malpractice lawsuits related to colonoscopy continue to pose challenges for practitioners, and a new analysis reveals that errors related to sedation are more likely to be awarded to plaintiffs. Primary care physicians and surgeons are often codefendants, which emphasizes the importance of interdisciplinary care in colonoscopy.
Cases involving informed consent were more likely to be ruled for the defendant, while those tied to medication error favored the plaintiff, according to an analysis of cases from the Westlaw legal database. The study, led by Krishan S. Patel and Sushil Ahlawat of Rutgers New Jersey Medical School, Newark, was published in the Journal of Clinical Gastroenterology.
According to the authors, 55% of physicians face a malpractice suit at some point in their careers, and gastroenterology ranks as the sixth most common specialty named in malpractice suits. Every year, about 13% of gastroenterologists confront malpractice allegations, and colonoscopy is the most common reason.
The researchers searched the Westlaw legal database for malpractice cases involving colonoscopy or sigmoidoscopy, identifying 305 cases between 1980 and 2017. The average patient age was 54.9 years, and 52.8% of cases were brought by female patients. The most cases were from New York (21.0%), followed by California (13.4%), Pennsylvania (13.1%), Massachusetts (12.5%), and New Jersey (7.9%). Gastroenterologists were named in 71.1% of cases, internists in 25.6%, and surgeons in 14.8%.
A little more than half (51.8%) of cases were ruled in favor of the defendant, and 25% for the plaintiff; 17% were settled, and 6% had a mixed outcome. Payouts ranged from $30,000 to $500,000,000, with a median of $995,000.
There were multiple causes of litigation listed in 83.6% of cases. The most frequent causes were delayed treatment (65.9%), delayed diagnosis (65.6%), procedural error/negligence (44.3%), and failure to refer/reorder tests (25.6%).
Of 135 cases alleging procedural negligence, 90 (67%) named perforation. Among 79 cases that cited a failure to refer and order appropriate tests, 97% claimed the defendant missed a cancerous lesion. In cases alleging missed cancers, 31% were in the cecum, and 23% in the anus.
A logistic regression analysis of factors associated with a verdict for the defendant found “lack of informed consent” to be an independent predictor of defendant verdict (odds ratio, 4.05; P = .004). “Medication error” was associated with reduced defendant success (OR, 0.17; P=.023). There were nonsignificant trends between reduced odds of a verdict for the defendant and lawsuits that named “delay in diagnosis” (OR, 0.35; P = .060) and “failure to refer” (OR, 0.51; P = .074).
The authors sound a dire note about the number of malpractice suits brought against gastroenterologists, but Lawrence Kosinski, MD, is more sanguine. He notes that gastroenterologists have low insurance premiums, compared with other specialties, but recognizes that colonoscopies are a significant source of risk.
Dr. Kosinski, who is chief medical officer at SonarMD and formerly a managing partner at the Illinois Gastroenterology Group, said in an interview that the study is revealing. “It comes out in the article: Acts of omission are more dangerous to the physician than acts of commission. Not finding that cancer, not acting on that malignant polyp, not pursuing it, is much more likely to get you in trouble than taking it off and perforating a colon,” said Dr. Kosinski, who was not involved in the study.
To gastroenterologists seeking to reduce their risks, he offered advice: You shouldn’t assume that the patient has read the information provided. Risks of anesthesia and the procedure should be directly communicated. It’s also important to document the procedure, including pictures of the cecum and rectal retroflexion. Finally, don’t rush. “This isn’t a race. Clean the colon, make sure you don’t miss something. If that person pops up in 3 years with a cancer, someone may go after you,” said Dr. Kosinski.
No source of funding was disclosed. Dr. Kosinski has no relevant financial disclosures.
FROM THE JOURNAL OF CLINICAL GASTROENTEROLOGY
Physicians react: Doctors worry about patients reading their clinical notes
Patients will soon be able to read the notes that physicians make during an episode of care, as well as information about diagnostic testing and imaging results, tests for STDs, fetal ultrasounds, and cancer biopsies. This open access is raising concerns among physicians.
As part of the 21st Century Cures Act, patients have the right to see their medical notes. Known as Open Notes, the policy will go into effect on April 5, 2021. The Department of Health & Human Services recently changed the original start date, which was to be Nov. 2, 2020.
The mandate has some physicians worrying about potential legal risks and possible violation of doctor-patient confidentiality. When asked to share their views on the new Open Notes mandate, many physicians expressed their concerns but also cited some of the positive effects that could come from this.
Potentially more legal woes for physicians?
A key concern raised by one physician commenter is that patients could misunderstand legitimate medical terminology or even put a physician in legal crosshairs. For example, a medical term such as “spontaneous abortion” could be misconstrued by patients. A physician might write notes with the idea that a patient is reading them and thus might alter those notes in a way that creates legal trouble.
“This layers another level of censorship and legal liability onto physicians, who in attempting to be [politically correct], may omit critical information or have to use euphemisms in order to avoid conflict,” one physician said.
She also questioned whether notes might now have to be run through legal counsel before being posted to avoid potential liability.
Another doctor questioned how physicians would be able to document patients suspected of faking injuries for pain medication, for example. Could such documentation lead to lawsuits for the doctor?
As one physician noted, some patients “are drug seekers. Some refuse to aid in their own care. Some are malingerers. Not documenting that is bad medicine.”
The possibility of violating doctor-patient confidentiality laws, particularly for teenagers, could be another negative effect of Open Notes, said one physician.
“Won’t this violate the statutes that teenagers have the right to confidential evaluations?” the commenter mused. “If charts are to be immediately available, then STDs and pregnancies they weren’t ready to talk about will now be suddenly known by their parents.”
One doctor has already faced this issue. “I already ran into this problem once,” he noted. “Now I warn those on their parents’ insurance before I start the visit. I have literally had a patient state, ‘well then we are done,’ and leave without being seen due to it.”
Another physician questioned the possibility of having to write notes differently than they do now, especially if the patients have lower reading comprehension abilities.
One physician who uses Open Notes said he receives patient requests for changes that have little to do with the actual diagnosis and relate to ancillary issues. He highlighted patients who “don’t want psych diagnosis in their chart or are concerned a diagnosis will raise their insurance premium, so they ask me to delete it.”
Will Open Notes erode patient communication?
One physician questioned whether it would lead to patients being less open and forthcoming about their medical concerns with doctors.
“The main problem I see is the patient not telling me the whole story, or worse, telling me the story, and then asking me not to document it (as many have done in the past) because they don’t want their spouse, family, etc. to read the notes and they have already given their permission for them to do so, for a variety of reasons,” he commented. “This includes topics of STDs, infidelity, depression, suicidal thoughts, and other symptoms the patient doesn’t want their family to read about.”
Some physicians envision positive developments
Many physicians are unconcerned by the new mandate. “I see some potential good in this, such as improving doctor-patient communication and more scrupulous charting,” one physician said.
A doctor working in the U.S. federal health care system noted that open access has been a part of that system for decades.
“Since health care providers work in this unveiled setting for their entire career, they usually know how to write appropriate clinical notes and what information needs to be included in them,” he wrote. “Now it’s time for the rest of the medical community to catch up to a reality that we have worked within for decades now.
“The world did not end, malpractice complaints did not increase, and physician/patient relationships were not damaged. Living in the information age, archaic practices like private notes were surely going to end at some point.”
One doctor who has been using Open Notes has had experiences in which the patient noted an error in the medical chart that needed correcting. “I have had one patient correct me on a timeline in the HPI which was helpful and I made the requested correction in that instance,” he said.
Another physician agreed. “I’ve had patients add or correct valuable information I’ve missed. Good probably outweighs the bad if we set limits on behaviors expressed by the personality disordered group. The majority of people don’t seem to care and still ask me ‘what would you do’ or ‘tell me what to do.’ It’s all about patient/physician trust.”
Another talked about how Open Notes should have little or no impact. “Here’s a novel concept – talking to our patients,” he commented. “There is nothing in every one of my chart notes that has not already been discussed with my patients and I dictate (speech to text) my findings and plan in front of them. So, if they are reviewing my office notes, it will only serve to reinforce what we have already discussed.”
“I don’t intend to change anything,” he added. “Chances are if they were to see a test result before I have a chance to discuss it with them, they will have already ‘Googled’ its meaning and we can have more meaningful interaction if they have a basic understanding of the test.”
“I understand that this is anxiety provoking, but in general I think it is appropriate for patients to have access to their notes,” said another physician. “If physicians write lousy notes that say they did things they didn’t do, that fail to actually state a diagnosis and a plan (and they often do), that is the doc’s problem, not the patient’s.”
A version of this article first appeared on Medscape.com.