User login
U.S. chikungunya epidemic would likely put rheumatologists on front line
SNOWMASS, COLO. – The continental United States is vulnerable to an epidemic of chikungunya virus disease, an event which would have profound consequences for rheumatologists, Robert T. Schoen, MD, said at the Winter Rheumatology Symposium sponsored by the American College of Rheumatology.
“We certainly have all the factors in place where we could have a major epidemic of chikungunya, particularly in Florida, Texas, and neighboring states. As rheumatologists, I think we can own this infection if we want to because it causes an arthritis that is a true arthritis in a significant percentage of patients,” said Dr. Schoen, a rheumatologist at Yale University in New Haven, Conn.

“That’s a major impact when you think that these epidemics affect tens of thousands of individuals. If 25% of them develop long-term arthritis disability, that’s a whole new world for us,” the rheumatologist observed.
Chikungunya is a single-stranded RNA virus in the togaviridae family, which also contains rubella. The infection is transmitted by Aedes aegypti and A. albopictus, also known as the yellow fever and Asian tiger mosquitoes, respectively. Both mosquitoes are established inhabitants of much of the United States.
“This infection is a one-bite deal. These are very aggressive mosquitoes,” Dr. Schoen observed. “If you haven’t seen a case of chikungunya yet, you will soon,” he added.
In 2014, at the height of a massive Caribbean epidemic which included half a million cases in Puerto Rico, roughly 2,800 cases of chikungunya were imported into 46 U.S. states. In 2015, however, as the Caribbean epidemic waned and herd immunity developed, that figure fell to 653 imported cases. But the epidemic in India, which began in 2008, remains ongoing with no end in sight. Several of Dr. Schoen’s patients with chikungunya had recently returned from India when they first became ill.
“India provides an unlimited reservoir of immunologically naive patients to perpetuate the infection,” he observed.
Course of illness
The rate of asymptomatic infection has been variously estimated at 3%-25%. Symptomatic chikungunya is a biphasic illness. After a 2- to 6-day incubation period, patients develop rapid-onset fever with severe joint pain and muscle aches. Indeed, chikungunya means “bent over” in Makonde, an African Bantu language.
Roughly 60% of patients develop a rash during the acute febrile phase of the illness, which lasts about a week. The dermatitis is most often a maculopapular rash on the trunk which is “absolutely indistinguishable” from the rash caused by Zika virus infection, transmitted by the same vectors, Dr. Schoen noted.
During this acute phase, almost all patients develop a severe polyarthritis which can last for weeks or, less commonly, for months or years. This polyarthritis mimics seronegative rheumatoid arthritis. It is usually symmetric and often affects the hands, wrists, and feet.
The acute febrile phase is characterized by high levels of viremia, with up to 1 billion viral particles per milliliter of blood. During this period, definitive diagnosis of chikungunya can be made through reverse transcriptase–polymerase chain reaction testing or viral culture.
Typically, though, patients make their way to a rheumatologist only well after the viremic period is over. In that situation, the diagnostic mainstay is serologic testing. Antichikungunya virus Immunoglobulin M is detectable starting on about day 5 after symptom onset, and it persists for the next 1-3 months. Immunoglobulin G (IgG) antibodies become detectable in the same time frame and remain elevated for years.
Dr. Schoen highlighted a small but intriguing study from Singapore that suggests that the early appearance of chikungunya-specific neutralizing IgG3–antibodies may constitute a marker for favorable long-term prognosis. The observational study involved 30 patients hospitalized for severe acute chikungunya infection. The investigators classified them into two groups: 14 patients had low levels of acute viremia, a less severe acute illness, and late development of IgG3 antibodies; the other 16 had a high initial viral load, a more severe acute phase, and a rapid IgG3 and interleukin-6 response to infection.
The patients with a robust early IgG3 response cleared the virus faster and none of them developed chronic arthritis. In contrast, those without early, chikungunya-specific IgG3 had a high rate of persistent arthralgia (J Infect Dis. 2012 Apr 1;205[7]:1147-54).
Treatment
No evidence-based treatment for chikungunya exists. Treatment in the acute phase is primarily supportive care. Rheumatologists on the Caribbean island of Martinique have reported a favorable experience using methotrexate at doses up to 25 mg/week or with standard doses of anti–tumor necrosis factor agents in chikungunya patients with severe bilateral symmetric chronic inflammatory joint disease arising during the 2013-2015 epidemic. The treatment response and tolerability were comparable with the results typically obtained in rheumatoid arthritis patients, according to the rheumatologists (Arthritis Rheumatol. 2016 Nov;68[11]:2817-24).
Dr. Schoen found the report from Martinique to be reassuring. He too has resorted to familiar rheumatologic medications in his severely affected patients. Anecdotally, his greatest success involved a patient with a 5-year history of disabling chikungunya polyarthritis who showed marked improvement after several months on hydroxychloroquine.
The Martinique investigators also reported on 22 patients who developed chikungunya while on biologic agents for rheumatoid arthritis, Crohn’s disease, psoriatic arthritis, or systemic lupus erythematosus. The biologics weren’t protective against the viral disease in these patients. All 22 of them developed severe acute chikungunya polyarthritis with a mean swollen joint count of 9.6 (Joint Bone Spine. 2016 Mar;83[2]:245-6).
Infection during pregnancy
There is a legitimate concern about chikungunya infection occurring during pregnancy, but, based on the experiences documented on Reunion Island, the risk to the baby is confined to intrapartum exposure in a viremic mother.
Reunion Island is a French region in the Indian Ocean off the eastern coast of Africa. It has first-world medical care. Much of the best documented early work on chikungunya outbreaks grew out of the 2005-2006 epidemic there, which affected more than one-third of the island’s 800,000-plus residents.
In a prospective study of 7,504 deliveries on the island during a 22-month period, mother-to-child transmission of chikungunya occurred only in the context of intrapartum viremia, with 19 cases of vertical transmission occurring among 39 affected mothers who delivered at a median 38 weeks of gestation. Cesarean section had no protective effect. All 19 infected neonates were asymptomatic at birth, with median onset of pain, fever, and thrombocytopenia on day 4. Nine of the 19 infected neonates developed encephalopathy with pathologic MRI findings, including cerebral hemorrhage in two cases (PLoS Med. 2008 Mar 18;5[3]:e60).
The case fatality rate for chikungunya is low at 0.1%. Most deaths occur in young children or elderly individuals with major comorbid conditions. Despite this low mortality, interest in chikungunya vaccine development is being driven by the infection’s impact on tourism, its spread to temperate climates, the economic impact of the considerable time lost from work, and military need. A promising attenuated, virus-like, particle-based vaccine is currently in phase II testing in the Caribbean.
Dr. Schoen reported having no financial conflicts.
SNOWMASS, COLO. – The continental United States is vulnerable to an epidemic of chikungunya virus disease, an event which would have profound consequences for rheumatologists, Robert T. Schoen, MD, said at the Winter Rheumatology Symposium sponsored by the American College of Rheumatology.
“We certainly have all the factors in place where we could have a major epidemic of chikungunya, particularly in Florida, Texas, and neighboring states. As rheumatologists, I think we can own this infection if we want to because it causes an arthritis that is a true arthritis in a significant percentage of patients,” said Dr. Schoen, a rheumatologist at Yale University in New Haven, Conn.
“That’s a major impact when you think that these epidemics affect tens of thousands of individuals. If 25% of them develop long-term arthritis disability, that’s a whole new world for us,” the rheumatologist observed.
Chikungunya is a single-stranded RNA virus in the togaviridae family, which also contains rubella. The infection is transmitted by Aedes aegypti and A. albopictus, also known as the yellow fever and Asian tiger mosquitoes, respectively. Both mosquitoes are established inhabitants of much of the United States.
“This infection is a one-bite deal. These are very aggressive mosquitoes,” Dr. Schoen observed. “If you haven’t seen a case of chikungunya yet, you will soon,” he added.
In 2014, at the height of a massive Caribbean epidemic which included half a million cases in Puerto Rico, roughly 2,800 cases of chikungunya were imported into 46 U.S. states. In 2015, however, as the Caribbean epidemic waned and herd immunity developed, that figure fell to 653 imported cases. But the epidemic in India, which began in 2008, remains ongoing with no end in sight. Several of Dr. Schoen’s patients with chikungunya had recently returned from India when they first became ill.
“India provides an unlimited reservoir of immunologically naive patients to perpetuate the infection,” he observed.
Course of illness
The rate of asymptomatic infection has been variously estimated at 3%-25%. Symptomatic chikungunya is a biphasic illness. After a 2- to 6-day incubation period, patients develop rapid-onset fever with severe joint pain and muscle aches. Indeed, chikungunya means “bent over” in Makonde, an African Bantu language.
Roughly 60% of patients develop a rash during the acute febrile phase of the illness, which lasts about a week. The dermatitis is most often a maculopapular rash on the trunk which is “absolutely indistinguishable” from the rash caused by Zika virus infection, transmitted by the same vectors, Dr. Schoen noted.
During this acute phase, almost all patients develop a severe polyarthritis which can last for weeks or, less commonly, for months or years. This polyarthritis mimics seronegative rheumatoid arthritis. It is usually symmetric and often affects the hands, wrists, and feet.
The acute febrile phase is characterized by high levels of viremia, with up to 1 billion viral particles per milliliter of blood. During this period, definitive diagnosis of chikungunya can be made through reverse transcriptase–polymerase chain reaction testing or viral culture.
Typically, though, patients make their way to a rheumatologist only well after the viremic period is over. In that situation, the diagnostic mainstay is serologic testing. Antichikungunya virus Immunoglobulin M is detectable starting on about day 5 after symptom onset, and it persists for the next 1-3 months. Immunoglobulin G (IgG) antibodies become detectable in the same time frame and remain elevated for years.
Dr. Schoen highlighted a small but intriguing study from Singapore that suggests that the early appearance of chikungunya-specific neutralizing IgG3–antibodies may constitute a marker for favorable long-term prognosis. The observational study involved 30 patients hospitalized for severe acute chikungunya infection. The investigators classified them into two groups: 14 patients had low levels of acute viremia, a less severe acute illness, and late development of IgG3 antibodies; the other 16 had a high initial viral load, a more severe acute phase, and a rapid IgG3 and interleukin-6 response to infection.
The patients with a robust early IgG3 response cleared the virus faster and none of them developed chronic arthritis. In contrast, those without early, chikungunya-specific IgG3 had a high rate of persistent arthralgia (J Infect Dis. 2012 Apr 1;205[7]:1147-54).
Treatment
No evidence-based treatment for chikungunya exists. Treatment in the acute phase is primarily supportive care. Rheumatologists on the Caribbean island of Martinique have reported a favorable experience using methotrexate at doses up to 25 mg/week or with standard doses of anti–tumor necrosis factor agents in chikungunya patients with severe bilateral symmetric chronic inflammatory joint disease arising during the 2013-2015 epidemic. The treatment response and tolerability were comparable with the results typically obtained in rheumatoid arthritis patients, according to the rheumatologists (Arthritis Rheumatol. 2016 Nov;68[11]:2817-24).
Dr. Schoen found the report from Martinique to be reassuring. He too has resorted to familiar rheumatologic medications in his severely affected patients. Anecdotally, his greatest success involved a patient with a 5-year history of disabling chikungunya polyarthritis who showed marked improvement after several months on hydroxychloroquine.
The Martinique investigators also reported on 22 patients who developed chikungunya while on biologic agents for rheumatoid arthritis, Crohn’s disease, psoriatic arthritis, or systemic lupus erythematosus. The biologics weren’t protective against the viral disease in these patients. All 22 of them developed severe acute chikungunya polyarthritis with a mean swollen joint count of 9.6 (Joint Bone Spine. 2016 Mar;83[2]:245-6).
Infection during pregnancy
There is a legitimate concern about chikungunya infection occurring during pregnancy, but, based on the experiences documented on Reunion Island, the risk to the baby is confined to intrapartum exposure in a viremic mother.
Reunion Island is a French region in the Indian Ocean off the eastern coast of Africa. It has first-world medical care. Much of the best documented early work on chikungunya outbreaks grew out of the 2005-2006 epidemic there, which affected more than one-third of the island’s 800,000-plus residents.
In a prospective study of 7,504 deliveries on the island during a 22-month period, mother-to-child transmission of chikungunya occurred only in the context of intrapartum viremia, with 19 cases of vertical transmission occurring among 39 affected mothers who delivered at a median 38 weeks of gestation. Cesarean section had no protective effect. All 19 infected neonates were asymptomatic at birth, with median onset of pain, fever, and thrombocytopenia on day 4. Nine of the 19 infected neonates developed encephalopathy with pathologic MRI findings, including cerebral hemorrhage in two cases (PLoS Med. 2008 Mar 18;5[3]:e60).
The case fatality rate for chikungunya is low at 0.1%. Most deaths occur in young children or elderly individuals with major comorbid conditions. Despite this low mortality, interest in chikungunya vaccine development is being driven by the infection’s impact on tourism, its spread to temperate climates, the economic impact of the considerable time lost from work, and military need. A promising attenuated, virus-like, particle-based vaccine is currently in phase II testing in the Caribbean.
Dr. Schoen reported having no financial conflicts.
SNOWMASS, COLO. – The continental United States is vulnerable to an epidemic of chikungunya virus disease, an event which would have profound consequences for rheumatologists, Robert T. Schoen, MD, said at the Winter Rheumatology Symposium sponsored by the American College of Rheumatology.
“We certainly have all the factors in place where we could have a major epidemic of chikungunya, particularly in Florida, Texas, and neighboring states. As rheumatologists, I think we can own this infection if we want to because it causes an arthritis that is a true arthritis in a significant percentage of patients,” said Dr. Schoen, a rheumatologist at Yale University in New Haven, Conn.
“That’s a major impact when you think that these epidemics affect tens of thousands of individuals. If 25% of them develop long-term arthritis disability, that’s a whole new world for us,” the rheumatologist observed.
Chikungunya is a single-stranded RNA virus in the togaviridae family, which also contains rubella. The infection is transmitted by Aedes aegypti and A. albopictus, also known as the yellow fever and Asian tiger mosquitoes, respectively. Both mosquitoes are established inhabitants of much of the United States.
“This infection is a one-bite deal. These are very aggressive mosquitoes,” Dr. Schoen observed. “If you haven’t seen a case of chikungunya yet, you will soon,” he added.
In 2014, at the height of a massive Caribbean epidemic which included half a million cases in Puerto Rico, roughly 2,800 cases of chikungunya were imported into 46 U.S. states. In 2015, however, as the Caribbean epidemic waned and herd immunity developed, that figure fell to 653 imported cases. But the epidemic in India, which began in 2008, remains ongoing with no end in sight. Several of Dr. Schoen’s patients with chikungunya had recently returned from India when they first became ill.
“India provides an unlimited reservoir of immunologically naive patients to perpetuate the infection,” he observed.
Course of illness
The rate of asymptomatic infection has been variously estimated at 3%-25%. Symptomatic chikungunya is a biphasic illness. After a 2- to 6-day incubation period, patients develop rapid-onset fever with severe joint pain and muscle aches. Indeed, chikungunya means “bent over” in Makonde, an African Bantu language.
Roughly 60% of patients develop a rash during the acute febrile phase of the illness, which lasts about a week. The dermatitis is most often a maculopapular rash on the trunk which is “absolutely indistinguishable” from the rash caused by Zika virus infection, transmitted by the same vectors, Dr. Schoen noted.
During this acute phase, almost all patients develop a severe polyarthritis which can last for weeks or, less commonly, for months or years. This polyarthritis mimics seronegative rheumatoid arthritis. It is usually symmetric and often affects the hands, wrists, and feet.
The acute febrile phase is characterized by high levels of viremia, with up to 1 billion viral particles per milliliter of blood. During this period, definitive diagnosis of chikungunya can be made through reverse transcriptase–polymerase chain reaction testing or viral culture.
Typically, though, patients make their way to a rheumatologist only well after the viremic period is over. In that situation, the diagnostic mainstay is serologic testing. Antichikungunya virus Immunoglobulin M is detectable starting on about day 5 after symptom onset, and it persists for the next 1-3 months. Immunoglobulin G (IgG) antibodies become detectable in the same time frame and remain elevated for years.
Dr. Schoen highlighted a small but intriguing study from Singapore that suggests that the early appearance of chikungunya-specific neutralizing IgG3–antibodies may constitute a marker for favorable long-term prognosis. The observational study involved 30 patients hospitalized for severe acute chikungunya infection. The investigators classified them into two groups: 14 patients had low levels of acute viremia, a less severe acute illness, and late development of IgG3 antibodies; the other 16 had a high initial viral load, a more severe acute phase, and a rapid IgG3 and interleukin-6 response to infection.
The patients with a robust early IgG3 response cleared the virus faster and none of them developed chronic arthritis. In contrast, those without early, chikungunya-specific IgG3 had a high rate of persistent arthralgia (J Infect Dis. 2012 Apr 1;205[7]:1147-54).
Treatment
No evidence-based treatment for chikungunya exists. Treatment in the acute phase is primarily supportive care. Rheumatologists on the Caribbean island of Martinique have reported a favorable experience using methotrexate at doses up to 25 mg/week or with standard doses of anti–tumor necrosis factor agents in chikungunya patients with severe bilateral symmetric chronic inflammatory joint disease arising during the 2013-2015 epidemic. The treatment response and tolerability were comparable with the results typically obtained in rheumatoid arthritis patients, according to the rheumatologists (Arthritis Rheumatol. 2016 Nov;68[11]:2817-24).
Dr. Schoen found the report from Martinique to be reassuring. He too has resorted to familiar rheumatologic medications in his severely affected patients. Anecdotally, his greatest success involved a patient with a 5-year history of disabling chikungunya polyarthritis who showed marked improvement after several months on hydroxychloroquine.
The Martinique investigators also reported on 22 patients who developed chikungunya while on biologic agents for rheumatoid arthritis, Crohn’s disease, psoriatic arthritis, or systemic lupus erythematosus. The biologics weren’t protective against the viral disease in these patients. All 22 of them developed severe acute chikungunya polyarthritis with a mean swollen joint count of 9.6 (Joint Bone Spine. 2016 Mar;83[2]:245-6).
Infection during pregnancy
There is a legitimate concern about chikungunya infection occurring during pregnancy, but, based on the experiences documented on Reunion Island, the risk to the baby is confined to intrapartum exposure in a viremic mother.
Reunion Island is a French region in the Indian Ocean off the eastern coast of Africa. It has first-world medical care. Much of the best documented early work on chikungunya outbreaks grew out of the 2005-2006 epidemic there, which affected more than one-third of the island’s 800,000-plus residents.
In a prospective study of 7,504 deliveries on the island during a 22-month period, mother-to-child transmission of chikungunya occurred only in the context of intrapartum viremia, with 19 cases of vertical transmission occurring among 39 affected mothers who delivered at a median 38 weeks of gestation. Cesarean section had no protective effect. All 19 infected neonates were asymptomatic at birth, with median onset of pain, fever, and thrombocytopenia on day 4. Nine of the 19 infected neonates developed encephalopathy with pathologic MRI findings, including cerebral hemorrhage in two cases (PLoS Med. 2008 Mar 18;5[3]:e60).
The case fatality rate for chikungunya is low at 0.1%. Most deaths occur in young children or elderly individuals with major comorbid conditions. Despite this low mortality, interest in chikungunya vaccine development is being driven by the infection’s impact on tourism, its spread to temperate climates, the economic impact of the considerable time lost from work, and military need. A promising attenuated, virus-like, particle-based vaccine is currently in phase II testing in the Caribbean.
Dr. Schoen reported having no financial conflicts.

MRD predicts outcome of HSCT in ALL, study suggests

ORLANDO, FL—Minimal residual disease (MRD) measurements before and after hematopoietic stem cell transplant (HSCT) can help predict outcomes in patients with childhood acute lymphoblastic leukemia (ALL), according to researchers.
Their work also suggests several other factors can be used to predict event-free survival (EFS) in this patient population, and the team developed risk scores incorporating these factors.
Michael A. Pulsipher, MD, of Children’s Hospital Los Angeles in California, presented this work as one of the “Best Abstracts” at the 2017 BMT Tandem Meetings (abstract 4*).
“The new risk scores that we were able to develop very nicely predict outcomes post-transplant and can guide study planning,” Dr Pulsipher said.
“MRD pre-transplant was a very powerful predictor of outcome, and MRD post-transplant highlights individual patients at risk.”
For this study, Dr Pulsipher and his colleagues retrospectively analyzed 747 patients treated in Europe, North America, and Australia. The patients received transplants between September 1999 and May 2015.
Most patients had pre-B ALL (78%, n=586), 19% (n=145) had T-cell ALL, 2% had “other” ALLs (n=8) or no data on ALL type (n=8). Sixty-two percent (n=466) were male.
Nearly half of patients were between the ages of 2 and 10 (49%, n=365), 47% (n=351) were older than 10, and 4% (n=31) were younger than 2.
Transplant details
Patients received grafts from matched unrelated donors (42%, n=314), matched sibling donors (30%, n=227), mismatched donors (10%, n=75), and cord blood from unrelated donors (17%, n=128). There was no data on donor type for 3 patients.
Most patients received bone marrow transplants (61%, n=458), 20% (n=147) received cord blood, and 18% (n=131) received peripheral blood stem cells. Eight patients received “other” types of transplants, and 3 patients had no data on stem cell source.
More than half of the patients (55%, n=410) were in their second complete remission (CR) at transplant. Thirty-seven percent were in their first CR (n=275), 7% were in their third or greater CR (n=53), and 1% were not in remission (n=7). Two patients had no data on remission status.
MRD
MRD was assessed before HSCT as well as after—on or near days 30, 60, 90, 180, 365, and beyond.
There were 4 MRD categories:
- MRD negative: No signal
- MRD low: >0 to <10-4 (<0.01%)
- MRD high: ≥10-4 to <10-3 (0.01 to 0.1%)
- MRD very high: ≥10-3 to <10-2 (>0.1%).
Dr Pulsipher noted that, when analyzing MRD pre-HSCT or at 30 days after HSCT, the estimated 5-year EFS was similar for patients in the MRD-negative and MRD-low groups. However, as time went on (at days 90, 180, and 365), any detectable level of MRD was associated with a poor prognosis.
“And patients arriving at day 365 with no detectable MRD had an exceptional prognosis, with survival approaching 90%,” Dr Pulsipher said.
He also pointed out an interaction between acute graft-vs-host disease (aGVHD) and MRD post-HSCT. He and his colleagues observed better survival for MRD-positive patients with aGVHD (grade 1-2) than for MRD-positive patients without aGVHD.
Pre-HSCT risk score
Via an adjusted Cox regression analysis, the researchers identified several pre-transplant factors that predicted EFS at 18 months.
These included remission status, donor type, immunophenotype, and MRD. The researchers assigned points to each of these factors to create a risk score.
Compared to patients in first CR, the hazard ratio (HR) for patients in early second CR was 2.53, and the score was 3. For patients in third CR or greater, the HR was 1.95, and the score was 2.
Compared to patients with a matched sibling donor, the HR for patients with a mismatched donor was 1.41, and the score was 1. For patients who received cord blood from an unrelated donor, the HR was 1.48, and the score was 1.
Compared to patients with T-cell ALL, the HR for patients with pre-B ALL was 1.35, and the score was 1.
Compared to patients with MRD <10-4, the HR for patients with MRD ≥10-4 was 2.32, and the score was 2.
The probability of EFS at 18 months was 78% ± 2% for patients with 0 to 1 points, 54% ± 3% for those with 2 to 3 points, and 46% ± 5% for patients with 4 or more points.
Day 30 post-HSCT risk score
When considering patients at day 30 post-HSCT, factors that predicted 18-month EFS included remission status, donor type, immunophenotype, aGVHD status, and MRD.
The HR for patients in early second CR was 2.51, and the score was 3. For patients in third CR or greater, the HR was 2.09, and the score was 2.
The HR for patients with a mismatched donor was 1.75, and the score was 2. The HR for patients with pre-B ALL was 1.40, and the score was 1.
Compared to patients with grade 1-2 aGVHD, the HR was 2.02 for patients with grade 0 aGVHD, and the score was 2. For patients with grade 3 aGVHD, the HR was 1.44, and the score was 1. For patients with grade 4 aGVHD, the HR was 7.12, and the score was 7.
The researchers evaluated MRD prior to HSCT and MRD at day 30, using a reference of MRD <10-4 at both time points. For patients with MRD <10-4 pre-HSCT and ≥10-4 at day 30, the HR was 2.29, and the score was 2.
For patients with MRD ≥10-4 pre-HSCT and <10-4 at day 30, the HR was 3.17, and the score was 3. For patients with MRD ≥10-4 pre-HSCT and at day 30, the HR was 3.63, and the score was 4.
The probability of EFS at 18 months was 80% ± 2% for patients with 0 to 3 points, 54% ± 4% for those with 4 to 6 points, and 25% ± 6% for those with 7 or more points.
Day 90 post-HSCT risk score
When considering patients at day 90 post-HSCT, factors that predicted 18-month EFS included remission status, aGVHD status, and MRD.
For patients in early second CR, the HR was 2.81, and the score was 3. For those in third CR or greater, the HR was 1.85, and the score was 2.
Compared to patients with grade 1-2 aGVHD, the HR was 1.60 for patients with grade 0 aGVHD, and the score was 2. For patients with grade 4 aGVHD, the HR was 2.49, and the score was 2.
The researchers assessed MRD prior to HSCT and MRD at day 90, using a reference of MRD <10-4 at both time points. For patients with MRD <10-4 pre-HSCT and ≥10-4 at day 90, the HR was 6.03, and the score was 6.
For patients with MRD ≥10-4 pre-HSCT and <10-4 at day 90, the HR was 3.11, and the score was 3. For patients with MRD ≥10-4 pre-HSCT and at day 90, the HR was 4.59, and the score was 5.
The probability of EFS at 18 months was 83% ± 2% for patients with 0 to 2 points, 60% ± 4% for those with 3 to 5 points, and 17% ± 11 for those with 6 or more points. 
*Information in the abstract differs from the presentation.
ORLANDO, FL—Minimal residual disease (MRD) measurements before and after hematopoietic stem cell transplant (HSCT) can help predict outcomes in patients with childhood acute lymphoblastic leukemia (ALL), according to researchers.
Their work also suggests several other factors can be used to predict event-free survival (EFS) in this patient population, and the team developed risk scores incorporating these factors.
Michael A. Pulsipher, MD, of Children’s Hospital Los Angeles in California, presented this work as one of the “Best Abstracts” at the 2017 BMT Tandem Meetings (abstract 4*).
“The new risk scores that we were able to develop very nicely predict outcomes post-transplant and can guide study planning,” Dr Pulsipher said.
“MRD pre-transplant was a very powerful predictor of outcome, and MRD post-transplant highlights individual patients at risk.”
For this study, Dr Pulsipher and his colleagues retrospectively analyzed 747 patients treated in Europe, North America, and Australia. The patients received transplants between September 1999 and May 2015.
Most patients had pre-B ALL (78%, n=586), 19% (n=145) had T-cell ALL, 2% had “other” ALLs (n=8) or no data on ALL type (n=8). Sixty-two percent (n=466) were male.
Nearly half of patients were between the ages of 2 and 10 (49%, n=365), 47% (n=351) were older than 10, and 4% (n=31) were younger than 2.
Transplant details
Patients received grafts from matched unrelated donors (42%, n=314), matched sibling donors (30%, n=227), mismatched donors (10%, n=75), and cord blood from unrelated donors (17%, n=128). There was no data on donor type for 3 patients.
Most patients received bone marrow transplants (61%, n=458), 20% (n=147) received cord blood, and 18% (n=131) received peripheral blood stem cells. Eight patients received “other” types of transplants, and 3 patients had no data on stem cell source.
More than half of the patients (55%, n=410) were in their second complete remission (CR) at transplant. Thirty-seven percent were in their first CR (n=275), 7% were in their third or greater CR (n=53), and 1% were not in remission (n=7). Two patients had no data on remission status.
MRD
MRD was assessed before HSCT as well as after—on or near days 30, 60, 90, 180, 365, and beyond.
There were 4 MRD categories:
- MRD negative: No signal
- MRD low: >0 to <10-4 (<0.01%)
- MRD high: ≥10-4 to <10-3 (0.01 to 0.1%)
- MRD very high: ≥10-3 to <10-2 (>0.1%).
Dr Pulsipher noted that, when analyzing MRD pre-HSCT or at 30 days after HSCT, the estimated 5-year EFS was similar for patients in the MRD-negative and MRD-low groups. However, as time went on (at days 90, 180, and 365), any detectable level of MRD was associated with a poor prognosis.
“And patients arriving at day 365 with no detectable MRD had an exceptional prognosis, with survival approaching 90%,” Dr Pulsipher said.
He also pointed out an interaction between acute graft-vs-host disease (aGVHD) and MRD post-HSCT. He and his colleagues observed better survival for MRD-positive patients with aGVHD (grade 1-2) than for MRD-positive patients without aGVHD.
Pre-HSCT risk score
Via an adjusted Cox regression analysis, the researchers identified several pre-transplant factors that predicted EFS at 18 months.
These included remission status, donor type, immunophenotype, and MRD. The researchers assigned points to each of these factors to create a risk score.
Compared to patients in first CR, the hazard ratio (HR) for patients in early second CR was 2.53, and the score was 3. For patients in third CR or greater, the HR was 1.95, and the score was 2.
Compared to patients with a matched sibling donor, the HR for patients with a mismatched donor was 1.41, and the score was 1. For patients who received cord blood from an unrelated donor, the HR was 1.48, and the score was 1.
Compared to patients with T-cell ALL, the HR for patients with pre-B ALL was 1.35, and the score was 1.
Compared to patients with MRD <10-4, the HR for patients with MRD ≥10-4 was 2.32, and the score was 2.
The probability of EFS at 18 months was 78% ± 2% for patients with 0 to 1 points, 54% ± 3% for those with 2 to 3 points, and 46% ± 5% for patients with 4 or more points.
Day 30 post-HSCT risk score
When considering patients at day 30 post-HSCT, factors that predicted 18-month EFS included remission status, donor type, immunophenotype, aGVHD status, and MRD.
The HR for patients in early second CR was 2.51, and the score was 3. For patients in third CR or greater, the HR was 2.09, and the score was 2.
The HR for patients with a mismatched donor was 1.75, and the score was 2. The HR for patients with pre-B ALL was 1.40, and the score was 1.
Compared to patients with grade 1-2 aGVHD, the HR was 2.02 for patients with grade 0 aGVHD, and the score was 2. For patients with grade 3 aGVHD, the HR was 1.44, and the score was 1. For patients with grade 4 aGVHD, the HR was 7.12, and the score was 7.
The researchers evaluated MRD prior to HSCT and MRD at day 30, using a reference of MRD <10-4 at both time points. For patients with MRD <10-4 pre-HSCT and ≥10-4 at day 30, the HR was 2.29, and the score was 2.
For patients with MRD ≥10-4 pre-HSCT and <10-4 at day 30, the HR was 3.17, and the score was 3. For patients with MRD ≥10-4 pre-HSCT and at day 30, the HR was 3.63, and the score was 4.
The probability of EFS at 18 months was 80% ± 2% for patients with 0 to 3 points, 54% ± 4% for those with 4 to 6 points, and 25% ± 6% for those with 7 or more points.
Day 90 post-HSCT risk score
When considering patients at day 90 post-HSCT, factors that predicted 18-month EFS included remission status, aGVHD status, and MRD.
For patients in early second CR, the HR was 2.81, and the score was 3. For those in third CR or greater, the HR was 1.85, and the score was 2.
Compared to patients with grade 1-2 aGVHD, the HR was 1.60 for patients with grade 0 aGVHD, and the score was 2. For patients with grade 4 aGVHD, the HR was 2.49, and the score was 2.
The researchers assessed MRD prior to HSCT and MRD at day 90, using a reference of MRD <10-4 at both time points. For patients with MRD <10-4 pre-HSCT and ≥10-4 at day 90, the HR was 6.03, and the score was 6.
For patients with MRD ≥10-4 pre-HSCT and <10-4 at day 90, the HR was 3.11, and the score was 3. For patients with MRD ≥10-4 pre-HSCT and at day 90, the HR was 4.59, and the score was 5.
The probability of EFS at 18 months was 83% ± 2% for patients with 0 to 2 points, 60% ± 4% for those with 3 to 5 points, and 17% ± 11 for those with 6 or more points.
*Information in the abstract differs from the presentation.
ORLANDO, FL—Minimal residual disease (MRD) measurements before and after hematopoietic stem cell transplant (HSCT) can help predict outcomes in patients with childhood acute lymphoblastic leukemia (ALL), according to researchers.
Their work also suggests several other factors can be used to predict event-free survival (EFS) in this patient population, and the team developed risk scores incorporating these factors.
Michael A. Pulsipher, MD, of Children’s Hospital Los Angeles in California, presented this work as one of the “Best Abstracts” at the 2017 BMT Tandem Meetings (abstract 4*).
“The new risk scores that we were able to develop very nicely predict outcomes post-transplant and can guide study planning,” Dr Pulsipher said.
“MRD pre-transplant was a very powerful predictor of outcome, and MRD post-transplant highlights individual patients at risk.”
For this study, Dr Pulsipher and his colleagues retrospectively analyzed 747 patients treated in Europe, North America, and Australia. The patients received transplants between September 1999 and May 2015.
Most patients had pre-B ALL (78%, n=586), 19% (n=145) had T-cell ALL, 2% had “other” ALLs (n=8) or no data on ALL type (n=8). Sixty-two percent (n=466) were male.
Nearly half of patients were between the ages of 2 and 10 (49%, n=365), 47% (n=351) were older than 10, and 4% (n=31) were younger than 2.
Transplant details
Patients received grafts from matched unrelated donors (42%, n=314), matched sibling donors (30%, n=227), mismatched donors (10%, n=75), and cord blood from unrelated donors (17%, n=128). There was no data on donor type for 3 patients.
Most patients received bone marrow transplants (61%, n=458), 20% (n=147) received cord blood, and 18% (n=131) received peripheral blood stem cells. Eight patients received “other” types of transplants, and 3 patients had no data on stem cell source.
More than half of the patients (55%, n=410) were in their second complete remission (CR) at transplant. Thirty-seven percent were in their first CR (n=275), 7% were in their third or greater CR (n=53), and 1% were not in remission (n=7). Two patients had no data on remission status.
MRD
MRD was assessed before HSCT as well as after—on or near days 30, 60, 90, 180, 365, and beyond.
There were 4 MRD categories:
- MRD negative: No signal
- MRD low: >0 to <10-4 (<0.01%)
- MRD high: ≥10-4 to <10-3 (0.01 to 0.1%)
- MRD very high: ≥10-3 to <10-2 (>0.1%).
Dr Pulsipher noted that, when analyzing MRD pre-HSCT or at 30 days after HSCT, the estimated 5-year EFS was similar for patients in the MRD-negative and MRD-low groups. However, as time went on (at days 90, 180, and 365), any detectable level of MRD was associated with a poor prognosis.
“And patients arriving at day 365 with no detectable MRD had an exceptional prognosis, with survival approaching 90%,” Dr Pulsipher said.
He also pointed out an interaction between acute graft-vs-host disease (aGVHD) and MRD post-HSCT. He and his colleagues observed better survival for MRD-positive patients with aGVHD (grade 1-2) than for MRD-positive patients without aGVHD.
Pre-HSCT risk score
Via an adjusted Cox regression analysis, the researchers identified several pre-transplant factors that predicted EFS at 18 months.
These included remission status, donor type, immunophenotype, and MRD. The researchers assigned points to each of these factors to create a risk score.
Compared to patients in first CR, the hazard ratio (HR) for patients in early second CR was 2.53, and the score was 3. For patients in third CR or greater, the HR was 1.95, and the score was 2.
Compared to patients with a matched sibling donor, the HR for patients with a mismatched donor was 1.41, and the score was 1. For patients who received cord blood from an unrelated donor, the HR was 1.48, and the score was 1.
Compared to patients with T-cell ALL, the HR for patients with pre-B ALL was 1.35, and the score was 1.
Compared to patients with MRD <10-4, the HR for patients with MRD ≥10-4 was 2.32, and the score was 2.
The probability of EFS at 18 months was 78% ± 2% for patients with 0 to 1 points, 54% ± 3% for those with 2 to 3 points, and 46% ± 5% for patients with 4 or more points.
Day 30 post-HSCT risk score
When considering patients at day 30 post-HSCT, factors that predicted 18-month EFS included remission status, donor type, immunophenotype, aGVHD status, and MRD.
The HR for patients in early second CR was 2.51, and the score was 3. For patients in third CR or greater, the HR was 2.09, and the score was 2.
The HR for patients with a mismatched donor was 1.75, and the score was 2. The HR for patients with pre-B ALL was 1.40, and the score was 1.
Compared to patients with grade 1-2 aGVHD, the HR was 2.02 for patients with grade 0 aGVHD, and the score was 2. For patients with grade 3 aGVHD, the HR was 1.44, and the score was 1. For patients with grade 4 aGVHD, the HR was 7.12, and the score was 7.
The researchers evaluated MRD prior to HSCT and MRD at day 30, using a reference of MRD <10-4 at both time points. For patients with MRD <10-4 pre-HSCT and ≥10-4 at day 30, the HR was 2.29, and the score was 2.
For patients with MRD ≥10-4 pre-HSCT and <10-4 at day 30, the HR was 3.17, and the score was 3. For patients with MRD ≥10-4 pre-HSCT and at day 30, the HR was 3.63, and the score was 4.
The probability of EFS at 18 months was 80% ± 2% for patients with 0 to 3 points, 54% ± 4% for those with 4 to 6 points, and 25% ± 6% for those with 7 or more points.
Day 90 post-HSCT risk score
When considering patients at day 90 post-HSCT, factors that predicted 18-month EFS included remission status, aGVHD status, and MRD.
For patients in early second CR, the HR was 2.81, and the score was 3. For those in third CR or greater, the HR was 1.85, and the score was 2.
Compared to patients with grade 1-2 aGVHD, the HR was 1.60 for patients with grade 0 aGVHD, and the score was 2. For patients with grade 4 aGVHD, the HR was 2.49, and the score was 2.
The researchers assessed MRD prior to HSCT and MRD at day 90, using a reference of MRD <10-4 at both time points. For patients with MRD <10-4 pre-HSCT and ≥10-4 at day 90, the HR was 6.03, and the score was 6.
For patients with MRD ≥10-4 pre-HSCT and <10-4 at day 90, the HR was 3.11, and the score was 3. For patients with MRD ≥10-4 pre-HSCT and at day 90, the HR was 4.59, and the score was 5.
The probability of EFS at 18 months was 83% ± 2% for patients with 0 to 2 points, 60% ± 4% for those with 3 to 5 points, and 17% ± 11 for those with 6 or more points.
*Information in the abstract differs from the presentation.
Gender impacts risk of atopic diseases
ATLANTA – Obese females who live in urban settings are significantly more likely to develop atopic diseases, compared with their male counterparts, results from a single-center study showed.
“Some research has shown that obese girls are much more likely to be atopic, but many of them only look at one disease alone, such as atopic dermatitis or food allergies,” lead study author Sairaman Nagarajan, MD, MPH, said in an interview at the annual meeting of the American Academy of Allergy, Asthma, and Immunology. “Most of the studies are in asthma.”

The mean age of patients was 9 years, 23% were obese, and 55% were male. The researchers observed no differences in laboratory biomarkers nor in the prevalence of individual/or cumulative atopic disease in obese children, compared with controls. When stratified by gender, obese females had a significantly higher mean atopic disease score, compared with controls (4.00 vs. 2.62, respectively; P less than .001), while males had a significantly lower mean atopic disease score, compared with controls (3 vs. 3.42; P less than .001). Regression models yielded similar results; obese females had a significantly higher mean atopic disease score, compared with controls (by a mean elevation of 1.37 points; P less than .005), while males had a significantly lower mean atopic disease score (by a mean decline of -0.42 points; P less than .006). “From this we can say that female gender is a positive risk factor for atopy, and urban obese females may be particularly likely to benefit from lifestyle modification therapy like exercise and diet in controlling weight, and thereby allergies,” Dr. Nagarajan said.
He noted that it remains unclear whether the findings would apply to children who live in nonurban settings. “It’s difficult to say because there are some variables which are unique to urban minority populations like the housing that they live in and the kind of stores they buy food from,” he said.
Dr. Nagarajan reported having no financial disclosures.
ATLANTA – Obese females who live in urban settings are significantly more likely to develop atopic diseases, compared with their male counterparts, results from a single-center study showed.
“Some research has shown that obese girls are much more likely to be atopic, but many of them only look at one disease alone, such as atopic dermatitis or food allergies,” lead study author Sairaman Nagarajan, MD, MPH, said in an interview at the annual meeting of the American Academy of Allergy, Asthma, and Immunology. “Most of the studies are in asthma.”
The mean age of patients was 9 years, 23% were obese, and 55% were male. The researchers observed no differences in laboratory biomarkers nor in the prevalence of individual/or cumulative atopic disease in obese children, compared with controls. When stratified by gender, obese females had a significantly higher mean atopic disease score, compared with controls (4.00 vs. 2.62, respectively; P less than .001), while males had a significantly lower mean atopic disease score, compared with controls (3 vs. 3.42; P less than .001). Regression models yielded similar results; obese females had a significantly higher mean atopic disease score, compared with controls (by a mean elevation of 1.37 points; P less than .005), while males had a significantly lower mean atopic disease score (by a mean decline of -0.42 points; P less than .006). “From this we can say that female gender is a positive risk factor for atopy, and urban obese females may be particularly likely to benefit from lifestyle modification therapy like exercise and diet in controlling weight, and thereby allergies,” Dr. Nagarajan said.
He noted that it remains unclear whether the findings would apply to children who live in nonurban settings. “It’s difficult to say because there are some variables which are unique to urban minority populations like the housing that they live in and the kind of stores they buy food from,” he said.
Dr. Nagarajan reported having no financial disclosures.
ATLANTA – Obese females who live in urban settings are significantly more likely to develop atopic diseases, compared with their male counterparts, results from a single-center study showed.
“Some research has shown that obese girls are much more likely to be atopic, but many of them only look at one disease alone, such as atopic dermatitis or food allergies,” lead study author Sairaman Nagarajan, MD, MPH, said in an interview at the annual meeting of the American Academy of Allergy, Asthma, and Immunology. “Most of the studies are in asthma.”
The mean age of patients was 9 years, 23% were obese, and 55% were male. The researchers observed no differences in laboratory biomarkers nor in the prevalence of individual/or cumulative atopic disease in obese children, compared with controls. When stratified by gender, obese females had a significantly higher mean atopic disease score, compared with controls (4.00 vs. 2.62, respectively; P less than .001), while males had a significantly lower mean atopic disease score, compared with controls (3 vs. 3.42; P less than .001). Regression models yielded similar results; obese females had a significantly higher mean atopic disease score, compared with controls (by a mean elevation of 1.37 points; P less than .005), while males had a significantly lower mean atopic disease score (by a mean decline of -0.42 points; P less than .006). “From this we can say that female gender is a positive risk factor for atopy, and urban obese females may be particularly likely to benefit from lifestyle modification therapy like exercise and diet in controlling weight, and thereby allergies,” Dr. Nagarajan said.
He noted that it remains unclear whether the findings would apply to children who live in nonurban settings. “It’s difficult to say because there are some variables which are unique to urban minority populations like the housing that they live in and the kind of stores they buy food from,” he said.
Dr. Nagarajan reported having no financial disclosures.
AT 2017 AAAAI ANNUAL MEETING
Key clinical point:
Major finding: When stratified by gender, obese females had a significantly higher mean atopic disease score, compared with controls (4 vs. 2.62, respectively; P less than .001), while males had a significantly lower mean atopic disease score, compared with controls (3 vs. 3.42; P less than .001).
Data source: A retrospective review of 113 children who were evaluated for a history of allergic rhinitis, eczema, asthma, food allergies, and IgE, the percentage of eosinophils, and absolute eosinophil counts.
Disclosures: Dr. Nagarajan reported having no financial disclosures.
In children, peanut IgE levels increase over time
ATLANTA – Within a cohort of children diagnosed with peanut allergy who were followed since 2001, peanut IgE levels increased significantly over time in all races, according to a preliminary analysis of data.
In an interview in advance of the annual meeting of the American Academy of Allergy, Asthma, and Immunology, lead study author Yasmin Hamzavi, MD, said that recent publications have implicated race as a factor in food sensitization, but how this may impact the management of food allergy has not been elucidated. “The novel aspect of this study is that we are not just looking at the baseline peanut IgE levels between the races, but at the rate of change in peanut IgE over time between the different races,” said Dr. Hamzavi, a fellow in the division of allergy and immunology at Northwell Health, Great Neck, N.Y. “My question was, does the level of peanut IgE decrease or increase faster in one race versus another?”
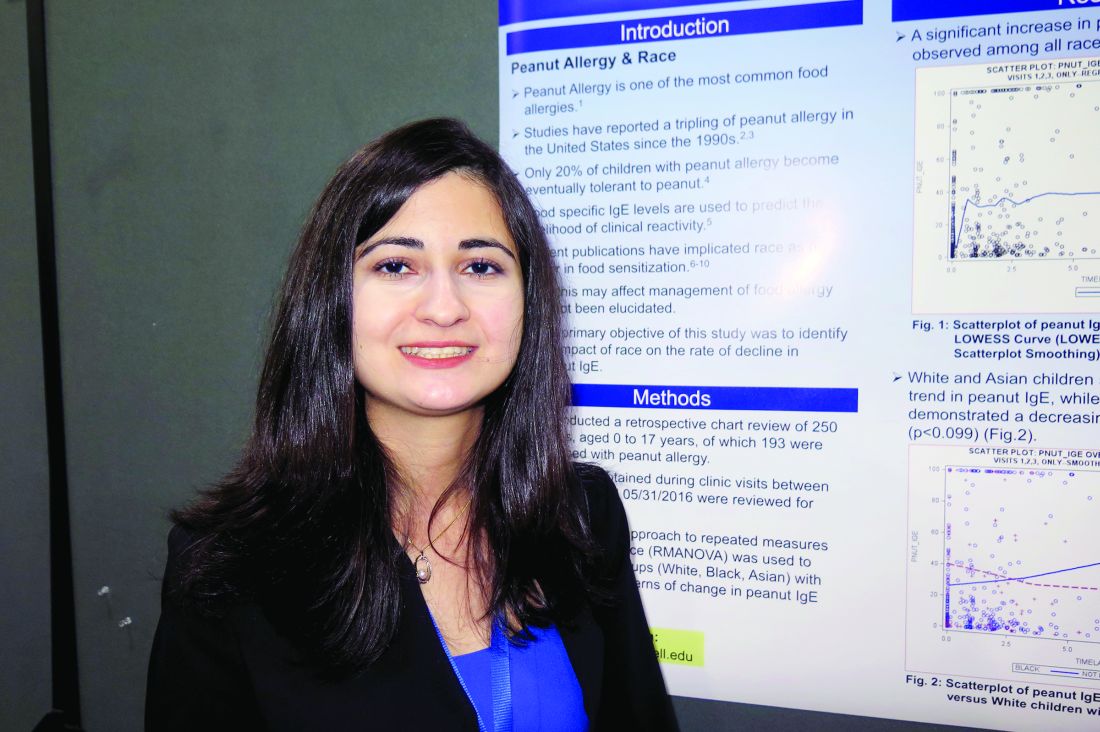
A significant increase in peanut IgE over time was observed among all races (P less than .0002). In addition, white and Asian children showed an increasing trend in peanut IgE, while black children demonstrated a decreasing trend over time (P less than .099), a finding that Dr. Hamzavi described as “surprising and unusual.” She called for larger studies exploring factors for the noted increase among all races, such as changes in testing methods, food avoidance, and increasing sensitization. “Understanding the changes in peanut sensitization over time is a crucial step in determining the likelihood of clinical reactivity,” she said.
Dr. Hamzavi is reviewing data for a similar analysis of children with milk and egg allergy. She reported having no financial disclosures.
ATLANTA – Within a cohort of children diagnosed with peanut allergy who were followed since 2001, peanut IgE levels increased significantly over time in all races, according to a preliminary analysis of data.
In an interview in advance of the annual meeting of the American Academy of Allergy, Asthma, and Immunology, lead study author Yasmin Hamzavi, MD, said that recent publications have implicated race as a factor in food sensitization, but how this may impact the management of food allergy has not been elucidated. “The novel aspect of this study is that we are not just looking at the baseline peanut IgE levels between the races, but at the rate of change in peanut IgE over time between the different races,” said Dr. Hamzavi, a fellow in the division of allergy and immunology at Northwell Health, Great Neck, N.Y. “My question was, does the level of peanut IgE decrease or increase faster in one race versus another?”
A significant increase in peanut IgE over time was observed among all races (P less than .0002). In addition, white and Asian children showed an increasing trend in peanut IgE, while black children demonstrated a decreasing trend over time (P less than .099), a finding that Dr. Hamzavi described as “surprising and unusual.” She called for larger studies exploring factors for the noted increase among all races, such as changes in testing methods, food avoidance, and increasing sensitization. “Understanding the changes in peanut sensitization over time is a crucial step in determining the likelihood of clinical reactivity,” she said.
Dr. Hamzavi is reviewing data for a similar analysis of children with milk and egg allergy. She reported having no financial disclosures.
ATLANTA – Within a cohort of children diagnosed with peanut allergy who were followed since 2001, peanut IgE levels increased significantly over time in all races, according to a preliminary analysis of data.
In an interview in advance of the annual meeting of the American Academy of Allergy, Asthma, and Immunology, lead study author Yasmin Hamzavi, MD, said that recent publications have implicated race as a factor in food sensitization, but how this may impact the management of food allergy has not been elucidated. “The novel aspect of this study is that we are not just looking at the baseline peanut IgE levels between the races, but at the rate of change in peanut IgE over time between the different races,” said Dr. Hamzavi, a fellow in the division of allergy and immunology at Northwell Health, Great Neck, N.Y. “My question was, does the level of peanut IgE decrease or increase faster in one race versus another?”
A significant increase in peanut IgE over time was observed among all races (P less than .0002). In addition, white and Asian children showed an increasing trend in peanut IgE, while black children demonstrated a decreasing trend over time (P less than .099), a finding that Dr. Hamzavi described as “surprising and unusual.” She called for larger studies exploring factors for the noted increase among all races, such as changes in testing methods, food avoidance, and increasing sensitization. “Understanding the changes in peanut sensitization over time is a crucial step in determining the likelihood of clinical reactivity,” she said.
Dr. Hamzavi is reviewing data for a similar analysis of children with milk and egg allergy. She reported having no financial disclosures.
AT 2017 AAAAI ANNUAL MEETING
Key clinical point:
Major finding: A significant increase in peanut IgE over time was observed among white, black, and Asian children (P less than .0002).
Data source: A retrospective review of 193 children diagnosed with peanut allergy .
Disclosures: Dr. Hamzavi reported having no financial disclosures.
Five-day treatment of ear infections
In December 2016, the results of a randomized, controlled trial of 5-day vs. 10-day amoxicillin/clavulanate treatment of acute otitis media (AOM) in children aged 6-23 months was reported by Hoberman et al. in the New England Journal of Medicine (NEJM).1 Predefined criteria for clinical failure were used that considered both symptoms and signs of AOM, assessed on days 12-14 after start of treatment with 5 vs. 10 days of treatment with the antibiotic. The conclusion reached was clear: The clinical failure rate for the 5-day regimen was 34% vs. 16% in the 10-day group, supporting a preference for the 10-day treatment.
I was surprised. The clinical failure rate for the 5-day regimen seemed very high for treatment with amoxicillin/clavulanate. If it is 34% with amoxicillin/clavulanate, then what would it have been with amoxicillin, as recommended by the American Academy of Pediatrics?

So, why did the systematic review conclude that there was a minimal difference between shortened treatments and the standard 10-day when the NEJM study reported such a striking difference?
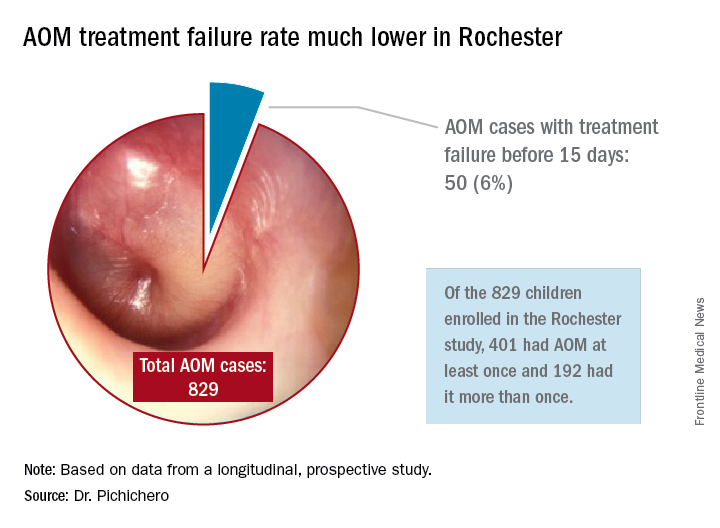
In Rochester, N.Y., we have been conducting a longitudinal, prospective study of AOM that is NIH-sponsored to better understand the immune response to AOM, especially in otitis-prone children.3,4 In that study we are treating all children aged 6-23 months with amoxicillin/clavulanate using the same dose as used in the study by Hoberman et al. We have two exceptions: If the child has a second AOM within 30 days of a prior episode or they have an eardrum rupture, we treat for 10 days.5 Our clinical failure rate is 6%. Why is the failure rate in Rochester so much lower than that in Pittsburgh and Bardstown, Ky., where the Hoberman et al. study was done?
One possibility is an important difference in our study design, compared with that of the NEJM study. All the children in our prospective study have a tympanocentesis to confirm the clinical diagnosis, and our research has shown that tympanocentesis results in immediate relief of ear pain and reduces the frequency of antibiotic treatment failure about twofold, compared with children diagnosed and treated by the same physicians in the same clinic practice.6 So, if the tympanocentesis is factored out of the equation, the Rochester clinical failure comes out to 14% for 5-day treatment. Why would the children in Rochester not getting a tympanocentesis, being treated with the same antibiotic, same dose, and same definition of clinical failure, during the same time frame, and having the same bacteria with the same antibiotic resistance rates have a clinical failure rate of 14%, compared with the 34% in the NEJM study?
Next question: How does a clinical failure rate of 34% fit according to past studies of shortened course antibiotic treatment of AOM? Besides the systematic review and meta-analysis noted above, in many countries outside the United States the 5-day regimen is standard, so, if health care providers were seeing a 34% failure rate, that would have been noticeable for sure.8 So, if health care providers were seeing a 34% failure rate, would that not have been noticeable? And would not a 16% failure rate, nearly 1 of 5 cases, be noticeable for children treated for 10 days?
Was there something different about the children who were in the Hoberman et al. study and the children treated in countries outside the United States and in our practice in Rochester? My group has collaborated and published on studies of AOM with the Pittsburgh and Kentucky groups, and we have not found significant site to site differences in outcomes, demonstrating that a population difference is unlikely.9-11
Next question: How does a clinical failure rate of 16% fit according to past studies of 10 days’ antibiotic treatment of AOM? It is on target with the meta-analysis and two other recent studies in the NEJM.12,13 However, if the failure rate was 16% with amoxicillin/clavulanate (which is effective against beta-lactamase–producing Haemophilus influenzae and Moraxella catarrhalis, whereas amoxicillin is not), then the predicted failure rate with amoxicillin for 10 days should be double (34%) or triple (51%) had amoxicillin been used as recommended by the AAP in light of the bacterial resistance of otopathogens. That calculation is based on the prevalence of beta-lactamase–producing H. influenzae and M. catarrhalis in the Pittsburgh and Kentucky populations, the same prevalence seen in the Rochester population.” 14
So, I conclude that this wonderful study does not convince me to change my practice from standard use of 5-day amoxicillin/clavulanate treatment of AOM. Besides, outside of a study setting, most parents don’t give the full 10-day treatment. They stop when their child seems normal (a few days after starting treatment) and save the remainder of the medicine in the refrigerator for the next illness to save a trip to the doctor. Plus, in this column, I did not even get into the issue of disturbing the microbiome with longer courses of antibiotic treatment, a topic for a future discussion.
References
1. N Engl J Med. 2016 Dec 22;375(25):2446-56.
2. Cochrane Database Syst Rev. 2010 Sep 8;(9):CD001095.
3. Pediatr Infect Dis J. 2016 Sep;35(9):1027-32.
4. Pediatr Infect Dis J. 2016 Sep;35(9):1033-9.
5. Otolaryngol Head Neck Surg. 2001 Apr;124(4):381-7.
6. Pediatr Infect Dis J. 2013 May;32(5):473-8.
7. Pediatr Infect Dis J. 2006 Mar;25(3):211-8.
8. Pediatr Infect Dis J. 2000 Sep;19(9):929-37.
9. Pediatr Infect Dis J. 1999 Aug;18(8):741-4.
10. Clin Pediatr (Phila). 2008 Nov;47(9):901-6.
11. Drugs. 2012 Oct 22;72(15):1991-7.
12. N Engl J Med. 2011 Jan 13;364(2):105-15.
13. N Engl J Med. 2011 Jan 13;364(2):116-26.
14. Pediatr Infect Dis J. 2016 Aug;35(8):901-6.
Dr. Pichichero, a specialist in pediatric infectious diseases, is director of the Research Institute, Rochester (N.Y.) General Hospital. He is also a pediatrician at Legacy Pediatrics in Rochester. He has no disclosures.
In December 2016, the results of a randomized, controlled trial of 5-day vs. 10-day amoxicillin/clavulanate treatment of acute otitis media (AOM) in children aged 6-23 months was reported by Hoberman et al. in the New England Journal of Medicine (NEJM).1 Predefined criteria for clinical failure were used that considered both symptoms and signs of AOM, assessed on days 12-14 after start of treatment with 5 vs. 10 days of treatment with the antibiotic. The conclusion reached was clear: The clinical failure rate for the 5-day regimen was 34% vs. 16% in the 10-day group, supporting a preference for the 10-day treatment.
I was surprised. The clinical failure rate for the 5-day regimen seemed very high for treatment with amoxicillin/clavulanate. If it is 34% with amoxicillin/clavulanate, then what would it have been with amoxicillin, as recommended by the American Academy of Pediatrics?
So, why did the systematic review conclude that there was a minimal difference between shortened treatments and the standard 10-day when the NEJM study reported such a striking difference?
In Rochester, N.Y., we have been conducting a longitudinal, prospective study of AOM that is NIH-sponsored to better understand the immune response to AOM, especially in otitis-prone children.3,4 In that study we are treating all children aged 6-23 months with amoxicillin/clavulanate using the same dose as used in the study by Hoberman et al. We have two exceptions: If the child has a second AOM within 30 days of a prior episode or they have an eardrum rupture, we treat for 10 days.5 Our clinical failure rate is 6%. Why is the failure rate in Rochester so much lower than that in Pittsburgh and Bardstown, Ky., where the Hoberman et al. study was done?
One possibility is an important difference in our study design, compared with that of the NEJM study. All the children in our prospective study have a tympanocentesis to confirm the clinical diagnosis, and our research has shown that tympanocentesis results in immediate relief of ear pain and reduces the frequency of antibiotic treatment failure about twofold, compared with children diagnosed and treated by the same physicians in the same clinic practice.6 So, if the tympanocentesis is factored out of the equation, the Rochester clinical failure comes out to 14% for 5-day treatment. Why would the children in Rochester not getting a tympanocentesis, being treated with the same antibiotic, same dose, and same definition of clinical failure, during the same time frame, and having the same bacteria with the same antibiotic resistance rates have a clinical failure rate of 14%, compared with the 34% in the NEJM study?
Next question: How does a clinical failure rate of 34% fit according to past studies of shortened course antibiotic treatment of AOM? Besides the systematic review and meta-analysis noted above, in many countries outside the United States the 5-day regimen is standard, so, if health care providers were seeing a 34% failure rate, that would have been noticeable for sure.8 So, if health care providers were seeing a 34% failure rate, would that not have been noticeable? And would not a 16% failure rate, nearly 1 of 5 cases, be noticeable for children treated for 10 days?
Was there something different about the children who were in the Hoberman et al. study and the children treated in countries outside the United States and in our practice in Rochester? My group has collaborated and published on studies of AOM with the Pittsburgh and Kentucky groups, and we have not found significant site to site differences in outcomes, demonstrating that a population difference is unlikely.9-11
Next question: How does a clinical failure rate of 16% fit according to past studies of 10 days’ antibiotic treatment of AOM? It is on target with the meta-analysis and two other recent studies in the NEJM.12,13 However, if the failure rate was 16% with amoxicillin/clavulanate (which is effective against beta-lactamase–producing Haemophilus influenzae and Moraxella catarrhalis, whereas amoxicillin is not), then the predicted failure rate with amoxicillin for 10 days should be double (34%) or triple (51%) had amoxicillin been used as recommended by the AAP in light of the bacterial resistance of otopathogens. That calculation is based on the prevalence of beta-lactamase–producing H. influenzae and M. catarrhalis in the Pittsburgh and Kentucky populations, the same prevalence seen in the Rochester population.” 14
So, I conclude that this wonderful study does not convince me to change my practice from standard use of 5-day amoxicillin/clavulanate treatment of AOM. Besides, outside of a study setting, most parents don’t give the full 10-day treatment. They stop when their child seems normal (a few days after starting treatment) and save the remainder of the medicine in the refrigerator for the next illness to save a trip to the doctor. Plus, in this column, I did not even get into the issue of disturbing the microbiome with longer courses of antibiotic treatment, a topic for a future discussion.
References
1. N Engl J Med. 2016 Dec 22;375(25):2446-56.
2. Cochrane Database Syst Rev. 2010 Sep 8;(9):CD001095.
3. Pediatr Infect Dis J. 2016 Sep;35(9):1027-32.
4. Pediatr Infect Dis J. 2016 Sep;35(9):1033-9.
5. Otolaryngol Head Neck Surg. 2001 Apr;124(4):381-7.
6. Pediatr Infect Dis J. 2013 May;32(5):473-8.
7. Pediatr Infect Dis J. 2006 Mar;25(3):211-8.
8. Pediatr Infect Dis J. 2000 Sep;19(9):929-37.
9. Pediatr Infect Dis J. 1999 Aug;18(8):741-4.
10. Clin Pediatr (Phila). 2008 Nov;47(9):901-6.
11. Drugs. 2012 Oct 22;72(15):1991-7.
12. N Engl J Med. 2011 Jan 13;364(2):105-15.
13. N Engl J Med. 2011 Jan 13;364(2):116-26.
14. Pediatr Infect Dis J. 2016 Aug;35(8):901-6.
Dr. Pichichero, a specialist in pediatric infectious diseases, is director of the Research Institute, Rochester (N.Y.) General Hospital. He is also a pediatrician at Legacy Pediatrics in Rochester. He has no disclosures.
In December 2016, the results of a randomized, controlled trial of 5-day vs. 10-day amoxicillin/clavulanate treatment of acute otitis media (AOM) in children aged 6-23 months was reported by Hoberman et al. in the New England Journal of Medicine (NEJM).1 Predefined criteria for clinical failure were used that considered both symptoms and signs of AOM, assessed on days 12-14 after start of treatment with 5 vs. 10 days of treatment with the antibiotic. The conclusion reached was clear: The clinical failure rate for the 5-day regimen was 34% vs. 16% in the 10-day group, supporting a preference for the 10-day treatment.
I was surprised. The clinical failure rate for the 5-day regimen seemed very high for treatment with amoxicillin/clavulanate. If it is 34% with amoxicillin/clavulanate, then what would it have been with amoxicillin, as recommended by the American Academy of Pediatrics?
So, why did the systematic review conclude that there was a minimal difference between shortened treatments and the standard 10-day when the NEJM study reported such a striking difference?
In Rochester, N.Y., we have been conducting a longitudinal, prospective study of AOM that is NIH-sponsored to better understand the immune response to AOM, especially in otitis-prone children.3,4 In that study we are treating all children aged 6-23 months with amoxicillin/clavulanate using the same dose as used in the study by Hoberman et al. We have two exceptions: If the child has a second AOM within 30 days of a prior episode or they have an eardrum rupture, we treat for 10 days.5 Our clinical failure rate is 6%. Why is the failure rate in Rochester so much lower than that in Pittsburgh and Bardstown, Ky., where the Hoberman et al. study was done?
One possibility is an important difference in our study design, compared with that of the NEJM study. All the children in our prospective study have a tympanocentesis to confirm the clinical diagnosis, and our research has shown that tympanocentesis results in immediate relief of ear pain and reduces the frequency of antibiotic treatment failure about twofold, compared with children diagnosed and treated by the same physicians in the same clinic practice.6 So, if the tympanocentesis is factored out of the equation, the Rochester clinical failure comes out to 14% for 5-day treatment. Why would the children in Rochester not getting a tympanocentesis, being treated with the same antibiotic, same dose, and same definition of clinical failure, during the same time frame, and having the same bacteria with the same antibiotic resistance rates have a clinical failure rate of 14%, compared with the 34% in the NEJM study?
Next question: How does a clinical failure rate of 34% fit according to past studies of shortened course antibiotic treatment of AOM? Besides the systematic review and meta-analysis noted above, in many countries outside the United States the 5-day regimen is standard, so, if health care providers were seeing a 34% failure rate, that would have been noticeable for sure.8 So, if health care providers were seeing a 34% failure rate, would that not have been noticeable? And would not a 16% failure rate, nearly 1 of 5 cases, be noticeable for children treated for 10 days?
Was there something different about the children who were in the Hoberman et al. study and the children treated in countries outside the United States and in our practice in Rochester? My group has collaborated and published on studies of AOM with the Pittsburgh and Kentucky groups, and we have not found significant site to site differences in outcomes, demonstrating that a population difference is unlikely.9-11
Next question: How does a clinical failure rate of 16% fit according to past studies of 10 days’ antibiotic treatment of AOM? It is on target with the meta-analysis and two other recent studies in the NEJM.12,13 However, if the failure rate was 16% with amoxicillin/clavulanate (which is effective against beta-lactamase–producing Haemophilus influenzae and Moraxella catarrhalis, whereas amoxicillin is not), then the predicted failure rate with amoxicillin for 10 days should be double (34%) or triple (51%) had amoxicillin been used as recommended by the AAP in light of the bacterial resistance of otopathogens. That calculation is based on the prevalence of beta-lactamase–producing H. influenzae and M. catarrhalis in the Pittsburgh and Kentucky populations, the same prevalence seen in the Rochester population.” 14
So, I conclude that this wonderful study does not convince me to change my practice from standard use of 5-day amoxicillin/clavulanate treatment of AOM. Besides, outside of a study setting, most parents don’t give the full 10-day treatment. They stop when their child seems normal (a few days after starting treatment) and save the remainder of the medicine in the refrigerator for the next illness to save a trip to the doctor. Plus, in this column, I did not even get into the issue of disturbing the microbiome with longer courses of antibiotic treatment, a topic for a future discussion.
References
1. N Engl J Med. 2016 Dec 22;375(25):2446-56.
2. Cochrane Database Syst Rev. 2010 Sep 8;(9):CD001095.
3. Pediatr Infect Dis J. 2016 Sep;35(9):1027-32.
4. Pediatr Infect Dis J. 2016 Sep;35(9):1033-9.
5. Otolaryngol Head Neck Surg. 2001 Apr;124(4):381-7.
6. Pediatr Infect Dis J. 2013 May;32(5):473-8.
7. Pediatr Infect Dis J. 2006 Mar;25(3):211-8.
8. Pediatr Infect Dis J. 2000 Sep;19(9):929-37.
9. Pediatr Infect Dis J. 1999 Aug;18(8):741-4.
10. Clin Pediatr (Phila). 2008 Nov;47(9):901-6.
11. Drugs. 2012 Oct 22;72(15):1991-7.
12. N Engl J Med. 2011 Jan 13;364(2):105-15.
13. N Engl J Med. 2011 Jan 13;364(2):116-26.
14. Pediatr Infect Dis J. 2016 Aug;35(8):901-6.
Dr. Pichichero, a specialist in pediatric infectious diseases, is director of the Research Institute, Rochester (N.Y.) General Hospital. He is also a pediatrician at Legacy Pediatrics in Rochester. He has no disclosures.
Wired to win
In 1929, an industrialist in Philadelphia whose factories had been plagued by vandalism sought to curtail the problem by organizing the boys in the community into athletic teams. Within a few years, his effort became Pop Warner Football. A few years later, a group of parents in Williamsport, Pa., started what was to become Little League Baseball.
Prior to the development of these two programs, kids organized their own games using shared equipment, if any at all. They drew foul lines and cobbled together goals in the bare dirt and the stubbly weeds of vacant lots and backyards. Kids shared equipment with each other. They picked teams in a manner that reflected the sometimes painful reality that some kids were proven winners and others were not. Rules were adjusted to fit the situation. Disagreements were settled without referees, or the game dissolved and a lesson was learned.
From its start in the 1930’s, the model of adult-organized and miniaturized versions of professional sports has spread from baseball and football to almost every team sport, including soccer, hockey, and lacrosse. Children may have been deprived of some self-organizing and negotiating skills, but, when one considers the electronically dominated sedentary alternatives, for the most part, adult-organized team youth sports have been a positive.

Of course, there have been some growing pains because an adult sport that has simply been miniaturized doesn’t necessarily fit well with young minds and bodies that are still developing. In some sports, adult/parent coaches now are required to undergo rigorous training in hopes of making the sport more child appropriate. However, the truth remains that, when teams compete, there are going to be winners and losers.
I recently read a newspaper article that included references to a few recent studies that suggest humans are hard wired to win (Sapolsky, Robert. “The Grim Truth Behind the ‘Winner Effect.’ ”The Wall Street Journal. Feb. 24, 2017). Well, not to win exactly but to be more likely to win again once they have been victorious, a phenomenon known as the “winner effect.”
A mouse that has been allowed to win a fixed fight with another mouse is more likely to win his next fight. Other studies on a variety of species, including humans, have found that winning can elevate testosterone levels and suppress stress-mediating hormones – winning boosts confidence and risk taking. More recent studies on zebra fish have demonstrated that a region of the habenula, a portion of the brain, seems to be critical for controlling these behaviors and chemical mediators.
Of course, the problem is that, when there are winners, there have to be losers. From time to time, the adult organizers have struggled with how to compensate for this unfortunate reality in the structure of their youth sports programs. One response has been to give every participant a trophy. Except when the children are so young that they don’t know which goal is theirs, however, awarding trophies to all is a transparent and foolish charade. The winners know who they are and so do the losers. Skillful and compassionate coaches of both winning and losing teams can cooperate to soften the cutting edge of competition, but it will never disappear. It should be fun to play, but it is always going to be more fun to win.
If there is a solution, it falls on the shoulders of parents, educators, and sometimes pediatricians to help the losers find environments and activities in which their skills and aptitudes will give them the greatest chance of enjoying the benefits of the “winner effect.” Winning isn’t everything, but it feels a lot better than losing. If we can help a child to win once – whether it is on the athletic field or in a classroom – it is more likely he or she will do it again.
Dr. Wilkoff practiced primary care pediatrics in Brunswick, Maine for nearly 40 years. He has authored several books on behavioral pediatrics, including “How to Say No to Your Toddler.” Email him at pdnews@frontlinemedcom.com.
In 1929, an industrialist in Philadelphia whose factories had been plagued by vandalism sought to curtail the problem by organizing the boys in the community into athletic teams. Within a few years, his effort became Pop Warner Football. A few years later, a group of parents in Williamsport, Pa., started what was to become Little League Baseball.
Prior to the development of these two programs, kids organized their own games using shared equipment, if any at all. They drew foul lines and cobbled together goals in the bare dirt and the stubbly weeds of vacant lots and backyards. Kids shared equipment with each other. They picked teams in a manner that reflected the sometimes painful reality that some kids were proven winners and others were not. Rules were adjusted to fit the situation. Disagreements were settled without referees, or the game dissolved and a lesson was learned.
From its start in the 1930’s, the model of adult-organized and miniaturized versions of professional sports has spread from baseball and football to almost every team sport, including soccer, hockey, and lacrosse. Children may have been deprived of some self-organizing and negotiating skills, but, when one considers the electronically dominated sedentary alternatives, for the most part, adult-organized team youth sports have been a positive.
Of course, there have been some growing pains because an adult sport that has simply been miniaturized doesn’t necessarily fit well with young minds and bodies that are still developing. In some sports, adult/parent coaches now are required to undergo rigorous training in hopes of making the sport more child appropriate. However, the truth remains that, when teams compete, there are going to be winners and losers.
I recently read a newspaper article that included references to a few recent studies that suggest humans are hard wired to win (Sapolsky, Robert. “The Grim Truth Behind the ‘Winner Effect.’ ”The Wall Street Journal. Feb. 24, 2017). Well, not to win exactly but to be more likely to win again once they have been victorious, a phenomenon known as the “winner effect.”
A mouse that has been allowed to win a fixed fight with another mouse is more likely to win his next fight. Other studies on a variety of species, including humans, have found that winning can elevate testosterone levels and suppress stress-mediating hormones – winning boosts confidence and risk taking. More recent studies on zebra fish have demonstrated that a region of the habenula, a portion of the brain, seems to be critical for controlling these behaviors and chemical mediators.
Of course, the problem is that, when there are winners, there have to be losers. From time to time, the adult organizers have struggled with how to compensate for this unfortunate reality in the structure of their youth sports programs. One response has been to give every participant a trophy. Except when the children are so young that they don’t know which goal is theirs, however, awarding trophies to all is a transparent and foolish charade. The winners know who they are and so do the losers. Skillful and compassionate coaches of both winning and losing teams can cooperate to soften the cutting edge of competition, but it will never disappear. It should be fun to play, but it is always going to be more fun to win.
If there is a solution, it falls on the shoulders of parents, educators, and sometimes pediatricians to help the losers find environments and activities in which their skills and aptitudes will give them the greatest chance of enjoying the benefits of the “winner effect.” Winning isn’t everything, but it feels a lot better than losing. If we can help a child to win once – whether it is on the athletic field or in a classroom – it is more likely he or she will do it again.
Dr. Wilkoff practiced primary care pediatrics in Brunswick, Maine for nearly 40 years. He has authored several books on behavioral pediatrics, including “How to Say No to Your Toddler.” Email him at pdnews@frontlinemedcom.com.
In 1929, an industrialist in Philadelphia whose factories had been plagued by vandalism sought to curtail the problem by organizing the boys in the community into athletic teams. Within a few years, his effort became Pop Warner Football. A few years later, a group of parents in Williamsport, Pa., started what was to become Little League Baseball.
Prior to the development of these two programs, kids organized their own games using shared equipment, if any at all. They drew foul lines and cobbled together goals in the bare dirt and the stubbly weeds of vacant lots and backyards. Kids shared equipment with each other. They picked teams in a manner that reflected the sometimes painful reality that some kids were proven winners and others were not. Rules were adjusted to fit the situation. Disagreements were settled without referees, or the game dissolved and a lesson was learned.
From its start in the 1930’s, the model of adult-organized and miniaturized versions of professional sports has spread from baseball and football to almost every team sport, including soccer, hockey, and lacrosse. Children may have been deprived of some self-organizing and negotiating skills, but, when one considers the electronically dominated sedentary alternatives, for the most part, adult-organized team youth sports have been a positive.
Of course, there have been some growing pains because an adult sport that has simply been miniaturized doesn’t necessarily fit well with young minds and bodies that are still developing. In some sports, adult/parent coaches now are required to undergo rigorous training in hopes of making the sport more child appropriate. However, the truth remains that, when teams compete, there are going to be winners and losers.
I recently read a newspaper article that included references to a few recent studies that suggest humans are hard wired to win (Sapolsky, Robert. “The Grim Truth Behind the ‘Winner Effect.’ ”The Wall Street Journal. Feb. 24, 2017). Well, not to win exactly but to be more likely to win again once they have been victorious, a phenomenon known as the “winner effect.”
A mouse that has been allowed to win a fixed fight with another mouse is more likely to win his next fight. Other studies on a variety of species, including humans, have found that winning can elevate testosterone levels and suppress stress-mediating hormones – winning boosts confidence and risk taking. More recent studies on zebra fish have demonstrated that a region of the habenula, a portion of the brain, seems to be critical for controlling these behaviors and chemical mediators.
Of course, the problem is that, when there are winners, there have to be losers. From time to time, the adult organizers have struggled with how to compensate for this unfortunate reality in the structure of their youth sports programs. One response has been to give every participant a trophy. Except when the children are so young that they don’t know which goal is theirs, however, awarding trophies to all is a transparent and foolish charade. The winners know who they are and so do the losers. Skillful and compassionate coaches of both winning and losing teams can cooperate to soften the cutting edge of competition, but it will never disappear. It should be fun to play, but it is always going to be more fun to win.
If there is a solution, it falls on the shoulders of parents, educators, and sometimes pediatricians to help the losers find environments and activities in which their skills and aptitudes will give them the greatest chance of enjoying the benefits of the “winner effect.” Winning isn’t everything, but it feels a lot better than losing. If we can help a child to win once – whether it is on the athletic field or in a classroom – it is more likely he or she will do it again.
Dr. Wilkoff practiced primary care pediatrics in Brunswick, Maine for nearly 40 years. He has authored several books on behavioral pediatrics, including “How to Say No to Your Toddler.” Email him at pdnews@frontlinemedcom.com.
MSC product granted fast track designation
The US Food and Drug Administration (FDA) has granted fast track designation to a mesenchymal stem cell (MSC) product, MSC-100-IV, as a treatment for children with steroid-refractory acute graft-vs-host disease (aGVHD).
MSC-100-IV consists of human MSCs derived from donor bone marrow and expanded in culture.
Fast track designation has the potential to shorten the time to FDA approval for MSC-100-IV through priority review, which reduces the FDA review process from 10 months to 6 months.
The designation also allows for a rolling review process, whereby completed sections of the Biologics License Application can be submitted for FDA review as they become available, instead of waiting for all sections to be completed.
In addition, fast track designation provides product developers with opportunities for more frequent meetings and written communications with the FDA.
MSC-100-IV is being developed by Mesoblast Limited in partnership with Mallinckrodt Pharmaceuticals.
Trial results
The application for fast track designation for MSC-100-IV was supported by a trial of 241 pediatric patients with steroid-refractory aGVHD. Results from this trial were presented at the 2016 BMT Tandem Meetings.
Patients initially received 2 million MSCs/kg twice a week for 4 weeks, at least 3 days apart. If they achieved a partial or mixed response (improvement in one organ with deterioration in another) at the day-28 assessment, patients then received 2 million MSCs/kg once a week for 4 weeks.
The patients received a total of 2434 infusions—a median of 11 (range, 1-24)—and had a median treatment duration of 46 days (range, 1-186).
Fifty-seven percent of patients (n=138) had at least 1 serious adverse event. About 5% (n=11) were considered treatment-related, and 1.7% (n=4) led to study discontinuation. There was 1 infusion reaction.
The overall response rate at day 28 was 65%, and the complete response rate was 14%. Responses were observed for all aGVHD grades and did not differ by baseline organ involvement.
Day 100 survival was significantly better in children who achieved a response at day 28—82%, compared to 39% for non-responders (P<0.0001).
In November 2016, Mesoblast reported success in an ongoing, phase 3 registration trial of MSC-100-IV in 60 children with steroid-refractory aGVHD.
The company said the trial was successful in a pre-specified interim futility analysis using the primary endpoint of day-28 overall response. Enrollment in this trial is expected to be complete in mid-2017.
The US Food and Drug Administration (FDA) has granted fast track designation to a mesenchymal stem cell (MSC) product, MSC-100-IV, as a treatment for children with steroid-refractory acute graft-vs-host disease (aGVHD).
MSC-100-IV consists of human MSCs derived from donor bone marrow and expanded in culture.
Fast track designation has the potential to shorten the time to FDA approval for MSC-100-IV through priority review, which reduces the FDA review process from 10 months to 6 months.
The designation also allows for a rolling review process, whereby completed sections of the Biologics License Application can be submitted for FDA review as they become available, instead of waiting for all sections to be completed.
In addition, fast track designation provides product developers with opportunities for more frequent meetings and written communications with the FDA.
MSC-100-IV is being developed by Mesoblast Limited in partnership with Mallinckrodt Pharmaceuticals.
Trial results
The application for fast track designation for MSC-100-IV was supported by a trial of 241 pediatric patients with steroid-refractory aGVHD. Results from this trial were presented at the 2016 BMT Tandem Meetings.
Patients initially received 2 million MSCs/kg twice a week for 4 weeks, at least 3 days apart. If they achieved a partial or mixed response (improvement in one organ with deterioration in another) at the day-28 assessment, patients then received 2 million MSCs/kg once a week for 4 weeks.
The patients received a total of 2434 infusions—a median of 11 (range, 1-24)—and had a median treatment duration of 46 days (range, 1-186).
Fifty-seven percent of patients (n=138) had at least 1 serious adverse event. About 5% (n=11) were considered treatment-related, and 1.7% (n=4) led to study discontinuation. There was 1 infusion reaction.
The overall response rate at day 28 was 65%, and the complete response rate was 14%. Responses were observed for all aGVHD grades and did not differ by baseline organ involvement.
Day 100 survival was significantly better in children who achieved a response at day 28—82%, compared to 39% for non-responders (P<0.0001).
In November 2016, Mesoblast reported success in an ongoing, phase 3 registration trial of MSC-100-IV in 60 children with steroid-refractory aGVHD.
The company said the trial was successful in a pre-specified interim futility analysis using the primary endpoint of day-28 overall response. Enrollment in this trial is expected to be complete in mid-2017.
The US Food and Drug Administration (FDA) has granted fast track designation to a mesenchymal stem cell (MSC) product, MSC-100-IV, as a treatment for children with steroid-refractory acute graft-vs-host disease (aGVHD).
MSC-100-IV consists of human MSCs derived from donor bone marrow and expanded in culture.
Fast track designation has the potential to shorten the time to FDA approval for MSC-100-IV through priority review, which reduces the FDA review process from 10 months to 6 months.
The designation also allows for a rolling review process, whereby completed sections of the Biologics License Application can be submitted for FDA review as they become available, instead of waiting for all sections to be completed.
In addition, fast track designation provides product developers with opportunities for more frequent meetings and written communications with the FDA.
MSC-100-IV is being developed by Mesoblast Limited in partnership with Mallinckrodt Pharmaceuticals.
Trial results
The application for fast track designation for MSC-100-IV was supported by a trial of 241 pediatric patients with steroid-refractory aGVHD. Results from this trial were presented at the 2016 BMT Tandem Meetings.
Patients initially received 2 million MSCs/kg twice a week for 4 weeks, at least 3 days apart. If they achieved a partial or mixed response (improvement in one organ with deterioration in another) at the day-28 assessment, patients then received 2 million MSCs/kg once a week for 4 weeks.
The patients received a total of 2434 infusions—a median of 11 (range, 1-24)—and had a median treatment duration of 46 days (range, 1-186).
Fifty-seven percent of patients (n=138) had at least 1 serious adverse event. About 5% (n=11) were considered treatment-related, and 1.7% (n=4) led to study discontinuation. There was 1 infusion reaction.
The overall response rate at day 28 was 65%, and the complete response rate was 14%. Responses were observed for all aGVHD grades and did not differ by baseline organ involvement.
Day 100 survival was significantly better in children who achieved a response at day 28—82%, compared to 39% for non-responders (P<0.0001).
In November 2016, Mesoblast reported success in an ongoing, phase 3 registration trial of MSC-100-IV in 60 children with steroid-refractory aGVHD.
The company said the trial was successful in a pre-specified interim futility analysis using the primary endpoint of day-28 overall response. Enrollment in this trial is expected to be complete in mid-2017.
Small study: Watchful waiting better for pediatric IBS
Children with irritable bowel syndrome (IBS) may recover more successfully with reassurance than with medication, according to a study from Federico II University in Naples, Italy.
Of 83 children in this single-center observational study, 30 of the 48 children (62.8%) who reported symptom resolution were not put on medication, according to Eleonora Giannetti, MD, and her colleagues (J Pediatr. 2017 Jan 18. doi: 10.1016/j.jpeds.2016.12.036).
Researchers assessed children using a symptom survey, having patients and their parents report “how often days off school or interruption of daily activities because of IBS were needed,” as well as a scale of disruption ranging from 0 to 4.
A total of 47 children received verbal reassurance only, with no medication, while 9 received polyethylene glycol, 24 received probiotics, and 3 received trimebutine (not available in the United States), according to Dr. Giannetti.
Dr. Giannetti and her colleagues argued the data showed not only a positive correlation between decreased symptoms and lack of pharmaceutical intervention, but a negative impact of medication on children with IBS.
“Despite larger interventional studies being needed, our results also seem to suggest that traditionally prescribed medications, particularly probiotics and [polyethlene glycol], poorly affect the progression of IBS symptoms,” Dr. Giannetti wrote. “There was even a trend toward worse outcome of patients receiving probiotics.”
Limitations included a small sample size and medication not being randomly allocated.
Researchers said they also were limited by a short time frame, which, in regards to the “recurrent nature” of IBS, makes it difficult for researchers to know if and when IBS is completely resolved.
ezimmerman@frontlinemedcom.com
On Twitter @EAZtweets
Children with irritable bowel syndrome (IBS) may recover more successfully with reassurance than with medication, according to a study from Federico II University in Naples, Italy.
Of 83 children in this single-center observational study, 30 of the 48 children (62.8%) who reported symptom resolution were not put on medication, according to Eleonora Giannetti, MD, and her colleagues (J Pediatr. 2017 Jan 18. doi: 10.1016/j.jpeds.2016.12.036).
Researchers assessed children using a symptom survey, having patients and their parents report “how often days off school or interruption of daily activities because of IBS were needed,” as well as a scale of disruption ranging from 0 to 4.
A total of 47 children received verbal reassurance only, with no medication, while 9 received polyethylene glycol, 24 received probiotics, and 3 received trimebutine (not available in the United States), according to Dr. Giannetti.
Dr. Giannetti and her colleagues argued the data showed not only a positive correlation between decreased symptoms and lack of pharmaceutical intervention, but a negative impact of medication on children with IBS.
“Despite larger interventional studies being needed, our results also seem to suggest that traditionally prescribed medications, particularly probiotics and [polyethlene glycol], poorly affect the progression of IBS symptoms,” Dr. Giannetti wrote. “There was even a trend toward worse outcome of patients receiving probiotics.”
Limitations included a small sample size and medication not being randomly allocated.
Researchers said they also were limited by a short time frame, which, in regards to the “recurrent nature” of IBS, makes it difficult for researchers to know if and when IBS is completely resolved.
ezimmerman@frontlinemedcom.com
On Twitter @EAZtweets
Children with irritable bowel syndrome (IBS) may recover more successfully with reassurance than with medication, according to a study from Federico II University in Naples, Italy.
Of 83 children in this single-center observational study, 30 of the 48 children (62.8%) who reported symptom resolution were not put on medication, according to Eleonora Giannetti, MD, and her colleagues (J Pediatr. 2017 Jan 18. doi: 10.1016/j.jpeds.2016.12.036).
Researchers assessed children using a symptom survey, having patients and their parents report “how often days off school or interruption of daily activities because of IBS were needed,” as well as a scale of disruption ranging from 0 to 4.
A total of 47 children received verbal reassurance only, with no medication, while 9 received polyethylene glycol, 24 received probiotics, and 3 received trimebutine (not available in the United States), according to Dr. Giannetti.
Dr. Giannetti and her colleagues argued the data showed not only a positive correlation between decreased symptoms and lack of pharmaceutical intervention, but a negative impact of medication on children with IBS.
“Despite larger interventional studies being needed, our results also seem to suggest that traditionally prescribed medications, particularly probiotics and [polyethlene glycol], poorly affect the progression of IBS symptoms,” Dr. Giannetti wrote. “There was even a trend toward worse outcome of patients receiving probiotics.”
Limitations included a small sample size and medication not being randomly allocated.
Researchers said they also were limited by a short time frame, which, in regards to the “recurrent nature” of IBS, makes it difficult for researchers to know if and when IBS is completely resolved.
ezimmerman@frontlinemedcom.com
On Twitter @EAZtweets
FROM THE JOURNAL OF PEDIATRICS
Key clinical point:
Major finding: Thirty of 48 children who reported IBS symptom resolution received no medical intervention; 18 were treated with one of three drugs.
Data Source: An observational, single-center study of 83 children.
Disclosures: The investigators reported no relevant conflicts of interest.
Study reveals higher rate of early death in kids with cancer

New research suggests that, in the US, early deaths from childhood cancer may be more common than clinical trials suggest.
Researchers found the rate of death within 1 month of diagnosis was higher among patients included in a large national database than among patients enrolled in phase 3 trials.
The data also indicated that early death is more likely in cancer patients under the age of 1 and those belonging to minority racial and ethnic groups.
Adam Green, MD, of the University of Colorado Anschutz Medical Campus in Aurora, and his colleagues conducted this research and reported the results in the Journal of Clinical Oncology.
The researchers analyzed data from the Surveillance, Epidemiology and End Results (SEER) database, which collects about 15% of all cancer outcomes across the US (representing a geographic and socioeconomic cross-section).
The team identified 36,337 patients with pediatric cancer (ages 0 to 19) diagnosed between 1992 and 2011. Of these patients, 555 (1.5%) died within 1 month of diagnosis.
Young age
Overall, the strongest predictor of early death was age below 1 year. The odds ratio (OR) was 4.36 for these patients (P<0.001), 0.75 for patients age 1 to 4, 0.78 for patients age 5 to 9, 1.00 (reference) for those age 10 to 14, and 1.69 for those age 15 to 19.
For hematologic malignancies, the adjusted OR (adjusted by poverty, unemployment, education, and year of diagnosis) was 4.32 for patients younger than 1 (P<0.001), 0.76 for patients age 1 to 4, 0.79 for patients age 5 to 9, 1.00 for those age 10 to 14, and 1.76 for those age 15 to 19 (P=0.002).
“In general, babies are just challenging, clinically, because they can’t tell you what they’re feeling,” Dr Green noted. “Parents and physicians have to pick the ones with cancer from the ones with a cold, without the patient being able to tell you about symptoms that could be diagnostic.”
“Babies tend to get aggressive cancers, it’s hard to tell when they’re getting sick, and some are even born with cancers that have already progressed. These factors combine to make very young age the strongest predictor of early death in our study.”
Race/ethnicity
Black race and Hispanic ethnicity also predicted early death. The OR was 1.48 for black race, 1.00 for white race (reference), and 1.09 for “other” races (P=0.102). The OR was 1.39 for Hispanic patients and 1.00 (reference) for non-Hispanic patients (P=0.007).
For hematologic malignancies, the adjusted OR was 1.68 for black patients (P=0.01) and 1.44 for patients of other, non-white races. The adjusted OR was 1.48 for Hispanic patients (P=0.009).
Dr Green said he hopes future studies will be able to determine the factors responsible for these disparities.
Higher death rates
Dr Green and his colleagues also found the rate of early death due to pediatric cancers is higher than reported in clinical trials, and this was true for all cancer subtypes assessed.
“Most of what we know about outcomes for cancer patients come from clinical trials, which have much more thorough reporting rules than cancer treated outside trials,” Dr Green said. “However, these kids in our study aren’t surviving long enough to join clinical trials.”
The researchers looked at a phase 3 trial (COG AAML0531) of pediatric patients with acute myeloid leukemia (AML) who were studied from August 2006 to June 2010. The early death rate in this trial was 1.6% (16/1022).
In contrast, the SEER database showed an early death rate for pediatric AML patients of 5.9% (15/256) during the same period as the trial and 6.2% (106/1698) for the period from 1992 to 2011. This is almost 4 times as high as the death rate in the trial.
The same effect was observed for acute lymphoblastic leukemia (ALL).
The early death rate for non-infant ALL was 0.7% (13/1790) in a trial (POG 9900) conducted from April 2000 to April 2005, 1.6% (30/1823) in the SEER data covering the same time period, and 1.3% (94/7353) in the SEER data from 1992 to 2011.
For infant ALL, the rates were 2.0% (3/149) in a trial (COG AALL0631) conducted from January 2008 to June 2014, 5.0% (2/40) in the SEER data during the trial period, and 5.4% (12/223) in the SEER data from 1992 to 2011.
“I had a hunch this was a bigger problem than we thought,” Dr Green said. “Now we see that is indeed the case.”
New research suggests that, in the US, early deaths from childhood cancer may be more common than clinical trials suggest.
Researchers found the rate of death within 1 month of diagnosis was higher among patients included in a large national database than among patients enrolled in phase 3 trials.
The data also indicated that early death is more likely in cancer patients under the age of 1 and those belonging to minority racial and ethnic groups.
Adam Green, MD, of the University of Colorado Anschutz Medical Campus in Aurora, and his colleagues conducted this research and reported the results in the Journal of Clinical Oncology.
The researchers analyzed data from the Surveillance, Epidemiology and End Results (SEER) database, which collects about 15% of all cancer outcomes across the US (representing a geographic and socioeconomic cross-section).
The team identified 36,337 patients with pediatric cancer (ages 0 to 19) diagnosed between 1992 and 2011. Of these patients, 555 (1.5%) died within 1 month of diagnosis.
Young age
Overall, the strongest predictor of early death was age below 1 year. The odds ratio (OR) was 4.36 for these patients (P<0.001), 0.75 for patients age 1 to 4, 0.78 for patients age 5 to 9, 1.00 (reference) for those age 10 to 14, and 1.69 for those age 15 to 19.
For hematologic malignancies, the adjusted OR (adjusted by poverty, unemployment, education, and year of diagnosis) was 4.32 for patients younger than 1 (P<0.001), 0.76 for patients age 1 to 4, 0.79 for patients age 5 to 9, 1.00 for those age 10 to 14, and 1.76 for those age 15 to 19 (P=0.002).
“In general, babies are just challenging, clinically, because they can’t tell you what they’re feeling,” Dr Green noted. “Parents and physicians have to pick the ones with cancer from the ones with a cold, without the patient being able to tell you about symptoms that could be diagnostic.”
“Babies tend to get aggressive cancers, it’s hard to tell when they’re getting sick, and some are even born with cancers that have already progressed. These factors combine to make very young age the strongest predictor of early death in our study.”
Race/ethnicity
Black race and Hispanic ethnicity also predicted early death. The OR was 1.48 for black race, 1.00 for white race (reference), and 1.09 for “other” races (P=0.102). The OR was 1.39 for Hispanic patients and 1.00 (reference) for non-Hispanic patients (P=0.007).
For hematologic malignancies, the adjusted OR was 1.68 for black patients (P=0.01) and 1.44 for patients of other, non-white races. The adjusted OR was 1.48 for Hispanic patients (P=0.009).
Dr Green said he hopes future studies will be able to determine the factors responsible for these disparities.
Higher death rates
Dr Green and his colleagues also found the rate of early death due to pediatric cancers is higher than reported in clinical trials, and this was true for all cancer subtypes assessed.
“Most of what we know about outcomes for cancer patients come from clinical trials, which have much more thorough reporting rules than cancer treated outside trials,” Dr Green said. “However, these kids in our study aren’t surviving long enough to join clinical trials.”
The researchers looked at a phase 3 trial (COG AAML0531) of pediatric patients with acute myeloid leukemia (AML) who were studied from August 2006 to June 2010. The early death rate in this trial was 1.6% (16/1022).
In contrast, the SEER database showed an early death rate for pediatric AML patients of 5.9% (15/256) during the same period as the trial and 6.2% (106/1698) for the period from 1992 to 2011. This is almost 4 times as high as the death rate in the trial.
The same effect was observed for acute lymphoblastic leukemia (ALL).
The early death rate for non-infant ALL was 0.7% (13/1790) in a trial (POG 9900) conducted from April 2000 to April 2005, 1.6% (30/1823) in the SEER data covering the same time period, and 1.3% (94/7353) in the SEER data from 1992 to 2011.
For infant ALL, the rates were 2.0% (3/149) in a trial (COG AALL0631) conducted from January 2008 to June 2014, 5.0% (2/40) in the SEER data during the trial period, and 5.4% (12/223) in the SEER data from 1992 to 2011.
“I had a hunch this was a bigger problem than we thought,” Dr Green said. “Now we see that is indeed the case.”
New research suggests that, in the US, early deaths from childhood cancer may be more common than clinical trials suggest.
Researchers found the rate of death within 1 month of diagnosis was higher among patients included in a large national database than among patients enrolled in phase 3 trials.
The data also indicated that early death is more likely in cancer patients under the age of 1 and those belonging to minority racial and ethnic groups.
Adam Green, MD, of the University of Colorado Anschutz Medical Campus in Aurora, and his colleagues conducted this research and reported the results in the Journal of Clinical Oncology.
The researchers analyzed data from the Surveillance, Epidemiology and End Results (SEER) database, which collects about 15% of all cancer outcomes across the US (representing a geographic and socioeconomic cross-section).
The team identified 36,337 patients with pediatric cancer (ages 0 to 19) diagnosed between 1992 and 2011. Of these patients, 555 (1.5%) died within 1 month of diagnosis.
Young age
Overall, the strongest predictor of early death was age below 1 year. The odds ratio (OR) was 4.36 for these patients (P<0.001), 0.75 for patients age 1 to 4, 0.78 for patients age 5 to 9, 1.00 (reference) for those age 10 to 14, and 1.69 for those age 15 to 19.
For hematologic malignancies, the adjusted OR (adjusted by poverty, unemployment, education, and year of diagnosis) was 4.32 for patients younger than 1 (P<0.001), 0.76 for patients age 1 to 4, 0.79 for patients age 5 to 9, 1.00 for those age 10 to 14, and 1.76 for those age 15 to 19 (P=0.002).
“In general, babies are just challenging, clinically, because they can’t tell you what they’re feeling,” Dr Green noted. “Parents and physicians have to pick the ones with cancer from the ones with a cold, without the patient being able to tell you about symptoms that could be diagnostic.”
“Babies tend to get aggressive cancers, it’s hard to tell when they’re getting sick, and some are even born with cancers that have already progressed. These factors combine to make very young age the strongest predictor of early death in our study.”
Race/ethnicity
Black race and Hispanic ethnicity also predicted early death. The OR was 1.48 for black race, 1.00 for white race (reference), and 1.09 for “other” races (P=0.102). The OR was 1.39 for Hispanic patients and 1.00 (reference) for non-Hispanic patients (P=0.007).
For hematologic malignancies, the adjusted OR was 1.68 for black patients (P=0.01) and 1.44 for patients of other, non-white races. The adjusted OR was 1.48 for Hispanic patients (P=0.009).
Dr Green said he hopes future studies will be able to determine the factors responsible for these disparities.
Higher death rates
Dr Green and his colleagues also found the rate of early death due to pediatric cancers is higher than reported in clinical trials, and this was true for all cancer subtypes assessed.
“Most of what we know about outcomes for cancer patients come from clinical trials, which have much more thorough reporting rules than cancer treated outside trials,” Dr Green said. “However, these kids in our study aren’t surviving long enough to join clinical trials.”
The researchers looked at a phase 3 trial (COG AAML0531) of pediatric patients with acute myeloid leukemia (AML) who were studied from August 2006 to June 2010. The early death rate in this trial was 1.6% (16/1022).
In contrast, the SEER database showed an early death rate for pediatric AML patients of 5.9% (15/256) during the same period as the trial and 6.2% (106/1698) for the period from 1992 to 2011. This is almost 4 times as high as the death rate in the trial.
The same effect was observed for acute lymphoblastic leukemia (ALL).
The early death rate for non-infant ALL was 0.7% (13/1790) in a trial (POG 9900) conducted from April 2000 to April 2005, 1.6% (30/1823) in the SEER data covering the same time period, and 1.3% (94/7353) in the SEER data from 1992 to 2011.
For infant ALL, the rates were 2.0% (3/149) in a trial (COG AALL0631) conducted from January 2008 to June 2014, 5.0% (2/40) in the SEER data during the trial period, and 5.4% (12/223) in the SEER data from 1992 to 2011.
“I had a hunch this was a bigger problem than we thought,” Dr Green said. “Now we see that is indeed the case.”
Does Patient History Affect the Treatment of Pediatric Refractory Status Epilepticus?
Children with refractory status epilepticus do not receive more timely treatment if they have a prior diagnosis of epilepsy, according to an investigation published January 24 in Neurology. A history of status epilepticus, however, is associated with more timely administration of abortive medication.
Most episodes of pediatric status epilepticus occur in children with no history of seizures. Investigators had not examined whether having a history of seizures or status epilepticus leads to more timely treatment, including escalation of therapy when indicated, and better outcomes.
Iván Sánchez Fernández, MD, Clinical Fellow in Neurology at Boston Children’s Hospital, and colleagues conducted a prospective observational study to compare the management and outcomes of refractory status epilepticus in children with and without a prior diagnosis of epilepsy and with and without a history of status epilepticus. Eligible patients were between ages one month and 21 years and had convulsive seizures at onset that continued after administration of at least two antiepileptic drugs (AEDs).
The investigators enrolled 189 participants (53% male) with a median age of 4.2 years. Eighty-nine (47%) patients had a prior diagnosis of epilepsy. Thirty-four (18%) patients had a history of status epilepticus.
The time to first benzodiazepine was similar in participants with and without a diagnosis of epilepsy (15 minutes vs 16.5 minutes). Patients with a diagnosis of epilepsy received their first nonbenzodiazepine AED later (93 minutes vs 50.5 minutes) and were less likely to receive at least one continuous infusion (39.3% vs 57%). The time to the first continuous infusion, however, was similar in patients with and without a diagnosis of epilepsy (258.5 vs 149 minutes)
Patients with a diagnosis of epilepsy were less likely to be intubated (66.3% vs 83%), had a longer duration of status epilepticus (174 minutes vs 120 minutes), and had a shorter ICU stay (3.9 days vs 5 days). At hospital discharge, patients with a diagnosis of epilepsy were more likely to return to baseline (75% vs 65%) and had lower mortality (0% vs 7%).
Time to the first benzodiazepine was shorter for patients with a history of status epilepticus, compared with patients without (8 minutes vs 20 minutes). The time to first nonbenzodiazepine AED was similar in patients with and without a history of status epilepticus (76.5 minutes vs 65 minutes). Patients with and without a history of status epilepticus were as likely to receive continuous infusions (52.9% vs 47.7%), had a similar time to the first continuous infusion (182 vs 180 minutes), and were as likely to be intubated (82.4% vs 73.5%). Patients with a history of status epilepticus had a longer duration of status epilepticus (150 minutes vs 124.5 minutes) and a shorter ICU stay (5 vs 4.3 days).
At hospital discharge, return to baseline function was similar between patients with and without a history of status epilepticus (76.5% vs 68.4%). The difference between groups in mortality rate was not statistically significant (0% vs 4.5%). The more timely administration of the first benzodiazepine in patients with a history of status epilepticus mainly resulted from cases with onset outside a hospital, while management of status epilepticus with in-hospital onset was similar in patients with and without a history of status epilepticus.
—Erik Greb
Suggested Reading
Sánchez Fernández I, Jackson MC, Abend NS, et al. Refractory status epilepticus in children with and without prior epilepsy or status epilepticus. Neurology. 2017;88(4):386-394.
Children with refractory status epilepticus do not receive more timely treatment if they have a prior diagnosis of epilepsy, according to an investigation published January 24 in Neurology. A history of status epilepticus, however, is associated with more timely administration of abortive medication.
Most episodes of pediatric status epilepticus occur in children with no history of seizures. Investigators had not examined whether having a history of seizures or status epilepticus leads to more timely treatment, including escalation of therapy when indicated, and better outcomes.
Iván Sánchez Fernández, MD, Clinical Fellow in Neurology at Boston Children’s Hospital, and colleagues conducted a prospective observational study to compare the management and outcomes of refractory status epilepticus in children with and without a prior diagnosis of epilepsy and with and without a history of status epilepticus. Eligible patients were between ages one month and 21 years and had convulsive seizures at onset that continued after administration of at least two antiepileptic drugs (AEDs).
The investigators enrolled 189 participants (53% male) with a median age of 4.2 years. Eighty-nine (47%) patients had a prior diagnosis of epilepsy. Thirty-four (18%) patients had a history of status epilepticus.
The time to first benzodiazepine was similar in participants with and without a diagnosis of epilepsy (15 minutes vs 16.5 minutes). Patients with a diagnosis of epilepsy received their first nonbenzodiazepine AED later (93 minutes vs 50.5 minutes) and were less likely to receive at least one continuous infusion (39.3% vs 57%). The time to the first continuous infusion, however, was similar in patients with and without a diagnosis of epilepsy (258.5 vs 149 minutes)
Patients with a diagnosis of epilepsy were less likely to be intubated (66.3% vs 83%), had a longer duration of status epilepticus (174 minutes vs 120 minutes), and had a shorter ICU stay (3.9 days vs 5 days). At hospital discharge, patients with a diagnosis of epilepsy were more likely to return to baseline (75% vs 65%) and had lower mortality (0% vs 7%).
Time to the first benzodiazepine was shorter for patients with a history of status epilepticus, compared with patients without (8 minutes vs 20 minutes). The time to first nonbenzodiazepine AED was similar in patients with and without a history of status epilepticus (76.5 minutes vs 65 minutes). Patients with and without a history of status epilepticus were as likely to receive continuous infusions (52.9% vs 47.7%), had a similar time to the first continuous infusion (182 vs 180 minutes), and were as likely to be intubated (82.4% vs 73.5%). Patients with a history of status epilepticus had a longer duration of status epilepticus (150 minutes vs 124.5 minutes) and a shorter ICU stay (5 vs 4.3 days).
At hospital discharge, return to baseline function was similar between patients with and without a history of status epilepticus (76.5% vs 68.4%). The difference between groups in mortality rate was not statistically significant (0% vs 4.5%). The more timely administration of the first benzodiazepine in patients with a history of status epilepticus mainly resulted from cases with onset outside a hospital, while management of status epilepticus with in-hospital onset was similar in patients with and without a history of status epilepticus.
—Erik Greb
Suggested Reading
Sánchez Fernández I, Jackson MC, Abend NS, et al. Refractory status epilepticus in children with and without prior epilepsy or status epilepticus. Neurology. 2017;88(4):386-394.
Children with refractory status epilepticus do not receive more timely treatment if they have a prior diagnosis of epilepsy, according to an investigation published January 24 in Neurology. A history of status epilepticus, however, is associated with more timely administration of abortive medication.
Most episodes of pediatric status epilepticus occur in children with no history of seizures. Investigators had not examined whether having a history of seizures or status epilepticus leads to more timely treatment, including escalation of therapy when indicated, and better outcomes.
Iván Sánchez Fernández, MD, Clinical Fellow in Neurology at Boston Children’s Hospital, and colleagues conducted a prospective observational study to compare the management and outcomes of refractory status epilepticus in children with and without a prior diagnosis of epilepsy and with and without a history of status epilepticus. Eligible patients were between ages one month and 21 years and had convulsive seizures at onset that continued after administration of at least two antiepileptic drugs (AEDs).
The investigators enrolled 189 participants (53% male) with a median age of 4.2 years. Eighty-nine (47%) patients had a prior diagnosis of epilepsy. Thirty-four (18%) patients had a history of status epilepticus.
The time to first benzodiazepine was similar in participants with and without a diagnosis of epilepsy (15 minutes vs 16.5 minutes). Patients with a diagnosis of epilepsy received their first nonbenzodiazepine AED later (93 minutes vs 50.5 minutes) and were less likely to receive at least one continuous infusion (39.3% vs 57%). The time to the first continuous infusion, however, was similar in patients with and without a diagnosis of epilepsy (258.5 vs 149 minutes)
Patients with a diagnosis of epilepsy were less likely to be intubated (66.3% vs 83%), had a longer duration of status epilepticus (174 minutes vs 120 minutes), and had a shorter ICU stay (3.9 days vs 5 days). At hospital discharge, patients with a diagnosis of epilepsy were more likely to return to baseline (75% vs 65%) and had lower mortality (0% vs 7%).
Time to the first benzodiazepine was shorter for patients with a history of status epilepticus, compared with patients without (8 minutes vs 20 minutes). The time to first nonbenzodiazepine AED was similar in patients with and without a history of status epilepticus (76.5 minutes vs 65 minutes). Patients with and without a history of status epilepticus were as likely to receive continuous infusions (52.9% vs 47.7%), had a similar time to the first continuous infusion (182 vs 180 minutes), and were as likely to be intubated (82.4% vs 73.5%). Patients with a history of status epilepticus had a longer duration of status epilepticus (150 minutes vs 124.5 minutes) and a shorter ICU stay (5 vs 4.3 days).
At hospital discharge, return to baseline function was similar between patients with and without a history of status epilepticus (76.5% vs 68.4%). The difference between groups in mortality rate was not statistically significant (0% vs 4.5%). The more timely administration of the first benzodiazepine in patients with a history of status epilepticus mainly resulted from cases with onset outside a hospital, while management of status epilepticus with in-hospital onset was similar in patients with and without a history of status epilepticus.
—Erik Greb
Suggested Reading
Sánchez Fernández I, Jackson MC, Abend NS, et al. Refractory status epilepticus in children with and without prior epilepsy or status epilepticus. Neurology. 2017;88(4):386-394.