User login
HIV Pre-exposure Prophylaxis (PrEP): A Survey of Dermatologists’ Knowledge and Practice Patterns
To the Editor:
In a 2010 landmark paper, researchers reported that the Preexposure Prophylaxis Initiative (iPrEx) trial demonstrated that once-daily pre-exposure prophylaxis (PrEP) with emtricitabine plus tenofovir disoproxil fumarate, which was approved by the US Food and Drug Administration (FDA) and packaged together as Truvada (Gilead Sciences, Inc), achieved a 44% reduction in the incidence of HIV infection compared to the placebo arm of the study (64/1248 HIV infections in the placebo group vs 36/1251 in the intervention group).1 Subsequently, the US Department of Health and Human Services proposed an initiative to reduce new HIV infections by 90% by 2030.2 The Centers for Disease Control and Prevention estimates that 1.1 million Americans have an indication for PrEP, yet only approximately 400,000 individuals currently take PrEP.3,4
Increasing awareness of PrEP and its indications is essential because PrEP exerts its greatest benefit when used broadly. Awareness among primary care and infectious disease physicians was reported at 76%5; awareness among other medical specialists remains unknown. Awareness of PrEP among dermatologists is important because dermatologists play an important role in the diagnosis and treatment of many sexually transmitted infections (STIs), which are a risk factor for transmission of HIV. As providers who treat STIs, dermatologists are in a prime position to educate patients about PrEP, refer them for treatment, and prescribe the regimen. We conducted a survey to assess dermatologists’ knowledge about and attitudes toward PrEP. We also provide a brief summary of prescribing information about common PrEP regimens to fill in the knowledge gap among dermatologists as a way to promote its utilization.
An electronic survey was distributed to 486 members of the Association of Professors of Dermatology based in the United States using the web-based survey application REDCap. The study was approved by the New York University Grossman School of Medicine (New York, New York) institutional review board. Eighty-one anonymous survey responses were completed and returned (response rate, 16.6%). Data were analyzed using descriptive statistics.
The mean age (SD) of respondents was 39.1 (9.7) years; 49.4% (40/81) were male; and 74.1% (60/81) were attending physicians, with a mean (SD) of 9.4 (8.6) years of practice. Clinical practices were predominantly from the northeast (46.9% [38/81]) and mostly in an academic setting (74.1% [60/81]). As shown in Table 1, most surveyed dermatologists reported being aware of PrEP (93.8% [76/81]), but a minority (42.0% [34/81]) were familiar with indications for its use; even fewer (4.9% [4/81]) were current prescribers. Referral to other physicians for PrEP was reported by 58.0% (47/81) of respondents.
")
Despite respondents’ awareness of PrEP as a preventive measure (93.8% [76/81]) and their willingness to prescribe it (67.9% [55/81]), many reported being largely unfamiliar with its indications (58.0% [47/81]) and uncomfortable discussing its adverse effects (72.8% [59/81]), conducting appropriate laboratory monitoring (84.0% [68/81]), and refilling existing prescriptions (77.8% [63/81]). Respondents’ lack of education about PrEP was a barrier to prescribing (51.9% [42/81] to 59.3% [48/81]) and explains why a small minority (4.9% [4/81]) currently prescribe the regimen.
Our study sought to characterize current clinical knowledge about and practice patterns of PrEP among dermatologists. Dermatologists often encounter patients who present with an STI, which is a risk factor for HIV infection, but our survey respondents reported several barriers to utilizing PrEP. The difference in the degree of respondents’ willingness to prescribe PrEP (67.9%) and those who self-identified as prescribers (4.9%) suggests a role for dermatologists in prescribing or discussing PrEP with their patients—albeit a currently undefined role.
The results of our study suggested that half (41/81) of dermatologists believe that PrEP prescription is out of their scope of practice, likely due to a combination of scheduling, laboratory monitoring, and medicolegal concerns. For dermatologists who are interested in being PrEP prescribers, our results suggested that closing the knowledge gap around PrEP among dermatologists through training and education could improve comfort with this medication and lead to changes in practice to prevent the spread of HIV infection.
PrEP is indicated for HIV-negative patients who have HIV-positive sexual partners, utilize barrier protection methods inconsistently, or had a diagnosis of an STI in the last 6 months.6 In 2012, the FDA approved once-daily use of emtricitabine plus tenofovir for primary prevention of HIV infection. Post hoc analysis of iPrEx trial data revealed that once-daily PrEP taken regularly had a 92% to 100% protective effect against HIV.7
Regrettably, real-world uptake of PrEP has been slower than desired. The most recent data (2021) show that nearly 1 million individuals worldwide take PrEP; however, this represents only approximately one-third of those eligible.8 Utilization is notably lower among Black and Latino populations who stand to gain the most from PrEP given their higher risk of contracting HIV compared to their White counterparts.9 As such, improving access to PrEP through expanded provider awareness is essential to decrease the risk for HIV infection and transmission.
Emtricitabine plus tenofovir is safe and well tolerated; more common adverse effects are headache, nausea, vomiting, rash, and loss of appetite. Tenofovir likely decreases bone mineral density, even in HIV-negative patients10; mineralization seems to recover after the medication is discontinued.11 Rarely, tenofovir can increase the level of creatinine and hepatic transaminases; a recent report on its long-term side effects has shown small nonprogressive decreases in glomerular filtration rate.12 Monitoring kidney function is a component of prescribing PrEP (Table 2).

In 2019, emtricitabine plus tenofovir was reformulated with tenofovir alafenamide; the new combination regimen received FDA approval for once-daily PrEP under the brand name Descovy (Gilead Sciences, Inc). The new formulation results in a lower blood concentration of tenofovir and has been reported to present less of a risk for bone and kidney toxicity.13,14
Notably, emtricitabine plus tenofovir alafenamide might accumulate faster in peripheral lymphatic tissue than emtricitabine plus tenofovir disoproxil fumarate. This property has led to a new regimen known as “on-demand PrEP,” which follows a 2-1-1 dosing regimen: Patients take a double dose 2 to 24 hours before sexual activity, 1 dose on the day of sexual activity, and 1 dose the day after sexual activity.15 Because some patients at risk for HIV infection might not be consistently sexually active, on-demand PrEP allows them to cycle on and off the medication. Barriers to implementing on-demand PrEP include requiring that sexual activity be planned and an adverse effect profile similar to daily-use PrEP.16
The FDA recently approved a long-acting, once-monthly combination injectable PrEP of cabotegravir and rilpivirine.17 The long duration of action of this PrEP will benefit patients who report problems with medication adherence.
Our study demonstrates low frequency in prescribing patterns of PrEP among dermatologists and suggests that an addressable barrier to such prescribing is the lack of knowledge on how to prescribe it safely, which warrants further clinical investigation. We summarize an approach to prescribing PrEP in Table 2. Our study was limited by a small sample of mostly academic dermatologists and selection bias, which may diminish the generalizability of findings. A study of a larger, more representative group of dermatologists likely would show different prescribing patterns and degrees of knowledge about PrEP. Research is needed to study the impact of educational interventions that aim to increase both knowledge and prescribing of PrEP among dermatologists.
- Grant RM, Lama JR, Anderson PL, et al; iPrEx Study Team. Preexposure chemoprophylaxis for HIV prevention in men who have sex with men. N Engl J Med. 2010;363:2587-2599. doi:10.1056/NEJMoa1011205
- Fauci AS, Redfield RR, Sigounas G, et al. Ending the HIV epidemic: a plan for the United States. JAMA. 2019;321:844-845. doi:10.1001/jama.2019.1343
- Smith DK, Van Handel M, Grey J. Estimates of adults with indications for HIV pre-exposure prophylaxis by jurisdiction, transmission risk group, and race/ethnicity, United States, 2015. Ann Epidemiol. 2018;28:850-857.e9. doi:10.1016/j.annepidem.2018.05.003
- Song HJ, Squires P, Wilson D, et al. Trends in HIV preexposure prophylaxis prescribing in the United States, 2012-2018. JAMA. 2020;324:395-397. doi:10.1001/jama.2020.7312
- Petroll AE, Walsh JL, Owczarzak JL, et al. PrEP awareness, familiarity, comfort, and prescribing experience among US primary care providers and HIV specialists. AIDS Behav. 2017;21:1256-1267. doi:10.1007/s10461-016-1625-1
- US Public Health Service. Preexposure prophylaxis for the prevention of HIV infection in the United States—2021 update. a clinical practice guideline. Centers for Disease Control and Prevention. Accessed September 15, 2022. https://www.cdc.gov/hiv/pdf/risk/prep/cdc-hiv-prep-guidelines-2021.pdf
- Riddell J 4th, Amico KR, Mayer KH. HIV preexposure prophylaxis: a review. JAMA. 2018;319:1261-1268. doi:10.1001/JAMA.2018.1917
- Segal K, Fitch L, Riaz F, et al. The evolution of oral PrEP access: tracking trends in global oral PrEP use over time. J Int AIDS Soc. 2021;24:27-28.
- Elion RA, Kabiri M, Mayer KH, et al. Estimated impact of targeted pre-exposure prophylaxis: strategies for men who have sex with men in the United States. Int J Environ Res Public Health. 2019;16:1592. doi:10.3390/ijerph16091592
- Kasonde M, Niska RW, Rose C, et al. Bone mineral density changes among HIV-uninfected young adults in a randomised trial of pre-exposure prophylaxis with tenofovir-emtricitabine or placebo in Botswana. PLoS One. 2014;9:e90111. doi:10.1371/journal.pone.0090111
- Glidden DV, Mulligan K, McMahan V, et al. Brief report: recovery of bone mineral density after discontinuation of tenofovir-based HIV pre-exposure prophylaxis. J Acquir Immune Defic Syndr. 2017;76:177-182. doi:10.1097/QAI.0000000000001475
- Tang EC, Vittinghoff E, Anderson PL, et al. Changes in kidney function associated with daily tenofovir disoproxil fumarate/emtricitabine for HIV preexposure prophylaxis use in the United States Demonstration Project. J Acquir Immune Defic Syndr. 2018;77:193-198. doi:10.1097/QAI.0000000000001566
- Gupta SK, Post FA, Arribas JR, et al. Renal safety of tenofovir alafenamide vs. tenofovir disoproxil fumarate: a pooled analysis of 26 clinical trials. AIDS. 2019;33:1455-1465. doi:10.1097/QAD.0000000000002223
- Agarwal K, Brunetto M, Seto WK, et al; GS-US-320-0110; GS-US-320-0108 Investigators. 96 weeks treatment of tenofovir alafenamide vs. tenofovir disoproxil fumarate for hepatitis B virus infection [published online January 17, 2018]. J Hepatol. 2018;68:672-681. doi:10.1016/j.jhep.2017.11.039
- Molina JM, Capitant C, Spire B, et al; ANRS IPERGAY Study Group. On-demand preexposure prophylaxis in men at high risk for HIV-1 infection [published online December 1, 2015]. N Engl J Med. 2015;3;2237-2246. doi:10.1056/NEJMoa1506273
- Saberi P, Scott HM. On-demand oral pre-exposure prophylaxis with tenofovir/emtricitabine: what every clinician needs to know. J Gen Intern Med. 2020;35:1285-1288. doi:10.1007/s11606-020-05651-2
- Landovitz RJ, Li S, Grinsztejn B, et al. Safety, tolerability, and pharmacokinetics of long-acting injectable cabotegravir in low-risk HIV-uninfected individuals: HPTN 077, a phase 2a randomized controlled trial. PLoS Med. 2018;15:e1002690. doi:10.1371/journal.pmed.1002690
To the Editor:
In a 2010 landmark paper, researchers reported that the Preexposure Prophylaxis Initiative (iPrEx) trial demonstrated that once-daily pre-exposure prophylaxis (PrEP) with emtricitabine plus tenofovir disoproxil fumarate, which was approved by the US Food and Drug Administration (FDA) and packaged together as Truvada (Gilead Sciences, Inc), achieved a 44% reduction in the incidence of HIV infection compared to the placebo arm of the study (64/1248 HIV infections in the placebo group vs 36/1251 in the intervention group).1 Subsequently, the US Department of Health and Human Services proposed an initiative to reduce new HIV infections by 90% by 2030.2 The Centers for Disease Control and Prevention estimates that 1.1 million Americans have an indication for PrEP, yet only approximately 400,000 individuals currently take PrEP.3,4
Increasing awareness of PrEP and its indications is essential because PrEP exerts its greatest benefit when used broadly. Awareness among primary care and infectious disease physicians was reported at 76%5; awareness among other medical specialists remains unknown. Awareness of PrEP among dermatologists is important because dermatologists play an important role in the diagnosis and treatment of many sexually transmitted infections (STIs), which are a risk factor for transmission of HIV. As providers who treat STIs, dermatologists are in a prime position to educate patients about PrEP, refer them for treatment, and prescribe the regimen. We conducted a survey to assess dermatologists’ knowledge about and attitudes toward PrEP. We also provide a brief summary of prescribing information about common PrEP regimens to fill in the knowledge gap among dermatologists as a way to promote its utilization.
An electronic survey was distributed to 486 members of the Association of Professors of Dermatology based in the United States using the web-based survey application REDCap. The study was approved by the New York University Grossman School of Medicine (New York, New York) institutional review board. Eighty-one anonymous survey responses were completed and returned (response rate, 16.6%). Data were analyzed using descriptive statistics.
The mean age (SD) of respondents was 39.1 (9.7) years; 49.4% (40/81) were male; and 74.1% (60/81) were attending physicians, with a mean (SD) of 9.4 (8.6) years of practice. Clinical practices were predominantly from the northeast (46.9% [38/81]) and mostly in an academic setting (74.1% [60/81]). As shown in Table 1, most surveyed dermatologists reported being aware of PrEP (93.8% [76/81]), but a minority (42.0% [34/81]) were familiar with indications for its use; even fewer (4.9% [4/81]) were current prescribers. Referral to other physicians for PrEP was reported by 58.0% (47/81) of respondents.
Despite respondents’ awareness of PrEP as a preventive measure (93.8% [76/81]) and their willingness to prescribe it (67.9% [55/81]), many reported being largely unfamiliar with its indications (58.0% [47/81]) and uncomfortable discussing its adverse effects (72.8% [59/81]), conducting appropriate laboratory monitoring (84.0% [68/81]), and refilling existing prescriptions (77.8% [63/81]). Respondents’ lack of education about PrEP was a barrier to prescribing (51.9% [42/81] to 59.3% [48/81]) and explains why a small minority (4.9% [4/81]) currently prescribe the regimen.
Our study sought to characterize current clinical knowledge about and practice patterns of PrEP among dermatologists. Dermatologists often encounter patients who present with an STI, which is a risk factor for HIV infection, but our survey respondents reported several barriers to utilizing PrEP. The difference in the degree of respondents’ willingness to prescribe PrEP (67.9%) and those who self-identified as prescribers (4.9%) suggests a role for dermatologists in prescribing or discussing PrEP with their patients—albeit a currently undefined role.
The results of our study suggested that half (41/81) of dermatologists believe that PrEP prescription is out of their scope of practice, likely due to a combination of scheduling, laboratory monitoring, and medicolegal concerns. For dermatologists who are interested in being PrEP prescribers, our results suggested that closing the knowledge gap around PrEP among dermatologists through training and education could improve comfort with this medication and lead to changes in practice to prevent the spread of HIV infection.
PrEP is indicated for HIV-negative patients who have HIV-positive sexual partners, utilize barrier protection methods inconsistently, or had a diagnosis of an STI in the last 6 months.6 In 2012, the FDA approved once-daily use of emtricitabine plus tenofovir for primary prevention of HIV infection. Post hoc analysis of iPrEx trial data revealed that once-daily PrEP taken regularly had a 92% to 100% protective effect against HIV.7
Regrettably, real-world uptake of PrEP has been slower than desired. The most recent data (2021) show that nearly 1 million individuals worldwide take PrEP; however, this represents only approximately one-third of those eligible.8 Utilization is notably lower among Black and Latino populations who stand to gain the most from PrEP given their higher risk of contracting HIV compared to their White counterparts.9 As such, improving access to PrEP through expanded provider awareness is essential to decrease the risk for HIV infection and transmission.
Emtricitabine plus tenofovir is safe and well tolerated; more common adverse effects are headache, nausea, vomiting, rash, and loss of appetite. Tenofovir likely decreases bone mineral density, even in HIV-negative patients10; mineralization seems to recover after the medication is discontinued.11 Rarely, tenofovir can increase the level of creatinine and hepatic transaminases; a recent report on its long-term side effects has shown small nonprogressive decreases in glomerular filtration rate.12 Monitoring kidney function is a component of prescribing PrEP (Table 2).
In 2019, emtricitabine plus tenofovir was reformulated with tenofovir alafenamide; the new combination regimen received FDA approval for once-daily PrEP under the brand name Descovy (Gilead Sciences, Inc). The new formulation results in a lower blood concentration of tenofovir and has been reported to present less of a risk for bone and kidney toxicity.13,14
Notably, emtricitabine plus tenofovir alafenamide might accumulate faster in peripheral lymphatic tissue than emtricitabine plus tenofovir disoproxil fumarate. This property has led to a new regimen known as “on-demand PrEP,” which follows a 2-1-1 dosing regimen: Patients take a double dose 2 to 24 hours before sexual activity, 1 dose on the day of sexual activity, and 1 dose the day after sexual activity.15 Because some patients at risk for HIV infection might not be consistently sexually active, on-demand PrEP allows them to cycle on and off the medication. Barriers to implementing on-demand PrEP include requiring that sexual activity be planned and an adverse effect profile similar to daily-use PrEP.16
The FDA recently approved a long-acting, once-monthly combination injectable PrEP of cabotegravir and rilpivirine.17 The long duration of action of this PrEP will benefit patients who report problems with medication adherence.
Our study demonstrates low frequency in prescribing patterns of PrEP among dermatologists and suggests that an addressable barrier to such prescribing is the lack of knowledge on how to prescribe it safely, which warrants further clinical investigation. We summarize an approach to prescribing PrEP in Table 2. Our study was limited by a small sample of mostly academic dermatologists and selection bias, which may diminish the generalizability of findings. A study of a larger, more representative group of dermatologists likely would show different prescribing patterns and degrees of knowledge about PrEP. Research is needed to study the impact of educational interventions that aim to increase both knowledge and prescribing of PrEP among dermatologists.
- Grant RM, Lama JR, Anderson PL, et al; iPrEx Study Team. Preexposure chemoprophylaxis for HIV prevention in men who have sex with men. N Engl J Med. 2010;363:2587-2599. doi:10.1056/NEJMoa1011205
- Fauci AS, Redfield RR, Sigounas G, et al. Ending the HIV epidemic: a plan for the United States. JAMA. 2019;321:844-845. doi:10.1001/jama.2019.1343
- Smith DK, Van Handel M, Grey J. Estimates of adults with indications for HIV pre-exposure prophylaxis by jurisdiction, transmission risk group, and race/ethnicity, United States, 2015. Ann Epidemiol. 2018;28:850-857.e9. doi:10.1016/j.annepidem.2018.05.003
- Song HJ, Squires P, Wilson D, et al. Trends in HIV preexposure prophylaxis prescribing in the United States, 2012-2018. JAMA. 2020;324:395-397. doi:10.1001/jama.2020.7312
- Petroll AE, Walsh JL, Owczarzak JL, et al. PrEP awareness, familiarity, comfort, and prescribing experience among US primary care providers and HIV specialists. AIDS Behav. 2017;21:1256-1267. doi:10.1007/s10461-016-1625-1
- US Public Health Service. Preexposure prophylaxis for the prevention of HIV infection in the United States—2021 update. a clinical practice guideline. Centers for Disease Control and Prevention. Accessed September 15, 2022. https://www.cdc.gov/hiv/pdf/risk/prep/cdc-hiv-prep-guidelines-2021.pdf
- Riddell J 4th, Amico KR, Mayer KH. HIV preexposure prophylaxis: a review. JAMA. 2018;319:1261-1268. doi:10.1001/JAMA.2018.1917
- Segal K, Fitch L, Riaz F, et al. The evolution of oral PrEP access: tracking trends in global oral PrEP use over time. J Int AIDS Soc. 2021;24:27-28.
- Elion RA, Kabiri M, Mayer KH, et al. Estimated impact of targeted pre-exposure prophylaxis: strategies for men who have sex with men in the United States. Int J Environ Res Public Health. 2019;16:1592. doi:10.3390/ijerph16091592
- Kasonde M, Niska RW, Rose C, et al. Bone mineral density changes among HIV-uninfected young adults in a randomised trial of pre-exposure prophylaxis with tenofovir-emtricitabine or placebo in Botswana. PLoS One. 2014;9:e90111. doi:10.1371/journal.pone.0090111
- Glidden DV, Mulligan K, McMahan V, et al. Brief report: recovery of bone mineral density after discontinuation of tenofovir-based HIV pre-exposure prophylaxis. J Acquir Immune Defic Syndr. 2017;76:177-182. doi:10.1097/QAI.0000000000001475
- Tang EC, Vittinghoff E, Anderson PL, et al. Changes in kidney function associated with daily tenofovir disoproxil fumarate/emtricitabine for HIV preexposure prophylaxis use in the United States Demonstration Project. J Acquir Immune Defic Syndr. 2018;77:193-198. doi:10.1097/QAI.0000000000001566
- Gupta SK, Post FA, Arribas JR, et al. Renal safety of tenofovir alafenamide vs. tenofovir disoproxil fumarate: a pooled analysis of 26 clinical trials. AIDS. 2019;33:1455-1465. doi:10.1097/QAD.0000000000002223
- Agarwal K, Brunetto M, Seto WK, et al; GS-US-320-0110; GS-US-320-0108 Investigators. 96 weeks treatment of tenofovir alafenamide vs. tenofovir disoproxil fumarate for hepatitis B virus infection [published online January 17, 2018]. J Hepatol. 2018;68:672-681. doi:10.1016/j.jhep.2017.11.039
- Molina JM, Capitant C, Spire B, et al; ANRS IPERGAY Study Group. On-demand preexposure prophylaxis in men at high risk for HIV-1 infection [published online December 1, 2015]. N Engl J Med. 2015;3;2237-2246. doi:10.1056/NEJMoa1506273
- Saberi P, Scott HM. On-demand oral pre-exposure prophylaxis with tenofovir/emtricitabine: what every clinician needs to know. J Gen Intern Med. 2020;35:1285-1288. doi:10.1007/s11606-020-05651-2
- Landovitz RJ, Li S, Grinsztejn B, et al. Safety, tolerability, and pharmacokinetics of long-acting injectable cabotegravir in low-risk HIV-uninfected individuals: HPTN 077, a phase 2a randomized controlled trial. PLoS Med. 2018;15:e1002690. doi:10.1371/journal.pmed.1002690
Practice Points
- Sexually transmitted infections (STIs) often have skin manifestations, with patients presenting to dermatologists.
- Pre-exposure prophylaxis (PrEP) uses antiretrovirals taken prophylactically to prevent transmission of and infection with HIV. Dermatologists are aware of PrEP, but several barriers prevent them from being prescribers.
- Patients with a history of an STI should be considered for PrEP.
Children and COVID: September slowdown continues
New COVID-19 cases and hospital admissions in children continue to decline, while the slow pace of vaccinations has not deterred manufacturers from seeking new emergency authorizations.
Since reaching a post-Omicron peak of 112,000 in late May, the number of weekly cases has fluctuated, with no stretch of increases or decreases lasting more than 4 weeks or the weekly count rising above 97,000 or falling lower than the current 55,000, according to state-level data collected by the American Academy of Pediatrics and the Children’s Hospital Association.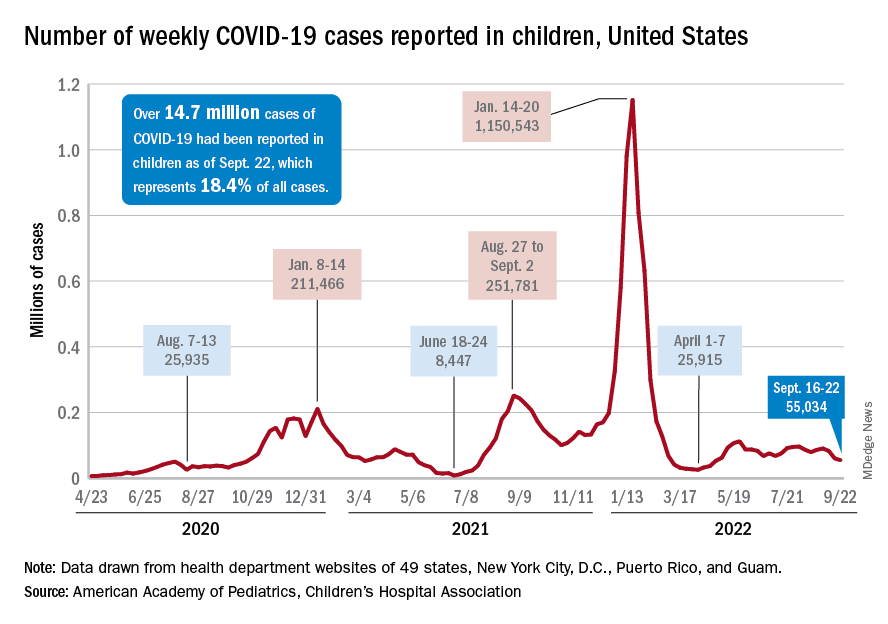
New admissions with confirmed COVID for children aged 0-17 years, which did not follow that pattern and instead continued to rise through the spring and early summer, have been largely decreasing in recent weeks and had fallen to 0.27 per 100,000 population as of Sept. 21 after peaking at 0.46 per 100,000 in late July, the Centers for Disease Control and Prevention reported. A similar decline has been seen for emergency department visits since late August.
The biggest vaccination news of the week came from Moderna and Pfizer and BioNTech, which are each seeking emergency authorization from the Food and Drug Administration for bivalent vaccine boosters that target both the original COVID strain and the BA.4 and BA.5 strains of Omicron.
“Pfizer’s booster would be for children 5 to 11 who have completed a primary vaccination series [and] Moderna’s updated boosters would be for children ages 6 to 17 who have completed a primary vaccination series,” WebMD said.
Although almost 61% of children aged 12-17 years are already fully vaccinated, that is not the case among those aged 5-11, of whom only 31.4% have completed the initial vaccine regimen. Since becoming eligible in June, just 1.9% of children under 5 years of age have been fully vaccinated and 6.3% have received at least one dose, the CDC said on its COVID Data Tracker. The latest data put the already boosted child populations at 28.8% for 12- to 17-year-olds and 14.8% in those aged 5-11.
About 51,000 children under age 5 years received their initial COVID vaccination during the week of Sept. 15-21, and the trend for that measure is one of gradual decline since July. Among the older children that same week, there were 28,000 initial vaccinations in the 5- to 11-year-olds and 18,000 for those aged 12-17, and activity in both age groups has largely stagnated since the spring, according to a separate AAP report based on CDC data.
Meet the JCOM Author with Dr. Barkoudah: Diabetes Population Health Innovations

Corticosteroids found to curb progression in community-acquired pneumonia
Adults hospitalized with community-acquired pneumonia were less likely to need mechanical ventilation after treatment with corticosteroids, but mortality was unaffected, based on data from a meta-analysis of nearly 4,000 patients.
Community-acquired pneumonia (CAP) remains a leading cause of morbidity and mortality in adults, but no routinely used strategies are associated with improvements in mortality, disease severity, or length of hospital stay, wrote Naveed Saleem, MSc, of University College, London, and colleagues.
Corticosteroids are recommended for various infectious diseases including bacterial meningitis, septic shock, and tuberculosis, as well as for COVID-19 pneumonia, because of their ability to reduce systemic inflammation, but have not been well studied in CAP, they noted.
In a study published in Chest, the researchers identified 16 randomized, controlled trials that compared the use of corticosteroids to standard care in CAP management. Of these, 9 were sponsored by pharmaceutical companies, 4 were open-label, and 11 were double-blind. The primary outcome was all-cause mortality; secondary outcomes were ICU admission, mechanical ventilation, treatment failure, readmission, and adverse events.
Although corticosteroids had no significant impact on the primary outcome of all-cause mortality, (relative risk 0.51, P = .001). The relative risk for the primary outcome of all-cause mortality was 0.85 (P = .17). Corticosteroids had no significant impact on the other secondary outcomes of ICU admission (RR 0.66), treatment failure (RR 0.78), and the incidence of adverse events (RR 1.10). However, data from five studies showed an increase in hospital admission rates for patients who received corticosteroids (RR 1.20, P = .008).
Overall, the risk of total adverse events was similar in patients who received corticosteroids vs. standard of care (55.8% vs. 48.5%). However, 27.2% of patients reported at least one adverse event related to corticosteroids. Incidence of most adverse events including gastrointestinal bleeding and secondary infections were similar between the groups, but patients who received corticosteroids had a significantly higher incidence of new-onset hyperglycemia compared to standard care patients (17.6% vs. 9.5%, P = .0001).
“Despite an increased risk of hyperglycemia associated with steroid use, we found no association between corticosteroid use and infectious complications,” the researchers wrote in their discussion. The optimal type, dose, and duration of corticosteroids for hospitalized CAP patients has yet to be determined, and the type of corticosteroid may affect outcomes, they added.
The study findings were limited by several factors, including the consideration of hospitalized patients only, not those in the community, and by the inability to adjust for differing diagnostic criteria, illness severity at baseline, or other therapeutic interventions, the researchers noted. Larger studies are needed to assess mortality benefit, and longer follow-up is needed to identify causes of readmission, they said. However, the results suggest that corticosteroids may be useful for preventing the need for mechanical ventilation in hospitalized patients with bacterial pneumonia, they concluded.
The study received no outside funding. The researchers had no financial conflicts to disclose.
FROM THE JOURNAL CHEST®
A switch to B/F/TAF keeps HIV suppressed, even with M184V/I mutation
People with suppressed HIV and the M184V/I viral mutation who switch medications to combined bictegravir, emtricitabine, and tenofovir alafenamide (B/F/TAF) appear to maintain viral suppression, reports an industry-sponsored analysis.
“M184V/I was detected in 10% of virologically suppressed clinical trial participants at study baseline. Switching to B/F/TAF demonstrated durable efficacy in maintaining viral suppression, including in those with preexisting M184V/I,” write senior study author Kirsten L. White, PhD, of Gilead Sciences, in Foster City, Calif., and colleagues in AIDS .
“Similarly high rates of virologic suppression were maintained in B/F/TAF-treated participants with or without preexisting M184V/I for at least 1 year with no emergent resistance,” they write.
Clinicians use the single-tablet B/F/TAF combination as an initial HIV therapy and as an approved replacement regimen when switching therapies in certain virologically suppressed people with HIV, the authors write.
Dr. White and her colleagues analyzed pooled data from 2,286 adult and 100 child participants in six randomized clinical trials investigating the safety and efficacy of switching to B/F/TAF in virologically suppressed (HIV-1 RNA < 50 copies/mL for 3 or 6 months) people with HIV. At screening, participants were on three-drug antiretroviral regimens.
Overall, 2,034 participants switched treatment regimens to B/F/TAF and had follow-up HIV-1 RNA data. Of these, 1,825 had baseline genotypic data, and preexisting M184V/I was detected in 182 (10%) of them.
All studies had postbaseline visits at weeks 4 and 12, and every 12 weeks thereafter, with B/F/TAF treatment lasting a median of 72 weeks. Plasma HIV-1 RNA levels were measured, and efficacy was assessed for all patients who switched to B/F/TAF.
The researchers assessed preexisting drug resistance by historical genotypes, baseline proviral DNA genotyping, or both, and they determined virologic outcomes by last available on-treatment HIV-1 RNA. They used stepwise selection in a multivariate logistic regression model to identify potential risk factors for M184V/I.
Virologic suppression well maintained
At the final on-treatment visit, 98% (179/182) of participants with preexisting M184V/I and 99% (2012/2034) of all B/F/TAF-treated participants had HIV-1 RNA less than 50 copies/mL, with no treatment-emergent resistance to B/F/TAF.
Factors linked with preexisting M184V/I in adults included being Black or Hispanic/Latinx, having baseline CD4+ cell count less than 500 cells/mL, advanced HIV disease, longer antiretroviral therapy, more prior third agents, and other resistance.
These results are important, Jana K. Dickter, MD, associate clinical professor in the division of infectious diseases at City of Hope in Duarte, Calif., told this news organization in an email.
added Dr. Dickter, who was not involved in the study. “This combination is recommended as an initial regimen by the U.S. Department of Health & Human Services.”
Easy to administer, well tolerated, and potent
Barbara Gripshover, MD, professor at Case Western Reserve University, Cleveland, and medical director of the special immunology unit of the Cleveland Medical Center, explained that “M184V/I is a common resistance mutation in patients who’ve had prior virologic failure on a lamivudine- or emtricitabine-containing regimen.”
“This study shows that, even in the presence of the M184V/I, switching virally suppressed persons to B/F/TAF provides continued durable virologic suppression,” Dr. Gripshover, who also was not involved in the study, said in an email.
Clinicians may comfortably switch patients to this regimen without fear of virologic failure, she added.
“Fixed-dose B/F/TAF, a potent, well-tolerated, single-tablet regimen, is a good switch option for persons on older regimens that contain either more pills, less tolerable agents, or ‘boosting’ agents that block cytochrome 3A4,” she noted. “Having a potent backbone agent is key.
“This is a good regimen due to its simplicity, tolerability, and potency,” Dr. Gripshover said, “and many patients exposed to older regimens may harbor archived M184V/I.
“The large number of subjects who had prior M184V/I and remained suppressed is convincing to me that B/F/TAF is durably effective in the presence of FTC resistance,” she concluded.
The study was supported by Gilead Sciences. Dr. White and 11 coauthors are employees and stock shareholders of Gilead, and three other coauthors report relevant financial relationships with Gilead and other pharmaceutical companies. One coauthor as well as Dr. Dickter and Dr. Gripshover report no relevant financial relationships.
A version of this article first appeared on Medscape.com.
Can we eliminate measles and rubella worldwide?
A study in The Lancet Global Health takes a pessimistic view of our ability to eradicate measles by 2100, although rubella forecasts look a bit more promising.
So far, measles has been eliminated in 81 countries and rubella in 93. But factors such as antivaccination sentiment and misinformation linking vaccination to autism have led to occasional outbreaks. In addition, because the COVID-19 pandemic fueled lower routine vaccination coverage and postponed public health campaigns, some countries have also lost previously gained ground.
The study, which is slated for publication in the Oct. 1 issue of the Lancet Global Health, explored the likelihood of eliminating measles and rubella, based on vaccination strategies in 93 countries with the highest measles and rubella burden, under two vaccination scenarios: 1) a “business as usual” approach, that is, continuing current vaccination coverage via routine childhood immunization schedules and intermittent vaccination campaigns that target age groups to vaccinate quickly (known as SIAs); and 2) an “intensified investment approach” that scales up SIA vaccination coverage into the future.
Both vaccination scenarios were evaluated within the context of two national models (Johns Hopkins University and Public Health England), and one subnational model (Nigeria) for rubella transmission.
Lead author Amy Winter, PhD, assistant professor of epidemiology and biostatistics, University of Georgia College of Public Health, Athens, told this news organization that “under the intensified investment scenario, rubella elimination is likely to be achieved in all 93 countries that were modeled [but] measles elimination is likely in some but not all countries.”
This is especially the case if the goal is cessation of vaccination campaigns, study authors noted when placing the research in context.
But Dr. Winter also emphasized that Nigeria offered specific lessons not seen in the national models.
For one,
In addition, she stressed a need to improve vaccine equity by focusing on areas with really low coverage and then moving into areas with higher coverage.
“The Nigerian subnational analysis definitely illustrates the importance of achieving equitable vaccination and the need for potentially targeted strategies to improve vaccination,” she said. “The initial focus should be on getting areas with low coverage up to par.”
Still, “even with the intensified investment approach, we won’t be able to eradicate measles,” William Moss, MD, professor of epidemiology and executive director, International Vaccine Access Center, Johns Hopkins University, Baltimore, who was not directly involved in the study, told this news organization.
Pandemic interruptions, future strategies
In a related editorial (The Lancet Global Health. 2022 Oct 1. doi: 10.1016/S2214-109X[22]00388-6), the authors noted that COVID-19 has markedly disrupted vaccination campaigns globally.
In 2017, 118 (61%) countries achieved the Global Vaccine Action Plan 2020 target of 90% or more national MCV1 (first dose of measles vaccine) coverage. Since that time, measles coverage has declined from 84%-85% in 2017 to 81% in 2021, leaving 24.7 million completely unprotected (also known as zero-dose children) and 14.7 million children underimmunized (that is, recipients of only 1 dose).
Notably, this is the lowest immunization level since 2008, with more than 5 million more children missing their first measles dose.
Dr. Moss has previously written on the biological feasibility of measles eradication and said that it’s not tenable to rely on increased vaccination coverage alone.
We need “new tools and the new strategies. One of the ones that we’re most excited about [is] microarray patches,” he said, noting that they are thermostable and can be administered by anyone.
Dr. Moss also said that, while he is hoping for point-of-care rapid diagnostics, the focus of the efforts needs to change.
“Where’s [the] measles virus coming from? Where’s it being exported from and where is it being imported to?” he posited, adding that the focus should be on these areas “to try to shut down transmission … a radical kind of second phase of a measles eradication puts aside equity and focuses on sources and sinks.”
In the interim, rubella elimination looks promising.
“It’s not as contagious [as measles] and has a lower sort of herd immunity threshold because of it,” Dr. Winter said.
Dr. Winter and Dr. Moss report no relevant financial relationships. The study was funded by the World Health Organization, Gavi, the Vaccine Alliance, the Centers for Disease Control and Prevention, and the Bill & Melinda Gates Foundation.
A version of this article first appeared on Medscape.com.
FROM THE LANCET GLOBAL HEALTH
Limiting antibiotic overprescription in pandemics: New guidelines
A statement by the Society for Healthcare Epidemiology of America, published online in Infection Control & Hospital Epidemiology, offers health care providers guidelines on how to prevent inappropriate antibiotic use in future pandemics and to avoid some of the negative scenarios that have been seen with COVID-19.
According to the U.S. Centers of Disease Control and Prevention,
The culprit might be the widespread antibiotic overprescription during the current pandemic. A 2022 meta-analysis revealed that in high-income countries, 58% of patients with COVID-19 were given antibiotics, whereas in lower- and middle-income countries, 89% of patients were put on such drugs. Some hospitals in Europe and the United States reported similarly elevated numbers, sometimes approaching 100%.
“We’ve lost control,” Natasha Pettit, PharmD, pharmacy director at University of Chicago Medicine, told this news organization. Dr. Pettit was not involved in the SHEA study. “Even if CDC didn’t come out with that data, I can tell you right now more of my time is spent trying to figure out how to manage these multi-drug–resistant infections, and we are running out of options for these patients,”
“Dealing with uncertainty, exhaustion, [and] critical illness in often young, otherwise healthy patients meant doctors wanted to do something for their patients,” said Tamar Barlam, MD, an infectious diseases expert at the Boston Medical Center who led the development of the SHEA white paper, in an interview.
That something often was a prescription for antibiotics, even without a clear indication that they were actually needed. A British study revealed that in times of pandemic uncertainty, clinicians often reached for antibiotics “just in case” and referred to conservative prescribing as “bravery.”
Studies have shown, however, that bacterial co-infections in COVID-19 are rare. A 2020 meta-analysis of 24 studies concluded that only 3.5% of patients had a bacterial co-infection on presentation, and 14.3% had a secondary infection. Similar patterns had previously been observed in other viral outbreaks. Research on MERS-CoV, for example, documented only 1% of patients with a bacterial co-infection on admission. During the 2009 H1N1 influenza pandemic, that number was 12% of non–ICU hospitalized patients.
Yet, according to Dr. Pettit, even when such data became available, it didn’t necessarily change prescribing patterns. “Information was coming at us so quickly, I think the providers didn’t have a moment to see the data, to understand what it meant for their prescribing. Having external guidance earlier on would have been hugely helpful,” she told this news organization.
That’s where the newly published SHEA statement comes in: It outlines recommendations on when to prescribe antibiotics during a respiratory viral pandemic, what tests to order, and when to de-escalate or discontinue the treatment. These recommendations include, for instance, advice to not trust inflammatory markers as reliable indicators of bacterial or fungal infection and to not use procalcitonin routinely to aid in the decision to initiate antibiotics.
According to Dr. Barlam, one of the crucial lessons here is that if clinicians see patients with symptoms that are consistent with the current pandemic, they should trust their own impressions and avoid reaching for antimicrobials “just in case.”
Another important lesson is that antibiotic stewardship programs have a huge role to play during pandemics. They should not only monitor prescribing but also compile new information on bacterial co-infections as it gets released and make sure it reaches the clinicians in a clear form.
Evidence suggests that such programs and guidelines do work to limit unnecessary antibiotic use. In one medical center in Chicago, for example, before recommendations on when to initiate and discontinue antimicrobials were released, over 74% of COVID-19 patients received antibiotics. After guidelines were put in place, the use of such drugs fell to 42%.
Dr. Pettit believes, however, that it’s important not to leave each medical center to its own devices. “Hindsight is always twenty-twenty,” she said, “but I think it would be great that, if we start hearing about a pathogen that might lead to another pandemic, we should have a mechanism in place to call together an expert body to get guidance for how antimicrobial stewardship programs should get involved.”
One of the authors of the SHEA statement, Susan Seo, reports an investigator-initiated Merck grant on cost-effectiveness of letermovir in hematopoietic stem cell transplant patients. Another author, Graeme Forrest, reports a clinical study grant from Regeneron for inpatient monoclonals against SARS-CoV-2. All other authors report no conflicts of interest. The study was independently supported.
A version of this article first appeared on Medscape.com.
FROM INFECTION CONTROL & HOSPITAL EPIDEMIOLOGY
Hep C, HIV coinfection tied to higher MI risk with age
, a new analysis suggests.
By contrast, the risk increases by 30% every 10 years among PWH without HCV infection.
“There is other evidence that suggests people with HIV and HCV have a greater burden of negative health outcomes,” senior author Keri N. Althoff, PhD, MPH, of the Johns Hopkins Bloomberg School of Public Health in Baltimore, said in an interview. “But the magnitude of ‘greater’ was bigger than I expected.”
“Understanding the difference HCV can make in the risk of MI with increasing age among those with – compared to without – HCV is an important step for understanding additional potential benefits of HCV treatment (among PWH),” she said.
The amplified risk with age occurred even though, overall, the association between HCV coinfection and increased risk of type 1 myocardial infarction (T1MI) was not significant, the analysis showed.
The study was published online in the Journal of the American Heart Association.
How age counts
Dr. Althoff and colleagues analyzed data from 23,361 PWH aged 40-79 who had initiated antiretroviral therapy between 2000 and 2017. The primary outcome was T1MI.
A total of 4,677 participants (20%) had HCV. Eighty-nine T1MIs occurred among PWH with HCV (1.9%) vs. 314 among PWH without HCV (1.7%). In adjusted analyses, HCV was not associated with increased T1MI risk (adjusted hazard ratio, 0.98).
However, the risk of T1MI increased with age and was augmented in those with HCV (aHR per 10-year increase in age, 1.85) vs. those without HCV (aHR, 1.30).
Specifically, compared with those without HCV, the estimated T1MI risk was 17% higher among 50- to 59-year-olds with HCV and 77% higher among those 60 and older; neither association was statistically significant, although the authors suggest this probably was because of the smaller number of participants in the older age categories.
Even without HCV, the risk of T1MI increased in participants who had traditional risk factors. The risk was significantly higher among PWH aged 40-49 with diabetes, hypertension, chronic kidney disease, protease inhibitor (PI) use, and smoking, whereas among PWH aged 50-59, the T1MI risk was significantly greater among those with hypertension, PI use, and smoking.
Among those aged 60 or older, hypertension and low CD4 counts were associated with a significantly increased T1MI risk.
“Clinicians providing health care to people with HIV should know their patients’ HCV status,” Dr. Althoff said, “and provide support regarding HCV treatment and ways to reduce their cardiovascular risk, including smoking cessation, reaching and maintaining a healthy BMI, and substance use treatment.”
Truly additive?
American Heart Association expert volunteer Nieca Goldberg, MD, a clinical associate professor of medicine at New York University and medical director of Atria NY, said the increased T1MI risk with coinfection “makes sense” because both HIV and HCV are linked to inflammation.
However, she said in an interview, “the fact that the authors didn’t control for other, more traditional heart attack risk factors is a limitation. I would like to see a study that takes other risk factors into consideration to see if HCV is truly additive.”
Meanwhile, like Dr. Althoff, she said, “Clinicians should be taking a careful history that includes chronic infections as well as traditional heart risk factors.”
Additional studies are needed, Dr. Althoff agreed. “There are two paths we are keenly interested in pursuing. The first is understanding how metabolic risk factors for MI change after HCV treatment. We are working on this.”
“Ultimately,” she said, “we want to compare MI risk in people with HIV who had successful HCV treatment to those who have not had successful HCV treatment.”
In their current study, they had nearly 2 decades of follow-up, she noted. “Although we don’t need to wait that long, we would like to have close to a decade of potential follow-up time (since 2016, when sofosbuvir/velpatasvir became available) so that we have a large enough sample size to observe a sufficient number of MIs within the first 5 years after successful HCV treatment.”
No commercial funding or relevant disclosures were reported.
A version of this article first appeared on Medscape.com.
FROM JOURNAL OF THE AMERICAN HEART ASSOCIATION
Early bird gets the worm, night owl gets the diabetes
Metabolism a player in circadian rhythm section
Are you an early bird, or do you wake up and stare at your phone, wondering why you were up watching “The Crown” until 3 a.m.? Recent research suggests that people who wake up earlier tend to be more active during the day and burn more fat than those who sleep in. Fat builds up in the night owls, putting them at higher risk of type 2 diabetes and heart disease.
The study gives physicians something to think about when assessing a patient’s risk factors. “This could help medical professionals consider another behavioral factor contributing to disease risk,” Steven Malin, PhD, lead author of the study and expert in metabolism at Rutgers University in New Brunswick, N.J., said in The Guardian.
For the research, 51 participants were divided into night owls and early birds, depending on their answers to a questionnaire. They were examined, monitored for a week, and assessed while doing various activities. Those who woke up early tended to be more sensitive to insulin and burned off fat faster than those who woke up late, the researchers explained.
“Night owls are reported to have a higher risk of obesity, type 2 diabetes, and cardiovascular disease when compared with early birds,” Dr. Malin said. “A potential explanation is they become misaligned with their circadian rhythm for various reasons, but most notably among adults would be work.”
We all know that we may not be at our best when we throw off our internal clocks by going to sleep late and waking up early. Think about that next time you start another episode on Netflix at 2:57 a.m.
Mosquitoes, chemical cocktails, and glass sock beads
We all know that mosquitoes are annoying little disease vectors with a taste for human blood. One of the less-known things about mosquitoes is what attracts them to humans in the first place. It’s so less known that, until now, it was unknown. Oh sure, we knew that odor was involved, and that lactic acid was part of the odor equation, but what are the specific chemicals? Well, there’s carbon dioxide … and ammonia. Those were already known.
Ring Cardé, PhD, an entomologist at the University of California, Riverside, wasn’t convinced. “I suspected there was something undiscovered about the chemistry of odors luring the yellow fever mosquito. I wanted to nail down the exact blend,” he said in a statement from the university.
Dr. Cardé and his associates eventually figured out that the exact chemical cocktail attracting female Aedes aegypti mosquitoes was a combination of carbon dioxide plus two chemicals, 2-ketoglutaric acid and lactic acid. The odor from these chemicals enables mosquitoes to locate and land on their victim and “also encourages probing, the use of piercing mouthparts to find blood,” the university said.
This amazing destination of science is important, but we have to acknowledge the journey as well. To do that we turn to one of Dr. Cardé’s associates, Jan Bello, PhD, formerly of Cal-Riverside and now with insect pest control company Provivi. Turns out that 2-ketoglutaric acid is tricky stuff because the methods typically used to identify chemicals don’t work on it.
Dr. Bello employed a somewhat unorthodox chemical extraction method: He filled his socks with glass beads and walked around with the beads in his socks. 
“Wearing the beads felt almost like a massage, like squeezing stress balls full of sand, but with your feet,” Dr. Bello said. “The most frustrating part of doing it for a long time is that they would get stuck in between your toes, so it would be uncomfortable after a while.”
We hate when science gets stuck between our toes, but we love it when scientists write their own punchlines.
The MS drugs are better down where it’s wetter, take it from me
The myth of the mermaid is one with hundreds, if not thousands, of years of history. The ancient Greeks had the mythological siren, while the Babylonians depicted kulullû (which were mermen – never let the Babylonians be known as noninclusive) in artwork as far back as 1600 BC. Cultures as far flung as Japan, southern Africa, and New Zealand have folkloric figures similar to the mermaid. It is most decidedly not a creation of western Europe, Hans Christian Andersen, or Disney.
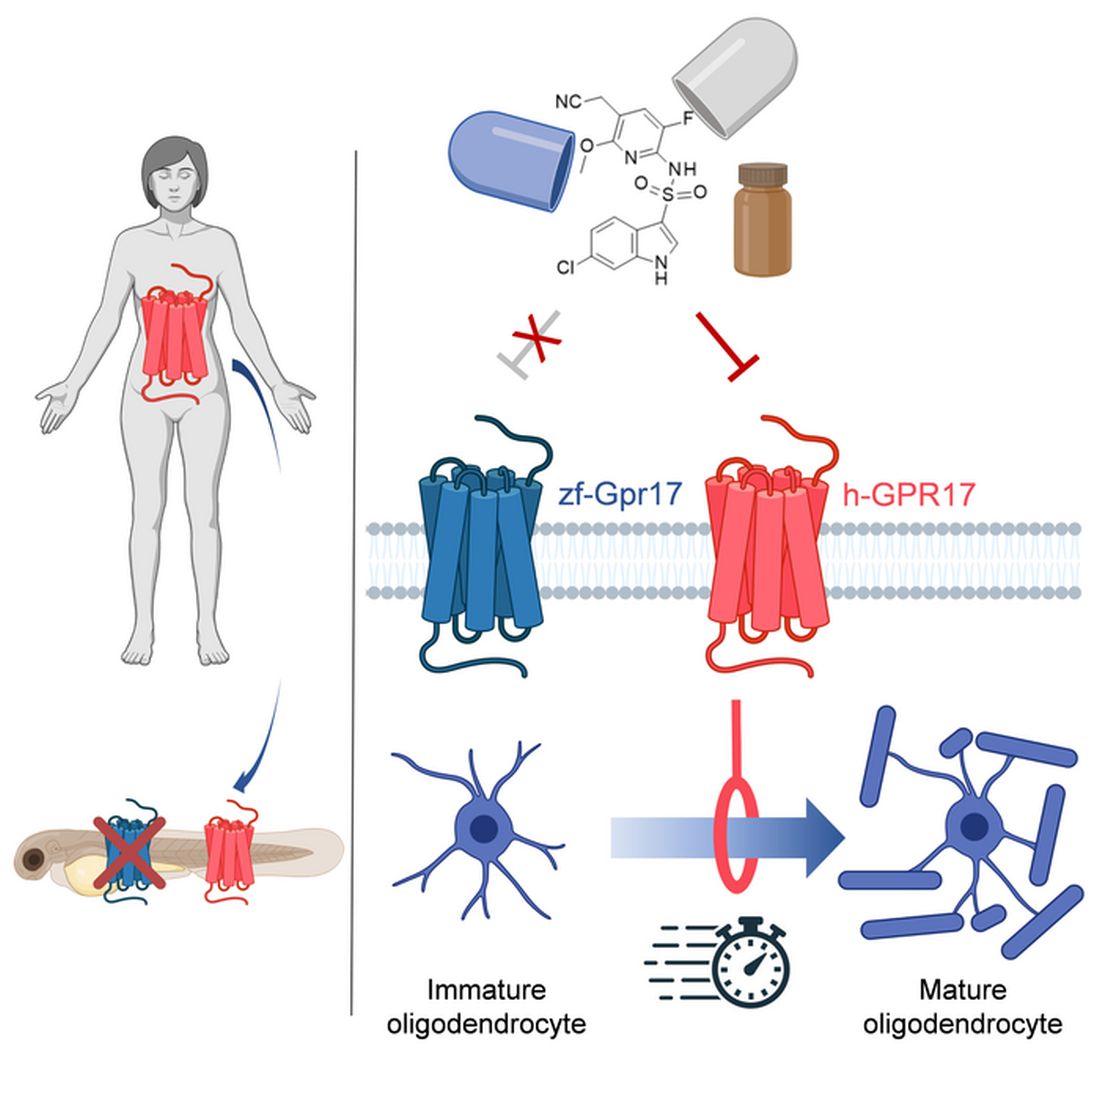
With that mild rant out of the way, let’s move to Germany and a group of researchers from the University of Bonn, who have not created a mermaid. They did, however, add human genes to a zebrafish for research purposes, which feels uncomfortably close. Nothing better than unholy animal-human hybrids, right?
Stick with us here, because the researchers did have a good reason for their gene splicing. Zebrafish and humans both have the GPR17 receptor, which is highly active in nerve tissue. When GPR17 is overactivated, diseases such as multiple sclerosis can develop. Because the zebrafish has this receptor, which performs the same function in its body as in ours, it’s a prime candidate for replacement. Also, zebrafish larvae are transparent, which makes it very easy to observe a drug working.
That said, fish and humans are very far apart, genetically speaking. Big shock right there. But by replacing their GPR17 receptor with ours, the scientists have created a fish that we could test drug candidates on and be assured that they would also work on humans. Actually testing drugs for MS on these humanized zebrafish was beyond the scope of the study, but the researchers said that the new genes function normally in the fish larvae, making them a promising new avenue for MS drug development.
Can we all promise not to tell Disney that human DNA can be spliced into a fish without consequence? Otherwise, we’re just going to have to sit through another “Little Mermaid” adaptation in 30 years, this one in super live-action featuring actual, real-life mermaids. And we’re not ready for that level of man-made horror just yet.
Beware of the fly vomit
Picture this: You’re outside at a picnic or barbecue, loading a plate with food. In a brief moment of conversation a fly lands right on top of your sandwich. You shoo it away and think nothing more of it, eating the sandwich anyway. We’ve all been there.
A recent study is making us think again.
John Stoffolano, an entomology professor at the University of Massachusetts, Amherst, claims that too much attention has been focused on pathogen transmission by the biting, blood-feeding flies when really we should be taking note of the nonbiting, or synanthropic, flies we live with, which may have a greater impact on the transmission of pathogens right in our own homes.

Sure, blood-feeding flies can spread pathogens directly, but house flies vomit every time they land on something. Think about that.
The fly that sneakily swooped into your house from a tear in your window screen has just been outside in the neighbor’s garbage or sitting on dog poop and now has who knows what filling its crop, the tank in their body that serves as “a place to store food before it makes its way into the digestive tract where it will get turned into energy for the fly,” Dr. Stoffolano explained in a written statement.
Did that fly land right on the baked potato you were prepping for dinner before you shooed it away? Guess what? Before flying off it emitted excess water that has pathogens from whatever was in its crop. We don’t want to say your potato might have dog poop on it, but you get the idea. The crop doesn’t have a ton of digestive enzymes that would help neutralize pathogens, so whatever that fly regurgitated before buzzing off is still around for you to ingest and there’s not much you can do about it.
More research needs to be done about flies, but at the very least this study should make you think twice before eating that baked potato after a fly has been there.
Metabolism a player in circadian rhythm section
Are you an early bird, or do you wake up and stare at your phone, wondering why you were up watching “The Crown” until 3 a.m.? Recent research suggests that people who wake up earlier tend to be more active during the day and burn more fat than those who sleep in. Fat builds up in the night owls, putting them at higher risk of type 2 diabetes and heart disease.
The study gives physicians something to think about when assessing a patient’s risk factors. “This could help medical professionals consider another behavioral factor contributing to disease risk,” Steven Malin, PhD, lead author of the study and expert in metabolism at Rutgers University in New Brunswick, N.J., said in The Guardian.
For the research, 51 participants were divided into night owls and early birds, depending on their answers to a questionnaire. They were examined, monitored for a week, and assessed while doing various activities. Those who woke up early tended to be more sensitive to insulin and burned off fat faster than those who woke up late, the researchers explained.
“Night owls are reported to have a higher risk of obesity, type 2 diabetes, and cardiovascular disease when compared with early birds,” Dr. Malin said. “A potential explanation is they become misaligned with their circadian rhythm for various reasons, but most notably among adults would be work.”
We all know that we may not be at our best when we throw off our internal clocks by going to sleep late and waking up early. Think about that next time you start another episode on Netflix at 2:57 a.m.
Mosquitoes, chemical cocktails, and glass sock beads
We all know that mosquitoes are annoying little disease vectors with a taste for human blood. One of the less-known things about mosquitoes is what attracts them to humans in the first place. It’s so less known that, until now, it was unknown. Oh sure, we knew that odor was involved, and that lactic acid was part of the odor equation, but what are the specific chemicals? Well, there’s carbon dioxide … and ammonia. Those were already known.
Ring Cardé, PhD, an entomologist at the University of California, Riverside, wasn’t convinced. “I suspected there was something undiscovered about the chemistry of odors luring the yellow fever mosquito. I wanted to nail down the exact blend,” he said in a statement from the university.
Dr. Cardé and his associates eventually figured out that the exact chemical cocktail attracting female Aedes aegypti mosquitoes was a combination of carbon dioxide plus two chemicals, 2-ketoglutaric acid and lactic acid. The odor from these chemicals enables mosquitoes to locate and land on their victim and “also encourages probing, the use of piercing mouthparts to find blood,” the university said.
This amazing destination of science is important, but we have to acknowledge the journey as well. To do that we turn to one of Dr. Cardé’s associates, Jan Bello, PhD, formerly of Cal-Riverside and now with insect pest control company Provivi. Turns out that 2-ketoglutaric acid is tricky stuff because the methods typically used to identify chemicals don’t work on it.
Dr. Bello employed a somewhat unorthodox chemical extraction method: He filled his socks with glass beads and walked around with the beads in his socks.
“Wearing the beads felt almost like a massage, like squeezing stress balls full of sand, but with your feet,” Dr. Bello said. “The most frustrating part of doing it for a long time is that they would get stuck in between your toes, so it would be uncomfortable after a while.”
We hate when science gets stuck between our toes, but we love it when scientists write their own punchlines.
The MS drugs are better down where it’s wetter, take it from me
The myth of the mermaid is one with hundreds, if not thousands, of years of history. The ancient Greeks had the mythological siren, while the Babylonians depicted kulullû (which were mermen – never let the Babylonians be known as noninclusive) in artwork as far back as 1600 BC. Cultures as far flung as Japan, southern Africa, and New Zealand have folkloric figures similar to the mermaid. It is most decidedly not a creation of western Europe, Hans Christian Andersen, or Disney.
With that mild rant out of the way, let’s move to Germany and a group of researchers from the University of Bonn, who have not created a mermaid. They did, however, add human genes to a zebrafish for research purposes, which feels uncomfortably close. Nothing better than unholy animal-human hybrids, right?
Stick with us here, because the researchers did have a good reason for their gene splicing. Zebrafish and humans both have the GPR17 receptor, which is highly active in nerve tissue. When GPR17 is overactivated, diseases such as multiple sclerosis can develop. Because the zebrafish has this receptor, which performs the same function in its body as in ours, it’s a prime candidate for replacement. Also, zebrafish larvae are transparent, which makes it very easy to observe a drug working.
That said, fish and humans are very far apart, genetically speaking. Big shock right there. But by replacing their GPR17 receptor with ours, the scientists have created a fish that we could test drug candidates on and be assured that they would also work on humans. Actually testing drugs for MS on these humanized zebrafish was beyond the scope of the study, but the researchers said that the new genes function normally in the fish larvae, making them a promising new avenue for MS drug development.
Can we all promise not to tell Disney that human DNA can be spliced into a fish without consequence? Otherwise, we’re just going to have to sit through another “Little Mermaid” adaptation in 30 years, this one in super live-action featuring actual, real-life mermaids. And we’re not ready for that level of man-made horror just yet.
Beware of the fly vomit
Picture this: You’re outside at a picnic or barbecue, loading a plate with food. In a brief moment of conversation a fly lands right on top of your sandwich. You shoo it away and think nothing more of it, eating the sandwich anyway. We’ve all been there.
A recent study is making us think again.
John Stoffolano, an entomology professor at the University of Massachusetts, Amherst, claims that too much attention has been focused on pathogen transmission by the biting, blood-feeding flies when really we should be taking note of the nonbiting, or synanthropic, flies we live with, which may have a greater impact on the transmission of pathogens right in our own homes.
Sure, blood-feeding flies can spread pathogens directly, but house flies vomit every time they land on something. Think about that.
The fly that sneakily swooped into your house from a tear in your window screen has just been outside in the neighbor’s garbage or sitting on dog poop and now has who knows what filling its crop, the tank in their body that serves as “a place to store food before it makes its way into the digestive tract where it will get turned into energy for the fly,” Dr. Stoffolano explained in a written statement.
Did that fly land right on the baked potato you were prepping for dinner before you shooed it away? Guess what? Before flying off it emitted excess water that has pathogens from whatever was in its crop. We don’t want to say your potato might have dog poop on it, but you get the idea. The crop doesn’t have a ton of digestive enzymes that would help neutralize pathogens, so whatever that fly regurgitated before buzzing off is still around for you to ingest and there’s not much you can do about it.
More research needs to be done about flies, but at the very least this study should make you think twice before eating that baked potato after a fly has been there.
Children and COVID: Weekly cases drop to lowest level since April
A hefty decline in new COVID-19 cases among children resulted in the lowest weekly total since late April, according to a report from the American Academy of Pediatrics and the Children’s Hospital Association.
, making for 2 consecutive weeks of declines after almost 91,000 cases were recorded for the week ending Sept. 1, the AAP and CHA said in their latest COVID report of state-level data.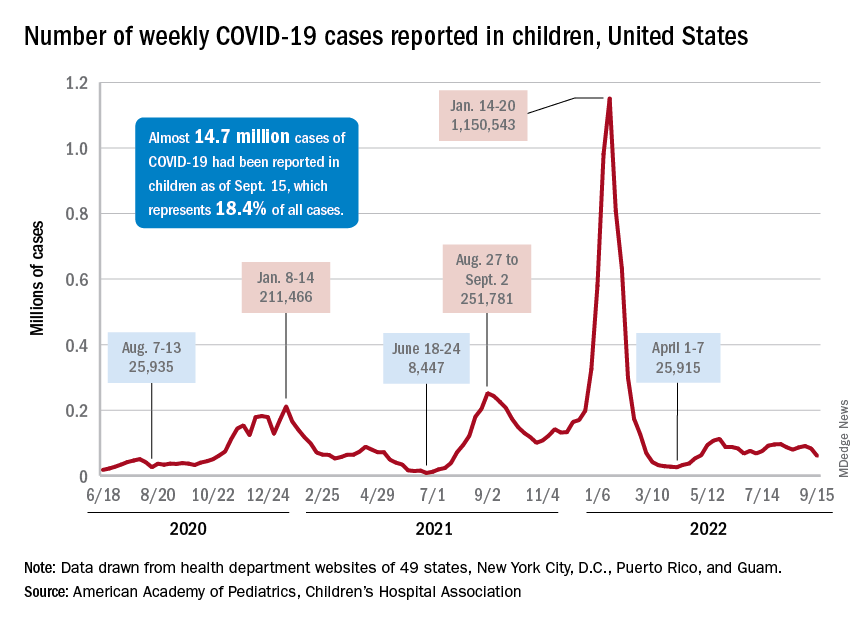
The last time the weekly count was under 60,000 came during the week of April 22-28, when 53,000 were reported by state and territorial health departments in the midst of a 7-week stretch of rising cases. Since that streak ended in mid-May, however, “reported weekly cases have plateaued, fluctuating between a low, now of 60,300 cases and a high of about 112,000,” the AAP noted.
Emergency department visits and hospital admissions, which showed less fluctuation over the summer and more steady rise and fall, have both dropped in recent weeks and are now approaching late May/early June rates, according to data from the Centers for Disease Control and Prevention.
On Sept. 15, for example, ED visits for children under 12 years with diagnosed COVID were just 2.2% of all visits, lower than at any time since May 19 and down from a summer high of 6.8% in late July. Hospital admissions for children aged 0-17 years also rose steadily through June and July, reaching 0.46 per 100,000 population on July 30, but have since slipped to 0.29 per 100,000 as of Sept. 17, the CDC said on its COVID Data Tracker.
Vaccination continues to be a tough sell
Vaccination activity among the most recently eligible age group, in the meantime, remains tepid. Just 6.0% of children under age 5 had received at least one dose of COVID-19 vaccine as of Sept. 13, about 3 months since its final approval in June, and 1.6% were fully vaccinated. For the two older groups of children with separate vaccine approvals, 31.5% of those aged 5-11 years and 43.3% of those aged 12-15 had received at least one dose 3 months after their vaccinations began, the CDC data show.
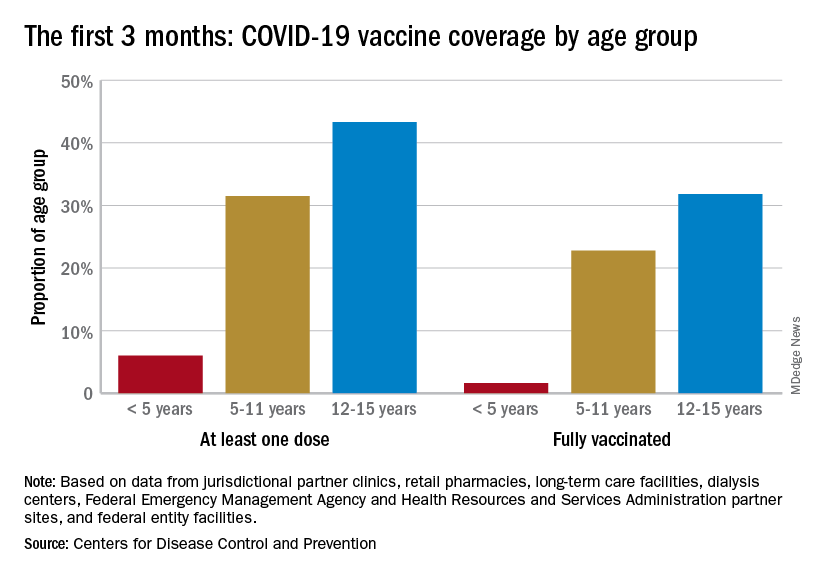
In the 2 weeks ending Sept. 14, almost 59,000 children under age 5 received their initial COVID-19 vaccine dose, as did 28,000 5- to 11-year-olds and 14,000 children aged 12-17. Children under age 5 years represented almost 20% of all Americans getting a first dose during Sept. 1-14, compared with 9.7% for those aged 5-11 and 4.8% for the 12- to 17-year-olds, the CDC said.
At the state level, children under age 5 years in the District of Columbia, where 28% have received at least one dose, and Vermont, at 24%, are the most likely to be vaccinated. The states with the lowest rates in this age group are Alabama, Louisiana, and Mississippi, all of which are at 2%. Vermont and D.C. have the highest rates for ages 5-11 at 70% each, and Alabama (17%) is the lowest, while D.C. (100%), Rhode Island (99%), and Massachusetts (99%) are highest for children aged 12-17 years and Wyoming (41%) is the lowest, the AAP said in a separate report.
A hefty decline in new COVID-19 cases among children resulted in the lowest weekly total since late April, according to a report from the American Academy of Pediatrics and the Children’s Hospital Association.
, making for 2 consecutive weeks of declines after almost 91,000 cases were recorded for the week ending Sept. 1, the AAP and CHA said in their latest COVID report of state-level data.
The last time the weekly count was under 60,000 came during the week of April 22-28, when 53,000 were reported by state and territorial health departments in the midst of a 7-week stretch of rising cases. Since that streak ended in mid-May, however, “reported weekly cases have plateaued, fluctuating between a low, now of 60,300 cases and a high of about 112,000,” the AAP noted.
Emergency department visits and hospital admissions, which showed less fluctuation over the summer and more steady rise and fall, have both dropped in recent weeks and are now approaching late May/early June rates, according to data from the Centers for Disease Control and Prevention.
On Sept. 15, for example, ED visits for children under 12 years with diagnosed COVID were just 2.2% of all visits, lower than at any time since May 19 and down from a summer high of 6.8% in late July. Hospital admissions for children aged 0-17 years also rose steadily through June and July, reaching 0.46 per 100,000 population on July 30, but have since slipped to 0.29 per 100,000 as of Sept. 17, the CDC said on its COVID Data Tracker.
Vaccination continues to be a tough sell
Vaccination activity among the most recently eligible age group, in the meantime, remains tepid. Just 6.0% of children under age 5 had received at least one dose of COVID-19 vaccine as of Sept. 13, about 3 months since its final approval in June, and 1.6% were fully vaccinated. For the two older groups of children with separate vaccine approvals, 31.5% of those aged 5-11 years and 43.3% of those aged 12-15 had received at least one dose 3 months after their vaccinations began, the CDC data show.
In the 2 weeks ending Sept. 14, almost 59,000 children under age 5 received their initial COVID-19 vaccine dose, as did 28,000 5- to 11-year-olds and 14,000 children aged 12-17. Children under age 5 years represented almost 20% of all Americans getting a first dose during Sept. 1-14, compared with 9.7% for those aged 5-11 and 4.8% for the 12- to 17-year-olds, the CDC said.
At the state level, children under age 5 years in the District of Columbia, where 28% have received at least one dose, and Vermont, at 24%, are the most likely to be vaccinated. The states with the lowest rates in this age group are Alabama, Louisiana, and Mississippi, all of which are at 2%. Vermont and D.C. have the highest rates for ages 5-11 at 70% each, and Alabama (17%) is the lowest, while D.C. (100%), Rhode Island (99%), and Massachusetts (99%) are highest for children aged 12-17 years and Wyoming (41%) is the lowest, the AAP said in a separate report.