User login
CTO PCI success rates rising, with blip during COVID-19, registry shows
Technical and procedural success rates for chronic total occlusion percutaneous coronary intervention (CTO PCI) have increased steadily over the past 6 years, with rates of in-hospital major adverse cardiac events (MACE) declining to the 2%-or-lower range in that time.
“CTO PCI technical and procedural success rates are high and continue to increase over time,” Spyridon Kostantinis, MD said in presenting updated results from the international PROGRESS-CTO registry at the Society for Cardiovascular Angiography & Interventions annual scientific sessions.

“The overall success rate increased from 81.6% in 2018 to 88.1% in 2021,” he added. The overall incidence of in-hospital MACE in that time was “an acceptable” 2.1% without significant changes over that period.
The analysis examined clinical, angiographic and procedural outcomes of 10,249 CTO PCIs performed on 10,019 patients from 63 centers in nine countries during 2016-2021. PROGRESS-CTO stands for Prospective Global Registry for the Study of Chronic Total Occlusion Intervention.
The target CTOs were highly complex, he said, with an average J-CTO (multicenter CTO registry in Japan) score of 2.4 ± 1.3 and PROGRESS-CTO score of 1.3 ± 1. The most common CTO target vessel was the right coronary artery (53%), followed by the left anterior descending artery (26%) and the circumflex artery (19%).
The registry also tracked how characteristics of the CTO PCI procedures themselves changed over time. “The septal and the epicardial collaterals were the most common collaterals used for retrograde crossing, with a decreasing trend for epicardial collaterals over time,” said Dr. Kostantinis, a research fellow at the Minneapolis Heart Institute.
Septal collateral use varied between 64% and 69% of cases from 2016 to 2021, but the share of epicardial collaterals declined from 35% to 22% in that time.
“Over time, the range of antegrade wiring as the final successfully crossing strategy increased from 46% in 2016 to 61% in 2021, with a decrease in antegrade dissection and re-entry (ADR) and no change in the retrograde approach,” Dr. Kostantinis said. The percentage of procedures using ADR as the final crossing strategy declined from 18% in 2016 to 12% in 2021, with the rate of retrograde crossings peaking at 21% in 2016 but leveling off to 18% or 19% in the subsequent years.
“An increasing use in the efficiency of antegrade wiring may reflect an improvement in guidewire retrograde crossing as well as the increasing operator expertise,” Dr. Kostantinis said.
The study also found that contrast volume, air kerma radiation dose, fluoroscopy time, and procedure time declined steadily over time. “The potential explanations for these are using new x-ray systems as well as the use of intravascular imaging,” Dr. Kostantinis said.
In 2020, the rates of technical and procedural success, as well as the number of overall procedures, declined from 2019, while MACE rates ticked upward that year, probably because of the COVID-19 pandemic, Dr. Kostantinis said.
“It is true that we noticed a rise in MACE rate from 1.6% in 2019 to 2.7% in 2020, but in 2021 that decreased again to 1.7%,” he said in an interview. “Another potential explanation is the higher angiographic complexity of CTOs treated during that year (2020) that resulted in more adverse events.”
Previous results from the PROGRESS-CTO registry reported the difference in MACE between 2019 and 2020 was significant (P = .01). “So, yes, the difference between those 2 years is significant,” Dr. Kostantinis said. However, he noted, the overall trend was not significant, with a P value of .194.
The risk profile of CTO PCI has improved “slowly” over time, said Kirk N. Garratt, MD, but “it’s not yet were it needs to be.”

He added, “Undoubtedly we’ve learned that, without any question, one method for minimizing the risk is to concentrate these cases in the hands of those that do many of them.” As the number of procedures fell – an “embedded” pandemic impact –“I worry that it’s inevitable that complication rates will tick up a bit,” said Dr. Garratt, director of the Center for Heart and Vascular Health at Christiana Care in Newark, Del.
By the same token, he added, this situation with regard to CTOs “parallels what’s happening elsewhere in interventional medicine and medicine broadly; numbers are increasing and we’re busy again. In most domains we’re not as busy as we had been prepandemic, and time will allow us to catch up.”
PROGRESS-CTO has received funding from the Joseph F. and Mary M. Fleischhacker Foundation and the Abbott Northwestern Hospital Foundation Innovation Grant.
Dr. Kostantinis has no disclosures. Dr. Garratt is an advisory board member for Abbott.
Technical and procedural success rates for chronic total occlusion percutaneous coronary intervention (CTO PCI) have increased steadily over the past 6 years, with rates of in-hospital major adverse cardiac events (MACE) declining to the 2%-or-lower range in that time.
“CTO PCI technical and procedural success rates are high and continue to increase over time,” Spyridon Kostantinis, MD said in presenting updated results from the international PROGRESS-CTO registry at the Society for Cardiovascular Angiography & Interventions annual scientific sessions.
“The overall success rate increased from 81.6% in 2018 to 88.1% in 2021,” he added. The overall incidence of in-hospital MACE in that time was “an acceptable” 2.1% without significant changes over that period.
The analysis examined clinical, angiographic and procedural outcomes of 10,249 CTO PCIs performed on 10,019 patients from 63 centers in nine countries during 2016-2021. PROGRESS-CTO stands for Prospective Global Registry for the Study of Chronic Total Occlusion Intervention.
The target CTOs were highly complex, he said, with an average J-CTO (multicenter CTO registry in Japan) score of 2.4 ± 1.3 and PROGRESS-CTO score of 1.3 ± 1. The most common CTO target vessel was the right coronary artery (53%), followed by the left anterior descending artery (26%) and the circumflex artery (19%).
The registry also tracked how characteristics of the CTO PCI procedures themselves changed over time. “The septal and the epicardial collaterals were the most common collaterals used for retrograde crossing, with a decreasing trend for epicardial collaterals over time,” said Dr. Kostantinis, a research fellow at the Minneapolis Heart Institute.
Septal collateral use varied between 64% and 69% of cases from 2016 to 2021, but the share of epicardial collaterals declined from 35% to 22% in that time.
“Over time, the range of antegrade wiring as the final successfully crossing strategy increased from 46% in 2016 to 61% in 2021, with a decrease in antegrade dissection and re-entry (ADR) and no change in the retrograde approach,” Dr. Kostantinis said. The percentage of procedures using ADR as the final crossing strategy declined from 18% in 2016 to 12% in 2021, with the rate of retrograde crossings peaking at 21% in 2016 but leveling off to 18% or 19% in the subsequent years.
“An increasing use in the efficiency of antegrade wiring may reflect an improvement in guidewire retrograde crossing as well as the increasing operator expertise,” Dr. Kostantinis said.
The study also found that contrast volume, air kerma radiation dose, fluoroscopy time, and procedure time declined steadily over time. “The potential explanations for these are using new x-ray systems as well as the use of intravascular imaging,” Dr. Kostantinis said.
In 2020, the rates of technical and procedural success, as well as the number of overall procedures, declined from 2019, while MACE rates ticked upward that year, probably because of the COVID-19 pandemic, Dr. Kostantinis said.
“It is true that we noticed a rise in MACE rate from 1.6% in 2019 to 2.7% in 2020, but in 2021 that decreased again to 1.7%,” he said in an interview. “Another potential explanation is the higher angiographic complexity of CTOs treated during that year (2020) that resulted in more adverse events.”
Previous results from the PROGRESS-CTO registry reported the difference in MACE between 2019 and 2020 was significant (P = .01). “So, yes, the difference between those 2 years is significant,” Dr. Kostantinis said. However, he noted, the overall trend was not significant, with a P value of .194.
The risk profile of CTO PCI has improved “slowly” over time, said Kirk N. Garratt, MD, but “it’s not yet were it needs to be.”
He added, “Undoubtedly we’ve learned that, without any question, one method for minimizing the risk is to concentrate these cases in the hands of those that do many of them.” As the number of procedures fell – an “embedded” pandemic impact –“I worry that it’s inevitable that complication rates will tick up a bit,” said Dr. Garratt, director of the Center for Heart and Vascular Health at Christiana Care in Newark, Del.
By the same token, he added, this situation with regard to CTOs “parallels what’s happening elsewhere in interventional medicine and medicine broadly; numbers are increasing and we’re busy again. In most domains we’re not as busy as we had been prepandemic, and time will allow us to catch up.”
PROGRESS-CTO has received funding from the Joseph F. and Mary M. Fleischhacker Foundation and the Abbott Northwestern Hospital Foundation Innovation Grant.
Dr. Kostantinis has no disclosures. Dr. Garratt is an advisory board member for Abbott.
FROM SCAI 2022
‘Sit less, move more’ to reduce stroke risk
in a population-based study of middle aged and older adults.
The study also found relatively short periods of moderate to vigorous exercise were associated with reduced stroke risk.
“Our results suggest there are a number of ways to reduce stroke risk simply by moving about,” said lead author Steven P. Hooker, PhD, San Diego State University. “This could be with short periods of moderate to vigorous activity each day, longer periods of light activity, or just sedentary for shorter periods of time. All these things can make a difference.”
Dr. Hooker explained that, while it has been found previously that moderate to vigorous exercise reduces stroke risk, this study gives more information on light-intensity activities and sedentary behavior and the risk of stroke.
“Our results suggest that you don’t have to be a chronic exerciser to reduce stroke risk. Replacing sedentary time with light-intensity activity will be beneficial. Just go for a short walk, get up from your desk and move around the house at regular intervals. That can help to reduce stroke risk,” Dr. Hooker said.
“Our message is basically to sit less and move more,” he added.
The study was published online in JAMA Network Open.
The study involved 7,607 U.S. individuals without a history of stroke, with oversampling from the southeastern “Stroke Belt,” who were participating in the REGARDS cohort study.
The participants wore an accelerometer to measure physical activity and sedentary behavior for 7 consecutive days. The mean age of the individuals was 63 years; 54% were female, 32% were Black.
Over a mean follow-up of 7.4 years, 286 incident stroke cases occurred.
Results showed that increased levels of physical activity were associated with reduced risk of stroke.
For moderate to vigorous activity, compared with participants in the lowest tertile, those in the highest tertile of total daily time in moderate to vigorous activity had a 43% lower risk of stroke.
In the current study, the amount of moderate to vigorous activity associated with a significant reduction in stroke risk was approximately 25 minutes per day (3 hours per week).
Dr. Hooker noted that moderate to vigorous activity included things such as brisk walking, jogging, bike riding, swimming, or playing tennis or soccer. “Doing such activities for just 25 minutes per day reduced risk of stroke by 43%. This is very doable. Just commuting to work by bicycle would cover you here,” he said.
In terms of light-intensity activity, individuals who did 4-5 hours of light activities each day had a 26% reduced risk for first stroke, compared with those doing less than 3 hours of such light activities.
Dr. Hooker explained that examples of light activity included household chores, such as vacuuming, washing dishes, or going for a gentle stroll. “These activities do not require heaving breathing, increased heart rate or breaking into a sweat. They are activities of daily living and relatively easy to engage in.”
But he pointed out that the 4-5 hours of light activity every day linked to a reduction in stroke risk may be more difficult to achieve than the 25 minutes of moderate to vigorous activity, saying: “You have to have some intentionality here.”
Long bouts of sedentary time are harmful
The study also showed that sedentary time was associated with a higher risk for stroke.
The authors noted that time spent in sedentary behavior is of interest because most adults spend most of their awake time being physically inactive.
They report that participants in the highest tertile of sedentary time (more than 13 hours/day) exhibited a 44% increase in risk of stroke, compared with those in the lowest tertile (less than 11 hours/day), and the association remained significant when adjusted for several covariates, including moderate to vigorous activity.
“Even when controlling for the amount of other physical activity, sedentary behavior is still highly associated with risk of stroke. So even if you are active, long bouts of sedentary behavior are harmful,” Dr. Hooker commented.
They also found that longer bouts of sedentary time (more than 17 minutes at a time) were associated with a 54% higher risk of stroke than shorter bouts (less than 8 minutes).
“This suggests that breaking up periods of sedentary behavior into shorter bouts would be beneficial,” Dr. Hooker said.
“If you are going to spend the evening on the couch watching television, try to stand up and walk around every few minutes. Same for if you are sitting at a computer all day – try having a standing workstation, or at least take regular breaks to walk around,” he added.
This research was supported by grants from the National Institute of Neurological Disorders and Stroke and the National Institute on Aging. Additional funding was provided by an unrestricted grant from the Coca-Cola Company. The authors report no disclosures.
A version of this article first appeared on Medscape.com.
FROM JAMA NETWORK OPEN
Antipsychotic tied to dose-related weight gain, higher cholesterol
new research suggests.
Investigators analyzed 1-year data for more than 400 patients who were taking risperidone and/or its metabolite paliperidone (Invega). Results showed increments of 1 mg of risperidone-equivalent doses were associated with an increase of 0.25% of weight within a year of follow-up.
“Although our findings report a positive and statistically significant dose-dependence of weight gain and cholesterol, both total and LDL [cholesterol], the size of the predicted changes of metabolic effects is clinically nonrelevant,” lead author Marianna Piras, PharmD, Centre for Psychiatric Neuroscience, Lausanne (Switzerland) University Hospital, said in an interview.
“Therefore, dose lowering would not have a beneficial effect on attenuating weight gain or cholesterol increases and could lead to psychiatric decompensation,” said Ms. Piras, who is also a PhD candidate in the unit of pharmacogenetics and clinical psychopharmacology at the University of Lausanne.
However, she added that because dose increments could increase risk for significant weight gain in the first month of treatment – the dose can be increased typically in a range of 1-10 grams – and strong dose increments could contribute to metabolic worsening over time, “risperidone minimum effective doses should be preferred.”
The findings were published online in the Journal of Clinical Psychiatry.
‘Serious public health issue’
Compared with the general population, patients with mental illness present with a greater prevalence of metabolic disorders. In addition, several psychotropic medications, including antipsychotics, can induce metabolic alterations such as weight gain, the investigators noted.
Antipsychotic-induced metabolic adverse effects “constitute a serious public health issue” because they are risk factors for cardiovascular diseases such as obesity and/or dyslipidemia, “which have been associated with a 10-year reduced life expectancy in the psychiatric population,” Ms. Piras said.
“The dose-dependence of metabolic adverse effects is a debated subject that needs to be assessed for each psychotropic drug known to induce weight gain,” she added.
Several previous studies have examined whether there is a dose-related effect of antipsychotics on metabolic parameters, “with some results suggesting that [weight gain] seems to develop even when low off-label doses are prescribed,” Ms. Piras noted.
She and her colleagues had already studied dose-related metabolic effects of quetiapine (Seroquel) and olanzapine (Zyprexa).
Risperidone is an antipsychotic with a “medium to high metabolic risk profile,” the researchers note, and few studies have examined the impact of risperidone on metabolic parameters other than weight gain.
For the current analysis, they analyzed data from a longitudinal study that included 438 patients (mean age, 40.7 years; 50.7% men) who started treatment with risperidone and/or paliperidone between 2007 and 2018.
The participants had diagnoses of schizophrenia, schizoaffective disorder, bipolar disorder, depression, “other,” or “unknown.”
Clinical follow-up periods were up to a year, but were no shorter than 3 weeks. The investigators also assessed the data at different time intervals at 1, 3, 6, and 12 months “to appreciate the evolution of the metabolic parameters.”
In addition, they collected demographic and clinical information, such as comorbidities, and measured patients’ weight, height, waist circumference, blood pressure, plasma glucose, and lipids at baseline and at 1, 3, and 12 months and then annually. Weight, waist circumference, and BP were also assessed at 2 and 6 months.
Doses of paliperidone were converted into risperidone-equivalent doses.
Significant weight gain over time
The mean duration of follow-up for the participants, of whom 374 were being treated with risperidone and 64 with paliperidone, was 153 days. Close to half (48.2%) were taking other psychotropic medications known to be associated with some degree of metabolic risk.
Patients were divided into two cohorts based on their daily dose intake (DDI): less than 3 mg/day (n = 201) and at least 3 mg/day (n = 237).
In the overall cohort, a “significant effect of time on weight change was found for each time point,” the investigators reported.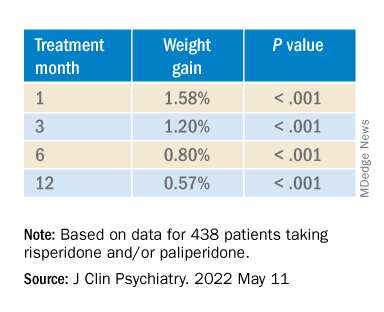
When the researchers looked at the changes according to DDI, they found that each 1-mg dose increase was associated with incremental weight gain at each time point.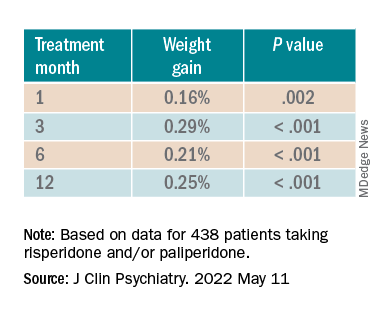
Patients who had 5% or greater weight gain in the first month continued to gain weight more than patients who did not reach that threshold, leading the researchers to call that early threshold a “strong predictor of important weight gain in the long term.” There was a weight gain of 6.68% at 3 months, of 7.36% at 6 months, and of 7.7% at 12 months.
After the patients were stratified by age, there were differences in the effect of DDI on various age groups at different time points.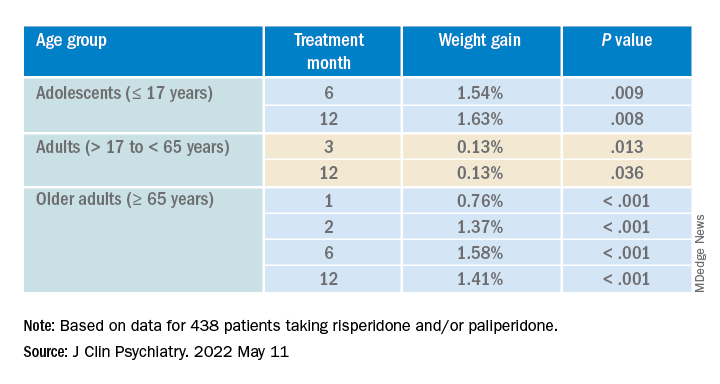
Dose was shown to have a significant effect on weight gain for women at all four time points (P ≥ .001), but for men only at 3 months (P = .003).
For each additional 1-mg dose, there was a 0.05 mmol/L (1.93 mg/dL) increase in total cholesterol (P = .018) after 1 year and a 0.04 mmol/L (1.54 mg/dL) increase in LDL cholesterol (P = .011).
There were no significant effects of time or DDI on triglycerides, HDL cholesterol, glucose levels, and systolic BP, and there was a negative effect of DDI on diastolic BP (P = .001).
The findings “provide evidence for a small dose effect of risperidone” on weight gain and total and LDL cholesterol levels, the investigators note.
Ms. Piras added that because each antipsychotic differs in its metabolic risk profile, “further analyses on other antipsychotics are ongoing in our laboratory, so far confirming our findings.”
Small increases, big changes
Commenting on the study, Erika Nurmi, MD, PhD, associate professor in the department of psychiatry and biobehavioral sciences at the Semel Institute for Neuroscience, University of California, Los Angeles, said the study is “unique in the field.”

It “leverages real-world data from a large patient registry to ask a long-unanswered question: Are weight and metabolic adverse effects proportional to dose? Big data approaches like these are very powerful, given the large number of participants that can be included,” said Dr. Nurmi, who was not involved with the research.
However, she cautioned, the “biggest drawback [is that] these data are by nature much more complex and prone to confounding effects.”
In this case, a “critical confounder” for the study was that the majority of individuals taking higher risperidone doses were also taking other drugs known to cause weight gain, whereas the majority of those on lower risperidone doses were not. “This difference may explain the dose relationship observed,” she said.
Because real-world, big data are “valuable but also messy, conclusions drawn from them must be interpreted with caution,” Dr. Nurmi said.
She added that it is generally wise to use the lowest effective dose possible.
“Clinicians should appreciate that even small doses of antipsychotics can cause big changes in weight. Risks and benefits of medications must be carefully considered in clinical practice,” Dr. Nurmi said.
The research was funded in part by the Swiss National Research Foundation. Piras reports no relevant financial relationships. The other investigators’ disclosures are listed in the original article. Dr. Nurmi reported no relevant financial relationships, but she is an unpaid member of the Tourette Association of America’s medical advisory board and of the Myriad Genetics scientific advisory board.
A version of this article first appeared on Medscape.com.
new research suggests.
Investigators analyzed 1-year data for more than 400 patients who were taking risperidone and/or its metabolite paliperidone (Invega). Results showed increments of 1 mg of risperidone-equivalent doses were associated with an increase of 0.25% of weight within a year of follow-up.
“Although our findings report a positive and statistically significant dose-dependence of weight gain and cholesterol, both total and LDL [cholesterol], the size of the predicted changes of metabolic effects is clinically nonrelevant,” lead author Marianna Piras, PharmD, Centre for Psychiatric Neuroscience, Lausanne (Switzerland) University Hospital, said in an interview.
“Therefore, dose lowering would not have a beneficial effect on attenuating weight gain or cholesterol increases and could lead to psychiatric decompensation,” said Ms. Piras, who is also a PhD candidate in the unit of pharmacogenetics and clinical psychopharmacology at the University of Lausanne.
However, she added that because dose increments could increase risk for significant weight gain in the first month of treatment – the dose can be increased typically in a range of 1-10 grams – and strong dose increments could contribute to metabolic worsening over time, “risperidone minimum effective doses should be preferred.”
The findings were published online in the Journal of Clinical Psychiatry.
‘Serious public health issue’
Compared with the general population, patients with mental illness present with a greater prevalence of metabolic disorders. In addition, several psychotropic medications, including antipsychotics, can induce metabolic alterations such as weight gain, the investigators noted.
Antipsychotic-induced metabolic adverse effects “constitute a serious public health issue” because they are risk factors for cardiovascular diseases such as obesity and/or dyslipidemia, “which have been associated with a 10-year reduced life expectancy in the psychiatric population,” Ms. Piras said.
“The dose-dependence of metabolic adverse effects is a debated subject that needs to be assessed for each psychotropic drug known to induce weight gain,” she added.
Several previous studies have examined whether there is a dose-related effect of antipsychotics on metabolic parameters, “with some results suggesting that [weight gain] seems to develop even when low off-label doses are prescribed,” Ms. Piras noted.
She and her colleagues had already studied dose-related metabolic effects of quetiapine (Seroquel) and olanzapine (Zyprexa).
Risperidone is an antipsychotic with a “medium to high metabolic risk profile,” the researchers note, and few studies have examined the impact of risperidone on metabolic parameters other than weight gain.
For the current analysis, they analyzed data from a longitudinal study that included 438 patients (mean age, 40.7 years; 50.7% men) who started treatment with risperidone and/or paliperidone between 2007 and 2018.
The participants had diagnoses of schizophrenia, schizoaffective disorder, bipolar disorder, depression, “other,” or “unknown.”
Clinical follow-up periods were up to a year, but were no shorter than 3 weeks. The investigators also assessed the data at different time intervals at 1, 3, 6, and 12 months “to appreciate the evolution of the metabolic parameters.”
In addition, they collected demographic and clinical information, such as comorbidities, and measured patients’ weight, height, waist circumference, blood pressure, plasma glucose, and lipids at baseline and at 1, 3, and 12 months and then annually. Weight, waist circumference, and BP were also assessed at 2 and 6 months.
Doses of paliperidone were converted into risperidone-equivalent doses.
Significant weight gain over time
The mean duration of follow-up for the participants, of whom 374 were being treated with risperidone and 64 with paliperidone, was 153 days. Close to half (48.2%) were taking other psychotropic medications known to be associated with some degree of metabolic risk.
Patients were divided into two cohorts based on their daily dose intake (DDI): less than 3 mg/day (n = 201) and at least 3 mg/day (n = 237).
In the overall cohort, a “significant effect of time on weight change was found for each time point,” the investigators reported.
When the researchers looked at the changes according to DDI, they found that each 1-mg dose increase was associated with incremental weight gain at each time point.
Patients who had 5% or greater weight gain in the first month continued to gain weight more than patients who did not reach that threshold, leading the researchers to call that early threshold a “strong predictor of important weight gain in the long term.” There was a weight gain of 6.68% at 3 months, of 7.36% at 6 months, and of 7.7% at 12 months.
After the patients were stratified by age, there were differences in the effect of DDI on various age groups at different time points.
Dose was shown to have a significant effect on weight gain for women at all four time points (P ≥ .001), but for men only at 3 months (P = .003).
For each additional 1-mg dose, there was a 0.05 mmol/L (1.93 mg/dL) increase in total cholesterol (P = .018) after 1 year and a 0.04 mmol/L (1.54 mg/dL) increase in LDL cholesterol (P = .011).
There were no significant effects of time or DDI on triglycerides, HDL cholesterol, glucose levels, and systolic BP, and there was a negative effect of DDI on diastolic BP (P = .001).
The findings “provide evidence for a small dose effect of risperidone” on weight gain and total and LDL cholesterol levels, the investigators note.
Ms. Piras added that because each antipsychotic differs in its metabolic risk profile, “further analyses on other antipsychotics are ongoing in our laboratory, so far confirming our findings.”
Small increases, big changes
Commenting on the study, Erika Nurmi, MD, PhD, associate professor in the department of psychiatry and biobehavioral sciences at the Semel Institute for Neuroscience, University of California, Los Angeles, said the study is “unique in the field.”
It “leverages real-world data from a large patient registry to ask a long-unanswered question: Are weight and metabolic adverse effects proportional to dose? Big data approaches like these are very powerful, given the large number of participants that can be included,” said Dr. Nurmi, who was not involved with the research.
However, she cautioned, the “biggest drawback [is that] these data are by nature much more complex and prone to confounding effects.”
In this case, a “critical confounder” for the study was that the majority of individuals taking higher risperidone doses were also taking other drugs known to cause weight gain, whereas the majority of those on lower risperidone doses were not. “This difference may explain the dose relationship observed,” she said.
Because real-world, big data are “valuable but also messy, conclusions drawn from them must be interpreted with caution,” Dr. Nurmi said.
She added that it is generally wise to use the lowest effective dose possible.
“Clinicians should appreciate that even small doses of antipsychotics can cause big changes in weight. Risks and benefits of medications must be carefully considered in clinical practice,” Dr. Nurmi said.
The research was funded in part by the Swiss National Research Foundation. Piras reports no relevant financial relationships. The other investigators’ disclosures are listed in the original article. Dr. Nurmi reported no relevant financial relationships, but she is an unpaid member of the Tourette Association of America’s medical advisory board and of the Myriad Genetics scientific advisory board.
A version of this article first appeared on Medscape.com.
FROM THE JOURNAL OF CLINICAL PSYCHIATRY
Childhood cardiovascular risks and longevity
Now hot off the press from the “always-guessed-it-was-true-but-now-you-know-it” department comes a multinational study that looked at childhood cardiovascular risk factors and longevity.
Using data collected from individuals in Finland, Australia, and the United States the International Childhood Cardiovascular Cohorts Consortium Outcomes Study investigators sought links between subjects’ body mass index, systolic blood pressure, total cholesterol, blood triglyceride level, and smoking in childhood with cardiovascular disease and outcomes as they aged into adulthood.

The children were initially enrolled in the 1970s and 1980s. The adult evaluations were done in 2015-2019 when the subjects’ average age was 46. Of the 40,000 individuals who originally entered the study, 800 were found to have cardiovascular events of which over 300 had resulted in death. I found these numbers a bit surprising given the relatively young age at which the follow-up data were collected.
What was less surprising is that people with higher than normal values for all five risk factors as children had nearly three times the risk of cardiovascular disease as adults. Researchers found that smoking at a young age was biggest risk factor with body mass index, systolic blood pressure, blood triglycerides, and cholesterol following in descending order. They also found that adults who were obese as children had triple the risk of cardiovascular disease as adults. High blood pressure in childhood doubled the risk.
It will be interesting to see if and how these trends change as the study population ages. It could be that the effect of these childhood risk factors is blunted as the those segments at the highest risk die off and/or risk- associated behaviors adopted in adulthood become more prominent. But, it feels more likely that the childhood risk factors will remain as major contributors.
Is this just another ho-hum-told-you-so study or does it have some special relevance for us as pediatricians? At a minimum these findings should inspire us to stick with our calling to commit ourselves to the health of children. A healthy adult population is clearly our legacy.
Of course the two individual risk factors in childhood that appear to be the most potent in adulthood, obesity and smoking, are also the most frustrating for pediatricians to address. However, the study suggests that we should rejoice in those few successes when we achieve them. Childhood obesity has been a tough nut to crack. On the other hand, the societal change that has made great strides in adult smoking over the last half century should encourage us that our work with the pediatric population will eventually bring rewards.
Smoking and obesity can include components of both patient and parental behavior. Monitoring cholesterol, triglycerides, and blood pressure hinges on our behavior as providers. Although there have been recent recommendations that we be more attentive, we don’t have a strong history when it comes to detecting and addressing high blood pressure in children. This study should serve as an another reminder to take blood pressure more seriously.
I was surprised and somewhat disappointed that I first learned about the results of this study in an email newsletter from the medical school I attended. I would have hoped that a paper like this from a well known peer-reviewed journal with a clear message about the relationship of childhood health and longevity should have been picked up quickly by the lay press. Again, this leaves it to us to promote the message that the health of children is important in and of itself but plays a critical role in the health of adults.
Dr. Wilkoff practiced primary care pediatrics in Brunswick, Maine, for nearly 40 years. He has authored several books on behavioral pediatrics, including “How to Say No to Your Toddler.” Other than a Littman stethoscope he accepted as a first-year medical student in 1966, Dr. Wilkoff reports having nothing to disclose. Email him at pdnews@mdedge.com.
Now hot off the press from the “always-guessed-it-was-true-but-now-you-know-it” department comes a multinational study that looked at childhood cardiovascular risk factors and longevity.
Using data collected from individuals in Finland, Australia, and the United States the International Childhood Cardiovascular Cohorts Consortium Outcomes Study investigators sought links between subjects’ body mass index, systolic blood pressure, total cholesterol, blood triglyceride level, and smoking in childhood with cardiovascular disease and outcomes as they aged into adulthood.
The children were initially enrolled in the 1970s and 1980s. The adult evaluations were done in 2015-2019 when the subjects’ average age was 46. Of the 40,000 individuals who originally entered the study, 800 were found to have cardiovascular events of which over 300 had resulted in death. I found these numbers a bit surprising given the relatively young age at which the follow-up data were collected.
What was less surprising is that people with higher than normal values for all five risk factors as children had nearly three times the risk of cardiovascular disease as adults. Researchers found that smoking at a young age was biggest risk factor with body mass index, systolic blood pressure, blood triglycerides, and cholesterol following in descending order. They also found that adults who were obese as children had triple the risk of cardiovascular disease as adults. High blood pressure in childhood doubled the risk.
It will be interesting to see if and how these trends change as the study population ages. It could be that the effect of these childhood risk factors is blunted as the those segments at the highest risk die off and/or risk- associated behaviors adopted in adulthood become more prominent. But, it feels more likely that the childhood risk factors will remain as major contributors.
Is this just another ho-hum-told-you-so study or does it have some special relevance for us as pediatricians? At a minimum these findings should inspire us to stick with our calling to commit ourselves to the health of children. A healthy adult population is clearly our legacy.
Of course the two individual risk factors in childhood that appear to be the most potent in adulthood, obesity and smoking, are also the most frustrating for pediatricians to address. However, the study suggests that we should rejoice in those few successes when we achieve them. Childhood obesity has been a tough nut to crack. On the other hand, the societal change that has made great strides in adult smoking over the last half century should encourage us that our work with the pediatric population will eventually bring rewards.
Smoking and obesity can include components of both patient and parental behavior. Monitoring cholesterol, triglycerides, and blood pressure hinges on our behavior as providers. Although there have been recent recommendations that we be more attentive, we don’t have a strong history when it comes to detecting and addressing high blood pressure in children. This study should serve as an another reminder to take blood pressure more seriously.
I was surprised and somewhat disappointed that I first learned about the results of this study in an email newsletter from the medical school I attended. I would have hoped that a paper like this from a well known peer-reviewed journal with a clear message about the relationship of childhood health and longevity should have been picked up quickly by the lay press. Again, this leaves it to us to promote the message that the health of children is important in and of itself but plays a critical role in the health of adults.
Dr. Wilkoff practiced primary care pediatrics in Brunswick, Maine, for nearly 40 years. He has authored several books on behavioral pediatrics, including “How to Say No to Your Toddler.” Other than a Littman stethoscope he accepted as a first-year medical student in 1966, Dr. Wilkoff reports having nothing to disclose. Email him at pdnews@mdedge.com.
Will tirzepatide slow kidney function decline in type 2 diabetes?
The “twincretin” tirzepatide might become part of the “arsenal” against diabetic kidney disease, new research suggests. Notably, the drug significantly reduced the likelihood of macroalbuminuria, in a prespecified subanalysis of the SURPASS-4 clinical trial.
“Once-per-week tirzepatide compared to [daily] insulin glargine treatment resulted in a meaningful improvement in estimated glomerular filtration rate (eGFR) decline and reduced urine albumin-to-creatinine ratio (UACR) and the risk of end stage kidney disease (ESKD) – with low risk of clinically relevant hypoglycemia in participants with type 2 diabetes at high cardiovascular risk and varying degrees of chronic kidney disease (CKD),” lead investigator Hiddo J. L. Heerspink, PhD, PharmD, summarized in an email to this news organization.

The U.S. Food and Drug Administration has just approved tirzepatide (Mounjaro, Eli Lilly) – a novel, glucose-dependent insulinotropic polypeptide (GIP) combined with a glucagonlike peptide-1 (GLP-1) receptor agonist – to treat glycemia in patients with type 2 diabetes, based on five pivotal SURPASS trials.
Dr. Heerspink presented the new findings about tirzepatide’s impact on kidney function in an oral session at the annual scientific sessions of the American Diabetes Association.
40% reduced risk of kidney function decline
The main results of SURPASS-4 were published in the Lancet in October 2021, and showed that tirzepatide appeared superior to insulin glargine in lowering hemoglobin A1c in patients with type 2 diabetes at high cardiovascular risk who were inadequately controlled on oral diabetes treatments.
Now, Dr. Heerspink has shown that patients who received tirzepatide as opposed to insulin glargine were significantly less likely to have kidney function decline that included new-onset macroalbuminuria (hazard ratio, 0.59; P < .05).
“These are very large benefits and clearly indicate the potential of tirzepatide to be a very strong kidney protective drug,” said Dr. Heerspink, from the department of clinical pharmacy and pharmacology, University Medical Center Groningen (the Netherlands).
“Based on results from the SURPASS-4 trial, tirzepatide has significant kidney-protective effects in adults with type 2 diabetes with high cardiovascular risk and largely normal kidney function,” Christine Limonte, MD, chair of the session in which the analysis was presented, agreed, in an email to this news organization.
The approximate 40% reduced risk of kidney function decline in this population “is important because it suggests that this novel agent may contribute to the growing arsenal for preventing and treating diabetic kidney disease,” added Dr. Limonte, a clinical research fellow in the division of nephrology, University of Washington, Seattle.
“Over the last several years,” she noted, “sodium glucose cotransporter-2 [SGLT2] inhibitors and GLP-1 receptor agonists have been identified as having significant kidney-protective effects in type 2 diabetes, and as such are becoming first-line agents in the treatment of diabetic kidney disease.”
Additional studies are needed, she added, to assess the impacts of tirzepatide compared to these agents (particularly GLP-1 receptor agonists, which overlap in their mechanism of action).
“With the growing number of therapeutic options for diabetic kidney disease, future research should also focus on identifying combinations of agents which benefit individuals in a ‘targeted’ manner,” according to Dr. Limonte.
“Ensuring accessibility to kidney-protective agents by promoting access to health care and reducing drug costs is essential to improving outcomes in diabetic kidney disease,” she added.
Strongest reduction seen in risk of new macroalbuminuria
One in three adults with diabetes has CKD, according to a press release issued by the ADA. Therefore, there is a need for therapies to reduce the development and progression of CKD in patients with type 2 diabetes.
The prespecified analysis of SUPRESS-4 investigated potential renoprotective effects of tirzepatide.
The trial enrolled 1,995 patients with type 2 diabetes who were at increased risk of cardiovascular disease. The patients had a mean age of 63.6 years and a mean hemoglobin A1c of 8.5%.
Most patients had normal kidney function. The mean eGFR based on the Chronic Kidney Disease Epidemiology Collaboration (CKD-EPI) equation was 81.3 mL/min per 1.73 m2.
Few patients (17%) had moderately or severely reduced kidney function (eGFR <60 mL/min per 1.73 m2). Around a quarter of the patients (28%) had microalbuminuria (UACR 30-300 mg/g) and 8% had macroalbuminuria (UACR >300 mg/g).
The patients were randomized to receive a weekly injection of 5, 10, or 15 mg tirzepatide or a daily individualized injection of insulin glargine starting at 10 IU/day at bedtime, titrated to a fasting blood glucose <100 mg/dL, in addition to existing oral glucose-lowering agents. The primary outcomes in the subanalysis were:
- Endpoint 1: a composite of ≥40% decline in eGFR from baseline, renal death, progression to ESKD, and new-onset macroalbuminuria.
- Endpoint 2: the same as endpoint 1 excluding new-onset macroalbuminuria.
During a median follow up of 85 weeks and up to 104 weeks, patients who received tirzepatide versus insulin glargine were significantly less likely to reach endpoint 1 but not endpoint 2.
In addition, tirzepatide “very strongly” reduced the risk of new-onset macroalbuminuria, compared to insulin glargine, by approximately 60% in the complete study cohort (hazard ratio, 0.41; P < .05), Dr. Limonte noted.
Tirzepatide also reduced the risk of a >40% decline in eGFR, but this effect was not statistically significant, possibly because this outcome was underpowered. There were also too few kidney deaths and progressions to ESKD to meaningfully assess the effects of tirzepatide on these outcomes.
Therefore, Dr. Limonte noted, “it is likely that tirzepatide’s significant benefit on composite endpoint 1 was largely driven by this agent’s impact on reducing macroalbuminuria onset [explaining why a significant benefit was not seen with composite endpoint 2, which excluded new-onset macroalbuminuria].”
The study was funded by Eli Lilly. Dr. Heerspink disclosed that he is a consultant for AstraZeneca, Bayer AG, Boehringer Ingelheim, Chinook Therapeutics, CSL Behring, Gilead Sciences, Goldfinch Bio, Janssen Research & Development, Mitsubishi Tanabe Pharma, Mundipharma, and Traveere Pharmaceuticals, and has received research support from AstraZeneca, Boehringer Ingelheim, and Novo Nordisk.
Dr. Limonte disclosed that she receives funds from the American Kidney Fund’s Clinical Scientist in Nephrology Award.
A version of this article first appeared on Medscape.com.
The “twincretin” tirzepatide might become part of the “arsenal” against diabetic kidney disease, new research suggests. Notably, the drug significantly reduced the likelihood of macroalbuminuria, in a prespecified subanalysis of the SURPASS-4 clinical trial.
“Once-per-week tirzepatide compared to [daily] insulin glargine treatment resulted in a meaningful improvement in estimated glomerular filtration rate (eGFR) decline and reduced urine albumin-to-creatinine ratio (UACR) and the risk of end stage kidney disease (ESKD) – with low risk of clinically relevant hypoglycemia in participants with type 2 diabetes at high cardiovascular risk and varying degrees of chronic kidney disease (CKD),” lead investigator Hiddo J. L. Heerspink, PhD, PharmD, summarized in an email to this news organization.
The U.S. Food and Drug Administration has just approved tirzepatide (Mounjaro, Eli Lilly) – a novel, glucose-dependent insulinotropic polypeptide (GIP) combined with a glucagonlike peptide-1 (GLP-1) receptor agonist – to treat glycemia in patients with type 2 diabetes, based on five pivotal SURPASS trials.
Dr. Heerspink presented the new findings about tirzepatide’s impact on kidney function in an oral session at the annual scientific sessions of the American Diabetes Association.
40% reduced risk of kidney function decline
The main results of SURPASS-4 were published in the Lancet in October 2021, and showed that tirzepatide appeared superior to insulin glargine in lowering hemoglobin A1c in patients with type 2 diabetes at high cardiovascular risk who were inadequately controlled on oral diabetes treatments.
Now, Dr. Heerspink has shown that patients who received tirzepatide as opposed to insulin glargine were significantly less likely to have kidney function decline that included new-onset macroalbuminuria (hazard ratio, 0.59; P < .05).
“These are very large benefits and clearly indicate the potential of tirzepatide to be a very strong kidney protective drug,” said Dr. Heerspink, from the department of clinical pharmacy and pharmacology, University Medical Center Groningen (the Netherlands).
“Based on results from the SURPASS-4 trial, tirzepatide has significant kidney-protective effects in adults with type 2 diabetes with high cardiovascular risk and largely normal kidney function,” Christine Limonte, MD, chair of the session in which the analysis was presented, agreed, in an email to this news organization.
The approximate 40% reduced risk of kidney function decline in this population “is important because it suggests that this novel agent may contribute to the growing arsenal for preventing and treating diabetic kidney disease,” added Dr. Limonte, a clinical research fellow in the division of nephrology, University of Washington, Seattle.
“Over the last several years,” she noted, “sodium glucose cotransporter-2 [SGLT2] inhibitors and GLP-1 receptor agonists have been identified as having significant kidney-protective effects in type 2 diabetes, and as such are becoming first-line agents in the treatment of diabetic kidney disease.”
Additional studies are needed, she added, to assess the impacts of tirzepatide compared to these agents (particularly GLP-1 receptor agonists, which overlap in their mechanism of action).
“With the growing number of therapeutic options for diabetic kidney disease, future research should also focus on identifying combinations of agents which benefit individuals in a ‘targeted’ manner,” according to Dr. Limonte.
“Ensuring accessibility to kidney-protective agents by promoting access to health care and reducing drug costs is essential to improving outcomes in diabetic kidney disease,” she added.
Strongest reduction seen in risk of new macroalbuminuria
One in three adults with diabetes has CKD, according to a press release issued by the ADA. Therefore, there is a need for therapies to reduce the development and progression of CKD in patients with type 2 diabetes.
The prespecified analysis of SUPRESS-4 investigated potential renoprotective effects of tirzepatide.
The trial enrolled 1,995 patients with type 2 diabetes who were at increased risk of cardiovascular disease. The patients had a mean age of 63.6 years and a mean hemoglobin A1c of 8.5%.
Most patients had normal kidney function. The mean eGFR based on the Chronic Kidney Disease Epidemiology Collaboration (CKD-EPI) equation was 81.3 mL/min per 1.73 m2.
Few patients (17%) had moderately or severely reduced kidney function (eGFR <60 mL/min per 1.73 m2). Around a quarter of the patients (28%) had microalbuminuria (UACR 30-300 mg/g) and 8% had macroalbuminuria (UACR >300 mg/g).
The patients were randomized to receive a weekly injection of 5, 10, or 15 mg tirzepatide or a daily individualized injection of insulin glargine starting at 10 IU/day at bedtime, titrated to a fasting blood glucose <100 mg/dL, in addition to existing oral glucose-lowering agents. The primary outcomes in the subanalysis were:
- Endpoint 1: a composite of ≥40% decline in eGFR from baseline, renal death, progression to ESKD, and new-onset macroalbuminuria.
- Endpoint 2: the same as endpoint 1 excluding new-onset macroalbuminuria.
During a median follow up of 85 weeks and up to 104 weeks, patients who received tirzepatide versus insulin glargine were significantly less likely to reach endpoint 1 but not endpoint 2.
In addition, tirzepatide “very strongly” reduced the risk of new-onset macroalbuminuria, compared to insulin glargine, by approximately 60% in the complete study cohort (hazard ratio, 0.41; P < .05), Dr. Limonte noted.
Tirzepatide also reduced the risk of a >40% decline in eGFR, but this effect was not statistically significant, possibly because this outcome was underpowered. There were also too few kidney deaths and progressions to ESKD to meaningfully assess the effects of tirzepatide on these outcomes.
Therefore, Dr. Limonte noted, “it is likely that tirzepatide’s significant benefit on composite endpoint 1 was largely driven by this agent’s impact on reducing macroalbuminuria onset [explaining why a significant benefit was not seen with composite endpoint 2, which excluded new-onset macroalbuminuria].”
The study was funded by Eli Lilly. Dr. Heerspink disclosed that he is a consultant for AstraZeneca, Bayer AG, Boehringer Ingelheim, Chinook Therapeutics, CSL Behring, Gilead Sciences, Goldfinch Bio, Janssen Research & Development, Mitsubishi Tanabe Pharma, Mundipharma, and Traveere Pharmaceuticals, and has received research support from AstraZeneca, Boehringer Ingelheim, and Novo Nordisk.
Dr. Limonte disclosed that she receives funds from the American Kidney Fund’s Clinical Scientist in Nephrology Award.
A version of this article first appeared on Medscape.com.
FROM ADA 2022
Omega-3 supplement sweet spot found for BP reduction
A meta-analysis of 71 randomized controlled trials has found the sweet spot for omega-3 fatty acid intake for lowering blood pressure: between 2 and 3 g/day. The investigators also reported that people at higher risk for cardiovascular disease may benefit from higher daily intake of omega-3.
The study analyzed data from randomized controlled trials involving 4,973 individuals and published from 1987 to 2020. Most of the trials used a combined supplementation of eicosapentaenoic acid (EPA) and docosahexaenoic acid (DHA). Outcomes analysis involved the impact of combined DHA-EPA at 1, 2, 3, 4, or 5 grams daily on average changes in both systolic and diastolic BP and compared them with the placebo or control groups who had a combined intake of 0 g/day.

“We found a significant nonlinear dose-response relationship for both SBP and DBP models,” wrote senior author Xinzhi Li, MD, PhD, and colleagues. Dr. Li is program director of the school of pharmacy at Macau University of Science and Technology in Taipa, China.
Most of the trials included in the meta-analysis evaluated fish oil supplements, but a number also included EPA and DHA omega-3 fatty acids consumed in food.
When the investigators analyzed studies that used an average baseline SBP of greater than 130 mm Hg, they found that increasing omega-3 supplementation resulted in strong reductions in SBP and DBP, but not so with people with baseline SBP below 130 mm Hg.
Across the entire cohort, average SBP and DBP changes averaged –2.61 (95% confidence interval, –3.57 to –1.65) and –1.64 (95% CI, –2.29 to –0.99) mm Hg for people taking 2 g/d omega-3 supplements, and –2.61 (95% CI, –3.52 to –1.69) and –1.80 (95% CI, –2.38 to –1.23) for those on 3 g/d. The changes weren’t as robust in higher and lower intake groups overall.
However, the higher the BP, the more robust the reductions. For those with SBP greater than 130 mm Hg, 3 g/d resulted in an average change of –3.22 mm Hg (95% CI, –5.21 to –1.23). In the greater than 80 mm Hg DBP group, 3 g/d of omega-3 resulted in an average –3.81 mm Hg reduction (95% CI, –4.48 to –1.87). In patients with BP greater than 140/90 and hypertension, the reductions were even more pronounced. And in patients with BP greater than 130/80, omega-3 intake of 4-5 g/d had a greater impact than 2-3 g/d, although that benefit didn’t carry over in the greater than 140/90 group.
High cholesterol was also a factor in determining the benefits of omega-3 supplementation on BP, as Dr. Li and colleagues wrote that they found “an approximately linear relationship” between hyperlipidemia and SBP, “suggesting that increasing supplementation was associated with greater reductions in SBP.” Likewise, the study found stronger effects on BP in studies with an average patient age greater than 45 years.
In 2019, the Food and Drug Administration issued an update that consuming combined EPA and DHA may lower BP in the general population and reduce the risk of hypertension, but that “the evidence is inconsistent and inconclusive.”
“However, while our study may add a layer of credible evidence, it does not meet the threshold to make an authorized health claim for omega-3 fatty acids in compliance with FDA regulations,” Dr. Li said.
The study addresses shortcomings of previous studies of omega-3 and BP and by identifying the optimal dose, Marc George, MRCP, PhD, of the Institute of Cardiovascular Science, University College, London, and Ajay Gupta, MD, PhD, of the William Harvey Research Institute at Queen Mary University, London, wrote in an accompanying editorial. “More importantly, they have demonstrated a significantly stronger and increased BP-lowering effect in higher cardiovascular risk groups, such as those with hypertension or hyperlipidemia.”
They also noted that the 2.61–mm Hg reduction in SBP the study reported is “likely to be significant” on a population level. “A 2–mm Hg reduction in SBP is estimated to reduce stroke mortality by 10% and deaths from ischemic heart disease by 7%,” they wrote. “Expressed another way, an analysis in the U.S. population using 2010 data estimates that a population-wide reduction in SBP of 2 mm Hg in those aged 45- 64 years would translate to 30,045 fewer cardiovascular events ([coronary heart disease], stroke, and heart failure).”
The investigators and editorialists have no disclosures.
A meta-analysis of 71 randomized controlled trials has found the sweet spot for omega-3 fatty acid intake for lowering blood pressure: between 2 and 3 g/day. The investigators also reported that people at higher risk for cardiovascular disease may benefit from higher daily intake of omega-3.
The study analyzed data from randomized controlled trials involving 4,973 individuals and published from 1987 to 2020. Most of the trials used a combined supplementation of eicosapentaenoic acid (EPA) and docosahexaenoic acid (DHA). Outcomes analysis involved the impact of combined DHA-EPA at 1, 2, 3, 4, or 5 grams daily on average changes in both systolic and diastolic BP and compared them with the placebo or control groups who had a combined intake of 0 g/day.
“We found a significant nonlinear dose-response relationship for both SBP and DBP models,” wrote senior author Xinzhi Li, MD, PhD, and colleagues. Dr. Li is program director of the school of pharmacy at Macau University of Science and Technology in Taipa, China.
Most of the trials included in the meta-analysis evaluated fish oil supplements, but a number also included EPA and DHA omega-3 fatty acids consumed in food.
When the investigators analyzed studies that used an average baseline SBP of greater than 130 mm Hg, they found that increasing omega-3 supplementation resulted in strong reductions in SBP and DBP, but not so with people with baseline SBP below 130 mm Hg.
Across the entire cohort, average SBP and DBP changes averaged –2.61 (95% confidence interval, –3.57 to –1.65) and –1.64 (95% CI, –2.29 to –0.99) mm Hg for people taking 2 g/d omega-3 supplements, and –2.61 (95% CI, –3.52 to –1.69) and –1.80 (95% CI, –2.38 to –1.23) for those on 3 g/d. The changes weren’t as robust in higher and lower intake groups overall.
However, the higher the BP, the more robust the reductions. For those with SBP greater than 130 mm Hg, 3 g/d resulted in an average change of –3.22 mm Hg (95% CI, –5.21 to –1.23). In the greater than 80 mm Hg DBP group, 3 g/d of omega-3 resulted in an average –3.81 mm Hg reduction (95% CI, –4.48 to –1.87). In patients with BP greater than 140/90 and hypertension, the reductions were even more pronounced. And in patients with BP greater than 130/80, omega-3 intake of 4-5 g/d had a greater impact than 2-3 g/d, although that benefit didn’t carry over in the greater than 140/90 group.
High cholesterol was also a factor in determining the benefits of omega-3 supplementation on BP, as Dr. Li and colleagues wrote that they found “an approximately linear relationship” between hyperlipidemia and SBP, “suggesting that increasing supplementation was associated with greater reductions in SBP.” Likewise, the study found stronger effects on BP in studies with an average patient age greater than 45 years.
In 2019, the Food and Drug Administration issued an update that consuming combined EPA and DHA may lower BP in the general population and reduce the risk of hypertension, but that “the evidence is inconsistent and inconclusive.”
“However, while our study may add a layer of credible evidence, it does not meet the threshold to make an authorized health claim for omega-3 fatty acids in compliance with FDA regulations,” Dr. Li said.
The study addresses shortcomings of previous studies of omega-3 and BP and by identifying the optimal dose, Marc George, MRCP, PhD, of the Institute of Cardiovascular Science, University College, London, and Ajay Gupta, MD, PhD, of the William Harvey Research Institute at Queen Mary University, London, wrote in an accompanying editorial. “More importantly, they have demonstrated a significantly stronger and increased BP-lowering effect in higher cardiovascular risk groups, such as those with hypertension or hyperlipidemia.”
They also noted that the 2.61–mm Hg reduction in SBP the study reported is “likely to be significant” on a population level. “A 2–mm Hg reduction in SBP is estimated to reduce stroke mortality by 10% and deaths from ischemic heart disease by 7%,” they wrote. “Expressed another way, an analysis in the U.S. population using 2010 data estimates that a population-wide reduction in SBP of 2 mm Hg in those aged 45- 64 years would translate to 30,045 fewer cardiovascular events ([coronary heart disease], stroke, and heart failure).”
The investigators and editorialists have no disclosures.
FROM THE JOURNAL OF THE AMERICAN HEART ASSOCIATION
ADA prioritizes heart failure in patients with diabetes
All U.S. patients with diabetes should undergo annual biomarker testing to allow for early diagnosis of progressive but presymptomatic heart failure, and treatment with an agent from the sodium-glucose cotransporter 2 (SGLT2) inhibitor class should expand among such patients to include everyone with stage B heart failure (“pre–heart failure”) or more advanced stages.
That’s a recommendation from an American Diabetes Association consensus report published June 1 in Diabetes Care.
The report notes that until now, “implementation of available strategies to detect asymptomatic heart failure [in patients with diabetes] has been suboptimal.” The remedy for this is that, “among individuals with diabetes, measurement of a natriuretic peptide or high-sensitivity cardiac troponin is recommended on at least a yearly basis to identify the earliest heart failure stages and to implement strategies to prevent transition to symptomatic heart failure.”
Written by a 10-member panel, chaired by Rodica Pop-Busui, MD, PhD, and endorsed by the American College of Cardiology, the document also set threshold for levels of these biomarkers that are diagnostic for a more advanced stage (stage B) of heart failure in patients with diabetes but without heart failure symptoms:
- A B-type natriuretic peptide (BNP) level of ≥50 pg/mL;
- An N-terminal pro-BNP level of ≥125 pg/mL; or
- Any high sensitivity cardiac troponin value that’s above the usual upper reference limit set at >99th percentile.
‘Inexpensive’ biomarker testing
“Addition of relatively inexpensive biomarker testing as part of the standard of care may help to refine heart failure risk prediction in individuals with diabetes,” the report says.
“Substantial data indicate the ability of these biomarkers to identify those in stage A or B [heart failure] at highest risk of progressing to symptomatic heart failure or death,” and this identification is useful because “the risk in such individuals may be lowered through targeted intervention or multidisciplinary care.”
It is “impossible to understate the importance of early recognition of heart failure” in patients with heart failure, the authors declare. However, the report also cautions that, “using biomarkers to identify and in turn reduce risk for heart failure should always be done within the context of a thoughtful clinical evaluation, supported by all information available.”
The report, written during March 2021 – March 2022, cites the high prevalence and increasing incidence of heart failure in patients with diabetes as the rationale for the new recommendations.
For a person with diabetes who receives a heart failure diagnosis, the report details several management steps, starting with an evaluation for obstructive coronary artery disease, given the strong link between diabetes and atherosclerotic cardiovascular disease.
It highlights the importance of interventions that involve nutrition, smoking avoidance, minimized alcohol intake, exercise, weight loss, and relevant social determinants of health, but focuses in greater detail on a range of pharmacologic interventions. These include treatment of hypertension for people with early-stage heart failure with an ACE inhibitor or an angiotensin receptor blocker, a thiazide-type diuretic, and a mineralocorticoid receptor antagonist, such as spironolactone or the newer, nonsteroidal agent finerenone for patients with diabetic kidney disease.
Dr. Busui of the division of metabolism, endocrinology, and diabetes at the University of Michigan, Ann Arbor, and colleagues cite recent recommendations for using guidelines-directed medical therapy to treat patients with more advanced, symptomatic stages of heart failure, including heart failure with reduced or with preserved ejection fraction.
‘Prioritize’ the SGLT2-inhibitor class
The consensus report also summarizes the roles for agents in the various classes of antidiabetes drugs now available, with particular emphasis on the role for the SGLT2-inhibitor class.
SGLT2 inhibitors “are recommended for all individuals with [diabetes and] heart failure,” it says. “This consensus recommends prioritizing the use of SGLT2 inhibitors in individuals with stage B heart failure, and that SGLT2 inhibitors be an expected element of care in all individuals with diabetes and symptomatic heart failure.”
Other agents for glycemic control that receive endorsement from the report are those in the glucagonlike peptide 1 receptor agonist class. “Despite the lack of conclusive evidence of direct heart failure risk reduction” with this class, it gets a “should be considered” designation, based on its positive effects on weight loss, blood pressure, and atherothrombotic disease.
Similar acknowledgment of potential benefit in a “should be considered” role goes to metformin. But the report turned a thumb down for both the class of dipeptidyl peptidase 4 inhibitors and the thiazolidinedione class, and said that agents from the insulin and sulfonylurea classes should be used “judiciously.”
The report did not identify any commercial funding. Several of the writing committee members listed personal commercial disclosures.
FROM DIABETES CARE
The latest on COVID-19 and the heart in children
The 2022 Pediatric Academic Societies meeting included an excellent session on the acute and delayed effects of COVID-19 on children’s hearts. Data on the risk for cardiac injury during acute COVID-19, return-to-play guidelines after COVID-19–related heart injury, and post–vaccine-associated myocarditis were reviewed.
COVID-induced cardiac injury
The risk for COVID-induced cardiac injury is directly associated with age. Recent Centers for Disease Control and Prevention data revealed a “myocarditis or pericarditis” rate in the range of 12-17 cases per 100,000 SARS-CoV-2 infections among male children aged 5-11 years (lower rates for females); the rate jumps to 50-65 cases per 100,000 infections among male children aged 12-17 years. So cardiac injury caused by acute COVID-19 appears rare, but the risk is clearly associated with male sex and adolescent age.
Return to play after COVID-19
Clinicians may be pressed by patients and parents for advice on return to play after illness with COVID-19. In July 2020, the American College of Cardiology published an algorithm that has been adjusted over time, most recently in 2022 by the American Academy of Pediatrics. These algorithms stratify recommendations by degree of illness. One rule of thumb: Patients with severe COVID-19 (ICU care or multisystem inflammatory syndrome in children [MIS-C]) have only one box on the algorithm, and that is to rest for 3-6 months and only return to usual activity after cardiac clearance. Moderate disease (defined as ≥ 4 days of fever > 100.4 °F; ≥ 1 week of myalgia, chills, lethargy, or any non-ICU hospital stay; and no evidence of MIS-C) require undergoing an ECG to look for cardiac dysfunction, followed by at least 10 days of rest if the ECG is negative or referral for cardiac evaluation if either ECG or exam by a pediatric cardiologist is abnormal.
Clinicians can perhaps be more permissible with patients who are younger or who have had less severe disease. For example, if a patient aged younger than 12 years is asymptomatic with routine activity at the time of evaluation, an ECG is not indicated. For patients aged 12-15 years who are asymptomatic at the time of evaluation but participate in a high-intensity sport, clinicians might consider obtaining an ECG. As few as 3 days of rest might be enough for select patients who are asymptomatic at presentation. For other patients, clinicians should work with parents to introduce activity gradually and make it clear to parents that any activity intolerance requires quick reevaluation. On existing athlete registries, no deaths that are attributable to post–COVID-19 cardiac effects have been confirmed in children; however, all data presented during the session were from prior to the Omicron variant surge in early 2022, so more information may be forthcoming.
Considerations for MIS-C
Among children experiencing MIS-C, 35% had ECG changes, 40% exhibited left ventricular systolic or diastolic dysfunction, and 30% had mitral regurgitation, meaning that a large percentage of patients with MIS-C show some degree of cardiac dysfunction. Unfortunately, we are still in the data-gathering phase for long-term outcomes. Functional parameters tend to improve within a week, and most patients will return to normal cardiac function by 3-4 months.
Return to play after MIS-C is quite different from that for acute COVID-19. Patients with MIS-C should be treated much like other patients with myocarditis with an expected return to play in 3-6 months and only after cardiac follow-up. Another good-to-remember recommendation is to delay COVID-19 vaccination for at least 90 days after an episode of MIS-C.
Vaccine-related myocarditis
Once again, older age appears to be a risk factor because most patients with postvaccine myocarditis have been in their mid-teens to early 20s, with events more likely after the second vaccine dose and also more likely in male children (4:1 ratio to female children). No deaths have occurred from postvaccination myocarditis in patients younger than 30 years. Still, many individuals have exhibited residual MRI enhancement in the cardiac tissue for some time after experiencing postvaccination myocarditis; it’s currently unclear whether that has clinical implications. By comparison, CDC data demonstrates convincingly that the risk for cardiac effects is much greater after acute COVID-19 than after COVID-19 vaccination, with risk ratios often higher than 20, depending on age and condition (for example, myocarditis vs. pericarditis). Data are still insufficient to determine whether clinicians should recommend or avoid COVID-19 vaccination in children with congenital heart disease.
In summary, administering COVID-19 vaccines requires a great deal of shared decision-making with parents, and the clinician’s role is to educate parents about all potential risks related to both the vaccine and COVID-19 illness. Research has consistently shown that acute COVID-19 myocarditis and myocarditis associated with MIS-C are much more likely to occur in unvaccinated youth and more likely than postvaccination myocarditis, regardless of age.
William T. Basco, Jr., MD, MS, is a professor of pediatrics at the Medical University of South Carolina, Charleston, and director of the division of general pediatrics. He is an active health services researcher and has published more than 60 manuscripts in the peer-reviewed literature.
A version of this article first appeared on Medscape.com.
LDL lowering to specific targets may offset risk from high Lp(a)
MILAN – The increased risk for atherosclerotic cardiovascular disease events caused by elevated lipoprotein(a) levels can potentially be precisely offset by lowering LDL cholesterol to specific levels, suggests a novel study that underscores the importance or early intervention.
The results, derived from an analysis of data on Lp(a) and LDL cholesterol levels and associated genetic risk scores in almost 500,000 individuals from the United Kingdom, have been used to develop a series of age-related targets for lowering LDL cholesterol levels to counter the risk associated with lifetime Lp(a) exposure.

Measuring Lp(a) levels can “substantially refine individual estimates of absolute risk of atherosclerotic cardiovascular disease,” said study presenter Brian A. Ference, MD, Centre for Naturally Randomized Trials, University of Cambridge (England).
This can “directly inform treatment decisions about the intensity of LDL lowering or other risk-factor modification needed to overcome the increased risk caused by Lp(a).”
Dr. Ference said this will allow clinicians to personalize the prevention of atherosclerotic cardiovascular disease and identify people “who may benefit from potent Lp(a)-lowering therapies when they become available.”
The research was presented at the European Atherosclerosis Society (EAS) 2022 congress on May 24.
In addition to producing a tabular version of the intensification of LDL-cholesterol reduction needed to overcome the increased cardiovascular risk at different levels of Lp(a), stratified by age, Dr. Ference is working with the EAS to develop an app to further deliver on that personalized prevention.
It will display an individual’s lifetime risk for myocardial infarction or stroke, with and without the inclusion of Lp(a) levels, and determine not only the percentage of increased risk caused by Lp(a), but also the amount by which LDL cholesterol needs to be lowered to overcome that risk.
“The whole rationale for this study was to say, how can we give practical advice on how to use Lp(a) to inform clinical decisions about how to individualize personal risk reduction,” Dr. Ference told this news organization.
“What the app will do is make it very easy for clinicians to, first, understand how much Lp(a) increases risk, but specifically how they can use that information to directly inform their treatment decisions.”
In addition, Dr. Ference said that it will “show patients why it’s important for them” to intensify LDL lowering to overcome their particular level of Lp(a).
Other key takeaways from the results is the importance of intervention as early as possible to minimize the impact of lifetime exposure to increased Lp(a), and that the reduction in LDL cholesterol required to achieve that remains relatively modest.
For Dr. Ference, this means ideally beginning comprehensive health checks at 30 years of age and starting lipid-lowering interventions immediately for those at risk.
“The good thing about LDL and other causes of atherosclerotic cardiovascular disease is it doesn’t really matter how you lower it,” he said, noting that it could be with diet, lifestyle interventions, or medication.
Handy tool
The new app could be a “handy tool to counsel patients,” Florian Kronenberg, MD, Institute of Genetic Epidemiology, Medical University of Innsbruck, Austria, told this news organization.
“We can say, look, you have high Lp(a),” he said. “This is coming from nature, from your genetics, but here we have a point where we can act on your high risk by lowering LDL further. This is important to explain to the patient,” said Dr. Kronenberg, who was not involved in the study.
He emphasized that it is crucial to get across the idea of an individual’s global risk, with not just Lp(a) or cholesterol levels influencing their likelihood of cardiovascular events, but also their age, blood pressure, smoking status, and underlying genetic risk.
Dr. Kronenberg said the current data will be helpful in explaining to clinicians why they should lower LDL-cholesterol levels when a patients had high Lp(a), again centered on the idea of lowering their global risk.
During his presentation, Dr. Ference noted that an increase in Lp(a) levels is associated with a log-linear increase in atherosclerotic cardiovascular disease that is proportional to the absolute, rather than relative, magnitude of Lp(a) increase.
“Unfortunately, unlike other proteins,” he continued, diet and exercise do not affect levels, and there are currently no effective therapies to lower the risks associated with increased Lp(a) concentrations.
“For that reason,” he said, the 2019 ESC/EAS guidelines for the management of dyslipidemias, on which Dr. Ference was a coauthor, “recommend that we intensify life risk-factor modification in persons with elevated risks.”
However, he added, “this guidance is not specific enough to be useful, and that has created a great deal of inertia among clinicians,” with some concluding that they don’t need to measure Lp(a) “because there’s nothing they can do for it.”
Until the development of novel therapies that directly target Lp(a), the authors sought to quantify the amount of LDL lowering needed to “overcome the increased risk caused by Lp(a),” he said.
They studied data on 455,765 individuals from the UK Biobank who did not have a history of cardiovascular events, diabetes, or any cancer before the age of 30. They also had LDL cholesterol levels below 5 mmol/L at the time of enrollment to exclude people with presumed familial hypercholesterolemia.
The researchers used an Lp(a) genetic risk score based on the variants rs10455872 and rs3798220 and an LDL instrumental variable genetic score comprised of 100 variants to randomly categorize individuals with average Lp(a) levels, higher Lp(a) levels, or higher Lp(a) and lower LDL-cholesterol levels.
The data showed that, with elevated absolute levels of measured Lp(a) and with elevated genetic risk scores, there was a progressive increase in the lifetime risk for major coronary events.
When looking at the combination of both increased Lp(a) levels and lower LDL-cholesterol levels, they found that the increase in risk for major coronary events at Lp(a) of 123 nmol/L could be offset by a reduction in LDL-cholesterol levels of 19.5 mg/dL.
For people with an Lp(a) level of 251 nmol/L, the increase in risk for major coronary events was offset by a reduction in LDL-cholesterol levels of 36.1 mg/dL.
Furthermore, the researchers found that the magnitude of intensification of LDL-cholesterol lowering needed to overcome the risk caused by elevated Lp(a) levels varied by age.
For example, in individuals with an Lp(a) level of 220 nmol/L, the reduction in LDL-cholesterol levels needed to offset the risk for major coronary events was calculated to be 0.8 mmol/L if lipid-lowering was started at 30 years of age, rising to 0.9 mmol/L if started at 40 years, 1.2 mmol/L if started at 50 years, and 1.5 mmol/L if started at 60 years.
This, Dr. Ference said, suggests that “diet and lifestyle modification is unlikely to be an effective strategy if started later.”
No funding was declared. Dr. Ference declared relationships with Amgen, Novartis, Merck, Esperion Therapeutics, Pfizer, Regeneron, Sanofi, AstraZeneca, Eli Lilly, Novo Nordisk, The Medicines Company, Mylan, Daiichi Sankyo, Viatris, Ionis Pharmaceuticals, dalCOR, CiVi Pharma, and KrKa Pharmaceuticals. Dr. Kronenberg declared relationships with Amgen, Novartis, and Kaneka.
A version of this article first appeared on Medscape.com.
MILAN – The increased risk for atherosclerotic cardiovascular disease events caused by elevated lipoprotein(a) levels can potentially be precisely offset by lowering LDL cholesterol to specific levels, suggests a novel study that underscores the importance or early intervention.
The results, derived from an analysis of data on Lp(a) and LDL cholesterol levels and associated genetic risk scores in almost 500,000 individuals from the United Kingdom, have been used to develop a series of age-related targets for lowering LDL cholesterol levels to counter the risk associated with lifetime Lp(a) exposure.
Measuring Lp(a) levels can “substantially refine individual estimates of absolute risk of atherosclerotic cardiovascular disease,” said study presenter Brian A. Ference, MD, Centre for Naturally Randomized Trials, University of Cambridge (England).
This can “directly inform treatment decisions about the intensity of LDL lowering or other risk-factor modification needed to overcome the increased risk caused by Lp(a).”
Dr. Ference said this will allow clinicians to personalize the prevention of atherosclerotic cardiovascular disease and identify people “who may benefit from potent Lp(a)-lowering therapies when they become available.”
The research was presented at the European Atherosclerosis Society (EAS) 2022 congress on May 24.
In addition to producing a tabular version of the intensification of LDL-cholesterol reduction needed to overcome the increased cardiovascular risk at different levels of Lp(a), stratified by age, Dr. Ference is working with the EAS to develop an app to further deliver on that personalized prevention.
It will display an individual’s lifetime risk for myocardial infarction or stroke, with and without the inclusion of Lp(a) levels, and determine not only the percentage of increased risk caused by Lp(a), but also the amount by which LDL cholesterol needs to be lowered to overcome that risk.
“The whole rationale for this study was to say, how can we give practical advice on how to use Lp(a) to inform clinical decisions about how to individualize personal risk reduction,” Dr. Ference told this news organization.
“What the app will do is make it very easy for clinicians to, first, understand how much Lp(a) increases risk, but specifically how they can use that information to directly inform their treatment decisions.”
In addition, Dr. Ference said that it will “show patients why it’s important for them” to intensify LDL lowering to overcome their particular level of Lp(a).
Other key takeaways from the results is the importance of intervention as early as possible to minimize the impact of lifetime exposure to increased Lp(a), and that the reduction in LDL cholesterol required to achieve that remains relatively modest.
For Dr. Ference, this means ideally beginning comprehensive health checks at 30 years of age and starting lipid-lowering interventions immediately for those at risk.
“The good thing about LDL and other causes of atherosclerotic cardiovascular disease is it doesn’t really matter how you lower it,” he said, noting that it could be with diet, lifestyle interventions, or medication.
Handy tool
The new app could be a “handy tool to counsel patients,” Florian Kronenberg, MD, Institute of Genetic Epidemiology, Medical University of Innsbruck, Austria, told this news organization.
“We can say, look, you have high Lp(a),” he said. “This is coming from nature, from your genetics, but here we have a point where we can act on your high risk by lowering LDL further. This is important to explain to the patient,” said Dr. Kronenberg, who was not involved in the study.
He emphasized that it is crucial to get across the idea of an individual’s global risk, with not just Lp(a) or cholesterol levels influencing their likelihood of cardiovascular events, but also their age, blood pressure, smoking status, and underlying genetic risk.
Dr. Kronenberg said the current data will be helpful in explaining to clinicians why they should lower LDL-cholesterol levels when a patients had high Lp(a), again centered on the idea of lowering their global risk.
During his presentation, Dr. Ference noted that an increase in Lp(a) levels is associated with a log-linear increase in atherosclerotic cardiovascular disease that is proportional to the absolute, rather than relative, magnitude of Lp(a) increase.
“Unfortunately, unlike other proteins,” he continued, diet and exercise do not affect levels, and there are currently no effective therapies to lower the risks associated with increased Lp(a) concentrations.
“For that reason,” he said, the 2019 ESC/EAS guidelines for the management of dyslipidemias, on which Dr. Ference was a coauthor, “recommend that we intensify life risk-factor modification in persons with elevated risks.”
However, he added, “this guidance is not specific enough to be useful, and that has created a great deal of inertia among clinicians,” with some concluding that they don’t need to measure Lp(a) “because there’s nothing they can do for it.”
Until the development of novel therapies that directly target Lp(a), the authors sought to quantify the amount of LDL lowering needed to “overcome the increased risk caused by Lp(a),” he said.
They studied data on 455,765 individuals from the UK Biobank who did not have a history of cardiovascular events, diabetes, or any cancer before the age of 30. They also had LDL cholesterol levels below 5 mmol/L at the time of enrollment to exclude people with presumed familial hypercholesterolemia.
The researchers used an Lp(a) genetic risk score based on the variants rs10455872 and rs3798220 and an LDL instrumental variable genetic score comprised of 100 variants to randomly categorize individuals with average Lp(a) levels, higher Lp(a) levels, or higher Lp(a) and lower LDL-cholesterol levels.
The data showed that, with elevated absolute levels of measured Lp(a) and with elevated genetic risk scores, there was a progressive increase in the lifetime risk for major coronary events.
When looking at the combination of both increased Lp(a) levels and lower LDL-cholesterol levels, they found that the increase in risk for major coronary events at Lp(a) of 123 nmol/L could be offset by a reduction in LDL-cholesterol levels of 19.5 mg/dL.
For people with an Lp(a) level of 251 nmol/L, the increase in risk for major coronary events was offset by a reduction in LDL-cholesterol levels of 36.1 mg/dL.
Furthermore, the researchers found that the magnitude of intensification of LDL-cholesterol lowering needed to overcome the risk caused by elevated Lp(a) levels varied by age.
For example, in individuals with an Lp(a) level of 220 nmol/L, the reduction in LDL-cholesterol levels needed to offset the risk for major coronary events was calculated to be 0.8 mmol/L if lipid-lowering was started at 30 years of age, rising to 0.9 mmol/L if started at 40 years, 1.2 mmol/L if started at 50 years, and 1.5 mmol/L if started at 60 years.
This, Dr. Ference said, suggests that “diet and lifestyle modification is unlikely to be an effective strategy if started later.”
No funding was declared. Dr. Ference declared relationships with Amgen, Novartis, Merck, Esperion Therapeutics, Pfizer, Regeneron, Sanofi, AstraZeneca, Eli Lilly, Novo Nordisk, The Medicines Company, Mylan, Daiichi Sankyo, Viatris, Ionis Pharmaceuticals, dalCOR, CiVi Pharma, and KrKa Pharmaceuticals. Dr. Kronenberg declared relationships with Amgen, Novartis, and Kaneka.
A version of this article first appeared on Medscape.com.
AT EAS 2022
Time-restricted eating may reduce CVD risk after breast cancer
, a single-group feasibility study suggests.
The results show a 15% relative decline in cardiovascular risk, measured using the Framingham Risk Score, among at-risk breast cancer survivors (BCS) after only 8 weeks of following a time-restricted eating regimen, reported Amy A. Kirkham, PhD, assistant professor of kinesiology and physical education, University of Toronto, and colleagues.
“Time-restricted eating also significantly decreased visceral adipose tissue (VAT), which our team has previously found to accumulate rapidly with cardiotoxic treatment and predict later cardiac events among BCS,” the researchers add.
The findings were published online in the Journal of the American College of Cardiology: Cardiac Onco.
Physical activity is one of the main modalities for lowering cardiovascular risk, but it is not feasible for everyone because of physical limitations and other factors, noted Dr. Kirkham.
“I became interested in time-restricted eating when I came across the literature, which has really exploded in the last 5 years, showing that it can reduce the number of cardiovascular risk factors,” she said in an interview.
“However, most of these populations studied have had cardiometabolic conditions, like obesity, type 2 diabetes, prediabetes, and metabolic syndrome, and no one has looked at this” in either the population specifically at high risk for cardiovascular disease or in patients with overt cardiovascular disease, she said.
This approach is easy for patients to follow and is much simpler than many of the other dietary patterns, noted Dr. Kirkham. “It simply consists of having a start time or end time to your eating, so it is easy to prescribe,” she said. “You can see how that is much easier for a doctor to explain to a patient than trying to explain how to meet the physical activity guidelines each week.”
“This particular study definitely shows that time-restricted eating can decrease the calorie intake, and I think by decreasing the calorie intake you definitely would improve the body weight, which has numerous benefits irrespective of how we arrive at the end goal which is including the cardiovascular risk factors,” said Ajay Vallakati, MBBS, physician and clinical assistant professor of internal medicine, the Ohio State University, Columbus, commenting on the study.
“I think time-restricted eating is a tool we should look at, and a bigger study would help us to recommend this for our patients,” Dr. Vallakati told this news organization.
The study involved 22 participants. Mean age was 66 years. Mean body mass index was 31 ± 5 kg/m². In the cohort, 91% of participants were taking aromatase inhibitors and tamoxifen at the time of the study, and 50% underwent left-sided radiation.
The study group included breast cancer survivors who had risk factors for cardiovascular disease mortality, including completion of cardiotoxic therapy, like anthracyclines, within 1-6 years, obesity/overweight, and older age, defined as 60 years of age or older.
Participants were allowed to eat freely between 12 PM and 8 PM on weekdays and any time during weekends. Outside of the allotted hours, they could only drink black coffee, water, or black tea for the 8-week study period. They were not under any other physical activity or dietary restrictions.
All were provided with behavioral support, such as check-in phone calls with the research team at 1-, 3-, and 6-week follow-up and pre-interventional calls from a registered dietitian. During weekdays, they also received automated text messages twice a day asking what time they started and stopped eating.
Irritability and headaches were among the transient, minor symptoms reported, the researchers say. The study group responded to nearly all of the text messages that they received from the researchers. The participants also followed through with the fast for a median 98% of the prescribed days by fasting for 16 or more hours.
The results showed that after 8 weeks, median Framingham cardiovascular risk declined from 10.9% to 8.6%, a 15% relative reduction (P = .037). Modifiable aspects of Framingham, such as systolic blood pressure, total cholesterol, and high-density lipoprotein, remained relatively consistent overall, however, suggesting variation between individuals in the etiology of the risk decline.
Caloric intake fell by a median of 450 kcal, representing a relative reduction of about 22% (P < .001), they note.
The findings also showed a decline in median derived whole-body fat mass (–0.9 kg; P = .046), body mass (–1.0 kg; P = .025), and mean MRI-derived VAT (–5%; P = .009).
Other data showed that the average BMI remained the same (P = .10).
At the beginning of the study, 68% of the cohort was considered cardiometabolically unhealthy, given the benchmarks for pharmacologic preventive therapy of cardiovascular risk or metabolic syndrome based on Canadian Cardiovascular Society recommendations.
Notably, 53% of the cohort was no longer classified as meeting the criteria for metabolic syndrome or for the therapeutic treatment of cardiovascular risk after the intervention.
The study’s limitations include its short duration, selection bias, and that it did not involve a control group, the researchers acknowledge.
“Randomized controlled trials are needed to confirm these findings and to evaluate the health benefits, including potential health care cost savings and safety of longer-term time-restricted eating,” the researchers conclude.
Dr. Vallakati and Dr. Kirkham report no relevant conflicts of interest.
A version of this article first appeared on Medscape.com.
FROM THE JOURNAL OF THE AMERICAN COLLEGE OF CARDIOLOGY: CARDIAC ONCO