User login
Standardizing the Use of Mental Health Screening Instruments in Patients With Pain (FULL)
Chronic pain is more prevalent in the US than diabetes mellitus, cancer, and cardiovascular disease combined, impacting about 100 million adults.1 The annual cost of all that pain in the US is between $560 and $635 billion.1
The high prevalence of chronic pain among active duty service members and veterans remains a pressing concern given its negative impact on military readiness, health care utilization, productivity, quality of life, and chronic disability rates.2 Pain was found to be the leading complaint of service members returning from Operations Iraqi Freedom and Enduring Freedomand 44% of veterans returning from deployment suffered with chronic pain.3,4
Chronic pain often occurs in the presence of comorbidities. In one study for example, 45% of primary care patients with chronic pain (N = 250) screened positive for ≥ 1 of the 5 types of common anxiety disorders, and those with anxiety disorder had higher pain scores.5 Another study involving almost 6000 participants found that anxiety disorders were present in 35% of people with chronic pain compared with 18% in the general population.6
In addition, military members are prone to depression with a rate of major depressive disorder that is 5% higher than that of civilians.7 Depression often is underdiagnosed and undertreated. According to a National Center for Health Statistics, only 35% of those with symptoms of severe depression in the US saw a mental health provider in the previous year.8 Comorbid depression, anxiety, and chronic pain are strongly associated with more severe pain, greater disability, and poorer health-related quality of life.9
As a result, there was a call for system-level interventions to increase access to, and continuity of, mental health care services for active duty service members and veterans.1 It has been recommended that depression and anxiety screenings take place in primary and secondary care clinics.10 Standardized referral processes also are needed to enhance mental health diagnosis and referral techniques.11 Although various screening tools are available that have excellent reliability and construct validity (eg, General Anxiety Disorder-7 [GAD-7], Patient Health Questionnaire-9 [PHQ-9]), they are underutilized.12 I have witnessed a noticeable gap between clinical practice guidelines and current practice associated with chronic pain and screening for anxiety and depression within the Pain Management Clinic at Navy Medical Center of Camp Lejeune (NMCCL) in North Carolina.
Methods
The premise of this performance improvement (PI) project was to reduce missed opportunities of screening for anxiety and depression, and to examine the impact of the standardized use of the GAD-7 and PHQ-9 on the rate of mental health care referrals. The Theory of Unpleasant Symptoms was chosen as the underpinning of the project because it suggests that symptoms often cluster, and that the occurrence of multiple symptoms makes each of those, as well as other symptoms, worse.13 The PI model used the find, organize, clarify, understand, select (FOCUS), and plan, do, check, act (PDCA) models.14 The facility institutional review board ruled that this performance improvement project did not qualify as human research.
Inclusion and exclusion criteria
Patients were included if they were active duty service members aged 18 to 56 years at the initial patient encounter. Veterans and dependents were not part of the sample because of the high clinic volume. Patients who received mental health care services within the previous 90 days were excluded.
Registered nurses, licensed practical nurses, US Navy corpsman, medical assistants, and nurse aides were educated on the purpose of the GAD-7 and PHQ-9 and were instructed to have patients complete them upon every new patient encounter. A retrospective chart review was conducted over a 6-week time frame to collect and analyze de-identified demographic data including age, gender, prior deployment (yes or no), and branch of service. The review also examined whether the patient had received mental health care services, whether the screening instruments were completed, and whether a mental health referral was made. The clinic providers were asked to consider mental health care referrals for patients who scored ≥ 10 on either the GAD-7 or PHQ-9. The frequency of the use of the instruments and the number of mental health referrals made was calculated during the 3-week period before and after the standardized use of the instruments. The author conducted audits of the new patient charts at the end of each work day to assess whether the GAD-7 and PHQ-9 were completed.
Results
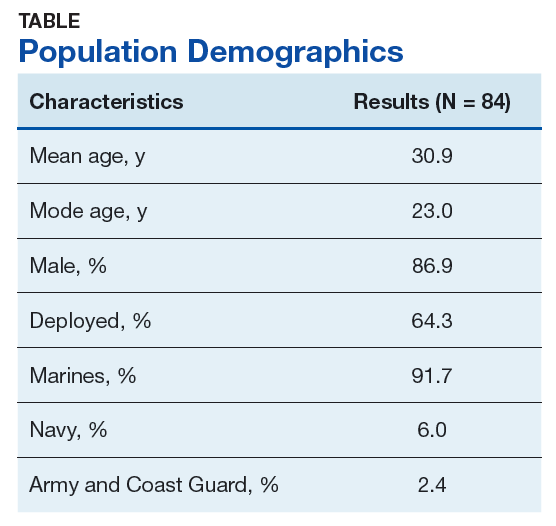
There were 117 new patient encounters during the 6-week project period. Thirty-three patients were excluded from the sample, leaving a remaining sample of 84. Thirty-two patients were included in the sample prior to the standardized use of the instruments, and 52 were included afterward (Table).
Prior to the standardized use of the screening tools, the GAD-7 was used during 75% of patient visits for pain and the PHQ-9 was used during 25%, reinforcing the premise of unpredictable utilization of the screening tools. Three mental health referrals were made during the 3-week period prior to the standardized use of the anxiety and depression instruments (3/32, 10%). After the standardized implementation of the GAD-7 and PHQ-9 tools, both instruments were used 98% of the time, and mental health referrals were made for 12 of 52 patients (23.1%). Eleven of the referrals were made based upon the trigger score of 10 on either the GAD-7 or PHQ-9. One referral was made for a patient with a score of 9 on the PHQ-9 because the provider determined a need for pain-related psychological services.
It was important to provide a link to mental health care because, as one study found, patients with a specific anxiety diagnosis are much more likely than those diagnosed with a not otherwise specified anxiety disorder to receive mental health care services (60% to 67% vs 37%).11 Similarly, patients diagnosed in specialty mental health care settings are more likely to receive mental health services than are those diagnosed in primary care.11 By the same token, experts estimate that 50% of those with severe depression symptoms are not properly diagnosed or treated in primary care.15
Strengths and Limitations
Utilization of the screening tools has led to further dialogue between patients and providers that anecdotally revealed suicidal ideation in some patients. Future studies could incorporate a qualitative component to include clinician and patient perceptions of mental health care services.
The study was limited by the lack of follow-up data to determine the effect of mental health care services on pain, function, or military readiness. Also, it is unclear whether education alone impacted the referral rate.
The author shared the outcomes of this PI project with fellow professionals at NMCCL. As a team, we explored ways for military to link with mental health care within their commands. The process of using these instruments is easily transferable to other clinics with no extraordinary cost.
Conclusion
The economic burden of major depressive disorder in the US has risen 21.5% from 2005 to 2010.16 Unfortunately, only 35% of those with symptoms of severe depression had contact with a mental health professional in the past year.8 Avoiding missing opportunities to screen for mental health conditions can decrease the disease burden. The GAD-7 and PHQ-9 are relatively cost free and are deemed reliable and valid for screening for, and determining the severity of, symptoms of anxiety and depression.12 The evidence suggests that screening for, and early recognition of, mental illness, are critical parts of evidence-based practice and provide the most cost-effective care.16
This PI project demonstrated that the standardized use of the GAD-7 and PHQ-9 during patient visits for pain did improve adherence to guidelines and resulted in a significant increase in the rate of mental health referrals from 10% to 23.1%. This information is valuable because a score of ≥ 10 on either screening instrument is considered the optimal cutoff for diagnosing and determining severity of anxiety and depression symptoms.12 The US Department of Veterans Affairs (VA) and the US Department of Defense (DoD) have jointly developed clinical practice guidelines, which recommend that interventions, such as behavioral therapies or first-line pharmacologic treatment, be offered to patients with mild to moderate symptoms of depression.17 The VA/DoD guidelines for low back pain suggest screening for mental health disorders.2 For these reasons, the standardized use of the screening instruments remains in place within the pain management clinic at NMCCL.
1. Board on Health Sciences Policy. Relieving Pain in America: A Blueprint for Transforming Prevention, Care, Education, and Research. The National Academies Press: Washington, DC; 2011.
2. US Department of Defense, US Department of Veterans Affairs. VA/DoD clinical practice guidelines for diagnosis and treatment of low back pain. https://www.healthquality.va.gov/guidelines/Pain/lbp/VADoDLBPCPG092917.pdf. Published October 21, 2016. Accessed September 26, 2019.
3. Gironda RJ, Clark ME, Massengale JP, Walker RL. Pain among veterans of Operations Enduring Freedom and Iraqi Freedom. Pain Med. 2006;7(4):339-343.
4. Arlotta CJ. New recommendations for pain management among active duty service military and veterans. Forbes. February 13, 2015. https://www.forbes.com/sites/cjarlotta/2015/02/13/managing-chronic-pain-in-the-active-military-and-veteran-populations/#7d7dd7d93fc3. Accessed September 26, 2019.
5. Kroenke K, Outcalt S, Krebs E, et al. Association between anxiety, health-related quality of life and functional impairment in primry care patients with chronic pain. Gen Hosp Psychiatry. 2013;35(4):359-365.
6. McWilliams LA, Cox BJ, Enns MW. Mood and anxiety disorders associated with chronic pain: an examination in a nationally representative sample. Pain. 2003;106(1-2):127-133.
7. Lazar SG. The mental health needs of active duty service members and veterans. Psychodynamic Psychiatry. 2014;42(3):459-478.
8. Pratt LA, Brody DJ. Depression in the U.S. household population, 2009-2012. NCHS Data Brief No. 172. https://www.cdc.gov/nchs/data/databriefs/db172.pdf. Published December 2014. Accessed September 26, 2019.
9. Bair MJ, Wu J, Damush TM, Sutherland JM, Kroenke K. Association of depression and anxiety alone and in combination with chronic musculoskeletal pain in primary care patients. Psychosom Med. 2008;70(8):890-897.
10. National Institute for Clinical Health and Care Excellence. Common mental health problems: identification and pathways to care. https://www.nice.org.uk/guidance/CG123/chapter/1-Guidance#step-1-identification-and-assessment. Published May 2011. Accessed September 26, 2019.
11. Barrera TL, Mott JM, Hundt NE, et al. Diagnostic specificity and mental health service utilization among veterans with newly diagnosed anxiety disorders. Gen Hosp Psychiatry. 2014;36(2):192-198.
12. Kroenke K, Spitzer RL, Williams JBW, Lowe B. The patient health questionnaire somatic, anxiety, and depressive symptom scales: a systematic review. Gen Hosp Psychiatry. 2010;32(4):345-359.
13. Smith MJ, Liehr PR. The Theory of Unpleasant Symptoms. Middle Range Theory for Nursing. New York, NY: Springer Publishing Company, 2014:165-195.
14. Substance Abuse and Mental Health Services Administration, Health Resources and Services Administration. FOCUS PDCA: plan-do-check-act. https://www.integration.samhsa.gov/pbhci-learning-community/Cross-site_TA_slides_-_FOCUSPDCA_Final.pdf. Published September 19, 2017. Accessed September 26, 2019.
15. Bridges KW, Goldberg DP. Somatic presentation of DSM III psychiatric disorders in primary care. J Psychosom Res. 1985;29(6):563-569.
16. Greenberg PE, Fournier AA, Sisitsky T, Pike CT, Kessler RC. The economic burden of adults with major depressive disorder in the United States (2005 and 2010). J Clin Psychiatry. 2015;76(2):155-162.
17. US Department of Defense, US Department of Veterans Affairs. VA/DoD clinical practice guidelines. Management of major depressive disorder (MDD) https://www.healthquality.va.gov/guidelines/MH/mdd/. Updated October 12, 2017. Accessed September 26, 2019.
Chronic pain is more prevalent in the US than diabetes mellitus, cancer, and cardiovascular disease combined, impacting about 100 million adults.1 The annual cost of all that pain in the US is between $560 and $635 billion.1
The high prevalence of chronic pain among active duty service members and veterans remains a pressing concern given its negative impact on military readiness, health care utilization, productivity, quality of life, and chronic disability rates.2 Pain was found to be the leading complaint of service members returning from Operations Iraqi Freedom and Enduring Freedomand 44% of veterans returning from deployment suffered with chronic pain.3,4
Chronic pain often occurs in the presence of comorbidities. In one study for example, 45% of primary care patients with chronic pain (N = 250) screened positive for ≥ 1 of the 5 types of common anxiety disorders, and those with anxiety disorder had higher pain scores.5 Another study involving almost 6000 participants found that anxiety disorders were present in 35% of people with chronic pain compared with 18% in the general population.6
In addition, military members are prone to depression with a rate of major depressive disorder that is 5% higher than that of civilians.7 Depression often is underdiagnosed and undertreated. According to a National Center for Health Statistics, only 35% of those with symptoms of severe depression in the US saw a mental health provider in the previous year.8 Comorbid depression, anxiety, and chronic pain are strongly associated with more severe pain, greater disability, and poorer health-related quality of life.9
As a result, there was a call for system-level interventions to increase access to, and continuity of, mental health care services for active duty service members and veterans.1 It has been recommended that depression and anxiety screenings take place in primary and secondary care clinics.10 Standardized referral processes also are needed to enhance mental health diagnosis and referral techniques.11 Although various screening tools are available that have excellent reliability and construct validity (eg, General Anxiety Disorder-7 [GAD-7], Patient Health Questionnaire-9 [PHQ-9]), they are underutilized.12 I have witnessed a noticeable gap between clinical practice guidelines and current practice associated with chronic pain and screening for anxiety and depression within the Pain Management Clinic at Navy Medical Center of Camp Lejeune (NMCCL) in North Carolina.
Methods
The premise of this performance improvement (PI) project was to reduce missed opportunities of screening for anxiety and depression, and to examine the impact of the standardized use of the GAD-7 and PHQ-9 on the rate of mental health care referrals. The Theory of Unpleasant Symptoms was chosen as the underpinning of the project because it suggests that symptoms often cluster, and that the occurrence of multiple symptoms makes each of those, as well as other symptoms, worse.13 The PI model used the find, organize, clarify, understand, select (FOCUS), and plan, do, check, act (PDCA) models.14 The facility institutional review board ruled that this performance improvement project did not qualify as human research.
Inclusion and exclusion criteria
Patients were included if they were active duty service members aged 18 to 56 years at the initial patient encounter. Veterans and dependents were not part of the sample because of the high clinic volume. Patients who received mental health care services within the previous 90 days were excluded.
Registered nurses, licensed practical nurses, US Navy corpsman, medical assistants, and nurse aides were educated on the purpose of the GAD-7 and PHQ-9 and were instructed to have patients complete them upon every new patient encounter. A retrospective chart review was conducted over a 6-week time frame to collect and analyze de-identified demographic data including age, gender, prior deployment (yes or no), and branch of service. The review also examined whether the patient had received mental health care services, whether the screening instruments were completed, and whether a mental health referral was made. The clinic providers were asked to consider mental health care referrals for patients who scored ≥ 10 on either the GAD-7 or PHQ-9. The frequency of the use of the instruments and the number of mental health referrals made was calculated during the 3-week period before and after the standardized use of the instruments. The author conducted audits of the new patient charts at the end of each work day to assess whether the GAD-7 and PHQ-9 were completed.
Results
There were 117 new patient encounters during the 6-week project period. Thirty-three patients were excluded from the sample, leaving a remaining sample of 84. Thirty-two patients were included in the sample prior to the standardized use of the instruments, and 52 were included afterward (Table).
Prior to the standardized use of the screening tools, the GAD-7 was used during 75% of patient visits for pain and the PHQ-9 was used during 25%, reinforcing the premise of unpredictable utilization of the screening tools. Three mental health referrals were made during the 3-week period prior to the standardized use of the anxiety and depression instruments (3/32, 10%). After the standardized implementation of the GAD-7 and PHQ-9 tools, both instruments were used 98% of the time, and mental health referrals were made for 12 of 52 patients (23.1%). Eleven of the referrals were made based upon the trigger score of 10 on either the GAD-7 or PHQ-9. One referral was made for a patient with a score of 9 on the PHQ-9 because the provider determined a need for pain-related psychological services.
It was important to provide a link to mental health care because, as one study found, patients with a specific anxiety diagnosis are much more likely than those diagnosed with a not otherwise specified anxiety disorder to receive mental health care services (60% to 67% vs 37%).11 Similarly, patients diagnosed in specialty mental health care settings are more likely to receive mental health services than are those diagnosed in primary care.11 By the same token, experts estimate that 50% of those with severe depression symptoms are not properly diagnosed or treated in primary care.15
Strengths and Limitations
Utilization of the screening tools has led to further dialogue between patients and providers that anecdotally revealed suicidal ideation in some patients. Future studies could incorporate a qualitative component to include clinician and patient perceptions of mental health care services.
The study was limited by the lack of follow-up data to determine the effect of mental health care services on pain, function, or military readiness. Also, it is unclear whether education alone impacted the referral rate.
The author shared the outcomes of this PI project with fellow professionals at NMCCL. As a team, we explored ways for military to link with mental health care within their commands. The process of using these instruments is easily transferable to other clinics with no extraordinary cost.
Conclusion
The economic burden of major depressive disorder in the US has risen 21.5% from 2005 to 2010.16 Unfortunately, only 35% of those with symptoms of severe depression had contact with a mental health professional in the past year.8 Avoiding missing opportunities to screen for mental health conditions can decrease the disease burden. The GAD-7 and PHQ-9 are relatively cost free and are deemed reliable and valid for screening for, and determining the severity of, symptoms of anxiety and depression.12 The evidence suggests that screening for, and early recognition of, mental illness, are critical parts of evidence-based practice and provide the most cost-effective care.16
This PI project demonstrated that the standardized use of the GAD-7 and PHQ-9 during patient visits for pain did improve adherence to guidelines and resulted in a significant increase in the rate of mental health referrals from 10% to 23.1%. This information is valuable because a score of ≥ 10 on either screening instrument is considered the optimal cutoff for diagnosing and determining severity of anxiety and depression symptoms.12 The US Department of Veterans Affairs (VA) and the US Department of Defense (DoD) have jointly developed clinical practice guidelines, which recommend that interventions, such as behavioral therapies or first-line pharmacologic treatment, be offered to patients with mild to moderate symptoms of depression.17 The VA/DoD guidelines for low back pain suggest screening for mental health disorders.2 For these reasons, the standardized use of the screening instruments remains in place within the pain management clinic at NMCCL.
1. Board on Health Sciences Policy. Relieving Pain in America: A Blueprint for Transforming Prevention, Care, Education, and Research. The National Academies Press: Washington, DC; 2011.
2. US Department of Defense, US Department of Veterans Affairs. VA/DoD clinical practice guidelines for diagnosis and treatment of low back pain. https://www.healthquality.va.gov/guidelines/Pain/lbp/VADoDLBPCPG092917.pdf. Published October 21, 2016. Accessed September 26, 2019.
3. Gironda RJ, Clark ME, Massengale JP, Walker RL. Pain among veterans of Operations Enduring Freedom and Iraqi Freedom. Pain Med. 2006;7(4):339-343.
4. Arlotta CJ. New recommendations for pain management among active duty service military and veterans. Forbes. February 13, 2015. https://www.forbes.com/sites/cjarlotta/2015/02/13/managing-chronic-pain-in-the-active-military-and-veteran-populations/#7d7dd7d93fc3. Accessed September 26, 2019.
5. Kroenke K, Outcalt S, Krebs E, et al. Association between anxiety, health-related quality of life and functional impairment in primry care patients with chronic pain. Gen Hosp Psychiatry. 2013;35(4):359-365.
6. McWilliams LA, Cox BJ, Enns MW. Mood and anxiety disorders associated with chronic pain: an examination in a nationally representative sample. Pain. 2003;106(1-2):127-133.
7. Lazar SG. The mental health needs of active duty service members and veterans. Psychodynamic Psychiatry. 2014;42(3):459-478.
8. Pratt LA, Brody DJ. Depression in the U.S. household population, 2009-2012. NCHS Data Brief No. 172. https://www.cdc.gov/nchs/data/databriefs/db172.pdf. Published December 2014. Accessed September 26, 2019.
9. Bair MJ, Wu J, Damush TM, Sutherland JM, Kroenke K. Association of depression and anxiety alone and in combination with chronic musculoskeletal pain in primary care patients. Psychosom Med. 2008;70(8):890-897.
10. National Institute for Clinical Health and Care Excellence. Common mental health problems: identification and pathways to care. https://www.nice.org.uk/guidance/CG123/chapter/1-Guidance#step-1-identification-and-assessment. Published May 2011. Accessed September 26, 2019.
11. Barrera TL, Mott JM, Hundt NE, et al. Diagnostic specificity and mental health service utilization among veterans with newly diagnosed anxiety disorders. Gen Hosp Psychiatry. 2014;36(2):192-198.
12. Kroenke K, Spitzer RL, Williams JBW, Lowe B. The patient health questionnaire somatic, anxiety, and depressive symptom scales: a systematic review. Gen Hosp Psychiatry. 2010;32(4):345-359.
13. Smith MJ, Liehr PR. The Theory of Unpleasant Symptoms. Middle Range Theory for Nursing. New York, NY: Springer Publishing Company, 2014:165-195.
14. Substance Abuse and Mental Health Services Administration, Health Resources and Services Administration. FOCUS PDCA: plan-do-check-act. https://www.integration.samhsa.gov/pbhci-learning-community/Cross-site_TA_slides_-_FOCUSPDCA_Final.pdf. Published September 19, 2017. Accessed September 26, 2019.
15. Bridges KW, Goldberg DP. Somatic presentation of DSM III psychiatric disorders in primary care. J Psychosom Res. 1985;29(6):563-569.
16. Greenberg PE, Fournier AA, Sisitsky T, Pike CT, Kessler RC. The economic burden of adults with major depressive disorder in the United States (2005 and 2010). J Clin Psychiatry. 2015;76(2):155-162.
17. US Department of Defense, US Department of Veterans Affairs. VA/DoD clinical practice guidelines. Management of major depressive disorder (MDD) https://www.healthquality.va.gov/guidelines/MH/mdd/. Updated October 12, 2017. Accessed September 26, 2019.
Assessing Refill Data Among Different Classes of Antidepressants (FULL)
Depression affects about 4.4% of the global population.1 Major depressive disorder (MDD) is currently the fourth highest cause of disability in the world and by 2030 MDD is expected to be third.2 Research has determined that 1 in 3 veterans seen in primary care shows depressive symptoms. Of these, 1 in 5 have symptoms severe enough to warrant further evaluation for MDD, and 1 in 10 require treatment.3 With this high rate of depression, optimized treatment strategies are needed, including antidepressants and psychotherapy. Antidepressants have grown in popularity since market entry in the 1950s; currently 1 in 10 US citizens aged ≥ 12 years are prescribed an antidepressant.4
Antidepressant Adherence
Antidepressant adherence is crucial for response and remission. Sansone and Sansone reported that, on average, < 50% of patients are adherent to their antidepressant treatment regimen 6 months after initiation (range, 5.4% - 87.6%).5 Fortney and colleagues found that, based on patient report, < 20% of veterans maintained at least 80% adherence at 6 months.6 Patients who are nonadherent are at an increased risk for relapse and recurrence and are more likely to seek care at an emergency department or to become hospitalized.2 In addition to the negative impact on patient outcomes, antidepressant nonadherence may also result in increased economic burden. In the US alone, the annual cost of treating MDD exceeds $210 billion, which will continue to increase if nonadherence is not mitigated.1
Patient-specific characteristics such as lack of knowledge about proper administration techniques, misguided beliefs, and negative attitudes towards treatment may affect adherence.5 In the veteran population, reasons for discontinuation also include lack of perceived benefit and adverse effects, specifically sexual difficulties.6 Sociodemographic and other patient characteristics also may be risk factors for nonadherence, including multiple medical comorbidities; substance use disorder (SUD) diagnosis; male gender; younger age; lack of health insurance or a higher medical cost burden; lack of or low involvement in psychotherapy; infrequent follow up visits; and high illness severity.1,7,8
Appreciating the adherence rates among the different antidepressant classes may help in antidepressant selection. To our knowledge, there have been no prior studies conducted in the veteran population that compared adherence rates among antidepressant classes. Studies in the nonveteran population report differing adherence rates among the antidepressant classes with generally higher adherence in patients prescribed serotonin norepinephrine reuptake inhibitors (SNRIs) and selective serotonin reuptake inhibitors (SSRIs). A retrospective review of commercial, Medicare, and Medicaid claims in > 5000 patients found that SNRIs had a significantly higher 3-month adherence rate based on the portion of days covered model (47%; P < .001) than other antidepressant classes (SSRIs, 42%; other antidepressants, 37%; tricyclic antidepressants [TCAs], 24%).7 Monoamine oxidase inhibitors (MAOIs) prescribed to 1% of the study population had the highest adherence rate at 48%.7 A study reviewing > 25 000 patient claims sourced from the IBM MarketScan research database (Armonk, NY) found that SSRIs (Odds ratio [OR], 1.26; P < .001) and norepinephrine dopamine reuptake inhibitors (NDRIs) (OR, 1.23; P = .007) had the highest ORs for adherence according to the portion of days covered model, while other serotonin modulators (OR, 0.65; P = .001) and tri/tetracyclic antidepressants (OR, 0.49; P < . 001) had the lowest ORs and were associated with lower adherence.1
VA Approaches to Adherence
To address antidepressant adherence, the US Department of Veteran Affairs (VA) adopted 2 measures from the Healthcare Effectiveness Data and Information Set: MDD43h and MDD47h. Measure MDD43h is defined as the proportion of patients with a depression diagnosis newly treated with an antidepressant medication who remained on the antidepressant medication for at least 84 out of 114 days (3 months). MDD47h is similar, but assesses patients remaining on an antidepressant medication for at least 180 out of 230 days (6 months).9 These constitute a SAIL (Strategic Analytics for Improvement and Learning) measure by which VA hospitals are compared. High performance on these measures aids in improving the comparative status of a VA facility.
To help improve performance on these measures, the VA Psychotropic Drug Safety Initiative developed the Antidepressant Nonadherence Report, which serves as a case finder for clinicians to identify veterans with low adherence and/or those overdue for a refill. The dashboard uses the medication possession ratio (MPR) to calculate adherence. While the optimal value is still widely debated, an MPR of ≥ 80% is generally accepted for many disease states.10 The dashboard defines low adherence as ≤ 60%.
As of September 2018, the Antidepressant Nonadherence Report for the Michael E. DeBakey VA Medical Center (MEDVAMC) in Houston, Texas, included > 5000 patients in both MEDVAMC and associated community-based outpatient clinics. About 30% of patients were categorized as overdue for a refill.
Study Objectives
To better understand the problem of antidepressant adherence within this population, we decided to study the relationship between antidepressant class and adherence rates, as well as how adherence relates to patient-specific characteristics. By highlighting predisposing risk factors to low adherence, we hope to provide better interventions.
The primary objective of this study was to determine whether 3-month adherence rates, measured by the MPR, differ between antidepressant classes in veterans newly initiated on antidepressant therapy. A secondary objective was to identify whether there are differences in patient characteristics between those with high MPR (≥ 80%) and low MPR (≤ 60%).
Methods
This study used a retrospective, cross-sectional chart review of MEDVAMC patients from the Antidepressant Nonadherence Report. Patients were: aged ≥ 18 years; newly initiated on an antidepressant with no previous use of the same medication; outpatient for the entire study period; and seen by a physician, physician assistant, nurse practitioner, or pharmacist mental health provider (MHP) within the 3-month study period. All patients’ charts showed a depression diagnosis—an inclusion criterion for the MDD43h and MDD47h measures. However, for this study, the indication(s) for the chosen antidepressant were determined by the MHP note in the patient electronic health record on the date that the medication was prescribed. Study patients may not have had a current depression diagnosis based upon the MHP assessment on the index date. We chose to determine the antidepressant indication(s) in this way because the MHP note would have the most detailed patient assessment.
Patients with previous use of the prescribed antidepressant were excluded because previous exposure may bias the patient and affect current adherence. Patients who were hospitalized at the VA for any reason during the 3-month study period were excluded because of a known risk during transitions of care for medications to be held or discontinued, which could impact refills and MPR. Some patients were excluded if they were taking the antidepressant for a nonmood-related indication (insomnia, neuropathy, migraine prophylaxis, etc). Patients also were excluded if the antidepressant was prescribed to take as-needed; if trazodone was the only antidepressant prescribed; if they were diagnosed with cognitive impairment including dementia or history of stroke; or if they were diagnosed with schizophrenia, schizoaffective disorder, or borderline personality disorder. Use of trazodone as the only antidepressant was excluded because of the relatively common practice to use it in the treatment of insomnia rather than depression.
Primary and Secondary Outcomes
Information collected for the primary outcome, including antidepressant class and MPR, was obtained from the Antidepressant Nonadherence Report. For the secondary outcome, the following data was collected for each patient: age, gender, race, housing status, Medication Regimen Complexity Index (MRCI), number and type of psychiatric diagnoses, number of previous antidepressants, psychotherapy involvement, and number of mental health visits during the 3-month study period. The MRCI is an objective, validated tool that determines relative medication regimen complexity by taking into consideration the number of medications, route and frequency of administration, splitting/multiple dosage units, and presence of any special instructions.11
The primary outcome was tested using a one-way analysis of variance (ANOVA). Nominal secondary outcomes were analyzed using the Fisher’s Exact. Continuous secondary outcomes were examined using an unpaired t-test.
Results
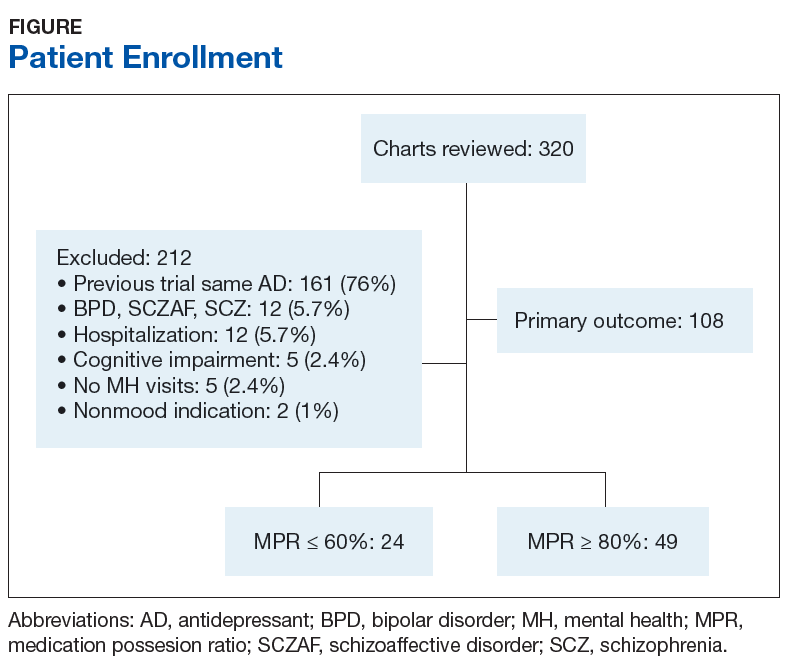
Of 320 charts, 212 patients were excluded and 108 were included (Figure). The most common reason for exclusion was a previously prescribed antidepressant. Of the included patients 49 had an MPR ≥ 80% and 24 had an MPR ≤ 60%. The characteristics of the study population are found in Table 1 and the antidepressant frequencies and MPRs are included in Table 2.
About 87% of study patients had a diagnosis of depression. Other concomitant psychiatric diagnoses include posttraumatic stress disorder (PTSD), anxiety, insomnia, and 2 cases of intermittent explosive disorder. There were no significant differences in mean MPR between the antidepressant classes (P = .31). Within each drug class, we identified the proportion of patients with high adherence (MPR ≥ 80%). Bupropion had the greatest percentage of highly adherent patients (50%) compared with SSRIs (42.5%), SNRIs (38.5%), and mirtazapine (31.3%).
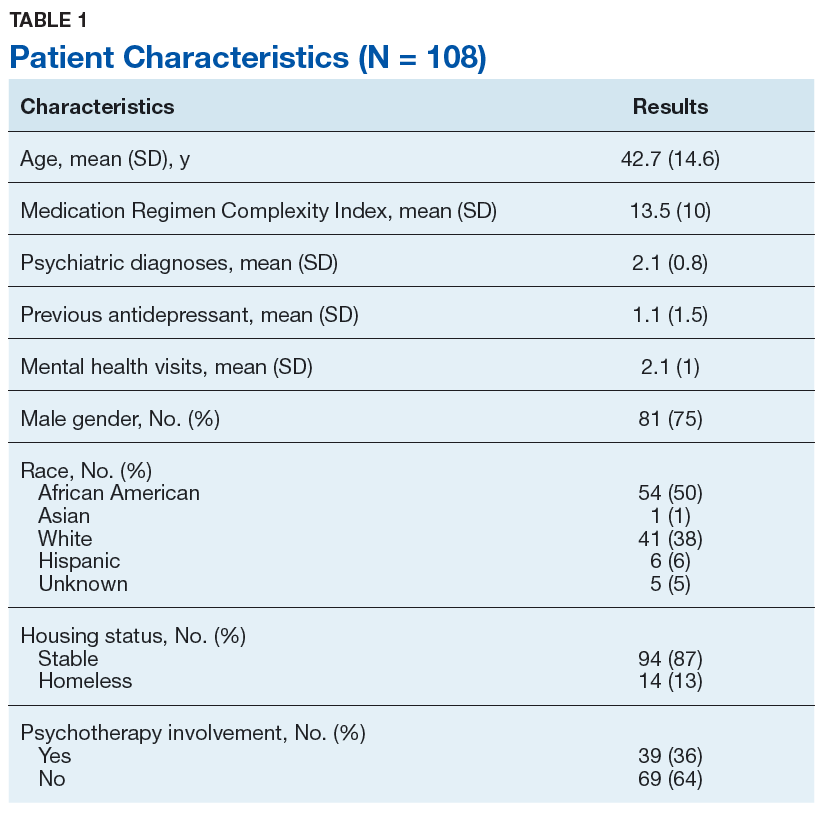
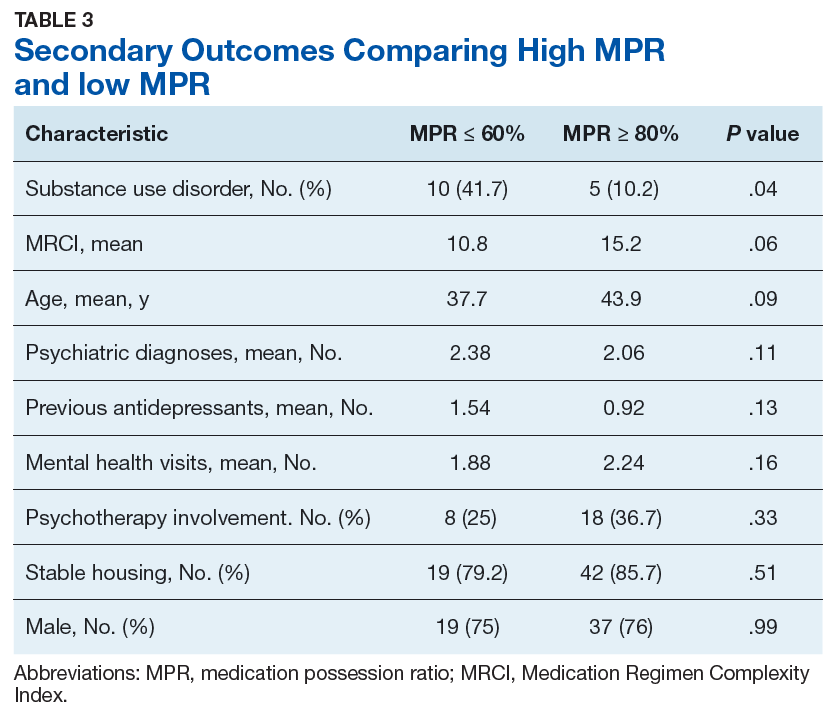
Table 3 compares the characteristics between high MPR and low MPR patients. The low MPR group showed a significantly greater proportion of patients with an SUD than the high adherence group (41.7% vs 10.2%, respectively; P = .04). The most common type of SUD was alcohol use disorder followed by cannabis use disorder. There were no other statistically significant differences identified between high and low MPR groups. There was a trend towards significance when comparing MRCI between the 2 groups (high MPR, 15.2; low MPR, 10.8; P = .06).
Discussion
In our study, there was no significant difference in 3-month adherence rates between veterans on SSRIs, SNRIs, bupropion, and mirtazapine. This result differs from a study by Keyloun and colleagues that found that SNRIs had a significantly higher adherence rate when compared with other antidepressants.7
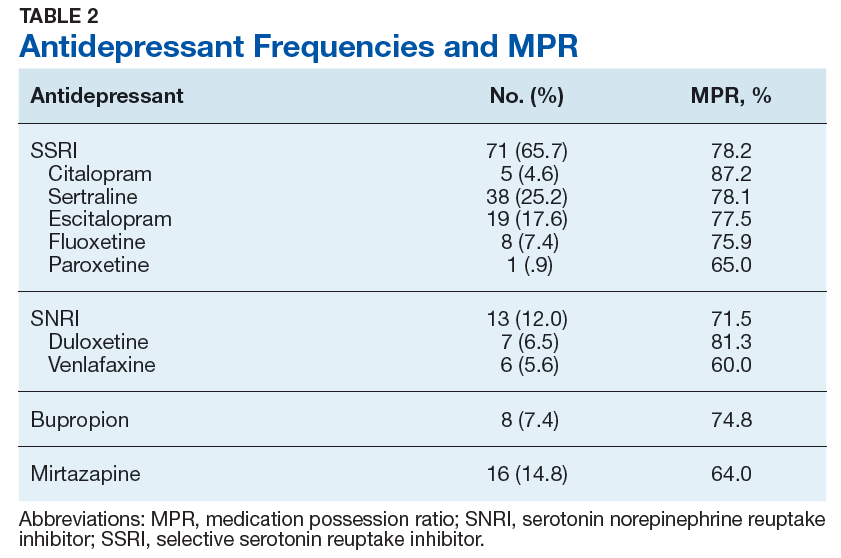
SSRIs were the most commonly prescribed antidepressant in our study, and also had the greatest mean 3-month MPR. The high use of SSRIs may be due to the greater number of SSRI choices to select from compared with other classes. SSRIs may also have been selected more frequently because nearly half (45.4%) of the patients had comorbid PTSD, for which 3 of the 4 first-line treatment options are SSRIs (sertraline, paroxetine, fluoxetine).
As previously stated, Keyloun and colleagues previously found that SNRIs had the highest 3-month adherence rate in a study of > 5000 patients.7 In our study, SNRIs had the second highest mean 3-month MPR at about 75%, but the difference was not considered significant when compared with other antidepressant classes.
Bupropion was prescribed least frequently, but had the largest proportion of adherent patients. Gaspar and colleagues demonstrated similar outcomes, reporting that patients prescribed bupropion had a high OR for adherence.1 Bupropion may have had relatively low prescribing rates in our study because 64% of patients were diagnosed with a comorbid anxiety disorder and/or PTSD. For these patients, bupropion avoidance may have been intentional so as to not exacerbate anxiety.
Mirtazapine had both the lowest mean MPR and the lowest proportion of adherent patients. While no significant difference between antidepressant 3-month adherence rates were found, this study’s findings were similar to previous studies that found lower adherence to mirtazapine.1,5 Adverse effects such as sedation, increased appetite, and weight gain may have contributed to low adherence with mirtazapine.4 Patients may also have been using the agent on an as needed basis to treat insomnia despite the order being written for daily use.
Substance Use Disorder Influence
A significantly greater proportion of patients had an SUD in the low MPR group, suggesting that an SUD diagnosis may be a risk factor for low adherence. This finding is consistent with previous studies that also found that an SUD was associated with poor medication adherence.1 Patients with depression and an SUD have been shown to have suboptimal outcomes compared to those without an SUD, including a lower response to antidepressant therapy and increased illness severity.11,12
In a study of 131 outpatients with dual diagnosis (26% with depression) predictors for low self-reported adherence were a medication-related variable (increased adverse effects), a cognitive variable (low self-efficacy for drug avoidance), and a social factor (low social support for recovery). This variety of predictors seems to indicate that simple memory aids may not improve adherence. “Dual focus” mutual aid groups that provide social support for patients with dual diagnosis have been shown to improve adherence.13
The MEDVAMC Substance Dependence Treatment Program (SDTP) is an outpatient program that uses group education to aid veterans, often those with comorbid psychiatric disorders, to build relapse prevention skills and provide social support. Further exploration into the relationship between involvement in SDTP groups and antidepressant adherence in patients with dual diagnosis may be warranted.
Secondary Outcomes
Trends identified in the secondary outcome were similar to outcomes of previous studies: younger age, lower therapy involvement, and more comorbid psychiatric diagnoses were associated with lower adherence.1,7,8 The presence of increased previous use of antidepressants in the low adherence group may suggest that these patients have an increased illness severity, although objective scales, such as the Patient Health Questionnaire 9 (PHQ9), were not consistently conducted and therefore not included in this analysis. It is unknown whether the previous antidepressant prescriptions were of adequate duration. These patients may have also had intolerances that led to multiple different antidepressant prescriptions and self-discontinuation.
The average MRCI of study patients was 13.5 (range 2 - 53), which was significantly lower than a previous study of geriatric patients with depression reporting an average MRCI of 25.4 (range 6 - 64).14 The positive trend between MRCI and adherence seen in this study was puzzling and counterintuitive. A more complex regimen is generally thought to be associated with poor adherence. Patients with a greater number of comorbid conditions may inherently be on more medications and thus have a more complex medication regimen. Manzano-Garcia and colleagues identified a negative relationship between adherence and the number of comorbidities (OR, 1.04-1.57; P = .021) and the MRCI (OR, 1.14-1.26; P < .001) in patients with HIV.15 Further studies are needed to clarify the relationship between medication adherence and medication regimen complexity in patients with mental health disorders. A better understanding of this relationship could possibly facilitate improved individualized prescribing practices and follow-up.
Limitations
Findings from our study should be interpreted within several limitations. Generalizability and statistical power were limited due to the small sample size, a practice site limited to 1 facility, and population type. The retrospective design of the study introduces inherent bias that would be minimized had a prospective study been conducted. The primary outcome was based upon MPR, which only accounts for refills within a specified time period and does not assess for actual or accurate use of the medication. Data collection was limited to VA and US Department of Defense records.
Geographically diverse studies with larger sample sizes need to be conducted to better understand antidepressant adherence and its barriers and facilitators in the veteran population. The exclusion of patients with previous trials of the prescribed antidepressant may have led to a possible selection bias favoring inclusion of younger patients. These patients may have a more limited period for assessment and treatment when compared with older patients, and thus may have had a smaller chance of previous exposure to the prescribed antidepressant. Neither MAOIs or TCAs were included in this study. No patients taking MAOIs were identified from the Antidepressant Nonadherence Report during the study period. Three patients on TCAs were chart reviewed, but excluded from the study because of prior use of the antidepressant or a non-mental health indication. Additionally, no newer antidepressants, including vortioxetine and vilazodone, were included, likely secondary to their nonformulary status at the VA.
Conclusion
As this study’s purpose was to improve the quality of care at our facility, we will discuss our findings with local MHPs to develop strategies to improve antidepressant adherence. While larger studies need to be conducted to confirm our findings, it is worthwhile to consider risk factors for low adherence such as SUD when prescribing antidepressant medications. Patients with SUD could be encouraged to enroll in our facility’s telephone nursing depression care management program for more frequent follow up and medication adherence counseling.
This study did not find a significant difference in 3-month adherence rates between SSRIs, SNRIs, bupropion, and mirtazapine. SUD was significantly more common in patients with low adherence than those categorized as adherent and may be a risk factor for low adherence based upon our findings and those of previous studies.
1. Gaspar FW, Zaidel CS, Dewa CS. Rates and determinants of use of pharmacotherapy and psychotherapy by patients with major depressive disorder. Psychiatr Serv. 2019;70(4):262-270.
2. Ho SC, Jacob SA, Tangiisuran B. Barriers and facilitators of adherence to antidepressants among outpatients with major depressive disorder: a qualitative study. PLoS One. 2017;12(6):e0179290.
3. US Department of Veterans Affairs, Office of Research and Development. VA research on: depression. https://www.research.va.gov/topics/depression.cfm#research1. Accessed May 30, 2019.
4. Santarsieri D, Schwartz TL. Antidepressant efficacy and side-effect burden: a quick guide for clinicians. Drugs Context. 2015;4:212290.
5. Sansone RA, Sansone LA. Antidepressant adherence: are patients taking their medications? Innov Clin Neurosci. 2012;9(5-6):41-46.
6. Fortney JC, Pyne JM, Edlund MJ, et al. Reasons for antidepressant nonadherence among veterans treated in primary care clinics. J Clin Psychiatry. 2011;72(6):827-834.
7. Keyloun KR, Hansen RN, Hepp Z, Gillard P, Thase ME, Devine EB. Adherence and persistence across antidepressant therapeutic classes: a retrospective claims analysis among insured US patients with major depressive disorder (MDD). [erratum: CNS Drugs. 2017;31(6):511.] CNS Drugs. 2017;31(5):421-432.
8. Mcinnis MG. Adherence to treatment regimens in major depression: perspectives, problems, and progress. https://www.psychiatrictimes.com/depression/adherence-treatment-regimens-major-depression-perspectives-problems-and-progress. Published September 15, 2007. Accessed September 10, 2019.
9. US Department of Veterans Affairs, Office of Mental Health Operations. Clinical support portal. User Guide – antidepressant non-adherence report (MDD43h MDD47h). https://spsites.cdw.va.gov/sites/OMHO_PsychPharm/_layouts/15/WopiFrame.aspx?sourcedoc=/sites/OMHO_PsychPharm/AnalyticsReports/UserGuideMDD43H47H.pdf. Accessed July 29, 2018. [Nonpublic site]
10. Crowe M. Do you know the difference between these adherence measures? https://www.pharmacytimes.com/contributor/michael-crowe-pharmd-mba-csp-fmpa/2015/07/do-you-know-the-difference-between-these-adherence-measures. Published July 5, 2015. Accessed September 13, 2019.
11. Watkins KE, Paddock SM, Zhang L, Wells KB. Improving care for depression in patients with comorbid substance misuse. Am J Psychiatry. 2006;163(1):125-132.
12. Magura S, Rosenblum A, Fong C. Factors associated with medication adherence among psychiatric outpatients at substance abuse risk. Open Addict J. 2011;4:58-64.
13. Magura S, Rosenblum A, Villano CL, Vogel HS, Fong C, Betzler T. Dual-focus mutual aid for co-occurring disorders: a quasi-experimental outcome evaluation study. Am J Drug Alcohol Abuse. 2008;34(1):61-74.
14. Libby AM, Fish DN, Hosokawa PW, et al. Patient-level medication regimen complexity across populations with chronic disease. Clin Ther. 2013;35(4):385-398.e1.
15. Manzano-García M, Pérez-Guerrero C, Álvarez de Sotomayor Paz M, Robustillo-Cortés MLA, Almeida-González CV, Morillo-Verdugo R. Identification of the medication regimen complexity index as an associated factor of nonadherence to antiretroviral treatment in HIV positive patients. Ann Pharmacother. 2018;52(9):862-867.
Depression affects about 4.4% of the global population.1 Major depressive disorder (MDD) is currently the fourth highest cause of disability in the world and by 2030 MDD is expected to be third.2 Research has determined that 1 in 3 veterans seen in primary care shows depressive symptoms. Of these, 1 in 5 have symptoms severe enough to warrant further evaluation for MDD, and 1 in 10 require treatment.3 With this high rate of depression, optimized treatment strategies are needed, including antidepressants and psychotherapy. Antidepressants have grown in popularity since market entry in the 1950s; currently 1 in 10 US citizens aged ≥ 12 years are prescribed an antidepressant.4
Antidepressant Adherence
Antidepressant adherence is crucial for response and remission. Sansone and Sansone reported that, on average, < 50% of patients are adherent to their antidepressant treatment regimen 6 months after initiation (range, 5.4% - 87.6%).5 Fortney and colleagues found that, based on patient report, < 20% of veterans maintained at least 80% adherence at 6 months.6 Patients who are nonadherent are at an increased risk for relapse and recurrence and are more likely to seek care at an emergency department or to become hospitalized.2 In addition to the negative impact on patient outcomes, antidepressant nonadherence may also result in increased economic burden. In the US alone, the annual cost of treating MDD exceeds $210 billion, which will continue to increase if nonadherence is not mitigated.1
Patient-specific characteristics such as lack of knowledge about proper administration techniques, misguided beliefs, and negative attitudes towards treatment may affect adherence.5 In the veteran population, reasons for discontinuation also include lack of perceived benefit and adverse effects, specifically sexual difficulties.6 Sociodemographic and other patient characteristics also may be risk factors for nonadherence, including multiple medical comorbidities; substance use disorder (SUD) diagnosis; male gender; younger age; lack of health insurance or a higher medical cost burden; lack of or low involvement in psychotherapy; infrequent follow up visits; and high illness severity.1,7,8
Appreciating the adherence rates among the different antidepressant classes may help in antidepressant selection. To our knowledge, there have been no prior studies conducted in the veteran population that compared adherence rates among antidepressant classes. Studies in the nonveteran population report differing adherence rates among the antidepressant classes with generally higher adherence in patients prescribed serotonin norepinephrine reuptake inhibitors (SNRIs) and selective serotonin reuptake inhibitors (SSRIs). A retrospective review of commercial, Medicare, and Medicaid claims in > 5000 patients found that SNRIs had a significantly higher 3-month adherence rate based on the portion of days covered model (47%; P < .001) than other antidepressant classes (SSRIs, 42%; other antidepressants, 37%; tricyclic antidepressants [TCAs], 24%).7 Monoamine oxidase inhibitors (MAOIs) prescribed to 1% of the study population had the highest adherence rate at 48%.7 A study reviewing > 25 000 patient claims sourced from the IBM MarketScan research database (Armonk, NY) found that SSRIs (Odds ratio [OR], 1.26; P < .001) and norepinephrine dopamine reuptake inhibitors (NDRIs) (OR, 1.23; P = .007) had the highest ORs for adherence according to the portion of days covered model, while other serotonin modulators (OR, 0.65; P = .001) and tri/tetracyclic antidepressants (OR, 0.49; P < . 001) had the lowest ORs and were associated with lower adherence.1
VA Approaches to Adherence
To address antidepressant adherence, the US Department of Veteran Affairs (VA) adopted 2 measures from the Healthcare Effectiveness Data and Information Set: MDD43h and MDD47h. Measure MDD43h is defined as the proportion of patients with a depression diagnosis newly treated with an antidepressant medication who remained on the antidepressant medication for at least 84 out of 114 days (3 months). MDD47h is similar, but assesses patients remaining on an antidepressant medication for at least 180 out of 230 days (6 months).9 These constitute a SAIL (Strategic Analytics for Improvement and Learning) measure by which VA hospitals are compared. High performance on these measures aids in improving the comparative status of a VA facility.
To help improve performance on these measures, the VA Psychotropic Drug Safety Initiative developed the Antidepressant Nonadherence Report, which serves as a case finder for clinicians to identify veterans with low adherence and/or those overdue for a refill. The dashboard uses the medication possession ratio (MPR) to calculate adherence. While the optimal value is still widely debated, an MPR of ≥ 80% is generally accepted for many disease states.10 The dashboard defines low adherence as ≤ 60%.
As of September 2018, the Antidepressant Nonadherence Report for the Michael E. DeBakey VA Medical Center (MEDVAMC) in Houston, Texas, included > 5000 patients in both MEDVAMC and associated community-based outpatient clinics. About 30% of patients were categorized as overdue for a refill.
Study Objectives
To better understand the problem of antidepressant adherence within this population, we decided to study the relationship between antidepressant class and adherence rates, as well as how adherence relates to patient-specific characteristics. By highlighting predisposing risk factors to low adherence, we hope to provide better interventions.
The primary objective of this study was to determine whether 3-month adherence rates, measured by the MPR, differ between antidepressant classes in veterans newly initiated on antidepressant therapy. A secondary objective was to identify whether there are differences in patient characteristics between those with high MPR (≥ 80%) and low MPR (≤ 60%).
Methods
This study used a retrospective, cross-sectional chart review of MEDVAMC patients from the Antidepressant Nonadherence Report. Patients were: aged ≥ 18 years; newly initiated on an antidepressant with no previous use of the same medication; outpatient for the entire study period; and seen by a physician, physician assistant, nurse practitioner, or pharmacist mental health provider (MHP) within the 3-month study period. All patients’ charts showed a depression diagnosis—an inclusion criterion for the MDD43h and MDD47h measures. However, for this study, the indication(s) for the chosen antidepressant were determined by the MHP note in the patient electronic health record on the date that the medication was prescribed. Study patients may not have had a current depression diagnosis based upon the MHP assessment on the index date. We chose to determine the antidepressant indication(s) in this way because the MHP note would have the most detailed patient assessment.
Patients with previous use of the prescribed antidepressant were excluded because previous exposure may bias the patient and affect current adherence. Patients who were hospitalized at the VA for any reason during the 3-month study period were excluded because of a known risk during transitions of care for medications to be held or discontinued, which could impact refills and MPR. Some patients were excluded if they were taking the antidepressant for a nonmood-related indication (insomnia, neuropathy, migraine prophylaxis, etc). Patients also were excluded if the antidepressant was prescribed to take as-needed; if trazodone was the only antidepressant prescribed; if they were diagnosed with cognitive impairment including dementia or history of stroke; or if they were diagnosed with schizophrenia, schizoaffective disorder, or borderline personality disorder. Use of trazodone as the only antidepressant was excluded because of the relatively common practice to use it in the treatment of insomnia rather than depression.
Primary and Secondary Outcomes
Information collected for the primary outcome, including antidepressant class and MPR, was obtained from the Antidepressant Nonadherence Report. For the secondary outcome, the following data was collected for each patient: age, gender, race, housing status, Medication Regimen Complexity Index (MRCI), number and type of psychiatric diagnoses, number of previous antidepressants, psychotherapy involvement, and number of mental health visits during the 3-month study period. The MRCI is an objective, validated tool that determines relative medication regimen complexity by taking into consideration the number of medications, route and frequency of administration, splitting/multiple dosage units, and presence of any special instructions.11
The primary outcome was tested using a one-way analysis of variance (ANOVA). Nominal secondary outcomes were analyzed using the Fisher’s Exact. Continuous secondary outcomes were examined using an unpaired t-test.
Results
Of 320 charts, 212 patients were excluded and 108 were included (Figure). The most common reason for exclusion was a previously prescribed antidepressant. Of the included patients 49 had an MPR ≥ 80% and 24 had an MPR ≤ 60%. The characteristics of the study population are found in Table 1 and the antidepressant frequencies and MPRs are included in Table 2.
About 87% of study patients had a diagnosis of depression. Other concomitant psychiatric diagnoses include posttraumatic stress disorder (PTSD), anxiety, insomnia, and 2 cases of intermittent explosive disorder. There were no significant differences in mean MPR between the antidepressant classes (P = .31). Within each drug class, we identified the proportion of patients with high adherence (MPR ≥ 80%). Bupropion had the greatest percentage of highly adherent patients (50%) compared with SSRIs (42.5%), SNRIs (38.5%), and mirtazapine (31.3%).
Table 3 compares the characteristics between high MPR and low MPR patients. The low MPR group showed a significantly greater proportion of patients with an SUD than the high adherence group (41.7% vs 10.2%, respectively; P = .04). The most common type of SUD was alcohol use disorder followed by cannabis use disorder. There were no other statistically significant differences identified between high and low MPR groups. There was a trend towards significance when comparing MRCI between the 2 groups (high MPR, 15.2; low MPR, 10.8; P = .06).
Discussion
In our study, there was no significant difference in 3-month adherence rates between veterans on SSRIs, SNRIs, bupropion, and mirtazapine. This result differs from a study by Keyloun and colleagues that found that SNRIs had a significantly higher adherence rate when compared with other antidepressants.7
SSRIs were the most commonly prescribed antidepressant in our study, and also had the greatest mean 3-month MPR. The high use of SSRIs may be due to the greater number of SSRI choices to select from compared with other classes. SSRIs may also have been selected more frequently because nearly half (45.4%) of the patients had comorbid PTSD, for which 3 of the 4 first-line treatment options are SSRIs (sertraline, paroxetine, fluoxetine).
As previously stated, Keyloun and colleagues previously found that SNRIs had the highest 3-month adherence rate in a study of > 5000 patients.7 In our study, SNRIs had the second highest mean 3-month MPR at about 75%, but the difference was not considered significant when compared with other antidepressant classes.
Bupropion was prescribed least frequently, but had the largest proportion of adherent patients. Gaspar and colleagues demonstrated similar outcomes, reporting that patients prescribed bupropion had a high OR for adherence.1 Bupropion may have had relatively low prescribing rates in our study because 64% of patients were diagnosed with a comorbid anxiety disorder and/or PTSD. For these patients, bupropion avoidance may have been intentional so as to not exacerbate anxiety.
Mirtazapine had both the lowest mean MPR and the lowest proportion of adherent patients. While no significant difference between antidepressant 3-month adherence rates were found, this study’s findings were similar to previous studies that found lower adherence to mirtazapine.1,5 Adverse effects such as sedation, increased appetite, and weight gain may have contributed to low adherence with mirtazapine.4 Patients may also have been using the agent on an as needed basis to treat insomnia despite the order being written for daily use.
Substance Use Disorder Influence
A significantly greater proportion of patients had an SUD in the low MPR group, suggesting that an SUD diagnosis may be a risk factor for low adherence. This finding is consistent with previous studies that also found that an SUD was associated with poor medication adherence.1 Patients with depression and an SUD have been shown to have suboptimal outcomes compared to those without an SUD, including a lower response to antidepressant therapy and increased illness severity.11,12
In a study of 131 outpatients with dual diagnosis (26% with depression) predictors for low self-reported adherence were a medication-related variable (increased adverse effects), a cognitive variable (low self-efficacy for drug avoidance), and a social factor (low social support for recovery). This variety of predictors seems to indicate that simple memory aids may not improve adherence. “Dual focus” mutual aid groups that provide social support for patients with dual diagnosis have been shown to improve adherence.13
The MEDVAMC Substance Dependence Treatment Program (SDTP) is an outpatient program that uses group education to aid veterans, often those with comorbid psychiatric disorders, to build relapse prevention skills and provide social support. Further exploration into the relationship between involvement in SDTP groups and antidepressant adherence in patients with dual diagnosis may be warranted.
Secondary Outcomes
Trends identified in the secondary outcome were similar to outcomes of previous studies: younger age, lower therapy involvement, and more comorbid psychiatric diagnoses were associated with lower adherence.1,7,8 The presence of increased previous use of antidepressants in the low adherence group may suggest that these patients have an increased illness severity, although objective scales, such as the Patient Health Questionnaire 9 (PHQ9), were not consistently conducted and therefore not included in this analysis. It is unknown whether the previous antidepressant prescriptions were of adequate duration. These patients may have also had intolerances that led to multiple different antidepressant prescriptions and self-discontinuation.
The average MRCI of study patients was 13.5 (range 2 - 53), which was significantly lower than a previous study of geriatric patients with depression reporting an average MRCI of 25.4 (range 6 - 64).14 The positive trend between MRCI and adherence seen in this study was puzzling and counterintuitive. A more complex regimen is generally thought to be associated with poor adherence. Patients with a greater number of comorbid conditions may inherently be on more medications and thus have a more complex medication regimen. Manzano-Garcia and colleagues identified a negative relationship between adherence and the number of comorbidities (OR, 1.04-1.57; P = .021) and the MRCI (OR, 1.14-1.26; P < .001) in patients with HIV.15 Further studies are needed to clarify the relationship between medication adherence and medication regimen complexity in patients with mental health disorders. A better understanding of this relationship could possibly facilitate improved individualized prescribing practices and follow-up.
Limitations
Findings from our study should be interpreted within several limitations. Generalizability and statistical power were limited due to the small sample size, a practice site limited to 1 facility, and population type. The retrospective design of the study introduces inherent bias that would be minimized had a prospective study been conducted. The primary outcome was based upon MPR, which only accounts for refills within a specified time period and does not assess for actual or accurate use of the medication. Data collection was limited to VA and US Department of Defense records.
Geographically diverse studies with larger sample sizes need to be conducted to better understand antidepressant adherence and its barriers and facilitators in the veteran population. The exclusion of patients with previous trials of the prescribed antidepressant may have led to a possible selection bias favoring inclusion of younger patients. These patients may have a more limited period for assessment and treatment when compared with older patients, and thus may have had a smaller chance of previous exposure to the prescribed antidepressant. Neither MAOIs or TCAs were included in this study. No patients taking MAOIs were identified from the Antidepressant Nonadherence Report during the study period. Three patients on TCAs were chart reviewed, but excluded from the study because of prior use of the antidepressant or a non-mental health indication. Additionally, no newer antidepressants, including vortioxetine and vilazodone, were included, likely secondary to their nonformulary status at the VA.
Conclusion
As this study’s purpose was to improve the quality of care at our facility, we will discuss our findings with local MHPs to develop strategies to improve antidepressant adherence. While larger studies need to be conducted to confirm our findings, it is worthwhile to consider risk factors for low adherence such as SUD when prescribing antidepressant medications. Patients with SUD could be encouraged to enroll in our facility’s telephone nursing depression care management program for more frequent follow up and medication adherence counseling.
This study did not find a significant difference in 3-month adherence rates between SSRIs, SNRIs, bupropion, and mirtazapine. SUD was significantly more common in patients with low adherence than those categorized as adherent and may be a risk factor for low adherence based upon our findings and those of previous studies.
1. Gaspar FW, Zaidel CS, Dewa CS. Rates and determinants of use of pharmacotherapy and psychotherapy by patients with major depressive disorder. Psychiatr Serv. 2019;70(4):262-270.
2. Ho SC, Jacob SA, Tangiisuran B. Barriers and facilitators of adherence to antidepressants among outpatients with major depressive disorder: a qualitative study. PLoS One. 2017;12(6):e0179290.
3. US Department of Veterans Affairs, Office of Research and Development. VA research on: depression. https://www.research.va.gov/topics/depression.cfm#research1. Accessed May 30, 2019.
4. Santarsieri D, Schwartz TL. Antidepressant efficacy and side-effect burden: a quick guide for clinicians. Drugs Context. 2015;4:212290.
5. Sansone RA, Sansone LA. Antidepressant adherence: are patients taking their medications? Innov Clin Neurosci. 2012;9(5-6):41-46.
6. Fortney JC, Pyne JM, Edlund MJ, et al. Reasons for antidepressant nonadherence among veterans treated in primary care clinics. J Clin Psychiatry. 2011;72(6):827-834.
7. Keyloun KR, Hansen RN, Hepp Z, Gillard P, Thase ME, Devine EB. Adherence and persistence across antidepressant therapeutic classes: a retrospective claims analysis among insured US patients with major depressive disorder (MDD). [erratum: CNS Drugs. 2017;31(6):511.] CNS Drugs. 2017;31(5):421-432.
8. Mcinnis MG. Adherence to treatment regimens in major depression: perspectives, problems, and progress. https://www.psychiatrictimes.com/depression/adherence-treatment-regimens-major-depression-perspectives-problems-and-progress. Published September 15, 2007. Accessed September 10, 2019.
9. US Department of Veterans Affairs, Office of Mental Health Operations. Clinical support portal. User Guide – antidepressant non-adherence report (MDD43h MDD47h). https://spsites.cdw.va.gov/sites/OMHO_PsychPharm/_layouts/15/WopiFrame.aspx?sourcedoc=/sites/OMHO_PsychPharm/AnalyticsReports/UserGuideMDD43H47H.pdf. Accessed July 29, 2018. [Nonpublic site]
10. Crowe M. Do you know the difference between these adherence measures? https://www.pharmacytimes.com/contributor/michael-crowe-pharmd-mba-csp-fmpa/2015/07/do-you-know-the-difference-between-these-adherence-measures. Published July 5, 2015. Accessed September 13, 2019.
11. Watkins KE, Paddock SM, Zhang L, Wells KB. Improving care for depression in patients with comorbid substance misuse. Am J Psychiatry. 2006;163(1):125-132.
12. Magura S, Rosenblum A, Fong C. Factors associated with medication adherence among psychiatric outpatients at substance abuse risk. Open Addict J. 2011;4:58-64.
13. Magura S, Rosenblum A, Villano CL, Vogel HS, Fong C, Betzler T. Dual-focus mutual aid for co-occurring disorders: a quasi-experimental outcome evaluation study. Am J Drug Alcohol Abuse. 2008;34(1):61-74.
14. Libby AM, Fish DN, Hosokawa PW, et al. Patient-level medication regimen complexity across populations with chronic disease. Clin Ther. 2013;35(4):385-398.e1.
15. Manzano-García M, Pérez-Guerrero C, Álvarez de Sotomayor Paz M, Robustillo-Cortés MLA, Almeida-González CV, Morillo-Verdugo R. Identification of the medication regimen complexity index as an associated factor of nonadherence to antiretroviral treatment in HIV positive patients. Ann Pharmacother. 2018;52(9):862-867.
Health Care Disparities Among Adolescents and Adults With Sickle Cell Disease: A Community-Based Needs Assessment to Inform Intervention Strategies
From the University of California San Francisco (Dr. Treadwell, Dr. Hessler, Yumei Chen, Swapandeep Mushiana, Dr. Potter, and Dr. Vichinsky), the University of California Los Angeles (Dr. Jacob), and the University of California Berkeley (Alex Chen).
Abstract
- Objective: Adolescents and adults with sickle cell disease (SCD) face pervasive disparities in health resources and outcomes. We explored barriers to and facilitators of care to identify opportunities to support implementation of evidence-based interventions aimed at improving care quality for patients with SCD.
- Methods: We engaged a representative sample of adolescents and adults with SCD (n = 58), health care providers (n = 51), and community stakeholders (health care administrators and community-based organization leads (n = 5) in Northern California in a community-based needs assessment. We conducted group interviews separately with participant groups to obtain in-depth perspectives. Adolescents and adults with SCD completed validated measures of pain interference, quality of care, self-efficacy, and barriers to care. Providers and community stakeholders completed surveys about barriers to SCD care.
- Results: We triangulated qualitative and quantitative data and found that participants with SCD (mean age, 31 ± 8.6 years), providers, and community stakeholders emphasized the social and emotional burden of SCD as barriers. Concrete barriers agreed upon included insurance and lack of resources for addressing pain impact. Adolescents and adults with SCD identified provider issues (lack of knowledge, implicit bias), transportation, and limited social support as barriers. Negative encounters with the health care system contributed to 84% of adolescents and adults with SCD reporting they chose to manage severe pain at home. Providers focused on structural barriers: lack of access to care guidelines, comfort level with and knowledge of SCD management, and poor care coordination.
- Conclusion: Strategies for improving access to compassionate, evidence-based quality care, as well as strategies for minimizing the burden of having SCD, are warranted for this medically complex population.
Keywords: barriers to care; quality of care; care access; care coordination.
Sickle cell disease (SCD), an inherited chronic medical condition, affects about 100,000 individuals in the United States, a population that is predominantly African American.1 These individuals experience multiple serious and life-threatening complications, most frequently recurrent vaso-occlusive pain episodes,2 and they require interactions with multidisciplinary specialists from childhood. Because of advances in treatments, the majority are reaching adulthood; however, there is a dearth of adult health care providers with the training and expertise to manage their complex medical needs.3 Other concrete barriers to adequate SCD care include insurance and distance to comprehensive SCD centers.4,5
Social, behavioral, and emotional factors may also contribute to challenges with SCD management. SCD may limit daily functional abilities and lead to diminished overall quality of life.6,7 Some adolescents and adults may require high doses of opioids, which contributes to health care providers’ perceptions that there is a high prevalence of drug addiction in the population.8,9 These providers express negative attitudes towards adults with SCD, and, consequently, delay medication administration when it is acutely needed and provide otherwise suboptimal treatment.8,10,11 Adult care providers may also be uncomfortable with prescribing and managing disease-modifying therapies (blood transfusion, hydroxyurea) that have established efficacy.12-17
As 1 of 8 programs funded by the National Heart, Lung, and Blood Institute’s (NHLBI) Sickle Cell Disease Implementation Consortium (SCDIC), we are using implementation science to reduce barriers to care and improve quality of care and health care outcomes in SCD.18,19 Given that adolescents and adults with SCD experience high mortality, severe pain, and progressive decline in their ability to function day to day, and also face lack of access to knowledgeable, compassionate providers in primary and emergency settings, the SCDIC focuses on individuals aged 15 to 45 years.6,8,9,11,12
Our regional SCDIC program, the Sickle Cell Care Coordination Initiative (SCCCI), brings together researchers, clinicians, adolescents, and adults with SCD and their families, dedicated community members, policy makers, and administrators to identify and address barriers to health care within 5 counties in Northern California. One of our first steps was to conduct a community-based needs assessment, designed to inform implementation of evidence-based interventions, accounting for unique contextual factors in our region.
Conceptual Framework for Improving Medical Practice
Our needs assessment is guided by Solberg’s Conceptual Framework for Improving Medical Practice (Figure 1).20 Consistent with the overarching principles of the SCDIC, this conceptual framework focuses on the inadequate implementation of evidence-based guidelines, and on the need to first understand multifactorial facilitators and barriers to guideline implementation in order to effect change. The framework identifies 3 main elements that must be present to ensure improvements in quality-of-care processes and patient outcomes: priority, change process capability, and care process content. Priority refers to ample resource allocation for the specific change, as well as freedom from competing priorities for those implementing the change. Change process capability includes strong, effective leadership, adequate infrastructure for managing change (including resources and time), change management skills at all levels, and an established clinical information system. Care process content refers to context and systems-level changes, such as delivery system redesign as needed, support for self-management to lessen the impact of the disease, and decision support.21-23

The purpose of our community-based needs assessment was to evaluate barriers to care and quality of care in SCD, within Solberg’s conceptual model for improving medical practice. The specific aims were to evaluate access and barriers to care (eg, lack of provider expertise and training, health care system barriers such as poor care coordination and provider communication); evaluate quality of care; and assess patient needs related to pain, pain interference, self-efficacy, and self-management for adolescents and adults with SCD. We gathered the perspectives of a representative community of adolescents and adults with SCD, their providers, and community stakeholders in order to examine barriers, quality of life and care, and patient experiences in our region.
Methods
Design
In this cross-sectional study, adolescents and adults with SCD, their providers, and community stakeholders participated in group or individual qualitative interviews and completed surveys between October 2017 and March 2018.
Setting and Sample
Recruitment flyers were posted on a regional SCD-focused website, and clinical providers or a study coordinator introduced information about the needs assessment to potential participants with SCD during clinic visits at the participating centers. Participants with SCD were eligible if they had any diagnosis of SCD, were aged 15 to 48 years, and received health services within 5 Northern California counties (Alameda, Contra Costa, Sacramento, San Francisco, and Solano). They were excluded if they did not have a SCD diagnosis or had not received health services within the catchment area. As the project proceeded, participants were asked to refer other adolescents and adults with SCD for the interviews and surveys (snowball sampling). Our goal was to recruit 50 adolescents and adults with SCD into the study, aiming for 10 representatives from each county.
Providers and community stakeholders were recruited via emails, letters and informational flyers. We engaged our partner, the Sickle Cell Data Collection Program,2 to generate a list of providers and institutions that had seen patients with SCD in primary, emergency, or inpatient settings in the region. We contacted these institutions to describe the SCCCI and invite participation in the needs assessment. We also invited community-based organization leads and health care administrators who worked with SCD to participate. Providers accessed confidential surveys via a secure link on the study website or completed paper versions. Common data collected across providers included demographics and descriptions of practice settings.
Participants were eligible to be part of the study if they were health care providers (physicians and nurses) representing hematology, primary care, family medicine, internal medicine, or emergency medicine; ancillary staff (social work, psychology, child life); or leaders or administrators of clinical or sickle cell community-based organizations in Northern California (recruitment goal of n = 50). Providers were excluded if they practiced in specialties other than those noted or did not practice within the region.
Data Collection Procedures
After providing assent/consent, participating adolescents and adults with SCD took part in individual and group interviews and completed survey questionnaires. All procedures were conducted in a private space in the sickle cell center or community. Adolescents and adults with SCD completed the survey questionnaire on a tablet, with responses recorded directly in a REDCap (Research Electronic Data Capture) database,24 or on a paper version. Interviews lasted 60 (individual) to 90 (group) minutes, while survey completion time was 20 to 25 minutes. Each participant received a gift card upon completion as an expression of appreciation. All procedures were approved by the institutional review boards of the participating health care facilities.
Group and Individual Interviews
Participants with SCD and providers were invited to participate in a semi-structured qualitative interview prior to being presented with the surveys. Adolescents and adults with SCD were interviewed about barriers to care, quality of care, and pain-related experiences. Providers were asked about barriers to care and treatments. Interview guides were modified for community-based organization leaders and health care administrators who did not provide clinical services. Interview guides can be found in the Appendix. Interviews were conducted by research coordinators trained in qualitative research methods by the first author (MT). As appropriate with semi-structured interviews, the interviewers could word questions spontaneously, change the order of questions for ease of flow of conversation, and inform simultaneous coding of interviews with new themes as those might arise, as long as they touched on all topics within the interview guide.25 The interview guides were written, per qualitative research standards, based on the aims and purpose of the research,26 and were informed by existing literature on access and barriers to care in SCD, quality of care, and the needs of individuals with SCD, including in relation to impact of the disease, self-efficacy, and self-management.
Interviewees participated in either individual or group interviews, but not both. The decision for which type of interview an individual participated in was based on 2 factors: if there were not comparable participants for group interviews (eg, health care administrator and community-based organization lead), these interviews were done individually; and given that we were drawing participants from a 5-county area in Northern California, scheduling was challenging for individuals with SCD with regard to aligning schedules and traveling to a central location where the group interviews were conducted. Provider group interviews were easier to arrange because we could schedule them at the same time as regularly scheduled meetings at the participants’ health care institutions.
Interview Data Gathering and Analysis
Digital recordings of the interviews were cleaned of any participant identifying data and sent for transcription to an outside service. Transcripts were reviewed for completeness and imported into NVivo (www.qsrinternational.com), a qualitative data management program.
A thematic content analysis and deductive and inductive approaches were used to analyze the verbatim transcripts generated from the interviews. The research team was trained in the use of NVivo software to facilitate the coding process. A deductive coding scheme was initially used based on existing concepts in the literature regarding challenges to optimal SCD care, with new codes added as the thematic content analyses progressed. The initial coding, pattern coding, and use of displays to examine the relationships between different categories were conducted simultaneously.27,28 Using the constant comparative method, new concepts from participants with SCD and providers could be incorporated into subsequent interviews with other participants. For this study, the only additional concepts added were in relation to participant recruitment and retention in the SCDIC Registry. Research team members coded transcripts separately and came together weekly, constantly comparing codes and developing the consensus coding scheme. Where differences between coders existed, code meanings were discussed and clarified until consensus was reached.29
Quantitative data were analyzed using SPSS (v. 25, Chicago, IL). Descriptive statistics (means, standard deviations, frequencies, percentages) were used to summarize demographics (eg, age, gender, and race), economic status, and type of SCD. No systematic differences were detected from cases with missing values. Scale reliabilities (ie, Cronbach α) were evaluated for self-report measures.
Measurement
Adolescents and adults with SCD completed items from the PhenX Toolkit (consensus measures for Phenotypes and eXposures), assessing sociodemographics (age, sex, race, ethnicity, educational attainment, occupation, marital status, annual income, insurance), and clinical characteristics (sickle cell diagnosis and emergency department [ED] and hospital utilization for pain).30
Pain Interference Short Form (Patient-Reported Outcomes Measurement Information System [PROMIS]). The Pain Interference Form consists of 8 items that assess the degree to which pain interfered with day-to-day activities in the previous 7 days at home, including impacts on social, cognitive, emotional, and physical functioning; household chores and recreational activities; sleep; and enjoyment in life. Reliability and validity of the PROMIS Pain Interference Scale has been demonstrated, with strong negative correlations with Physical Function Scales (r = 0.717, P < 0.01), indicating that higher scores are associated with lower function (β = 0.707, P < 0.001).31 The Cronbach α estimate for the other items on the pain interference scale was 0.99. Validity analysis indicated strong correlations with pain-related domains: BPI Interference Subscale (rho = 0.90), SF-36 Bodily Pain Subscale (rho = –0.84), and 0–10 Numerical Rating of Pain Intensity (rho = 0.48).32
Adult Sickle Cell Quality of Life Measurement Information System (ASCQ-Me) Quality of Care (QOC). ASCQ-Me QOC consists of 27 items that measure the quality of care that adults with SCD have received from health care providers.33 There are 3 composites: provider communication (quality of patient and provider communication), ED care (quality of care in the ED), and access (to routine and emergency care). Internal consistency reliability for all 3 composites is greater than 0.70. Strong correlations of the provider communication composite with overall ratings of routine care (r = 0.65) and overall provider ratings (r = 0.83) provided evidence of construct validity. Similarly, the ED care composite was strongly correlated with overall ratings of QOC in the ED, and the access composite was highly correlated with overall evaluations of ED care (r = 0.70). Access, provider interaction, and ED care composites were reliable (Cronbach α, 0.70–0.83) and correlated with ratings of global care (r = 0.32–0.83), further indicating construct validity.33
Sickle Cell Self-Efficacy Scale (SCSES). The SCSES is a 9-item, self-administered questionnaire measuring perceptions of the ability to manage day-to-day issues resulting from SCD. SCSES items are scored on a 5-point scale ranging from Not sure at all (1) to Very sure (5). Individual item responses are summed to give an overall score, with higher scores indicating greater self-efficacy. The SCSES has acceptable reliability (r = 0.45, P < 0.001) and validity (α = 0.89).34,35
Sickle Cell Disease Barriers Checklist. This checklist consists of 53 items organized into 8 categories: insurance, transportation, accommodations and accessibility, provider knowledge and attitudes, social support, individual barriers such as forgetting or difficulties understanding instructions, emotional barriers (fear, anger), and disease-related barriers. Participants check applicable barriers, with a total score range of 0 to 53 and higher scores indicating more barriers to care. The SCD Barriers Checklist has demonstrated face validity and test-retest reliability (Pearson r = 0.74, P < 0.05).5
ED Provider Checklist. The ED provider survey is a checklist of 14 statements pertaining to issues regarding patient care, with which the provider rates level of agreement. Items representing the attitudes and beliefs of providers towards patients with SCD are rated on a Likert-type scale, with level of agreement indicated as 1 (strongly disagree) to 6 (strongly agree). The positive attitudes subscale consists of 4 items (Cronbach α= 0.85), and the negative attitudes subscale consists of 6 items (Cronbach α = 0.89). The Red-Flag Behaviors subscale includes 4 items that indicate behavior concerns about drug-seeking, such as requesting specific narcotics and changing behavior when the provider walks in.8,36,37
Sickle cell and primary care providers also completed a survey consisting of sets of items compiled from existing provider surveys; this survey consisted of a list of 16 barriers to using opioids, which the providers rated on a 5-point Likert-type scale (1, not a barrier; 5, complete barrier).13,16,38 Providers indicated their level of experience with caring for patients with SCD; care provided, such as routine health screenings; and comfort level with providing preventive care, managing comorbidities, and managing acute and chronic pain. Providers were asked what potential facilitators might improve care for patients with SCD, including higher reimbursement, case management services, access to pain management specialists, and access to clinical decision-support tools. Providers responded to specific questions about management with hydroxyurea (eg, criteria for, barriers to, and comfort level with prescribing).39 The surveys are included in the Appendix.
Triangulation
Data from the interviews and surveys were triangulated to enhance understanding of results generated from the different data sources.40 Convergence of findings, different facets of the same phenomenon, or new perspectives were examined.
Results
Qualitative Data
Adolescents and adults with SCD (n = 55) and health care providers and community stakeholders (n = 56) participated in group or individual interviews to help us gain an in-depth understanding of the needs and barriers related to SCD care in our 5-county region. Participants with SCD described their experiences, which included stigma, racism, labeling, and, consequently, stress. They also identified barriers such as lack of transportation, challenges with insurance, and lack of access to providers who were competent with pain management. They reported that having SCD in a health care system that was unable to meet their needs was burdensome.
Barriers to Care and Treatments. Adolescents and adults indicated that SCD and its sequelae posed significant barriers to health care. Feelings of tiredness and pain make it more difficult for them to seek care. The emotional burden of SCD (fear and anger) was a frequently cited barrier, which was fueled by previous negative encounters with the health care system. All adolescents and adults with SCD reported that they knew of stigma in relation to seeking pain management that was pervasive and long-standing, and the majority reported they had directly experienced stigma. They reported that being labeled as “drug-seekers” was typical when in the ED for pain management. Participants articulated unconscious bias or overt racism among providers: “people with sickle cell are Black ... and Black pain is never as valuable as White pain” (25-year-old male). Respondents with SCD described challenges to the credibility of their pain reports in the ED. They reported that ED providers expressed doubts regarding the existence and/or severity of their pain, consequently creating a feeling of disrespect for patients seeking pain relief. The issue of stigma was mentioned by only 2 of 56 providers during their interviews.
Lack of Access to Knowledgeable, Compassionate Providers. Lack of access to knowledgeable care providers was another prevalent theme expressed by adolescents and adults with SCD. Frustration occurred when providers did not have knowledge of SCD and its management, particularly pain assessment. Adolescents and adults with SCD noted the lack of compassion among providers: “I’ve been kicked out of the hospital because they felt like okay, well we gave you enough medication, you should be all right” (29-year-old female). Providers specifically mentioned lack of compassion and knowledge as barriers to SCD care much less often during their interviews compared with the adolescents and adults with SCD.
Health Care System Barriers. Patient participants often expressed concerns about concrete and structural aspects of care. Getting to their appointments was a challenge for half of the interviewees, as they either did not have access to a vehicle or could not afford to travel the needed distance to obtain quality care. Even when hospitals were accessible by public transportation, those with excruciating pain understandably preferred a more comfortable and private way to travel: “I would like to change that, something that will be much easier, convenient for sickle cell patients that do suffer with pain, that they don’t have to travel always to see the doctor” (30-year-old male).
Insurance and other financial barriers also played an important role in influencing decisions to seek health care services. Medical expenses were not covered, or co-pays were too high. The Medicaid managed care system could prevent access to knowledgeable providers who were not within network. Such a lack of access discouraged some adolescents and adults with SCD from seeking acute and preventive care.
Transition From Pediatric to Adult Care. Interviewees with SCD expressed distress about the gap between pediatric and adult care. They described how they had a long-standing relationship with their medical providers, who were familiar with their medical background and history from childhood. Adolescent interviewees reported an understanding of their own pain management as well as adherence to and satisfaction with their individualized pain plans. However, adults noted that satisfaction plummeted with increasing age due to the limited number of experienced adult SCD providers, which was compounded by negative experiences (stigma, racism, drug-seeking label).
One interviewee emphasized the difficulty of finding knowledgeable providers after transition: “When you’re a pediatric sickle cell [patient], you have the doctors there every step of the way, but not with adult sickle cell… I know when I first transitioned I never felt more alone in my life… you look at that ER doctor kind of with the same mindset as you would your hematologist who just hand walked you through everything. And adult care providers were a lot more blunt and cold and they’re like… ‘I don’t know; I’m not really educated in sickle cell.’” A sickle cell provider shared his insight about the problem of transitioning: “I think it’s particularly challenging because we, as a community, don’t really set them up for success. It’s different from other chronic conditions [in that] it’s much harder to find an adult sickle cell provider. There’s not a lot of adult hematologists that will take care of our adult patients, and so I know statistically, there’s like a drop-down in the overall outcomes of our kids after they age out of our pediatric program.”
Self-Management, Supporting Hydroxyurea Use. Interview participants with SCD reported using a variety of methods to manage pain at home and chose to go to the ED only when the pain became intolerable. Patients and providers expressed awareness of different resources for managing pain at home, yet they also indicated that these resources have not been consolidated in an accessible way for patients and families. Some resources cited included heat therapy, acupuncture, meditation, medical marijuana, virtual reality devices, and pain medications other than opioids.
Patients and providers expressed the need for increasing awareness and education about hydroxyurea. Many interview participants with SCD were concerned about side effects, multiple visits with a provider during dose titration, and ongoing laboratory monitoring. They also expressed difficulties with scheduling multiple appointments, depending on access to transportation and limited provider clinic hours. They were aware of strategies for improving adherence with hydroxyurea, including setting phone alarms, educating family members about hydroxyurea, and eliciting family support, but expressed needing help to consistently implement these strategies.
Safe Opioid Prescribing. Adult care providers expressed concerns about safe opioid prescribing for patients with SCD. They were reluctant to prescribe opioid doses needed to adequately control SCD pain. Providers expressed uncertainty and fear or concern about medical/legal liability or about their judgment about what’s safe and not safe for patients with chronic use/very high doses of opioids. “I know we’re in like this opiate epidemic here in this country but I feel like these patients don’t really fit under that umbrella that the problem is coming from so [I am] just trying to learn more about how to take care of them.”
Care Coordination and Provider Communication. Adolescents and adults with SCD reported having positive experiences—good communication, established trust, and compassionate care—with their usual providers. However, they perceived that ED physicians and nurses did not really care about them. Both interviewees with SCD and providers recognized the importance of good communication in all settings as the key to overcoming barriers to receiving quality care. All agreed on the importance of using individual pain plans so that all providers, especially ED providers, can be more at ease with treating adolescents and adults with SCD.
Quantitative Data: Adolescents and Adults With SCD
Fifty-eight adolescents and adults with SCD (aged 15 to 48 years) completed the survey. Three additional individuals who did not complete the interview completed the survey. Reasons for not completing the interview included scheduling challenges (n = 2) or a sickle cell pain episode (n = 1). The average age of participants was 31 years ± 8.6, more than half (57%) were female, and the majority (93%) were African American (Table 1). Most (71%) had never been married. Half (50%) had some college or an associate degree, and 40% were employed and reported an annual household income of less than $30,000. Insurance coverage was predominantly Medi-Cal (Medicaid, 69%). The majority of participants resided in Alameda (34.5%) or Contra Costa (21%) counties. The majority of sickle cell care was received in Alameda County, whether outpatient (52%), inpatient (40%), or ED care (41%). The majority (71%) had a diagnosis of SCD hemoglobin SS.

Pain. More than one-third of individuals with SCD reported 1 or 2 ED visits for pain in the previous 6 months (34%), and more than 3 hospitalizations (36%) related to pain in the previous year (Table 2). The majority (85%) reported having severe pain at home in the previous 6 months that they did not seek health care for, consistent with their reports in the qualitative interviews. More than half (59%) reported 4 or more of these severe pain episodes that led to inability to perform daily activities for 1 week or more. While pain interference on the PROMIS Pain Interference Short Form on average (T-score, 59.6 ± 8.6) was similar to that of the general population (T-score, 50 ± 10), a higher proportion of patients with SCD reported pain interference compared with the general population. The mean self-efficacy (confidence in ability to manage complications of SCD) score on the SCSES of 30.0 ± 7.3 (range, 9–45) was similar to that of other adults with SCD (mean, 32.2 ± 7.0). Twenty-five percent of the present sample had a low self-efficacy score (< 25).

Barriers to Care and Treatments. Consistent with the qualitative data, SCD-related symptoms such as tiredness (64%) and pain (62%) were reported most often as barriers to care (Table 3). Emotions (> 25%) such as worry/fear, frustration/anger, and lack of confidence were other important barriers to care. Provider knowledge and attitudes were cited next most often, with 38% of the sample indicating “Providers accuse me of drug-seeking” and “It is hard for me to find a provider who has enough experiences with or knowledge about SCD.” Participants expressed that they were not believed when in pain and “I am treated differently from other patients.” Almost half of respondents cited “I am not seen quickly enough when I am in pain” as a barrier to their care.

Consistent with the qualitative data, transportation barriers (not having a vehicle, costs of transportation, public transit not easy to get to) were cited by 55% of participants. About half of participants reported that insurance was an important barrier, with high co-pays and medications and other services not covered. In addition, gathering approvals was a long and fragmented process, particularly for consultations among providers (hematology, primary care provider, pain specialist). Furthermore, insurance provided limited choices about location for services.
Participants reported social support system burnout (22%), help needed with daily activities (21%), and social isolation or generally not having enough support (33%) as ongoing barriers. Difficulties were encountered with self-management (eg, taking medications on time or making follow-up appointments, 19%), with 22% of participants finding the health care system confusing or hard to understand. Thirty percent reported “Places for me to go to learn how to stay well are not close by or easy to get to.” ”Worry about side effects” (33%) was a common barrier to hydroxyurea use. Participants described “forgetting to take the medicine,” “tried before but it did not work,” “heard scary things” about hydroxyurea, and “not interested in taking another medicine” as barriers.
Quality of Care. More than half (51%) of the 53 participants who had accessed health care in the previous year rated their overall health care as poor on the ASCQ-Me QOC measure. This was significantly higher compared to the reports from more than 47,000 adults with Medicaid in 2017 (16%),41 and to the 2008-2009 report from 556 adults with SCD from across the United States (37%, Figure 2).33 The major contributor to these poor ratings for participants in our sample was low satisfaction with ED care.

Sixty percent of the 42 participants who had accessed ED care in the past year indicated “never” or “sometimes” to the question “When you went to the ED for care, how often did you get it as soon as you wanted?” compared with only 16% of the 2017 adult Medicaid population responding (n = 25,789) (Figure 3). Forty-seven percent of those with an ED visit indicated that, in the previous 12 months, they had been made to wait “more than 2 hours before receiving treatment for acute pain in the ED.” However, in the previous 12 months, 39% reported that their wait time in the ED had been only “between five minutes and one hour.”

On the ASCQ-Me QOC Access to Care composite measure, 33% of 42 participants responding reported they were seen at a routine appointment as soon as they would have liked. This is significantly lower compared to 56% of the adult Medicaid population responding to the same question. Reports of provider communication (Provider Communication composite) for adolescents and adults with SCD were comparable to reports of adults with SCD from the ASCQ-Me field test,33 but adults with Medicaid reported higher ratings of quality communication behaviors (Figure 4).33,41 Nearly 60% of both groups with SCD reported that providers “always” performed quality communication behaviors—listened carefully, spent enough time, treated them with respect, and explained things well—compared with more than 70% of adults with Medicaid.

Participants from all counties reported the same number of barriers to care on average (3.3 ± 2.1). Adolescents and adults who reported more barriers to care also reported lower satisfaction with care (r = –0.47, P < 0.01) and less confidence in their ability to manage their SCD (self-efficacy, r = – 0.36, P < 0.05). Female participants reported more barriers to care on average compared with male participants (2.6 ± 2.4 vs 1.4 ± 2.0, P = 0.05). Participants with higher self-efficacy reported lower pain ratings (r = –0.47, P < 0.001).
Quantitative Data: Health Care Providers
Providers (n = 56) and community stakeholders (2 leaders of community-based organizations and 3 health care administrators) were interviewed, with 29 also completing the survey. The reason for not completing (n = 22) was not having the time once the interview was complete. A link to the survey was sent to any provider not completing at the time of the interview, with 2 follow-up reminders. The majority of providers were between the ages of 31 and 50 years (46.4%), female (71.4%), and white (66.1%) (Table 4). None were of Hispanic, Latinx, or Spanish origin. Thirty-six were physicians (64.3%), and 16 were allied health professionals (28.6%). Of the 56 providers, 32 indicated they had expertise caring for patients with SCD (57.1%), 14 were ED providers (25%), and 5 were primary care providers. Most of the providers practiced in an urban setting (91.1%).

Barriers to Care: ED Provider Perspectives. Nine of 14 ED providers interviewed completed the survey on their perspectives regarding barriers to care in the ED, difficulty with follow-ups, ED training resources, and pain control for patients with SCD. ED providers (n = 8) indicated that “provider attitudes” were a barrier to care delivery in the ED for patients with SCD. Some providers (n = 7) indicated that “implicit bias,” “opioid epidemic,” “concern about addiction,” and “patient behavior” were barriers. Respondents indicated that “overcrowding” (n = 6) and “lack of care pathway/protocol” (n = 5) were barriers. When asked to express their level of agreement with statements about SCD care in the ED, respondents disagreed/strongly disagreed (n = 5) that they were “able to make a follow-up appointment” with a sickle cell specialist or primary care provider upon discharge from the ED, and others disagreed/strongly disagreed (n = 4) that they were able to make a “referral to a case management program.”
ED training and resources. Providers agreed/strongly agreed (n = 8) that they had the knowledge and training to care for patients with SCD, that they had access to needed medications, and that they had access to knowledgeable nursing staff with expertise in SCD care. All 9 ED providers indicated that they had sufficient physician/provider staffing to provide good pain management to persons with SCD in the ED.
Pain control in the ED. Seven ED providers indicated that their ED used individualized dosing protocols to treat sickle cell pain, and 5 respondents indicated their ED had a protocol for treating sickle cell pain. Surprisingly, only 3 indicated that they were aware of the NHLBI recommendations for the treatment of vaso-occlusive pain.
Barriers to Care: Primary Care Provider Perspectives. Twenty providers completed the SCD provider section of the survey, including 17 multidisciplinary SCD providers from 4 sickle cell special care centers and 3 community primary care providers. Of the 20, 12 were primary care providers for patients with SCD (Table 4).
Patient needs. Six primary care providers indicated that the medical needs of patients with SCD were being met, but none indicated that the behavioral health or mental health needs were being met.
Managing SCD comorbidities. Five primary care providers indicated they were very comfortable providing preventive ambulatory care to patients with SCD. Six indicated they were very comfortable managing acute pain episodes, but none were very comfortable managing comorbidities such as pulmonary hypertension, diabetes, or chronic pain.
Barriers to opioid use. Only 3 of 12 providers reviewing a list of 15 potential barriers to the use of opioids for SCD pain management indicated a perceived lack of efficacy of opioids, development of tolerance and dependence, and concerns about community perceptions as barriers. Two providers selected potential for diversion as a moderate barrier to opioid use.
Barriers to hydroxyurea use. Eight of 12 providers indicated that the common reasons that patients/families refuse hydroxyurea were “worry about side effects”; 7 chose “don’t want to take another medicine,” and 6 chose “worry about carcinogenic potential.” Others (n = 10) indicated that “patient/family adherence with hydroxyurea” and “patient/family adherence with required blood tests” were important barriers to hydroxyurea use. Eight of the 12 providers indicated that they were comfortable with managing hydroxyurea in patients with SCD.
Care redesign. Twenty SCD and primary care providers completed the Care Redesign section of the survey. Respondents (n = 11) indicated that they would see more patients with SCD if they had accessible case management services available without charge or if patient access to transportation to clinic was also available. Ten indicated that they would see more patients with SCD if they had an accessible community health worker (who understands patient’s/family’s social situation) and access to a pain management specialist on call to answer questions and who would manage chronic pain. All (n = 20) were willing to see more patients with SCD in their practices. Most reported that a clinical decision-support tool for SCD treatment (n = 13) and avoidance of complications (n = 12) would be useful.
Discussion
We evaluated access and barriers to care, quality of care, care coordination, and provider communication from the perspectives of adolescents and adults with SCD, their care providers, and community stakeholders, within the Solberg conceptual model for quality improvement. We found that barriers within the care process content domain (context and systems) were most salient for this population of adolescents and adults with SCD, with lack of provider knowledge and poor attitudes toward adolescents and adults with SCD, particularly in the ED, cited consistently by participant groups. Stigmatization and lack of provider compassion that affected the quality of care were particularly problematic. These findings are consistent with previous reports.42,43 Adult health care (particularly ED) provider biases and negative attitudes have been recognized as major barriers to optimal pain management in SCD.8,11,44,45 Interestingly, ED providers in our needs assessment indicated that they felt they had the training and resources to manage patients with SCD. However, only a few actually reported knowing about the NHLBI recommendations for the treatment of vaso-occlusive pain.
Within the care process content domain, we also found that SCD-related complications and associated emotions (fear, worry, anxiety), compounded by lack of access to knowledgeable and compassionate providers, pose a significant burden. Negative encounters with the health care system contributed to a striking 84% of patient participants choosing to manage severe pain at home, with pain seriously interfering with their ability to function on a daily basis. ED providers agreed that provider attitudes and implicit bias pose important barriers to care for adolescents and adults with SCD. Adolescents and adults with SCD wanted, and understood the need, to enhance self-management skills. Both they and their providers agreed that barriers to hydroxyurea uptake included worries about potential side effects, challenges with adherence to repeated laboratory testing, and support with remembering to take the medicine. However, providers uniformly expressed that access to behavioral and mental health services were, if not nonexistent, impossible to access.
Participants with SCD and their providers reported infrastructural challenges (change process capability), as manifested in limitations with accessing acute and preventive care due to transportation- and insurance- related issues. There were health system barriers that were particularly encountered during the transition from pediatric to adult care. These findings are consistent with previous reports that have found fewer interdisciplinary services available in the adult care settings compared with pediatrics.46,47 Furthermore, adult care providers were less willing to accept adults with SCD because of the complexity of their management, for which the providers did not have the necessary expertise.3,48-50 In addition, both adolescents and adults with SCD and primary care providers highlighted the inadequacies of the current system in addressing the chronic pain needs of this population. Linking back to the Solberg conceptual framework, our needs assessment results confirm the important role of establishing SCD care as a priority within a health care system—this requires leadership and vision. The vision and priorities must be implemented by effective health care teams. Multilevel approaches or interventions, when implemented, will lead to the desired outcomes.
Findings from our needs assessment within our 5-county region mirror needs assessment results from the broader consortium.51 The SCDIC has prioritized developing an intervention that addresses the challenges identified within the care process domain by directly enhancing provider access to patient individualized care plans in the electronic health record in the ED. Importantly, ED providers will be asked to view a short video that directly challenges bias and stigma in the ED. Previous studies have indeed found that attitudes can be improved by providers viewing short video segments of adults with SCD discussing their experiences.36,52 This ED protocol will be one of the interventions that we will roll out in Northern California, given the significance of negative ED encounters reported by needs assessment participants. An additional feature of the intervention is a script for adults with SCD that guides them through introducing their individualized pain plan to their ED providers, thereby enhancing their self-efficacy in a situation that has been so overwhelmingly challenging.
We will implement a second SCDIC intervention that utilizes a mobile app to support self-management on the part of the patient, by supporting motivation and adherence with hydroxyurea.53 A companion app supports hydroxyurea guideline adherence on the part of the provider, in keeping with one of our findings that providers are in need of decision-support tools. Elements of the intervention also align with our findings related to the importance of a support system in managing SCD, in that participants will identify a supportive partner who will play a specific role in supporting their adherence with hydroxyurea.
On our local level, we have, by necessity, partnered with leaders and community stakeholders throughout the region to ensure that these interventions to improve SCD care are prioritized. Grant funds provide initial resources for the SCDIC interventions, but our partnering health care administrators and medical directors must ensure that participating ED and hematology providers are free from competing priorities in order to implement the changes. We have partnered with a SCD community-based organization that is designing additional educational presentations for local emergency medicine providers, with the goal to bring to life very personal stories of bias and stigma within the EDs that directly contribute to decisions to avoid ED care despite severe symptoms.
Although we attempted to obtain samples of adolescents and adults with SCD and their providers that were representative across the 5-county region, the larger proportion of respondents were from 1 county. We did not assess concerns of age- and race-matched adults in our catchment area, so we cannot definitively say that our findings are unique to SCD. However, our results are consistent with findings from the national sample of adults with SCD who participated in the ASCQ-Me field test, and with results from the SCDIC needs assessment.33,51 Interviews and surveys are subject to self-report bias and, therefore, may or may not reflect the actual behaviors or thoughts of participants. Confidence is increased in our results given the triangulation of expressed concerns across participant groups and across data collection strategies. The majority of adolescents and adults with SCD (95%) completed both the interview and survey, while 64% of ED providers interviewed completed the survey, compared with 54% of SCD specialists and primary care providers. These response rates are more than acceptable within the realm of survey response rates.54,55
Although we encourage examining issues with care delivery within the conceptual framework for quality improvement presented, we recognize that grant funding allowed us to conduct an in-depth needs assessment that might not be feasible in other settings. Still, we would like readers to understand the importance of gathering data for improvement in a systematic manner across a range of participant groups, to ultimately inform the development of interventions and provide for evaluation of outcomes as a result of the interventions. This is particularly important for a disease, such as SCD, that is both medically and sociopolitically complex.
Conclusion
Our needs assessment brought into focus the multiple factors contributing to the disparities in health care experienced by adolescents and adults with SCD on our local level, and within the context of inequities in health resources and outcomes on the national level. We propose solutions that include specific interventions developed by a consortium of SCD and implementation science experts. We utilize a quality improvement framework to ensure that the elements of the interventions also address the barriers identified by our local providers and patients that are unique to our community. The pervasive challenges in SCD care, coupled with its medical complexities, may seem insurmountable, but our survey and qualitative results provide us with a road map for the way forward.
Acknowledgments: The authors thank the adolescents and adults with sickle cell disease, the providers, and the community stakeholders who completed the interviews and surveys. The authors also acknowledge the SCCCI co-investigators for their contributions to this project, including Michael Bell, MD, Ward Hagar, MD, Christine Hoehner, FNP, Kimberly Major, MSW, Anne Marsh, MD, Lynne Neumayr, MD, and Ted Wun, MD. We also thank Kamilah Bailey, Jameelah Hodge, Jennifer Kim, Michael Rowland, Adria Stauber, Amber Fearon, and Shanda Robertson, and the Sickle Cell Data Collection Program for their contributions.
Corresponding author: Marsha J. Treadwell, PhD, University of California San Francisco Benioff Children’s Hospital Oakland, 747 52nd St., Oakland, CA 94609; marsha.treadwell@ucsf.edu.
Financial disclosures: None.
Funding/support: This work was supported by grant # 1U01HL134007 from the National Heart, Lung, and Blood Institute to the University of California San Francisco Benioff Children’s Hospital Oakland.
1. Hassell KL. Population Estimates of sickle cell disease in the U.S. Am J Prev Med. 2010; 38:S512-S521.
2. Data & Statistics on Sickle Cell Disease. Centers for Disease Control and Prevention website. www.cdc.gov/ncbddd/sicklecell/data.html. Accessed March 25, 2020.
3. Inusa BPD, Stewart CE, Mathurin-Charles S, et al. Paediatric to adult transition care for patients with sickle cell disease: a global perspective. Lancet Haematol. 2020;7:e329-e341.
4. Smith SK, Johnston J, Rutherford C, et al. Identifying social-behavioral health needs of adults with sickle cell disease in the emergency department. J Emerg Nurs. 2017;43:444-450.
5. Treadwell MJ, Barreda F, Kaur K, et al. Emotional distress, barriers to care, and health-related quality of life in sickle cell disease. J Clin Outcomes Manag. 2015;22:8-17.
6. Treadwell MJ, Hassell K, Levine R, et al. Adult Sickle Cell Quality-of-Life Measurement Information System (ASCQ-Me): conceptual model based on review of the literature and formative research. Clin J Pain. 2014;30:902-914.
7. Rizio AA, Bhor M, Lin X, et al. The relationship between frequency and severity of vaso-occlusive crises and health-related quality of life and work productivity in adults with sickle cell disease. Qual Life Res. 2020;29:1533-1547.
8. Freiermuth CE, Haywood C, Silva S, et al. Attitudes toward patients with sickle cell disease in a multicenter sample of emergency department providers. Adv Emerg Nurs J. 2014;36:335-347.
9. Jenerette CM, Brewer C. Health-related stigma in young adults with sickle cell disease. J Natl Med Assoc. 2010;102:1050-1055.
10. Lazio MP, Costello HH, Courtney DM, et al. A comparison of analgesic management for emergency department patients with sickle cell disease and renal colic. Clin J Pain. 2010;26:199-205.
11. Haywood C, Tanabe P, Naik R, et al. The impact of race and disease on sickle cell patient wait times in the emergency department. Am J Emerg Med. 2013;31:651-656.
12. Haywood C, Beach MC, Lanzkron S, et al. A systematic review of barriers and interventions to improve appropriate use of therapies for sickle cell disease. J Natl Med Assoc. 2009;101:1022-1033.
13. Mainous AG, Tanner RJ, Harle CA, et al. Attitudes toward management of sickle cell disease and its complications: a national survey of academic family physicians. Anemia. 2015;2015:1-6.
14. Yawn BP, Buchanan GR, Afenyi-Annan AN, et al. Management of sickle cell disease: summary of the 2014 evidence-based report by expert panel members. JAMA. 2014;312:1033.
15. Lunyera J, Jonassaint C, Jonassaint J, et al. Attitudes of primary care physicians toward sickle cell disease care, guidelines, and comanaging hydroxyurea with a specialist. J Prim Care Community Health. 2017;8:37-40.
16. Whiteman LN, Haywood C, Lanzkron S, et al. Primary care providers’ comfort levels in caring for patients with sickle cell disease. South Med J. 2015;108:531-536.
17. Wong TE, Brandow AM, Lim W, Lottenberg R. Update on the use of hydroxyurea therapy in sickle cell disease. Blood. 2014;124:3850-4004.
18. DiMartino LD, Baumann AA, Hsu LL, et al. The sickle cell disease implementation consortium: Translating evidence-based guidelines into practice for sickle cell disease. Am J Hematol. 2018;93:E391-E395.
19. King AA, Baumann AA. Sickle cell disease and implementation science: A partnership to accelerate advances. Pediatr Blood Cancer. 2017;64:e26649.
20. Solberg LI. Improving medical practice: a conceptual framework. Ann Fam Med. 2007;5:251-256.
21. Bodenheimer T, Wagner EH, Grumbach K. Improving primary care for patients with chronic illness. J Am Med Assoc. 2002;288:5.
22. Bodenheimer T. Interventions to improve chronic illness care: evaluating their effectiveness. Dis Manag. 2003;6:63-71.
23. Tsai AC, Morton SC, Mangione CM, Keeler EB. A meta-analysis of interventions to improve care for chronic illnesses. Am J Manag Care. 2005;11:478-488.
24. Harris PA, Taylor R, Thielke R, et al. Research electronic data capture (REDCap)—A metadata-driven methodology and workflow process for providing translational research informatics support. J Biomed Inform. 2009;42:377-381.
25. Kallio H, Pietilä A-M, Johnson M, et al. Systematic methodological review: developing a framework for a qualitative semi-structured interview guide. J Adv Nurs. 2016;72:2954-2965.
26. Clarke V, Braun V. Successful Qualitative Research: A Practical Guide for Beginners. First. Thousand Oaks, CA: Sage; 2013.
27. Hsieh H-F, Shannon SE. Three approaches to qualitative content analysis. Qual Health Res. 2005;15:1277-1288.
28. Creswell JW, Hanson WE, Clark Plano VL, et al. Qualitative research designs: selection and implementation. Couns Psychol. 2007;35:236-264.
29. Miles MB, Huberman AM, Saldana J. Qualitative Data Analysis A Methods Sourcebook. 4th ed. Thousand Oaks, CA: Sage; 2019.
30. Eckman JR, Hassell KL, Huggins W, et al. Standard measures for sickle cell disease research: the PhenX Toolkit sickle cell disease collections. Blood Adv. 2017; 1: 2703-2711.
31. Kendall R, Wagner B, Brodke D, et al. The relationship of PROMIS pain interference and physical function scales. Pain Med. 2018;19:1720-1724.
32. Amtmann D, Cook KF, Jensen MP, et al. Development of a PROMIS item bank to measure pain interference. Pain. 2010;150:173-182.
33. Evensen CT, Treadwell MJ, Keller S, et al. Quality of care in sickle cell disease: Cross-sectional study and development of a measure for adults reporting on ambulatory and emergency department care. Medicine (Baltimore). 2016;95:e4528.
34. Edwards R, Telfair J, Cecil H, et al. Reliability and validity of a self-efficacy instrument specific to sickle cell disease. Behav Res Ther. 2000;38:951-963.
35. Edwards R, Telfair J, Cecil H, et al. Self-efficacy as a predictor of adult adjustment to sickle cell disease: one-year outcomes. Psychosom Med. 2001;63:850-858.
36. Puri Singh A, Haywood C, Beach MC, et al. Improving emergency providers’ attitudes toward sickle cell patients in pain. J Pain Symptom Manage. 2016;51:628-632.e3.
37. Glassberg JA, Tanabe P, Chow A, et al. Emergency provider analgesic practices and attitudes towards patients with sickle cell disease. Ann Emerg Med. 2013;62:293-302.e10.
38. Grahmann PH, Jackson KC 2nd, Lipman AG. Clinician beliefs about opioid use and barriers in chronic nonmalignant pain [published correction appears in J Pain Palliat Care Pharmacother. 2004;18:145-6]. J Pain Palliat Care Pharmacother. 2004;18:7-28.
39. Brandow AM, Panepinto JA. Hydroxyurea use in sickle cell disease: the battle with low prescription rates, poor patient compliance and fears of toxicities. Expert Rev Hematol. 2010;3:255-260.
40. Fielding N. Triangulation and mixed methods designs: data integration with new research technologies. J Mixed Meth Res. 2012;6:124-136.
41. 2017 CAHPS Health Plan Survey Chartbook. Agency for Healthcare Research and Quality website. www.ahrq.gov/cahps/cahps-database/comparative-data/2017-health-plan-chartbook/results-enrollee-population.html. Accessed September 8, 2020.
42. Bulgin D, Tanabe P, Jenerette C. Stigma of sickle cell disease: a systematic review. Issues Ment Health Nurs. 2018;1-11.
43. Wakefield EO, Zempsky WT, Puhl RM, et al. Conceptualizing pain-related stigma in adolescent chronic pain: a literature review and preliminary focus group findings. PAIN Rep. 2018;3:e679.
44. Nelson SC, Hackman HW. Race matters: Perceptions of race and racism in a sickle cell center. Pediatr Blood Cancer. 2013;60:451-454.
45. Dyal BW, Abudawood K, Schoppee TM, et al. Reflections of healthcare experiences of african americans with sickle cell disease or cancer: a qualitative study. Cancer Nurs. 2019;10.1097/NCC.0000000000000750.
46. Renedo A. Not being heard: barriers to high quality unplanned hospital care during young people’s transition to adult services - evidence from ‘this sickle cell life’ research. BMC Health Serv Res. 2019;19:876.
47. Ballas S, Vichinsky E. Is the medical home for adult patients with sickle cell disease a reality or an illusion? Hemoglobin. 2015;39:130-133.
48. Hankins JS, Osarogiagbon R, Adams-Graves P, et al. A transition pilot program for adolescents with sickle cell disease. J Pediatr Health Care. 2012;26 e45-e49.
49. Smith WR, Sisler IY, Johnson S, et al. Lessons learned from building a pediatric-to-adult sickle cell transition program. South Med J. 2019;112:190-197.
50. Lanzkron S, Sawicki GS, Hassell KL, et al. Transition to adulthood and adult health care for patients with sickle cell disease or cystic fibrosis: Current practices and research priorities. J Clin Transl Sci. 2018;2:334-342.
51. Kanter J, Gibson R, Lawrence RH, et al. Perceptions of US adolescents and adults with sickle cell disease on their quality of care. JAMA Netw Open. 2020;3:e206016.
52. Haywood C, Lanzkron S, Hughes MT, et al. A video-intervention to improve clinician attitudes toward patients with sickle cell disease: the results of a randomized experiment. J Gen Intern Med. 2011;26:518-523.
53. Hankins JS, Shah N, DiMartino L, et al. Integration of mobile health into sickle cell disease care to increase hydroxyurea utilization: protocol for an efficacy and implementation study. JMIR Res Protoc. 2020;9:e16319.
54. Fan W, Yan Z. Factors affecting response rates of the web survey: A systematic review. Comput Hum Behav. 2010;26:132-139.
55. Millar MM, Dillman DA. Improving response to web and mixed-mode surveys. Public Opin Q. 2011;75:249-269.
From the University of California San Francisco (Dr. Treadwell, Dr. Hessler, Yumei Chen, Swapandeep Mushiana, Dr. Potter, and Dr. Vichinsky), the University of California Los Angeles (Dr. Jacob), and the University of California Berkeley (Alex Chen).
Abstract
- Objective: Adolescents and adults with sickle cell disease (SCD) face pervasive disparities in health resources and outcomes. We explored barriers to and facilitators of care to identify opportunities to support implementation of evidence-based interventions aimed at improving care quality for patients with SCD.
- Methods: We engaged a representative sample of adolescents and adults with SCD (n = 58), health care providers (n = 51), and community stakeholders (health care administrators and community-based organization leads (n = 5) in Northern California in a community-based needs assessment. We conducted group interviews separately with participant groups to obtain in-depth perspectives. Adolescents and adults with SCD completed validated measures of pain interference, quality of care, self-efficacy, and barriers to care. Providers and community stakeholders completed surveys about barriers to SCD care.
- Results: We triangulated qualitative and quantitative data and found that participants with SCD (mean age, 31 ± 8.6 years), providers, and community stakeholders emphasized the social and emotional burden of SCD as barriers. Concrete barriers agreed upon included insurance and lack of resources for addressing pain impact. Adolescents and adults with SCD identified provider issues (lack of knowledge, implicit bias), transportation, and limited social support as barriers. Negative encounters with the health care system contributed to 84% of adolescents and adults with SCD reporting they chose to manage severe pain at home. Providers focused on structural barriers: lack of access to care guidelines, comfort level with and knowledge of SCD management, and poor care coordination.
- Conclusion: Strategies for improving access to compassionate, evidence-based quality care, as well as strategies for minimizing the burden of having SCD, are warranted for this medically complex population.
Keywords: barriers to care; quality of care; care access; care coordination.
Sickle cell disease (SCD), an inherited chronic medical condition, affects about 100,000 individuals in the United States, a population that is predominantly African American.1 These individuals experience multiple serious and life-threatening complications, most frequently recurrent vaso-occlusive pain episodes,2 and they require interactions with multidisciplinary specialists from childhood. Because of advances in treatments, the majority are reaching adulthood; however, there is a dearth of adult health care providers with the training and expertise to manage their complex medical needs.3 Other concrete barriers to adequate SCD care include insurance and distance to comprehensive SCD centers.4,5
Social, behavioral, and emotional factors may also contribute to challenges with SCD management. SCD may limit daily functional abilities and lead to diminished overall quality of life.6,7 Some adolescents and adults may require high doses of opioids, which contributes to health care providers’ perceptions that there is a high prevalence of drug addiction in the population.8,9 These providers express negative attitudes towards adults with SCD, and, consequently, delay medication administration when it is acutely needed and provide otherwise suboptimal treatment.8,10,11 Adult care providers may also be uncomfortable with prescribing and managing disease-modifying therapies (blood transfusion, hydroxyurea) that have established efficacy.12-17
As 1 of 8 programs funded by the National Heart, Lung, and Blood Institute’s (NHLBI) Sickle Cell Disease Implementation Consortium (SCDIC), we are using implementation science to reduce barriers to care and improve quality of care and health care outcomes in SCD.18,19 Given that adolescents and adults with SCD experience high mortality, severe pain, and progressive decline in their ability to function day to day, and also face lack of access to knowledgeable, compassionate providers in primary and emergency settings, the SCDIC focuses on individuals aged 15 to 45 years.6,8,9,11,12
Our regional SCDIC program, the Sickle Cell Care Coordination Initiative (SCCCI), brings together researchers, clinicians, adolescents, and adults with SCD and their families, dedicated community members, policy makers, and administrators to identify and address barriers to health care within 5 counties in Northern California. One of our first steps was to conduct a community-based needs assessment, designed to inform implementation of evidence-based interventions, accounting for unique contextual factors in our region.
Conceptual Framework for Improving Medical Practice
Our needs assessment is guided by Solberg’s Conceptual Framework for Improving Medical Practice (Figure 1).20 Consistent with the overarching principles of the SCDIC, this conceptual framework focuses on the inadequate implementation of evidence-based guidelines, and on the need to first understand multifactorial facilitators and barriers to guideline implementation in order to effect change. The framework identifies 3 main elements that must be present to ensure improvements in quality-of-care processes and patient outcomes: priority, change process capability, and care process content. Priority refers to ample resource allocation for the specific change, as well as freedom from competing priorities for those implementing the change. Change process capability includes strong, effective leadership, adequate infrastructure for managing change (including resources and time), change management skills at all levels, and an established clinical information system. Care process content refers to context and systems-level changes, such as delivery system redesign as needed, support for self-management to lessen the impact of the disease, and decision support.21-23
The purpose of our community-based needs assessment was to evaluate barriers to care and quality of care in SCD, within Solberg’s conceptual model for improving medical practice. The specific aims were to evaluate access and barriers to care (eg, lack of provider expertise and training, health care system barriers such as poor care coordination and provider communication); evaluate quality of care; and assess patient needs related to pain, pain interference, self-efficacy, and self-management for adolescents and adults with SCD. We gathered the perspectives of a representative community of adolescents and adults with SCD, their providers, and community stakeholders in order to examine barriers, quality of life and care, and patient experiences in our region.
Methods
Design
In this cross-sectional study, adolescents and adults with SCD, their providers, and community stakeholders participated in group or individual qualitative interviews and completed surveys between October 2017 and March 2018.
Setting and Sample
Recruitment flyers were posted on a regional SCD-focused website, and clinical providers or a study coordinator introduced information about the needs assessment to potential participants with SCD during clinic visits at the participating centers. Participants with SCD were eligible if they had any diagnosis of SCD, were aged 15 to 48 years, and received health services within 5 Northern California counties (Alameda, Contra Costa, Sacramento, San Francisco, and Solano). They were excluded if they did not have a SCD diagnosis or had not received health services within the catchment area. As the project proceeded, participants were asked to refer other adolescents and adults with SCD for the interviews and surveys (snowball sampling). Our goal was to recruit 50 adolescents and adults with SCD into the study, aiming for 10 representatives from each county.
Providers and community stakeholders were recruited via emails, letters and informational flyers. We engaged our partner, the Sickle Cell Data Collection Program,2 to generate a list of providers and institutions that had seen patients with SCD in primary, emergency, or inpatient settings in the region. We contacted these institutions to describe the SCCCI and invite participation in the needs assessment. We also invited community-based organization leads and health care administrators who worked with SCD to participate. Providers accessed confidential surveys via a secure link on the study website or completed paper versions. Common data collected across providers included demographics and descriptions of practice settings.
Participants were eligible to be part of the study if they were health care providers (physicians and nurses) representing hematology, primary care, family medicine, internal medicine, or emergency medicine; ancillary staff (social work, psychology, child life); or leaders or administrators of clinical or sickle cell community-based organizations in Northern California (recruitment goal of n = 50). Providers were excluded if they practiced in specialties other than those noted or did not practice within the region.
Data Collection Procedures
After providing assent/consent, participating adolescents and adults with SCD took part in individual and group interviews and completed survey questionnaires. All procedures were conducted in a private space in the sickle cell center or community. Adolescents and adults with SCD completed the survey questionnaire on a tablet, with responses recorded directly in a REDCap (Research Electronic Data Capture) database,24 or on a paper version. Interviews lasted 60 (individual) to 90 (group) minutes, while survey completion time was 20 to 25 minutes. Each participant received a gift card upon completion as an expression of appreciation. All procedures were approved by the institutional review boards of the participating health care facilities.
Group and Individual Interviews
Participants with SCD and providers were invited to participate in a semi-structured qualitative interview prior to being presented with the surveys. Adolescents and adults with SCD were interviewed about barriers to care, quality of care, and pain-related experiences. Providers were asked about barriers to care and treatments. Interview guides were modified for community-based organization leaders and health care administrators who did not provide clinical services. Interview guides can be found in the Appendix. Interviews were conducted by research coordinators trained in qualitative research methods by the first author (MT). As appropriate with semi-structured interviews, the interviewers could word questions spontaneously, change the order of questions for ease of flow of conversation, and inform simultaneous coding of interviews with new themes as those might arise, as long as they touched on all topics within the interview guide.25 The interview guides were written, per qualitative research standards, based on the aims and purpose of the research,26 and were informed by existing literature on access and barriers to care in SCD, quality of care, and the needs of individuals with SCD, including in relation to impact of the disease, self-efficacy, and self-management.
Interviewees participated in either individual or group interviews, but not both. The decision for which type of interview an individual participated in was based on 2 factors: if there were not comparable participants for group interviews (eg, health care administrator and community-based organization lead), these interviews were done individually; and given that we were drawing participants from a 5-county area in Northern California, scheduling was challenging for individuals with SCD with regard to aligning schedules and traveling to a central location where the group interviews were conducted. Provider group interviews were easier to arrange because we could schedule them at the same time as regularly scheduled meetings at the participants’ health care institutions.
Interview Data Gathering and Analysis
Digital recordings of the interviews were cleaned of any participant identifying data and sent for transcription to an outside service. Transcripts were reviewed for completeness and imported into NVivo (www.qsrinternational.com), a qualitative data management program.
A thematic content analysis and deductive and inductive approaches were used to analyze the verbatim transcripts generated from the interviews. The research team was trained in the use of NVivo software to facilitate the coding process. A deductive coding scheme was initially used based on existing concepts in the literature regarding challenges to optimal SCD care, with new codes added as the thematic content analyses progressed. The initial coding, pattern coding, and use of displays to examine the relationships between different categories were conducted simultaneously.27,28 Using the constant comparative method, new concepts from participants with SCD and providers could be incorporated into subsequent interviews with other participants. For this study, the only additional concepts added were in relation to participant recruitment and retention in the SCDIC Registry. Research team members coded transcripts separately and came together weekly, constantly comparing codes and developing the consensus coding scheme. Where differences between coders existed, code meanings were discussed and clarified until consensus was reached.29
Quantitative data were analyzed using SPSS (v. 25, Chicago, IL). Descriptive statistics (means, standard deviations, frequencies, percentages) were used to summarize demographics (eg, age, gender, and race), economic status, and type of SCD. No systematic differences were detected from cases with missing values. Scale reliabilities (ie, Cronbach α) were evaluated for self-report measures.
Measurement
Adolescents and adults with SCD completed items from the PhenX Toolkit (consensus measures for Phenotypes and eXposures), assessing sociodemographics (age, sex, race, ethnicity, educational attainment, occupation, marital status, annual income, insurance), and clinical characteristics (sickle cell diagnosis and emergency department [ED] and hospital utilization for pain).30
Pain Interference Short Form (Patient-Reported Outcomes Measurement Information System [PROMIS]). The Pain Interference Form consists of 8 items that assess the degree to which pain interfered with day-to-day activities in the previous 7 days at home, including impacts on social, cognitive, emotional, and physical functioning; household chores and recreational activities; sleep; and enjoyment in life. Reliability and validity of the PROMIS Pain Interference Scale has been demonstrated, with strong negative correlations with Physical Function Scales (r = 0.717, P < 0.01), indicating that higher scores are associated with lower function (β = 0.707, P < 0.001).31 The Cronbach α estimate for the other items on the pain interference scale was 0.99. Validity analysis indicated strong correlations with pain-related domains: BPI Interference Subscale (rho = 0.90), SF-36 Bodily Pain Subscale (rho = –0.84), and 0–10 Numerical Rating of Pain Intensity (rho = 0.48).32
Adult Sickle Cell Quality of Life Measurement Information System (ASCQ-Me) Quality of Care (QOC). ASCQ-Me QOC consists of 27 items that measure the quality of care that adults with SCD have received from health care providers.33 There are 3 composites: provider communication (quality of patient and provider communication), ED care (quality of care in the ED), and access (to routine and emergency care). Internal consistency reliability for all 3 composites is greater than 0.70. Strong correlations of the provider communication composite with overall ratings of routine care (r = 0.65) and overall provider ratings (r = 0.83) provided evidence of construct validity. Similarly, the ED care composite was strongly correlated with overall ratings of QOC in the ED, and the access composite was highly correlated with overall evaluations of ED care (r = 0.70). Access, provider interaction, and ED care composites were reliable (Cronbach α, 0.70–0.83) and correlated with ratings of global care (r = 0.32–0.83), further indicating construct validity.33
Sickle Cell Self-Efficacy Scale (SCSES). The SCSES is a 9-item, self-administered questionnaire measuring perceptions of the ability to manage day-to-day issues resulting from SCD. SCSES items are scored on a 5-point scale ranging from Not sure at all (1) to Very sure (5). Individual item responses are summed to give an overall score, with higher scores indicating greater self-efficacy. The SCSES has acceptable reliability (r = 0.45, P < 0.001) and validity (α = 0.89).34,35
Sickle Cell Disease Barriers Checklist. This checklist consists of 53 items organized into 8 categories: insurance, transportation, accommodations and accessibility, provider knowledge and attitudes, social support, individual barriers such as forgetting or difficulties understanding instructions, emotional barriers (fear, anger), and disease-related barriers. Participants check applicable barriers, with a total score range of 0 to 53 and higher scores indicating more barriers to care. The SCD Barriers Checklist has demonstrated face validity and test-retest reliability (Pearson r = 0.74, P < 0.05).5
ED Provider Checklist. The ED provider survey is a checklist of 14 statements pertaining to issues regarding patient care, with which the provider rates level of agreement. Items representing the attitudes and beliefs of providers towards patients with SCD are rated on a Likert-type scale, with level of agreement indicated as 1 (strongly disagree) to 6 (strongly agree). The positive attitudes subscale consists of 4 items (Cronbach α= 0.85), and the negative attitudes subscale consists of 6 items (Cronbach α = 0.89). The Red-Flag Behaviors subscale includes 4 items that indicate behavior concerns about drug-seeking, such as requesting specific narcotics and changing behavior when the provider walks in.8,36,37
Sickle cell and primary care providers also completed a survey consisting of sets of items compiled from existing provider surveys; this survey consisted of a list of 16 barriers to using opioids, which the providers rated on a 5-point Likert-type scale (1, not a barrier; 5, complete barrier).13,16,38 Providers indicated their level of experience with caring for patients with SCD; care provided, such as routine health screenings; and comfort level with providing preventive care, managing comorbidities, and managing acute and chronic pain. Providers were asked what potential facilitators might improve care for patients with SCD, including higher reimbursement, case management services, access to pain management specialists, and access to clinical decision-support tools. Providers responded to specific questions about management with hydroxyurea (eg, criteria for, barriers to, and comfort level with prescribing).39 The surveys are included in the Appendix.
Triangulation
Data from the interviews and surveys were triangulated to enhance understanding of results generated from the different data sources.40 Convergence of findings, different facets of the same phenomenon, or new perspectives were examined.
Results
Qualitative Data
Adolescents and adults with SCD (n = 55) and health care providers and community stakeholders (n = 56) participated in group or individual interviews to help us gain an in-depth understanding of the needs and barriers related to SCD care in our 5-county region. Participants with SCD described their experiences, which included stigma, racism, labeling, and, consequently, stress. They also identified barriers such as lack of transportation, challenges with insurance, and lack of access to providers who were competent with pain management. They reported that having SCD in a health care system that was unable to meet their needs was burdensome.
Barriers to Care and Treatments. Adolescents and adults indicated that SCD and its sequelae posed significant barriers to health care. Feelings of tiredness and pain make it more difficult for them to seek care. The emotional burden of SCD (fear and anger) was a frequently cited barrier, which was fueled by previous negative encounters with the health care system. All adolescents and adults with SCD reported that they knew of stigma in relation to seeking pain management that was pervasive and long-standing, and the majority reported they had directly experienced stigma. They reported that being labeled as “drug-seekers” was typical when in the ED for pain management. Participants articulated unconscious bias or overt racism among providers: “people with sickle cell are Black ... and Black pain is never as valuable as White pain” (25-year-old male). Respondents with SCD described challenges to the credibility of their pain reports in the ED. They reported that ED providers expressed doubts regarding the existence and/or severity of their pain, consequently creating a feeling of disrespect for patients seeking pain relief. The issue of stigma was mentioned by only 2 of 56 providers during their interviews.
Lack of Access to Knowledgeable, Compassionate Providers. Lack of access to knowledgeable care providers was another prevalent theme expressed by adolescents and adults with SCD. Frustration occurred when providers did not have knowledge of SCD and its management, particularly pain assessment. Adolescents and adults with SCD noted the lack of compassion among providers: “I’ve been kicked out of the hospital because they felt like okay, well we gave you enough medication, you should be all right” (29-year-old female). Providers specifically mentioned lack of compassion and knowledge as barriers to SCD care much less often during their interviews compared with the adolescents and adults with SCD.
Health Care System Barriers. Patient participants often expressed concerns about concrete and structural aspects of care. Getting to their appointments was a challenge for half of the interviewees, as they either did not have access to a vehicle or could not afford to travel the needed distance to obtain quality care. Even when hospitals were accessible by public transportation, those with excruciating pain understandably preferred a more comfortable and private way to travel: “I would like to change that, something that will be much easier, convenient for sickle cell patients that do suffer with pain, that they don’t have to travel always to see the doctor” (30-year-old male).
Insurance and other financial barriers also played an important role in influencing decisions to seek health care services. Medical expenses were not covered, or co-pays were too high. The Medicaid managed care system could prevent access to knowledgeable providers who were not within network. Such a lack of access discouraged some adolescents and adults with SCD from seeking acute and preventive care.
Transition From Pediatric to Adult Care. Interviewees with SCD expressed distress about the gap between pediatric and adult care. They described how they had a long-standing relationship with their medical providers, who were familiar with their medical background and history from childhood. Adolescent interviewees reported an understanding of their own pain management as well as adherence to and satisfaction with their individualized pain plans. However, adults noted that satisfaction plummeted with increasing age due to the limited number of experienced adult SCD providers, which was compounded by negative experiences (stigma, racism, drug-seeking label).
One interviewee emphasized the difficulty of finding knowledgeable providers after transition: “When you’re a pediatric sickle cell [patient], you have the doctors there every step of the way, but not with adult sickle cell… I know when I first transitioned I never felt more alone in my life… you look at that ER doctor kind of with the same mindset as you would your hematologist who just hand walked you through everything. And adult care providers were a lot more blunt and cold and they’re like… ‘I don’t know; I’m not really educated in sickle cell.’” A sickle cell provider shared his insight about the problem of transitioning: “I think it’s particularly challenging because we, as a community, don’t really set them up for success. It’s different from other chronic conditions [in that] it’s much harder to find an adult sickle cell provider. There’s not a lot of adult hematologists that will take care of our adult patients, and so I know statistically, there’s like a drop-down in the overall outcomes of our kids after they age out of our pediatric program.”
Self-Management, Supporting Hydroxyurea Use. Interview participants with SCD reported using a variety of methods to manage pain at home and chose to go to the ED only when the pain became intolerable. Patients and providers expressed awareness of different resources for managing pain at home, yet they also indicated that these resources have not been consolidated in an accessible way for patients and families. Some resources cited included heat therapy, acupuncture, meditation, medical marijuana, virtual reality devices, and pain medications other than opioids.
Patients and providers expressed the need for increasing awareness and education about hydroxyurea. Many interview participants with SCD were concerned about side effects, multiple visits with a provider during dose titration, and ongoing laboratory monitoring. They also expressed difficulties with scheduling multiple appointments, depending on access to transportation and limited provider clinic hours. They were aware of strategies for improving adherence with hydroxyurea, including setting phone alarms, educating family members about hydroxyurea, and eliciting family support, but expressed needing help to consistently implement these strategies.
Safe Opioid Prescribing. Adult care providers expressed concerns about safe opioid prescribing for patients with SCD. They were reluctant to prescribe opioid doses needed to adequately control SCD pain. Providers expressed uncertainty and fear or concern about medical/legal liability or about their judgment about what’s safe and not safe for patients with chronic use/very high doses of opioids. “I know we’re in like this opiate epidemic here in this country but I feel like these patients don’t really fit under that umbrella that the problem is coming from so [I am] just trying to learn more about how to take care of them.”
Care Coordination and Provider Communication. Adolescents and adults with SCD reported having positive experiences—good communication, established trust, and compassionate care—with their usual providers. However, they perceived that ED physicians and nurses did not really care about them. Both interviewees with SCD and providers recognized the importance of good communication in all settings as the key to overcoming barriers to receiving quality care. All agreed on the importance of using individual pain plans so that all providers, especially ED providers, can be more at ease with treating adolescents and adults with SCD.
Quantitative Data: Adolescents and Adults With SCD
Fifty-eight adolescents and adults with SCD (aged 15 to 48 years) completed the survey. Three additional individuals who did not complete the interview completed the survey. Reasons for not completing the interview included scheduling challenges (n = 2) or a sickle cell pain episode (n = 1). The average age of participants was 31 years ± 8.6, more than half (57%) were female, and the majority (93%) were African American (Table 1). Most (71%) had never been married. Half (50%) had some college or an associate degree, and 40% were employed and reported an annual household income of less than $30,000. Insurance coverage was predominantly Medi-Cal (Medicaid, 69%). The majority of participants resided in Alameda (34.5%) or Contra Costa (21%) counties. The majority of sickle cell care was received in Alameda County, whether outpatient (52%), inpatient (40%), or ED care (41%). The majority (71%) had a diagnosis of SCD hemoglobin SS.
Pain. More than one-third of individuals with SCD reported 1 or 2 ED visits for pain in the previous 6 months (34%), and more than 3 hospitalizations (36%) related to pain in the previous year (Table 2). The majority (85%) reported having severe pain at home in the previous 6 months that they did not seek health care for, consistent with their reports in the qualitative interviews. More than half (59%) reported 4 or more of these severe pain episodes that led to inability to perform daily activities for 1 week or more. While pain interference on the PROMIS Pain Interference Short Form on average (T-score, 59.6 ± 8.6) was similar to that of the general population (T-score, 50 ± 10), a higher proportion of patients with SCD reported pain interference compared with the general population. The mean self-efficacy (confidence in ability to manage complications of SCD) score on the SCSES of 30.0 ± 7.3 (range, 9–45) was similar to that of other adults with SCD (mean, 32.2 ± 7.0). Twenty-five percent of the present sample had a low self-efficacy score (< 25).
Barriers to Care and Treatments. Consistent with the qualitative data, SCD-related symptoms such as tiredness (64%) and pain (62%) were reported most often as barriers to care (Table 3). Emotions (> 25%) such as worry/fear, frustration/anger, and lack of confidence were other important barriers to care. Provider knowledge and attitudes were cited next most often, with 38% of the sample indicating “Providers accuse me of drug-seeking” and “It is hard for me to find a provider who has enough experiences with or knowledge about SCD.” Participants expressed that they were not believed when in pain and “I am treated differently from other patients.” Almost half of respondents cited “I am not seen quickly enough when I am in pain” as a barrier to their care.
Consistent with the qualitative data, transportation barriers (not having a vehicle, costs of transportation, public transit not easy to get to) were cited by 55% of participants. About half of participants reported that insurance was an important barrier, with high co-pays and medications and other services not covered. In addition, gathering approvals was a long and fragmented process, particularly for consultations among providers (hematology, primary care provider, pain specialist). Furthermore, insurance provided limited choices about location for services.
Participants reported social support system burnout (22%), help needed with daily activities (21%), and social isolation or generally not having enough support (33%) as ongoing barriers. Difficulties were encountered with self-management (eg, taking medications on time or making follow-up appointments, 19%), with 22% of participants finding the health care system confusing or hard to understand. Thirty percent reported “Places for me to go to learn how to stay well are not close by or easy to get to.” ”Worry about side effects” (33%) was a common barrier to hydroxyurea use. Participants described “forgetting to take the medicine,” “tried before but it did not work,” “heard scary things” about hydroxyurea, and “not interested in taking another medicine” as barriers.
Quality of Care. More than half (51%) of the 53 participants who had accessed health care in the previous year rated their overall health care as poor on the ASCQ-Me QOC measure. This was significantly higher compared to the reports from more than 47,000 adults with Medicaid in 2017 (16%),41 and to the 2008-2009 report from 556 adults with SCD from across the United States (37%, Figure 2).33 The major contributor to these poor ratings for participants in our sample was low satisfaction with ED care.
Sixty percent of the 42 participants who had accessed ED care in the past year indicated “never” or “sometimes” to the question “When you went to the ED for care, how often did you get it as soon as you wanted?” compared with only 16% of the 2017 adult Medicaid population responding (n = 25,789) (Figure 3). Forty-seven percent of those with an ED visit indicated that, in the previous 12 months, they had been made to wait “more than 2 hours before receiving treatment for acute pain in the ED.” However, in the previous 12 months, 39% reported that their wait time in the ED had been only “between five minutes and one hour.”
On the ASCQ-Me QOC Access to Care composite measure, 33% of 42 participants responding reported they were seen at a routine appointment as soon as they would have liked. This is significantly lower compared to 56% of the adult Medicaid population responding to the same question. Reports of provider communication (Provider Communication composite) for adolescents and adults with SCD were comparable to reports of adults with SCD from the ASCQ-Me field test,33 but adults with Medicaid reported higher ratings of quality communication behaviors (Figure 4).33,41 Nearly 60% of both groups with SCD reported that providers “always” performed quality communication behaviors—listened carefully, spent enough time, treated them with respect, and explained things well—compared with more than 70% of adults with Medicaid.
Participants from all counties reported the same number of barriers to care on average (3.3 ± 2.1). Adolescents and adults who reported more barriers to care also reported lower satisfaction with care (r = –0.47, P < 0.01) and less confidence in their ability to manage their SCD (self-efficacy, r = – 0.36, P < 0.05). Female participants reported more barriers to care on average compared with male participants (2.6 ± 2.4 vs 1.4 ± 2.0, P = 0.05). Participants with higher self-efficacy reported lower pain ratings (r = –0.47, P < 0.001).
Quantitative Data: Health Care Providers
Providers (n = 56) and community stakeholders (2 leaders of community-based organizations and 3 health care administrators) were interviewed, with 29 also completing the survey. The reason for not completing (n = 22) was not having the time once the interview was complete. A link to the survey was sent to any provider not completing at the time of the interview, with 2 follow-up reminders. The majority of providers were between the ages of 31 and 50 years (46.4%), female (71.4%), and white (66.1%) (Table 4). None were of Hispanic, Latinx, or Spanish origin. Thirty-six were physicians (64.3%), and 16 were allied health professionals (28.6%). Of the 56 providers, 32 indicated they had expertise caring for patients with SCD (57.1%), 14 were ED providers (25%), and 5 were primary care providers. Most of the providers practiced in an urban setting (91.1%).
Barriers to Care: ED Provider Perspectives. Nine of 14 ED providers interviewed completed the survey on their perspectives regarding barriers to care in the ED, difficulty with follow-ups, ED training resources, and pain control for patients with SCD. ED providers (n = 8) indicated that “provider attitudes” were a barrier to care delivery in the ED for patients with SCD. Some providers (n = 7) indicated that “implicit bias,” “opioid epidemic,” “concern about addiction,” and “patient behavior” were barriers. Respondents indicated that “overcrowding” (n = 6) and “lack of care pathway/protocol” (n = 5) were barriers. When asked to express their level of agreement with statements about SCD care in the ED, respondents disagreed/strongly disagreed (n = 5) that they were “able to make a follow-up appointment” with a sickle cell specialist or primary care provider upon discharge from the ED, and others disagreed/strongly disagreed (n = 4) that they were able to make a “referral to a case management program.”
ED training and resources. Providers agreed/strongly agreed (n = 8) that they had the knowledge and training to care for patients with SCD, that they had access to needed medications, and that they had access to knowledgeable nursing staff with expertise in SCD care. All 9 ED providers indicated that they had sufficient physician/provider staffing to provide good pain management to persons with SCD in the ED.
Pain control in the ED. Seven ED providers indicated that their ED used individualized dosing protocols to treat sickle cell pain, and 5 respondents indicated their ED had a protocol for treating sickle cell pain. Surprisingly, only 3 indicated that they were aware of the NHLBI recommendations for the treatment of vaso-occlusive pain.
Barriers to Care: Primary Care Provider Perspectives. Twenty providers completed the SCD provider section of the survey, including 17 multidisciplinary SCD providers from 4 sickle cell special care centers and 3 community primary care providers. Of the 20, 12 were primary care providers for patients with SCD (Table 4).
Patient needs. Six primary care providers indicated that the medical needs of patients with SCD were being met, but none indicated that the behavioral health or mental health needs were being met.
Managing SCD comorbidities. Five primary care providers indicated they were very comfortable providing preventive ambulatory care to patients with SCD. Six indicated they were very comfortable managing acute pain episodes, but none were very comfortable managing comorbidities such as pulmonary hypertension, diabetes, or chronic pain.
Barriers to opioid use. Only 3 of 12 providers reviewing a list of 15 potential barriers to the use of opioids for SCD pain management indicated a perceived lack of efficacy of opioids, development of tolerance and dependence, and concerns about community perceptions as barriers. Two providers selected potential for diversion as a moderate barrier to opioid use.
Barriers to hydroxyurea use. Eight of 12 providers indicated that the common reasons that patients/families refuse hydroxyurea were “worry about side effects”; 7 chose “don’t want to take another medicine,” and 6 chose “worry about carcinogenic potential.” Others (n = 10) indicated that “patient/family adherence with hydroxyurea” and “patient/family adherence with required blood tests” were important barriers to hydroxyurea use. Eight of the 12 providers indicated that they were comfortable with managing hydroxyurea in patients with SCD.
Care redesign. Twenty SCD and primary care providers completed the Care Redesign section of the survey. Respondents (n = 11) indicated that they would see more patients with SCD if they had accessible case management services available without charge or if patient access to transportation to clinic was also available. Ten indicated that they would see more patients with SCD if they had an accessible community health worker (who understands patient’s/family’s social situation) and access to a pain management specialist on call to answer questions and who would manage chronic pain. All (n = 20) were willing to see more patients with SCD in their practices. Most reported that a clinical decision-support tool for SCD treatment (n = 13) and avoidance of complications (n = 12) would be useful.
Discussion
We evaluated access and barriers to care, quality of care, care coordination, and provider communication from the perspectives of adolescents and adults with SCD, their care providers, and community stakeholders, within the Solberg conceptual model for quality improvement. We found that barriers within the care process content domain (context and systems) were most salient for this population of adolescents and adults with SCD, with lack of provider knowledge and poor attitudes toward adolescents and adults with SCD, particularly in the ED, cited consistently by participant groups. Stigmatization and lack of provider compassion that affected the quality of care were particularly problematic. These findings are consistent with previous reports.42,43 Adult health care (particularly ED) provider biases and negative attitudes have been recognized as major barriers to optimal pain management in SCD.8,11,44,45 Interestingly, ED providers in our needs assessment indicated that they felt they had the training and resources to manage patients with SCD. However, only a few actually reported knowing about the NHLBI recommendations for the treatment of vaso-occlusive pain.
Within the care process content domain, we also found that SCD-related complications and associated emotions (fear, worry, anxiety), compounded by lack of access to knowledgeable and compassionate providers, pose a significant burden. Negative encounters with the health care system contributed to a striking 84% of patient participants choosing to manage severe pain at home, with pain seriously interfering with their ability to function on a daily basis. ED providers agreed that provider attitudes and implicit bias pose important barriers to care for adolescents and adults with SCD. Adolescents and adults with SCD wanted, and understood the need, to enhance self-management skills. Both they and their providers agreed that barriers to hydroxyurea uptake included worries about potential side effects, challenges with adherence to repeated laboratory testing, and support with remembering to take the medicine. However, providers uniformly expressed that access to behavioral and mental health services were, if not nonexistent, impossible to access.
Participants with SCD and their providers reported infrastructural challenges (change process capability), as manifested in limitations with accessing acute and preventive care due to transportation- and insurance- related issues. There were health system barriers that were particularly encountered during the transition from pediatric to adult care. These findings are consistent with previous reports that have found fewer interdisciplinary services available in the adult care settings compared with pediatrics.46,47 Furthermore, adult care providers were less willing to accept adults with SCD because of the complexity of their management, for which the providers did not have the necessary expertise.3,48-50 In addition, both adolescents and adults with SCD and primary care providers highlighted the inadequacies of the current system in addressing the chronic pain needs of this population. Linking back to the Solberg conceptual framework, our needs assessment results confirm the important role of establishing SCD care as a priority within a health care system—this requires leadership and vision. The vision and priorities must be implemented by effective health care teams. Multilevel approaches or interventions, when implemented, will lead to the desired outcomes.
Findings from our needs assessment within our 5-county region mirror needs assessment results from the broader consortium.51 The SCDIC has prioritized developing an intervention that addresses the challenges identified within the care process domain by directly enhancing provider access to patient individualized care plans in the electronic health record in the ED. Importantly, ED providers will be asked to view a short video that directly challenges bias and stigma in the ED. Previous studies have indeed found that attitudes can be improved by providers viewing short video segments of adults with SCD discussing their experiences.36,52 This ED protocol will be one of the interventions that we will roll out in Northern California, given the significance of negative ED encounters reported by needs assessment participants. An additional feature of the intervention is a script for adults with SCD that guides them through introducing their individualized pain plan to their ED providers, thereby enhancing their self-efficacy in a situation that has been so overwhelmingly challenging.
We will implement a second SCDIC intervention that utilizes a mobile app to support self-management on the part of the patient, by supporting motivation and adherence with hydroxyurea.53 A companion app supports hydroxyurea guideline adherence on the part of the provider, in keeping with one of our findings that providers are in need of decision-support tools. Elements of the intervention also align with our findings related to the importance of a support system in managing SCD, in that participants will identify a supportive partner who will play a specific role in supporting their adherence with hydroxyurea.
On our local level, we have, by necessity, partnered with leaders and community stakeholders throughout the region to ensure that these interventions to improve SCD care are prioritized. Grant funds provide initial resources for the SCDIC interventions, but our partnering health care administrators and medical directors must ensure that participating ED and hematology providers are free from competing priorities in order to implement the changes. We have partnered with a SCD community-based organization that is designing additional educational presentations for local emergency medicine providers, with the goal to bring to life very personal stories of bias and stigma within the EDs that directly contribute to decisions to avoid ED care despite severe symptoms.
Although we attempted to obtain samples of adolescents and adults with SCD and their providers that were representative across the 5-county region, the larger proportion of respondents were from 1 county. We did not assess concerns of age- and race-matched adults in our catchment area, so we cannot definitively say that our findings are unique to SCD. However, our results are consistent with findings from the national sample of adults with SCD who participated in the ASCQ-Me field test, and with results from the SCDIC needs assessment.33,51 Interviews and surveys are subject to self-report bias and, therefore, may or may not reflect the actual behaviors or thoughts of participants. Confidence is increased in our results given the triangulation of expressed concerns across participant groups and across data collection strategies. The majority of adolescents and adults with SCD (95%) completed both the interview and survey, while 64% of ED providers interviewed completed the survey, compared with 54% of SCD specialists and primary care providers. These response rates are more than acceptable within the realm of survey response rates.54,55
Although we encourage examining issues with care delivery within the conceptual framework for quality improvement presented, we recognize that grant funding allowed us to conduct an in-depth needs assessment that might not be feasible in other settings. Still, we would like readers to understand the importance of gathering data for improvement in a systematic manner across a range of participant groups, to ultimately inform the development of interventions and provide for evaluation of outcomes as a result of the interventions. This is particularly important for a disease, such as SCD, that is both medically and sociopolitically complex.
Conclusion
Our needs assessment brought into focus the multiple factors contributing to the disparities in health care experienced by adolescents and adults with SCD on our local level, and within the context of inequities in health resources and outcomes on the national level. We propose solutions that include specific interventions developed by a consortium of SCD and implementation science experts. We utilize a quality improvement framework to ensure that the elements of the interventions also address the barriers identified by our local providers and patients that are unique to our community. The pervasive challenges in SCD care, coupled with its medical complexities, may seem insurmountable, but our survey and qualitative results provide us with a road map for the way forward.
Acknowledgments: The authors thank the adolescents and adults with sickle cell disease, the providers, and the community stakeholders who completed the interviews and surveys. The authors also acknowledge the SCCCI co-investigators for their contributions to this project, including Michael Bell, MD, Ward Hagar, MD, Christine Hoehner, FNP, Kimberly Major, MSW, Anne Marsh, MD, Lynne Neumayr, MD, and Ted Wun, MD. We also thank Kamilah Bailey, Jameelah Hodge, Jennifer Kim, Michael Rowland, Adria Stauber, Amber Fearon, and Shanda Robertson, and the Sickle Cell Data Collection Program for their contributions.
Corresponding author: Marsha J. Treadwell, PhD, University of California San Francisco Benioff Children’s Hospital Oakland, 747 52nd St., Oakland, CA 94609; marsha.treadwell@ucsf.edu.
Financial disclosures: None.
Funding/support: This work was supported by grant # 1U01HL134007 from the National Heart, Lung, and Blood Institute to the University of California San Francisco Benioff Children’s Hospital Oakland.
1. Hassell KL. Population Estimates of sickle cell disease in the U.S. Am J Prev Med. 2010; 38:S512-S521.
2. Data & Statistics on Sickle Cell Disease. Centers for Disease Control and Prevention website. www.cdc.gov/ncbddd/sicklecell/data.html. Accessed March 25, 2020.
3. Inusa BPD, Stewart CE, Mathurin-Charles S, et al. Paediatric to adult transition care for patients with sickle cell disease: a global perspective. Lancet Haematol. 2020;7:e329-e341.
4. Smith SK, Johnston J, Rutherford C, et al. Identifying social-behavioral health needs of adults with sickle cell disease in the emergency department. J Emerg Nurs. 2017;43:444-450.
5. Treadwell MJ, Barreda F, Kaur K, et al. Emotional distress, barriers to care, and health-related quality of life in sickle cell disease. J Clin Outcomes Manag. 2015;22:8-17.
6. Treadwell MJ, Hassell K, Levine R, et al. Adult Sickle Cell Quality-of-Life Measurement Information System (ASCQ-Me): conceptual model based on review of the literature and formative research. Clin J Pain. 2014;30:902-914.
7. Rizio AA, Bhor M, Lin X, et al. The relationship between frequency and severity of vaso-occlusive crises and health-related quality of life and work productivity in adults with sickle cell disease. Qual Life Res. 2020;29:1533-1547.
8. Freiermuth CE, Haywood C, Silva S, et al. Attitudes toward patients with sickle cell disease in a multicenter sample of emergency department providers. Adv Emerg Nurs J. 2014;36:335-347.
9. Jenerette CM, Brewer C. Health-related stigma in young adults with sickle cell disease. J Natl Med Assoc. 2010;102:1050-1055.
10. Lazio MP, Costello HH, Courtney DM, et al. A comparison of analgesic management for emergency department patients with sickle cell disease and renal colic. Clin J Pain. 2010;26:199-205.
11. Haywood C, Tanabe P, Naik R, et al. The impact of race and disease on sickle cell patient wait times in the emergency department. Am J Emerg Med. 2013;31:651-656.
12. Haywood C, Beach MC, Lanzkron S, et al. A systematic review of barriers and interventions to improve appropriate use of therapies for sickle cell disease. J Natl Med Assoc. 2009;101:1022-1033.
13. Mainous AG, Tanner RJ, Harle CA, et al. Attitudes toward management of sickle cell disease and its complications: a national survey of academic family physicians. Anemia. 2015;2015:1-6.
14. Yawn BP, Buchanan GR, Afenyi-Annan AN, et al. Management of sickle cell disease: summary of the 2014 evidence-based report by expert panel members. JAMA. 2014;312:1033.
15. Lunyera J, Jonassaint C, Jonassaint J, et al. Attitudes of primary care physicians toward sickle cell disease care, guidelines, and comanaging hydroxyurea with a specialist. J Prim Care Community Health. 2017;8:37-40.
16. Whiteman LN, Haywood C, Lanzkron S, et al. Primary care providers’ comfort levels in caring for patients with sickle cell disease. South Med J. 2015;108:531-536.
17. Wong TE, Brandow AM, Lim W, Lottenberg R. Update on the use of hydroxyurea therapy in sickle cell disease. Blood. 2014;124:3850-4004.
18. DiMartino LD, Baumann AA, Hsu LL, et al. The sickle cell disease implementation consortium: Translating evidence-based guidelines into practice for sickle cell disease. Am J Hematol. 2018;93:E391-E395.
19. King AA, Baumann AA. Sickle cell disease and implementation science: A partnership to accelerate advances. Pediatr Blood Cancer. 2017;64:e26649.
20. Solberg LI. Improving medical practice: a conceptual framework. Ann Fam Med. 2007;5:251-256.
21. Bodenheimer T, Wagner EH, Grumbach K. Improving primary care for patients with chronic illness. J Am Med Assoc. 2002;288:5.
22. Bodenheimer T. Interventions to improve chronic illness care: evaluating their effectiveness. Dis Manag. 2003;6:63-71.
23. Tsai AC, Morton SC, Mangione CM, Keeler EB. A meta-analysis of interventions to improve care for chronic illnesses. Am J Manag Care. 2005;11:478-488.
24. Harris PA, Taylor R, Thielke R, et al. Research electronic data capture (REDCap)—A metadata-driven methodology and workflow process for providing translational research informatics support. J Biomed Inform. 2009;42:377-381.
25. Kallio H, Pietilä A-M, Johnson M, et al. Systematic methodological review: developing a framework for a qualitative semi-structured interview guide. J Adv Nurs. 2016;72:2954-2965.
26. Clarke V, Braun V. Successful Qualitative Research: A Practical Guide for Beginners. First. Thousand Oaks, CA: Sage; 2013.
27. Hsieh H-F, Shannon SE. Three approaches to qualitative content analysis. Qual Health Res. 2005;15:1277-1288.
28. Creswell JW, Hanson WE, Clark Plano VL, et al. Qualitative research designs: selection and implementation. Couns Psychol. 2007;35:236-264.
29. Miles MB, Huberman AM, Saldana J. Qualitative Data Analysis A Methods Sourcebook. 4th ed. Thousand Oaks, CA: Sage; 2019.
30. Eckman JR, Hassell KL, Huggins W, et al. Standard measures for sickle cell disease research: the PhenX Toolkit sickle cell disease collections. Blood Adv. 2017; 1: 2703-2711.
31. Kendall R, Wagner B, Brodke D, et al. The relationship of PROMIS pain interference and physical function scales. Pain Med. 2018;19:1720-1724.
32. Amtmann D, Cook KF, Jensen MP, et al. Development of a PROMIS item bank to measure pain interference. Pain. 2010;150:173-182.
33. Evensen CT, Treadwell MJ, Keller S, et al. Quality of care in sickle cell disease: Cross-sectional study and development of a measure for adults reporting on ambulatory and emergency department care. Medicine (Baltimore). 2016;95:e4528.
34. Edwards R, Telfair J, Cecil H, et al. Reliability and validity of a self-efficacy instrument specific to sickle cell disease. Behav Res Ther. 2000;38:951-963.
35. Edwards R, Telfair J, Cecil H, et al. Self-efficacy as a predictor of adult adjustment to sickle cell disease: one-year outcomes. Psychosom Med. 2001;63:850-858.
36. Puri Singh A, Haywood C, Beach MC, et al. Improving emergency providers’ attitudes toward sickle cell patients in pain. J Pain Symptom Manage. 2016;51:628-632.e3.
37. Glassberg JA, Tanabe P, Chow A, et al. Emergency provider analgesic practices and attitudes towards patients with sickle cell disease. Ann Emerg Med. 2013;62:293-302.e10.
38. Grahmann PH, Jackson KC 2nd, Lipman AG. Clinician beliefs about opioid use and barriers in chronic nonmalignant pain [published correction appears in J Pain Palliat Care Pharmacother. 2004;18:145-6]. J Pain Palliat Care Pharmacother. 2004;18:7-28.
39. Brandow AM, Panepinto JA. Hydroxyurea use in sickle cell disease: the battle with low prescription rates, poor patient compliance and fears of toxicities. Expert Rev Hematol. 2010;3:255-260.
40. Fielding N. Triangulation and mixed methods designs: data integration with new research technologies. J Mixed Meth Res. 2012;6:124-136.
41. 2017 CAHPS Health Plan Survey Chartbook. Agency for Healthcare Research and Quality website. www.ahrq.gov/cahps/cahps-database/comparative-data/2017-health-plan-chartbook/results-enrollee-population.html. Accessed September 8, 2020.
42. Bulgin D, Tanabe P, Jenerette C. Stigma of sickle cell disease: a systematic review. Issues Ment Health Nurs. 2018;1-11.
43. Wakefield EO, Zempsky WT, Puhl RM, et al. Conceptualizing pain-related stigma in adolescent chronic pain: a literature review and preliminary focus group findings. PAIN Rep. 2018;3:e679.
44. Nelson SC, Hackman HW. Race matters: Perceptions of race and racism in a sickle cell center. Pediatr Blood Cancer. 2013;60:451-454.
45. Dyal BW, Abudawood K, Schoppee TM, et al. Reflections of healthcare experiences of african americans with sickle cell disease or cancer: a qualitative study. Cancer Nurs. 2019;10.1097/NCC.0000000000000750.
46. Renedo A. Not being heard: barriers to high quality unplanned hospital care during young people’s transition to adult services - evidence from ‘this sickle cell life’ research. BMC Health Serv Res. 2019;19:876.
47. Ballas S, Vichinsky E. Is the medical home for adult patients with sickle cell disease a reality or an illusion? Hemoglobin. 2015;39:130-133.
48. Hankins JS, Osarogiagbon R, Adams-Graves P, et al. A transition pilot program for adolescents with sickle cell disease. J Pediatr Health Care. 2012;26 e45-e49.
49. Smith WR, Sisler IY, Johnson S, et al. Lessons learned from building a pediatric-to-adult sickle cell transition program. South Med J. 2019;112:190-197.
50. Lanzkron S, Sawicki GS, Hassell KL, et al. Transition to adulthood and adult health care for patients with sickle cell disease or cystic fibrosis: Current practices and research priorities. J Clin Transl Sci. 2018;2:334-342.
51. Kanter J, Gibson R, Lawrence RH, et al. Perceptions of US adolescents and adults with sickle cell disease on their quality of care. JAMA Netw Open. 2020;3:e206016.
52. Haywood C, Lanzkron S, Hughes MT, et al. A video-intervention to improve clinician attitudes toward patients with sickle cell disease: the results of a randomized experiment. J Gen Intern Med. 2011;26:518-523.
53. Hankins JS, Shah N, DiMartino L, et al. Integration of mobile health into sickle cell disease care to increase hydroxyurea utilization: protocol for an efficacy and implementation study. JMIR Res Protoc. 2020;9:e16319.
54. Fan W, Yan Z. Factors affecting response rates of the web survey: A systematic review. Comput Hum Behav. 2010;26:132-139.
55. Millar MM, Dillman DA. Improving response to web and mixed-mode surveys. Public Opin Q. 2011;75:249-269.

Improving Identification of Patients at Low Risk for Major Cardiac Events After Noncardiac Surgery Using Intraoperative Data
Annually, more than 40 million noncardiac surgeries take place in the US,1 with 1%-3% of patients experiencing a major adverse cardiovascular event (MACE) such as acute myocardial infarction (AMI) or cardiac arrest postoperatively.2 Such patients are at markedly increased risk of both perioperative and long-term death.2-5
Over the past 40 years, efforts to model the risk of cardiac complications after noncardiac surgery have examined relationships between preoperative risk factors and postoperative cardiovascular events. The resulting risk-stratification tools, such as the Lee Revised Cardiac Risk Index (RCRI), have been used to inform perioperative care, including strategies for risk factor management prior to surgery, testing for cardiac events after surgery, and decisions regarding postoperative disposition.6 However, tools used in practice have not incorporated intraoperative data on hemodynamics or medication administration in the transition to postoperative care, which is often provided by nonsurgical clinicians such as hospitalists. Presently, there is active debate about the optimal approach to postoperative evaluation and management of MACE, particularly with regard to indications for cardiac biomarker testing after surgery in patients without signs or symptoms of acute cardiac syndromes. The lack of consensus is reflected in differences among guidelines for postoperative cardiac biomarker testing across professional societies in Europe, Canada, and the United States.7-9
In this study, we examined whether the addition of intraoperative data to preoperative data (together, perioperative data) improved prediction of MACE after noncardiac surgery when compared with RCRI. Additionally, to investigate how such a model could be applied in practice, we compared risk stratification based on our model to a published risk factor–based guideline algorithm for postoperative cardiac biomarker testing.7 In particular, we evaluated to what extent patients recommended for postoperative cardiac biomarkers under the risk factor–based guideline algorithm would be reclassified as low risk by the model using perioperative data. Conducting biomarker tests on these patients would potentially represent low-value care. We hypothesized that adding intraoperative data would (a) lead to improved prediction of MACE complications when compared with RCRI and (b) more effectively identify, compared with a risk factor–based guideline algorithm, patients for whom cardiac biomarker testing would or would not be clinically meaningful.
METHODS
We followed the Transparent Reporting of a Multivariable Prediction Model for Individual Prognosis or Diagnosis (TRIPOD) reporting guideline.10
Study Data
Baseline, preoperative, and intraoperative data were collected for patients undergoing surgery between January 2014 and April 2018 within the University of Pennsylvania Health System (UPHS) electronic health record (EHR), and these data were then integrated into a comprehensive perioperative dataset (data containing administrative, preoperative, intraoperative, and postoperative information related to surgeries) created through a collaboration with the Multicenter Perioperative Outcomes Group.11 The University of Pennsylvania Institutional Review Board approved this study.
Study Population
Patients aged 18 years or older who underwent inpatient major noncardiac surgery across four tertiary academic medical centers within UPHS in Pennsylvania during the study period were included in the cohort (see Appendix for inclusion/exclusion criteria).12,13 Noncardiac surgery was identified using primary Current Procedural Terminology (CPT) code specification ranges for noncardiac surgeries 10021-32999 and 34001-69990. The study sample was divided randomly into a training set (60%), validation (20%), and test set (20%),14 with similar rates of MACE in the resulting sets. We used a holdout test set for all final analyses to avoid overfitting during model selection.
Outcomes
The composite outcome used to develop the risk-stratification models was in-hospital MACE after major noncardiac surgery. Following prior literature, MACE was defined using billing codes for ST-elevation/non–ST-elevation myocardial infarction (STEMI/NSTEMI, ICD-9-CM 410.xx, ICD-10-CM I21.xx), cardiac arrest (ICD-9-CM 427.5, ICD-10-CM I46.x, I97.121), or all-cause in-hospital death.2,15-17
Variables
Variables were selected from baseline administrative, preoperative clinical, and intraoperative clinical data sources (full list in Appendix). Baseline variables included demographics, insurance type, and Elixhauser comorbidities.18,19 Preoperative variables included surgery type, laboratory results, and American Society of Anesthesiologists (ASA) Physical Status classification.20 Intraoperative variables included vital signs, estimated blood loss, fluid administration, and vasopressor use. We winsorized outlier values and used multiple imputation to address missingness. Rates of missing data can be found in Appendix Table 1.
Risk-Stratification Models Used as Comparisons
Briefly, RCRI variables include the presence of high-risk surgery,21 comorbid cardiovascular diseases (ie, ischemic heart disease, congestive heart failure, and cerebrovascular disease), preoperative use of insulin, and elevated preoperative serum creatinine.6 RCRI uses the inputs to calculate a point score that equates to different risk strata and is based on a stepwise logistic regression model with postoperative cardiovascular complications as the dependent outcome variable. For this study, we implemented the weighted version of the RCRI algorithm and computed the point scores (Appendix).6,7,22
We also applied a risk factor–based algorithm for postoperative cardiac biomarker testing published in 2017 by the Canadian Cardiovascular Society (CCS) guidelines to each patient in the study sample.7 Specifically, this algorithm recommends daily troponin surveillance for 48 to 72 hours after surgery among patients who have (1) an elevated NT-proBNP/BNP measurement or no NT-proBNP/BNP measurement before surgery, (2) have a Revised Cardiac Risk Index score of 1 or greater, (3) are aged 65 years and older, (4) are aged 45 to 64 years with significant cardiovascular disease undergoing elective surgery, or (5) are aged 18 to 64 years with significant cardiovascular disease undergoing semiurgent, urgent, or emergent surgery.
Statistical Analysis
We compared patient characteristics and outcomes between those who did and those who did not experience MACE during hospitalization. Chi-square tests were used to compare categorical variables and Mann Whitney tests were used to compare continuous variables.
To create the perioperative risk-stratification model based on baseline, preoperative, and intraoperative data, we used a logistic regression with elastic net selection using a dichotomous dependent variable indicating MACE and independent variables described earlier. This perioperative model was fit on the training set and the model coefficients were then applied to the patients in the test set. The area under the receiver operating characteristic curve (AUC) was reported and the outcomes were reported by predicted risk decile, with higher deciles indicating higher risk (ie, higher numbers of patients with MACE outcomes in higher deciles implied better risk stratification). Because predicted risk of postoperative MACE may not have been distributed evenly across deciles, we also examined the distribution of the predicted probability of MACE and examined the number of patients below thresholds of risk corresponding to 0.1% or less, 0.25% or less, 0.5% or less, and 1% or less. These thresholds were chosen because they were close to the overall rate of MACE within our cohort.
We tested for differences in predictive performance between the RCRI logistic regression model AUC and the perioperative model AUC using DeLong’s test.23 Additionally, we illustrated differences between the perioperative and RCRI models’ performance in two ways by stratifying patients into deciles based on predicted risk. First, we compared rates of MACE and MACE component events by predicted decile of the perioperative and RCRI models. Second, we further classified patients as RCRI high or low risk (per RCRI score classification in which RCRI score of 1 or greater is high risk and RCRI score of 0 is low risk) and examined numbers of surgical cases and MACE complications within these categories stratified by perioperative model predicted decile.
To compare the perioperative model’s performance with that of a risk factor–based guideline algorithm, we classified patients according to CCS guidelines as high risk (those for whom the CCS guidelines algorithm would recommend postoperative troponin surveillance testing) and low risk (those for whom the CCS guidelines algorithm would not recommend surveillance testing). We also used a logistic regression to examine if the predicted risk from our model was independently associated with MACE above and beyond the testing recommendation of the CCS guidelines algorithm. This model used MACE as the dependent variable and model-predicted risk and a CCS guidelines–defined high-risk indicator as predictors. We computed the association between a 10 percentage–point increase in predicted risk on observed MACE outcome rates.24
In sensitivity analyses, we used a random forest machine learning classifier to test an alternate model specification, used complete case analysis, varied RCRI thresholds, and limited to patients aged 50 years or older. We also varied the penalty parameter in the elastic net model and plotted AUC versus the number of variables included to examine parsimonious models. SAS v9.4 (SAS Institute Inc) was used for main analyses. Data preparations and sensitivity analysis were done in Python v3.6 with Pandas v0.24.2 and Scikit-learn v0.19.1.

RESULTS
Study Sample
Patients who underwent major noncardiac surgery in our sample (n = 72,909) were approximately a mean age of 56 years, 58% female, 66% of White race and 26% of Black race, and most likely to have received orthopedic surgery (33%) or general surgery (20%). Those who experienced MACE (n = 558; 0.77%) differed along several characteristics (Table 1). For example, those with MACE were older (mean age, 65.4 vs 55.4 years; P < .001) and less likely to be female (41.9% vs 58.3%; P < .001).

Model Performance After Intraoperative Data Inclusion
In the perioperative model combining preoperative and intraoperative data, 26 variables were included after elastic net selection (Appendix Table 2). Model discrimination in the test set of patients demonstrated an AUC of 0.88 (95% CI, 0.85-0.92; Figure). When examining outcome rates by predicted decile, the outcome rates of in-hospital MACE complications were higher in the highest decile than in the lowest decile, notably with 58 of 92 (63%) cases with MACE complications within the top decile of predicted risk (Table 2). The majority of patients had low predicted risk of MACE, with 5,309 (36.1%), 8,796 (59.7%), 11,335 (77.0%), and 12,972 (88.1%) below the risk thresholds of to 0.1%, 0.25%, 0.5%, and 1.0% respectively. The associated MACE rates were 0.04%, 0.10%, 0.17%, and 0.25% (average rate in sample was 0.63%) (Appendix Table 3).

Model Performance Comparisons
The perioperative model AUC of 0.88 was higher when compared with RCRI’s AUC of 0.79 (95% CI, 0.74-0.84; P < .001). The number of MACE complications was more concentrated in the top decile of predicted risk of the perioperative model than it was in that of the RCRI model (58 vs 43 of 92 events, respectively; 63% vs 47%; Table 2). Furthermore, there were fewer cases with MACE complications in the low-risk deciles (ie, deciles 1 to 5) of the perioperative model than in the those of the RCRI model. These relative differences were consistent for MACE component outcomes of STEMI/NSTEMI, cardiac arrest, and in-hospital death, as well.
There was substantial heterogeneity in the perioperative model predicted risk of patients classified as either RCRI low risk or high risk (ie, each category included patients with low and high predicted risk) categories (Table 3). Patients in the bottom (low-risk) five deciles of the perioperative model’s predicted risk who were in the RCRI model’s high-risk group were very unlikely to experience MACE complications (3 out of 722 cases; 0.42%). Furthermore, among those classified as low risk by the RCRI model but were in the top decile of the perioperative model’s predicted risk, the MACE complication rate was 3.5% (8 out of 229), which was 6 times the sample mean MACE complication rate.

The perioperative model identified more patients as low risk than did the CCS guidelines’ risk factor–based algorithm (Table 3). For example, 2,341 of the patients the CCS guidelines algorithm identified as high risk were in the bottom 50% of the perioperative model’s predicted risk for experiencing MACE (below a 0.18% chance of a MACE complication); only four of these patients (0.17%) actually experienced MACE. This indicates that the 2,341 of 7,597 (31%) high-risk patients identified as low risk in the perioperative model would have been recommended for postoperative troponin testing by CCS guidelines based on preoperative risk factors alone—but did not go on to experience a MACE. Regression results indicated that both CCS guidelines risk-factor classification and the perioperative model’s predicted risk were predictive of MACE outcomes. A change in the perioperative model’s predicted risk of 10 percentage points was associated with an increase in the probability of a MACE outcomes of 0.45 percentage points (95% CI, 0.35-0.55 percentage points; P < .001) and moving from CCS guidelines’ low- to high-risk categories was associated with an increased probability of MACE by 0.96 percentage points (95% CI, 0.75-1.16 percentage points; P < .001).
Results were consistent with the main analysis across all sensitivity analyses (Appendix Tables 4-7). Parsimonious models with variables as few as eight variables retained strong predictive power (AUC, 0.870; Appendix Figure 1 and Table 8).
DISCUSSION
In this study, the addition of intraoperative data improved risk stratification for MACE complications when compared with standard risk tools such as RCRI. This approach also outperformed a guidelines-based approach and identified additional patients at low risk of cardiovascular complications. This study has three main implications.
First, this study demonstrated the additional value of combining intraoperative data with preoperative data in risk prediction for postoperative cardiovascular events. The intraoperative data most strongly associated with MACE, which likely were responsible for the performance improvement, included administration of medications (eg, sodium bicarbonate or calcium chloride) and blood products (eg, platelets and packed red blood cells), vitals (ie, heart rate), and intraoperative procedures (ie, arterial line placement); all model variables and coefficients are reported in Appendix Table 9. The risk-stratification model using intraoperative clinical data outperformed validated standard models such as RCRI. While this model should not be used in causal inference and cannot be used to inform decisions about risk-benefit tradeoffs of undergoing surgery, its improved performance relative to prior models highlights the potential in using real-time data. Preliminary illustrative analysis demonstrated that parsimonious models with as few as eight variables perform well, whose implementation as risk scores in EHRs is likely straightforward (Appendix Table 8). This is particularly important for longitudinal care in the hospital, in which patients frequently are cared for by multiple clinical services and experience handoffs. For example, many orthopedic surgery patients with significant medical comorbidity are managed postoperatively by hospitalist physicians after initial surgical care.
Second, our study aligns well with the cardiac risk-stratification literature more broadly. For example, the patient characteristics and clinical variables most associated with cardiovascular complications were age, history of ischemic heart disease, American Society of Anesthesiologists physical status, use of intraoperative sodium bicarbonate or vasopressors, lowest intraoperative heart rate measured, and lowest intraoperative mean arterial pressure measured. While many of these variables overlap with those included in the RCRI model, others (such as American Society of Anesthesiologists physical status) are not included in RCRI but have been shown to be important in risk prediction in other studies using different data variables.6,25,26
Third, we illustrated a clinical application of this model in identifying patients at low risk of cardiovascular complications, although benefit may extend to other patients as well. This is particularly germane to clinicians who frequently manage patients in the postsurgical or postprocedural setting. Moreover, the clinical relevance to these clinicians is underscored by the lack of consensus among professional societies across Europe, Canada, and the United States about which subgroups of patients undergoing noncardiac surgery should receive postoperative cardiac biomarker surveillance testing in the 48 to 72 hours after surgery.6-9 This may be in part caused by differences in clinical objectives. For example, the CCS guidelines in part aim to detect myocardial injury after noncardiac surgery (MINS) up to 30 days after surgery, which may be more sensitive to myocardial injury but less strongly associated with outcomes like MACE. The results of this study suggest that adopting such risk factor–based testing would likely lead to additional testing of low risk patients, which may represent low value surveillance tests. For example, there were 2,257 patients without postoperative cardiac biomarker testing in our data who would have been categorized as high risk by risk factor guidelines and therefore recommended to receive at least one postoperative cardiac biomarker surveillance test but were classified as low-risk individuals using a predicted probability of MACE less than 0.18% per our perioperative risk stratification model (Appendix Table 4). If each of these patients received one troponin biomarker test, the associated cost increase would be $372,405 (using the $165 cost per test reported at our institution). These costs would multiply if daily surveillance troponin biomarker tests were ordered for 48 to 72 hours after surgery, as recommended by the risk factor–based testing guidelines. This would be a departure from testing among patients using clinician discretion that may avoid low-value testing.
Applying the perioperative model developed in this paper to clinical practice still requires several steps. The technical aspects of finding a parsimonious model that can be implemented in the EHR is likely quite straightforward. Our preliminary analysis illustrates that doing so will not require accessing large numbers of intraoperative variables. Perhaps more important steps include prospective validation of the safety, usability, and clinical benefit of such an algorithm-based risk score.27
The study has several limitations. First, it was an observational study using EHR data subject to missingness and data quality issues that may have persisted despite our methods. Furthermore, EHR data is not generated randomly, and unmeasured variables observed by clinicians but not by researchers could confound the results. However, our approach used the statistical model to examine risk, not causal inference. Second, this is a single institution study and the availability of EHR data, as well as practice patterns, may vary at other institutions. Furthermore, it is possible that performance of the RCRI score, the model fitting RCRI classification of high vs low risk on the sample data, and our model’s performance may not generalize to other clinical settings. However, we utilized data from multiple hospitals within a health system with different surgery and anesthesia groups and providers, and a similar AUC was reported for RCRI in original validation study.6 Third, our follow up period was limited to the hospital setting and we do not capture longitudinal outcomes, such as 30-day MACE. This may impact the ability to risk stratify for other important longer-term outcomes, limit clinical utility, and hinder comparability to other studies. Fourth, results may vary for other important cardiovascular outcomes that may be more sensitive to myocardial injury, such as MINS. Fifth, we used a limited number of modeling strategies.
CONCLUSION
Addition of intraoperative data to preoperative data improves prediction of cardiovascular complications after noncardiac surgery. Improving the identification of patients at low risk for such complications could potentially be applied to reduce unnecessary postoperative cardiac biomarker testing after noncardiac surgery, but it will require further validation in prospective clinical settings.
Disclosures
Dr Navathe reports grants from the following entities: Hawaii Medical Service Association, Anthem Public Policy Institute, Commonwealth Fund, Oscar Health, Cigna Corporation, Robert Wood Johnson Foundation, Donaghue Foundation, Pennsylvania Department of Health, Ochsner Health System, United Healthcare, Blue Cross Blue Shield of NC, Blue Shield of CA; personal fees from the following: Navvis Healthcare, Agathos, Inc, Navahealth, YNHHSC/CORE, Maine Health Accountable Care Organization, Maine Department of Health and Human Services, National University Health System - Singapore, Ministry of Health - Singapore, Social Security Administration - France, Elsevier Press, Medicare Payment Advisory Commission, Cleveland Clinic, Embedded Healthcare; and other support from Integrated Services, Inc, outside of the submitted work. Dr Volpp reports grants from Humana during the conduct of the study; grants from Hawaii Medical Services Agency, Discovery (South Africa), Merck, Weight Watchers, and CVS outside of the submitted work; he has received consulting income from CVS and VALHealth and is a principal in VALHealth, a behavioral economics consulting firm. Dr Holmes receives funding from the Pennsylvania Department of Health, US Public Health Service, and the Cardiovascular Medicine Research and Education Foundation. All other authors declare no conflicts of interest.
Prior Presentations
2019 Academy Health Annual Research Meeting, Poster Abstract Presentation, June 2 to June 4, 2019, Washington, DC.
Funding
This project was funded, in part, under a grant with the Pennsylvania Department of Health. This research was independent from the funder. The funder had no role in the study design; in the collection, analysis, and interpretation of data; in the writing of the report; or in the decision to submit the article for publication. The department specifically disclaims responsibility for any analyses, interpretations, or conclusions.
1. National Center for Health Statistics. National Hospital Discharge Survey: 2010 Table, Number of all-listed procedures for discharges from short-stay hospitals, by procedure category and age: United States, 2010. Centers for Disease Control and Prevention; 2010. Accessed November 11, 2018. https://www.cdc.gov/nchs/data/nhds/4procedures/2010pro4_numberprocedureage.pdf
2. Devereaux PJ, Goldman L, Cook DJ, Gilbert K, Leslie K, Guyatt GH. Perioperative cardiac events in patients undergoing noncardiac surgery: a review of the magnitude of the problem, the pathophysiology of the events and methods to estimate and communicate risk. CMAJ. 2005;173(6):627-634. https://doi.org/10.1503/cmaj.050011
3. Charlson M, Peterson J, Szatrowski TP, MacKenzie R, Gold J. Long-term prognosis after peri-operative cardiac complications. J Clin Epidemiol. 1994;47(12):1389-1400. https://doi.org/10.1016/0895-4356(94)90083-3
4. Devereaux PJ, Sessler DI. Cardiac complications in patients undergoing major noncardiac surgery. N Engl J Med. 2015;373(23):2258-2269. https://doi.org/10.1056/nejmra1502824
5. Sprung J, Warner ME, Contreras MG, et al. Predictors of survival following cardiac arrest in patients undergoing noncardiac surgery: a study of 518,294 patients at a tertiary referral center. Anesthesiology. 2003;99(2):259-269. https://doi.org/10.1097/00000542-200308000-00006
6. Lee TH, Marcantonio ER, Mangione CM, et al. Derivation and prospective validation of a simple index for prediction of cardiac risk of major noncardiac surgery. Circulation. 1999;100(10):1043-1049. https://doi.org/10.1161/01.cir.100.10.1043
7. Duceppe E, Parlow J, MacDonald P, et al. Canadian Cardiovascular Society guidelines on perioperative cardiac risk assessment and management for patients who undergo noncardiac surgery. Can J Cardiol. 2017;33(1):17-32. https://doi.org/10.1016/j.cjca.2016.09.008
8. Fleisher LA, Fleischmann KE, Auerbach AD, et al. 2014 ACC/AHA guideline on perioperative cardiovascular evaluation and management of patients undergoing noncardiac surgery: a report of the American College of Cardiology/American Heart Association Task Force on practice guidelines. J Am Coll Cardiol. 2014;64(22):e77-e137. https://doi.org/10.1016/j.jacc.2014.07.944
9. Kristensen SD, Knuuti J, Saraste A, et al. 2014 ESC/ESA guidelines on non-cardiac surgery: cardiovascular assessment and management: The Joint Task Force on non-cardiac surgery: cardiovascular assessment and management of the European Society of Cardiology (ESC) and the European Society of Anaesthesiology (ESA). Euro Heart J. 2014;35(35):2383-2431. https://doi.org/10.1093/eurheartj/ehu282
10. Collins GS, Reitsma JB, Altman DG, Moons KG. Transparent reporting of a multivariable prediction model for individual prognosis or diagnosis (TRIPOD): the TRIPOD statement. Ann Intern Med. 2015;162(1):55-63. https://doi.org/10.7326/m14-0697
11. Freundlich RE, Kheterpal S. Perioperative effectiveness research using large databases. Best Pract Res Clin Anaesthesiol. 2011;25(4):489-498. https://doi.org/10.1016/j.bpa.2011.08.008
12. CPT® (Current Procedural Terminology). American Medical Association. 2018. Accessed November 11, 2018. https://www.ama-assn.org/practice-management/cpt-current-procedural-terminology
13. Surgery Flag Software for ICD-9-CM. AHRQ Healthcare Cost and Utilization Project; 2017. Accessed November 11, 2018. https://www.hcup-us.ahrq.gov/toolssoftware/surgflags/surgeryflags.jsp
14. Hastie T, Tibshirani R, Friedman J. The Elements of Statistical Learning: Data Mining, Inference, and Prediction. 2nd ed. Springer; 2009. https://www.springer.com/gp/book/9780387848570
15. Bucy R, Hanisko KA, Ewing LA, et al. Abstract 281: Validity of in-hospital cardiac arrest ICD-9-CM codes in veterans. Circ Cardiovasc Qual Outcomes. 2015;8(suppl_2):A281-A281.
16. Institute of Medicine; Board on Health Sciences Policy; Committee on the Treatment of Cardiac Arrest: Current Status and Future Directions. Graham R, McCoy MA, Schultz AM, eds. Strategies to Improve Cardiac Arrest Survival: A Time to Act. The National Academies Press; 2015. https://doi.org/10.17226/21723
17. Pladevall M, Goff DC, Nichaman MZ, et al. An assessment of the validity of ICD Code 410 to identify hospital admissions for myocardial infarction: The Corpus Christi Heart Project. Int J Epidemiol. 1996;25(5):948-952. https://doi.org/10.1093/ije/25.5.948
18. Elixhauser A, Steiner C, Harris DR, Coffey RM. Comorbidity measures for use with administrative data. Med Care. 1998;36(1):8-27. https://doi.org/10.1097/00005650-199801000-00004
19. Quan H, Sundararajan V, Halfon P, et al. Coding algorithms for defining comorbidities in ICD-9-CM and ICD-10 administrative data. Med Care. 2005;43(11):1130-1139. https://doi.org/10.1097/01.mlr.0000182534.19832.83
20. Keats AS. The ASA classification of physical status--a recapitulation. Anesthesiology. 1978;49(4):233-236. https://doi.org/10.1097/00000542-197810000-00001
21. Schwarze ML, Barnato AE, Rathouz PJ, et al. Development of a list of high-risk operations for patients 65 years and older. JAMA Surg. 2015;150(4):325-331. https://doi.org/10.1001/jamasurg.2014.1819
22. VISION Pilot Study Investigators, Devereaux PJ, Bradley D, et al. An international prospective cohort study evaluating major vascular complications among patients undergoing noncardiac surgery: the VISION Pilot Study. Open Med. 2011;5(4):e193-e200.
23. DeLong ER, DeLong DM, Clarke-Pearson DL. Comparing the areas under two or more correlated receiver operating characteristic curves: a nonparametric approach. Biometrics. 1988;44(3):837-845.
24. Norton EC, Dowd BE, Maciejewski ML. Marginal effects-quantifying the effect of changes in risk factors in logistic regression models. JAMA. 2019;321(13):1304‐1305. https://doi.org/10.1001/jama.2019.1954
25. Bilimoria KY, Liu Y, Paruch JL, et al. Development and evaluation of the universal ACS NSQIP surgical risk calculator: a decision aid and informed consent tool for patients and surgeons. J Am Coll Surg. 2013;217(5):833-842. https://doi.org/10.1016/j.jamcollsurg.2013.07.385
26. Gawande AA, Kwaan MR, Regenbogen SE, Lipsitz SA, Zinner MJ. An Apgar score for surgery. J Am Coll Surg. 2007;204(2):201-208. https://doi.org/10.1016/j.jamcollsurg.2006.11.011
27. Parikh RB, Obermeyer Z, Navathe AS. Regulation of predictive analytics in medicine. Science. 2019;363(6429):810-812. https://doi.org/10.1126/science.aaw0029
Annually, more than 40 million noncardiac surgeries take place in the US,1 with 1%-3% of patients experiencing a major adverse cardiovascular event (MACE) such as acute myocardial infarction (AMI) or cardiac arrest postoperatively.2 Such patients are at markedly increased risk of both perioperative and long-term death.2-5
Over the past 40 years, efforts to model the risk of cardiac complications after noncardiac surgery have examined relationships between preoperative risk factors and postoperative cardiovascular events. The resulting risk-stratification tools, such as the Lee Revised Cardiac Risk Index (RCRI), have been used to inform perioperative care, including strategies for risk factor management prior to surgery, testing for cardiac events after surgery, and decisions regarding postoperative disposition.6 However, tools used in practice have not incorporated intraoperative data on hemodynamics or medication administration in the transition to postoperative care, which is often provided by nonsurgical clinicians such as hospitalists. Presently, there is active debate about the optimal approach to postoperative evaluation and management of MACE, particularly with regard to indications for cardiac biomarker testing after surgery in patients without signs or symptoms of acute cardiac syndromes. The lack of consensus is reflected in differences among guidelines for postoperative cardiac biomarker testing across professional societies in Europe, Canada, and the United States.7-9
In this study, we examined whether the addition of intraoperative data to preoperative data (together, perioperative data) improved prediction of MACE after noncardiac surgery when compared with RCRI. Additionally, to investigate how such a model could be applied in practice, we compared risk stratification based on our model to a published risk factor–based guideline algorithm for postoperative cardiac biomarker testing.7 In particular, we evaluated to what extent patients recommended for postoperative cardiac biomarkers under the risk factor–based guideline algorithm would be reclassified as low risk by the model using perioperative data. Conducting biomarker tests on these patients would potentially represent low-value care. We hypothesized that adding intraoperative data would (a) lead to improved prediction of MACE complications when compared with RCRI and (b) more effectively identify, compared with a risk factor–based guideline algorithm, patients for whom cardiac biomarker testing would or would not be clinically meaningful.
METHODS
We followed the Transparent Reporting of a Multivariable Prediction Model for Individual Prognosis or Diagnosis (TRIPOD) reporting guideline.10
Study Data
Baseline, preoperative, and intraoperative data were collected for patients undergoing surgery between January 2014 and April 2018 within the University of Pennsylvania Health System (UPHS) electronic health record (EHR), and these data were then integrated into a comprehensive perioperative dataset (data containing administrative, preoperative, intraoperative, and postoperative information related to surgeries) created through a collaboration with the Multicenter Perioperative Outcomes Group.11 The University of Pennsylvania Institutional Review Board approved this study.
Study Population
Patients aged 18 years or older who underwent inpatient major noncardiac surgery across four tertiary academic medical centers within UPHS in Pennsylvania during the study period were included in the cohort (see Appendix for inclusion/exclusion criteria).12,13 Noncardiac surgery was identified using primary Current Procedural Terminology (CPT) code specification ranges for noncardiac surgeries 10021-32999 and 34001-69990. The study sample was divided randomly into a training set (60%), validation (20%), and test set (20%),14 with similar rates of MACE in the resulting sets. We used a holdout test set for all final analyses to avoid overfitting during model selection.
Outcomes
The composite outcome used to develop the risk-stratification models was in-hospital MACE after major noncardiac surgery. Following prior literature, MACE was defined using billing codes for ST-elevation/non–ST-elevation myocardial infarction (STEMI/NSTEMI, ICD-9-CM 410.xx, ICD-10-CM I21.xx), cardiac arrest (ICD-9-CM 427.5, ICD-10-CM I46.x, I97.121), or all-cause in-hospital death.2,15-17
Variables
Variables were selected from baseline administrative, preoperative clinical, and intraoperative clinical data sources (full list in Appendix). Baseline variables included demographics, insurance type, and Elixhauser comorbidities.18,19 Preoperative variables included surgery type, laboratory results, and American Society of Anesthesiologists (ASA) Physical Status classification.20 Intraoperative variables included vital signs, estimated blood loss, fluid administration, and vasopressor use. We winsorized outlier values and used multiple imputation to address missingness. Rates of missing data can be found in Appendix Table 1.
Risk-Stratification Models Used as Comparisons
Briefly, RCRI variables include the presence of high-risk surgery,21 comorbid cardiovascular diseases (ie, ischemic heart disease, congestive heart failure, and cerebrovascular disease), preoperative use of insulin, and elevated preoperative serum creatinine.6 RCRI uses the inputs to calculate a point score that equates to different risk strata and is based on a stepwise logistic regression model with postoperative cardiovascular complications as the dependent outcome variable. For this study, we implemented the weighted version of the RCRI algorithm and computed the point scores (Appendix).6,7,22
We also applied a risk factor–based algorithm for postoperative cardiac biomarker testing published in 2017 by the Canadian Cardiovascular Society (CCS) guidelines to each patient in the study sample.7 Specifically, this algorithm recommends daily troponin surveillance for 48 to 72 hours after surgery among patients who have (1) an elevated NT-proBNP/BNP measurement or no NT-proBNP/BNP measurement before surgery, (2) have a Revised Cardiac Risk Index score of 1 or greater, (3) are aged 65 years and older, (4) are aged 45 to 64 years with significant cardiovascular disease undergoing elective surgery, or (5) are aged 18 to 64 years with significant cardiovascular disease undergoing semiurgent, urgent, or emergent surgery.
Statistical Analysis
We compared patient characteristics and outcomes between those who did and those who did not experience MACE during hospitalization. Chi-square tests were used to compare categorical variables and Mann Whitney tests were used to compare continuous variables.
To create the perioperative risk-stratification model based on baseline, preoperative, and intraoperative data, we used a logistic regression with elastic net selection using a dichotomous dependent variable indicating MACE and independent variables described earlier. This perioperative model was fit on the training set and the model coefficients were then applied to the patients in the test set. The area under the receiver operating characteristic curve (AUC) was reported and the outcomes were reported by predicted risk decile, with higher deciles indicating higher risk (ie, higher numbers of patients with MACE outcomes in higher deciles implied better risk stratification). Because predicted risk of postoperative MACE may not have been distributed evenly across deciles, we also examined the distribution of the predicted probability of MACE and examined the number of patients below thresholds of risk corresponding to 0.1% or less, 0.25% or less, 0.5% or less, and 1% or less. These thresholds were chosen because they were close to the overall rate of MACE within our cohort.
We tested for differences in predictive performance between the RCRI logistic regression model AUC and the perioperative model AUC using DeLong’s test.23 Additionally, we illustrated differences between the perioperative and RCRI models’ performance in two ways by stratifying patients into deciles based on predicted risk. First, we compared rates of MACE and MACE component events by predicted decile of the perioperative and RCRI models. Second, we further classified patients as RCRI high or low risk (per RCRI score classification in which RCRI score of 1 or greater is high risk and RCRI score of 0 is low risk) and examined numbers of surgical cases and MACE complications within these categories stratified by perioperative model predicted decile.
To compare the perioperative model’s performance with that of a risk factor–based guideline algorithm, we classified patients according to CCS guidelines as high risk (those for whom the CCS guidelines algorithm would recommend postoperative troponin surveillance testing) and low risk (those for whom the CCS guidelines algorithm would not recommend surveillance testing). We also used a logistic regression to examine if the predicted risk from our model was independently associated with MACE above and beyond the testing recommendation of the CCS guidelines algorithm. This model used MACE as the dependent variable and model-predicted risk and a CCS guidelines–defined high-risk indicator as predictors. We computed the association between a 10 percentage–point increase in predicted risk on observed MACE outcome rates.24
In sensitivity analyses, we used a random forest machine learning classifier to test an alternate model specification, used complete case analysis, varied RCRI thresholds, and limited to patients aged 50 years or older. We also varied the penalty parameter in the elastic net model and plotted AUC versus the number of variables included to examine parsimonious models. SAS v9.4 (SAS Institute Inc) was used for main analyses. Data preparations and sensitivity analysis were done in Python v3.6 with Pandas v0.24.2 and Scikit-learn v0.19.1.
RESULTS
Study Sample
Patients who underwent major noncardiac surgery in our sample (n = 72,909) were approximately a mean age of 56 years, 58% female, 66% of White race and 26% of Black race, and most likely to have received orthopedic surgery (33%) or general surgery (20%). Those who experienced MACE (n = 558; 0.77%) differed along several characteristics (Table 1). For example, those with MACE were older (mean age, 65.4 vs 55.4 years; P < .001) and less likely to be female (41.9% vs 58.3%; P < .001).
Model Performance After Intraoperative Data Inclusion
In the perioperative model combining preoperative and intraoperative data, 26 variables were included after elastic net selection (Appendix Table 2). Model discrimination in the test set of patients demonstrated an AUC of 0.88 (95% CI, 0.85-0.92; Figure). When examining outcome rates by predicted decile, the outcome rates of in-hospital MACE complications were higher in the highest decile than in the lowest decile, notably with 58 of 92 (63%) cases with MACE complications within the top decile of predicted risk (Table 2). The majority of patients had low predicted risk of MACE, with 5,309 (36.1%), 8,796 (59.7%), 11,335 (77.0%), and 12,972 (88.1%) below the risk thresholds of to 0.1%, 0.25%, 0.5%, and 1.0% respectively. The associated MACE rates were 0.04%, 0.10%, 0.17%, and 0.25% (average rate in sample was 0.63%) (Appendix Table 3).
Model Performance Comparisons
The perioperative model AUC of 0.88 was higher when compared with RCRI’s AUC of 0.79 (95% CI, 0.74-0.84; P < .001). The number of MACE complications was more concentrated in the top decile of predicted risk of the perioperative model than it was in that of the RCRI model (58 vs 43 of 92 events, respectively; 63% vs 47%; Table 2). Furthermore, there were fewer cases with MACE complications in the low-risk deciles (ie, deciles 1 to 5) of the perioperative model than in the those of the RCRI model. These relative differences were consistent for MACE component outcomes of STEMI/NSTEMI, cardiac arrest, and in-hospital death, as well.
There was substantial heterogeneity in the perioperative model predicted risk of patients classified as either RCRI low risk or high risk (ie, each category included patients with low and high predicted risk) categories (Table 3). Patients in the bottom (low-risk) five deciles of the perioperative model’s predicted risk who were in the RCRI model’s high-risk group were very unlikely to experience MACE complications (3 out of 722 cases; 0.42%). Furthermore, among those classified as low risk by the RCRI model but were in the top decile of the perioperative model’s predicted risk, the MACE complication rate was 3.5% (8 out of 229), which was 6 times the sample mean MACE complication rate.
The perioperative model identified more patients as low risk than did the CCS guidelines’ risk factor–based algorithm (Table 3). For example, 2,341 of the patients the CCS guidelines algorithm identified as high risk were in the bottom 50% of the perioperative model’s predicted risk for experiencing MACE (below a 0.18% chance of a MACE complication); only four of these patients (0.17%) actually experienced MACE. This indicates that the 2,341 of 7,597 (31%) high-risk patients identified as low risk in the perioperative model would have been recommended for postoperative troponin testing by CCS guidelines based on preoperative risk factors alone—but did not go on to experience a MACE. Regression results indicated that both CCS guidelines risk-factor classification and the perioperative model’s predicted risk were predictive of MACE outcomes. A change in the perioperative model’s predicted risk of 10 percentage points was associated with an increase in the probability of a MACE outcomes of 0.45 percentage points (95% CI, 0.35-0.55 percentage points; P < .001) and moving from CCS guidelines’ low- to high-risk categories was associated with an increased probability of MACE by 0.96 percentage points (95% CI, 0.75-1.16 percentage points; P < .001).
Results were consistent with the main analysis across all sensitivity analyses (Appendix Tables 4-7). Parsimonious models with variables as few as eight variables retained strong predictive power (AUC, 0.870; Appendix Figure 1 and Table 8).
DISCUSSION
In this study, the addition of intraoperative data improved risk stratification for MACE complications when compared with standard risk tools such as RCRI. This approach also outperformed a guidelines-based approach and identified additional patients at low risk of cardiovascular complications. This study has three main implications.
First, this study demonstrated the additional value of combining intraoperative data with preoperative data in risk prediction for postoperative cardiovascular events. The intraoperative data most strongly associated with MACE, which likely were responsible for the performance improvement, included administration of medications (eg, sodium bicarbonate or calcium chloride) and blood products (eg, platelets and packed red blood cells), vitals (ie, heart rate), and intraoperative procedures (ie, arterial line placement); all model variables and coefficients are reported in Appendix Table 9. The risk-stratification model using intraoperative clinical data outperformed validated standard models such as RCRI. While this model should not be used in causal inference and cannot be used to inform decisions about risk-benefit tradeoffs of undergoing surgery, its improved performance relative to prior models highlights the potential in using real-time data. Preliminary illustrative analysis demonstrated that parsimonious models with as few as eight variables perform well, whose implementation as risk scores in EHRs is likely straightforward (Appendix Table 8). This is particularly important for longitudinal care in the hospital, in which patients frequently are cared for by multiple clinical services and experience handoffs. For example, many orthopedic surgery patients with significant medical comorbidity are managed postoperatively by hospitalist physicians after initial surgical care.
Second, our study aligns well with the cardiac risk-stratification literature more broadly. For example, the patient characteristics and clinical variables most associated with cardiovascular complications were age, history of ischemic heart disease, American Society of Anesthesiologists physical status, use of intraoperative sodium bicarbonate or vasopressors, lowest intraoperative heart rate measured, and lowest intraoperative mean arterial pressure measured. While many of these variables overlap with those included in the RCRI model, others (such as American Society of Anesthesiologists physical status) are not included in RCRI but have been shown to be important in risk prediction in other studies using different data variables.6,25,26
Third, we illustrated a clinical application of this model in identifying patients at low risk of cardiovascular complications, although benefit may extend to other patients as well. This is particularly germane to clinicians who frequently manage patients in the postsurgical or postprocedural setting. Moreover, the clinical relevance to these clinicians is underscored by the lack of consensus among professional societies across Europe, Canada, and the United States about which subgroups of patients undergoing noncardiac surgery should receive postoperative cardiac biomarker surveillance testing in the 48 to 72 hours after surgery.6-9 This may be in part caused by differences in clinical objectives. For example, the CCS guidelines in part aim to detect myocardial injury after noncardiac surgery (MINS) up to 30 days after surgery, which may be more sensitive to myocardial injury but less strongly associated with outcomes like MACE. The results of this study suggest that adopting such risk factor–based testing would likely lead to additional testing of low risk patients, which may represent low value surveillance tests. For example, there were 2,257 patients without postoperative cardiac biomarker testing in our data who would have been categorized as high risk by risk factor guidelines and therefore recommended to receive at least one postoperative cardiac biomarker surveillance test but were classified as low-risk individuals using a predicted probability of MACE less than 0.18% per our perioperative risk stratification model (Appendix Table 4). If each of these patients received one troponin biomarker test, the associated cost increase would be $372,405 (using the $165 cost per test reported at our institution). These costs would multiply if daily surveillance troponin biomarker tests were ordered for 48 to 72 hours after surgery, as recommended by the risk factor–based testing guidelines. This would be a departure from testing among patients using clinician discretion that may avoid low-value testing.
Applying the perioperative model developed in this paper to clinical practice still requires several steps. The technical aspects of finding a parsimonious model that can be implemented in the EHR is likely quite straightforward. Our preliminary analysis illustrates that doing so will not require accessing large numbers of intraoperative variables. Perhaps more important steps include prospective validation of the safety, usability, and clinical benefit of such an algorithm-based risk score.27
The study has several limitations. First, it was an observational study using EHR data subject to missingness and data quality issues that may have persisted despite our methods. Furthermore, EHR data is not generated randomly, and unmeasured variables observed by clinicians but not by researchers could confound the results. However, our approach used the statistical model to examine risk, not causal inference. Second, this is a single institution study and the availability of EHR data, as well as practice patterns, may vary at other institutions. Furthermore, it is possible that performance of the RCRI score, the model fitting RCRI classification of high vs low risk on the sample data, and our model’s performance may not generalize to other clinical settings. However, we utilized data from multiple hospitals within a health system with different surgery and anesthesia groups and providers, and a similar AUC was reported for RCRI in original validation study.6 Third, our follow up period was limited to the hospital setting and we do not capture longitudinal outcomes, such as 30-day MACE. This may impact the ability to risk stratify for other important longer-term outcomes, limit clinical utility, and hinder comparability to other studies. Fourth, results may vary for other important cardiovascular outcomes that may be more sensitive to myocardial injury, such as MINS. Fifth, we used a limited number of modeling strategies.
CONCLUSION
Addition of intraoperative data to preoperative data improves prediction of cardiovascular complications after noncardiac surgery. Improving the identification of patients at low risk for such complications could potentially be applied to reduce unnecessary postoperative cardiac biomarker testing after noncardiac surgery, but it will require further validation in prospective clinical settings.
Disclosures
Dr Navathe reports grants from the following entities: Hawaii Medical Service Association, Anthem Public Policy Institute, Commonwealth Fund, Oscar Health, Cigna Corporation, Robert Wood Johnson Foundation, Donaghue Foundation, Pennsylvania Department of Health, Ochsner Health System, United Healthcare, Blue Cross Blue Shield of NC, Blue Shield of CA; personal fees from the following: Navvis Healthcare, Agathos, Inc, Navahealth, YNHHSC/CORE, Maine Health Accountable Care Organization, Maine Department of Health and Human Services, National University Health System - Singapore, Ministry of Health - Singapore, Social Security Administration - France, Elsevier Press, Medicare Payment Advisory Commission, Cleveland Clinic, Embedded Healthcare; and other support from Integrated Services, Inc, outside of the submitted work. Dr Volpp reports grants from Humana during the conduct of the study; grants from Hawaii Medical Services Agency, Discovery (South Africa), Merck, Weight Watchers, and CVS outside of the submitted work; he has received consulting income from CVS and VALHealth and is a principal in VALHealth, a behavioral economics consulting firm. Dr Holmes receives funding from the Pennsylvania Department of Health, US Public Health Service, and the Cardiovascular Medicine Research and Education Foundation. All other authors declare no conflicts of interest.
Prior Presentations
2019 Academy Health Annual Research Meeting, Poster Abstract Presentation, June 2 to June 4, 2019, Washington, DC.
Funding
This project was funded, in part, under a grant with the Pennsylvania Department of Health. This research was independent from the funder. The funder had no role in the study design; in the collection, analysis, and interpretation of data; in the writing of the report; or in the decision to submit the article for publication. The department specifically disclaims responsibility for any analyses, interpretations, or conclusions.
1. National Center for Health Statistics. National Hospital Discharge Survey: 2010 Table, Number of all-listed procedures for discharges from short-stay hospitals, by procedure category and age: United States, 2010. Centers for Disease Control and Prevention; 2010. Accessed November 11, 2018. https://www.cdc.gov/nchs/data/nhds/4procedures/2010pro4_numberprocedureage.pdf
2. Devereaux PJ, Goldman L, Cook DJ, Gilbert K, Leslie K, Guyatt GH. Perioperative cardiac events in patients undergoing noncardiac surgery: a review of the magnitude of the problem, the pathophysiology of the events and methods to estimate and communicate risk. CMAJ. 2005;173(6):627-634. https://doi.org/10.1503/cmaj.050011
3. Charlson M, Peterson J, Szatrowski TP, MacKenzie R, Gold J. Long-term prognosis after peri-operative cardiac complications. J Clin Epidemiol. 1994;47(12):1389-1400. https://doi.org/10.1016/0895-4356(94)90083-3
4. Devereaux PJ, Sessler DI. Cardiac complications in patients undergoing major noncardiac surgery. N Engl J Med. 2015;373(23):2258-2269. https://doi.org/10.1056/nejmra1502824
5. Sprung J, Warner ME, Contreras MG, et al. Predictors of survival following cardiac arrest in patients undergoing noncardiac surgery: a study of 518,294 patients at a tertiary referral center. Anesthesiology. 2003;99(2):259-269. https://doi.org/10.1097/00000542-200308000-00006
6. Lee TH, Marcantonio ER, Mangione CM, et al. Derivation and prospective validation of a simple index for prediction of cardiac risk of major noncardiac surgery. Circulation. 1999;100(10):1043-1049. https://doi.org/10.1161/01.cir.100.10.1043
7. Duceppe E, Parlow J, MacDonald P, et al. Canadian Cardiovascular Society guidelines on perioperative cardiac risk assessment and management for patients who undergo noncardiac surgery. Can J Cardiol. 2017;33(1):17-32. https://doi.org/10.1016/j.cjca.2016.09.008
8. Fleisher LA, Fleischmann KE, Auerbach AD, et al. 2014 ACC/AHA guideline on perioperative cardiovascular evaluation and management of patients undergoing noncardiac surgery: a report of the American College of Cardiology/American Heart Association Task Force on practice guidelines. J Am Coll Cardiol. 2014;64(22):e77-e137. https://doi.org/10.1016/j.jacc.2014.07.944
9. Kristensen SD, Knuuti J, Saraste A, et al. 2014 ESC/ESA guidelines on non-cardiac surgery: cardiovascular assessment and management: The Joint Task Force on non-cardiac surgery: cardiovascular assessment and management of the European Society of Cardiology (ESC) and the European Society of Anaesthesiology (ESA). Euro Heart J. 2014;35(35):2383-2431. https://doi.org/10.1093/eurheartj/ehu282
10. Collins GS, Reitsma JB, Altman DG, Moons KG. Transparent reporting of a multivariable prediction model for individual prognosis or diagnosis (TRIPOD): the TRIPOD statement. Ann Intern Med. 2015;162(1):55-63. https://doi.org/10.7326/m14-0697
11. Freundlich RE, Kheterpal S. Perioperative effectiveness research using large databases. Best Pract Res Clin Anaesthesiol. 2011;25(4):489-498. https://doi.org/10.1016/j.bpa.2011.08.008
12. CPT® (Current Procedural Terminology). American Medical Association. 2018. Accessed November 11, 2018. https://www.ama-assn.org/practice-management/cpt-current-procedural-terminology
13. Surgery Flag Software for ICD-9-CM. AHRQ Healthcare Cost and Utilization Project; 2017. Accessed November 11, 2018. https://www.hcup-us.ahrq.gov/toolssoftware/surgflags/surgeryflags.jsp
14. Hastie T, Tibshirani R, Friedman J. The Elements of Statistical Learning: Data Mining, Inference, and Prediction. 2nd ed. Springer; 2009. https://www.springer.com/gp/book/9780387848570
15. Bucy R, Hanisko KA, Ewing LA, et al. Abstract 281: Validity of in-hospital cardiac arrest ICD-9-CM codes in veterans. Circ Cardiovasc Qual Outcomes. 2015;8(suppl_2):A281-A281.
16. Institute of Medicine; Board on Health Sciences Policy; Committee on the Treatment of Cardiac Arrest: Current Status and Future Directions. Graham R, McCoy MA, Schultz AM, eds. Strategies to Improve Cardiac Arrest Survival: A Time to Act. The National Academies Press; 2015. https://doi.org/10.17226/21723
17. Pladevall M, Goff DC, Nichaman MZ, et al. An assessment of the validity of ICD Code 410 to identify hospital admissions for myocardial infarction: The Corpus Christi Heart Project. Int J Epidemiol. 1996;25(5):948-952. https://doi.org/10.1093/ije/25.5.948
18. Elixhauser A, Steiner C, Harris DR, Coffey RM. Comorbidity measures for use with administrative data. Med Care. 1998;36(1):8-27. https://doi.org/10.1097/00005650-199801000-00004
19. Quan H, Sundararajan V, Halfon P, et al. Coding algorithms for defining comorbidities in ICD-9-CM and ICD-10 administrative data. Med Care. 2005;43(11):1130-1139. https://doi.org/10.1097/01.mlr.0000182534.19832.83
20. Keats AS. The ASA classification of physical status--a recapitulation. Anesthesiology. 1978;49(4):233-236. https://doi.org/10.1097/00000542-197810000-00001
21. Schwarze ML, Barnato AE, Rathouz PJ, et al. Development of a list of high-risk operations for patients 65 years and older. JAMA Surg. 2015;150(4):325-331. https://doi.org/10.1001/jamasurg.2014.1819
22. VISION Pilot Study Investigators, Devereaux PJ, Bradley D, et al. An international prospective cohort study evaluating major vascular complications among patients undergoing noncardiac surgery: the VISION Pilot Study. Open Med. 2011;5(4):e193-e200.
23. DeLong ER, DeLong DM, Clarke-Pearson DL. Comparing the areas under two or more correlated receiver operating characteristic curves: a nonparametric approach. Biometrics. 1988;44(3):837-845.
24. Norton EC, Dowd BE, Maciejewski ML. Marginal effects-quantifying the effect of changes in risk factors in logistic regression models. JAMA. 2019;321(13):1304‐1305. https://doi.org/10.1001/jama.2019.1954
25. Bilimoria KY, Liu Y, Paruch JL, et al. Development and evaluation of the universal ACS NSQIP surgical risk calculator: a decision aid and informed consent tool for patients and surgeons. J Am Coll Surg. 2013;217(5):833-842. https://doi.org/10.1016/j.jamcollsurg.2013.07.385
26. Gawande AA, Kwaan MR, Regenbogen SE, Lipsitz SA, Zinner MJ. An Apgar score for surgery. J Am Coll Surg. 2007;204(2):201-208. https://doi.org/10.1016/j.jamcollsurg.2006.11.011
27. Parikh RB, Obermeyer Z, Navathe AS. Regulation of predictive analytics in medicine. Science. 2019;363(6429):810-812. https://doi.org/10.1126/science.aaw0029
© 2020 Society of Hospital Medicine
Relationship of Hospital Star Ratings to Race, Education, and Community Income
Hospitals play important roles in the healthcare ecosystem. Currently, they account for approximately one-third of more than $3 trillion dollars spent on healthcare annually.1 To contain costs, improve patient experience, and advance population health, there has been progress in standardizing quality metrics and increasing transparency around key performance metrics.
Launched in 2016, the Overall Hospital Quality Star Rating was developed by the Centers for Medicare & Medicaid Services (CMS) as a means of assessing quality and outcome measures. More importantly, star ratings are aimed to enhance the usability and accessibility of information about quality. The rating system evaluates seven quality categories: mortality, safety, readmission, patient experience, effectiveness, timeliness, and efficient use of medical imaging. Hospitals that have at least three measures within at least three measure categories, including one outcome group (mortality, safety, or readmission) are eligible for an overall rating based on a five-star system.2
While the intent of quality ratings is to summarize high-dimensional information to facilitate patients in choosing hospitals with better quality, it is unclear whether patients have equal geographic proximity to hospitals with high ratings. Although researchers have examined overall quality ratings by hospital type (community, specialty, teaching, bed size),3 there is an opportunity to expand the body of knowledge at the intersection of overall star rating and race/ethnicity, education attainment, income level, and geographic region.
This study complements prior investigations on the topic. For example, Osbourne et al found that comorbidities and socioeconomic barriers were leading factors in observed mortality disparities between Black and White patients.4 Since mortality ratings are factored into overall star ratings, hospitals that serve low-income communities of color with high-acuity volumes may be at risk for lower star quality ratings. Trivedi et al found that, compared with White patients, Black and Hispanic patients were more likely to use low-volume hospitals for cardiac procedures. In addition, Black patients experienced worse outcomes.5 Insurance barriers, limited access to specialty care providers, and residential segregation may explain the chasm. These factors, often beyond hospitals’ control, may impact readmissions, which are also factored into overall quality ratings. Additionally, Hu and Nerenz found that, on average, the most “stressed” cities have lower quality ratings than less “stressed” cities.6 Stress markers include poverty, unemployment, divorce rate, and adult health conditions. Other findings suggest readmission rates are correlated with patient provider ratios, community characteristics, and poor social and economic conditions that influence decision-making.7-9 Some investigators have explored quality ratings in other sectors of healthcare. For example, residents in socioeconomically disadvantaged counties are less likely to access nursing homes with higher star ratings.9
In light of new and emerging value-based payment models, coupled with efforts to risk-adjust for socioeconomic conditions that may compromise desired outcomes, this study sought to expand the scope of knowledge by offering insight on the association between hospital quality ratings and socioeconomic factors and geographic indicators. Particularly, we focus on the minority population percentage, county-level household income, education, dual eligibility, rural/urban designation, and geographic region.
METHODS
Data and Study Sample
Our analysis relies on data extracted from multiple sources. We obtained hospital overall quality ratings from the Hospital Compare website (www.medicare.gov/hospitalcompare) released in July 2018. We also included key hospital characteristics extracted by American Hospital Directory and Medicare cost reports. Socioeconomic and demographic variables were obtained from the Area Health Resources Files (AHRF) maintained by Health Resources & Services Administration. Hospital referral region data was downloaded from Dartmouth Atlas Project. We included only acute hospitals that were certified by CMS. Hospitals with missing overall star rating values were excluded. Our study included 3,075 acute care hospitals in 1,047 counties and 306 hospital referral regions.
Dependent Variable: Hospital Quality Ratings
Our main outcome variables are hospital quality ratings reported by CMS. The overall star ratings use 64 of more than 100 quality measures and ranges from one to five stars, with five stars representing the highest quality. Our study uses the hospital quality star rating released in July 2018. The measurement period starts in January 2014 and extends to September 2017. Because of space limitation, we only present the results on the overall rating. The full results of all seven quality domains are provided in appendices.
Key Independent Variables
Key variables of interest are the socioeconomic factors of the communities served by the hospital. Specifically, our analysis focuses on minority population percentage, household income, education attainment, Medicare/Medicaid dual eligibility, urban/rural designation, and geographic region. For these key variables except urban/rural designation and geographic region, we created categorical variables indicating whether the values are below the national median (low group), in the 3rd quartile (intermediate group), and in the 4th quartile (high group). Group cutoffs are based on socioeconomic and demographic variables reported by AHRF for all counties nationwide. Because we use the county averages as the cutoff values and each county has a different number of hospitals, the number of hospitals distributes unevenly in each quartile. Additionally, we grouped the 1st and 2nd quartiles as the low group because there are fewer hospitals in these two quartiles. Education attainment is measured by the percentage of population above 25 years old with a college degree. “Hospital access” is defined as a measure for the availability of services from competing hospitals, and we counted the number of hospitals available in a hospital referral region. For the 306 hospital referral regions, the number of hospitals ranges from 1 to 71 with an average of 12.
Statistical Model
To study the relationship between quality rating and socioeconomic factors, we used both logistic and multinomial logistic regression models. The regression model can be described as follows:
Q i = Minority i β 1 + Income i β 2 + Population Age i β 3 + Education i β 4 + Access i β 5 + Dual_Eligible i β 6 + Rural i β 7 + Region i β 8 + Hosp i γ + ϵ i
In the logistic model, Qi represents the dependent variable indicating whether a hospital has an overall quality star rating of either one star or five stars; we also ran a multinomial logistic regression model in which the hospital overall quality star rating ranges from one star to five stars with one-star increments. These ordinal regression models include key socioeconomic factors, such as percentage of population that is a minority, the average household income, the education attainment level, access to hospitals, the percentage of population that is Medicare/Medicaid dual-eligible, and the rurality of a hospital. We also include a set of dummy variables to control for region differences. [Hosp]i is a vector of hospital characteristics, including ownership status, teaching status, and hospital size.

To examine extreme hospital quality (ie, one or five stars) overall ratings in relation to socioeconomic factors of serving communities, we first used the logistic regression model to predict probabilities of hospitals with either one-star or five-star ratings. We then compared the marginal probabilities of key socioeconomic factors. Finally, we treated the overall quality rating collectively, ranging from one to five stars, as an ordinal variable and applied multinomial logistic regression to produce odds ratios of relationship of key variables with higher quality rating hospitals. For all these models, standard errors are clustered at the hospital referral region level. Models are estimated by generalized estimating equations. Statistical analyses were conducted in SAS 9.2.

RESULTS
We first present the summary statistics of key variables in Table 1. The estimated marginal probabilities and odds ratios from the multivariate regressions are reported in Table 2.

Distribution of Quality Ratings
The distribution of hospital quality rating is shown in the Figure. About 8% of the hospitals received a one-star rating, whereas 9.95% of the hospitals had a five-star rating. Most of the hospitals received two, three, and four stars with frequencies of 21.63%, 30.80%, and 29.63%, respectively. The distribution of quality ratings with respect to socioeconomic and geographic factors are presented in Table 1. Most hospitals in our sample were located in counties where the minority population percentage was above the national median (8.21%). The hospitals in counties with highest minority presence had a lower overall rating (2.86). There is a clear gradient between the median household income and hospital overall rating. About 43% of hospitals were in counties in which the median household income was in the 4th quartile, whereas only 31% of hospitals are in counties with a median household income below the national median. Hospitals in counties with high income also have higher overall rating (3.24). In terms of urban/rural hospitals, there are more urban hospitals (70%) but with a lower overall rating of 3.04, compared with rural hospitals (30%, 3.31). We also found that the counties with higher education attainment and lower dual-eligible population tend to have higher hospital ratings. Geographically, hospitals in the Midwest and West have higher average overall quality ratings than do those in the Northeast and South.
Minority Population Percentage and Hospital Rating
As shown in Table 2, results from the logistic regression show that, compared with those in counties with low minority population percentage, hospitals in counties with high minority population percentage have higher marginal probabilities to have one-star ratings, and the result is statistically significant at the 1% level. At the same time, hospitals in counties with intermediate minority percentage have lower marginal probabilities of having a five-star rating. On the other hand, the odds ratio from the multinomial logistic regressions show that minority population percentage is negatively correlated with hospital rating, statistically significant at the 1% level.
Median Household Income and Hospital Rating
We found a statistically significant relationship between household income and hospital quality rating. Hospitals in lower income groups are more likely to have one-star ratings. The odds ratio analysis provides consistent evidence that higher household income is correlated with star ratings.
Education Attainment, Dual Eligibility, and Hospital Rating
In addition, we found a consistent and statistically significant relationship between education attainment and hospital ratings. Compared with counties with high education attainment (reference group), hospitals in counties with intermediate education attainment are more likely to have one-star ratings. Similarly, hospitals in counties with less and intermediate education attainment are less likely to be five-star rated. Consistently, odds ratios of hospitals in intermediate and lower education attainment counties with better quality are significantly lower, at the 1% level.
In terms of dual eligibility, hospitals in counties with higher percentage of dual-eligible residents are statistically significantly less likely to receive five-star ratings. Consistent evidence was found in odds ratios. However, dual eligibility is not statistically significantly correlated with the probabilities of receiving one-star ratings.
Rurality, Geographic Region, and Hospital Rating
Compared with urban hospitals, rural hospitals are less likely to receive five-star ratings. However, there is no difference in the probabilities of receiving one-star ratings and no statistically significant difference in overall ratings. Geographically, hospitals in the Northeast are more likely to have one-star ratings and less likely to be five-star rated. The odds ratio also suggests that Northeastern hospitals on average have lower quality rating compared with Midwestern hospitals. Hospitals in South and West are also less likely to have five-star ratings.
DISCUSSION
Consistent with findings in nursing homes,10 hospitals that serve lower income communities have comparatively lower quality ratings than did those that serve more affluent communities. Several factors may contribute to these outcomes. Higher volumes of uninsured patients and patients with public insurance impact how much revenue the hospital collects for services, hindering the capacity to reinvest in processes to advance quality. Moreover, these hospitals are likely to serve patients with higher acuity and complex psychosocial barriers that affect their experience, perceptions, and outcomes. Structural conditions of economically distressed communities also play a role. Limited access to a robust network of community-based resources for healthy living post surgery may contribute to higher rates of readmission, which may compromise overall quality ratings.
Furthermore, after adjustment for community characteristics, hospitals that serve higher volumes of racial minorities have higher probability of receiving one-star ratings and lower average quality rating. While more research is needed to examine specific measures in the quality rating formula that may disproportionately affect racial and ethnic minorities, Hospital Consumer Assessment of Healthcare Providers and Systems (HCAHPS) surveys may offer some insight. Some researchers have found that White respondents and those with higher levels of education are more likely to cite favorable HCAHPS responses than are minorities or persons with lower levels of education.11 This has negative implications on the HCAPHS scores of hospitals that serve higher volumes of minority patients with low education attainment. Real or perceived discrimination, unconscious bias, miscommunication, and language discordance may explain the disparity between the survey results of White respondents and minorities.12-16
While interpreting the results of this study, it is important to note that the research design examines the relationship between quality ratings, race, and community characteristics. Our analysis does not specifically examine clinical quality of care. It should not be assumed that hospitals with low ratings provide substandard clinical care.
While the intent of Hospital Quality Ratings is well received, there are varying perspectives on the calculation methodology—particularly the need for social risk adjustment.17-19 There is also concern about community perception which affects consumer choice, decision making, and referral patterns. Hospitals with lower ratings are likely to have negative repercussions that perpetuate inequities. For example, in light of new and emerging pay-for-performance models, the publicity of star ratings has the potential to influence behaviors that exacerbate disparities.20 Physicians and medical groups may explicitly or implicitly avoid patients with characteristics that may lower their quality scores. Patients with resources to fully cover their healthcare expenses may choose hospitals with higher quality ratings, leaving hospitals with lower quality ratings to serve the under- or uninsured. Over time, these patterns may jeopardize quality, safety, and the fiscal viability of hospitals that serve communities with lower socioeconomic status.
Among the geographic regions analyzed, quality ratings were higher in the Midwest. This finding aligns with a report from the Agency for Healthcare Research and Quality, which recognized five states from the Midwest for having the highest quality ratings (Iowa, Minnesota, Nebraska, North Dakota, and Wisconsin).21 Hospitals in the South and Northeast generally had lower quality ratings. As discovered by other investigators, nonteaching, smaller, rural hospitals had more favorable outcomes when compared with teaching, larger, urban hospitals, which are more likely to care for more complex, critically ill patients.22 These regional differences, coupled with hospital types, have implications for federal appropriations and funding priorities earmarked for quality initiatives.
CONCLUSION
As national efforts continue to promote health equity and enhance the value of healthcare, it is important to recognize the association between race, socioeconomic factors, and hospital star quality ratings. Allocated resources should ensure that hospitals serving racial minorities, low-income communities, and those in urban settings have the capacity to deliver comprehensive care based on the unique needs of the community. Hospitals that serve low-income communities may benefit from payment models and incentives that adjust for these differences—which could allow them to invest in quality improvement processes and social support services.
Disclosures
The authors declared no potential conflicts of interest with respect to the research, authorship, and/or publication of this article.
Funding
The authors did not receive external funding for this study.
1. Statistica. U.S. Hospitals - Statistics & Facts. www.statista.com. Accessed May 22, 2019. https://www.statista.com/topics/1074/hospitals/
2. Centers for Medicare & Medicaid Services. Hospital Compare overall hospital rating. Accessed May 22, 2019. https://www.medicare.gov/hospitalcompare/Data/Hospital-overall-ratings-calculation.html
3. DeLancey JO, Softcheck J, Chung JW, Barnard C, Dahlke AR, Bilimoria KY. Associations between hospital characteristics, measure reporting, and the Centers for Medicare & Medicaid Services Overall Hospital Quality Star Ratings. JAMA. 2017;317(19):2015-2017. https://doi.org/10.1001/jama.2017.3148
4. Osborne NH, Upchurch GR, Mathur AK, Dimick JB. Explaining racial disparities in mortality after abdominal aortic aneurysm repair. J Vasc Surg. 2009;50(4):709-713. https://doi.org/10.1016/j.jvs.2009.05.020
5. Trivedi AN, Sequist TD, Ayanian JZ. Impact of hospital volume on racial disparities in cardiovascular procedure mortality. J Am Coll Cardiol. 2006;47(2):417-424. https://doi.org/10.1016/j.jacc.2005.08.068
6. Hu J, Nerenz D. Relationship between stress rankings and the overall hospital star ratings: an analysis of 150 cities in the United States. JAMA Intern Med. 2017;177(1):136-137. https://doi.org/10.1001/jamainternmed.2016.7068
7. Herrin J, Andre JS, Kenward K, Joshi MS, Audet AM, Hines SC. Community factors and hospital readmission rates. Health Serv Res. 2015;50(1):20-39. https://doi.org/10.1111/1475-6773.12177
8. Brewster AL, Lee S, Curry LA, Bradley EH. Association between community social capital and hospital readmission rates. Popul Health Manag. 2018;22(1):40-47. https://doi.org/10.1089/pop.2018.0030
9. Navathe AS, Zhong F, Lei VJ, et al. Hospital readmission and social risk factors identified from physician notes. Health Serv Res. 2018;53(2):1110-1136. https://doi.org/10.1111/1475-6773.12670
10. Yuan Y, Louis C, Cabral H, Schneider JC, Ryan CM, Kazis LE. Socioeconomic and geographic disparities in accessing nursing homes with high star ratings. J Am Med Dir Assoc. 2018;19(10):852-859.e2. https://doi.org/10.1016/j.jamda.2018.05.017
11. Goldstein E, Elliott MN, Lehrman WG, Hambarsoomian K, Giordano LA. Racial/ethnic differences in patients’ perceptions of inpatient care using the HCAHPS survey. Med Care Res Rev. 2010;67(1):74-92. https://doi.org/10.1177/1077558709341066
12. Jacobs EA, Rathouz PJ, Karavolos K, et al. Perceived discrimination is associated with reduced breast and cervical cancer screening: the study of women’s health across the nation (SWAN). J Womens Health (Larchmt). 2014;23(2):138-145. https://doi.org/10.1089/jwh.2013.4328
13. Reskin B. The race discrimination system. Annu Rev Sociol. 2012;38(1):17-35. https://doi.org/10.1146/annurev-soc-071811-145508
14. Chapman EN, Kaatz A, Carnes M. Physicians and implicit bias: how doctors may unwittingly perpetuate health care disparities. J Gen Intern Med. 2013;28(11):1504-1510. https://doi.org/10.1007/s11606-013-2441-1
15. DeVoe JE, Wallace LS, Fryer Jr GE. Measuring patients’ perceptions of communication with healthcare providers: do differences in demographic and socioeconomic characteristics matter? Health Expect. 2009;12(1):70-80. https://doi.org/10.1111/j.1369-7625.2008.00516.x
16. Austin JM, Jha AK, Romano PS, et al. National hospital ratings systems share few common scores and may generate confusion instead of clarity. Health Aff (Millwood). 2015;34(3):423-430. http://doi.org/10.1377/hlthaff.2014.0201
17. Halasyamani LK, Davis MM. Conflicting measures of hospital quality: Ratings from “Hospital Compare” versus “Best Hospitals.” J Hosp Med. 2007;2(3):128-134. https://doi.org/10.1002/jhm.176
18. Lavenberg JG, Leas B, Umscheid CA, Williams K, Goldmann DR, Kripalani S. Assessing preventability in the quest to reduce hospital readmissions. J Hosp Med . 2014;9(9):598-603. https://doi.org/10.1002/jhm.2226
19. Bilimoria KY, Barnard C. The new CMS hospital quality star ratings: the stars are not aligned. JAMA. 2016;316(17):1761-1762. https://doi.org/10.1001/jama.2016.13679
20. Casalino LP, Elster A, Eisenberg A, Lewis E, Montgomery J, Ramos D. Will pay-for-performance and quality reporting affect health care disparities? Health Aff (Millwood). 2007;26(3):w405-w414. https://doi.org/10.1377/hlthaff.26.3.w405
21. Agency for Healthcare Research & Quality. Overview of Quality and Access in the U.S. Health Care System. Published July 3, 2017. Accessed May 23, 2019. https://www.ahrq.gov/research/findings/nhqrdr/nhqdr16/overview.html
22. Wang DE, Tsugawa Y, Figueroa JF, Jha AK. Association between the Centers for Medicare and Medicaid Services hospital star rating and patient outcomes. JAMA Intern Med. 2016;176(6):848-850. https://doi.org/10.1001/jamainternmed.2016.0784
Hospitals play important roles in the healthcare ecosystem. Currently, they account for approximately one-third of more than $3 trillion dollars spent on healthcare annually.1 To contain costs, improve patient experience, and advance population health, there has been progress in standardizing quality metrics and increasing transparency around key performance metrics.
Launched in 2016, the Overall Hospital Quality Star Rating was developed by the Centers for Medicare & Medicaid Services (CMS) as a means of assessing quality and outcome measures. More importantly, star ratings are aimed to enhance the usability and accessibility of information about quality. The rating system evaluates seven quality categories: mortality, safety, readmission, patient experience, effectiveness, timeliness, and efficient use of medical imaging. Hospitals that have at least three measures within at least three measure categories, including one outcome group (mortality, safety, or readmission) are eligible for an overall rating based on a five-star system.2
While the intent of quality ratings is to summarize high-dimensional information to facilitate patients in choosing hospitals with better quality, it is unclear whether patients have equal geographic proximity to hospitals with high ratings. Although researchers have examined overall quality ratings by hospital type (community, specialty, teaching, bed size),3 there is an opportunity to expand the body of knowledge at the intersection of overall star rating and race/ethnicity, education attainment, income level, and geographic region.
This study complements prior investigations on the topic. For example, Osbourne et al found that comorbidities and socioeconomic barriers were leading factors in observed mortality disparities between Black and White patients.4 Since mortality ratings are factored into overall star ratings, hospitals that serve low-income communities of color with high-acuity volumes may be at risk for lower star quality ratings. Trivedi et al found that, compared with White patients, Black and Hispanic patients were more likely to use low-volume hospitals for cardiac procedures. In addition, Black patients experienced worse outcomes.5 Insurance barriers, limited access to specialty care providers, and residential segregation may explain the chasm. These factors, often beyond hospitals’ control, may impact readmissions, which are also factored into overall quality ratings. Additionally, Hu and Nerenz found that, on average, the most “stressed” cities have lower quality ratings than less “stressed” cities.6 Stress markers include poverty, unemployment, divorce rate, and adult health conditions. Other findings suggest readmission rates are correlated with patient provider ratios, community characteristics, and poor social and economic conditions that influence decision-making.7-9 Some investigators have explored quality ratings in other sectors of healthcare. For example, residents in socioeconomically disadvantaged counties are less likely to access nursing homes with higher star ratings.9
In light of new and emerging value-based payment models, coupled with efforts to risk-adjust for socioeconomic conditions that may compromise desired outcomes, this study sought to expand the scope of knowledge by offering insight on the association between hospital quality ratings and socioeconomic factors and geographic indicators. Particularly, we focus on the minority population percentage, county-level household income, education, dual eligibility, rural/urban designation, and geographic region.
METHODS
Data and Study Sample
Our analysis relies on data extracted from multiple sources. We obtained hospital overall quality ratings from the Hospital Compare website (www.medicare.gov/hospitalcompare) released in July 2018. We also included key hospital characteristics extracted by American Hospital Directory and Medicare cost reports. Socioeconomic and demographic variables were obtained from the Area Health Resources Files (AHRF) maintained by Health Resources & Services Administration. Hospital referral region data was downloaded from Dartmouth Atlas Project. We included only acute hospitals that were certified by CMS. Hospitals with missing overall star rating values were excluded. Our study included 3,075 acute care hospitals in 1,047 counties and 306 hospital referral regions.
Dependent Variable: Hospital Quality Ratings
Our main outcome variables are hospital quality ratings reported by CMS. The overall star ratings use 64 of more than 100 quality measures and ranges from one to five stars, with five stars representing the highest quality. Our study uses the hospital quality star rating released in July 2018. The measurement period starts in January 2014 and extends to September 2017. Because of space limitation, we only present the results on the overall rating. The full results of all seven quality domains are provided in appendices.
Key Independent Variables
Key variables of interest are the socioeconomic factors of the communities served by the hospital. Specifically, our analysis focuses on minority population percentage, household income, education attainment, Medicare/Medicaid dual eligibility, urban/rural designation, and geographic region. For these key variables except urban/rural designation and geographic region, we created categorical variables indicating whether the values are below the national median (low group), in the 3rd quartile (intermediate group), and in the 4th quartile (high group). Group cutoffs are based on socioeconomic and demographic variables reported by AHRF for all counties nationwide. Because we use the county averages as the cutoff values and each county has a different number of hospitals, the number of hospitals distributes unevenly in each quartile. Additionally, we grouped the 1st and 2nd quartiles as the low group because there are fewer hospitals in these two quartiles. Education attainment is measured by the percentage of population above 25 years old with a college degree. “Hospital access” is defined as a measure for the availability of services from competing hospitals, and we counted the number of hospitals available in a hospital referral region. For the 306 hospital referral regions, the number of hospitals ranges from 1 to 71 with an average of 12.
Statistical Model
To study the relationship between quality rating and socioeconomic factors, we used both logistic and multinomial logistic regression models. The regression model can be described as follows:
Q i = Minority i β 1 + Income i β 2 + Population Age i β 3 + Education i β 4 + Access i β 5 + Dual_Eligible i β 6 + Rural i β 7 + Region i β 8 + Hosp i γ + ϵ i
In the logistic model, Qi represents the dependent variable indicating whether a hospital has an overall quality star rating of either one star or five stars; we also ran a multinomial logistic regression model in which the hospital overall quality star rating ranges from one star to five stars with one-star increments. These ordinal regression models include key socioeconomic factors, such as percentage of population that is a minority, the average household income, the education attainment level, access to hospitals, the percentage of population that is Medicare/Medicaid dual-eligible, and the rurality of a hospital. We also include a set of dummy variables to control for region differences. [Hosp]i is a vector of hospital characteristics, including ownership status, teaching status, and hospital size.
To examine extreme hospital quality (ie, one or five stars) overall ratings in relation to socioeconomic factors of serving communities, we first used the logistic regression model to predict probabilities of hospitals with either one-star or five-star ratings. We then compared the marginal probabilities of key socioeconomic factors. Finally, we treated the overall quality rating collectively, ranging from one to five stars, as an ordinal variable and applied multinomial logistic regression to produce odds ratios of relationship of key variables with higher quality rating hospitals. For all these models, standard errors are clustered at the hospital referral region level. Models are estimated by generalized estimating equations. Statistical analyses were conducted in SAS 9.2.
RESULTS
We first present the summary statistics of key variables in Table 1. The estimated marginal probabilities and odds ratios from the multivariate regressions are reported in Table 2.
Distribution of Quality Ratings
The distribution of hospital quality rating is shown in the Figure. About 8% of the hospitals received a one-star rating, whereas 9.95% of the hospitals had a five-star rating. Most of the hospitals received two, three, and four stars with frequencies of 21.63%, 30.80%, and 29.63%, respectively. The distribution of quality ratings with respect to socioeconomic and geographic factors are presented in Table 1. Most hospitals in our sample were located in counties where the minority population percentage was above the national median (8.21%). The hospitals in counties with highest minority presence had a lower overall rating (2.86). There is a clear gradient between the median household income and hospital overall rating. About 43% of hospitals were in counties in which the median household income was in the 4th quartile, whereas only 31% of hospitals are in counties with a median household income below the national median. Hospitals in counties with high income also have higher overall rating (3.24). In terms of urban/rural hospitals, there are more urban hospitals (70%) but with a lower overall rating of 3.04, compared with rural hospitals (30%, 3.31). We also found that the counties with higher education attainment and lower dual-eligible population tend to have higher hospital ratings. Geographically, hospitals in the Midwest and West have higher average overall quality ratings than do those in the Northeast and South.
Minority Population Percentage and Hospital Rating
As shown in Table 2, results from the logistic regression show that, compared with those in counties with low minority population percentage, hospitals in counties with high minority population percentage have higher marginal probabilities to have one-star ratings, and the result is statistically significant at the 1% level. At the same time, hospitals in counties with intermediate minority percentage have lower marginal probabilities of having a five-star rating. On the other hand, the odds ratio from the multinomial logistic regressions show that minority population percentage is negatively correlated with hospital rating, statistically significant at the 1% level.
Median Household Income and Hospital Rating
We found a statistically significant relationship between household income and hospital quality rating. Hospitals in lower income groups are more likely to have one-star ratings. The odds ratio analysis provides consistent evidence that higher household income is correlated with star ratings.
Education Attainment, Dual Eligibility, and Hospital Rating
In addition, we found a consistent and statistically significant relationship between education attainment and hospital ratings. Compared with counties with high education attainment (reference group), hospitals in counties with intermediate education attainment are more likely to have one-star ratings. Similarly, hospitals in counties with less and intermediate education attainment are less likely to be five-star rated. Consistently, odds ratios of hospitals in intermediate and lower education attainment counties with better quality are significantly lower, at the 1% level.
In terms of dual eligibility, hospitals in counties with higher percentage of dual-eligible residents are statistically significantly less likely to receive five-star ratings. Consistent evidence was found in odds ratios. However, dual eligibility is not statistically significantly correlated with the probabilities of receiving one-star ratings.
Rurality, Geographic Region, and Hospital Rating
Compared with urban hospitals, rural hospitals are less likely to receive five-star ratings. However, there is no difference in the probabilities of receiving one-star ratings and no statistically significant difference in overall ratings. Geographically, hospitals in the Northeast are more likely to have one-star ratings and less likely to be five-star rated. The odds ratio also suggests that Northeastern hospitals on average have lower quality rating compared with Midwestern hospitals. Hospitals in South and West are also less likely to have five-star ratings.
DISCUSSION
Consistent with findings in nursing homes,10 hospitals that serve lower income communities have comparatively lower quality ratings than did those that serve more affluent communities. Several factors may contribute to these outcomes. Higher volumes of uninsured patients and patients with public insurance impact how much revenue the hospital collects for services, hindering the capacity to reinvest in processes to advance quality. Moreover, these hospitals are likely to serve patients with higher acuity and complex psychosocial barriers that affect their experience, perceptions, and outcomes. Structural conditions of economically distressed communities also play a role. Limited access to a robust network of community-based resources for healthy living post surgery may contribute to higher rates of readmission, which may compromise overall quality ratings.
Furthermore, after adjustment for community characteristics, hospitals that serve higher volumes of racial minorities have higher probability of receiving one-star ratings and lower average quality rating. While more research is needed to examine specific measures in the quality rating formula that may disproportionately affect racial and ethnic minorities, Hospital Consumer Assessment of Healthcare Providers and Systems (HCAHPS) surveys may offer some insight. Some researchers have found that White respondents and those with higher levels of education are more likely to cite favorable HCAHPS responses than are minorities or persons with lower levels of education.11 This has negative implications on the HCAPHS scores of hospitals that serve higher volumes of minority patients with low education attainment. Real or perceived discrimination, unconscious bias, miscommunication, and language discordance may explain the disparity between the survey results of White respondents and minorities.12-16
While interpreting the results of this study, it is important to note that the research design examines the relationship between quality ratings, race, and community characteristics. Our analysis does not specifically examine clinical quality of care. It should not be assumed that hospitals with low ratings provide substandard clinical care.
While the intent of Hospital Quality Ratings is well received, there are varying perspectives on the calculation methodology—particularly the need for social risk adjustment.17-19 There is also concern about community perception which affects consumer choice, decision making, and referral patterns. Hospitals with lower ratings are likely to have negative repercussions that perpetuate inequities. For example, in light of new and emerging pay-for-performance models, the publicity of star ratings has the potential to influence behaviors that exacerbate disparities.20 Physicians and medical groups may explicitly or implicitly avoid patients with characteristics that may lower their quality scores. Patients with resources to fully cover their healthcare expenses may choose hospitals with higher quality ratings, leaving hospitals with lower quality ratings to serve the under- or uninsured. Over time, these patterns may jeopardize quality, safety, and the fiscal viability of hospitals that serve communities with lower socioeconomic status.
Among the geographic regions analyzed, quality ratings were higher in the Midwest. This finding aligns with a report from the Agency for Healthcare Research and Quality, which recognized five states from the Midwest for having the highest quality ratings (Iowa, Minnesota, Nebraska, North Dakota, and Wisconsin).21 Hospitals in the South and Northeast generally had lower quality ratings. As discovered by other investigators, nonteaching, smaller, rural hospitals had more favorable outcomes when compared with teaching, larger, urban hospitals, which are more likely to care for more complex, critically ill patients.22 These regional differences, coupled with hospital types, have implications for federal appropriations and funding priorities earmarked for quality initiatives.
CONCLUSION
As national efforts continue to promote health equity and enhance the value of healthcare, it is important to recognize the association between race, socioeconomic factors, and hospital star quality ratings. Allocated resources should ensure that hospitals serving racial minorities, low-income communities, and those in urban settings have the capacity to deliver comprehensive care based on the unique needs of the community. Hospitals that serve low-income communities may benefit from payment models and incentives that adjust for these differences—which could allow them to invest in quality improvement processes and social support services.
Disclosures
The authors declared no potential conflicts of interest with respect to the research, authorship, and/or publication of this article.
Funding
The authors did not receive external funding for this study.
1. Statistica. U.S. Hospitals - Statistics & Facts. www.statista.com. Accessed May 22, 2019. https://www.statista.com/topics/1074/hospitals/
2. Centers for Medicare & Medicaid Services. Hospital Compare overall hospital rating. Accessed May 22, 2019. https://www.medicare.gov/hospitalcompare/Data/Hospital-overall-ratings-calculation.html
3. DeLancey JO, Softcheck J, Chung JW, Barnard C, Dahlke AR, Bilimoria KY. Associations between hospital characteristics, measure reporting, and the Centers for Medicare & Medicaid Services Overall Hospital Quality Star Ratings. JAMA. 2017;317(19):2015-2017. https://doi.org/10.1001/jama.2017.3148
4. Osborne NH, Upchurch GR, Mathur AK, Dimick JB. Explaining racial disparities in mortality after abdominal aortic aneurysm repair. J Vasc Surg. 2009;50(4):709-713. https://doi.org/10.1016/j.jvs.2009.05.020
5. Trivedi AN, Sequist TD, Ayanian JZ. Impact of hospital volume on racial disparities in cardiovascular procedure mortality. J Am Coll Cardiol. 2006;47(2):417-424. https://doi.org/10.1016/j.jacc.2005.08.068
6. Hu J, Nerenz D. Relationship between stress rankings and the overall hospital star ratings: an analysis of 150 cities in the United States. JAMA Intern Med. 2017;177(1):136-137. https://doi.org/10.1001/jamainternmed.2016.7068
7. Herrin J, Andre JS, Kenward K, Joshi MS, Audet AM, Hines SC. Community factors and hospital readmission rates. Health Serv Res. 2015;50(1):20-39. https://doi.org/10.1111/1475-6773.12177
8. Brewster AL, Lee S, Curry LA, Bradley EH. Association between community social capital and hospital readmission rates. Popul Health Manag. 2018;22(1):40-47. https://doi.org/10.1089/pop.2018.0030
9. Navathe AS, Zhong F, Lei VJ, et al. Hospital readmission and social risk factors identified from physician notes. Health Serv Res. 2018;53(2):1110-1136. https://doi.org/10.1111/1475-6773.12670
10. Yuan Y, Louis C, Cabral H, Schneider JC, Ryan CM, Kazis LE. Socioeconomic and geographic disparities in accessing nursing homes with high star ratings. J Am Med Dir Assoc. 2018;19(10):852-859.e2. https://doi.org/10.1016/j.jamda.2018.05.017
11. Goldstein E, Elliott MN, Lehrman WG, Hambarsoomian K, Giordano LA. Racial/ethnic differences in patients’ perceptions of inpatient care using the HCAHPS survey. Med Care Res Rev. 2010;67(1):74-92. https://doi.org/10.1177/1077558709341066
12. Jacobs EA, Rathouz PJ, Karavolos K, et al. Perceived discrimination is associated with reduced breast and cervical cancer screening: the study of women’s health across the nation (SWAN). J Womens Health (Larchmt). 2014;23(2):138-145. https://doi.org/10.1089/jwh.2013.4328
13. Reskin B. The race discrimination system. Annu Rev Sociol. 2012;38(1):17-35. https://doi.org/10.1146/annurev-soc-071811-145508
14. Chapman EN, Kaatz A, Carnes M. Physicians and implicit bias: how doctors may unwittingly perpetuate health care disparities. J Gen Intern Med. 2013;28(11):1504-1510. https://doi.org/10.1007/s11606-013-2441-1
15. DeVoe JE, Wallace LS, Fryer Jr GE. Measuring patients’ perceptions of communication with healthcare providers: do differences in demographic and socioeconomic characteristics matter? Health Expect. 2009;12(1):70-80. https://doi.org/10.1111/j.1369-7625.2008.00516.x
16. Austin JM, Jha AK, Romano PS, et al. National hospital ratings systems share few common scores and may generate confusion instead of clarity. Health Aff (Millwood). 2015;34(3):423-430. http://doi.org/10.1377/hlthaff.2014.0201
17. Halasyamani LK, Davis MM. Conflicting measures of hospital quality: Ratings from “Hospital Compare” versus “Best Hospitals.” J Hosp Med. 2007;2(3):128-134. https://doi.org/10.1002/jhm.176
18. Lavenberg JG, Leas B, Umscheid CA, Williams K, Goldmann DR, Kripalani S. Assessing preventability in the quest to reduce hospital readmissions. J Hosp Med . 2014;9(9):598-603. https://doi.org/10.1002/jhm.2226
19. Bilimoria KY, Barnard C. The new CMS hospital quality star ratings: the stars are not aligned. JAMA. 2016;316(17):1761-1762. https://doi.org/10.1001/jama.2016.13679
20. Casalino LP, Elster A, Eisenberg A, Lewis E, Montgomery J, Ramos D. Will pay-for-performance and quality reporting affect health care disparities? Health Aff (Millwood). 2007;26(3):w405-w414. https://doi.org/10.1377/hlthaff.26.3.w405
21. Agency for Healthcare Research & Quality. Overview of Quality and Access in the U.S. Health Care System. Published July 3, 2017. Accessed May 23, 2019. https://www.ahrq.gov/research/findings/nhqrdr/nhqdr16/overview.html
22. Wang DE, Tsugawa Y, Figueroa JF, Jha AK. Association between the Centers for Medicare and Medicaid Services hospital star rating and patient outcomes. JAMA Intern Med. 2016;176(6):848-850. https://doi.org/10.1001/jamainternmed.2016.0784
© 2020 Society of Hospital Medicine
Clinical Utility of Methicillin-Resistant Staphylococcus aureus Polymerase Chain Reaction Nasal Swab Testing in Lower Respiratory Tract Infections
From the Hospital of Central Connecticut, New Britain, CT (Dr. Caulfield and Dr. Shepard); Hartford Hospital, Hartford, CT (Dr. Linder and Dr. Dempsey); and the Hartford HealthCare Research Program, Hartford, CT (Dr. O’Sullivan).
Abstract
- Objective: To assess the utility of methicillin-resistant Staphylococcus aureus (MRSA) polymerase chain reaction (PCR) nasal swab testing in patients with lower respiratory tract infections (LRTI).
- Design and setting: Multicenter, retrospective, electronic chart review conducted within the Hartford HealthCare system.
- Participants: Patients who were treated for LRTIs at the Hospital of Central Connecticut or Hartford Hospital between July 1, 2018, and June 30, 2019.
- Measurements: The primary outcome was anti-MRSA days of therapy (DOT) in patients who underwent MRSA PCR testing versus those who did not. In a subgroup analysis, we compared anti-MRSA DOT among patients with appropriate versus inappropriate utilization of the MRSA PCR test.
- Results: Of the 319 patients treated for LRTIs, 155 (48.6%) had a MRSA PCR ordered, and appropriate utilization occurred in 94 (60.6%) of these patients. Anti-MRSA DOT in the MRSA PCR group (n = 155) was shorter than in the group that did not undergo MRSA PCR testing (n = 164), but this difference did not reach statistical significance (1.68 days [interquartile range {IQR}, 0.80-2.74] vs 1.86 days [IQR, 0.56-3.33], P = 0.458). In the subgroup analysis, anti-MRSA DOT was significantly shorter in the MRSA PCR group with appropriate utilization compared to the inappropriate utilization group (1.16 [IQR, 0.44-1.88] vs 2.68 [IQR, 1.75-3.76], P < 0.001)
- Conclusion: Appropriate utilization of MRSA PCR nasal swab testing can reduce DOT in patients with LRTI. Further education is necessary to expand the appropriate use of the MRSA PCR test across our health system.
Keywords: MRSA; LRTI; pneumonia; antimicrobial stewardship; antibiotic resistance.
More than 300,000 patients were hospitalized with methicillin-resistant Staphylococcus aureus (MRSA) infections in the United States in 2017, and at least 10,000 of these cases resulted in mortality.1 While MRSA infections overall are decreasing, it is crucial to continue to employ antimicrobial stewardship tactics to keep these infections at bay. Recently, strains of S. aureus have become resistant to vancomycin, making this bacterium even more difficult to treat.2
A novel tactic in antimicrobial stewardship involves the use of MRSA polymerase chain reaction (PCR) nasal swab testing to rule out the presence of MRSA in patients with lower respiratory tract infections (LRTI). If used appropriately, this approach may decrease the number of days patients are treated with anti-MRSA antimicrobials. Waiting for cultures to speciate can take up to 72 hours,3 meaning that patients may be exposed to 3 days of unnecessary broad-spectrum antibiotics. Results of MRSA PCR assay of nasal swab specimens can be available in 1 to 2 hours,4 allowing for more rapid de-escalation of therapy. Numerous studies have shown that this test has a negative predictive value (NPV) greater than 95%, indicating that a negative nasal swab result may be useful to guide de-escalation of antibiotic therapy.5-8 The purpose of this study was to assess the utility of MRSA PCR nasal swab testing in patients with LRTI throughout the Hartford HealthCare system.
Methods
Design
This study was a multicenter, retrospective, electronic chart review. It was approved by the Hartford HealthCare Institutional Review Board (HHC-2019-0169).
Selection of Participants
Patients were identified through electronic medical record reports based on ICD-10 codes. Records were categorized into 2 groups: patients who received a MRSA PCR nasal swab testing and patients who did not. Patients who received the MRSA PCR were further categorized by appropriate or inappropriate utilization. Appropriate utilization of the MRSA PCR was defined as MRSA PCR ordered within 48 hours of a new vancomycin or linezolid order, and anti-MRSA therapy discontinued within 24 hours of a negative result. Inappropriate utilization of the MRSA PCR was defined as MRSA PCR ordered more than 48 hours after a new vancomycin or linezolid order, or continuation of anti-MRSA therapy despite a negative MRSA PCR and no other evidence of a MRSA infection.
Patients were included if they met all of the following criteria: age 18 years or older, with no upper age limit; treated for a LRTI, identified by ICD-10 codes (J13-22, J44, J85); treated with empiric antibiotics active against MRSA, specifically vancomycin or linezolid; and treated at the Hospital of Central Connecticut (HOCC) or Hartford Hospital (HH) between July 1, 2018, and June 30, 2019, inclusive. Patients were excluded if they met 1 or more of the following criteria: age less than 18 years old; admitted for 48 hours or fewer or discharged from the emergency department; not treated at either facility; treated before July 1, 2018, or after June 30, 2019; treated for ventilator-associated pneumonia; received anti-MRSA therapy within 30 days prior to admission; or treated for a concurrent bacterial infection requiring anti-MRSA therapy.
Outcome Measures
The primary outcome was anti-MRSA days of therapy (DOT) in patients who underwent MRSA PCR testing compared to patients who did not undergo MRSA PCR testing. A subgroup analysis was completed to compare anti-MRSA DOT within patients in the MRSA PCR group. Patients in the subgroup were categorized by appropriate or inappropriate utilization, and anti-MRSA DOT were compared between these groups. Secondary outcomes that were evaluated included length of stay (LOS), 30-day readmission rate, and incidence of acute kidney injury (AKI). Thirty-day readmission was defined as admission to HOCC, HH, or any institution within Hartford HealthCare within 30 days of discharge. AKI was defined as an increase in serum creatinine by ≥ 0.3 mg/dL in 48 hours, increase ≥ 1.5 times baseline, or a urine volume < 0.5 mL/kg/hr for 6 hours.
Statistical Analyses
The study was powered for the primary outcome, anti-MRSA DOT, with a clinically meaningful difference of 1 day. Group sample sizes of 240 in the MRSA PCR group and 160 in the no MRSA PCR group would have afforded 92% power to detect that difference, if the null hypothesis was that both group means were 4 days and the alternative hypothesis was that the mean of the MRSA PCR group was 3 days, with estimated group standard deviations of 80% of each mean. This estimate used an alpha level of 0.05 with a 2-sided t-test. Among those who received a MRSA PCR test, a clinically meaningful difference between appropriate and inappropriate utilization was 5%.
Descriptive statistics were provided for all variables as a function of the individual hospital and for the combined data set. Continuous data were summarized with means and standard deviations (SD), or with median and interquartile ranges (IQR), depending on distribution. Categorical variables were reported as frequencies, using percentages. All data were evaluated for normality of distribution. Inferential statistics comprised a Student’s t-test to compare normally distributed, continuous data between groups. Nonparametric distributions were compared using a Mann-Whitney U test. Categorical comparisons were made using a Fisher’s exact test for 2×2 tables and a Pearson chi-square test for comparisons involving more than 2 groups.
Since anti-MRSA DOT (primary outcome) and LOS (secondary outcome) are often non-normally distributed, they have been transformed (eg, log or square root, again depending on distribution). Whichever native variable or transformation variable was appropriate was used as the outcome measure in a linear regression model to account for the influence of factors (covariates) that show significant univariate differences. Given the relatively small sample size, a maximum of 10 variables were included in the model. All factors were iterated in a forward regression model (most influential first) until no significant changes were observed.
All calculations were performed with SPSS v. 21 (IBM; Armonk, NY) using an a priori alpha level of 0.05, such that all results yielding P < 0.05 were deemed statistically significant.
Results
Of the 561 patient records reviewed, 319 patients were included and 242 patients were excluded. Reasons for exclusion included 65 patients admitted for a duration of 48 hours or less or discharged from the emergency department; 61 patients having another infection requiring anti-MRSA therapy; 60 patients not having a diagnosis of a LRTI or not receiving anti-MRSA therapy; 52 patients having received anti-MRSA therapy within 30 days prior to admission; and 4 patients treated outside of the specified date range.
Of the 319 patients included, 155 (48.6%) were in the MRSA PCR group and 164 (51.4%) were in the group that did not undergo MRSA PCR (Table 1). Of the 155 patients with a MRSA PCR ordered, the test was utilized appropriately in 94 (60.6%) patients and inappropriately in 61 (39.4%) patients (Table 2). In the MRSA PCR group, 135 patients had a negative result on PCR assay, with 133 of those patients having negative respiratory cultures, resulting in a NPV of 98.5%. Differences in baseline characteristics between the MRSA PCR and no MRSA PCR groups were observed. The patients in the MRSA PCR group appeared to be significantly more ill than those in the no MRSA PCR group, as indicated by statistically significant differences in intensive care unit (ICU) admissions (P = 0.001), positive chest radiographs (P = 0.034), sepsis at time of anti-MRSA initiation (P = 0.013), pulmonary consults placed (P = 0.003), and carbapenem usage (P = 0.047).

In the subgroup analysis comparing appropriate and inappropriate utilization within the MRSA PCR group, the inappropriate utilization group had significantly higher numbers of infectious diseases consults placed, patients with hospital-acquired pneumonia, and patients with community-acquired pneumonia with risk factors.

Outcomes
Median anti-MRSA DOT in the MRSA PCR group was shorter than DOT in the no MRSA PCR group, but this difference did not reach statistical significance (1.68 [IQR, 0.80-2.74] vs 1.86 days [IQR, 0.56-3.33], P = 0.458; Table 3). LOS in the MRSA PCR group was longer than in the no MRSA PCR group (6.0 [IQR, 4.0-10.0] vs 5.0 [IQR, 3.0-7.0] days, P = 0.001). There was no difference in 30-day readmissions that were related to the previous visit or incidence of AKI between groups.

In the subgroup analysis, anti-MRSA DOT in the MRSA PCR group with appropriate utilization was shorter than DOT in the MRSA PCR group with inappropriate utilization (1.16 [IQR, 0.44-1.88] vs 2.68 [IQR, 1.75-3.76] days, P < 0.001; Table 4). LOS in the MRSA PCR group with appropriate utilization was shorter than LOS in the inappropriate utilization group (5.0 [IQR, 4.0-7.0] vs 7.0 [IQR, 5.0-12.0] days, P < 0.001). Thirty-day readmissions that were related to the previous visit were significantly higher in patients in the MRSA PCR group with appropriate utilization (13 vs 2, P = 0.030). There was no difference in incidence of AKI between the groups.

A multivariate analysis was completed to determine whether the sicker MRSA PCR population was confounding outcomes, particularly the secondary outcome of LOS, which was noted to be longer in the MRSA PCR group (Table 5). When comparing LOS in the MRSA PCR and the no MRSA PCR patients, the multivariate analysis showed that admission to the ICU and carbapenem use were associated with a longer LOS (P < 0.001 and P = 0.009, respectively). The incidence of admission to the ICU and carbapenem use were higher in the MRSA PCR group (P = 0.001 and P = 0.047). Therefore, longer LOS in the MRSA PCR patients could be a result of the higher prevalence of ICU admissions and infections requiring carbapenem therapy rather than the result of the MRSA PCR itself.

Discussion
A MRSA PCR nasal swab protocol can be used to minimize a patient’s exposure to unnecessary broad-spectrum antibiotics, thereby preventing antimicrobial resistance. Thus, it is important to assess how our health system is utilizing this antimicrobial stewardship tactic. With the MRSA PCR’s high NPV, providers can be confident that MRSA pneumonia is unlikely in the absence of MRSA colonization. Our study established a NPV of 98.5%, which is similar to other studies, all of which have shown NPVs greater than 95%.5-8 Despite the high NPV, this study demonstrated that only 51.4% of patients with LRTI had orders for a MRSA PCR. Of the 155 patients with a MRSA PCR, the test was utilized appropriately only 60.6% of the time. A majority of the inappropriately utilized tests were due to MRSA PCR orders placed more than 48 hours after anti-MRSA therapy initiation. To our knowledge, no other studies have assessed the clinical utility of MRSA PCR nasal swabs as an antimicrobial stewardship tool in a diverse health system; therefore, these results are useful to guide future practices at our institution. There is a clear need for provider and pharmacist education to increase the use of MRSA PCR nasal swab testing for patients with LRTI being treated with anti-MRSA therapy. Additionally, clinician education regarding the initial timing of the MRSA PCR order and the proper utilization of the results of the MRSA PCR likely will benefit patient outcomes at our institution.
When evaluating anti-MRSA DOT, this study demonstrated a reduction of only 0.18 days (about 4 hours) of anti-MRSA therapy in the patients who received MRSA PCR testing compared to the patients without a MRSA PCR ordered. Our anti-MRSA DOT reduction was lower than what has been reported in similar studies. For example, Baby et al found that the use of the MRSA PCR was associated with 46.6 fewer hours of unnecessary antimicrobial treatment. Willis et al evaluated a pharmacist-driven protocol that resulted in a reduction of 1.8 days of anti-MRSA therapy, despite a protocol compliance rate of only 55%.9,10 In our study, the patients in the MRSA PCR group appeared to be significantly more ill than those in the no MRSA PCR group, which may be the reason for the incongruences in our results compared to the current literature. Characteristics such as ICU admissions, positive chest radiographs, sepsis cases, pulmonary consults, and carbapenem usage—all of which are indicative of a sicker population—were more prevalent in the MRSA PCR group. This sicker population could have underestimated the reduction of DOT in the MRSA PCR group compared to the no MRSA PCR group.
After isolating the MRSA PCR patients in the subgroup analysis, anti-MRSA DOT was 1.5 days shorter when the test was appropriately utilized, which is more comparable to what has been reported in the literature.9,10 Only 60.6% of the MRSA PCR patients had their anti-MRSA therapy appropriately managed based on the MRSA PCR. Interestingly, a majority of patients in the inappropriate utilization group had MRSA PCR tests ordered more than 48 hours after beginning anti-MRSA therapy. More prompt and efficient ordering of the MRSA PCR may have resulted in more opportunities for earlier de-escalation of therapy. Due to these factors, the patients in the inappropriate utilization group could have further contributed to the underestimated difference in anti-MRSA DOT between the MRSA PCR and no MRSA PCR patients in the primary outcome. Additionally, there were no notable differences between the appropriate and inappropriate utilization groups, unlike in the MRSA PCR and no MRSA PCR groups, which is why we were able to draw more robust conclusions in the subgroup analysis. Therefore, the subgroup analysis confirmed that if the results of the MRSA PCR are used appropriately to guide anti-MRSA therapy, patients can potentially avoid 36 hours of broad-spectrum antibiotics.
Data on how the utilization of the MRSA PCR nasal swab can affect LOS are limited; however, one study did report a 2.8-day reduction in LOS after implementation of a pharmacist-driven MRSA PCR nasal swab protocol.11 Our study demonstrated that LOS was significantly longer in the MRSA PCR group than in the no MRSA PCR group. This result was likely affected by the aforementioned sicker MRSA PCR population. Our multivariate analysis further confirmed that ICU admissions were associated with a longer LOS, and, given that the MRSA PCR group had a significantly higher ICU population, this likely confounded these results. If our 2 groups had had more evenly distributed characteristics, it is possible that we could have found a shorter LOS in the MRSA PCR group, similar to what is reported in the literature. In the subgroup analysis, LOS was 2 days shorter in the appropriate utilization group compared to the inappropriate utilization group. This further affirms that the results of the MRSA PCR must be used appropriately in order for patient outcomes, like LOS, to benefit.
The effects of the MRSA PCR nasal swab on 30-day readmission rates and incidence of AKI are not well-documented in the literature. One study did report 30-day readmission rates as an outcome, but did not cite any difference after the implementation of a protocol that utilized MRSA PCR nasal swab testing.12 The outcome of AKI is slightly better represented in the literature, but the results are conflicting. Some studies report no difference after the implementation of a MRSA PCR-based protocol,11 and others report a significant decrease in AKI with the use of the MRSA PCR.9 Our study detected no difference in 30-day readmission rates related to the previous admission or in AKI between the MRSA PCR and no MRSA PCR populations. In the subgroup analysis, 30-day readmission rates were significantly higher in the MRSA PCR group with appropriate utilization than in the group with inappropriate utilization; however, our study was not powered to detect a difference in this secondary outcome.
This study had some limitations that may have affected our results. First, this study was a retrospective chart review. Additionally, the baseline characteristics were not well balanced across the different groups. There were sicker patients in the MRSA PCR group, which may have led to an underestimate of the reduction in DOT and LOS in these patients. Finally, we did not include enough patient records to reach power in the MRSA PCR group due to a higher than expected number of patients meeting exclusion criteria. Had we attained sufficient power, there may have been more profound reductions in DOT and LOS.
Conclusion
MRSA infections are a common cause for hospitalization, and there is a growing need for antimicrobial stewardship efforts to limit unnecessary antibiotic usage in order to prevent resistance. As illustrated in our study, appropriate utilization of the MRSA PCR can reduce DOT up to 1.5 days. However, our results suggest that there is room for provider and pharmacist education to increase the use of MRSA PCR nasal swab testing in patients with LRTI receiving anti-MRSA therapy. Further emphasis on the appropriate utilization of the MRSA PCR within our health care system is essential.
Corresponding author: Casey Dempsey, PharmD, BCIDP, 80 Seymour St., Hartford, CT 06106; casey.dempsey@hhchealth.org.
Financial disclosures: None.
1. Antimicrobial resistance threats. Centers for Disease Control and Prevention web site. www.cdc.gov/drugresistance/biggest-threats.html. Accessed September 9, 2020.
2. Biggest threats and data. Centers for Disease Control and Prevention web site. www.cdc.gov/drugresistance/biggest_threats.html#mrsa. Accessed September 9, 2020.
3. Smith MN, Erdman MJ, Ferreira JA, et al. Clinical utility of methicillin-resistant Staphylococcus aureus nasal polymerase chain reaction assay in critically ill patients with nosocomial pneumonia. J Crit Care. 2017;38:168-171.
4. Giancola SE, Nguyen AT, Le B, et al. Clinical utility of a nasal swab methicillin-resistant Staphylococcus aureus polymerase chain reaction test in intensive and intermediate care unit patients with pneumonia. Diagn Microbiol Infect Dis. 2016;86:307-310.
5. Dangerfield B, Chung A, Webb B, Seville MT. Predictive value of methicillin-resistant Staphylococcus aureus (MRSA) nasal swab PCR assay for MRSA pneumonia. Antimicrob Agents Chemother. 2014;58:859-864.
6. Johnson JA, Wright ME, Sheperd LA, et al. Nasal methicillin-resistant Staphylococcus aureus polymerase chain reaction: a potential use in guiding antibiotic therapy for pneumonia. Perm J. 2015;19: 34-36.
7. Dureau AF, Duclos G, Antonini F, et al. Rapid diagnostic test and use of antibiotic against methicillin-resistant Staphylococcus aureus in adult intensive care unit. Eur J Clin Microbiol Infect Dis. 2017;36:267-272.
8. Tilahun B, Faust AC, McCorstin P, Ortegon A. Nasal colonization and lower respiratory tract infections with methicillin-resistant Staphylococcus aureus. Am J Crit Care. 2015;24:8-12.
9. Baby N, Faust AC, Smith T, et al. Nasal methicillin-resistant Staphylococcus aureus (MRSA) PCR testing reduces the duration of MRSA-targeted therapy in patients with suspected MRSA pneumonia. Antimicrob Agents Chemother. 2017;61:e02432-16.
10. Willis C, Allen B, Tucker C, et al. Impact of a pharmacist-driven methicillin-resistant Staphylococcus aureus surveillance protocol. Am J Health-Syst Pharm. 2017;74:1765-1773.
11. Dadzie P, Dietrich T, Ashurst J. Impact of a pharmacist-driven methicillin-resistant Staphylococcus aureus polymerase chain reaction nasal swab protocol on the de-escalation of empiric vancomycin in patients with pneumonia in a rural healthcare setting. Cureus. 2019;11:e6378
12. Dunaway S, Orwig KW, Arbogast ZQ, et al. Evaluation of a pharmacy-driven methicillin-resistant Staphylococcus aureus surveillance protocol in pneumonia. Int J Clin Pharm. 2018;40;526-532.
From the Hospital of Central Connecticut, New Britain, CT (Dr. Caulfield and Dr. Shepard); Hartford Hospital, Hartford, CT (Dr. Linder and Dr. Dempsey); and the Hartford HealthCare Research Program, Hartford, CT (Dr. O’Sullivan).
Abstract
- Objective: To assess the utility of methicillin-resistant Staphylococcus aureus (MRSA) polymerase chain reaction (PCR) nasal swab testing in patients with lower respiratory tract infections (LRTI).
- Design and setting: Multicenter, retrospective, electronic chart review conducted within the Hartford HealthCare system.
- Participants: Patients who were treated for LRTIs at the Hospital of Central Connecticut or Hartford Hospital between July 1, 2018, and June 30, 2019.
- Measurements: The primary outcome was anti-MRSA days of therapy (DOT) in patients who underwent MRSA PCR testing versus those who did not. In a subgroup analysis, we compared anti-MRSA DOT among patients with appropriate versus inappropriate utilization of the MRSA PCR test.
- Results: Of the 319 patients treated for LRTIs, 155 (48.6%) had a MRSA PCR ordered, and appropriate utilization occurred in 94 (60.6%) of these patients. Anti-MRSA DOT in the MRSA PCR group (n = 155) was shorter than in the group that did not undergo MRSA PCR testing (n = 164), but this difference did not reach statistical significance (1.68 days [interquartile range {IQR}, 0.80-2.74] vs 1.86 days [IQR, 0.56-3.33], P = 0.458). In the subgroup analysis, anti-MRSA DOT was significantly shorter in the MRSA PCR group with appropriate utilization compared to the inappropriate utilization group (1.16 [IQR, 0.44-1.88] vs 2.68 [IQR, 1.75-3.76], P < 0.001)
- Conclusion: Appropriate utilization of MRSA PCR nasal swab testing can reduce DOT in patients with LRTI. Further education is necessary to expand the appropriate use of the MRSA PCR test across our health system.
Keywords: MRSA; LRTI; pneumonia; antimicrobial stewardship; antibiotic resistance.
More than 300,000 patients were hospitalized with methicillin-resistant Staphylococcus aureus (MRSA) infections in the United States in 2017, and at least 10,000 of these cases resulted in mortality.1 While MRSA infections overall are decreasing, it is crucial to continue to employ antimicrobial stewardship tactics to keep these infections at bay. Recently, strains of S. aureus have become resistant to vancomycin, making this bacterium even more difficult to treat.2
A novel tactic in antimicrobial stewardship involves the use of MRSA polymerase chain reaction (PCR) nasal swab testing to rule out the presence of MRSA in patients with lower respiratory tract infections (LRTI). If used appropriately, this approach may decrease the number of days patients are treated with anti-MRSA antimicrobials. Waiting for cultures to speciate can take up to 72 hours,3 meaning that patients may be exposed to 3 days of unnecessary broad-spectrum antibiotics. Results of MRSA PCR assay of nasal swab specimens can be available in 1 to 2 hours,4 allowing for more rapid de-escalation of therapy. Numerous studies have shown that this test has a negative predictive value (NPV) greater than 95%, indicating that a negative nasal swab result may be useful to guide de-escalation of antibiotic therapy.5-8 The purpose of this study was to assess the utility of MRSA PCR nasal swab testing in patients with LRTI throughout the Hartford HealthCare system.
Methods
Design
This study was a multicenter, retrospective, electronic chart review. It was approved by the Hartford HealthCare Institutional Review Board (HHC-2019-0169).
Selection of Participants
Patients were identified through electronic medical record reports based on ICD-10 codes. Records were categorized into 2 groups: patients who received a MRSA PCR nasal swab testing and patients who did not. Patients who received the MRSA PCR were further categorized by appropriate or inappropriate utilization. Appropriate utilization of the MRSA PCR was defined as MRSA PCR ordered within 48 hours of a new vancomycin or linezolid order, and anti-MRSA therapy discontinued within 24 hours of a negative result. Inappropriate utilization of the MRSA PCR was defined as MRSA PCR ordered more than 48 hours after a new vancomycin or linezolid order, or continuation of anti-MRSA therapy despite a negative MRSA PCR and no other evidence of a MRSA infection.
Patients were included if they met all of the following criteria: age 18 years or older, with no upper age limit; treated for a LRTI, identified by ICD-10 codes (J13-22, J44, J85); treated with empiric antibiotics active against MRSA, specifically vancomycin or linezolid; and treated at the Hospital of Central Connecticut (HOCC) or Hartford Hospital (HH) between July 1, 2018, and June 30, 2019, inclusive. Patients were excluded if they met 1 or more of the following criteria: age less than 18 years old; admitted for 48 hours or fewer or discharged from the emergency department; not treated at either facility; treated before July 1, 2018, or after June 30, 2019; treated for ventilator-associated pneumonia; received anti-MRSA therapy within 30 days prior to admission; or treated for a concurrent bacterial infection requiring anti-MRSA therapy.
Outcome Measures
The primary outcome was anti-MRSA days of therapy (DOT) in patients who underwent MRSA PCR testing compared to patients who did not undergo MRSA PCR testing. A subgroup analysis was completed to compare anti-MRSA DOT within patients in the MRSA PCR group. Patients in the subgroup were categorized by appropriate or inappropriate utilization, and anti-MRSA DOT were compared between these groups. Secondary outcomes that were evaluated included length of stay (LOS), 30-day readmission rate, and incidence of acute kidney injury (AKI). Thirty-day readmission was defined as admission to HOCC, HH, or any institution within Hartford HealthCare within 30 days of discharge. AKI was defined as an increase in serum creatinine by ≥ 0.3 mg/dL in 48 hours, increase ≥ 1.5 times baseline, or a urine volume < 0.5 mL/kg/hr for 6 hours.
Statistical Analyses
The study was powered for the primary outcome, anti-MRSA DOT, with a clinically meaningful difference of 1 day. Group sample sizes of 240 in the MRSA PCR group and 160 in the no MRSA PCR group would have afforded 92% power to detect that difference, if the null hypothesis was that both group means were 4 days and the alternative hypothesis was that the mean of the MRSA PCR group was 3 days, with estimated group standard deviations of 80% of each mean. This estimate used an alpha level of 0.05 with a 2-sided t-test. Among those who received a MRSA PCR test, a clinically meaningful difference between appropriate and inappropriate utilization was 5%.
Descriptive statistics were provided for all variables as a function of the individual hospital and for the combined data set. Continuous data were summarized with means and standard deviations (SD), or with median and interquartile ranges (IQR), depending on distribution. Categorical variables were reported as frequencies, using percentages. All data were evaluated for normality of distribution. Inferential statistics comprised a Student’s t-test to compare normally distributed, continuous data between groups. Nonparametric distributions were compared using a Mann-Whitney U test. Categorical comparisons were made using a Fisher’s exact test for 2×2 tables and a Pearson chi-square test for comparisons involving more than 2 groups.
Since anti-MRSA DOT (primary outcome) and LOS (secondary outcome) are often non-normally distributed, they have been transformed (eg, log or square root, again depending on distribution). Whichever native variable or transformation variable was appropriate was used as the outcome measure in a linear regression model to account for the influence of factors (covariates) that show significant univariate differences. Given the relatively small sample size, a maximum of 10 variables were included in the model. All factors were iterated in a forward regression model (most influential first) until no significant changes were observed.
All calculations were performed with SPSS v. 21 (IBM; Armonk, NY) using an a priori alpha level of 0.05, such that all results yielding P < 0.05 were deemed statistically significant.
Results
Of the 561 patient records reviewed, 319 patients were included and 242 patients were excluded. Reasons for exclusion included 65 patients admitted for a duration of 48 hours or less or discharged from the emergency department; 61 patients having another infection requiring anti-MRSA therapy; 60 patients not having a diagnosis of a LRTI or not receiving anti-MRSA therapy; 52 patients having received anti-MRSA therapy within 30 days prior to admission; and 4 patients treated outside of the specified date range.
Of the 319 patients included, 155 (48.6%) were in the MRSA PCR group and 164 (51.4%) were in the group that did not undergo MRSA PCR (Table 1). Of the 155 patients with a MRSA PCR ordered, the test was utilized appropriately in 94 (60.6%) patients and inappropriately in 61 (39.4%) patients (Table 2). In the MRSA PCR group, 135 patients had a negative result on PCR assay, with 133 of those patients having negative respiratory cultures, resulting in a NPV of 98.5%. Differences in baseline characteristics between the MRSA PCR and no MRSA PCR groups were observed. The patients in the MRSA PCR group appeared to be significantly more ill than those in the no MRSA PCR group, as indicated by statistically significant differences in intensive care unit (ICU) admissions (P = 0.001), positive chest radiographs (P = 0.034), sepsis at time of anti-MRSA initiation (P = 0.013), pulmonary consults placed (P = 0.003), and carbapenem usage (P = 0.047).
In the subgroup analysis comparing appropriate and inappropriate utilization within the MRSA PCR group, the inappropriate utilization group had significantly higher numbers of infectious diseases consults placed, patients with hospital-acquired pneumonia, and patients with community-acquired pneumonia with risk factors.
Outcomes
Median anti-MRSA DOT in the MRSA PCR group was shorter than DOT in the no MRSA PCR group, but this difference did not reach statistical significance (1.68 [IQR, 0.80-2.74] vs 1.86 days [IQR, 0.56-3.33], P = 0.458; Table 3). LOS in the MRSA PCR group was longer than in the no MRSA PCR group (6.0 [IQR, 4.0-10.0] vs 5.0 [IQR, 3.0-7.0] days, P = 0.001). There was no difference in 30-day readmissions that were related to the previous visit or incidence of AKI between groups.
In the subgroup analysis, anti-MRSA DOT in the MRSA PCR group with appropriate utilization was shorter than DOT in the MRSA PCR group with inappropriate utilization (1.16 [IQR, 0.44-1.88] vs 2.68 [IQR, 1.75-3.76] days, P < 0.001; Table 4). LOS in the MRSA PCR group with appropriate utilization was shorter than LOS in the inappropriate utilization group (5.0 [IQR, 4.0-7.0] vs 7.0 [IQR, 5.0-12.0] days, P < 0.001). Thirty-day readmissions that were related to the previous visit were significantly higher in patients in the MRSA PCR group with appropriate utilization (13 vs 2, P = 0.030). There was no difference in incidence of AKI between the groups.
A multivariate analysis was completed to determine whether the sicker MRSA PCR population was confounding outcomes, particularly the secondary outcome of LOS, which was noted to be longer in the MRSA PCR group (Table 5). When comparing LOS in the MRSA PCR and the no MRSA PCR patients, the multivariate analysis showed that admission to the ICU and carbapenem use were associated with a longer LOS (P < 0.001 and P = 0.009, respectively). The incidence of admission to the ICU and carbapenem use were higher in the MRSA PCR group (P = 0.001 and P = 0.047). Therefore, longer LOS in the MRSA PCR patients could be a result of the higher prevalence of ICU admissions and infections requiring carbapenem therapy rather than the result of the MRSA PCR itself.
Discussion
A MRSA PCR nasal swab protocol can be used to minimize a patient’s exposure to unnecessary broad-spectrum antibiotics, thereby preventing antimicrobial resistance. Thus, it is important to assess how our health system is utilizing this antimicrobial stewardship tactic. With the MRSA PCR’s high NPV, providers can be confident that MRSA pneumonia is unlikely in the absence of MRSA colonization. Our study established a NPV of 98.5%, which is similar to other studies, all of which have shown NPVs greater than 95%.5-8 Despite the high NPV, this study demonstrated that only 51.4% of patients with LRTI had orders for a MRSA PCR. Of the 155 patients with a MRSA PCR, the test was utilized appropriately only 60.6% of the time. A majority of the inappropriately utilized tests were due to MRSA PCR orders placed more than 48 hours after anti-MRSA therapy initiation. To our knowledge, no other studies have assessed the clinical utility of MRSA PCR nasal swabs as an antimicrobial stewardship tool in a diverse health system; therefore, these results are useful to guide future practices at our institution. There is a clear need for provider and pharmacist education to increase the use of MRSA PCR nasal swab testing for patients with LRTI being treated with anti-MRSA therapy. Additionally, clinician education regarding the initial timing of the MRSA PCR order and the proper utilization of the results of the MRSA PCR likely will benefit patient outcomes at our institution.
When evaluating anti-MRSA DOT, this study demonstrated a reduction of only 0.18 days (about 4 hours) of anti-MRSA therapy in the patients who received MRSA PCR testing compared to the patients without a MRSA PCR ordered. Our anti-MRSA DOT reduction was lower than what has been reported in similar studies. For example, Baby et al found that the use of the MRSA PCR was associated with 46.6 fewer hours of unnecessary antimicrobial treatment. Willis et al evaluated a pharmacist-driven protocol that resulted in a reduction of 1.8 days of anti-MRSA therapy, despite a protocol compliance rate of only 55%.9,10 In our study, the patients in the MRSA PCR group appeared to be significantly more ill than those in the no MRSA PCR group, which may be the reason for the incongruences in our results compared to the current literature. Characteristics such as ICU admissions, positive chest radiographs, sepsis cases, pulmonary consults, and carbapenem usage—all of which are indicative of a sicker population—were more prevalent in the MRSA PCR group. This sicker population could have underestimated the reduction of DOT in the MRSA PCR group compared to the no MRSA PCR group.
After isolating the MRSA PCR patients in the subgroup analysis, anti-MRSA DOT was 1.5 days shorter when the test was appropriately utilized, which is more comparable to what has been reported in the literature.9,10 Only 60.6% of the MRSA PCR patients had their anti-MRSA therapy appropriately managed based on the MRSA PCR. Interestingly, a majority of patients in the inappropriate utilization group had MRSA PCR tests ordered more than 48 hours after beginning anti-MRSA therapy. More prompt and efficient ordering of the MRSA PCR may have resulted in more opportunities for earlier de-escalation of therapy. Due to these factors, the patients in the inappropriate utilization group could have further contributed to the underestimated difference in anti-MRSA DOT between the MRSA PCR and no MRSA PCR patients in the primary outcome. Additionally, there were no notable differences between the appropriate and inappropriate utilization groups, unlike in the MRSA PCR and no MRSA PCR groups, which is why we were able to draw more robust conclusions in the subgroup analysis. Therefore, the subgroup analysis confirmed that if the results of the MRSA PCR are used appropriately to guide anti-MRSA therapy, patients can potentially avoid 36 hours of broad-spectrum antibiotics.
Data on how the utilization of the MRSA PCR nasal swab can affect LOS are limited; however, one study did report a 2.8-day reduction in LOS after implementation of a pharmacist-driven MRSA PCR nasal swab protocol.11 Our study demonstrated that LOS was significantly longer in the MRSA PCR group than in the no MRSA PCR group. This result was likely affected by the aforementioned sicker MRSA PCR population. Our multivariate analysis further confirmed that ICU admissions were associated with a longer LOS, and, given that the MRSA PCR group had a significantly higher ICU population, this likely confounded these results. If our 2 groups had had more evenly distributed characteristics, it is possible that we could have found a shorter LOS in the MRSA PCR group, similar to what is reported in the literature. In the subgroup analysis, LOS was 2 days shorter in the appropriate utilization group compared to the inappropriate utilization group. This further affirms that the results of the MRSA PCR must be used appropriately in order for patient outcomes, like LOS, to benefit.
The effects of the MRSA PCR nasal swab on 30-day readmission rates and incidence of AKI are not well-documented in the literature. One study did report 30-day readmission rates as an outcome, but did not cite any difference after the implementation of a protocol that utilized MRSA PCR nasal swab testing.12 The outcome of AKI is slightly better represented in the literature, but the results are conflicting. Some studies report no difference after the implementation of a MRSA PCR-based protocol,11 and others report a significant decrease in AKI with the use of the MRSA PCR.9 Our study detected no difference in 30-day readmission rates related to the previous admission or in AKI between the MRSA PCR and no MRSA PCR populations. In the subgroup analysis, 30-day readmission rates were significantly higher in the MRSA PCR group with appropriate utilization than in the group with inappropriate utilization; however, our study was not powered to detect a difference in this secondary outcome.
This study had some limitations that may have affected our results. First, this study was a retrospective chart review. Additionally, the baseline characteristics were not well balanced across the different groups. There were sicker patients in the MRSA PCR group, which may have led to an underestimate of the reduction in DOT and LOS in these patients. Finally, we did not include enough patient records to reach power in the MRSA PCR group due to a higher than expected number of patients meeting exclusion criteria. Had we attained sufficient power, there may have been more profound reductions in DOT and LOS.
Conclusion
MRSA infections are a common cause for hospitalization, and there is a growing need for antimicrobial stewardship efforts to limit unnecessary antibiotic usage in order to prevent resistance. As illustrated in our study, appropriate utilization of the MRSA PCR can reduce DOT up to 1.5 days. However, our results suggest that there is room for provider and pharmacist education to increase the use of MRSA PCR nasal swab testing in patients with LRTI receiving anti-MRSA therapy. Further emphasis on the appropriate utilization of the MRSA PCR within our health care system is essential.
Corresponding author: Casey Dempsey, PharmD, BCIDP, 80 Seymour St., Hartford, CT 06106; casey.dempsey@hhchealth.org.
Financial disclosures: None.
1. Antimicrobial resistance threats. Centers for Disease Control and Prevention web site. www.cdc.gov/drugresistance/biggest-threats.html. Accessed September 9, 2020.
2. Biggest threats and data. Centers for Disease Control and Prevention web site. www.cdc.gov/drugresistance/biggest_threats.html#mrsa. Accessed September 9, 2020.
3. Smith MN, Erdman MJ, Ferreira JA, et al. Clinical utility of methicillin-resistant Staphylococcus aureus nasal polymerase chain reaction assay in critically ill patients with nosocomial pneumonia. J Crit Care. 2017;38:168-171.
4. Giancola SE, Nguyen AT, Le B, et al. Clinical utility of a nasal swab methicillin-resistant Staphylococcus aureus polymerase chain reaction test in intensive and intermediate care unit patients with pneumonia. Diagn Microbiol Infect Dis. 2016;86:307-310.
5. Dangerfield B, Chung A, Webb B, Seville MT. Predictive value of methicillin-resistant Staphylococcus aureus (MRSA) nasal swab PCR assay for MRSA pneumonia. Antimicrob Agents Chemother. 2014;58:859-864.
6. Johnson JA, Wright ME, Sheperd LA, et al. Nasal methicillin-resistant Staphylococcus aureus polymerase chain reaction: a potential use in guiding antibiotic therapy for pneumonia. Perm J. 2015;19: 34-36.
7. Dureau AF, Duclos G, Antonini F, et al. Rapid diagnostic test and use of antibiotic against methicillin-resistant Staphylococcus aureus in adult intensive care unit. Eur J Clin Microbiol Infect Dis. 2017;36:267-272.
8. Tilahun B, Faust AC, McCorstin P, Ortegon A. Nasal colonization and lower respiratory tract infections with methicillin-resistant Staphylococcus aureus. Am J Crit Care. 2015;24:8-12.
9. Baby N, Faust AC, Smith T, et al. Nasal methicillin-resistant Staphylococcus aureus (MRSA) PCR testing reduces the duration of MRSA-targeted therapy in patients with suspected MRSA pneumonia. Antimicrob Agents Chemother. 2017;61:e02432-16.
10. Willis C, Allen B, Tucker C, et al. Impact of a pharmacist-driven methicillin-resistant Staphylococcus aureus surveillance protocol. Am J Health-Syst Pharm. 2017;74:1765-1773.
11. Dadzie P, Dietrich T, Ashurst J. Impact of a pharmacist-driven methicillin-resistant Staphylococcus aureus polymerase chain reaction nasal swab protocol on the de-escalation of empiric vancomycin in patients with pneumonia in a rural healthcare setting. Cureus. 2019;11:e6378
12. Dunaway S, Orwig KW, Arbogast ZQ, et al. Evaluation of a pharmacy-driven methicillin-resistant Staphylococcus aureus surveillance protocol in pneumonia. Int J Clin Pharm. 2018;40;526-532.
Content Analysis of Psoriasis and Eczema Direct-to-Consumer Advertisements
Direct-to-consumer (DTC) advertisements are an important and influential source of health-related information for Americans. In 1997, the US Food and Drug Administration (FDA) relaxed regulations and permitted DTC drug advertisements to be televised. Now, via television alone, the average American is exposed to more than 30 hours annually of DTC advertisements for drugs,1 which exceeds, by far, the amount of time the average American spends with his/her physician.2 The United States spends $9.6 billion on DTC advertisements per year, of which $605 million is spent exclusively on DTC advertisements for dermatologic conditions—one of the highest amounts of spending for DTC advertisements, second only to diabetes.3
The increase in advertising for dermatologic conditions is reflective of the rapid growth in the number of treatment options available for chronic skin diseases, especially psoriasis. Since 2004, 11 biologics and 1 oral medication were FDA approved for the treatment of moderate to severe psoriasis. Despite the expansion of treatment options for psoriasis, knowledge and understanding of psoriasis and its treatments generally are poor,4,5 and undertreatment of psoriasis continues to be common.6 Data also suggest existing age and racial disparities in psoriasis treatment in the United States, whereby patients who are older or Black are less likely to receive biologic therapies.7-9 Although the exact causes of these disparities remain unclear, one study found that Black patients with psoriasis were less familiar with biologics compared to White patients,10 which suggests that the racial disparity in biologic treatment of psoriasis could be due to less exposure to and thus recognition of biologics as treatments of psoriasis among Black patients.
Some data suggest that DTC advertisements may affect drug uptake by encouraging patients to request advertised medications from their medical providers.11,12 As such, DTC advertisements are a potentially important source of exposure and information for patients. However, is it possible that DTC advertisements also may contribute to widening knowledge gaps among certain populations, and thus treatment disparities, by neglecting certain groups and targeting others with their content? In an effort to answer this question, we performed an analysis of DTC advertisements for psoriasis and eczema with special attention to advertisement placement, character representation, and disease-related content. We specifically targeted advertisements for psoriasis and eczema, as advertisements for the former are rampant and advertisements for the latter are on the rise because of emerging therapies. We hypothesized that age and racial/ethnic diversity among advertisement characters is poor, and disease-related content is lacking.
Materials and Methods
Study Design and Sample
We performed a cross-sectional analysis of televised DTC advertisements for psoriasis and eczema over 14 consecutive days (July 1, 2018, to July 14, 2018). We accessed Nielsen’s top 10 lists, specifically Prime Broadcast Network TV-United States and Prime Broadcast Programs Among African-American, from June 2018 and identified the networks with the greatest potential exposure to American consumers: ABC, CBS, FOX, and NBC.13,14 Each day, programming aired from 5
The FDA identifies DTC advertisement types as product-claim, reminder, and help-seeking advertisements. Product-claim advertisements are required to include the following information for the drug of interest: name; at least 1 FDA-approved indication; the most notable risks; and reference to a toll-free telephone number, website, or print advertisement by which a detailed summary of risks and benefits can be accessed. Reminder advertisements include the name of the drug but no information about the drug’s use.15 Help-seeking advertisements describe a disease or condition without referencing a specific drug treatment. Product-claim, reminder, and help-seeking advertisements for psoriasis or eczema that aired during the recorded time frame were included for analysis; advertisements that aired during sporting events and special programming were excluded.
DTC Advertisement Coding
Advertisement placement (ie, network, day of the week, time, associated television program), type, and target disease were documented for all advertisements included in the study. The content of each unique advertisement for psoriasis and eczema also was documented electronically in REDCap (Research Electronic Data Capture) as follows: characteristics of affected individuals and disease-related content. Advertisement coding was performed independently by 2 graduate students (A.H. and C.W.). First, one-third of the advertisements were randomly selected to be coded by both students. Intercoder agreement between the 2 students was 95.3%. Coding disagreements were primarily due to misunderstanding of definitions and were resolved through consensus. Subsequently, the remaining advertisements were randomly distributed between the 2 students, and each advertisement was coded by 1 student.
Statistical Analysis
All data were summarized descriptively with counts and frequencies using Stata 15 (StataCorp).
Results
We identified 297 DTC advertisements addressing 25 different conditions during our study period. CBS, ABC, NBC, and FOX aired 44.4%, 26.3%, 24.4%, and 5.1% of advertisements, respectively. Overall, DTC advertisements were least likely to air on Saturdays and between the hours of 5
Psoriasis DTC Advertisements
There were 5 unique psoriasis DTC advertisements, all of which were product-claim advertisements, with 1 each for secukinumab (Cosentyx [Novartis]), ixekizumab (Taltz [Eli Lilly and Company]), and guselkumab (Tremfya [Janssen Biotech, Inc]), and 2 for adalimumab (Humira [AbbVie Inc]). The advertisements aired on ABC (n=5 [38.5%]), CBS (n=5 [38.5%]), and NBC (n=3 [23.1%]). Most advertisements aired on weekdays (61.5%) between 6
Psoriasis Character Portrayal and Disease-Related Content
We identified 81 main characters who were depicted as having psoriasis among all advertisements. Characteristics of the affected characters are summarized in the Table. All affected characters were perceived to be younger adults, and there was a slight female predominance (58.0% [47/81]). Most characters were perceived to be White (92.6% [75/81]). Black and Asian characters only represented 6.2% (5/81) and 1.2% (1/81) of all affected individuals, respectively. Notably, the advertisements that featured only White main characters were aired 2.75 times more frequently than the advertisements that included non-White characters.
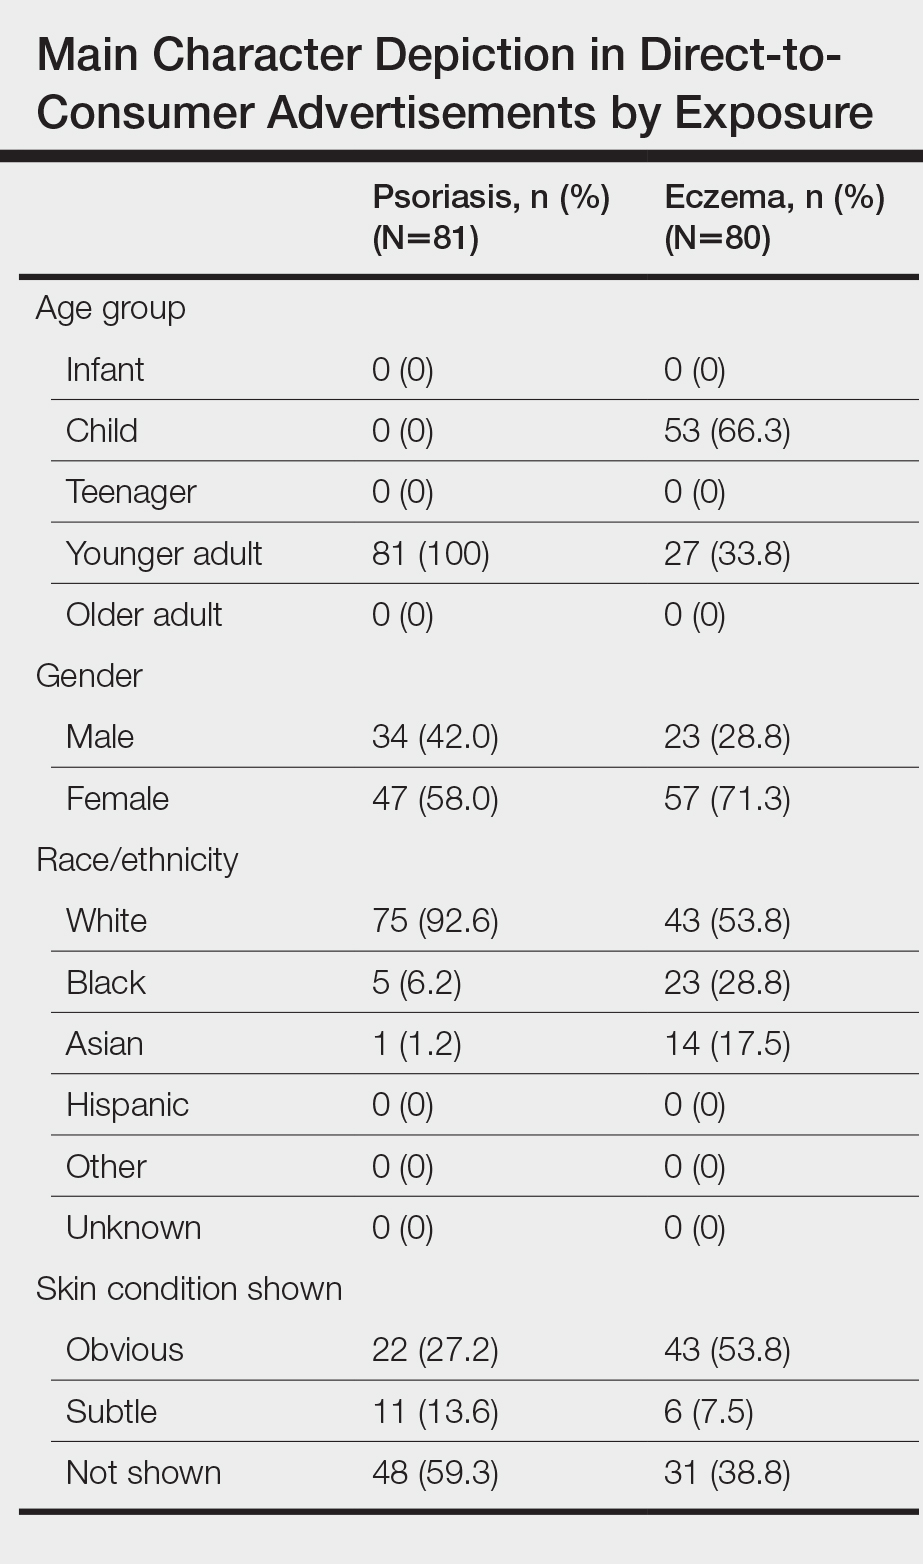
Psoriasis was shown on the skin of at least 1 character in an obvious depiction (ie, did not require more than 1 viewing) in 84.6% (11/13) of the advertisements. Symptoms of psoriasis (communicated either verbally or visually) were included in only 15.4% (2/13) of advertisements. No advertisements included information on the epidemiology of (ie, prevalence, subpopulations at risk), risk factors for, pathophysiology of, or comorbid diseases associated with psoriasis.
Eczema DTC Advertisements
Among the 27 eczema advertisements aired, there were 4 unique advertisements, of which 3 were product-claim advertisements (all for crisaborole [Eucrisa (Pfizer Inc)]), and 1 was a help-seeking advertisement that was sponsored by Sanofi Genzyme and Regeneron Pharmaceuticals. The advertisements aired on ABC (n=2 [7.4%]), CBS (n=17 [63.0%]), and NBC (n=8 [29.6%]). All advertisements aired on weekdays between 7
Eczema Character Portrayal and Disease-Related Content
We identified 80 main characters who were depicted to be affected by eczema among all advertisements. Characteristics of the affected characters are summarized in the Table. Most of the affected characters were perceived to be White (53.8% [43/80]) and female (71.3% [57/80]). Other races depicted included Black (28.8% [23/80]) and Asian (17.5% [14/80]). Each unique eczema advertisement included at least 1 non-White main character. Most eczema main characters were perceived to be children (66.3% [53/80]), followed by younger adults (33.8% [27/80]). No infants, teenagers, or older adults were shown as being affected by eczema.
Skin manifestations of eczema were portrayed on at least 1 character in all of the advertisements; 77.8% (21/27) of the advertisements had at least 1 obvious depiction. Symptoms of eczema and the mechanism of disease (pathophysiology) were each included in 44.4% (12/27) of advertisements. This information was included exclusively in the single help-seeking advertisement, which also referenced a website for additional disease-related information. No advertisements included information on the epidemiology of, risk factors for, or comorbid diseases associated with eczema.
Comment
In our study of televised DTC advertisements for psoriasis and eczema in the United States, we identified underrepresentation of racial/ethnic minorities and specific age groups (older adults for psoriasis and all adults for eczema) across all advertisements. Although psoriasis is suggested to be less prevalent among minority patients (1.3%–1.9% among Black patients and 1.6% among Hispanic patients) compared to White patients (2%–4%),16,17 minority vs White representation in psoriasis DTC advertisements was disproportionately lower than population-based prevalence estimates. Direct-to-consumer advertisements for eczema included more minority characters than psoriasis advertisements; however, minority representation remained inadequate considering that childhood eczema is more prevalent among Black vs White children,18 and adult eczema is at least as prevalent among minority patients compared to White patients.19 Not only was minority representation in all advertisements poor, but advertisement placement also was suboptimal, particularly for reaching Black viewers. FOX network was home to 2 of the top 3 primetime broadcast programs among Black viewers around the study period,13 yet no DTC advertisements were aired on FOX.
The current literature regarding minority representation in DTC advertisements is mixed. Some studies report underrepresentation of Black and other minority patients across a variety of diseases.20 Other studies suggest that representation of Black patients, in particular, generally is adequate, except among select serious health conditions, and that advertisements depict tokenism or stereotypical roles for minorities.21 Our study provides new and specific insight about the state of racial/ethnic and age diversity, or lack thereof, in DTC advertisements for the skin conditions that currently are most commonly targeted—psoriasis and eczema. Although it remains unclear whether DTC advertisements are good or bad, existing data suggest that potential benefits of DTC advertisements include strengthening of patient-provider relationships, reduction of underdiagnosis and undertreatment of disease, and reduction of disease stigma.22 However, in our analyses, we found disease-specific factual content among all DTC advertisements to be sparse and obvious depictions of skin disease and symptoms to be uncommon, especially for psoriasis. As such, it seems unlikely that existing DTC advertisements for psoriasis and eczema can be expected to contribute to meaningful disease education, reduce underdiagnosis, and reduce the stigmatizing attitudes that have been documented for both skin diseases.23-25
Furthermore, it is important to consider our findings in light of the role that social identity theory plays in marketing. Social identity theory supports the idea that a person’s social identity (eg, age, gender, race/ethnicity) influences his/her behavior, perceptions, and performance.26 The principle of homophily—the tendency for individuals to have positive ties to those who are similar to themselves—is a critical concept in social identity theory and suggests that consumers are more likely to pay attention to and be influenced by sources perceived as similar to themselves.20 Thus, even if the potential benefits of DTC advertisements were to be realized for psoriasis and eczema, the lack of adequate minority and older adult representation raises concerns about whether these benefits would reach a diverse population and if the advertisements might further potentiate existing knowledge and treatment disparities.
Limitations
Our study is not without limitations. The sampling period was short and might not reflect advertisement content over a longer time course. We did not evaluate other potential sources of information, such as the Internet and social media. Nevertheless, televised DTC advertisements remain a major source of medical and drug information for the general public. We did not directly evaluate viewers’ reactions to the DTC advertisements of interest; however, other literature lends support to the significance of social identity theory and its impact on consumer behavior.26
Conclusion
Our study highlights a lost opportunity among psoriasis and eczema DTC advertisements for patient reach and disease education that may encourage existing and emerging knowledge and treatment disparities for both conditions. Our findings should serve as a call to action to pharmaceutical companies and other organizations involved in creating and supporting DTC advertisements for psoriasis and eczema to increase the educational content, diversify the depicted characters, and optimize advertisement placement.
- Brownfield ED, Bernhardt JM, Phan JL, et al. Direct-to-consumer drug advertisements on network television: an exploration of quantity, frequency, and placement. J Health Commun. 2004;9:491-497.
- Tai-Seale M, McGuire TG, Zhang W. Time allocation in primary care office visits. Health Serv Res. 2007;42:1871-1894.
- Schwartz LM, Woloshin S. Medical marketing in the United States, 1997-2016. JAMA. 2019;321:80-96.
- Lanigan SW, Farber EM. Patients’ knowledge of psoriasis: pilot study. Cutis. 1990;46:359-362.
- Renzi C, Di Pietro C, Tabolli S. Participation, satisfaction and knowledge level of patients with cutaneous psoriasis or psoriatic arthritis. Clin Exp Dermatol. 2011;36:885-888.
- Lebwohl MG, Bachelez H, Barker J, et al. Patient perspectives in the management of psoriasis: results from the population-based Multinational Assessment of Psoriasis and Psoriatic Arthritis Survey. J Am Acad Dermatol. 2014;70:871-881.e871-830.
- Wu JJ, Lu M, Veverka KA, et al. The journey for US psoriasis patients prescribed a topical: a retrospective database evaluation of patient progression to oral and/or biologic treatment. J Dermatolog Treat. 2019;30:446-453.
- Takeshita J, Gelfand JM, Li P, et al. Psoriasis in the US Medicare population: prevalence, treatment, and factors associated with biologic use. J Invest Dermatol. 2015;135:2955-2963.
- Kerr GS, Qaiyumi S, Richards J, et al. Psoriasis and psoriatic arthritis in African-American patients—the need to measure disease burden. Clin Rheumatol. 2015;34:1753-1759.
- Takeshita J, Eriksen WT, Raziano VT, et al. Racial differences in perceptions of psoriasis therapies: implications for racial disparities in psoriasis treatment. J Invest Dermatol. 2019;139:1672-1679.e1.
- Wu MH, Bartz D, Avorn J, et al. Trends in direct-to-consumer advertising of prescription contraceptives. Contraception. 2016;93:398-405.
- Mintzes B, Barer ML, Kravitz RL, et al. How does direct-to-consumer advertising (DTCA) affect prescribing? a survey in primary care environments with and without legal DTCA. CMAJ. 2003;169:405-412.
- Topten. Nielson website. https://www.nielsen.com/us/en/top-ten/. Accessed July 22, 2020.
- Leading ad supported broadcast and cable networks in the United States in 2019, by average number of viewers. Statistia website. https://www.statista.com/statistics/530119/tv-networks-viewers-usa/. Accessed July 22, 2020.
- Prescription drug advertisements. Electronic Code of Federal Regulations website. https://www.ecfr.gov/cgi-bin/text-idx?SID=d4f308e364578bda8e55a831638a26c6&mc=true&node=pt21.4.202&rgn=div5. Updated August 12, 2020. Accessed August 12, 2020.
- Gelfand JM, Stern RS, Nijsten T, et al. The prevalence of psoriasis in African Americans: results from a population-based study. J Am Acad Dermatol. 2005;52:23-26.
- Rachakonda TD, Schupp CW, Armstrong AW. Psoriasis prevalence among adults in the United States. J Am Acad Dermatol. 2014;70:512-516.
- Centers for Disease Control and Prevention. National Center for Health Statistics, National Health Interview Survey, 2014. https://www.cdc.gov/nchs/data/health_policy/eczema_skin_problems_tables.pdf. Accessed July 22, 2020.
- Chiesa Fuxench ZC, Block JK, Boguniewicz M, et al. Atopic dermatitis in America study: a cross-sectional study examining the prevalence and disease burden of atopic dermatitis in the US adult population. J Invest Dermatol. 2019;139:583-590.
- Welch Cline RJ, Young HN. Marketing drugs, marketing health care relationships: a content analysis of visual cues in direct-to-consumer prescription drug advertising. Health Commun. 2004;16:131-157.
- Ball JG, Liang A, Lee WN. Representation of African Americans in direct-to-consumer pharmaceutical commercials: a content analysis with implications for health disparities. Health Mark Q. 2009;26:372-390.
- Ventola CL. Direct-to-consumer pharmaceutical advertising: therapeutic or toxic? P T. 2011;36:669-674, 681-684.
- Pearl RL, Wan MT, Takeshita J, et al. Stigmatizing attitudes toward persons with psoriasis among laypersons and medical students. J Am Acad Dermatol. 2019;80:1556-1563.
- Chernyshov PV. Stigmatization and self-perception in children with atopic dermatitis. Clin Cosmet Investig Dermatol. 2016;9:159-166.
- Wittkowski A, Richards HL, Griffiths CEM, et al. The impact of psychological and clinical factors on quality of life in individuals with atopic dermatitis. J Psychosom Res. 2004;57:195-200.
- Forehand MR, Deshpande R, Reed 2nd A. Identity salience and the influence of differential activation of the social self-schema on advertising response. J Appl Psychol. 2002;87:1086-1099.
Direct-to-consumer (DTC) advertisements are an important and influential source of health-related information for Americans. In 1997, the US Food and Drug Administration (FDA) relaxed regulations and permitted DTC drug advertisements to be televised. Now, via television alone, the average American is exposed to more than 30 hours annually of DTC advertisements for drugs,1 which exceeds, by far, the amount of time the average American spends with his/her physician.2 The United States spends $9.6 billion on DTC advertisements per year, of which $605 million is spent exclusively on DTC advertisements for dermatologic conditions—one of the highest amounts of spending for DTC advertisements, second only to diabetes.3
The increase in advertising for dermatologic conditions is reflective of the rapid growth in the number of treatment options available for chronic skin diseases, especially psoriasis. Since 2004, 11 biologics and 1 oral medication were FDA approved for the treatment of moderate to severe psoriasis. Despite the expansion of treatment options for psoriasis, knowledge and understanding of psoriasis and its treatments generally are poor,4,5 and undertreatment of psoriasis continues to be common.6 Data also suggest existing age and racial disparities in psoriasis treatment in the United States, whereby patients who are older or Black are less likely to receive biologic therapies.7-9 Although the exact causes of these disparities remain unclear, one study found that Black patients with psoriasis were less familiar with biologics compared to White patients,10 which suggests that the racial disparity in biologic treatment of psoriasis could be due to less exposure to and thus recognition of biologics as treatments of psoriasis among Black patients.
Some data suggest that DTC advertisements may affect drug uptake by encouraging patients to request advertised medications from their medical providers.11,12 As such, DTC advertisements are a potentially important source of exposure and information for patients. However, is it possible that DTC advertisements also may contribute to widening knowledge gaps among certain populations, and thus treatment disparities, by neglecting certain groups and targeting others with their content? In an effort to answer this question, we performed an analysis of DTC advertisements for psoriasis and eczema with special attention to advertisement placement, character representation, and disease-related content. We specifically targeted advertisements for psoriasis and eczema, as advertisements for the former are rampant and advertisements for the latter are on the rise because of emerging therapies. We hypothesized that age and racial/ethnic diversity among advertisement characters is poor, and disease-related content is lacking.
Materials and Methods
Study Design and Sample
We performed a cross-sectional analysis of televised DTC advertisements for psoriasis and eczema over 14 consecutive days (July 1, 2018, to July 14, 2018). We accessed Nielsen’s top 10 lists, specifically Prime Broadcast Network TV-United States and Prime Broadcast Programs Among African-American, from June 2018 and identified the networks with the greatest potential exposure to American consumers: ABC, CBS, FOX, and NBC.13,14 Each day, programming aired from 5
The FDA identifies DTC advertisement types as product-claim, reminder, and help-seeking advertisements. Product-claim advertisements are required to include the following information for the drug of interest: name; at least 1 FDA-approved indication; the most notable risks; and reference to a toll-free telephone number, website, or print advertisement by which a detailed summary of risks and benefits can be accessed. Reminder advertisements include the name of the drug but no information about the drug’s use.15 Help-seeking advertisements describe a disease or condition without referencing a specific drug treatment. Product-claim, reminder, and help-seeking advertisements for psoriasis or eczema that aired during the recorded time frame were included for analysis; advertisements that aired during sporting events and special programming were excluded.
DTC Advertisement Coding
Advertisement placement (ie, network, day of the week, time, associated television program), type, and target disease were documented for all advertisements included in the study. The content of each unique advertisement for psoriasis and eczema also was documented electronically in REDCap (Research Electronic Data Capture) as follows: characteristics of affected individuals and disease-related content. Advertisement coding was performed independently by 2 graduate students (A.H. and C.W.). First, one-third of the advertisements were randomly selected to be coded by both students. Intercoder agreement between the 2 students was 95.3%. Coding disagreements were primarily due to misunderstanding of definitions and were resolved through consensus. Subsequently, the remaining advertisements were randomly distributed between the 2 students, and each advertisement was coded by 1 student.
Statistical Analysis
All data were summarized descriptively with counts and frequencies using Stata 15 (StataCorp).
Results
We identified 297 DTC advertisements addressing 25 different conditions during our study period. CBS, ABC, NBC, and FOX aired 44.4%, 26.3%, 24.4%, and 5.1% of advertisements, respectively. Overall, DTC advertisements were least likely to air on Saturdays and between the hours of 5
Psoriasis DTC Advertisements
There were 5 unique psoriasis DTC advertisements, all of which were product-claim advertisements, with 1 each for secukinumab (Cosentyx [Novartis]), ixekizumab (Taltz [Eli Lilly and Company]), and guselkumab (Tremfya [Janssen Biotech, Inc]), and 2 for adalimumab (Humira [AbbVie Inc]). The advertisements aired on ABC (n=5 [38.5%]), CBS (n=5 [38.5%]), and NBC (n=3 [23.1%]). Most advertisements aired on weekdays (61.5%) between 6
Psoriasis Character Portrayal and Disease-Related Content
We identified 81 main characters who were depicted as having psoriasis among all advertisements. Characteristics of the affected characters are summarized in the Table. All affected characters were perceived to be younger adults, and there was a slight female predominance (58.0% [47/81]). Most characters were perceived to be White (92.6% [75/81]). Black and Asian characters only represented 6.2% (5/81) and 1.2% (1/81) of all affected individuals, respectively. Notably, the advertisements that featured only White main characters were aired 2.75 times more frequently than the advertisements that included non-White characters.
Psoriasis was shown on the skin of at least 1 character in an obvious depiction (ie, did not require more than 1 viewing) in 84.6% (11/13) of the advertisements. Symptoms of psoriasis (communicated either verbally or visually) were included in only 15.4% (2/13) of advertisements. No advertisements included information on the epidemiology of (ie, prevalence, subpopulations at risk), risk factors for, pathophysiology of, or comorbid diseases associated with psoriasis.
Eczema DTC Advertisements
Among the 27 eczema advertisements aired, there were 4 unique advertisements, of which 3 were product-claim advertisements (all for crisaborole [Eucrisa (Pfizer Inc)]), and 1 was a help-seeking advertisement that was sponsored by Sanofi Genzyme and Regeneron Pharmaceuticals. The advertisements aired on ABC (n=2 [7.4%]), CBS (n=17 [63.0%]), and NBC (n=8 [29.6%]). All advertisements aired on weekdays between 7
Eczema Character Portrayal and Disease-Related Content
We identified 80 main characters who were depicted to be affected by eczema among all advertisements. Characteristics of the affected characters are summarized in the Table. Most of the affected characters were perceived to be White (53.8% [43/80]) and female (71.3% [57/80]). Other races depicted included Black (28.8% [23/80]) and Asian (17.5% [14/80]). Each unique eczema advertisement included at least 1 non-White main character. Most eczema main characters were perceived to be children (66.3% [53/80]), followed by younger adults (33.8% [27/80]). No infants, teenagers, or older adults were shown as being affected by eczema.
Skin manifestations of eczema were portrayed on at least 1 character in all of the advertisements; 77.8% (21/27) of the advertisements had at least 1 obvious depiction. Symptoms of eczema and the mechanism of disease (pathophysiology) were each included in 44.4% (12/27) of advertisements. This information was included exclusively in the single help-seeking advertisement, which also referenced a website for additional disease-related information. No advertisements included information on the epidemiology of, risk factors for, or comorbid diseases associated with eczema.
Comment
In our study of televised DTC advertisements for psoriasis and eczema in the United States, we identified underrepresentation of racial/ethnic minorities and specific age groups (older adults for psoriasis and all adults for eczema) across all advertisements. Although psoriasis is suggested to be less prevalent among minority patients (1.3%–1.9% among Black patients and 1.6% among Hispanic patients) compared to White patients (2%–4%),16,17 minority vs White representation in psoriasis DTC advertisements was disproportionately lower than population-based prevalence estimates. Direct-to-consumer advertisements for eczema included more minority characters than psoriasis advertisements; however, minority representation remained inadequate considering that childhood eczema is more prevalent among Black vs White children,18 and adult eczema is at least as prevalent among minority patients compared to White patients.19 Not only was minority representation in all advertisements poor, but advertisement placement also was suboptimal, particularly for reaching Black viewers. FOX network was home to 2 of the top 3 primetime broadcast programs among Black viewers around the study period,13 yet no DTC advertisements were aired on FOX.
The current literature regarding minority representation in DTC advertisements is mixed. Some studies report underrepresentation of Black and other minority patients across a variety of diseases.20 Other studies suggest that representation of Black patients, in particular, generally is adequate, except among select serious health conditions, and that advertisements depict tokenism or stereotypical roles for minorities.21 Our study provides new and specific insight about the state of racial/ethnic and age diversity, or lack thereof, in DTC advertisements for the skin conditions that currently are most commonly targeted—psoriasis and eczema. Although it remains unclear whether DTC advertisements are good or bad, existing data suggest that potential benefits of DTC advertisements include strengthening of patient-provider relationships, reduction of underdiagnosis and undertreatment of disease, and reduction of disease stigma.22 However, in our analyses, we found disease-specific factual content among all DTC advertisements to be sparse and obvious depictions of skin disease and symptoms to be uncommon, especially for psoriasis. As such, it seems unlikely that existing DTC advertisements for psoriasis and eczema can be expected to contribute to meaningful disease education, reduce underdiagnosis, and reduce the stigmatizing attitudes that have been documented for both skin diseases.23-25
Furthermore, it is important to consider our findings in light of the role that social identity theory plays in marketing. Social identity theory supports the idea that a person’s social identity (eg, age, gender, race/ethnicity) influences his/her behavior, perceptions, and performance.26 The principle of homophily—the tendency for individuals to have positive ties to those who are similar to themselves—is a critical concept in social identity theory and suggests that consumers are more likely to pay attention to and be influenced by sources perceived as similar to themselves.20 Thus, even if the potential benefits of DTC advertisements were to be realized for psoriasis and eczema, the lack of adequate minority and older adult representation raises concerns about whether these benefits would reach a diverse population and if the advertisements might further potentiate existing knowledge and treatment disparities.
Limitations
Our study is not without limitations. The sampling period was short and might not reflect advertisement content over a longer time course. We did not evaluate other potential sources of information, such as the Internet and social media. Nevertheless, televised DTC advertisements remain a major source of medical and drug information for the general public. We did not directly evaluate viewers’ reactions to the DTC advertisements of interest; however, other literature lends support to the significance of social identity theory and its impact on consumer behavior.26
Conclusion
Our study highlights a lost opportunity among psoriasis and eczema DTC advertisements for patient reach and disease education that may encourage existing and emerging knowledge and treatment disparities for both conditions. Our findings should serve as a call to action to pharmaceutical companies and other organizations involved in creating and supporting DTC advertisements for psoriasis and eczema to increase the educational content, diversify the depicted characters, and optimize advertisement placement.
- Brownfield ED, Bernhardt JM, Phan JL, et al. Direct-to-consumer drug advertisements on network television: an exploration of quantity, frequency, and placement. J Health Commun. 2004;9:491-497.
- Tai-Seale M, McGuire TG, Zhang W. Time allocation in primary care office visits. Health Serv Res. 2007;42:1871-1894.
- Schwartz LM, Woloshin S. Medical marketing in the United States, 1997-2016. JAMA. 2019;321:80-96.
- Lanigan SW, Farber EM. Patients’ knowledge of psoriasis: pilot study. Cutis. 1990;46:359-362.
- Renzi C, Di Pietro C, Tabolli S. Participation, satisfaction and knowledge level of patients with cutaneous psoriasis or psoriatic arthritis. Clin Exp Dermatol. 2011;36:885-888.
- Lebwohl MG, Bachelez H, Barker J, et al. Patient perspectives in the management of psoriasis: results from the population-based Multinational Assessment of Psoriasis and Psoriatic Arthritis Survey. J Am Acad Dermatol. 2014;70:871-881.e871-830.
- Wu JJ, Lu M, Veverka KA, et al. The journey for US psoriasis patients prescribed a topical: a retrospective database evaluation of patient progression to oral and/or biologic treatment. J Dermatolog Treat. 2019;30:446-453.
- Takeshita J, Gelfand JM, Li P, et al. Psoriasis in the US Medicare population: prevalence, treatment, and factors associated with biologic use. J Invest Dermatol. 2015;135:2955-2963.
- Kerr GS, Qaiyumi S, Richards J, et al. Psoriasis and psoriatic arthritis in African-American patients—the need to measure disease burden. Clin Rheumatol. 2015;34:1753-1759.
- Takeshita J, Eriksen WT, Raziano VT, et al. Racial differences in perceptions of psoriasis therapies: implications for racial disparities in psoriasis treatment. J Invest Dermatol. 2019;139:1672-1679.e1.
- Wu MH, Bartz D, Avorn J, et al. Trends in direct-to-consumer advertising of prescription contraceptives. Contraception. 2016;93:398-405.
- Mintzes B, Barer ML, Kravitz RL, et al. How does direct-to-consumer advertising (DTCA) affect prescribing? a survey in primary care environments with and without legal DTCA. CMAJ. 2003;169:405-412.
- Topten. Nielson website. https://www.nielsen.com/us/en/top-ten/. Accessed July 22, 2020.
- Leading ad supported broadcast and cable networks in the United States in 2019, by average number of viewers. Statistia website. https://www.statista.com/statistics/530119/tv-networks-viewers-usa/. Accessed July 22, 2020.
- Prescription drug advertisements. Electronic Code of Federal Regulations website. https://www.ecfr.gov/cgi-bin/text-idx?SID=d4f308e364578bda8e55a831638a26c6&mc=true&node=pt21.4.202&rgn=div5. Updated August 12, 2020. Accessed August 12, 2020.
- Gelfand JM, Stern RS, Nijsten T, et al. The prevalence of psoriasis in African Americans: results from a population-based study. J Am Acad Dermatol. 2005;52:23-26.
- Rachakonda TD, Schupp CW, Armstrong AW. Psoriasis prevalence among adults in the United States. J Am Acad Dermatol. 2014;70:512-516.
- Centers for Disease Control and Prevention. National Center for Health Statistics, National Health Interview Survey, 2014. https://www.cdc.gov/nchs/data/health_policy/eczema_skin_problems_tables.pdf. Accessed July 22, 2020.
- Chiesa Fuxench ZC, Block JK, Boguniewicz M, et al. Atopic dermatitis in America study: a cross-sectional study examining the prevalence and disease burden of atopic dermatitis in the US adult population. J Invest Dermatol. 2019;139:583-590.
- Welch Cline RJ, Young HN. Marketing drugs, marketing health care relationships: a content analysis of visual cues in direct-to-consumer prescription drug advertising. Health Commun. 2004;16:131-157.
- Ball JG, Liang A, Lee WN. Representation of African Americans in direct-to-consumer pharmaceutical commercials: a content analysis with implications for health disparities. Health Mark Q. 2009;26:372-390.
- Ventola CL. Direct-to-consumer pharmaceutical advertising: therapeutic or toxic? P T. 2011;36:669-674, 681-684.
- Pearl RL, Wan MT, Takeshita J, et al. Stigmatizing attitudes toward persons with psoriasis among laypersons and medical students. J Am Acad Dermatol. 2019;80:1556-1563.
- Chernyshov PV. Stigmatization and self-perception in children with atopic dermatitis. Clin Cosmet Investig Dermatol. 2016;9:159-166.
- Wittkowski A, Richards HL, Griffiths CEM, et al. The impact of psychological and clinical factors on quality of life in individuals with atopic dermatitis. J Psychosom Res. 2004;57:195-200.
- Forehand MR, Deshpande R, Reed 2nd A. Identity salience and the influence of differential activation of the social self-schema on advertising response. J Appl Psychol. 2002;87:1086-1099.
Practice Points
- Racial/ethnic minorities and older adults are underrepresented in direct-to-consumer (DTC) advertisements for psoriasis and eczema.
- Character representation in psoriasis DTC advertisements, in particular, mirrors existing age and racial disparities in treatment with biologics.
- Disease-specific factual content was sparse, and obvious depictions of skin disease and symptoms were uncommon, especially among psoriasis DTC advertisements.
- Dermatologists should be aware of these deficiencies in psoriasis and eczema DTC advertisements and take care not to further reinforce existing knowledge gaps and inequitable treatment patterns among patients.
Using Artificial Intelligence for COVID-19 Chest X-ray Diagnosis
The novel coronavirus severe acute respiratory syndrome coronavirus 2 (SARSCoV- 2), which causes the respiratory disease coronavirus disease-19 (COVID- 19), was first identified as a cluster of cases of pneumonia in Wuhan, Hubei Province of China on December 31, 2019.1 Within a month, the disease had spread significantly, leading the World Health Organization (WHO) to designate COVID-19 a public health emergency of international concern. On March 11, 2020, the WHO declared COVID-19 a global pandemic.2 As of August 18, 2020, the virus has infected > 21 million people, with > 750,000 deaths worldwide.3 The spread of COVID-19 has had a dramatic impact on social, economic, and health care issues throughout the world, which has been discussed elsewhere.4
Prior to the this century, members of the coronavirus family had minimal impact on human health.5 However, in the past 20 years, outbreaks have highlighted an emerging importance of coronaviruses in morbidity and mortality on a global scale. Although less prevalent than COVID-19, severe acute respiratory syndrome (SARS) in 2002 to 2003 and Middle East respiratory syndrome (MERS) in 2012 likely had higher mortality rates than the current pandemic.5 Based on this recent history, it is reasonable to assume that we will continue to see novel diseases with similar significant health and societal implications. The challenges presented to health care providers (HCPs) by such novel viral pathogens are numerous, including methods for rapid diagnosis, prevention, and treatment. In the current study, we focus on diagnosis issues, which were evident with COVID-19 with the time required to develop rapid and effective diagnostic modalities.
We have previously reported the utility of using artificial intelligence (AI) in the histopathologic diagnosis of cancer.6-8 AI was first described in 1956 and involves the field of computer science in which machines are trained to learn from experience.9 Machine learning (ML) is a subset of AI and is achieved by using mathematic models to compute sample datasets.10 Current ML employs deep learning with neural network algorithms, which can recognize patterns and achieve complex computational tasks often far quicker and with increased precision than can humans.11-13 In addition to applications in pathology, ML algorithms have both prognostic and diagnostic applications in multiple medical specialties, such as radiology, dermatology, ophthalmology, and cardiology.6 It is predicted that AI will impact almost every aspect of health care in the future.14
In this article, we examine the potential for AI to diagnose patients with COVID-19 pneumonia using chest radiographs (CXR) alone. This is done using Microsoft CustomVision (www.customvision.ai), a readily available, automated ML platform. Employing AI to both screen and diagnose emerging health emergencies such as COVID-19 has the potential to dramatically change how we approach medical care in the future. In addition, we describe the creation of a publicly available website (interknowlogy-covid-19 .azurewebsites.net) that could augment COVID-19 pneumonia CXR diagnosis.
Methods
For the training dataset, 103 CXR images of COVID-19 were downloaded from GitHub covid-chest-xray dataset.15 Five hundred images of non-COVID-19 pneumonia and 500 images of the normal lung were downloaded from the Kaggle RSNA Pneumonia Detection Challenge dataset.16 To balance the dataset, we expanded the COVID-19 dataset to 500 images by slight rotation (probability = 1, max rotation = 5) and zooming (probability = 0.5, percentage area = 0.9) of the original images using the Augmentor Python package.17
Validation Dataset
For the validation dataset 30 random CXR images were obtained from the US Department of Veterans Affairs (VA) PACS (picture archiving and communication system). This dataset included 10 CXR images from hospitalized patients with COVID-19, 10 CXR pneumonia images from patients without COVID-19, and 10 normal CXRs. COVID-19 diagnoses were confirmed with a positive test result from the Xpert Xpress SARS-CoV-2 polymerase chain reaction (PCR) platform.18
Microsoft Custom
Vision Microsoft CustomVision is an automated image classification and object detection system that is a part of Microsoft Azure Cognitive Services (azure.microsoft.com). It has a pay-as-you-go model with fees depending on the computing needs and usage. It offers a free trial to users for 2 initial projects. The service is online with an easy-to-follow graphical user interface. No coding skills are necessary.
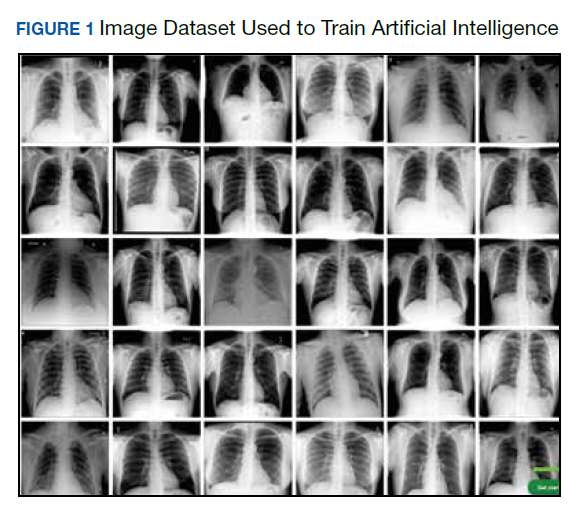
We created a new classification project in CustomVision and chose a compact general domain for small size and easy export to TensorFlow. js model format. TensorFlow.js is a JavaScript library that enables dynamic download and execution of ML models. After the project was created, we proceeded to upload our image dataset. Each class was uploaded separately and tagged with the appropriate label (covid pneumonia, non-covid pneumonia, or normal lung). The system rejected 16 COVID-19 images as duplicates. The final CustomVision training dataset consisted of 484 images of COVID-19 pneumonia, 500 images of non-COVID-19 pneumonia, and 500 images of normal lungs. Once uploaded, CustomVision self-trains using the dataset upon initiating the program (Figure 1).
Website Creation
CustomVision was used to train the model. It can be used to execute the model continuously, or the model can be compacted and decoupled from CustomVision. In this case, the model was compacted and decoupled for use in an online application. An Angular online application was created with TensorFlow.js. Within a user’s web browser, the model is executed when an image of a CXR is submitted. Confidence values for each classification are returned. In this design, after the initial webpage and model is downloaded, the webpage no longer needs to access any server components and performs all operations in the browser. Although the solution works well on mobile phone browsers and in low bandwidth situations, the quality of predictions may depend on the browser and device used. At no time does an image get submitted to the cloud.
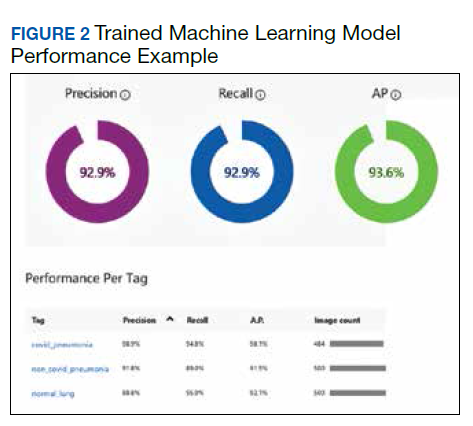
Result
Overall, our trained model showed 92.9% precision and recall. Precision and recall results for each label were 98.9% and 94.8%, respectively for COVID-19 pneumonia; 91.8% and 89%, respectively, for non- COVID-19 pneumonia; and 88.8% and 95%, respectively, for normal lung (Figure 2). Next, we proceeded to validate the training model on the VA data by making individual predictions on 30 images from the VA dataset. Our model performed well with 100% sensitivity (recall), 95% specificity, 97% accuracy, 91% positive predictive value (precision), and 100% negative predictive value (Table).
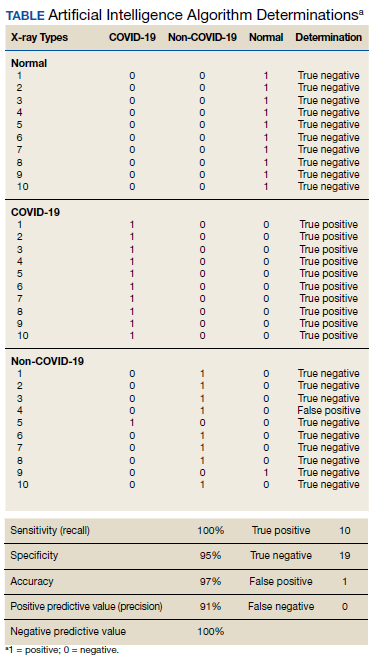
Discussion
We successfully demonstrated the potential of using AI algorithms in assessing CXRs for COVID-19. We first trained the CustomVision automated image classification and object detection system to differentiate cases of COVID-19 from pneumonia from other etiologies as well as normal lung CXRs. We then tested our model against known patients from the James A. Haley Veterans’ Hospital in Tampa, Florida. The program achieved 100% sensitivity (recall), 95% specificity, 97% accuracy, 91% positive predictive value (precision), and 100% negative predictive value in differentiating the 3 scenarios. Using the trained ML model, we proceeded to create a website that could augment COVID-19 CXR diagnosis.19 The website works on mobile as well as desktop platforms. A health care provider can take a CXR photo with a mobile phone or upload the image file. The ML algorithm would provide the probability of COVID-19 pneumonia, non-COVID-19 pneumonia, or normal lung diagnosis (Figure 3).
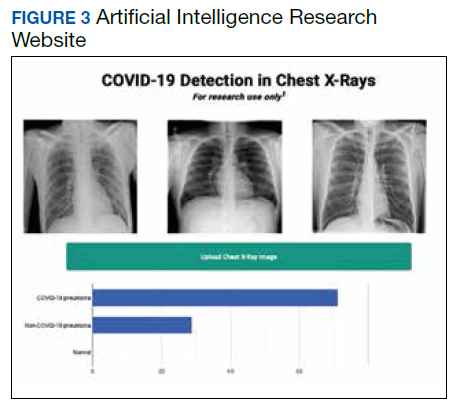
Emerging diseases such as COVID-19 present numerous challenges to HCPs, governments, and businesses, as well as to individual members of society. As evidenced with COVID-19, the time from first recognition of an emerging pathogen to the development of methods for reliable diagnosis and treatment can be months, even with a concerted international effort. The gold standard for diagnosis of COVID-19 is by reverse transcriptase PCR (RT-PCR) technologies; however, early RT-PCR testing produced less than optimal results.20-22 Even after the development of reliable tests for detection, making test kits readily available to health care providers on an adequate scale presents an additional challenge as evident with COVID-19.
Use of X-ray vs Computed Tomography
The lack of availability of diagnostic RTPCR with COVID-19 initially placed increased reliability on presumptive diagnoses via imaging in some situations.23 Most of the literature evaluating radiographs of patients with COVID-19 focuses on chest computed tomography (CT) findings, with initial results suggesting CT was more accurate than early RT-PCR methodologies.21,22,24 The Radiological Society of North America Expert consensus statement on chest CT for COVID-19 states that CT findings can even precede positivity on RT-PCR in some cases.22 However, currently it does not recommend the use of CT scanning as a screening tool. Furthermore, the actual sensitivity and specificity of CT interpretation by radiologists for COVID-19 are unknown.22
Characteristic CT findings include ground-glass opacities (GGOs) and consolidation most commonly in the lung periphery, though a diffuse distribution was found in a minority of patients.21,23,25-27 Lomoro and colleagues recently summarized the CT findings from several reports that described abnormalities as most often bilateral and peripheral, subpleural, and affecting the lower lobes.26 Not surprisingly, CT appears more sensitive at detecting changes with COVID-19 than does CXR, with reports that a minority of patients exhibited CT changes before changes were visible on CXR.23,26
We focused our study on the potential of AI in the examination of CXRs in patients with COVID-19, as there are several limitations to the routine use of CT scans with conditions such as COVID-19. Aside from the more considerable time required to obtain CTs, there are issues with contamination of CT suites, sometimes requiring a dedicated COVID-19 CT scanner.23,28 The time constraints of decontamination or limited utilization of CT suites can delay or disrupt services for patients with and without COVID-19. Because of these factors, CXR may be a better resource to minimize the risk of infection to other patients. Also, accurate assessment of abnormalities on CXR for COVID-19 may identify patients in whom the CXR was performed for other purposes.23 CXR is more readily available than CT, especially in more remote or underdeveloped areas.28 Finally, as with CT, CXR abnormalities are reported to have appeared before RT-PCR tests became positive for a minority of patients.23
CXR findings described in patients with COVID-19 are similar to those of CT and include GGOs, consolidation, and hazy increased opacities.23,25,26,28,29 Like CT, the majority of patients who received CXR demonstrated greater involvement in the lower zones and peripherally.23,25,26,28,29 Most patients showed bilateral involvement. However, while these findings are common in patients with COVID-19, they are not specific and can be seen in other conditions, such as other viral pneumonia, bacterial pneumonia, injury from drug toxicity, inhalation injury, connective tissue disease, and idiopathic conditions.
Application of AI for COVID-19
Applications of AI in interpreting radiographs of various types are numerous, and extensive literature has been written on the topic.30 Using deep learning algorithms, AI has multiple possible roles to augment traditional radiograph interpretation. These include the potential for screening, triaging, and increasing the speed to render diagnoses. It also can provide a rapid “second opinion” to the radiologist to support the final interpretation. In areas with critical shortages of radiologists, AI potentially can be used to render the definitive diagnosis. In COVID- 19, imaging studies have been shown to correlate with disease severity and mortality, and AI could assist in monitoring the course of the disease as it progresses and potentially identify patients at greatest risk.27 Furthermore, early results from PCR have been considered suboptimal, and it is known that patients with COVID-19 can test negative initially even by reliable testing methodologies. As AI technology progresses, interpretation can detect and guide triage and treatment of patients with high suspicions of COVID-19 but negative initial PCR results, or in situations where test availability is limited or results are delayed. There are numerous potential benefits should a rapid diagnostic test as simple as a CXR be able to reliably impact containment and prevention of the spread of contagions such as COVID- 19 early in its course.
Few studies have assessed using AI in the radiologic diagnosis of COVID-19, most of which use CT scanning. Bai and colleagues demonstrated increased accuracy, sensitivity, and specificity in distinguishing chest CTs of COVID-19 patients from other types of pneumonia.21,31 A separate study demonstrated the utility of using AI to differentiate COVID-19 from community-acquired pneumonia with CT.32 However, the effective utility of AI for CXR interpretation also has been demonstrated.14,33 Implementation of convolutional neural network layers has allowed for reliable differentiation of viral and bacterial pneumonia with CXR imaging.34 Evidence suggests that there is great potential in the application of AI in the interpretation of radiographs of all types.
Finally, we have developed a publicly available website based on our studies.18 This website is for research use only as it is based on data from our preliminary investigation. To appear within the website, images must have protected health information removed before uploading. The information on the website, including text, graphics, images, or other material, is for research and may not be appropriate for all circumstances. The website does not provide medical, professional, or licensed advice and is not a substitute for consultation with a HCP. Medical advice should be sought from a qualified HCP for any questions, and the website should not be used for medical diagnosis or treatment.
Limitations
In our preliminary study, we have demonstrated the potential impact AI can have in multiple aspects of patient care for emerging pathogens such as COVID-19 using a test as readily available as a CXR. However, several limitations to this investigation should be mentioned. The study is retrospective in nature with limited sample size and with X-rays from patients with various stages of COVID-19 pneumonia. Also, cases of non-COVID-19 pneumonia are not stratified into different types or etiologies. We intend to demonstrate the potential of AI in differentiating COVID-19 pneumonia from non-COVID-19 pneumonia of any etiology, though future studies should address comparison of COVID-19 cases to more specific types of pneumonias, such as of bacterial or viral origin. Furthermore, the present study does not address any potential effects of additional radiographic findings from coexistent conditions, such as pulmonary edema as seen in congestive heart failure, pleural effusions (which can be seen with COVID-19 pneumonia, though rarely), interstitial lung disease, etc. Future studies are required to address these issues. Ultimately, prospective studies to assess AI-assisted radiographic interpretation in conditions such as COVID-19 are required to demonstrate the impact on diagnosis, treatment, outcome, and patient safety as these technologies are implemented.
Conclusions
We have used a readily available, commercial platform to demonstrate the potential of AI to assist in the successful diagnosis of COVID-19 pneumonia on CXR images. While this technology has numerous applications in radiology, we have focused on the potential impact on future world health crises such as COVID-19. The findings have implications for screening and triage, initial diagnosis, monitoring disease progression, and identifying patients at increased risk of morbidity and mortality. Based on the data, a website was created to demonstrate how such technologies could be shared and distributed to others to combat entities such as COVID-19 moving forward. Our study offers a small window into the potential for how AI will likely dramatically change the practice of medicine in the future.
1. World Health Organization. Coronavirus disease (COVID- 19) pandemic. https://www.who.int/emergencies/diseases /novel-coronavirus2019. Updated August 23, 2020. Accessed August 24, 2020.
2. World Health Organization. WHO Director-General’s opening remarks at the media briefing on COVID-19 - 11 March 2020. https://www.who.int/dg/speeches/detail/who -director-general-sopening-remarks-at-the-media-briefing -on-covid-19---11-march2020. Published March 11, 2020. Accessed August 24, 2020.
3. World Health Organization. Coronavirus disease (COVID- 19): situation report--209. https://www.who.int/docs /default-source/coronaviruse/situation-reports/20200816 -covid-19-sitrep-209.pdf. Updated August 16, 2020. Accessed August 24, 2020.
4. Nicola M, Alsafi Z, Sohrabi C, et al. The socio-economic implications of the coronavirus pandemic (COVID-19): a review. Int J Surg. 2020;78:185-193. doi:10.1016/j.ijsu.2020.04.018
5. da Costa VG, Moreli ML, Saivish MV. The emergence of SARS, MERS and novel SARS-2 coronaviruses in the 21st century. Arch Virol. 2020;165(7):1517-1526. doi:10.1007/s00705-020-04628-0
6. Borkowski AA, Wilson CP, Borkowski SA, et al. Comparing artificial intelligence platforms for histopathologic cancer diagnosis. Fed Pract. 2019;36(10):456-463.
7. Borkowski AA, Wilson CP, Borkowski SA, Thomas LB, Deland LA, Mastorides SM. Apple machine learning algorithms successfully detect colon cancer but fail to predict KRAS mutation status. http://arxiv.org/abs/1812.04660. Updated January 15, 2019. Accessed August 24, 2020.
8. Borkowski AA, Wilson CP, Borkowski SA, Deland LA, Mastorides SM. Using Apple machine learning algorithms to detect and subclassify non-small cell lung cancer. http:// arxiv.org/abs/1808.08230. Updated January 15, 2019. Accessed August 24, 2020.
9. Moor J. The Dartmouth College artificial intelligence conference: the next fifty years. AI Mag. 2006;27(4):87. doi:10.1609/AIMAG.V27I4.1911
10. Samuel AL. Some studies in machine learning using the game of checkers. IBM J Res Dev. 1959;3(3):210-229. doi:10.1147/rd.33.0210
11. Sarle WS. Neural networks and statistical models https:// people.orie.cornell.edu/davidr/or474/nn_sas.pdf. Published April 1994. Accessed August 24, 2020.
12. Schmidhuber J. Deep learning in neural networks: an overview. Neural Netw. 2015;61:85-117. doi:10.1016/j.neunet.2014.09.003
13. 13. LeCun Y, Bengio Y, Hinton G. Deep learning. Nature. 2015;521(7553):436-444. doi:10.1038/nature14539
14. Topol EJ. High-performance medicine: the convergence of human and artificial intelligence. Nat Med. 2019;25(1):44- 56. doi:10.1038/s41591-018-0300-7
15. Cohen JP, Morrison P, Dao L. COVID-19 Image Data Collection. Published online March 25, 2020. Accessed May 13, 2020. http://arxiv.org/abs/2003.11597
16. Radiological Society of America. RSNA pneumonia detection challenge. https://www.kaggle.com/c/rsnapneumonia- detectionchallenge. Accessed August 24, 2020.
17. Bloice MD, Roth PM, Holzinger A. Biomedical image augmentation using Augmentor. Bioinformatics. 2019;35(21):4522-4524. doi:10.1093/bioinformatics/btz259
18. Cepheid. Xpert Xpress SARS-CoV-2. https://www.cepheid .com/coronavirus. Accessed August 24, 2020.
19. Interknowlogy. COVID-19 detection in chest X-rays. https://interknowlogy-covid-19.azurewebsites.net. Accessed August 27, 2020.
20. Bernheim A, Mei X, Huang M, et al. Chest CT Findings in Coronavirus Disease-19 (COVID-19): Relationship to Duration of Infection. Radiology. 2020;295(3):200463. doi:10.1148/radiol.2020200463
21. Ai T, Yang Z, Hou H, et al. Correlation of Chest CT and RTPCR Testing for Coronavirus Disease 2019 (COVID-19) in China: a report of 1014 cases. Radiology. 2020;296(2):E32- E40. doi:10.1148/radiol.2020200642
22. Simpson S, Kay FU, Abbara S, et al. Radiological Society of North America Expert Consensus Statement on Reporting Chest CT Findings Related to COVID-19. Endorsed by the Society of Thoracic Radiology, the American College of Radiology, and RSNA - Secondary Publication. J Thorac Imaging. 2020;35(4):219-227. doi:10.1097/RTI.0000000000000524
23. Wong HYF, Lam HYS, Fong AH, et al. Frequency and distribution of chest radiographic findings in patients positive for COVID-19. Radiology. 2020;296(2):E72-E78. doi:10.1148/radiol.2020201160
24. Fang Y, Zhang H, Xie J, et al. Sensitivity of chest CT for COVID-19: comparison to RT-PCR. Radiology. 2020;296(2):E115-E117. doi:10.1148/radiol.2020200432
25. Chen N, Zhou M, Dong X, et al. Epidemiological and clinical characteristics of 99 cases of 2019 novel coronavirus pneumonia in Wuhan, China: a descriptive study. Lancet. 2020;395(10223):507-513. doi:10.1016/S0140-6736(20)30211-7
26. Lomoro P, Verde F, Zerboni F, et al. COVID-19 pneumonia manifestations at the admission on chest ultrasound, radiographs, and CT: single-center study and comprehensive radiologic literature review. Eur J Radiol Open. 2020;7:100231. doi:10.1016/j.ejro.2020.100231
27. Salehi S, Abedi A, Balakrishnan S, Gholamrezanezhad A. Coronavirus disease 2019 (COVID-19) imaging reporting and data system (COVID-RADS) and common lexicon: a proposal based on the imaging data of 37 studies. Eur Radiol. 2020;30(9):4930-4942. doi:10.1007/s00330-020-06863-0
28. Jacobi A, Chung M, Bernheim A, Eber C. Portable chest X-ray in coronavirus disease-19 (COVID- 19): a pictorial review. Clin Imaging. 2020;64:35-42. doi:10.1016/j.clinimag.2020.04.001
29. Bhat R, Hamid A, Kunin JR, et al. Chest imaging in patients hospitalized With COVID-19 infection - a case series. Curr Probl Diagn Radiol. 2020;49(4):294-301. doi:10.1067/j.cpradiol.2020.04.001
30. Liu X, Faes L, Kale AU, et al. A comparison of deep learning performance against health-care professionals in detecting diseases from medical imaging: a systematic review and meta-analysis. Lancet Digit Heal. 2019;1(6):E271- E297. doi:10.1016/S2589-7500(19)30123-2
31. Bai HX, Wang R, Xiong Z, et al. Artificial intelligence augmentation of radiologist performance in distinguishing COVID-19 from pneumonia of other origin at chest CT. Radiology. 2020;296(3):E156-E165. doi:10.1148/radiol.2020201491
32. Li L, Qin L, Xu Z, et al. Using artificial intelligence to detect COVID-19 and community-acquired pneumonia based on pulmonary CT: evaluation of the diagnostic accuracy. Radiology. 2020;296(2):E65-E71. doi:10.1148/radiol.2020200905
33. Rajpurkar P, Joshi A, Pareek A, et al. CheXpedition: investigating generalization challenges for translation of chest x-ray algorithms to the clinical setting. http://arxiv.org /abs/2002.11379. Updated March 11, 2020. Accessed August 24, 2020.
34. Kermany DS, Goldbaum M, Cai W, et al. Identifying medical diagnoses and treatable diseases by imagebased deep learning. Cell. 2018;172(5):1122-1131.e9. doi:10.1016/j.cell.2018.02.010
The novel coronavirus severe acute respiratory syndrome coronavirus 2 (SARSCoV- 2), which causes the respiratory disease coronavirus disease-19 (COVID- 19), was first identified as a cluster of cases of pneumonia in Wuhan, Hubei Province of China on December 31, 2019.1 Within a month, the disease had spread significantly, leading the World Health Organization (WHO) to designate COVID-19 a public health emergency of international concern. On March 11, 2020, the WHO declared COVID-19 a global pandemic.2 As of August 18, 2020, the virus has infected > 21 million people, with > 750,000 deaths worldwide.3 The spread of COVID-19 has had a dramatic impact on social, economic, and health care issues throughout the world, which has been discussed elsewhere.4
Prior to the this century, members of the coronavirus family had minimal impact on human health.5 However, in the past 20 years, outbreaks have highlighted an emerging importance of coronaviruses in morbidity and mortality on a global scale. Although less prevalent than COVID-19, severe acute respiratory syndrome (SARS) in 2002 to 2003 and Middle East respiratory syndrome (MERS) in 2012 likely had higher mortality rates than the current pandemic.5 Based on this recent history, it is reasonable to assume that we will continue to see novel diseases with similar significant health and societal implications. The challenges presented to health care providers (HCPs) by such novel viral pathogens are numerous, including methods for rapid diagnosis, prevention, and treatment. In the current study, we focus on diagnosis issues, which were evident with COVID-19 with the time required to develop rapid and effective diagnostic modalities.
We have previously reported the utility of using artificial intelligence (AI) in the histopathologic diagnosis of cancer.6-8 AI was first described in 1956 and involves the field of computer science in which machines are trained to learn from experience.9 Machine learning (ML) is a subset of AI and is achieved by using mathematic models to compute sample datasets.10 Current ML employs deep learning with neural network algorithms, which can recognize patterns and achieve complex computational tasks often far quicker and with increased precision than can humans.11-13 In addition to applications in pathology, ML algorithms have both prognostic and diagnostic applications in multiple medical specialties, such as radiology, dermatology, ophthalmology, and cardiology.6 It is predicted that AI will impact almost every aspect of health care in the future.14
In this article, we examine the potential for AI to diagnose patients with COVID-19 pneumonia using chest radiographs (CXR) alone. This is done using Microsoft CustomVision (www.customvision.ai), a readily available, automated ML platform. Employing AI to both screen and diagnose emerging health emergencies such as COVID-19 has the potential to dramatically change how we approach medical care in the future. In addition, we describe the creation of a publicly available website (interknowlogy-covid-19 .azurewebsites.net) that could augment COVID-19 pneumonia CXR diagnosis.
Methods
For the training dataset, 103 CXR images of COVID-19 were downloaded from GitHub covid-chest-xray dataset.15 Five hundred images of non-COVID-19 pneumonia and 500 images of the normal lung were downloaded from the Kaggle RSNA Pneumonia Detection Challenge dataset.16 To balance the dataset, we expanded the COVID-19 dataset to 500 images by slight rotation (probability = 1, max rotation = 5) and zooming (probability = 0.5, percentage area = 0.9) of the original images using the Augmentor Python package.17
Validation Dataset
For the validation dataset 30 random CXR images were obtained from the US Department of Veterans Affairs (VA) PACS (picture archiving and communication system). This dataset included 10 CXR images from hospitalized patients with COVID-19, 10 CXR pneumonia images from patients without COVID-19, and 10 normal CXRs. COVID-19 diagnoses were confirmed with a positive test result from the Xpert Xpress SARS-CoV-2 polymerase chain reaction (PCR) platform.18
Microsoft Custom
Vision Microsoft CustomVision is an automated image classification and object detection system that is a part of Microsoft Azure Cognitive Services (azure.microsoft.com). It has a pay-as-you-go model with fees depending on the computing needs and usage. It offers a free trial to users for 2 initial projects. The service is online with an easy-to-follow graphical user interface. No coding skills are necessary.
We created a new classification project in CustomVision and chose a compact general domain for small size and easy export to TensorFlow. js model format. TensorFlow.js is a JavaScript library that enables dynamic download and execution of ML models. After the project was created, we proceeded to upload our image dataset. Each class was uploaded separately and tagged with the appropriate label (covid pneumonia, non-covid pneumonia, or normal lung). The system rejected 16 COVID-19 images as duplicates. The final CustomVision training dataset consisted of 484 images of COVID-19 pneumonia, 500 images of non-COVID-19 pneumonia, and 500 images of normal lungs. Once uploaded, CustomVision self-trains using the dataset upon initiating the program (Figure 1).
Website Creation
CustomVision was used to train the model. It can be used to execute the model continuously, or the model can be compacted and decoupled from CustomVision. In this case, the model was compacted and decoupled for use in an online application. An Angular online application was created with TensorFlow.js. Within a user’s web browser, the model is executed when an image of a CXR is submitted. Confidence values for each classification are returned. In this design, after the initial webpage and model is downloaded, the webpage no longer needs to access any server components and performs all operations in the browser. Although the solution works well on mobile phone browsers and in low bandwidth situations, the quality of predictions may depend on the browser and device used. At no time does an image get submitted to the cloud.
Result
Overall, our trained model showed 92.9% precision and recall. Precision and recall results for each label were 98.9% and 94.8%, respectively for COVID-19 pneumonia; 91.8% and 89%, respectively, for non- COVID-19 pneumonia; and 88.8% and 95%, respectively, for normal lung (Figure 2). Next, we proceeded to validate the training model on the VA data by making individual predictions on 30 images from the VA dataset. Our model performed well with 100% sensitivity (recall), 95% specificity, 97% accuracy, 91% positive predictive value (precision), and 100% negative predictive value (Table).
Discussion
We successfully demonstrated the potential of using AI algorithms in assessing CXRs for COVID-19. We first trained the CustomVision automated image classification and object detection system to differentiate cases of COVID-19 from pneumonia from other etiologies as well as normal lung CXRs. We then tested our model against known patients from the James A. Haley Veterans’ Hospital in Tampa, Florida. The program achieved 100% sensitivity (recall), 95% specificity, 97% accuracy, 91% positive predictive value (precision), and 100% negative predictive value in differentiating the 3 scenarios. Using the trained ML model, we proceeded to create a website that could augment COVID-19 CXR diagnosis.19 The website works on mobile as well as desktop platforms. A health care provider can take a CXR photo with a mobile phone or upload the image file. The ML algorithm would provide the probability of COVID-19 pneumonia, non-COVID-19 pneumonia, or normal lung diagnosis (Figure 3).
Emerging diseases such as COVID-19 present numerous challenges to HCPs, governments, and businesses, as well as to individual members of society. As evidenced with COVID-19, the time from first recognition of an emerging pathogen to the development of methods for reliable diagnosis and treatment can be months, even with a concerted international effort. The gold standard for diagnosis of COVID-19 is by reverse transcriptase PCR (RT-PCR) technologies; however, early RT-PCR testing produced less than optimal results.20-22 Even after the development of reliable tests for detection, making test kits readily available to health care providers on an adequate scale presents an additional challenge as evident with COVID-19.
Use of X-ray vs Computed Tomography
The lack of availability of diagnostic RTPCR with COVID-19 initially placed increased reliability on presumptive diagnoses via imaging in some situations.23 Most of the literature evaluating radiographs of patients with COVID-19 focuses on chest computed tomography (CT) findings, with initial results suggesting CT was more accurate than early RT-PCR methodologies.21,22,24 The Radiological Society of North America Expert consensus statement on chest CT for COVID-19 states that CT findings can even precede positivity on RT-PCR in some cases.22 However, currently it does not recommend the use of CT scanning as a screening tool. Furthermore, the actual sensitivity and specificity of CT interpretation by radiologists for COVID-19 are unknown.22
Characteristic CT findings include ground-glass opacities (GGOs) and consolidation most commonly in the lung periphery, though a diffuse distribution was found in a minority of patients.21,23,25-27 Lomoro and colleagues recently summarized the CT findings from several reports that described abnormalities as most often bilateral and peripheral, subpleural, and affecting the lower lobes.26 Not surprisingly, CT appears more sensitive at detecting changes with COVID-19 than does CXR, with reports that a minority of patients exhibited CT changes before changes were visible on CXR.23,26
We focused our study on the potential of AI in the examination of CXRs in patients with COVID-19, as there are several limitations to the routine use of CT scans with conditions such as COVID-19. Aside from the more considerable time required to obtain CTs, there are issues with contamination of CT suites, sometimes requiring a dedicated COVID-19 CT scanner.23,28 The time constraints of decontamination or limited utilization of CT suites can delay or disrupt services for patients with and without COVID-19. Because of these factors, CXR may be a better resource to minimize the risk of infection to other patients. Also, accurate assessment of abnormalities on CXR for COVID-19 may identify patients in whom the CXR was performed for other purposes.23 CXR is more readily available than CT, especially in more remote or underdeveloped areas.28 Finally, as with CT, CXR abnormalities are reported to have appeared before RT-PCR tests became positive for a minority of patients.23
CXR findings described in patients with COVID-19 are similar to those of CT and include GGOs, consolidation, and hazy increased opacities.23,25,26,28,29 Like CT, the majority of patients who received CXR demonstrated greater involvement in the lower zones and peripherally.23,25,26,28,29 Most patients showed bilateral involvement. However, while these findings are common in patients with COVID-19, they are not specific and can be seen in other conditions, such as other viral pneumonia, bacterial pneumonia, injury from drug toxicity, inhalation injury, connective tissue disease, and idiopathic conditions.
Application of AI for COVID-19
Applications of AI in interpreting radiographs of various types are numerous, and extensive literature has been written on the topic.30 Using deep learning algorithms, AI has multiple possible roles to augment traditional radiograph interpretation. These include the potential for screening, triaging, and increasing the speed to render diagnoses. It also can provide a rapid “second opinion” to the radiologist to support the final interpretation. In areas with critical shortages of radiologists, AI potentially can be used to render the definitive diagnosis. In COVID- 19, imaging studies have been shown to correlate with disease severity and mortality, and AI could assist in monitoring the course of the disease as it progresses and potentially identify patients at greatest risk.27 Furthermore, early results from PCR have been considered suboptimal, and it is known that patients with COVID-19 can test negative initially even by reliable testing methodologies. As AI technology progresses, interpretation can detect and guide triage and treatment of patients with high suspicions of COVID-19 but negative initial PCR results, or in situations where test availability is limited or results are delayed. There are numerous potential benefits should a rapid diagnostic test as simple as a CXR be able to reliably impact containment and prevention of the spread of contagions such as COVID- 19 early in its course.
Few studies have assessed using AI in the radiologic diagnosis of COVID-19, most of which use CT scanning. Bai and colleagues demonstrated increased accuracy, sensitivity, and specificity in distinguishing chest CTs of COVID-19 patients from other types of pneumonia.21,31 A separate study demonstrated the utility of using AI to differentiate COVID-19 from community-acquired pneumonia with CT.32 However, the effective utility of AI for CXR interpretation also has been demonstrated.14,33 Implementation of convolutional neural network layers has allowed for reliable differentiation of viral and bacterial pneumonia with CXR imaging.34 Evidence suggests that there is great potential in the application of AI in the interpretation of radiographs of all types.
Finally, we have developed a publicly available website based on our studies.18 This website is for research use only as it is based on data from our preliminary investigation. To appear within the website, images must have protected health information removed before uploading. The information on the website, including text, graphics, images, or other material, is for research and may not be appropriate for all circumstances. The website does not provide medical, professional, or licensed advice and is not a substitute for consultation with a HCP. Medical advice should be sought from a qualified HCP for any questions, and the website should not be used for medical diagnosis or treatment.
Limitations
In our preliminary study, we have demonstrated the potential impact AI can have in multiple aspects of patient care for emerging pathogens such as COVID-19 using a test as readily available as a CXR. However, several limitations to this investigation should be mentioned. The study is retrospective in nature with limited sample size and with X-rays from patients with various stages of COVID-19 pneumonia. Also, cases of non-COVID-19 pneumonia are not stratified into different types or etiologies. We intend to demonstrate the potential of AI in differentiating COVID-19 pneumonia from non-COVID-19 pneumonia of any etiology, though future studies should address comparison of COVID-19 cases to more specific types of pneumonias, such as of bacterial or viral origin. Furthermore, the present study does not address any potential effects of additional radiographic findings from coexistent conditions, such as pulmonary edema as seen in congestive heart failure, pleural effusions (which can be seen with COVID-19 pneumonia, though rarely), interstitial lung disease, etc. Future studies are required to address these issues. Ultimately, prospective studies to assess AI-assisted radiographic interpretation in conditions such as COVID-19 are required to demonstrate the impact on diagnosis, treatment, outcome, and patient safety as these technologies are implemented.
Conclusions
We have used a readily available, commercial platform to demonstrate the potential of AI to assist in the successful diagnosis of COVID-19 pneumonia on CXR images. While this technology has numerous applications in radiology, we have focused on the potential impact on future world health crises such as COVID-19. The findings have implications for screening and triage, initial diagnosis, monitoring disease progression, and identifying patients at increased risk of morbidity and mortality. Based on the data, a website was created to demonstrate how such technologies could be shared and distributed to others to combat entities such as COVID-19 moving forward. Our study offers a small window into the potential for how AI will likely dramatically change the practice of medicine in the future.
1. World Health Organization. Coronavirus disease (COVID- 19) pandemic. https://www.who.int/emergencies/diseases /novel-coronavirus2019. Updated August 23, 2020. Accessed August 24, 2020.
2. World Health Organization. WHO Director-General’s opening remarks at the media briefing on COVID-19 - 11 March 2020. https://www.who.int/dg/speeches/detail/who -director-general-sopening-remarks-at-the-media-briefing -on-covid-19---11-march2020. Published March 11, 2020. Accessed August 24, 2020.
3. World Health Organization. Coronavirus disease (COVID- 19): situation report--209. https://www.who.int/docs /default-source/coronaviruse/situation-reports/20200816 -covid-19-sitrep-209.pdf. Updated August 16, 2020. Accessed August 24, 2020.
4. Nicola M, Alsafi Z, Sohrabi C, et al. The socio-economic implications of the coronavirus pandemic (COVID-19): a review. Int J Surg. 2020;78:185-193. doi:10.1016/j.ijsu.2020.04.018
5. da Costa VG, Moreli ML, Saivish MV. The emergence of SARS, MERS and novel SARS-2 coronaviruses in the 21st century. Arch Virol. 2020;165(7):1517-1526. doi:10.1007/s00705-020-04628-0
6. Borkowski AA, Wilson CP, Borkowski SA, et al. Comparing artificial intelligence platforms for histopathologic cancer diagnosis. Fed Pract. 2019;36(10):456-463.
7. Borkowski AA, Wilson CP, Borkowski SA, Thomas LB, Deland LA, Mastorides SM. Apple machine learning algorithms successfully detect colon cancer but fail to predict KRAS mutation status. http://arxiv.org/abs/1812.04660. Updated January 15, 2019. Accessed August 24, 2020.
8. Borkowski AA, Wilson CP, Borkowski SA, Deland LA, Mastorides SM. Using Apple machine learning algorithms to detect and subclassify non-small cell lung cancer. http:// arxiv.org/abs/1808.08230. Updated January 15, 2019. Accessed August 24, 2020.
9. Moor J. The Dartmouth College artificial intelligence conference: the next fifty years. AI Mag. 2006;27(4):87. doi:10.1609/AIMAG.V27I4.1911
10. Samuel AL. Some studies in machine learning using the game of checkers. IBM J Res Dev. 1959;3(3):210-229. doi:10.1147/rd.33.0210
11. Sarle WS. Neural networks and statistical models https:// people.orie.cornell.edu/davidr/or474/nn_sas.pdf. Published April 1994. Accessed August 24, 2020.
12. Schmidhuber J. Deep learning in neural networks: an overview. Neural Netw. 2015;61:85-117. doi:10.1016/j.neunet.2014.09.003
13. 13. LeCun Y, Bengio Y, Hinton G. Deep learning. Nature. 2015;521(7553):436-444. doi:10.1038/nature14539
14. Topol EJ. High-performance medicine: the convergence of human and artificial intelligence. Nat Med. 2019;25(1):44- 56. doi:10.1038/s41591-018-0300-7
15. Cohen JP, Morrison P, Dao L. COVID-19 Image Data Collection. Published online March 25, 2020. Accessed May 13, 2020. http://arxiv.org/abs/2003.11597
16. Radiological Society of America. RSNA pneumonia detection challenge. https://www.kaggle.com/c/rsnapneumonia- detectionchallenge. Accessed August 24, 2020.
17. Bloice MD, Roth PM, Holzinger A. Biomedical image augmentation using Augmentor. Bioinformatics. 2019;35(21):4522-4524. doi:10.1093/bioinformatics/btz259
18. Cepheid. Xpert Xpress SARS-CoV-2. https://www.cepheid .com/coronavirus. Accessed August 24, 2020.
19. Interknowlogy. COVID-19 detection in chest X-rays. https://interknowlogy-covid-19.azurewebsites.net. Accessed August 27, 2020.
20. Bernheim A, Mei X, Huang M, et al. Chest CT Findings in Coronavirus Disease-19 (COVID-19): Relationship to Duration of Infection. Radiology. 2020;295(3):200463. doi:10.1148/radiol.2020200463
21. Ai T, Yang Z, Hou H, et al. Correlation of Chest CT and RTPCR Testing for Coronavirus Disease 2019 (COVID-19) in China: a report of 1014 cases. Radiology. 2020;296(2):E32- E40. doi:10.1148/radiol.2020200642
22. Simpson S, Kay FU, Abbara S, et al. Radiological Society of North America Expert Consensus Statement on Reporting Chest CT Findings Related to COVID-19. Endorsed by the Society of Thoracic Radiology, the American College of Radiology, and RSNA - Secondary Publication. J Thorac Imaging. 2020;35(4):219-227. doi:10.1097/RTI.0000000000000524
23. Wong HYF, Lam HYS, Fong AH, et al. Frequency and distribution of chest radiographic findings in patients positive for COVID-19. Radiology. 2020;296(2):E72-E78. doi:10.1148/radiol.2020201160
24. Fang Y, Zhang H, Xie J, et al. Sensitivity of chest CT for COVID-19: comparison to RT-PCR. Radiology. 2020;296(2):E115-E117. doi:10.1148/radiol.2020200432
25. Chen N, Zhou M, Dong X, et al. Epidemiological and clinical characteristics of 99 cases of 2019 novel coronavirus pneumonia in Wuhan, China: a descriptive study. Lancet. 2020;395(10223):507-513. doi:10.1016/S0140-6736(20)30211-7
26. Lomoro P, Verde F, Zerboni F, et al. COVID-19 pneumonia manifestations at the admission on chest ultrasound, radiographs, and CT: single-center study and comprehensive radiologic literature review. Eur J Radiol Open. 2020;7:100231. doi:10.1016/j.ejro.2020.100231
27. Salehi S, Abedi A, Balakrishnan S, Gholamrezanezhad A. Coronavirus disease 2019 (COVID-19) imaging reporting and data system (COVID-RADS) and common lexicon: a proposal based on the imaging data of 37 studies. Eur Radiol. 2020;30(9):4930-4942. doi:10.1007/s00330-020-06863-0
28. Jacobi A, Chung M, Bernheim A, Eber C. Portable chest X-ray in coronavirus disease-19 (COVID- 19): a pictorial review. Clin Imaging. 2020;64:35-42. doi:10.1016/j.clinimag.2020.04.001
29. Bhat R, Hamid A, Kunin JR, et al. Chest imaging in patients hospitalized With COVID-19 infection - a case series. Curr Probl Diagn Radiol. 2020;49(4):294-301. doi:10.1067/j.cpradiol.2020.04.001
30. Liu X, Faes L, Kale AU, et al. A comparison of deep learning performance against health-care professionals in detecting diseases from medical imaging: a systematic review and meta-analysis. Lancet Digit Heal. 2019;1(6):E271- E297. doi:10.1016/S2589-7500(19)30123-2
31. Bai HX, Wang R, Xiong Z, et al. Artificial intelligence augmentation of radiologist performance in distinguishing COVID-19 from pneumonia of other origin at chest CT. Radiology. 2020;296(3):E156-E165. doi:10.1148/radiol.2020201491
32. Li L, Qin L, Xu Z, et al. Using artificial intelligence to detect COVID-19 and community-acquired pneumonia based on pulmonary CT: evaluation of the diagnostic accuracy. Radiology. 2020;296(2):E65-E71. doi:10.1148/radiol.2020200905
33. Rajpurkar P, Joshi A, Pareek A, et al. CheXpedition: investigating generalization challenges for translation of chest x-ray algorithms to the clinical setting. http://arxiv.org /abs/2002.11379. Updated March 11, 2020. Accessed August 24, 2020.
34. Kermany DS, Goldbaum M, Cai W, et al. Identifying medical diagnoses and treatable diseases by imagebased deep learning. Cell. 2018;172(5):1122-1131.e9. doi:10.1016/j.cell.2018.02.010