User login
Clinical Characteristics and Outcomes of Non-ICU Hospitalization for COVID-19 in a Nonepicenter, Centrally Monitored Healthcare System
Severe acute respiratory syndrome coronavirus 2 (SARS-CoV-2), the cause of coronavirus disease 2019 (COVID-19), is associated with a wide range of illness severity and community prevalence, with an estimated 20% to 30% of patients requiring hospitalization.1,2 Outcome studies of hospitalized patients to date have focused on epicenter healthcare systems operating at surge-level bed capacity in resource-limited settings with mortality exceeding 20% among patients with a discharge disposition3,4 and have had a publication bias toward those suffering critical illness.5-7 Generalizability of these results to nonepicenter hospital systems is unclear given potential differences in triage practices and resource availability according to disease prevalence, with nonepicenter systems that are operating below capacity potentially able to accommodate the needs of most, if not all patients, requiring inpatient level care. Clinical outcomes associated with non–critically ill patients in nonepicenter regions remain poorly characterized yet highly relevant because these will ultimately apply to most US and global healthcare environments.
Nonepicenter healthcare systems must anticipate disease requirements for noncritically ill patients hospitalized with COVID-19 in order to appropriately allocate resources, including monitoring services like continuous pulse oximetry and cardiac telemetry. Data regarding the incidence of in-hospital respiratory and cardiovascular complications, including arrhythmias, among non–intensive care unit (non-ICU) hospitalized patients with COVID-19 are limited, with little granularity in terms of associated variables.7-11 Further data are needed to guide prioritization of valuable non-ICU continuous monitoring resources to the highest-risk patients in order to minimize consumption of personal protective equipment, reduce healthcare worker exposure, and ensure adequate availability for the expansion of prepandemic services.
Projections indicate that COVID-19 incidence may persist in the coming months.11-13 As nonessential hospital operations simultaneously resume, planning for resource allocation for patients with COVID-19 must be incorporated into broader systems of care. Further data are needed to help hospitals anticipate resource needs during this transition, especially by most systems that are caring for COVID-19 patients in nonepicenter environments. Therefore, we conducted a retrospective study of a large, multihospital, nonepicenter health system equipped with centralized continuous monitoring services in order to describe the detailed clinical course, resource utilization, and risk factors for adverse events in patients with COVID-19 initially admitted to the non-ICU setting.
METHODS
Central Monitoring Unit
The central monitoring unit (CMU) provides standardized and continuous off-site secondary monitoring of cardiac telemetry and pulse oximetry for non-ICU patients within Cleveland Clinic hospitals (Ohio, Florida), with direct communication to bedside nursing and inpatient emergency response teams for clinically significant cardiac arrhythmias, respiratory events, and vital sign changes according to standardized indications, as previously reported.14 Clinical variables of interest, including electrocardiographic and vital sign data, are collected and periodically analyzed within a central registry for quality assurance, risk stratification, and resource allocation. The data registry carries Institutional Review Board approval for retrospective analysis and deidentified outcomes reporting with consent form waiver.
Study Design and Data Collection
All patients positive for SARS-CoV-2 infection by nasopharyngeal polymerase chain reaction assay (Applied Biosystems) admitted from the emergency department to a non-ICU bed at a CMU hospital on or after March 13, 2020, and subsequently discharged on or before May 1, 2020, were identified. Retrospective review of the electronic medical record was performed, with follow-up continued through hospital discharge. Data were collected on patient demographics, clinical characteristics including admission laboratories and chest x-ray findings (abnormal defined as presence of an infiltrate/opacity consistent with airspace disease), continuous monitoring utilization, respiratory support, medication treatment, ICU transfer, and final hospital disposition. In addition, prospective recordings of cardiac arrhythmias that prompted CMU notification of bedside nursing were reviewed.
The primary outcome was a composite of death, ICU transfer, or increased oxygen requirement defined as escalation from simple nasal cannula to either high-flow nasal cannula (HFNC), noninvasive ventilation (NIV) consisting of continuous positive airway pressure (CPAP) or bilevel positive airway pressure (BiPAP), or mechanical ventilation. In accordance with published guidelines, patients were treated with supplemental oxygen to maintain peripheral oxygen saturation between 92% and 96%.15
Of note, based on the validated performance of high sensitivity troponin primarily for the diagnosis of acute myocardial infarction in patients presenting to the emergency department with chest pain, our system reserves its use for this context and prefers conventional (fourth generation) troponin T testing for inpatients. Therefore, conventional troponin T values are reported in this study.
Statistical Analyses
Continuous variables are expressed as mean ± standard deviation or median (interquartile range), and categorical variables are expressed as absolute numbers with percentages. Independent samples t and Mann-Whitney U tests were used to compare continuous variables, as appropriate, and chi-square testing was used to compare categorical variables. Clinical variables satisfying an a priori two-tailed threshold of P < .05 were retained for multivariable logistic regression analysis. Variables retaining P < .05 in multivariable modeling were considered statistically significant. Analyses were performed using SPSS software, Version 23 (SPSS Inc).
RESULTS
Baseline Characteristics
Between March 13, 2020, and May 1, 2020, a total of 350 patients admitted from the emergency department to a non-ICU inpatient bed had a final hospital disposition. Baseline characteristics, medication treatments, and continuous monitoring utilization are shown in Table 1 and Table 2. The average age was 64 ± 16 years, more than half of patients were male (n = 194; 55%), and most patients had at least one underlying comorbidity (n = 297; 85%), the most common being hypertension (n = 230; 66%), diabetes mellitus (n = 113; 32%), and current or prior tobacco use (n = 99; 28%). The presenting syndrome most frequently included subjective fever (n = 191; 55%), cough (n = 191; 55%), or dyspnea (n = 180; 51%).

Continuous Monitoring Use
Continuous monitoring was used in most patients (n = 289; 83%), including telemetry with intermittent pulse oximetry (n = 197; 56%), telemetry with continuous pulse oximetry (n = 81; 23%), or continuous pulse oximetry alone (n = 11; 3%). Among telemetry-monitored patients (n = 278; 79%), the most frequent indication was for a noncardiac disease state (n = 187; 67%), while indications for known cardiac arrhythmia (n = 74; 27%), heart failure (n = 10; 4%), or coronary artery disease (n = 7; 2%) were less common.

Oxygen Requirements and Cardiac Arrhythmias
The maximum level of respiratory support required by each patient is shown in Appendix Figure 1A. A total of 256 patients (73%) required 3 L/min or less of supplemental oxygen by nasal cannula, 45 (13%) required more than 3 L/min of supplemental oxygen by nasal cannula, 19 (5%) required HFNC, 8 (2%) required NIV, and 22 patients (6%) required mechanical ventilation. Among patients requiring HFNC or NIV, there were 13 (48%) who remained in a non-ICU bed, while the remaining 14 patients (52%) were transferred to the ICU.
Cardiac arrhythmias were detected in 39 (14%) of the 278 telemetry-monitored patients (Appendix Figure 1B). Clinical arrhythmias consisted of supraventricular tachycardia (SVT) in 17 patients (6%), nonsustained monomorphic ventricular tachycardia (VT) in 15 patients (5%), and a prolonged pause or severe bradyarrhythmia in 12 patients (4%). There were no cases of sustained monomorphic VT, polymorphic VT (including torsades de pointes), or ventricular fibrillation. All supraventricular tachycardias, nonsustained monomorphic VTs, and bradyarrhythmias/pauses were managed medically in the non-ICU setting, with the exception of one patient who was transferred to the ICU for a primary indication of atrial fibrillation with rapid ventricular response, which was treated with amiodarone. No patient with supraventricular tachycardia required emergent cardioversion, and no patient with a bradyarrhythmia or pause required temporary or permanent pacemaker implantation.
The detection of any arrhythmia was more common in patients with a history of cardiac arrhythmia (n = 18/41 vs 21/237; 44% vs 9%; P < .001), congestive heart failure (n = 11/36 vs 28/242; 31% vs 12%; P = .002), coronary artery disease (n = 12/49 vs 27/229; 24% vs 12%; P = .02), hypertension (n = 33/190 vs 6/88; 17% vs 7%; P = .02), and an abnormal admission troponin level (n = 13/40 vs 19/142; 33% vs 13%; P = .005). Notably, of the 39 patients with cardiac arrhythmias, 35 (90%) had either an abnormal admission troponin level or a history of cardiac arrhythmia, congestive heart failure, coronary artery disease, or hypertension. Of the 17 patients with SVT episodes, 13 (76%) had a known history of atrial fibrillation. Among patients who had a cardiac arrhythmia vs those who did not, there were no differences in levels of C-reactive protein (CRP; 7.3 ± 6.2 mg/dL vs. 7.8 ± 6.8 mg/dL, P = .63) or lactate dehydrogenase (LDH; 281 ± 89 U/L vs. 318 ± 142 U/L; P = .17). Approximately half of patients were treated with hydroxychloroquine (n = 185; 53%) or azithromycin (n = 182; 52%); 41% were treated with both (n = 142), with no observed association between any arrhythmia type and treatment with one or both medications (P > .05 for all comparisons).
Discharge Disposition and Adverse Outcomes
After an average length of stay of 6.1 ± 5.9 days, final hospital disposition included discharge to home (n = 278; 79%), discharge to subacute facility (n = 40; 11%), discharge to hospice (n = 8; 2%), death (n = 22, 6%), or release against medical advice (n = 2; 1%) (Figure). The primary composite outcome occurred in 62 patients (18%), including 22 deaths (6%), 48 ICU transfers (14%), and 49 patients with increased oxygen requirements (14%). Only two deaths occurred in the absence of an increased oxygen requirement or ICU transfer.

Increased oxygen requirement was the indication for ICU transfer in 37 of 48 patients (77%), with 22 patients (46%) requiring mechanical ventilation. Of the 48 patients requiring ICU transfer, 14 (29%) died, including 10 of the 22 patients (45%) treated with mechanical ventilation. Of the 302 patients who remained in the non-ICU setting, 8 (3%) died and 8 (3%) were discharged to hospice.
In univariable analyses, the primary composite outcome was more common among older patients (event vs event free, 72 ± 13 years vs 63 ± 16 years; P < .001); it was also more common in patients with congestive heart failure (n = 14/62 vs 28/288; 23% vs 10%; P = .005), chronic obstructive pulmonary disease (n = 9/62 vs 19/288; 15% vs 7%; P = .04), lower body mass index (29 ± 5 kg/m2 vs 31 ± 7 kg/m2; P = .006), lower peripheral oxygen saturation on room air (93% ± 5% vs 95% ± 3%; P = .005), higher CRP level (12.0 ± 7.8 mg/dL vs 6.9 ± 6.1 mg/dL; P < .001), higher LDH level (358 ± 140 U/L vs 302 ± 133 U/L; P = .009), higher troponin level (0.05 ± 0.13 ng/dL vs 0.02 ± 0.06 ng/dL; P = .01), abnormal D-dimer level (n = 39/42 vs 102/145; 93% vs 70%; P = .003), and abnormal chest x-ray findings (n = 48/62 vs 166/285; 77% vs 58%; P = .005) (Table 1 and Table 2). After multivariable adjustment, CRP level (odds ratio [OR], 1.09 per 1 mg/dL increase; 95% CI, 1.01-1.18; P = .04) and LDH level (OR, 1.006 per 1 U/L increase; 95% CI, 1.001-1.012; P = .03) remained significantly associated with the composite adverse outcome (Table 3). The rate of death, ICU transfer, or increased oxygen requirement was sixfold higher in patients with a CRP level in the fourth quartile (≥11.0 mg/dL) than it was among those in the first quartile (≤ 2.6 mg/dL) (P < .001 for trend), and it was fivefold higher in patients with an LDH level in the fourth quartile (≥ 354 U/L) than it was among those in the first quartile (≤ 232 U/L) (P = .001 for trend) (Appendix Figure 2). No patient with a CRP level in the reference range (≤ 0.9 mg/dL) experienced the composite adverse event, compared to three patients (n = 3/49, 6.1%) within the reference range for LDH level (≤ 225 U/L), all of whom had an elevated CRP.

DISCUSSION
In this study of 350 patients initially admitted to a non-ICU hospital bed within a large, nonepicenter healthcare system, the primary outcome of death, ICU transfer, or increased oxygen requirement occurred in 18% of patients and was independently associated with higher admission CRP and LDH levels on multivariable analysis. Most patients (73%) required 3 L/min or less of supplemental oxygen, while 14% of patients required escalation to HFNC, NIV, or mechanical ventilation. Despite frequent telemetry use (79%), cardiac arrhythmias were uncommon (14%), including no life-threatening ventricular arrhythmias. Clinical deterioration requiring ICU transfer occurred in 14% of patients, most often for an indication of increased oxygen requirement (77%). In-hospital mortality was 6% for the entire cohort, 29% for patients requiring ICU transfer, and 3% for patients who remained in the non-ICU setting.
Nonepicenter, Non-ICU Mortality
This study offers an assessment of clinical outcomes in patients with COVID-19 hospitalized in a non-ICU, nonepicenter healthcare system operating below capacity. Although such systems account for most institutions caring for patients with COVID-19, this population has been underrepresented in the literature, which has focused on epicenter hospitals and critically ill patients.3-7 Existing epicenter estimates of in-hospital mortality for patients not requiring ICU-level care range from 6% in Northern California2 to at least 10% in New York, New York,3 and 11% in Wuhan, China.4 The corresponding non-ICU in-hospital mortality in our study was only 3%, supporting the vital role of social distancing in reducing COVID-19 mortality by facilitating care delivery in a non–resource limited hospital setting.
Oxygen Requirements and Cardiac Arrhythmias in Non-ICU Patients
Beyond nonepicenter mortality estimates, this study is the first to provide a detailed characterization of the clinical course and resource usage among patients with COVID-19 admitted to the non-ICU setting. Given the predicted persistence of SARS-CoV-2 spread,11-13 this information is crucial to healthcare systems that must anticipate resource requirements, such as respiratory support and continuous monitoring equipment, for the care of hospitalized patients with COVID-19. Such informed planning takes on even greater importance as prepandemic hospital services resume.
While most patients (73%) with COVID-19 admitted to a non-ICU bed required peak supplemental oxygen of 3 L/min or less, a relevant proportion (14%) developed a need for HFNC, NIV, or mechanical ventilation. Furthermore, among telemetry-monitored patients (79%), cardiac arrhythmias were uncommon (14%), and nearly all (90%) occurred in patients with either a positive troponin or known history of cardiac disease. There were no life-threatening ventricular arrhythmias associated with frequent use of hydroxychloroquine (53%) and azithromycin (52%).
These telemetry findings expand upon a smaller study of non-ICU patients receiving either hydroxychloroquine or azithromycin, in which no life-threatening ventricular tachyarrhythmias were detected.8 A separate study reported a 5.9% incidence of malignant ventricular tachyarrhythmias in hospitalized patients with COVID-19,10 but this study did not stratify arrhythmias by illness severity, and a high frequency of critical illness is suggested by the mechanical ventilation rate of 24%, thereby limiting comparison with our non-ICU telemetry findings.
CRP and LDH Levels as Predictors of Adverse Outcomes
This study supports the utility of obtaining CRP and LDH levels for risk stratification at the time of non-ICU hospital admission. In multivariable analysis, higher CRP and LDH levels were significantly associated with the composite adverse outcome. The adverse event rates was increased sixfold between patients with a CRP in the fourth quartile (≥ 11.0 mg/dL, 36%) and those in the first quartile (≤ 2.6 mg/dL, 5.3%), and it was fivefold higher in patients with an LDH level in the fourth quartile (≥ 354 U/L, 34%) compared with those in the first quartile (≤ 232 U/L, 7%).
These findings are consistent with prior studies that have associated elevated inflammatory markers with poor prognosis and death.7,9,16 In some cases, COVID-19 may manifest similar to a cytokine storm syndrome, which highlights the importance of inflammation-associated tissue injury and leads to widespread interest in the use of immunosuppressive medications.17,18 Several studies also have demonstrated an association between LDH level and severe illness,4,7,19 although this is the first to specifically demonstrate its association with clinical decompensation in the non-ICU hospitalized population. Given that SARS-CoV-2 can infect multiple organs,20,21 there is biological plausibility for the use of LDH levels as a nonspecific marker of tissue injury for early identification of more severe infection.
Notably, while elevated troponin levels have been strongly associated with the need for mechanical ventilation and with death, this has primarily been established using either high-sensitivity troponin assays at the time of admission22 or using peak conventional troponin levels during hospitalization.10 In this study, while abnormal conventional troponin levels at the time of non-ICU admission were not significantly associated with the primary outcome in multivariable analysis, absolute troponin values were significantly higher in univariable analysis. Incomplete troponin sampling and the lack of routine high-sensitivity troponin assay use may explain the lack of more robust troponin significance in this study.
Implications for Non-ICU Continuous Monitoring Resource Allocation
Prioritization of non-ICU continuous monitoring resources among patients with COVID-19 has numerous benefits, including reduced consumption of personal protective equipment, fewer healthcare worker exposures, and adequate availability of continuous monitoring for the expansion of prepandemic hospital services. While individualized clinical discretion is still required, the results of this study can be used as a guide for the allocation of continuous pulse oximetry and cardiac telemetry. Patients with a normal presenting CRP level and/or LDH level had a low incidence of clinical decompensation, which suggests that such patients could be monitored with intermittent rather than continuous pulse oximetry. Furthermore, cardiac telemetry could be reserved for patients with a history of cardiac comorbidities or abnormal troponin levels because such patients accounted for 90% of cardiac arrhythmias in this study.
Limitations
This study was limited to a single health system, and it lacks a direct comparison to nonhospitalized patients and those directly admitted to the ICU. Triage practices and thresholds for hospitalization may differ across institutions and regions, thereby limiting the generalizability of our study. Additional limitations include the lack of selected admission laboratories for all patients, as well as the lack of telemetry monitoring in all patients. However, any resulting selection bias may be more likely to attenuate the magnitude of observed effects given that additional testing and increased telemetry use may be expected in patients who are felt to be higher risk by routine clinical assessment.
CONCLUSION
In this study of non–critically ill patients hospitalized within a nonepicenter health system, the development of more severe illness or death was significantly associated with higher levels of CRP and LDH on admission. Clinical decompensation was driven largely by respiratory complications, while cardiac arrhythmias were rare. Overall, the non-ICU mortality rate was at least half of that reported in epicenter regions. Altogether, these findings provide valuable information for resource allocation planning while nonepicenter health systems continue caring for patients with COVID-19 as they also resume prepandemic operations.
1. Bialek S, Boundy E, Bowen V, et al; CDC COVID-19 Response Team. Severe outcomes among patients with coronavirus disease 2019 (COVID-19) - United States, February 12–March 16, 2020. MMWR Morb Mortal Wkly Rep. 2020;69(12):343-346. https://doi.org/10.15585/mmwr.mm6912e2
2. Myers LC, Parodi SM, Escobar GJ, Liu VX. Characteristics of hospitalized adults with COVID-19 in an integrated health care system in California. JAMA. 2020;323(21):2195-2198. https://doi.org/10.1001/jama.2020.7202
3. Richardson S, Hirsch JS, Narasimhan M, et al. Presenting characteristics, comorbidities, and outcomes among 5700 patients hospitalized with COVID-19 in the New York City area. JAMA. Published online April 22, 2020. https://doi.org/10.1001/jama.2020.6775
4. Zhou F, Yu T, Du R, et al. Clinical course and risk factors for mortality of adult inpatients with COVID-19 in Wuhan, China: a retrospective cohort study. Lancet. 2020;395(10229):1054-1062. https://doi.org/10.1016/s0140-6736(20)30566-3
5. Arentz M, Yim E, Klaff L, et al. Characteristics and outcomes of 21 critically ill patients with COVID-19 in Washington state. JAMA. 2020;323(16):1612-1614. https://doi.org/10.1001/jama.2020.4326
6. Grasselli G, Zangrillo A, Zanella A, et al. Baseline characteristics and outcomes of 1591 patients infected with SARS-CoV-2 admitted to ICUs of the Lombardy region, Italy. JAMA. 2020;323(16):1574-1581. https://doi.org/10.1001/jama.2020.5394
7. Wang D, Hu B, Hu C, et al. Clinical Characteristics of 138 hospitalized patients with 2019 novel coronavirus-infected pneumonia in Wuhan, China. JAMA. 2020;323(11):1061-1069. https://doi.org/10.1001/jama.2020.1585
8. Chang D, Saleh M, Gabriels J, et al. Inpatient use of ambulatory telemetry monitors for COVID-19 patients treated with hydroxychloroquine and/or azithromycin. J Am Coll Cardiol. 2020;75(23):2992-2993. https://doi.org/10.1016/j.jacc.2020.04.032
9. Huang C, Wang Y, Li X, et al. Clinical features of patients infected with 2019 novel coronavirus in Wuhan, China. Lancet. 2020;395(10223):497-506. https://doi.org/10.1016/s0140-6736(20)30183-5
10. Guo T, Fan Y, Chen M, et al. Cardiovascular implications of fatal outcomes of patients with coronavirus disease 2019 (COVID-19). JAMA Cardiol. 2020;5(7):1-8. https://doi.org/10.1001/jamacardio.2020.1017
11. Centers for Disease Control and Prevention COVID-19 Forecasts. Accessed May 19, 2020. https://www.cdc.gov/coronavirus/2019-ncov/covid-data/forecasting-us.html
12. Kissler SM, Tedijanto C, Goldstein E, Grad YH, Lipsitch M. Projecting the transmission dynamics of SARS-CoV-2 through the postpandemic period. Science. 2020;368(6493):860-868. https://doi.org/10.1126/science.abb5793
13. Baker RE, Yang W, Vecchi GA, Metcalf CJE, Grenfell BT. Susceptible supply limits the role of climate in the early SARS-CoV-2 pandemic. Science. 2020;369(6501):315-319. https://doi.org/10.1126/science.abc2535
14. Cantillon DJ, Loy M, Burkle A, et al. Association between off-site central monitoring using standardized cardiac telemetry and clinical outcomes among non-critically ill patients. JAMA. 2016;316(5):519-524. https://doi.org/10.1001/jama.2016.10258
15. Alhazzani W, Møller MH, Arabi YM, et al. Surviving Sepsis Campaign: guidelines on the management of critically ill adults with coronavirus disease 2019 (COVID-19). Crit Care Med. 2020;48(6):e440-e469. https://doi.org/10.1097/ccm.0000000000004363
16. Guan WJ, Ni ZY, Hu Y, et al. Clinical characteristics of coronavirus disease 2019 in China. N Engl J Med. 2020;382(18):1708-1720. https://doi.org/10.1056/nejmoa2002032
17. Mehta P, McAuley DF, Brown M, et al; HLH Across Speciality Collaboration, UK. COVID-19: consider cytokine storm syndromes and immunosuppression. Lancet. 2020;395(10229):1033-1034. https://doi.org/10.1016/s0140-6736(20)30628-0
18. Sanders JM, Monogue ML, Jodlowski TZ, Cutrell JB. Pharmacologic treatments for coronavirus disease 2019 (COVID-19): a review. JAMA. Published online April 13, 2020. https://doi.org/10.1001/jama.2020.6019
19. Liang W, Liang H, Ou L, et al. Development and validation of a clinical risk score to predict the occurrence of critical illness in hospitalized patients with COVID-19. JAMA Intern Med. 2020;180(8):1-9. https://doi.org/10.1001/jamainternmed.2020.2033
20. Puelles VG, Lütgehetmann M, Lindenmeyer MT, et al. Multiorgan and renal tropism of SARS-CoV-2. N Engl J Med. 2020;383(6):590-592. https://doi.org/10.1056/nejmc2011400
21. Zhou J, Li C, Liu X, et al. Infection of bat and human intestinal organoids by SARS-CoV-2. Nat Med. 2020;26(7):1077-1083. https://doi.org/10.1038/s41591-020-0912-6
22. Shi S, Qin M, Shen B, et al. Association of cardiac injury with mortality in hospitalized patients with COVID-19 in Wuhan, China. JAMA Cardiol. 2020;5(7):802-810. https://doi.org/10.1001/jamacardio.2020.0950
Severe acute respiratory syndrome coronavirus 2 (SARS-CoV-2), the cause of coronavirus disease 2019 (COVID-19), is associated with a wide range of illness severity and community prevalence, with an estimated 20% to 30% of patients requiring hospitalization.1,2 Outcome studies of hospitalized patients to date have focused on epicenter healthcare systems operating at surge-level bed capacity in resource-limited settings with mortality exceeding 20% among patients with a discharge disposition3,4 and have had a publication bias toward those suffering critical illness.5-7 Generalizability of these results to nonepicenter hospital systems is unclear given potential differences in triage practices and resource availability according to disease prevalence, with nonepicenter systems that are operating below capacity potentially able to accommodate the needs of most, if not all patients, requiring inpatient level care. Clinical outcomes associated with non–critically ill patients in nonepicenter regions remain poorly characterized yet highly relevant because these will ultimately apply to most US and global healthcare environments.
Nonepicenter healthcare systems must anticipate disease requirements for noncritically ill patients hospitalized with COVID-19 in order to appropriately allocate resources, including monitoring services like continuous pulse oximetry and cardiac telemetry. Data regarding the incidence of in-hospital respiratory and cardiovascular complications, including arrhythmias, among non–intensive care unit (non-ICU) hospitalized patients with COVID-19 are limited, with little granularity in terms of associated variables.7-11 Further data are needed to guide prioritization of valuable non-ICU continuous monitoring resources to the highest-risk patients in order to minimize consumption of personal protective equipment, reduce healthcare worker exposure, and ensure adequate availability for the expansion of prepandemic services.
Projections indicate that COVID-19 incidence may persist in the coming months.11-13 As nonessential hospital operations simultaneously resume, planning for resource allocation for patients with COVID-19 must be incorporated into broader systems of care. Further data are needed to help hospitals anticipate resource needs during this transition, especially by most systems that are caring for COVID-19 patients in nonepicenter environments. Therefore, we conducted a retrospective study of a large, multihospital, nonepicenter health system equipped with centralized continuous monitoring services in order to describe the detailed clinical course, resource utilization, and risk factors for adverse events in patients with COVID-19 initially admitted to the non-ICU setting.
METHODS
Central Monitoring Unit
The central monitoring unit (CMU) provides standardized and continuous off-site secondary monitoring of cardiac telemetry and pulse oximetry for non-ICU patients within Cleveland Clinic hospitals (Ohio, Florida), with direct communication to bedside nursing and inpatient emergency response teams for clinically significant cardiac arrhythmias, respiratory events, and vital sign changes according to standardized indications, as previously reported.14 Clinical variables of interest, including electrocardiographic and vital sign data, are collected and periodically analyzed within a central registry for quality assurance, risk stratification, and resource allocation. The data registry carries Institutional Review Board approval for retrospective analysis and deidentified outcomes reporting with consent form waiver.
Study Design and Data Collection
All patients positive for SARS-CoV-2 infection by nasopharyngeal polymerase chain reaction assay (Applied Biosystems) admitted from the emergency department to a non-ICU bed at a CMU hospital on or after March 13, 2020, and subsequently discharged on or before May 1, 2020, were identified. Retrospective review of the electronic medical record was performed, with follow-up continued through hospital discharge. Data were collected on patient demographics, clinical characteristics including admission laboratories and chest x-ray findings (abnormal defined as presence of an infiltrate/opacity consistent with airspace disease), continuous monitoring utilization, respiratory support, medication treatment, ICU transfer, and final hospital disposition. In addition, prospective recordings of cardiac arrhythmias that prompted CMU notification of bedside nursing were reviewed.
The primary outcome was a composite of death, ICU transfer, or increased oxygen requirement defined as escalation from simple nasal cannula to either high-flow nasal cannula (HFNC), noninvasive ventilation (NIV) consisting of continuous positive airway pressure (CPAP) or bilevel positive airway pressure (BiPAP), or mechanical ventilation. In accordance with published guidelines, patients were treated with supplemental oxygen to maintain peripheral oxygen saturation between 92% and 96%.15
Of note, based on the validated performance of high sensitivity troponin primarily for the diagnosis of acute myocardial infarction in patients presenting to the emergency department with chest pain, our system reserves its use for this context and prefers conventional (fourth generation) troponin T testing for inpatients. Therefore, conventional troponin T values are reported in this study.
Statistical Analyses
Continuous variables are expressed as mean ± standard deviation or median (interquartile range), and categorical variables are expressed as absolute numbers with percentages. Independent samples t and Mann-Whitney U tests were used to compare continuous variables, as appropriate, and chi-square testing was used to compare categorical variables. Clinical variables satisfying an a priori two-tailed threshold of P < .05 were retained for multivariable logistic regression analysis. Variables retaining P < .05 in multivariable modeling were considered statistically significant. Analyses were performed using SPSS software, Version 23 (SPSS Inc).
RESULTS
Baseline Characteristics
Between March 13, 2020, and May 1, 2020, a total of 350 patients admitted from the emergency department to a non-ICU inpatient bed had a final hospital disposition. Baseline characteristics, medication treatments, and continuous monitoring utilization are shown in Table 1 and Table 2. The average age was 64 ± 16 years, more than half of patients were male (n = 194; 55%), and most patients had at least one underlying comorbidity (n = 297; 85%), the most common being hypertension (n = 230; 66%), diabetes mellitus (n = 113; 32%), and current or prior tobacco use (n = 99; 28%). The presenting syndrome most frequently included subjective fever (n = 191; 55%), cough (n = 191; 55%), or dyspnea (n = 180; 51%).
Continuous Monitoring Use
Continuous monitoring was used in most patients (n = 289; 83%), including telemetry with intermittent pulse oximetry (n = 197; 56%), telemetry with continuous pulse oximetry (n = 81; 23%), or continuous pulse oximetry alone (n = 11; 3%). Among telemetry-monitored patients (n = 278; 79%), the most frequent indication was for a noncardiac disease state (n = 187; 67%), while indications for known cardiac arrhythmia (n = 74; 27%), heart failure (n = 10; 4%), or coronary artery disease (n = 7; 2%) were less common.
Oxygen Requirements and Cardiac Arrhythmias
The maximum level of respiratory support required by each patient is shown in Appendix Figure 1A. A total of 256 patients (73%) required 3 L/min or less of supplemental oxygen by nasal cannula, 45 (13%) required more than 3 L/min of supplemental oxygen by nasal cannula, 19 (5%) required HFNC, 8 (2%) required NIV, and 22 patients (6%) required mechanical ventilation. Among patients requiring HFNC or NIV, there were 13 (48%) who remained in a non-ICU bed, while the remaining 14 patients (52%) were transferred to the ICU.
Cardiac arrhythmias were detected in 39 (14%) of the 278 telemetry-monitored patients (Appendix Figure 1B). Clinical arrhythmias consisted of supraventricular tachycardia (SVT) in 17 patients (6%), nonsustained monomorphic ventricular tachycardia (VT) in 15 patients (5%), and a prolonged pause or severe bradyarrhythmia in 12 patients (4%). There were no cases of sustained monomorphic VT, polymorphic VT (including torsades de pointes), or ventricular fibrillation. All supraventricular tachycardias, nonsustained monomorphic VTs, and bradyarrhythmias/pauses were managed medically in the non-ICU setting, with the exception of one patient who was transferred to the ICU for a primary indication of atrial fibrillation with rapid ventricular response, which was treated with amiodarone. No patient with supraventricular tachycardia required emergent cardioversion, and no patient with a bradyarrhythmia or pause required temporary or permanent pacemaker implantation.
The detection of any arrhythmia was more common in patients with a history of cardiac arrhythmia (n = 18/41 vs 21/237; 44% vs 9%; P < .001), congestive heart failure (n = 11/36 vs 28/242; 31% vs 12%; P = .002), coronary artery disease (n = 12/49 vs 27/229; 24% vs 12%; P = .02), hypertension (n = 33/190 vs 6/88; 17% vs 7%; P = .02), and an abnormal admission troponin level (n = 13/40 vs 19/142; 33% vs 13%; P = .005). Notably, of the 39 patients with cardiac arrhythmias, 35 (90%) had either an abnormal admission troponin level or a history of cardiac arrhythmia, congestive heart failure, coronary artery disease, or hypertension. Of the 17 patients with SVT episodes, 13 (76%) had a known history of atrial fibrillation. Among patients who had a cardiac arrhythmia vs those who did not, there were no differences in levels of C-reactive protein (CRP; 7.3 ± 6.2 mg/dL vs. 7.8 ± 6.8 mg/dL, P = .63) or lactate dehydrogenase (LDH; 281 ± 89 U/L vs. 318 ± 142 U/L; P = .17). Approximately half of patients were treated with hydroxychloroquine (n = 185; 53%) or azithromycin (n = 182; 52%); 41% were treated with both (n = 142), with no observed association between any arrhythmia type and treatment with one or both medications (P > .05 for all comparisons).
Discharge Disposition and Adverse Outcomes
After an average length of stay of 6.1 ± 5.9 days, final hospital disposition included discharge to home (n = 278; 79%), discharge to subacute facility (n = 40; 11%), discharge to hospice (n = 8; 2%), death (n = 22, 6%), or release against medical advice (n = 2; 1%) (Figure). The primary composite outcome occurred in 62 patients (18%), including 22 deaths (6%), 48 ICU transfers (14%), and 49 patients with increased oxygen requirements (14%). Only two deaths occurred in the absence of an increased oxygen requirement or ICU transfer.
Increased oxygen requirement was the indication for ICU transfer in 37 of 48 patients (77%), with 22 patients (46%) requiring mechanical ventilation. Of the 48 patients requiring ICU transfer, 14 (29%) died, including 10 of the 22 patients (45%) treated with mechanical ventilation. Of the 302 patients who remained in the non-ICU setting, 8 (3%) died and 8 (3%) were discharged to hospice.
In univariable analyses, the primary composite outcome was more common among older patients (event vs event free, 72 ± 13 years vs 63 ± 16 years; P < .001); it was also more common in patients with congestive heart failure (n = 14/62 vs 28/288; 23% vs 10%; P = .005), chronic obstructive pulmonary disease (n = 9/62 vs 19/288; 15% vs 7%; P = .04), lower body mass index (29 ± 5 kg/m2 vs 31 ± 7 kg/m2; P = .006), lower peripheral oxygen saturation on room air (93% ± 5% vs 95% ± 3%; P = .005), higher CRP level (12.0 ± 7.8 mg/dL vs 6.9 ± 6.1 mg/dL; P < .001), higher LDH level (358 ± 140 U/L vs 302 ± 133 U/L; P = .009), higher troponin level (0.05 ± 0.13 ng/dL vs 0.02 ± 0.06 ng/dL; P = .01), abnormal D-dimer level (n = 39/42 vs 102/145; 93% vs 70%; P = .003), and abnormal chest x-ray findings (n = 48/62 vs 166/285; 77% vs 58%; P = .005) (Table 1 and Table 2). After multivariable adjustment, CRP level (odds ratio [OR], 1.09 per 1 mg/dL increase; 95% CI, 1.01-1.18; P = .04) and LDH level (OR, 1.006 per 1 U/L increase; 95% CI, 1.001-1.012; P = .03) remained significantly associated with the composite adverse outcome (Table 3). The rate of death, ICU transfer, or increased oxygen requirement was sixfold higher in patients with a CRP level in the fourth quartile (≥11.0 mg/dL) than it was among those in the first quartile (≤ 2.6 mg/dL) (P < .001 for trend), and it was fivefold higher in patients with an LDH level in the fourth quartile (≥ 354 U/L) than it was among those in the first quartile (≤ 232 U/L) (P = .001 for trend) (Appendix Figure 2). No patient with a CRP level in the reference range (≤ 0.9 mg/dL) experienced the composite adverse event, compared to three patients (n = 3/49, 6.1%) within the reference range for LDH level (≤ 225 U/L), all of whom had an elevated CRP.
DISCUSSION
In this study of 350 patients initially admitted to a non-ICU hospital bed within a large, nonepicenter healthcare system, the primary outcome of death, ICU transfer, or increased oxygen requirement occurred in 18% of patients and was independently associated with higher admission CRP and LDH levels on multivariable analysis. Most patients (73%) required 3 L/min or less of supplemental oxygen, while 14% of patients required escalation to HFNC, NIV, or mechanical ventilation. Despite frequent telemetry use (79%), cardiac arrhythmias were uncommon (14%), including no life-threatening ventricular arrhythmias. Clinical deterioration requiring ICU transfer occurred in 14% of patients, most often for an indication of increased oxygen requirement (77%). In-hospital mortality was 6% for the entire cohort, 29% for patients requiring ICU transfer, and 3% for patients who remained in the non-ICU setting.
Nonepicenter, Non-ICU Mortality
This study offers an assessment of clinical outcomes in patients with COVID-19 hospitalized in a non-ICU, nonepicenter healthcare system operating below capacity. Although such systems account for most institutions caring for patients with COVID-19, this population has been underrepresented in the literature, which has focused on epicenter hospitals and critically ill patients.3-7 Existing epicenter estimates of in-hospital mortality for patients not requiring ICU-level care range from 6% in Northern California2 to at least 10% in New York, New York,3 and 11% in Wuhan, China.4 The corresponding non-ICU in-hospital mortality in our study was only 3%, supporting the vital role of social distancing in reducing COVID-19 mortality by facilitating care delivery in a non–resource limited hospital setting.
Oxygen Requirements and Cardiac Arrhythmias in Non-ICU Patients
Beyond nonepicenter mortality estimates, this study is the first to provide a detailed characterization of the clinical course and resource usage among patients with COVID-19 admitted to the non-ICU setting. Given the predicted persistence of SARS-CoV-2 spread,11-13 this information is crucial to healthcare systems that must anticipate resource requirements, such as respiratory support and continuous monitoring equipment, for the care of hospitalized patients with COVID-19. Such informed planning takes on even greater importance as prepandemic hospital services resume.
While most patients (73%) with COVID-19 admitted to a non-ICU bed required peak supplemental oxygen of 3 L/min or less, a relevant proportion (14%) developed a need for HFNC, NIV, or mechanical ventilation. Furthermore, among telemetry-monitored patients (79%), cardiac arrhythmias were uncommon (14%), and nearly all (90%) occurred in patients with either a positive troponin or known history of cardiac disease. There were no life-threatening ventricular arrhythmias associated with frequent use of hydroxychloroquine (53%) and azithromycin (52%).
These telemetry findings expand upon a smaller study of non-ICU patients receiving either hydroxychloroquine or azithromycin, in which no life-threatening ventricular tachyarrhythmias were detected.8 A separate study reported a 5.9% incidence of malignant ventricular tachyarrhythmias in hospitalized patients with COVID-19,10 but this study did not stratify arrhythmias by illness severity, and a high frequency of critical illness is suggested by the mechanical ventilation rate of 24%, thereby limiting comparison with our non-ICU telemetry findings.
CRP and LDH Levels as Predictors of Adverse Outcomes
This study supports the utility of obtaining CRP and LDH levels for risk stratification at the time of non-ICU hospital admission. In multivariable analysis, higher CRP and LDH levels were significantly associated with the composite adverse outcome. The adverse event rates was increased sixfold between patients with a CRP in the fourth quartile (≥ 11.0 mg/dL, 36%) and those in the first quartile (≤ 2.6 mg/dL, 5.3%), and it was fivefold higher in patients with an LDH level in the fourth quartile (≥ 354 U/L, 34%) compared with those in the first quartile (≤ 232 U/L, 7%).
These findings are consistent with prior studies that have associated elevated inflammatory markers with poor prognosis and death.7,9,16 In some cases, COVID-19 may manifest similar to a cytokine storm syndrome, which highlights the importance of inflammation-associated tissue injury and leads to widespread interest in the use of immunosuppressive medications.17,18 Several studies also have demonstrated an association between LDH level and severe illness,4,7,19 although this is the first to specifically demonstrate its association with clinical decompensation in the non-ICU hospitalized population. Given that SARS-CoV-2 can infect multiple organs,20,21 there is biological plausibility for the use of LDH levels as a nonspecific marker of tissue injury for early identification of more severe infection.
Notably, while elevated troponin levels have been strongly associated with the need for mechanical ventilation and with death, this has primarily been established using either high-sensitivity troponin assays at the time of admission22 or using peak conventional troponin levels during hospitalization.10 In this study, while abnormal conventional troponin levels at the time of non-ICU admission were not significantly associated with the primary outcome in multivariable analysis, absolute troponin values were significantly higher in univariable analysis. Incomplete troponin sampling and the lack of routine high-sensitivity troponin assay use may explain the lack of more robust troponin significance in this study.
Implications for Non-ICU Continuous Monitoring Resource Allocation
Prioritization of non-ICU continuous monitoring resources among patients with COVID-19 has numerous benefits, including reduced consumption of personal protective equipment, fewer healthcare worker exposures, and adequate availability of continuous monitoring for the expansion of prepandemic hospital services. While individualized clinical discretion is still required, the results of this study can be used as a guide for the allocation of continuous pulse oximetry and cardiac telemetry. Patients with a normal presenting CRP level and/or LDH level had a low incidence of clinical decompensation, which suggests that such patients could be monitored with intermittent rather than continuous pulse oximetry. Furthermore, cardiac telemetry could be reserved for patients with a history of cardiac comorbidities or abnormal troponin levels because such patients accounted for 90% of cardiac arrhythmias in this study.
Limitations
This study was limited to a single health system, and it lacks a direct comparison to nonhospitalized patients and those directly admitted to the ICU. Triage practices and thresholds for hospitalization may differ across institutions and regions, thereby limiting the generalizability of our study. Additional limitations include the lack of selected admission laboratories for all patients, as well as the lack of telemetry monitoring in all patients. However, any resulting selection bias may be more likely to attenuate the magnitude of observed effects given that additional testing and increased telemetry use may be expected in patients who are felt to be higher risk by routine clinical assessment.
CONCLUSION
In this study of non–critically ill patients hospitalized within a nonepicenter health system, the development of more severe illness or death was significantly associated with higher levels of CRP and LDH on admission. Clinical decompensation was driven largely by respiratory complications, while cardiac arrhythmias were rare. Overall, the non-ICU mortality rate was at least half of that reported in epicenter regions. Altogether, these findings provide valuable information for resource allocation planning while nonepicenter health systems continue caring for patients with COVID-19 as they also resume prepandemic operations.
1. Bialek S, Boundy E, Bowen V, et al; CDC COVID-19 Response Team. Severe outcomes among patients with coronavirus disease 2019 (COVID-19) - United States, February 12–March 16, 2020. MMWR Morb Mortal Wkly Rep. 2020;69(12):343-346. https://doi.org/10.15585/mmwr.mm6912e2
2. Myers LC, Parodi SM, Escobar GJ, Liu VX. Characteristics of hospitalized adults with COVID-19 in an integrated health care system in California. JAMA. 2020;323(21):2195-2198. https://doi.org/10.1001/jama.2020.7202
3. Richardson S, Hirsch JS, Narasimhan M, et al. Presenting characteristics, comorbidities, and outcomes among 5700 patients hospitalized with COVID-19 in the New York City area. JAMA. Published online April 22, 2020. https://doi.org/10.1001/jama.2020.6775
4. Zhou F, Yu T, Du R, et al. Clinical course and risk factors for mortality of adult inpatients with COVID-19 in Wuhan, China: a retrospective cohort study. Lancet. 2020;395(10229):1054-1062. https://doi.org/10.1016/s0140-6736(20)30566-3
5. Arentz M, Yim E, Klaff L, et al. Characteristics and outcomes of 21 critically ill patients with COVID-19 in Washington state. JAMA. 2020;323(16):1612-1614. https://doi.org/10.1001/jama.2020.4326
6. Grasselli G, Zangrillo A, Zanella A, et al. Baseline characteristics and outcomes of 1591 patients infected with SARS-CoV-2 admitted to ICUs of the Lombardy region, Italy. JAMA. 2020;323(16):1574-1581. https://doi.org/10.1001/jama.2020.5394
7. Wang D, Hu B, Hu C, et al. Clinical Characteristics of 138 hospitalized patients with 2019 novel coronavirus-infected pneumonia in Wuhan, China. JAMA. 2020;323(11):1061-1069. https://doi.org/10.1001/jama.2020.1585
8. Chang D, Saleh M, Gabriels J, et al. Inpatient use of ambulatory telemetry monitors for COVID-19 patients treated with hydroxychloroquine and/or azithromycin. J Am Coll Cardiol. 2020;75(23):2992-2993. https://doi.org/10.1016/j.jacc.2020.04.032
9. Huang C, Wang Y, Li X, et al. Clinical features of patients infected with 2019 novel coronavirus in Wuhan, China. Lancet. 2020;395(10223):497-506. https://doi.org/10.1016/s0140-6736(20)30183-5
10. Guo T, Fan Y, Chen M, et al. Cardiovascular implications of fatal outcomes of patients with coronavirus disease 2019 (COVID-19). JAMA Cardiol. 2020;5(7):1-8. https://doi.org/10.1001/jamacardio.2020.1017
11. Centers for Disease Control and Prevention COVID-19 Forecasts. Accessed May 19, 2020. https://www.cdc.gov/coronavirus/2019-ncov/covid-data/forecasting-us.html
12. Kissler SM, Tedijanto C, Goldstein E, Grad YH, Lipsitch M. Projecting the transmission dynamics of SARS-CoV-2 through the postpandemic period. Science. 2020;368(6493):860-868. https://doi.org/10.1126/science.abb5793
13. Baker RE, Yang W, Vecchi GA, Metcalf CJE, Grenfell BT. Susceptible supply limits the role of climate in the early SARS-CoV-2 pandemic. Science. 2020;369(6501):315-319. https://doi.org/10.1126/science.abc2535
14. Cantillon DJ, Loy M, Burkle A, et al. Association between off-site central monitoring using standardized cardiac telemetry and clinical outcomes among non-critically ill patients. JAMA. 2016;316(5):519-524. https://doi.org/10.1001/jama.2016.10258
15. Alhazzani W, Møller MH, Arabi YM, et al. Surviving Sepsis Campaign: guidelines on the management of critically ill adults with coronavirus disease 2019 (COVID-19). Crit Care Med. 2020;48(6):e440-e469. https://doi.org/10.1097/ccm.0000000000004363
16. Guan WJ, Ni ZY, Hu Y, et al. Clinical characteristics of coronavirus disease 2019 in China. N Engl J Med. 2020;382(18):1708-1720. https://doi.org/10.1056/nejmoa2002032
17. Mehta P, McAuley DF, Brown M, et al; HLH Across Speciality Collaboration, UK. COVID-19: consider cytokine storm syndromes and immunosuppression. Lancet. 2020;395(10229):1033-1034. https://doi.org/10.1016/s0140-6736(20)30628-0
18. Sanders JM, Monogue ML, Jodlowski TZ, Cutrell JB. Pharmacologic treatments for coronavirus disease 2019 (COVID-19): a review. JAMA. Published online April 13, 2020. https://doi.org/10.1001/jama.2020.6019
19. Liang W, Liang H, Ou L, et al. Development and validation of a clinical risk score to predict the occurrence of critical illness in hospitalized patients with COVID-19. JAMA Intern Med. 2020;180(8):1-9. https://doi.org/10.1001/jamainternmed.2020.2033
20. Puelles VG, Lütgehetmann M, Lindenmeyer MT, et al. Multiorgan and renal tropism of SARS-CoV-2. N Engl J Med. 2020;383(6):590-592. https://doi.org/10.1056/nejmc2011400
21. Zhou J, Li C, Liu X, et al. Infection of bat and human intestinal organoids by SARS-CoV-2. Nat Med. 2020;26(7):1077-1083. https://doi.org/10.1038/s41591-020-0912-6
22. Shi S, Qin M, Shen B, et al. Association of cardiac injury with mortality in hospitalized patients with COVID-19 in Wuhan, China. JAMA Cardiol. 2020;5(7):802-810. https://doi.org/10.1001/jamacardio.2020.0950
© 2021 Society of Hospital Medicine
Financial Difficulties in Families of Hospitalized Children
Rising US healthcare costs coupled with high cost-sharing insurance plans have led to increased out-of-pocket healthcare expenditures, especially for those who are low income or in poorer health.1-7 Increased out-of-pocket expenditures can lead to “financial distress” (defined as the subjective level of stress felt toward one’s personal financial situation) and to “medical financial burden” (defined as the subjective assessment of financial problems relating specifically to medical costs). Financial distress and medical financial burden (defined together as “financial difficulty”) lead to impaired access and delayed presentation to care and treatment nonadherence in hopes of alleviating costs.8-12
Between 20% and 50% of families with children requiring frequent medical care report that their child’s healthcare has caused a financial difficulty.13,14 In addition to direct medical costs, these parents can also suffer from indirect costs of their child’s care, such as unemployment or missed work.15-17 Along with these families, families who are low income (generally defined as living below 200% of the Federal Poverty Level) also have higher absolute and relative out-of-pocket healthcare costs, and both groups are more likely to have unmet medical needs or to delay or forgo care.18-20 Medically complex children also represent an increasing percentage of patients admitted to children’s hospitals21,22 where their families may be more vulnerable to worsening financial difficulties caused by direct costs and income depletion—due to lost wages, transportation, and meals—associated with hospitalization.23
The hospitalized population can be readily screened and provided interventions. Although evidence on effective inpatient financial interventions is lacking, financial navigation programs piloted in the ambulatory setting that standardize financial screening and support trained financial navigators could prove a promising model for inpatient care.24-26 Therefore, understanding the prevalence of financial difficulties in this population and potential high-yield screening characteristics is critical in laying the groundwork for more robust in-hospital financial screening and support systems.
Our primary objective was to assess the prevalence of financial distress and medical financial burden in families of hospitalized children. Our secondary objective was to examine measurable factors during hospitalization that could identify families at risk for these financial difficulties to better understand how to target and implement hospital-based interventions.
METHODS
We conducted a cross-sectional survey at six university-affiliated children’s hospitals (Table 1). Each site’s institutional review board approved the study. All participants were verbally informed of the research goals of the study and provided with a research information document. Need for written informed consent was determined by each institutional review board.

Study enrollment occurred between October 2017 and November 2018, with individual sites having shorter active enrollment periods (ranging from 25 to 100 days) until sample size goals were met as explained below. Participants represented a convenience sample of parents or guardians (hereafter referred to only as “parents”), who were eligible for enrollment if their child was admitted to one of the six hospitals during the active enrollment period at that site. To avoid sampling bias, each site made an effort to enroll a consecutive sample of parents, but this was limited by resources and investigator availability. Parents were excluded if their child was admitted to a neonatal unit because of difficulty in complexity categorization and the confounding issue of mothers often being admitted simultaneously. There were no other unit-, diagnosis-, or service-based exclusions to participation. Parents were also excluded if their child was 18 years or older or if they themselves were younger than 18 years. Parents were approached once their child was identified for discharge from the hospital within 48 hours. Surveys were self-administered at the time of enrollment on provided electronic tablets. Participants at some sites were offered a $5 gift card as an incentive for survey completion.
The survey included a previously published financial distress scale (InCharge Financial Distress/Financial Wellbeing Scale [IFDFW])(Appendix).27 A question in addition to the IFDFW assessed whether families were currently experiencing financial burden from medical care28,29 and whether that burden was caused by their child (Appendix) because the IFDFW does not address the source of financial distress. The survey also included questions assessing perspectives on healthcare costs (data not presented here). The survey was refined through review by psychometric experts and members of the Family Advisory Council at the primary research site, which led to minor modifications. The final survey consisted of 40 items and was professionally translated into Spanish by a third-party company (Idem Translations). It was pilot tested by 10 parents of hospitalized children to assess for adequate comprehension and clarity; these parents were not included in the final data analysis.
Variables
The primary outcome variables were level of financial distress as defined by the IFDFW scale27 and the presence of medical financial burden. The IFDFW scale has eight questions answered on a scale of 1-10, and the final score is calculated by averaging these answers. The scale defines three categories of financial distress (high, 1-3.9; average, 4-6.9; low, 7-10); however, we dichotomized our outcome as high (<4) or not high (≥4). The outcome was analyzed as both continuous and dichotomous variables because small differences in continuous scores, if detected, may be less clinically relevant. Medical financial burden was categorized as child related, child unrelated, and none.

Our secondary aim was to identify predictors of financial distress and medical financial burden. The primary predictor variable of interest was the hospitalized child’s level of chronic disease (complex chronic disease, C-CD; noncomplex chronic disease, NC-CD; no chronic disease, no-CD) as categorized by the consensus definitions from the Center of Excellence on Quality of Care Measures for Children with Complex Needs (Appendix).30 We assigned level of chronic disease based on manual review of problem lists and diagnoses in the electronic health record (EHR) from up to 3 years prior. At sites with multiple researchers, the first five to ten charts were reviewed together to ensure consistency in categorization, but no formal assessment of interrater reliability was conducted. Other predictor variables are listed in Tables 2 and 3. Insurance payer was defined as “public” or “private” based on the documented insurance plan in the EHR. Patients with dual public and private insurance were categorized as public.

Statistical Analysis
We estimated sample size requirements using an expected mean IFDFW score with standard deviation of 5.7 ± 2 based on preliminary data from the primary study site and previously published data.27 We used a significance level of P = .05, power of 0.80, and an effect size of 0.5 points difference on the IFDFW scale between the families of children with C-CD and those with either NC-CD or no-CD. We assumed there would be unequal representation of chronic disease states, with an expectation that children with C-CD would make up approximately 40% of the total population.21,22,31 Under these assumptions, we calculated a desired total sample size of 519. This would also allow us to detect a 12% absolute difference in the rate of high financial distress between families with and without C-CD, assuming a baseline level of high financial distress of 30%.27 Our goal enrollment was 150 parents at the primary site and 75 parents at each of the other 5 sites.
We fit mixed effects logistic regression models to evaluate the odds of high financial distress and polytomous logistic regression models (for our three-level outcome) to evaluate the odds of having child-related medical financial burden vs having child-unrelated burden vs having no burden. We fit linear mixed effects models to evaluate the effect of chronic disease level and medical financial burden on mean IFDFW scores. Respondents who answered “I don’t know” to the medical financial burden question were aggregated with those who reported no medical financial burden. Models were fit as a function of chronic disease level, race, ethnicity, percentage of Federal Poverty Level (FPL), insurance payer, and having a deductible less than $1,000 per year. These models included a random intercept for facility. We also fit logistic regression models that used an interaction term between chronic disease level and percentage of FPL, as well as insurance payer and percentage of FPL, to explore potential effect modification between poverty and both chronic disease level and insurance payer on financial distress. For our models, we used the MICE package for multiple imputation to fill in missing data. We imputed 25 data sets with 25 iterations each and pooled model results using Rubin’s Rules.32 All analyses were performed in R 3.5.33
RESULTS
Of 644 parents who were invited to participate, 526 (82%) were enrolled. Participants and their hospitalized children were mostly White/Caucasian (69%) and not Hispanic/Latino (76%), with 34% of families living below 200% FPL and 274 (52%) having private insurance (Table 1). Of the hospitalized children, 225 (43%) were categorized as C-CD, 143 (27%) as NC-CD, and 157 (30%) as no-CD. All participants completed the IFDFW; however, there were five missing responses to the medical financial burden question. Table 1 lists missing demographic and financial difficulty data.
Financial Distress
The mean IFDFW score of all participants was 5.6 ± 2.1, with 125 having high financial distress (24%; 95% CI, 20-28) (Table 1). There was no difference in mean IFDFW scores among families of children with different chronic disease levels (Figure). On unadjusted and adjusted analyses, there was no association between level of chronic disease and high financial distress when C-CD and NC-CD groups were each compared with no-CD (Table 2). However, families living below 400% FPL (annual income of $100,400 for a family of four) were significantly more likely than families living at 400% FPL and above to have high financial distress. Families tended to have lower financial distress (as indicated by mean IFDFW scores) with increasing percentage of FPL; however, there were families in every FPL bracket who experienced high financial distress (Appendix Figure 1a). A secondary analysis of families below and those at or above 200% FPL did not find any significant interactions between percentage of FPL and either chronic disease level (P = .86) or insurance payer (P = .83) on financial distress.

Medical Financial Burden
Overall, 160 parents (30%; 95% CI, 27-35) reported having medical financial burden, with 86 of those parents (54%) indicating their financial burden was related to their child’s medical care (Table 1). Compared with families with no such medical financial burden, respondents with medical financial burden, either child related or child unrelated, had significantly lower mean IFDFW scores (Figure), which indicates overall higher financial distress in these families. However, some families with low financial distress also reported medical financial burden.
Adjusted analyses demonstrated that, compared with families of children with no-CD, families of children with C-CD (adjusted odds ratio [AOR], 4.98; 95% CI, 2.41-10.29) or NC-CD (AOR, 2.57; 95% CI, 1.11-5.93) had significantly higher odds of having child-related medical financial burden (Table 3). Families of children with NC-CD were also more likely than families of children with no-CD to have child-unrelated medical burden (Table 3). Percentage of FPL was the only other significant predictor of child-related and child-unrelated medical financial burden (Table 3), but as with the distribution of financial distress, medical financial burden was seen across family income brackets (Appendix Figure 1b).
DISCUSSION
In this multicenter study of parents of hospitalized children, almost one in four families experienced high financial distress and almost one in three families reported having medical financial burden, with both measures of financial difficulty affecting families across all income levels. While these percentages are not substantially higher than those seen in the general population,27,34 70% of our population was composed of children with chronic disease who are more likely to have short-term and long-term healthcare needs, which places them at risk for significant ongoing medical costs.
We hypothesized that families of children with complex chronic disease would have higher levels of financial difficulties,13,35,36 but we found that level of chronic disease was associated only with medical financial burden and not with high financial distress. Financial distress is likely multifactorial and dynamic, with different drivers across various income levels. Therefore, while medical financial burden likely contributes to high financial distress, there may be other contributing factors not captured by the IFDFW. However, subjective medical financial burden has still been associated with impaired access to care.10,34 Therefore, our results suggest that families of children with chronic diseases might be at higher risk for barriers to consistent healthcare because of the financial burden their frequent healthcare utilization incurs.
Household poverty level was also associated with financial distress and medical financial burden, although surprisingly both measures of financial difficulty were present in all FPL brackets. This highlights an important reality that financial vulnerability extends beyond income and federally defined “poverty.” Non-income factors, such as high local costs of living and the growing problem of underinsurance, may significantly contribute to financial difficulty, which may render static financial metrics such as percentage of FPL insufficient screeners. Furthermore, as evidenced by the nearly 10% of our respondents who declined to provide their income information, this is a sensitive topic for some families, so gathering income data during admission could likely be a nonstarter.
In the absence of other consistent predictors of financial difficulty that could trigger interventions such as an automatic financial counselor consult, hospitals and healthcare providers could consider implementing routine non-income based financial screening questions on admission, such as one assessing medical financial burden, as a nondiscriminatory way of identifying at-risk families and provide further education and assistance regarding their financial needs. Systematically gathering this data may also further demonstrate the need for broad financial navigation programs as a mainstay in comprehensive inpatient care.
We acknowledge several limitations of this study. Primarily, we surveyed families prior to discharge and receipt of hospitalization-related bills, and these bills could contribute significantly to financial difficulties. While the families of children with chronic disease, who likely have recurrent medical bills, did not demonstrate higher financial distress, it is possible that the overall rate of financial difficulties would have been higher had we surveyed families several weeks after discharge. Our measures of financial difficulty were also subjective and, therefore, at risk for response biases (such as recall bias) that could have misestimated the prevalence of these problems in our population. However, published literature on the IFDFW scale demonstrates concordance between the subjective score and tangible outcomes of financial distress (eg, contacting a credit agency). The IFDFW scale was validated in the general population, and although it has been used in studies of medical populations,37-41 none have been in hospitalized populations, which may affect the scale’s applicability in our study. The study was also conducted only at university-affiliated children’s hospitals, and although these hospitals are geographically diverse, most children in the United States are admitted to general or community hospitals.31 Our population was also largely White, non-Hispanic/Latino, and English speaking. Therefore, our sample may not reflect the general population of hospitalized children and their families. We also assigned levels of chronic disease based on manual EHR review. While the EHR should capture each patient’s breadth of medical issues, inaccurate or missing documentation could have led to misclassification of complexity in some cases. Additionally, our sample size was calculated to detect fairly large differences in our primary outcome, and some of our unexpected results may have resulted from this study being underpowered for detection of smaller, but perhaps still clinically relevant, differences. Finally, we do not have data for several possible confounders in our study, such as employment status, health insurance concordance among family members, or sources of supplemental income, that may impact a family’s overall financial health, along with some potential important hospital-based screening characteristics, such as admitting service team or primary diagnosis.
CONCLUSION
Financial difficulties are common in families of hospitalized pediatric patients. Low-income families and those who have children with chronic conditions are at particular risk; however, all subsets of families can be affected. Given the potential negative health outcomes financial difficulties impose on families and children, the ability to identify and support vulnerable families is a crucial component of care. Hospitalization may be a prime opportunity to identify and support our at-risk families.
Acknowledgments
The authors would like to thank the parents at each of the study sites for their participation, as well as the multiple research coordinators across the study sites for assisting in recruitment of families, survey administration, and data collection. KT Park, MD, MS (Stanford University School of Medicine) served as an adviser for the study’s design.
Disclosures
All authors have no financial relationships or conflicts of interest relevant to this article to disclose.
1. Blumberg LJ, Waidmann TA, Blavin F, Roth J. Trends in health care financial burdens, 2001 to 2009. Milbank Q. 2014;92(1):88-113. https://doi.org/10.1111/1468-0009.12042
2. Claxton G, Rae M, Long M, et al. Employer Health Benefits, 2015 Annual Survey. Kaiser Family Foundation; 2015. http://files.kff.org/attachment/report-2015-employer-health-benefits-survey
3. Long M, Rae M, Claxton G, et al. Recent trends in employer-sponsored insurance premiums. JAMA. 2016;315(1):18. https://doi.org/10.1001/jama.2015.17349
4. Patients’ perspectives on health care in the United States: A look at seven states and the nation. Press release. NPR, Robert Wood Johnson Foundation, Harvard T.H. Chan School of Public Health; February 29, 2016. Accessed February 23, 2018. https://www.rwjf.org/en/library/research/2016/02/patients--perspectives-on-health-care-in-the-united-states.html
5. May JH, Cunningham PJ. Tough trade-offs: medical bills, family finances and access to care. Issue Brief Cent Stud Health Syst Change. 2004;(85):1-4.
6. Tu HT. Rising health costs, medical debt and chronic conditions. Issue Brief Cent Stud Health Syst Change. 2004;(88):1-5.
7. Richman IB, Brodie M. A National study of burdensome health care costs among non-elderly Americans. BMC Health Serv Res. 2014;14:435. https://doi.org/10.1186/1472-6963-14-435
8. Choudhry NK, Saya UY, Shrank WH, et al. Cost-related medication underuse: prevalence among hospitalized managed care patients. J Hosp Med. 2012;7(2):104-109. https://doi.org/10.1002/jhm.948
9. QuickStats: percentage of persons of all ages who delayed or did not receive medical care during the preceding year because of cost, by U.S. Census region of residence—National Health Interview Survey, 2015. MMWR Morb Mortal Wkly Rep. 2017;66(4):121. https://dx.doi.org/10.15585/mmwr.mm6604a9
10. Doty MM, Ho A, Davis K. How High Is Too High? Implications of High-Deductible Health Plans. The Commonwealth Fund; April 1, 2005. Accessed February 24, 2018. http://www.commonwealthfund.org/publications/fund-reports/2005/apr/how-high-is-too-high--implications-of-high-deductible-health-plans
11. Doty MM, Edwards JN, Holmgren AL. Seeing Red: American Driven into Debt by Medical Bills. The Commonwealth Fund; August 1, 2005. Accessed October 24, 2018. https://www.commonwealthfund.org/publications/issue-briefs/2005/aug/seeing-red-americans-driven-debt-medical-bills
12. Altice CK, Banegas MP, Tucker-Seeley RD, Yabroff KR. Financial hardships experienced by cancer survivors: a systematic review. J Natl Cancer Inst. 2016;109(2):djw205. https://doi.org/10.1093/jnci/djw205
13. Ghandour RM, Hirai AH, Blumberg SJ, Strickland BB, Kogan MD. Financial and nonfinancial burden among families of CSHCN: changes between 2001 and 2009-2010. Acad Pediatr. 2014;14(1):92-100. https://doi.org/10.1016/j.acap.2013.10.001
14. Thomson J, Shah SS, Simmons JM, et al. Financial and social hardships in families of children with medical complexity. J Pediatr. 2016;172:187-193.e1. https://doi.org/10.1016/j.jpeds.2016.01.049
15. Kuhlthau K, Kahn R, Hill KS, Gnanasekaran S, Ettner SL. The well-being of parental caregivers of children with activity limitations. Matern Child Health J. 2010;14(2):155-163. https://doi.org/10.1007/s10995-008-0434-1
16. Kuhlthau KA, Perrin JM. Child health status and parental employment. Arch Pediatr Adolesc Med. 2001;155(12):1346-1350. https://doi.org/10.1001/archpedi.155.12.1346
17. Witt WP, Gottlieb CA, Hampton J, Litzelman K. The impact of childhood activity limitations on parental health, mental health, and workdays lost in the United States. Acad Pediatr. 2009;9(4):263-269. https://doi.org/10.1016/j.acap.2009.02.008
18. Wisk LE, Witt WP. Predictors of delayed or forgone needed health care for families with children. Pediatrics. 2012;130(6):1027-1037. https://doi.org/10.1542/peds.2012-0668
19. Davidoff AJ. Insurance for children with special health care needs: patterns of coverage and burden on families to provide adequate insurance. Pediatrics. 2004;114(2):394-403. https://doi.org/10.1542/peds.114.2.394
20. Galbraith AA, Wong ST, Kim SE, Newacheck PW. Out-of-pocket financial burden for low-income families with children: socioeconomic disparities and effects of insurance. Health Serv Res. 2005;40(6 Pt 1):1722-1736. https://doi.org/10.1111/j.1475-6773.2005.00421.x
21. Berry JG, Hall DE, Kuo DZ, et al. Hospital utilization and characteristics of patients experiencing recurrent readmissions within children’s hospitals. JAMA. 2011;305(7):682-690. https://doi.org/10.1001/jama.2011.122
22. Berry JG, Hall M, Hall DE, et al. Inpatient growth and resource use in 28 children’s hospitals: a longitudinal, multi-institutional study. JAMA Pediatrics. 2013;167(2):170-177. https://doi.org/10.1001/jamapediatrics.2013.432
23. Chang LV, Shah AN, Hoefgen ER, et al. Lost earnings and nonmedical expenses of pediatric hospitalizations. Pediatrics. 2018;142(3):e20180195. https://doi.org/10.1542/peds.2018-0195
24. Banegas MP, Dickerson JF, Friedman NL, et al. Evaluation of a novel financial navigator pilot to address patient concerns about medical care costs. Perm J. 2019;23:18-084. https://doi.org/10.7812/tpp/18-084
25. Shankaran V, Leahy T, Steelquist J, et al. Pilot feasibility study of an oncology financial navigation program. J Oncol Pract. 2018;14(2):e122-e129. https://doi.org/10.1200/jop.2017.024927
26. Yezefski T, Steelquist J, Watabayashi K, Sherman D, Shankaran V. Impact of trained oncology financial navigators on patient out-of-pocket spending. Am J Manag Care. 2018;24(5 Suppl):S74-S79.
27. Prawitz AD, Garman ET, Sorhaindo B, O’Neill B, Kim J, Drentea P. InCharge Financial Distress/Financial Well-Being Scale: Development, Administration, and Score Interpretation. J Financial Counseling Plann. 2006;17(1):34-50. https://doi.org/10.1037/t60365-000
28. Cohen RA, Kirzinger WK. Financial burden of medical care: a family perspective. NCHS Data Brief. 2014;(142):1-8.
29. Galbraith AA, Ross-Degnan D, Soumerai SB, Rosenthal MB, Gay C, Lieu TA. Nearly half of families in high-deductible health plans whose members have chronic conditions face substantial financial burden. Health Aff (Millwood). 2011;30(2):322-331. https://doi.org/10.1377/hlthaff.2010.0584
30. Simon TD, Cawthon ML, Stanford S, et al. Pediatric medical complexity algorithm: a new method to stratify children by medical complexity. Pediatrics. 2014;133(6):e1647-e1654. https://doi.org/10.1542/peds.2013-3875
31. Leyenaar JK, Ralston SL, Shieh MS, Pekow PS, Mangione-Smith R, Lindenauer PK. Epidemiology of pediatric hospitalizations at general hospitals and freestanding children’s hospitals in the United States. J Hosp Med. 2016;11(11):743-749. https://doi.org/10.1002/jhm.2624
32. Rubin DB. Multiple Imputation for Nonresponse in Surveys. John Wiley and Sons; 1987.
33. R: A language and environment for statistical computing. R Foundation for Statistical Computing; 2018. https://www.R-project.org/
34. Hamel L, Norton M, Pollitz K, Levitt L, Claxton G, Brodie M. The Burden of Medical Debt: Results from the Kaiser Family Foundation/New York Times Medical Bills Survey. Kaiser Family Foundation; January 5, 2016. Accessed February 26, 2019. https://www.kff.org/wp-content/uploads/2016/01/8806-the-burden-of-medical-debt-results-from-the-kaiser-family-foundation-new-york-times-medical-bills-survey.pdf
35. Witt WP, Litzelman K, Mandic CG, et al. Healthcare-related financial burden among families in the U.S.: the role of childhood activity limitations and income. J Fam Econ Issues. 2011;32(2):308-326. https://doi.org/10.1007/s10834-011-9253-4
36. Zan H, Scharff RL. The heterogeneity in financial and time burden of caregiving to children with chronic conditions. Matern Child Health J. 2015;19(3):615-625. https://doi.org/10.1007/s10995-014-1547-3
37. Irwin B, Kimmick G, Altomare I, et al. Patient experience and attitudes toward addressing the cost of breast cancer care. Oncologist. 2014;19(11):1135-1140. https://doi.org/10.1634/theoncologist.2014-0117
38. Meisenberg BR, Varner A, Ellis E, et al. Patient attitudes regarding the cost of illness in cancer care. Oncologist. 2015;20(10):1199-1204. https://doi.org/10.1634/theoncologist.2015-0168
39. Altomare I, Irwin B, Zafar SY, et al. Physician experience and attitudes toward addressing the cost of cancer care. J Oncol Pract. 2016;12(3):e281-288, 247-288. https://doi.org/10.1200/jop.2015.007401
40. Starkey AJ, Keane CR, Terry MA, Marx JH, Ricci EM. Financial distress and depressive symptoms among African American women: identifying financial priorities and needs and why it matters for mental health. J Urban Health. 2013;90(1):83-100. https://doi.org/10.1007/s11524-012-9755-x
41. Amanatullah DF, Murasko MJ, Chona DV, Crijns TJ, Ring D, Kamal RN. Financial distress and discussing the cost of total joint arthroplasty. J Arthroplasty. 2018;33(11):3394-3397. https://doi.org/10.1016/j.arth.2018.07.010
Rising US healthcare costs coupled with high cost-sharing insurance plans have led to increased out-of-pocket healthcare expenditures, especially for those who are low income or in poorer health.1-7 Increased out-of-pocket expenditures can lead to “financial distress” (defined as the subjective level of stress felt toward one’s personal financial situation) and to “medical financial burden” (defined as the subjective assessment of financial problems relating specifically to medical costs). Financial distress and medical financial burden (defined together as “financial difficulty”) lead to impaired access and delayed presentation to care and treatment nonadherence in hopes of alleviating costs.8-12
Between 20% and 50% of families with children requiring frequent medical care report that their child’s healthcare has caused a financial difficulty.13,14 In addition to direct medical costs, these parents can also suffer from indirect costs of their child’s care, such as unemployment or missed work.15-17 Along with these families, families who are low income (generally defined as living below 200% of the Federal Poverty Level) also have higher absolute and relative out-of-pocket healthcare costs, and both groups are more likely to have unmet medical needs or to delay or forgo care.18-20 Medically complex children also represent an increasing percentage of patients admitted to children’s hospitals21,22 where their families may be more vulnerable to worsening financial difficulties caused by direct costs and income depletion—due to lost wages, transportation, and meals—associated with hospitalization.23
The hospitalized population can be readily screened and provided interventions. Although evidence on effective inpatient financial interventions is lacking, financial navigation programs piloted in the ambulatory setting that standardize financial screening and support trained financial navigators could prove a promising model for inpatient care.24-26 Therefore, understanding the prevalence of financial difficulties in this population and potential high-yield screening characteristics is critical in laying the groundwork for more robust in-hospital financial screening and support systems.
Our primary objective was to assess the prevalence of financial distress and medical financial burden in families of hospitalized children. Our secondary objective was to examine measurable factors during hospitalization that could identify families at risk for these financial difficulties to better understand how to target and implement hospital-based interventions.
METHODS
We conducted a cross-sectional survey at six university-affiliated children’s hospitals (Table 1). Each site’s institutional review board approved the study. All participants were verbally informed of the research goals of the study and provided with a research information document. Need for written informed consent was determined by each institutional review board.
Study enrollment occurred between October 2017 and November 2018, with individual sites having shorter active enrollment periods (ranging from 25 to 100 days) until sample size goals were met as explained below. Participants represented a convenience sample of parents or guardians (hereafter referred to only as “parents”), who were eligible for enrollment if their child was admitted to one of the six hospitals during the active enrollment period at that site. To avoid sampling bias, each site made an effort to enroll a consecutive sample of parents, but this was limited by resources and investigator availability. Parents were excluded if their child was admitted to a neonatal unit because of difficulty in complexity categorization and the confounding issue of mothers often being admitted simultaneously. There were no other unit-, diagnosis-, or service-based exclusions to participation. Parents were also excluded if their child was 18 years or older or if they themselves were younger than 18 years. Parents were approached once their child was identified for discharge from the hospital within 48 hours. Surveys were self-administered at the time of enrollment on provided electronic tablets. Participants at some sites were offered a $5 gift card as an incentive for survey completion.
The survey included a previously published financial distress scale (InCharge Financial Distress/Financial Wellbeing Scale [IFDFW])(Appendix).27 A question in addition to the IFDFW assessed whether families were currently experiencing financial burden from medical care28,29 and whether that burden was caused by their child (Appendix) because the IFDFW does not address the source of financial distress. The survey also included questions assessing perspectives on healthcare costs (data not presented here). The survey was refined through review by psychometric experts and members of the Family Advisory Council at the primary research site, which led to minor modifications. The final survey consisted of 40 items and was professionally translated into Spanish by a third-party company (Idem Translations). It was pilot tested by 10 parents of hospitalized children to assess for adequate comprehension and clarity; these parents were not included in the final data analysis.
Variables
The primary outcome variables were level of financial distress as defined by the IFDFW scale27 and the presence of medical financial burden. The IFDFW scale has eight questions answered on a scale of 1-10, and the final score is calculated by averaging these answers. The scale defines three categories of financial distress (high, 1-3.9; average, 4-6.9; low, 7-10); however, we dichotomized our outcome as high (<4) or not high (≥4). The outcome was analyzed as both continuous and dichotomous variables because small differences in continuous scores, if detected, may be less clinically relevant. Medical financial burden was categorized as child related, child unrelated, and none.
Our secondary aim was to identify predictors of financial distress and medical financial burden. The primary predictor variable of interest was the hospitalized child’s level of chronic disease (complex chronic disease, C-CD; noncomplex chronic disease, NC-CD; no chronic disease, no-CD) as categorized by the consensus definitions from the Center of Excellence on Quality of Care Measures for Children with Complex Needs (Appendix).30 We assigned level of chronic disease based on manual review of problem lists and diagnoses in the electronic health record (EHR) from up to 3 years prior. At sites with multiple researchers, the first five to ten charts were reviewed together to ensure consistency in categorization, but no formal assessment of interrater reliability was conducted. Other predictor variables are listed in Tables 2 and 3. Insurance payer was defined as “public” or “private” based on the documented insurance plan in the EHR. Patients with dual public and private insurance were categorized as public.
Statistical Analysis
We estimated sample size requirements using an expected mean IFDFW score with standard deviation of 5.7 ± 2 based on preliminary data from the primary study site and previously published data.27 We used a significance level of P = .05, power of 0.80, and an effect size of 0.5 points difference on the IFDFW scale between the families of children with C-CD and those with either NC-CD or no-CD. We assumed there would be unequal representation of chronic disease states, with an expectation that children with C-CD would make up approximately 40% of the total population.21,22,31 Under these assumptions, we calculated a desired total sample size of 519. This would also allow us to detect a 12% absolute difference in the rate of high financial distress between families with and without C-CD, assuming a baseline level of high financial distress of 30%.27 Our goal enrollment was 150 parents at the primary site and 75 parents at each of the other 5 sites.
We fit mixed effects logistic regression models to evaluate the odds of high financial distress and polytomous logistic regression models (for our three-level outcome) to evaluate the odds of having child-related medical financial burden vs having child-unrelated burden vs having no burden. We fit linear mixed effects models to evaluate the effect of chronic disease level and medical financial burden on mean IFDFW scores. Respondents who answered “I don’t know” to the medical financial burden question were aggregated with those who reported no medical financial burden. Models were fit as a function of chronic disease level, race, ethnicity, percentage of Federal Poverty Level (FPL), insurance payer, and having a deductible less than $1,000 per year. These models included a random intercept for facility. We also fit logistic regression models that used an interaction term between chronic disease level and percentage of FPL, as well as insurance payer and percentage of FPL, to explore potential effect modification between poverty and both chronic disease level and insurance payer on financial distress. For our models, we used the MICE package for multiple imputation to fill in missing data. We imputed 25 data sets with 25 iterations each and pooled model results using Rubin’s Rules.32 All analyses were performed in R 3.5.33
RESULTS
Of 644 parents who were invited to participate, 526 (82%) were enrolled. Participants and their hospitalized children were mostly White/Caucasian (69%) and not Hispanic/Latino (76%), with 34% of families living below 200% FPL and 274 (52%) having private insurance (Table 1). Of the hospitalized children, 225 (43%) were categorized as C-CD, 143 (27%) as NC-CD, and 157 (30%) as no-CD. All participants completed the IFDFW; however, there were five missing responses to the medical financial burden question. Table 1 lists missing demographic and financial difficulty data.
Financial Distress
The mean IFDFW score of all participants was 5.6 ± 2.1, with 125 having high financial distress (24%; 95% CI, 20-28) (Table 1). There was no difference in mean IFDFW scores among families of children with different chronic disease levels (Figure). On unadjusted and adjusted analyses, there was no association between level of chronic disease and high financial distress when C-CD and NC-CD groups were each compared with no-CD (Table 2). However, families living below 400% FPL (annual income of $100,400 for a family of four) were significantly more likely than families living at 400% FPL and above to have high financial distress. Families tended to have lower financial distress (as indicated by mean IFDFW scores) with increasing percentage of FPL; however, there were families in every FPL bracket who experienced high financial distress (Appendix Figure 1a). A secondary analysis of families below and those at or above 200% FPL did not find any significant interactions between percentage of FPL and either chronic disease level (P = .86) or insurance payer (P = .83) on financial distress.
Medical Financial Burden
Overall, 160 parents (30%; 95% CI, 27-35) reported having medical financial burden, with 86 of those parents (54%) indicating their financial burden was related to their child’s medical care (Table 1). Compared with families with no such medical financial burden, respondents with medical financial burden, either child related or child unrelated, had significantly lower mean IFDFW scores (Figure), which indicates overall higher financial distress in these families. However, some families with low financial distress also reported medical financial burden.
Adjusted analyses demonstrated that, compared with families of children with no-CD, families of children with C-CD (adjusted odds ratio [AOR], 4.98; 95% CI, 2.41-10.29) or NC-CD (AOR, 2.57; 95% CI, 1.11-5.93) had significantly higher odds of having child-related medical financial burden (Table 3). Families of children with NC-CD were also more likely than families of children with no-CD to have child-unrelated medical burden (Table 3). Percentage of FPL was the only other significant predictor of child-related and child-unrelated medical financial burden (Table 3), but as with the distribution of financial distress, medical financial burden was seen across family income brackets (Appendix Figure 1b).
DISCUSSION
In this multicenter study of parents of hospitalized children, almost one in four families experienced high financial distress and almost one in three families reported having medical financial burden, with both measures of financial difficulty affecting families across all income levels. While these percentages are not substantially higher than those seen in the general population,27,34 70% of our population was composed of children with chronic disease who are more likely to have short-term and long-term healthcare needs, which places them at risk for significant ongoing medical costs.
We hypothesized that families of children with complex chronic disease would have higher levels of financial difficulties,13,35,36 but we found that level of chronic disease was associated only with medical financial burden and not with high financial distress. Financial distress is likely multifactorial and dynamic, with different drivers across various income levels. Therefore, while medical financial burden likely contributes to high financial distress, there may be other contributing factors not captured by the IFDFW. However, subjective medical financial burden has still been associated with impaired access to care.10,34 Therefore, our results suggest that families of children with chronic diseases might be at higher risk for barriers to consistent healthcare because of the financial burden their frequent healthcare utilization incurs.
Household poverty level was also associated with financial distress and medical financial burden, although surprisingly both measures of financial difficulty were present in all FPL brackets. This highlights an important reality that financial vulnerability extends beyond income and federally defined “poverty.” Non-income factors, such as high local costs of living and the growing problem of underinsurance, may significantly contribute to financial difficulty, which may render static financial metrics such as percentage of FPL insufficient screeners. Furthermore, as evidenced by the nearly 10% of our respondents who declined to provide their income information, this is a sensitive topic for some families, so gathering income data during admission could likely be a nonstarter.
In the absence of other consistent predictors of financial difficulty that could trigger interventions such as an automatic financial counselor consult, hospitals and healthcare providers could consider implementing routine non-income based financial screening questions on admission, such as one assessing medical financial burden, as a nondiscriminatory way of identifying at-risk families and provide further education and assistance regarding their financial needs. Systematically gathering this data may also further demonstrate the need for broad financial navigation programs as a mainstay in comprehensive inpatient care.
We acknowledge several limitations of this study. Primarily, we surveyed families prior to discharge and receipt of hospitalization-related bills, and these bills could contribute significantly to financial difficulties. While the families of children with chronic disease, who likely have recurrent medical bills, did not demonstrate higher financial distress, it is possible that the overall rate of financial difficulties would have been higher had we surveyed families several weeks after discharge. Our measures of financial difficulty were also subjective and, therefore, at risk for response biases (such as recall bias) that could have misestimated the prevalence of these problems in our population. However, published literature on the IFDFW scale demonstrates concordance between the subjective score and tangible outcomes of financial distress (eg, contacting a credit agency). The IFDFW scale was validated in the general population, and although it has been used in studies of medical populations,37-41 none have been in hospitalized populations, which may affect the scale’s applicability in our study. The study was also conducted only at university-affiliated children’s hospitals, and although these hospitals are geographically diverse, most children in the United States are admitted to general or community hospitals.31 Our population was also largely White, non-Hispanic/Latino, and English speaking. Therefore, our sample may not reflect the general population of hospitalized children and their families. We also assigned levels of chronic disease based on manual EHR review. While the EHR should capture each patient’s breadth of medical issues, inaccurate or missing documentation could have led to misclassification of complexity in some cases. Additionally, our sample size was calculated to detect fairly large differences in our primary outcome, and some of our unexpected results may have resulted from this study being underpowered for detection of smaller, but perhaps still clinically relevant, differences. Finally, we do not have data for several possible confounders in our study, such as employment status, health insurance concordance among family members, or sources of supplemental income, that may impact a family’s overall financial health, along with some potential important hospital-based screening characteristics, such as admitting service team or primary diagnosis.
CONCLUSION
Financial difficulties are common in families of hospitalized pediatric patients. Low-income families and those who have children with chronic conditions are at particular risk; however, all subsets of families can be affected. Given the potential negative health outcomes financial difficulties impose on families and children, the ability to identify and support vulnerable families is a crucial component of care. Hospitalization may be a prime opportunity to identify and support our at-risk families.
Acknowledgments
The authors would like to thank the parents at each of the study sites for their participation, as well as the multiple research coordinators across the study sites for assisting in recruitment of families, survey administration, and data collection. KT Park, MD, MS (Stanford University School of Medicine) served as an adviser for the study’s design.
Disclosures
All authors have no financial relationships or conflicts of interest relevant to this article to disclose.
1. Blumberg LJ, Waidmann TA, Blavin F, Roth J. Trends in health care financial burdens, 2001 to 2009. Milbank Q. 2014;92(1):88-113. https://doi.org/10.1111/1468-0009.12042
2. Claxton G, Rae M, Long M, et al. Employer Health Benefits, 2015 Annual Survey. Kaiser Family Foundation; 2015. http://files.kff.org/attachment/report-2015-employer-health-benefits-survey
3. Long M, Rae M, Claxton G, et al. Recent trends in employer-sponsored insurance premiums. JAMA. 2016;315(1):18. https://doi.org/10.1001/jama.2015.17349
4. Patients’ perspectives on health care in the United States: A look at seven states and the nation. Press release. NPR, Robert Wood Johnson Foundation, Harvard T.H. Chan School of Public Health; February 29, 2016. Accessed February 23, 2018. https://www.rwjf.org/en/library/research/2016/02/patients--perspectives-on-health-care-in-the-united-states.html
5. May JH, Cunningham PJ. Tough trade-offs: medical bills, family finances and access to care. Issue Brief Cent Stud Health Syst Change. 2004;(85):1-4.
6. Tu HT. Rising health costs, medical debt and chronic conditions. Issue Brief Cent Stud Health Syst Change. 2004;(88):1-5.
7. Richman IB, Brodie M. A National study of burdensome health care costs among non-elderly Americans. BMC Health Serv Res. 2014;14:435. https://doi.org/10.1186/1472-6963-14-435
8. Choudhry NK, Saya UY, Shrank WH, et al. Cost-related medication underuse: prevalence among hospitalized managed care patients. J Hosp Med. 2012;7(2):104-109. https://doi.org/10.1002/jhm.948
9. QuickStats: percentage of persons of all ages who delayed or did not receive medical care during the preceding year because of cost, by U.S. Census region of residence—National Health Interview Survey, 2015. MMWR Morb Mortal Wkly Rep. 2017;66(4):121. https://dx.doi.org/10.15585/mmwr.mm6604a9
10. Doty MM, Ho A, Davis K. How High Is Too High? Implications of High-Deductible Health Plans. The Commonwealth Fund; April 1, 2005. Accessed February 24, 2018. http://www.commonwealthfund.org/publications/fund-reports/2005/apr/how-high-is-too-high--implications-of-high-deductible-health-plans
11. Doty MM, Edwards JN, Holmgren AL. Seeing Red: American Driven into Debt by Medical Bills. The Commonwealth Fund; August 1, 2005. Accessed October 24, 2018. https://www.commonwealthfund.org/publications/issue-briefs/2005/aug/seeing-red-americans-driven-debt-medical-bills
12. Altice CK, Banegas MP, Tucker-Seeley RD, Yabroff KR. Financial hardships experienced by cancer survivors: a systematic review. J Natl Cancer Inst. 2016;109(2):djw205. https://doi.org/10.1093/jnci/djw205
13. Ghandour RM, Hirai AH, Blumberg SJ, Strickland BB, Kogan MD. Financial and nonfinancial burden among families of CSHCN: changes between 2001 and 2009-2010. Acad Pediatr. 2014;14(1):92-100. https://doi.org/10.1016/j.acap.2013.10.001
14. Thomson J, Shah SS, Simmons JM, et al. Financial and social hardships in families of children with medical complexity. J Pediatr. 2016;172:187-193.e1. https://doi.org/10.1016/j.jpeds.2016.01.049
15. Kuhlthau K, Kahn R, Hill KS, Gnanasekaran S, Ettner SL. The well-being of parental caregivers of children with activity limitations. Matern Child Health J. 2010;14(2):155-163. https://doi.org/10.1007/s10995-008-0434-1
16. Kuhlthau KA, Perrin JM. Child health status and parental employment. Arch Pediatr Adolesc Med. 2001;155(12):1346-1350. https://doi.org/10.1001/archpedi.155.12.1346
17. Witt WP, Gottlieb CA, Hampton J, Litzelman K. The impact of childhood activity limitations on parental health, mental health, and workdays lost in the United States. Acad Pediatr. 2009;9(4):263-269. https://doi.org/10.1016/j.acap.2009.02.008
18. Wisk LE, Witt WP. Predictors of delayed or forgone needed health care for families with children. Pediatrics. 2012;130(6):1027-1037. https://doi.org/10.1542/peds.2012-0668
19. Davidoff AJ. Insurance for children with special health care needs: patterns of coverage and burden on families to provide adequate insurance. Pediatrics. 2004;114(2):394-403. https://doi.org/10.1542/peds.114.2.394
20. Galbraith AA, Wong ST, Kim SE, Newacheck PW. Out-of-pocket financial burden for low-income families with children: socioeconomic disparities and effects of insurance. Health Serv Res. 2005;40(6 Pt 1):1722-1736. https://doi.org/10.1111/j.1475-6773.2005.00421.x
21. Berry JG, Hall DE, Kuo DZ, et al. Hospital utilization and characteristics of patients experiencing recurrent readmissions within children’s hospitals. JAMA. 2011;305(7):682-690. https://doi.org/10.1001/jama.2011.122
22. Berry JG, Hall M, Hall DE, et al. Inpatient growth and resource use in 28 children’s hospitals: a longitudinal, multi-institutional study. JAMA Pediatrics. 2013;167(2):170-177. https://doi.org/10.1001/jamapediatrics.2013.432
23. Chang LV, Shah AN, Hoefgen ER, et al. Lost earnings and nonmedical expenses of pediatric hospitalizations. Pediatrics. 2018;142(3):e20180195. https://doi.org/10.1542/peds.2018-0195
24. Banegas MP, Dickerson JF, Friedman NL, et al. Evaluation of a novel financial navigator pilot to address patient concerns about medical care costs. Perm J. 2019;23:18-084. https://doi.org/10.7812/tpp/18-084
25. Shankaran V, Leahy T, Steelquist J, et al. Pilot feasibility study of an oncology financial navigation program. J Oncol Pract. 2018;14(2):e122-e129. https://doi.org/10.1200/jop.2017.024927
26. Yezefski T, Steelquist J, Watabayashi K, Sherman D, Shankaran V. Impact of trained oncology financial navigators on patient out-of-pocket spending. Am J Manag Care. 2018;24(5 Suppl):S74-S79.
27. Prawitz AD, Garman ET, Sorhaindo B, O’Neill B, Kim J, Drentea P. InCharge Financial Distress/Financial Well-Being Scale: Development, Administration, and Score Interpretation. J Financial Counseling Plann. 2006;17(1):34-50. https://doi.org/10.1037/t60365-000
28. Cohen RA, Kirzinger WK. Financial burden of medical care: a family perspective. NCHS Data Brief. 2014;(142):1-8.
29. Galbraith AA, Ross-Degnan D, Soumerai SB, Rosenthal MB, Gay C, Lieu TA. Nearly half of families in high-deductible health plans whose members have chronic conditions face substantial financial burden. Health Aff (Millwood). 2011;30(2):322-331. https://doi.org/10.1377/hlthaff.2010.0584
30. Simon TD, Cawthon ML, Stanford S, et al. Pediatric medical complexity algorithm: a new method to stratify children by medical complexity. Pediatrics. 2014;133(6):e1647-e1654. https://doi.org/10.1542/peds.2013-3875
31. Leyenaar JK, Ralston SL, Shieh MS, Pekow PS, Mangione-Smith R, Lindenauer PK. Epidemiology of pediatric hospitalizations at general hospitals and freestanding children’s hospitals in the United States. J Hosp Med. 2016;11(11):743-749. https://doi.org/10.1002/jhm.2624
32. Rubin DB. Multiple Imputation for Nonresponse in Surveys. John Wiley and Sons; 1987.
33. R: A language and environment for statistical computing. R Foundation for Statistical Computing; 2018. https://www.R-project.org/
34. Hamel L, Norton M, Pollitz K, Levitt L, Claxton G, Brodie M. The Burden of Medical Debt: Results from the Kaiser Family Foundation/New York Times Medical Bills Survey. Kaiser Family Foundation; January 5, 2016. Accessed February 26, 2019. https://www.kff.org/wp-content/uploads/2016/01/8806-the-burden-of-medical-debt-results-from-the-kaiser-family-foundation-new-york-times-medical-bills-survey.pdf
35. Witt WP, Litzelman K, Mandic CG, et al. Healthcare-related financial burden among families in the U.S.: the role of childhood activity limitations and income. J Fam Econ Issues. 2011;32(2):308-326. https://doi.org/10.1007/s10834-011-9253-4
36. Zan H, Scharff RL. The heterogeneity in financial and time burden of caregiving to children with chronic conditions. Matern Child Health J. 2015;19(3):615-625. https://doi.org/10.1007/s10995-014-1547-3
37. Irwin B, Kimmick G, Altomare I, et al. Patient experience and attitudes toward addressing the cost of breast cancer care. Oncologist. 2014;19(11):1135-1140. https://doi.org/10.1634/theoncologist.2014-0117
38. Meisenberg BR, Varner A, Ellis E, et al. Patient attitudes regarding the cost of illness in cancer care. Oncologist. 2015;20(10):1199-1204. https://doi.org/10.1634/theoncologist.2015-0168
39. Altomare I, Irwin B, Zafar SY, et al. Physician experience and attitudes toward addressing the cost of cancer care. J Oncol Pract. 2016;12(3):e281-288, 247-288. https://doi.org/10.1200/jop.2015.007401
40. Starkey AJ, Keane CR, Terry MA, Marx JH, Ricci EM. Financial distress and depressive symptoms among African American women: identifying financial priorities and needs and why it matters for mental health. J Urban Health. 2013;90(1):83-100. https://doi.org/10.1007/s11524-012-9755-x
41. Amanatullah DF, Murasko MJ, Chona DV, Crijns TJ, Ring D, Kamal RN. Financial distress and discussing the cost of total joint arthroplasty. J Arthroplasty. 2018;33(11):3394-3397. https://doi.org/10.1016/j.arth.2018.07.010
© 2020 Society of Hospital Medicine
Retrospective Review on the Safety and Efficacy of Direct Oral Anticoagulants Compared With Warfarin in Patients With Cirrhosis
Coagulation in patients with cirrhosis is a complicated area of evolving research. Patients with cirrhosis were originally thought to be naturally anticoagulated due to the decreased production of clotting factors and platelets, combined with an increased international normalized ratio (INR).1 New data have shown that patients with cirrhosis are at a concomitant risk of bleeding and thrombosis due to increased platelet aggregation, decreased fibrinolysis, and decreased production of natural anticoagulants such as protein C and antithrombin.1 Traditionally, patients with cirrhosis needing anticoagulation therapy for comorbid conditions, such as nonvalvular atrial fibrillation (NVAF) or venous thromboembolism (VTE) were placed on warfarin therapy. Managing warfarin in patients with cirrhosis poses a challenge to clinicians due to the many food and drug interactions, narrow therapeutic index, and complications with maintaining a therapeutic INR.1
Direct oral anticoagulants (DOACs) have several benefits over warfarin therapy, including convenience, decreased monitoring, decreased drug and dietary restrictions, and faster onset of action.2 Conversely, DOACs undergo extensive hepatic metabolism giving rise to concerns about supratherapeutic drug levels and increased bleeding rates in patients with liver dysfunction.1 Consequently, patients with cirrhosis were excluded from the pivotal trials establishing DOACs for NVAF and VTE treatment. Exclusion of these patients in major clinical trials alongside the challenges of managing warfarin warrant an evaluation of the efficacy and safety of DOACs in patients with cirrhosis.
Recent retrospective studies have examined the use of DOACs in patients with cirrhosis and found favorable results. A retrospective chart review by Intagliata and colleagues consisting of 39 patients with cirrhosis using either a DOAC or warfarin found similar rates of all-cause bleeding and major bleeding between the 2 groups.3 A retrospective cohort study by Hum and colleagues consisting of 45 patients with cirrhosis compared the use of DOACs with warfarin or low-molecular weight heparin (LMWH).4 Hum and colleagues found patients prescribed a DOAC had significantly fewer major bleeding events than did patients using warfarin or LMWH.4 The largest retrospective cohort study consisted of 233 patients with chronic liver disease and found no differences among all-cause bleeding and major bleeding rates between patients using DOACs compared with those of patients using warfarin.5
The purpose of this research is to evaluate the safety and efficacy of DOACs in veteran patients with cirrhosis compared with patients using warfarin.
Methods
A retrospective single-center chart review was conducted at the Michael E. DeBakey Veterans Affairs Medical Center (MEDVAMC) in Houston, Texas, between October 31, 2014 and October 31, 2018. Patients included in the study were adults aged ≥ 18 years with a diagnosis of cirrhosis and prescribed any of the following oral anticoagulants: apixaban, dabigatran, edoxaban, rivaroxaban, or warfarin. Patients prescribed apixaban, dabigatran, edoxaban, or rivaroxaban were collectively grouped into the DOAC group, while patients prescribed warfarin were classified as the standard of care comparator group.
A diagnosis of cirrhosis was confirmed using a combination of the codes from the ninth and tenth editions of the International Classification of Diseases (ICD) for cirrhosis, documentation of diagnostic confirmation by clinicians from the gastroenterology or hepatology services, and positive liver biopsy result. Liver function tests, liver ultrasound results, and FibroSure biomarker assays were used to aid in confirming the diagnosis of cirrhosis but were not considered definitive. Patients were excluded from the trial if they had indications for anticoagulation other than NVAF and VTE and/or were prescribed triple antithrombotic therapy (dual antiplatelet therapy plus an anticoagulant). Patients who switched anticoagulant therapy during the trial period (ie, switched from warfarin to a DOAC) were also excluded from the analysis.
Patient demographic characteristics that were collected included weight; body mass index (BMI); etiology of cirrhosis; Child-Turcotte-Pugh, Model for End-Stage Liver Disease (MELD), and CHA2DS2-VASc score; concomitant antiplatelet, nonsteroidal anti-inflammatory drug (NSAID), proton pump inhibitor (PPI), and histamine-2 receptor antagonist
Two patient lists were used to identify patients for inclusion in the warfarin arm. The first patient list was generated using the US Department of Veterans Affairs (VA) Cirrhosis Tracker, which identified patients with an ICD-9/10 code for cirrhosis and an INR laboratory value. Patients generated from the VA Cirrhosis Tracker with an INR > 1.5 were screened for a warfarin prescription and then evaluated for full study inclusion. The second patient list was generated using the VA Advanced Liver Disease Dashboard which identified patients with ICD-9/10 codes for advanced liver disease and an active warfarin prescription. Patients with an active warfarin prescription were then evaluated for full study inclusion. A single patient list was generated to identify patients for inclusion in the DOAC arm. This patient list was generated using the VA DOAC dashboard, which identified patients with an active DOAC prescription and an ICD-9/10 code for cirrhosis. Patients with an ICD-9/10 code for cirrhosis and prescribed a DOAC were screened for full study inclusion. Patient data were collected from the MEDVAMC Computerized Patient Record System (CPRS) electronic health record (EHR). The research study was approved by the Baylor College of Medicine Institutional Review Board and the VA Office of Research and Development.
Outcomes
The primary endpoint for the study was all-cause bleeding. The secondary endpoints for the study were major bleeding and failed efficacy. Major bleeding was defined using the International Society on Thrombosis and Haemostasis (ISTH) 2005 definition: fatal bleeding, symptomatic bleeding in a critical organ area (ie, intracranial, intraspinal, intraocular, retroperitoneal, intraarticular, pericardial, or intramuscular with compartment syndrome), or bleeding causing a fall in hemoglobin level of > 2 g/dL or leading to the transfusion of ≥ 2 units of red cells.6 Failed efficacy was a combination endpoint that included development of VTE, stroke, myocardial infarction (MI), and/or death. A prespecified subgroup analysis was conducted at the end of the study period to analyze trends in the DOAC and warfarin groups with respect to all-cause bleeding. All-cause bleeding risk was stratified by weight, BMI, Child-Turcotte-Pugh score, MELD score, presence of gastric and/or esophageal varices, active malignancies, percentage of time within therapeutic INR range in the warfarin group, indications for anticoagulation, and antiplatelet, NSAID, PPI, and H2RA therapy.
Statistical Analysis
Data were analyzed using descriptive and inferential statistics. Continuous data were analyzed using the Student t test, and categorical data were analyzed using the Fisher exact test. Previous studies determined an all-cause bleeding rate of 10 to 17% for warfarin compared with 5% for DOACs.7,8 To detect a 12% difference in the all-cause bleeding rate between DOACs and warfarin, 212 patients would be needed to achieve 80% power at an α level of 0.05.
Results
A total of 170 patients were screened, and after applying inclusion and exclusion criteria, 79 patients were enrolled in the study (Figure). The DOAC group included 42 patients, and the warfarin group included 37 patients. In the DOAC group, 69.1% (n = 29) of patients were taking apixaban, 21.4% (n = 9) rivaroxaban, and 9.5% (n = 4) dabigatran. There were no patients prescribed edoxaban during the study period.
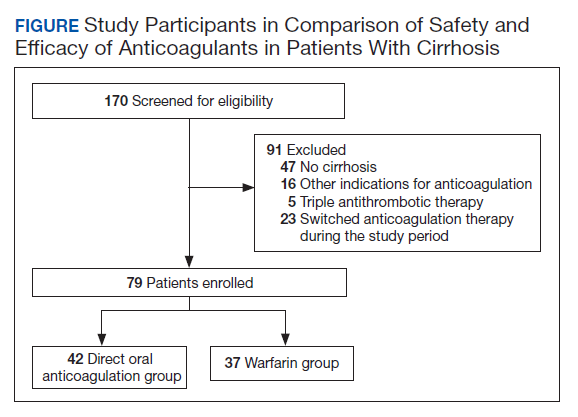
Baseline characteristics were similar between the 2 groups except for Child-Turcotte-Pugh score, MELD score, mean INR, and number of days on anticoagulation therapy (Table 1). Most of the patients were male (98.7%), and the mean age was 71 years. The most common causes of cirrhosis were viral (29.1%), nonalcoholic fatty liver disease (NAFLD) (24.1%), multiple causes (22.8%), and alcohol (21.5%). Sixty-two patients (78.5%) had a NVAF indication for anticoagulation. The average CHA2DS2-VASc score was 3.7. Aspirin was prescribed in 51.9% (n = 41) of patients, and PPIs were prescribed in 48.1% (n = 38) of patients. At inclusion, esophageal varices were present in 13 patients and active malignancies were present in 6 patients.
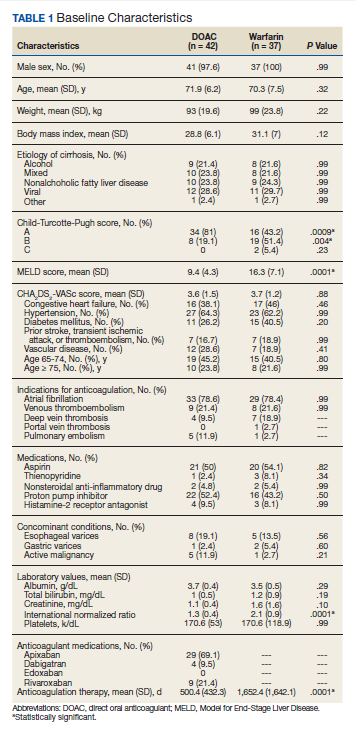
Statistically significant differences in baseline characteristics were found between mean INR, Child-Turcotte-Pugh scores, MELD scores, and number of days on anticoagulant therapy. The mean INR was 1.3 in the DOAC group compared with 2.1 in the warfarin group (P = .0001). Eighty-one percent (n = 34) of patients in the DOAC group had a Child-Turcotte-Pugh score of A compared with 43.2% (n = 16) of patients in the warfarin group (P = .0009). Eight patients in the DOAC group had a Child-Turcotte-Pugh score of B compared with 19 patients in the warfarin group (P = .004). The mean MELD score was 9.4 in the DOAC group compared with 16.3 in the warfarin group (P = .0001). The mean days on anticoagulant therapy was 500.4 days for the DOAC group compared with 1,652.4 days for the warfarin group (P = .0001).
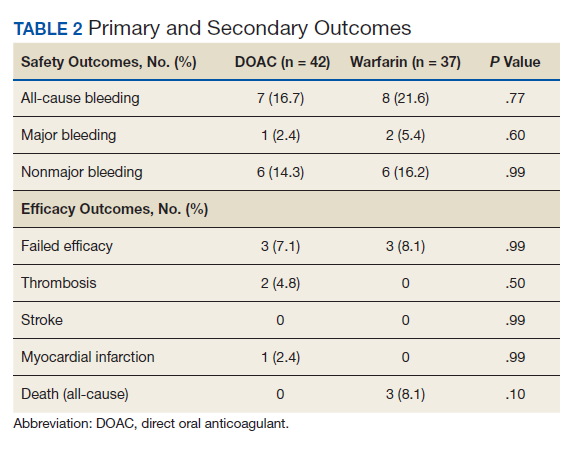
Safety Outcome
The primary outcome comparing all-cause bleeding rates between patients on DOACs compared with warfarin are listed in Table 2. With respect to the primary outcome, 7 (16.7%) patients on DOACs experienced a bleeding event compared with 8 (21.6%) patients on warfarin (P = .77). No statistically significant differences were detected between the DOAC and warfarin groups with respect to all-cause bleeding. Seven bleeding events occurred in the DOAC group; 1 met the qualification for major bleeding with a suspected gastrointestinal (GI) bleed.6 The other 6 bleeding episodes in the DOAC group consisted of hematoma, epistaxis, hematuria, and hematochezia. Eight bleeding events occurred in the warfarin group; 2 met the qualification for major bleeding with an intracranial hemorrhage and upper GI bleed.6 The other 6 bleeding episodes in the warfarin group consisted of epistaxis, bleeding gums, hematuria, and hematochezia. There were no statistically significant differences between the rates of major bleeding and nonmajor bleeding between the DOAC and warfarin groups.
Efficacy Outcomes
There were 3 events in the DOAC group and 3 events in the warfarin group (P = .99). In the DOAC group, 2 patients experienced a pulmonary embolism, and 1 patient experienced a MI. In the warfarin group, 3 patients died (end-stage heart failure, unknown cause due to death at an outside hospital, and sepsis/organ failure). There were no statistically significant differences between the composite endpoint of failed efficacy or the individual endpoints of VTE, stroke, MI, and death.
Subgroup Analysis
A prespecified subgroup analysis was conducted to determine risk factors for all-cause bleeding within each treatment group (Table 3). No significant trends were observed in the following risk factors: Child-Turcotte-Pugh score, indication for anticoagulation, use of NSAIDs, PPIs or H2RAs, presence of gastric or esophageal varices, active malignancies, and time within therapeutic INR range in the warfarin group. Patients with bleeding events had slightly increased weight and BMI vs patients without bleeding events. Within the warfarin group, patients with bleeding events had slightly elevated MELD scores compared to patients without bleeding events. There was an equal balance of patients prescribed aspirin therapy between the groups with and without bleeding events. Overall, no significant risk factors were identified for all-cause bleeding.
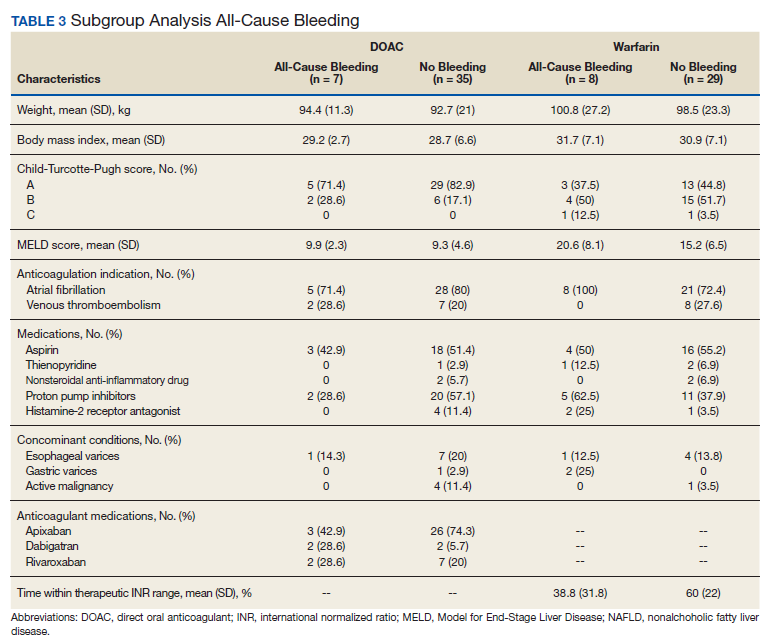
Discussion
Initially, patients with cirrhosis were excluded from DOAC trials due to concerns for increased bleeding risk with hepatically eliminated medications. New retrospective research has concluded that in patients with cirrhosis, DOACs have similar or lower bleeding rates when compared directly to warfarin.9,10
In this study, no statistically significant differences were detected between the primary and secondary outcomes of all-cause bleeding, major bleeding, or failed efficacy. Subgroup analysis did not identify any significant risk factors with respect to all-cause bleeding among patients in the DOAC and warfarin groups. To meet 80% power, 212 patients needed to be enrolled in the study; however, only 79 patients were enrolled, and power was not met. The results of this study should be interpreted cautiously as hypothesis-generating due to the small sample size. Strengths of this study include similar baseline characteristics between the DOAC and warfarin groups, 4-year length of retrospective data review, and availability of both inpatient and outpatient EHR limiting the amount of missing data points.
Baseline characteristics were similar between the groups except for mean INR, Child-Turcotte-Pugh score, MELD score, and number of days on anticoagulation therapy. The difference in mean INR between groups is expected as patients in the warfarin group have a goal INR of 2 to 3 to maintain therapeutic efficacy and safety. INR is not used as a marker of efficacy or safety with DOACs; therefore, a consistent elevation in INR is not expected. Child- Turcotte-Pugh scores are calculated using INR levels.11 When calculating the score, patients with an INR < 1.7 receive 1 point; patients with an INR between 1.7 and 2.3 receive 2 points.11 Therefore, patients in the warfarin group will have artificially inflated Child-Turcotte-Pugh scores as this group has goal INR levels of 2 to 3. This makes Child-Turcotte-Pugh scores unreliable markers of disease severity in patients using warfarin therapy. When the INR scores for patients prescribed warfarin were replaced with values < 1.7, the statistical difference disappeared between the warfarin and DOAC groups. The same effect is seen on MELD scores for patients prescribed warfarin therapy. The MELD score is calculated using INR levels.12 MELD scores also will be artificially elevated in patients prescribed warfarin therapy due to the INR elevation to between 2 and 3. When MELD scores for patients prescribed warfarin were replaced with values similar to those in the DOAC group, the statistical difference disappeared between the warfarin and DOAC groups.
The last statistically significant difference was found in number of days on anticoagulant therapy. This difference was expected as warfarin is the standard of care for anticoagulation treatment in patients with cirrhosis. The first DOAC, dabigatran, was not approved by the US Food and Drug Administration until 2010.13 DOACs have only recently been used in patients with cirrhosis accounting for the statistically significant difference in days on anticoagulation therapy between the warfarin and DOAC groups.
Limitations
The inability to meet power or evaluate adherence and appropriate renal dose adjustments for DOACs limited this study. This study was conducted at a single center in a predominantly male veteran population and therefore may not be generalizable to other populations. A majority of patients in the DOAC group were prescribed apixaban (69.1%), which may have affected the overall rate of major bleeding in the DOAC group. Pivotal trials of apixaban have shown a consistent decreased risk of major bleeding in patients with NVAF or VTE when compared with warfarin.14,15 Therefore, the results of this study may not be generalizable to all DOACs.
An inherent limitation of this study was the inability to collect data verifying adherence in the DOAC group. However, in the warfarin group, percentage of time within the therapeutic INR range of 2 to 3 was collected. While not a direct marker of adherence, this does allow for limited evaluation of therapeutic efficacy and safety within the warfarin group. Last, proper dosing of DOACs in patients with and without adequate renal function was not evaluated in this study.
Conclusions
The results of this study are consistent with other retrospective research and literature reviews. There were no statistically significant differences identified between the rates of all-cause bleeding, major bleeding, and failed efficacy between the DOAC and warfarin groups. DOACs may be a safe alternative to warfarin in patients with cirrhosis requiring anticoagulation for NVAF or VTE, but large randomized trials are required to confirm these results.
1. Qamar A, Vaduganathan M, Greenberger NJ, Giugliano RP. Oral anticoagulation in patients with liver disease. J Am Coll Cardiol. 2018;71(19):2162-2175. doi:10.1016/j.jacc.2018.03.023
2. Priyanka P, Kupec JT, Krafft M, Shah NA, Reynolds GJ. Newer oral anticoagulants in the treatment of acute portal vein thrombosis in patients with and without cirrhosis. Int J Hepatol. 2018;2018:8432781. Published 2018 Jun 5. doi:10.1155/2018/8432781
3. Intagliata NM, Henry ZH, Maitland H, et al. Direct oral anticoagulants in cirrhosis patients pose similar risks of bleeding when compared to traditional anticoagulation. Dig Dis Sci. 2016;61(6):1721-1727. doi:10.1007/s10620-015-4012-2
4. Hum J, Shatzel JJ, Jou JH, Deloughery TG. The efficacy and safety of direct oral anticoagulants vs traditional anticoagulants in cirrhosis. Eur J Haematol. 2017;98(4):393-397. doi:10.1111/ejh.12844
5. Goriacko P, Veltri KT. Safety of direct oral anticoagulants vs warfarin in patients with chronic liver disease and atrial fibrillation. Eur J Haematol. 2018;100(5):488-493. doi:10.1111/ejh.13045
6. Schulman S, Kearon C; Subcommittee on Control of Anticoagulation of the Scientific and Standardization Committee of the International Society on Thrombosis and Haemostasis. Definition of major bleeding in clinical investigations of antihemostatic medicinal products in non-surgical patients. J Thromb Haemost. 2005;3(4):692-694. doi:10.1111/j.1538-7836.2005.01204.x
7. Rubboli A, Becattini C, Verheugt FW. Incidence, clinical impact and risk of bleeding during oral anticoagulation therapy. World J Cardiol. 2011;3(11):351-358. doi:10.4330/wjc.v3.i11.351
8. Ruff CT, Giugliano RP, Braunwald E, et al. Comparison of the efficacy and safety of new oral anticoagulants with warfarin in patients with atrial fibrillation: a meta-analysis of randomised trials. Lancet. 2014;383(9921):955-962. doi:10.1016/S0140-6736(13)62343-0
9. Hoolwerf EW, Kraaijpoel N, Büller HR, van Es N. Direct oral anticoagulants in patients with liver cirrhosis: A systematic review. Thromb Res. 2018;170:102-108. doi:10.1016/j.thromres.2018.08.011
10. Steuber TD, Howard ML, Nisly SA. Direct oral anticoagulants in chronic liver disease. Ann Pharmacother. 2019;53(10):1042-1049. doi:10.1177/1060028019841582
11. Janevska D, Chaloska-Ivanova V, Janevski V. Hepatocellular carcinoma: risk factors, diagnosis and treatment. Open Access Maced J Med Sci. 2015;3(4):732-736. doi:10.3889/oamjms.2015.111
12. Singal AK, Kamath PS. Model for End-Stage Liver Disease. J Clin Exp Hepatol. 2013;3(1):50-60. doi:10.1016/j.jceh.2012.11.002
13. Joppa SA, Salciccioli J, Adamski J, et al. A practical review of the emerging direct anticoagulants, laboratory monitoring, and reversal agents. J Clin Med. 2018;7(2):29. Published 2018 Feb 11. doi:10.3390/jcm7020029
14. Granger CB, Alexander JH, McMurray JJ, et al. Apixaban versus warfarin in patients with atrial fibrillation. N Engl J Med. 2011;365(11):981-992. doi:10.1056/NEJMoa1107039
15. Agnelli G, Buller HR, Cohen A, et al. Oral apixaban for the treatment of acute venous thromboembolism. N Engl J Med. 2013;369(9):799-808. doi:10.1056/NEJMoa1302507
Coagulation in patients with cirrhosis is a complicated area of evolving research. Patients with cirrhosis were originally thought to be naturally anticoagulated due to the decreased production of clotting factors and platelets, combined with an increased international normalized ratio (INR).1 New data have shown that patients with cirrhosis are at a concomitant risk of bleeding and thrombosis due to increased platelet aggregation, decreased fibrinolysis, and decreased production of natural anticoagulants such as protein C and antithrombin.1 Traditionally, patients with cirrhosis needing anticoagulation therapy for comorbid conditions, such as nonvalvular atrial fibrillation (NVAF) or venous thromboembolism (VTE) were placed on warfarin therapy. Managing warfarin in patients with cirrhosis poses a challenge to clinicians due to the many food and drug interactions, narrow therapeutic index, and complications with maintaining a therapeutic INR.1
Direct oral anticoagulants (DOACs) have several benefits over warfarin therapy, including convenience, decreased monitoring, decreased drug and dietary restrictions, and faster onset of action.2 Conversely, DOACs undergo extensive hepatic metabolism giving rise to concerns about supratherapeutic drug levels and increased bleeding rates in patients with liver dysfunction.1 Consequently, patients with cirrhosis were excluded from the pivotal trials establishing DOACs for NVAF and VTE treatment. Exclusion of these patients in major clinical trials alongside the challenges of managing warfarin warrant an evaluation of the efficacy and safety of DOACs in patients with cirrhosis.
Recent retrospective studies have examined the use of DOACs in patients with cirrhosis and found favorable results. A retrospective chart review by Intagliata and colleagues consisting of 39 patients with cirrhosis using either a DOAC or warfarin found similar rates of all-cause bleeding and major bleeding between the 2 groups.3 A retrospective cohort study by Hum and colleagues consisting of 45 patients with cirrhosis compared the use of DOACs with warfarin or low-molecular weight heparin (LMWH).4 Hum and colleagues found patients prescribed a DOAC had significantly fewer major bleeding events than did patients using warfarin or LMWH.4 The largest retrospective cohort study consisted of 233 patients with chronic liver disease and found no differences among all-cause bleeding and major bleeding rates between patients using DOACs compared with those of patients using warfarin.5
The purpose of this research is to evaluate the safety and efficacy of DOACs in veteran patients with cirrhosis compared with patients using warfarin.
Methods
A retrospective single-center chart review was conducted at the Michael E. DeBakey Veterans Affairs Medical Center (MEDVAMC) in Houston, Texas, between October 31, 2014 and October 31, 2018. Patients included in the study were adults aged ≥ 18 years with a diagnosis of cirrhosis and prescribed any of the following oral anticoagulants: apixaban, dabigatran, edoxaban, rivaroxaban, or warfarin. Patients prescribed apixaban, dabigatran, edoxaban, or rivaroxaban were collectively grouped into the DOAC group, while patients prescribed warfarin were classified as the standard of care comparator group.
A diagnosis of cirrhosis was confirmed using a combination of the codes from the ninth and tenth editions of the International Classification of Diseases (ICD) for cirrhosis, documentation of diagnostic confirmation by clinicians from the gastroenterology or hepatology services, and positive liver biopsy result. Liver function tests, liver ultrasound results, and FibroSure biomarker assays were used to aid in confirming the diagnosis of cirrhosis but were not considered definitive. Patients were excluded from the trial if they had indications for anticoagulation other than NVAF and VTE and/or were prescribed triple antithrombotic therapy (dual antiplatelet therapy plus an anticoagulant). Patients who switched anticoagulant therapy during the trial period (ie, switched from warfarin to a DOAC) were also excluded from the analysis.
Patient demographic characteristics that were collected included weight; body mass index (BMI); etiology of cirrhosis; Child-Turcotte-Pugh, Model for End-Stage Liver Disease (MELD), and CHA2DS2-VASc score; concomitant antiplatelet, nonsteroidal anti-inflammatory drug (NSAID), proton pump inhibitor (PPI), and histamine-2 receptor antagonist
Two patient lists were used to identify patients for inclusion in the warfarin arm. The first patient list was generated using the US Department of Veterans Affairs (VA) Cirrhosis Tracker, which identified patients with an ICD-9/10 code for cirrhosis and an INR laboratory value. Patients generated from the VA Cirrhosis Tracker with an INR > 1.5 were screened for a warfarin prescription and then evaluated for full study inclusion. The second patient list was generated using the VA Advanced Liver Disease Dashboard which identified patients with ICD-9/10 codes for advanced liver disease and an active warfarin prescription. Patients with an active warfarin prescription were then evaluated for full study inclusion. A single patient list was generated to identify patients for inclusion in the DOAC arm. This patient list was generated using the VA DOAC dashboard, which identified patients with an active DOAC prescription and an ICD-9/10 code for cirrhosis. Patients with an ICD-9/10 code for cirrhosis and prescribed a DOAC were screened for full study inclusion. Patient data were collected from the MEDVAMC Computerized Patient Record System (CPRS) electronic health record (EHR). The research study was approved by the Baylor College of Medicine Institutional Review Board and the VA Office of Research and Development.
Outcomes
The primary endpoint for the study was all-cause bleeding. The secondary endpoints for the study were major bleeding and failed efficacy. Major bleeding was defined using the International Society on Thrombosis and Haemostasis (ISTH) 2005 definition: fatal bleeding, symptomatic bleeding in a critical organ area (ie, intracranial, intraspinal, intraocular, retroperitoneal, intraarticular, pericardial, or intramuscular with compartment syndrome), or bleeding causing a fall in hemoglobin level of > 2 g/dL or leading to the transfusion of ≥ 2 units of red cells.6 Failed efficacy was a combination endpoint that included development of VTE, stroke, myocardial infarction (MI), and/or death. A prespecified subgroup analysis was conducted at the end of the study period to analyze trends in the DOAC and warfarin groups with respect to all-cause bleeding. All-cause bleeding risk was stratified by weight, BMI, Child-Turcotte-Pugh score, MELD score, presence of gastric and/or esophageal varices, active malignancies, percentage of time within therapeutic INR range in the warfarin group, indications for anticoagulation, and antiplatelet, NSAID, PPI, and H2RA therapy.
Statistical Analysis
Data were analyzed using descriptive and inferential statistics. Continuous data were analyzed using the Student t test, and categorical data were analyzed using the Fisher exact test. Previous studies determined an all-cause bleeding rate of 10 to 17% for warfarin compared with 5% for DOACs.7,8 To detect a 12% difference in the all-cause bleeding rate between DOACs and warfarin, 212 patients would be needed to achieve 80% power at an α level of 0.05.
Results
A total of 170 patients were screened, and after applying inclusion and exclusion criteria, 79 patients were enrolled in the study (Figure). The DOAC group included 42 patients, and the warfarin group included 37 patients. In the DOAC group, 69.1% (n = 29) of patients were taking apixaban, 21.4% (n = 9) rivaroxaban, and 9.5% (n = 4) dabigatran. There were no patients prescribed edoxaban during the study period.
Baseline characteristics were similar between the 2 groups except for Child-Turcotte-Pugh score, MELD score, mean INR, and number of days on anticoagulation therapy (Table 1). Most of the patients were male (98.7%), and the mean age was 71 years. The most common causes of cirrhosis were viral (29.1%), nonalcoholic fatty liver disease (NAFLD) (24.1%), multiple causes (22.8%), and alcohol (21.5%). Sixty-two patients (78.5%) had a NVAF indication for anticoagulation. The average CHA2DS2-VASc score was 3.7. Aspirin was prescribed in 51.9% (n = 41) of patients, and PPIs were prescribed in 48.1% (n = 38) of patients. At inclusion, esophageal varices were present in 13 patients and active malignancies were present in 6 patients.
Statistically significant differences in baseline characteristics were found between mean INR, Child-Turcotte-Pugh scores, MELD scores, and number of days on anticoagulant therapy. The mean INR was 1.3 in the DOAC group compared with 2.1 in the warfarin group (P = .0001). Eighty-one percent (n = 34) of patients in the DOAC group had a Child-Turcotte-Pugh score of A compared with 43.2% (n = 16) of patients in the warfarin group (P = .0009). Eight patients in the DOAC group had a Child-Turcotte-Pugh score of B compared with 19 patients in the warfarin group (P = .004). The mean MELD score was 9.4 in the DOAC group compared with 16.3 in the warfarin group (P = .0001). The mean days on anticoagulant therapy was 500.4 days for the DOAC group compared with 1,652.4 days for the warfarin group (P = .0001).
Safety Outcome
The primary outcome comparing all-cause bleeding rates between patients on DOACs compared with warfarin are listed in Table 2. With respect to the primary outcome, 7 (16.7%) patients on DOACs experienced a bleeding event compared with 8 (21.6%) patients on warfarin (P = .77). No statistically significant differences were detected between the DOAC and warfarin groups with respect to all-cause bleeding. Seven bleeding events occurred in the DOAC group; 1 met the qualification for major bleeding with a suspected gastrointestinal (GI) bleed.6 The other 6 bleeding episodes in the DOAC group consisted of hematoma, epistaxis, hematuria, and hematochezia. Eight bleeding events occurred in the warfarin group; 2 met the qualification for major bleeding with an intracranial hemorrhage and upper GI bleed.6 The other 6 bleeding episodes in the warfarin group consisted of epistaxis, bleeding gums, hematuria, and hematochezia. There were no statistically significant differences between the rates of major bleeding and nonmajor bleeding between the DOAC and warfarin groups.
Efficacy Outcomes
There were 3 events in the DOAC group and 3 events in the warfarin group (P = .99). In the DOAC group, 2 patients experienced a pulmonary embolism, and 1 patient experienced a MI. In the warfarin group, 3 patients died (end-stage heart failure, unknown cause due to death at an outside hospital, and sepsis/organ failure). There were no statistically significant differences between the composite endpoint of failed efficacy or the individual endpoints of VTE, stroke, MI, and death.
Subgroup Analysis
A prespecified subgroup analysis was conducted to determine risk factors for all-cause bleeding within each treatment group (Table 3). No significant trends were observed in the following risk factors: Child-Turcotte-Pugh score, indication for anticoagulation, use of NSAIDs, PPIs or H2RAs, presence of gastric or esophageal varices, active malignancies, and time within therapeutic INR range in the warfarin group. Patients with bleeding events had slightly increased weight and BMI vs patients without bleeding events. Within the warfarin group, patients with bleeding events had slightly elevated MELD scores compared to patients without bleeding events. There was an equal balance of patients prescribed aspirin therapy between the groups with and without bleeding events. Overall, no significant risk factors were identified for all-cause bleeding.
Discussion
Initially, patients with cirrhosis were excluded from DOAC trials due to concerns for increased bleeding risk with hepatically eliminated medications. New retrospective research has concluded that in patients with cirrhosis, DOACs have similar or lower bleeding rates when compared directly to warfarin.9,10
In this study, no statistically significant differences were detected between the primary and secondary outcomes of all-cause bleeding, major bleeding, or failed efficacy. Subgroup analysis did not identify any significant risk factors with respect to all-cause bleeding among patients in the DOAC and warfarin groups. To meet 80% power, 212 patients needed to be enrolled in the study; however, only 79 patients were enrolled, and power was not met. The results of this study should be interpreted cautiously as hypothesis-generating due to the small sample size. Strengths of this study include similar baseline characteristics between the DOAC and warfarin groups, 4-year length of retrospective data review, and availability of both inpatient and outpatient EHR limiting the amount of missing data points.
Baseline characteristics were similar between the groups except for mean INR, Child-Turcotte-Pugh score, MELD score, and number of days on anticoagulation therapy. The difference in mean INR between groups is expected as patients in the warfarin group have a goal INR of 2 to 3 to maintain therapeutic efficacy and safety. INR is not used as a marker of efficacy or safety with DOACs; therefore, a consistent elevation in INR is not expected. Child- Turcotte-Pugh scores are calculated using INR levels.11 When calculating the score, patients with an INR < 1.7 receive 1 point; patients with an INR between 1.7 and 2.3 receive 2 points.11 Therefore, patients in the warfarin group will have artificially inflated Child-Turcotte-Pugh scores as this group has goal INR levels of 2 to 3. This makes Child-Turcotte-Pugh scores unreliable markers of disease severity in patients using warfarin therapy. When the INR scores for patients prescribed warfarin were replaced with values < 1.7, the statistical difference disappeared between the warfarin and DOAC groups. The same effect is seen on MELD scores for patients prescribed warfarin therapy. The MELD score is calculated using INR levels.12 MELD scores also will be artificially elevated in patients prescribed warfarin therapy due to the INR elevation to between 2 and 3. When MELD scores for patients prescribed warfarin were replaced with values similar to those in the DOAC group, the statistical difference disappeared between the warfarin and DOAC groups.
The last statistically significant difference was found in number of days on anticoagulant therapy. This difference was expected as warfarin is the standard of care for anticoagulation treatment in patients with cirrhosis. The first DOAC, dabigatran, was not approved by the US Food and Drug Administration until 2010.13 DOACs have only recently been used in patients with cirrhosis accounting for the statistically significant difference in days on anticoagulation therapy between the warfarin and DOAC groups.
Limitations
The inability to meet power or evaluate adherence and appropriate renal dose adjustments for DOACs limited this study. This study was conducted at a single center in a predominantly male veteran population and therefore may not be generalizable to other populations. A majority of patients in the DOAC group were prescribed apixaban (69.1%), which may have affected the overall rate of major bleeding in the DOAC group. Pivotal trials of apixaban have shown a consistent decreased risk of major bleeding in patients with NVAF or VTE when compared with warfarin.14,15 Therefore, the results of this study may not be generalizable to all DOACs.
An inherent limitation of this study was the inability to collect data verifying adherence in the DOAC group. However, in the warfarin group, percentage of time within the therapeutic INR range of 2 to 3 was collected. While not a direct marker of adherence, this does allow for limited evaluation of therapeutic efficacy and safety within the warfarin group. Last, proper dosing of DOACs in patients with and without adequate renal function was not evaluated in this study.
Conclusions
The results of this study are consistent with other retrospective research and literature reviews. There were no statistically significant differences identified between the rates of all-cause bleeding, major bleeding, and failed efficacy between the DOAC and warfarin groups. DOACs may be a safe alternative to warfarin in patients with cirrhosis requiring anticoagulation for NVAF or VTE, but large randomized trials are required to confirm these results.
1. Qamar A, Vaduganathan M, Greenberger NJ, Giugliano RP. Oral anticoagulation in patients with liver disease. J Am Coll Cardiol. 2018;71(19):2162-2175. doi:10.1016/j.jacc.2018.03.023
2. Priyanka P, Kupec JT, Krafft M, Shah NA, Reynolds GJ. Newer oral anticoagulants in the treatment of acute portal vein thrombosis in patients with and without cirrhosis. Int J Hepatol. 2018;2018:8432781. Published 2018 Jun 5. doi:10.1155/2018/8432781
3. Intagliata NM, Henry ZH, Maitland H, et al. Direct oral anticoagulants in cirrhosis patients pose similar risks of bleeding when compared to traditional anticoagulation. Dig Dis Sci. 2016;61(6):1721-1727. doi:10.1007/s10620-015-4012-2
4. Hum J, Shatzel JJ, Jou JH, Deloughery TG. The efficacy and safety of direct oral anticoagulants vs traditional anticoagulants in cirrhosis. Eur J Haematol. 2017;98(4):393-397. doi:10.1111/ejh.12844
5. Goriacko P, Veltri KT. Safety of direct oral anticoagulants vs warfarin in patients with chronic liver disease and atrial fibrillation. Eur J Haematol. 2018;100(5):488-493. doi:10.1111/ejh.13045
6. Schulman S, Kearon C; Subcommittee on Control of Anticoagulation of the Scientific and Standardization Committee of the International Society on Thrombosis and Haemostasis. Definition of major bleeding in clinical investigations of antihemostatic medicinal products in non-surgical patients. J Thromb Haemost. 2005;3(4):692-694. doi:10.1111/j.1538-7836.2005.01204.x
7. Rubboli A, Becattini C, Verheugt FW. Incidence, clinical impact and risk of bleeding during oral anticoagulation therapy. World J Cardiol. 2011;3(11):351-358. doi:10.4330/wjc.v3.i11.351
8. Ruff CT, Giugliano RP, Braunwald E, et al. Comparison of the efficacy and safety of new oral anticoagulants with warfarin in patients with atrial fibrillation: a meta-analysis of randomised trials. Lancet. 2014;383(9921):955-962. doi:10.1016/S0140-6736(13)62343-0
9. Hoolwerf EW, Kraaijpoel N, Büller HR, van Es N. Direct oral anticoagulants in patients with liver cirrhosis: A systematic review. Thromb Res. 2018;170:102-108. doi:10.1016/j.thromres.2018.08.011
10. Steuber TD, Howard ML, Nisly SA. Direct oral anticoagulants in chronic liver disease. Ann Pharmacother. 2019;53(10):1042-1049. doi:10.1177/1060028019841582
11. Janevska D, Chaloska-Ivanova V, Janevski V. Hepatocellular carcinoma: risk factors, diagnosis and treatment. Open Access Maced J Med Sci. 2015;3(4):732-736. doi:10.3889/oamjms.2015.111
12. Singal AK, Kamath PS. Model for End-Stage Liver Disease. J Clin Exp Hepatol. 2013;3(1):50-60. doi:10.1016/j.jceh.2012.11.002
13. Joppa SA, Salciccioli J, Adamski J, et al. A practical review of the emerging direct anticoagulants, laboratory monitoring, and reversal agents. J Clin Med. 2018;7(2):29. Published 2018 Feb 11. doi:10.3390/jcm7020029
14. Granger CB, Alexander JH, McMurray JJ, et al. Apixaban versus warfarin in patients with atrial fibrillation. N Engl J Med. 2011;365(11):981-992. doi:10.1056/NEJMoa1107039
15. Agnelli G, Buller HR, Cohen A, et al. Oral apixaban for the treatment of acute venous thromboembolism. N Engl J Med. 2013;369(9):799-808. doi:10.1056/NEJMoa1302507
Penicillin Allergy Delabeling Can Decrease Antibiotic Resistance, Reduce Costs, and Optimize Patient Outcomes
Antibiotics are one of the most frequently prescribed medications in both inpatient and outpatient settings.1,2 More than 266 million courses of antibiotics are prescribed annually in the outpatient setting; 49.9% of hospitalized patients were prescribed ≥ 1 antibiotic during their hospitalization.1,2 Among all classes of antibiotics, penicillins are prescribed due to their clinical efficacy, cost-effectiveness, and general safety for all ages. Unfortunately, penicillins also are the most common drug allergy listed in medical records. Patients with this allergy are consistently treated with broad-spectrum antibiotics, have more antibiotic resistant infections, incur higher health care costs, and experience more adverse effects (AEs).3,4
Drug allergies are distinguished by different immune mechanisms, including IgE-mediated reaction, T-lymphocyte-mediated mild skin reactions, and severe cutaneous adverse reactions (SCAR), or other systemic immune syndromes, such as hemolytic anemia, nephritis, and rash with eosinophilia.3 Although drug allergies should be a concern, compelling evidence shows that > 90% of patients labeled with a penicillin allergy are not allergic to penicillins (and associated β-lactams).3,4 Although this evidence is growing, clinicians still hesitate to prescribe penicillin, and patients are similarly anxious to take them. This article reviews the health care consequences of penicillin allergy and the application of this information to military medicine and readiness.
Penicillin Allergy Prevalence
Since their approval for public use in 1945, penicillins have been one of the most often prescribed antibiotics due to their clinical efficacy for many types of infections.3 However, 8 to 10% of the US population and up to 15% of hospitalized patients have a documented penicillin allergy, which limits the ability to use these effective antibiotics.3,4 Once a patient is labeled with a penicillin allergy, many clinicians avoid prescribing all β-lactam antibiotics to patients. Clinicians also avoid prescribing cephalosporins due to the concern for potential cross-reactivity (at a rate of about 2%, which is lower than previously reported).3 These reported allergies are often not clear and range from patients avoiding penicillins because their parents exhibited allergies, they had a symptom that was not likely allergic (ie, nausea, headache, itching with no rash), being told by their parents that they had a rash as a child, or experiencing severe anaphylaxis or other systemic reaction.3,4 Despite the high rates of documented penicillin allergy, studies now show that most patients do not have a serious allergy; < 1% of the population has a true immune-mediated penicillin allergy.3,4
Broad-Spectrum Antibiotic Risks
Even though penicillin allergies are often not confirmed, many patients are treated with alternative antibiotics. Unfortunately, most alternative antibiotics are not as effective or as safe as penicillin.3,4 Twenty percent of hospitalized patients will experience an AE related to their antibiotic; 19.3% of emergency department visits for adverse drug reactions (ADRs) are from antibiotics.5,6 Sulfonamides, clindamycin, and quinolones were the antibiotics most commonly associated with AEs.6
In a large database study over a 3-year period, > 400,000 hospitalizations were analyzed in patients matched for admission type, with and without a penicillin allergy in their medical record.7 Those with a documented penicillin allergy had longer hospitalizations; were treated with broad-spectrum antibiotics; and had increased rates of Clostridium difficile (C difficile), methicillin-resistant Staphylococcus aureus (MRSA), and vancomycin-resistant Enterococcus (VRE).7,8 In addition to being first-line treatment for many common infections, penicillins often are used for dental, perinatal, and perioperative prophylaxis.1,3 Nearly 25 million antibiotics are prescribed annually by dentists.1 If a patient has a penicillin allergy listed in their medical record, they will inevitably receive a second- or third-line treatment that is less effective and has higher risks. Common alternative antibiotics include clindamycin, fluoroquinolones, macrolides, and vancomycin.3,7,8
Clindamycin and fluoroquinolones are associated with C difficile infections.9,10 Fluoroquinolones come with a boxed warning for known serious ADRs, including tendon rupture, peripheral neuropathy, central nervous system effects, and are known for causing cardiac reactions such as QT prolongation, life-threatening arrhythmias, and cardiovascular death.11,12 Fluoroquinolones are associated with an increased risk for VRE and MRSA, in more than any other antibiotic classes.3,7,12,13
Macrolides, such as azithromycin and clarithromycin, are another common class of antibiotics used as an alternative for penicillins. Both are used frequently for upper respiratory infections. Known ADRs to macrolides include gastrointestinal adverse effects (AEs) (ie, nausea, vomiting, diarrhea, and abdominal pain), liver toxicity (ie, abnormal liver function tests, hepatitis, and liver failure), and cardiac risks (ie, QT prolongation and sudden death). When compared with amoxicillin, there was an increased risk for cardiovascular mortality in those patients receiving macrolides.14,15
Vancomycin is known for its potential to cause “red man syndrome,” an infusion-related reaction causing redness and itching as well as nephrotoxic and hematologic effects requiring close monitoring.3 Vancomycin is less effective than methicillin in clearing MRSA or other sensitive pathogens; however, vancomycin is used in patients with a penicillin allergy label.16-18 Intrapartum antibiotic use of vancomycin for group B streptococcus infection was associated with clinically significant morbidity and ADRs.19,20 Perioperatively, patients with penicillin allergies developed more surgical site infections due to the use of second-line antibiotics, such as vancomycin or others.21
Cost of Penicillin Allergies
Penicillin allergy plays an important role in rising health care costs. In 2017, health care spending reached 17.9% of the gross domestic product.22 Macy and Contreras demonstrated the significantly higher costs associated with having a reported (and unverified) penicillin allergy in a matched cohort study. Inferred for the extra hospital use, the penicillin allergy group cost the health care system $64,626,630 more than for the group who did not have a penicillin allergy label.7 A subsequent study by Macy and Contreras of both inpatient and outpatient settings showed a potential savings of $2,000 per patient per year in health care expenses with the testing and delabeling of penicillin allergies.23 Use of newer and broad-spectrum antibiotics also are more costly and contribute to higher health care costs.24
When these potential savings are applied to the military insurance population of 9.4 million beneficiaries (TRICARE, including active duty, their dependents, and all retirees participating in the program), the results showed that this could impart a savings of nearly $1.7 billion annually, using the model by Macy and Contreras.23,25,26
Previously with colleagues, I reviewed penicillin’s role in military history, compiled data from relevant studies from military penicillin allergy rates and delabeling efforts, and calculated the potential economic impact of penicillin allergies along with the benefits of testing.26 Calculations were estimated using the TRICARE beneficiary population (9.4 million) × the estimated prevalence (10%) to get an estimate of 940,000 TRICARE patients with penicillin allergy in their medical record.25 If 90% of those patients were delabeled, this would equal 846,000 TRICARE patients. When multiplied by the potential savings of $2,000 per patient per year, the estimated savings would be $1,692,000,000 annually.23,26
Current literature provides compelling evidence that all health care plans should use penicillin allergy testing and delabeling programs.3,23,26 As most patients with a history of penicillin allergy in their medical records do not have a verified allergy, delabeling those who do not have a true allergy will have individual, public health, and cost benefits.3,7,23,26
Antibiotic Stewardship
Antibiotic stewardship programs are now mandated to combat antibiotic resistance.3,27 This program is supported by major medical organizations, including the Centers for Disease Control and Prevention, Society for Healthcare Epidemiology of America, Infectious Disease Society of America, and the American Academy of Allergy Asthma and Immunology.3 Given the role of broad-spectrum antibiotics in antibiotic resistance, penicillin allergy testing and delabeling is an important component of these programs.3
In the US, > 2 million people acquire antibiotic resistant infections annually; 23,000 people die of these infections.27 More than 250,000 illnesses and 14,000 deaths annually are due to C difficile.27 There are many factors contributing to the increase in antibiotic resistance; however, one established and consistent factor is the use of broad-spectrum antibiotics. Further, broad-spectrum antibiotics are often used when first-line agents, such as penicillins, cannot be used due to a reported “allergy.” In addition, there are fewer novel antibiotics being developed, and as they are introduced, pathogens develop resistance to these new agents.27
Military Relevance
Infectious diseases have always accompanied military activity.28-30 Despite preventive programs such as vaccinations, hygiene measures, and prophylactic antibiotics, military personnel are at increased risk for infections due to the military’s mobile nature and crowded living situations.28-30 This situation has operational relevance from basic training, deployments, and combat operations to peacetime activities.
Military recruits are treated routinely with penicillin G benzathine as standard prophylaxis against streptococcal infections.26,30 A recent study by the Marine Corps Recruiting Depot in San Diego, California showed that in a cohort of 402 young healthy male recruits, only 5 (1.5%) had a positive reaction to penicillin testing and challenge over a 21-month period.31 The delabeled other 397 (98.5%) marine recruits were able to receive benzathine penicillin prophylaxis successfully.31 Recruits with a penicillin allergy who had a positive test or were not tested received azithromycin (or erythromycin at some recruit training locations).26,31 Military members may need to operate in remote or austere locations; the ability to use penicillins is important for readiness.
Evaluation and Management of Reported Penicillin Allergy
Verifying penicillin allergies is an important first step in optimizing medical care and decreasing resistance and ADRs.3,4,32,33 Although allergists can provide specialized evaluation, due to the high prevalence of penicillin allergy in the US, all health care team members, including clinicians and pharmacists, should be educated about penicillin allergies and be able to implement evaluations in both inpatient and outpatient settings. Reactions to any of the penicillins should be considered, including the natural penicillins (penicillin V, etc), antistaphylococcal penicillins (dicloxacillin), aminopenicillins (amoxicillin and ampicillin), and extended-spectrum penicillins (piperacillin).3 A thorough history, including the prior reaction (age, type of reaction) and subsequent tolerance are helpful in stratifying patients.3,26
Patient Risk Levels
Based on the clinical history, patients would fall into 4 categories from low risk, medium risk, high risk, to do not test/use.3,32,33 Low-risk patients are those who report mild or nonallergic symptoms (ie, gastrointestinal symptoms, headache, yeast infection, etc), remote cutaneous reactions (> 10 years), or in those with a family history of penicillin allergy.3,32,33 Low-risk patients often can be safely tested with an oral challenge. Although there are different approaches to the oral challenge, a single amoxicillin dose of 250 mg followed by 1 hour of direct monitoring is usually sufficient.3,32,33
Medium-risk patients have a more recent (< 1 year) history of pruritic rashes, urticaria, and/or angioedema without a history of severe or systemic reactions. These patients benefit from negative skin testing prior to an oral challenge, which can be performed by trained clinicians or pharmacists or an allergist. However, due to limited availability of skin testing and the potential for false positive testing with skin tests, a single dose or graded challenge would be a reasonable approach as well.3,32,33
High-risk patients are those with severe symptoms (anaphylaxis), a history of reactions to other β-lactam antibiotics, and/or recurrent reactions to antibiotics. These patients benefit from a formal evaluation by an allergist and skin testing prior to challenge.3,32,33 Testing and/or challenge should not be performed in patients who report a history of severe cutaneous reactions (blistering rash, such as Stevens Johnson syndrome), hemolytic anemia, serum sickness, drug fever, and other organ dysfunction.3,4,31,32
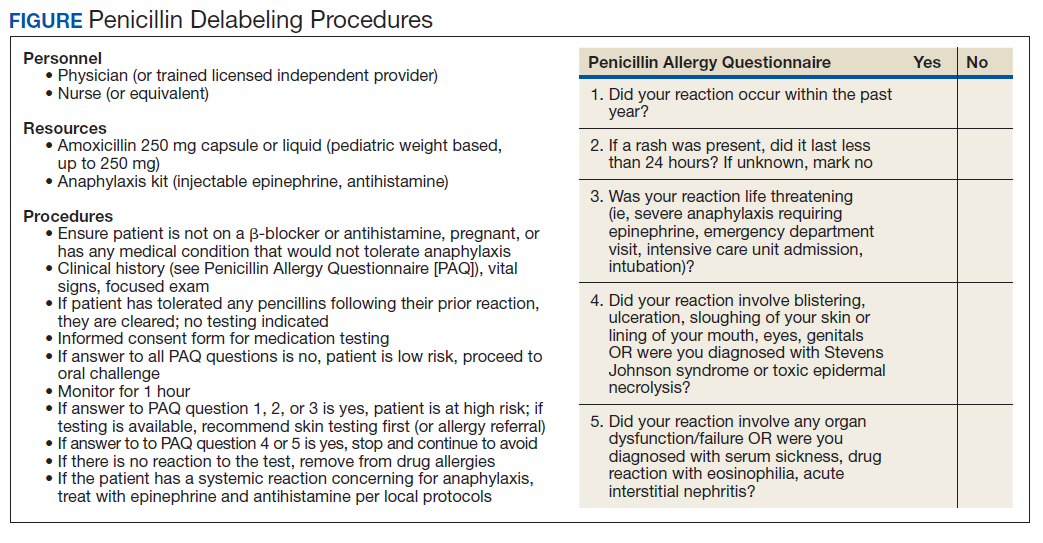
The Figure describes a published questionnaire, personnel, resources, and procedures for penicillin delabeling.26 Although skin testing is reliable in revealing a immunoglobulin E-mediated penicillin allergy, there is potential for false positives.32,33 The oral amoxicillin challenge effectively clears the patient for future penicillin administration.3,32-34 In high-risk patients, desensitization should be considered if penicillins (or cephalosporins) are required as first-line treatment. A test dose (one-tenth dose, higher or lower depending on route of administration, historic reaction, clinical status, and level of certainty of prior reaction) may be considered in low- to moderate-risk patients, depending on the indication for the use of the antibiotics.32
Penicillin evaluation pathways can occur in both inpatient and outpatient settings where antibiotics will be prescribed.32-34 There are several proposed pathways, including a screening questionnaire to determine the penicillin allergy risk.26,32,33 Implementation of perioperative testing has been successful in decreasing the rates of vancomycin use and lessening the morbidity associated with use of second-line antibiotics.35 Many hospitals throughout the country have implemented standardized penicillin delabeling programs.3,32-34
Conclusions
Penicillin allergies are an important barrier to effective antibiotic treatments and are associated with worse outcomes and higher economic costs.3,7,23,26,34 Therefore, in addition to vaccinations, infection control measures, and public health education, penicillin allergy verification and delabeling programs should be a proactive component of military medical readiness and all antibiotic stewardship initiatives in all health care settings.29 Given the many issues and negative impact of having a penicillin allergy label, penicillin delabeling will allow service members to be treated with the necessary antibiotics with fewer adverse complications, and return them to health and readiness for operational duties. In the current standardization of the Defense Health Agency, implementing this program across all services would have significant clinical, public health, and cost benefits for patients, the health care team, taxpayers, and the community at large.
Many patients report an allergy to penicillin, but only a small portion have a current true immune-mediated allergy. Given the clinical, public health, and economic costs associated with a penicillin allergy label, evaluation and clearance of penicillin allergies is a simple method that would improve clinical outcomes, decrease AEs to high-risk alternative broad-spectrum antibiotics, and prevent the spread of antibiotic resistance. In the military, penicillin delabeling improves readiness with optimal antibiotic options and avoidance of unnecessary risks of using alternative antibiotics, expediting return to full duty for military personnel.
1. Centers for Disease Control and Prevention. Outpatient antibiotic prescriptions-United States, 2014. https://www.cdc.gov/antibiotic-use/community/pdfs/annual-reportsummary_2014.pdf. Accessed August 15, 2020.
2. Magill SS, Edwards JR, Beldavs ZG, et al. Prevalence of antimicrobial use in US acute care hospitals, May-September 2011. JAMA. 2014;312(14):1438-1446. doi:10.1001/jama.2014.12923
3. Shenoy ES, Macy E, Rowe T, Blumenthal KG. Evaluation and management of penicillin allergy. JAMA. 2019;321:188-199. doi:10.1001/jama.2018.19283
4. Har D, Solensky R. Penicillin and beta-lactam hypersensitivity. Immunol Allergy Clin North Am. 2017;37(4):643-662. doi:10.1016/j.iac.2017.07.001
5. Tamma PD, Avdic E, Li DX, Dzintars K, Cosgrove SE. Association of adverse events with antibiotic use in hospitalized patients. JAMA Intern Med. 2017;177(9):1308-1315. doi:10.1001/jamainternmed.2017.1938
6. Shebab N, Patel PR, Srinivasan A, Budnitz DS. Emergency department visits for antibiotic-associated adverse events. Clin Infect Dis. 2008;47(6):735-743. doi:10.1086/591126
7. Macy E, Contreras R. Healthcare use and serious infection prevalence associated with penicillin “allergy” in hospitalized patients: a cohort study. J Allergy Clin Immunol. 2014;133(3):790-796. doi:10.1016/j.jaci.2013.09.021
8. Blumenthal KG, Lu N, Zhang Y, Li Y, Walensky RP, Choi HK. Risk of methicillin resistant Staphylococcal aureus and Clostridium difficile in patients with a documented penicillin allergy: population-based matched cohort study. BMJ. 2018;361:k2400. doi:10.1136/bmj.k2400
9. Loo VG, Poirier L, Miller MA, et al. A predominantly clonal multi-institutional outbreak of Clostridium difficile associated diarrhea with high morbidity and mortality. N Engl J Med. 2005;353(23):2442-2449. doi:10.1056/NEJMoa051639
10. Pepin J, Saheb N, Coulombe MA, et al. Emergence of fluoroquinolone as the predominant risk factor for Clostridium difficile-associated diarrhea: a cohort study during an epidemic in Quebec. Clin Infect Dis. 2005;41(9):1254-1260. doi:10.1086/496986
11. Chou HW, Wang JL, Chang CH, et al. Risks of cardiac arrhythmia and mortality among patients using new-generation macrolides, fluoroquinolones, and β-lactam/β-lactamase inhibitors: a Taiwanese nationwide study. Clin Infec Dis. 2015;60(4):566-577. doi:10.1093/cid/ciu914
12. Rao GA, Mann JR, Shoaibi A, et al. Azithromycin and levofloxacin use and increased risk of cardiac arrhythmia and death. Ann Fam Med. 2014;12(2):121-127. doi:10.1370/afm.1601
13. LeBlanc L, Pepin J, Toulouse K, et al. Fluoroquinolone and risk for methicillin-resistant Staphylococcus aureus, Canada. Emerg Infect Dis. 2006;12(9):1398-1405. doi:10.3201/eid1209.060397
14. Schembri S, Williamson PA, Short PM, et al. Cardiovascular events after clarithromycin use in lower respiratory tract infections: analysis of two prospective cohort studies. BMJ. 2013;346:f1245. doi:10.1136/bmj.f1235
15. Ray WA, Murray KT, Hall K, Arbogast PG, Stein CM. Azithromycin and the risk of cardiovascular death. N Engl J Med. 2012;366(20):1881-1890. doi:10.1056/NEJMoa1003833
16. McDaniel JS, Perencevich EN, Diekema DJ, et al. Comparative effectiveness of beta-lactams versus vancomycin for treatment of methicillin-susceptible Staphylococcus aureus bloodstream infections among 122 hospitals. Clin Infect Dis. 2015;61(3):361-367. doi:10.1093/cid/civ308
17. Wong D, Wong T, Romney M, Leung V. Comparison of outcomes in patients with methicillin-susceptible Staphylococcus aureus (MSSA) bacteremia who are treated with β-lactam vs vancomycin empiric therapy: a retrospective cohort study. BMC Infect Dis. 2016;16:224. doi:10.1186/s12879-016-1564-5
18. Blumenthal KG, Shenoy ES, Huang M, et al. The impact of reporting a prior penicillin allergy on the treatment of methicillin-sensitivity Staphylococcus aureus bacteremia. PLoS One. 2016;11(7):e0159406. doi:10.1371/journal.pone.0159406
19. Verani JR, McGee L, Schrag SJ; . Prevention of perinatal group B streptococcal disease. MMWR Recomm Rep. 2010;59(RR-10):1-36.
20. Desai SH, Kaplan MS, Chen Q, Macy EM. Morbidity in pregnant women associated with unverified penicillin allergies, antibiotic use, and group B Streptococcus infections. Perm J. 2017;21:16-080. doi:10.7812/TPP/16-080
21. Blumenthal KG, Ryan EE, Li Y, Lee H, Kuhlen JL, Shenoy ES. The impact of a reported penicillin allergy on surgical site infection risk. Clin Infect Dis. 2018;66(3):329-336. doi:10.1093/cid/cix794
22. National Health Expenditures 2017 Highlights. Centers for Medicare & Medicaid services. https://www.cms.gov/Research-Statistics-Data-and-Systems/Statistics-Trends-and-Reports/NationalHealthExpendData/Downloads/highlights.pdf. Accessed August 25, 2020.
23. Macy E, Shu YH. The effect of penicillin allergy testing on future health care utilization: a matched cohort study. J Allergy Clin Immunol Pract. 2017;5(3):705-710. doi:10.1016/j.jaip.2017.02.012
24. Picard M, Begin P, Bouchard H, et al. Treatment of patients with a history of penicillin allergy in a large tertiary-care academic hospital. J Allergy Clin Immunol Pract. 2013;1(3):252-257. doi:10.1016/j.jaip.2013.01.006
25. US Department of Defense. Beneficiary population statistics. https://health.mil/I-Am-A/Media/Media-Center/Patient-Population-Statistics. Accessed August 25, 2020.
26. Lee RU, Banks TA, Waibel KH, Rodriguez RG. Penicillin allergy…maybe not? The military relevance for penicillin testing and de-labeling. Mil Med. 2019;184(3-4):e163-e168. doi:10.1093/milmed/usy194
27. Antibiotic resistance threats in the United States, 2013. Centers for Disease Control and Prevention. https://www.cdc.gov/drugresistance/threat-report-2013/index.html. Accessed May 10, 2019.
28. Gray GC, Callahan JD, Hawksworth AW, Fisher CA, Gaydos JC. Respiratory diseases among U.S. military personnel: countering emerging threats. Emerg Infect Dis. 1999;5(3):379-385. doi:10.3201/eid0503.990308
29. Beaumier CM, Gomez-Rubio AM, Hotez PJ, Weina PJ. United States military tropical medicine: extraordinary legacy, uncertain future. PLoS Negl Trop Dis. 2013;7(12):e2448. doi:10.1371/journal.pntd.0002448
30. Thomas RJ, Conwill DE, Morton DE, et al. Penicillin prophylaxis for streptococcal infections in the United States Navy and Marine Corps recruit camps, 1951-1985. Rev Infect Dis. 1988;10(1):125-130. doi:10.1093/clinids/10.1.125
31. Tucker MH, Lomas CM, Ramchandar N, Waldram JD. Amoxicillin challenge without penicillin skin testing in evaluation of penicillin allergy in a cohort of Marine recruits. J Allergy Clin Immunol Pract. 2017;5(3):813-815. doi:10.1016/j.jaip.2017.01.023
32. Blumenthal KG, Shenoy ES, Wolfson AR, et al. Addressing inpatient beta-lactam allergies: a multihospital implementation. J Allergy Clin Immunol Pract. 2017;5(3):616-625. doi:10.1016/j.jaip.2017.02.019
33. Kuruvilla M, Shih J, Patel K, Scanlon N. Direct oral amoxicillin challenge without preliminary skin testing in adult patients with allergy and at low risk with reported penicillin allergy. Allergy Asthma Proc. 2019;40(1):57-61. doi:10.2500/aap.2019.40.4184
34. Banks TA, Tucker M, Macy E. Evaluating penicillin allergies without skin testing. Curr Allergy Asthma Rep. 2019;19(5):27. doi:10.1007/s11882-019-0854-6
35. Park M, Markus P, Matesic
Antibiotics are one of the most frequently prescribed medications in both inpatient and outpatient settings.1,2 More than 266 million courses of antibiotics are prescribed annually in the outpatient setting; 49.9% of hospitalized patients were prescribed ≥ 1 antibiotic during their hospitalization.1,2 Among all classes of antibiotics, penicillins are prescribed due to their clinical efficacy, cost-effectiveness, and general safety for all ages. Unfortunately, penicillins also are the most common drug allergy listed in medical records. Patients with this allergy are consistently treated with broad-spectrum antibiotics, have more antibiotic resistant infections, incur higher health care costs, and experience more adverse effects (AEs).3,4
Drug allergies are distinguished by different immune mechanisms, including IgE-mediated reaction, T-lymphocyte-mediated mild skin reactions, and severe cutaneous adverse reactions (SCAR), or other systemic immune syndromes, such as hemolytic anemia, nephritis, and rash with eosinophilia.3 Although drug allergies should be a concern, compelling evidence shows that > 90% of patients labeled with a penicillin allergy are not allergic to penicillins (and associated β-lactams).3,4 Although this evidence is growing, clinicians still hesitate to prescribe penicillin, and patients are similarly anxious to take them. This article reviews the health care consequences of penicillin allergy and the application of this information to military medicine and readiness.
Penicillin Allergy Prevalence
Since their approval for public use in 1945, penicillins have been one of the most often prescribed antibiotics due to their clinical efficacy for many types of infections.3 However, 8 to 10% of the US population and up to 15% of hospitalized patients have a documented penicillin allergy, which limits the ability to use these effective antibiotics.3,4 Once a patient is labeled with a penicillin allergy, many clinicians avoid prescribing all β-lactam antibiotics to patients. Clinicians also avoid prescribing cephalosporins due to the concern for potential cross-reactivity (at a rate of about 2%, which is lower than previously reported).3 These reported allergies are often not clear and range from patients avoiding penicillins because their parents exhibited allergies, they had a symptom that was not likely allergic (ie, nausea, headache, itching with no rash), being told by their parents that they had a rash as a child, or experiencing severe anaphylaxis or other systemic reaction.3,4 Despite the high rates of documented penicillin allergy, studies now show that most patients do not have a serious allergy; < 1% of the population has a true immune-mediated penicillin allergy.3,4
Broad-Spectrum Antibiotic Risks
Even though penicillin allergies are often not confirmed, many patients are treated with alternative antibiotics. Unfortunately, most alternative antibiotics are not as effective or as safe as penicillin.3,4 Twenty percent of hospitalized patients will experience an AE related to their antibiotic; 19.3% of emergency department visits for adverse drug reactions (ADRs) are from antibiotics.5,6 Sulfonamides, clindamycin, and quinolones were the antibiotics most commonly associated with AEs.6
In a large database study over a 3-year period, > 400,000 hospitalizations were analyzed in patients matched for admission type, with and without a penicillin allergy in their medical record.7 Those with a documented penicillin allergy had longer hospitalizations; were treated with broad-spectrum antibiotics; and had increased rates of Clostridium difficile (C difficile), methicillin-resistant Staphylococcus aureus (MRSA), and vancomycin-resistant Enterococcus (VRE).7,8 In addition to being first-line treatment for many common infections, penicillins often are used for dental, perinatal, and perioperative prophylaxis.1,3 Nearly 25 million antibiotics are prescribed annually by dentists.1 If a patient has a penicillin allergy listed in their medical record, they will inevitably receive a second- or third-line treatment that is less effective and has higher risks. Common alternative antibiotics include clindamycin, fluoroquinolones, macrolides, and vancomycin.3,7,8
Clindamycin and fluoroquinolones are associated with C difficile infections.9,10 Fluoroquinolones come with a boxed warning for known serious ADRs, including tendon rupture, peripheral neuropathy, central nervous system effects, and are known for causing cardiac reactions such as QT prolongation, life-threatening arrhythmias, and cardiovascular death.11,12 Fluoroquinolones are associated with an increased risk for VRE and MRSA, in more than any other antibiotic classes.3,7,12,13
Macrolides, such as azithromycin and clarithromycin, are another common class of antibiotics used as an alternative for penicillins. Both are used frequently for upper respiratory infections. Known ADRs to macrolides include gastrointestinal adverse effects (AEs) (ie, nausea, vomiting, diarrhea, and abdominal pain), liver toxicity (ie, abnormal liver function tests, hepatitis, and liver failure), and cardiac risks (ie, QT prolongation and sudden death). When compared with amoxicillin, there was an increased risk for cardiovascular mortality in those patients receiving macrolides.14,15
Vancomycin is known for its potential to cause “red man syndrome,” an infusion-related reaction causing redness and itching as well as nephrotoxic and hematologic effects requiring close monitoring.3 Vancomycin is less effective than methicillin in clearing MRSA or other sensitive pathogens; however, vancomycin is used in patients with a penicillin allergy label.16-18 Intrapartum antibiotic use of vancomycin for group B streptococcus infection was associated with clinically significant morbidity and ADRs.19,20 Perioperatively, patients with penicillin allergies developed more surgical site infections due to the use of second-line antibiotics, such as vancomycin or others.21
Cost of Penicillin Allergies
Penicillin allergy plays an important role in rising health care costs. In 2017, health care spending reached 17.9% of the gross domestic product.22 Macy and Contreras demonstrated the significantly higher costs associated with having a reported (and unverified) penicillin allergy in a matched cohort study. Inferred for the extra hospital use, the penicillin allergy group cost the health care system $64,626,630 more than for the group who did not have a penicillin allergy label.7 A subsequent study by Macy and Contreras of both inpatient and outpatient settings showed a potential savings of $2,000 per patient per year in health care expenses with the testing and delabeling of penicillin allergies.23 Use of newer and broad-spectrum antibiotics also are more costly and contribute to higher health care costs.24
When these potential savings are applied to the military insurance population of 9.4 million beneficiaries (TRICARE, including active duty, their dependents, and all retirees participating in the program), the results showed that this could impart a savings of nearly $1.7 billion annually, using the model by Macy and Contreras.23,25,26
Previously with colleagues, I reviewed penicillin’s role in military history, compiled data from relevant studies from military penicillin allergy rates and delabeling efforts, and calculated the potential economic impact of penicillin allergies along with the benefits of testing.26 Calculations were estimated using the TRICARE beneficiary population (9.4 million) × the estimated prevalence (10%) to get an estimate of 940,000 TRICARE patients with penicillin allergy in their medical record.25 If 90% of those patients were delabeled, this would equal 846,000 TRICARE patients. When multiplied by the potential savings of $2,000 per patient per year, the estimated savings would be $1,692,000,000 annually.23,26
Current literature provides compelling evidence that all health care plans should use penicillin allergy testing and delabeling programs.3,23,26 As most patients with a history of penicillin allergy in their medical records do not have a verified allergy, delabeling those who do not have a true allergy will have individual, public health, and cost benefits.3,7,23,26
Antibiotic Stewardship
Antibiotic stewardship programs are now mandated to combat antibiotic resistance.3,27 This program is supported by major medical organizations, including the Centers for Disease Control and Prevention, Society for Healthcare Epidemiology of America, Infectious Disease Society of America, and the American Academy of Allergy Asthma and Immunology.3 Given the role of broad-spectrum antibiotics in antibiotic resistance, penicillin allergy testing and delabeling is an important component of these programs.3
In the US, > 2 million people acquire antibiotic resistant infections annually; 23,000 people die of these infections.27 More than 250,000 illnesses and 14,000 deaths annually are due to C difficile.27 There are many factors contributing to the increase in antibiotic resistance; however, one established and consistent factor is the use of broad-spectrum antibiotics. Further, broad-spectrum antibiotics are often used when first-line agents, such as penicillins, cannot be used due to a reported “allergy.” In addition, there are fewer novel antibiotics being developed, and as they are introduced, pathogens develop resistance to these new agents.27
Military Relevance
Infectious diseases have always accompanied military activity.28-30 Despite preventive programs such as vaccinations, hygiene measures, and prophylactic antibiotics, military personnel are at increased risk for infections due to the military’s mobile nature and crowded living situations.28-30 This situation has operational relevance from basic training, deployments, and combat operations to peacetime activities.
Military recruits are treated routinely with penicillin G benzathine as standard prophylaxis against streptococcal infections.26,30 A recent study by the Marine Corps Recruiting Depot in San Diego, California showed that in a cohort of 402 young healthy male recruits, only 5 (1.5%) had a positive reaction to penicillin testing and challenge over a 21-month period.31 The delabeled other 397 (98.5%) marine recruits were able to receive benzathine penicillin prophylaxis successfully.31 Recruits with a penicillin allergy who had a positive test or were not tested received azithromycin (or erythromycin at some recruit training locations).26,31 Military members may need to operate in remote or austere locations; the ability to use penicillins is important for readiness.
Evaluation and Management of Reported Penicillin Allergy
Verifying penicillin allergies is an important first step in optimizing medical care and decreasing resistance and ADRs.3,4,32,33 Although allergists can provide specialized evaluation, due to the high prevalence of penicillin allergy in the US, all health care team members, including clinicians and pharmacists, should be educated about penicillin allergies and be able to implement evaluations in both inpatient and outpatient settings. Reactions to any of the penicillins should be considered, including the natural penicillins (penicillin V, etc), antistaphylococcal penicillins (dicloxacillin), aminopenicillins (amoxicillin and ampicillin), and extended-spectrum penicillins (piperacillin).3 A thorough history, including the prior reaction (age, type of reaction) and subsequent tolerance are helpful in stratifying patients.3,26
Patient Risk Levels
Based on the clinical history, patients would fall into 4 categories from low risk, medium risk, high risk, to do not test/use.3,32,33 Low-risk patients are those who report mild or nonallergic symptoms (ie, gastrointestinal symptoms, headache, yeast infection, etc), remote cutaneous reactions (> 10 years), or in those with a family history of penicillin allergy.3,32,33 Low-risk patients often can be safely tested with an oral challenge. Although there are different approaches to the oral challenge, a single amoxicillin dose of 250 mg followed by 1 hour of direct monitoring is usually sufficient.3,32,33
Medium-risk patients have a more recent (< 1 year) history of pruritic rashes, urticaria, and/or angioedema without a history of severe or systemic reactions. These patients benefit from negative skin testing prior to an oral challenge, which can be performed by trained clinicians or pharmacists or an allergist. However, due to limited availability of skin testing and the potential for false positive testing with skin tests, a single dose or graded challenge would be a reasonable approach as well.3,32,33
High-risk patients are those with severe symptoms (anaphylaxis), a history of reactions to other β-lactam antibiotics, and/or recurrent reactions to antibiotics. These patients benefit from a formal evaluation by an allergist and skin testing prior to challenge.3,32,33 Testing and/or challenge should not be performed in patients who report a history of severe cutaneous reactions (blistering rash, such as Stevens Johnson syndrome), hemolytic anemia, serum sickness, drug fever, and other organ dysfunction.3,4,31,32
The Figure describes a published questionnaire, personnel, resources, and procedures for penicillin delabeling.26 Although skin testing is reliable in revealing a immunoglobulin E-mediated penicillin allergy, there is potential for false positives.32,33 The oral amoxicillin challenge effectively clears the patient for future penicillin administration.3,32-34 In high-risk patients, desensitization should be considered if penicillins (or cephalosporins) are required as first-line treatment. A test dose (one-tenth dose, higher or lower depending on route of administration, historic reaction, clinical status, and level of certainty of prior reaction) may be considered in low- to moderate-risk patients, depending on the indication for the use of the antibiotics.32
Penicillin evaluation pathways can occur in both inpatient and outpatient settings where antibiotics will be prescribed.32-34 There are several proposed pathways, including a screening questionnaire to determine the penicillin allergy risk.26,32,33 Implementation of perioperative testing has been successful in decreasing the rates of vancomycin use and lessening the morbidity associated with use of second-line antibiotics.35 Many hospitals throughout the country have implemented standardized penicillin delabeling programs.3,32-34
Conclusions
Penicillin allergies are an important barrier to effective antibiotic treatments and are associated with worse outcomes and higher economic costs.3,7,23,26,34 Therefore, in addition to vaccinations, infection control measures, and public health education, penicillin allergy verification and delabeling programs should be a proactive component of military medical readiness and all antibiotic stewardship initiatives in all health care settings.29 Given the many issues and negative impact of having a penicillin allergy label, penicillin delabeling will allow service members to be treated with the necessary antibiotics with fewer adverse complications, and return them to health and readiness for operational duties. In the current standardization of the Defense Health Agency, implementing this program across all services would have significant clinical, public health, and cost benefits for patients, the health care team, taxpayers, and the community at large.
Many patients report an allergy to penicillin, but only a small portion have a current true immune-mediated allergy. Given the clinical, public health, and economic costs associated with a penicillin allergy label, evaluation and clearance of penicillin allergies is a simple method that would improve clinical outcomes, decrease AEs to high-risk alternative broad-spectrum antibiotics, and prevent the spread of antibiotic resistance. In the military, penicillin delabeling improves readiness with optimal antibiotic options and avoidance of unnecessary risks of using alternative antibiotics, expediting return to full duty for military personnel.
1. Centers for Disease Control and Prevention. Outpatient antibiotic prescriptions-United States, 2014. https://www.cdc.gov/antibiotic-use/community/pdfs/annual-reportsummary_2014.pdf. Accessed August 15, 2020.
2. Magill SS, Edwards JR, Beldavs ZG, et al. Prevalence of antimicrobial use in US acute care hospitals, May-September 2011. JAMA. 2014;312(14):1438-1446. doi:10.1001/jama.2014.12923
3. Shenoy ES, Macy E, Rowe T, Blumenthal KG. Evaluation and management of penicillin allergy. JAMA. 2019;321:188-199. doi:10.1001/jama.2018.19283
4. Har D, Solensky R. Penicillin and beta-lactam hypersensitivity. Immunol Allergy Clin North Am. 2017;37(4):643-662. doi:10.1016/j.iac.2017.07.001
5. Tamma PD, Avdic E, Li DX, Dzintars K, Cosgrove SE. Association of adverse events with antibiotic use in hospitalized patients. JAMA Intern Med. 2017;177(9):1308-1315. doi:10.1001/jamainternmed.2017.1938
6. Shebab N, Patel PR, Srinivasan A, Budnitz DS. Emergency department visits for antibiotic-associated adverse events. Clin Infect Dis. 2008;47(6):735-743. doi:10.1086/591126
7. Macy E, Contreras R. Healthcare use and serious infection prevalence associated with penicillin “allergy” in hospitalized patients: a cohort study. J Allergy Clin Immunol. 2014;133(3):790-796. doi:10.1016/j.jaci.2013.09.021
8. Blumenthal KG, Lu N, Zhang Y, Li Y, Walensky RP, Choi HK. Risk of methicillin resistant Staphylococcal aureus and Clostridium difficile in patients with a documented penicillin allergy: population-based matched cohort study. BMJ. 2018;361:k2400. doi:10.1136/bmj.k2400
9. Loo VG, Poirier L, Miller MA, et al. A predominantly clonal multi-institutional outbreak of Clostridium difficile associated diarrhea with high morbidity and mortality. N Engl J Med. 2005;353(23):2442-2449. doi:10.1056/NEJMoa051639
10. Pepin J, Saheb N, Coulombe MA, et al. Emergence of fluoroquinolone as the predominant risk factor for Clostridium difficile-associated diarrhea: a cohort study during an epidemic in Quebec. Clin Infect Dis. 2005;41(9):1254-1260. doi:10.1086/496986
11. Chou HW, Wang JL, Chang CH, et al. Risks of cardiac arrhythmia and mortality among patients using new-generation macrolides, fluoroquinolones, and β-lactam/β-lactamase inhibitors: a Taiwanese nationwide study. Clin Infec Dis. 2015;60(4):566-577. doi:10.1093/cid/ciu914
12. Rao GA, Mann JR, Shoaibi A, et al. Azithromycin and levofloxacin use and increased risk of cardiac arrhythmia and death. Ann Fam Med. 2014;12(2):121-127. doi:10.1370/afm.1601
13. LeBlanc L, Pepin J, Toulouse K, et al. Fluoroquinolone and risk for methicillin-resistant Staphylococcus aureus, Canada. Emerg Infect Dis. 2006;12(9):1398-1405. doi:10.3201/eid1209.060397
14. Schembri S, Williamson PA, Short PM, et al. Cardiovascular events after clarithromycin use in lower respiratory tract infections: analysis of two prospective cohort studies. BMJ. 2013;346:f1245. doi:10.1136/bmj.f1235
15. Ray WA, Murray KT, Hall K, Arbogast PG, Stein CM. Azithromycin and the risk of cardiovascular death. N Engl J Med. 2012;366(20):1881-1890. doi:10.1056/NEJMoa1003833
16. McDaniel JS, Perencevich EN, Diekema DJ, et al. Comparative effectiveness of beta-lactams versus vancomycin for treatment of methicillin-susceptible Staphylococcus aureus bloodstream infections among 122 hospitals. Clin Infect Dis. 2015;61(3):361-367. doi:10.1093/cid/civ308
17. Wong D, Wong T, Romney M, Leung V. Comparison of outcomes in patients with methicillin-susceptible Staphylococcus aureus (MSSA) bacteremia who are treated with β-lactam vs vancomycin empiric therapy: a retrospective cohort study. BMC Infect Dis. 2016;16:224. doi:10.1186/s12879-016-1564-5
18. Blumenthal KG, Shenoy ES, Huang M, et al. The impact of reporting a prior penicillin allergy on the treatment of methicillin-sensitivity Staphylococcus aureus bacteremia. PLoS One. 2016;11(7):e0159406. doi:10.1371/journal.pone.0159406
19. Verani JR, McGee L, Schrag SJ; . Prevention of perinatal group B streptococcal disease. MMWR Recomm Rep. 2010;59(RR-10):1-36.
20. Desai SH, Kaplan MS, Chen Q, Macy EM. Morbidity in pregnant women associated with unverified penicillin allergies, antibiotic use, and group B Streptococcus infections. Perm J. 2017;21:16-080. doi:10.7812/TPP/16-080
21. Blumenthal KG, Ryan EE, Li Y, Lee H, Kuhlen JL, Shenoy ES. The impact of a reported penicillin allergy on surgical site infection risk. Clin Infect Dis. 2018;66(3):329-336. doi:10.1093/cid/cix794
22. National Health Expenditures 2017 Highlights. Centers for Medicare & Medicaid services. https://www.cms.gov/Research-Statistics-Data-and-Systems/Statistics-Trends-and-Reports/NationalHealthExpendData/Downloads/highlights.pdf. Accessed August 25, 2020.
23. Macy E, Shu YH. The effect of penicillin allergy testing on future health care utilization: a matched cohort study. J Allergy Clin Immunol Pract. 2017;5(3):705-710. doi:10.1016/j.jaip.2017.02.012
24. Picard M, Begin P, Bouchard H, et al. Treatment of patients with a history of penicillin allergy in a large tertiary-care academic hospital. J Allergy Clin Immunol Pract. 2013;1(3):252-257. doi:10.1016/j.jaip.2013.01.006
25. US Department of Defense. Beneficiary population statistics. https://health.mil/I-Am-A/Media/Media-Center/Patient-Population-Statistics. Accessed August 25, 2020.
26. Lee RU, Banks TA, Waibel KH, Rodriguez RG. Penicillin allergy…maybe not? The military relevance for penicillin testing and de-labeling. Mil Med. 2019;184(3-4):e163-e168. doi:10.1093/milmed/usy194
27. Antibiotic resistance threats in the United States, 2013. Centers for Disease Control and Prevention. https://www.cdc.gov/drugresistance/threat-report-2013/index.html. Accessed May 10, 2019.
28. Gray GC, Callahan JD, Hawksworth AW, Fisher CA, Gaydos JC. Respiratory diseases among U.S. military personnel: countering emerging threats. Emerg Infect Dis. 1999;5(3):379-385. doi:10.3201/eid0503.990308
29. Beaumier CM, Gomez-Rubio AM, Hotez PJ, Weina PJ. United States military tropical medicine: extraordinary legacy, uncertain future. PLoS Negl Trop Dis. 2013;7(12):e2448. doi:10.1371/journal.pntd.0002448
30. Thomas RJ, Conwill DE, Morton DE, et al. Penicillin prophylaxis for streptococcal infections in the United States Navy and Marine Corps recruit camps, 1951-1985. Rev Infect Dis. 1988;10(1):125-130. doi:10.1093/clinids/10.1.125
31. Tucker MH, Lomas CM, Ramchandar N, Waldram JD. Amoxicillin challenge without penicillin skin testing in evaluation of penicillin allergy in a cohort of Marine recruits. J Allergy Clin Immunol Pract. 2017;5(3):813-815. doi:10.1016/j.jaip.2017.01.023
32. Blumenthal KG, Shenoy ES, Wolfson AR, et al. Addressing inpatient beta-lactam allergies: a multihospital implementation. J Allergy Clin Immunol Pract. 2017;5(3):616-625. doi:10.1016/j.jaip.2017.02.019
33. Kuruvilla M, Shih J, Patel K, Scanlon N. Direct oral amoxicillin challenge without preliminary skin testing in adult patients with allergy and at low risk with reported penicillin allergy. Allergy Asthma Proc. 2019;40(1):57-61. doi:10.2500/aap.2019.40.4184
34. Banks TA, Tucker M, Macy E. Evaluating penicillin allergies without skin testing. Curr Allergy Asthma Rep. 2019;19(5):27. doi:10.1007/s11882-019-0854-6
35. Park M, Markus P, Matesic
Evaluation of Glycemic Control and Cost Savings Associated With Liraglutide Dose Reduction at a Veterans Affairs Hospital
Glucagon-like peptide 1 receptor agonists (GLP-1 RAs) are injectable incretin hormones approved for the treatment of type 2 diabetes mellitus (T2DM). They are highly efficacious agents with hemoglobin A1c (HbA1c) reduction potential of approximately 0.8 to 1.6% and mechanisms of action that result in an average weight loss of 1 to 3 kg.1,2 Published in 2016, The LEADER (Liraglutide Effect and Action in Diabetes: Evaluation of Cardiovascular Outcome Results) trial established cardiovascular benefits associated with liraglutide, making it a preferred GLP-1 RA.3
In addition to HbA1c reduction, weight loss, and cardiovascular benefits, liraglutide also has shown insulin-sparing effects when used in combination with insulin. A trial by Lane and colleagues revealed a 34% decrease in total daily insulin dose 6 months after the addition of liraglutide to insulin in patients with T2DM receiving > 100 units of insulin daily.4 When used in combination with basal insulin analogues (glargine or detemir) similar findings also were shown.5
The Michael E. DeBakey Veterans Affairs Medical Center (MEDVAMC) in Houston, Texas, selected liraglutide as its preferred GLP-1 RA because of its favorable glycemic and cardiovascular outcomes. In addition, as part of a cost-savings initiative for fiscal year 2018, liraglutide 6 mg/mL injection 2-count pen packs was selected as the preferred liraglutide product. Before the availability of the 2-count pen packs, veterans previously received 3-count pen packs, which allowed for up to a 30-day supply of liraglutide 1.8 mg daily dosing. However, the cost-efficient 2-count pen packs allow for up to 1.2 mg daily dose of liraglutide for a 30-day supply. Due to these changes, veterans at MEDVAMC were converted from liraglutide 1.8 mg daily to 1.2 mg daily between May 2018 and August 2018.
The primary objective of this study was to assess sustained glycemic control and cost savings that resulted from this change. The secondary objectives were to assess sustained weight loss and adverse effects (AEs).
Methods
This study was approved by the MEDVAMC Quality Assurance and Regulatory Affairs committee. In this single-center study, a retrospective chart review was conducted on veterans with T2DM who underwent a liraglutide dose reduction from 1.8 mg daily to 1.2 mg daily between May 2018 and August 2018. Patients were included if they were aged ≥ 18 years with an active prescription for liraglutide 1.8 mg daily and insulin (with or without other antihyperglycemic agents) at the time of conversion. In addition, patients must have had ≥ 1 HbA1c reading within 3 months of the dose conversion and a follow-up HbA1c within 6 months after the dose conversion. To assess the primary objective of glycemic control that resulted from the liraglutide dose reduction, mean change of HbA1c at time of dose conversion was compared with mean HbA1c 6 months postconversion. To assess savings, cost information was obtained from the US Department of Veterans Affairs (VA) Drug Price Database and monthly and annual costs of liraglutide 6 mg/mL injection 2-count pen pack were compared with that of the 3-count pen pack. A chart review of patients’ electronic health records assessed secondary outcomes. The VA Computerized Patient Record System (CPRS) was used to collect patient data.
Patients and Characteristics
The following patient information was obtained from patients’ records: age, sex, race/ethnicity, diabetic medications (at time of conversion and 6 months after conversion), cardiovascular history and risk factors (hypertension, coronary artery disease, heart failure, arrhythmias, peripheral artery disease, obesity, etc), prescriber type (physician, nurse practitioner/physician assistant, pharmacist, etc), weight (at baseline, at time of conversion, and 6 months after conversion), HbA1c (at baseline, at time of conversion, and 6 months after conversion), average blood glucose (at baseline, at time of conversion, and 6 months after conversion), insulin dose (at time of conversion and 6 months after conversion), and reported AEs.
Statistical Analysis
The 2-tailed, paired t test was used to assess changes in HbA1c, average blood glucose, and body weight. Demographic data and other outcomes were assessed using descriptive statistics.
Results
Prior to the dose reduction, 312 veterans had active prescriptions for liraglutide 1.8 mg daily. Due to lack of glycemic control benefit (failing to achieve a HbA1c reduction of at least 0.5% after at least 3 to 6 months following initiation of therapy) or nonadherence (assessed by medication refill history), 126 veterans did not meet the criteria for the dose conversion. As a result, liraglutide was discontinued, and veterans were sent patient letter notifications and health care providers were notified via medication review notes in the patient electronic health record “to make medication adjustments if warranted. A total of 186 veterans underwent a liraglutide dose reduction between May and August 2018. Thirty-two veterans were without active insulin prescriptions, 53 were without HbA1c results, and 4 veterans died; resulting in 97 veterans who were included in the study (Figure 1).
Most of the patients included in the study were male (90.7%) and White (63.9%) with an average (SD) age of 65.9 years (7.9) and a mean (SD) HbA1c at baseline of 8.4% (1.2). About 56.7% received concurrent T2DM treatment with metformin, and 8.3% received concurrent treatment with empagliflozin. The most common cardiovascular disease/risk factors included hypertension (93.8%), hyperlipidemia (85.6%), and obesity (85.6%) (Table 1).
Glycemic Control and Weight Loss
At the time of conversion, the average (SD) HbA1c was 8.2% (1.4) and increased to an average (SD) of 8.7% (1.8) (P =.0005) 6 months after the dose reduction (Table 2). The average (SD) body weight was 116.2 kg (23.2) at time of conversion and increased to 116.5 (24.6) 6 months following the dose reduction; however, the difference was not statistically significant (P = .8).
As a result of the HbA1c change, 41.2% of veterans underwent an insulin dose increase with dose increase of 5 to 200 units of total daily insulin during the 6-month period. Antihyperglycemic regimen remained unchanged for 40.2% of veterans, while additional glucose lowering agents were initiated in 6 veterans. Medications initiated included empagliflozin in 4 veterans and saxagliptin in 2 veterans.

HbA1c reduction was noted in 33% of veterans (Figure 2) mostly due to improved diet and exercise habits. A majority of veterans, 62%, experienced an increase in HbA1c, whereas 5.2% of veterans maintained the same HbA1c. Of 60 veterans with HbA1c increases, 15 had an increase between 0.1% and 0.5%, another 15 with an increase between 0.5 to 0.9%, and half had HbA1c increases of at least 1% with a maximum increase of 5.1% (Figure 3).
Cost Savings
Cost information was obtained from the VA Drug Price Database. The estimated monthly cost savings per patient associated with the conversion from 3-count to 2-count injection pen packs of liraglutide 6 mg/mL was $103.46. With 186 veterans converted to the 2-count pen packs, MEDVAMC saved $115,461.36 in a 6-month period. The estimated annualized cost savings was estimated to be about $231,000 (Figure 4).
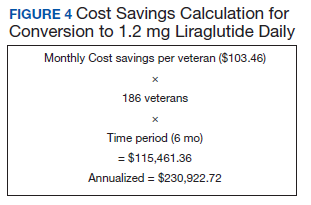
Adverse Effects During the 6-month period following the dose conversion, no major AEs associated with liraglutide were documented. Documented AEs included 3 cases of diarrhea, resulting in the discontinuation of metformin. Metformin also was discontinued in a veteran with worsened renal function and eGFR < 30 mL/min/1.73 m2.
Discussion
According to previous clinical trials, when used in combination with insulin, 1.2 mg and 1.8 mg daily liraglutide showed significant improvement in glycemic control and body weight and was associated with decreased insulin requirements.4-6 However, subgroup analyses were not performed to show differences in benefit between the liraglutide 1.8 mg and 1.2 mg groups.4-6 Similarly, cardiovascular benefit was observed in patients receiving liraglutide 1.2 mg daily and liraglutide 1.8 mg daily in the LEADER trial with no subgroup analysis or distinction between treatment doses.3 With this information and approval by the Veterans Integrated Services Network, the pharmacoeconomics team at MEDVAMC made the decision to select a more cost-efficient preparation and, hence, lower dose of liraglutide.
To ensure that patients only taking liraglutide for glycemic control were captured, patients without insulin therapies at baseline were excluded. Due to concerns of potential off-label use of liraglutide for weight loss, patients without active prescriptions for insulin at baseline were excluded.
A mean HbA1c increase of 0.5% was observed over the 6-month period, supporting findings of a dose-dependent HbA1c decrease observed in clinical trials. In the LEAD-3 MONO trial when used as monotherapy, liraglutide 1.8 mg was associated with significantly greater HbA1c reduction than liraglutide 1.2 mg (–0·29%; –0·50 to –0.09, P = .005) after 52 weeks of treatment.7 Liraglutide 1.8 mg was also associated with higher rates of AEs; particularly gastrointestinal. 7 To minimize these AEs, it is recommended to initiate liraglutide at 0.6 mg daily for a week then increase to 1.2 mg daily. If tolerated, liraglutide can be further titrated to 1.8 mg daily to optimize glycemic control.8 Unsurprisingly, no major AEs were noted in this study, as AEs are typically noted with increased doses.
Despite the observed trend of increased HbA1c, no changes were made to glucoselowering agents in 39 veterans. This group of veterans consisted primarily of those whose HbA1c remained unchanged during the 6-month period, those whose HbA1c improved (with no documented hypoglycemia), and older veterans with less stringent HbA1c goals. As a result, doses of glucose lowering agents were maintained as appropriate.
No significant difference was noted in body weight during the 6-month period. The slight weight gain observed may have been due to several factors. Lack of exercise and dietary changes may have contributed to weight gain. In addition, insulin doses were increased in 40 veterans, which may have contributed to the observed weight gain.
As expected, significant cost savings were achieved as a result of the liraglutide dose reduction. Of note, liraglutide was discontinued in 126 veterans (prior to the dose reduction) due to nonadherence or inadequate response to therapy, which also resulted in additional savings. Although cost savings was achieved, the long-term benefit of this initiative still remains unknown. The worsened glycemic control that was detected may increase the risk of microvascular and macrovascular complications, thereby negating cost savings achieved. To assess this effect, longterm prospective studies are warranted.
Limitations
A number of issues limit these finding, including its retrospective data review, small sample size, additional factors contributing to HbA1c increase, and missing documentation in some patient records. Only 97 patients were included in the study, reflecting less than half of the charts reviewed (52% exclusion rate). In addition, several confounding factors may have contributed to the increased HbA1c observed. Medication changes and lifestyle factors may have contributed to the observed change in HbA1c levels. Exclusion of patients without active prescriptions for insulin may have contributed to a selection bias, as most patients included in the study were veterans with uncontrolled T2DM requiring insulin. Finally, as a retrospective study involving patient records, investigators relied heavily on information provided in patients’ charts (HbA1c, body weight, insulin doses, adverse effects, etc), which may not entirely be accurate and may have been missing other pertinent information.
Conclusions
The daily dose reduction of liraglutide from 1.8 mg to 1.2 mg due to a cost-savings initiative resulted in a HbA1c increase of 0.5% in a 6-month period. Due to HbA1c increases, 41.2% of veterans underwent an insulin dose increase, negating the insulin-sparing role of liraglutide. Although this study further confirms the dose-dependent HbA1c reduction with liraglutide that has been noted in previous trials, long-term prospective studies and cost-effectiveness analyses are warranted to assess the overall clinical significance and other benefits of the change, including its effects on cardiovascular outcomes.
1. American Diabetes Association. Pharmacologic approaches to glycemic treatment. Diabetes Care. 2019;42(suppl 1):S90-S102. doi:10.2337/dc19-S009
2. Hinnen D. Glucagon-like peptide 1 receptor agonists for type 2 diabetes. Diabetes Spectr. 2017;30(3):202-210. doi:10.2337/ds16-0026
3. Marso SP, Daniels GH, Brown-Frandsen K, et al. Liraglutide and cardiovascular outcomes in type 2 diabetes. N Engl J Med. 2016;375(4):311-322. doi:10.1056/NEJMoa1603827
4. Lane W, Weinrib S, Rappaport J, Hale C. The effect of addition of liraglutide to high-dose intensive insulin therapy: a randomized prospective trial. Diabetes Obes Metab. 2014;16(9):827-832. doi:10.1111/dom.12286
5. Ahmann A, Rodbard HW, Rosenstock J, et al. Efficacy and safety of liraglutide versus placebo added to basal insulin analogues (with or without metformin) in patients with type 2 diabetes: a randomized, placebo-controlled trial. Diabetes Obes Metab. 2015;17(11):1056-1064. doi:10.1111/dom.12539
6. Lane W, Weinrib S, Rappaport J. The effect of liraglutide added to U-500 insulin in patients with type 2 diabetes and high insulin requirements. Diabetes Technol Ther. 2011;13(5):592-595. doi:10.1089/dia.2010.0221
7. Garber A, Henry R, Ratner R, et al. Liraglutide versus glimepiride monotherapy for type 2 diabetes (LEAD-3 Mono): a randomised, 52-week, phase III, double-blind, parallel-treatment trial. Lancet. 2009;373(9662):473-481. doi:10.1016/S0140-6736(08)61246-5.
8. Victoza [package insert]. Princeton: Novo Nordisk Inc; 2020.
Glucagon-like peptide 1 receptor agonists (GLP-1 RAs) are injectable incretin hormones approved for the treatment of type 2 diabetes mellitus (T2DM). They are highly efficacious agents with hemoglobin A1c (HbA1c) reduction potential of approximately 0.8 to 1.6% and mechanisms of action that result in an average weight loss of 1 to 3 kg.1,2 Published in 2016, The LEADER (Liraglutide Effect and Action in Diabetes: Evaluation of Cardiovascular Outcome Results) trial established cardiovascular benefits associated with liraglutide, making it a preferred GLP-1 RA.3
In addition to HbA1c reduction, weight loss, and cardiovascular benefits, liraglutide also has shown insulin-sparing effects when used in combination with insulin. A trial by Lane and colleagues revealed a 34% decrease in total daily insulin dose 6 months after the addition of liraglutide to insulin in patients with T2DM receiving > 100 units of insulin daily.4 When used in combination with basal insulin analogues (glargine or detemir) similar findings also were shown.5
The Michael E. DeBakey Veterans Affairs Medical Center (MEDVAMC) in Houston, Texas, selected liraglutide as its preferred GLP-1 RA because of its favorable glycemic and cardiovascular outcomes. In addition, as part of a cost-savings initiative for fiscal year 2018, liraglutide 6 mg/mL injection 2-count pen packs was selected as the preferred liraglutide product. Before the availability of the 2-count pen packs, veterans previously received 3-count pen packs, which allowed for up to a 30-day supply of liraglutide 1.8 mg daily dosing. However, the cost-efficient 2-count pen packs allow for up to 1.2 mg daily dose of liraglutide for a 30-day supply. Due to these changes, veterans at MEDVAMC were converted from liraglutide 1.8 mg daily to 1.2 mg daily between May 2018 and August 2018.
The primary objective of this study was to assess sustained glycemic control and cost savings that resulted from this change. The secondary objectives were to assess sustained weight loss and adverse effects (AEs).
Methods
This study was approved by the MEDVAMC Quality Assurance and Regulatory Affairs committee. In this single-center study, a retrospective chart review was conducted on veterans with T2DM who underwent a liraglutide dose reduction from 1.8 mg daily to 1.2 mg daily between May 2018 and August 2018. Patients were included if they were aged ≥ 18 years with an active prescription for liraglutide 1.8 mg daily and insulin (with or without other antihyperglycemic agents) at the time of conversion. In addition, patients must have had ≥ 1 HbA1c reading within 3 months of the dose conversion and a follow-up HbA1c within 6 months after the dose conversion. To assess the primary objective of glycemic control that resulted from the liraglutide dose reduction, mean change of HbA1c at time of dose conversion was compared with mean HbA1c 6 months postconversion. To assess savings, cost information was obtained from the US Department of Veterans Affairs (VA) Drug Price Database and monthly and annual costs of liraglutide 6 mg/mL injection 2-count pen pack were compared with that of the 3-count pen pack. A chart review of patients’ electronic health records assessed secondary outcomes. The VA Computerized Patient Record System (CPRS) was used to collect patient data.
Patients and Characteristics
The following patient information was obtained from patients’ records: age, sex, race/ethnicity, diabetic medications (at time of conversion and 6 months after conversion), cardiovascular history and risk factors (hypertension, coronary artery disease, heart failure, arrhythmias, peripheral artery disease, obesity, etc), prescriber type (physician, nurse practitioner/physician assistant, pharmacist, etc), weight (at baseline, at time of conversion, and 6 months after conversion), HbA1c (at baseline, at time of conversion, and 6 months after conversion), average blood glucose (at baseline, at time of conversion, and 6 months after conversion), insulin dose (at time of conversion and 6 months after conversion), and reported AEs.
Statistical Analysis
The 2-tailed, paired t test was used to assess changes in HbA1c, average blood glucose, and body weight. Demographic data and other outcomes were assessed using descriptive statistics.
Results
Prior to the dose reduction, 312 veterans had active prescriptions for liraglutide 1.8 mg daily. Due to lack of glycemic control benefit (failing to achieve a HbA1c reduction of at least 0.5% after at least 3 to 6 months following initiation of therapy) or nonadherence (assessed by medication refill history), 126 veterans did not meet the criteria for the dose conversion. As a result, liraglutide was discontinued, and veterans were sent patient letter notifications and health care providers were notified via medication review notes in the patient electronic health record “to make medication adjustments if warranted. A total of 186 veterans underwent a liraglutide dose reduction between May and August 2018. Thirty-two veterans were without active insulin prescriptions, 53 were without HbA1c results, and 4 veterans died; resulting in 97 veterans who were included in the study (Figure 1).
Most of the patients included in the study were male (90.7%) and White (63.9%) with an average (SD) age of 65.9 years (7.9) and a mean (SD) HbA1c at baseline of 8.4% (1.2). About 56.7% received concurrent T2DM treatment with metformin, and 8.3% received concurrent treatment with empagliflozin. The most common cardiovascular disease/risk factors included hypertension (93.8%), hyperlipidemia (85.6%), and obesity (85.6%) (Table 1).
Glycemic Control and Weight Loss
At the time of conversion, the average (SD) HbA1c was 8.2% (1.4) and increased to an average (SD) of 8.7% (1.8) (P =.0005) 6 months after the dose reduction (Table 2). The average (SD) body weight was 116.2 kg (23.2) at time of conversion and increased to 116.5 (24.6) 6 months following the dose reduction; however, the difference was not statistically significant (P = .8).
As a result of the HbA1c change, 41.2% of veterans underwent an insulin dose increase with dose increase of 5 to 200 units of total daily insulin during the 6-month period. Antihyperglycemic regimen remained unchanged for 40.2% of veterans, while additional glucose lowering agents were initiated in 6 veterans. Medications initiated included empagliflozin in 4 veterans and saxagliptin in 2 veterans.
HbA1c reduction was noted in 33% of veterans (Figure 2) mostly due to improved diet and exercise habits. A majority of veterans, 62%, experienced an increase in HbA1c, whereas 5.2% of veterans maintained the same HbA1c. Of 60 veterans with HbA1c increases, 15 had an increase between 0.1% and 0.5%, another 15 with an increase between 0.5 to 0.9%, and half had HbA1c increases of at least 1% with a maximum increase of 5.1% (Figure 3).
Cost Savings
Cost information was obtained from the VA Drug Price Database. The estimated monthly cost savings per patient associated with the conversion from 3-count to 2-count injection pen packs of liraglutide 6 mg/mL was $103.46. With 186 veterans converted to the 2-count pen packs, MEDVAMC saved $115,461.36 in a 6-month period. The estimated annualized cost savings was estimated to be about $231,000 (Figure 4).
Adverse Effects During the 6-month period following the dose conversion, no major AEs associated with liraglutide were documented. Documented AEs included 3 cases of diarrhea, resulting in the discontinuation of metformin. Metformin also was discontinued in a veteran with worsened renal function and eGFR < 30 mL/min/1.73 m2.
Discussion
According to previous clinical trials, when used in combination with insulin, 1.2 mg and 1.8 mg daily liraglutide showed significant improvement in glycemic control and body weight and was associated with decreased insulin requirements.4-6 However, subgroup analyses were not performed to show differences in benefit between the liraglutide 1.8 mg and 1.2 mg groups.4-6 Similarly, cardiovascular benefit was observed in patients receiving liraglutide 1.2 mg daily and liraglutide 1.8 mg daily in the LEADER trial with no subgroup analysis or distinction between treatment doses.3 With this information and approval by the Veterans Integrated Services Network, the pharmacoeconomics team at MEDVAMC made the decision to select a more cost-efficient preparation and, hence, lower dose of liraglutide.
To ensure that patients only taking liraglutide for glycemic control were captured, patients without insulin therapies at baseline were excluded. Due to concerns of potential off-label use of liraglutide for weight loss, patients without active prescriptions for insulin at baseline were excluded.
A mean HbA1c increase of 0.5% was observed over the 6-month period, supporting findings of a dose-dependent HbA1c decrease observed in clinical trials. In the LEAD-3 MONO trial when used as monotherapy, liraglutide 1.8 mg was associated with significantly greater HbA1c reduction than liraglutide 1.2 mg (–0·29%; –0·50 to –0.09, P = .005) after 52 weeks of treatment.7 Liraglutide 1.8 mg was also associated with higher rates of AEs; particularly gastrointestinal. 7 To minimize these AEs, it is recommended to initiate liraglutide at 0.6 mg daily for a week then increase to 1.2 mg daily. If tolerated, liraglutide can be further titrated to 1.8 mg daily to optimize glycemic control.8 Unsurprisingly, no major AEs were noted in this study, as AEs are typically noted with increased doses.
Despite the observed trend of increased HbA1c, no changes were made to glucoselowering agents in 39 veterans. This group of veterans consisted primarily of those whose HbA1c remained unchanged during the 6-month period, those whose HbA1c improved (with no documented hypoglycemia), and older veterans with less stringent HbA1c goals. As a result, doses of glucose lowering agents were maintained as appropriate.
No significant difference was noted in body weight during the 6-month period. The slight weight gain observed may have been due to several factors. Lack of exercise and dietary changes may have contributed to weight gain. In addition, insulin doses were increased in 40 veterans, which may have contributed to the observed weight gain.
As expected, significant cost savings were achieved as a result of the liraglutide dose reduction. Of note, liraglutide was discontinued in 126 veterans (prior to the dose reduction) due to nonadherence or inadequate response to therapy, which also resulted in additional savings. Although cost savings was achieved, the long-term benefit of this initiative still remains unknown. The worsened glycemic control that was detected may increase the risk of microvascular and macrovascular complications, thereby negating cost savings achieved. To assess this effect, longterm prospective studies are warranted.
Limitations
A number of issues limit these finding, including its retrospective data review, small sample size, additional factors contributing to HbA1c increase, and missing documentation in some patient records. Only 97 patients were included in the study, reflecting less than half of the charts reviewed (52% exclusion rate). In addition, several confounding factors may have contributed to the increased HbA1c observed. Medication changes and lifestyle factors may have contributed to the observed change in HbA1c levels. Exclusion of patients without active prescriptions for insulin may have contributed to a selection bias, as most patients included in the study were veterans with uncontrolled T2DM requiring insulin. Finally, as a retrospective study involving patient records, investigators relied heavily on information provided in patients’ charts (HbA1c, body weight, insulin doses, adverse effects, etc), which may not entirely be accurate and may have been missing other pertinent information.
Conclusions
The daily dose reduction of liraglutide from 1.8 mg to 1.2 mg due to a cost-savings initiative resulted in a HbA1c increase of 0.5% in a 6-month period. Due to HbA1c increases, 41.2% of veterans underwent an insulin dose increase, negating the insulin-sparing role of liraglutide. Although this study further confirms the dose-dependent HbA1c reduction with liraglutide that has been noted in previous trials, long-term prospective studies and cost-effectiveness analyses are warranted to assess the overall clinical significance and other benefits of the change, including its effects on cardiovascular outcomes.
1. American Diabetes Association. Pharmacologic approaches to glycemic treatment. Diabetes Care. 2019;42(suppl 1):S90-S102. doi:10.2337/dc19-S009
2. Hinnen D. Glucagon-like peptide 1 receptor agonists for type 2 diabetes. Diabetes Spectr. 2017;30(3):202-210. doi:10.2337/ds16-0026
3. Marso SP, Daniels GH, Brown-Frandsen K, et al. Liraglutide and cardiovascular outcomes in type 2 diabetes. N Engl J Med. 2016;375(4):311-322. doi:10.1056/NEJMoa1603827
4. Lane W, Weinrib S, Rappaport J, Hale C. The effect of addition of liraglutide to high-dose intensive insulin therapy: a randomized prospective trial. Diabetes Obes Metab. 2014;16(9):827-832. doi:10.1111/dom.12286
5. Ahmann A, Rodbard HW, Rosenstock J, et al. Efficacy and safety of liraglutide versus placebo added to basal insulin analogues (with or without metformin) in patients with type 2 diabetes: a randomized, placebo-controlled trial. Diabetes Obes Metab. 2015;17(11):1056-1064. doi:10.1111/dom.12539
6. Lane W, Weinrib S, Rappaport J. The effect of liraglutide added to U-500 insulin in patients with type 2 diabetes and high insulin requirements. Diabetes Technol Ther. 2011;13(5):592-595. doi:10.1089/dia.2010.0221
7. Garber A, Henry R, Ratner R, et al. Liraglutide versus glimepiride monotherapy for type 2 diabetes (LEAD-3 Mono): a randomised, 52-week, phase III, double-blind, parallel-treatment trial. Lancet. 2009;373(9662):473-481. doi:10.1016/S0140-6736(08)61246-5.
8. Victoza [package insert]. Princeton: Novo Nordisk Inc; 2020.
Long-Term Oxygen Therapy and Risk of Fire-Related Events
Chronic obstructive pulmonary disease (COPD) has been the third leading cause of death in the US since 2008.1 Current management of COPD includes smoking cessation, adequate nutrition, medication therapy, pulmonary rehabilitation, and vaccines.2 Outside of pharmacologic management, oxygen therapy has become a staple treatment of chronic hypoxemic respiratory failure due to COPD. Landmark trials, including the Nocturnal Oxygen Therapy Trial (NOTT) and Medical Research Council (MRC) study, demonstrated improved survival in patients with COPD and hypoxemia, particularly if these patients received oxygen for 18 hours per day.3,4 NOTT prospectively evaluated 203 patients at 6 centers who were randomly allocated to either continuous oxygen therapy or 12-hour nocturnal oxygen therapy. The overall mortality in the nocturnal oxygen therapy group was 1.94 times that in the continuous oxygen therapy group (P = .01).3 The MRC study included 87 patients who were randomized to oxygen therapy or no oxygen; risk of death was 12% per year in the treated group vs 29% per year in the control group (P = .04).4 The effectiveness of long-term oxygen therapy (LTOT) in active smokers continues to be a source of debate; although 50% of patients in the NOTT trial were smokers, there was no subgroup analysis of whether smoking status had an impact on survival in those on continuous oxygen therapy.
Although many therapies are available for the treatment of COPD, the most effective treatment to prevent the progression of COPD is smoking cessation. Resources like smoking cessation programs, nicotine patches, and medications, such as bupropion and varenicline, are available to aid smoking cessation.5 However, many patients are unable to quit tobacco use despite their best efforts using available resources, and they continue to smoke even with progressive COPD. Long-time smokers also are likely to continue smoking while on LTOT, which increases their risk for fire-related injury.6-8
Traditional indications are being scrutinized after the LTOT trial found no benefit with respect to time to death or first hospitalization among patients with stable COPD and resting or exercise-induced moderate desaturation.9
Although oxygen accelerates combustion and is a potential fire hazard, LTOT has been prescribed even to active smokers as the 2 landmark trials did not exclude patients who were active smokers from receiving oxygen therapy.3,4 Therefore, LTOT has traditionally been prescribed to veterans who are actively smoking, despite the fire hazard. Attempts at mitigating hazards related to oxygen therapy in active smokers include counseling extensively about safety measures (which includes avoiding open flames such as candles, large fires, or sparks when on LTOT and providing Home Safety Agreements—a written contract between prescriber and patient wherein the patient agrees to abide by the terms of the US Department of Veterans Affairs (VA) to mitigate hazards related to LTOT in order to receive LTOT (eAppendix
Methods
With this practice in mind, we conducted an institutional review board approved retrospective chart review of all veterans with diagnosis of COPD within the Central Texas Veterans Health Care System (CTVHCS) who were prescribed new LTOT between October 1, 2010 and September 30, 2015. Given the retrospective nature of the chart review, patient consent was not obtained. Inclusion criteria were veterans aged > 18 years who had a confirmed diagnosis of COPD by spirometry and who met criteria for either continuous or ambulation- only oxygen therapy.
Criteria for exclusion included patients with hypoxemia not solely attributable to COPD or due to diseases other than COPD. We reviewed encounters in these patients’ charts, including follow-up in the clinic of the providers prescribing oxygen, to assess for fire-related incidents, defined as events wherein fire was visualized by the patient or by individuals living with the patient and with report provided to medical equipment company providing oxygen; the patient did not have to seek medical care to qualify for fire-related incident. Of the 158 patients who met the criteria for inclusion in the study, 152 were male.
Statistics
Bayesian logistic regression was used to model the outcome variable fire-related incident with the predictors smoking status, age, race, depression, PTSD, and type of oxygen used. Mental health disorders have significant effect on substance use disorders, such as alcohol use. Depression and PTSD were more common mental health diagnoses found in our patient population. Additionally, due to the small sample size, these psychiatric diagnoses were chosen to evaluate the impact of mental health disorders on firerelated events.
Although the sample size of events was small, weakly informative normal priors (0, 2.5) were used to shrink parameter estimates toward 0 and minimize overfitting. Weakly informative normal priors have also been suggested to deal with the problem of quasi-complete separation, where in our case, both smoking and no-PTSD perfectly predicted the 9 fire-related incidents.10 All input variables were centered and scaled as recommended. 9 The model fit well as assessed by posterior predictive checks, and Rhat was 1.00 for all parameters, indicating that all chains converged. Analysis was completed in R version 3.5.1 using the ‘brms’ package for Bayesian modeling.11
Results
The mean age for the 158 included patients was 71.3 years in nonsmokers and 65.9 years in smokers. Fifty-three of the included patients were active smokers when LTOT was initiated. Nine veterans had fire-related incidents during the study period. All 9 patients were actively smoking (about 17%) at the time of the fire incidents. There were no deaths, and 5 patients required hospitalization due to facial burns resulting from the fire-related incidents. Our study focused on 5 baseline characteristics in our population (Table 1). After gathering data, our group inferred that these characteristics had a potential relationship to fire-related incidents compared with other variables that were studied. Future studies could look at other patient characteristics that may be linked to fire-related incidents in patients on LTOT. For example, not having PTSD also perfectly predicts fire-related incidents in our data (ie, none of the participants who had fire-related incidents had PTSD). Although this finding was not within the 95% confidence interval (CI) in the model, it does show that care must be taken when interpreting effects from small samples (Table 2). The modelestimated odds of a fire-related incident occurring in a smoker were 31.6 (5.1-372.7) times more likely than were the odds of a firerelated incident occurring in a nonsmoker, holding all other predictors at their reference level; 95% CI for the odds ratios for all other predictors in the model included a value of 1.
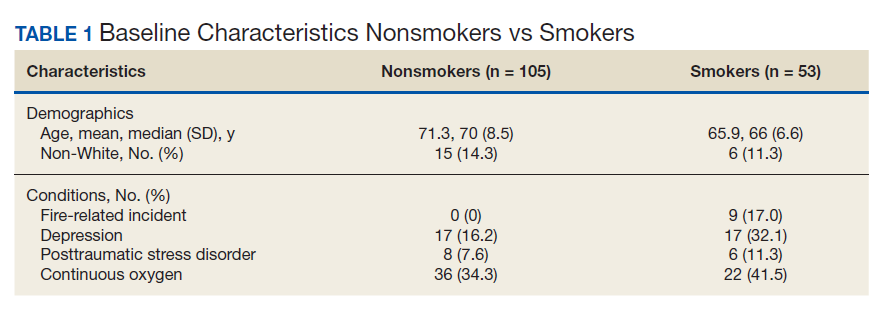
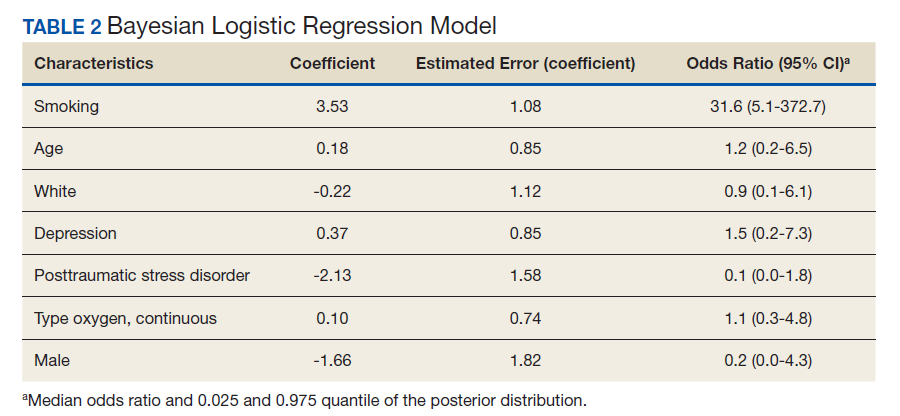
Discussion
This study showed evidence of increased odds of fire-related events in actively smoking patients receiving LTOT compared with patients who do not actively smoke while attempting to adjust for potential confounders. Of the 9 patients who had fire events, 5 required hospitalization for burns.
A similar retrospective cohort study by Sharma and colleagues in 2015 demonstrated an increased risk of burn-related injury when on LTOT but reiterated that the benefit of oxygen outweighs the risk of burn-related injury in patients requiring oxygen therapy.12 Interestingly, Sharma and colleagues were unable to identify smoking status for the patients studied but further identified factors associated with burn injury to include male sex, low socioeconomic status, oxygen therapy use, and ≥ 3 comorbidities. The study’s conclusion recommended continued education by health care professionals (HCPs) to their patients on LTOT regarding potential for burn injury. In the same vein, the VA National Center for Ethics in Health Care noted that “clinicians should familiarize themselves with the risks and benefits of LTOT; should inform their patients of the risks and benefits without exaggerating the risk associated with smoking; avoid undue coercion inherent in the clinician’s ability to withdraw LTOT; reduce the risk to the greatest degree possible; and consider termination of LTOT in very extreme cases and in consultation with a multidisciplinary committee.”13
This statement is in contrast to the guidelines and policies of other countries, such as Sweden, where smoking is a direct contraindication for prescription of oxygen therapy, or in Australia and New Zealand, where the Thoracic Society of Australia and New Zealand oxygen therapy guidelines recommend against prescription of LTOT, citing “increased fire risk and the probability that the poorer prognosis conferred by smoking will offset treatment benefit.”6,14
The prevalence of oxygen therapy introduces the potential for fire-related incidents with subsequent injury requiring medical care. There are few studies regarding home oxygen fire in the US due to the lack of a uniform reporting system. One study by Wendling and Pelletier analyzed deaths in Maine, Massachusetts, New Hampshire, and Oklahoma between 2000 and 2007 and found 38 deaths directly attributable to home oxygen fires as a result of smoking.15 Further, the Consumer Product Safety Commission’s National Electronic Injury Surveillance System between 2003 and 2006 attributed 1,190 thermal burns related to home oxygen fires; the majority of which were ignited by tobacco smoking.15 The Swedish National Register of Respiratory Failure (Swedevox) published prospective population-based, consecutive cohort study that collected data over 17 years and evaluated the risk of fire-related incident in those on LTOT. Of the 12,497 patients sampled, 17 had a burn injury and 2 patients died. The low incidence of burn injury on LTOT was attributed to the strict guidelines instituted in Sweden for doctors to avoid prescribing LTOT to actively smoking patients.6 A follow-up study by Tanash and colleagues compared the risk of burn injury in each country, respectively. The results found an increased number of burn injuries in those on oxygen therapy in Denmark, a country with fewer restrictions on smoking compared with those of Sweden.7 Similarly, our results showed that the rate of fire and burn injuries was exclusively among veterans who were active smokers. All patients who were prescribed oxygen therapy at CTVHCS received counseling and signed Home Safety Agreements. Despite following the recommendations set forth by the VA on counseling, extensive harm reduction techniques, and close follow-up, we found there was still a high incidence of fires in veterans with COPD on LTOT who continue to smoke.
The findings from our study concur with those previously published regarding the risk of home oxygen fire and concomitant smoking, supporting the idea for more regulated and concrete guidelines for prescribing LTOT to those requiring it.8
Limitations
The major limitation was the small sample size of our study. Another limitation was that our study population is predominantly male as is common in veteran cohorts. In fiscal year 2016, the veteran population of Texas was 1,434,361 males and 168,967 females.16 According to Franklin and colleagues, HCPs noticed an increase use of long-term oxygen among women compared with that of men.17
Conclusions
Our study showed an increased odds of firerelated incidents of patients while on LTOT, strengthening the argument that even with extensive education, those who smoke and are on LTOT continue to put themselves at risk of a fire-related incident. This finding stresses the importance of continuing patient education on the importance of smoking cessation prior to administration of LTOT or avoiding fire hazards while on LTOT. Further research into LTOT and fire hazards could help in implementing a more structured approval process for patients who want to obtain LTOT. We propose further studies evaluating risk factors for the incidence of fire events among patients prescribed LTOT. A growing and aging population with a need for LTOT necessitates examination of oxygen safe prescribing.
1. Ni H, Xu J. COPD-related mortality by sex and race among adults aged 25 and over: United States 2000-2014. https:// www.cdc.gov/nchs/data/databriefs/db256.pdf. Published September 2016. Accessed September 10, 2020.
2. Itoh M, Tsuji T, Nemoto K, Nakamura H, Aoshiba K. Undernutrition in patients with COPD and its treatment. Nutrients. 2013;5(4):1316-1335. doi:10.3390/nu5041316
3. Continuous or nocturnal oxygen therapy in hypoxemic chronic obstructive lung disease: a clinical trial. Nocturnal Oxygen Therapy Trial Group. Ann Intern Med. 1980;93(3):391. doi:10.7326/0003-4819-93-3-391
4. Long term domiciliary oxygen therapy in chronic hypoxic cor pulmonale complicating chronic bronchitis and emphysema. Report of the Medical Research Council Working Party. Lancet. 1981;1(8222):681-686. doi:10.1016/S0140-6736(81)91970-X
5. Anthonisen NR, Skeans MA, Wise RA, Manfreda J, Kanner RE, Connett JE. The effects of a smoking cessation intervention on 14.5-year mortality. Ann Intern Med. 2005;142(4):233-239. doi:10.7326/0003-4819-142-4 -200502150-00005
6. Tanash HA, Huss F, Ekström M. The risk of burn injury during long-term oxygen therapy: a 17-year longitudinal national study in Sweden. Int J Chron Obstruct Pulmon Dis. 2015;10:2479-2484. doi:10.2147/COPD.S91508
7. Tanash HA, Ringbaek T, Huss F, Ekström M. Burn injury during long-term oxygen therapy in Denmark and Sweden: the potential role of smoking. Int J Chronic Obstruct Pulmon Dis. 2017;12:193-197. doi:10.2147/COPD.S119949
8. Kassis SA, Savetamal A, Assi R, et al. Characteristics of patients with injury secondary to smoking on home oxygen therapy transferred intubated to a burn center. J Am Coll Surg. 2014;218(6):1182-1186. doi:10.1016/j.jamcollsurg.2013.12.055
9. Long-Term Oxygen Treatment Trial Research Group, Albert RK, Au DH, et al. A Randomized Trial of Long-Term Oxygen for COPD with Moderate Desaturation. N Engl J Med. 2016;375(17):1617-1627. doi:10.1056/NEJMoa1604344
10. Ghosh J, Li Y, Mitra R. On the use of Cauchy prior distributions for Bayesian logistic regression. Bayesian Anal. 2018;13(2):359-383. doi:10.1214/17-ba1051
11. Bürkner P-C. brms: An R package for Bayesian multilevel models using Stan. J Stat Software. 2017;80(1). doi:10.18637/jss.v080.i01
12. Sharma G, Meena R, Goodwin JS, Zhang W, Kuo Y-F, Duarte AG. Burn injury associated with home oxygen use in patients with chronic obstructive pulmonary disease. Mayo Clin Proc. 2015;90(4):492-499. doi:10.1016/j.mayocp.2014.12.024
13. US Department of Veterans Affairs, National Ethics Committee. Ethical considerations that arise when a home care patient on long term oxygen therapy continues to smoke. http://vaww.ethics.va.gov/docs/necrpts/NEC_Report_20100301_Smoking_while_on_LTOT.pdf. Published March 2010. [Nonpublic, source not verified.]
14. McDonald C F, Whyte K, Jenkins S, Serginson J. Frith P. Clinical practice guideline on adult domiciliary oxygen therapy: executive summary from the Thoracic Society of Australia and New Zealand. Respirology. 2016;21(1):76-78. doi:10.1111/resp.12678
15. Centers for Disease Control and Prevention (CDC). Fatal fires associated with smoking during long-term oxygen therapy--Maine, Massachusetts, New Hampshire, and Oklahoma, 2000-2007. MMWR Morb Mortal Wkly Rep. 2008;57(31):852-854.
16. US Department of Veteran Affairs. National Center for Veterans Analysis and Statistics. Population tables: the state, age/gender, 2016. https://www.va.gov/vetdata/Veteran_ Population.asp. Updated August 5, 2020. Accessed September 11, 2020.
17. Franklin KA, Gustafson T, Ranstam J, Ström K. Survival and future need of long-term oxygen therapy for chronic obstructive pulmonary disease--gender differences. Respir Med. 2007;101(7):1506-1511. doi:10.1016/j.rmed.2007.01.009
Chronic obstructive pulmonary disease (COPD) has been the third leading cause of death in the US since 2008.1 Current management of COPD includes smoking cessation, adequate nutrition, medication therapy, pulmonary rehabilitation, and vaccines.2 Outside of pharmacologic management, oxygen therapy has become a staple treatment of chronic hypoxemic respiratory failure due to COPD. Landmark trials, including the Nocturnal Oxygen Therapy Trial (NOTT) and Medical Research Council (MRC) study, demonstrated improved survival in patients with COPD and hypoxemia, particularly if these patients received oxygen for 18 hours per day.3,4 NOTT prospectively evaluated 203 patients at 6 centers who were randomly allocated to either continuous oxygen therapy or 12-hour nocturnal oxygen therapy. The overall mortality in the nocturnal oxygen therapy group was 1.94 times that in the continuous oxygen therapy group (P = .01).3 The MRC study included 87 patients who were randomized to oxygen therapy or no oxygen; risk of death was 12% per year in the treated group vs 29% per year in the control group (P = .04).4 The effectiveness of long-term oxygen therapy (LTOT) in active smokers continues to be a source of debate; although 50% of patients in the NOTT trial were smokers, there was no subgroup analysis of whether smoking status had an impact on survival in those on continuous oxygen therapy.
Although many therapies are available for the treatment of COPD, the most effective treatment to prevent the progression of COPD is smoking cessation. Resources like smoking cessation programs, nicotine patches, and medications, such as bupropion and varenicline, are available to aid smoking cessation.5 However, many patients are unable to quit tobacco use despite their best efforts using available resources, and they continue to smoke even with progressive COPD. Long-time smokers also are likely to continue smoking while on LTOT, which increases their risk for fire-related injury.6-8
Traditional indications are being scrutinized after the LTOT trial found no benefit with respect to time to death or first hospitalization among patients with stable COPD and resting or exercise-induced moderate desaturation.9
Although oxygen accelerates combustion and is a potential fire hazard, LTOT has been prescribed even to active smokers as the 2 landmark trials did not exclude patients who were active smokers from receiving oxygen therapy.3,4 Therefore, LTOT has traditionally been prescribed to veterans who are actively smoking, despite the fire hazard. Attempts at mitigating hazards related to oxygen therapy in active smokers include counseling extensively about safety measures (which includes avoiding open flames such as candles, large fires, or sparks when on LTOT and providing Home Safety Agreements—a written contract between prescriber and patient wherein the patient agrees to abide by the terms of the US Department of Veterans Affairs (VA) to mitigate hazards related to LTOT in order to receive LTOT (eAppendix
Methods
With this practice in mind, we conducted an institutional review board approved retrospective chart review of all veterans with diagnosis of COPD within the Central Texas Veterans Health Care System (CTVHCS) who were prescribed new LTOT between October 1, 2010 and September 30, 2015. Given the retrospective nature of the chart review, patient consent was not obtained. Inclusion criteria were veterans aged > 18 years who had a confirmed diagnosis of COPD by spirometry and who met criteria for either continuous or ambulation- only oxygen therapy.
Criteria for exclusion included patients with hypoxemia not solely attributable to COPD or due to diseases other than COPD. We reviewed encounters in these patients’ charts, including follow-up in the clinic of the providers prescribing oxygen, to assess for fire-related incidents, defined as events wherein fire was visualized by the patient or by individuals living with the patient and with report provided to medical equipment company providing oxygen; the patient did not have to seek medical care to qualify for fire-related incident. Of the 158 patients who met the criteria for inclusion in the study, 152 were male.
Statistics
Bayesian logistic regression was used to model the outcome variable fire-related incident with the predictors smoking status, age, race, depression, PTSD, and type of oxygen used. Mental health disorders have significant effect on substance use disorders, such as alcohol use. Depression and PTSD were more common mental health diagnoses found in our patient population. Additionally, due to the small sample size, these psychiatric diagnoses were chosen to evaluate the impact of mental health disorders on firerelated events.
Although the sample size of events was small, weakly informative normal priors (0, 2.5) were used to shrink parameter estimates toward 0 and minimize overfitting. Weakly informative normal priors have also been suggested to deal with the problem of quasi-complete separation, where in our case, both smoking and no-PTSD perfectly predicted the 9 fire-related incidents.10 All input variables were centered and scaled as recommended. 9 The model fit well as assessed by posterior predictive checks, and Rhat was 1.00 for all parameters, indicating that all chains converged. Analysis was completed in R version 3.5.1 using the ‘brms’ package for Bayesian modeling.11
Results
The mean age for the 158 included patients was 71.3 years in nonsmokers and 65.9 years in smokers. Fifty-three of the included patients were active smokers when LTOT was initiated. Nine veterans had fire-related incidents during the study period. All 9 patients were actively smoking (about 17%) at the time of the fire incidents. There were no deaths, and 5 patients required hospitalization due to facial burns resulting from the fire-related incidents. Our study focused on 5 baseline characteristics in our population (Table 1). After gathering data, our group inferred that these characteristics had a potential relationship to fire-related incidents compared with other variables that were studied. Future studies could look at other patient characteristics that may be linked to fire-related incidents in patients on LTOT. For example, not having PTSD also perfectly predicts fire-related incidents in our data (ie, none of the participants who had fire-related incidents had PTSD). Although this finding was not within the 95% confidence interval (CI) in the model, it does show that care must be taken when interpreting effects from small samples (Table 2). The modelestimated odds of a fire-related incident occurring in a smoker were 31.6 (5.1-372.7) times more likely than were the odds of a firerelated incident occurring in a nonsmoker, holding all other predictors at their reference level; 95% CI for the odds ratios for all other predictors in the model included a value of 1.
Discussion
This study showed evidence of increased odds of fire-related events in actively smoking patients receiving LTOT compared with patients who do not actively smoke while attempting to adjust for potential confounders. Of the 9 patients who had fire events, 5 required hospitalization for burns.
A similar retrospective cohort study by Sharma and colleagues in 2015 demonstrated an increased risk of burn-related injury when on LTOT but reiterated that the benefit of oxygen outweighs the risk of burn-related injury in patients requiring oxygen therapy.12 Interestingly, Sharma and colleagues were unable to identify smoking status for the patients studied but further identified factors associated with burn injury to include male sex, low socioeconomic status, oxygen therapy use, and ≥ 3 comorbidities. The study’s conclusion recommended continued education by health care professionals (HCPs) to their patients on LTOT regarding potential for burn injury. In the same vein, the VA National Center for Ethics in Health Care noted that “clinicians should familiarize themselves with the risks and benefits of LTOT; should inform their patients of the risks and benefits without exaggerating the risk associated with smoking; avoid undue coercion inherent in the clinician’s ability to withdraw LTOT; reduce the risk to the greatest degree possible; and consider termination of LTOT in very extreme cases and in consultation with a multidisciplinary committee.”13
This statement is in contrast to the guidelines and policies of other countries, such as Sweden, where smoking is a direct contraindication for prescription of oxygen therapy, or in Australia and New Zealand, where the Thoracic Society of Australia and New Zealand oxygen therapy guidelines recommend against prescription of LTOT, citing “increased fire risk and the probability that the poorer prognosis conferred by smoking will offset treatment benefit.”6,14
The prevalence of oxygen therapy introduces the potential for fire-related incidents with subsequent injury requiring medical care. There are few studies regarding home oxygen fire in the US due to the lack of a uniform reporting system. One study by Wendling and Pelletier analyzed deaths in Maine, Massachusetts, New Hampshire, and Oklahoma between 2000 and 2007 and found 38 deaths directly attributable to home oxygen fires as a result of smoking.15 Further, the Consumer Product Safety Commission’s National Electronic Injury Surveillance System between 2003 and 2006 attributed 1,190 thermal burns related to home oxygen fires; the majority of which were ignited by tobacco smoking.15 The Swedish National Register of Respiratory Failure (Swedevox) published prospective population-based, consecutive cohort study that collected data over 17 years and evaluated the risk of fire-related incident in those on LTOT. Of the 12,497 patients sampled, 17 had a burn injury and 2 patients died. The low incidence of burn injury on LTOT was attributed to the strict guidelines instituted in Sweden for doctors to avoid prescribing LTOT to actively smoking patients.6 A follow-up study by Tanash and colleagues compared the risk of burn injury in each country, respectively. The results found an increased number of burn injuries in those on oxygen therapy in Denmark, a country with fewer restrictions on smoking compared with those of Sweden.7 Similarly, our results showed that the rate of fire and burn injuries was exclusively among veterans who were active smokers. All patients who were prescribed oxygen therapy at CTVHCS received counseling and signed Home Safety Agreements. Despite following the recommendations set forth by the VA on counseling, extensive harm reduction techniques, and close follow-up, we found there was still a high incidence of fires in veterans with COPD on LTOT who continue to smoke.
The findings from our study concur with those previously published regarding the risk of home oxygen fire and concomitant smoking, supporting the idea for more regulated and concrete guidelines for prescribing LTOT to those requiring it.8
Limitations
The major limitation was the small sample size of our study. Another limitation was that our study population is predominantly male as is common in veteran cohorts. In fiscal year 2016, the veteran population of Texas was 1,434,361 males and 168,967 females.16 According to Franklin and colleagues, HCPs noticed an increase use of long-term oxygen among women compared with that of men.17
Conclusions
Our study showed an increased odds of firerelated incidents of patients while on LTOT, strengthening the argument that even with extensive education, those who smoke and are on LTOT continue to put themselves at risk of a fire-related incident. This finding stresses the importance of continuing patient education on the importance of smoking cessation prior to administration of LTOT or avoiding fire hazards while on LTOT. Further research into LTOT and fire hazards could help in implementing a more structured approval process for patients who want to obtain LTOT. We propose further studies evaluating risk factors for the incidence of fire events among patients prescribed LTOT. A growing and aging population with a need for LTOT necessitates examination of oxygen safe prescribing.
1. Ni H, Xu J. COPD-related mortality by sex and race among adults aged 25 and over: United States 2000-2014. https:// www.cdc.gov/nchs/data/databriefs/db256.pdf. Published September 2016. Accessed September 10, 2020.
2. Itoh M, Tsuji T, Nemoto K, Nakamura H, Aoshiba K. Undernutrition in patients with COPD and its treatment. Nutrients. 2013;5(4):1316-1335. doi:10.3390/nu5041316
3. Continuous or nocturnal oxygen therapy in hypoxemic chronic obstructive lung disease: a clinical trial. Nocturnal Oxygen Therapy Trial Group. Ann Intern Med. 1980;93(3):391. doi:10.7326/0003-4819-93-3-391
4. Long term domiciliary oxygen therapy in chronic hypoxic cor pulmonale complicating chronic bronchitis and emphysema. Report of the Medical Research Council Working Party. Lancet. 1981;1(8222):681-686. doi:10.1016/S0140-6736(81)91970-X
5. Anthonisen NR, Skeans MA, Wise RA, Manfreda J, Kanner RE, Connett JE. The effects of a smoking cessation intervention on 14.5-year mortality. Ann Intern Med. 2005;142(4):233-239. doi:10.7326/0003-4819-142-4 -200502150-00005
6. Tanash HA, Huss F, Ekström M. The risk of burn injury during long-term oxygen therapy: a 17-year longitudinal national study in Sweden. Int J Chron Obstruct Pulmon Dis. 2015;10:2479-2484. doi:10.2147/COPD.S91508
7. Tanash HA, Ringbaek T, Huss F, Ekström M. Burn injury during long-term oxygen therapy in Denmark and Sweden: the potential role of smoking. Int J Chronic Obstruct Pulmon Dis. 2017;12:193-197. doi:10.2147/COPD.S119949
8. Kassis SA, Savetamal A, Assi R, et al. Characteristics of patients with injury secondary to smoking on home oxygen therapy transferred intubated to a burn center. J Am Coll Surg. 2014;218(6):1182-1186. doi:10.1016/j.jamcollsurg.2013.12.055
9. Long-Term Oxygen Treatment Trial Research Group, Albert RK, Au DH, et al. A Randomized Trial of Long-Term Oxygen for COPD with Moderate Desaturation. N Engl J Med. 2016;375(17):1617-1627. doi:10.1056/NEJMoa1604344
10. Ghosh J, Li Y, Mitra R. On the use of Cauchy prior distributions for Bayesian logistic regression. Bayesian Anal. 2018;13(2):359-383. doi:10.1214/17-ba1051
11. Bürkner P-C. brms: An R package for Bayesian multilevel models using Stan. J Stat Software. 2017;80(1). doi:10.18637/jss.v080.i01
12. Sharma G, Meena R, Goodwin JS, Zhang W, Kuo Y-F, Duarte AG. Burn injury associated with home oxygen use in patients with chronic obstructive pulmonary disease. Mayo Clin Proc. 2015;90(4):492-499. doi:10.1016/j.mayocp.2014.12.024
13. US Department of Veterans Affairs, National Ethics Committee. Ethical considerations that arise when a home care patient on long term oxygen therapy continues to smoke. http://vaww.ethics.va.gov/docs/necrpts/NEC_Report_20100301_Smoking_while_on_LTOT.pdf. Published March 2010. [Nonpublic, source not verified.]
14. McDonald C F, Whyte K, Jenkins S, Serginson J. Frith P. Clinical practice guideline on adult domiciliary oxygen therapy: executive summary from the Thoracic Society of Australia and New Zealand. Respirology. 2016;21(1):76-78. doi:10.1111/resp.12678
15. Centers for Disease Control and Prevention (CDC). Fatal fires associated with smoking during long-term oxygen therapy--Maine, Massachusetts, New Hampshire, and Oklahoma, 2000-2007. MMWR Morb Mortal Wkly Rep. 2008;57(31):852-854.
16. US Department of Veteran Affairs. National Center for Veterans Analysis and Statistics. Population tables: the state, age/gender, 2016. https://www.va.gov/vetdata/Veteran_ Population.asp. Updated August 5, 2020. Accessed September 11, 2020.
17. Franklin KA, Gustafson T, Ranstam J, Ström K. Survival and future need of long-term oxygen therapy for chronic obstructive pulmonary disease--gender differences. Respir Med. 2007;101(7):1506-1511. doi:10.1016/j.rmed.2007.01.009
Validation of the Timberlawn Couple and Family Evaluation Scales–Self-Report in Veterans with PTSD
Although about 8.3% of the general adult civilian population will be diagnosed with posttraumatic stress disorder (PTSD) in their lifetime, rates of PTSD are even higher in the veteran population.1,2 PTSD is associated with a number of psychosocial consequences in veterans, including decreased intimate partner relationship functioning.3,4 For example, Cloitre and colleagues reported that PTSD is associated with difficulty with socializing, intimacy, responsibility, and control, all of which increase difficulties in intimate partner relationships.5 Similarly, researchers also have noted that traumatic experiences can affect an individual’s attachment style, resulting in progressive avoidance of interpersonal relationships, which can lead to marked difficulties in maintaining and beginning intimate partner relationships.6,7 Despite these known consequences of PTSD, as Dekel and Monson noted in a review,further research is still needed regarding the mechanisms by which trauma and PTSD result in decreased intimate partner relationship functioning among veterans.8 Nonetheless, as positive interpersonal relationships are associated with decreased PTSD symptom severity9,10 and increased engagement in PTSD treatment,11 determining methods of measuring intimate partner relationship functioning in veterans with PTSD is important to inform future research and aid the provision of care.
To date, limited research has examined the valid measurement of intimate partner relationship functioning among veterans with PTSD. Many existing measures that comprehensively assess intimate partner relationship functioning are time and resource intensive. One such measure, the Timberlawn Couple and Family Evaluation Scales (TCFES), comprehensively assesses multiple pertinent domains of intimate partner relationship functioning (ie, structure, autonomy, problem solving, affect regulation, and disagreement/conflict).12 By assessing multiple domains, the TCFES offers a method of understanding the specific components of an individual’s intimate partner relationship in need of increased clinical attention.12 However, the TCFES is a time- and labor-intensive observational measure that requires a couple to interact while a blinded, independent rater observes and rates their interactions using an intricate coding process. This survey structure precludes the ability to quickly and comprehensively assess a veteran’s intimate partner functioning in settings such as mental health outpatient clinics where mental health providers engage in brief, time-limited psychotherapy. As such, brief measures of intimate partner relationship functioning are needed to best inform clinical care among veterans with PTSD.
The primary aim of the current study was to create a psychometrically valid, yet brief, self-report version of the TCFES to assess multiple domains of intimate partner relationship functioning. The psychometric properties of this measure were assessed among a sample of US veterans with PTSD who were in an intimate partner relationship. We specifically examined factor structure, reliability, and associations to established measures of specific domains of relational functioning.
Methods
Ninety-four veterans were recruited via posted advertisements, promotion in PTSD therapy groups/staff meetings, and word of mouth at the Dallas Veterans Affairs Medical Center (VAMC). Participants were eligible if they had a documented diagnosis of PTSD as confirmed in the veteran’s electronic medical record and an affirmative response to currently being involved in an intimate partner relationship (ie, legally married, common-law spouse, involved in a relationship/partnership). There were no exclusion criteria.
Interested veterans were invited to complete several study-related self-report measures concerning their intimate partner relationships that would take about an hour. They were informed that the surveys were voluntary and confidential, and that they would be compensated for their participation. All veterans who participated provided written consent and the study was approved by the Dallas VAMC institutional review board.
Of the 94 veterans recruited, 3 veterans’ data were removed from current analyses after informed consent but before completing the surveys when they indicated they were not currently in a relationship or were divorced. After consent, the 91 participants were administered several study-related self-report measures. The measures took between 30 and 55 minutes to complete. Participants were then compensated $25 for their participation.
Intimate Partner Relationship Functioning
The 16-item TCFES self-report version (TCFES-SR) was developed to assess multiple domains of interpersonal functioning (Appendix). The observational TCFES assesses 5 intimate partner relationship characteristic domains (ie, structure, autonomy, problem solving, affect regulation, and disagreement/conflict) during a couple’s interaction by an independent trained rater.12 Each of the 16 TCFES-SR items were modeled after original constructs measured by the TCFES, including power, closeness, clarify, other’s views, responsibility, closure, negotiation, expressiveness, responsiveness, positive regard, negative regard, mood/tone, empathy, frequency, affective quality, and generalization and escalation. To maintain consistency with the TCFES, each item of the TCFES-SR was scored from 1 (severely dysfunctional) to 5 (highly functional). Additionally, all item wording for the TCFES-SR was based on wording in the TCFES manual after consultation with an expert who facilitated the development of the TCFES.12 On average, the TCFES-SR took 5 to 10 minutes to complete.
To measure concurrent validity of the modified TCFES-SR, several additional interpersonal measures were selected and administered based on prior research and established domains of the TCFES. The Positive and Negative Quality in Marriage Scale (PANQIMS) was administered to assess perceived attitudes toward a relationship.13,14 The PANQIMS generates 2 subscales: positive quality and negative quality in the relationship. Because the PANQIMS specifically assesses married relationships and our sample included married and nonmarried participants, wording was modified (eg, “spouse/partner”).
The relative power subscale of the Network Relationships Inventory–Relationship Qualities Version (NRI-RQV) measure was administered to assess the unequal/shared role romantic partners have in power equality (ie, relative power).15
The Revised Dyadic Adjustment Scale (RDAS) is a self-report measure that assesses multiple dimensions of marital adjustment and functioning.16 Six subscales of the RDAS were chosen based on items of the TCFES-SR: decision making, values, affection, conflict, activities, and discussion.
The Interpersonal Reactivity Index (IRI) empathetic concern subscale was administered to assess empathy across multiple contexts and situations17 and the Experiences in Close Relationships-Revised Questionnaire (ECR-R) was administered to assess relational functioning by determining attachment-related anxiety and avoidance.18
Sociodemographic Information
A sociodemographic questionnaire also was administered. The questionnaire assessed gender, age, education, service branch, length of interpersonal relationship, race, and ethnicity of the veteran as well as gender of the veteran’s partner.
Statistical Analysis
Factor structure of the TCFES-SR was determined by conducting an exploratory factor analysis. To allow for correlation between items, the Promax oblique rotation method was chosen.19 Number of factors was determined by agreement between number of eigenvalues ≥ 1, visual inspection of the scree plot, and a parallel analysis. Factor loadings of ≥ 0.3 were used to determine which items loaded on to which factors.
Convergent validity was assessed by conducting Pearson’s bivariate correlations between identified TCFES-SR factor(s) and other administered measures of interpersonal functioning (ie, PANQIMS positive and negative quality; NRI-RQV relative power subscale; RDAS decision making, values, affection, conflict, activities, and discussion subscales; IRI-empathetic concern subscale; and ECR-R attachment-related anxiety and avoidance subscales). Strength of relationship was determined based on the following guidelines: ± 0.3 to 0.49 = small, ± 0.5 to 0.69 = moderate, and ± 0.7 to 1.00 = large. Internal consistency was also determined for TCFES-SR factor(s) using Cronbach’s α. A standard level of significance (α=.05) was used for all statistical analyses.
Results
Eighty-six veterans provided complete data (Table 1). The Kaiser-Meyer-Olkin measure of sampling adequacy was indicative that sample size was adequate (.91), while Bartlett’s test of sphericity found the variables were suitable for structure detection, χ2 (120) = 800.00, P < .001. While 2 eigenvalues were ≥ 1, visual inspection of the scree plot and subsequent parallel analysis identified a unidimensional structure (ie, 1 factor) for the TCFES-SR. All items were found to load to this single factor, with all loadings being ≥ 0.5 (Table 2). Additionally, internal consistency was excellent for the scale (α = .93).
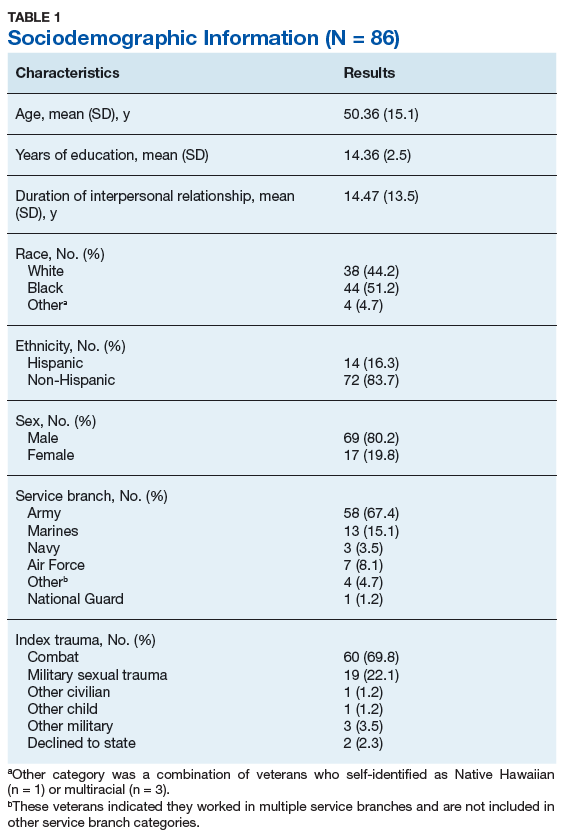
Pearson’s bivariate correlations were significant (P < .05) between TCFES-SR total score, and almost all administered interpersonal functioning measures (Table 3). Interestingly, no significant associations were found between any of the administered measures, including the TCFES-SR total score, and the IRI-empathetic concern subscale (P > .05).
Discussion
These findings provide initial support for the psychometric properties of the TCFES-SR, including excellent internal consistency and the adequate association of its total score to established measures of interpersonal functioning. Contrary to the TCFES, the TCFES-SR was shown to best fit a unidimensional factor rather than a multidimensional measure of relationship functioning. However, the TCFES-SR was also shown to have strong convergent validity with multiple domains of relationship functioning, indicating that the measure of overall intimate partner relationship functioning encompasses a number of relational domains (ie, structure, autonomy, problem solving, affect regulation, and disagreement/conflict). Critically, the TCFES-SR is brief and was administered easily in our sample, providing utility as clinical tool to be used in time-sensitive outpatient settings.
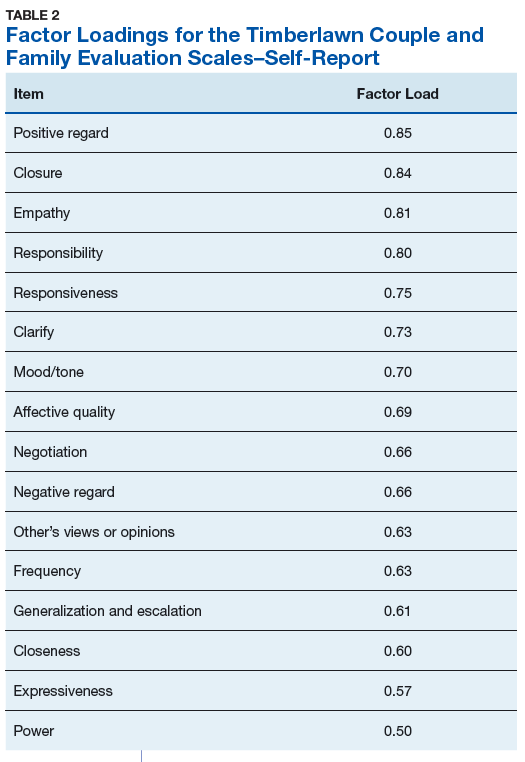
A unidimensional factor has particular strength in providing a global portrait of perceived intimate partner relationship functioning, and mental health providers can administer the TCFES-SR to assess for overall perceptions of intimate partner relationship functioning rather than administering a number of measures focusing on specific interpersonal domains (eg, decision making processes or positive/negative attitudes towards one’s relationship). This allows for the quick assessment (ie, 5-10 minutes) of overall intimate partner relationship functioning rather than administration of multiple self-report measures which can be time-intensive and expensive. However, the TCFES-SR also is limited by a lack of nuanced understanding of perceptions of functioning specific to particular domains. For example, the TCFES-SR score cannot describe intimate partner functioning in the domain of problem solving. Therefore, brief screening tools need to be developed that assess multiple intimate partner relationship domains.
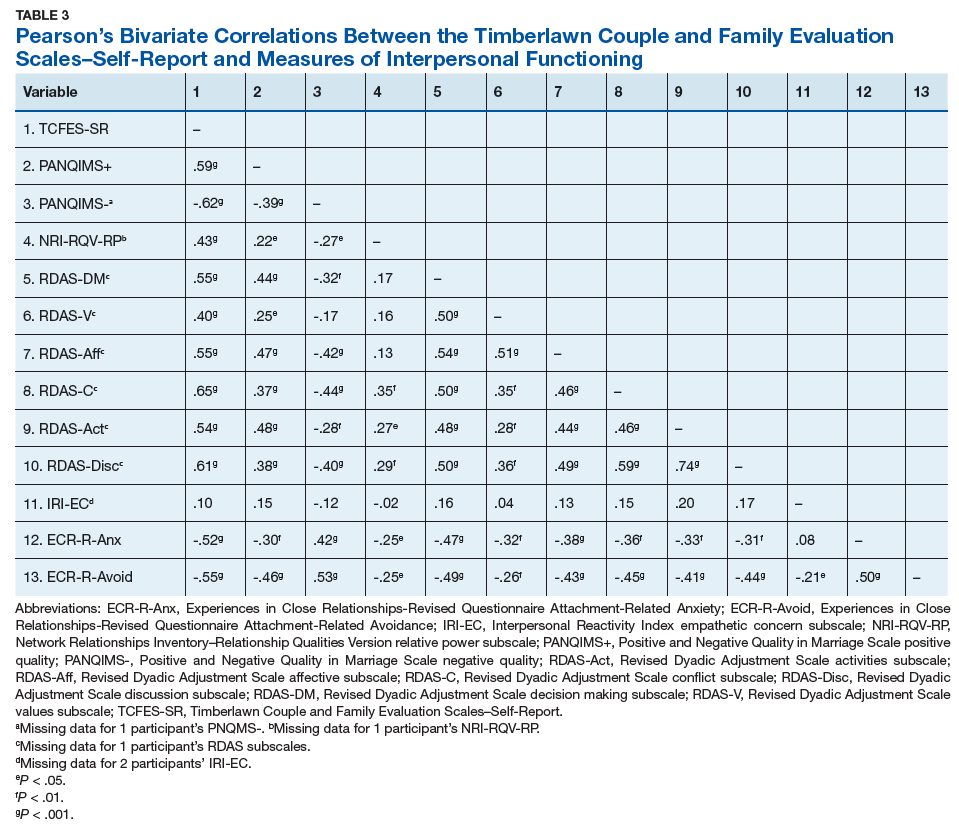
Importantly, overall intimate partner relationship functioning as measured by the TCFES-SR may not incorporate perceptions of relationship empathy, as the total score did not correlate with a measure of empathetic concern (ie, the IRI-empathetic concern subscale). As empathy was based on one item in the TCFES-SR vs 7 in the IRI-empathetic concern subscale, it is unclear if the TCFES-SR only captures a portion of the construct of empathy (ie, sensitivity to partner) vs the comprehensive assessment of trait empathy that the IRI subscale measures. Additionally, the IRI-empathetic concern subscale did not significantly correlate with any of the other administered measures of relationship functioning. Given the role of empathy in positive, healthy intimate partner relationships, future research should explore the role of empathetic concern among veterans with PTSD as it relates to overall (eg, TCFES-SR) and specific aspects of intimate partner relationship functioning.20
While the clinical applicability of the TCFES-SR requires further examination, this measure has a number of potential uses. Information captured quickly by the TCFES-SR may help to inform appropriate referral for treatment. For instance, veterans reporting low total scores on the TCFES-SR may indicate a need for a referral for intervention focused on improving overall relationship functioning (eg, Integrative Behavioral Couple Therapy).21,22 Measurement-based care (ie, tracking and discussing changes in symptoms during treatment using validated self-report measures) is now required by the Joint Commission as a standard of care,and has been shown to improve outcomes in couples therapy.23,24 As a brief self-report measure, the TCFES-SR may be able to facilitate measurement-based care and assist providers in tracking changes in overall relationship functioning over the course of treatment. However, the purpose of the current study was to validate the TCFES-SR and not to examine the utility of the TCFES-SR in clinical care; additional research is needed to determine standardized cutoff scores to indicate a need for clinical intervention.
Limitations
Several limitations should be noted. The current study only assessed perceived intimate partner relationship functioning from the perspective of the veteran, thus limiting implications as it pertains to the spouse/partner of the veteran. PTSD diagnosis was based on chart review rather than a psychodiagnostic measure (eg, Clinician Administered PTSD Scale); therefore, whether this diagnosis was current or in remission was unclear. Although our sample was adequate to conduct an exploratory factor analysis,the overall sample size was modest, and results should be considered preliminary with need for further replication.25 The sample was also primarily male, white or black, and non-Hispanic; therefore, results may not generalize to a more sociodemographically diverse population. Finally, given the focus of the study to develop a self-report measure, we did not compare the TCFES-SR to the original TCFES. Thus, further research examining the relationship between the TCFES-SR and TCFES may be needed to better understand overlap and potential incongruence in these measures, and to ascertain any differences in their factor structures.
Conclusion
This study is novel in that it adapted a comprehensive observational measure of relationship functioning to a self-report measure piloted among a sample of veterans with PTSD in an intimate partner relationship, a clinical population that remains largely understudied. Although findings are preliminary, the TCFES-SR was found to be a reliable and valid measure of overall intimate partner relationship functioning. Given the rapid administration of this self-report measure, the TCFES-SR may hold clinical utility as a screen of intimate partner relationship deficits in need of clinical intervention. Replication in a larger, more diverse sample is needed to further examine the generalizability and confirm psychometric properties of the TCFES-SR. Additionally, further understanding of the clinical utility of the TCFES-SR in treatment settings remains critical to promote the development and maintenance of healthy intimate partner relationships among veterans with PTSD. Finally, development of effective self-report measures of intimate partner relationship functioning, such as the TCFES-SR, may help to facilitate needed research to understand the effect of PTSD on establishing and maintaining healthy intimate partner relationships among veterans.
Acknowledgments
The current study was funded by the Timberlawn Psychiatric Research Foundation. This material is the result of work supported in part by the US Department of Veterans Affairs; the Rocky Mountain Mental Illness Research, Education and Clinical Center (MIRECC) for Suicide Prevention; Sierra Pacific MIRECC; and the Office of Academic Affiliations, Advanced Fellowship Program in Mental Illness Research and Treatment, Department of Veterans Affairs.
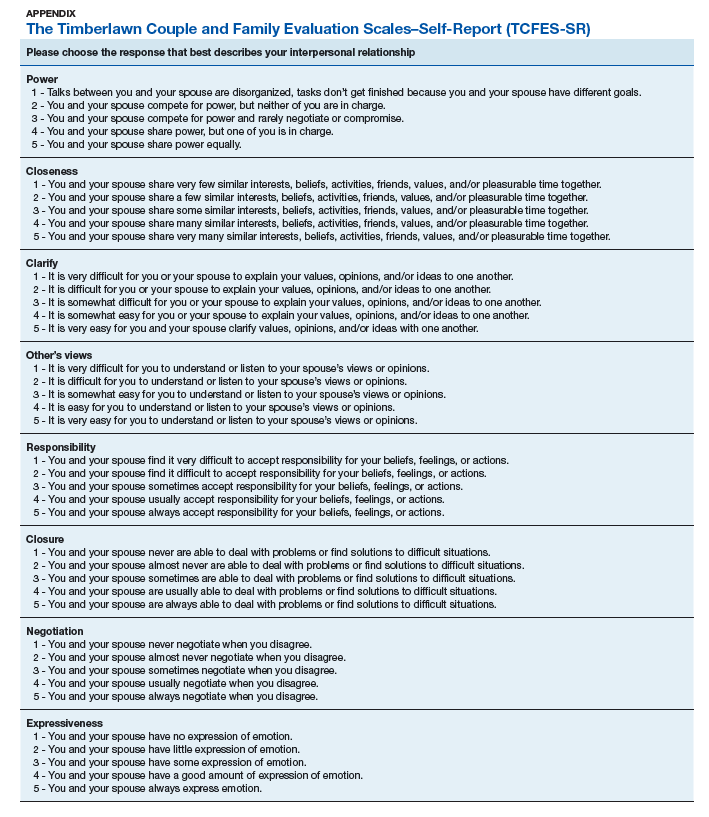
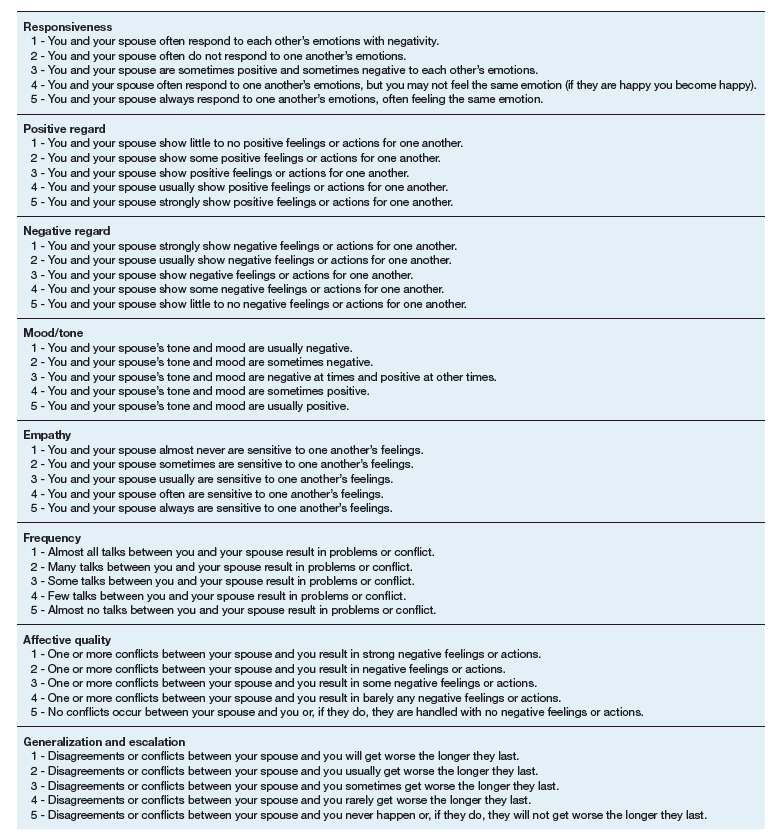
1. Kilpatrick DG, Resnick HS, Milanak ME, Miller MW, Keyes KM, Friedman MJ. National estimates of exposure to traumatic events and PTSD prevalence using DSM-IV and DSM-5 criteria. J Trauma Stress. 2013;26(5):537-547.
2. Lehavot K, Goldberg SB, Chen JA, et al. Do trauma type, stressful life events, and social support explain women veterans’ high prevalence of PTSD? Soc Psychiatry Psychiatr Epidemiol. 2018;53(9):943-953.
3. Galovski T, Lyons JA. Psychological sequelae of combat violence: a review of the impact of PTSD on the veteran’s family and possible interventions. Aggress Violent Behav. 2004;9(5):477-501.
4. Ray SL, Vanstone M. The impact of PTSD on veterans’ family relationships: an interpretative phenomenological inquiry. Int J Nurs Stud. 2009;46(6):838-847.
5. Cloitre M, Miranda R, Stovall-McClough KC, Han H. Beyond PTSD: emotion regulation and interpersonal problems as predictors of functional impairment in survivors of childhood abuse. Behav Ther. 2005;36(2):119-124.
6. McFarlane AC, Bookless C. The effect of PTSD on interpersonal relationships: issues for emergency service works. Sex Relation Ther. 2001;16(3):261-267.
7. Itzhaky L, Stein JY, Levin Y, Solomon Z. Posttraumatic stress symptoms and marital adjustment among Israeli combat veterans: the role of loneliness and attachment. Psychol Trauma. 2017;9(6):655-662.
8. Dekel R, Monson CM. Military-related post-traumatic stress disorder and family relations: current knowledge and future directions. Aggress Violent Behav. 2010;15(4):303-309.
9. Allen ES, Rhoades GK, Stanley SM, Markman HJ. Hitting home: relationships between recent deployment, posttraumatic stress symptoms, and marital functioning for Army couples. J Fam Psychol. 2010;24(3):280-288.
10. Laffaye C, Cavella S, Drescher K, Rosen C. Relationships among PTSD symptoms, social support, and support source in veterans with chronic PTSD. J Trauma Stress. 2008;21(4):394-401.
11. Meis LA, Noorbaloochi S, Hagel Campbell EM, et al. Sticking it out in trauma-focused treatment for PTSD: it takes a village. J Consult Clin Psychol. 2019;87(3):246-256.
12. Lewis JM, Gossett JT, Housson MM, Owen MT. Timberlawn Couple and Family Evaluation Scales. Dallas, TX: Timberlawn Psychiatric Research Foundation; 1999.
13. Fincham FD, Linfield KJ. A new look at marital quality: can spouses feel positive and negative about their marriage? J Fam Psychol. 1997;11(4):489-502.
14. Kaplan KJ. On the ambivalence-indifference problem in attitude theory and measurement: a suggested modification of the semantic differential technique. Psychol Bull. 1972;77(5):361-372.
15. Buhrmester D, Furman W. The Network of Relationship Inventory: Relationship Qualities Version [unpublished measure]. University of Texas at Dallas; 2008.
16. Busby DM, Christensen C, Crane DR, Larson JH. A revision of the Dyadic Adjustment Scale for use with distressed and nondistressed couples: construct hierarchy and multidimensional scales. J Marital Fam Ther. 1995;21(3):289-308.
17. Davis MH. A multidimensional approach to individual differences in empathy. JSAS Catalog Sel Doc Psychol. 1980;10:85.
18. Fraley RC, Waller NG, Brennan KA. An item-response theory analysis of self-report measures of adult attachment. J Pers Soc Psychol. 2000;78(2):350-365.
19. Tabachnick BG, Fidell L. Using Multivariate Statistics. 6th ed. Boston, MA: Pearson; 2013.
20. Sautter FJ, Armelie AP, Glynn SM, Wielt DB. The development of a couple-based treatment for PTSD in returning veterans. Prof Psychol Res Pr. 2011;42(1):63-69.
21. Jacobson NS, Christensen A, Prince SE, Cordova J, Eldridge K. Integrative behavioral couple therapy: an acceptance-based, promising new treatment of couple discord. J Consult Clin Psychol. 2000;9(2):351-355.
22. Makin-Byrd K, Gifford E, McCutcheon S, Glynn S. Family and couples treatment for newly returning veterans. Prof Psychol Res Pr. 2011;42(1):47-55.
23. Peterson K, Anderson J, Bourne D. Evidence Brief: Use of Patient Reported Outcome Measures for Measurement Based Care in Mental Health Shared Decision Making. Washington, DC: Department of Veterans Affairs; 2018. https://www.ncbi.nlm.nih.gov/books/NBK536143. Accessed September 13, 2019.
24. Fortney JC, Unützer J, Wrenn G, et al. A tipping point for measurement-based care. Psychiatr Serv. 2017;68(2):179-188.
25. Costello AB, Osborne JW. Best practices in exploratory factor analysis: four recommendations for getting the most from your analysis. Pract Assess Res Eval. 2005;10(7):1-9.
Although about 8.3% of the general adult civilian population will be diagnosed with posttraumatic stress disorder (PTSD) in their lifetime, rates of PTSD are even higher in the veteran population.1,2 PTSD is associated with a number of psychosocial consequences in veterans, including decreased intimate partner relationship functioning.3,4 For example, Cloitre and colleagues reported that PTSD is associated with difficulty with socializing, intimacy, responsibility, and control, all of which increase difficulties in intimate partner relationships.5 Similarly, researchers also have noted that traumatic experiences can affect an individual’s attachment style, resulting in progressive avoidance of interpersonal relationships, which can lead to marked difficulties in maintaining and beginning intimate partner relationships.6,7 Despite these known consequences of PTSD, as Dekel and Monson noted in a review,further research is still needed regarding the mechanisms by which trauma and PTSD result in decreased intimate partner relationship functioning among veterans.8 Nonetheless, as positive interpersonal relationships are associated with decreased PTSD symptom severity9,10 and increased engagement in PTSD treatment,11 determining methods of measuring intimate partner relationship functioning in veterans with PTSD is important to inform future research and aid the provision of care.
To date, limited research has examined the valid measurement of intimate partner relationship functioning among veterans with PTSD. Many existing measures that comprehensively assess intimate partner relationship functioning are time and resource intensive. One such measure, the Timberlawn Couple and Family Evaluation Scales (TCFES), comprehensively assesses multiple pertinent domains of intimate partner relationship functioning (ie, structure, autonomy, problem solving, affect regulation, and disagreement/conflict).12 By assessing multiple domains, the TCFES offers a method of understanding the specific components of an individual’s intimate partner relationship in need of increased clinical attention.12 However, the TCFES is a time- and labor-intensive observational measure that requires a couple to interact while a blinded, independent rater observes and rates their interactions using an intricate coding process. This survey structure precludes the ability to quickly and comprehensively assess a veteran’s intimate partner functioning in settings such as mental health outpatient clinics where mental health providers engage in brief, time-limited psychotherapy. As such, brief measures of intimate partner relationship functioning are needed to best inform clinical care among veterans with PTSD.
The primary aim of the current study was to create a psychometrically valid, yet brief, self-report version of the TCFES to assess multiple domains of intimate partner relationship functioning. The psychometric properties of this measure were assessed among a sample of US veterans with PTSD who were in an intimate partner relationship. We specifically examined factor structure, reliability, and associations to established measures of specific domains of relational functioning.
Methods
Ninety-four veterans were recruited via posted advertisements, promotion in PTSD therapy groups/staff meetings, and word of mouth at the Dallas Veterans Affairs Medical Center (VAMC). Participants were eligible if they had a documented diagnosis of PTSD as confirmed in the veteran’s electronic medical record and an affirmative response to currently being involved in an intimate partner relationship (ie, legally married, common-law spouse, involved in a relationship/partnership). There were no exclusion criteria.
Interested veterans were invited to complete several study-related self-report measures concerning their intimate partner relationships that would take about an hour. They were informed that the surveys were voluntary and confidential, and that they would be compensated for their participation. All veterans who participated provided written consent and the study was approved by the Dallas VAMC institutional review board.
Of the 94 veterans recruited, 3 veterans’ data were removed from current analyses after informed consent but before completing the surveys when they indicated they were not currently in a relationship or were divorced. After consent, the 91 participants were administered several study-related self-report measures. The measures took between 30 and 55 minutes to complete. Participants were then compensated $25 for their participation.
Intimate Partner Relationship Functioning
The 16-item TCFES self-report version (TCFES-SR) was developed to assess multiple domains of interpersonal functioning (Appendix). The observational TCFES assesses 5 intimate partner relationship characteristic domains (ie, structure, autonomy, problem solving, affect regulation, and disagreement/conflict) during a couple’s interaction by an independent trained rater.12 Each of the 16 TCFES-SR items were modeled after original constructs measured by the TCFES, including power, closeness, clarify, other’s views, responsibility, closure, negotiation, expressiveness, responsiveness, positive regard, negative regard, mood/tone, empathy, frequency, affective quality, and generalization and escalation. To maintain consistency with the TCFES, each item of the TCFES-SR was scored from 1 (severely dysfunctional) to 5 (highly functional). Additionally, all item wording for the TCFES-SR was based on wording in the TCFES manual after consultation with an expert who facilitated the development of the TCFES.12 On average, the TCFES-SR took 5 to 10 minutes to complete.
To measure concurrent validity of the modified TCFES-SR, several additional interpersonal measures were selected and administered based on prior research and established domains of the TCFES. The Positive and Negative Quality in Marriage Scale (PANQIMS) was administered to assess perceived attitudes toward a relationship.13,14 The PANQIMS generates 2 subscales: positive quality and negative quality in the relationship. Because the PANQIMS specifically assesses married relationships and our sample included married and nonmarried participants, wording was modified (eg, “spouse/partner”).
The relative power subscale of the Network Relationships Inventory–Relationship Qualities Version (NRI-RQV) measure was administered to assess the unequal/shared role romantic partners have in power equality (ie, relative power).15
The Revised Dyadic Adjustment Scale (RDAS) is a self-report measure that assesses multiple dimensions of marital adjustment and functioning.16 Six subscales of the RDAS were chosen based on items of the TCFES-SR: decision making, values, affection, conflict, activities, and discussion.
The Interpersonal Reactivity Index (IRI) empathetic concern subscale was administered to assess empathy across multiple contexts and situations17 and the Experiences in Close Relationships-Revised Questionnaire (ECR-R) was administered to assess relational functioning by determining attachment-related anxiety and avoidance.18
Sociodemographic Information
A sociodemographic questionnaire also was administered. The questionnaire assessed gender, age, education, service branch, length of interpersonal relationship, race, and ethnicity of the veteran as well as gender of the veteran’s partner.
Statistical Analysis
Factor structure of the TCFES-SR was determined by conducting an exploratory factor analysis. To allow for correlation between items, the Promax oblique rotation method was chosen.19 Number of factors was determined by agreement between number of eigenvalues ≥ 1, visual inspection of the scree plot, and a parallel analysis. Factor loadings of ≥ 0.3 were used to determine which items loaded on to which factors.
Convergent validity was assessed by conducting Pearson’s bivariate correlations between identified TCFES-SR factor(s) and other administered measures of interpersonal functioning (ie, PANQIMS positive and negative quality; NRI-RQV relative power subscale; RDAS decision making, values, affection, conflict, activities, and discussion subscales; IRI-empathetic concern subscale; and ECR-R attachment-related anxiety and avoidance subscales). Strength of relationship was determined based on the following guidelines: ± 0.3 to 0.49 = small, ± 0.5 to 0.69 = moderate, and ± 0.7 to 1.00 = large. Internal consistency was also determined for TCFES-SR factor(s) using Cronbach’s α. A standard level of significance (α=.05) was used for all statistical analyses.
Results
Eighty-six veterans provided complete data (Table 1). The Kaiser-Meyer-Olkin measure of sampling adequacy was indicative that sample size was adequate (.91), while Bartlett’s test of sphericity found the variables were suitable for structure detection, χ2 (120) = 800.00, P < .001. While 2 eigenvalues were ≥ 1, visual inspection of the scree plot and subsequent parallel analysis identified a unidimensional structure (ie, 1 factor) for the TCFES-SR. All items were found to load to this single factor, with all loadings being ≥ 0.5 (Table 2). Additionally, internal consistency was excellent for the scale (α = .93).
Pearson’s bivariate correlations were significant (P < .05) between TCFES-SR total score, and almost all administered interpersonal functioning measures (Table 3). Interestingly, no significant associations were found between any of the administered measures, including the TCFES-SR total score, and the IRI-empathetic concern subscale (P > .05).
Discussion
These findings provide initial support for the psychometric properties of the TCFES-SR, including excellent internal consistency and the adequate association of its total score to established measures of interpersonal functioning. Contrary to the TCFES, the TCFES-SR was shown to best fit a unidimensional factor rather than a multidimensional measure of relationship functioning. However, the TCFES-SR was also shown to have strong convergent validity with multiple domains of relationship functioning, indicating that the measure of overall intimate partner relationship functioning encompasses a number of relational domains (ie, structure, autonomy, problem solving, affect regulation, and disagreement/conflict). Critically, the TCFES-SR is brief and was administered easily in our sample, providing utility as clinical tool to be used in time-sensitive outpatient settings.
A unidimensional factor has particular strength in providing a global portrait of perceived intimate partner relationship functioning, and mental health providers can administer the TCFES-SR to assess for overall perceptions of intimate partner relationship functioning rather than administering a number of measures focusing on specific interpersonal domains (eg, decision making processes or positive/negative attitudes towards one’s relationship). This allows for the quick assessment (ie, 5-10 minutes) of overall intimate partner relationship functioning rather than administration of multiple self-report measures which can be time-intensive and expensive. However, the TCFES-SR also is limited by a lack of nuanced understanding of perceptions of functioning specific to particular domains. For example, the TCFES-SR score cannot describe intimate partner functioning in the domain of problem solving. Therefore, brief screening tools need to be developed that assess multiple intimate partner relationship domains.
Importantly, overall intimate partner relationship functioning as measured by the TCFES-SR may not incorporate perceptions of relationship empathy, as the total score did not correlate with a measure of empathetic concern (ie, the IRI-empathetic concern subscale). As empathy was based on one item in the TCFES-SR vs 7 in the IRI-empathetic concern subscale, it is unclear if the TCFES-SR only captures a portion of the construct of empathy (ie, sensitivity to partner) vs the comprehensive assessment of trait empathy that the IRI subscale measures. Additionally, the IRI-empathetic concern subscale did not significantly correlate with any of the other administered measures of relationship functioning. Given the role of empathy in positive, healthy intimate partner relationships, future research should explore the role of empathetic concern among veterans with PTSD as it relates to overall (eg, TCFES-SR) and specific aspects of intimate partner relationship functioning.20
While the clinical applicability of the TCFES-SR requires further examination, this measure has a number of potential uses. Information captured quickly by the TCFES-SR may help to inform appropriate referral for treatment. For instance, veterans reporting low total scores on the TCFES-SR may indicate a need for a referral for intervention focused on improving overall relationship functioning (eg, Integrative Behavioral Couple Therapy).21,22 Measurement-based care (ie, tracking and discussing changes in symptoms during treatment using validated self-report measures) is now required by the Joint Commission as a standard of care,and has been shown to improve outcomes in couples therapy.23,24 As a brief self-report measure, the TCFES-SR may be able to facilitate measurement-based care and assist providers in tracking changes in overall relationship functioning over the course of treatment. However, the purpose of the current study was to validate the TCFES-SR and not to examine the utility of the TCFES-SR in clinical care; additional research is needed to determine standardized cutoff scores to indicate a need for clinical intervention.
Limitations
Several limitations should be noted. The current study only assessed perceived intimate partner relationship functioning from the perspective of the veteran, thus limiting implications as it pertains to the spouse/partner of the veteran. PTSD diagnosis was based on chart review rather than a psychodiagnostic measure (eg, Clinician Administered PTSD Scale); therefore, whether this diagnosis was current or in remission was unclear. Although our sample was adequate to conduct an exploratory factor analysis,the overall sample size was modest, and results should be considered preliminary with need for further replication.25 The sample was also primarily male, white or black, and non-Hispanic; therefore, results may not generalize to a more sociodemographically diverse population. Finally, given the focus of the study to develop a self-report measure, we did not compare the TCFES-SR to the original TCFES. Thus, further research examining the relationship between the TCFES-SR and TCFES may be needed to better understand overlap and potential incongruence in these measures, and to ascertain any differences in their factor structures.
Conclusion
This study is novel in that it adapted a comprehensive observational measure of relationship functioning to a self-report measure piloted among a sample of veterans with PTSD in an intimate partner relationship, a clinical population that remains largely understudied. Although findings are preliminary, the TCFES-SR was found to be a reliable and valid measure of overall intimate partner relationship functioning. Given the rapid administration of this self-report measure, the TCFES-SR may hold clinical utility as a screen of intimate partner relationship deficits in need of clinical intervention. Replication in a larger, more diverse sample is needed to further examine the generalizability and confirm psychometric properties of the TCFES-SR. Additionally, further understanding of the clinical utility of the TCFES-SR in treatment settings remains critical to promote the development and maintenance of healthy intimate partner relationships among veterans with PTSD. Finally, development of effective self-report measures of intimate partner relationship functioning, such as the TCFES-SR, may help to facilitate needed research to understand the effect of PTSD on establishing and maintaining healthy intimate partner relationships among veterans.
Acknowledgments
The current study was funded by the Timberlawn Psychiatric Research Foundation. This material is the result of work supported in part by the US Department of Veterans Affairs; the Rocky Mountain Mental Illness Research, Education and Clinical Center (MIRECC) for Suicide Prevention; Sierra Pacific MIRECC; and the Office of Academic Affiliations, Advanced Fellowship Program in Mental Illness Research and Treatment, Department of Veterans Affairs.
1. Kilpatrick DG, Resnick HS, Milanak ME, Miller MW, Keyes KM, Friedman MJ. National estimates of exposure to traumatic events and PTSD prevalence using DSM-IV and DSM-5 criteria. J Trauma Stress. 2013;26(5):537-547.
2. Lehavot K, Goldberg SB, Chen JA, et al. Do trauma type, stressful life events, and social support explain women veterans’ high prevalence of PTSD? Soc Psychiatry Psychiatr Epidemiol. 2018;53(9):943-953.
3. Galovski T, Lyons JA. Psychological sequelae of combat violence: a review of the impact of PTSD on the veteran’s family and possible interventions. Aggress Violent Behav. 2004;9(5):477-501.
4. Ray SL, Vanstone M. The impact of PTSD on veterans’ family relationships: an interpretative phenomenological inquiry. Int J Nurs Stud. 2009;46(6):838-847.
5. Cloitre M, Miranda R, Stovall-McClough KC, Han H. Beyond PTSD: emotion regulation and interpersonal problems as predictors of functional impairment in survivors of childhood abuse. Behav Ther. 2005;36(2):119-124.
6. McFarlane AC, Bookless C. The effect of PTSD on interpersonal relationships: issues for emergency service works. Sex Relation Ther. 2001;16(3):261-267.
7. Itzhaky L, Stein JY, Levin Y, Solomon Z. Posttraumatic stress symptoms and marital adjustment among Israeli combat veterans: the role of loneliness and attachment. Psychol Trauma. 2017;9(6):655-662.
8. Dekel R, Monson CM. Military-related post-traumatic stress disorder and family relations: current knowledge and future directions. Aggress Violent Behav. 2010;15(4):303-309.
9. Allen ES, Rhoades GK, Stanley SM, Markman HJ. Hitting home: relationships between recent deployment, posttraumatic stress symptoms, and marital functioning for Army couples. J Fam Psychol. 2010;24(3):280-288.
10. Laffaye C, Cavella S, Drescher K, Rosen C. Relationships among PTSD symptoms, social support, and support source in veterans with chronic PTSD. J Trauma Stress. 2008;21(4):394-401.
11. Meis LA, Noorbaloochi S, Hagel Campbell EM, et al. Sticking it out in trauma-focused treatment for PTSD: it takes a village. J Consult Clin Psychol. 2019;87(3):246-256.
12. Lewis JM, Gossett JT, Housson MM, Owen MT. Timberlawn Couple and Family Evaluation Scales. Dallas, TX: Timberlawn Psychiatric Research Foundation; 1999.
13. Fincham FD, Linfield KJ. A new look at marital quality: can spouses feel positive and negative about their marriage? J Fam Psychol. 1997;11(4):489-502.
14. Kaplan KJ. On the ambivalence-indifference problem in attitude theory and measurement: a suggested modification of the semantic differential technique. Psychol Bull. 1972;77(5):361-372.
15. Buhrmester D, Furman W. The Network of Relationship Inventory: Relationship Qualities Version [unpublished measure]. University of Texas at Dallas; 2008.
16. Busby DM, Christensen C, Crane DR, Larson JH. A revision of the Dyadic Adjustment Scale for use with distressed and nondistressed couples: construct hierarchy and multidimensional scales. J Marital Fam Ther. 1995;21(3):289-308.
17. Davis MH. A multidimensional approach to individual differences in empathy. JSAS Catalog Sel Doc Psychol. 1980;10:85.
18. Fraley RC, Waller NG, Brennan KA. An item-response theory analysis of self-report measures of adult attachment. J Pers Soc Psychol. 2000;78(2):350-365.
19. Tabachnick BG, Fidell L. Using Multivariate Statistics. 6th ed. Boston, MA: Pearson; 2013.
20. Sautter FJ, Armelie AP, Glynn SM, Wielt DB. The development of a couple-based treatment for PTSD in returning veterans. Prof Psychol Res Pr. 2011;42(1):63-69.
21. Jacobson NS, Christensen A, Prince SE, Cordova J, Eldridge K. Integrative behavioral couple therapy: an acceptance-based, promising new treatment of couple discord. J Consult Clin Psychol. 2000;9(2):351-355.
22. Makin-Byrd K, Gifford E, McCutcheon S, Glynn S. Family and couples treatment for newly returning veterans. Prof Psychol Res Pr. 2011;42(1):47-55.
23. Peterson K, Anderson J, Bourne D. Evidence Brief: Use of Patient Reported Outcome Measures for Measurement Based Care in Mental Health Shared Decision Making. Washington, DC: Department of Veterans Affairs; 2018. https://www.ncbi.nlm.nih.gov/books/NBK536143. Accessed September 13, 2019.
24. Fortney JC, Unützer J, Wrenn G, et al. A tipping point for measurement-based care. Psychiatr Serv. 2017;68(2):179-188.
25. Costello AB, Osborne JW. Best practices in exploratory factor analysis: four recommendations for getting the most from your analysis. Pract Assess Res Eval. 2005;10(7):1-9.
Perceived Barriers and Facilitators of Clozapine Use: A National Survey of Veterans Affairs Prescribers (FULL)
Clozapine is an atypical antipsychotic that the US Food and Drug Administration (FDA) approved for use in schizophrenia and suicidality associated with schizophrenia or schizoaffective disorder. Clozapine has been shown to be superior to other antipsychotic treatment for treatment resistant schizophrenia (TRS), which is defined as failure of 2 adequate trials of antipsychotic therapy.1 Up to 30% of patients with schizophrenia are classified as treatment resistant.2
Clozapine is considered the drug of choice for patients with TRS in both the US Department of Veterans Affairs (VA) policies and other evidence-based guidelines and remains the only antipsychotic with FDA approval for TRS.2-5 Patients treated with clozapine have fewer psychiatric hospitalizations, fewer suicide attempts, lower rates of nonadherence, and less antipsychotic polypharmacy compared with patients who are treated with other antipsychotic therapy.6,7 A 2016 study by Gören and colleagues found that in addition to the clinical benefits, there is the potential for cost savings of $22,000 for each veteran switched to and treated with clozapine for 1 year even when accounting for the cost of monitoring and potential adverse event management.8 This translates to a total savings of > $80 million if current utilization were doubled and half of those patients continued treatment for 1 year within the Veterans Health Administration (VHA). However, despite evidence supporting use, < 10% of Medicaid-eligible patients and only 4% of patients with schizophrenia in the VHA are prescribed clozapine.8,9
Clozapine is underutilized for a variety of reasons, including intensive monitoring requirements, potential for severe adverse drug reactions, and concern for patient adherence.8 Common adverse effects (AEs) can range from mild to severe and include weight gain, constipation, sedation, orthostatic hypotension, and excessive salivation. Clozapine also carries a boxed warning for agranulocytosis, seizures, myocarditis, other cardiovascular and respiratory AEs (including orthostatic hypotension), and increased mortality in elderly patients with dementia.
Severe agranulocytosis occurs in between 0.05% and 0.86% of patients, which led the FDA to implement a Risk Evaluation and Mitigation Strategy (REMS) program for clozapine prescribing in 2015. Prior to the REMS program, each of the 6 clozapine manufacturers were required to maintain a registry to monitor for agranulocytosis. Per the REMS program requirements, health care providers (HCPs), dispensing pharmacies, and patients must be enrolled in the program and provide an updated absolute neutrophil count (ANC) prior to prescribing or dispensing clozapine. This is potentially time consuming, particularly during the first 6 months of treatment when the ANC must be monitored weekly and prescriptions are restricted to a 7-day supply. With recent changes to the REMS program, pharmacists are no longer permitted to enroll patients in the REMS system. This adds to the administrative burden on HCPs and may decrease further the likelihood of prescribing clozapine due to lack of time for these tasks. Within the VHA, a separate entity, the VA National Clozapine Coordinating Center (NCCC), reduces the administrative burden on HCPs by monitoring laboratory values, controlling dispensing, and communicating data electronically to the FDA REMS program.10
Despite the various administrative and clinical barriers and facilitators to prescribing that exist, previous studies have found that certain organizational characteristics also may influence clozapine prescribing rates. Gören and colleagues found that utilization at VHA facilities ranged from < 5% to about 20% of patients with schizophrenia. In this study, facilities with higher utilization of clozapine were more likely to have integrated nonphysician psychiatric providers in clinics and to have clear organizational structure and processes for the treatment of severe mental illness, while facilities with lower utilization rates were less likely to have a point person for clozapine management.11
Although many national efforts have been made to increase clozapine use in recent years, no study has examined HCP perception of barriers and facilitators of clozapine use in the VHA. The objective of this study is to identify barriers and facilitators of clozapine use within the VHA as perceived by HCPs so that these may be addressed to increase appropriate utilization of clozapine in veterans with TRS.
Methods
This study was conducted as a national survey of mental health providers within the VHA who had a scope of practice that allowed clozapine prescribing. Any HCP in a solely administrative role was excluded. The survey tool was reviewed by clinical pharmacy specialists at the Lexington VA Health Care System for content and ease of administration. Following appropriate institutional review board approval, the survey was submitted to the organizational assessment subcommittee and the 5 national VA unions for approval per VA policy. The survey tool was built and administered through REDCap (Nashville, Tennessee) software. An electronic link was sent out to the national VA psychiatric pharmacist and national psychiatry chief listservs for dissemination to the psychiatric providers at each facility with weekly reminders sent out during the 4-week study period to maximize participation. The 29-item survey was developed to assess demographic information, HCP characteristics, perceived barriers and facilitators of clozapine use, and general clozapine knowledge. Knowledge-based questions included appropriate indications, starting dose, baseline ANC requirement, ANC monitoring requirements, and possible AEs.
Primary outcomes assessed were perceived barriers to clozapine prescribing, opinions of potential interventions to facilitate clozapine prescribing, knowledge regarding clozapine, and the impact of medication management clinics on clozapine prescribing. For the purposes of this study, a clozapine clinic was defined as an interdisciplinary team dedicated to clozapine prescribing and monitoring.
Secondary outcomes included a comparison of clozapine prescribing rates among different subgroups of HCPs. Subgroups included HCP discipline, geographic region, presence of academic affiliation, level of comfort or familiarity with clozapine, and percentage of time spent in direct patient care. The regional Veterans Integrated Service Networks (VISN) were used to evaluate the effect of geographic region on prescribing practices.
Results of the survey were analyzed using descriptive statistics. The Mann-Whitney U test was utilized to compare ordinal data from questions that were scored on a Likert scale, and nominal data was compared utilizing the χ2 test. For all objectives, an α of < .05 was considered significant.
Results
Ninety-eight HCPs from 17 VISNs responded during the 4-week survey period. One participant was excluded due to a solely administrative role. HCP characteristics and demographics are described in Table 1. The majority of respondents practice in an outpatient mental health setting either at the main VA campus or at a community-based outpatient clinic (CBOC).
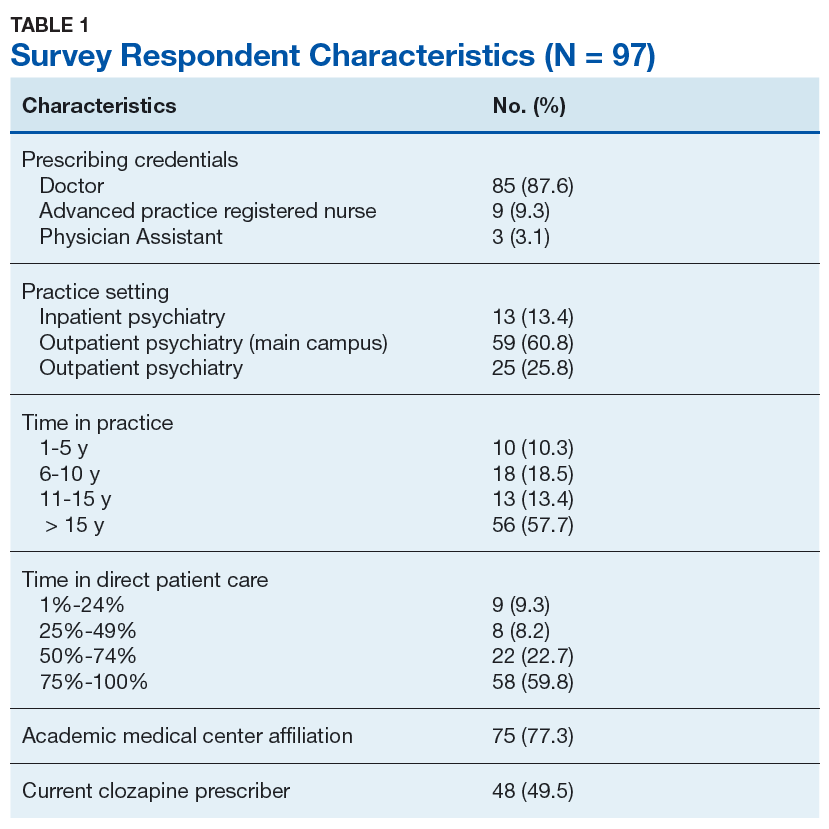
Primary Outcomes
Perceived Barriers to Prescribing
The majority of survey respondents rated all factors listed as at least somewhat of a barrier to prescribing. Table 2 describes the perception of these various factors as barriers to clozapine prescribing. Along with prespecified variables, a free text box was available to participants to identify other perceived barriers not listed. Among other concerns listed in this text box were patient buy-in (11.3%), process/coordination of prescribing (8.2%), time restrictions (7.2%), prescriber restrictions (7.2%), access (3.1%), credentialing problems (2.1%), and lack of clear education materials (1%).
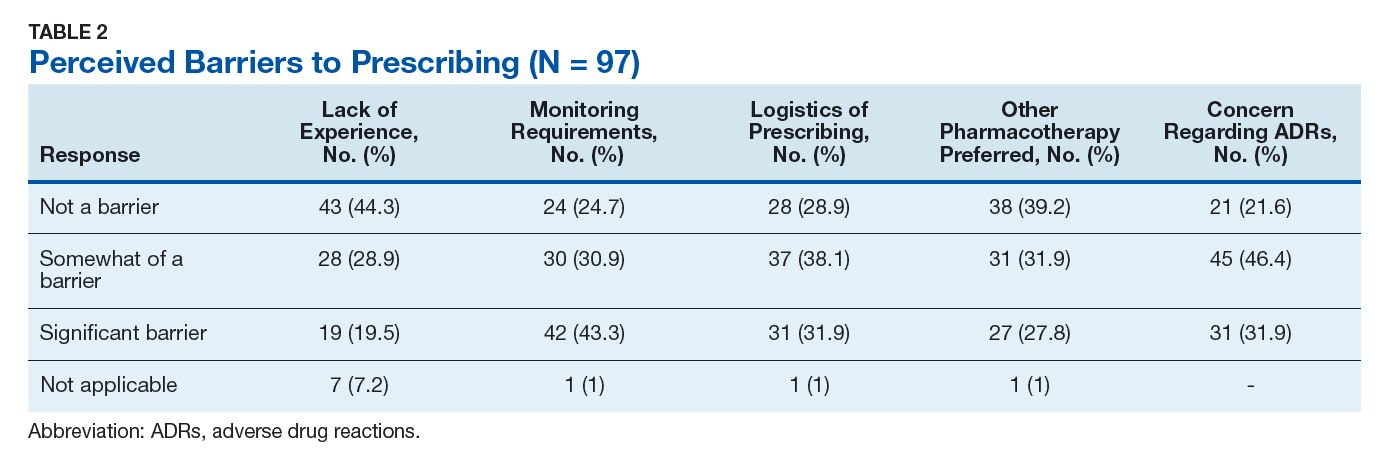
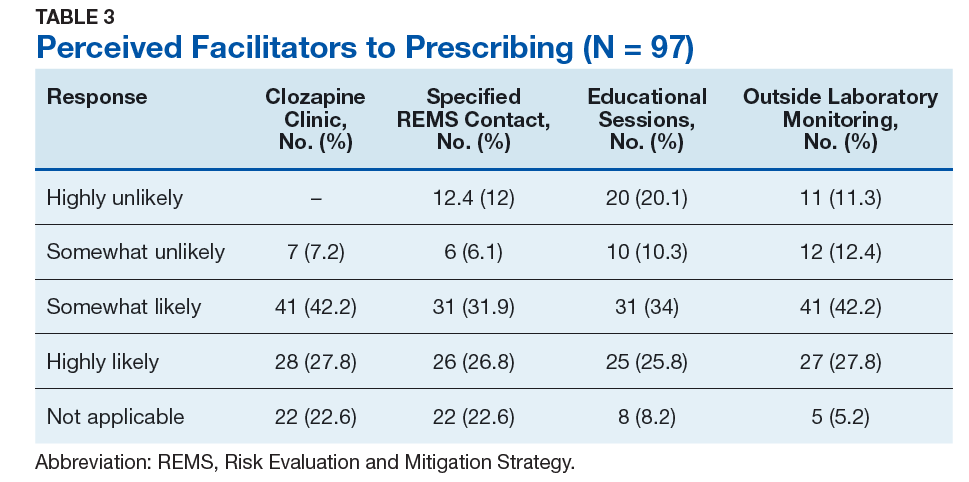
Perceived Facilitators to Prescribing
When asked to consider the potential for increased prescribing with various interventions, most participants reported that all identified facilitators would be at least somewhat likely to increase their clozapine utilization. Table 3 describes the perception of these various factors as facilitators to clozapine prescribing. Other identified facilitators included nursing or pharmacy support for follow-ups (4.1%), advanced practice registered nurse credentialing for VHA prescribing (3.1%), utilization of national REMS program without the NCCC (3.1%), outside pharmacy use during titration phase (2.1%), prespecified coverage for HCPs while on leave (1%), and increased access to specialty consults for AEs (1%).
Clozapine Knowledge Assessment
Overall, the average score on the clozapine knowledge assessment portion of the survey was 85.6%. The most commonly missed questions concerned the minimum ANC required to initiate clozapine and the appropriate starting dose for clozapine (Table 4). No significant difference was seen in clozapine utilization based on the clozapine knowledge assessment score when HCPs who scored≤ 60% were compared with those who scored ≥ 80% (P = .29).
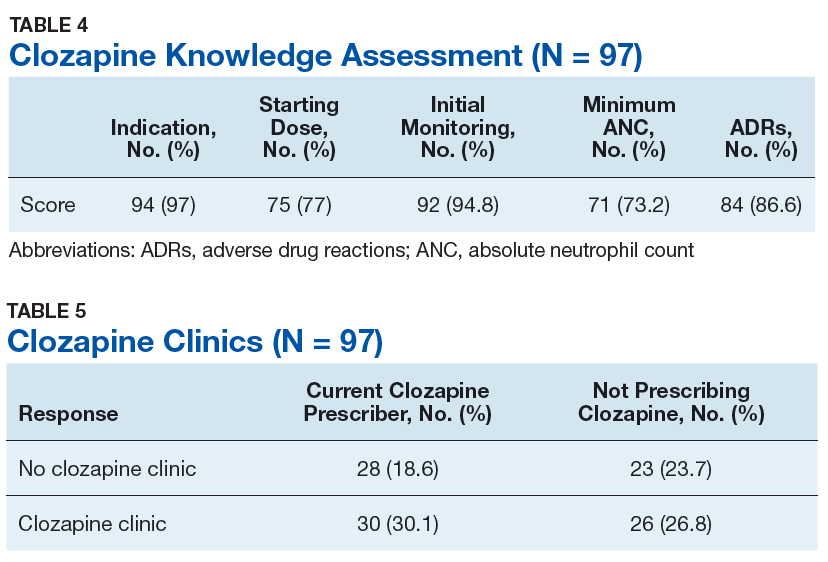
Clozapine Clinic
No statistically significant difference was found (P = .35) when rates of prescribing between facilities with or without a dedicated clozapine clinic were compared (Table 5). Additionally, the involvement of a pharmacist in clozapine management clinics did not lead to a statistically significant difference in utilization rates (P = .45).
Secondary Outcomes
Self-rated level of comfort with clozapine prescribing was significantly associated with rates of clozapine prescribing (P < .01). HCPs who rated themselves as somewhat or very comfortable were significantly more likely to prescribe clozapine (Table 6). Providers who rated themselves as very familiar with clozapine monitoring requirements (Table 7) were significantly more likely to prescribe clozapine (P < .01). This significance remained when comparing HCPs who rated themselves as very familiar to those who ranked themselves as somewhat familiar (P = .01). There was no statistically significant difference in clozapine prescribing based on academic medical center affiliation, time spent in direct patient care, or geographic location.
Discussion
This survey targeted VHA HCPs who were licensed to prescribe clozapine to identify barriers and facilitators of use, along with HCP characteristics that may impact clozapine utilization. The findings of this study indicate that even though HCPs may perceive many legitimate barriers to clozapine prescribing, such as the frequent laboratory monitoring requirements, some factors may increase their willingness to prescribe clozapine. Many of these facilitators involve addressing logistical concerns and the administrative burden that accompanies clozapine use. These findings echo previous studies done within and outside the VHA.8,9
While some identified barriers would require national policy changes to address, others could be addressed at VHA facilities. It may be prudent for each VA facility to identify a HCP who is familiar with clozapine to serve as a subject matter expert. This would be beneficial to those HCPs who feel their patients may benefit from clozapine, but who lack experience in prescribing, or for those with concerns about appropriateness of a specific patient. Additionally, this point of contact could be a valuable resource for concerns regarding administrative issues that may arise with the laboratory reporting system. In some facilities, it may be beneficial to set aside dedicated prescriber time in a clinic designed for clozapine management. Many HCPs in this survey identified the establishment of a clozapine clinic as an intervention that would increase their likelihood of prescribing clozapine. This type of clinic may alleviate some of the concerns regarding appointment availability for weekly or bimonthly appointments early in therapy by having additional staff and time dedicated to accommodating the need for frequent visits.
The majority of respondents to this survey were concerned about the logistics of clozapine monitoring and prescribing; however, this is largely dictated by FDA and VHA policies and regulations. Per national guidance, patients within the VHA should only receive prescriptions for clozapine from their local VA facility pharmacy. It takes many veterans ≥ 1 hour to travel to the closest VA hospital or CBOC. This is especially true for facilities with largely rural catchments. These patients often lack many resources that may be present in more urban areas, such as reliable public transportation. This creates challenges for both weekly laboratory monitoring and dispensing of weekly clozapine prescriptions early in therapy. The option to get clozapine from a local non-VA pharmacy and complete laboratory monitoring at a non-VA laboratory facility could make a clozapine trial more feasible for these veterans. Another consideration is increasing the availability of VA-funded transportation for these patients to assist them in getting to their appointments. Serious mental illness case workers or mental health intensive case management services also may prove useful in arranging for transportation for laboratory monitoring.
Providers with higher self-rated comfort and familiarity with monitoring requirements had a significantly increased likelihood of clozapine utilization. Lack of experience was commonly identified as a barrier to prescribing. Subsequently, the majority of respondents felt that educational sessions would increase their likelihood to prescribe clozapine. This could be addressed at both a facility and national level. As discussed above, a subject matter expert at each facility could provide some of this education and guidance for prescribers who have little or no experience with clozapine. Additionally, national educational presentations and academic detailing campaigns may be an efficient way to provide standardized education across the VHA. Dissemination of required education via the VA Talent Management System is another potential route that would ensure all providers received adequate training regarding the specific challenges of prescribing clozapine within the VA.
Strengths and Limitations
The strengths of this study lie in directly assessing HCP perceptions of barriers and facilitators. It is ultimately up to each individual HCP to decide to use clozapine. Addressing the concerns of these HCPs will be advantageous in efforts to increase clozapine utilization. Additionally, to the authors’ knowledge this is the first study to assess provider characteristics and knowledge of clozapine in relation to utilization rates.
The method of distribution was a major limitation of this study. This survey was distributed via national e-mail listservs; however, no listserv exists within the VA that targets all psychiatric providers. This study relied on the psychiatry chiefs and psychiatric pharmacists within each facility to further disseminate the survey, which could have led to lower response rates than what may be gathered via more direct contact methods. In addition, targeting psychiatric section chiefs and pharmacists may have introduced response bias. Another limitation to this study was the small number of responses. It is possible that this study was not adequately powered to detect significant differences in clozapine prescribing based on HCP characteristics or clozapine clinic availability. Further studies investigating the impact of provider characteristics on clozapine utilization are warranted.
Conclusion
Even though clozapine is an effective medication for TRS, providers underutilize it for a variety of reasons. Commonly identified barriers to prescribing in this study included frequent monitoring requirements, logistics of prescribing (including the REMS program and transportation for laboratory monitoring), pharmacotherapy preferences, and concern about the potential AEs. Facilitators identified in this study included implementation of clozapine clinics, having a specified contact point within the facility to assist with administrative responsibility, educational sessions, and the ability to utilize outside laboratories.
While some of these barriers and facilitators cannot be fully addressed without national policy change, individual facilities should make every effort to identify institution-specific concerns and address these. Clozapine clinic implementation and educational sessions appear to be reasonable considerations. This study did not identify any HCP characteristics that significantly impacted the likelihood of prescribing clozapine aside from self-rated comfort and familiarity with clozapine. However, further studies are needed to fully assess the impact of provider characteristics on clozapine utilization.
1. Siskind D, Mccartney L, Goldschlager R, Kisely S. Clozapine v. first- and second-generation antipsychotics in treatment-refractory schizophrenia: systematic review and meta-analysis. Br J Psychiatry. 2016;209(5):385-392.
2. Lehman A, Lieberman JA, Dixon LB, et al; American Psychiatric Association; Steering Committee on Practice Guidelines. Practice guidelines for the treatment of patients with schizophrenia, second edition. Am J Psychiatry. 2004;161(2 suppl):1-56.
3. US Department of Veterans Affairs. Recommendations for antipsychotic selection in schizophrenia and schizoaffective disorders. https://www.pbm.va.gov/PBM/clinicalguidance/clinicalrecommendations/AntipsychoticSelectionAlgorithmSchizophreniaJune2012.doc. Published June 2012. Accessed September 12, 2019.
4. Dixon L, Perkins D, Calmes C. Guidelines watch (September 2009): practice guidelines for the treatment of patients with schizophrenia. https://psychiatryonline.org/pb/assets/raw/sitewide/practice_guidelines/guidelines/schizophrenia-watch.pdf. Published September 2009. Accessed September 12, 2019.
5. National Institute for Health and Care Excellence. Psychosis and schizophrenia in adults: prevention and management. https://www.nice.org.uk/guidance/cg178. Updated March 2014. Accessed September 12, 2019.
6. Meltzer HY, Alphs L, Green AI, et al; International Suicide Prevention Trial Study Group. Clozapine treatment for suicidality in schizophrenia: International Suicide Prevention Trial (InterSePT). Arch Gen Psychiatry. 2003;60(1):82-91.
7. Stroup TS, Gerhard T, Crystal S, Huang C, Olfson M. Comparative effectiveness of clozapine and standard antipsychotic treatment in adults with schizophrenia. Am J Psychiatry. 2016;173(2):166-173.
8. Gören JL, Rose AJ, Smith EG, Ney JP. The business case for expanded clozapine utilization. Psychiatr Serv. 2016;67(11):1197-1205.
9. Kelly DL, Freudenreich O, Sayer MA, Love RC. Addressing barriers to clozapine underutilization: a national effort. Psychiatr Serv. 2018;69(2):224-227.
10. US Department of Veterans Affairs. Clozapine patient management protocol (CPMP). https://www.va.gov/vhapublications/ViewPublication.asp?pub_ID=1818. Published December 23, 2008. Accessed September 12, 2019.
11. Gören JL, Rose AJ, Engle RL, et al. Organizational characteristics of Veterans Affairs clinics with high and low utilization of clozapine. Psychiatr Serv. 2016;67(11):1189-1196.
Clozapine is an atypical antipsychotic that the US Food and Drug Administration (FDA) approved for use in schizophrenia and suicidality associated with schizophrenia or schizoaffective disorder. Clozapine has been shown to be superior to other antipsychotic treatment for treatment resistant schizophrenia (TRS), which is defined as failure of 2 adequate trials of antipsychotic therapy.1 Up to 30% of patients with schizophrenia are classified as treatment resistant.2
Clozapine is considered the drug of choice for patients with TRS in both the US Department of Veterans Affairs (VA) policies and other evidence-based guidelines and remains the only antipsychotic with FDA approval for TRS.2-5 Patients treated with clozapine have fewer psychiatric hospitalizations, fewer suicide attempts, lower rates of nonadherence, and less antipsychotic polypharmacy compared with patients who are treated with other antipsychotic therapy.6,7 A 2016 study by Gören and colleagues found that in addition to the clinical benefits, there is the potential for cost savings of $22,000 for each veteran switched to and treated with clozapine for 1 year even when accounting for the cost of monitoring and potential adverse event management.8 This translates to a total savings of > $80 million if current utilization were doubled and half of those patients continued treatment for 1 year within the Veterans Health Administration (VHA). However, despite evidence supporting use, < 10% of Medicaid-eligible patients and only 4% of patients with schizophrenia in the VHA are prescribed clozapine.8,9
Clozapine is underutilized for a variety of reasons, including intensive monitoring requirements, potential for severe adverse drug reactions, and concern for patient adherence.8 Common adverse effects (AEs) can range from mild to severe and include weight gain, constipation, sedation, orthostatic hypotension, and excessive salivation. Clozapine also carries a boxed warning for agranulocytosis, seizures, myocarditis, other cardiovascular and respiratory AEs (including orthostatic hypotension), and increased mortality in elderly patients with dementia.
Severe agranulocytosis occurs in between 0.05% and 0.86% of patients, which led the FDA to implement a Risk Evaluation and Mitigation Strategy (REMS) program for clozapine prescribing in 2015. Prior to the REMS program, each of the 6 clozapine manufacturers were required to maintain a registry to monitor for agranulocytosis. Per the REMS program requirements, health care providers (HCPs), dispensing pharmacies, and patients must be enrolled in the program and provide an updated absolute neutrophil count (ANC) prior to prescribing or dispensing clozapine. This is potentially time consuming, particularly during the first 6 months of treatment when the ANC must be monitored weekly and prescriptions are restricted to a 7-day supply. With recent changes to the REMS program, pharmacists are no longer permitted to enroll patients in the REMS system. This adds to the administrative burden on HCPs and may decrease further the likelihood of prescribing clozapine due to lack of time for these tasks. Within the VHA, a separate entity, the VA National Clozapine Coordinating Center (NCCC), reduces the administrative burden on HCPs by monitoring laboratory values, controlling dispensing, and communicating data electronically to the FDA REMS program.10
Despite the various administrative and clinical barriers and facilitators to prescribing that exist, previous studies have found that certain organizational characteristics also may influence clozapine prescribing rates. Gören and colleagues found that utilization at VHA facilities ranged from < 5% to about 20% of patients with schizophrenia. In this study, facilities with higher utilization of clozapine were more likely to have integrated nonphysician psychiatric providers in clinics and to have clear organizational structure and processes for the treatment of severe mental illness, while facilities with lower utilization rates were less likely to have a point person for clozapine management.11
Although many national efforts have been made to increase clozapine use in recent years, no study has examined HCP perception of barriers and facilitators of clozapine use in the VHA. The objective of this study is to identify barriers and facilitators of clozapine use within the VHA as perceived by HCPs so that these may be addressed to increase appropriate utilization of clozapine in veterans with TRS.
Methods
This study was conducted as a national survey of mental health providers within the VHA who had a scope of practice that allowed clozapine prescribing. Any HCP in a solely administrative role was excluded. The survey tool was reviewed by clinical pharmacy specialists at the Lexington VA Health Care System for content and ease of administration. Following appropriate institutional review board approval, the survey was submitted to the organizational assessment subcommittee and the 5 national VA unions for approval per VA policy. The survey tool was built and administered through REDCap (Nashville, Tennessee) software. An electronic link was sent out to the national VA psychiatric pharmacist and national psychiatry chief listservs for dissemination to the psychiatric providers at each facility with weekly reminders sent out during the 4-week study period to maximize participation. The 29-item survey was developed to assess demographic information, HCP characteristics, perceived barriers and facilitators of clozapine use, and general clozapine knowledge. Knowledge-based questions included appropriate indications, starting dose, baseline ANC requirement, ANC monitoring requirements, and possible AEs.
Primary outcomes assessed were perceived barriers to clozapine prescribing, opinions of potential interventions to facilitate clozapine prescribing, knowledge regarding clozapine, and the impact of medication management clinics on clozapine prescribing. For the purposes of this study, a clozapine clinic was defined as an interdisciplinary team dedicated to clozapine prescribing and monitoring.
Secondary outcomes included a comparison of clozapine prescribing rates among different subgroups of HCPs. Subgroups included HCP discipline, geographic region, presence of academic affiliation, level of comfort or familiarity with clozapine, and percentage of time spent in direct patient care. The regional Veterans Integrated Service Networks (VISN) were used to evaluate the effect of geographic region on prescribing practices.
Results of the survey were analyzed using descriptive statistics. The Mann-Whitney U test was utilized to compare ordinal data from questions that were scored on a Likert scale, and nominal data was compared utilizing the χ2 test. For all objectives, an α of < .05 was considered significant.
Results
Ninety-eight HCPs from 17 VISNs responded during the 4-week survey period. One participant was excluded due to a solely administrative role. HCP characteristics and demographics are described in Table 1. The majority of respondents practice in an outpatient mental health setting either at the main VA campus or at a community-based outpatient clinic (CBOC).
Primary Outcomes
Perceived Barriers to Prescribing
The majority of survey respondents rated all factors listed as at least somewhat of a barrier to prescribing. Table 2 describes the perception of these various factors as barriers to clozapine prescribing. Along with prespecified variables, a free text box was available to participants to identify other perceived barriers not listed. Among other concerns listed in this text box were patient buy-in (11.3%), process/coordination of prescribing (8.2%), time restrictions (7.2%), prescriber restrictions (7.2%), access (3.1%), credentialing problems (2.1%), and lack of clear education materials (1%).
Perceived Facilitators to Prescribing
When asked to consider the potential for increased prescribing with various interventions, most participants reported that all identified facilitators would be at least somewhat likely to increase their clozapine utilization. Table 3 describes the perception of these various factors as facilitators to clozapine prescribing. Other identified facilitators included nursing or pharmacy support for follow-ups (4.1%), advanced practice registered nurse credentialing for VHA prescribing (3.1%), utilization of national REMS program without the NCCC (3.1%), outside pharmacy use during titration phase (2.1%), prespecified coverage for HCPs while on leave (1%), and increased access to specialty consults for AEs (1%).
Clozapine Knowledge Assessment
Overall, the average score on the clozapine knowledge assessment portion of the survey was 85.6%. The most commonly missed questions concerned the minimum ANC required to initiate clozapine and the appropriate starting dose for clozapine (Table 4). No significant difference was seen in clozapine utilization based on the clozapine knowledge assessment score when HCPs who scored≤ 60% were compared with those who scored ≥ 80% (P = .29).
Clozapine Clinic
No statistically significant difference was found (P = .35) when rates of prescribing between facilities with or without a dedicated clozapine clinic were compared (Table 5). Additionally, the involvement of a pharmacist in clozapine management clinics did not lead to a statistically significant difference in utilization rates (P = .45).
Secondary Outcomes
Self-rated level of comfort with clozapine prescribing was significantly associated with rates of clozapine prescribing (P < .01). HCPs who rated themselves as somewhat or very comfortable were significantly more likely to prescribe clozapine (Table 6). Providers who rated themselves as very familiar with clozapine monitoring requirements (Table 7) were significantly more likely to prescribe clozapine (P < .01). This significance remained when comparing HCPs who rated themselves as very familiar to those who ranked themselves as somewhat familiar (P = .01). There was no statistically significant difference in clozapine prescribing based on academic medical center affiliation, time spent in direct patient care, or geographic location.
Discussion
This survey targeted VHA HCPs who were licensed to prescribe clozapine to identify barriers and facilitators of use, along with HCP characteristics that may impact clozapine utilization. The findings of this study indicate that even though HCPs may perceive many legitimate barriers to clozapine prescribing, such as the frequent laboratory monitoring requirements, some factors may increase their willingness to prescribe clozapine. Many of these facilitators involve addressing logistical concerns and the administrative burden that accompanies clozapine use. These findings echo previous studies done within and outside the VHA.8,9
While some identified barriers would require national policy changes to address, others could be addressed at VHA facilities. It may be prudent for each VA facility to identify a HCP who is familiar with clozapine to serve as a subject matter expert. This would be beneficial to those HCPs who feel their patients may benefit from clozapine, but who lack experience in prescribing, or for those with concerns about appropriateness of a specific patient. Additionally, this point of contact could be a valuable resource for concerns regarding administrative issues that may arise with the laboratory reporting system. In some facilities, it may be beneficial to set aside dedicated prescriber time in a clinic designed for clozapine management. Many HCPs in this survey identified the establishment of a clozapine clinic as an intervention that would increase their likelihood of prescribing clozapine. This type of clinic may alleviate some of the concerns regarding appointment availability for weekly or bimonthly appointments early in therapy by having additional staff and time dedicated to accommodating the need for frequent visits.
The majority of respondents to this survey were concerned about the logistics of clozapine monitoring and prescribing; however, this is largely dictated by FDA and VHA policies and regulations. Per national guidance, patients within the VHA should only receive prescriptions for clozapine from their local VA facility pharmacy. It takes many veterans ≥ 1 hour to travel to the closest VA hospital or CBOC. This is especially true for facilities with largely rural catchments. These patients often lack many resources that may be present in more urban areas, such as reliable public transportation. This creates challenges for both weekly laboratory monitoring and dispensing of weekly clozapine prescriptions early in therapy. The option to get clozapine from a local non-VA pharmacy and complete laboratory monitoring at a non-VA laboratory facility could make a clozapine trial more feasible for these veterans. Another consideration is increasing the availability of VA-funded transportation for these patients to assist them in getting to their appointments. Serious mental illness case workers or mental health intensive case management services also may prove useful in arranging for transportation for laboratory monitoring.
Providers with higher self-rated comfort and familiarity with monitoring requirements had a significantly increased likelihood of clozapine utilization. Lack of experience was commonly identified as a barrier to prescribing. Subsequently, the majority of respondents felt that educational sessions would increase their likelihood to prescribe clozapine. This could be addressed at both a facility and national level. As discussed above, a subject matter expert at each facility could provide some of this education and guidance for prescribers who have little or no experience with clozapine. Additionally, national educational presentations and academic detailing campaigns may be an efficient way to provide standardized education across the VHA. Dissemination of required education via the VA Talent Management System is another potential route that would ensure all providers received adequate training regarding the specific challenges of prescribing clozapine within the VA.
Strengths and Limitations
The strengths of this study lie in directly assessing HCP perceptions of barriers and facilitators. It is ultimately up to each individual HCP to decide to use clozapine. Addressing the concerns of these HCPs will be advantageous in efforts to increase clozapine utilization. Additionally, to the authors’ knowledge this is the first study to assess provider characteristics and knowledge of clozapine in relation to utilization rates.
The method of distribution was a major limitation of this study. This survey was distributed via national e-mail listservs; however, no listserv exists within the VA that targets all psychiatric providers. This study relied on the psychiatry chiefs and psychiatric pharmacists within each facility to further disseminate the survey, which could have led to lower response rates than what may be gathered via more direct contact methods. In addition, targeting psychiatric section chiefs and pharmacists may have introduced response bias. Another limitation to this study was the small number of responses. It is possible that this study was not adequately powered to detect significant differences in clozapine prescribing based on HCP characteristics or clozapine clinic availability. Further studies investigating the impact of provider characteristics on clozapine utilization are warranted.
Conclusion
Even though clozapine is an effective medication for TRS, providers underutilize it for a variety of reasons. Commonly identified barriers to prescribing in this study included frequent monitoring requirements, logistics of prescribing (including the REMS program and transportation for laboratory monitoring), pharmacotherapy preferences, and concern about the potential AEs. Facilitators identified in this study included implementation of clozapine clinics, having a specified contact point within the facility to assist with administrative responsibility, educational sessions, and the ability to utilize outside laboratories.
While some of these barriers and facilitators cannot be fully addressed without national policy change, individual facilities should make every effort to identify institution-specific concerns and address these. Clozapine clinic implementation and educational sessions appear to be reasonable considerations. This study did not identify any HCP characteristics that significantly impacted the likelihood of prescribing clozapine aside from self-rated comfort and familiarity with clozapine. However, further studies are needed to fully assess the impact of provider characteristics on clozapine utilization.
1. Siskind D, Mccartney L, Goldschlager R, Kisely S. Clozapine v. first- and second-generation antipsychotics in treatment-refractory schizophrenia: systematic review and meta-analysis. Br J Psychiatry. 2016;209(5):385-392.
2. Lehman A, Lieberman JA, Dixon LB, et al; American Psychiatric Association; Steering Committee on Practice Guidelines. Practice guidelines for the treatment of patients with schizophrenia, second edition. Am J Psychiatry. 2004;161(2 suppl):1-56.
3. US Department of Veterans Affairs. Recommendations for antipsychotic selection in schizophrenia and schizoaffective disorders. https://www.pbm.va.gov/PBM/clinicalguidance/clinicalrecommendations/AntipsychoticSelectionAlgorithmSchizophreniaJune2012.doc. Published June 2012. Accessed September 12, 2019.
4. Dixon L, Perkins D, Calmes C. Guidelines watch (September 2009): practice guidelines for the treatment of patients with schizophrenia. https://psychiatryonline.org/pb/assets/raw/sitewide/practice_guidelines/guidelines/schizophrenia-watch.pdf. Published September 2009. Accessed September 12, 2019.
5. National Institute for Health and Care Excellence. Psychosis and schizophrenia in adults: prevention and management. https://www.nice.org.uk/guidance/cg178. Updated March 2014. Accessed September 12, 2019.
6. Meltzer HY, Alphs L, Green AI, et al; International Suicide Prevention Trial Study Group. Clozapine treatment for suicidality in schizophrenia: International Suicide Prevention Trial (InterSePT). Arch Gen Psychiatry. 2003;60(1):82-91.
7. Stroup TS, Gerhard T, Crystal S, Huang C, Olfson M. Comparative effectiveness of clozapine and standard antipsychotic treatment in adults with schizophrenia. Am J Psychiatry. 2016;173(2):166-173.
8. Gören JL, Rose AJ, Smith EG, Ney JP. The business case for expanded clozapine utilization. Psychiatr Serv. 2016;67(11):1197-1205.
9. Kelly DL, Freudenreich O, Sayer MA, Love RC. Addressing barriers to clozapine underutilization: a national effort. Psychiatr Serv. 2018;69(2):224-227.
10. US Department of Veterans Affairs. Clozapine patient management protocol (CPMP). https://www.va.gov/vhapublications/ViewPublication.asp?pub_ID=1818. Published December 23, 2008. Accessed September 12, 2019.
11. Gören JL, Rose AJ, Engle RL, et al. Organizational characteristics of Veterans Affairs clinics with high and low utilization of clozapine. Psychiatr Serv. 2016;67(11):1189-1196.