User login
Annual mammography starting at age 40: More talk, less action?
National societies agree on the value of mammographic screening at age 50 through 69 (though the frequency is still debated), but there is no consensus about whether to screen at age 40 through 49, or age 70 and older. The US Preventive Services Task Force (USPSTF) recommends against routinely screening women age 40 through 49, while the American Academy of Family Physicians and the American College of Physicians recommend screening every 1 to 2 years for women in this age group. The American Cancer Society, the American Medical Association, the National Cancer Institute, the American College of Radiology, and the American Congress of Obstetricians and Gynecologists recommend yearly mammography starting at age 40.1
Besides female sex, the major risk factor for breast cancer is increasing age. Thus, women in their 40s are at significantly lower risk of breast cancer than those in their 50s. As emerging evidence focuses on the potential harms and benefits from screening, we must question the practice of annual screening starting at age 40.
DOES MAMMOGRAPHIC SCREENING SAVE LIVES?
The main goal of screening for any type of cancer is to reduce the death rate. A 2014 meta-analysis of randomized controlled trials found a 15% to 20% relative decrease in the breast cancer mortality rate with screening mammography, approximately 15% for women in their 40s and 32% for women in their 60s.2 Since the prevalence of breast cancer is lower in younger women, many more women in their 40s must be screened to prevent one breast cancer death. For women age 60 to 69, 377 must be screened to prevent one breast cancer death, whereas for women age 39 to 49 the number is 1,904.3
Whether screening for breast cancer reduces the death rate has been questioned following the 2014 publication of 25-year follow-up data from the Canadian National Breast Screening Study.4 This randomized controlled trial of screening mammography and clinical breast examination, launched in 1980, involved 89,835 women and 5 years of screening. Women age 40 to 49 were randomly assigned to undergo either five annual mammographic screenings and annual clinical breast examinations or no mammography and a single clinical breast examination, followed by usual care in the community. Those age 50 to 59 received annual clinical breast examinations and were randomized to either mammography or no mammography.
During 25 years of follow-up, 3,250 women in the mammography group and 3,133 in the control group were diagnosed with breast cancer, and 500 and 505, respectively, died of breast cancer. No difference in mortality rate was found between the mammography and control groups (hazard ratio 0.99, 95% confidence interval 0.88–1.12), and the findings in both age cohorts were similar.4
Criticisms of this study include that it was performed using outdated imaging technology, and that a significant proportion of the control group also received mammography, although it is also possible that the mortality benefit from mammographic screening alone may not be as high as once predicted.
Reduction in breast cancer mortality is likely from a combination of screening mammography and better treatment. The number of women presenting with late-stage cancers has decreased in the past 3 decades, but only slightly; and most of the decrease has been in regional, node-positive disease, a stage that can now often be treated successfully (the expected 5-year survival rate is 85% in women age 40 or older).5 For women with estrogen receptor-positive tumors, the combination of hormonal therapy and adjuvant chemotherapy has reduced the death rate by half.6
It has been 50 years since a large randomized controlled trial of mammographic screening has been done in the United States. Thus, further study is needed to understand whether screening is less valuable now that better treatments are available.
DOES MAMMOGRAPHIC SCREENING REDUCE LATE-STAGE CANCERS?
To be effective, screening must detect disease at an earlier, more curable stage. Although screening mammography has substantially increased the number of early-stage breast cancers detected, it has only marginally decreased the rate of diagnosis of late-stage cancers.5
The National Cancer Institute’s Surveillance, Epidemiology, and End Results (SEER) data5 show that between 1976 and 2008 screening mammography was associated with a doubling in early-stage breast cancer cases detected (from 112 to 234 cases per 100,000 women per year, an absolute increase of 122 cases per 100,000 per year). In contrast, late-stage cancer diagnoses decreased by 8% (from 102 to 94 cases per 100,000 women per year, or an absolute decrease of 8 per 100,000 women per year). Assuming a constant underlying disease burden, only 8 of the 122 early-stage cancers diagnosed would be expected to progress to advanced disease, suggesting that the rest would have never harmed these women—ie, they were overdiagnosed. The authors estimated that in 2008, breast cancer was overdiagnosed in more than 70,000 women, accounting for 31% of all diagnosed breast cancers.5
HARMS OF OVERDIAGNOSIS
Based on SEER data, Bleyer and Welch5 estimated that more than 1 million US women may have been overdiagnosed with breast cancer in the past 3 decades. Many women in this situation subsequently undergo surgery, radiation therapy, hormonal therapy, chemotherapy, or a combination of these for a cancer that may never become clinically significant. Until we can differentiate deadly from indolent cancers, highly sensitive screening tests will increase the risk of overtreatment.
Breast cancer has increased in incidence since the 1990s, mostly from the detection of more early-stage cancer or ductal carcinoma in situ (DCIS). Rare before widespread screening, DCIS now accounts for 20% to 30% of all breast cancer diagnoses.6,7 However, DCIS is not always a precursor to invasive cancer: untreated, it progresses to invasive disease in half of cases or fewer. Because DCIS is usually diagnosed only with mammography, its incidence has been steadily on the rise since screening became widespread.1
Welch and Passow6 reviewed the available evidence and attempted to provide a range of estimates for three outcomes important to the mammography decision: breast cancer deaths avoided, false alarms, and overdiagnosis. For every 1,000 US women screened yearly for a decade starting at age 50, an estimated 0.3 to 3.2 avoided breast cancer death, 490 to 670 had at least one false alarm, and 3 to 14 were overdiagnosed and treated needlessly.
Esserman et al7 calculated that in women age 50 to 70, prevention of one breast cancer death would require that 838 women be screened for 6 years, leading to 5,866 screening visits, 535 recalls, 90 biopsies, and 24 cancers treated (18 invasive, 6 DCIS).
SCREENING EVERY YEAR VS EVERY 2 YEARS
Also controversial is whether screening mammography should be done annually or every 2 years. For women in their 50s, the American Cancer Society recommends mammography every year, the American College of Physicians and American Academy of Family Physicians recommend it every 1 to 2 years, and the USPSTF recommends it every 2 years.
A prospective analysis of 11,474 women with breast cancer and 922,624 controls8 found that performing mammography every 2 years instead of annually for women age 50 to 74 did not increase the risk of advanced-stage or large-size tumors regardless of breast density or hormone therapy use. But women undergoing annual mammography had a higher risk of false-positive results and biopsy recommendations.8 Women age 40 to 49 with extremely dense breasts were the only subgroup who derived additional benefit from annual screening, as they had a higher risk of advanced-stage cancer if they were screened every 2 years instead of yearly (odds ratio [OR] 1.89; 95% CI 1.06–3.39) and a higher risk of larger tumors (OR 2.39; 95% CI 1.37–4.18). However, the probability of a false-positive result in these younger women undergoing annual mammography was also very high at 65.5%.8
For most women in their 40s (other than those with extremely dense breasts) and 50s, biennial and annual mammography were associated with a similar risk of advanced-stage disease. Women with fatty breasts are at low risk of breast cancer regardless of other risk factors and did not appear to benefit from annual screening.8 The 12% to 15% of women in their 40s with extremely dense breasts (whose risk of breast cancer is similar to that in average-risk women in their 50s) should decide if the added benefit of annual screening is outweighed by the additional harms, including doubling the number of mammograms, as well as more false-positive results and breast biopsy recommendations.8
Mandelblatt et al9 statistically evaluated 20 screening strategies, ie, screening every year or every 2 years, and starting and stopping at various ages. On average, screening every 2 years was 81% as beneficial as annual screening but caused only about half as many false-positive results. Women age 50 through 69 who were screened every 2 years achieved a median 16.5% (range 15%–23%) reduction in breast cancer deaths compared with no screening. Initiating screening every 2 years at age 40 reduced the death rate by an additional 3% (range 1%–6%) compared with starting at age 50. Not surprisingly, starting screening at age 40 consumed more resources and yielded more false-positive results. After age 69, screening every 2 years yielded some additional mortality reduction in all models, but overdiagnosis increased most substantially at older ages, as the ratio of slow- to fast-growing tumors increases with age. The authors concluded that screening every 2 years achieves most of the benefit of annual screening with less harm.
FALSE-POSITIVE RESULTS AND ANXIETY
False-positive results on mammography can increase distress and anxiety about breast cancer and perceived breast cancer risk in some women.3 After 10 years of annual screening, more than half of women receive at least one false-positive recall, and 7% to 9% receive a false-positive biopsy recommendation. It is helpful for women to understand this risk when deciding whether to start mammographic screening.10
OUR VIEWS
There are two major issues to address in clinical practice regarding mammographic screening: at what age to start, and how often to screen. For years, women have been instructed to start annual mammographic screening at age 40, and such established patterns can be difficult to change.
When deciding whether to have a mammogram at age 40, women should be aware of the full range of risks and benefits. Assessing a woman’s individual risk of breast cancer (based on family history and number and age of pregnancies) can be an important starting point for assessing the potential benefits and risks of screening.
Although a shared decision-making approach is intuitively appealing, it takes much more time than simply ordering a mammogram. Time constraints during a medical appointment may make it challenging to have a prolonged discussion about the pros and cons of screening. Patient education materials about the risks vs benefits of screening initiation may be useful, and because the decision does not usually need to be made urgently, women can be given the opportunity to consider the decision outside of the primary care appointment.
The issue of annual vs biennial screening presents an additional challenge, because women have come to expect annual screening. Studies show that the only subgroup of women who appear to benefit from annual screening are those in their 40s with dense breasts. Although breast cancer is rarer in younger women, when it does develop, it is often more aggressive, so offering annual screening to this subpopulation may make sense. For all other women, since there is no evidence that annual mammography offers clinical benefit over biennial screening, clinicians can be comfortable with offering screening every 2 years.
Future research must focus on developing better tools for differentiating women who are at higher vs lower risk for breast cancer and on developing methods to determine which DCIS cancers are more likely to be indolent and therefore amenable to watchful waiting.
In the interim, we must continue to identify women at high risk who will benefit from magnetic resonance imaging, genetic testing, and prophylactic medications, in accordance with USPSTF recommendations. Women with new breast symptoms or concerns should continue to undergo evaluation with diagnostic imaging, including mammography. However, for most women who are at average risk and have no symptoms, we must ensure that they are fully aware of the possible benefits and risks of screening mammography so that they can make an informed decision about when to start screening and how often to be screened.
- US Preventive Services Task Force. Screening for breast cancer: US Preventive Services Task Force recommendation statement. Ann Intern Med 2009; 151:716–726.
- Pace LE, Keating NL. A systematic assessment of benefits and risks to guide breast cancer screening decisions. JAMA 2014; 311:1327–1335.
- Nelson HD, Tyne K, Naik A, Bougatsos C, Chan BK, Humphrey L; US Preventive Services Task Force. Screening for breast cancer: an update for the US Preventive Services Task Force. Ann Intern Med 2009; 151:727–737.
- Miller AB, Wall C, Baines CJ, Sun P, To T, Narod SA. Twenty five year follow-up for breast cancer incidence and mortality of the Canadian National Breast Screening Study: randomised screening trial. BMJ 2014; 348:g366.
- Bleyer A, Welch HG. Effect of three decades of screening mammography on breast-cancer incidence. N Engl J Med 2012; 367:1998–2005.
- Welch HG, Passow HJ. Quantifying the benefits and harms of screening mammography. JAMA Intern Med 2014; 174:448–454.
- Esserman L, Shieh Y, Thompson I. Rethinking screening for breast cancer and prostate cancer. JAMA 2009; 302:1685–1692.
- Kerlikowske K, Zhu W, Hubbard RA, et al; Breast Cancer Surveillance Consortium. Outcomes of screening mammography by frequency, breast density, and postmenopausal hormone therapy. JAMA Intern Med 2013; 173:807–816.
- Mandelblatt JS, Cronin KA, Bailey S, et al; Breast Cancer Working Group of the Cancer Intervention and Surveillance Modeling Network. Effects of mammography screening under different screening schedules: model estimates of potential benefits and harms. Ann Intern Med 2009; 151:738–747.
- Hubbard RA, Kerlikowske K, Flowers CI, Yankaskas BC, Zhu W, Miglioretti DL. Cumulative probability of false-positive recall or biopsy recommendation after 10 years of screening mammography: a cohort study. Ann Intern Med 2011; 155:481–492.
National societies agree on the value of mammographic screening at age 50 through 69 (though the frequency is still debated), but there is no consensus about whether to screen at age 40 through 49, or age 70 and older. The US Preventive Services Task Force (USPSTF) recommends against routinely screening women age 40 through 49, while the American Academy of Family Physicians and the American College of Physicians recommend screening every 1 to 2 years for women in this age group. The American Cancer Society, the American Medical Association, the National Cancer Institute, the American College of Radiology, and the American Congress of Obstetricians and Gynecologists recommend yearly mammography starting at age 40.1
Besides female sex, the major risk factor for breast cancer is increasing age. Thus, women in their 40s are at significantly lower risk of breast cancer than those in their 50s. As emerging evidence focuses on the potential harms and benefits from screening, we must question the practice of annual screening starting at age 40.
DOES MAMMOGRAPHIC SCREENING SAVE LIVES?
The main goal of screening for any type of cancer is to reduce the death rate. A 2014 meta-analysis of randomized controlled trials found a 15% to 20% relative decrease in the breast cancer mortality rate with screening mammography, approximately 15% for women in their 40s and 32% for women in their 60s.2 Since the prevalence of breast cancer is lower in younger women, many more women in their 40s must be screened to prevent one breast cancer death. For women age 60 to 69, 377 must be screened to prevent one breast cancer death, whereas for women age 39 to 49 the number is 1,904.3
Whether screening for breast cancer reduces the death rate has been questioned following the 2014 publication of 25-year follow-up data from the Canadian National Breast Screening Study.4 This randomized controlled trial of screening mammography and clinical breast examination, launched in 1980, involved 89,835 women and 5 years of screening. Women age 40 to 49 were randomly assigned to undergo either five annual mammographic screenings and annual clinical breast examinations or no mammography and a single clinical breast examination, followed by usual care in the community. Those age 50 to 59 received annual clinical breast examinations and were randomized to either mammography or no mammography.
During 25 years of follow-up, 3,250 women in the mammography group and 3,133 in the control group were diagnosed with breast cancer, and 500 and 505, respectively, died of breast cancer. No difference in mortality rate was found between the mammography and control groups (hazard ratio 0.99, 95% confidence interval 0.88–1.12), and the findings in both age cohorts were similar.4
Criticisms of this study include that it was performed using outdated imaging technology, and that a significant proportion of the control group also received mammography, although it is also possible that the mortality benefit from mammographic screening alone may not be as high as once predicted.
Reduction in breast cancer mortality is likely from a combination of screening mammography and better treatment. The number of women presenting with late-stage cancers has decreased in the past 3 decades, but only slightly; and most of the decrease has been in regional, node-positive disease, a stage that can now often be treated successfully (the expected 5-year survival rate is 85% in women age 40 or older).5 For women with estrogen receptor-positive tumors, the combination of hormonal therapy and adjuvant chemotherapy has reduced the death rate by half.6
It has been 50 years since a large randomized controlled trial of mammographic screening has been done in the United States. Thus, further study is needed to understand whether screening is less valuable now that better treatments are available.
DOES MAMMOGRAPHIC SCREENING REDUCE LATE-STAGE CANCERS?
To be effective, screening must detect disease at an earlier, more curable stage. Although screening mammography has substantially increased the number of early-stage breast cancers detected, it has only marginally decreased the rate of diagnosis of late-stage cancers.5
The National Cancer Institute’s Surveillance, Epidemiology, and End Results (SEER) data5 show that between 1976 and 2008 screening mammography was associated with a doubling in early-stage breast cancer cases detected (from 112 to 234 cases per 100,000 women per year, an absolute increase of 122 cases per 100,000 per year). In contrast, late-stage cancer diagnoses decreased by 8% (from 102 to 94 cases per 100,000 women per year, or an absolute decrease of 8 per 100,000 women per year). Assuming a constant underlying disease burden, only 8 of the 122 early-stage cancers diagnosed would be expected to progress to advanced disease, suggesting that the rest would have never harmed these women—ie, they were overdiagnosed. The authors estimated that in 2008, breast cancer was overdiagnosed in more than 70,000 women, accounting for 31% of all diagnosed breast cancers.5
HARMS OF OVERDIAGNOSIS
Based on SEER data, Bleyer and Welch5 estimated that more than 1 million US women may have been overdiagnosed with breast cancer in the past 3 decades. Many women in this situation subsequently undergo surgery, radiation therapy, hormonal therapy, chemotherapy, or a combination of these for a cancer that may never become clinically significant. Until we can differentiate deadly from indolent cancers, highly sensitive screening tests will increase the risk of overtreatment.
Breast cancer has increased in incidence since the 1990s, mostly from the detection of more early-stage cancer or ductal carcinoma in situ (DCIS). Rare before widespread screening, DCIS now accounts for 20% to 30% of all breast cancer diagnoses.6,7 However, DCIS is not always a precursor to invasive cancer: untreated, it progresses to invasive disease in half of cases or fewer. Because DCIS is usually diagnosed only with mammography, its incidence has been steadily on the rise since screening became widespread.1
Welch and Passow6 reviewed the available evidence and attempted to provide a range of estimates for three outcomes important to the mammography decision: breast cancer deaths avoided, false alarms, and overdiagnosis. For every 1,000 US women screened yearly for a decade starting at age 50, an estimated 0.3 to 3.2 avoided breast cancer death, 490 to 670 had at least one false alarm, and 3 to 14 were overdiagnosed and treated needlessly.
Esserman et al7 calculated that in women age 50 to 70, prevention of one breast cancer death would require that 838 women be screened for 6 years, leading to 5,866 screening visits, 535 recalls, 90 biopsies, and 24 cancers treated (18 invasive, 6 DCIS).
SCREENING EVERY YEAR VS EVERY 2 YEARS
Also controversial is whether screening mammography should be done annually or every 2 years. For women in their 50s, the American Cancer Society recommends mammography every year, the American College of Physicians and American Academy of Family Physicians recommend it every 1 to 2 years, and the USPSTF recommends it every 2 years.
A prospective analysis of 11,474 women with breast cancer and 922,624 controls8 found that performing mammography every 2 years instead of annually for women age 50 to 74 did not increase the risk of advanced-stage or large-size tumors regardless of breast density or hormone therapy use. But women undergoing annual mammography had a higher risk of false-positive results and biopsy recommendations.8 Women age 40 to 49 with extremely dense breasts were the only subgroup who derived additional benefit from annual screening, as they had a higher risk of advanced-stage cancer if they were screened every 2 years instead of yearly (odds ratio [OR] 1.89; 95% CI 1.06–3.39) and a higher risk of larger tumors (OR 2.39; 95% CI 1.37–4.18). However, the probability of a false-positive result in these younger women undergoing annual mammography was also very high at 65.5%.8
For most women in their 40s (other than those with extremely dense breasts) and 50s, biennial and annual mammography were associated with a similar risk of advanced-stage disease. Women with fatty breasts are at low risk of breast cancer regardless of other risk factors and did not appear to benefit from annual screening.8 The 12% to 15% of women in their 40s with extremely dense breasts (whose risk of breast cancer is similar to that in average-risk women in their 50s) should decide if the added benefit of annual screening is outweighed by the additional harms, including doubling the number of mammograms, as well as more false-positive results and breast biopsy recommendations.8
Mandelblatt et al9 statistically evaluated 20 screening strategies, ie, screening every year or every 2 years, and starting and stopping at various ages. On average, screening every 2 years was 81% as beneficial as annual screening but caused only about half as many false-positive results. Women age 50 through 69 who were screened every 2 years achieved a median 16.5% (range 15%–23%) reduction in breast cancer deaths compared with no screening. Initiating screening every 2 years at age 40 reduced the death rate by an additional 3% (range 1%–6%) compared with starting at age 50. Not surprisingly, starting screening at age 40 consumed more resources and yielded more false-positive results. After age 69, screening every 2 years yielded some additional mortality reduction in all models, but overdiagnosis increased most substantially at older ages, as the ratio of slow- to fast-growing tumors increases with age. The authors concluded that screening every 2 years achieves most of the benefit of annual screening with less harm.
FALSE-POSITIVE RESULTS AND ANXIETY
False-positive results on mammography can increase distress and anxiety about breast cancer and perceived breast cancer risk in some women.3 After 10 years of annual screening, more than half of women receive at least one false-positive recall, and 7% to 9% receive a false-positive biopsy recommendation. It is helpful for women to understand this risk when deciding whether to start mammographic screening.10
OUR VIEWS
There are two major issues to address in clinical practice regarding mammographic screening: at what age to start, and how often to screen. For years, women have been instructed to start annual mammographic screening at age 40, and such established patterns can be difficult to change.
When deciding whether to have a mammogram at age 40, women should be aware of the full range of risks and benefits. Assessing a woman’s individual risk of breast cancer (based on family history and number and age of pregnancies) can be an important starting point for assessing the potential benefits and risks of screening.
Although a shared decision-making approach is intuitively appealing, it takes much more time than simply ordering a mammogram. Time constraints during a medical appointment may make it challenging to have a prolonged discussion about the pros and cons of screening. Patient education materials about the risks vs benefits of screening initiation may be useful, and because the decision does not usually need to be made urgently, women can be given the opportunity to consider the decision outside of the primary care appointment.
The issue of annual vs biennial screening presents an additional challenge, because women have come to expect annual screening. Studies show that the only subgroup of women who appear to benefit from annual screening are those in their 40s with dense breasts. Although breast cancer is rarer in younger women, when it does develop, it is often more aggressive, so offering annual screening to this subpopulation may make sense. For all other women, since there is no evidence that annual mammography offers clinical benefit over biennial screening, clinicians can be comfortable with offering screening every 2 years.
Future research must focus on developing better tools for differentiating women who are at higher vs lower risk for breast cancer and on developing methods to determine which DCIS cancers are more likely to be indolent and therefore amenable to watchful waiting.
In the interim, we must continue to identify women at high risk who will benefit from magnetic resonance imaging, genetic testing, and prophylactic medications, in accordance with USPSTF recommendations. Women with new breast symptoms or concerns should continue to undergo evaluation with diagnostic imaging, including mammography. However, for most women who are at average risk and have no symptoms, we must ensure that they are fully aware of the possible benefits and risks of screening mammography so that they can make an informed decision about when to start screening and how often to be screened.
National societies agree on the value of mammographic screening at age 50 through 69 (though the frequency is still debated), but there is no consensus about whether to screen at age 40 through 49, or age 70 and older. The US Preventive Services Task Force (USPSTF) recommends against routinely screening women age 40 through 49, while the American Academy of Family Physicians and the American College of Physicians recommend screening every 1 to 2 years for women in this age group. The American Cancer Society, the American Medical Association, the National Cancer Institute, the American College of Radiology, and the American Congress of Obstetricians and Gynecologists recommend yearly mammography starting at age 40.1
Besides female sex, the major risk factor for breast cancer is increasing age. Thus, women in their 40s are at significantly lower risk of breast cancer than those in their 50s. As emerging evidence focuses on the potential harms and benefits from screening, we must question the practice of annual screening starting at age 40.
DOES MAMMOGRAPHIC SCREENING SAVE LIVES?
The main goal of screening for any type of cancer is to reduce the death rate. A 2014 meta-analysis of randomized controlled trials found a 15% to 20% relative decrease in the breast cancer mortality rate with screening mammography, approximately 15% for women in their 40s and 32% for women in their 60s.2 Since the prevalence of breast cancer is lower in younger women, many more women in their 40s must be screened to prevent one breast cancer death. For women age 60 to 69, 377 must be screened to prevent one breast cancer death, whereas for women age 39 to 49 the number is 1,904.3
Whether screening for breast cancer reduces the death rate has been questioned following the 2014 publication of 25-year follow-up data from the Canadian National Breast Screening Study.4 This randomized controlled trial of screening mammography and clinical breast examination, launched in 1980, involved 89,835 women and 5 years of screening. Women age 40 to 49 were randomly assigned to undergo either five annual mammographic screenings and annual clinical breast examinations or no mammography and a single clinical breast examination, followed by usual care in the community. Those age 50 to 59 received annual clinical breast examinations and were randomized to either mammography or no mammography.
During 25 years of follow-up, 3,250 women in the mammography group and 3,133 in the control group were diagnosed with breast cancer, and 500 and 505, respectively, died of breast cancer. No difference in mortality rate was found between the mammography and control groups (hazard ratio 0.99, 95% confidence interval 0.88–1.12), and the findings in both age cohorts were similar.4
Criticisms of this study include that it was performed using outdated imaging technology, and that a significant proportion of the control group also received mammography, although it is also possible that the mortality benefit from mammographic screening alone may not be as high as once predicted.
Reduction in breast cancer mortality is likely from a combination of screening mammography and better treatment. The number of women presenting with late-stage cancers has decreased in the past 3 decades, but only slightly; and most of the decrease has been in regional, node-positive disease, a stage that can now often be treated successfully (the expected 5-year survival rate is 85% in women age 40 or older).5 For women with estrogen receptor-positive tumors, the combination of hormonal therapy and adjuvant chemotherapy has reduced the death rate by half.6
It has been 50 years since a large randomized controlled trial of mammographic screening has been done in the United States. Thus, further study is needed to understand whether screening is less valuable now that better treatments are available.
DOES MAMMOGRAPHIC SCREENING REDUCE LATE-STAGE CANCERS?
To be effective, screening must detect disease at an earlier, more curable stage. Although screening mammography has substantially increased the number of early-stage breast cancers detected, it has only marginally decreased the rate of diagnosis of late-stage cancers.5
The National Cancer Institute’s Surveillance, Epidemiology, and End Results (SEER) data5 show that between 1976 and 2008 screening mammography was associated with a doubling in early-stage breast cancer cases detected (from 112 to 234 cases per 100,000 women per year, an absolute increase of 122 cases per 100,000 per year). In contrast, late-stage cancer diagnoses decreased by 8% (from 102 to 94 cases per 100,000 women per year, or an absolute decrease of 8 per 100,000 women per year). Assuming a constant underlying disease burden, only 8 of the 122 early-stage cancers diagnosed would be expected to progress to advanced disease, suggesting that the rest would have never harmed these women—ie, they were overdiagnosed. The authors estimated that in 2008, breast cancer was overdiagnosed in more than 70,000 women, accounting for 31% of all diagnosed breast cancers.5
HARMS OF OVERDIAGNOSIS
Based on SEER data, Bleyer and Welch5 estimated that more than 1 million US women may have been overdiagnosed with breast cancer in the past 3 decades. Many women in this situation subsequently undergo surgery, radiation therapy, hormonal therapy, chemotherapy, or a combination of these for a cancer that may never become clinically significant. Until we can differentiate deadly from indolent cancers, highly sensitive screening tests will increase the risk of overtreatment.
Breast cancer has increased in incidence since the 1990s, mostly from the detection of more early-stage cancer or ductal carcinoma in situ (DCIS). Rare before widespread screening, DCIS now accounts for 20% to 30% of all breast cancer diagnoses.6,7 However, DCIS is not always a precursor to invasive cancer: untreated, it progresses to invasive disease in half of cases or fewer. Because DCIS is usually diagnosed only with mammography, its incidence has been steadily on the rise since screening became widespread.1
Welch and Passow6 reviewed the available evidence and attempted to provide a range of estimates for three outcomes important to the mammography decision: breast cancer deaths avoided, false alarms, and overdiagnosis. For every 1,000 US women screened yearly for a decade starting at age 50, an estimated 0.3 to 3.2 avoided breast cancer death, 490 to 670 had at least one false alarm, and 3 to 14 were overdiagnosed and treated needlessly.
Esserman et al7 calculated that in women age 50 to 70, prevention of one breast cancer death would require that 838 women be screened for 6 years, leading to 5,866 screening visits, 535 recalls, 90 biopsies, and 24 cancers treated (18 invasive, 6 DCIS).
SCREENING EVERY YEAR VS EVERY 2 YEARS
Also controversial is whether screening mammography should be done annually or every 2 years. For women in their 50s, the American Cancer Society recommends mammography every year, the American College of Physicians and American Academy of Family Physicians recommend it every 1 to 2 years, and the USPSTF recommends it every 2 years.
A prospective analysis of 11,474 women with breast cancer and 922,624 controls8 found that performing mammography every 2 years instead of annually for women age 50 to 74 did not increase the risk of advanced-stage or large-size tumors regardless of breast density or hormone therapy use. But women undergoing annual mammography had a higher risk of false-positive results and biopsy recommendations.8 Women age 40 to 49 with extremely dense breasts were the only subgroup who derived additional benefit from annual screening, as they had a higher risk of advanced-stage cancer if they were screened every 2 years instead of yearly (odds ratio [OR] 1.89; 95% CI 1.06–3.39) and a higher risk of larger tumors (OR 2.39; 95% CI 1.37–4.18). However, the probability of a false-positive result in these younger women undergoing annual mammography was also very high at 65.5%.8
For most women in their 40s (other than those with extremely dense breasts) and 50s, biennial and annual mammography were associated with a similar risk of advanced-stage disease. Women with fatty breasts are at low risk of breast cancer regardless of other risk factors and did not appear to benefit from annual screening.8 The 12% to 15% of women in their 40s with extremely dense breasts (whose risk of breast cancer is similar to that in average-risk women in their 50s) should decide if the added benefit of annual screening is outweighed by the additional harms, including doubling the number of mammograms, as well as more false-positive results and breast biopsy recommendations.8
Mandelblatt et al9 statistically evaluated 20 screening strategies, ie, screening every year or every 2 years, and starting and stopping at various ages. On average, screening every 2 years was 81% as beneficial as annual screening but caused only about half as many false-positive results. Women age 50 through 69 who were screened every 2 years achieved a median 16.5% (range 15%–23%) reduction in breast cancer deaths compared with no screening. Initiating screening every 2 years at age 40 reduced the death rate by an additional 3% (range 1%–6%) compared with starting at age 50. Not surprisingly, starting screening at age 40 consumed more resources and yielded more false-positive results. After age 69, screening every 2 years yielded some additional mortality reduction in all models, but overdiagnosis increased most substantially at older ages, as the ratio of slow- to fast-growing tumors increases with age. The authors concluded that screening every 2 years achieves most of the benefit of annual screening with less harm.
FALSE-POSITIVE RESULTS AND ANXIETY
False-positive results on mammography can increase distress and anxiety about breast cancer and perceived breast cancer risk in some women.3 After 10 years of annual screening, more than half of women receive at least one false-positive recall, and 7% to 9% receive a false-positive biopsy recommendation. It is helpful for women to understand this risk when deciding whether to start mammographic screening.10
OUR VIEWS
There are two major issues to address in clinical practice regarding mammographic screening: at what age to start, and how often to screen. For years, women have been instructed to start annual mammographic screening at age 40, and such established patterns can be difficult to change.
When deciding whether to have a mammogram at age 40, women should be aware of the full range of risks and benefits. Assessing a woman’s individual risk of breast cancer (based on family history and number and age of pregnancies) can be an important starting point for assessing the potential benefits and risks of screening.
Although a shared decision-making approach is intuitively appealing, it takes much more time than simply ordering a mammogram. Time constraints during a medical appointment may make it challenging to have a prolonged discussion about the pros and cons of screening. Patient education materials about the risks vs benefits of screening initiation may be useful, and because the decision does not usually need to be made urgently, women can be given the opportunity to consider the decision outside of the primary care appointment.
The issue of annual vs biennial screening presents an additional challenge, because women have come to expect annual screening. Studies show that the only subgroup of women who appear to benefit from annual screening are those in their 40s with dense breasts. Although breast cancer is rarer in younger women, when it does develop, it is often more aggressive, so offering annual screening to this subpopulation may make sense. For all other women, since there is no evidence that annual mammography offers clinical benefit over biennial screening, clinicians can be comfortable with offering screening every 2 years.
Future research must focus on developing better tools for differentiating women who are at higher vs lower risk for breast cancer and on developing methods to determine which DCIS cancers are more likely to be indolent and therefore amenable to watchful waiting.
In the interim, we must continue to identify women at high risk who will benefit from magnetic resonance imaging, genetic testing, and prophylactic medications, in accordance with USPSTF recommendations. Women with new breast symptoms or concerns should continue to undergo evaluation with diagnostic imaging, including mammography. However, for most women who are at average risk and have no symptoms, we must ensure that they are fully aware of the possible benefits and risks of screening mammography so that they can make an informed decision about when to start screening and how often to be screened.
- US Preventive Services Task Force. Screening for breast cancer: US Preventive Services Task Force recommendation statement. Ann Intern Med 2009; 151:716–726.
- Pace LE, Keating NL. A systematic assessment of benefits and risks to guide breast cancer screening decisions. JAMA 2014; 311:1327–1335.
- Nelson HD, Tyne K, Naik A, Bougatsos C, Chan BK, Humphrey L; US Preventive Services Task Force. Screening for breast cancer: an update for the US Preventive Services Task Force. Ann Intern Med 2009; 151:727–737.
- Miller AB, Wall C, Baines CJ, Sun P, To T, Narod SA. Twenty five year follow-up for breast cancer incidence and mortality of the Canadian National Breast Screening Study: randomised screening trial. BMJ 2014; 348:g366.
- Bleyer A, Welch HG. Effect of three decades of screening mammography on breast-cancer incidence. N Engl J Med 2012; 367:1998–2005.
- Welch HG, Passow HJ. Quantifying the benefits and harms of screening mammography. JAMA Intern Med 2014; 174:448–454.
- Esserman L, Shieh Y, Thompson I. Rethinking screening for breast cancer and prostate cancer. JAMA 2009; 302:1685–1692.
- Kerlikowske K, Zhu W, Hubbard RA, et al; Breast Cancer Surveillance Consortium. Outcomes of screening mammography by frequency, breast density, and postmenopausal hormone therapy. JAMA Intern Med 2013; 173:807–816.
- Mandelblatt JS, Cronin KA, Bailey S, et al; Breast Cancer Working Group of the Cancer Intervention and Surveillance Modeling Network. Effects of mammography screening under different screening schedules: model estimates of potential benefits and harms. Ann Intern Med 2009; 151:738–747.
- Hubbard RA, Kerlikowske K, Flowers CI, Yankaskas BC, Zhu W, Miglioretti DL. Cumulative probability of false-positive recall or biopsy recommendation after 10 years of screening mammography: a cohort study. Ann Intern Med 2011; 155:481–492.
- US Preventive Services Task Force. Screening for breast cancer: US Preventive Services Task Force recommendation statement. Ann Intern Med 2009; 151:716–726.
- Pace LE, Keating NL. A systematic assessment of benefits and risks to guide breast cancer screening decisions. JAMA 2014; 311:1327–1335.
- Nelson HD, Tyne K, Naik A, Bougatsos C, Chan BK, Humphrey L; US Preventive Services Task Force. Screening for breast cancer: an update for the US Preventive Services Task Force. Ann Intern Med 2009; 151:727–737.
- Miller AB, Wall C, Baines CJ, Sun P, To T, Narod SA. Twenty five year follow-up for breast cancer incidence and mortality of the Canadian National Breast Screening Study: randomised screening trial. BMJ 2014; 348:g366.
- Bleyer A, Welch HG. Effect of three decades of screening mammography on breast-cancer incidence. N Engl J Med 2012; 367:1998–2005.
- Welch HG, Passow HJ. Quantifying the benefits and harms of screening mammography. JAMA Intern Med 2014; 174:448–454.
- Esserman L, Shieh Y, Thompson I. Rethinking screening for breast cancer and prostate cancer. JAMA 2009; 302:1685–1692.
- Kerlikowske K, Zhu W, Hubbard RA, et al; Breast Cancer Surveillance Consortium. Outcomes of screening mammography by frequency, breast density, and postmenopausal hormone therapy. JAMA Intern Med 2013; 173:807–816.
- Mandelblatt JS, Cronin KA, Bailey S, et al; Breast Cancer Working Group of the Cancer Intervention and Surveillance Modeling Network. Effects of mammography screening under different screening schedules: model estimates of potential benefits and harms. Ann Intern Med 2009; 151:738–747.
- Hubbard RA, Kerlikowske K, Flowers CI, Yankaskas BC, Zhu W, Miglioretti DL. Cumulative probability of false-positive recall or biopsy recommendation after 10 years of screening mammography: a cohort study. Ann Intern Med 2011; 155:481–492.
Screening mammography starting at age 40: Still relevant
Screening mammography is not a perfect test, but it still plays an important role for women even in their 40s, when the incidence of breast cancer is low but the risk of a tumor being aggressive is especially high.
SCREENING DETECTS CANCER EARLY
The goal of screening mammography is to reduce breast cancer deaths by detecting cancers early, when treatment is more effective and less harmful.
Mammography detects tumors when they are smaller: the median size of breast cancers found with high-quality, two-view screening mammography is 1.0 to 1.5 cm, whereas cancers found by palpation are 2.0 to 2.5 cm.1 In general, tumors found when they are smaller require less treatment, and patients are more likely to survive.
Moreover, about 10% of invasive cancers smaller than 1 cm have spread to lymph nodes at the time of detection, compared with 35% of those 2 cm in size and 60% of those 4 cm or larger. Women who have a positive lymph node at the time of diagnosis usually undergo more intensive treatment with chemotherapy and more radical surgery than those who do not. The 5-year disease-free survival rate is more than 98% for breast cancer with a tumor smaller than 2 cm that has not spread to lymph nodes (stage I), compared with 86% for stage II disease (tumors 2.1–5 cm or one to three positive axillary lymph nodes).2
Treating breast cancer early is also less expensive. In a study of women enrolled in a health maintenance organization in Pennsylvania, 14% of those not screened presented with advanced breast cancer (stage III or IV) compared with 2% who had been screened. The cumulative cost of treating advanced breast cancer was two to three times that of treating early breast cancer (stage 0 or I), not accounting for time lost away from work and family, in addition to pain and suffering.3
SCREENING SAVES LIVES
Multiple prospective, randomized controlled trials have been conducted to assess whether inviting women between ages 40 and 74 to undergo screening mammography reduces the rate of death from breast cancer.4,5 Such trials tend to underestimate the effect of screening because not all women invited to be screened actually are screened, and some in the control group may undergo screening on their own.6
The Canadian National Breast Screening Study (NBSS) had additional problems that underestimated the benefits of screening. The quality of mammography came under question, and an issue with randomization became evident after the first round of screening, as the group invited to be screened had an excess of women presenting with palpable lumps and advanced breast cancer.6–8 Despite these issues, a meta-analysis of randomized controlled trials of screening mammography, including the NBSS data, found a 15% reduction in deaths.9 When the NBSS data were excluded, the reduction was 24%.10
In 2009, the United States Preventive Services Task Force (USPSTF)11 recommended against mammographic screening for women ages 40 to 49. Using results from trials including the NBSS, they estimated that the number of women needed to be invited to screening to prevent one breast cancer death was:
- 1,904 for ages 39 to 49
- 1,339 for ages 50 to 59
- 377 for ages 60 to 69.
But if the NBSS study were excluded, these results would be 950, 670, and 377, respectively.6
In a review on screening mammography, Feig12 points out that the USPSTF selected the number of women invited to be screened rather than the number that were actually screened to measure the absolute benefit of screening.
Hendrick and Helvie13 reported that the number of women who needed to be screened to prevent one cancer death was:
- 746 for ages 40 to 49
- 351 for ages 50 to 59
- 253 for ages 60 to 69.
The benefit of screening, if analyzed by number of life years gained rather than number of deaths prevented, is even more favorable to younger women with longer life expectancy. The number needed to be screened per life year gained is:
- 28 at ages 40 to 49
- 17 at ages 50 to 59
- 16 at ages 60 to 69.12
These data provide additional support for screening women starting at age 40.
Observational studies, which provide a better measure of effectiveness because only women who actually undergo routine mammography are compared with those who do not, also support this conclusion. An observational study in Sweden with 20 years of follow-up found that women of all ages who participated in screening had a 44% lower risk of death from breast cancer than with those who were not screened; for women in their 40s, the risk reduction was 48%.14 Similarly, an observational study conducted in British Columbia15 found a 40% decrease in deaths in women screened annually between ages 40 and 79, and a 39% decrease in deaths in women first screened between ages 40 and 49.
LOW RATE OF FALSE-POSITIVE RESULTS
Like many screening programs, screening mammography does not benefit all women equally.
False-positive results occur, for which women need additional imaging or a biopsy for findings that turn out not to be cancer. But the false-positive rate is not high: for every 1,000 women screened in the United States, 80 to 100 (10% or less) are recalled for additional evaluation, 15 (1.5%) undergo biopsy, and 2 to 5 have a cancer, so only about 1% of the women screened underwent an unnecessary biopsy.16
False-positive test results can provoke unnecessary anxiety, but evidence indicates that this tends to be a temporary effect, and even women who had a false-positive result tend to support mammography. In a report by Lerman et al,17 when mood was assessed 3 months after mammography, worry was reported by 26% of women who had had a false-positive report, compared with 9% of women who had had a normal mammogram. Another report addressing the consequences of false-positive mammograms found that although short-term anxiety increased, long-term anxiety did not.18 In a random telephone survey, 98% of adults who reported having had a false-positive cancer screening result stated that they were nevertheless glad that they had undergone screening.19
OVERDIAGNOSIS OCCURS BUT IS LIKELY UNCOMMON
Overdiagnosis of breast cancer is a possible drawback of screening mammography. Cancers may be detected that would not have become clinically apparent in a person’s lifetime20 or have affected ultimate prognosis,18 and so would not have needed to be treated.
Overdiagnosis from screening mammography usually refers to finding ductal carcinoma in situ (DCIS) on breast biopsy. Because no randomized controlled study has been done in which breast cancer was diagnosed and not treated, evidence of the danger from DCIS comes from retrospective reviews of 130 cases in which excised tissue initially interpreted as benign was actually cancerous. Over 10 to 30 years, 11% to 60% of these patients developed invasive breast cancer in the same quadrant from which tissue had been excised.21 This rate of cancer development could lead to underestimation of the invasive potential of DCIS because the patients studied all had low-grade DCIS; further, some of the baseline biopsies involved complete removal of the tumor, thereby preventing the development or progression of cancer.
All DCIS is not the same. An ongoing trial22 found a 5-year recurrence rate of 6.1% after surgery for low-grade or intermediate-grade DCIS, and 15% after surgery for high-grade DCIS. Swedish trials23 have shown that most women who die of “early” breast cancer have high-grade DCIS. These findings suggest that although screening mammography may result in overdiagnosis and overtreatment of low-grade DCIS, high-grade DCIS can be lethal and should be treated. Thus, overdiagnosis likely represents a small fraction of all breast cancers.
Most important, it is not yet possible to accurately predict the biologic behavior of an individual tumor. Current clinical practice is to treat patients with DCIS similar to the way we treat patients with early-stage breast cancer, as we cannot determine which types of DCIS may remain indolent and which ones may become invasive.
HOW FREQUENTLY SHOULD YOUNGER WOMEN BE SCREENED?
The frequency of screening mammography has been another area of controversy, but we believe that annual screening offers the greatest benefit, especially for younger women.
The optimum screening frequency depends on how fast breast cancer grows and spreads. Data suggest that tumors in younger women tend to be biologically aggressive and grow and spread more quickly, making the benefit of yearly mammography more dramatic for younger women. A model based on data from Swedish studies24–26 predicted that the mortality reduction from breast cancer in women ages 40 to 49 would be 36% with annual screening, 18% with screening every 2 years, and 4% with screening every 3 years. For women in their 50s, the model estimated a reduction of 46% for yearly mammography, and 39% and 34% for screening every 2 or 3 years, respectively.6
In a prospective cohort study of the Breast Cancer Surveillance Consortium,27 in women ages 40 to 49 with extremely dense breasts, screening every 2 years was associated with a higher risk of advanced-stage disease (IIb or higher) and large tumors (> 2 cm) than with annual screening. For women ages 50 to 74, screening every 2 years vs every year did not increase the odds of advanced-stage or larger tumors.
AN INFORMED DECISION
In agreement with the current recommendations from the American Cancer Society, the American College of Radiology, and the American Congress of Obstetricians and Gynecologists, we support starting breast cancer screening with mammography at age 40.
Not all cancers are visible on mammography (false negatives), as they may be masked by mammographically dense breast tissue. Women should be informed of the importance of seeking medical attention for breast symptoms, even if mammography is normal. We need to inform women of the benefits and risks of screening mammography, including the risk of false-positive results that could lead to additional imaging and anxiety, and the uncertainties related to the potential for overdiagnosis and overtreatment. This information, offered in an easily understandable format, can help the patient make an informed decision regarding screening mammography, based on her values and preferences.
- Güth U, Huang DJ, Huber M, et al. Tumor size and detection in breast cancer: self-examination and clinical breast examination are at their limit. Cancer Detect Prev 2008; 32:224–228.
- Ries LAG, Young JL, Keel GE, Eisner MP, Lin YD, Horner M-J, editors. SEER Survival Monograph: Cancer Survival Among Adults: US SEER Program, 1988–2001, Patient and Tumor Characteristics. National Cancer Institute, SEER Program, NIH Pub. No. 07-6215, Bethesda, MD; 2007:101–110. http://seer.cancer.gov/archive/publications/survival/seer_survival_mono_lowres.pdf. Accessed April 9, 2015.
- Legorreta AP, Brooks RJ, Leibowitz AN, Solin LJ. Cost of breast cancer treatment. A 4-year longitudinal study. Arch Intern Med 1996; 156:2197–2201.
- Moss SM, Cuckle H, Evans A, Johns L, Waller M, Bobrow L; Trial Management Group. Effect of mammographic screening from age 40 years on breast cancer mortality at 10 years’ follow-up: a randomised controlled trial. Lancet 2006; 368:2053–2060.
- Humphrey LL, Helfand M, Chan BK, Woolf SH. Breast cancer screening: a summary of the evidence for the US Preventive Services Task Force. Ann Intern Med 2002; 137:347–360.
- Feig SA. Screening mammography benefit controversies: sorting the evidence. Radiol Clin North Am 2014; 52:455–480.
- Miller AB, Baines CJ, To T, Wall C. Canadian National Breast Screening Study: 2. Breast cancer detection and death rates among women aged 50 to 59 years. CMAJ 1992; 147:1477–1488.
- Miller AB, To T, Baines CJ, Wall C. Canadian National Breast Screening Study-2: 13-year results of a randomized trial in women aged 50–59 years. J Natl Cancer Inst 2000; 92:1490–1499.
- Smart CR, Hendrick RE, Rutledge JH 3rd, Smith RA. Benefit of mammography screening in women ages 40 to 49 years. Current evidence from randomized controlled trials. Cancer 1995; 75:1619–1626.
- Breast-cancer screening with mammography in women aged 40-49 years. Swedish Cancer Society and the Swedish National Board of Health and Welfare. Int J Cancer 1996; 68:693–699.
- US Preventive Services Task Force. Screening for breast cancer: U.S. Preventive Services Task Force recommendation statement. Ann Intern Med 2009; 151:716–726.
- Feig SA. Number needed to screen. Appropriate use of this new basis for screening mammography guidelines. AJR Am J Roentgenol 2012; 198:1214–1217.
- Hendrick RE, Helvie MA. Mammography screening: a new estimate of number needed to screen to prevent one breast cancer death. AJR Am J Roentgenol 2012; 198:723–728.
- Tabar L, Yen MF, Vitak B, Chen HH, Smith RA, Duffy SW. Mammography service screening and mortality in breast cancer patients: 20-year follow-up before and after introduction of screening. Lancet 2003; 361:1405–1410.
- Coldman A, Phillips N, Warren L, Kan L. Breast cancer mortality after screening mammography in British Columbia women. Int J Cancer 2007; 120:1076–1080.
- Rosenberg RD, Yankaskas BC, Abraham LA, et al. Performance benchmarks for screening mammography. Radiology 2006; 241:55–66.
- Lerman C, Trock B, Rimer BK, Boyce A, Jepson C, Engstrom PF. Psychological and behavioral implications of abnormal mammograms. Ann Intern Med 1991; 114:657–661.
- Tosteson AN, Fryback DG, Hammond CS, et al. Consequences of false-positive screening mammograms. JAMA Intern Med 2014; 174:954–961.
- Schwartz LM, Woloshin S, Fowler FJ Jr, Welch HG. Enthusiasm for cancer screening in the United States. JAMA 2004; 291:71–78.
- Marmot MG, Altman DG, Cameron DA, Dewar JA, Thompson SG, Wilcox M. The benefits and harms of breast cancer screening: an independent review. Br J Cancer 2013; 108:2205–2240.
- Feig SA. Ductal carcinoma in situ. Implications for screening mammography. Radiol Clin North Am 2000; 38:653–668,
- Hughes LL, Wang M, Page DL, et al. Local excision alone without irradiation for ductal carcinoma in situ of the breast: a trial of the Eastern Cooperative Oncology Group. J Clin Oncol 2009; 27:5319–5324.
- Tabár L, Vitak B, Chen HH, et al. The Swedish two-county trial twenty years later. Updated mortality results and new insights from long-term follow-up. Radiol Clin North Am 2000; 38:625–651.
- Duffy SW, Chen HH, Tabar L, et al. Estimation of mean sojourn time in breast cancer screening using a Markov chair model of entry to and exit from the preclinical detectable phase. Stat Med 1995; 14:1521-1534.
- Chen HH, Duffy SW, Tabar L, et al. Markov chain models for progression of breast cancer. Part I: tumor attributes and the preclinical screening detectable phase. J Epidemiol Biostat 1997; 2:9–25.
- Chen HH, Duffy SW, Tabar L, et al. Markov chain models for progression of breast cancer. Part II: prediction of outcomes for different screening regimes. J Epidemiol Biostat 1997; 2:25–35.
- Kerlikowske K, Zhu W, Hubbard RA, et al; Breast Cancer Surveillance Consortium. Outcomes of screening mammography by frequency, breast density, and postmenopausal hormone therapy. JAMA Intern Med 2013; 173:807–816.
Screening mammography is not a perfect test, but it still plays an important role for women even in their 40s, when the incidence of breast cancer is low but the risk of a tumor being aggressive is especially high.
SCREENING DETECTS CANCER EARLY
The goal of screening mammography is to reduce breast cancer deaths by detecting cancers early, when treatment is more effective and less harmful.
Mammography detects tumors when they are smaller: the median size of breast cancers found with high-quality, two-view screening mammography is 1.0 to 1.5 cm, whereas cancers found by palpation are 2.0 to 2.5 cm.1 In general, tumors found when they are smaller require less treatment, and patients are more likely to survive.
Moreover, about 10% of invasive cancers smaller than 1 cm have spread to lymph nodes at the time of detection, compared with 35% of those 2 cm in size and 60% of those 4 cm or larger. Women who have a positive lymph node at the time of diagnosis usually undergo more intensive treatment with chemotherapy and more radical surgery than those who do not. The 5-year disease-free survival rate is more than 98% for breast cancer with a tumor smaller than 2 cm that has not spread to lymph nodes (stage I), compared with 86% for stage II disease (tumors 2.1–5 cm or one to three positive axillary lymph nodes).2
Treating breast cancer early is also less expensive. In a study of women enrolled in a health maintenance organization in Pennsylvania, 14% of those not screened presented with advanced breast cancer (stage III or IV) compared with 2% who had been screened. The cumulative cost of treating advanced breast cancer was two to three times that of treating early breast cancer (stage 0 or I), not accounting for time lost away from work and family, in addition to pain and suffering.3
SCREENING SAVES LIVES
Multiple prospective, randomized controlled trials have been conducted to assess whether inviting women between ages 40 and 74 to undergo screening mammography reduces the rate of death from breast cancer.4,5 Such trials tend to underestimate the effect of screening because not all women invited to be screened actually are screened, and some in the control group may undergo screening on their own.6
The Canadian National Breast Screening Study (NBSS) had additional problems that underestimated the benefits of screening. The quality of mammography came under question, and an issue with randomization became evident after the first round of screening, as the group invited to be screened had an excess of women presenting with palpable lumps and advanced breast cancer.6–8 Despite these issues, a meta-analysis of randomized controlled trials of screening mammography, including the NBSS data, found a 15% reduction in deaths.9 When the NBSS data were excluded, the reduction was 24%.10
In 2009, the United States Preventive Services Task Force (USPSTF)11 recommended against mammographic screening for women ages 40 to 49. Using results from trials including the NBSS, they estimated that the number of women needed to be invited to screening to prevent one breast cancer death was:
- 1,904 for ages 39 to 49
- 1,339 for ages 50 to 59
- 377 for ages 60 to 69.
But if the NBSS study were excluded, these results would be 950, 670, and 377, respectively.6
In a review on screening mammography, Feig12 points out that the USPSTF selected the number of women invited to be screened rather than the number that were actually screened to measure the absolute benefit of screening.
Hendrick and Helvie13 reported that the number of women who needed to be screened to prevent one cancer death was:
- 746 for ages 40 to 49
- 351 for ages 50 to 59
- 253 for ages 60 to 69.
The benefit of screening, if analyzed by number of life years gained rather than number of deaths prevented, is even more favorable to younger women with longer life expectancy. The number needed to be screened per life year gained is:
- 28 at ages 40 to 49
- 17 at ages 50 to 59
- 16 at ages 60 to 69.12
These data provide additional support for screening women starting at age 40.
Observational studies, which provide a better measure of effectiveness because only women who actually undergo routine mammography are compared with those who do not, also support this conclusion. An observational study in Sweden with 20 years of follow-up found that women of all ages who participated in screening had a 44% lower risk of death from breast cancer than with those who were not screened; for women in their 40s, the risk reduction was 48%.14 Similarly, an observational study conducted in British Columbia15 found a 40% decrease in deaths in women screened annually between ages 40 and 79, and a 39% decrease in deaths in women first screened between ages 40 and 49.
LOW RATE OF FALSE-POSITIVE RESULTS
Like many screening programs, screening mammography does not benefit all women equally.
False-positive results occur, for which women need additional imaging or a biopsy for findings that turn out not to be cancer. But the false-positive rate is not high: for every 1,000 women screened in the United States, 80 to 100 (10% or less) are recalled for additional evaluation, 15 (1.5%) undergo biopsy, and 2 to 5 have a cancer, so only about 1% of the women screened underwent an unnecessary biopsy.16
False-positive test results can provoke unnecessary anxiety, but evidence indicates that this tends to be a temporary effect, and even women who had a false-positive result tend to support mammography. In a report by Lerman et al,17 when mood was assessed 3 months after mammography, worry was reported by 26% of women who had had a false-positive report, compared with 9% of women who had had a normal mammogram. Another report addressing the consequences of false-positive mammograms found that although short-term anxiety increased, long-term anxiety did not.18 In a random telephone survey, 98% of adults who reported having had a false-positive cancer screening result stated that they were nevertheless glad that they had undergone screening.19
OVERDIAGNOSIS OCCURS BUT IS LIKELY UNCOMMON
Overdiagnosis of breast cancer is a possible drawback of screening mammography. Cancers may be detected that would not have become clinically apparent in a person’s lifetime20 or have affected ultimate prognosis,18 and so would not have needed to be treated.
Overdiagnosis from screening mammography usually refers to finding ductal carcinoma in situ (DCIS) on breast biopsy. Because no randomized controlled study has been done in which breast cancer was diagnosed and not treated, evidence of the danger from DCIS comes from retrospective reviews of 130 cases in which excised tissue initially interpreted as benign was actually cancerous. Over 10 to 30 years, 11% to 60% of these patients developed invasive breast cancer in the same quadrant from which tissue had been excised.21 This rate of cancer development could lead to underestimation of the invasive potential of DCIS because the patients studied all had low-grade DCIS; further, some of the baseline biopsies involved complete removal of the tumor, thereby preventing the development or progression of cancer.
All DCIS is not the same. An ongoing trial22 found a 5-year recurrence rate of 6.1% after surgery for low-grade or intermediate-grade DCIS, and 15% after surgery for high-grade DCIS. Swedish trials23 have shown that most women who die of “early” breast cancer have high-grade DCIS. These findings suggest that although screening mammography may result in overdiagnosis and overtreatment of low-grade DCIS, high-grade DCIS can be lethal and should be treated. Thus, overdiagnosis likely represents a small fraction of all breast cancers.
Most important, it is not yet possible to accurately predict the biologic behavior of an individual tumor. Current clinical practice is to treat patients with DCIS similar to the way we treat patients with early-stage breast cancer, as we cannot determine which types of DCIS may remain indolent and which ones may become invasive.
HOW FREQUENTLY SHOULD YOUNGER WOMEN BE SCREENED?
The frequency of screening mammography has been another area of controversy, but we believe that annual screening offers the greatest benefit, especially for younger women.
The optimum screening frequency depends on how fast breast cancer grows and spreads. Data suggest that tumors in younger women tend to be biologically aggressive and grow and spread more quickly, making the benefit of yearly mammography more dramatic for younger women. A model based on data from Swedish studies24–26 predicted that the mortality reduction from breast cancer in women ages 40 to 49 would be 36% with annual screening, 18% with screening every 2 years, and 4% with screening every 3 years. For women in their 50s, the model estimated a reduction of 46% for yearly mammography, and 39% and 34% for screening every 2 or 3 years, respectively.6
In a prospective cohort study of the Breast Cancer Surveillance Consortium,27 in women ages 40 to 49 with extremely dense breasts, screening every 2 years was associated with a higher risk of advanced-stage disease (IIb or higher) and large tumors (> 2 cm) than with annual screening. For women ages 50 to 74, screening every 2 years vs every year did not increase the odds of advanced-stage or larger tumors.
AN INFORMED DECISION
In agreement with the current recommendations from the American Cancer Society, the American College of Radiology, and the American Congress of Obstetricians and Gynecologists, we support starting breast cancer screening with mammography at age 40.
Not all cancers are visible on mammography (false negatives), as they may be masked by mammographically dense breast tissue. Women should be informed of the importance of seeking medical attention for breast symptoms, even if mammography is normal. We need to inform women of the benefits and risks of screening mammography, including the risk of false-positive results that could lead to additional imaging and anxiety, and the uncertainties related to the potential for overdiagnosis and overtreatment. This information, offered in an easily understandable format, can help the patient make an informed decision regarding screening mammography, based on her values and preferences.
Screening mammography is not a perfect test, but it still plays an important role for women even in their 40s, when the incidence of breast cancer is low but the risk of a tumor being aggressive is especially high.
SCREENING DETECTS CANCER EARLY
The goal of screening mammography is to reduce breast cancer deaths by detecting cancers early, when treatment is more effective and less harmful.
Mammography detects tumors when they are smaller: the median size of breast cancers found with high-quality, two-view screening mammography is 1.0 to 1.5 cm, whereas cancers found by palpation are 2.0 to 2.5 cm.1 In general, tumors found when they are smaller require less treatment, and patients are more likely to survive.
Moreover, about 10% of invasive cancers smaller than 1 cm have spread to lymph nodes at the time of detection, compared with 35% of those 2 cm in size and 60% of those 4 cm or larger. Women who have a positive lymph node at the time of diagnosis usually undergo more intensive treatment with chemotherapy and more radical surgery than those who do not. The 5-year disease-free survival rate is more than 98% for breast cancer with a tumor smaller than 2 cm that has not spread to lymph nodes (stage I), compared with 86% for stage II disease (tumors 2.1–5 cm or one to three positive axillary lymph nodes).2
Treating breast cancer early is also less expensive. In a study of women enrolled in a health maintenance organization in Pennsylvania, 14% of those not screened presented with advanced breast cancer (stage III or IV) compared with 2% who had been screened. The cumulative cost of treating advanced breast cancer was two to three times that of treating early breast cancer (stage 0 or I), not accounting for time lost away from work and family, in addition to pain and suffering.3
SCREENING SAVES LIVES
Multiple prospective, randomized controlled trials have been conducted to assess whether inviting women between ages 40 and 74 to undergo screening mammography reduces the rate of death from breast cancer.4,5 Such trials tend to underestimate the effect of screening because not all women invited to be screened actually are screened, and some in the control group may undergo screening on their own.6
The Canadian National Breast Screening Study (NBSS) had additional problems that underestimated the benefits of screening. The quality of mammography came under question, and an issue with randomization became evident after the first round of screening, as the group invited to be screened had an excess of women presenting with palpable lumps and advanced breast cancer.6–8 Despite these issues, a meta-analysis of randomized controlled trials of screening mammography, including the NBSS data, found a 15% reduction in deaths.9 When the NBSS data were excluded, the reduction was 24%.10
In 2009, the United States Preventive Services Task Force (USPSTF)11 recommended against mammographic screening for women ages 40 to 49. Using results from trials including the NBSS, they estimated that the number of women needed to be invited to screening to prevent one breast cancer death was:
- 1,904 for ages 39 to 49
- 1,339 for ages 50 to 59
- 377 for ages 60 to 69.
But if the NBSS study were excluded, these results would be 950, 670, and 377, respectively.6
In a review on screening mammography, Feig12 points out that the USPSTF selected the number of women invited to be screened rather than the number that were actually screened to measure the absolute benefit of screening.
Hendrick and Helvie13 reported that the number of women who needed to be screened to prevent one cancer death was:
- 746 for ages 40 to 49
- 351 for ages 50 to 59
- 253 for ages 60 to 69.
The benefit of screening, if analyzed by number of life years gained rather than number of deaths prevented, is even more favorable to younger women with longer life expectancy. The number needed to be screened per life year gained is:
- 28 at ages 40 to 49
- 17 at ages 50 to 59
- 16 at ages 60 to 69.12
These data provide additional support for screening women starting at age 40.
Observational studies, which provide a better measure of effectiveness because only women who actually undergo routine mammography are compared with those who do not, also support this conclusion. An observational study in Sweden with 20 years of follow-up found that women of all ages who participated in screening had a 44% lower risk of death from breast cancer than with those who were not screened; for women in their 40s, the risk reduction was 48%.14 Similarly, an observational study conducted in British Columbia15 found a 40% decrease in deaths in women screened annually between ages 40 and 79, and a 39% decrease in deaths in women first screened between ages 40 and 49.
LOW RATE OF FALSE-POSITIVE RESULTS
Like many screening programs, screening mammography does not benefit all women equally.
False-positive results occur, for which women need additional imaging or a biopsy for findings that turn out not to be cancer. But the false-positive rate is not high: for every 1,000 women screened in the United States, 80 to 100 (10% or less) are recalled for additional evaluation, 15 (1.5%) undergo biopsy, and 2 to 5 have a cancer, so only about 1% of the women screened underwent an unnecessary biopsy.16
False-positive test results can provoke unnecessary anxiety, but evidence indicates that this tends to be a temporary effect, and even women who had a false-positive result tend to support mammography. In a report by Lerman et al,17 when mood was assessed 3 months after mammography, worry was reported by 26% of women who had had a false-positive report, compared with 9% of women who had had a normal mammogram. Another report addressing the consequences of false-positive mammograms found that although short-term anxiety increased, long-term anxiety did not.18 In a random telephone survey, 98% of adults who reported having had a false-positive cancer screening result stated that they were nevertheless glad that they had undergone screening.19
OVERDIAGNOSIS OCCURS BUT IS LIKELY UNCOMMON
Overdiagnosis of breast cancer is a possible drawback of screening mammography. Cancers may be detected that would not have become clinically apparent in a person’s lifetime20 or have affected ultimate prognosis,18 and so would not have needed to be treated.
Overdiagnosis from screening mammography usually refers to finding ductal carcinoma in situ (DCIS) on breast biopsy. Because no randomized controlled study has been done in which breast cancer was diagnosed and not treated, evidence of the danger from DCIS comes from retrospective reviews of 130 cases in which excised tissue initially interpreted as benign was actually cancerous. Over 10 to 30 years, 11% to 60% of these patients developed invasive breast cancer in the same quadrant from which tissue had been excised.21 This rate of cancer development could lead to underestimation of the invasive potential of DCIS because the patients studied all had low-grade DCIS; further, some of the baseline biopsies involved complete removal of the tumor, thereby preventing the development or progression of cancer.
All DCIS is not the same. An ongoing trial22 found a 5-year recurrence rate of 6.1% after surgery for low-grade or intermediate-grade DCIS, and 15% after surgery for high-grade DCIS. Swedish trials23 have shown that most women who die of “early” breast cancer have high-grade DCIS. These findings suggest that although screening mammography may result in overdiagnosis and overtreatment of low-grade DCIS, high-grade DCIS can be lethal and should be treated. Thus, overdiagnosis likely represents a small fraction of all breast cancers.
Most important, it is not yet possible to accurately predict the biologic behavior of an individual tumor. Current clinical practice is to treat patients with DCIS similar to the way we treat patients with early-stage breast cancer, as we cannot determine which types of DCIS may remain indolent and which ones may become invasive.
HOW FREQUENTLY SHOULD YOUNGER WOMEN BE SCREENED?
The frequency of screening mammography has been another area of controversy, but we believe that annual screening offers the greatest benefit, especially for younger women.
The optimum screening frequency depends on how fast breast cancer grows and spreads. Data suggest that tumors in younger women tend to be biologically aggressive and grow and spread more quickly, making the benefit of yearly mammography more dramatic for younger women. A model based on data from Swedish studies24–26 predicted that the mortality reduction from breast cancer in women ages 40 to 49 would be 36% with annual screening, 18% with screening every 2 years, and 4% with screening every 3 years. For women in their 50s, the model estimated a reduction of 46% for yearly mammography, and 39% and 34% for screening every 2 or 3 years, respectively.6
In a prospective cohort study of the Breast Cancer Surveillance Consortium,27 in women ages 40 to 49 with extremely dense breasts, screening every 2 years was associated with a higher risk of advanced-stage disease (IIb or higher) and large tumors (> 2 cm) than with annual screening. For women ages 50 to 74, screening every 2 years vs every year did not increase the odds of advanced-stage or larger tumors.
AN INFORMED DECISION
In agreement with the current recommendations from the American Cancer Society, the American College of Radiology, and the American Congress of Obstetricians and Gynecologists, we support starting breast cancer screening with mammography at age 40.
Not all cancers are visible on mammography (false negatives), as they may be masked by mammographically dense breast tissue. Women should be informed of the importance of seeking medical attention for breast symptoms, even if mammography is normal. We need to inform women of the benefits and risks of screening mammography, including the risk of false-positive results that could lead to additional imaging and anxiety, and the uncertainties related to the potential for overdiagnosis and overtreatment. This information, offered in an easily understandable format, can help the patient make an informed decision regarding screening mammography, based on her values and preferences.
- Güth U, Huang DJ, Huber M, et al. Tumor size and detection in breast cancer: self-examination and clinical breast examination are at their limit. Cancer Detect Prev 2008; 32:224–228.
- Ries LAG, Young JL, Keel GE, Eisner MP, Lin YD, Horner M-J, editors. SEER Survival Monograph: Cancer Survival Among Adults: US SEER Program, 1988–2001, Patient and Tumor Characteristics. National Cancer Institute, SEER Program, NIH Pub. No. 07-6215, Bethesda, MD; 2007:101–110. http://seer.cancer.gov/archive/publications/survival/seer_survival_mono_lowres.pdf. Accessed April 9, 2015.
- Legorreta AP, Brooks RJ, Leibowitz AN, Solin LJ. Cost of breast cancer treatment. A 4-year longitudinal study. Arch Intern Med 1996; 156:2197–2201.
- Moss SM, Cuckle H, Evans A, Johns L, Waller M, Bobrow L; Trial Management Group. Effect of mammographic screening from age 40 years on breast cancer mortality at 10 years’ follow-up: a randomised controlled trial. Lancet 2006; 368:2053–2060.
- Humphrey LL, Helfand M, Chan BK, Woolf SH. Breast cancer screening: a summary of the evidence for the US Preventive Services Task Force. Ann Intern Med 2002; 137:347–360.
- Feig SA. Screening mammography benefit controversies: sorting the evidence. Radiol Clin North Am 2014; 52:455–480.
- Miller AB, Baines CJ, To T, Wall C. Canadian National Breast Screening Study: 2. Breast cancer detection and death rates among women aged 50 to 59 years. CMAJ 1992; 147:1477–1488.
- Miller AB, To T, Baines CJ, Wall C. Canadian National Breast Screening Study-2: 13-year results of a randomized trial in women aged 50–59 years. J Natl Cancer Inst 2000; 92:1490–1499.
- Smart CR, Hendrick RE, Rutledge JH 3rd, Smith RA. Benefit of mammography screening in women ages 40 to 49 years. Current evidence from randomized controlled trials. Cancer 1995; 75:1619–1626.
- Breast-cancer screening with mammography in women aged 40-49 years. Swedish Cancer Society and the Swedish National Board of Health and Welfare. Int J Cancer 1996; 68:693–699.
- US Preventive Services Task Force. Screening for breast cancer: U.S. Preventive Services Task Force recommendation statement. Ann Intern Med 2009; 151:716–726.
- Feig SA. Number needed to screen. Appropriate use of this new basis for screening mammography guidelines. AJR Am J Roentgenol 2012; 198:1214–1217.
- Hendrick RE, Helvie MA. Mammography screening: a new estimate of number needed to screen to prevent one breast cancer death. AJR Am J Roentgenol 2012; 198:723–728.
- Tabar L, Yen MF, Vitak B, Chen HH, Smith RA, Duffy SW. Mammography service screening and mortality in breast cancer patients: 20-year follow-up before and after introduction of screening. Lancet 2003; 361:1405–1410.
- Coldman A, Phillips N, Warren L, Kan L. Breast cancer mortality after screening mammography in British Columbia women. Int J Cancer 2007; 120:1076–1080.
- Rosenberg RD, Yankaskas BC, Abraham LA, et al. Performance benchmarks for screening mammography. Radiology 2006; 241:55–66.
- Lerman C, Trock B, Rimer BK, Boyce A, Jepson C, Engstrom PF. Psychological and behavioral implications of abnormal mammograms. Ann Intern Med 1991; 114:657–661.
- Tosteson AN, Fryback DG, Hammond CS, et al. Consequences of false-positive screening mammograms. JAMA Intern Med 2014; 174:954–961.
- Schwartz LM, Woloshin S, Fowler FJ Jr, Welch HG. Enthusiasm for cancer screening in the United States. JAMA 2004; 291:71–78.
- Marmot MG, Altman DG, Cameron DA, Dewar JA, Thompson SG, Wilcox M. The benefits and harms of breast cancer screening: an independent review. Br J Cancer 2013; 108:2205–2240.
- Feig SA. Ductal carcinoma in situ. Implications for screening mammography. Radiol Clin North Am 2000; 38:653–668,
- Hughes LL, Wang M, Page DL, et al. Local excision alone without irradiation for ductal carcinoma in situ of the breast: a trial of the Eastern Cooperative Oncology Group. J Clin Oncol 2009; 27:5319–5324.
- Tabár L, Vitak B, Chen HH, et al. The Swedish two-county trial twenty years later. Updated mortality results and new insights from long-term follow-up. Radiol Clin North Am 2000; 38:625–651.
- Duffy SW, Chen HH, Tabar L, et al. Estimation of mean sojourn time in breast cancer screening using a Markov chair model of entry to and exit from the preclinical detectable phase. Stat Med 1995; 14:1521-1534.
- Chen HH, Duffy SW, Tabar L, et al. Markov chain models for progression of breast cancer. Part I: tumor attributes and the preclinical screening detectable phase. J Epidemiol Biostat 1997; 2:9–25.
- Chen HH, Duffy SW, Tabar L, et al. Markov chain models for progression of breast cancer. Part II: prediction of outcomes for different screening regimes. J Epidemiol Biostat 1997; 2:25–35.
- Kerlikowske K, Zhu W, Hubbard RA, et al; Breast Cancer Surveillance Consortium. Outcomes of screening mammography by frequency, breast density, and postmenopausal hormone therapy. JAMA Intern Med 2013; 173:807–816.
- Güth U, Huang DJ, Huber M, et al. Tumor size and detection in breast cancer: self-examination and clinical breast examination are at their limit. Cancer Detect Prev 2008; 32:224–228.
- Ries LAG, Young JL, Keel GE, Eisner MP, Lin YD, Horner M-J, editors. SEER Survival Monograph: Cancer Survival Among Adults: US SEER Program, 1988–2001, Patient and Tumor Characteristics. National Cancer Institute, SEER Program, NIH Pub. No. 07-6215, Bethesda, MD; 2007:101–110. http://seer.cancer.gov/archive/publications/survival/seer_survival_mono_lowres.pdf. Accessed April 9, 2015.
- Legorreta AP, Brooks RJ, Leibowitz AN, Solin LJ. Cost of breast cancer treatment. A 4-year longitudinal study. Arch Intern Med 1996; 156:2197–2201.
- Moss SM, Cuckle H, Evans A, Johns L, Waller M, Bobrow L; Trial Management Group. Effect of mammographic screening from age 40 years on breast cancer mortality at 10 years’ follow-up: a randomised controlled trial. Lancet 2006; 368:2053–2060.
- Humphrey LL, Helfand M, Chan BK, Woolf SH. Breast cancer screening: a summary of the evidence for the US Preventive Services Task Force. Ann Intern Med 2002; 137:347–360.
- Feig SA. Screening mammography benefit controversies: sorting the evidence. Radiol Clin North Am 2014; 52:455–480.
- Miller AB, Baines CJ, To T, Wall C. Canadian National Breast Screening Study: 2. Breast cancer detection and death rates among women aged 50 to 59 years. CMAJ 1992; 147:1477–1488.
- Miller AB, To T, Baines CJ, Wall C. Canadian National Breast Screening Study-2: 13-year results of a randomized trial in women aged 50–59 years. J Natl Cancer Inst 2000; 92:1490–1499.
- Smart CR, Hendrick RE, Rutledge JH 3rd, Smith RA. Benefit of mammography screening in women ages 40 to 49 years. Current evidence from randomized controlled trials. Cancer 1995; 75:1619–1626.
- Breast-cancer screening with mammography in women aged 40-49 years. Swedish Cancer Society and the Swedish National Board of Health and Welfare. Int J Cancer 1996; 68:693–699.
- US Preventive Services Task Force. Screening for breast cancer: U.S. Preventive Services Task Force recommendation statement. Ann Intern Med 2009; 151:716–726.
- Feig SA. Number needed to screen. Appropriate use of this new basis for screening mammography guidelines. AJR Am J Roentgenol 2012; 198:1214–1217.
- Hendrick RE, Helvie MA. Mammography screening: a new estimate of number needed to screen to prevent one breast cancer death. AJR Am J Roentgenol 2012; 198:723–728.
- Tabar L, Yen MF, Vitak B, Chen HH, Smith RA, Duffy SW. Mammography service screening and mortality in breast cancer patients: 20-year follow-up before and after introduction of screening. Lancet 2003; 361:1405–1410.
- Coldman A, Phillips N, Warren L, Kan L. Breast cancer mortality after screening mammography in British Columbia women. Int J Cancer 2007; 120:1076–1080.
- Rosenberg RD, Yankaskas BC, Abraham LA, et al. Performance benchmarks for screening mammography. Radiology 2006; 241:55–66.
- Lerman C, Trock B, Rimer BK, Boyce A, Jepson C, Engstrom PF. Psychological and behavioral implications of abnormal mammograms. Ann Intern Med 1991; 114:657–661.
- Tosteson AN, Fryback DG, Hammond CS, et al. Consequences of false-positive screening mammograms. JAMA Intern Med 2014; 174:954–961.
- Schwartz LM, Woloshin S, Fowler FJ Jr, Welch HG. Enthusiasm for cancer screening in the United States. JAMA 2004; 291:71–78.
- Marmot MG, Altman DG, Cameron DA, Dewar JA, Thompson SG, Wilcox M. The benefits and harms of breast cancer screening: an independent review. Br J Cancer 2013; 108:2205–2240.
- Feig SA. Ductal carcinoma in situ. Implications for screening mammography. Radiol Clin North Am 2000; 38:653–668,
- Hughes LL, Wang M, Page DL, et al. Local excision alone without irradiation for ductal carcinoma in situ of the breast: a trial of the Eastern Cooperative Oncology Group. J Clin Oncol 2009; 27:5319–5324.
- Tabár L, Vitak B, Chen HH, et al. The Swedish two-county trial twenty years later. Updated mortality results and new insights from long-term follow-up. Radiol Clin North Am 2000; 38:625–651.
- Duffy SW, Chen HH, Tabar L, et al. Estimation of mean sojourn time in breast cancer screening using a Markov chair model of entry to and exit from the preclinical detectable phase. Stat Med 1995; 14:1521-1534.
- Chen HH, Duffy SW, Tabar L, et al. Markov chain models for progression of breast cancer. Part I: tumor attributes and the preclinical screening detectable phase. J Epidemiol Biostat 1997; 2:9–25.
- Chen HH, Duffy SW, Tabar L, et al. Markov chain models for progression of breast cancer. Part II: prediction of outcomes for different screening regimes. J Epidemiol Biostat 1997; 2:25–35.
- Kerlikowske K, Zhu W, Hubbard RA, et al; Breast Cancer Surveillance Consortium. Outcomes of screening mammography by frequency, breast density, and postmenopausal hormone therapy. JAMA Intern Med 2013; 173:807–816.
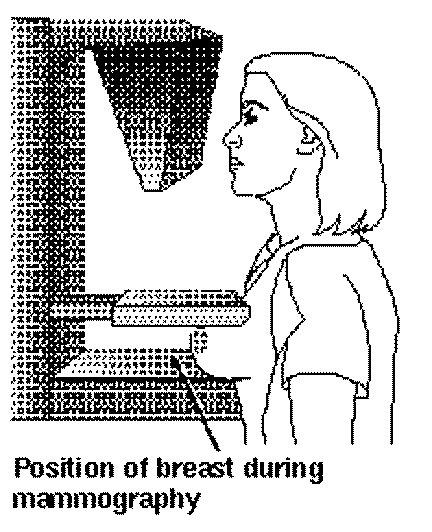
Still having reservations about ablation

“UPDATE ON ABNORMAL UTERINE BLEEDING”
HOWARD T. SHARP, MD (MARCH 2015)
Still having reservations about ablation
We discussed Dr. Sharp’s update on abnormal uterine bleeding (AUB) at a recent clinical meeting in my office. I have long told my nurse practition-ers that I am not in favor of ablation for AUB associated with ovulatory dysfunction (AUB-O). I learned from recent recertification reading that the risks for failure of ablation are dysmenorrhea, tubal ligation, and obesity, not anovulation. Therefore I may be more lenient with the use of ablation in this situation.
I still have the same reservations about performing ablation in women with ongoing irregular bleeding: If patients continue to have irregular bleeding, which they often do, it can be difficult to evaluate the endometrial cavity due to scarring, even at the time of dilation and curettage. Therefore, if they have other risk factors for hyperplasia or endometrial cancer or have postmenopausal bleeding, I won’t offer them ablation.
Nancy Shumeyko, MD
Binghamton, New York
Dr. Sharp responds
I appreciate Dr. Shumeyko’s comments and concerns about endometrial sampling in patients with abnormal bleeding (specifically AUB-O)who may have endometrial scarring after endometrial ablation. This is one of the unsettling challenges of post-ablation bleeding that we must sometimes address. Unfortunately, this can occur even in patients who seem to be “ideal” candidates for endometrial ablation (AUB-E). With amenorrhea rates generally less than 50% with most ablative methods, this unintended consequence makes the levonorgestrel IUD look all the more appealing. Hence, I agree with Dr. Shumeyko, and would add that just because we can do something, doesn’t mean we should.
The important question is how to repair the incision
I read with interest Dr. Barbieri’s March editorial about hysterotomy during cesarean delivery. In my opinion, the important question is not how to open but how to repair.
I cannot dictate or even encourage other surgeons to do as I do because our surgical skills differ. I create a bladder flap on primary cesarean sections out of habit, but I have performed a few without creating it, and without harming the patient.
Personally, I open the lower uterine segment sharply unless copious bleeding hampers my view. Most of the time, I can gain entrance to the uterine cavity without performing a concurrent amniotomy, which allows me to sharply perform the hysterotomy without concern for injuring the fetus. If bleeding hampers my view, I do all the dissection bluntly.
Have I noticed a big difference one way or the other? Not at all.
It is my impression that a double-layered closure is beneficial to the patient. I close the hysterotomy in this fashion even if the patient would not be a candidate for a trial of labor after cesarean in future pregnancies.
Maybe I am just lucky, but I only remember having injured 1 baby (a breech presentation fetus with severe oligohydramnios) since I finished my residency in 1986.
Tomas Hernandez, MD
Pasco, Washington
Dr. Barbieri responds
I respect Dr. Hernandez’s 30 years of clinical experience and appreciate his recommendations on opening and closing of the hysterotomy at cesarean delivery. My observation is that most US obstetricians close the hysterotomy in 2 layers. Like Dr. Hernandez, I favor a double-layer closure even if the patient is not a candidate for a trial of labor in a future pregnancy.
ANSWERING YOUR CODING QUESTIONS
A reader recently requested assistance for a specific coding challenge. We’ve asked our reimbursement specialist, Melanie Witt, RN, CPC, COBGC, MA, to provide her insight.
How should we code when using CUSA on vulvar dysplasia?
I provide coding assistance for several ObGyn practices and have always found your Web site to be informative. My question concerns Current Procedural Terminology (CPT) coding for removal of vulvar dysplasia using the cavitron ultrasonic surgical aspirator. The device is used to remove diseased epithelium. Generally, acetic acid is applied to highlight the diseased area and the lesions are removed with the device. The aspirator also collects the removed tissue so that it can be sent to pathology. Silver sulfadiazine cream is applied to the areas treated, as in laser surgery. The treatment may take 10 to 15 minutes. Which code, 56620 or 56515, should be used to reflect the actual work involved?
Marie D. Pelino, CPC
Annapolis, Maryland
Ms. Witt responds
The clinical vignette that was used by the CPT Editorial Panel in valuing code 56620 (Vulvectomy simple; partial) reads1:
The relative value units (RVUs) for this code are also fairly high at 14.86, and the procedure is designated as one that is performed in the hospital setting only. In addition, when valued, this procedure was assumed to represent 45 minutes of intraservice time (that is, the time for the actual surgery), and 56620 has a 90-day global period.
In contrast, 56515 (Destruction of lesion[s], vulva; extensive [eg, laser surgery, electrosurgery, cryosurgery, chemosurgery]) can be performed either in the facility or office setting and represents extensive destruction of tissue. In some cases, the physician may take a sample of tissue prior to the destruction, but this would be considered included in the destruction and not separately reportable, as the destruction represents the most extensive procedure. The clinical vignette used to value this code reads1:
The RVUs for this procedure are less at 5.75 in the facility setting and 6.45 in the office setting, but the intraservice time is also less than with 56620.
Given your description of the procedure in this case, I would consider 56515 to be the most correct code to report for this surgery.
Reference
1. American Medical Association. RBRVS DataManager Online. AMA Store Web site. https://commerce.ama-assn.org/store/catalog/productDetail.jsp?product_id=prod280002&navAction =push. Accessed March 17, 2015.
Share your thoughts on this article! Send your Letter to the Editor to rbarbieri@frontlinemedcom.com. Please include your name and the city and state in which you practice.
“UPDATE ON ABNORMAL UTERINE BLEEDING”
HOWARD T. SHARP, MD (MARCH 2015)
Still having reservations about ablation
We discussed Dr. Sharp’s update on abnormal uterine bleeding (AUB) at a recent clinical meeting in my office. I have long told my nurse practition-ers that I am not in favor of ablation for AUB associated with ovulatory dysfunction (AUB-O). I learned from recent recertification reading that the risks for failure of ablation are dysmenorrhea, tubal ligation, and obesity, not anovulation. Therefore I may be more lenient with the use of ablation in this situation.
I still have the same reservations about performing ablation in women with ongoing irregular bleeding: If patients continue to have irregular bleeding, which they often do, it can be difficult to evaluate the endometrial cavity due to scarring, even at the time of dilation and curettage. Therefore, if they have other risk factors for hyperplasia or endometrial cancer or have postmenopausal bleeding, I won’t offer them ablation.
Nancy Shumeyko, MD
Binghamton, New York
Dr. Sharp responds
I appreciate Dr. Shumeyko’s comments and concerns about endometrial sampling in patients with abnormal bleeding (specifically AUB-O)who may have endometrial scarring after endometrial ablation. This is one of the unsettling challenges of post-ablation bleeding that we must sometimes address. Unfortunately, this can occur even in patients who seem to be “ideal” candidates for endometrial ablation (AUB-E). With amenorrhea rates generally less than 50% with most ablative methods, this unintended consequence makes the levonorgestrel IUD look all the more appealing. Hence, I agree with Dr. Shumeyko, and would add that just because we can do something, doesn’t mean we should.
The important question is how to repair the incision
I read with interest Dr. Barbieri’s March editorial about hysterotomy during cesarean delivery. In my opinion, the important question is not how to open but how to repair.
I cannot dictate or even encourage other surgeons to do as I do because our surgical skills differ. I create a bladder flap on primary cesarean sections out of habit, but I have performed a few without creating it, and without harming the patient.
Personally, I open the lower uterine segment sharply unless copious bleeding hampers my view. Most of the time, I can gain entrance to the uterine cavity without performing a concurrent amniotomy, which allows me to sharply perform the hysterotomy without concern for injuring the fetus. If bleeding hampers my view, I do all the dissection bluntly.
Have I noticed a big difference one way or the other? Not at all.
It is my impression that a double-layered closure is beneficial to the patient. I close the hysterotomy in this fashion even if the patient would not be a candidate for a trial of labor after cesarean in future pregnancies.
Maybe I am just lucky, but I only remember having injured 1 baby (a breech presentation fetus with severe oligohydramnios) since I finished my residency in 1986.
Tomas Hernandez, MD
Pasco, Washington
Dr. Barbieri responds
I respect Dr. Hernandez’s 30 years of clinical experience and appreciate his recommendations on opening and closing of the hysterotomy at cesarean delivery. My observation is that most US obstetricians close the hysterotomy in 2 layers. Like Dr. Hernandez, I favor a double-layer closure even if the patient is not a candidate for a trial of labor in a future pregnancy.
ANSWERING YOUR CODING QUESTIONS
A reader recently requested assistance for a specific coding challenge. We’ve asked our reimbursement specialist, Melanie Witt, RN, CPC, COBGC, MA, to provide her insight.
How should we code when using CUSA on vulvar dysplasia?
I provide coding assistance for several ObGyn practices and have always found your Web site to be informative. My question concerns Current Procedural Terminology (CPT) coding for removal of vulvar dysplasia using the cavitron ultrasonic surgical aspirator. The device is used to remove diseased epithelium. Generally, acetic acid is applied to highlight the diseased area and the lesions are removed with the device. The aspirator also collects the removed tissue so that it can be sent to pathology. Silver sulfadiazine cream is applied to the areas treated, as in laser surgery. The treatment may take 10 to 15 minutes. Which code, 56620 or 56515, should be used to reflect the actual work involved?
Marie D. Pelino, CPC
Annapolis, Maryland
Ms. Witt responds
The clinical vignette that was used by the CPT Editorial Panel in valuing code 56620 (Vulvectomy simple; partial) reads1:
The relative value units (RVUs) for this code are also fairly high at 14.86, and the procedure is designated as one that is performed in the hospital setting only. In addition, when valued, this procedure was assumed to represent 45 minutes of intraservice time (that is, the time for the actual surgery), and 56620 has a 90-day global period.
In contrast, 56515 (Destruction of lesion[s], vulva; extensive [eg, laser surgery, electrosurgery, cryosurgery, chemosurgery]) can be performed either in the facility or office setting and represents extensive destruction of tissue. In some cases, the physician may take a sample of tissue prior to the destruction, but this would be considered included in the destruction and not separately reportable, as the destruction represents the most extensive procedure. The clinical vignette used to value this code reads1:
The RVUs for this procedure are less at 5.75 in the facility setting and 6.45 in the office setting, but the intraservice time is also less than with 56620.
Given your description of the procedure in this case, I would consider 56515 to be the most correct code to report for this surgery.
Reference
1. American Medical Association. RBRVS DataManager Online. AMA Store Web site. https://commerce.ama-assn.org/store/catalog/productDetail.jsp?product_id=prod280002&navAction =push. Accessed March 17, 2015.
Share your thoughts on this article! Send your Letter to the Editor to rbarbieri@frontlinemedcom.com. Please include your name and the city and state in which you practice.
“UPDATE ON ABNORMAL UTERINE BLEEDING”
HOWARD T. SHARP, MD (MARCH 2015)
Still having reservations about ablation
We discussed Dr. Sharp’s update on abnormal uterine bleeding (AUB) at a recent clinical meeting in my office. I have long told my nurse practition-ers that I am not in favor of ablation for AUB associated with ovulatory dysfunction (AUB-O). I learned from recent recertification reading that the risks for failure of ablation are dysmenorrhea, tubal ligation, and obesity, not anovulation. Therefore I may be more lenient with the use of ablation in this situation.
I still have the same reservations about performing ablation in women with ongoing irregular bleeding: If patients continue to have irregular bleeding, which they often do, it can be difficult to evaluate the endometrial cavity due to scarring, even at the time of dilation and curettage. Therefore, if they have other risk factors for hyperplasia or endometrial cancer or have postmenopausal bleeding, I won’t offer them ablation.
Nancy Shumeyko, MD
Binghamton, New York
Dr. Sharp responds
I appreciate Dr. Shumeyko’s comments and concerns about endometrial sampling in patients with abnormal bleeding (specifically AUB-O)who may have endometrial scarring after endometrial ablation. This is one of the unsettling challenges of post-ablation bleeding that we must sometimes address. Unfortunately, this can occur even in patients who seem to be “ideal” candidates for endometrial ablation (AUB-E). With amenorrhea rates generally less than 50% with most ablative methods, this unintended consequence makes the levonorgestrel IUD look all the more appealing. Hence, I agree with Dr. Shumeyko, and would add that just because we can do something, doesn’t mean we should.
The important question is how to repair the incision
I read with interest Dr. Barbieri’s March editorial about hysterotomy during cesarean delivery. In my opinion, the important question is not how to open but how to repair.
I cannot dictate or even encourage other surgeons to do as I do because our surgical skills differ. I create a bladder flap on primary cesarean sections out of habit, but I have performed a few without creating it, and without harming the patient.
Personally, I open the lower uterine segment sharply unless copious bleeding hampers my view. Most of the time, I can gain entrance to the uterine cavity without performing a concurrent amniotomy, which allows me to sharply perform the hysterotomy without concern for injuring the fetus. If bleeding hampers my view, I do all the dissection bluntly.
Have I noticed a big difference one way or the other? Not at all.
It is my impression that a double-layered closure is beneficial to the patient. I close the hysterotomy in this fashion even if the patient would not be a candidate for a trial of labor after cesarean in future pregnancies.
Maybe I am just lucky, but I only remember having injured 1 baby (a breech presentation fetus with severe oligohydramnios) since I finished my residency in 1986.
Tomas Hernandez, MD
Pasco, Washington
Dr. Barbieri responds
I respect Dr. Hernandez’s 30 years of clinical experience and appreciate his recommendations on opening and closing of the hysterotomy at cesarean delivery. My observation is that most US obstetricians close the hysterotomy in 2 layers. Like Dr. Hernandez, I favor a double-layer closure even if the patient is not a candidate for a trial of labor in a future pregnancy.
ANSWERING YOUR CODING QUESTIONS
A reader recently requested assistance for a specific coding challenge. We’ve asked our reimbursement specialist, Melanie Witt, RN, CPC, COBGC, MA, to provide her insight.
How should we code when using CUSA on vulvar dysplasia?
I provide coding assistance for several ObGyn practices and have always found your Web site to be informative. My question concerns Current Procedural Terminology (CPT) coding for removal of vulvar dysplasia using the cavitron ultrasonic surgical aspirator. The device is used to remove diseased epithelium. Generally, acetic acid is applied to highlight the diseased area and the lesions are removed with the device. The aspirator also collects the removed tissue so that it can be sent to pathology. Silver sulfadiazine cream is applied to the areas treated, as in laser surgery. The treatment may take 10 to 15 minutes. Which code, 56620 or 56515, should be used to reflect the actual work involved?
Marie D. Pelino, CPC
Annapolis, Maryland
Ms. Witt responds
The clinical vignette that was used by the CPT Editorial Panel in valuing code 56620 (Vulvectomy simple; partial) reads1:
The relative value units (RVUs) for this code are also fairly high at 14.86, and the procedure is designated as one that is performed in the hospital setting only. In addition, when valued, this procedure was assumed to represent 45 minutes of intraservice time (that is, the time for the actual surgery), and 56620 has a 90-day global period.
In contrast, 56515 (Destruction of lesion[s], vulva; extensive [eg, laser surgery, electrosurgery, cryosurgery, chemosurgery]) can be performed either in the facility or office setting and represents extensive destruction of tissue. In some cases, the physician may take a sample of tissue prior to the destruction, but this would be considered included in the destruction and not separately reportable, as the destruction represents the most extensive procedure. The clinical vignette used to value this code reads1:
The RVUs for this procedure are less at 5.75 in the facility setting and 6.45 in the office setting, but the intraservice time is also less than with 56620.
Given your description of the procedure in this case, I would consider 56515 to be the most correct code to report for this surgery.
Reference
1. American Medical Association. RBRVS DataManager Online. AMA Store Web site. https://commerce.ama-assn.org/store/catalog/productDetail.jsp?product_id=prod280002&navAction =push. Accessed March 17, 2015.
Share your thoughts on this article! Send your Letter to the Editor to rbarbieri@frontlinemedcom.com. Please include your name and the city and state in which you practice.
The Baltimore riots
Practically everyone who lives in America has heard about the Baltimore riots, precipitated by the death of a man while in police custody. Their scope was unprecedented; their implications, far reaching. I, like many Americans, stayed glued to the news to keep abreast of the latest updates for a variety of reasons, one of which was that I live and work nearby, and personal safety was a major concern. At the peak of the violence, when people were leaving the city in droves, I kept in close contact with my brother, a physician who works in a hospital at the epicenter of the chaos. Fortunately, he got out safely, as did most people. Yet many, including citizens and police officers, were injured, some seriously so.
No matter where you stand regarding the events surrounding the riots, the fact remains that we as physicians are not infrequently called upon to care for patients who have victimized or been victimized by others. We care for those who are slowly destroying themselves and endangering others with their abuse of drugs and alcohol, yet refuse any help we offer for their substance abuse. Some hospitalists work in hospitals with booming prison wards, and thus frequently care for murderers, thieves, child abusers, and others whom we may secretly fear, yet openly pledge to protect, respect, and care for. While I could not find a good scholarly article addressing how we as physicians do versus how we should handle these situations, I believe many of us have struggled with the personal emotions and ethical dilemmas raised by some of these cases.
How much can we and should we get involved? How do we mask our personal opinions of patients who have committed egregious acts and provide not only the best care possible, but do so while treating them with the respect and dignity that we allow for other patients? And if we go the extra mile to provide emotional support and encouragement, will we really have any positive impact on them, or will they just shut us out? Where do we draw the line between just being health care providers and being compassionate, nonjudgmental clinicians who can really impact their lives?
I don’t think there is an easy answer to any of these questions, and each patient is different. But I believe that many people still look up to their health care providers, and there will be those times when we can be more than their doctor; we can be their (much-needed) friend. Meanwhile, we need to guard against the natural human inclination to act as judge and jury toward those who have committed acts we personally find reprehensible. Every patient deserves our very best medical care, even when we cannot find it within ourselves to give this service with a smile.
Dr. Hester is a hospitalist at Baltimore-Washington Medical Center in Glen Burnie, Md. She is the creator of the Patient Whiz, a patient-engagement app for iOS. Reach her at healthsavvy@aol.com.
Practically everyone who lives in America has heard about the Baltimore riots, precipitated by the death of a man while in police custody. Their scope was unprecedented; their implications, far reaching. I, like many Americans, stayed glued to the news to keep abreast of the latest updates for a variety of reasons, one of which was that I live and work nearby, and personal safety was a major concern. At the peak of the violence, when people were leaving the city in droves, I kept in close contact with my brother, a physician who works in a hospital at the epicenter of the chaos. Fortunately, he got out safely, as did most people. Yet many, including citizens and police officers, were injured, some seriously so.
No matter where you stand regarding the events surrounding the riots, the fact remains that we as physicians are not infrequently called upon to care for patients who have victimized or been victimized by others. We care for those who are slowly destroying themselves and endangering others with their abuse of drugs and alcohol, yet refuse any help we offer for their substance abuse. Some hospitalists work in hospitals with booming prison wards, and thus frequently care for murderers, thieves, child abusers, and others whom we may secretly fear, yet openly pledge to protect, respect, and care for. While I could not find a good scholarly article addressing how we as physicians do versus how we should handle these situations, I believe many of us have struggled with the personal emotions and ethical dilemmas raised by some of these cases.
How much can we and should we get involved? How do we mask our personal opinions of patients who have committed egregious acts and provide not only the best care possible, but do so while treating them with the respect and dignity that we allow for other patients? And if we go the extra mile to provide emotional support and encouragement, will we really have any positive impact on them, or will they just shut us out? Where do we draw the line between just being health care providers and being compassionate, nonjudgmental clinicians who can really impact their lives?
I don’t think there is an easy answer to any of these questions, and each patient is different. But I believe that many people still look up to their health care providers, and there will be those times when we can be more than their doctor; we can be their (much-needed) friend. Meanwhile, we need to guard against the natural human inclination to act as judge and jury toward those who have committed acts we personally find reprehensible. Every patient deserves our very best medical care, even when we cannot find it within ourselves to give this service with a smile.
Dr. Hester is a hospitalist at Baltimore-Washington Medical Center in Glen Burnie, Md. She is the creator of the Patient Whiz, a patient-engagement app for iOS. Reach her at healthsavvy@aol.com.
Practically everyone who lives in America has heard about the Baltimore riots, precipitated by the death of a man while in police custody. Their scope was unprecedented; their implications, far reaching. I, like many Americans, stayed glued to the news to keep abreast of the latest updates for a variety of reasons, one of which was that I live and work nearby, and personal safety was a major concern. At the peak of the violence, when people were leaving the city in droves, I kept in close contact with my brother, a physician who works in a hospital at the epicenter of the chaos. Fortunately, he got out safely, as did most people. Yet many, including citizens and police officers, were injured, some seriously so.
No matter where you stand regarding the events surrounding the riots, the fact remains that we as physicians are not infrequently called upon to care for patients who have victimized or been victimized by others. We care for those who are slowly destroying themselves and endangering others with their abuse of drugs and alcohol, yet refuse any help we offer for their substance abuse. Some hospitalists work in hospitals with booming prison wards, and thus frequently care for murderers, thieves, child abusers, and others whom we may secretly fear, yet openly pledge to protect, respect, and care for. While I could not find a good scholarly article addressing how we as physicians do versus how we should handle these situations, I believe many of us have struggled with the personal emotions and ethical dilemmas raised by some of these cases.
How much can we and should we get involved? How do we mask our personal opinions of patients who have committed egregious acts and provide not only the best care possible, but do so while treating them with the respect and dignity that we allow for other patients? And if we go the extra mile to provide emotional support and encouragement, will we really have any positive impact on them, or will they just shut us out? Where do we draw the line between just being health care providers and being compassionate, nonjudgmental clinicians who can really impact their lives?
I don’t think there is an easy answer to any of these questions, and each patient is different. But I believe that many people still look up to their health care providers, and there will be those times when we can be more than their doctor; we can be their (much-needed) friend. Meanwhile, we need to guard against the natural human inclination to act as judge and jury toward those who have committed acts we personally find reprehensible. Every patient deserves our very best medical care, even when we cannot find it within ourselves to give this service with a smile.
Dr. Hester is a hospitalist at Baltimore-Washington Medical Center in Glen Burnie, Md. She is the creator of the Patient Whiz, a patient-engagement app for iOS. Reach her at healthsavvy@aol.com.

More than ever, diversity matters in dermatology
As a profession, I think it’s fair to say that dermatology has done a good job welcoming women and including them into this field of medicine. But how many of your physician colleagues are African Americans? How many are Latinos or Latinas?
Does the diversity of your clinician colleagues reflect our patient population? The 2013 census shows that 13.2% of Americans are African American and 17.1% are Latino. Because these populations are not represented in medicine at anything like these percentages, African American and Latino physicians are referred to as underrepresented in medicine (UIM).

A brochure for an upcoming medical conference states that by 2050, “half of the U.S. population will have skin of color.” This may well become a fact. But I argue that a professional workforce that is as diverse as the population we care for is a much better workforce.
I serve as the interim dean of the University of California, San Francisco (UCSF) School of Medicine, which is one of the great medical schools in the United States. The school has 632 students – 26% from underrepresented minorities, and 56% women – the most diverse student group in California and perhaps the United States. There are 2,180 full-time faculty members but less than 2% are underrepresented in medicine. The annual operating budget is more than $2 billion and the school is No. 1 in National Institutes of Health funding. But there are some important shortcomings.
Three things happened after I took the job as interim dean last year. First, the accrediting body of medical schools, the Liaison Committee on Medical Education, served us with a citation for our hiring practices and the lack of diversity among our faculty.
Second, I ran into something called the “climate survey.” We have all heard about climate change, but have you heard of a “climate survey”? No, it’s not an opportunity to complain about too much snow in Boston and too little water in San Francisco. People on every University of California campus were asked if they felt included in the organization that they worked in. Did they feel comfortable? Did they feel part of the club?
The UC survey found that at UCSF and its sister institutions, people from groups underrepresented in medicine – mainly Hispanics and African Americans, whether they were faculty, staff, or students – felt less comfortable than did their white counterparts. They did not feel our climate was inclusive. That’s not the same as being specifically excluded. It’s about not being included.
Third, there were the racially charged events in Ferguson, Missouri, and in Staten Island, New York, and the way our students responded to them. On December 9, 2014, our students organized a “die-in” protest to demonstrate their concern about racism in health care in our country. They called it WhiteCoats4BlackLives. So here I was, the dean of a medical school, and I find all of our students lying down in the street on campus in a very peaceful but profoundly moving demonstration to protest racism. Not only did our students protest at UCSF, they instigated the same WhiteCoats4BlackLives protest simultaneously at 83 medical schools across the country.
I recalled my own student days when we protested public events, and university administrators responded. But this time, as dean of medicine, I was the administrator. It gave me pause to think: What did those three pieces of evidence tell me? They made it clear that race matters. Once that realization finally became clear to me, the question was, what do we do? We were a few weeks away from our annual leadership retreat. The topic was going to be “strategic partnerships.” I sat down with the vice deans and said: Let’s talk about race instead.
And we did, and it turned into an amazing discussion. Just one example: Before the retreat, all of us took the Implicit Associations Test for race. This is a test designed to detect unconscious bias, the kind of bias we are not even aware of. Like me, many of us who considered ourselves fair and unbiased were shocked at the results. We were unconsciously biased for white people and against people of color.
Nicholas Kristof talked about this in the Feb. 21, 2015, edition of The New York Times, in a piece called “Straight Talk for White Men.” It’s worth reading the whole piece, but a study he cited especially struck me. Two scholars sent out fictitious résumés in response to help-wanted ads. Each résumé was given a name that sounded stereotypically black or white. The résumés were otherwise the same.
A résumé with a name like Emily or Greg received 50% more callbacks than the same résumé with a name like Lakisha or Jamal. Having a white-sounding name was more beneficial than 8 years’ work experience.
We heard stories from our students and faculty of color. I will highlight two. A medical student of color was called to the ED and was stopped by a nurse who thought he was a custodian. A senior faculty member was returning to his alma mater medical school in North Carolina as a visiting professor and was traveling from the airport to the medical school in a rental car. He was stopped and detained because he was black. His hosts came to his rescue and were required to prove that he was indeed visiting at their invitation. Needless to say these and other stories were startling in 2015. America is not post racial.
As a result of the retreat, we are now finishing a plan to make UCSF an inclusive institution for all who work here. The plan includes both short- and long-term elements, and an investment of at least $10 million to recruit and develop faculty from populations that are underrepresented in medicine.
Today’s doctor-patient relationship has become more and more collaborative. Patients actively look for doctors whom they feel they can talk to, who will understand their special concerns, their background, and their culture. There is neuroscience behind this. Research by Mahzarin Banaji, the coauthor of “Blind Spot,” found that we are in fact wired to react more positively to someone who looks like us.
All of us probably understand why a woman might want to choose a female gynecologist. Why a Chinese family will prefer a doctor who speaks their language. Our patients, too, are looking for physicians, for dermatologists, whose skin reflects theirs. They feel better if their doctor looks more like them.
The website Blackdermatologists.org is meant to help patients find exactly that. Guess how many black dermatologists are listed there in the whole State of California. Three. None of them are in San Francisco. None of them are across the bay in Oakland, a city with a large African American population. I did some research via other websites and found one African American dermatologist in the East Bay.
It’s one thing to be underrepresented in medicine, it’s another thing to be unrepresented. The lack of access to a physician who looks like our patients, whose background and experience might reflect theirs, is crucial. But what about the lack of research focused on African Americans, Latinos, and other underrepresented populations by people who understand the culture from the inside and what questions to ask?
I came across such an example in JAMA Dermatology, in an study titled, “Hair Care Practices as a Barrier to Physical Activity in African American Women” (JAMA Dermatol. 2013;149:310-4). My first reaction to this article was “what?” But that’s my unconscious bias talking. In fact, this study points to something significant. We know regular exercise is important for health. Research shows that African American women are the least likely to meet recommended levels of physical activity. Therefore, we want to be aware of any barriers to exercise for that population. But who would have imagined that one of the barriers to exercise for black women was hair care? This never would have occurred to me.
The people who did think to investigate this were in a team led by and including African American women dermatologists and researchers. So now that this is a known barrier, it can be addressed with patients. This is just one example of the type of knowledge we gain if we have a more diverse group of physicians and clinical researchers.
We know we don’t have enough practicing physicians of color in medicine in general, and in dermatology in particular. We easily fall back to the pipeline as the excuse for the situation. So, let’s look at the pipeline. Unfortunately, the current numbers are not encouraging. According to data from the Association of American Medical Colleges, from 1980 to 2013 the number of applicants to U.S. medical schools rose by 4,296. In 1980, 2,507 applicants were African American/black (7.1%), but by 2013 that number only rose to 3,490 (8.8%). During that same time period the number of Hispanic/Latino applicants rose from 5% to 10%.
How many of the applicants entered medical school? From 1980 to 2013 the number of African American/black students rose by 235: from 999 to 1,234, or 6.5% to 7%. At the same time, Hispanic/Latino students rose from 5.2% to 10.6% of entering students.
How many of the applicants matriculated? In 1980, 39.4% of African American/black applicants matriculated, but in 2013 the rate fell to 35%. What explains the data? Lack of role models? Lack of qualifications? Unconscious bias? An exclusive climate? Continued racism in our country? I don’t pretend to know the answer, but we always fall back on the pipeline as the excuse for the situation. So, what are we going to do about the pipeline?
Given the current state of the pipeline, the question may not be “what is the ideal” but “what is an achievable goal for dermatology?” In 2014, 47 of 731 applicants to dermatology programs were African American and another 47 were Latino. I don’t know how many of these finally matched, but only 6.4% of the applicants were either African American or Latino. This is well below their representation in the population at large.
There may be many reasons why physicians of color are not choosing dermatology as a specialty. Not surprisingly, many of them go into primary care. There is nothing wrong with that. You could argue that having African American and Latino doctors in primary care is where they are most needed, where personal relationships are most crucial. But that should not be an argument against trying to improve the general pipeline and diversify our own specialty pipeline. One goal could be to double the annual number of UIM applicants. I think this is achievable and would have an impact.
Here’s how we might get there. For those of us who are involved in the training of new dermatologists, we have to “lean forward.” Instead of receiving those who choose to come to us, we have to reach out to them. We have to engage, mentor, and ask questions. Find out about hidden bias, your own and others. Understand how your organization or institution can be enriched by having a more diverse pool of learners and leaders.
For those of you who are in practice, there is something you can do as well: You can plant a seed. You all see young people with skin problems. Many of them are and will be from underrepresented populations. Some of them may strike you as particularly bright and lively. So when you have the opportunity to talk to such a bright young woman or young man, ask, “Have you ever thought about becoming a doctor?” And if that strikes a spark, ask, “Have you thought about becoming a dermatologist?” Do this twice a day, 10 times a week, and 500 times each year.
If you do only that, whenever you have an opportunity, you may just plant a few seeds that will make a difference down the line. You will never know the outcome, but it’s worth doing. There’s no downside.
For those of you who are involved in organizations such as the American Academy of Dermatology or the Dermatology Foundation, what can the leadership in our field do? Think about mentorship, role models, scholarships, outreach, and pipeline programs. Think about recruiting colleagues who are UIMs into leadership positions. Let’s be the most inclusive specialty in medicine.
Ultimately, our goal is to have a workforce that mirrors our population. I know this is not achievable in the short term. It will take decades. But this will never occur if we don’t take the first step. To ensure the future of dermatology, let’s all lean forward and embrace this task. Diversity matters in medicine.
A board-certified dermatologist, Dr. Bruce U. Wintroub is interim dean of the University of California, San Francisco School of Medicine. He has been professor and chair of the department of dermatology at UCSF since 1985. This text was extracted from a plenary presentation he delivered at the 2015 annual meeting of the American Academy of Dermatology meeting in San Francisco.
As a profession, I think it’s fair to say that dermatology has done a good job welcoming women and including them into this field of medicine. But how many of your physician colleagues are African Americans? How many are Latinos or Latinas?
Does the diversity of your clinician colleagues reflect our patient population? The 2013 census shows that 13.2% of Americans are African American and 17.1% are Latino. Because these populations are not represented in medicine at anything like these percentages, African American and Latino physicians are referred to as underrepresented in medicine (UIM).
A brochure for an upcoming medical conference states that by 2050, “half of the U.S. population will have skin of color.” This may well become a fact. But I argue that a professional workforce that is as diverse as the population we care for is a much better workforce.
I serve as the interim dean of the University of California, San Francisco (UCSF) School of Medicine, which is one of the great medical schools in the United States. The school has 632 students – 26% from underrepresented minorities, and 56% women – the most diverse student group in California and perhaps the United States. There are 2,180 full-time faculty members but less than 2% are underrepresented in medicine. The annual operating budget is more than $2 billion and the school is No. 1 in National Institutes of Health funding. But there are some important shortcomings.
Three things happened after I took the job as interim dean last year. First, the accrediting body of medical schools, the Liaison Committee on Medical Education, served us with a citation for our hiring practices and the lack of diversity among our faculty.
Second, I ran into something called the “climate survey.” We have all heard about climate change, but have you heard of a “climate survey”? No, it’s not an opportunity to complain about too much snow in Boston and too little water in San Francisco. People on every University of California campus were asked if they felt included in the organization that they worked in. Did they feel comfortable? Did they feel part of the club?
The UC survey found that at UCSF and its sister institutions, people from groups underrepresented in medicine – mainly Hispanics and African Americans, whether they were faculty, staff, or students – felt less comfortable than did their white counterparts. They did not feel our climate was inclusive. That’s not the same as being specifically excluded. It’s about not being included.
Third, there were the racially charged events in Ferguson, Missouri, and in Staten Island, New York, and the way our students responded to them. On December 9, 2014, our students organized a “die-in” protest to demonstrate their concern about racism in health care in our country. They called it WhiteCoats4BlackLives. So here I was, the dean of a medical school, and I find all of our students lying down in the street on campus in a very peaceful but profoundly moving demonstration to protest racism. Not only did our students protest at UCSF, they instigated the same WhiteCoats4BlackLives protest simultaneously at 83 medical schools across the country.
I recalled my own student days when we protested public events, and university administrators responded. But this time, as dean of medicine, I was the administrator. It gave me pause to think: What did those three pieces of evidence tell me? They made it clear that race matters. Once that realization finally became clear to me, the question was, what do we do? We were a few weeks away from our annual leadership retreat. The topic was going to be “strategic partnerships.” I sat down with the vice deans and said: Let’s talk about race instead.
And we did, and it turned into an amazing discussion. Just one example: Before the retreat, all of us took the Implicit Associations Test for race. This is a test designed to detect unconscious bias, the kind of bias we are not even aware of. Like me, many of us who considered ourselves fair and unbiased were shocked at the results. We were unconsciously biased for white people and against people of color.
Nicholas Kristof talked about this in the Feb. 21, 2015, edition of The New York Times, in a piece called “Straight Talk for White Men.” It’s worth reading the whole piece, but a study he cited especially struck me. Two scholars sent out fictitious résumés in response to help-wanted ads. Each résumé was given a name that sounded stereotypically black or white. The résumés were otherwise the same.
A résumé with a name like Emily or Greg received 50% more callbacks than the same résumé with a name like Lakisha or Jamal. Having a white-sounding name was more beneficial than 8 years’ work experience.
We heard stories from our students and faculty of color. I will highlight two. A medical student of color was called to the ED and was stopped by a nurse who thought he was a custodian. A senior faculty member was returning to his alma mater medical school in North Carolina as a visiting professor and was traveling from the airport to the medical school in a rental car. He was stopped and detained because he was black. His hosts came to his rescue and were required to prove that he was indeed visiting at their invitation. Needless to say these and other stories were startling in 2015. America is not post racial.
As a result of the retreat, we are now finishing a plan to make UCSF an inclusive institution for all who work here. The plan includes both short- and long-term elements, and an investment of at least $10 million to recruit and develop faculty from populations that are underrepresented in medicine.
Today’s doctor-patient relationship has become more and more collaborative. Patients actively look for doctors whom they feel they can talk to, who will understand their special concerns, their background, and their culture. There is neuroscience behind this. Research by Mahzarin Banaji, the coauthor of “Blind Spot,” found that we are in fact wired to react more positively to someone who looks like us.
All of us probably understand why a woman might want to choose a female gynecologist. Why a Chinese family will prefer a doctor who speaks their language. Our patients, too, are looking for physicians, for dermatologists, whose skin reflects theirs. They feel better if their doctor looks more like them.
The website Blackdermatologists.org is meant to help patients find exactly that. Guess how many black dermatologists are listed there in the whole State of California. Three. None of them are in San Francisco. None of them are across the bay in Oakland, a city with a large African American population. I did some research via other websites and found one African American dermatologist in the East Bay.
It’s one thing to be underrepresented in medicine, it’s another thing to be unrepresented. The lack of access to a physician who looks like our patients, whose background and experience might reflect theirs, is crucial. But what about the lack of research focused on African Americans, Latinos, and other underrepresented populations by people who understand the culture from the inside and what questions to ask?
I came across such an example in JAMA Dermatology, in an study titled, “Hair Care Practices as a Barrier to Physical Activity in African American Women” (JAMA Dermatol. 2013;149:310-4). My first reaction to this article was “what?” But that’s my unconscious bias talking. In fact, this study points to something significant. We know regular exercise is important for health. Research shows that African American women are the least likely to meet recommended levels of physical activity. Therefore, we want to be aware of any barriers to exercise for that population. But who would have imagined that one of the barriers to exercise for black women was hair care? This never would have occurred to me.
The people who did think to investigate this were in a team led by and including African American women dermatologists and researchers. So now that this is a known barrier, it can be addressed with patients. This is just one example of the type of knowledge we gain if we have a more diverse group of physicians and clinical researchers.
We know we don’t have enough practicing physicians of color in medicine in general, and in dermatology in particular. We easily fall back to the pipeline as the excuse for the situation. So, let’s look at the pipeline. Unfortunately, the current numbers are not encouraging. According to data from the Association of American Medical Colleges, from 1980 to 2013 the number of applicants to U.S. medical schools rose by 4,296. In 1980, 2,507 applicants were African American/black (7.1%), but by 2013 that number only rose to 3,490 (8.8%). During that same time period the number of Hispanic/Latino applicants rose from 5% to 10%.
How many of the applicants entered medical school? From 1980 to 2013 the number of African American/black students rose by 235: from 999 to 1,234, or 6.5% to 7%. At the same time, Hispanic/Latino students rose from 5.2% to 10.6% of entering students.
How many of the applicants matriculated? In 1980, 39.4% of African American/black applicants matriculated, but in 2013 the rate fell to 35%. What explains the data? Lack of role models? Lack of qualifications? Unconscious bias? An exclusive climate? Continued racism in our country? I don’t pretend to know the answer, but we always fall back on the pipeline as the excuse for the situation. So, what are we going to do about the pipeline?
Given the current state of the pipeline, the question may not be “what is the ideal” but “what is an achievable goal for dermatology?” In 2014, 47 of 731 applicants to dermatology programs were African American and another 47 were Latino. I don’t know how many of these finally matched, but only 6.4% of the applicants were either African American or Latino. This is well below their representation in the population at large.
There may be many reasons why physicians of color are not choosing dermatology as a specialty. Not surprisingly, many of them go into primary care. There is nothing wrong with that. You could argue that having African American and Latino doctors in primary care is where they are most needed, where personal relationships are most crucial. But that should not be an argument against trying to improve the general pipeline and diversify our own specialty pipeline. One goal could be to double the annual number of UIM applicants. I think this is achievable and would have an impact.
Here’s how we might get there. For those of us who are involved in the training of new dermatologists, we have to “lean forward.” Instead of receiving those who choose to come to us, we have to reach out to them. We have to engage, mentor, and ask questions. Find out about hidden bias, your own and others. Understand how your organization or institution can be enriched by having a more diverse pool of learners and leaders.
For those of you who are in practice, there is something you can do as well: You can plant a seed. You all see young people with skin problems. Many of them are and will be from underrepresented populations. Some of them may strike you as particularly bright and lively. So when you have the opportunity to talk to such a bright young woman or young man, ask, “Have you ever thought about becoming a doctor?” And if that strikes a spark, ask, “Have you thought about becoming a dermatologist?” Do this twice a day, 10 times a week, and 500 times each year.
If you do only that, whenever you have an opportunity, you may just plant a few seeds that will make a difference down the line. You will never know the outcome, but it’s worth doing. There’s no downside.
For those of you who are involved in organizations such as the American Academy of Dermatology or the Dermatology Foundation, what can the leadership in our field do? Think about mentorship, role models, scholarships, outreach, and pipeline programs. Think about recruiting colleagues who are UIMs into leadership positions. Let’s be the most inclusive specialty in medicine.
Ultimately, our goal is to have a workforce that mirrors our population. I know this is not achievable in the short term. It will take decades. But this will never occur if we don’t take the first step. To ensure the future of dermatology, let’s all lean forward and embrace this task. Diversity matters in medicine.
A board-certified dermatologist, Dr. Bruce U. Wintroub is interim dean of the University of California, San Francisco School of Medicine. He has been professor and chair of the department of dermatology at UCSF since 1985. This text was extracted from a plenary presentation he delivered at the 2015 annual meeting of the American Academy of Dermatology meeting in San Francisco.
As a profession, I think it’s fair to say that dermatology has done a good job welcoming women and including them into this field of medicine. But how many of your physician colleagues are African Americans? How many are Latinos or Latinas?
Does the diversity of your clinician colleagues reflect our patient population? The 2013 census shows that 13.2% of Americans are African American and 17.1% are Latino. Because these populations are not represented in medicine at anything like these percentages, African American and Latino physicians are referred to as underrepresented in medicine (UIM).
A brochure for an upcoming medical conference states that by 2050, “half of the U.S. population will have skin of color.” This may well become a fact. But I argue that a professional workforce that is as diverse as the population we care for is a much better workforce.
I serve as the interim dean of the University of California, San Francisco (UCSF) School of Medicine, which is one of the great medical schools in the United States. The school has 632 students – 26% from underrepresented minorities, and 56% women – the most diverse student group in California and perhaps the United States. There are 2,180 full-time faculty members but less than 2% are underrepresented in medicine. The annual operating budget is more than $2 billion and the school is No. 1 in National Institutes of Health funding. But there are some important shortcomings.
Three things happened after I took the job as interim dean last year. First, the accrediting body of medical schools, the Liaison Committee on Medical Education, served us with a citation for our hiring practices and the lack of diversity among our faculty.
Second, I ran into something called the “climate survey.” We have all heard about climate change, but have you heard of a “climate survey”? No, it’s not an opportunity to complain about too much snow in Boston and too little water in San Francisco. People on every University of California campus were asked if they felt included in the organization that they worked in. Did they feel comfortable? Did they feel part of the club?
The UC survey found that at UCSF and its sister institutions, people from groups underrepresented in medicine – mainly Hispanics and African Americans, whether they were faculty, staff, or students – felt less comfortable than did their white counterparts. They did not feel our climate was inclusive. That’s not the same as being specifically excluded. It’s about not being included.
Third, there were the racially charged events in Ferguson, Missouri, and in Staten Island, New York, and the way our students responded to them. On December 9, 2014, our students organized a “die-in” protest to demonstrate their concern about racism in health care in our country. They called it WhiteCoats4BlackLives. So here I was, the dean of a medical school, and I find all of our students lying down in the street on campus in a very peaceful but profoundly moving demonstration to protest racism. Not only did our students protest at UCSF, they instigated the same WhiteCoats4BlackLives protest simultaneously at 83 medical schools across the country.
I recalled my own student days when we protested public events, and university administrators responded. But this time, as dean of medicine, I was the administrator. It gave me pause to think: What did those three pieces of evidence tell me? They made it clear that race matters. Once that realization finally became clear to me, the question was, what do we do? We were a few weeks away from our annual leadership retreat. The topic was going to be “strategic partnerships.” I sat down with the vice deans and said: Let’s talk about race instead.
And we did, and it turned into an amazing discussion. Just one example: Before the retreat, all of us took the Implicit Associations Test for race. This is a test designed to detect unconscious bias, the kind of bias we are not even aware of. Like me, many of us who considered ourselves fair and unbiased were shocked at the results. We were unconsciously biased for white people and against people of color.
Nicholas Kristof talked about this in the Feb. 21, 2015, edition of The New York Times, in a piece called “Straight Talk for White Men.” It’s worth reading the whole piece, but a study he cited especially struck me. Two scholars sent out fictitious résumés in response to help-wanted ads. Each résumé was given a name that sounded stereotypically black or white. The résumés were otherwise the same.
A résumé with a name like Emily or Greg received 50% more callbacks than the same résumé with a name like Lakisha or Jamal. Having a white-sounding name was more beneficial than 8 years’ work experience.
We heard stories from our students and faculty of color. I will highlight two. A medical student of color was called to the ED and was stopped by a nurse who thought he was a custodian. A senior faculty member was returning to his alma mater medical school in North Carolina as a visiting professor and was traveling from the airport to the medical school in a rental car. He was stopped and detained because he was black. His hosts came to his rescue and were required to prove that he was indeed visiting at their invitation. Needless to say these and other stories were startling in 2015. America is not post racial.
As a result of the retreat, we are now finishing a plan to make UCSF an inclusive institution for all who work here. The plan includes both short- and long-term elements, and an investment of at least $10 million to recruit and develop faculty from populations that are underrepresented in medicine.
Today’s doctor-patient relationship has become more and more collaborative. Patients actively look for doctors whom they feel they can talk to, who will understand their special concerns, their background, and their culture. There is neuroscience behind this. Research by Mahzarin Banaji, the coauthor of “Blind Spot,” found that we are in fact wired to react more positively to someone who looks like us.
All of us probably understand why a woman might want to choose a female gynecologist. Why a Chinese family will prefer a doctor who speaks their language. Our patients, too, are looking for physicians, for dermatologists, whose skin reflects theirs. They feel better if their doctor looks more like them.
The website Blackdermatologists.org is meant to help patients find exactly that. Guess how many black dermatologists are listed there in the whole State of California. Three. None of them are in San Francisco. None of them are across the bay in Oakland, a city with a large African American population. I did some research via other websites and found one African American dermatologist in the East Bay.
It’s one thing to be underrepresented in medicine, it’s another thing to be unrepresented. The lack of access to a physician who looks like our patients, whose background and experience might reflect theirs, is crucial. But what about the lack of research focused on African Americans, Latinos, and other underrepresented populations by people who understand the culture from the inside and what questions to ask?
I came across such an example in JAMA Dermatology, in an study titled, “Hair Care Practices as a Barrier to Physical Activity in African American Women” (JAMA Dermatol. 2013;149:310-4). My first reaction to this article was “what?” But that’s my unconscious bias talking. In fact, this study points to something significant. We know regular exercise is important for health. Research shows that African American women are the least likely to meet recommended levels of physical activity. Therefore, we want to be aware of any barriers to exercise for that population. But who would have imagined that one of the barriers to exercise for black women was hair care? This never would have occurred to me.
The people who did think to investigate this were in a team led by and including African American women dermatologists and researchers. So now that this is a known barrier, it can be addressed with patients. This is just one example of the type of knowledge we gain if we have a more diverse group of physicians and clinical researchers.
We know we don’t have enough practicing physicians of color in medicine in general, and in dermatology in particular. We easily fall back to the pipeline as the excuse for the situation. So, let’s look at the pipeline. Unfortunately, the current numbers are not encouraging. According to data from the Association of American Medical Colleges, from 1980 to 2013 the number of applicants to U.S. medical schools rose by 4,296. In 1980, 2,507 applicants were African American/black (7.1%), but by 2013 that number only rose to 3,490 (8.8%). During that same time period the number of Hispanic/Latino applicants rose from 5% to 10%.
How many of the applicants entered medical school? From 1980 to 2013 the number of African American/black students rose by 235: from 999 to 1,234, or 6.5% to 7%. At the same time, Hispanic/Latino students rose from 5.2% to 10.6% of entering students.
How many of the applicants matriculated? In 1980, 39.4% of African American/black applicants matriculated, but in 2013 the rate fell to 35%. What explains the data? Lack of role models? Lack of qualifications? Unconscious bias? An exclusive climate? Continued racism in our country? I don’t pretend to know the answer, but we always fall back on the pipeline as the excuse for the situation. So, what are we going to do about the pipeline?
Given the current state of the pipeline, the question may not be “what is the ideal” but “what is an achievable goal for dermatology?” In 2014, 47 of 731 applicants to dermatology programs were African American and another 47 were Latino. I don’t know how many of these finally matched, but only 6.4% of the applicants were either African American or Latino. This is well below their representation in the population at large.
There may be many reasons why physicians of color are not choosing dermatology as a specialty. Not surprisingly, many of them go into primary care. There is nothing wrong with that. You could argue that having African American and Latino doctors in primary care is where they are most needed, where personal relationships are most crucial. But that should not be an argument against trying to improve the general pipeline and diversify our own specialty pipeline. One goal could be to double the annual number of UIM applicants. I think this is achievable and would have an impact.
Here’s how we might get there. For those of us who are involved in the training of new dermatologists, we have to “lean forward.” Instead of receiving those who choose to come to us, we have to reach out to them. We have to engage, mentor, and ask questions. Find out about hidden bias, your own and others. Understand how your organization or institution can be enriched by having a more diverse pool of learners and leaders.
For those of you who are in practice, there is something you can do as well: You can plant a seed. You all see young people with skin problems. Many of them are and will be from underrepresented populations. Some of them may strike you as particularly bright and lively. So when you have the opportunity to talk to such a bright young woman or young man, ask, “Have you ever thought about becoming a doctor?” And if that strikes a spark, ask, “Have you thought about becoming a dermatologist?” Do this twice a day, 10 times a week, and 500 times each year.
If you do only that, whenever you have an opportunity, you may just plant a few seeds that will make a difference down the line. You will never know the outcome, but it’s worth doing. There’s no downside.
For those of you who are involved in organizations such as the American Academy of Dermatology or the Dermatology Foundation, what can the leadership in our field do? Think about mentorship, role models, scholarships, outreach, and pipeline programs. Think about recruiting colleagues who are UIMs into leadership positions. Let’s be the most inclusive specialty in medicine.
Ultimately, our goal is to have a workforce that mirrors our population. I know this is not achievable in the short term. It will take decades. But this will never occur if we don’t take the first step. To ensure the future of dermatology, let’s all lean forward and embrace this task. Diversity matters in medicine.
A board-certified dermatologist, Dr. Bruce U. Wintroub is interim dean of the University of California, San Francisco School of Medicine. He has been professor and chair of the department of dermatology at UCSF since 1985. This text was extracted from a plenary presentation he delivered at the 2015 annual meeting of the American Academy of Dermatology meeting in San Francisco.

To drink or not to drink – What do you tell your patients?
It has been more than 40 years since fetal alcohol syndrome was first recognized as a brain disorder leading to a wide range of learning and behavior problems – fetal alcohol spectrum disorders – in children prenatally exposed to alcohol.
Over that time, obstetric providers have played a key role in counseling patients, both preconception and during pregnancy, about the risks associated with various amounts and patterns of alcohol consumption. This advice is critical as about half of women of reproductive age in the United States consume some alcohol, and about half of pregnancies are not planned, leading to a high prevalence of exposure to alcohol prior to pregnancy recognition.

But how much alcohol at what specific time in early pregnancy leads to a known risk of learning and behavior problems as children reach school age?
The U.S. Surgeon General’s Office and the Centers for Disease Control and Prevention recommend that alcohol be avoided entirely during all weeks of pregnancy, as there is no known safe amount, type of beverage, or timing in gestation that a woman can consume alcohol. However, in recent years, a number of publications have suggested that “low to moderate” alcohol consumption in pregnancy is not demonstrably harmful to the developing fetus, at least in terms of learning ability.
Three recently published studies exemplify the dilemma. Colleen M. O’Leary et. al. examined educational achievement in 8- to 9-year olds in Western Australia (Pediatrics 2013;132:e468-75). The sample was a population-based cohort of 4,056 infants randomly ascertained with births between 1995 and 1997 whose mothers had responded to a postnatal survey about health behaviors including alcohol consumption. Researchers linked these infants to a midwives database to obtain birth details and to an educational testing database to obtain measures of school achievement.

Children were not evaluated for the physical features or a diagnosis of FAS or something on the FASD spectrum. Low alcohol consumption was defined as 1-2 standard drinks (10 g alcohol per standard drink in Australia) per occasion and fewer than 7 drinks per week. Moderate alcohol consumption was defined as 3-4 standard drinks per occasion and no more than 7 drinks per week. Binge drinking was defined as 5 or more drinks per occasion less frequently than weekly, and heavy drinking was defined as more than 7 standard drinks per week including binge drinking weekly or more often.
Underachievement in reading and writing was significantly associated with either heavy first trimester or binge drinking in late pregnancy. However, achievement in numeracy, reading, spelling and writing was not significantly impaired with low to moderate prenatal alcohol exposure.
In a study of a sample derived from the Danish National Birth Cohort, 1,628 women and their children were sampled from the original cohort based on maternal alcohol drinking patterns reported in pregnancy (BJOG 2012;119:1191-1200). The child’s IQ was assessed at 5 years of age.
Children were not specifically evaluated for the physical features of FAS or a diagnosis of something on the FASD spectrum. Levels of alcohol consumption were categorized as none, average intake of 1-4 standard drinks per week (12 g alcohol per standard drink in Denmark), 5-8 standard drinks per week, and more than 8 standard drinks per week. There were no differences in the performance of children whose mothers consumed up to 8 standard drinks per week at some point in pregnancy compared to children whose mothers abstained.
In a subsequently published study in which researchers used the same sample, the parent and teacher versions of the Strengths and Difficulties Questionnaire, a standard behavioral screening tool, were completed by the mothers and the preschool teachers (BJOG 2013;120:1042-50). After adjustment for confounders, overall there were no significant associations found for any drinking category compared to abstainers.
Many experts asked to comment on these findings emphasized that these studies were limited to a few measures of learning and behavior in young children that may not be reflective of the range of alcohol-related developmental effects. They also pointed out the great difficulty in obtaining an accurate report of alcohol exposure in the absence of a sensitive and specific biomarker.
For example, recall of specific quantities, frequencies, and timing of alcohol consumption either after delivery (the Australian study) or in a single prenatal interview that was conducted sometime between 7 and 39 weeks’ gestation (the Danish study) may be inaccurate. This could be because of difficulty in remembering these details, as well as the influence of the social unacceptability of drinking during pregnancy.
However, as emphasized in the conclusions drawn by both research teams, negative findings for low to moderate alcohol exposure should not be overinterpreted to represent a finding of no risk for this type of exposure. The data are clear that heavy prenatal alcohol exposure, and in particular binge drinking, pose substantial risks for alcohol-related problems, including cognitive and behavioral deficits.
Decades of research have also demonstrated that there is large variability in individual susceptibility to the effects of prenatal alcohol. In addition to the alcohol itself, alcohol metabolizing genotype, maternal age, socioeconomic status, nutrition, and other factors likely play a role in modifying or mediating the effects for the individual mother and her child.
Since obstetric providers and their patients cannot know who is most susceptible, the current CDC and Surgeon General’s recommendations are the most prudent.
Dr. Chambers is professor of pediatrics and director of clinical research at Rady Children’s Hospital, and associate director of the Clinical and Translational Research Institute at the University of California, San Diego. She is director of MotherToBaby California, past president of the Organization of Teratology Information Specialists, and past president of the Teratology Society. She has no relevant financial disclosures. To comment, e-mail her at obnews@frontlinemedcom.com.
It has been more than 40 years since fetal alcohol syndrome was first recognized as a brain disorder leading to a wide range of learning and behavior problems – fetal alcohol spectrum disorders – in children prenatally exposed to alcohol.
Over that time, obstetric providers have played a key role in counseling patients, both preconception and during pregnancy, about the risks associated with various amounts and patterns of alcohol consumption. This advice is critical as about half of women of reproductive age in the United States consume some alcohol, and about half of pregnancies are not planned, leading to a high prevalence of exposure to alcohol prior to pregnancy recognition.
But how much alcohol at what specific time in early pregnancy leads to a known risk of learning and behavior problems as children reach school age?
The U.S. Surgeon General’s Office and the Centers for Disease Control and Prevention recommend that alcohol be avoided entirely during all weeks of pregnancy, as there is no known safe amount, type of beverage, or timing in gestation that a woman can consume alcohol. However, in recent years, a number of publications have suggested that “low to moderate” alcohol consumption in pregnancy is not demonstrably harmful to the developing fetus, at least in terms of learning ability.
Three recently published studies exemplify the dilemma. Colleen M. O’Leary et. al. examined educational achievement in 8- to 9-year olds in Western Australia (Pediatrics 2013;132:e468-75). The sample was a population-based cohort of 4,056 infants randomly ascertained with births between 1995 and 1997 whose mothers had responded to a postnatal survey about health behaviors including alcohol consumption. Researchers linked these infants to a midwives database to obtain birth details and to an educational testing database to obtain measures of school achievement.
Children were not evaluated for the physical features or a diagnosis of FAS or something on the FASD spectrum. Low alcohol consumption was defined as 1-2 standard drinks (10 g alcohol per standard drink in Australia) per occasion and fewer than 7 drinks per week. Moderate alcohol consumption was defined as 3-4 standard drinks per occasion and no more than 7 drinks per week. Binge drinking was defined as 5 or more drinks per occasion less frequently than weekly, and heavy drinking was defined as more than 7 standard drinks per week including binge drinking weekly or more often.
Underachievement in reading and writing was significantly associated with either heavy first trimester or binge drinking in late pregnancy. However, achievement in numeracy, reading, spelling and writing was not significantly impaired with low to moderate prenatal alcohol exposure.
In a study of a sample derived from the Danish National Birth Cohort, 1,628 women and their children were sampled from the original cohort based on maternal alcohol drinking patterns reported in pregnancy (BJOG 2012;119:1191-1200). The child’s IQ was assessed at 5 years of age.
Children were not specifically evaluated for the physical features of FAS or a diagnosis of something on the FASD spectrum. Levels of alcohol consumption were categorized as none, average intake of 1-4 standard drinks per week (12 g alcohol per standard drink in Denmark), 5-8 standard drinks per week, and more than 8 standard drinks per week. There were no differences in the performance of children whose mothers consumed up to 8 standard drinks per week at some point in pregnancy compared to children whose mothers abstained.
In a subsequently published study in which researchers used the same sample, the parent and teacher versions of the Strengths and Difficulties Questionnaire, a standard behavioral screening tool, were completed by the mothers and the preschool teachers (BJOG 2013;120:1042-50). After adjustment for confounders, overall there were no significant associations found for any drinking category compared to abstainers.
Many experts asked to comment on these findings emphasized that these studies were limited to a few measures of learning and behavior in young children that may not be reflective of the range of alcohol-related developmental effects. They also pointed out the great difficulty in obtaining an accurate report of alcohol exposure in the absence of a sensitive and specific biomarker.
For example, recall of specific quantities, frequencies, and timing of alcohol consumption either after delivery (the Australian study) or in a single prenatal interview that was conducted sometime between 7 and 39 weeks’ gestation (the Danish study) may be inaccurate. This could be because of difficulty in remembering these details, as well as the influence of the social unacceptability of drinking during pregnancy.
However, as emphasized in the conclusions drawn by both research teams, negative findings for low to moderate alcohol exposure should not be overinterpreted to represent a finding of no risk for this type of exposure. The data are clear that heavy prenatal alcohol exposure, and in particular binge drinking, pose substantial risks for alcohol-related problems, including cognitive and behavioral deficits.
Decades of research have also demonstrated that there is large variability in individual susceptibility to the effects of prenatal alcohol. In addition to the alcohol itself, alcohol metabolizing genotype, maternal age, socioeconomic status, nutrition, and other factors likely play a role in modifying or mediating the effects for the individual mother and her child.
Since obstetric providers and their patients cannot know who is most susceptible, the current CDC and Surgeon General’s recommendations are the most prudent.
Dr. Chambers is professor of pediatrics and director of clinical research at Rady Children’s Hospital, and associate director of the Clinical and Translational Research Institute at the University of California, San Diego. She is director of MotherToBaby California, past president of the Organization of Teratology Information Specialists, and past president of the Teratology Society. She has no relevant financial disclosures. To comment, e-mail her at obnews@frontlinemedcom.com.
It has been more than 40 years since fetal alcohol syndrome was first recognized as a brain disorder leading to a wide range of learning and behavior problems – fetal alcohol spectrum disorders – in children prenatally exposed to alcohol.
Over that time, obstetric providers have played a key role in counseling patients, both preconception and during pregnancy, about the risks associated with various amounts and patterns of alcohol consumption. This advice is critical as about half of women of reproductive age in the United States consume some alcohol, and about half of pregnancies are not planned, leading to a high prevalence of exposure to alcohol prior to pregnancy recognition.
But how much alcohol at what specific time in early pregnancy leads to a known risk of learning and behavior problems as children reach school age?
The U.S. Surgeon General’s Office and the Centers for Disease Control and Prevention recommend that alcohol be avoided entirely during all weeks of pregnancy, as there is no known safe amount, type of beverage, or timing in gestation that a woman can consume alcohol. However, in recent years, a number of publications have suggested that “low to moderate” alcohol consumption in pregnancy is not demonstrably harmful to the developing fetus, at least in terms of learning ability.
Three recently published studies exemplify the dilemma. Colleen M. O’Leary et. al. examined educational achievement in 8- to 9-year olds in Western Australia (Pediatrics 2013;132:e468-75). The sample was a population-based cohort of 4,056 infants randomly ascertained with births between 1995 and 1997 whose mothers had responded to a postnatal survey about health behaviors including alcohol consumption. Researchers linked these infants to a midwives database to obtain birth details and to an educational testing database to obtain measures of school achievement.
Children were not evaluated for the physical features or a diagnosis of FAS or something on the FASD spectrum. Low alcohol consumption was defined as 1-2 standard drinks (10 g alcohol per standard drink in Australia) per occasion and fewer than 7 drinks per week. Moderate alcohol consumption was defined as 3-4 standard drinks per occasion and no more than 7 drinks per week. Binge drinking was defined as 5 or more drinks per occasion less frequently than weekly, and heavy drinking was defined as more than 7 standard drinks per week including binge drinking weekly or more often.
Underachievement in reading and writing was significantly associated with either heavy first trimester or binge drinking in late pregnancy. However, achievement in numeracy, reading, spelling and writing was not significantly impaired with low to moderate prenatal alcohol exposure.
In a study of a sample derived from the Danish National Birth Cohort, 1,628 women and their children were sampled from the original cohort based on maternal alcohol drinking patterns reported in pregnancy (BJOG 2012;119:1191-1200). The child’s IQ was assessed at 5 years of age.
Children were not specifically evaluated for the physical features of FAS or a diagnosis of something on the FASD spectrum. Levels of alcohol consumption were categorized as none, average intake of 1-4 standard drinks per week (12 g alcohol per standard drink in Denmark), 5-8 standard drinks per week, and more than 8 standard drinks per week. There were no differences in the performance of children whose mothers consumed up to 8 standard drinks per week at some point in pregnancy compared to children whose mothers abstained.
In a subsequently published study in which researchers used the same sample, the parent and teacher versions of the Strengths and Difficulties Questionnaire, a standard behavioral screening tool, were completed by the mothers and the preschool teachers (BJOG 2013;120:1042-50). After adjustment for confounders, overall there were no significant associations found for any drinking category compared to abstainers.
Many experts asked to comment on these findings emphasized that these studies were limited to a few measures of learning and behavior in young children that may not be reflective of the range of alcohol-related developmental effects. They also pointed out the great difficulty in obtaining an accurate report of alcohol exposure in the absence of a sensitive and specific biomarker.
For example, recall of specific quantities, frequencies, and timing of alcohol consumption either after delivery (the Australian study) or in a single prenatal interview that was conducted sometime between 7 and 39 weeks’ gestation (the Danish study) may be inaccurate. This could be because of difficulty in remembering these details, as well as the influence of the social unacceptability of drinking during pregnancy.
However, as emphasized in the conclusions drawn by both research teams, negative findings for low to moderate alcohol exposure should not be overinterpreted to represent a finding of no risk for this type of exposure. The data are clear that heavy prenatal alcohol exposure, and in particular binge drinking, pose substantial risks for alcohol-related problems, including cognitive and behavioral deficits.
Decades of research have also demonstrated that there is large variability in individual susceptibility to the effects of prenatal alcohol. In addition to the alcohol itself, alcohol metabolizing genotype, maternal age, socioeconomic status, nutrition, and other factors likely play a role in modifying or mediating the effects for the individual mother and her child.
Since obstetric providers and their patients cannot know who is most susceptible, the current CDC and Surgeon General’s recommendations are the most prudent.
Dr. Chambers is professor of pediatrics and director of clinical research at Rady Children’s Hospital, and associate director of the Clinical and Translational Research Institute at the University of California, San Diego. She is director of MotherToBaby California, past president of the Organization of Teratology Information Specialists, and past president of the Teratology Society. She has no relevant financial disclosures. To comment, e-mail her at obnews@frontlinemedcom.com.

Are your patients vaccinated for travel?
Graduation season is rapidly approaching, with high school graduations, followed by summer vacations. While searching for that unique gift and /or summer experience, many of your patients may choose an international destination. Not to be forgotten are those who might travel to resource-limited areas to visit relatives, volunteer, or have extended stays because of parental job relocation. More U.S. high school graduates are participating in gap year programs, many of which involve extensive travel while providing the participant the opportunity to immerse and to actively participate in other cultures. For many, it may be their first experience in a country with poor hygiene. This week alone, I’ve helped prepare travelers, including adolescents and children, for a safari and one for 4 weeks of volunteerism in Tanzania. Another young traveler’s destinations were Rwanda, Uganda, and Kenya, and a fourth is planning to explore and trek regions in the high elevations of Bolivia and Peru. The question is, Will you be ready to help prepare young travelers to stay healthy and return home without any unwanted souvenirs?
For many, health concerns often are not the top priority when they are planning vacations. However, the primary care physician will most likely will be their initial call and resource once they realize their potential to be exposed to diseases and/or conditions not routinely encountered in the United States. Even if you receive the call late, there are still interventions you can provide.

To avoid that last-minute call, develop strategies to identify international travelers in your practice. Many practices send out reminders yearly for influenza and well visits, so consider developing one for international travel. Text-message reminders have been shown to improve influenza vaccine administration rates and are another form of communication that can be considered. Frequently remind families that if planning international travel, they should seek pretravel advice in a timely manner: Ideally advice should be obtained 4-6 weeks in advance, and definitely at least 2 weeks prior to departure. Remind them that adequate time is needed for the vaccine to become effective. In addition, depending on the patients’ destination, trip duration, and type of activity, two vaccines (rabies and Japanese encephalitis) may be recommended and are administered over a 28-day period. Yellow fever vaccine, which is recommended or required for entry into some countries, can be obtained only at centers designated by each state health department. It should be administered at least 10 days prior to travel.
Vaccine interventions are based on the potential risk for disease exposure/acquisition. Factors to consider include the age of the travelers, their health and immunization status, in addition to their destination, duration of stay, accommodations, activities, and reason for travel (such as business or visiting friends and relatives). If you have a child with a chronic disorder or who is immunocompromised, comparable medical care may not be available at all international destinations. In addition, not everyone may be a candidate to receive some recommended or required vaccines. Involvement with a health professional prior to booking the trip would be advisable.
Identify a travel health specialist in your area as a local resource who can provide the most up-to-date information and recommendations. Ensure that individual is willing to see children of all ages.
Make sure routine immunizations are up to date for age. Measles is the one exception. I know you have heard it before, but outbreaks persist, even in the United States. Travelers 6- to 11-months-old should receive one MMR dose prior to international travel. This dose will not count, so these children should receive two additional doses of vaccine once they are at least 1 year old. Many children travel with adults. All travelers at least 12 months of age and born after 1956 should have two documented doses of MMR prior to international travel unless they have serologic evidence of immunity. The second dose can be given as early as 4 weeks after the first. If two doses at least 4 weeks apart are administered when a child is at least 12 months of age, no additional doses are necessary.
In 2014, there were 668 cases of measles from 27 states in the United States. The United States is still experiencing a multistate outbreak of measles at press time, which began December 2014. As of April 24, 2015, 166 cases have been reported from 19 states. The Centers for Disease Control and Prevention analyzed the virus type (B3). It is identical to the one responsible for the outbreak in the Philippines in 2014, and it has now been identified in 14 other countries.
Most U.S. measles cases occur in unvaccinated travelers who become ill after their return and spread the disease to susceptible individuals. Do you have patients who are unimmunized? Another point to consider when speaking with these parents about travel is the potential loss of the herd immunity afforded their children while living in the United States. This benefit may not exist when they are visiting and/or relocating to countries with lower immunization rates. Measles outbreaks are occurring in multiple countries and are not limited to underdeveloped countries. For the most up-to-date travel health-related information from the CDC, click here.
Travelers’ diarrhea (TD) occurs in up to 70 % of travelers to developing countries. The World Health Organization defines it as passage of at least three loose stools in a 24-hour period. Most often it is self-limited, with symptoms lasting a median of 3-4 days. Although TD can be caused by bacteria, protozoa, and viruses, bacteria are usually the etiology, with enterotoxigenic Escherichia coli being the most common pathogens. Other bacterial etiologies include Shigella and Campylobacter species. Two antimicrobials are frequently prescribed to travelers for self-treatment of TD: ciprofloxacin and azithromycin. Most young children are prescribed the latter; however, in older children, ciprofloxacin may be prescribed off label, as its use in persons younger than 18 years is not approved by the Food and Drug Administration.
In December 2014, PulseNet, the national molecular subtyping network for food-borne disease, detected a multistate cluster of ciprofloxacin-resistant Shigella sonnei. Between May 2014 and February 2015, 157 cases including 37 children were detected in 32 states and Puerto Rico. Nine of the cases identified by PulseNet, and an additional 76 cases, were associated with an outbreak of ciprofloxacin-resistant S. sonnei in San Francisco. Antibiotic susceptibility was available for 126 isolates, of which 109 (87%) were not ciprofloxacin susceptible. Travel history was available for 75 patients not associated with the San Francisco outbreak, and slightly more than half (40) were associated with international travel. The island of Hispaniola (Dominican Republic = 22 cases and Haiti = 4 cases) was the most common destination, followed by India (8 cases) and Morocco (3 cases). The remaining destinations were Asia and Europe (MMWR 2015;64:318-20) Travel history was available and positive for 23 of the 37 children (62%).
Why such a concern? International travelers are at risk of becoming colonized with drug-resistant bacteria and have the potential to spread them domestically. It has already begun. In 2012, the National Antimicrobial Resistance Monitoring System (NARMS) revealed that isolates of S. sonnei had the following resistance pattern: trimethoprim/sulfamethoxazole, 42%; ampicillin, 18%; and ciprofloxacin, 2.1%. During this outbreak, 19 of the 126 isolates were tested by NARMS with the following resistance patterns noted: trimethoprim/sulfamethoxazole, 84%; ampicillin, 5%; and ciprofloxacin, 32%.
More judicious use of antibiotics is necessary. As pediatricians, we are not immune to this issue. The challenge is when, if at all, antibiotics should be prescribed for TD, and under what conditions should patients be instructed to use them. I’m rethinking my own practice. TD is one of the most common illnesses travelers acquire and is easily treated, but at what cost? The one expression I keep hearing myself say is, First do no harm.
Dr. Word is a pediatric infectious disease specialist and director of the Houston Travel Medicine Clinic. She had no relevant financial disclosures.
Graduation season is rapidly approaching, with high school graduations, followed by summer vacations. While searching for that unique gift and /or summer experience, many of your patients may choose an international destination. Not to be forgotten are those who might travel to resource-limited areas to visit relatives, volunteer, or have extended stays because of parental job relocation. More U.S. high school graduates are participating in gap year programs, many of which involve extensive travel while providing the participant the opportunity to immerse and to actively participate in other cultures. For many, it may be their first experience in a country with poor hygiene. This week alone, I’ve helped prepare travelers, including adolescents and children, for a safari and one for 4 weeks of volunteerism in Tanzania. Another young traveler’s destinations were Rwanda, Uganda, and Kenya, and a fourth is planning to explore and trek regions in the high elevations of Bolivia and Peru. The question is, Will you be ready to help prepare young travelers to stay healthy and return home without any unwanted souvenirs?
For many, health concerns often are not the top priority when they are planning vacations. However, the primary care physician will most likely will be their initial call and resource once they realize their potential to be exposed to diseases and/or conditions not routinely encountered in the United States. Even if you receive the call late, there are still interventions you can provide.
To avoid that last-minute call, develop strategies to identify international travelers in your practice. Many practices send out reminders yearly for influenza and well visits, so consider developing one for international travel. Text-message reminders have been shown to improve influenza vaccine administration rates and are another form of communication that can be considered. Frequently remind families that if planning international travel, they should seek pretravel advice in a timely manner: Ideally advice should be obtained 4-6 weeks in advance, and definitely at least 2 weeks prior to departure. Remind them that adequate time is needed for the vaccine to become effective. In addition, depending on the patients’ destination, trip duration, and type of activity, two vaccines (rabies and Japanese encephalitis) may be recommended and are administered over a 28-day period. Yellow fever vaccine, which is recommended or required for entry into some countries, can be obtained only at centers designated by each state health department. It should be administered at least 10 days prior to travel.
Vaccine interventions are based on the potential risk for disease exposure/acquisition. Factors to consider include the age of the travelers, their health and immunization status, in addition to their destination, duration of stay, accommodations, activities, and reason for travel (such as business or visiting friends and relatives). If you have a child with a chronic disorder or who is immunocompromised, comparable medical care may not be available at all international destinations. In addition, not everyone may be a candidate to receive some recommended or required vaccines. Involvement with a health professional prior to booking the trip would be advisable.
Identify a travel health specialist in your area as a local resource who can provide the most up-to-date information and recommendations. Ensure that individual is willing to see children of all ages.
Make sure routine immunizations are up to date for age. Measles is the one exception. I know you have heard it before, but outbreaks persist, even in the United States. Travelers 6- to 11-months-old should receive one MMR dose prior to international travel. This dose will not count, so these children should receive two additional doses of vaccine once they are at least 1 year old. Many children travel with adults. All travelers at least 12 months of age and born after 1956 should have two documented doses of MMR prior to international travel unless they have serologic evidence of immunity. The second dose can be given as early as 4 weeks after the first. If two doses at least 4 weeks apart are administered when a child is at least 12 months of age, no additional doses are necessary.
In 2014, there were 668 cases of measles from 27 states in the United States. The United States is still experiencing a multistate outbreak of measles at press time, which began December 2014. As of April 24, 2015, 166 cases have been reported from 19 states. The Centers for Disease Control and Prevention analyzed the virus type (B3). It is identical to the one responsible for the outbreak in the Philippines in 2014, and it has now been identified in 14 other countries.
Most U.S. measles cases occur in unvaccinated travelers who become ill after their return and spread the disease to susceptible individuals. Do you have patients who are unimmunized? Another point to consider when speaking with these parents about travel is the potential loss of the herd immunity afforded their children while living in the United States. This benefit may not exist when they are visiting and/or relocating to countries with lower immunization rates. Measles outbreaks are occurring in multiple countries and are not limited to underdeveloped countries. For the most up-to-date travel health-related information from the CDC, click here.
Travelers’ diarrhea (TD) occurs in up to 70 % of travelers to developing countries. The World Health Organization defines it as passage of at least three loose stools in a 24-hour period. Most often it is self-limited, with symptoms lasting a median of 3-4 days. Although TD can be caused by bacteria, protozoa, and viruses, bacteria are usually the etiology, with enterotoxigenic Escherichia coli being the most common pathogens. Other bacterial etiologies include Shigella and Campylobacter species. Two antimicrobials are frequently prescribed to travelers for self-treatment of TD: ciprofloxacin and azithromycin. Most young children are prescribed the latter; however, in older children, ciprofloxacin may be prescribed off label, as its use in persons younger than 18 years is not approved by the Food and Drug Administration.
In December 2014, PulseNet, the national molecular subtyping network for food-borne disease, detected a multistate cluster of ciprofloxacin-resistant Shigella sonnei. Between May 2014 and February 2015, 157 cases including 37 children were detected in 32 states and Puerto Rico. Nine of the cases identified by PulseNet, and an additional 76 cases, were associated with an outbreak of ciprofloxacin-resistant S. sonnei in San Francisco. Antibiotic susceptibility was available for 126 isolates, of which 109 (87%) were not ciprofloxacin susceptible. Travel history was available for 75 patients not associated with the San Francisco outbreak, and slightly more than half (40) were associated with international travel. The island of Hispaniola (Dominican Republic = 22 cases and Haiti = 4 cases) was the most common destination, followed by India (8 cases) and Morocco (3 cases). The remaining destinations were Asia and Europe (MMWR 2015;64:318-20) Travel history was available and positive for 23 of the 37 children (62%).
Why such a concern? International travelers are at risk of becoming colonized with drug-resistant bacteria and have the potential to spread them domestically. It has already begun. In 2012, the National Antimicrobial Resistance Monitoring System (NARMS) revealed that isolates of S. sonnei had the following resistance pattern: trimethoprim/sulfamethoxazole, 42%; ampicillin, 18%; and ciprofloxacin, 2.1%. During this outbreak, 19 of the 126 isolates were tested by NARMS with the following resistance patterns noted: trimethoprim/sulfamethoxazole, 84%; ampicillin, 5%; and ciprofloxacin, 32%.
More judicious use of antibiotics is necessary. As pediatricians, we are not immune to this issue. The challenge is when, if at all, antibiotics should be prescribed for TD, and under what conditions should patients be instructed to use them. I’m rethinking my own practice. TD is one of the most common illnesses travelers acquire and is easily treated, but at what cost? The one expression I keep hearing myself say is, First do no harm.
Dr. Word is a pediatric infectious disease specialist and director of the Houston Travel Medicine Clinic. She had no relevant financial disclosures.
Graduation season is rapidly approaching, with high school graduations, followed by summer vacations. While searching for that unique gift and /or summer experience, many of your patients may choose an international destination. Not to be forgotten are those who might travel to resource-limited areas to visit relatives, volunteer, or have extended stays because of parental job relocation. More U.S. high school graduates are participating in gap year programs, many of which involve extensive travel while providing the participant the opportunity to immerse and to actively participate in other cultures. For many, it may be their first experience in a country with poor hygiene. This week alone, I’ve helped prepare travelers, including adolescents and children, for a safari and one for 4 weeks of volunteerism in Tanzania. Another young traveler’s destinations were Rwanda, Uganda, and Kenya, and a fourth is planning to explore and trek regions in the high elevations of Bolivia and Peru. The question is, Will you be ready to help prepare young travelers to stay healthy and return home without any unwanted souvenirs?
For many, health concerns often are not the top priority when they are planning vacations. However, the primary care physician will most likely will be their initial call and resource once they realize their potential to be exposed to diseases and/or conditions not routinely encountered in the United States. Even if you receive the call late, there are still interventions you can provide.
To avoid that last-minute call, develop strategies to identify international travelers in your practice. Many practices send out reminders yearly for influenza and well visits, so consider developing one for international travel. Text-message reminders have been shown to improve influenza vaccine administration rates and are another form of communication that can be considered. Frequently remind families that if planning international travel, they should seek pretravel advice in a timely manner: Ideally advice should be obtained 4-6 weeks in advance, and definitely at least 2 weeks prior to departure. Remind them that adequate time is needed for the vaccine to become effective. In addition, depending on the patients’ destination, trip duration, and type of activity, two vaccines (rabies and Japanese encephalitis) may be recommended and are administered over a 28-day period. Yellow fever vaccine, which is recommended or required for entry into some countries, can be obtained only at centers designated by each state health department. It should be administered at least 10 days prior to travel.
Vaccine interventions are based on the potential risk for disease exposure/acquisition. Factors to consider include the age of the travelers, their health and immunization status, in addition to their destination, duration of stay, accommodations, activities, and reason for travel (such as business or visiting friends and relatives). If you have a child with a chronic disorder or who is immunocompromised, comparable medical care may not be available at all international destinations. In addition, not everyone may be a candidate to receive some recommended or required vaccines. Involvement with a health professional prior to booking the trip would be advisable.
Identify a travel health specialist in your area as a local resource who can provide the most up-to-date information and recommendations. Ensure that individual is willing to see children of all ages.
Make sure routine immunizations are up to date for age. Measles is the one exception. I know you have heard it before, but outbreaks persist, even in the United States. Travelers 6- to 11-months-old should receive one MMR dose prior to international travel. This dose will not count, so these children should receive two additional doses of vaccine once they are at least 1 year old. Many children travel with adults. All travelers at least 12 months of age and born after 1956 should have two documented doses of MMR prior to international travel unless they have serologic evidence of immunity. The second dose can be given as early as 4 weeks after the first. If two doses at least 4 weeks apart are administered when a child is at least 12 months of age, no additional doses are necessary.
In 2014, there were 668 cases of measles from 27 states in the United States. The United States is still experiencing a multistate outbreak of measles at press time, which began December 2014. As of April 24, 2015, 166 cases have been reported from 19 states. The Centers for Disease Control and Prevention analyzed the virus type (B3). It is identical to the one responsible for the outbreak in the Philippines in 2014, and it has now been identified in 14 other countries.
Most U.S. measles cases occur in unvaccinated travelers who become ill after their return and spread the disease to susceptible individuals. Do you have patients who are unimmunized? Another point to consider when speaking with these parents about travel is the potential loss of the herd immunity afforded their children while living in the United States. This benefit may not exist when they are visiting and/or relocating to countries with lower immunization rates. Measles outbreaks are occurring in multiple countries and are not limited to underdeveloped countries. For the most up-to-date travel health-related information from the CDC, click here.
Travelers’ diarrhea (TD) occurs in up to 70 % of travelers to developing countries. The World Health Organization defines it as passage of at least three loose stools in a 24-hour period. Most often it is self-limited, with symptoms lasting a median of 3-4 days. Although TD can be caused by bacteria, protozoa, and viruses, bacteria are usually the etiology, with enterotoxigenic Escherichia coli being the most common pathogens. Other bacterial etiologies include Shigella and Campylobacter species. Two antimicrobials are frequently prescribed to travelers for self-treatment of TD: ciprofloxacin and azithromycin. Most young children are prescribed the latter; however, in older children, ciprofloxacin may be prescribed off label, as its use in persons younger than 18 years is not approved by the Food and Drug Administration.
In December 2014, PulseNet, the national molecular subtyping network for food-borne disease, detected a multistate cluster of ciprofloxacin-resistant Shigella sonnei. Between May 2014 and February 2015, 157 cases including 37 children were detected in 32 states and Puerto Rico. Nine of the cases identified by PulseNet, and an additional 76 cases, were associated with an outbreak of ciprofloxacin-resistant S. sonnei in San Francisco. Antibiotic susceptibility was available for 126 isolates, of which 109 (87%) were not ciprofloxacin susceptible. Travel history was available for 75 patients not associated with the San Francisco outbreak, and slightly more than half (40) were associated with international travel. The island of Hispaniola (Dominican Republic = 22 cases and Haiti = 4 cases) was the most common destination, followed by India (8 cases) and Morocco (3 cases). The remaining destinations were Asia and Europe (MMWR 2015;64:318-20) Travel history was available and positive for 23 of the 37 children (62%).
Why such a concern? International travelers are at risk of becoming colonized with drug-resistant bacteria and have the potential to spread them domestically. It has already begun. In 2012, the National Antimicrobial Resistance Monitoring System (NARMS) revealed that isolates of S. sonnei had the following resistance pattern: trimethoprim/sulfamethoxazole, 42%; ampicillin, 18%; and ciprofloxacin, 2.1%. During this outbreak, 19 of the 126 isolates were tested by NARMS with the following resistance patterns noted: trimethoprim/sulfamethoxazole, 84%; ampicillin, 5%; and ciprofloxacin, 32%.
More judicious use of antibiotics is necessary. As pediatricians, we are not immune to this issue. The challenge is when, if at all, antibiotics should be prescribed for TD, and under what conditions should patients be instructed to use them. I’m rethinking my own practice. TD is one of the most common illnesses travelers acquire and is easily treated, but at what cost? The one expression I keep hearing myself say is, First do no harm.
Dr. Word is a pediatric infectious disease specialist and director of the Houston Travel Medicine Clinic. She had no relevant financial disclosures.

Using cervical length screening to predict preterm birth
One of the key indicators of a nation’s health is how well it can care for its young. Despite many advances in medical care and improvements in access to care, infant mortality remains a significant concern worldwide. According to the World Health Organization, the leading cause of death among children under age 5 is preterm birth complications. With an estimated 15 million babies born prematurely (prior to 37 weeks’ gestation) globally each year, it is vital for ob.gyns. to uncover ways to predict, diagnose early, and treat the causes of preterm birth.
While the challenges to infant health could be considered more of an issue in developing countries, here in the United States, the Centers for Disease Control and Prevention estimates that 1 in 9 babies is born prematurely. Preterm birth-related causes of death (i.e., breathing and feeding problems and disabilities) accounted for 35% of all infant deaths in 2010.

The World Health Organization (WHO) lists the United States as one of the top 10 countries with the greatest number of preterm births, despite the fact that we spend approximately 17.1% of our gross domestic product in total health care expenditures – the highest rate among our peer nations.
In the April 2014 edition of Master Class, we discussed one of the primary causes of preterm birth, bacterial infections, and specifically the need for ob.gyns. to rigorously screen patients for asymptomatic bacteriuria, which can lead to pyelonephritis. This month, we examine another biologic marker of preterm birth, cervical length.
Seminal studies of transvaginal sonography to measure cervical length during pregnancy and predict premature birth were published more than 2 decades ago. This work showed that a short cervix at 24 and 28 weeks’ gestation predicted preterm birth. Since then, clinical studies have demonstrated the utility of cervical length screening in women with prior preterm pregnancies. In the last decade, three large, randomized human trials have examined the usefulness of universal cervical length screening (Am. J. Obstet. Gynecol. 2012;207:101-6). However, the results of these trials have given practitioners a confusing picture of the predictability of this biologic marker.
Given the complexity of the “to screen or not to screen” issue, we have devoted this Master Class to a discussion on the role of cervical length screening and the prediction of preterm birth. Our guest author this month is Dr. Erika Werner, an assistant professor in ob.gyn (maternal-fetal medicine) in the department of obstetrics and gynecology at Brown University, in Providence, R.I., and an expert in the area of preterm birth.
Dr. Reece, who specializes in maternal-fetal medicine, is vice president for medical affairs at the University of Maryland, Baltimore, as well as the John Z. and Akiko K. Bowers Distinguished Professor and dean of the school of medicine. Dr. Reece said he had no relevant financial disclosures. He is the medical editor of this column. Contact him at obnews@frontlinemedcom.com.
One of the key indicators of a nation’s health is how well it can care for its young. Despite many advances in medical care and improvements in access to care, infant mortality remains a significant concern worldwide. According to the World Health Organization, the leading cause of death among children under age 5 is preterm birth complications. With an estimated 15 million babies born prematurely (prior to 37 weeks’ gestation) globally each year, it is vital for ob.gyns. to uncover ways to predict, diagnose early, and treat the causes of preterm birth.
While the challenges to infant health could be considered more of an issue in developing countries, here in the United States, the Centers for Disease Control and Prevention estimates that 1 in 9 babies is born prematurely. Preterm birth-related causes of death (i.e., breathing and feeding problems and disabilities) accounted for 35% of all infant deaths in 2010.
The World Health Organization (WHO) lists the United States as one of the top 10 countries with the greatest number of preterm births, despite the fact that we spend approximately 17.1% of our gross domestic product in total health care expenditures – the highest rate among our peer nations.
In the April 2014 edition of Master Class, we discussed one of the primary causes of preterm birth, bacterial infections, and specifically the need for ob.gyns. to rigorously screen patients for asymptomatic bacteriuria, which can lead to pyelonephritis. This month, we examine another biologic marker of preterm birth, cervical length.
Seminal studies of transvaginal sonography to measure cervical length during pregnancy and predict premature birth were published more than 2 decades ago. This work showed that a short cervix at 24 and 28 weeks’ gestation predicted preterm birth. Since then, clinical studies have demonstrated the utility of cervical length screening in women with prior preterm pregnancies. In the last decade, three large, randomized human trials have examined the usefulness of universal cervical length screening (Am. J. Obstet. Gynecol. 2012;207:101-6). However, the results of these trials have given practitioners a confusing picture of the predictability of this biologic marker.
Given the complexity of the “to screen or not to screen” issue, we have devoted this Master Class to a discussion on the role of cervical length screening and the prediction of preterm birth. Our guest author this month is Dr. Erika Werner, an assistant professor in ob.gyn (maternal-fetal medicine) in the department of obstetrics and gynecology at Brown University, in Providence, R.I., and an expert in the area of preterm birth.
Dr. Reece, who specializes in maternal-fetal medicine, is vice president for medical affairs at the University of Maryland, Baltimore, as well as the John Z. and Akiko K. Bowers Distinguished Professor and dean of the school of medicine. Dr. Reece said he had no relevant financial disclosures. He is the medical editor of this column. Contact him at obnews@frontlinemedcom.com.
One of the key indicators of a nation’s health is how well it can care for its young. Despite many advances in medical care and improvements in access to care, infant mortality remains a significant concern worldwide. According to the World Health Organization, the leading cause of death among children under age 5 is preterm birth complications. With an estimated 15 million babies born prematurely (prior to 37 weeks’ gestation) globally each year, it is vital for ob.gyns. to uncover ways to predict, diagnose early, and treat the causes of preterm birth.
While the challenges to infant health could be considered more of an issue in developing countries, here in the United States, the Centers for Disease Control and Prevention estimates that 1 in 9 babies is born prematurely. Preterm birth-related causes of death (i.e., breathing and feeding problems and disabilities) accounted for 35% of all infant deaths in 2010.
The World Health Organization (WHO) lists the United States as one of the top 10 countries with the greatest number of preterm births, despite the fact that we spend approximately 17.1% of our gross domestic product in total health care expenditures – the highest rate among our peer nations.
In the April 2014 edition of Master Class, we discussed one of the primary causes of preterm birth, bacterial infections, and specifically the need for ob.gyns. to rigorously screen patients for asymptomatic bacteriuria, which can lead to pyelonephritis. This month, we examine another biologic marker of preterm birth, cervical length.
Seminal studies of transvaginal sonography to measure cervical length during pregnancy and predict premature birth were published more than 2 decades ago. This work showed that a short cervix at 24 and 28 weeks’ gestation predicted preterm birth. Since then, clinical studies have demonstrated the utility of cervical length screening in women with prior preterm pregnancies. In the last decade, three large, randomized human trials have examined the usefulness of universal cervical length screening (Am. J. Obstet. Gynecol. 2012;207:101-6). However, the results of these trials have given practitioners a confusing picture of the predictability of this biologic marker.
Given the complexity of the “to screen or not to screen” issue, we have devoted this Master Class to a discussion on the role of cervical length screening and the prediction of preterm birth. Our guest author this month is Dr. Erika Werner, an assistant professor in ob.gyn (maternal-fetal medicine) in the department of obstetrics and gynecology at Brown University, in Providence, R.I., and an expert in the area of preterm birth.
Dr. Reece, who specializes in maternal-fetal medicine, is vice president for medical affairs at the University of Maryland, Baltimore, as well as the John Z. and Akiko K. Bowers Distinguished Professor and dean of the school of medicine. Dr. Reece said he had no relevant financial disclosures. He is the medical editor of this column. Contact him at obnews@frontlinemedcom.com.

The benefits, costs of universal cervical length screening
Rates of preterm birth in the United States have been falling since 2006, but the rates of early preterm birth in singletons (those under 34 weeks’ gestation), specifically, have not trended downward as dramatically as have late preterm birth in singletons (34-36 weeks). According to 2015 data from the National Vital Statistics Reports, the rate of early preterm births is still 3.4% in all pregnancies and 2.7% among singletons.
While the number of neonates born before 37 weeks of gestation remains high – approximately 11% in 2013 – and signifies a continuing public health problem, the rate of early preterm birth is particularly concerning because early preterm birth is more significantly associated with neonatal mortality, long-term morbidity and extended neonatal intensive care unit stays, all leading to increased health care expenditures.
Finding predictors for preterm birth that are stronger than traditional clinical factors has long been a goal of ob.gyns. because the vast majority of all spontaneous preterm births occur to women without known risk factors (i.e., multiple gestations or prior preterm birth).

Cervical length in the midtrimester is now a well-verified predictor of preterm birth, for both low- and high-risk women. Furthermore, vaginal progesterone has been shown to be a safe and beneficial intervention for women with no known risk factors who are diagnosed with a shortened cervical length (< 2 cm), and cervical cerclage has been suggested to reduce the risk of preterm birth for women with a history of prior preterm birth who also have a shortened cervical length.
Some are now advocating universal cervical length screening for women with singleton gestations, but before universal screening is mandated, the downstream effect of such a change in practice must be considered.
Backdrop to screening
Cervical length measurement was first investigated more than 25 years ago as a possible predictor of preterm birth. In 1996, a prospective multicenter study of almost 3,000 women with singleton pregnancies showed that the risk of preterm delivery is inversely and directly related to the length of the cervix, as measured with vaginal ultrasonography (N. Engl. J. Med. 1996;334:567-72).
In fact, at 24 weeks’ gestation, every 1 mm of additional cervical length equates to a significant decrease in preterm birth risk (odds ratio, 0.91). Several other studies, in addition to the landmark 1996 study, have similarly demonstrated this inverse relationship between preterm birth risk and cervical length between 18 and 24 weeks’ gestation.
However, the use of cervical measurement did not achieve widespread use until more than a decade later, when researchers began to identify interventions that could prolong pregnancy if a short cervix was diagnosed in the second trimester.
For example, Dr. E.B. Fonseca’s study of almost 25,000 asymptomatic pregnant women, demonstrated that daily vaginal progesterone reduced the risk of spontaneous delivery before 34 weeks by approximately 44% in women identified with a cervical length of 1.5 cm or less (N. Engl. J. Med. 2007;357:462-9). The vast majority of the women in this study had singleton pregnancies.
Shortly thereafter, Dr. S.S. Hassan and her colleagues completed a similar trial in women with singleton gestations and transvaginal cervical lengths between 1.0 and 2.0 cm at 20-23 weeks’ gestation. In this trial, nightly progesterone gel (with 90 mg progesterone per application) was associated with a 45% reduction in preterm birth before 33 weeks and a 38% reduction in preterm birth before 35 weeks (Ultrasound. Obstet. Gynecol. 2011;38:18-31).
A meta-analysis led by Dr. Roberto Romero, which included the Fonseca and Hassan trials, looked specifically at 775 women with a midtrimester cervical length of 2.5 cm or less. Women with a singleton gestation who had no history of preterm birth had a 40% reduction in the rate of early preterm birth when they were treated with vaginal progesterone (Am. J. Obstet. Gynecol. 2012;206:124-e1-19).
The benefits of identifying a short cervix likely extend to women with a history of prior preterm birth. A patient-level meta-analysis published in 2011 demonstrated that cervical cerclage placement was associated with a significant reduction in preterm birth before 35 weeks’ gestation in women with singleton gestations, previous spontaneous preterm birth, and cervical length less than 2.5 cm before 24 weeks’ gestation (Obstet. Gynecol. 2011;117:663-71).
The possible benefits of diagnosing and intervening for a shortened cervix have tipped many experts and clinicians toward the practice of universal cervical length screening of all singleton pregnancies. Research has shown that we can accurately obtain a cervical-length measurement before 24 weeks, and that we have effective and safe interventions for cases of short cervix: cerclage in women with a history of preterm birth who are already receiving progesterone, and vaginal progesterone in women without such a history.
Screening certainties and doubts
In 2011, my colleagues and I compared the cost effectiveness of two approaches to preterm birth prevention in low-risk pregnancies: no screening versus a single transvaginal ultrasound cervical-length measurement in all asymptomatic, low-risk singleton pregnant individuals between 18 and 24 weeks’ gestation.
In our model, women identified as having a cervical length less than 1.5 cm would be offered vaginal progesterone. Based on published data, we assumed there would be a 92% adherence rate, and a 45% reduction in deliveries before 34 weeks with progesterone treatment.
We found that in low-risk pregnancies, universal transvaginal cervical-length ultrasound screening and progesterone intervention would be cost effective and in many cases cost saving. We estimated that screening would prevent 248 early preterm births – as well as 22 neonatal deaths or neonates with long-term neurologic deficits – per 100,000 deliveries.
Our sensitivity analyses showed that screening remained cost saving under a range of clinical scenarios, including varied preterm birth rates and predictive values of a shortened cervix. Screening was not cost saving, but remained cost effective, when the expense of a transvaginal ultrasound scan exceeds $187 or when vaginal progesterone is assumed to reduce the risk of early preterm delivery by less than 20% (Ultrasound Obstet. Gynecol. 2011;38;32-37).
Neither the American College of Obstetricians and Gynecologists nor the Society for Maternal-Fetal Medicine support mandated universal transvaginal ultrasound cervical length screening. Both organizations state, however, that the approach may be considered in women with singleton gestations without prior spontaneous preterm birth.
Interestingly, Thomas Jefferson University in Philadelphia, which uses a universal screening program for singleton gestations without prior preterm birth, has recently published data that complicate the growing trend toward universal cervical length screening.
The Philadelphia clinicians followed a strategy whereby women with a transvaginal cervical length of 2 cm or less were prescribed vaginal progesterone (90 mg vaginal progesterone gel, or 200 mg micronized progesterone gel capsules). Those with a cervical length between approximately 2 cm and 2.5 cm were asked to return for a follow-up cervical length measurement before 24 weeks’ gestation.
What they found in this cohort was surprising: a rate of short cervix that is significantly lower than what previous research has shown.
Among those screened, 0.8% of women had a cervical length of 2 cm or less on an initial transvaginal ultrasonogram. Previously, a prevalence of 1%-2% for an even shorter cervical length (less than 1.5 cm) was fairly consistent in the literature.
As Dr. Kelly M. Orzechowski and her colleagues point out, the low incidence of short cervix “raises questions regarding whether universal transvaginal ultrasonogram cervical length screening in low-risk asymptomatic women is beneficial” (Obstet. Gynecol. 2014;124:520-5).
In our 2011 cost-effectiveness analysis, we found that screening was no longer a cost-saving practice when the incidence of cervical length less than 1.5 cm falls below 0.8%. Screening remained cost effective, however.
Recently, we found that if the Philadelphia protocol is followed and the U.S. population has an incidence of shortened cervix similar to that described by Dr. Orzechowski and her colleagues, universal cervical length screening in low-risk singleton pregnancies is cost effective but not cost saving. Furthermore, we found several additional plausible situations in this unpublished analysis in which universal screening ceased to be cost effective.
Thus, before we move to a strategy of mandated universal screening, we need better population-based estimates of the incidence of short cervix in a truly low-risk population.
We also must consider the future costs of progesterone. It is possible that costs may increase significantly if vaginal progesterone wins approval from the Food and Drug Administration for this indication.
Finally, if universal cervical length screening is to become the standard of care, we need policies in place to prevent misuse of the screening technology that would inevitably drive up costs without improving outcomes. For example, we must ensure that one cervical length measurement does not transition into serial cervical length measurements over the course of pregnancy, since measurement after 24 weeks has limited clinical utility. Similarly, progesterone use for a cervical length less than or equal to 2.0 cm cannot progress to progesterone for anyone approaching 2.0 cm (i.e. 2.5 cm or even 3 cm) as there is no evidence to suggest a benefit for women with longer cervixes.
Over time, it would be beneficial to have additional data on how best to manage patients who have a cervical length of 2 cm-2.5 cm before 24 weeks’ gestation. Many of us ask these women to return for a follow-up measurement and some may prescribe progesterone. However, we lack evidence for either approach; while a cervical length measurement less than 2.5 cm is clearly associated with an increased risk of preterm birth, the benefit of treatment has been demonstrated only with a cervical length of 2 cm or less.
Today and the future
For women with a history of preterm birth, cervical length screening is now routine. For low-risk pregnant women – those without a history of previous spontaneous preterm delivery – various approaches are currently taken. Most physicians recommend assessing the cervical length transabdominally at the time of the 18-20-week ultrasound, and proceeding to transvaginal ultrasonography if the cervical length is less than 3 cm or 3.5 cm.
To reliably image the cervix with transabdominal ultrasound, it should be performed with a full bladder and with the understanding that the cervix appears longer (6 mm longer, on average) when the bladder is full (Aust. N. Z. J. Obstet. Gynaecol. 2014;54:250-55).
Transvaginal ultrasound has been widely recognized as a sensitive and reproducible method for detecting shortened cervical length. Overall, this tool has several advantages over the transabdominal approach. However, the lack of universal access to transvaginal ultrasound and to consistently reliable cervical length measurements have been valid concerns of those who oppose universal transvaginal ultrasound cervical length screening.
Such concerns likely will lessen over time as transvaginal ultrasound continues to become more pervasive. Several years ago, the Perinatal Quality Foundation set standards for measuring the cervix and launched the Cervical Length Education and Review (CLEAR) program. When sonographers and physicians obtain training and credentialing, there appears to be only a 5%-10% intraobserver variability in cervical length measurement. (The PQF’s initial focus in 2005 was the Nuchal Translucency Quality Review program.)
Increasingly, I believe, transvaginal ultrasound cervical length measurement will be utilized to identify women at high risk for early preterm birth so that low-risk women can receive progesterone and high-risk women (those with a history of preterm birth) can be considered as candidates for cerclage placement. In the process, the quality of clinical care as well as the quality of our research data will improve. Whether and when such screening will become universal, however, is still uncertain.
Dr. Werner reported that she has no financial disclosures relevant to this Master Class.
Rates of preterm birth in the United States have been falling since 2006, but the rates of early preterm birth in singletons (those under 34 weeks’ gestation), specifically, have not trended downward as dramatically as have late preterm birth in singletons (34-36 weeks). According to 2015 data from the National Vital Statistics Reports, the rate of early preterm births is still 3.4% in all pregnancies and 2.7% among singletons.
While the number of neonates born before 37 weeks of gestation remains high – approximately 11% in 2013 – and signifies a continuing public health problem, the rate of early preterm birth is particularly concerning because early preterm birth is more significantly associated with neonatal mortality, long-term morbidity and extended neonatal intensive care unit stays, all leading to increased health care expenditures.
Finding predictors for preterm birth that are stronger than traditional clinical factors has long been a goal of ob.gyns. because the vast majority of all spontaneous preterm births occur to women without known risk factors (i.e., multiple gestations or prior preterm birth).
Cervical length in the midtrimester is now a well-verified predictor of preterm birth, for both low- and high-risk women. Furthermore, vaginal progesterone has been shown to be a safe and beneficial intervention for women with no known risk factors who are diagnosed with a shortened cervical length (< 2 cm), and cervical cerclage has been suggested to reduce the risk of preterm birth for women with a history of prior preterm birth who also have a shortened cervical length.
Some are now advocating universal cervical length screening for women with singleton gestations, but before universal screening is mandated, the downstream effect of such a change in practice must be considered.
Backdrop to screening
Cervical length measurement was first investigated more than 25 years ago as a possible predictor of preterm birth. In 1996, a prospective multicenter study of almost 3,000 women with singleton pregnancies showed that the risk of preterm delivery is inversely and directly related to the length of the cervix, as measured with vaginal ultrasonography (N. Engl. J. Med. 1996;334:567-72).
In fact, at 24 weeks’ gestation, every 1 mm of additional cervical length equates to a significant decrease in preterm birth risk (odds ratio, 0.91). Several other studies, in addition to the landmark 1996 study, have similarly demonstrated this inverse relationship between preterm birth risk and cervical length between 18 and 24 weeks’ gestation.
However, the use of cervical measurement did not achieve widespread use until more than a decade later, when researchers began to identify interventions that could prolong pregnancy if a short cervix was diagnosed in the second trimester.
For example, Dr. E.B. Fonseca’s study of almost 25,000 asymptomatic pregnant women, demonstrated that daily vaginal progesterone reduced the risk of spontaneous delivery before 34 weeks by approximately 44% in women identified with a cervical length of 1.5 cm or less (N. Engl. J. Med. 2007;357:462-9). The vast majority of the women in this study had singleton pregnancies.
Shortly thereafter, Dr. S.S. Hassan and her colleagues completed a similar trial in women with singleton gestations and transvaginal cervical lengths between 1.0 and 2.0 cm at 20-23 weeks’ gestation. In this trial, nightly progesterone gel (with 90 mg progesterone per application) was associated with a 45% reduction in preterm birth before 33 weeks and a 38% reduction in preterm birth before 35 weeks (Ultrasound. Obstet. Gynecol. 2011;38:18-31).
A meta-analysis led by Dr. Roberto Romero, which included the Fonseca and Hassan trials, looked specifically at 775 women with a midtrimester cervical length of 2.5 cm or less. Women with a singleton gestation who had no history of preterm birth had a 40% reduction in the rate of early preterm birth when they were treated with vaginal progesterone (Am. J. Obstet. Gynecol. 2012;206:124-e1-19).
The benefits of identifying a short cervix likely extend to women with a history of prior preterm birth. A patient-level meta-analysis published in 2011 demonstrated that cervical cerclage placement was associated with a significant reduction in preterm birth before 35 weeks’ gestation in women with singleton gestations, previous spontaneous preterm birth, and cervical length less than 2.5 cm before 24 weeks’ gestation (Obstet. Gynecol. 2011;117:663-71).
The possible benefits of diagnosing and intervening for a shortened cervix have tipped many experts and clinicians toward the practice of universal cervical length screening of all singleton pregnancies. Research has shown that we can accurately obtain a cervical-length measurement before 24 weeks, and that we have effective and safe interventions for cases of short cervix: cerclage in women with a history of preterm birth who are already receiving progesterone, and vaginal progesterone in women without such a history.
Screening certainties and doubts
In 2011, my colleagues and I compared the cost effectiveness of two approaches to preterm birth prevention in low-risk pregnancies: no screening versus a single transvaginal ultrasound cervical-length measurement in all asymptomatic, low-risk singleton pregnant individuals between 18 and 24 weeks’ gestation.
In our model, women identified as having a cervical length less than 1.5 cm would be offered vaginal progesterone. Based on published data, we assumed there would be a 92% adherence rate, and a 45% reduction in deliveries before 34 weeks with progesterone treatment.
We found that in low-risk pregnancies, universal transvaginal cervical-length ultrasound screening and progesterone intervention would be cost effective and in many cases cost saving. We estimated that screening would prevent 248 early preterm births – as well as 22 neonatal deaths or neonates with long-term neurologic deficits – per 100,000 deliveries.
Our sensitivity analyses showed that screening remained cost saving under a range of clinical scenarios, including varied preterm birth rates and predictive values of a shortened cervix. Screening was not cost saving, but remained cost effective, when the expense of a transvaginal ultrasound scan exceeds $187 or when vaginal progesterone is assumed to reduce the risk of early preterm delivery by less than 20% (Ultrasound Obstet. Gynecol. 2011;38;32-37).
Neither the American College of Obstetricians and Gynecologists nor the Society for Maternal-Fetal Medicine support mandated universal transvaginal ultrasound cervical length screening. Both organizations state, however, that the approach may be considered in women with singleton gestations without prior spontaneous preterm birth.
Interestingly, Thomas Jefferson University in Philadelphia, which uses a universal screening program for singleton gestations without prior preterm birth, has recently published data that complicate the growing trend toward universal cervical length screening.
The Philadelphia clinicians followed a strategy whereby women with a transvaginal cervical length of 2 cm or less were prescribed vaginal progesterone (90 mg vaginal progesterone gel, or 200 mg micronized progesterone gel capsules). Those with a cervical length between approximately 2 cm and 2.5 cm were asked to return for a follow-up cervical length measurement before 24 weeks’ gestation.
What they found in this cohort was surprising: a rate of short cervix that is significantly lower than what previous research has shown.
Among those screened, 0.8% of women had a cervical length of 2 cm or less on an initial transvaginal ultrasonogram. Previously, a prevalence of 1%-2% for an even shorter cervical length (less than 1.5 cm) was fairly consistent in the literature.
As Dr. Kelly M. Orzechowski and her colleagues point out, the low incidence of short cervix “raises questions regarding whether universal transvaginal ultrasonogram cervical length screening in low-risk asymptomatic women is beneficial” (Obstet. Gynecol. 2014;124:520-5).
In our 2011 cost-effectiveness analysis, we found that screening was no longer a cost-saving practice when the incidence of cervical length less than 1.5 cm falls below 0.8%. Screening remained cost effective, however.
Recently, we found that if the Philadelphia protocol is followed and the U.S. population has an incidence of shortened cervix similar to that described by Dr. Orzechowski and her colleagues, universal cervical length screening in low-risk singleton pregnancies is cost effective but not cost saving. Furthermore, we found several additional plausible situations in this unpublished analysis in which universal screening ceased to be cost effective.
Thus, before we move to a strategy of mandated universal screening, we need better population-based estimates of the incidence of short cervix in a truly low-risk population.
We also must consider the future costs of progesterone. It is possible that costs may increase significantly if vaginal progesterone wins approval from the Food and Drug Administration for this indication.
Finally, if universal cervical length screening is to become the standard of care, we need policies in place to prevent misuse of the screening technology that would inevitably drive up costs without improving outcomes. For example, we must ensure that one cervical length measurement does not transition into serial cervical length measurements over the course of pregnancy, since measurement after 24 weeks has limited clinical utility. Similarly, progesterone use for a cervical length less than or equal to 2.0 cm cannot progress to progesterone for anyone approaching 2.0 cm (i.e. 2.5 cm or even 3 cm) as there is no evidence to suggest a benefit for women with longer cervixes.
Over time, it would be beneficial to have additional data on how best to manage patients who have a cervical length of 2 cm-2.5 cm before 24 weeks’ gestation. Many of us ask these women to return for a follow-up measurement and some may prescribe progesterone. However, we lack evidence for either approach; while a cervical length measurement less than 2.5 cm is clearly associated with an increased risk of preterm birth, the benefit of treatment has been demonstrated only with a cervical length of 2 cm or less.
Today and the future
For women with a history of preterm birth, cervical length screening is now routine. For low-risk pregnant women – those without a history of previous spontaneous preterm delivery – various approaches are currently taken. Most physicians recommend assessing the cervical length transabdominally at the time of the 18-20-week ultrasound, and proceeding to transvaginal ultrasonography if the cervical length is less than 3 cm or 3.5 cm.
To reliably image the cervix with transabdominal ultrasound, it should be performed with a full bladder and with the understanding that the cervix appears longer (6 mm longer, on average) when the bladder is full (Aust. N. Z. J. Obstet. Gynaecol. 2014;54:250-55).
Transvaginal ultrasound has been widely recognized as a sensitive and reproducible method for detecting shortened cervical length. Overall, this tool has several advantages over the transabdominal approach. However, the lack of universal access to transvaginal ultrasound and to consistently reliable cervical length measurements have been valid concerns of those who oppose universal transvaginal ultrasound cervical length screening.
Such concerns likely will lessen over time as transvaginal ultrasound continues to become more pervasive. Several years ago, the Perinatal Quality Foundation set standards for measuring the cervix and launched the Cervical Length Education and Review (CLEAR) program. When sonographers and physicians obtain training and credentialing, there appears to be only a 5%-10% intraobserver variability in cervical length measurement. (The PQF’s initial focus in 2005 was the Nuchal Translucency Quality Review program.)
Increasingly, I believe, transvaginal ultrasound cervical length measurement will be utilized to identify women at high risk for early preterm birth so that low-risk women can receive progesterone and high-risk women (those with a history of preterm birth) can be considered as candidates for cerclage placement. In the process, the quality of clinical care as well as the quality of our research data will improve. Whether and when such screening will become universal, however, is still uncertain.
Dr. Werner reported that she has no financial disclosures relevant to this Master Class.
Rates of preterm birth in the United States have been falling since 2006, but the rates of early preterm birth in singletons (those under 34 weeks’ gestation), specifically, have not trended downward as dramatically as have late preterm birth in singletons (34-36 weeks). According to 2015 data from the National Vital Statistics Reports, the rate of early preterm births is still 3.4% in all pregnancies and 2.7% among singletons.
While the number of neonates born before 37 weeks of gestation remains high – approximately 11% in 2013 – and signifies a continuing public health problem, the rate of early preterm birth is particularly concerning because early preterm birth is more significantly associated with neonatal mortality, long-term morbidity and extended neonatal intensive care unit stays, all leading to increased health care expenditures.
Finding predictors for preterm birth that are stronger than traditional clinical factors has long been a goal of ob.gyns. because the vast majority of all spontaneous preterm births occur to women without known risk factors (i.e., multiple gestations or prior preterm birth).
Cervical length in the midtrimester is now a well-verified predictor of preterm birth, for both low- and high-risk women. Furthermore, vaginal progesterone has been shown to be a safe and beneficial intervention for women with no known risk factors who are diagnosed with a shortened cervical length (< 2 cm), and cervical cerclage has been suggested to reduce the risk of preterm birth for women with a history of prior preterm birth who also have a shortened cervical length.
Some are now advocating universal cervical length screening for women with singleton gestations, but before universal screening is mandated, the downstream effect of such a change in practice must be considered.
Backdrop to screening
Cervical length measurement was first investigated more than 25 years ago as a possible predictor of preterm birth. In 1996, a prospective multicenter study of almost 3,000 women with singleton pregnancies showed that the risk of preterm delivery is inversely and directly related to the length of the cervix, as measured with vaginal ultrasonography (N. Engl. J. Med. 1996;334:567-72).
In fact, at 24 weeks’ gestation, every 1 mm of additional cervical length equates to a significant decrease in preterm birth risk (odds ratio, 0.91). Several other studies, in addition to the landmark 1996 study, have similarly demonstrated this inverse relationship between preterm birth risk and cervical length between 18 and 24 weeks’ gestation.
However, the use of cervical measurement did not achieve widespread use until more than a decade later, when researchers began to identify interventions that could prolong pregnancy if a short cervix was diagnosed in the second trimester.
For example, Dr. E.B. Fonseca’s study of almost 25,000 asymptomatic pregnant women, demonstrated that daily vaginal progesterone reduced the risk of spontaneous delivery before 34 weeks by approximately 44% in women identified with a cervical length of 1.5 cm or less (N. Engl. J. Med. 2007;357:462-9). The vast majority of the women in this study had singleton pregnancies.
Shortly thereafter, Dr. S.S. Hassan and her colleagues completed a similar trial in women with singleton gestations and transvaginal cervical lengths between 1.0 and 2.0 cm at 20-23 weeks’ gestation. In this trial, nightly progesterone gel (with 90 mg progesterone per application) was associated with a 45% reduction in preterm birth before 33 weeks and a 38% reduction in preterm birth before 35 weeks (Ultrasound. Obstet. Gynecol. 2011;38:18-31).
A meta-analysis led by Dr. Roberto Romero, which included the Fonseca and Hassan trials, looked specifically at 775 women with a midtrimester cervical length of 2.5 cm or less. Women with a singleton gestation who had no history of preterm birth had a 40% reduction in the rate of early preterm birth when they were treated with vaginal progesterone (Am. J. Obstet. Gynecol. 2012;206:124-e1-19).
The benefits of identifying a short cervix likely extend to women with a history of prior preterm birth. A patient-level meta-analysis published in 2011 demonstrated that cervical cerclage placement was associated with a significant reduction in preterm birth before 35 weeks’ gestation in women with singleton gestations, previous spontaneous preterm birth, and cervical length less than 2.5 cm before 24 weeks’ gestation (Obstet. Gynecol. 2011;117:663-71).
The possible benefits of diagnosing and intervening for a shortened cervix have tipped many experts and clinicians toward the practice of universal cervical length screening of all singleton pregnancies. Research has shown that we can accurately obtain a cervical-length measurement before 24 weeks, and that we have effective and safe interventions for cases of short cervix: cerclage in women with a history of preterm birth who are already receiving progesterone, and vaginal progesterone in women without such a history.
Screening certainties and doubts
In 2011, my colleagues and I compared the cost effectiveness of two approaches to preterm birth prevention in low-risk pregnancies: no screening versus a single transvaginal ultrasound cervical-length measurement in all asymptomatic, low-risk singleton pregnant individuals between 18 and 24 weeks’ gestation.
In our model, women identified as having a cervical length less than 1.5 cm would be offered vaginal progesterone. Based on published data, we assumed there would be a 92% adherence rate, and a 45% reduction in deliveries before 34 weeks with progesterone treatment.
We found that in low-risk pregnancies, universal transvaginal cervical-length ultrasound screening and progesterone intervention would be cost effective and in many cases cost saving. We estimated that screening would prevent 248 early preterm births – as well as 22 neonatal deaths or neonates with long-term neurologic deficits – per 100,000 deliveries.
Our sensitivity analyses showed that screening remained cost saving under a range of clinical scenarios, including varied preterm birth rates and predictive values of a shortened cervix. Screening was not cost saving, but remained cost effective, when the expense of a transvaginal ultrasound scan exceeds $187 or when vaginal progesterone is assumed to reduce the risk of early preterm delivery by less than 20% (Ultrasound Obstet. Gynecol. 2011;38;32-37).
Neither the American College of Obstetricians and Gynecologists nor the Society for Maternal-Fetal Medicine support mandated universal transvaginal ultrasound cervical length screening. Both organizations state, however, that the approach may be considered in women with singleton gestations without prior spontaneous preterm birth.
Interestingly, Thomas Jefferson University in Philadelphia, which uses a universal screening program for singleton gestations without prior preterm birth, has recently published data that complicate the growing trend toward universal cervical length screening.
The Philadelphia clinicians followed a strategy whereby women with a transvaginal cervical length of 2 cm or less were prescribed vaginal progesterone (90 mg vaginal progesterone gel, or 200 mg micronized progesterone gel capsules). Those with a cervical length between approximately 2 cm and 2.5 cm were asked to return for a follow-up cervical length measurement before 24 weeks’ gestation.
What they found in this cohort was surprising: a rate of short cervix that is significantly lower than what previous research has shown.
Among those screened, 0.8% of women had a cervical length of 2 cm or less on an initial transvaginal ultrasonogram. Previously, a prevalence of 1%-2% for an even shorter cervical length (less than 1.5 cm) was fairly consistent in the literature.
As Dr. Kelly M. Orzechowski and her colleagues point out, the low incidence of short cervix “raises questions regarding whether universal transvaginal ultrasonogram cervical length screening in low-risk asymptomatic women is beneficial” (Obstet. Gynecol. 2014;124:520-5).
In our 2011 cost-effectiveness analysis, we found that screening was no longer a cost-saving practice when the incidence of cervical length less than 1.5 cm falls below 0.8%. Screening remained cost effective, however.
Recently, we found that if the Philadelphia protocol is followed and the U.S. population has an incidence of shortened cervix similar to that described by Dr. Orzechowski and her colleagues, universal cervical length screening in low-risk singleton pregnancies is cost effective but not cost saving. Furthermore, we found several additional plausible situations in this unpublished analysis in which universal screening ceased to be cost effective.
Thus, before we move to a strategy of mandated universal screening, we need better population-based estimates of the incidence of short cervix in a truly low-risk population.
We also must consider the future costs of progesterone. It is possible that costs may increase significantly if vaginal progesterone wins approval from the Food and Drug Administration for this indication.
Finally, if universal cervical length screening is to become the standard of care, we need policies in place to prevent misuse of the screening technology that would inevitably drive up costs without improving outcomes. For example, we must ensure that one cervical length measurement does not transition into serial cervical length measurements over the course of pregnancy, since measurement after 24 weeks has limited clinical utility. Similarly, progesterone use for a cervical length less than or equal to 2.0 cm cannot progress to progesterone for anyone approaching 2.0 cm (i.e. 2.5 cm or even 3 cm) as there is no evidence to suggest a benefit for women with longer cervixes.
Over time, it would be beneficial to have additional data on how best to manage patients who have a cervical length of 2 cm-2.5 cm before 24 weeks’ gestation. Many of us ask these women to return for a follow-up measurement and some may prescribe progesterone. However, we lack evidence for either approach; while a cervical length measurement less than 2.5 cm is clearly associated with an increased risk of preterm birth, the benefit of treatment has been demonstrated only with a cervical length of 2 cm or less.
Today and the future
For women with a history of preterm birth, cervical length screening is now routine. For low-risk pregnant women – those without a history of previous spontaneous preterm delivery – various approaches are currently taken. Most physicians recommend assessing the cervical length transabdominally at the time of the 18-20-week ultrasound, and proceeding to transvaginal ultrasonography if the cervical length is less than 3 cm or 3.5 cm.
To reliably image the cervix with transabdominal ultrasound, it should be performed with a full bladder and with the understanding that the cervix appears longer (6 mm longer, on average) when the bladder is full (Aust. N. Z. J. Obstet. Gynaecol. 2014;54:250-55).
Transvaginal ultrasound has been widely recognized as a sensitive and reproducible method for detecting shortened cervical length. Overall, this tool has several advantages over the transabdominal approach. However, the lack of universal access to transvaginal ultrasound and to consistently reliable cervical length measurements have been valid concerns of those who oppose universal transvaginal ultrasound cervical length screening.
Such concerns likely will lessen over time as transvaginal ultrasound continues to become more pervasive. Several years ago, the Perinatal Quality Foundation set standards for measuring the cervix and launched the Cervical Length Education and Review (CLEAR) program. When sonographers and physicians obtain training and credentialing, there appears to be only a 5%-10% intraobserver variability in cervical length measurement. (The PQF’s initial focus in 2005 was the Nuchal Translucency Quality Review program.)
Increasingly, I believe, transvaginal ultrasound cervical length measurement will be utilized to identify women at high risk for early preterm birth so that low-risk women can receive progesterone and high-risk women (those with a history of preterm birth) can be considered as candidates for cerclage placement. In the process, the quality of clinical care as well as the quality of our research data will improve. Whether and when such screening will become universal, however, is still uncertain.
Dr. Werner reported that she has no financial disclosures relevant to this Master Class.

Helmets needed for female lacrosse players
On April 8, the sports section in my local N.J. paper showed a picture of three female lacrosse players with their sticks up high in the air all reaching for a flying ball. Male players wear a full helmet and face mask, but these players wore only goggles and mouth guards. As a pediatrician who has had a lot of experience in treating head injuries in high school and college athletes, my question is this: Why we don’t protect the girls as well as the boys?
Yes, it is true the boys’ game is more aggressive, but anyone who knows these athletes realizes there is not much difference between them in their enthusiasm and commitment to win. The excuse put forth by U.S. Lacrosse is that if helmets are required the game will become more aggressive. That is not only a sexist viewpoint, it is like saying our children will ride their bikes in a safer way if we don’t have them wear bike helmets. I have seen many lacrosse injuries from not only sticks to the head, but impacts of the ball, too. It is a significant source of morbidity to female athletes.
In 2007, Randall Dick and associates, reviewing 16 years of NCAA injury data, found that 56% of above-the-neck injuries in women’s lacrosse resulted from contact with a stick and 20% from contact with a ball (J. Athl. Train. 2007;42:173-82). A 3-year prospective study by Dr. Richard Y. Hinton and his associates found that female players had higher rates of overall head injuries than their male counterparts, mostly involving contact with sticks and balls (Am. J. Sports Med. 2005;33:1305-14).
In 2001, a 10-year analysis of the National Electronic Injury Surveillance System by P.T. Diamond and S.D. Gale showed that the head and face were the most common areas injured, being significantly more prevalent in females (30%) than males (18%) (Brain. Inj. 2001;15:537-44). Their recommendation: “Women and children lacrosse players are at risk of serious injury to the head and face region. The use of protective head/face gear should be encouraged.”
Perhaps the most compelling study, by Andrew E. Lincoln, Sc.D., and associates, found that high school girls’ head, face, and eye injuries (0.54/1,000 athletic exposures) were significantly higher than for boys (0.38/1,000), and while concussions were higher in boys, girls sustained significantly more facial injuries, primarily resulting from stick or ball contact (Am. J. Sports Med. 2007;35:207-15).
In the early sixties, hockey players wore no helmets and goalies no masks. It does not seem that the addition of these pieces of safety equipment has ruined the game at all. Even though there is no checking in the girls’ lacrosse games, this does not prevent the inevitable accidents that occur in any sporting event. The above referenced articles support this. Many of these injuries are not only game injuries, but may carry lifelong consequences. Although the situation in professional sports is well known, my colleagues and I are seeing an increasing number of head injuries in all amateur sports, with women’s lacrosse making up a significant proportion of these incidents. When the governing bodies will not act, those of us who care for these athletes must speak up. Isn’t it time we protect the girls as well as the boys?
Patrick A. Caruso, M.D.
clinical associate professor of pediatrics
Mount Sinai School of Medicine
Morristown, N.J.
On April 8, the sports section in my local N.J. paper showed a picture of three female lacrosse players with their sticks up high in the air all reaching for a flying ball. Male players wear a full helmet and face mask, but these players wore only goggles and mouth guards. As a pediatrician who has had a lot of experience in treating head injuries in high school and college athletes, my question is this: Why we don’t protect the girls as well as the boys?
Yes, it is true the boys’ game is more aggressive, but anyone who knows these athletes realizes there is not much difference between them in their enthusiasm and commitment to win. The excuse put forth by U.S. Lacrosse is that if helmets are required the game will become more aggressive. That is not only a sexist viewpoint, it is like saying our children will ride their bikes in a safer way if we don’t have them wear bike helmets. I have seen many lacrosse injuries from not only sticks to the head, but impacts of the ball, too. It is a significant source of morbidity to female athletes.
In 2007, Randall Dick and associates, reviewing 16 years of NCAA injury data, found that 56% of above-the-neck injuries in women’s lacrosse resulted from contact with a stick and 20% from contact with a ball (J. Athl. Train. 2007;42:173-82). A 3-year prospective study by Dr. Richard Y. Hinton and his associates found that female players had higher rates of overall head injuries than their male counterparts, mostly involving contact with sticks and balls (Am. J. Sports Med. 2005;33:1305-14).
In 2001, a 10-year analysis of the National Electronic Injury Surveillance System by P.T. Diamond and S.D. Gale showed that the head and face were the most common areas injured, being significantly more prevalent in females (30%) than males (18%) (Brain. Inj. 2001;15:537-44). Their recommendation: “Women and children lacrosse players are at risk of serious injury to the head and face region. The use of protective head/face gear should be encouraged.”
Perhaps the most compelling study, by Andrew E. Lincoln, Sc.D., and associates, found that high school girls’ head, face, and eye injuries (0.54/1,000 athletic exposures) were significantly higher than for boys (0.38/1,000), and while concussions were higher in boys, girls sustained significantly more facial injuries, primarily resulting from stick or ball contact (Am. J. Sports Med. 2007;35:207-15).
In the early sixties, hockey players wore no helmets and goalies no masks. It does not seem that the addition of these pieces of safety equipment has ruined the game at all. Even though there is no checking in the girls’ lacrosse games, this does not prevent the inevitable accidents that occur in any sporting event. The above referenced articles support this. Many of these injuries are not only game injuries, but may carry lifelong consequences. Although the situation in professional sports is well known, my colleagues and I are seeing an increasing number of head injuries in all amateur sports, with women’s lacrosse making up a significant proportion of these incidents. When the governing bodies will not act, those of us who care for these athletes must speak up. Isn’t it time we protect the girls as well as the boys?
Patrick A. Caruso, M.D.
clinical associate professor of pediatrics
Mount Sinai School of Medicine
Morristown, N.J.
On April 8, the sports section in my local N.J. paper showed a picture of three female lacrosse players with their sticks up high in the air all reaching for a flying ball. Male players wear a full helmet and face mask, but these players wore only goggles and mouth guards. As a pediatrician who has had a lot of experience in treating head injuries in high school and college athletes, my question is this: Why we don’t protect the girls as well as the boys?
Yes, it is true the boys’ game is more aggressive, but anyone who knows these athletes realizes there is not much difference between them in their enthusiasm and commitment to win. The excuse put forth by U.S. Lacrosse is that if helmets are required the game will become more aggressive. That is not only a sexist viewpoint, it is like saying our children will ride their bikes in a safer way if we don’t have them wear bike helmets. I have seen many lacrosse injuries from not only sticks to the head, but impacts of the ball, too. It is a significant source of morbidity to female athletes.
In 2007, Randall Dick and associates, reviewing 16 years of NCAA injury data, found that 56% of above-the-neck injuries in women’s lacrosse resulted from contact with a stick and 20% from contact with a ball (J. Athl. Train. 2007;42:173-82). A 3-year prospective study by Dr. Richard Y. Hinton and his associates found that female players had higher rates of overall head injuries than their male counterparts, mostly involving contact with sticks and balls (Am. J. Sports Med. 2005;33:1305-14).
In 2001, a 10-year analysis of the National Electronic Injury Surveillance System by P.T. Diamond and S.D. Gale showed that the head and face were the most common areas injured, being significantly more prevalent in females (30%) than males (18%) (Brain. Inj. 2001;15:537-44). Their recommendation: “Women and children lacrosse players are at risk of serious injury to the head and face region. The use of protective head/face gear should be encouraged.”
Perhaps the most compelling study, by Andrew E. Lincoln, Sc.D., and associates, found that high school girls’ head, face, and eye injuries (0.54/1,000 athletic exposures) were significantly higher than for boys (0.38/1,000), and while concussions were higher in boys, girls sustained significantly more facial injuries, primarily resulting from stick or ball contact (Am. J. Sports Med. 2007;35:207-15).
In the early sixties, hockey players wore no helmets and goalies no masks. It does not seem that the addition of these pieces of safety equipment has ruined the game at all. Even though there is no checking in the girls’ lacrosse games, this does not prevent the inevitable accidents that occur in any sporting event. The above referenced articles support this. Many of these injuries are not only game injuries, but may carry lifelong consequences. Although the situation in professional sports is well known, my colleagues and I are seeing an increasing number of head injuries in all amateur sports, with women’s lacrosse making up a significant proportion of these incidents. When the governing bodies will not act, those of us who care for these athletes must speak up. Isn’t it time we protect the girls as well as the boys?
Patrick A. Caruso, M.D.
clinical associate professor of pediatrics
Mount Sinai School of Medicine
Morristown, N.J.