User login
Med Students’ Simple Idea Has Serious Potential
The difficulties in routinely recalling each and every action to take with a patient has encouraged hospitalists to abide by checklists that remind them of just what to do. So why shouldn’t patients have the same systematic prodding? That’s exactly what two first-year students at the University of Michigan Medical School in Ann Arbor—Andrew Lin and Aaron Farberg—thought two years ago, prompting them to invent Dear Doctor.
With the help of senior physicians, including former SHM president Scott Flanders, MD, SFHM, FACP, Lin and Farberg conducted a three-month study that provided bedside notepads to patients. The patients were encouraged to jot down questions for their doctors whenever a question occurred to them, not just when the physician was in the room. The students produced 1,000 notepads, even shrink-wrapping them with companion pens.
The simple yet seemingly effective approach worked so well that “Dear Doctor: A Tool to Facilitate Patient-Centered Care and Enhance Communication” earned the budding physicians the 2010 Innovation Poster award in the Research, Innovations, and Clinical Vignettes competition at HM10.
“This isn’t groundbreaking work here,” Lin says. “It’s a notepad, scraps of paper. Look around your desk and you’ve got sticky notes around. That’s what this is.”
Lin and Farberg both say they were surprised no one had crafted a similar communication tool as a potential quality-improvement (QI) measure. To wit, they are now working on publishing their research in the Journal of Hospital Medicine to further draw attention to the concept. They envision a day when the notes patients write down could be included in electronic medical records.
The ultimate goal is to give hospitalists and other physicians another way to communicate with their patients. “We want to institutionalize [Dear Doctor] to the point it’s a recognized necessity for the hospital system,” Lin says.—RQ
Toolkit Addresses Small-Business Security Concerns
The Healthcare Information and Management Systems Society (HIMSS) has had a privacy and security toolkit for physicians for a decade, but after its last annual security survey with the Medical Group Management Association (MGMA), it became clear that small- to medium-sized organizations were behind in implementation.
And so was born the HIMSS Privacy and Security Toolkit for Small Provider Organizations. The joint initiative is one that HM groups in rural or small settings should take advantage of, says Lisa Gallagher, HIMSS’ senior director of privacy and security.
Hospitalists “need to understand the reporting environment,” Gallagher says. “They are the subject of a lot of the policies and technology. We need them to be knowledgeable about it. They’re the ones who have access.”
HM’s role at the juncture of different departments and physicians, particularly at smaller hospitals that rely on hospitalists as traffic cops, makes it all the more important for hospitalists to understand the nuances of both privacy and security.
The interactive toolkit allows users to submit their own suggestions for improved processes and features introductions to the Centers for Medicare & Medicaid Services’ (CMS) “meaningful use” standard. Gallagher is hopeful that an engaged physician response to the toolkit will only bolster its efficacy in the coming months. “This is going to continue to evolve,” she says.—RQ
QUALITY RESEARCH
Care Transitions, Readmissions Concern Other Countries
International studies suggest that the recent torrent of attention toward improving care transitions and preventing hospital readmissions is not just an American trend. For example, a literature survey of physician “handovers” (aka handoffs) in international hospitals published in the British Medical Journal for Quality and Safety identified 32 papers on the subject.1 The authors conclude that the existing literature rarely examines pre- and post-handover phases or evaluates the quality of handover practices, and thus “does not fully identify where communication failures typically occur.” More systematic analysis of all stages of handoffs by physicians is warranted, the authors suggest.
In the same journal, a literature search of English-language publications from 1990 to 2010 found a dozen studies—eight from the U.S.—documenting failure to perform adequate follow-up for patients’ test results.2 The lack of follow-up ranged from 20% to 62% for hospitalized patients, and from 1% to 75% for patients treated in the ED. Two areas where problems were particularly evident were critical test results and results for patients moving across healthcare settings. “The existing evidence suggests that the problem of missed test results is considerable and reported negative impacts on patients warrant the exploration of solutions,” the authors conclude. They recommend further study of the effectiveness of such interventions as online endorsement of results, and integration of information technology into clinical work practices.
The World Alliance for Patient Safety, which was convened in 2004 by the World Health Organization, recently pointed to poor test result follow-up as one of the major processes contributing to unsafe patient care internationally.1 The organization has identified nine “patient-safety solutions,” one of which is ensuring medication accuracy at transitions of care.
For more information on the alliance and WHO’s interest in patient safety, visit http://www.who.int/topics/patient_safety/en/. —LB
References
- Raduma-Tomás MA, Flin R, Yule S, Williams D. Doctors’ handovers in hospi- tals: a literature review. BMJ Qual Saf. 2011;20:128-133.
- Callen J, Georgiou A, Li J, Westbrook JI. The safety implications of missed test results for hospitalised patients: a systematic review. BMJ Qual Saf. 2011;20:194-199.
The Future Is Forward
GRAPEVINE, Texas—New SHM President Joseph Li, MD, SFHM, associate professor of medicine at Harvard Medical School and director of the hospital medicine division at Beth Israel Deaconess Medical Center in Boston, asked a question at HM11 that might be a first for the relatively nascent field. After explaining to the crowd in the ballroom at the Gaylord Texan Resort and Convention Center that the average hospitalist is 37 years old, Dr. Li asked: “What’s going to happen when the hospitalist gets older and their priorities change?”
A hopeful, if wary, eye on the future of the still-growing field was a common thread throughout HM11, as SHM leaders from the new president to CEO Larry Wellikson, MD, SFHM, laid out the pathway of growth for a 15-year-old specialty. Although each acknowledged uncertainties as they adjust to a domestic healthcare system in the throes of its largest reform in a generation, they agree on a few mainstays.
First, HM should continue to take ownership of quality-improvement (QI) and patient-safety initiatives that improve outcomes and reduce costs for hospitals, as the dual reward of better care for patients and lower costs for chief financial officers can serve as change agents for healthcare and leverage for the next contract.
Second, hospitalists should be careful to balance expansion of their duties—be it via such “hyphenated hospitalists” as laborists, say, or through comanagement of surgical and ED patients—with an appropriate amount of dedicated resources.
Finally, academic hospitalists, from residents to attendings, should continue to plan for this summer’s reduction in work hours and patient caps for residents, new rules from the Accreditation Council for Graduate Medical Education (ACGME) that some fear could create a future cast of ill-prepared internists.
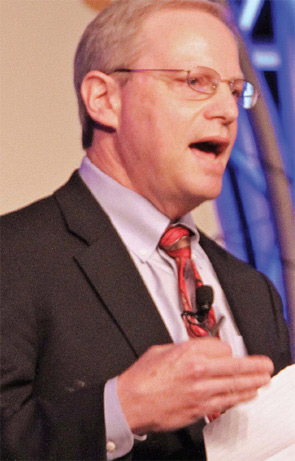
“There’s a lot that’s bearing down on physicians and it’s been compressed in a short period of time,” said AMA President Cecil Wilson, MD. “We cannot go back to where we were and we cannot stay where we are. … We may not have a choice about change, but we do have a choice on how we respond to change and how we influence it.”
Dr. Li sees SHM sitting at the intersection of practical application and influence. He wants to continue with society-sponsored training academies and leadership programs that both impress upon hospitalists how important it is for them to take leadership roles in their hospitals and make sure they have the skills to do so. Dr. Li says the field needs to look no further than other fields adopting the in-hospital practice model as proof that the care model is vital to improving equality.
“We need to be laser-focused in terms of what we want to do. [We] want to improve the quality of care of patients both inside and outside the hospital,” he adds. “I say both inside and outside because, oftentimes, that transition is somewhere in between it. We have many hospitalists, like at my place, who provide care in the outpatient setting, in post-discharge clinics, and other places.”
Dr. Li also says that collaborations with fellow medical societies and organizations are key to SHM’s advocacy role. Society leaders are attending other specialty conferences to build and strengthen relationships that help extend HM’s reach into policy circles. In perhaps one of the strongest relationships, SHM leadership is meeting this summer with Donald Berwick, MD, administrator of the Centers for Medicare & Medicaid Services (CMS). The meeting is even more valuable in context of Dr. Berwick’s recent selection of Patrick Conway, MD, MSc, SFHM, a pediatric hospitalist and director of hospital medicine at Cincinnati Children’s Hospital Medical Center, as CMS’ chief medical officer. The government position is the highest-ranking policy role ever held by a hospitalist (see “Hospitalist Takes Charge” p. 28).
“We’re in a position going forward where we don’t talk alone,” says immediate past SHM president Jeff Wiese, MD, FACP, SFHM, associate professor of medicine at Tulane University Health Sciences Center in New Orleans. “It’s us and our partners talking together. That moves what is currently a loud voice to a stentorian voice. You can imagine where SHM and ACP [American College of Physicians] and the VA [Veterans Administration] and Society of Critical Care Medicine … if they’re all saying the same thing, that’s a very different message than if one organization is saying it alone.”
Adds SHM board member and former SHM Public Policy Committee chairman Eric Siegal, MD, SFHM, a critical-care fellow at the University of Wisconsin School of Medicine and Public Health in Madison, “We’re absolutely at the table in a way that’s, frankly, almost stunning how fast we have evolved [from] several years ago, when we first went to Washington, D.C., for our first advocacy day, and we had to explain to people that hospitalists were not in the hospitality industry. We punch well above our weight class right now.”
It’s a tall order for any specialty society to push the national healthcare discussion, but Dr. Li sees HM as perfectly perched “to train the trainers.” The field has grown to more than 30,000 hospitalists, well beyond the estimated ceiling of 20,000 hospitalists forecasted in the field’s earliest days. That rapid-fire growth–hospitalists are now present in the vast majority of hospitals that can either afford them or need them–means the field can now evolve past simply swelling numbers to creating better physicians. By encouraging more rank-and-file practitioners to become leaders, the logic goes, the number of groups will increase as practices sprout in those remaining hospitals without HM services: more practices, more hospitalists, more presence in future policy discussions.
To that end, Dr. Wellikson notes that SHM continues to introduce training courses and research repositories. Two recent additions are eQUIPS (Electronic Quality Improvement Programs), a series of QI and patient toolkits aimed at transitional care, glycemic control, and VTE prevention, and SQUINT, SHM’s new QI repository, which allows users to upload research projects to a searchable database that other physicians can then mine for data.
“We’re really only at the very beginning,” Dr. Li says. “All of hospital medicine only started 10, 15 years ago. For some folks, they believe that’s a long time. But this really is the very beginning of this movement.”
Richard Quinn is a freelance writer based in New Jersey.
GRAPEVINE, Texas—New SHM President Joseph Li, MD, SFHM, associate professor of medicine at Harvard Medical School and director of the hospital medicine division at Beth Israel Deaconess Medical Center in Boston, asked a question at HM11 that might be a first for the relatively nascent field. After explaining to the crowd in the ballroom at the Gaylord Texan Resort and Convention Center that the average hospitalist is 37 years old, Dr. Li asked: “What’s going to happen when the hospitalist gets older and their priorities change?”
A hopeful, if wary, eye on the future of the still-growing field was a common thread throughout HM11, as SHM leaders from the new president to CEO Larry Wellikson, MD, SFHM, laid out the pathway of growth for a 15-year-old specialty. Although each acknowledged uncertainties as they adjust to a domestic healthcare system in the throes of its largest reform in a generation, they agree on a few mainstays.
First, HM should continue to take ownership of quality-improvement (QI) and patient-safety initiatives that improve outcomes and reduce costs for hospitals, as the dual reward of better care for patients and lower costs for chief financial officers can serve as change agents for healthcare and leverage for the next contract.
Second, hospitalists should be careful to balance expansion of their duties—be it via such “hyphenated hospitalists” as laborists, say, or through comanagement of surgical and ED patients—with an appropriate amount of dedicated resources.
Finally, academic hospitalists, from residents to attendings, should continue to plan for this summer’s reduction in work hours and patient caps for residents, new rules from the Accreditation Council for Graduate Medical Education (ACGME) that some fear could create a future cast of ill-prepared internists.
“There’s a lot that’s bearing down on physicians and it’s been compressed in a short period of time,” said AMA President Cecil Wilson, MD. “We cannot go back to where we were and we cannot stay where we are. … We may not have a choice about change, but we do have a choice on how we respond to change and how we influence it.”
Dr. Li sees SHM sitting at the intersection of practical application and influence. He wants to continue with society-sponsored training academies and leadership programs that both impress upon hospitalists how important it is for them to take leadership roles in their hospitals and make sure they have the skills to do so. Dr. Li says the field needs to look no further than other fields adopting the in-hospital practice model as proof that the care model is vital to improving equality.
“We need to be laser-focused in terms of what we want to do. [We] want to improve the quality of care of patients both inside and outside the hospital,” he adds. “I say both inside and outside because, oftentimes, that transition is somewhere in between it. We have many hospitalists, like at my place, who provide care in the outpatient setting, in post-discharge clinics, and other places.”
Dr. Li also says that collaborations with fellow medical societies and organizations are key to SHM’s advocacy role. Society leaders are attending other specialty conferences to build and strengthen relationships that help extend HM’s reach into policy circles. In perhaps one of the strongest relationships, SHM leadership is meeting this summer with Donald Berwick, MD, administrator of the Centers for Medicare & Medicaid Services (CMS). The meeting is even more valuable in context of Dr. Berwick’s recent selection of Patrick Conway, MD, MSc, SFHM, a pediatric hospitalist and director of hospital medicine at Cincinnati Children’s Hospital Medical Center, as CMS’ chief medical officer. The government position is the highest-ranking policy role ever held by a hospitalist (see “Hospitalist Takes Charge” p. 28).
“We’re in a position going forward where we don’t talk alone,” says immediate past SHM president Jeff Wiese, MD, FACP, SFHM, associate professor of medicine at Tulane University Health Sciences Center in New Orleans. “It’s us and our partners talking together. That moves what is currently a loud voice to a stentorian voice. You can imagine where SHM and ACP [American College of Physicians] and the VA [Veterans Administration] and Society of Critical Care Medicine … if they’re all saying the same thing, that’s a very different message than if one organization is saying it alone.”
Adds SHM board member and former SHM Public Policy Committee chairman Eric Siegal, MD, SFHM, a critical-care fellow at the University of Wisconsin School of Medicine and Public Health in Madison, “We’re absolutely at the table in a way that’s, frankly, almost stunning how fast we have evolved [from] several years ago, when we first went to Washington, D.C., for our first advocacy day, and we had to explain to people that hospitalists were not in the hospitality industry. We punch well above our weight class right now.”
It’s a tall order for any specialty society to push the national healthcare discussion, but Dr. Li sees HM as perfectly perched “to train the trainers.” The field has grown to more than 30,000 hospitalists, well beyond the estimated ceiling of 20,000 hospitalists forecasted in the field’s earliest days. That rapid-fire growth–hospitalists are now present in the vast majority of hospitals that can either afford them or need them–means the field can now evolve past simply swelling numbers to creating better physicians. By encouraging more rank-and-file practitioners to become leaders, the logic goes, the number of groups will increase as practices sprout in those remaining hospitals without HM services: more practices, more hospitalists, more presence in future policy discussions.
To that end, Dr. Wellikson notes that SHM continues to introduce training courses and research repositories. Two recent additions are eQUIPS (Electronic Quality Improvement Programs), a series of QI and patient toolkits aimed at transitional care, glycemic control, and VTE prevention, and SQUINT, SHM’s new QI repository, which allows users to upload research projects to a searchable database that other physicians can then mine for data.
“We’re really only at the very beginning,” Dr. Li says. “All of hospital medicine only started 10, 15 years ago. For some folks, they believe that’s a long time. But this really is the very beginning of this movement.”
Richard Quinn is a freelance writer based in New Jersey.
The Future of Better Patient Care
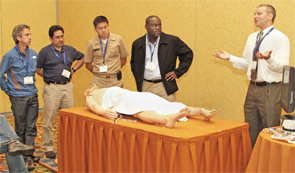
GRAPEVINE, Texas—Hospitalist Michael Monge, MD, of Cogent Healthcare in San Bernardino, Calif., watched an instructor squeeze the lubricating gel on the transponder and press it gently, but firmly, into the crook of a woman’s arm. Veins practically popped off an ultrasound monitor, serving as a literal road map for vascular access.
And he thought: Wouldn’t it be great if I had this technology all the time, just like I remember from my residency?
“A lot of my ER attendings were able to do a study at the bedside in a manner of minutes, not 30 or 45 minutes,” says Dr. Monge, who practices at Saint Bernardine Medical Center. “If they saw something abnormal, sure enough, they got the full study. But they were able to get that glimpse. Ultimately, it’s just better patient care.”
Dr. Monge’s ultrasound lesson was a first for the SHM annual meeting. In past years, training on ultrasounds was wrapped into the “Medical Procedures for the Hospitalist” pre-course. But at HM11, thanks to the growing prevalence and portability of the technology, the training was expanded into its own half-day pre-course, appropriately dubbed “Portable Ultrasound for the Hospitalist.”
“The ultrasound will be the stethoscope of the 21st century,” says Mark Ault, director of the Division of General Internal Medicine and assistant chairman for clinical affairs of the Department of Medicine at Cedars-Sinai Medical Center in Los Angeles. “And the goal will be to have an ultrasound in the hands of every internist.”
Only time will tell whether portable ultrasound becomes as commonplace as Dr. Ault envisions, but what is clear is that the evolution of the technology makes it widely applicable to hospitalists, says Bradley Rosen, MD, MBA, medical director of the Inpatient Specialty Program (ISP) at Cedars-Sinai Medical Center.
Pricing is one such example. In years past, ultrasound machines were bulky and costly, with price tags in the hundreds of thousands of dollars. Now, portable units, depending on the number of transducers and functionality, can come as low as $20,000, though more-advanced machines quickly jump into the $40,000 to $60,000 range.
Still, Dr. Rosen views the practical uses of the technology as almost endless, and could include vascular access, placing central and PICC lines, and insertion and removal of catheters. Most hospitalists, however, continue to have limited experience with portable ultrasound, meaning those interested in learning more likely have to seek out physicians in other departments to provide the training and mentorship required. Dr. Rosen suggests working with ED physicians, OB-GYNs, and radiologists, although he notes you should be careful to be clear that the HM community is not looking to supplant anyone, or take billing opportunities away.
Hospitalists “don’t know how to use it, and people don’t know where to go to learn how to use it,” he says. “This is a starting point that will allow people … to take these ideas back and, hopefully, generate enough of a critical mass that it becomes a louder and louder chorus asking for this technology.”
The Suggestions Box: SHM's Special Interest Forums
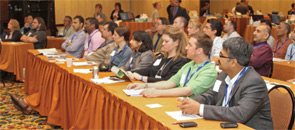
It was only natural when SHM started hosting Special Interest Forums a few meetings ago that a chat devoted to quality would emerge. So it was no surprise when some 60 HM11 attendees crowded into a room to talk about just that. But part of preaching the value of quality is knowing how to preach.
To that end, Mangla Gulati, MD, FACP, assistant professor in the Department of Medicine at the University of Maryland School of Medicine in Baltimore, wants resources to teach her how to talk with administrators on their level. “We need to know the language to parlay with our CFO or CEO,” she says. “That’s what’s helpful for us.”
Joe Miller, SHM’s senior vice president and chief solutions officer, suggested the society could create a microsite within www.hospitalmedicine.org dedicated to the topic. He says there are online toolkits the society has developed in the past, and will continue to develop, that will help introduce hospitalists to already-existing quality initiatives they simply don’t know about. He particularly noted SQUINT, SHM’s searchable database for quality projects that is just getting off the ground.
“The stuff that’s there, I use and I love it,” says Dorothy Pusateri, MD, of Allegheny Hospitalist Service in Pittsburgh. “The stuff on Project BOOST [Better Outcomes for Older Adults through Safer Transitions] was enough to teach me.”
Rural Hospitalists
Small-town hospitalists from every corner of the country discussed recruiting issues, scheduling solutions, advocacy concerns, and more. A group of 15 rural hospitalists shared concerns about brutal, “72-hour” shifts and potential solutions to hiring and staffing issues, including growing your own hospitalists and hiring nonphysician providers (NPPs) to supplement 24/7 coverage.
“You can’t sustain mentally if you are doing all of it by yourself all day, all night,” said Martin Johns, MD, a hospitalist at 25-bed Gifford Medical Center in Randolph, Vt. Dr. Johns suggested rural groups think about utilizing NPPs and physician assistants (PAs) to fill coverage gaps; however, the opinions varied widely in what was considered proper compensation and responsibilities for nonphysicians.
“Our PAs make almost as much as our docs,” said Dale Vizcarra, MD, medical director of the hospitalist group at St. Mary’s Healthcare, a 68-bed critical-care hospital in Pierre, S.D.
The group also discussed at length the difficulties in bringing doctors to small towns. Although compensation can be higher than in large urban centers, the group agreed that the “one-man show” aspect of working as a small-town hospitalist is a detractor.
“I hear it all the time,” said forum moderator Alan Himmelstein, a regional vice president for Sound Physicians. “I can take care of gunshot wounds, but I forgot everything I know about community-acquired pneumonia. You aren’t surrounded by 23 specialists; in rural communities, you guys are the top of the heap. Your skill set, by definition, has to make you comfortable to take care of everything that comes through the door. You don’t have another facility a half-hour away; a lot of your geography doesn’t allow helicopters to fly 365 days.”
Rural hospitalists, who as a group admit nearly 40% of all hospital admissions nationwide, also are looking for a voice. “We’re a huge constituency,” Dr. Johns said, “and we are under-represented.”
Jason Carris, editor of The Hospitalist, contributed to this report.
HM=Improved Patient Care
GRAPEVINE, Texas—The most successful companies tend to have superior branding. Starbucks owns coffee. Disney owns family fun. And hospitalists own patient-safety and quality-improvement (QI) initiatives within their hospitals.
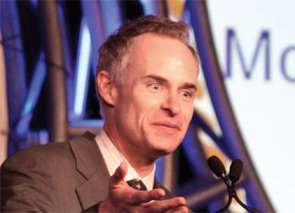
“We were pretty confident that if we embraced this, we would have a clear running field to ourselves,” says Robert Wachter, MD, MHM, professor, chief of the Division of Hospital Medicine, and chief of the Medical Service at the University of California at San Francisco Medical Center, former SHM president, and author of the Wachter’s World blog. “No other physician field would do the same thing, and by owning the patient-safety field, we would distinguish ourselves.”
Now comes the really hard part, though.
Three keynote speakers at HM11—Dr. Wachter, AMA President Cecil Wilson, MD, and Robert Kocher, MD, a healthcare policy advisor to President Obama—pointed to hospitalists as the physician cohort that can help shepherd the conceptual reform passed last year by Congress into daily practice in America’s hospitals. And all three also point to HM’s role at the vanguard of patient safety as a primary reason why.
Hurdles will arise, Dr. Wilson says. A solo practitioner most of his career, he says hospitalists can play a key role in the coming years as more patients receive insurance, but looming doctor shortages could stymie the cause. While many caution that the flood of newly insured patients will overburden primary-care physicians (PCPs), the expected shortage of physicians will plague HM as well.
“Hospitalists are primary-care physicians; the vast majority of them are general internists,” Dr. Wilson says. “… So when we say that the number of people who are going into primary care, particularly general internal medicine, is reducing, that reduces not only the pool of physicians in the community, but also the hospitalist pool. We’re in that boat together.”
Dr. Kocher, director of the McKinsey Center for U.S. Health System Reform in Washington, D.C., says hospitalists are in the best position to push for on-the-ground reform as they are the doctors who bridge all hospital departments, floors, and wards. He sees four broad areas where HM can take a particularly leading role:
- Increasing labor productivity. HM’s role as a link between specialties from cardiology to the pharmacy makes HM a natural conduit to push institutional values from a unique vantage point.
- Driving decision-making. Whether it’s recommending less costly drugs with similar outcomes, questioning whether expensive test batteries are truly necessary or being done for fear of missing something, or pausing to ask whether a “90-year-old hip replacement patient should receive orthopedic implants that will last far longer than their grandkids will be alive,” hospitalists can use their data to be a common-sense lynchpin of daily operations.
- Using technology to lower delivery costs. Many insurance companies are willing to enter into risk-based contracts with hospitals, but some hospital executives worry whether they will be able to perform well enough to justify the risk. “Hospitalists can help say, ‘We can do this. We can hit the thresholds.’ ”
- Shifting compensation models from “selling work RVUs to selling years of health.”
“The biggest thing [hospitalists] should begin doing,” Dr. Kocher adds, “is stop thinking about units of work, or RVUs, and start thinking about how much better patients can be by virtue of the care they’re delivering, how many readmissions are they avoiding, how many core measures/outcomes are they hitting, how much better is the patient experience, and how much smoother is the handoff.”
The push to improve quality and show better outcomes, of course, is intrinsically tied to payment reform. Bundled payments that reimburse a set fee for a case from pre-admission to a preset post-discharge deadline worry some hospitalists, who fear how the payments will be divvied up and who will be in charge of said payment decisions. Dr. Kocher says that even when the initial rules are set, the system is likely to evolve.
However, the hospitalist’s role as a driver of QI positions the field well, all three speakers noted. By quarterbacking patient handoffs and continuing to be seen by hospital executives as quality and safety leaders, HM groups can make the argument that they are worth the financial support they ask for in negotiations. Dr. Wachter adds that while quality research has become a staple of academics and residents, hospitalists should look to now tie value to the equation, effectively linking better patient outcomes to HM’s bottom line.
“There’s no question that physicians that can care for patients more efficiently, in a higher-quality way, in hospitals at lower costs, are going to do better no matter how the system evolves,” Dr. Kocher says. “I’m positive, as long as hospitalists are confident—and I think they should be—that they can deliver, more consistently, better care than those who aren’t hospitalists practicing in hospitals … and they’re going to do better economically.”
GRAPEVINE, Texas—The most successful companies tend to have superior branding. Starbucks owns coffee. Disney owns family fun. And hospitalists own patient-safety and quality-improvement (QI) initiatives within their hospitals.
“We were pretty confident that if we embraced this, we would have a clear running field to ourselves,” says Robert Wachter, MD, MHM, professor, chief of the Division of Hospital Medicine, and chief of the Medical Service at the University of California at San Francisco Medical Center, former SHM president, and author of the Wachter’s World blog. “No other physician field would do the same thing, and by owning the patient-safety field, we would distinguish ourselves.”
Now comes the really hard part, though.
Three keynote speakers at HM11—Dr. Wachter, AMA President Cecil Wilson, MD, and Robert Kocher, MD, a healthcare policy advisor to President Obama—pointed to hospitalists as the physician cohort that can help shepherd the conceptual reform passed last year by Congress into daily practice in America’s hospitals. And all three also point to HM’s role at the vanguard of patient safety as a primary reason why.
Hurdles will arise, Dr. Wilson says. A solo practitioner most of his career, he says hospitalists can play a key role in the coming years as more patients receive insurance, but looming doctor shortages could stymie the cause. While many caution that the flood of newly insured patients will overburden primary-care physicians (PCPs), the expected shortage of physicians will plague HM as well.
“Hospitalists are primary-care physicians; the vast majority of them are general internists,” Dr. Wilson says. “… So when we say that the number of people who are going into primary care, particularly general internal medicine, is reducing, that reduces not only the pool of physicians in the community, but also the hospitalist pool. We’re in that boat together.”
Dr. Kocher, director of the McKinsey Center for U.S. Health System Reform in Washington, D.C., says hospitalists are in the best position to push for on-the-ground reform as they are the doctors who bridge all hospital departments, floors, and wards. He sees four broad areas where HM can take a particularly leading role:
- Increasing labor productivity. HM’s role as a link between specialties from cardiology to the pharmacy makes HM a natural conduit to push institutional values from a unique vantage point.
- Driving decision-making. Whether it’s recommending less costly drugs with similar outcomes, questioning whether expensive test batteries are truly necessary or being done for fear of missing something, or pausing to ask whether a “90-year-old hip replacement patient should receive orthopedic implants that will last far longer than their grandkids will be alive,” hospitalists can use their data to be a common-sense lynchpin of daily operations.
- Using technology to lower delivery costs. Many insurance companies are willing to enter into risk-based contracts with hospitals, but some hospital executives worry whether they will be able to perform well enough to justify the risk. “Hospitalists can help say, ‘We can do this. We can hit the thresholds.’ ”
- Shifting compensation models from “selling work RVUs to selling years of health.”
“The biggest thing [hospitalists] should begin doing,” Dr. Kocher adds, “is stop thinking about units of work, or RVUs, and start thinking about how much better patients can be by virtue of the care they’re delivering, how many readmissions are they avoiding, how many core measures/outcomes are they hitting, how much better is the patient experience, and how much smoother is the handoff.”
The push to improve quality and show better outcomes, of course, is intrinsically tied to payment reform. Bundled payments that reimburse a set fee for a case from pre-admission to a preset post-discharge deadline worry some hospitalists, who fear how the payments will be divvied up and who will be in charge of said payment decisions. Dr. Kocher says that even when the initial rules are set, the system is likely to evolve.
However, the hospitalist’s role as a driver of QI positions the field well, all three speakers noted. By quarterbacking patient handoffs and continuing to be seen by hospital executives as quality and safety leaders, HM groups can make the argument that they are worth the financial support they ask for in negotiations. Dr. Wachter adds that while quality research has become a staple of academics and residents, hospitalists should look to now tie value to the equation, effectively linking better patient outcomes to HM’s bottom line.
“There’s no question that physicians that can care for patients more efficiently, in a higher-quality way, in hospitals at lower costs, are going to do better no matter how the system evolves,” Dr. Kocher says. “I’m positive, as long as hospitalists are confident—and I think they should be—that they can deliver, more consistently, better care than those who aren’t hospitalists practicing in hospitals … and they’re going to do better economically.”
HM11 BREAKOUT SESSIONS OVERVIEW


QUALITY
Utilizing Technology to Improve the Clinical and Operational Performance of Hospitalists
SPEAKERS: Jason Stein, MD, SFHM, associate vice chair for quality, Department of Medicine, Bryce Gartland, MD, FHM, associate director, section of hospital medicine, Emory University School of Medicine, Atlanta
In an age of increasing technology, just getting technology into a hospital isn’t the answer. It’s about integrating it into practice to improve care.
At Emory, the marriage of “low-tech solutions” and patented data displays has resulted in what Drs. Stein and Gartland call an accountable-care unit (ACU). The unit-based team features geographic ownership and structured interdisciplinary bedside rounds (SIBR). Perhaps more important, the unit generates real-time data captured on monitors, allowing teams of hospitalists, nonphysician providers (NPPs), residents, interns, and social workers to “visually digest immense amounts of information in a very short time period,” Dr. Gartland said.
Dr. Stein defined an ACU as a bounded geographic inpatient area responsible for the clinical, service, and cost outcomes it produces. To help manage beds, Emory instituted a system called “e-Bed,” a McKesson system that tracks room availability. The system shows whether rooms are occupied, being cleaned, or somewhere in between. It has icons to show whether patients are elsewhere in the hospital for treatment, as well as clinical data capacities. Unit teams round together and use a portable workstation or tablet computer to input clinical data, notes, or other comments into real-time dashboards that can then show everything from VTE prophylaxis to whether a patient is at high risk for falls.
The project has been in the works for several years, and Dr. Garltand noted that any hospitalists looking to push similar initiatives at their institution need to ensure that they have buy-in from providers and a commitment to seeing the project through.
“Timing is everything,” he said. “If we tried to force this … a few years ago, it would not have worked.”
PRACTICE MANAGEMENT
Recruiting and Retaining Hospitalists: Developing a Talent Facilitation Framework
SPEAKERS: Patrick Kneeland, MD, hospitalist, Providence Regional Medical Center, Everett, Wash.; Christine Kneeland, COO, Center Partners, Fort Collins, Colo.; Niraj Sehgal, associate professor of medicine, associate chair for quality and safety, Department of Medicine, University of California at San Francisco
Lincoln Godfrey, DO, a hospitalist at Baxter Regional Medical Center in Mountain Home, Ark., was sitting and listening to strategies to lure and keep hospitalists when his hospital CEO sent him a text asking how his recruiting efforts were going with a would-be hire.
“I said I’d get back to him,” Dr. Godfrey jokes.
The C-suite’s passion is understandable, though, as the fight to hire experienced staff outside of major markets continues to stymie many HM groups. Dr. Godfrey says he can’t hire anybody without first getting them to the Ozark Mountains to learn the hospital, its people, and its community.
“There’s going to be a limited talent pool of people who will come at all,” he says. “But I don’t get anybody who doesn’t work with us for a bit first.”
Christine Kneeland—Dr. Kneeland’s mother—said HM leaders tasked with their group’s personnel duties should focus on a few main concepts:
- Think outside the bank. Some physicians look only to earn as much as they can as quickly as they can, but many seek personal and professional satisfaction.
- Engagement is instrumental. A one-day orientation program for a lifetime job doesn’t sound like enough, does it?
In the coming years, hiring managers will have to focus on “millennials”—the generation of doctors born between 1977 and 1999—which Christine Kneeland described as tech-savvy doctors interested in a blended lifestyle of work and leisure. And while some might not agree with or understand their perspective, they’d better get used to it, she said. “The millennials are here, the workplace has changed, and they are leading that change,” she added. “Just embrace it.”
QUALITY
Patient Satisfaction: Tips for Improving Your HCAHPS Scores
MODERATORS: Win Whitcomb, MD, MHM, medical director of healthcare quality, Baystate Medical Center, Springfield, Mass.; Steven Deitelzweig, MD, MMM, SFHM, system chairman, Department of Hospital Medicine, regional vice president of medical affairs, Ochsner Health System, New Orleans
Patient satisfaction scores are a big deal right now, as many HM groups tie the scores to compensation and the federal government tethers the scores and a portion of hospital payment through the value-based purchasing (VBP) program.
So how does a hospitalist improve their HCAHPS score? Here’s what the experts said:
- Personalize things. Give a business card with a picture. Sit down. Smile. Ask the patient if they understand what you’ve said, and don’t get frustrated if they don’t.
- First and last. Make good impressions when introducing yourself to the patient and when it’s time to discharge or transition them to a different facility. “When the hospitalist hands a patient off,” Dr. Whitcomb said, “it doesn’t cut it to pull out your brochure of 40 practitioners when the patient asks, ‘Who am I going to see tomorrow?’”
- Be professional. Don’t vent about workplace issues in front of patients. Dr. Deitelzweig illustrated the point with the case of an elderly patient who got out of bed to help a practitioner they heard complaining about a heavy workload. The patient fell.
- Creative use of white space. Consider using in-room white boards to help keep patients informed of a day’s care plan.
David Jaworski, MD, director of the hospitalist service at Windham Hospital in Willimantic, Conn., says honesty was a key piece of advice he gleaned from the session.
“I think one of the things people appreciate the most when they’re in the hospital is being honest about our uncertainties,” he says. “I have had more people thank me for saying, ‘I don’t know, but we will find out by doing this, this, and this.’ ”
ACADEMIC
The Role of Hospital Medicine in Adapting to the New ACGME Requirements
SPEAKER: Jeff Wiese, MD, FACP, SFHM, associate professor of medicine at Tulane University Health Sciences Center, New Orleans
The new Accreditation Council for Graduate Medical Education (ACGME) work-hour rules that take effect July 1 have received a lot of attention since they were announced last summer. The guideline that has attracted the bulk of the attention limits intern shifts to 16 hours, with upper-level residents capped at 24 consecutive hours, with four hours of administrative follow-on allowed with the caveat that strategic napping is “strongly suggested.”
“I’m all for work hours,” said Dr. Wiese, immediate past president of SHM. “It’s the right thing to do; it’s safer. But I think we have to be careful we don’t super-fragment the system or double the intensity of the system. And on both of those plates, if you don’t do it right, what you end up with is people who will be ill-prepared.”
Dr. Wiese said an easy way to question the validity of one ACGME rule is to examine the guideline that limits a first-year resident’s census to 10 patients. He wondered which scenario offers more teaching opportunities: a roster of six chest-pain cases, two pneumonia cases, and two similarly familiar or relatively safe cases, or a resident with only four cases but each one having multiple comorbidities and complex decisions?
The new rules provide hospitals and HM groups an opportunity to change their way of thinking, adds Jeffrey Schnipper, MD, MPH, FHM, of Brigham and Women’s Hospital and Massachusetts General Hospital in Boston. “Every program has to change its entire way of doing business anyway, so let’s be at the table and say, ‘Well, while you’re redesigning your entire program, let’s inject patent safety and quality of care, and good pedagogy into the system,’” he says.
CLINICAL
Skin is In: Dermatological Images Every Hospitalist Should Recognize
MODERATOR: Paul Aronowitz, MD, FACP, internal medicine residency program director, California Pacific Medical Center, San Francisco
A patient comes into the ED with a blistering skin condition, but the diagnosis escapes the triage doctor on the case. The problem turns out to be bullosis diabeticorum, but the ED doc doesn’t know that yet and pushes to add a patient to the upstairs HM roster.
“The ED will usually try to admit because they’re worried [the patient has] some terrible drug eruption, but they can actually go home,” Dr. Aronowitz explained. “Hospitalists can help tell the difference.”
HM groups shouldn’t work to become amateur dermatologists, Dr. Aronowitz added. However, given that many hospitalists find themselves confronted by dermatologic cases several times a month, a rudimentary pedigree is a good idea to help sift out which cases require admission and which would take up bed space required for others.
He referred to it as knowing enough to know whether you know enough. “For sure, a hospitalist can diagnose a hypersensitivity reaction from a classic drug like Dilantin,” Dr. Aronowitz said, “and then stop the drug, because that would be one of the best things they could do.”
The session exposed hospitalists to dozens of images of skin conditions theymight come across in daily rounds, from snakebites to drug reactions to argyria.
“The idea is to help hospitalists recognize what’s serious and what’s not,” he said. “If you recognize those initial cutaneous clues, you can guide your antibiotic therapy, or whether you need antibiotics.”
CAREER
This Disease Is Easy; It’s the Patient Who’s Difficult
Speaker: Susan Block, chair, Department of Psychosocial Oncology and Palliative Care at Dana Farber Cancer Institute, Boston
Every physician will have their “button pushed” by a patient now and then, and hospitalists are in the unfortunate position of having little or no previous relationship with most patients, according to Dr. Block, a national expert in physician-patient conflict resolution who said “interpersonal challenges are an onerous part” of the job.
“We want to make sure we provide really good care to these patients, but it can be very challenging,” she said, noting that between 10% and 30% of patients in the healthcare setting present with difficult behaviors.
Whether it’s an empowered patient, a traumatized patient, an intrusive family member, or a patient with clear psychosocial issues, Dr. Block explained that “these patients can make physicians feel lousy. … Being aware of that and trying to stop that process is one of the key issues in professionalism and competence in working with difficult patients.”
She also warned hospitalists to recognize when they become a “magnet” for difficult patients, as many times the expert in the group will become the “go-to” doc. “I don’t think anyone can take care of a large panel of these patients; it’s just too much,” she said, noting you have to negotiate some limits or you will “burn out and lose perspective.”
Many doctors are very uncomfortable with scared or crying patients, Dr. Block said, explaining these are some of her most difficult patients. “Show me a patient in the hospital who isn’t scared,” she said. “Even it they aren’t, they are scared of dying.”
Other sources of workplace discomfort include the dependent or “needy” patient, the suspicious patient, and the extremely pushy patient. Dr. Block suggested setting clear boundaries with patients; she also noted physicians should be ready and willing to identify and reflect on your own emotions so that “you have the capacity to get perspective on the problem and keep yourself from being part of the problem.
“Limit-setting is one of the most therapeutic things you can do with difficult patients,” she said. “It feels to us as a form of sadism, as though we are punishing patients. But for many patients, the most dangerous, scary, and dysfunctional thing you can do for patients is not set limits.”
CLINICAL
The Art of Clinical Problem-Solving: Mystery Cases
SPEAKER: Gupreet Dhaliwal, MD, University of California at San Francisco
Humility, patience, and practice: Those are the keys to improving one’s clinical diagnostic skills, according to Dr. Dhaliwal, an acclaimed educator and clinician at UCSF who walked a packed room through two blind cases and encouraged hospitalists to work hard at their craft.
“If you want to reach your maximum potential, you have to view it the same way we do other things, the same way a great musician rehearses and a great soccer player scrimmages,” he said. “All of us are busy, but you either have to increase the number of cases you put your mind through, or you take the cases you have and you analyze them, you seek feedback, you try to improve the process around the diagnostic.
“The message isn’t always fun, because both of those things equal more work, but there is no way to hide it because there is no field in which people get better without more work.”
Dr. Dhaliwal says hospitalists should be “humble about diagnosis.” He explained that the more experienced people become, the more we shift from analytical reasoning, “thinking hard like we did when we were students and residents,” to intuitive reasoning, which “is basically saying, ‘I recognize a pattern, this is an old friend, I’ve seen gout before.’ I think any of us can be guilty of forgetting that it has pitfalls. And there is a whole list of cognitive biases that are associated with moving fast and building patterns.”
He also believes hospitalists who dedicate themselves to clinical greatness can parlay such improvement in the quality realm. “Every one of us has used diagnosis as a core part of our identity, but in terms of getting the community or other stakeholders behind improving diagnosis or improving judgment, I think the umbrella of quality and reducing diagnostic errors is the most appealing and most logical,” he says. “I think we start to take for granted we are good at it, but I think there are ways many of us, especially if we work at it, can become great at it.”
CLINICAL
The How, When, and Why of Noninvasive Ventilation
SPEAKER: Eric Siegal, MD, SFHM, critical care fellow, University of Wisconsin School of Medicine, Madison
Dr. Siegal’s review of literature in front of a packed crowd provided a road map to Noninvasive Positive Pressure Ventilation (NPPV) usage. In the end, NPPV should be a hospitalist’s first choice for patients with hypercarbic COPD exacerbations, and likely in patients with acute cardiogenic pulmonary edema, hypoxemic respiratory failure, immunocompromised patients, and pre-intubation patients.
Dr. Siegal stressed the use of NPPV in COPD, which has been studied thoroughly and “held up to repeated scrutiny.”
“If you put people on NPPV instead of intubating them … mortality is halved, intubation rate is less than half, treatment failure is much lower, you have a third of the complications, and huge reductions in length of stay,” Dr. Siegal said.
In the absence of contraindications, he stressed, NPPV should be the first line of therapy for patients with hypercarbic COPD exacerbations. “In fact, I would argue that you really should be asking yourself, ‘Why can’t I put these patients on NPPV?’ ” he asked, “because this has really shown to be life-saving.”
Dr. Siegal also explored recent findings on NPPV in acute cardiogenic pulmonary edema patients, which surprisingly showed “no better than supplemental oxygen.” He concluded that if your patient is not hypercarbic, “there is no advantage to adding pressure support.” He also said the benefit is more robust in ACPE patients who have acute coronary syndrome.
Dr. Siegal advised hospitalists to pick the right patients, start NPPV therapy early, and if the patient doesn’t improve within one or two hours, “it’s time to move on.”
QUALITY
Utilizing Technology to Improve the Clinical and Operational Performance of Hospitalists
SPEAKERS: Jason Stein, MD, SFHM, associate vice chair for quality, Department of Medicine, Bryce Gartland, MD, FHM, associate director, section of hospital medicine, Emory University School of Medicine, Atlanta
In an age of increasing technology, just getting technology into a hospital isn’t the answer. It’s about integrating it into practice to improve care.
At Emory, the marriage of “low-tech solutions” and patented data displays has resulted in what Drs. Stein and Gartland call an accountable-care unit (ACU). The unit-based team features geographic ownership and structured interdisciplinary bedside rounds (SIBR). Perhaps more important, the unit generates real-time data captured on monitors, allowing teams of hospitalists, nonphysician providers (NPPs), residents, interns, and social workers to “visually digest immense amounts of information in a very short time period,” Dr. Gartland said.
Dr. Stein defined an ACU as a bounded geographic inpatient area responsible for the clinical, service, and cost outcomes it produces. To help manage beds, Emory instituted a system called “e-Bed,” a McKesson system that tracks room availability. The system shows whether rooms are occupied, being cleaned, or somewhere in between. It has icons to show whether patients are elsewhere in the hospital for treatment, as well as clinical data capacities. Unit teams round together and use a portable workstation or tablet computer to input clinical data, notes, or other comments into real-time dashboards that can then show everything from VTE prophylaxis to whether a patient is at high risk for falls.
The project has been in the works for several years, and Dr. Garltand noted that any hospitalists looking to push similar initiatives at their institution need to ensure that they have buy-in from providers and a commitment to seeing the project through.
“Timing is everything,” he said. “If we tried to force this … a few years ago, it would not have worked.”
PRACTICE MANAGEMENT
Recruiting and Retaining Hospitalists: Developing a Talent Facilitation Framework
SPEAKERS: Patrick Kneeland, MD, hospitalist, Providence Regional Medical Center, Everett, Wash.; Christine Kneeland, COO, Center Partners, Fort Collins, Colo.; Niraj Sehgal, associate professor of medicine, associate chair for quality and safety, Department of Medicine, University of California at San Francisco
Lincoln Godfrey, DO, a hospitalist at Baxter Regional Medical Center in Mountain Home, Ark., was sitting and listening to strategies to lure and keep hospitalists when his hospital CEO sent him a text asking how his recruiting efforts were going with a would-be hire.
“I said I’d get back to him,” Dr. Godfrey jokes.
The C-suite’s passion is understandable, though, as the fight to hire experienced staff outside of major markets continues to stymie many HM groups. Dr. Godfrey says he can’t hire anybody without first getting them to the Ozark Mountains to learn the hospital, its people, and its community.
“There’s going to be a limited talent pool of people who will come at all,” he says. “But I don’t get anybody who doesn’t work with us for a bit first.”
Christine Kneeland—Dr. Kneeland’s mother—said HM leaders tasked with their group’s personnel duties should focus on a few main concepts:
- Think outside the bank. Some physicians look only to earn as much as they can as quickly as they can, but many seek personal and professional satisfaction.
- Engagement is instrumental. A one-day orientation program for a lifetime job doesn’t sound like enough, does it?
In the coming years, hiring managers will have to focus on “millennials”—the generation of doctors born between 1977 and 1999—which Christine Kneeland described as tech-savvy doctors interested in a blended lifestyle of work and leisure. And while some might not agree with or understand their perspective, they’d better get used to it, she said. “The millennials are here, the workplace has changed, and they are leading that change,” she added. “Just embrace it.”
QUALITY
Patient Satisfaction: Tips for Improving Your HCAHPS Scores
MODERATORS: Win Whitcomb, MD, MHM, medical director of healthcare quality, Baystate Medical Center, Springfield, Mass.; Steven Deitelzweig, MD, MMM, SFHM, system chairman, Department of Hospital Medicine, regional vice president of medical affairs, Ochsner Health System, New Orleans
Patient satisfaction scores are a big deal right now, as many HM groups tie the scores to compensation and the federal government tethers the scores and a portion of hospital payment through the value-based purchasing (VBP) program.
So how does a hospitalist improve their HCAHPS score? Here’s what the experts said:
- Personalize things. Give a business card with a picture. Sit down. Smile. Ask the patient if they understand what you’ve said, and don’t get frustrated if they don’t.
- First and last. Make good impressions when introducing yourself to the patient and when it’s time to discharge or transition them to a different facility. “When the hospitalist hands a patient off,” Dr. Whitcomb said, “it doesn’t cut it to pull out your brochure of 40 practitioners when the patient asks, ‘Who am I going to see tomorrow?’”
- Be professional. Don’t vent about workplace issues in front of patients. Dr. Deitelzweig illustrated the point with the case of an elderly patient who got out of bed to help a practitioner they heard complaining about a heavy workload. The patient fell.
- Creative use of white space. Consider using in-room white boards to help keep patients informed of a day’s care plan.
David Jaworski, MD, director of the hospitalist service at Windham Hospital in Willimantic, Conn., says honesty was a key piece of advice he gleaned from the session.
“I think one of the things people appreciate the most when they’re in the hospital is being honest about our uncertainties,” he says. “I have had more people thank me for saying, ‘I don’t know, but we will find out by doing this, this, and this.’ ”
ACADEMIC
The Role of Hospital Medicine in Adapting to the New ACGME Requirements
SPEAKER: Jeff Wiese, MD, FACP, SFHM, associate professor of medicine at Tulane University Health Sciences Center, New Orleans
The new Accreditation Council for Graduate Medical Education (ACGME) work-hour rules that take effect July 1 have received a lot of attention since they were announced last summer. The guideline that has attracted the bulk of the attention limits intern shifts to 16 hours, with upper-level residents capped at 24 consecutive hours, with four hours of administrative follow-on allowed with the caveat that strategic napping is “strongly suggested.”
“I’m all for work hours,” said Dr. Wiese, immediate past president of SHM. “It’s the right thing to do; it’s safer. But I think we have to be careful we don’t super-fragment the system or double the intensity of the system. And on both of those plates, if you don’t do it right, what you end up with is people who will be ill-prepared.”
Dr. Wiese said an easy way to question the validity of one ACGME rule is to examine the guideline that limits a first-year resident’s census to 10 patients. He wondered which scenario offers more teaching opportunities: a roster of six chest-pain cases, two pneumonia cases, and two similarly familiar or relatively safe cases, or a resident with only four cases but each one having multiple comorbidities and complex decisions?
The new rules provide hospitals and HM groups an opportunity to change their way of thinking, adds Jeffrey Schnipper, MD, MPH, FHM, of Brigham and Women’s Hospital and Massachusetts General Hospital in Boston. “Every program has to change its entire way of doing business anyway, so let’s be at the table and say, ‘Well, while you’re redesigning your entire program, let’s inject patent safety and quality of care, and good pedagogy into the system,’” he says.
CLINICAL
Skin is In: Dermatological Images Every Hospitalist Should Recognize
MODERATOR: Paul Aronowitz, MD, FACP, internal medicine residency program director, California Pacific Medical Center, San Francisco
A patient comes into the ED with a blistering skin condition, but the diagnosis escapes the triage doctor on the case. The problem turns out to be bullosis diabeticorum, but the ED doc doesn’t know that yet and pushes to add a patient to the upstairs HM roster.
“The ED will usually try to admit because they’re worried [the patient has] some terrible drug eruption, but they can actually go home,” Dr. Aronowitz explained. “Hospitalists can help tell the difference.”
HM groups shouldn’t work to become amateur dermatologists, Dr. Aronowitz added. However, given that many hospitalists find themselves confronted by dermatologic cases several times a month, a rudimentary pedigree is a good idea to help sift out which cases require admission and which would take up bed space required for others.
He referred to it as knowing enough to know whether you know enough. “For sure, a hospitalist can diagnose a hypersensitivity reaction from a classic drug like Dilantin,” Dr. Aronowitz said, “and then stop the drug, because that would be one of the best things they could do.”
The session exposed hospitalists to dozens of images of skin conditions theymight come across in daily rounds, from snakebites to drug reactions to argyria.
“The idea is to help hospitalists recognize what’s serious and what’s not,” he said. “If you recognize those initial cutaneous clues, you can guide your antibiotic therapy, or whether you need antibiotics.”
CAREER
This Disease Is Easy; It’s the Patient Who’s Difficult
Speaker: Susan Block, chair, Department of Psychosocial Oncology and Palliative Care at Dana Farber Cancer Institute, Boston
Every physician will have their “button pushed” by a patient now and then, and hospitalists are in the unfortunate position of having little or no previous relationship with most patients, according to Dr. Block, a national expert in physician-patient conflict resolution who said “interpersonal challenges are an onerous part” of the job.
“We want to make sure we provide really good care to these patients, but it can be very challenging,” she said, noting that between 10% and 30% of patients in the healthcare setting present with difficult behaviors.
Whether it’s an empowered patient, a traumatized patient, an intrusive family member, or a patient with clear psychosocial issues, Dr. Block explained that “these patients can make physicians feel lousy. … Being aware of that and trying to stop that process is one of the key issues in professionalism and competence in working with difficult patients.”
She also warned hospitalists to recognize when they become a “magnet” for difficult patients, as many times the expert in the group will become the “go-to” doc. “I don’t think anyone can take care of a large panel of these patients; it’s just too much,” she said, noting you have to negotiate some limits or you will “burn out and lose perspective.”
Many doctors are very uncomfortable with scared or crying patients, Dr. Block said, explaining these are some of her most difficult patients. “Show me a patient in the hospital who isn’t scared,” she said. “Even it they aren’t, they are scared of dying.”
Other sources of workplace discomfort include the dependent or “needy” patient, the suspicious patient, and the extremely pushy patient. Dr. Block suggested setting clear boundaries with patients; she also noted physicians should be ready and willing to identify and reflect on your own emotions so that “you have the capacity to get perspective on the problem and keep yourself from being part of the problem.
“Limit-setting is one of the most therapeutic things you can do with difficult patients,” she said. “It feels to us as a form of sadism, as though we are punishing patients. But for many patients, the most dangerous, scary, and dysfunctional thing you can do for patients is not set limits.”
CLINICAL
The Art of Clinical Problem-Solving: Mystery Cases
SPEAKER: Gupreet Dhaliwal, MD, University of California at San Francisco
Humility, patience, and practice: Those are the keys to improving one’s clinical diagnostic skills, according to Dr. Dhaliwal, an acclaimed educator and clinician at UCSF who walked a packed room through two blind cases and encouraged hospitalists to work hard at their craft.
“If you want to reach your maximum potential, you have to view it the same way we do other things, the same way a great musician rehearses and a great soccer player scrimmages,” he said. “All of us are busy, but you either have to increase the number of cases you put your mind through, or you take the cases you have and you analyze them, you seek feedback, you try to improve the process around the diagnostic.
“The message isn’t always fun, because both of those things equal more work, but there is no way to hide it because there is no field in which people get better without more work.”
Dr. Dhaliwal says hospitalists should be “humble about diagnosis.” He explained that the more experienced people become, the more we shift from analytical reasoning, “thinking hard like we did when we were students and residents,” to intuitive reasoning, which “is basically saying, ‘I recognize a pattern, this is an old friend, I’ve seen gout before.’ I think any of us can be guilty of forgetting that it has pitfalls. And there is a whole list of cognitive biases that are associated with moving fast and building patterns.”
He also believes hospitalists who dedicate themselves to clinical greatness can parlay such improvement in the quality realm. “Every one of us has used diagnosis as a core part of our identity, but in terms of getting the community or other stakeholders behind improving diagnosis or improving judgment, I think the umbrella of quality and reducing diagnostic errors is the most appealing and most logical,” he says. “I think we start to take for granted we are good at it, but I think there are ways many of us, especially if we work at it, can become great at it.”
CLINICAL
The How, When, and Why of Noninvasive Ventilation
SPEAKER: Eric Siegal, MD, SFHM, critical care fellow, University of Wisconsin School of Medicine, Madison
Dr. Siegal’s review of literature in front of a packed crowd provided a road map to Noninvasive Positive Pressure Ventilation (NPPV) usage. In the end, NPPV should be a hospitalist’s first choice for patients with hypercarbic COPD exacerbations, and likely in patients with acute cardiogenic pulmonary edema, hypoxemic respiratory failure, immunocompromised patients, and pre-intubation patients.
Dr. Siegal stressed the use of NPPV in COPD, which has been studied thoroughly and “held up to repeated scrutiny.”
“If you put people on NPPV instead of intubating them … mortality is halved, intubation rate is less than half, treatment failure is much lower, you have a third of the complications, and huge reductions in length of stay,” Dr. Siegal said.
In the absence of contraindications, he stressed, NPPV should be the first line of therapy for patients with hypercarbic COPD exacerbations. “In fact, I would argue that you really should be asking yourself, ‘Why can’t I put these patients on NPPV?’ ” he asked, “because this has really shown to be life-saving.”
Dr. Siegal also explored recent findings on NPPV in acute cardiogenic pulmonary edema patients, which surprisingly showed “no better than supplemental oxygen.” He concluded that if your patient is not hypercarbic, “there is no advantage to adding pressure support.” He also said the benefit is more robust in ACPE patients who have acute coronary syndrome.
Dr. Siegal advised hospitalists to pick the right patients, start NPPV therapy early, and if the patient doesn’t improve within one or two hours, “it’s time to move on.”
HM11 Special Report: Pediatric Perils
Pediatric hospitalists demonstrated their leadership and ownership of clinical hospital medicine on this year’s pediatric track at HM11.
Joel Tieder, MD, MPH, advocated for a balanced and risk-based approach to apparent life-threatening events (ALTEs). Although the differential for this observer-defined symptom remains broad, a link to perhaps the most worrisome outcome, sudden infant death syndrome (SIDS), has not been borne out in the medical literature. Testing seldom offers conclusive answers, Dr. Tieder said in his review.
Thus, a risk-based approach to guide work-up is prudent. Young age and a history of recurrent events are two factors that could signify risk for worrisome underlying pathology, to include infection and nonaccidental trauma. Dr. Tieder has worked with SHM to organize and lead an expert panel that hopes to release a white paper on this topic in the future.
John Pope, MD, Kris Rehm, MD, and Brian Alverson, MD, collectively presented an update on the top articles of the year relevant to pediatric HM.
Highlights included:
- The potential utility of the Pediatric Early Warning Score in identifying clinical deterioration;
- A reduction in symptoms in patients with irritable bowel syndrome given Lactobacillus GG;
- The positive impact of an antimicrobial stewardship program on vancomycin usage;
- The utility of the clinical examination in deciding whether a lumbar puncture is warranted to evaluate for bacterial meningitis in patients presenting with complex febrile seizures; and
- The adequacy of short-term IV antibiotic therapy in young infants with UTIs.
Dr. Alverson provided an update on the development of clinical practice guidelines for community-acquired pneumonia in children, highlighting his participation on a committee cosponsored by the Pediatric Infectious Disease Society and the Infectious Disease Society of America. Laboratory and radiographic data rarely clarify the diagnosis of clinical pneumonia and are not as useful in the outpatient setting but may be justified to look for complications in children who are hospitalized, he reported.
Other take-home points:
- Antimicrobial therapy in uncomplicated pneumonia should primarily target pneumococcus;
- Ampicillin and amoxicillin penetrate lung tissue well, and in high dosages can overcome most pneumococcal resistance; and
- Management of mycoplasma in children remains controversial and requires further investigation.
- The final guidelines are expected to be published sometime toward the end of the year.
Dr. Shen is pediatric editor of The Hospitalist.
Something for Everyone
GRAPEVINE, Texas—Femi Adewunmi, MD, MBA, SFHM, might land a new job as a multisite medical director because of it. Amaka Nweke, MD, might have gained an idea for a new committee for her hospital from it. And Randa Perkins, MD, is going to lead one long brown-bag lunch thanks to it.
Everyone gets something different out of SHM’s annual meeting, a four-day bazaar of CME, plenary sessions, and breakout sessions akin to one-hour crash courses that follow clinical, academic, practice management, pediatric, and quality tracks.
The Hospitalist sat down with three attendees to break down what each took home from HM11.
New Year, New Job?
A veteran of multiple annual meetings, Dr. Adewunmi usually splits his time between breakout sessions and networking. But this year, the former medical director of the hospitalist service at Johnston Medical Center in Smithfield, N.C., says he’s looking to step up from a single-site leadership position to a regional head. So the mission was more about networking than note-taking.
“It’s been invaluable for me at this point,” Dr. Adewunmi says, “as I navigate and decide what the next steps should be in terms of my career progression.”
Of course, that progression meant using his time-management skills to hold discussions with potential employers.
“I was in and out,” he says, noting he’s been doing locum tenens work for several months as he weighs his next move. “Sometimes, if you want to have the time to meet one-on-one [at the exhibitor hall]without the crowd and the distractions, it’s probably easier and better to go in between sessions.”
Dr. Adewunmi, a newly seated member of Team Hospitalist, says he met with eight to 10 of the largest HM firms during the meeting. He leveraged contacts he’s built over the years, and also used relationships with SHM staff to make introductions. He thinks employers appreciate the annual meeting for the same reason.
“It’s one spot where rather than trying to fly in 10 or 20 candidates every month or every few weeks, you can just come in one spot and interview several people … or put your feelers out,” he says. “It works both ways.”
Dr. Adewunmi can’t be sure his networking will be successful. He plans to keep working locums with one potential employer so both sides can get to know each other. But even if nothing pans out, between the clinical sessions he attended and the relationships he either built or strengthened, he says he’s glad he came again to the annual meeting.
“This, for me, has always been the best resource in terms of place you could come to one stop and get a little bit of everything,” he adds. “It’s like a buffet.”

Meet and Greet, Over and Over
Dr. Nweke, assistant site director for Hospitalists Management Group at Kenosha Medical Center in Wisconsin, wasn’t going to let her first meeting overwhelm her. She laid out her agenda early, planning to attend as many practice management and leadership classes as she could. When she arrived, she sat through talks including “Understanding Your Hospital’s Key Financial Drivers,” “Hiding in Plain Sight,” and “Introduction to QI Methodology.”
But it was a session on basic tips to improve patient-satisfaction scores that gave her the most feedback.
“There are a lot of things you kind of instinctively know just as a human being as opposed to being a physician,” Dr. Nweke says. “It’s only polite that you shake the hand of the person you’re meeting and you smile at them, as opposed to being a grouch. But it’s interesting to hear what questions are asked in the patient surveys. While I was there, I actually sat thinking from a patient’s perspective: ‘What would I be looking for in my hospital?’ ”
Dr. Nweke admittedly felt a bit frustrated with some sessions, as she’d hoped to extract more advanced tips. However, she had no complaints about the networking opportunities. Everywhere she turned, she says, she had the chance to discuss ideas with new faces.
“I’ve randomly met people, introduced myself to people, and talked about different challenges,” she says. “For someone like me, it’s really very important because I’m at the bottom of the totem pole, so to speak, as far as leadership.”
One bit of practical advice Dr. Nweke learned from meeting someone was the idea of a medical records committee. One of her new contacts chairs such a committee, which prompted Dr. Nweke to check in with her hospital while the annual meeting was happening. Turns out, her hospital doesn’t have a similar committee. Yet.
“Maybe this might be something I could throw out there and say, ‘How about we do this or that?’ ” Dr. Nweke adds, “whatever it might be, little things that I could do to improve and add some value and worth to my program, and our relationship with the hospital.”
A Kid in a Candy Store
If Dr. Perkins ever becomes president of the society, HM11 will be why. A self-proclaimed lame-duck chief resident at Tallahassee Memorial’s Family Medicine Residency Program in Florida, she’d already signed her first contract as a hospitalist and starts the job in August. Yet she didn’t know about SHM or the annual meeting until shortly before it started, when a community physician mentioned it to her.
So she booked a room at a nearby hotel (the 1,551-room Gaylord Texan Resort and Convention Center having filled up early) and spent the last of her CME money on HM11. She had trouble picking out any specific tips she wanted to take home to her new practice, Tallahassee Memorial HealthCare Hospitalists Group, as she had so many.
She sat in a recruitment session just to have things to tell her new boss. She took feverish notes during a presentation on best practices in the ICU because she’ll be spending a lot of time there. And during a meet-and-greet pairing residents with potential mentors, she befriended Daniel Dressler, MD, MSc, SFHM, an SHM board member, HM11’s course director, and academic hospitalist heavyweight at Emory University Hospital in Atlanta.
“It’s kind of like when you start any adventure, you don’t have everything laid out in a guidebook,” Dr. Perkins says. “You just kind of have to put your feet out there and start moving and hope to God that things fall into your lap sometimes. This conference kind of did. This is kind of my guidebook, this is my compass, this is what I can look to when I’m trying to figure out how to make my own path in the specialty.”
Dr. Perkins adds that the fraternal feel of HM11 makes her feel like she chose the right specialty. Given all of the research talk, she might even start pushing her 12-member hospitalist group to begin more projects that could “help our community.”
“All the educational opportunities that were at the conference pulled me into it and then, all of a sudden, all these resources are laid out in front of me,” she adds. “I’m literally a kid in a candy store with access to data and information and guides. It’s great.” TH
GRAPEVINE, Texas—Femi Adewunmi, MD, MBA, SFHM, might land a new job as a multisite medical director because of it. Amaka Nweke, MD, might have gained an idea for a new committee for her hospital from it. And Randa Perkins, MD, is going to lead one long brown-bag lunch thanks to it.
Everyone gets something different out of SHM’s annual meeting, a four-day bazaar of CME, plenary sessions, and breakout sessions akin to one-hour crash courses that follow clinical, academic, practice management, pediatric, and quality tracks.
The Hospitalist sat down with three attendees to break down what each took home from HM11.
New Year, New Job?
A veteran of multiple annual meetings, Dr. Adewunmi usually splits his time between breakout sessions and networking. But this year, the former medical director of the hospitalist service at Johnston Medical Center in Smithfield, N.C., says he’s looking to step up from a single-site leadership position to a regional head. So the mission was more about networking than note-taking.
“It’s been invaluable for me at this point,” Dr. Adewunmi says, “as I navigate and decide what the next steps should be in terms of my career progression.”
Of course, that progression meant using his time-management skills to hold discussions with potential employers.
“I was in and out,” he says, noting he’s been doing locum tenens work for several months as he weighs his next move. “Sometimes, if you want to have the time to meet one-on-one [at the exhibitor hall]without the crowd and the distractions, it’s probably easier and better to go in between sessions.”
Dr. Adewunmi, a newly seated member of Team Hospitalist, says he met with eight to 10 of the largest HM firms during the meeting. He leveraged contacts he’s built over the years, and also used relationships with SHM staff to make introductions. He thinks employers appreciate the annual meeting for the same reason.
“It’s one spot where rather than trying to fly in 10 or 20 candidates every month or every few weeks, you can just come in one spot and interview several people … or put your feelers out,” he says. “It works both ways.”
Dr. Adewunmi can’t be sure his networking will be successful. He plans to keep working locums with one potential employer so both sides can get to know each other. But even if nothing pans out, between the clinical sessions he attended and the relationships he either built or strengthened, he says he’s glad he came again to the annual meeting.
“This, for me, has always been the best resource in terms of place you could come to one stop and get a little bit of everything,” he adds. “It’s like a buffet.”
Meet and Greet, Over and Over
Dr. Nweke, assistant site director for Hospitalists Management Group at Kenosha Medical Center in Wisconsin, wasn’t going to let her first meeting overwhelm her. She laid out her agenda early, planning to attend as many practice management and leadership classes as she could. When she arrived, she sat through talks including “Understanding Your Hospital’s Key Financial Drivers,” “Hiding in Plain Sight,” and “Introduction to QI Methodology.”
But it was a session on basic tips to improve patient-satisfaction scores that gave her the most feedback.
“There are a lot of things you kind of instinctively know just as a human being as opposed to being a physician,” Dr. Nweke says. “It’s only polite that you shake the hand of the person you’re meeting and you smile at them, as opposed to being a grouch. But it’s interesting to hear what questions are asked in the patient surveys. While I was there, I actually sat thinking from a patient’s perspective: ‘What would I be looking for in my hospital?’ ”
Dr. Nweke admittedly felt a bit frustrated with some sessions, as she’d hoped to extract more advanced tips. However, she had no complaints about the networking opportunities. Everywhere she turned, she says, she had the chance to discuss ideas with new faces.
“I’ve randomly met people, introduced myself to people, and talked about different challenges,” she says. “For someone like me, it’s really very important because I’m at the bottom of the totem pole, so to speak, as far as leadership.”
One bit of practical advice Dr. Nweke learned from meeting someone was the idea of a medical records committee. One of her new contacts chairs such a committee, which prompted Dr. Nweke to check in with her hospital while the annual meeting was happening. Turns out, her hospital doesn’t have a similar committee. Yet.
“Maybe this might be something I could throw out there and say, ‘How about we do this or that?’ ” Dr. Nweke adds, “whatever it might be, little things that I could do to improve and add some value and worth to my program, and our relationship with the hospital.”
A Kid in a Candy Store
If Dr. Perkins ever becomes president of the society, HM11 will be why. A self-proclaimed lame-duck chief resident at Tallahassee Memorial’s Family Medicine Residency Program in Florida, she’d already signed her first contract as a hospitalist and starts the job in August. Yet she didn’t know about SHM or the annual meeting until shortly before it started, when a community physician mentioned it to her.
So she booked a room at a nearby hotel (the 1,551-room Gaylord Texan Resort and Convention Center having filled up early) and spent the last of her CME money on HM11. She had trouble picking out any specific tips she wanted to take home to her new practice, Tallahassee Memorial HealthCare Hospitalists Group, as she had so many.
She sat in a recruitment session just to have things to tell her new boss. She took feverish notes during a presentation on best practices in the ICU because she’ll be spending a lot of time there. And during a meet-and-greet pairing residents with potential mentors, she befriended Daniel Dressler, MD, MSc, SFHM, an SHM board member, HM11’s course director, and academic hospitalist heavyweight at Emory University Hospital in Atlanta.
“It’s kind of like when you start any adventure, you don’t have everything laid out in a guidebook,” Dr. Perkins says. “You just kind of have to put your feet out there and start moving and hope to God that things fall into your lap sometimes. This conference kind of did. This is kind of my guidebook, this is my compass, this is what I can look to when I’m trying to figure out how to make my own path in the specialty.”
Dr. Perkins adds that the fraternal feel of HM11 makes her feel like she chose the right specialty. Given all of the research talk, she might even start pushing her 12-member hospitalist group to begin more projects that could “help our community.”
“All the educational opportunities that were at the conference pulled me into it and then, all of a sudden, all these resources are laid out in front of me,” she adds. “I’m literally a kid in a candy store with access to data and information and guides. It’s great.” TH
What Corticosteroid is Most Appropriate for treating Acute Exacerbations of CoPD?
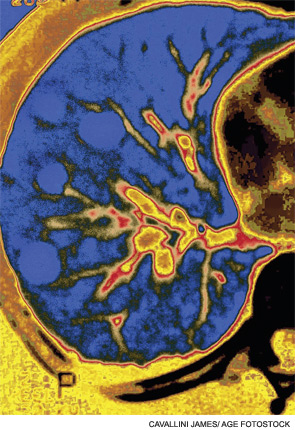
Case
A 66-year-old Caucasian female with moderate chronic obstructive pulmonary disease (COPD) (FEV1 55% predicted), obesity, hypertension, and Type 2 diabetes mellitus on insulin therapy presents to the ED with four days of increased cough productive of yellow sputum and progressive shortness of breath. Her physical exam is notable for an oxygen saturation of 87% on room air, along with diffuse expiratory wheezing with use of accessory muscles; her chest X-ray is unchanged from previous. The patient is given oxygen, nebulized bronchodilators, and one dose of IV methylprednisolone. Her symptoms do not improve significantly, and she is admitted for further management. What regimen of corticosteroids is most appropriate to treat her acute exacerbation of COPD?
Overview
COPD is the fourth-leading cause of death in the United States and continues to increase in prevalence.1 Acute exacerbations of COPD (AECOPD) contribute significantly to this high mortality rate, which approaches 40% at one year in those patients requiring mechanical support.1 An exacerbation of COPD has been defined as an acute change in a patient’s baseline dyspnea, cough, and/or sputum beyond day-to-day variability sufficient to warrant a change in therapy.2 Exacerbations commonly occur in COPD patients and often necessitate hospital admission. In fact, COPD consistently is one of the 10 most common reasons for hospitalization, with billions of dollars in associated healthcare costs.3
The goals for inpatient management of AECOPD are to provide acute symptom relief and to minimize the potential for subsequent exacerbations. These are accomplished via a multifaceted approach, including the use of bronchodilators, antibiotics, supplemental oxygen, noninvasive positive pressure ventilation in certain circumstances, and systemic corticosteroids.
The administration of systemic steroids in AECOPD has been prevalent for several decades, with initial studies showing positive effects on lung function, specifically FEV1.4 Studies have demonstrated the benefit of steroids in prolonging the time to subsequent exacerbation, reducing the rate of treatment failure, and reducing length of stay (LOS).5 Corticosteroids have since become an essential component of the standard of care in AECOPD management.
Despite consensus that systemic steroids should be used in COPD exacerbations, a great deal of controversy still surrounds the optimal steroid regimen.6 Steroid use is not without risk, as steroids can lead to adverse outcomes in medically complex hospitalized patients (see Table 1, below). Current guidelines provide limited guidance as to the optimal route of administration, dosing regimen, or length of therapy; clinical practice varies widely.
Review of the Data
Administration route: intravenous (IV) vs. oral. The use of steroids in AECOPD began with such IV formulations as methylprednisolone, and this became the typical method of treating hospitalized patients. This practice was validated in a multicenter Veterans Affairs trial, which demonstrated decreased risk of treatment failure (defined as all-cause mortality, need for intubation, readmission for COPD, or intensification of pharmacologic therapy) for patients randomized to receive an IV-to-oral steroid regimen compared with those randomized to placebo.5 Patients receiving steroids also had shorter LOS and improvements in FEV1 after the first day of treatment. Subsequent randomized controlled trials in patients with AECOPD demonstrated the benefit of oral regimens compared with placebo with regard to FEV1, LOS, and risk of treatment failure.6,7,8
Similarities in the bioavailability of oral and IV steroids have been known for a long time.9 Comparisons in efficacy initially were completed in the management of acute asthma exacerbations, with increasing evidence, including a meta-analysis, demonstrating no difference in improvement in pulmonary function and in preventing relapse of exacerbations for oral compared with IV steroids.10 However, only recently have oral and IV steroids been compared in the treatment of AECOPD. De Jong et al randomized more than 200 patients hospitalized for AECOPD to 60 mg of either IV or oral prednisolone for five days, followed by a week of an oral taper.11 There were no significant differences in treatment failure between the IV and oral groups (62% vs. 56%, respectively, at 90 days; one-sided lower bound of the 95% confidence interval [CI], −5.8%).
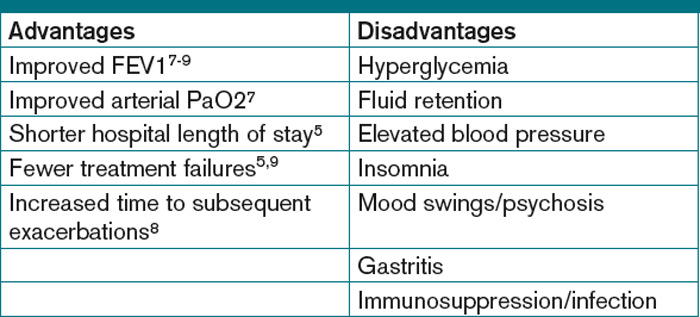
A large observational study by Lindenauer et al, including nearly 80,000 AECOPD patients admitted at more than 400 hospitals, added further support to the idea that oral and IV steroids were comparable in efficacy.12 In this study, multivariate analysis found no difference in treatment failure between oral and IV groups (odds ratio [OR] 0.93; 95% CI, 0.84-1.02). The authors also found, however, that current clinical practice still overwhelmingly favors intravenous steroids, with 92% of study patients initially being administered IV steroids.12
Based on the evidence from de Jong and Lindenauer, it appears that there is no significant benefit to the use of IV over oral steroids. Additionally, there is evidence for oral administration being associated with beneficial effects on cost and hospital LOS.12 Oral steroids, therefore, are the preferred route of administration to treat a hospitalized patient with AECOPD, unless the patient is unable to tolerate oral medications. Current guidelines support the practice of giving oral steroids as first-line treatment for AECOPD (see Table 2, above).
High dose vs. low dose. Another important clinical issue concerns the dosing of steroids. The randomized trials examining the use of corticosteroids in AECOPD vary widely in the dosages studied. Further, the majority of these trials have compared steroids to placebo, rather than comparing different dosage regimens. The agents studied have included prednisone, prednisolone, methylprednisolone, and hydrocortisone, or combinations thereof. In order to compare regimens of these different drugs, steroid doses often are converted into prednisone equivalents (see Table 3, below). Though no guidelines define “high dose” and “low dose,” some studies have designated doses of >80 mg prednisone equivalents daily as high-dose and prednisone equivalents of ≤80 mg daily as low-dose.13,14
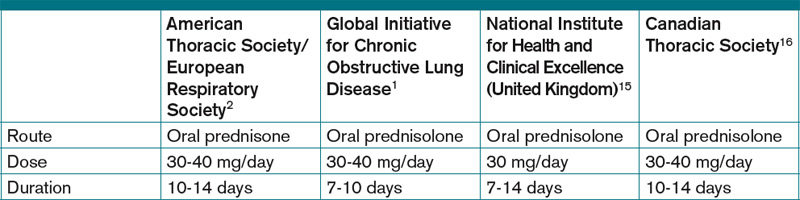
Starting doses of systemic corticosteroids in the treatment of AECOPD in clinical studies range from prednisone equivalents of 30 mg daily to 625 mg on the first day of treatment.5,8 No randomized studies of high- versus low-dose steroid regimens have been conducted. One retrospective chart review of 145 AECOPD admissions evaluated outcomes among patients who were given higher (mean daily dose >80 mg prednisone equivalent) and lower (mean daily dose of ≤80 mg prednisone) doses.14 The authors found that patients who received higher doses of steroids had significantly longer LOS compared with those who received lower doses, especially among the subset of patients who were admitted to the floor rather than the ICU, though this analysis did not adjust for severity of illness. In this study, the most striking finding noted by the authors was the wide variability in the steroid doses prescribed for the inpatient treatment of AECOPD.
More recently, the study by Lindenauer et al examined outcomes between patients treated with high-dose IV steroids (equivalent of 120 mg-800 mg of prednisone on the first or second day of treatment) compared to low-dose oral steroids (prednisone equivalents of 20 mg-80 mg per day).12 The authors found no differences between the two groups regarding the rate of treatment failure, defined by initiation of mechanical ventilation after the second hospital day, in-hospital mortality, or readmission for COPD within 30 days of discharge. After multivariate adjustment, including the propensity for oral treatment, the low-dose oral therapy group was found to have lower risk of treatment failure, shorter LOS, and lower total hospital cost.
Despite the heterogeneity of the published data and the lack of randomized trials, the existing evidence suggests that low-dose prednisone (or equivalent) is similar in efficacy to higher doses and generally is associated with shorter hospital stays. Recognizing these benefits, guidelines do favor initiating treatment with low-dose steroids in patients admitted with AECOPD. The most recent publications from the American Thoracic Society/European Respiratory Society Task Force (ATS/ERS), the Global Initiative for Chronic Obstructive Lung Disease (GOLD), the National Clinical Guidelines Centre in the United Kingdom, and the Canadian Thoracic Society all recommend equivalent dosing of prednisone in patients admitted with AECOPD who are able to tolerate oral intake (see Table 2).1,2,15,16
Duration. As with the dosing of systemic corticosteroids in AECOPD, the optimal duration of treatment is not well-established. National and international consensus panels vary in their recommendations, as outlined in Table 2. This may be related to the variability in length of treatment found in the literature.
Treatment durations ranging from one day to eight weeks have been studied in inpatients with AECOPD. The landmark randomized controlled trial by Niewoehner and colleagues compared two-week and eight-week courses of systemic corticosteroids and found no difference in the rates of treatment failure, which included death, need for mechanical ventilation, readmission for COPD, and intensification of pharmacologic therapy.5 Based on these results, many experts have concluded that there is no benefit to steroid courses lasting beyond two weeks.
Although improvements in outcomes have been demonstrated with corticosteroid regimens as short as three days compared with placebo, most of the randomized controlled trials have included courses of seven to 14 days.4 Given the risks of adverse events (e.g. hyperglycemia) that are associated with systemic administration of steroids, the shortest effective duration should be considered.
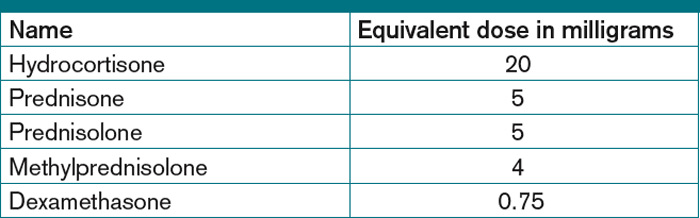
In both clinical practice and clinical studies, steroid regimens often include a taper. A study by Vondracek and Hemstreet found that 79% of hospital discharges for AECOPD included a tapered corticosteroid regimen.14 From a physiologic standpoint, durations of corticosteroid treatment approximately three weeks or less, regardless of dosage, should not lead to adrenal suppression.17 There also is no evidence to suggest that abrupt discontinuation of steroids leads to clinical worsening of disease, and complicated steroid tapers are a potential source of medication errors after hospital discharge.18 Furthermore, the clinical guidelines do not address the tapering of corticosteroids. Therefore, there is a lack of evidence advocating for or against the use of tapered steroid regimens in AECOPD.
Back to the Case
In addition to standard treatment modalities for AECOPD, our patient was administered oral prednisone 40 mg daily. She experienced steroid-induced hyperglycemia, which was corrected with adjustment of her insulin regimen. The patient’s pulmonary symptoms improved within 72 hours, and she was discharged home on hospital day four to complete a seven-day steroid course. At hospital discharge, she was administered influenza and pneumococcal vaccinations, and she was instructed to resume her usual insulin dosing once she finished her prednisone course.
Overview
In the management of AECOPD, there remains a lack of consensus in defining the ideal steroid regimen. Based on current literature, the use of low-dose oral corticosteroids, such as prednisone 40 mg daily, for a seven- to 14-day course is recommended. TH
Dr. Cunningham is an assistant professor of internal medicine and academic hospitalist in the section of hospital medicine at Vanderbilt University School of Medicine in Nashville, Tenn. Dr. LaBrin is an assistant professor of internal medicine and pediatrics and academic hospitalist at Vanderbilt University School of Medicine.
References
- From the Global Strategy for the Diagnosis, Management and Prevention of COPD, Global Initiative for Chronic Obstructive Lung Disease (GOLD) 2010. Global Initiative for Chronic Obstructive Lung Disease website. Available at: www.goldcopd.org/GuidelineItem.asp?intId=989. Accessed Feb. 21, 2011.
- Celli BR, MacNee W, ATS/ERS Task Force. Standards for the diagnosis and treatment of patients with COPD: a summary of the ATS/ERS position paper. Eur Respir J. 2004;23:932-946.
- Morbidity and mortality: 2009 chart book on cardiovascular, lung, and blood diseases. National Institutes of Health’s National Heart, Lung, and Blood Institute website. Available at: www.nhlbi.nih.gov/resources/docs/2009_ChartBook.pdf. Accessed Feb. 24, 2011.
- Albert RK, Martin TR, Lewis SW. Controlled trial of methylprednisolone in patients with chronic bronchitis and acute respiratory insufficiency. Ann Intern Med. 1980;92(6):753-758.
- Niewoehner DE, Erbland ML, Deupree RH, et al. Effect of systemic glucocorticoids on exacerbations of chronic obstructive pulmonary disease. Department of Veterans Affairs Cooperative Study Group. N Engl J Med. 1999;340(25):1941-1947.
- Thompson WH, Nielson C, Carvalho P, Charan NB, Crowley JJ. Controlled trial of oral prednisone in outpatients with acute COPD exacerbation. Am J Respir Crit Care Med. 1996;154:407-412.
- Seemungal TA, Donaldson GC, Bhowmik A, Jeffries DJ, Wedzicha JA. Time course and recovery of exacerbations in patients with chronic obstructive pulmonary disease. Am J Respir Crit Care Med. 2000;161:1608-1613.
- Davies L, Angus RM, Calverley PM. Oral corticosteroids in patients admitted to hospital with exacerbations of chronic obstructive pulmonary disease: a prospective randomised controlled trial. Lancet. 1999;354(9177):456-460.
- Al-Habet S, Rogers HJ. Pharmacokinetics of intravenous and oral prednisolone. Br J Clin Pharmacol. 1980;10(5):503-508.
- Rowe BH, Keller JL, Oxman AD. Effectiveness of steroid therapy in acute exacerbations of asthma: a meta-analysis. Am J Emerg Med. 1992;10:301-310.
- De Jong YP, Uil SM, Grotjohan HP, Postma DS, Kerstjens HA, van den Berg JW. Oral or IV prednisolone in the treatment of COPD exacerbations: A randomized, controlled, double-blind study. Chest. 2007;132(6):1741-1747.
- Lindenauer PK, Pekow PS, Lahti MC, Lee Y, Benjamin EM, Rothberg MB. Association of corticosteroid dose and route of administration with risk of treatment failure in acute exacerbation of chronic obstructive pulmonary disease. JAMA. 2010;303(23):2359-2367.
- Manser R, Reid D, Abramsom MJ. Corticosteroids for acute severe asthma in hospitalized patients. Cochrane Database Syst Rev. 2000;(2):CD001740.
- Vondracek SF, Hemstreet BA. Retrospective evaluation of systemic corticosteroids for the management of acute exacerbations of chronic obstructive pulmonary disease. Am J Health Syst Pharm. 2006;63:645-652.
- Chronic obstructive pulmonary disease: management of chronic obstructive pulmonary disease in adults in primary and secondary care. National Institute for Health and Clinical Excellence website. Available at: guidance.nice.org.uk/CG101/Guidance/pdf/English. Accessed Feb. 21, 2011.
- O’Donnell DE, Aaron S, Bourbeau J, et al. Canadian Thoracic Society recommendations for management of chronic obstructive pulmonary disease—2007 update. Can Respir J. 2007;14 Suppl B:5B-32B.
- Webb J, Clark TJ. Recovery of plasma corticotrophin and cortisol levels after three-week course of prednisolone. Thorax. 1981;36:22-24.
- O’Driscoll BR, Kalra S, Wilson M, Pickering CA, Carroll KB, Woodcock AA. Double-blind trial of steroid tapering in acute asthma. Lancet. 1993; 341:324-7.
Case
A 66-year-old Caucasian female with moderate chronic obstructive pulmonary disease (COPD) (FEV1 55% predicted), obesity, hypertension, and Type 2 diabetes mellitus on insulin therapy presents to the ED with four days of increased cough productive of yellow sputum and progressive shortness of breath. Her physical exam is notable for an oxygen saturation of 87% on room air, along with diffuse expiratory wheezing with use of accessory muscles; her chest X-ray is unchanged from previous. The patient is given oxygen, nebulized bronchodilators, and one dose of IV methylprednisolone. Her symptoms do not improve significantly, and she is admitted for further management. What regimen of corticosteroids is most appropriate to treat her acute exacerbation of COPD?
Overview
COPD is the fourth-leading cause of death in the United States and continues to increase in prevalence.1 Acute exacerbations of COPD (AECOPD) contribute significantly to this high mortality rate, which approaches 40% at one year in those patients requiring mechanical support.1 An exacerbation of COPD has been defined as an acute change in a patient’s baseline dyspnea, cough, and/or sputum beyond day-to-day variability sufficient to warrant a change in therapy.2 Exacerbations commonly occur in COPD patients and often necessitate hospital admission. In fact, COPD consistently is one of the 10 most common reasons for hospitalization, with billions of dollars in associated healthcare costs.3
The goals for inpatient management of AECOPD are to provide acute symptom relief and to minimize the potential for subsequent exacerbations. These are accomplished via a multifaceted approach, including the use of bronchodilators, antibiotics, supplemental oxygen, noninvasive positive pressure ventilation in certain circumstances, and systemic corticosteroids.
The administration of systemic steroids in AECOPD has been prevalent for several decades, with initial studies showing positive effects on lung function, specifically FEV1.4 Studies have demonstrated the benefit of steroids in prolonging the time to subsequent exacerbation, reducing the rate of treatment failure, and reducing length of stay (LOS).5 Corticosteroids have since become an essential component of the standard of care in AECOPD management.
Despite consensus that systemic steroids should be used in COPD exacerbations, a great deal of controversy still surrounds the optimal steroid regimen.6 Steroid use is not without risk, as steroids can lead to adverse outcomes in medically complex hospitalized patients (see Table 1, below). Current guidelines provide limited guidance as to the optimal route of administration, dosing regimen, or length of therapy; clinical practice varies widely.
Review of the Data
Administration route: intravenous (IV) vs. oral. The use of steroids in AECOPD began with such IV formulations as methylprednisolone, and this became the typical method of treating hospitalized patients. This practice was validated in a multicenter Veterans Affairs trial, which demonstrated decreased risk of treatment failure (defined as all-cause mortality, need for intubation, readmission for COPD, or intensification of pharmacologic therapy) for patients randomized to receive an IV-to-oral steroid regimen compared with those randomized to placebo.5 Patients receiving steroids also had shorter LOS and improvements in FEV1 after the first day of treatment. Subsequent randomized controlled trials in patients with AECOPD demonstrated the benefit of oral regimens compared with placebo with regard to FEV1, LOS, and risk of treatment failure.6,7,8
Similarities in the bioavailability of oral and IV steroids have been known for a long time.9 Comparisons in efficacy initially were completed in the management of acute asthma exacerbations, with increasing evidence, including a meta-analysis, demonstrating no difference in improvement in pulmonary function and in preventing relapse of exacerbations for oral compared with IV steroids.10 However, only recently have oral and IV steroids been compared in the treatment of AECOPD. De Jong et al randomized more than 200 patients hospitalized for AECOPD to 60 mg of either IV or oral prednisolone for five days, followed by a week of an oral taper.11 There were no significant differences in treatment failure between the IV and oral groups (62% vs. 56%, respectively, at 90 days; one-sided lower bound of the 95% confidence interval [CI], −5.8%).
A large observational study by Lindenauer et al, including nearly 80,000 AECOPD patients admitted at more than 400 hospitals, added further support to the idea that oral and IV steroids were comparable in efficacy.12 In this study, multivariate analysis found no difference in treatment failure between oral and IV groups (odds ratio [OR] 0.93; 95% CI, 0.84-1.02). The authors also found, however, that current clinical practice still overwhelmingly favors intravenous steroids, with 92% of study patients initially being administered IV steroids.12
Based on the evidence from de Jong and Lindenauer, it appears that there is no significant benefit to the use of IV over oral steroids. Additionally, there is evidence for oral administration being associated with beneficial effects on cost and hospital LOS.12 Oral steroids, therefore, are the preferred route of administration to treat a hospitalized patient with AECOPD, unless the patient is unable to tolerate oral medications. Current guidelines support the practice of giving oral steroids as first-line treatment for AECOPD (see Table 2, above).
High dose vs. low dose. Another important clinical issue concerns the dosing of steroids. The randomized trials examining the use of corticosteroids in AECOPD vary widely in the dosages studied. Further, the majority of these trials have compared steroids to placebo, rather than comparing different dosage regimens. The agents studied have included prednisone, prednisolone, methylprednisolone, and hydrocortisone, or combinations thereof. In order to compare regimens of these different drugs, steroid doses often are converted into prednisone equivalents (see Table 3, below). Though no guidelines define “high dose” and “low dose,” some studies have designated doses of >80 mg prednisone equivalents daily as high-dose and prednisone equivalents of ≤80 mg daily as low-dose.13,14
Starting doses of systemic corticosteroids in the treatment of AECOPD in clinical studies range from prednisone equivalents of 30 mg daily to 625 mg on the first day of treatment.5,8 No randomized studies of high- versus low-dose steroid regimens have been conducted. One retrospective chart review of 145 AECOPD admissions evaluated outcomes among patients who were given higher (mean daily dose >80 mg prednisone equivalent) and lower (mean daily dose of ≤80 mg prednisone) doses.14 The authors found that patients who received higher doses of steroids had significantly longer LOS compared with those who received lower doses, especially among the subset of patients who were admitted to the floor rather than the ICU, though this analysis did not adjust for severity of illness. In this study, the most striking finding noted by the authors was the wide variability in the steroid doses prescribed for the inpatient treatment of AECOPD.
More recently, the study by Lindenauer et al examined outcomes between patients treated with high-dose IV steroids (equivalent of 120 mg-800 mg of prednisone on the first or second day of treatment) compared to low-dose oral steroids (prednisone equivalents of 20 mg-80 mg per day).12 The authors found no differences between the two groups regarding the rate of treatment failure, defined by initiation of mechanical ventilation after the second hospital day, in-hospital mortality, or readmission for COPD within 30 days of discharge. After multivariate adjustment, including the propensity for oral treatment, the low-dose oral therapy group was found to have lower risk of treatment failure, shorter LOS, and lower total hospital cost.
Despite the heterogeneity of the published data and the lack of randomized trials, the existing evidence suggests that low-dose prednisone (or equivalent) is similar in efficacy to higher doses and generally is associated with shorter hospital stays. Recognizing these benefits, guidelines do favor initiating treatment with low-dose steroids in patients admitted with AECOPD. The most recent publications from the American Thoracic Society/European Respiratory Society Task Force (ATS/ERS), the Global Initiative for Chronic Obstructive Lung Disease (GOLD), the National Clinical Guidelines Centre in the United Kingdom, and the Canadian Thoracic Society all recommend equivalent dosing of prednisone in patients admitted with AECOPD who are able to tolerate oral intake (see Table 2).1,2,15,16
Duration. As with the dosing of systemic corticosteroids in AECOPD, the optimal duration of treatment is not well-established. National and international consensus panels vary in their recommendations, as outlined in Table 2. This may be related to the variability in length of treatment found in the literature.
Treatment durations ranging from one day to eight weeks have been studied in inpatients with AECOPD. The landmark randomized controlled trial by Niewoehner and colleagues compared two-week and eight-week courses of systemic corticosteroids and found no difference in the rates of treatment failure, which included death, need for mechanical ventilation, readmission for COPD, and intensification of pharmacologic therapy.5 Based on these results, many experts have concluded that there is no benefit to steroid courses lasting beyond two weeks.
Although improvements in outcomes have been demonstrated with corticosteroid regimens as short as three days compared with placebo, most of the randomized controlled trials have included courses of seven to 14 days.4 Given the risks of adverse events (e.g. hyperglycemia) that are associated with systemic administration of steroids, the shortest effective duration should be considered.
In both clinical practice and clinical studies, steroid regimens often include a taper. A study by Vondracek and Hemstreet found that 79% of hospital discharges for AECOPD included a tapered corticosteroid regimen.14 From a physiologic standpoint, durations of corticosteroid treatment approximately three weeks or less, regardless of dosage, should not lead to adrenal suppression.17 There also is no evidence to suggest that abrupt discontinuation of steroids leads to clinical worsening of disease, and complicated steroid tapers are a potential source of medication errors after hospital discharge.18 Furthermore, the clinical guidelines do not address the tapering of corticosteroids. Therefore, there is a lack of evidence advocating for or against the use of tapered steroid regimens in AECOPD.
Back to the Case
In addition to standard treatment modalities for AECOPD, our patient was administered oral prednisone 40 mg daily. She experienced steroid-induced hyperglycemia, which was corrected with adjustment of her insulin regimen. The patient’s pulmonary symptoms improved within 72 hours, and she was discharged home on hospital day four to complete a seven-day steroid course. At hospital discharge, she was administered influenza and pneumococcal vaccinations, and she was instructed to resume her usual insulin dosing once she finished her prednisone course.
Overview
In the management of AECOPD, there remains a lack of consensus in defining the ideal steroid regimen. Based on current literature, the use of low-dose oral corticosteroids, such as prednisone 40 mg daily, for a seven- to 14-day course is recommended. TH
Dr. Cunningham is an assistant professor of internal medicine and academic hospitalist in the section of hospital medicine at Vanderbilt University School of Medicine in Nashville, Tenn. Dr. LaBrin is an assistant professor of internal medicine and pediatrics and academic hospitalist at Vanderbilt University School of Medicine.
References
- From the Global Strategy for the Diagnosis, Management and Prevention of COPD, Global Initiative for Chronic Obstructive Lung Disease (GOLD) 2010. Global Initiative for Chronic Obstructive Lung Disease website. Available at: www.goldcopd.org/GuidelineItem.asp?intId=989. Accessed Feb. 21, 2011.
- Celli BR, MacNee W, ATS/ERS Task Force. Standards for the diagnosis and treatment of patients with COPD: a summary of the ATS/ERS position paper. Eur Respir J. 2004;23:932-946.
- Morbidity and mortality: 2009 chart book on cardiovascular, lung, and blood diseases. National Institutes of Health’s National Heart, Lung, and Blood Institute website. Available at: www.nhlbi.nih.gov/resources/docs/2009_ChartBook.pdf. Accessed Feb. 24, 2011.
- Albert RK, Martin TR, Lewis SW. Controlled trial of methylprednisolone in patients with chronic bronchitis and acute respiratory insufficiency. Ann Intern Med. 1980;92(6):753-758.
- Niewoehner DE, Erbland ML, Deupree RH, et al. Effect of systemic glucocorticoids on exacerbations of chronic obstructive pulmonary disease. Department of Veterans Affairs Cooperative Study Group. N Engl J Med. 1999;340(25):1941-1947.
- Thompson WH, Nielson C, Carvalho P, Charan NB, Crowley JJ. Controlled trial of oral prednisone in outpatients with acute COPD exacerbation. Am J Respir Crit Care Med. 1996;154:407-412.
- Seemungal TA, Donaldson GC, Bhowmik A, Jeffries DJ, Wedzicha JA. Time course and recovery of exacerbations in patients with chronic obstructive pulmonary disease. Am J Respir Crit Care Med. 2000;161:1608-1613.
- Davies L, Angus RM, Calverley PM. Oral corticosteroids in patients admitted to hospital with exacerbations of chronic obstructive pulmonary disease: a prospective randomised controlled trial. Lancet. 1999;354(9177):456-460.
- Al-Habet S, Rogers HJ. Pharmacokinetics of intravenous and oral prednisolone. Br J Clin Pharmacol. 1980;10(5):503-508.
- Rowe BH, Keller JL, Oxman AD. Effectiveness of steroid therapy in acute exacerbations of asthma: a meta-analysis. Am J Emerg Med. 1992;10:301-310.
- De Jong YP, Uil SM, Grotjohan HP, Postma DS, Kerstjens HA, van den Berg JW. Oral or IV prednisolone in the treatment of COPD exacerbations: A randomized, controlled, double-blind study. Chest. 2007;132(6):1741-1747.
- Lindenauer PK, Pekow PS, Lahti MC, Lee Y, Benjamin EM, Rothberg MB. Association of corticosteroid dose and route of administration with risk of treatment failure in acute exacerbation of chronic obstructive pulmonary disease. JAMA. 2010;303(23):2359-2367.
- Manser R, Reid D, Abramsom MJ. Corticosteroids for acute severe asthma in hospitalized patients. Cochrane Database Syst Rev. 2000;(2):CD001740.
- Vondracek SF, Hemstreet BA. Retrospective evaluation of systemic corticosteroids for the management of acute exacerbations of chronic obstructive pulmonary disease. Am J Health Syst Pharm. 2006;63:645-652.
- Chronic obstructive pulmonary disease: management of chronic obstructive pulmonary disease in adults in primary and secondary care. National Institute for Health and Clinical Excellence website. Available at: guidance.nice.org.uk/CG101/Guidance/pdf/English. Accessed Feb. 21, 2011.
- O’Donnell DE, Aaron S, Bourbeau J, et al. Canadian Thoracic Society recommendations for management of chronic obstructive pulmonary disease—2007 update. Can Respir J. 2007;14 Suppl B:5B-32B.
- Webb J, Clark TJ. Recovery of plasma corticotrophin and cortisol levels after three-week course of prednisolone. Thorax. 1981;36:22-24.
- O’Driscoll BR, Kalra S, Wilson M, Pickering CA, Carroll KB, Woodcock AA. Double-blind trial of steroid tapering in acute asthma. Lancet. 1993; 341:324-7.
Good Advice, Bad Advice?

Do you view your medical school and residency training the same way I see mine? I think I received really good training and education in the clinical knowledge base (e.g. which tests and drugs are useful in pneumonia) but really poor training and guidance into how to get the job done efficiently and organize my career. My problem was an inability to separate the good and bad advice about organizing my work; I essentially tried to follow all advice.
An energetic ENT attending who really seemed to care about students and trainees told me during my third year of medical school that failure to palpate the floor of the mouth on every new patient was a failure to do an adequate exam, not just on the ENT service but also on every patient in the hospital. While less dogmatic about it, he also encouraged documenting the presence or absence of a Darwinian tubercle. So I was determined to do these things—on all patients. No shortcuts for me!
But on my next rotation a few weeks later, I noticed that none of the neurosurgery attendings palpated the floor of the mouth on their patients. I stopped doing it routinely not long after.
By the time I was a resident, I was catching on to the fact that, like the ENT attending, my superiors were sometimes providing misguided, or even bad, advice. Meanwhile, I got a little better at knowing the difference. If I didn’t hear the same advice from multiple people, I gave it much less credibility. But if enough different people gave me advice, I typically accepted it as well-founded and tried to follow it.
Bad Advice: Keeping Up with the Literature
There must have been dozens of people who told me that the best strategy to keep up with the medical literature was to pick one, maybe two, medical journals with original scientific research and read all the articles in every issue. So that is exactly what I tried to do.
But after a few years, I decided that “pick one journal and read every issue” was bad advice. I think it is a poor way for most doctors in community practice to keep up with the latest and most important information. How many of us can really understand the strengths and weaknesses of study design and statistics? For example, outside of those who spend their career writing and analyzing original research (and are proficient in the complex and counterintuitive statistics they contain), how many of us have been able to make sense of all the conflicting studies of perioperative beta-blocker use? Outcomes of these studies vary a lot. So what should we do in clinical practice?
Better Advice: Keep Up with Literature
I finally concluded that in the pre-Internet era, the best way to keep up was to let academicians and researchers study the original research articles and write review articles, editorials, and letters to the editor. These seemed to pay much greater dividends in improving my clinical practice.
The traditional literature sources I’ve relied on for these kinds of articles are the New England Journal of Medicine, Annals of Internal Medicine, and the Cleveland Clinic Journal of Medicine. The latter is my favorite; it provides concise articles written to address very focused questions that come up all the time in my practice.
Since the arrival of the Internet, there are so many more ways to keep up with literature other than just deciding which journals and articles you’ll read. I’ll leave it to others to provide thoughts about that.
Get a Gimmick: Good Advice?
It was a tradition in my residency that at the end of a month “on the wards,” the attending (who rounded with us seven days a week for the whole month) took the whole team out to lunch or dinner. I think this once-common tradition has largely disappeared as a result of both the residency work-hour restrictions and attendings usually staying “on service” for only a couple of weeks, rather than the whole month. Right? (I’d love to hear from someone at a place where the attending-led, end-of-the-month team social event is still a common practice.)
On every such occasion, I would ask the attending, “What do you know now about ensuring a good career as a doctor that you wish you knew when you were a resident?” A number of the attendings didn’t seem willing to give it much thought: “I dunno,” most would say. “Maybe just make sure to leave time for nonprofessional activities like regular exercise.” Others gave generic advice: “Be sure to keep up with the literature.”
But one successful GI attending surprised me. When asked to provide career advice, he said, “Get a gimmick.” This is not what a young and idealistic trainee wanted to hear. A gimmick sounds like cheating or taking a shortcut.
He went on to explain that he meant that focusing only on being a good doctor for the next patient on your list, although it might be the most important thing you can do, might not be enough to keep your career interesting and energizing. So he advocated for finding an additional special interest, such as becoming a super-expert in a particular disease (e.g. you’re the snakebite expert at your hospital) or becoming a quality-improvement (QI) expert for your institution.
I’ve since fully embraced this idea and consider it among the best pearls of wisdom I’ve collected in my career. But “gimmick” is probably the wrong word choice; maybe it’s better to just say that you should get a special interest.
It would be best if you are the only one, or one of only a few, who pursues an area of interest at your institution. It can be rewarding to be the “go-to guy” for certain issues. And it might even lead to invitations to speak on the topic elsewhere, additional compensation, etc.
For nonacademic hospitalists, most of us will see our direct-patient-care activities as the core of what defines our career. I do many things other than patient care, but when I’m asked by a stranger about my occupation, I almost always end up talking about being a doctor who takes care of hospitalized patients. But my non-patient-care activities, my “gimmicks,” have been vitally important and satisfying components of my career.
If I were an attending at an end-of-the-month dinner with my team, I would talk with them about the value of developing these additional interests as part of a healthy and balanced career. TH
Dr. Nelson has been a practicing hospitalist since 1988 and is co-founder and past president of SHM. He is a principal in Nelson Flores Hospital Medicine Consultants, a national hospitalist practice management consulting firm (www.nelsonflores.com). He is course co-director and faculty for SHM’s “Best Practices in Managing a Hospital Medicine Program.” This column represents his views and is not intended to reflect an official position of SHM.