Introduction Mark H. Einstein, MD, MS, Chair Director, Clinical Research Division of Gynecologic Oncology Department of Obstetrics and Gynecology and Women's Health Montefiore Medical Center Bronx, N.Y. Dr Einstein has received clinical grants from GlaxoSmithKline, Merck & Co., Inc., and Tigris Pharmaceuticals, Inc.
Milestones in Cervical Cancer Detection and Prevention: Significance in Clinical Practice Mark H. Einstein, MD, MS, Chair
Improving HSIL and Glandular Disease Detection: What the Recent Data Show Richard Lozano, MD Director of Cytology Pathology and Cytology Laboratories, Inc. Lexington, Ky. Dr Lozano has nothing to disclose. and Harold J. Sauer, MD, FACOG Associate Professor and Acting Chair Department of Obstetrics and Gynecology and Reproductive Biology Michigan State University Lansing Dr Sauer has nothing to disclose.
Weighing the Costs and Benefits: Technologic Advances in Cervical Cancer Screening Warner K. Huh, MD, FACOG, FACS Assistant Professor Division of Gynecologic Oncology University of Alabama at Birmingham Dr Huh has received clinical grants from 3M Pharmaceuticals, Cytyc Corporation, GlaxoSmithKline, MGI PHARMA, Merck, Roche Molecular Systems, and Tigris Pharmaceuticals. He is a consultant to GlaxoSmithKline, MGI PHARMA, Roche Molecular Systems, and mtm laboratories AG.
Efficacy of HPV Screening Versus Liquid-Based Cervical Cytology and Imaging: What the Data Really Show Michael Karram, MD, FACOG President and Medical Director Seven Hills Women's Health Centers Cincinnati, Ohio Dr Karram has nothing to disclose. and Michael L. Krychman, MD Associate Clinical Attending Sexual Medicine Program Memorial Sloan-Kettering Cancer Center New York, N.Y. Dr Krychman is a consultant to Cytyc.
• Nutritional Gaps for Women in the United States • Role of Obstetricians and Gynecologists in Women's Health Care Faculty/Faculty Disclosures
Linda D. Bradley MD Vice Chair, Obstetrics Gynecology & Women's Health Institute Cleveland Clinic Cleveland, OH Dr. Bradley is a consultant for Xanodyne Pharmaceuticals, Inc.
Beth Reardon, MS, RD, LDN Integrative Nutritionist Duke Integrative Nutrition Durham, NC Dr. Reardon has nothing to disclose.
John M. Thorp, Jr., MD McAllister Distinguished Professor Department of Obstetrics and Gynecology University of North Carolina at Chapel Hill Chapel Hill, NC Dr. Thorp has nothing to disclose.
Barbara A. Underwood, PhD Adjunct Professor of Nutrition Columbia University Institute of Human Nutrition New York, NY Dr. Underwood has nothing to disclose.
Fernando E. Viteri, MD, ScD Professor (Emeritus) Department of Nutritional Sciences and Toxicology University of California Berkeley, CA and Scientist Children's Hospital Oakland Research Institute Oakland, CA Dr. Viteri has received clinical grant funding from the University of California Institute for Mexico and the United States.
The Changing Landscape of Cervical Cancer Screening and Implications for the Clinician
A supplement to Ob.Gyn. News. This educational supplement was supported by an educational grant from CYTYC Corporation. The articles are based on clinical dialogues with the faculty.
Implications of Computer-Assisted Cervical Screening for the Ob.Gyn. Clinician Co-Chairs: Randall K. Gibb, MD Assistant Professor, Division of Gynecologic Oncology Washington University School of Medicine St. Louis, Mo.
Thomas J. Herzog, MD Director, Division of Gynecologic Oncology Columbia University College of Physicians and Surgeons New York, N.Y.
Comparison of Manual and Image-Directed Screening of Liquid-Based Cervical Cytology in a Large Metropolitan Cytology Practice James R. Lingle, MD Lingle, Gore, and Harding, P.C. Englewood, Colo.
Fern S. Miller, MSN, CT(ASCP) Cytology Manager, Cytology Department Metropolitan Pathologists Denver, Colo.
Performance of a Computer-Assisted Imaging System in Detecting High-Grade Squamous Intraepithelial Lesions Bruce R. Dziura, MD Chief of Pathology New England Pathology Associates Mercy Medical Center Springfield, Mass
Timothy Kelly Fitzpatrick, MD Attending Physician Mercy Medical Center Springfield, Mass.
Evaluation of a Computer-Assisted Imaging System in Diagnosing Uncommon Malignancies Andrea E. Dawson, MD Staff Pathologist Cleveland Clinic Foundation Cleveland, Ohio
Holly L. Thacker, MD Director, Women's Health Center Cleveland Clinic Foundation Cleveland, Ohio
Chronic Dysfunctional Uterine Bleeding: Identifying Patients and Helping Them Understand Their Treatment Options
A supplement to Ob.Gyn. News. Supported by an educational grant from Gynecare Worldwide, a division of Ethicon, Inc., a Johnson & Johnson Company. The articles in this supplement are based on clinical dialogues with the faculty.
Types, Patterns, and Causes of Abnormal Uterine Bleeding
• Evaluating the Endometrial Cavity
Treatment Options: Entering the Dialogue
• Medical Therapy
• Surgical Interventions
• Endometrial Ablation Procedures
Considering Cases:
• An Overweight Patient
• A Patient Who Prefers to Avoid Hysterectomy
• A Patient With Postsurgical HMB
Helping Patients Choose
Conclusion
Faculty/Faculty Disclosure Statement
Mary Jane Minkin, MD, FACOG, Chair Clinical Professor Department of Obstetrics and Gynecology Yale University School of Medicine New Haven, Conn. Developed a Web site for Gynecare; Speaker's Bureau: Berlex, Inc.
Charles E. Miller, MD, FACOG Clinical Associate Professor Department of Obstetrics and Gynecology University of Illinois at Chicago Clinical Associate Department of Obstetrics and Gynecology University of Chicago Consultant: Gynecare Worldwide.
Malcolm G. Munro, MD, FRCS(c), FACOG Professor Department of Obstetrics and Gynecology The David Geffen School of Medicine at UCLA Los Angeles Attending Staff Department of Obstetrics and Gynecology Kaiser Permanente Los Angeles Medical Center Received Funding for Clinical Grants: Kaiser Research Foundation and Karl Storz Endoscopy-America, Inc.M Consultant: Boston Scientific Corporation, Gynecare, and Karl Storz Endoscopy.
Robert K. Zurawin, MD, FACOG Associate Professor Department of Obstetrics and Gynecology Baylor College of Medicine Houston Consultant/Speaker: Gynecare Worldwide.
Hospital discharge can be hazardous because discontinuity and fragmentation of care increase risks to the patient. Inadequate communication has been identified as a major etiology for errors and adverse events occurring shortly after discharge.1, 2 Another potential result of a failed hospital discharge is patient dissatisfaction. Increased patient involvement in care improves health outcomes, and may improve patient satisfaction.3 To engage patients in their care, healthcare providers must collaborate with patients to coordinate care across settings.
In this study, we sought to determine what patients and their caregivers view as essential elements of a safe and high‐quality discharge process. We developed a survey with a broad range of questions related to the hospital discharge process (see Supporting Information, Appendix A, in the online version of this article). The survey included several questions derived from Project BOOST (Better Outcomes for Older adults through Safe Transitions) discharge care plans.4
METHODS
Study Design
We surveyed patients on the second day of admission to the internal medicine wards at the University of Washington Medical Center (a 450‐bed tertiary care teaching hospital) and Harborview Medical Center (a 412‐bed county teaching hospital) from June 1, 2010 to August 1, 2010. All patients 18 years old who were admitted during weekdays were considered for participation. Any potential participant unable to manually fill out the survey was offered the opportunity to use a proxy to help complete the survey. A proxy was any adult support person who was present in the room at the time the patient was approached with the opportunity to participate. Patients were excluded only if they (or their proxies) could not read English. The second day of hospitalization was chosen for several reasons: 1) to attempt to assess patients at a similar point in their hospital stay; 2) to avoid the day of discharge, as this may have introduced confounders such as patients who were actively engaged in the discharge process; and 3) to avoid the day of admission to increase the likelihood that patients would be medically stable at the time of the survey.
The Survey
The study protocol was reviewed and approved by the University of Washington Committee for the Protection of Human Subjects. All subjects gave verbal informed consent. The survey consisted of 3 sections: demographics, questions gauging the importance of various key points in the discharge process to patients, and open‐ended questions. Responses to questions used a Likert scale. Responses to open‐ended questions were handwritten on the paper survey.
Statistical Analysis
The quantitative data were classified categorically and analyzed using Fisher's exact test. Three investigators (M.S., S.E.M., M.B.J.) individually reviewed and coded all written patient or proxy comments using grounded theory methodology.5 Discrepant coding was identified and reconciled. The reconciled coded comments were aggregated into themes.
RESULTS
Demographics
We screened 240 patients or proxies and 200 completed the survey; 10.4% were ineligible due to language barrier, and 6.3% refused. Ninety‐two percent of patients completed the surveys. A majority were male (62.5%), 1859 years old (80%); spoke English as their first language (66%); were community‐dwelling prior to hospitalization (59%); were followed by a primary care provider (PCP) (53%), and many had at least a 4‐year‐college education (45%). One hundred eighty‐five surveys (92.5%) were completed by patients, and 15 (7.5%) were completed by proxies. Ninety surveys were completed at the county teaching hospital, and 110 surveys were completed at the tertiary teaching hospital. See Table 1 for detailed demographic information.
Patient Demographic Characteristics
Patient age, n (%)
1859 yr
160 (80)
6069 yr
30 (15)
7079 yr
5 (2.5)
80 and older
5 (2.5)
Patient gender, n (%)
Male
125 (62.5)
Female
75 (37.5)
Patient schooling, n (%)
Less than high school
20 (10)
High school
50 (25)
Two‐year college
40 (20)
Four‐year college
70 (35)
Graduate education
20 (10)
English is patient's first language, n (%)
Yes
132 (66)
No
68 (34)
Patient has a primary care doctor, n (%)
Yes
106 (53)
No
94 (47)
Patient's residence before hospitalization, n (%)
Home without home health
64 (32)
Home with home health
54 (27)
Skilled nursing facility
52 (26)
Shelter
30 (15)
Survey Results
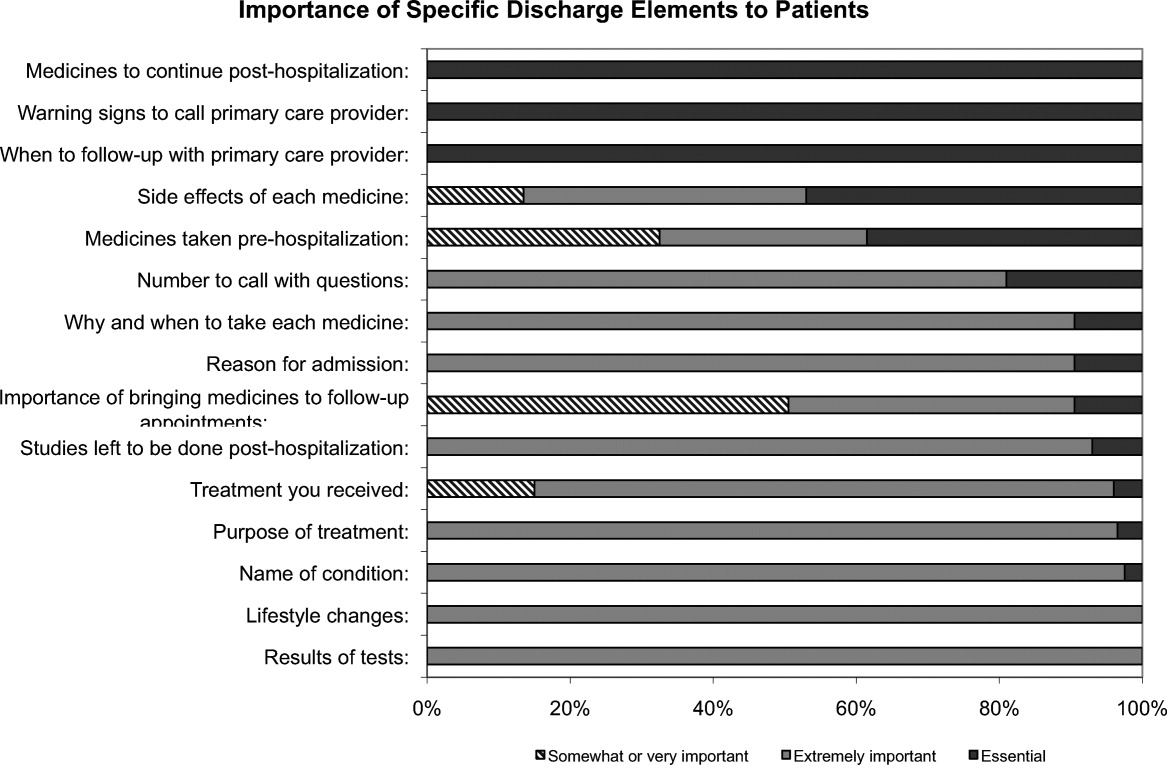
One hundred percent of patients rated the following items as essential (highest category on Likert Scale): when you need to follow‐up with primary care doctor, warning signs to call primary care doctor, and medicines to continue post‐hospitalization (Figure 1). Patients rated the following items as less important (these items were not unanimously rated as extremely important or essential): treatment you received, medicines you took pre‐hospitalization, importance of bringing all your medicines to follow‐up appointments, and given the side effect of each medication. One hundred percent of patients wanted a lot of explanation (highest category on Likert Scale) about my condition and my test results. Only 39% of patients wanted a lot of explanation about discharge medications. Sixty‐one percent wanted somewhatof an explanation about discharge medications. When asked to choose the most important piece of information, 67.5% of patients chose lifestyle changes. See Figure 1 for the relative importance of the items.
Figure 1
Importance of specific elements of discharge instructions to patients.
The majority of patients surveyed, 173 (86.5%), wanted verbal discharge instructions with or without written discharge instructions, with only 10.5% requesting only written discharge instructions (P 0.0001). The majority of patients, 168 (84%), wanted resources to read about their medical condition, with 97 (57%) requesting brochures and 62 (36.9%) requesting Web sites. One hundred percent of patients thought that personal communication between the inpatient provider and the primary care doctor was extremely important or essential.
We identified 4 major themes in our qualitative review of the patients' and proxies' comments: verbal communication, frustration, opacity of system, and too many physicians. Participant quotes related to the 4 major themes are presented in Table 2. Many participants expressed a desire for verbal, rather than written, communication at the time of discharge with their healthcare team; patients particularly requested time for verbal communication with their physician. In the frustration theme, many patients and caregivers expressed frustration that the healthcare team was not carefully listening to them. In the theme of too many physicians, many patients expressed feeling overwhelmed by the number of different doctors involved in their care; particularly at discharge, patients did not know to whom to direct questions. Finally, as part of the opacity of system theme, patient comments included concerns regarding how information will be passed to outside doctors, and that the system of communication is not clear.
Major Themes From Open‐Ended Comments With Patient Quotes
Verbal communication
Can we just stop and talk? Everybody is rushing in and out.
I just want my doctor to stop by before I go home and tell me what the plan is.
Sometimes I feel like no one is talking to me. All they do is give me paperwork.
I want my doctors to sit down with me before I leave the hospital and tell me exactly what I need to do so that I don't come back.
I don't want papers, I want people. I want to talk to someone and not read my problems from a sheet of paper.
Frustration
I wonder sometimes if anyone is listening to me I seem to be part of a very elaborate organization that has its own rules and regulations and will not alter its ways.
Why do I have to keep retelling my story? It gets tiring. I wish my story could just be told once.
Too many physicians
I saw lots of doctors during my time here, but I didn't see them again when I was leaving.
I see so many doctors I have no idea who is in charge and who I should direct my questions to.
I feel overwhelmed by the number of doctors I see every time I come into the hospital.
I want my main doctor to talk to me. I get so confused when I hear from more than one doctor.
I miss the days when my primary doctor came in to check on me. He knew exactly what I needed. Now, I meet new people every time I go into the hospital.
Opacity of system
I wonder if all my doctors talk to each other. Sometimes, it seems like they don't.
Who keeps track of all this information? Is there someone who will pass on what happened to me here to the outside world?
DISCUSSION
Discharge is a period of transition from hospital to home that involves a transfer in responsibility from the inpatient care team to the patient and/or caregivers and primary care physician. Ineffective communication, planning, and coordination of care can undermine patient satisfaction, increase adverse events, and contribute to more frequent hospital readmissions.
The patients we surveyed uniformly placed high value on verbal (more than written) communication about discharge care plans. Protected time during the discharge process for hospital staff to provide verbal recommendations to patients, especially about when they should return for follow‐up, warning signs to contact PCP sooner, and medications to continue after discharge, may improve patient satisfaction.
In open‐ended comments, several subjects suggested that physicians should sit down in the patient's room and provide verbal discharge instructions. Although it is well recognized that verbal communication alone has limitations and that providing patients with written instructions remains crucial, verbal reinforcement may highlight the most important instructions.
Interestingly, subjects valued information about lifestyle changes over detailed information about their medications. This may suggest that hospitalized patients are particularly receptive to information about lifestyle changes such as smoking cessation or importance of compliance with medical appointments.
Lastly, patients we surveyed value personal communication between inpatient and outpatient providers. It is plausible that this would improve transitions of care, and previous studies have suggested that direct communication between inpatient and outpatient providers occurs infrequently, with only 20% of primary care providers in 1 study reporting that they are always notified when their patient is being discharged from a hospitalist service.6
The themes that emerged from our open‐ended questions also highlight the importance of direct verbal communication with patients and careful coordination of care with outside physicians. Because patients may be unlikely to fully remember verbal instructions at discharge, providers may consider providing patients and family members with patient‐centered written materials to take home in order to reinforce important self‐care instructions. The patient comments further suggest that patients may be more satisfied, and that discharges may be smoother, if 1 or 2 physicians were always identified to the patients and their caregivers as the leaders of the care team throughout the hospital course and discharge process.
Our study had several limitations. We only surveyed patients on general medicine services, so our findings might not apply to other populations. We did not enroll participants on weekends and holidays; it is possible that this led to some bias in the enrollment of subjects. We also only surveyed patients and/or proxies who could speak and read English, and this was a fairly highly educated population, with almost half having completed 4 years of college. Finally, we relied on participant self‐report for demographic information because we did not have access to the electronic medical record. This study was conducted at 2 large academic medical centers that include resident physicians in the daily care of patients; thus, these results may not be generalizable to other settings.
Effective verbal communication between physicians, outpatient providers, patients, and their caregivers about discharge care plans might improve patients' understanding of their hospitalizations, increase their satisfaction with care, and reduce readmissions. In addition, physicians should recognize that patients value advice about lifestyle interventions that might improve their health, as part of the discharge care plan. Intervention studies are necessary to test these hypotheses in large, diverse populations.
Moore C,Wisnivesky J,Williams S,McGinn T.Medical errors related to discontinuity of care from an inpatient to an outpatient setting.J Gen Intern Med.2003;18(8):646–651.
Kripalani S,LeFevre F,Phillips CO,Williams MV,Basaviah P,Baker DW.Deficits in communication and information transfer between hospital‐based and primary care physicians: implications for patient safety and continuity of care.JAMA.2007;297(8):831–841.
Greenfield S,Kaplan S,Ware JE.Expanding patient involvement in care. Effects on patient outcomes.Ann Intern Med.1985;102(4):520–528.
Society of Hospital Medicine. Project BOOST, Better Outcomes for Older adults through Safe Transitions. Available at: http://www.hospitalmedicine.org/AM/Template.cfm?Section=Home1998.
Pantilat SZ,Lindenauer PK,Katz PP,Wachter RM.Primary care physician attitudes regarding communication with hospitalists.Am J Med.2001;111(9B):15S–20S.
Hospital discharge can be hazardous because discontinuity and fragmentation of care increase risks to the patient. Inadequate communication has been identified as a major etiology for errors and adverse events occurring shortly after discharge.1, 2 Another potential result of a failed hospital discharge is patient dissatisfaction. Increased patient involvement in care improves health outcomes, and may improve patient satisfaction.3 To engage patients in their care, healthcare providers must collaborate with patients to coordinate care across settings.
In this study, we sought to determine what patients and their caregivers view as essential elements of a safe and high‐quality discharge process. We developed a survey with a broad range of questions related to the hospital discharge process (see Supporting Information, Appendix A, in the online version of this article). The survey included several questions derived from Project BOOST (Better Outcomes for Older adults through Safe Transitions) discharge care plans.4
METHODS
Study Design
We surveyed patients on the second day of admission to the internal medicine wards at the University of Washington Medical Center (a 450‐bed tertiary care teaching hospital) and Harborview Medical Center (a 412‐bed county teaching hospital) from June 1, 2010 to August 1, 2010. All patients 18 years old who were admitted during weekdays were considered for participation. Any potential participant unable to manually fill out the survey was offered the opportunity to use a proxy to help complete the survey. A proxy was any adult support person who was present in the room at the time the patient was approached with the opportunity to participate. Patients were excluded only if they (or their proxies) could not read English. The second day of hospitalization was chosen for several reasons: 1) to attempt to assess patients at a similar point in their hospital stay; 2) to avoid the day of discharge, as this may have introduced confounders such as patients who were actively engaged in the discharge process; and 3) to avoid the day of admission to increase the likelihood that patients would be medically stable at the time of the survey.
The Survey
The study protocol was reviewed and approved by the University of Washington Committee for the Protection of Human Subjects. All subjects gave verbal informed consent. The survey consisted of 3 sections: demographics, questions gauging the importance of various key points in the discharge process to patients, and open‐ended questions. Responses to questions used a Likert scale. Responses to open‐ended questions were handwritten on the paper survey.
Statistical Analysis
The quantitative data were classified categorically and analyzed using Fisher's exact test. Three investigators (M.S., S.E.M., M.B.J.) individually reviewed and coded all written patient or proxy comments using grounded theory methodology.5 Discrepant coding was identified and reconciled. The reconciled coded comments were aggregated into themes.
RESULTS
Demographics
We screened 240 patients or proxies and 200 completed the survey; 10.4% were ineligible due to language barrier, and 6.3% refused. Ninety‐two percent of patients completed the surveys. A majority were male (62.5%), 1859 years old (80%); spoke English as their first language (66%); were community‐dwelling prior to hospitalization (59%); were followed by a primary care provider (PCP) (53%), and many had at least a 4‐year‐college education (45%). One hundred eighty‐five surveys (92.5%) were completed by patients, and 15 (7.5%) were completed by proxies. Ninety surveys were completed at the county teaching hospital, and 110 surveys were completed at the tertiary teaching hospital. See Table 1 for detailed demographic information.
Patient Demographic Characteristics
Patient age, n (%)
1859 yr
160 (80)
6069 yr
30 (15)
7079 yr
5 (2.5)
80 and older
5 (2.5)
Patient gender, n (%)
Male
125 (62.5)
Female
75 (37.5)
Patient schooling, n (%)
Less than high school
20 (10)
High school
50 (25)
Two‐year college
40 (20)
Four‐year college
70 (35)
Graduate education
20 (10)
English is patient's first language, n (%)
Yes
132 (66)
No
68 (34)
Patient has a primary care doctor, n (%)
Yes
106 (53)
No
94 (47)
Patient's residence before hospitalization, n (%)
Home without home health
64 (32)
Home with home health
54 (27)
Skilled nursing facility
52 (26)
Shelter
30 (15)
Survey Results
One hundred percent of patients rated the following items as essential (highest category on Likert Scale): when you need to follow‐up with primary care doctor, warning signs to call primary care doctor, and medicines to continue post‐hospitalization (Figure 1). Patients rated the following items as less important (these items were not unanimously rated as extremely important or essential): treatment you received, medicines you took pre‐hospitalization, importance of bringing all your medicines to follow‐up appointments, and given the side effect of each medication. One hundred percent of patients wanted a lot of explanation (highest category on Likert Scale) about my condition and my test results. Only 39% of patients wanted a lot of explanation about discharge medications. Sixty‐one percent wanted somewhatof an explanation about discharge medications. When asked to choose the most important piece of information, 67.5% of patients chose lifestyle changes. See Figure 1 for the relative importance of the items.
Figure 1
Importance of specific elements of discharge instructions to patients.
The majority of patients surveyed, 173 (86.5%), wanted verbal discharge instructions with or without written discharge instructions, with only 10.5% requesting only written discharge instructions (P 0.0001). The majority of patients, 168 (84%), wanted resources to read about their medical condition, with 97 (57%) requesting brochures and 62 (36.9%) requesting Web sites. One hundred percent of patients thought that personal communication between the inpatient provider and the primary care doctor was extremely important or essential.
We identified 4 major themes in our qualitative review of the patients' and proxies' comments: verbal communication, frustration, opacity of system, and too many physicians. Participant quotes related to the 4 major themes are presented in Table 2. Many participants expressed a desire for verbal, rather than written, communication at the time of discharge with their healthcare team; patients particularly requested time for verbal communication with their physician. In the frustration theme, many patients and caregivers expressed frustration that the healthcare team was not carefully listening to them. In the theme of too many physicians, many patients expressed feeling overwhelmed by the number of different doctors involved in their care; particularly at discharge, patients did not know to whom to direct questions. Finally, as part of the opacity of system theme, patient comments included concerns regarding how information will be passed to outside doctors, and that the system of communication is not clear.
Major Themes From Open‐Ended Comments With Patient Quotes
Verbal communication
Can we just stop and talk? Everybody is rushing in and out.
I just want my doctor to stop by before I go home and tell me what the plan is.
Sometimes I feel like no one is talking to me. All they do is give me paperwork.
I want my doctors to sit down with me before I leave the hospital and tell me exactly what I need to do so that I don't come back.
I don't want papers, I want people. I want to talk to someone and not read my problems from a sheet of paper.
Frustration
I wonder sometimes if anyone is listening to me I seem to be part of a very elaborate organization that has its own rules and regulations and will not alter its ways.
Why do I have to keep retelling my story? It gets tiring. I wish my story could just be told once.
Too many physicians
I saw lots of doctors during my time here, but I didn't see them again when I was leaving.
I see so many doctors I have no idea who is in charge and who I should direct my questions to.
I feel overwhelmed by the number of doctors I see every time I come into the hospital.
I want my main doctor to talk to me. I get so confused when I hear from more than one doctor.
I miss the days when my primary doctor came in to check on me. He knew exactly what I needed. Now, I meet new people every time I go into the hospital.
Opacity of system
I wonder if all my doctors talk to each other. Sometimes, it seems like they don't.
Who keeps track of all this information? Is there someone who will pass on what happened to me here to the outside world?
DISCUSSION
Discharge is a period of transition from hospital to home that involves a transfer in responsibility from the inpatient care team to the patient and/or caregivers and primary care physician. Ineffective communication, planning, and coordination of care can undermine patient satisfaction, increase adverse events, and contribute to more frequent hospital readmissions.
The patients we surveyed uniformly placed high value on verbal (more than written) communication about discharge care plans. Protected time during the discharge process for hospital staff to provide verbal recommendations to patients, especially about when they should return for follow‐up, warning signs to contact PCP sooner, and medications to continue after discharge, may improve patient satisfaction.
In open‐ended comments, several subjects suggested that physicians should sit down in the patient's room and provide verbal discharge instructions. Although it is well recognized that verbal communication alone has limitations and that providing patients with written instructions remains crucial, verbal reinforcement may highlight the most important instructions.
Interestingly, subjects valued information about lifestyle changes over detailed information about their medications. This may suggest that hospitalized patients are particularly receptive to information about lifestyle changes such as smoking cessation or importance of compliance with medical appointments.
Lastly, patients we surveyed value personal communication between inpatient and outpatient providers. It is plausible that this would improve transitions of care, and previous studies have suggested that direct communication between inpatient and outpatient providers occurs infrequently, with only 20% of primary care providers in 1 study reporting that they are always notified when their patient is being discharged from a hospitalist service.6
The themes that emerged from our open‐ended questions also highlight the importance of direct verbal communication with patients and careful coordination of care with outside physicians. Because patients may be unlikely to fully remember verbal instructions at discharge, providers may consider providing patients and family members with patient‐centered written materials to take home in order to reinforce important self‐care instructions. The patient comments further suggest that patients may be more satisfied, and that discharges may be smoother, if 1 or 2 physicians were always identified to the patients and their caregivers as the leaders of the care team throughout the hospital course and discharge process.
Our study had several limitations. We only surveyed patients on general medicine services, so our findings might not apply to other populations. We did not enroll participants on weekends and holidays; it is possible that this led to some bias in the enrollment of subjects. We also only surveyed patients and/or proxies who could speak and read English, and this was a fairly highly educated population, with almost half having completed 4 years of college. Finally, we relied on participant self‐report for demographic information because we did not have access to the electronic medical record. This study was conducted at 2 large academic medical centers that include resident physicians in the daily care of patients; thus, these results may not be generalizable to other settings.
Effective verbal communication between physicians, outpatient providers, patients, and their caregivers about discharge care plans might improve patients' understanding of their hospitalizations, increase their satisfaction with care, and reduce readmissions. In addition, physicians should recognize that patients value advice about lifestyle interventions that might improve their health, as part of the discharge care plan. Intervention studies are necessary to test these hypotheses in large, diverse populations.
Acknowledgements
Disclosure: Nothing to report.
References
Moore C,Wisnivesky J,Williams S,McGinn T.Medical errors related to discontinuity of care from an inpatient to an outpatient setting.J Gen Intern Med.2003;18(8):646–651.
Kripalani S,LeFevre F,Phillips CO,Williams MV,Basaviah P,Baker DW.Deficits in communication and information transfer between hospital‐based and primary care physicians: implications for patient safety and continuity of care.JAMA.2007;297(8):831–841.
Greenfield S,Kaplan S,Ware JE.Expanding patient involvement in care. Effects on patient outcomes.Ann Intern Med.1985;102(4):520–528.
Society of Hospital Medicine. Project BOOST, Better Outcomes for Older adults through Safe Transitions. Available at: http://www.hospitalmedicine.org/AM/Template.cfm?Section=Home1998.
Pantilat SZ,Lindenauer PK,Katz PP,Wachter RM.Primary care physician attitudes regarding communication with hospitalists.Am J Med.2001;111(9B):15S–20S.
Neoplastic meningitis occurs in approximately 5%–10% of all patients with cancer, and aggressive supportive measures are a critical component of comprehensive care. A literature review of the current diagnostic methods, randomized controlled trials, and available treatments was undertaken; and a comprehensive discussion of best-practice supportive care measures is provided. Although the prognosis for those diagnosed with neoplastic meningitis is poor, treatment and supportive care may allow stabilization of neurologic symptoms and afford protection from further neurologic deterioration, allowing patients to maximize their function and independence and adjust their expectations of treatment from cure to palliation.
*For a PDF of the full article and accompanying viewpoints by Alexis Demopoulos and Matthias Holdhoff along with Stuart Grossman, click in the links to the left of this introduction.
Review
Neoplastic Meningitis
Alixis Van Horn, RN, CHPN
Marc C. Chamberlain, MD
Received 26 May 2011. Accepted 2 June 2011. Available online 23 September 2011.
Neoplastic meningitis occurs in approximately 5%–10% of all patients with cancer, and aggressive supportive measures are a critical component of comprehensive care. A literature review of the current diagnostic methods, randomized controlled trials, and available treatments was undertaken; and a comprehensive discussion of best-practice supportive care measures is provided. Although the prognosis for those diagnosed with neoplastic meningitis is poor, treatment and supportive care may allow stabilization of neurologic symptoms and afford protection from further neurologic deterioration, allowing patients to maximize their function and independence and adjust their expectations of treatment from cure to palliation.
*For a PDF of the full article and accompanying viewpoints by Alexis Demopoulos and Matthias Holdhoff along with Stuart Grossman, click in the links to the left of this introduction.
Palonosetron Plus 1-Day Dexamethasone for the Prevention of Nausea and Vomiting Due to Moderately Emetogenic Chemotherapy: Effect of Established Risk Factors on Treatment Outcome in a Phase III Trial
Original research
Palonosetron Plus 1-Day Dexamethasone for the Prevention of Nausea and Vomiting Due to Moderately Emetogenic Chemotherapy: Effect of Established Risk Factors on Treatment Outcome in a Phase III Trial
Previous Presentation: Presented in part at the annual meeting of the American Society of Clinical Oncology, Orlando, Florida, May 29–June 2, 2009.
Luigi Celio, MD
,
Angela Denaro, MD,
Francesco Agustoni, MD,
Emilio Bajetta, MD
Department of Medical Oncology, Fondazione IRCCS “Istituto Nazionale Tumori,” Milan, Italy
Received 11 February 2011. Accepted 16 June 2011. Available online 23 September 2011.
The non-inferiority of palonosetron plus 1-day versus 3-day dexamethasone in preventing chemotherapy-induced nausea and vomiting (CINV) due to moderately emetogenic chemotherapy (MEC) has been previously demonstrated.
Objective
The objectives of this prespecified post hoc analysis were to demonstrate the non-inferiority hypothesis in an adjusted model for known risk factors (age, gender, alcohol consumption, and type of MEC [anthracycline plus cyclophosphamide (AC)–based versus other MEC]) for CINV and to explore the impact on antiemetic outcome of these risk factors.
Methods
Chemonaive patients (n = 324) with solid tumors were randomized to receive palonosetron 0.25 mg IV plus dexamethasone 8 mg IV on day 1 of chemotherapy or the same regimen followed by oral dexamethasone 8 mg on days 2 and 3. The primary end point was complete response (CR, no emesis and no rescue antiemetics) during the 5-day study period. A modified intention-to-treat approach was used for multivariable analysis.
Results
Non-inferiority of the 1-day regimen was confirmed even after adjusting for risk factors (risk difference −4.4%, 95% CI −14.1% to 5.4%; P = .381). Only age less than 50 years (P = .044) independently predicted a poor outcome of antiemetic treatment. However, most of the younger patients were women (1-day regimen 81.8%, 3-day regimen 88.4%) who underwent AC-based chemotherapy (1-day regimen 61.1%, 3-day regimen 71.0%). There were no significant between-treatment differences in the CR rate according to risk factors.
Conclusion
This analysis confirmed that the 1-day regimen provides a valid treatment option for prevention of CINV in delayed, non-AC-based MEC.
Original research
Palonosetron Plus 1-Day Dexamethasone for the Prevention of Nausea and Vomiting Due to Moderately Emetogenic Chemotherapy: Effect of Established Risk Factors on Treatment Outcome in a Phase III Trial
Previous Presentation: Presented in part at the annual meeting of the American Society of Clinical Oncology, Orlando, Florida, May 29–June 2, 2009.
Luigi Celio, MD
,
Angela Denaro, MD,
Francesco Agustoni, MD,
Emilio Bajetta, MD
Department of Medical Oncology, Fondazione IRCCS “Istituto Nazionale Tumori,” Milan, Italy
Received 11 February 2011. Accepted 16 June 2011. Available online 23 September 2011.
The non-inferiority of palonosetron plus 1-day versus 3-day dexamethasone in preventing chemotherapy-induced nausea and vomiting (CINV) due to moderately emetogenic chemotherapy (MEC) has been previously demonstrated.
Objective
The objectives of this prespecified post hoc analysis were to demonstrate the non-inferiority hypothesis in an adjusted model for known risk factors (age, gender, alcohol consumption, and type of MEC [anthracycline plus cyclophosphamide (AC)–based versus other MEC]) for CINV and to explore the impact on antiemetic outcome of these risk factors.
Methods
Chemonaive patients (n = 324) with solid tumors were randomized to receive palonosetron 0.25 mg IV plus dexamethasone 8 mg IV on day 1 of chemotherapy or the same regimen followed by oral dexamethasone 8 mg on days 2 and 3. The primary end point was complete response (CR, no emesis and no rescue antiemetics) during the 5-day study period. A modified intention-to-treat approach was used for multivariable analysis.
Results
Non-inferiority of the 1-day regimen was confirmed even after adjusting for risk factors (risk difference −4.4%, 95% CI −14.1% to 5.4%; P = .381). Only age less than 50 years (P = .044) independently predicted a poor outcome of antiemetic treatment. However, most of the younger patients were women (1-day regimen 81.8%, 3-day regimen 88.4%) who underwent AC-based chemotherapy (1-day regimen 61.1%, 3-day regimen 71.0%). There were no significant between-treatment differences in the CR rate according to risk factors.
Conclusion
This analysis confirmed that the 1-day regimen provides a valid treatment option for prevention of CINV in delayed, non-AC-based MEC.
Palonosetron Plus 1-Day Dexamethasone for the Prevention of Nausea and Vomiting Due to Moderately Emetogenic Chemotherapy: Effect of Established Risk Factors on Treatment Outcome in a Phase III Trial
Display Headline
Palonosetron Plus 1-Day Dexamethasone for the Prevention of Nausea and Vomiting Due to Moderately Emetogenic Chemotherapy: Effect of Established Risk Factors on Treatment Outcome in a Phase III Trial
Spiritual Well-Being and Quality of Life of Women with Ovarian Cancer and Their Spouses
This is a descriptive, longitudinal study involving 70 women with ovarian cancer and 26 spouses. Questionnaires were completed postoperatively and by mail 3, 7, 12, 18, 24, and 36 months later.
Original research
Spiritual Well-Being and Quality of Life of Women with Ovarian Cancer and Their Spouses
There is little research on the quality of life (QOL) and spiritual well-being (SWB) of women diagnosed with ovarian cancer and their spouses.
Objective
We compared the SWB and QOL of these women and their spouses over a 3-year period.
Methods
This is a descriptive, longitudinal study involving 70 women with ovarian cancer and 26 spouses. Questionnaires were completed postoperatively and by mail 3, 7, 12, 18, 24, and 36 months later. All participants completed the Functional Assessment of Chronic Illness Therapy (FACIT)–Spiritual Well-Being–Expanded Version, Symptom Distress Scale, and open-ended questions about changes in their lives. Diagnosed women completed the FACIT-Ovarian and spouses the Caregiver Burden Interview and Linear Analog Self-Assessment scales.
Results
Women reported a high level of SWB over time. Spouses' SWB was significantly worse than the women's at 1 and 3 years (P ≤ .05). Insomnia, fatigue, and outlook/worry were problematic across time, with no significant differences between women and spouses except that women experienced more insomnia through 3 months (P = .02). Emotional well-being was compromised over time for the women but not their spouses until year 3. Physical and social well-being were compromised in spouses across time, while women's social well-being remained high and physical well-being was problematic only for the first year.
Limitations
Limitations include a small spouse sample and, due to the disease process, attrition over time.
Conclusions
Ovarian cancer has significant, but different, effects on women and spouses. Some effects are static, while others are not, which underscores the need for continual monitoring.
This is a descriptive, longitudinal study involving 70 women with ovarian cancer and 26 spouses. Questionnaires were completed postoperatively and by mail 3, 7, 12, 18, 24, and 36 months later.
This is a descriptive, longitudinal study involving 70 women with ovarian cancer and 26 spouses. Questionnaires were completed postoperatively and by mail 3, 7, 12, 18, 24, and 36 months later.
Original research
Spiritual Well-Being and Quality of Life of Women with Ovarian Cancer and Their Spouses
There is little research on the quality of life (QOL) and spiritual well-being (SWB) of women diagnosed with ovarian cancer and their spouses.
Objective
We compared the SWB and QOL of these women and their spouses over a 3-year period.
Methods
This is a descriptive, longitudinal study involving 70 women with ovarian cancer and 26 spouses. Questionnaires were completed postoperatively and by mail 3, 7, 12, 18, 24, and 36 months later. All participants completed the Functional Assessment of Chronic Illness Therapy (FACIT)–Spiritual Well-Being–Expanded Version, Symptom Distress Scale, and open-ended questions about changes in their lives. Diagnosed women completed the FACIT-Ovarian and spouses the Caregiver Burden Interview and Linear Analog Self-Assessment scales.
Results
Women reported a high level of SWB over time. Spouses' SWB was significantly worse than the women's at 1 and 3 years (P ≤ .05). Insomnia, fatigue, and outlook/worry were problematic across time, with no significant differences between women and spouses except that women experienced more insomnia through 3 months (P = .02). Emotional well-being was compromised over time for the women but not their spouses until year 3. Physical and social well-being were compromised in spouses across time, while women's social well-being remained high and physical well-being was problematic only for the first year.
Limitations
Limitations include a small spouse sample and, due to the disease process, attrition over time.
Conclusions
Ovarian cancer has significant, but different, effects on women and spouses. Some effects are static, while others are not, which underscores the need for continual monitoring.
National palliative care guidelines outline spiritual care as a domain of palliative care, yet patients' religiousness and/or spirituality (R/S) are underappreciated in the palliative oncology setting. Among patients with advanced cancer receiving palliative radiation therapy (RT), this study aims to characterize patient spirituality, religiousness, and religious coping; examine the relationships of these variables to quality of life (QOL); and assess patients' perceptions of spiritual care in the cancer care setting.
Methods
This is a multisite, cross-sectional survey of 69 patients with advanced cancer (response rate = 73%) receiving palliative RT. Scripted interviews assessed patient spirituality, religiousness, religious coping, QOL (McGill QOL Questionnaire), and perceptions of the importance of attention to spiritual needs by health providers. Multivariable models assessed the relationships of patient spirituality and R/S coping to patient QOL, controlling for other significant predictors of QOL.
Results
Most participants (84%) indicated reliance on R/S beliefs to cope with cancer. Patient spirituality and religious coping were associated with improved QOL in multivariable analyses (β = 10.57, P < .001 and β = 1.28, P = .01, respectively). Most patients considered attention to spiritual concerns an important part of cancer care by physicians (87%) and nurses (85%).
Limitations
Limitations include a small sample size, a cross-sectional study design, and a limited proportion of nonwhite participants (15%) from one US region.
Conclusion
Patients receiving palliative RT rely on R/S beliefs to cope with advanced cancer. Furthermore, spirituality and religious coping are contributors to better QOL. These findings highlight the importance of spiritual care in advanced cancer care.
*For a PDF of the full article click in the link to the left of this introduction.
Original research
The Role of Spirituality and Religious Coping in the Quality of Life of Patients With Advanced Cancer Receiving Palliative Radiation Therapy
National palliative care guidelines outline spiritual care as a domain of palliative care, yet patients' religiousness and/or spirituality (R/S) are underappreciated in the palliative oncology setting. Among patients with advanced cancer receiving palliative radiation therapy (RT), this study aims to characterize patient spirituality, religiousness, and religious coping; examine the relationships of these variables to quality of life (QOL); and assess patients' perceptions of spiritual care in the cancer care setting.
Methods
This is a multisite, cross-sectional survey of 69 patients with advanced cancer (response rate = 73%) receiving palliative RT. Scripted interviews assessed patient spirituality, religiousness, religious coping, QOL (McGill QOL Questionnaire), and perceptions of the importance of attention to spiritual needs by health providers. Multivariable models assessed the relationships of patient spirituality and R/S coping to patient QOL, controlling for other significant predictors of QOL.
Results
Most participants (84%) indicated reliance on R/S beliefs to cope with cancer. Patient spirituality and religious coping were associated with improved QOL in multivariable analyses (β = 10.57, P < .001 and β = 1.28, P = .01, respectively). Most patients considered attention to spiritual concerns an important part of cancer care by physicians (87%) and nurses (85%).
Limitations
Limitations include a small sample size, a cross-sectional study design, and a limited proportion of nonwhite participants (15%) from one US region.
Conclusion
Patients receiving palliative RT rely on R/S beliefs to cope with advanced cancer. Furthermore, spirituality and religious coping are contributors to better QOL. These findings highlight the importance of spiritual care in advanced cancer care.
*For a PDF of the full article click in the link to the left of this introduction.
A Practical Update on Sexually Transmitted Infections: Advances in Diagnosis and Treatment
A supplement to Ob. Gyn. News. Supported by a restricted educational grant from 3M Pharmaceuticals. Highlights of presentations that took place at a continuing medical education conference held April 5-6, 2003, Washington, DC.
Introduction Jack D. Sobel, MD Professor, Chief Division of Infectious Disease Wayne State University School of Medicine Harper Hospital Detroit, MI Clinical Grants: 3M Pharmaceuticals, Pfizer, and Ortho-McNeil. Discusses the investigational use of fluconazole and 17.4% topical flucytosine cream for treating Candida glabrata, and 10% hydrocortisone for treating erosive lichen planus.
Phillip G. Stubblefield, MD Professor and Chairman, Obstetrics and Gynecology Boston University School of Medicine Director, Obstetrics and Gynecology Boston Medical Center Boston, MA Nothing to disclose.
Jonathan M. Zenilman, MD Professor, Infectious Diseases Division Johns Hopkins School of Medicine Baltimore, MD Clinical Grants/Research: Osmetech PLC; Consultant: Merck and Company; Speaker's Bureau: GlaxoSmithKline, Pfizer, Inc.
Normal Vaginal Flora Jeanne M. Marrazzo, MD, MPH Assistant Professor, Department of Medicine Division of Allergy and Infectious Diseases University of Washington, Harborview Medical Center Seattle, WA Discusses the use of intravaginal Lactobacillus crispatus capsules for the treatment of bacterial vaginosis.
Diagnosis and Treatment of Routine and Resistant Trichomoniasis Anne M. Rompalo, MD, ScM Associate Professor, Infectious Diseases Division Johns Hopkins School of Medicine Baltimore, MD Clinical Grants/Research: GlaxoSmithKline; Speaker's Bureau: GlaxoSmithKline, Pfizer, Inc.
New Findings in Routine and Recurrent Vulvovaginal Candidiasis Treatment Jack D. Sobel, MD
Overview of Bacterial Vaginosis and Its Role in Upper Genital Tract Infection David A. Eschenbach, MD Professor and Director, Women's Health Chair, Department of Obstetrics and Gynecology University of Washington Seattle, WA Consultant: 3M Pharmaceuticals.
Noninfectious Vulvovaginal Symptoms as Manifestations of Systemic Diseases Jack D. Sobel, MD