User login
When “Different” Is Not OK
ANSWER
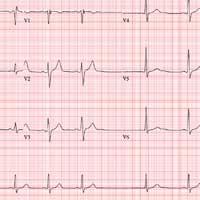
The correct interpretation includes sinus bradycardia, marked sinus arrhythmia, junctional escape beats with sinus arrest or a transient atrioventricular (AV) block, and an intraventricular conduction defect.
Sinus bradycardia is diagnosed based on narrow QRS intervals < 60 beats/min. Marked sinus arrhythmia is indicated by the narrow QRS intervals of similar size but with an irregular rhythm.
When the rate is slow and irregular, rather than use the 300/150/100 method, it is more accurate to count the number of QRS complexes in the rhythm strip and multiply by six (an ECG at standard paper speed takes 10 s; 6 × 10 s = 60 s). If the patient does not have a pacemaker, a range within two to three beats of the computer measurement is acceptable. In this case, 9 × 6 = 54 beats/min—very close to the interval measured by the computer.
The first three beats on the rhythm strip are sinus with a normal PQRST complex. After that, there is a pause (either sinus arrest or a transient AV block—we can’t tell which) that is interrupted by a junctional escape beat (no P wave, but the QRS is similar to the prior, normal complexes). The fifth, sixth, and seventh beats are normal sinus, followed by another pause with an ensuing junctional escape. The last QRS complex is another sinus beat.
Finally, although the QRS duration (122 ms) is greater than normal, the complexes in leads V1 and V6 do not constitute a right or left bundle branch block.
ANSWER
The correct interpretation includes sinus bradycardia, marked sinus arrhythmia, junctional escape beats with sinus arrest or a transient atrioventricular (AV) block, and an intraventricular conduction defect.
Sinus bradycardia is diagnosed based on narrow QRS intervals < 60 beats/min. Marked sinus arrhythmia is indicated by the narrow QRS intervals of similar size but with an irregular rhythm.
When the rate is slow and irregular, rather than use the 300/150/100 method, it is more accurate to count the number of QRS complexes in the rhythm strip and multiply by six (an ECG at standard paper speed takes 10 s; 6 × 10 s = 60 s). If the patient does not have a pacemaker, a range within two to three beats of the computer measurement is acceptable. In this case, 9 × 6 = 54 beats/min—very close to the interval measured by the computer.
The first three beats on the rhythm strip are sinus with a normal PQRST complex. After that, there is a pause (either sinus arrest or a transient AV block—we can’t tell which) that is interrupted by a junctional escape beat (no P wave, but the QRS is similar to the prior, normal complexes). The fifth, sixth, and seventh beats are normal sinus, followed by another pause with an ensuing junctional escape. The last QRS complex is another sinus beat.
Finally, although the QRS duration (122 ms) is greater than normal, the complexes in leads V1 and V6 do not constitute a right or left bundle branch block.
ANSWER
The correct interpretation includes sinus bradycardia, marked sinus arrhythmia, junctional escape beats with sinus arrest or a transient atrioventricular (AV) block, and an intraventricular conduction defect.
Sinus bradycardia is diagnosed based on narrow QRS intervals < 60 beats/min. Marked sinus arrhythmia is indicated by the narrow QRS intervals of similar size but with an irregular rhythm.
When the rate is slow and irregular, rather than use the 300/150/100 method, it is more accurate to count the number of QRS complexes in the rhythm strip and multiply by six (an ECG at standard paper speed takes 10 s; 6 × 10 s = 60 s). If the patient does not have a pacemaker, a range within two to three beats of the computer measurement is acceptable. In this case, 9 × 6 = 54 beats/min—very close to the interval measured by the computer.
The first three beats on the rhythm strip are sinus with a normal PQRST complex. After that, there is a pause (either sinus arrest or a transient AV block—we can’t tell which) that is interrupted by a junctional escape beat (no P wave, but the QRS is similar to the prior, normal complexes). The fifth, sixth, and seventh beats are normal sinus, followed by another pause with an ensuing junctional escape. The last QRS complex is another sinus beat.
Finally, although the QRS duration (122 ms) is greater than normal, the complexes in leads V1 and V6 do not constitute a right or left bundle branch block.

For four days, a 66-year-old man with New York Heart Association Class II congestive heart failure has been short of breath. Over the three years he has been your patient, he has generally done well on maximum medical therapy. He has never had a myocardial infarction (MI), atrial fibrillation, or symptoms suggestive of ischemia.
Three months ago, he was hospitalized following a robust meal. At the time, his left ventricular ejection fraction was 42% on echocardiogram, and he was in normal sinus rhythm; he responded quickly to diuresis. This time, he says, he feels “different.” He’s tired and lethargic, he can’t seem to catch his breath, and he just wants to sleep.
Medical history is remarkable for type 2 diabetes and cholecystitis. Surgical history includes a cholecystectomy and an open reduction and internal fixation of a right high ankle fracture. His current medications include metformin, lisinopril, metoprolol, spironolactone, furosemide, potassium chloride, and atorvastatin.
The patient, an accountant at a busy firm, is married with three healthy adult children. He has never smoked, and he drinks alcohol rarely on weekends. His father died during cardiac revascularization surgery at age 58, his mother died of heart failure complications at age 69, and his older brother had an inferior MI at age 68.
Review of systems is remarkable for a recent upper respiratory infection. The patient has also noticed that his abdomen seems distended and his urine output has diminished.
Vital signs include a blood pressure of 98/62 mm Hg; pulse, 50 beats/min; respiratory rate, 16 breaths/min-1; and temperature, 97.6°F. His weight is 224 lb—a 7-lb increase since his last clinic visit—and his height, 68 in.
On physical exam, you note a well-groomed male in mild distress. Pertinent findings include distended neck veins with visible cannon waves and jugular venous distention to 10 cm. There are no carotid bruits. Auscultation of the chest reveals scattered rhonchi in all fields, with bilateral rales in both bases that do not clear with coughing.
Cardiac exam reveals a regular rhythm at a rate of 58 beats/min, with a grade II/VI systolic murmur best heard at the left sternal border. There are no gallops or clicks. On abdominal exam, the liver edge is palpable 2 cm below the right costal margin. Bowel tones are present in all quadrants. There is no hepatojugular reflux or tenderness.
The lower extremities have 3+ pitting edema below the knees. Peripheral pulses are present and equal bilaterally, and there is no cyanosis or clubbing. The neurologic exam reveals mild sensory loss in both feet, with no perception of 2-point discrimination in the toes of the left foot.
An ECG reveals a ventricular rate of 55 beats/min; PR interval, 146 ms; QRS duration, 122 ms; QT/QTc interval, 424/405 ms; P axis, 60°; R axis, 38°; and T axis, 29°. What is your interpretation?
Among cannabinoids, cannabidiol has best evidence for decreasing seizures
A reasonable number of patients with treatment-resistant epilepsy experienced a decrease in the frequency of seizures when treated with pharmaceutical-grade cannabidiol, according to findings from a systematic review.
The review, published online March 6 in the Journal of Neurology, Neurosurgery and Psychiatry, centers on 36 studies testing the use of cannabinoids as adjunctive treatments for treatment-resistant epilepsy, including six randomized controlled trials involving a total of 555 patients and 30 observational studies involving 2,865 patients.
Two randomized, controlled trials representing a total of 291 patients (one with 120 patients with Dravet syndrome and another with 171 patients with Lennox-Gastaut syndrome) found cannabidiol (CBD) treatment was 74% more likely than placebo to achieve a greater than 50% reduction in seizures. In the observational studies, nearly half (48.5%) of the 970 patients across a range of epilepsy subtypes achieved a 50% or greater reduction in seizures.
Emily Stockings, PhD, of the National Drug and Alcohol Research Centre at the University of New South Wales, Sydney, and her coauthors estimated that eight patients would need to receive CBD treatment to achieve a 50% reduction in seizures in one person. However, they also pointed out that the quality of the evidence was mixed.
“There is insufficient evidence from moderate-quality or high-quality studies to assess whether there is a treatment effect of Cannabis sativa, CBD:THC combinations, or oral cannabis extracts,” they wrote.
There were three randomized, controlled trials that also looked at complete seizure freedom, finding a sixfold higher likelihood of total seizure freedom with CBD, compared with placebo. However, the number needed to treat to achieve this was 171, and again, the quality of evidence was described as “mixed.”
Just over half of patients treated with CBD reported improved quality of life, and significantly more parents and caregivers of those treated with CBD said the patient’s overall condition had improved. The pooled estimates from observational studies suggested that 55.8% of patients experienced improvements in their quality of life when using cannabinoids.
Studies involving patients with Dravet syndrome reported the greatest improvements in quality of life, compared with studies involving a mix of epilepsy syndromes. However, the authors noted that the studies that involved Dravet syndrome patients were all case series in which every patient responded and suggested they should be interpreted with caution.
The authors said they were more confident of the benefits of CBD in children than in adults, because the more recent, larger, and better-conducted randomized, controlled trials focused on children and adolescents.
“In RCTs, and most of the non-RCTs, cannabinoids were used as an adjunctive therapy rather than as a standalone intervention, so at present, there is little evidence to support any recommendation that cannabinoids can be recommended as a replacement for current standard [antiepileptic drugs].”
The review also looked at the number of withdrawals, which they said could serve as an indicator of the tolerability and effectiveness of a treatment. The randomized, controlled trials showed no difference in withdrawal rates between patients on CBD and those on placebo, although CBD patients were more likely to withdraw because of adverse events.
There was a small but significant increase in the risk of adverse events with CBD, compared with placebo: particularly drowsiness, diarrhea, fatigue, and changes in appetite. There also was a higher incidence of serious adverse events (AEs), including status epilepticus and elevated aminotransferase levels.
“The fact that more patients withdrew or experienced AEs when receiving CBD than placebo indicates the need for clinicians and patients to weigh the risks and benefits of adding CBD to other AED [antiepileptic drug] treatment,” the authors wrote.
The study was supported by the Commonwealth Department of Health, the New South Wales Government Centre for Medicinal Cannabis Research and Innovation, the Victorian Department of Health and Human Services, and the Queensland Department of Health. Four authors were also supported by National Health and Medical Research Council grants. Three authors declared grants from the pharmaceutical industry, and one author has provided evidence to parliamentary committees on medical uses of cannabis in Australia and the United Kingdom, and is on the Australian Advisory Council on the Medicinal Use of Cannabis. No other conflicts of interest were declared.
SOURCE: Stockings E et al. J Neurol Neurosurg Psychiatry. 2018 Mar 6. doi: 10.1136/jnnp-2017-317168
A reasonable number of patients with treatment-resistant epilepsy experienced a decrease in the frequency of seizures when treated with pharmaceutical-grade cannabidiol, according to findings from a systematic review.
The review, published online March 6 in the Journal of Neurology, Neurosurgery and Psychiatry, centers on 36 studies testing the use of cannabinoids as adjunctive treatments for treatment-resistant epilepsy, including six randomized controlled trials involving a total of 555 patients and 30 observational studies involving 2,865 patients.
Two randomized, controlled trials representing a total of 291 patients (one with 120 patients with Dravet syndrome and another with 171 patients with Lennox-Gastaut syndrome) found cannabidiol (CBD) treatment was 74% more likely than placebo to achieve a greater than 50% reduction in seizures. In the observational studies, nearly half (48.5%) of the 970 patients across a range of epilepsy subtypes achieved a 50% or greater reduction in seizures.
Emily Stockings, PhD, of the National Drug and Alcohol Research Centre at the University of New South Wales, Sydney, and her coauthors estimated that eight patients would need to receive CBD treatment to achieve a 50% reduction in seizures in one person. However, they also pointed out that the quality of the evidence was mixed.
“There is insufficient evidence from moderate-quality or high-quality studies to assess whether there is a treatment effect of Cannabis sativa, CBD:THC combinations, or oral cannabis extracts,” they wrote.
There were three randomized, controlled trials that also looked at complete seizure freedom, finding a sixfold higher likelihood of total seizure freedom with CBD, compared with placebo. However, the number needed to treat to achieve this was 171, and again, the quality of evidence was described as “mixed.”
Just over half of patients treated with CBD reported improved quality of life, and significantly more parents and caregivers of those treated with CBD said the patient’s overall condition had improved. The pooled estimates from observational studies suggested that 55.8% of patients experienced improvements in their quality of life when using cannabinoids.
Studies involving patients with Dravet syndrome reported the greatest improvements in quality of life, compared with studies involving a mix of epilepsy syndromes. However, the authors noted that the studies that involved Dravet syndrome patients were all case series in which every patient responded and suggested they should be interpreted with caution.
The authors said they were more confident of the benefits of CBD in children than in adults, because the more recent, larger, and better-conducted randomized, controlled trials focused on children and adolescents.
“In RCTs, and most of the non-RCTs, cannabinoids were used as an adjunctive therapy rather than as a standalone intervention, so at present, there is little evidence to support any recommendation that cannabinoids can be recommended as a replacement for current standard [antiepileptic drugs].”
The review also looked at the number of withdrawals, which they said could serve as an indicator of the tolerability and effectiveness of a treatment. The randomized, controlled trials showed no difference in withdrawal rates between patients on CBD and those on placebo, although CBD patients were more likely to withdraw because of adverse events.
There was a small but significant increase in the risk of adverse events with CBD, compared with placebo: particularly drowsiness, diarrhea, fatigue, and changes in appetite. There also was a higher incidence of serious adverse events (AEs), including status epilepticus and elevated aminotransferase levels.
“The fact that more patients withdrew or experienced AEs when receiving CBD than placebo indicates the need for clinicians and patients to weigh the risks and benefits of adding CBD to other AED [antiepileptic drug] treatment,” the authors wrote.
The study was supported by the Commonwealth Department of Health, the New South Wales Government Centre for Medicinal Cannabis Research and Innovation, the Victorian Department of Health and Human Services, and the Queensland Department of Health. Four authors were also supported by National Health and Medical Research Council grants. Three authors declared grants from the pharmaceutical industry, and one author has provided evidence to parliamentary committees on medical uses of cannabis in Australia and the United Kingdom, and is on the Australian Advisory Council on the Medicinal Use of Cannabis. No other conflicts of interest were declared.
SOURCE: Stockings E et al. J Neurol Neurosurg Psychiatry. 2018 Mar 6. doi: 10.1136/jnnp-2017-317168
A reasonable number of patients with treatment-resistant epilepsy experienced a decrease in the frequency of seizures when treated with pharmaceutical-grade cannabidiol, according to findings from a systematic review.
The review, published online March 6 in the Journal of Neurology, Neurosurgery and Psychiatry, centers on 36 studies testing the use of cannabinoids as adjunctive treatments for treatment-resistant epilepsy, including six randomized controlled trials involving a total of 555 patients and 30 observational studies involving 2,865 patients.
Two randomized, controlled trials representing a total of 291 patients (one with 120 patients with Dravet syndrome and another with 171 patients with Lennox-Gastaut syndrome) found cannabidiol (CBD) treatment was 74% more likely than placebo to achieve a greater than 50% reduction in seizures. In the observational studies, nearly half (48.5%) of the 970 patients across a range of epilepsy subtypes achieved a 50% or greater reduction in seizures.
Emily Stockings, PhD, of the National Drug and Alcohol Research Centre at the University of New South Wales, Sydney, and her coauthors estimated that eight patients would need to receive CBD treatment to achieve a 50% reduction in seizures in one person. However, they also pointed out that the quality of the evidence was mixed.
“There is insufficient evidence from moderate-quality or high-quality studies to assess whether there is a treatment effect of Cannabis sativa, CBD:THC combinations, or oral cannabis extracts,” they wrote.
There were three randomized, controlled trials that also looked at complete seizure freedom, finding a sixfold higher likelihood of total seizure freedom with CBD, compared with placebo. However, the number needed to treat to achieve this was 171, and again, the quality of evidence was described as “mixed.”
Just over half of patients treated with CBD reported improved quality of life, and significantly more parents and caregivers of those treated with CBD said the patient’s overall condition had improved. The pooled estimates from observational studies suggested that 55.8% of patients experienced improvements in their quality of life when using cannabinoids.
Studies involving patients with Dravet syndrome reported the greatest improvements in quality of life, compared with studies involving a mix of epilepsy syndromes. However, the authors noted that the studies that involved Dravet syndrome patients were all case series in which every patient responded and suggested they should be interpreted with caution.
The authors said they were more confident of the benefits of CBD in children than in adults, because the more recent, larger, and better-conducted randomized, controlled trials focused on children and adolescents.
“In RCTs, and most of the non-RCTs, cannabinoids were used as an adjunctive therapy rather than as a standalone intervention, so at present, there is little evidence to support any recommendation that cannabinoids can be recommended as a replacement for current standard [antiepileptic drugs].”
The review also looked at the number of withdrawals, which they said could serve as an indicator of the tolerability and effectiveness of a treatment. The randomized, controlled trials showed no difference in withdrawal rates between patients on CBD and those on placebo, although CBD patients were more likely to withdraw because of adverse events.
There was a small but significant increase in the risk of adverse events with CBD, compared with placebo: particularly drowsiness, diarrhea, fatigue, and changes in appetite. There also was a higher incidence of serious adverse events (AEs), including status epilepticus and elevated aminotransferase levels.
“The fact that more patients withdrew or experienced AEs when receiving CBD than placebo indicates the need for clinicians and patients to weigh the risks and benefits of adding CBD to other AED [antiepileptic drug] treatment,” the authors wrote.
The study was supported by the Commonwealth Department of Health, the New South Wales Government Centre for Medicinal Cannabis Research and Innovation, the Victorian Department of Health and Human Services, and the Queensland Department of Health. Four authors were also supported by National Health and Medical Research Council grants. Three authors declared grants from the pharmaceutical industry, and one author has provided evidence to parliamentary committees on medical uses of cannabis in Australia and the United Kingdom, and is on the Australian Advisory Council on the Medicinal Use of Cannabis. No other conflicts of interest were declared.
SOURCE: Stockings E et al. J Neurol Neurosurg Psychiatry. 2018 Mar 6. doi: 10.1136/jnnp-2017-317168
FROM JOURNAL OF NEUROLOGY, NEUROSURGERY AND PSYCHIATRY
Key clinical point:
Major finding: Eight patients would need to receive cannabidiol treatment to achieve a 50% reduction in seizures in one person.
Data source: Systematic review of 36 studies.
Disclosures: The study was supported by the Commonwealth Department of Health, the New South Wales Government Centre for Medicinal Cannabis Research and Innovation, the Victorian Department of Health and Human Services, and the Queensland Department of Health. Four authors also were supported by National Health and Medical Research Council grants. Three authors declared grants from the pharmaceutical industry, and one author has provided evidence to parliamentary committees on medical uses of cannabis in Australia and the United Kingdom and is on the Australian Advisory Council on the Medicinal Use of Cannabis. No other conflicts of interest were declared.
Source: Stockings E et al. J Neurol Neurosurg Psychiatry. 2018 Mar 6. doi: 10.1136/jnnp-2017-317168.

Defensive medicine’s stranglehold on the realities of practice
In the September 2017 issue of JAMA Neurology, Louis R. Caplan, MD, wrote an excellent editorial, “Patient care is all about stories.” He notes that we all hear from patients about a recurrence of their previous stroke deficits, typically caused by infections, medications, or metabolic changes.
His point is that, telling the difference between true vascular events and recrudescence of old deficits can be difficult, but generally can be gleaned by taking a thorough history. He also notes, quite correctly, that the generic, automated features of modern charting systems often make it harder to get the details you need from previous visits.

Obviously, being able to accurately tell the difference between them can save health care costs, too. In a study in the same issue, Mehmet Topcuoglo, MD, and his colleagues discuss methodologies to differentiate between the causes of recrudescence of stroke-related deficits. Currently, the main approach is to admit patients to the hospital, do a knee-jerk repeat work-up with MRI, magnetic resonance angiogram, and echocardiogram (typically ordered before the neurologist has even been told of the consult) and then conclude that nothing has changed neurologically and that it was all caused by a bladder infection.
Surely, if we had an accurate way of telling the difference between them with a careful history, we’d save a lot of time and money on unnecessary hospital admissions. Right?
It sounds good in principle, but, sadly, the answer is “probably not.”
This is where the idealism of medicine meets the reality of its practice.
In the world of the emergency department, time and resources are limited. Emergency medicine physicians don’t have the luxury of taking a detailed neurologic history, nor are they trained (or expected) to be able to do so. Their job is to decide what is (and isn’t) life-threatening and who does (or doesn’t) need to be admitted.
But probably the main reason why Dr. Topcuoglo and his colleagues’ methodologies will never be implemented is defensive medicine. It’s a heck of lot easier and safer for any doctor – emergency medicine, hospitalist, and neurologist – to admit the patient and order more studies than it is to get served for malpractice and have to defend why you didn’t do that.
People can bemoan defensive medicine and its costs all they want. But, if you’ve been sued, you won’t care. You’ll order any test to protect yourself. Claiming that you followed a guideline from a journal, no matter how well researched it was, will likely be worthless the one time a stroke was missed. It’s easy for a plaintiff’s attorney to find someone to say you fell below the standard of care for doing so.

For an example of where this stands, here’s something from personal experience: One of my patients went to the emergency department for recrudescence of an old left hemiparesis, likely caused by a urinary tract infection. This wasn’t the first time it had happened. A head CT was stable while a urine analysis was abnormal. Because of my schedule, I wasn’t in a position to go see him in the ED in an expedient fashion. The ED physician was planning on admitting him and called to notify me. Knowing the history, I suggested sending him home with treatment for the UTI and to follow up with me the next day.
I thought that seemed reasonable, but the ED doctor didn’t. He said, “If you want to do that, then I am going to document that it’s on your instructions, that you are assuming all responsibility for care and outcome if a stroke is missed, and that I entirely disagree with your decision.”
I’m sure another neurologist might have said, “Okay, tell him to come in here tomorrow,” and hung up, but I really don’t have that kind of fortitude or desire for conflict with another physician. So I backed down and let the person on the scene make the decision. I saw the patient later that day as a consult, all his tests (except the urine analysis in the ED) were fine, and he went home the next day. I’m sure the bill was at least $50,000 (what really got paid is another matter), and defensive medicine had, for better or worse, won out over probability and reason.
Dr. Caplan, quite correctly, emphasizes the importance of taking a careful history, and I absolutely agree with him. Unfortunately, the lack of time in the ED setting, and fears driven by legal consequences, often make a good history irrelevant. Even when it’s done, there are other forces that push it to the background in making medical decisions.
I’m not saying that’s a good thing – it isn’t. But that’s the way it is right now in American medicine, and this aspect of the system shows no sign of changing.
Dr. Block has a solo neurology practice in Scottsdale, Ariz.
In the September 2017 issue of JAMA Neurology, Louis R. Caplan, MD, wrote an excellent editorial, “Patient care is all about stories.” He notes that we all hear from patients about a recurrence of their previous stroke deficits, typically caused by infections, medications, or metabolic changes.
His point is that, telling the difference between true vascular events and recrudescence of old deficits can be difficult, but generally can be gleaned by taking a thorough history. He also notes, quite correctly, that the generic, automated features of modern charting systems often make it harder to get the details you need from previous visits.
Obviously, being able to accurately tell the difference between them can save health care costs, too. In a study in the same issue, Mehmet Topcuoglo, MD, and his colleagues discuss methodologies to differentiate between the causes of recrudescence of stroke-related deficits. Currently, the main approach is to admit patients to the hospital, do a knee-jerk repeat work-up with MRI, magnetic resonance angiogram, and echocardiogram (typically ordered before the neurologist has even been told of the consult) and then conclude that nothing has changed neurologically and that it was all caused by a bladder infection.
Surely, if we had an accurate way of telling the difference between them with a careful history, we’d save a lot of time and money on unnecessary hospital admissions. Right?
It sounds good in principle, but, sadly, the answer is “probably not.”
This is where the idealism of medicine meets the reality of its practice.
In the world of the emergency department, time and resources are limited. Emergency medicine physicians don’t have the luxury of taking a detailed neurologic history, nor are they trained (or expected) to be able to do so. Their job is to decide what is (and isn’t) life-threatening and who does (or doesn’t) need to be admitted.
But probably the main reason why Dr. Topcuoglo and his colleagues’ methodologies will never be implemented is defensive medicine. It’s a heck of lot easier and safer for any doctor – emergency medicine, hospitalist, and neurologist – to admit the patient and order more studies than it is to get served for malpractice and have to defend why you didn’t do that.
People can bemoan defensive medicine and its costs all they want. But, if you’ve been sued, you won’t care. You’ll order any test to protect yourself. Claiming that you followed a guideline from a journal, no matter how well researched it was, will likely be worthless the one time a stroke was missed. It’s easy for a plaintiff’s attorney to find someone to say you fell below the standard of care for doing so.
For an example of where this stands, here’s something from personal experience: One of my patients went to the emergency department for recrudescence of an old left hemiparesis, likely caused by a urinary tract infection. This wasn’t the first time it had happened. A head CT was stable while a urine analysis was abnormal. Because of my schedule, I wasn’t in a position to go see him in the ED in an expedient fashion. The ED physician was planning on admitting him and called to notify me. Knowing the history, I suggested sending him home with treatment for the UTI and to follow up with me the next day.
I thought that seemed reasonable, but the ED doctor didn’t. He said, “If you want to do that, then I am going to document that it’s on your instructions, that you are assuming all responsibility for care and outcome if a stroke is missed, and that I entirely disagree with your decision.”
I’m sure another neurologist might have said, “Okay, tell him to come in here tomorrow,” and hung up, but I really don’t have that kind of fortitude or desire for conflict with another physician. So I backed down and let the person on the scene make the decision. I saw the patient later that day as a consult, all his tests (except the urine analysis in the ED) were fine, and he went home the next day. I’m sure the bill was at least $50,000 (what really got paid is another matter), and defensive medicine had, for better or worse, won out over probability and reason.
Dr. Caplan, quite correctly, emphasizes the importance of taking a careful history, and I absolutely agree with him. Unfortunately, the lack of time in the ED setting, and fears driven by legal consequences, often make a good history irrelevant. Even when it’s done, there are other forces that push it to the background in making medical decisions.
I’m not saying that’s a good thing – it isn’t. But that’s the way it is right now in American medicine, and this aspect of the system shows no sign of changing.
Dr. Block has a solo neurology practice in Scottsdale, Ariz.
In the September 2017 issue of JAMA Neurology, Louis R. Caplan, MD, wrote an excellent editorial, “Patient care is all about stories.” He notes that we all hear from patients about a recurrence of their previous stroke deficits, typically caused by infections, medications, or metabolic changes.
His point is that, telling the difference between true vascular events and recrudescence of old deficits can be difficult, but generally can be gleaned by taking a thorough history. He also notes, quite correctly, that the generic, automated features of modern charting systems often make it harder to get the details you need from previous visits.
Obviously, being able to accurately tell the difference between them can save health care costs, too. In a study in the same issue, Mehmet Topcuoglo, MD, and his colleagues discuss methodologies to differentiate between the causes of recrudescence of stroke-related deficits. Currently, the main approach is to admit patients to the hospital, do a knee-jerk repeat work-up with MRI, magnetic resonance angiogram, and echocardiogram (typically ordered before the neurologist has even been told of the consult) and then conclude that nothing has changed neurologically and that it was all caused by a bladder infection.
Surely, if we had an accurate way of telling the difference between them with a careful history, we’d save a lot of time and money on unnecessary hospital admissions. Right?
It sounds good in principle, but, sadly, the answer is “probably not.”
This is where the idealism of medicine meets the reality of its practice.
In the world of the emergency department, time and resources are limited. Emergency medicine physicians don’t have the luxury of taking a detailed neurologic history, nor are they trained (or expected) to be able to do so. Their job is to decide what is (and isn’t) life-threatening and who does (or doesn’t) need to be admitted.
But probably the main reason why Dr. Topcuoglo and his colleagues’ methodologies will never be implemented is defensive medicine. It’s a heck of lot easier and safer for any doctor – emergency medicine, hospitalist, and neurologist – to admit the patient and order more studies than it is to get served for malpractice and have to defend why you didn’t do that.
People can bemoan defensive medicine and its costs all they want. But, if you’ve been sued, you won’t care. You’ll order any test to protect yourself. Claiming that you followed a guideline from a journal, no matter how well researched it was, will likely be worthless the one time a stroke was missed. It’s easy for a plaintiff’s attorney to find someone to say you fell below the standard of care for doing so.
For an example of where this stands, here’s something from personal experience: One of my patients went to the emergency department for recrudescence of an old left hemiparesis, likely caused by a urinary tract infection. This wasn’t the first time it had happened. A head CT was stable while a urine analysis was abnormal. Because of my schedule, I wasn’t in a position to go see him in the ED in an expedient fashion. The ED physician was planning on admitting him and called to notify me. Knowing the history, I suggested sending him home with treatment for the UTI and to follow up with me the next day.
I thought that seemed reasonable, but the ED doctor didn’t. He said, “If you want to do that, then I am going to document that it’s on your instructions, that you are assuming all responsibility for care and outcome if a stroke is missed, and that I entirely disagree with your decision.”
I’m sure another neurologist might have said, “Okay, tell him to come in here tomorrow,” and hung up, but I really don’t have that kind of fortitude or desire for conflict with another physician. So I backed down and let the person on the scene make the decision. I saw the patient later that day as a consult, all his tests (except the urine analysis in the ED) were fine, and he went home the next day. I’m sure the bill was at least $50,000 (what really got paid is another matter), and defensive medicine had, for better or worse, won out over probability and reason.
Dr. Caplan, quite correctly, emphasizes the importance of taking a careful history, and I absolutely agree with him. Unfortunately, the lack of time in the ED setting, and fears driven by legal consequences, often make a good history irrelevant. Even when it’s done, there are other forces that push it to the background in making medical decisions.
I’m not saying that’s a good thing – it isn’t. But that’s the way it is right now in American medicine, and this aspect of the system shows no sign of changing.
Dr. Block has a solo neurology practice in Scottsdale, Ariz.

Tear proteins seen as Parkinson’s biomarker
The tears of people with established Parkinson’s disease have protein signatures distinct from those of healthy controls, researchers have learned.
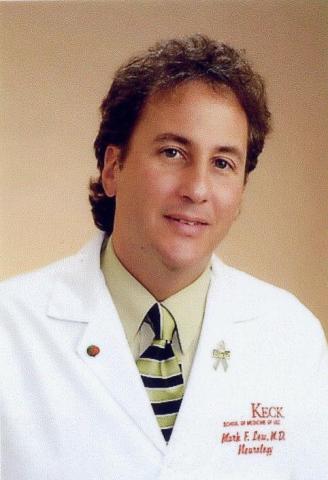
Mark Lew, MD, and his colleagues at the University of Southern California, Los Angeles, used a noninvasive method to collect the tears and readily available assays to detect the proteins, paving the way for future studies of these proteins as biomarkers in early Parkinson’s disease (PD).

The researchers will report on their study at the annual meeting of the American Academy of Neurology in Los Angeles on April 22.
This research from Dr. Lew and his colleagues joins a host of ongoing efforts to find biomarkers for PD that can be used in the early stages of the disease, before motor dysfunction occurs. Other research groups are working on biomarkers in saliva and salivary glands, skin, blood, and cerebrospinal fluid. “Right now, a diagnosis of Parkinson’s disease is based on clinical history and then examination and then, potentially, on response to medication,” said Dr. Lew, professor of neurology, the vice chair of the department of neurology, and the director of the division of movement disorders at USC. “The difficulty is really being able to definitively be able to diagnose patients with early disease.”
Dr. Lew and his coinvestigators measured the levels of the protein alpha-synuclein in the tears of 55 people with PD and compared them with levels in the tears of 27 age- and sex-matched controls. They also measured oligomeric alpha-synuclein, an abnormal form of the protein whose aggregates are implicated in nerve damage in PD.
The test administered is based on a Schirmer’s test, which is used in ophthalmology to measure tear production. A strip of paper is placed in the lower eyelid pouch to collect tears, which the researchers then can analyze using commercially available assays.
Dr. Lew and his colleagues found levels of the oligomeric form of alpha-synuclein to be significantly greater in PD patients than they were in controls: an average of 1.45 ng/mg of tear protein, compared with 0.27 ng/mg in controls (P = .0007).
Total alpha-synuclein was decreased significantly in PD patients relative to healthy controls.
While the team looked at the levels of two additional proteins, CC chemokine ligand 2 and DJ-1 (Parkinson’s disease protein 7), neither of them varied significantly between PD patients and non-PD controls.
“We’re cautiously optimistic, and I don’t want to overstate the results because it’s still a relatively small group of subjects – we need to more than double the control population to make sure our results are maintained,” Dr. Lew said in an interview in advance of the meeting. “But it’s very exciting.”
At AAN, Dr. Lew’s research group will present findings from a larger cohort of both patients and controls. “Our expectation is that things will look similar and we will continue to see a significant difference in the oligomeric form of alpha-synuclein,” the tear protein associated with PD.
The idea of using tear proteins as biomarkers for PD came as a result of a collaboration with scientists working in USC’s ophthalmology lab, who had previously worked on tear biomarkers in other disorders, including Sjogren’s syndrome, Dr. Lew said.
Dr. Lew said that, if the initial results bear out in a larger cohort, the next step is to test the tears of people with genetic or atypical forms of PD and compare the results with those for idiopathic forms. “These atypical forms, like progressive supranuclear palsy [PSP] and multiple system atrophy [MSA], can be very difficult to tell apart clinically in the early stages. If we had a simple test to do that, it would be very helpful.”
A reliable biomarker, if it can be shown to be sensitive early in disease, also would have implications for the timing of disease-modifying interventions, such as the monoclonal antibodies or gene therapies that are currently being investigated.
“We don’t have those therapies now, but in a few years we very well could,” Dr. Lew said. “If we could identify patients early and if we had a therapy that we could give them that was disease-modifying, or neuroprotective, you’d want to start much earlier than we currently do.”
This study from Dr. Lew and his colleagues was supported by the Michael J. Fox Foundation and the Plotkin Foundation. Dr. Lew has received personal compensation for consulting for, serving on a scientific advisory board for, speaking for, or other activities with Teva Pharmaceutical Industries, US WorldMeds, AbbVie, Lundbeck, Acadia Pharmaceuticals, UCB, Revance Therapeutics, and Adamas Pharmaceuticals. Dr. Lew has received research support from Acorda Therapeutics, Biotie Therapies, NeuroDerm, and Lilly. None of the other authors had anything to disclose.
SOURCE: Feigenbaum D et al. Abstract 4209.
The tears of people with established Parkinson’s disease have protein signatures distinct from those of healthy controls, researchers have learned.
Mark Lew, MD, and his colleagues at the University of Southern California, Los Angeles, used a noninvasive method to collect the tears and readily available assays to detect the proteins, paving the way for future studies of these proteins as biomarkers in early Parkinson’s disease (PD).
The researchers will report on their study at the annual meeting of the American Academy of Neurology in Los Angeles on April 22.
This research from Dr. Lew and his colleagues joins a host of ongoing efforts to find biomarkers for PD that can be used in the early stages of the disease, before motor dysfunction occurs. Other research groups are working on biomarkers in saliva and salivary glands, skin, blood, and cerebrospinal fluid. “Right now, a diagnosis of Parkinson’s disease is based on clinical history and then examination and then, potentially, on response to medication,” said Dr. Lew, professor of neurology, the vice chair of the department of neurology, and the director of the division of movement disorders at USC. “The difficulty is really being able to definitively be able to diagnose patients with early disease.”
Dr. Lew and his coinvestigators measured the levels of the protein alpha-synuclein in the tears of 55 people with PD and compared them with levels in the tears of 27 age- and sex-matched controls. They also measured oligomeric alpha-synuclein, an abnormal form of the protein whose aggregates are implicated in nerve damage in PD.
The test administered is based on a Schirmer’s test, which is used in ophthalmology to measure tear production. A strip of paper is placed in the lower eyelid pouch to collect tears, which the researchers then can analyze using commercially available assays.
Dr. Lew and his colleagues found levels of the oligomeric form of alpha-synuclein to be significantly greater in PD patients than they were in controls: an average of 1.45 ng/mg of tear protein, compared with 0.27 ng/mg in controls (P = .0007).
Total alpha-synuclein was decreased significantly in PD patients relative to healthy controls.
While the team looked at the levels of two additional proteins, CC chemokine ligand 2 and DJ-1 (Parkinson’s disease protein 7), neither of them varied significantly between PD patients and non-PD controls.
“We’re cautiously optimistic, and I don’t want to overstate the results because it’s still a relatively small group of subjects – we need to more than double the control population to make sure our results are maintained,” Dr. Lew said in an interview in advance of the meeting. “But it’s very exciting.”
At AAN, Dr. Lew’s research group will present findings from a larger cohort of both patients and controls. “Our expectation is that things will look similar and we will continue to see a significant difference in the oligomeric form of alpha-synuclein,” the tear protein associated with PD.
The idea of using tear proteins as biomarkers for PD came as a result of a collaboration with scientists working in USC’s ophthalmology lab, who had previously worked on tear biomarkers in other disorders, including Sjogren’s syndrome, Dr. Lew said.
Dr. Lew said that, if the initial results bear out in a larger cohort, the next step is to test the tears of people with genetic or atypical forms of PD and compare the results with those for idiopathic forms. “These atypical forms, like progressive supranuclear palsy [PSP] and multiple system atrophy [MSA], can be very difficult to tell apart clinically in the early stages. If we had a simple test to do that, it would be very helpful.”
A reliable biomarker, if it can be shown to be sensitive early in disease, also would have implications for the timing of disease-modifying interventions, such as the monoclonal antibodies or gene therapies that are currently being investigated.
“We don’t have those therapies now, but in a few years we very well could,” Dr. Lew said. “If we could identify patients early and if we had a therapy that we could give them that was disease-modifying, or neuroprotective, you’d want to start much earlier than we currently do.”
This study from Dr. Lew and his colleagues was supported by the Michael J. Fox Foundation and the Plotkin Foundation. Dr. Lew has received personal compensation for consulting for, serving on a scientific advisory board for, speaking for, or other activities with Teva Pharmaceutical Industries, US WorldMeds, AbbVie, Lundbeck, Acadia Pharmaceuticals, UCB, Revance Therapeutics, and Adamas Pharmaceuticals. Dr. Lew has received research support from Acorda Therapeutics, Biotie Therapies, NeuroDerm, and Lilly. None of the other authors had anything to disclose.
SOURCE: Feigenbaum D et al. Abstract 4209.
The tears of people with established Parkinson’s disease have protein signatures distinct from those of healthy controls, researchers have learned.
Mark Lew, MD, and his colleagues at the University of Southern California, Los Angeles, used a noninvasive method to collect the tears and readily available assays to detect the proteins, paving the way for future studies of these proteins as biomarkers in early Parkinson’s disease (PD).
The researchers will report on their study at the annual meeting of the American Academy of Neurology in Los Angeles on April 22.
This research from Dr. Lew and his colleagues joins a host of ongoing efforts to find biomarkers for PD that can be used in the early stages of the disease, before motor dysfunction occurs. Other research groups are working on biomarkers in saliva and salivary glands, skin, blood, and cerebrospinal fluid. “Right now, a diagnosis of Parkinson’s disease is based on clinical history and then examination and then, potentially, on response to medication,” said Dr. Lew, professor of neurology, the vice chair of the department of neurology, and the director of the division of movement disorders at USC. “The difficulty is really being able to definitively be able to diagnose patients with early disease.”
Dr. Lew and his coinvestigators measured the levels of the protein alpha-synuclein in the tears of 55 people with PD and compared them with levels in the tears of 27 age- and sex-matched controls. They also measured oligomeric alpha-synuclein, an abnormal form of the protein whose aggregates are implicated in nerve damage in PD.
The test administered is based on a Schirmer’s test, which is used in ophthalmology to measure tear production. A strip of paper is placed in the lower eyelid pouch to collect tears, which the researchers then can analyze using commercially available assays.
Dr. Lew and his colleagues found levels of the oligomeric form of alpha-synuclein to be significantly greater in PD patients than they were in controls: an average of 1.45 ng/mg of tear protein, compared with 0.27 ng/mg in controls (P = .0007).
Total alpha-synuclein was decreased significantly in PD patients relative to healthy controls.
While the team looked at the levels of two additional proteins, CC chemokine ligand 2 and DJ-1 (Parkinson’s disease protein 7), neither of them varied significantly between PD patients and non-PD controls.
“We’re cautiously optimistic, and I don’t want to overstate the results because it’s still a relatively small group of subjects – we need to more than double the control population to make sure our results are maintained,” Dr. Lew said in an interview in advance of the meeting. “But it’s very exciting.”
At AAN, Dr. Lew’s research group will present findings from a larger cohort of both patients and controls. “Our expectation is that things will look similar and we will continue to see a significant difference in the oligomeric form of alpha-synuclein,” the tear protein associated with PD.
The idea of using tear proteins as biomarkers for PD came as a result of a collaboration with scientists working in USC’s ophthalmology lab, who had previously worked on tear biomarkers in other disorders, including Sjogren’s syndrome, Dr. Lew said.
Dr. Lew said that, if the initial results bear out in a larger cohort, the next step is to test the tears of people with genetic or atypical forms of PD and compare the results with those for idiopathic forms. “These atypical forms, like progressive supranuclear palsy [PSP] and multiple system atrophy [MSA], can be very difficult to tell apart clinically in the early stages. If we had a simple test to do that, it would be very helpful.”
A reliable biomarker, if it can be shown to be sensitive early in disease, also would have implications for the timing of disease-modifying interventions, such as the monoclonal antibodies or gene therapies that are currently being investigated.
“We don’t have those therapies now, but in a few years we very well could,” Dr. Lew said. “If we could identify patients early and if we had a therapy that we could give them that was disease-modifying, or neuroprotective, you’d want to start much earlier than we currently do.”
This study from Dr. Lew and his colleagues was supported by the Michael J. Fox Foundation and the Plotkin Foundation. Dr. Lew has received personal compensation for consulting for, serving on a scientific advisory board for, speaking for, or other activities with Teva Pharmaceutical Industries, US WorldMeds, AbbVie, Lundbeck, Acadia Pharmaceuticals, UCB, Revance Therapeutics, and Adamas Pharmaceuticals. Dr. Lew has received research support from Acorda Therapeutics, Biotie Therapies, NeuroDerm, and Lilly. None of the other authors had anything to disclose.
SOURCE: Feigenbaum D et al. Abstract 4209.
FROM AAN 2018
Key clinical point: Elevated oligomeric alpha-synuclein in tears shows promise as an early biomarker for Parkinson’s disease.
Major finding: Levels of the oligomeric form of alpha-synuclein were significantly greater in PD patients, compared with controls: an average of 1.45 ng/mg of tear protein, compared with 0.27 ng/mg in controls (P = .0007).
Study details: An ongoing study that has so far measured tear proteins in 55 people with PD and 27 age- and sex-matched controls.
Disclosures: Dr. Lew and his colleagues’ study was supported by the Michael J. Fox Foundation and the Plotkin Foundation. Dr. Lew has received personal compensation for consulting for, serving on a scientific advisory board for, speaking for, or other activities with Teva Pharmaceutical Industries, US WorldMeds, AbbVie, Lundbeck, Acadia Pharmaceuticals, UCB, Revance Therapeutics, and Adamas Pharmaceuticals. Dr. Lew has received research support from Acorda Therapeutics, Biotie Therapies, NeuroDerm, and Lilly. None of the other authors had anything to disclose.
Source: Feigenbaum D et al. AAN 2018, Abstract 4209
RA unlikely to be transmitted through blood transfusions
Rheumatoid arthritis does not get transmitted through blood transfusions, according to findings from a large retrospective study of blood transfusions in Denmark and Sweden.
Two separate analyses showed that the risk of developing RA among transfusion recipients was not correlated to the presence of RA in the blood donor.
There had been concern about risks of transfusion because of RA’s long preclinical phase, in which RA pathogenesis factors circulate in the periphery and could potentially be transmitted in a transfusion. Mouse models had suggested that anti–citrullinated peptide/protein antibodies could spark or worsen arthritis, and RA fibroblast-like synoviocyte cell precursors could spread RA between joints.
Two previous studies, based on self-reported history of blood transfusion, reached the opposite conclusion regarding the risk of RA transmission.
The latest findings, published online in Annals of the Rheumatic Diseases, involved an analysis of data from the Danish–Swedish population-based research donations and transfusions database (SCANDAT2). In one model, they looked at 938,942 blood donors, 2,412 of whom were diagnosed with RA during the follow-up period. The researchers then analyzed data from 13,369 subjects who had been exposed to blood from donors who went on to develop RA, and compared them to 139,470 recipients who received blood from donors who did not develop RA. There was no statistically significant correlation between risk of RA among recipients by RA status of the donors, RA serotype in the donors, donor age at RA diagnosis, or elapsed time between donation and RA diagnosis.
In a second analysis, the researchers looked for RA clusters among recipients who might have received blood from a donor with RA. They found no association between RA risk for a given recipient based on whether other recipients from the same donor had gone on to develop RA.
“In light of the study’s strengths, including low likelihood of confounding and large study size ensuring meaningful statistical power, we believe the possibility of RA transmission is unlikely to be clinically relevant,” the authors wrote.
The study was funded by the Danish Rheumatism Association, the Odense University Hospital PhD Fund and Fund for clinical research, the Nordic Cancer Union, the Swedish Foundation for Strategic Research, the Swedish Research Council, and ALF funds. One author reported receiving grants from AbbVie, Bristol-Myers Squibb, Merck, Pfizer, Roche, Samsung, and UCB.
SOURCE: Just SA et al. Ann Rheum Dis. 2018 Mar 1. doi: 10.1136/annrheumdis-2017-212844
Rheumatoid arthritis does not get transmitted through blood transfusions, according to findings from a large retrospective study of blood transfusions in Denmark and Sweden.
Two separate analyses showed that the risk of developing RA among transfusion recipients was not correlated to the presence of RA in the blood donor.
There had been concern about risks of transfusion because of RA’s long preclinical phase, in which RA pathogenesis factors circulate in the periphery and could potentially be transmitted in a transfusion. Mouse models had suggested that anti–citrullinated peptide/protein antibodies could spark or worsen arthritis, and RA fibroblast-like synoviocyte cell precursors could spread RA between joints.
Two previous studies, based on self-reported history of blood transfusion, reached the opposite conclusion regarding the risk of RA transmission.
The latest findings, published online in Annals of the Rheumatic Diseases, involved an analysis of data from the Danish–Swedish population-based research donations and transfusions database (SCANDAT2). In one model, they looked at 938,942 blood donors, 2,412 of whom were diagnosed with RA during the follow-up period. The researchers then analyzed data from 13,369 subjects who had been exposed to blood from donors who went on to develop RA, and compared them to 139,470 recipients who received blood from donors who did not develop RA. There was no statistically significant correlation between risk of RA among recipients by RA status of the donors, RA serotype in the donors, donor age at RA diagnosis, or elapsed time between donation and RA diagnosis.
In a second analysis, the researchers looked for RA clusters among recipients who might have received blood from a donor with RA. They found no association between RA risk for a given recipient based on whether other recipients from the same donor had gone on to develop RA.
“In light of the study’s strengths, including low likelihood of confounding and large study size ensuring meaningful statistical power, we believe the possibility of RA transmission is unlikely to be clinically relevant,” the authors wrote.
The study was funded by the Danish Rheumatism Association, the Odense University Hospital PhD Fund and Fund for clinical research, the Nordic Cancer Union, the Swedish Foundation for Strategic Research, the Swedish Research Council, and ALF funds. One author reported receiving grants from AbbVie, Bristol-Myers Squibb, Merck, Pfizer, Roche, Samsung, and UCB.
SOURCE: Just SA et al. Ann Rheum Dis. 2018 Mar 1. doi: 10.1136/annrheumdis-2017-212844
Rheumatoid arthritis does not get transmitted through blood transfusions, according to findings from a large retrospective study of blood transfusions in Denmark and Sweden.
Two separate analyses showed that the risk of developing RA among transfusion recipients was not correlated to the presence of RA in the blood donor.
There had been concern about risks of transfusion because of RA’s long preclinical phase, in which RA pathogenesis factors circulate in the periphery and could potentially be transmitted in a transfusion. Mouse models had suggested that anti–citrullinated peptide/protein antibodies could spark or worsen arthritis, and RA fibroblast-like synoviocyte cell precursors could spread RA between joints.
Two previous studies, based on self-reported history of blood transfusion, reached the opposite conclusion regarding the risk of RA transmission.
The latest findings, published online in Annals of the Rheumatic Diseases, involved an analysis of data from the Danish–Swedish population-based research donations and transfusions database (SCANDAT2). In one model, they looked at 938,942 blood donors, 2,412 of whom were diagnosed with RA during the follow-up period. The researchers then analyzed data from 13,369 subjects who had been exposed to blood from donors who went on to develop RA, and compared them to 139,470 recipients who received blood from donors who did not develop RA. There was no statistically significant correlation between risk of RA among recipients by RA status of the donors, RA serotype in the donors, donor age at RA diagnosis, or elapsed time between donation and RA diagnosis.
In a second analysis, the researchers looked for RA clusters among recipients who might have received blood from a donor with RA. They found no association between RA risk for a given recipient based on whether other recipients from the same donor had gone on to develop RA.
“In light of the study’s strengths, including low likelihood of confounding and large study size ensuring meaningful statistical power, we believe the possibility of RA transmission is unlikely to be clinically relevant,” the authors wrote.
The study was funded by the Danish Rheumatism Association, the Odense University Hospital PhD Fund and Fund for clinical research, the Nordic Cancer Union, the Swedish Foundation for Strategic Research, the Swedish Research Council, and ALF funds. One author reported receiving grants from AbbVie, Bristol-Myers Squibb, Merck, Pfizer, Roche, Samsung, and UCB.
SOURCE: Just SA et al. Ann Rheum Dis. 2018 Mar 1. doi: 10.1136/annrheumdis-2017-212844
FROM ANNALS OF THE RHEUMATIC DISEASES
Key clinical point: Blood transfusion is unlikely to be a RA transmission route.
Major finding: Recipients had similar risk of RA whether or not the donor later developed RA.
Data source: Retrospective analysis of 938,942 blood donors and 152,839 recipients.
Disclosures: The study was funded by the Danish Rheumatism Association, the Odense University Hospital PhD Fund and Fund for clinical research, the Nordic Cancer Union, the Swedish Foundation for Strategic Research, the Swedish Research Council, and ALF funds. One author reported receiving grants from AbbVie, Bristol-Myers Squibb, Merck, Pfizer, Roche, Samsung, and UCB.
Source: Just SA et al. Ann Rheum Dis. 2018 Mar 1. doi: 10.1136/annrheumdis-2017-212844.
Nonopioid analgesics have no major disadvantages vs. opioids for chronic pain
Patients treated with opioids for moderate to severe chronic back pain or knee or hip osteoarthritis pain saw no significant improvement when results were compared with treatment using acetaminophen or nonsteroidal anti-inflammatory drugs in the randomized SPACE study.
These findings may help restructure how physicians treat patients with chronic pain in order to decrease the risk of opioid addiction in a population that is particularly susceptible.

“Long-term opioid therapy became a standard approach to managing chronic musculoskeletal pain despite a lack of high-quality data on benefits and harms,” wrote Erin E. Krebs, MD, MPH, core investigator at the Minneapolis Veterans Affairs Center for Chronic Disease Outcomes Research, and her colleagues. “Rising rates of opioid overdose deaths have raised questions about prescribing opioids for chronic pain management.”
In the 12-month SPACE (Strategies for Prescribing Analgesics Comparative Effectiveness) trial published March 6 in JAMA, the investigators reported randomizing a total of 240 patients to treatment with immediate-release opioids (morphine, oxycodone, or hydrocodone/acetaminophen) or acetaminophen or nonsteroidal anti-inflammatory drugs. The patients came from the Minneapolis VA system between June 2013 and December 2015. Patients in the opioid group were on average 57 years old, while those in the nonopioid group had an average age of 60 years. Men comprised 87% of all patients, and both groups were predominantly white (86%-88%) with chronic back pain (65%). The investigators excluded patients with physiological opioid dependence from ongoing opioid use.
Patients taking opioids saw no significant improvement in the primary outcome of pain-related function on the seven-item Brief Pain Inventory (BPI) interference scale over those taking nonopioids at the end of the 12-month period (P = .58), according to Dr. Krebs and her fellow investigators.
The main secondary outcome of pain intensity using the four-item BPI severity scale improved significantly more among the nonopioid group, which reported an average score of 3.5, compared with 4.0 in the opioid group (P = .03). However, the small difference of 0.5 is less than the minimal clinically important difference of 1.0, according to the investigators.
Anxiety control was the only secondary outcome measure that was significantly better among patients in the opioid group, which was unsurprising to the investigators. “This finding is consistent with the role of the endogenous opioid system in stress and emotional suffering,” they wrote.
The investigators were uncertain about the significance of this small difference because overall anxiety levels were low, with 9% of patients reporting moderate severity anxiety symptoms at baseline.
Patients in the opioid group took a mean of 1.7 analgesics during the study period, compared with 3.8 in the nonopioid group. In the nonopioid group, the mean number of months that nonopioid analgesics were prescribed ranged from 2.6 for acetaminophen to 5.9 with oral NSAIDs. In this group, tramadol was prescribed to no more than 11% of patients during any particular month and was dispensed for a mean of 0.4 months overall.
Patients in the opioid group took opioids for a mean of 8.1 months, with all other analgesics taken for a mean of 0.4 months or less. The authors noted that in “each 90-day follow-up period, fewer than 15% of patients in the opioid group had a mean dispensed dosage of 50 morphine-equivalent mg/day or more.” Patients could be titrated up to a maximum daily dosage of 100 morphine-equivalent mg/day.
Patients prescribed opioids were significantly more likely to report medication-related symptoms, and while misuse was not significantly higher in the opioid group, the investigators said that “Overall, opioids did not demonstrate any advantage over nonopioid medications that could potentially outweigh their greater risk of harms.”
Further studies will need to include a more diverse population, they noted.
The study was funded by an award from the U.S. Department of Veterans Affairs Health Services Research and Development Service. The investigators reported no relevant disclosures.
ezimmerman@frontlinemedcom.com
SOURCE: Krebs EE et al. JAMA. 2018 Mar 6;319(9):872-82
Patients treated with opioids for moderate to severe chronic back pain or knee or hip osteoarthritis pain saw no significant improvement when results were compared with treatment using acetaminophen or nonsteroidal anti-inflammatory drugs in the randomized SPACE study.
These findings may help restructure how physicians treat patients with chronic pain in order to decrease the risk of opioid addiction in a population that is particularly susceptible.
“Long-term opioid therapy became a standard approach to managing chronic musculoskeletal pain despite a lack of high-quality data on benefits and harms,” wrote Erin E. Krebs, MD, MPH, core investigator at the Minneapolis Veterans Affairs Center for Chronic Disease Outcomes Research, and her colleagues. “Rising rates of opioid overdose deaths have raised questions about prescribing opioids for chronic pain management.”
In the 12-month SPACE (Strategies for Prescribing Analgesics Comparative Effectiveness) trial published March 6 in JAMA, the investigators reported randomizing a total of 240 patients to treatment with immediate-release opioids (morphine, oxycodone, or hydrocodone/acetaminophen) or acetaminophen or nonsteroidal anti-inflammatory drugs. The patients came from the Minneapolis VA system between June 2013 and December 2015. Patients in the opioid group were on average 57 years old, while those in the nonopioid group had an average age of 60 years. Men comprised 87% of all patients, and both groups were predominantly white (86%-88%) with chronic back pain (65%). The investigators excluded patients with physiological opioid dependence from ongoing opioid use.
Patients taking opioids saw no significant improvement in the primary outcome of pain-related function on the seven-item Brief Pain Inventory (BPI) interference scale over those taking nonopioids at the end of the 12-month period (P = .58), according to Dr. Krebs and her fellow investigators.
The main secondary outcome of pain intensity using the four-item BPI severity scale improved significantly more among the nonopioid group, which reported an average score of 3.5, compared with 4.0 in the opioid group (P = .03). However, the small difference of 0.5 is less than the minimal clinically important difference of 1.0, according to the investigators.
Anxiety control was the only secondary outcome measure that was significantly better among patients in the opioid group, which was unsurprising to the investigators. “This finding is consistent with the role of the endogenous opioid system in stress and emotional suffering,” they wrote.
The investigators were uncertain about the significance of this small difference because overall anxiety levels were low, with 9% of patients reporting moderate severity anxiety symptoms at baseline.
Patients in the opioid group took a mean of 1.7 analgesics during the study period, compared with 3.8 in the nonopioid group. In the nonopioid group, the mean number of months that nonopioid analgesics were prescribed ranged from 2.6 for acetaminophen to 5.9 with oral NSAIDs. In this group, tramadol was prescribed to no more than 11% of patients during any particular month and was dispensed for a mean of 0.4 months overall.
Patients in the opioid group took opioids for a mean of 8.1 months, with all other analgesics taken for a mean of 0.4 months or less. The authors noted that in “each 90-day follow-up period, fewer than 15% of patients in the opioid group had a mean dispensed dosage of 50 morphine-equivalent mg/day or more.” Patients could be titrated up to a maximum daily dosage of 100 morphine-equivalent mg/day.
Patients prescribed opioids were significantly more likely to report medication-related symptoms, and while misuse was not significantly higher in the opioid group, the investigators said that “Overall, opioids did not demonstrate any advantage over nonopioid medications that could potentially outweigh their greater risk of harms.”
Further studies will need to include a more diverse population, they noted.
The study was funded by an award from the U.S. Department of Veterans Affairs Health Services Research and Development Service. The investigators reported no relevant disclosures.
ezimmerman@frontlinemedcom.com
SOURCE: Krebs EE et al. JAMA. 2018 Mar 6;319(9):872-82
Patients treated with opioids for moderate to severe chronic back pain or knee or hip osteoarthritis pain saw no significant improvement when results were compared with treatment using acetaminophen or nonsteroidal anti-inflammatory drugs in the randomized SPACE study.
These findings may help restructure how physicians treat patients with chronic pain in order to decrease the risk of opioid addiction in a population that is particularly susceptible.
“Long-term opioid therapy became a standard approach to managing chronic musculoskeletal pain despite a lack of high-quality data on benefits and harms,” wrote Erin E. Krebs, MD, MPH, core investigator at the Minneapolis Veterans Affairs Center for Chronic Disease Outcomes Research, and her colleagues. “Rising rates of opioid overdose deaths have raised questions about prescribing opioids for chronic pain management.”
In the 12-month SPACE (Strategies for Prescribing Analgesics Comparative Effectiveness) trial published March 6 in JAMA, the investigators reported randomizing a total of 240 patients to treatment with immediate-release opioids (morphine, oxycodone, or hydrocodone/acetaminophen) or acetaminophen or nonsteroidal anti-inflammatory drugs. The patients came from the Minneapolis VA system between June 2013 and December 2015. Patients in the opioid group were on average 57 years old, while those in the nonopioid group had an average age of 60 years. Men comprised 87% of all patients, and both groups were predominantly white (86%-88%) with chronic back pain (65%). The investigators excluded patients with physiological opioid dependence from ongoing opioid use.
Patients taking opioids saw no significant improvement in the primary outcome of pain-related function on the seven-item Brief Pain Inventory (BPI) interference scale over those taking nonopioids at the end of the 12-month period (P = .58), according to Dr. Krebs and her fellow investigators.
The main secondary outcome of pain intensity using the four-item BPI severity scale improved significantly more among the nonopioid group, which reported an average score of 3.5, compared with 4.0 in the opioid group (P = .03). However, the small difference of 0.5 is less than the minimal clinically important difference of 1.0, according to the investigators.
Anxiety control was the only secondary outcome measure that was significantly better among patients in the opioid group, which was unsurprising to the investigators. “This finding is consistent with the role of the endogenous opioid system in stress and emotional suffering,” they wrote.
The investigators were uncertain about the significance of this small difference because overall anxiety levels were low, with 9% of patients reporting moderate severity anxiety symptoms at baseline.
Patients in the opioid group took a mean of 1.7 analgesics during the study period, compared with 3.8 in the nonopioid group. In the nonopioid group, the mean number of months that nonopioid analgesics were prescribed ranged from 2.6 for acetaminophen to 5.9 with oral NSAIDs. In this group, tramadol was prescribed to no more than 11% of patients during any particular month and was dispensed for a mean of 0.4 months overall.
Patients in the opioid group took opioids for a mean of 8.1 months, with all other analgesics taken for a mean of 0.4 months or less. The authors noted that in “each 90-day follow-up period, fewer than 15% of patients in the opioid group had a mean dispensed dosage of 50 morphine-equivalent mg/day or more.” Patients could be titrated up to a maximum daily dosage of 100 morphine-equivalent mg/day.
Patients prescribed opioids were significantly more likely to report medication-related symptoms, and while misuse was not significantly higher in the opioid group, the investigators said that “Overall, opioids did not demonstrate any advantage over nonopioid medications that could potentially outweigh their greater risk of harms.”
Further studies will need to include a more diverse population, they noted.
The study was funded by an award from the U.S. Department of Veterans Affairs Health Services Research and Development Service. The investigators reported no relevant disclosures.
ezimmerman@frontlinemedcom.com
SOURCE: Krebs EE et al. JAMA. 2018 Mar 6;319(9):872-82
FROM JAMA
Key clinical point: Opioids and nonopioid analgesics provided similar improvements in pain-related function for patients with chronic pain.
Major finding: Patients taking opioids did not show significant improvement in pain-related function, compared with those taking nonopioids (P = .58).
Study details: A 12-month, randomized trial of 240 patients with chronic back, knee, or hip pain, gathered from a Veterans Affairs clinic between June 2013 to December 2015.
Disclosures: The study was funded by an award from the U.S. Department of Veterans Affairs Health Services Research and Development Service. The investigators reported no relevant disclosures.
Source: Krebs E et al. JAMA. 2018;319(9):872-82

FDA approves new treatment for multidrug-resistant HIV
The Food and Drug Administration Feb. 6 approved ibalizumab-uiyk (Trogarzo) to treat multidrug-resistant HIV (MDR HIV) in adults, the agency announced.
“While most patients living with HIV can be successfully treated using a combination of two or more antiretroviral drugs, a small percentage of patients who have taken many HIV drugs in the past have multidrug-resistant HIV, limiting their treatment options and putting them at a high risk of HIV-related complications and progression to death,” Jeff Murray, MD, deputy director of the FDA Division of Antiviral Products, said in a statement. “Trogarzo is the first drug in a new class of antiretroviral medications that can provide significant benefit to patients who have run out of HIV treatment options. New treatment options may be able to improve their outcomes.”

Ibalizumab-uiyk, an HIV-1 inhibitor, was approved based on the results of a phase 3, single-arm study of 40 patients with MDR-HIV-1 who had high virus levels in their blood despite antiretroviral treatment. To be included in the study, all patients had to have received highly active antiretroviral therapy for at least 6 months prior. Over 24 weeks, patients were monitored to compare previous, infective treatments with ibalizumab-uiyk in conjunction with an optimized background regimen of antiretroviral drugs.
The majority of patients showed a significant decrease in their HIV-RNA levels 1 week after ibalizumab-uiyk was added to their previous drug regimens. After 24 weeks of treatment with ibalizumab-uiyk, in conjunction with other antiretroviral drugs, 43% of patients achieved HIV RNA suppression.
Ibalizumab-uiyk was granted Fast Track, Priority Review, and Breakthrough Therapy designations from the FDA. In addition, it was granted Orphan Drug designation, a program that encourages the development of drugs to treat rare diseases.
Ibalizumab-uiyk is administered once every 14 days in conjunction with other retroviral medications.
The most common adverse reactions to ibalizumab-uiyk were diarrhea, dizziness, nausea, and rash. Less common, and more severe, reactions were changes in the immune system.
Ibalizumab-uiyk will be marketed by Taimed Biologics USA.
The Food and Drug Administration Feb. 6 approved ibalizumab-uiyk (Trogarzo) to treat multidrug-resistant HIV (MDR HIV) in adults, the agency announced.
“While most patients living with HIV can be successfully treated using a combination of two or more antiretroviral drugs, a small percentage of patients who have taken many HIV drugs in the past have multidrug-resistant HIV, limiting their treatment options and putting them at a high risk of HIV-related complications and progression to death,” Jeff Murray, MD, deputy director of the FDA Division of Antiviral Products, said in a statement. “Trogarzo is the first drug in a new class of antiretroviral medications that can provide significant benefit to patients who have run out of HIV treatment options. New treatment options may be able to improve their outcomes.”
Ibalizumab-uiyk, an HIV-1 inhibitor, was approved based on the results of a phase 3, single-arm study of 40 patients with MDR-HIV-1 who had high virus levels in their blood despite antiretroviral treatment. To be included in the study, all patients had to have received highly active antiretroviral therapy for at least 6 months prior. Over 24 weeks, patients were monitored to compare previous, infective treatments with ibalizumab-uiyk in conjunction with an optimized background regimen of antiretroviral drugs.
The majority of patients showed a significant decrease in their HIV-RNA levels 1 week after ibalizumab-uiyk was added to their previous drug regimens. After 24 weeks of treatment with ibalizumab-uiyk, in conjunction with other antiretroviral drugs, 43% of patients achieved HIV RNA suppression.
Ibalizumab-uiyk was granted Fast Track, Priority Review, and Breakthrough Therapy designations from the FDA. In addition, it was granted Orphan Drug designation, a program that encourages the development of drugs to treat rare diseases.
Ibalizumab-uiyk is administered once every 14 days in conjunction with other retroviral medications.
The most common adverse reactions to ibalizumab-uiyk were diarrhea, dizziness, nausea, and rash. Less common, and more severe, reactions were changes in the immune system.
Ibalizumab-uiyk will be marketed by Taimed Biologics USA.
The Food and Drug Administration Feb. 6 approved ibalizumab-uiyk (Trogarzo) to treat multidrug-resistant HIV (MDR HIV) in adults, the agency announced.
“While most patients living with HIV can be successfully treated using a combination of two or more antiretroviral drugs, a small percentage of patients who have taken many HIV drugs in the past have multidrug-resistant HIV, limiting their treatment options and putting them at a high risk of HIV-related complications and progression to death,” Jeff Murray, MD, deputy director of the FDA Division of Antiviral Products, said in a statement. “Trogarzo is the first drug in a new class of antiretroviral medications that can provide significant benefit to patients who have run out of HIV treatment options. New treatment options may be able to improve their outcomes.”
Ibalizumab-uiyk, an HIV-1 inhibitor, was approved based on the results of a phase 3, single-arm study of 40 patients with MDR-HIV-1 who had high virus levels in their blood despite antiretroviral treatment. To be included in the study, all patients had to have received highly active antiretroviral therapy for at least 6 months prior. Over 24 weeks, patients were monitored to compare previous, infective treatments with ibalizumab-uiyk in conjunction with an optimized background regimen of antiretroviral drugs.
The majority of patients showed a significant decrease in their HIV-RNA levels 1 week after ibalizumab-uiyk was added to their previous drug regimens. After 24 weeks of treatment with ibalizumab-uiyk, in conjunction with other antiretroviral drugs, 43% of patients achieved HIV RNA suppression.
Ibalizumab-uiyk was granted Fast Track, Priority Review, and Breakthrough Therapy designations from the FDA. In addition, it was granted Orphan Drug designation, a program that encourages the development of drugs to treat rare diseases.
Ibalizumab-uiyk is administered once every 14 days in conjunction with other retroviral medications.
The most common adverse reactions to ibalizumab-uiyk were diarrhea, dizziness, nausea, and rash. Less common, and more severe, reactions were changes in the immune system.
Ibalizumab-uiyk will be marketed by Taimed Biologics USA.

Flu activity takes another turn for the better
Outpatient influenza-like illness activity continues to drop, but pediatric deaths for 2017-2018 are already higher than either of the last two entire seasons, according to the Centers for Disease and Prevention.
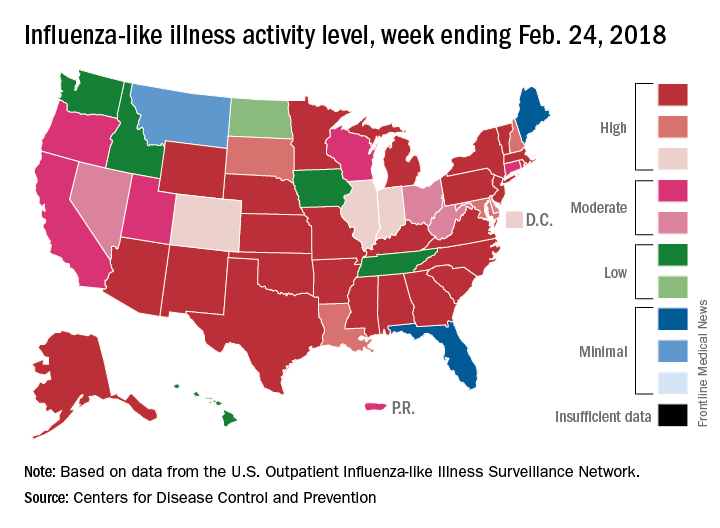
An additional 17 influenza-like illness-related (ILI) pediatric deaths were reported during the week ending Feb. 24, eight of which occurred in previous weeks. That brings the total to 114 for the 2017-2018 flu season so far, compared with 110 for the entire 2016-2017 season and 93 for the 2015-2016 season, the CDC reported Mar. 2.
The proportion of outpatient visits for ILI took another big drop, falling to 5.0% for the week, which was down from 6.4% the previous week and the seasonal high of 7.4% the 2 weeks before that (Feb. 10 and Feb. 3), CDC data show.
Flu-related hospitalizations, however, continued to rise to new highs, as the cumulative rate hit 81.7 per 100,000 population. In 2014-2015, the season with the highest number of hospitalizations since the CDC started keeping track, the cumulative rate for the corresponding week was 55.9 per 100,000, according to the CDC’s Fluview website.
The map of state-reported ILI activity shows that 25 states are at level 10 on the CDC’s 1-10 scale, which is down from 33 the week before. Eight other states and the District of Columbia were in the “high” range with activity at levels 8 and 9 for the week ending Feb. 24, the CDC said.
Outpatient influenza-like illness activity continues to drop, but pediatric deaths for 2017-2018 are already higher than either of the last two entire seasons, according to the Centers for Disease and Prevention.
An additional 17 influenza-like illness-related (ILI) pediatric deaths were reported during the week ending Feb. 24, eight of which occurred in previous weeks. That brings the total to 114 for the 2017-2018 flu season so far, compared with 110 for the entire 2016-2017 season and 93 for the 2015-2016 season, the CDC reported Mar. 2.
The proportion of outpatient visits for ILI took another big drop, falling to 5.0% for the week, which was down from 6.4% the previous week and the seasonal high of 7.4% the 2 weeks before that (Feb. 10 and Feb. 3), CDC data show.
Flu-related hospitalizations, however, continued to rise to new highs, as the cumulative rate hit 81.7 per 100,000 population. In 2014-2015, the season with the highest number of hospitalizations since the CDC started keeping track, the cumulative rate for the corresponding week was 55.9 per 100,000, according to the CDC’s Fluview website.
The map of state-reported ILI activity shows that 25 states are at level 10 on the CDC’s 1-10 scale, which is down from 33 the week before. Eight other states and the District of Columbia were in the “high” range with activity at levels 8 and 9 for the week ending Feb. 24, the CDC said.
Outpatient influenza-like illness activity continues to drop, but pediatric deaths for 2017-2018 are already higher than either of the last two entire seasons, according to the Centers for Disease and Prevention.
An additional 17 influenza-like illness-related (ILI) pediatric deaths were reported during the week ending Feb. 24, eight of which occurred in previous weeks. That brings the total to 114 for the 2017-2018 flu season so far, compared with 110 for the entire 2016-2017 season and 93 for the 2015-2016 season, the CDC reported Mar. 2.
The proportion of outpatient visits for ILI took another big drop, falling to 5.0% for the week, which was down from 6.4% the previous week and the seasonal high of 7.4% the 2 weeks before that (Feb. 10 and Feb. 3), CDC data show.
Flu-related hospitalizations, however, continued to rise to new highs, as the cumulative rate hit 81.7 per 100,000 population. In 2014-2015, the season with the highest number of hospitalizations since the CDC started keeping track, the cumulative rate for the corresponding week was 55.9 per 100,000, according to the CDC’s Fluview website.
The map of state-reported ILI activity shows that 25 states are at level 10 on the CDC’s 1-10 scale, which is down from 33 the week before. Eight other states and the District of Columbia were in the “high” range with activity at levels 8 and 9 for the week ending Feb. 24, the CDC said.
Opioid deaths in the ED increase nationally
Opioid-related deaths in emergency departments increased by approximately 30% across all regions of the United States between 2016 and 2017, according to the Centers for Disease Control and Prevention.
Analysis of 91 million ED visits from the CDC’s National Syndromic Surveillance Program and Enhanced State Opioid Overdose Surveillance database found significant increases in opioid overdose deaths in 16 states, reaching as high as 109% in Wisconsin and 106% in Delaware, CDC officials said during a press briefing.

“We are currently seeing the highest drug overdose death rate ever recorded in the United States, driven by prescription opioids and by illicit opioids such as heroin and illicitly manufactured fentanyl,” said Anne Schuchat, MD, acting CDC director. “In 2016, there were more than 63,000 drug overdose deaths, and more than 42,000 of those deaths involved an opioid.”
Of the 91 million visits, a total of 261,755 were suspected of opioid overdoses across both databases.
The greatest increase was seen in the Midwest region (69.7%), followed by the West (40.3%), Northeast (21.3%), Southwest (20.2%), and Southeast (14%).
Death rates rose across all demographics, regardless of sex or age.
While Delaware recorded some of the highest increases in deaths, Massachusetts, New Hampshire, and Rhode Island decreased, although not within statistical significance.
“These decreases may possibly be related to implementation of interventions, including expansion of access to medication-assisted treatment,” said Dr. Schuchat. “The decrease in Kentucky during this period of time may reflect some fluctuations in drug supply.”
In a comparison of urban and rural areas, large and medium metropolitan communities had the sharpest increase, at 45%.
To combat the rise in deaths, the CDC is encouraging an increase in naloxone distribution and training for first responders and community members.
The agency also recommends that local health departments begin using ED data to alert local communities when opioid-related deaths rise.
“This is a very difficult and fast-moving epidemic, and there are no easy solutions,” Dr. Schuchat said. [These data send] “a wake-up call about the need to improve what happens when patients leave the emergency department; all of us working together, government, public health, the medical community, law enforcement, and community members themselves can help fight this epidemic and save lives.”
ezimmerman@frontlinemedcom.com
SOURCE: Vivolo-Kantor AM et al. MMWR Morb Mortal Wkly Rep. 6 Mar 2018. doi: 10.15585/mmwr.mm6709e1.
Opioid-related deaths in emergency departments increased by approximately 30% across all regions of the United States between 2016 and 2017, according to the Centers for Disease Control and Prevention.
Analysis of 91 million ED visits from the CDC’s National Syndromic Surveillance Program and Enhanced State Opioid Overdose Surveillance database found significant increases in opioid overdose deaths in 16 states, reaching as high as 109% in Wisconsin and 106% in Delaware, CDC officials said during a press briefing.
“We are currently seeing the highest drug overdose death rate ever recorded in the United States, driven by prescription opioids and by illicit opioids such as heroin and illicitly manufactured fentanyl,” said Anne Schuchat, MD, acting CDC director. “In 2016, there were more than 63,000 drug overdose deaths, and more than 42,000 of those deaths involved an opioid.”
Of the 91 million visits, a total of 261,755 were suspected of opioid overdoses across both databases.
The greatest increase was seen in the Midwest region (69.7%), followed by the West (40.3%), Northeast (21.3%), Southwest (20.2%), and Southeast (14%).
Death rates rose across all demographics, regardless of sex or age.
While Delaware recorded some of the highest increases in deaths, Massachusetts, New Hampshire, and Rhode Island decreased, although not within statistical significance.
“These decreases may possibly be related to implementation of interventions, including expansion of access to medication-assisted treatment,” said Dr. Schuchat. “The decrease in Kentucky during this period of time may reflect some fluctuations in drug supply.”
In a comparison of urban and rural areas, large and medium metropolitan communities had the sharpest increase, at 45%.
To combat the rise in deaths, the CDC is encouraging an increase in naloxone distribution and training for first responders and community members.
The agency also recommends that local health departments begin using ED data to alert local communities when opioid-related deaths rise.
“This is a very difficult and fast-moving epidemic, and there are no easy solutions,” Dr. Schuchat said. [These data send] “a wake-up call about the need to improve what happens when patients leave the emergency department; all of us working together, government, public health, the medical community, law enforcement, and community members themselves can help fight this epidemic and save lives.”
ezimmerman@frontlinemedcom.com
SOURCE: Vivolo-Kantor AM et al. MMWR Morb Mortal Wkly Rep. 6 Mar 2018. doi: 10.15585/mmwr.mm6709e1.
Opioid-related deaths in emergency departments increased by approximately 30% across all regions of the United States between 2016 and 2017, according to the Centers for Disease Control and Prevention.
Analysis of 91 million ED visits from the CDC’s National Syndromic Surveillance Program and Enhanced State Opioid Overdose Surveillance database found significant increases in opioid overdose deaths in 16 states, reaching as high as 109% in Wisconsin and 106% in Delaware, CDC officials said during a press briefing.
“We are currently seeing the highest drug overdose death rate ever recorded in the United States, driven by prescription opioids and by illicit opioids such as heroin and illicitly manufactured fentanyl,” said Anne Schuchat, MD, acting CDC director. “In 2016, there were more than 63,000 drug overdose deaths, and more than 42,000 of those deaths involved an opioid.”
Of the 91 million visits, a total of 261,755 were suspected of opioid overdoses across both databases.
The greatest increase was seen in the Midwest region (69.7%), followed by the West (40.3%), Northeast (21.3%), Southwest (20.2%), and Southeast (14%).
Death rates rose across all demographics, regardless of sex or age.
While Delaware recorded some of the highest increases in deaths, Massachusetts, New Hampshire, and Rhode Island decreased, although not within statistical significance.
“These decreases may possibly be related to implementation of interventions, including expansion of access to medication-assisted treatment,” said Dr. Schuchat. “The decrease in Kentucky during this period of time may reflect some fluctuations in drug supply.”
In a comparison of urban and rural areas, large and medium metropolitan communities had the sharpest increase, at 45%.
To combat the rise in deaths, the CDC is encouraging an increase in naloxone distribution and training for first responders and community members.
The agency also recommends that local health departments begin using ED data to alert local communities when opioid-related deaths rise.
“This is a very difficult and fast-moving epidemic, and there are no easy solutions,” Dr. Schuchat said. [These data send] “a wake-up call about the need to improve what happens when patients leave the emergency department; all of us working together, government, public health, the medical community, law enforcement, and community members themselves can help fight this epidemic and save lives.”
ezimmerman@frontlinemedcom.com
SOURCE: Vivolo-Kantor AM et al. MMWR Morb Mortal Wkly Rep. 6 Mar 2018. doi: 10.15585/mmwr.mm6709e1.
FROM MMWR

Early childhood vaccines not associated with increased infection risk
There was no significant difference in vaccine antigen exposure through the first 23 months of life between children with non–vaccine-targeted infections and controls between 24 and 47 months of age, according to results published March 6 in JAMA.
This was determined in a nested, matched case-control study of 193 infection cases and 751 controls, in whom estimated mean cumulative vaccine antigen exposure was 240.6 for cases of non–vaccine-targeted infections, and 242.9 for controls, reported Jason M. Glanz, PhD, of Kaiser Permanente Colorado, Denver, and his coauthors. The between-group difference was –2.3 (P = .55), a nonsignificant difference.
Using data from the Centers for Disease Control and Prevention-funded Vaccine Safety Datalink (VSD), the investigators identified children born between Jan. 1, 2003, and Sep. 31, 2013. Exclusion criteria were not having at least two well-child visits before the first birthday, medical contraindications to vaccination, or receiving vaccines not recommended by the Advisory Committee on Immunization Practices. Eligible children were followed through age 47 months or until disenrollment from their health care organization, the authors said.
ICD-9 and ICD-10 codes were used to identify non–vaccine-targeted infections, including upper and lower respiratory infections, gastrointestinal infections, and other viral and bacterial infections from ages 24to 47 months. A medical record review was performed to confirm case status. Cases were included only if it was confirmed that the infection occurred, that it was an incident outcome, that the outcome was the primary reason for the medical visit, that the outcome occurred in the inpatient or emergency department setting, and that there was no evidence that the child was diagnosed as having a vaccine preventable disease (VPD) on the same day as the infection. Controls did not have a VPD or record of a non–vaccine-targeted infection prior to the index date, Dr. Glanz and his colleagues said.
Antigen exposure was measured as the number of immunogenic proteins and polysaccharides in each vaccine, and was estimated from birth through age 23 months in both groups. Cumulative antigen exposure was estimated by adding the number of antigens in each non–vaccine-targeted infection and controls.
Estimated mean cumulative vaccine antigen exposure was 240.6 for cases of non–vaccine-targeted infections, and 242.9 for controls, the authors reported. The matched odds ratio (mOR) for estimated cumulative antigen exposure through age 23 months was not significant in children with infections, compared with controls (mOR = 0.94; 95% confidence interval, 0.84-1.07). The estimated maximum single-day antigen exposure was not significantly associated with non–vaccine-targeted infection (mOR = 1.07; 95% CI, 0.81-1.41).
The findings of this study “did not reveal any beneficial or detrimental associations with estimated cumulative vaccine antigen exposure in young children with non–vaccine-targeted infections in ED and inpatient settings,” wrote Dr. Glanz and coauthors. In addition, the study “did not find evidence that multiple vaccine exposure was associated with the risk for non-targeted infectious diseases.”
The CDC funded the study. The authors reported receiving contracts, grants, and other funding from the CDC.
SOURCE: Glanz JM et al. JAMA. 2018;319(9):906-13.
These results provide “further reassurance about the safety of the U.S. child vaccination schedule,” said Sean T. O’Leary, MD, and Yvonne A. Maldonado, MD.
However, they added, more work must be done to strengthen the public’s trust and confidence in vaccines. Parents long have voiced concerns that vaccines might weaken their children’s immune systems.
“The small but vocal minority of anti-vaccine groups may not be satisfied by the evidence provided through VSD and other vaccine safety surveillance,” they wrote. “Simply providing scientific information and assuming parents will make the decision to vaccinate is not enough.
“Delivering evidence-based information to parents and clinicians in ways that inspire confidence in the robust and safe childhood immunization schedule is critical for maintaining the health of children,” they concluded.
Dr. O’Leary and Dr. Maldonado, both of the University of Colorado, Aurora, commented in an editorial accompanying the article by Glanz et al. (JAMA. 2018 Mar 6;319(9):870-1). Dr. Maldonado reported receiving personal fees for serving on a data and safety monitoring board for Pfizer. Dr. O’Leary reported no relevant financial disclosures.
These results provide “further reassurance about the safety of the U.S. child vaccination schedule,” said Sean T. O’Leary, MD, and Yvonne A. Maldonado, MD.
However, they added, more work must be done to strengthen the public’s trust and confidence in vaccines. Parents long have voiced concerns that vaccines might weaken their children’s immune systems.
“The small but vocal minority of anti-vaccine groups may not be satisfied by the evidence provided through VSD and other vaccine safety surveillance,” they wrote. “Simply providing scientific information and assuming parents will make the decision to vaccinate is not enough.
“Delivering evidence-based information to parents and clinicians in ways that inspire confidence in the robust and safe childhood immunization schedule is critical for maintaining the health of children,” they concluded.
Dr. O’Leary and Dr. Maldonado, both of the University of Colorado, Aurora, commented in an editorial accompanying the article by Glanz et al. (JAMA. 2018 Mar 6;319(9):870-1). Dr. Maldonado reported receiving personal fees for serving on a data and safety monitoring board for Pfizer. Dr. O’Leary reported no relevant financial disclosures.
These results provide “further reassurance about the safety of the U.S. child vaccination schedule,” said Sean T. O’Leary, MD, and Yvonne A. Maldonado, MD.
However, they added, more work must be done to strengthen the public’s trust and confidence in vaccines. Parents long have voiced concerns that vaccines might weaken their children’s immune systems.
“The small but vocal minority of anti-vaccine groups may not be satisfied by the evidence provided through VSD and other vaccine safety surveillance,” they wrote. “Simply providing scientific information and assuming parents will make the decision to vaccinate is not enough.
“Delivering evidence-based information to parents and clinicians in ways that inspire confidence in the robust and safe childhood immunization schedule is critical for maintaining the health of children,” they concluded.
Dr. O’Leary and Dr. Maldonado, both of the University of Colorado, Aurora, commented in an editorial accompanying the article by Glanz et al. (JAMA. 2018 Mar 6;319(9):870-1). Dr. Maldonado reported receiving personal fees for serving on a data and safety monitoring board for Pfizer. Dr. O’Leary reported no relevant financial disclosures.
There was no significant difference in vaccine antigen exposure through the first 23 months of life between children with non–vaccine-targeted infections and controls between 24 and 47 months of age, according to results published March 6 in JAMA.
This was determined in a nested, matched case-control study of 193 infection cases and 751 controls, in whom estimated mean cumulative vaccine antigen exposure was 240.6 for cases of non–vaccine-targeted infections, and 242.9 for controls, reported Jason M. Glanz, PhD, of Kaiser Permanente Colorado, Denver, and his coauthors. The between-group difference was –2.3 (P = .55), a nonsignificant difference.
Using data from the Centers for Disease Control and Prevention-funded Vaccine Safety Datalink (VSD), the investigators identified children born between Jan. 1, 2003, and Sep. 31, 2013. Exclusion criteria were not having at least two well-child visits before the first birthday, medical contraindications to vaccination, or receiving vaccines not recommended by the Advisory Committee on Immunization Practices. Eligible children were followed through age 47 months or until disenrollment from their health care organization, the authors said.
ICD-9 and ICD-10 codes were used to identify non–vaccine-targeted infections, including upper and lower respiratory infections, gastrointestinal infections, and other viral and bacterial infections from ages 24to 47 months. A medical record review was performed to confirm case status. Cases were included only if it was confirmed that the infection occurred, that it was an incident outcome, that the outcome was the primary reason for the medical visit, that the outcome occurred in the inpatient or emergency department setting, and that there was no evidence that the child was diagnosed as having a vaccine preventable disease (VPD) on the same day as the infection. Controls did not have a VPD or record of a non–vaccine-targeted infection prior to the index date, Dr. Glanz and his colleagues said.
Antigen exposure was measured as the number of immunogenic proteins and polysaccharides in each vaccine, and was estimated from birth through age 23 months in both groups. Cumulative antigen exposure was estimated by adding the number of antigens in each non–vaccine-targeted infection and controls.
Estimated mean cumulative vaccine antigen exposure was 240.6 for cases of non–vaccine-targeted infections, and 242.9 for controls, the authors reported. The matched odds ratio (mOR) for estimated cumulative antigen exposure through age 23 months was not significant in children with infections, compared with controls (mOR = 0.94; 95% confidence interval, 0.84-1.07). The estimated maximum single-day antigen exposure was not significantly associated with non–vaccine-targeted infection (mOR = 1.07; 95% CI, 0.81-1.41).
The findings of this study “did not reveal any beneficial or detrimental associations with estimated cumulative vaccine antigen exposure in young children with non–vaccine-targeted infections in ED and inpatient settings,” wrote Dr. Glanz and coauthors. In addition, the study “did not find evidence that multiple vaccine exposure was associated with the risk for non-targeted infectious diseases.”
The CDC funded the study. The authors reported receiving contracts, grants, and other funding from the CDC.
SOURCE: Glanz JM et al. JAMA. 2018;319(9):906-13.
There was no significant difference in vaccine antigen exposure through the first 23 months of life between children with non–vaccine-targeted infections and controls between 24 and 47 months of age, according to results published March 6 in JAMA.
This was determined in a nested, matched case-control study of 193 infection cases and 751 controls, in whom estimated mean cumulative vaccine antigen exposure was 240.6 for cases of non–vaccine-targeted infections, and 242.9 for controls, reported Jason M. Glanz, PhD, of Kaiser Permanente Colorado, Denver, and his coauthors. The between-group difference was –2.3 (P = .55), a nonsignificant difference.
Using data from the Centers for Disease Control and Prevention-funded Vaccine Safety Datalink (VSD), the investigators identified children born between Jan. 1, 2003, and Sep. 31, 2013. Exclusion criteria were not having at least two well-child visits before the first birthday, medical contraindications to vaccination, or receiving vaccines not recommended by the Advisory Committee on Immunization Practices. Eligible children were followed through age 47 months or until disenrollment from their health care organization, the authors said.
ICD-9 and ICD-10 codes were used to identify non–vaccine-targeted infections, including upper and lower respiratory infections, gastrointestinal infections, and other viral and bacterial infections from ages 24to 47 months. A medical record review was performed to confirm case status. Cases were included only if it was confirmed that the infection occurred, that it was an incident outcome, that the outcome was the primary reason for the medical visit, that the outcome occurred in the inpatient or emergency department setting, and that there was no evidence that the child was diagnosed as having a vaccine preventable disease (VPD) on the same day as the infection. Controls did not have a VPD or record of a non–vaccine-targeted infection prior to the index date, Dr. Glanz and his colleagues said.
Antigen exposure was measured as the number of immunogenic proteins and polysaccharides in each vaccine, and was estimated from birth through age 23 months in both groups. Cumulative antigen exposure was estimated by adding the number of antigens in each non–vaccine-targeted infection and controls.
Estimated mean cumulative vaccine antigen exposure was 240.6 for cases of non–vaccine-targeted infections, and 242.9 for controls, the authors reported. The matched odds ratio (mOR) for estimated cumulative antigen exposure through age 23 months was not significant in children with infections, compared with controls (mOR = 0.94; 95% confidence interval, 0.84-1.07). The estimated maximum single-day antigen exposure was not significantly associated with non–vaccine-targeted infection (mOR = 1.07; 95% CI, 0.81-1.41).
The findings of this study “did not reveal any beneficial or detrimental associations with estimated cumulative vaccine antigen exposure in young children with non–vaccine-targeted infections in ED and inpatient settings,” wrote Dr. Glanz and coauthors. In addition, the study “did not find evidence that multiple vaccine exposure was associated with the risk for non-targeted infectious diseases.”
The CDC funded the study. The authors reported receiving contracts, grants, and other funding from the CDC.
SOURCE: Glanz JM et al. JAMA. 2018;319(9):906-13.
FROM JAMA
Key clinical point: No significant difference was found in vaccine antigen exposure between controls and children with infectious diseases not targeted by vaccines.
Major finding: Estimated mean cumulative vaccine antigen exposure was 240.6 for cases and 242.9 for controls.
Study details: A matched case-control study of 944 patients enrolled in six integrated health care organizations as part of the Vaccine Safety Datalink (VSD).
Disclosures: The Centers for Disease Control and Prevention funded the study. The authors reported receiving contracts, grants, and other funding from the CDC.
Source: Glanz JM et al. JAMA. 2018;319(9):906-13.