User login
The Journal of Clinical Outcomes Management® is an independent, peer-reviewed journal offering evidence-based, practical information for improving the quality, safety, and value of health care.
div[contains(@class, 'header__large-screen')]
div[contains(@class, 'read-next-article')]
div[contains(@class, 'nav-primary')]
nav[contains(@class, 'nav-primary')]
section[contains(@class, 'footer-nav-section-wrapper')]
footer[@id='footer']
div[contains(@class, 'main-prefix')]
section[contains(@class, 'nav-hidden')]
div[contains(@class, 'ce-card-content')]
nav[contains(@class, 'nav-ce-stack')]
Massive rise in drug overdose deaths driven by opioids
The 376% represents the change in age-adjusted overdose deaths per 100,000 population, which went from 6.9 in 2001 to 32.4 in 2021, as the total number of deaths rose from 19,394 to 106,699 (450%) over that time period, the NCHS said in a recent data brief. That total made 2021 the first year ever with more than 100,000 overdose deaths.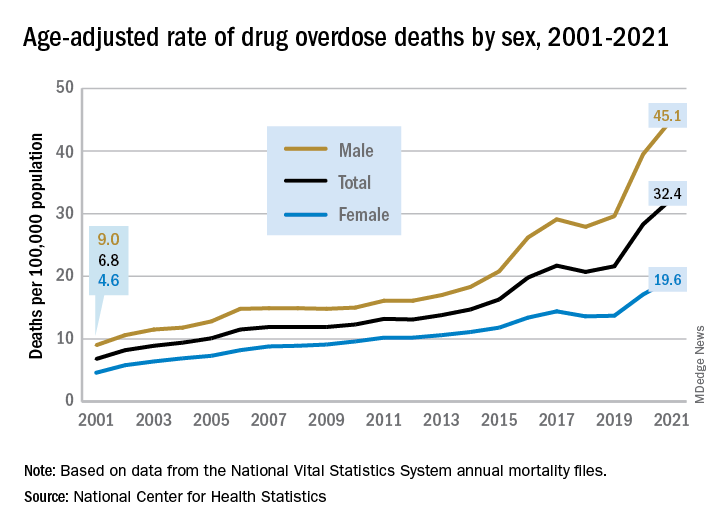
Since the age-adjusted rate stood at 21.6 per 100,000 in 2019, that means 42% of the total increase over 20 years actually occurred in 2020 and 2021. The number of deaths increased by about 36,000 over those 2 years, accounting for 41% of the total annual increase from 2001 to 2021, based on data from the National Vital Statistics System mortality files.
The overdose death rate was significantly higher for males than females for all of the years from 2001 to 2021, with males seeing an increase from 9.0 to 45.1 per 100,000 and females going from 4.6 to 19.6 deaths per 100,000. In the single year from 2020 to 2021, the age-adjusted rate was up by 14% for males and 15% for females, the mortality-file data show.
Analysis by age showed an even larger effect in some groups from 2020 to 2021. Drug overdose deaths jumped 28% among adults aged 65 years and older, more than any other group, and by 21% in those aged 55-64 years, according to the NCHS.
The only age group for which deaths didn’t increase significantly from 2020 to 2021 was 15- to 24-year-olds, whose rate rose by just 3%. The age group with the highest rate in both 2020 and 2021, however, was the 35- to 44-year-olds: 53.9 and 62.0 overdose deaths per 100,000, respectively, for an increase of 15%, the NCHS said in the report.
The drugs now involved in overdose deaths are most often opioids, a change from 2001. That year, opioids were involved in 49% of all overdose deaths, but by 2021 that share had increased to 75%. The trend for opioid-related deaths almost matches that of overall deaths over the 20-year span, and the significantly increasing trend that began for all overdose deaths in 2013 closely follows that of synthetic opioids such as fentanyl and tramadol, the report shows.
Overdose deaths involving cocaine and psychostimulants such as methamphetamine, amphetamine, and methylphenidate also show similar increases. The cocaine-related death rate rose 22% from 2020 to 2021 and is up by 421% since 2012, while the corresponding increases for psychostimulant deaths were 33% and 2,400%, the NCHS said.
Washington medical board charges doctor with spreading COVID misinformation
Doctors and professional organizations are standing guard, hoping to protect patients from any harm that results from mistruths spread by colleagues.
Case in point: Several physicians and the American Board of Pathology filed complaints with Washington and Idaho medical boards alleging that Ryan Cole, MD, a board-certified pathologist who practices in Boise, Idaho, but who also holds a license in Washington, has spread antivaccine and pro-ivermectin statements on social media. Dr. Cole is one of the founders of America’s Frontline Doctors, a right-wing political organization. Dr. Cole did not respond to a request for comment.
Gary W. Procop, MD, CEO, American Board of Pathology, told this news organization that “as physicians and board-certified pathologists, we have a public trust, and we must be accountable to patients, society, and the profession. Misinformation can cause real harm to patients, which may include death. Misinformation diverts patients away from lifesaving vaccination and other preventive measures, promotes viral transmission, and recommends ineffective therapies that may be toxic instead of evidence-based medical care.”
Cavalcade of complaints
Several doctors also chimed in with formal complaints alleging that Cole is spreading unreliable information, according to a report from KTVB News. For example, a Boise doctor wrote in his complaint that Dr. Cole is “a major purveyor of misinformation” and called it “amazing” that the physician was continuing to publicly support debunked information about COVID-19 more than a year into the pandemic. The doctor also stated, “Cole is a health menace, abusing his status as a physician to mislead the public.”
As a result of such complaints, the Washington medical board has charged Cole with COVID-19–related violations. It is unclear whether or not the Idaho medical board will sanction the doctor. At least 12 medical boards have sanctioned doctors for similar violations since the start of the pandemic.
The statement of charges from the Washington medical board contends that since March 2021, Dr. Cole has made numerous misleading statements regarding the COVID-19 pandemic, vaccines, the use of ivermectin to treat COVID-19, and the effectiveness of masks.
In addition, the statement alleges that Dr. Cole treated several COVID-19 patients via telemedicine. During these sessions, he prescribed ivermectin, an antiparasite drug that has not been found to have any effectiveness in treating, curing, or preventing COVID-19. One of the patients died after receiving this treatment, according to the complaint.
Citing a study published in the New England Journal of Medicine, Dr. Procop pointed out that use of ivermectin, which is not approved by the U.S. Food and Drug Administration to treat COVID-19, is particularly troubling.
“There is a concern whenever an ineffective treatment is prescribed when more effective and scientifically proven therapies are available. Therapeutics have potential side effects, and toxicities have been associated with the use of ivermectin,” Dr. Procop said. “The benefits of therapy should always outweigh the risks of treatment.”
If the Washington medical board finds that Dr. Cole has engaged in unprofessional conduct, possible sanctions include revocation or suspension of his license. Washington state law also provides for a range of other possible sanctions, including restriction or limitation of his practice, requiring that he complete a specific program of remedial education or treatment, monitoring of his practice, censure or reprimand, probation, a fine of up to $5,000 for each violation, or refunding fees that his practice has billed to and collected from patients. Dr. Cole had until January 30 to respond to the medical board’s statement.
“The American Board of Pathology supports the actions of the Washington State Medical Board regarding their inquiries into any physician that holds license in their state who makes false and misleading medical claims, or provides medical care beyond their scope of practice, as indicated by their training,” Dr. Procop said.
Law in limbo
While medical boards are seeking to sanction professionals who spread falsehoods, the pause button has been hit on the California law that allows regulators to punish doctors for spreading false information about COVID-19 vaccinations and treatments.
The law went into effect Jan. 1 but was temporarily halted when U.S. District Judge William B. Shubb of the Eastern District of California granted a preliminary injunction against the law on Jan. 25, according to a report in the Sacramento Bee.
Mr. Shubb said the measure’s definition of “misinformation” was “unconstitutionally vague” under the due process clause of the 14th Amendment. He also criticized the law’s definition of “misinformation” as being “grammatically incoherent.”
A version of this article first appeared on Medscape.com.
Can AI conquer the late-shift dip in colonoscopy quality?
AI systems “may be a potential tool for minimizing time-related degradation of colonoscopy quality and further maintaining high quality and homogeneity of colonoscopies in high-workload centers,” Honggang Yu, MD, with the department of gastroenterology, Renmin Hospital of Wuhan (China) University, said in an interview.
The study was published online in JAMA Network Open.
Fatigue a factor?
Adenoma detection rate (ADR) is a critical quality measure of screening colonoscopy. Time of day is a well-known factor related to suboptimal ADR – with morning colonoscopies associated with improved ADR and afternoon colonoscopies with reduced ADR, Dr. Yu and colleagues write.
“However, an objective approach to solve this problem is still lacking,” Dr. Yu said. AI systems have been shown to improve the ADR, but the performance of AI during different times of the day remains unknown.
This cohort study is a secondary analysis of two prospective randomized controlled trials, in which a total of 1,780 consecutive patients were randomly allocated to either conventional colonoscopy or AI-assisted colonoscopy. The ADR for early and late colonoscopy sessions per half day were then compared.
Colonoscopy procedures were divided into two groups according to the end time of the procedure. The early group included procedures started in the early session per half day (8:00 a.m.–10:59 a.m. or 1:00 p.m.–2:59 p.m.). The late group included procedures started in the later session per half day (11:00 a.m.–12:59 p.m. or 3:00 p.m.–4:59 p.m.).
A total of 1,041 procedures were performed in the early sessions (357 conventional and 684 AI assisted). A total of 739 procedures were performed in the late sessions (263 conventional and 476 AI assisted).
In the unassisted colonoscopy group, later sessions per half day were associated with a decline in ADR (early vs. late, 13.73% vs. 5.7%; P = .005; odds ratio, 2.42; 95% confidence interval, 1.31-4.47).
With AI assistance, however, no such association was found in the ADR (early vs. late, 22.95% vs. 22.06%; P = .78; OR, 0.96; 95% CI, 0.71-1.29). AI provided the highest assistance capability in the last hour per half day.
The decline in ADR in late sessions (vs. early sessions) was evident in different colonoscopy settings. The investigators say accrual of endoscopist fatigue may be an independent factor of time-related degradation of colonoscopy quality.
More exploration required
“We’re excited about the great potential of using the power of AI to assist endoscopists in quality control or disease diagnosis in colonoscopy practice, but it’s too early to see AI as the standard,” Dr. Yu told this news organization.
“Despite recent achievements in the design and validation of AI systems, much more exploration is required in the clinical application of AI,” Dr. Yu said.
Dr. Yu further explained that, in addition to regulatory approval, the results of AI output must be trusted by the endoscopist, which remains a challenge for current AI systems that lack interpretability.
“Therefore, at the current stage of AI development, AI models can only serve as an extra reminder to assist endoscopists in colonoscopy,” Dr. Yu said.
This study was supported by the Innovation Team Project of Health Commission of Hubei Province. The authors have indicated no relevant financial relationships.
A version of this article originally appeared on Medscape.com.
This article was updated 2/1/23.
FROM JAMA NETWORK OPEN
Pandemic pregnancy-linked deaths up 35% from 2019
Pregnancy-associated deaths, including drug-related deaths and homicide, were up 35% in 2020, compared with prepandemic 2019, new research indicates.
The data also show a 7.1% decrease in pregnancy-related suicides in 2020 from 2019.
The study, led by Claire E. Margerison, PhD, with the department of epidemiology and biostatistics at Michigan State University, East Lansing, included 4,528 pregnancy-associated deaths. The rate of deaths per 100,000 live births from April to December 2020 was 66.9 (95% confidence interval, 63.9-70.1). The comparative rate from April to December 2019 was 49.6. Researchers looked at that time period because the pandemic started in March 2020.
The findings were published online in JAMA Open Network.
Drug-related deaths up 55.3%
During the study period, drug deaths increased 55.3% and deaths from homicide increased 41.2%. Deaths from obstetric and other causes (mainly vehicle crashes) increased 28.4% and 56.7%, respectively, according to Dr. Margerison's group.
“Although pregnancy-associated deaths increased over time, increases from 2019 to 2020 were substantially larger than increases from 2018 to 2019,” the authors wrote.
The findings align with deaths in the general population in that time frame, they added.
Another study – this one looking at all-cause and cause-specific mortality from 2019 to 2020 in recently pregnant women, also published in JAMA Network Open, found significant racial and ethnic disparities in rates and cause of death.
According to the study, “Compared with non-Hispanic White women, mortality rates were three- to fivefold higher among American Indian or Alaska Native women for every cause, including suicide. Likewise, these findings suggest that non-Hispanic Black women experienced significantly higher mortality rates across causes, with the highest rates for homicide.”
Dr. Margerison and colleagues did not try to answer what caused the increases but pointed to the fentanyl epidemic, the murder of George Floyd, and COVID-19–related economic strain as potential stressors. They also suggest fewer screenings during the pandemic may have played a role.
Prevention opportunities missed
“Although pregnancy is considered an opportunity for screening and prevention related to physical, mental, and behavioral health, our data suggest that such opportunities were missed for hundreds of pregnant people during the pandemic,” the authors wrote.
Researchers analyzed cross-sectional U.S. death certificates from Jan. 1, 2018, to Dec. 31, 2020, for female U.S. residents ages 15-44 years. They then obtained the count for live births for the same population and time frame from the Centers for Disease Control and Prevention WONDER database.
They were able to identify pregnancy-associated deaths as the 2003 Revised Death Certificate contains a standardized pregnancy checkbox that asks whether the person was pregnant at the time of death, within 42 days of death, or within 43 days to 1 year of death.
Researchers also included deaths with ICD-10 codes linked with death from obstetric causes.
Deaths from overdose, suicide, and homicide are making up large and growing proportions of all deaths during pregnancy and in the first year postpartum, the authors report.
Dr. Margerison and coauthors, in research published in 2022, reported that these causes account for more than one-fifth of all pregnancy-related deaths. They also reported that drug-related deaths and homicides in this population have increased over the past 10 years.
“Substantial racial and ethnic inequities in these deaths exist,” they wrote in that paper.
The authors concluded in the current research: “Our study findings suggest that there is a need for prevention and intervention efforts, including harm-reduction strategies, tailored to pregnant and postpartum women, particularly during times of population stress and decreased utilization of preventive care, such as a pandemic.”
Dr. Margerison and coauthors reported receiving grant support from the Eunice Kennedy Shriver National Institute of Child Health and Human Development during the study. One coauthor received personal fees from the World Health Organization and Population Reference Bureau outside the submitted work. One coauthor reported receiving grant support from the National Institutes of Mental Health during the study.
*This story was updated on 2/1.
FROM JAMA NETWORK OPEN
Long QT syndrome overdiagnosis persists
Five factors underlie the ongoing overdiagnosis and misdiagnosis of long QT syndrome (LQTS), including temporary QT prolongation following vasovagal syncope, a “pseudo”-positive genetic test result, family history of sudden cardiac death, transient QT prolongation, and misinterpretation of the QTc interval, a new study suggests.
Awareness of these characteristics, which led to a diagnostic reversal in 290 of 1,841 (16%) patients, could reduce the burden of overdiagnosis on the health care system and on patients and families, senior author Michael J. Ackerman, MD, PhD, of Mayo Clinic, Rochester, Minn., and colleagues conclude.
“The findings are a disturbing and disappointing sequel to the paper we published about LQTS overdiagnosis back in 2007, which showed that 2 out of every 5 patients who came to Mayo Clinic for a second opinion left without the diagnosis,” Dr. Ackerman told this news organization.
To date, Dr. Ackerman has reversed the diagnosis for 350 patients, he said.
The consequences of an LQTS diagnosis are “profound,” he noted, including years of unnecessary drug therapy, implantation of a cardioverter defibrillator, disqualification from competitive sports, and emotional stress to the individual and family.
By pointing out the five biggest mistakes his team has seen, he said, “we hope to equip the diagnostician with the means to challenge and assess the veracity of a LQTS diagnosis.”
The study was published online in the Journal of the American College of Cardiology.
Time to do better
Dr. Ackerman and colleagues analyzed electronic medical records on 290 of 1,841 (16%) patients who presented with an outside diagnosis of LQTS but subsequently were dismissed as having normal findings. The mean age of these patients at their first Mayo Clinic evaluation was 22, 60% were female, and the mean QTc interval was 427 ±25 milliseconds.
Overall, 38% of misdiagnoses were the result of misinterpretation of clinical factors; 29%, to diagnostic test misinterpretations; 17%, to an apparently positive genetic test in the context of a weak or absent phenotype; and 16%, to a family history of false LQTS or of sudden cardiac or sudden unexplained death.
More specifically, the most common cause of an LQTS misdiagnosis was QT prolongation following vasovagal syncope, which was misinterpreted as LQTS-attributed syncope.
The second most common cause was an apparently positive genetic test for an LQTS gene that turned out to be a benign or likely benign variant.
The third most common cause was an LQTS diagnosis based solely on a family history of sudden unexplained death (26 patients), QT prolongation (11 patients), or sudden cardiac arrest (9 patients).
The fourth most common cause was an isolated event of QT prolongation (44 patients). The transient QT prolongation was observed under myriad conditions unrelated to LQTS. Yet, 31 patients received a diagnosis based solely on the event.
The fifth most common cause was inclusion of the U-wave in the calculation of the QTc interval (40 patients), leading to an inaccurate interpretation of the electrocardiogram.
Dr. Ackerman noted that these LQTS diagnoses were given by heart-rhythm specialists, and most patients self-referred for a second opinion because a family member questioned the diagnosis after doing their own research.
“It’s time that we step up to the plate and do better,” Dr. Ackerman said. The team’s evaluation of the impact of the misdiagnosis on the patients’ lifestyle and quality of life showed that 45% had been restricted from competitive sports (and subsequently resumed sports activity with no adverse events); 80% had been started on beta-blockers (the drugs were discontinued in 84% as a result of the Mayo Clinic evaluation, whereas 16% opted to continue); and 10 of 22 patients (45%) who received an implanted cardioverter device underwent an extraction of the device without complications.
The authors conclude: “Although missing a patient who truly has LQTS can lead to a tragic outcome, the implications of overdiagnosed LQTS are not trivial and are potentially tragic as well.”
‘Tricky diagnosis’
LQTS specialist Peter Aziz, MD, director of pediatric electrophysiology at the Cleveland Clinic, agreed with these findings.
“Most of us ‘channelopathists’ who see LQTS for a living have a good grasp of the disease, but it can be elusive for others,” he said in an interview. “This is a tricky diagnosis. There are ends of the spectrum where people for sure don’t have it and people for sure do. Most clinicians are able to identify that.”
However, he added, “A lot of patients fall into that gray area where it may not be clear at first, even to an expert. But the expert knows how to do a comprehensive evaluation, examining episodes and symptoms and understanding whether they are relevant to LQTS or completely red herrings, and feeling confident about how they calculate the acute interval on an electrocardiogram.”
“All of these may seem mundane, but without the experience, clinicians are vulnerable to miscalculations,” he said. “That’s why our bias, as channelopathists, is that every patient who has a suspected diagnosis or is being treated for LQTS really should see an expert.”
Similarly, Arthur A.M. Wilde, MD, PhD, of the University of Amsterdam, and Peter J. Schwartz, MD, of IRCCS Istituto Auxologico Italiano, Milan, write in a related editorial that it “has to be kept in mind that both diagnostic scores and risk scores are dynamic and can be modified by time and by appropriate therapy.
“Therefore, to make hasty diagnosis of a disease that requires life-long treatment is inappropriate, especially when this is done without the support of adequate, specific experience.”
No commercial funding or relevant financial relationships were reported.
A version of this article first appeared on Medscape.com.
FROM THE JOURNAL OF THE AMERICAN COLLEGE OF CARDIOLOGY
First Humira biosimilar launches in U.S.
The first biosimilar for Humira, adalimumab-atto (Amjevita), is now available in the United States, according to an announcement on Jan. 31 by the manufacturer, Amgen. At least seven other U.S. Food and Drug Administration–approved Humira biosimilars are expected to become available later in 2023.
Amjevita was approved by the FDA in September 2016 for multiple inflammatory diseases, including rheumatoid arthritis, psoriatic arthritis, ankylosing spondylitis, Crohn’s disease, ulcerative colitis, and plaque psoriasis. The delayed launch was part of a global settlement with Humira’s manufacturer, AbbVie.
Humira (adalimumab) has been available since 2002 and is consistently one of the top-selling drugs in the United States. A single 40-mg Amjevita pen device will be available at two prices: a list price (wholesale acquisition cost) of $1,557.59, 55% below the current Humira list price, and a list price of $3,288.24, 5% below the current Humira list price, according to Amgen.
“Amgen’s goal is to provide broad access for patients by offering two options to health plans and pharmacy benefit managers,” the company said in the press release.
Patients are less likely to benefit from the more significant discount, said Marta Wosinska, PhD, a health care economist at the Brookings Institute in Washington, DC. It's expected that insurance companies will use the higher list price for Amjevita, she said, as this higher price will also likely have higher rebates. Rebates are payments to health insurance payers provided by drug manufacturers to promote use of an expensive drug. Some pharmacy benefit managers have already said that they plan to charge patients the same amount for Humira as its biosimilars, Dr. Wosinska said.
"For an existing patient, there's really no incentive for them to switch," she said in an interview.
So far only one insurance company, Kaiser Permanente, has plans to switch patients over to biosimilars, according to the health policy podcast Tradeoffs, and the insurer will stop covering Humira by the end of this year.
A version of this article first appeared on Medscape.com.
*This story was updated 2/1/2023.
Muscle weakness predicts poor outcomes in asthma patients
, based on data from 114 individuals.
Previous studies have shown reduced muscle mass in asthma patients, but the impact on clinical and functional outcomes has not been well studied, wrote Edith Visser, MSc, of Medical Centre Leeuwarden (the Netherlands) and colleagues.
“Many asthma patients, especially those with severe disease, report exercise intolerance and limitations in daily activities, severely affecting their quality of life,” they said. Research into the clinical consequences of low muscle mass and low muscle strength for patients with asthma and the role of inflammation could make muscle function a potential treatment target for those with asthma, they said.
In a study published in the Journal of Allergy and Clinical Immunology: In Practice, the researchers recruited 114 consecutive adults aged 18 years and older with a diagnosis of moderate to severe asthma who were seen at a single center between Jun. 2019 and Oct. 2022. The mean age of the patients was 51.9 years, 36% were men, 70% were overweight or obese, and 34 were diagnosed with severe asthma.
Participants underwent clinical, functional, and laboratory assessments at one or two visits within a 2-week period. Assessment tools included the Asthma Quality of Life Questionnaire (AQLQ), the Asthma Control Questionnaire (ACQ-6), a questionnaire on health care use (HCU), and the ‘short questionnaire to assess health-enhancing physical activity’ (SQUASH).
Functional activity was based on the 6-minute walking distance (6MWD), and lung function tests included spirometry and fractional inhaled nitric oxide (FeNO). Muscle mass was based on fat-free mass index (FFMI) and urinary creatinine excretion rate (CER). Muscle strength was measured using hand-grip strength (HGS).
The researchers examined levels of muscle mass and strength and their relation to functional and clinical outcomes.
Overall, the mean measures of muscle mass and strength were higher in males, who had average FFMI, CER, and HGS measures of 20.1 kg/m2, 15.3 mmol/day, and 48.8 kg, respectively. These measures in women were 17.3 kg/m2, 10.8 mmol/day, and 29.3 kg, respectively.
After adjusting for confounding factors, patients in the lowest tertile for muscle mass based on FFMI had significantly more severe asthma based on postbronchodilator forced expiratory volume in 1 second and FEV1/forced vital capacity, as well as lower functional exercise capacity based on the 6MWD compared to those in the highest tertile. A similar association appeared between CER and FEV1, but not FEV1/FVC.
However, no significant associations appeared between the muscle mass measures of FFMI or CER and scores on the ACQ, AQLQ, emergency department visits, or asthma exacerbations, the researchers noted.
No relationship appeared between muscle strength and functional outcomes. However, patients in the lowest tertile of HGS had worse asthma control, worse quality of life, and a higher probability of at least one visit to the emergency department compared to patients in the highest HGS tertile.
Higher leukocyte levels were significantly associated with lower muscle mass after adjusting for age, sex, weight, and physical activity, but no other inflammatory markers were significantly associated with FFMI.
The association between lower muscle strength and poorer asthma control, lower quality of life, and greater odds of emergency department visits reflect findings from previous studies, the researchers said. The mechanisms behind the loss of muscle strength in asthma remain unclear, but physical inactivity and daily oral corticosteroid use may play a role, they added.
The study findings were limited by the cross-sectional design and the possibility that muscle weakness may instead stem from reduced physical activity associated with poor lung function and asthma control, the researchers noted. Other limitations included the potential overestimation of FFMI and the lack of statistical power to show a relationship between FFMI and emergency department visits and asthma exacerbations, they said.
However, the current study is the first known to explore the relationship between lower muscle mass and strength and a range of both functional and clinical outcomes in patients with moderate to severe asthma, they said.
“Our findings encourage longitudinal studies into muscle function as a potential target for treatment to improve asthma outcomes,” they concluded.
The study was supported by unrestricted grants from Medical Centre Leeuwarden research fund. Ms. Visser had no financial conflicts to disclose.
FROM THE JOURNAL OF ALLERGY AND CLINICAL IMMUNOLOGY: IN PRACTICE
Children and COVID: Weekly cases may have doubled in early January
Although new COVID-19 cases in children, as measured by the American Academy of Pediatrics and the Children’s Hospital Association, have remained fairly steady in recent months, data from the Centers for Diseases Control and Prevention suggest that weekly cases took a big jump in early January.
For the most recent week covered . New cases for the first 2 weeks of the year – 31,000 for the week of Dec. 30 to Jan. 5 and 26,000 during Jan. 6-12 – were consistent with the AAP/CHA assertion that “weekly reported child cases have plateaued at an average of about 32,000 cases ... over the past 4 months.”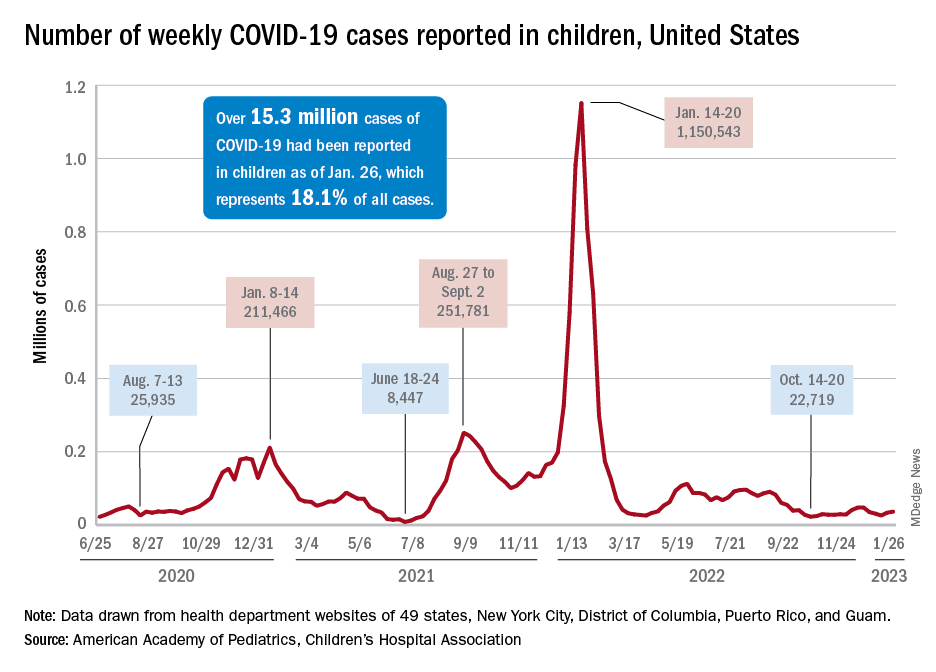
The CDC data, however, show that new cases doubled during the week of Jan. 1-7 to over 65,000, compared with the end of December, and stayed at that level for Jan. 8-14, and since CDC figures are subject to a 6-week reporting delay, the final numbers are likely to be even higher. The composition by age changed somewhat between the 2 weeks, though, as those aged 0-4 years went from almost half of all cases in the first week down to 40% in the second, while cases rose for children aged 5-11 and 12-15, based on data from the COVID-19 response team.
Emergency department visits for January do not show a corresponding increase. ED visits among children aged 0-11 years with COVID-19, measured as a percentage of all ED visits, declined over the course of the month, as did visits for 16- and 17-year-olds, while those aged 12-15 started the month at 1.4% and were at 1.4% on Jan. 27, with a slight dip down to 1.2% in between, the CDC said on its COVID Data Tracker. Daily hospitalizations for children aged 0-17 also declined through mid-January and did not reflect the jump in new cases.
Meanwhile, vaccinated children are still in the minority: 57% of those under age 18 have received no COVID vaccine yet, the AAP said in a separate report. Just 7.4% of children under age 2 years had received at least one dose as of Jan. 25, as had 10.1% of those aged 2-4 years, 39.6% of 5- to 11-year-olds and 71.8% of those 12-17 years old, according to the CDC, with corresponding figures for completion of the primary series at 3.5%, 5.3%, 32.5%, and 61.5%.
Managing respiratory symptoms in the ‘tripledemic’ era
Is it COVID-19, flu, or even RSV? I recently described just such a patient, an obese woman with type 2 diabetes, presenting with fever, cough, myalgia, and fatigue. I asked readers whether they agreed with my management of this patient.
Thank you for your comments as we continue to react to high rates of URIs. Your comments highlight the importance of local resources and practice habits when managing patients with URI.
It was clear that readers value testing to distinguish between infections. However, access to testing is highly variable around the world and is likely to be routinely used only in high-income countries. The Kaiser Family Foundation performed a cost analysis of testing for SARS-CoV-2 in 2020 and found, not surprisingly, wide variability in the cost of testing. Medicare covers tests at rates of $36-$143 per test; a study of list prices for SARS-CoV-2 tests at 93 hospitals found a median cost of $148 per test. And this does not include collection or facility fees. About 20% of tests cost more than $300.
These costs are prohibitive for many health systems. However, more devices have been introduced since that analysis, and competition and evolving technology should drive down prices. Generally, multiplex polymerase chain reaction (PCR) testing for multiple pathogens is less expensive than ordering two or three separate molecular tests and is more convenient for patients and practices alike.
Other reader comments focused on the challenges of getting accurate data on viral epidemiology, and there is certainly a time lag between infection trends and public health reports. This is exacerbated by underreporting of symptoms and more testing at home using antigen tests.
But please do not give up on epidemiology! If a test such as PCR is 90% sensitive for identifying infection, the yield in terms of the number of individuals infected with a particular virus should be high, and that is true when infection is in broad circulation. If 20% of a population of 1,000 has an infection and the test sensitivity is 90%, the yield of testing is 180 true cases versus 20 false positives.
However, if just 2% of the population of 1,000 has the infection in this same scenario, then only 18 true cases are identified. The effect on public health is certainly less, and a lower prevalence rate means that confounding variables, such as how long an individual might shed viral particles and the method of sample collection, have an outsized effect on results. This reduces the validity of diagnostic tests.
Even trends on a national level can provide some insight regarding whom to test. Traditionally, our practice has been to not routinely test patients for influenza or RSV from late spring to early fall unless there was a compelling reason, such as recent travel to an area where these infections were more prevalent. The loss of temporality for these infections since 2020 has altered this approach and made us pay more attention to reports from public health organizations.
I also appreciate the discussion of how to treat Agnes’s symptoms as she waits to improve, and anyone who suffers with or treats a viral URI knows that there are few interventions effective for such symptoms as cough and congestion. A systematic review of 29 randomized controlled trials of over-the-counter medications for cough yielded mixed and largely negative results.
Antihistamines alone do not seem to work, and guaifenesin was successful in only one of three trials. Combinations of different drug classes appeared to be slightly more effective.
My personal favorite for the management of acute cough is something that kids generally love: honey. In a review of 14 studies, 9 of which were limited to pediatric patients, honey was associated with significant reductions in cough frequency, cough severity, and total symptom score. However, there was a moderate risk of bias in the included research, and evidence of honey’s benefit in placebo-controlled trials was limited. Honey used in this research came in a variety of forms, so the best dosage is uncertain.
Clearly, advancements are needed. Better symptom management in viral URI will almost certainly improve productivity across the population and will probably reduce the inappropriate use of antibiotics as well. I have said for years that the scientists who can solve the Gordian knot of pediatric mucus deserve three Nobel prizes. I look forward to that golden day.
Dr. Vega is a clinical professor of family medicine at the University of California, Irvine. He reported a conflict of interest with McNeil Pharmaceuticals.
A version of this article first appeared on Medscape.com.
Citing workplace violence, one-fourth of critical care workers are ready to quit
A surgeon in Tulsa shot by a disgruntled patient. A doctor in India beaten by a group of bereaved family members. A general practitioner in the United Kingdom threatened with stabbing. A new study identifies this trend and finds that 25% of health care workers polled were willing to quit because of such violence.
“That was pretty appalling,” Rahul Kashyap, MD, MBA, MBBS, recalls. Dr. Kashyap is one of the leaders of the Violence Study of Healthcare Workers and Systems (ViSHWaS), which polled an international sample of physicians, nurses, and hospital staff. This study has worrying implications, Dr. Kashyap says. In a time when hospital staff are reporting burnout in record numbers, further deterrents may be the last thing our health care system needs. But Dr. Kashyap hopes that bringing awareness to these trends may allow physicians, policymakers, and the public to mobilize and intervene before it’s too late.
Previous studies have revealed similar trends. The rate of workplace violence directed at U.S. health care workers is five times that of workers in any other industry, according to the Bureau of Labor Statistics. The same study found that attacks had increased 63% from 2011 to 2018. Other polls that focus on the pandemic show that nearly half of U.S. nurses believe that violence increased since the world shut down. Well before the pandemic, however, a study from the Indian Medical Association found that 75% of doctors experienced workplace violence.
With this history in mind, perhaps it’s not surprising that the idea for the study came from the authors’ personal experiences. They had seen coworkers go through attacks, or they had endured attacks themselves, Dr. Kashyap says. But they couldn’t find any global data to back up these experiences. So Dr. Kashyap and his colleagues formed a web of volunteers dedicated to creating a cross-sectional study.
They got in touch with researchers from countries across Asia, the Middle East, South America, North America, and Africa. The initial group agreed to reach out to their contacts, casting a wide net. Researchers used WhatsApp, LinkedIn, and text messages to distribute the survey. Health care workers in each country completed the brief questionnaire, recalling their prepandemic world and evaluating their current one.
Within 2 months, they had reached health care workers in more than 100 countries. They concluded the study when they received about 5,000 results, according to Dr. Kashyap, and then began the process of stratifying the data. For this report, they focused on critical care, emergency medicine, and anesthesiology, which resulted in 598 responses from 69 countries. Of these, India and the United States had the highest number of participants.
In all, 73% of participants reported facing physical or verbal violence while in the hospital; 48% said they felt less motivated to work because of that violence; 39% of respondents believed that the amount of violence they experienced was the same as before the COVID-19 pandemic; and 36% of respondents believed that violence had increased. Even though they were trained on guidelines from the Occupational Safety and Health Administration, 20% of participants felt unprepared to face violence.
Although the study didn’t analyze the reasons workers felt this way, Dr. Kashyap speculates that it could be related to the medical distrust that grew during the pandemic or the stress patients and health care professionals experienced during its peak.
Regardless, the researchers say their study is a starting point. Now that the trend has been highlighted, it may be acted on.
Moving forward, Dr. Kashyap believes that controlling for different variables could determine whether factors like gender or shift time put a worker at higher risk for violence. He hopes it’s possible to interrupt these patterns and reestablish trust in the hospital environment. “It’s aspirational, but you’re hoping that through studies like ViSHWaS, which means trust in Hindi ... [we could restore] the trust and confidence among health care providers for the patients and family members.”
A version of this article first appeared on Medscape.com.