User login
Laser Safety: The Need for Protocols
The use of lasers in dermatology has evolved and expanded since their first cutaneous use in 1963.1 As the fundamental understanding of the interaction of laser energy with biological tissues increased, the need for laser safety became apparent. Since then, lasers of varying wavelengths have been developed, each with its specific chromophore target and specific safety need. Protocols, such as a checklist, that have been shown to reduce adverse events in surgery and in the intensive care unit can be borrowed to decrease risk from laser injury and optimize laser safety in dermatology.2 The safety of the patient, the laser operator, and the other health care providers involved in the delivery of laser therapy led to the first US Food and Drug Administration (FDA) guidelines for laser use in 1984.3
There are 4 regulatory organizations for laser safety in the United States: the American National Standards Institute (ANSI), the Occupational Health and Safety Administration (OSHA), the FDA’s Center for Devices and Radiological Health, and The Joint Commission.
Laser Principles
The basic principles of lasers include transmission, absorption, scatter, and reflection, all occurring when laser light is applied to biological tissues. The effects of the laser are a function of the target tissue (the chromophore) and the wavelength of light being used.4 In the skin, there are 3 main endogenous chromophores: water, hemoglobin, and melanin. Some experts consider collagen to be a fourth and separate entity as a chromophore. Tattoos are considered exogenous chromophores.3 The basic principles of lasers are important to understand and keep in mind when discussing laser safety, as they are the mechanisms through which unintended consequences can occur.
Laser Safety
Ocular Hazards
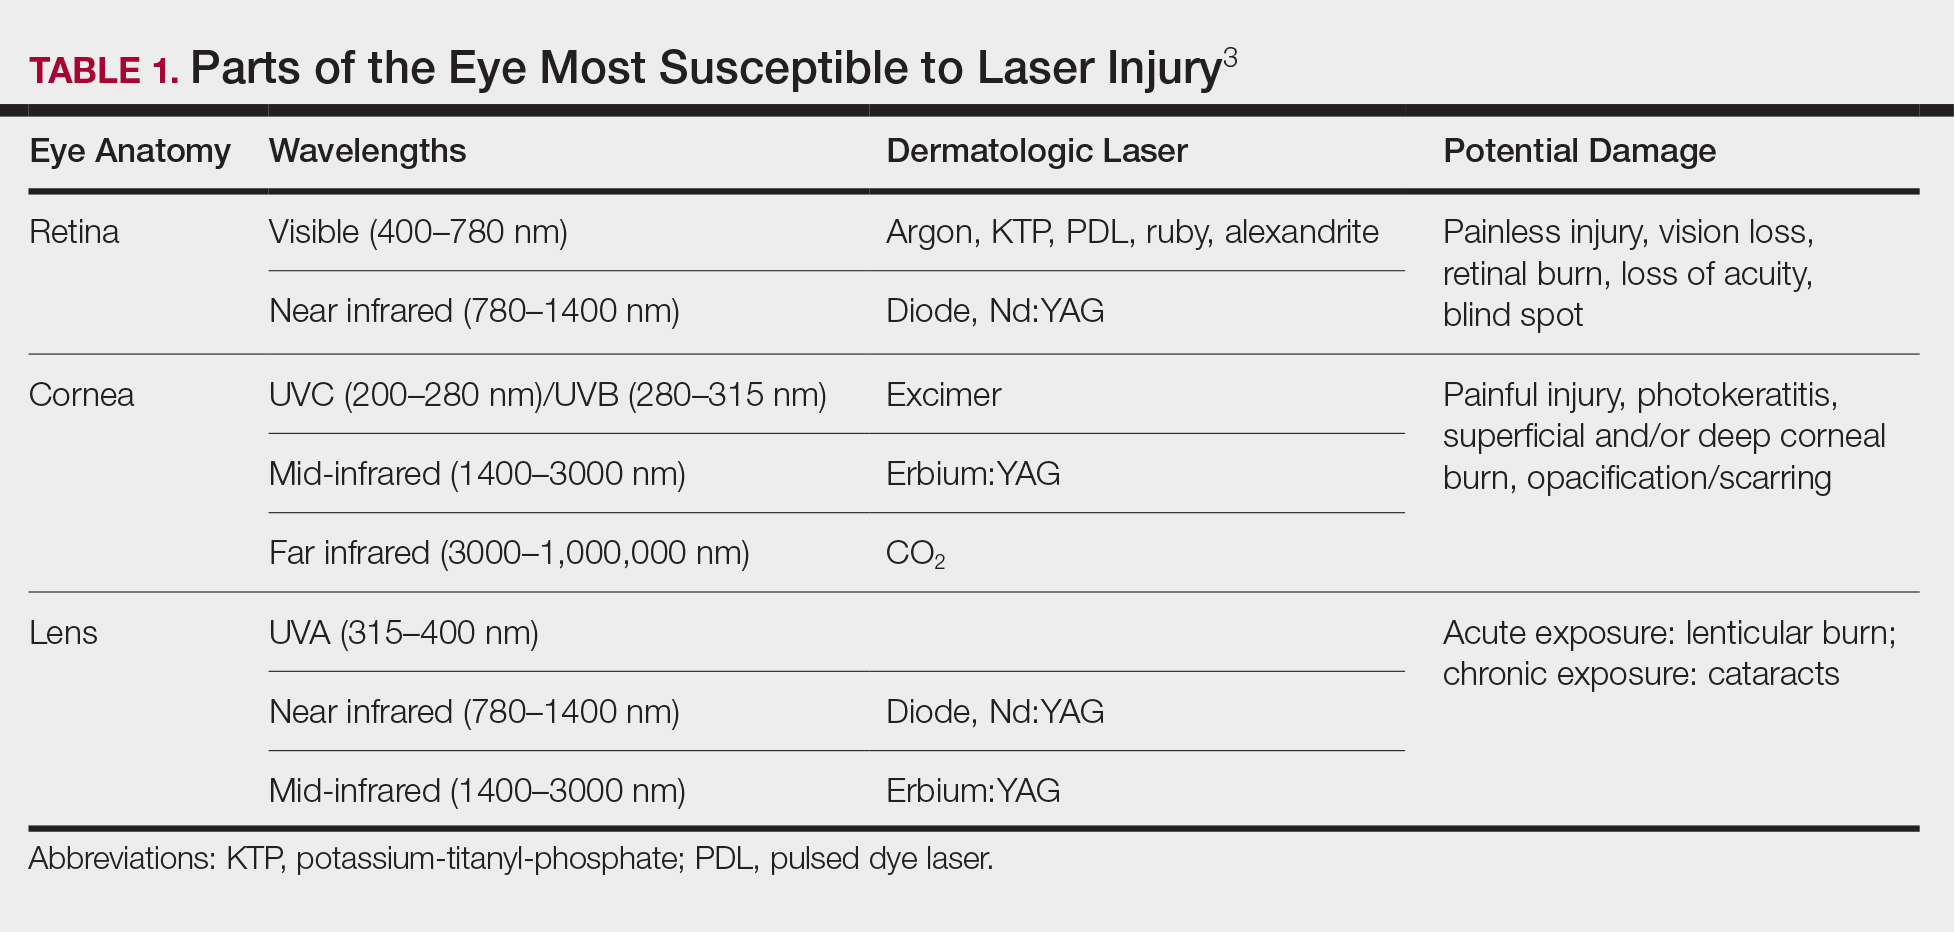
Ocular hazards are a notable concern in laser surgery. The eye is uniquely susceptible to laser light, and eye injuries represent a majority of reported injuries, which can occur through direct beam, mirror reflection by surgical instruments, and beam reflection off the skin (4%–7% of light that hits the skin is reflected because of the refractive index between air and the stratum corneum).3 The different wavelengths of lasers affect different parts of the eye. The 3 parts of the eye affected most are the retina, cornea, and lens. Not only is the lens primarily at risk for acute (lenticular burns) and chronic (cataracts) injury from the laser, but secondarily the lens also can concentrate a laser beam onto the retina by a factor of 100,000 (Table 1).3
The use of ocular protective equipment, sometimes referred to as personal protective eyewear (PPE), is essential and is mandated by ANSI and OSHA for all class 3 and class 4 lasers. The eyewear must be labeled with the wavelength and the degree of optical protection—termed the optical density (OD) or filter factor—of each lens and should match the laser being used. Laser manufacturers, as required by ANSI, must provide the wavelength and OD of their lasers, and both can be found on each laser as well as in ANSI Z136.1.3
Vendors supplying PPE generally provide the material, usually glass or polycarbonate; color; visible light transmission, which is the actual amount of light that reaches one’s eye through the lens; filter specifications, which contain the OD at certain wavelengths; and the types of lasers for which each specific PPE is used. It is important to match the laser to the correct PPE. The use of multiple types of lasers in the same office or laser treatment area can present challenges regarding eye safety. Matching the PPE to the laser in use is critical, and therefore all steps to prevent error for patients and personnel should be employed. One recommendation is to place each laser in a separate room with the appropriate PPE hung outside on the door of that room.
When the treatment area is in the periocular region, protection of the patient’s cornea is essential. Leaded eye shields with nonreflective surfaces have been shown to offer the best protection.5 Prior to placement, anesthetic eye drops and lubrication are important for patient comfort and protection from corneal injury.
Laser-Generated Airborne Contaminants
Other hazards associated with laser use not directly related to the beam are laser-generated airborne contaminants (LGACs), including chemicals, viruses, bacteria, aerosolized blood products, and nanoparticles (<1 µm) known as ultrafine particles (UFPs). According to ANSI, electrosurgical devices and lasers generate the same smoke. The plume (surgical smoke) is known to contain as many as 60 chemicals, including but not limited to carbon monoxide, acrylonitrite, hydrocyanide, benzene, toluene, naphthalene, and formaldehyde. Several are known carcinogens, and others are environmental toxins.6,7
Smoke management is an important consideration for dermatologists and their patients and generally includes respiratory protection via masks and ventilation techniques. However, the practice is not universal, and oversight agencies such as OSHA and the National Institute for Occupational Safety and Health (NIOSH) provide guidelines only; they do not enforce. As such, smoke management is voluntary and not widely practiced. In a 2014 survey of 997 dermatologic surgeons who were asked if smoke management is used in their practice, 77% of respondents indicated no smoke management was used.6
The Surgical Plume: Composition
A 2014 study from the University of California, San Diego Department of Dermatology analyzed surgical smoke.6 The researchers placed the smoke collection probe 16 to 18 inches above the electrocautery site, which approximates the location of the surgeon’s head during the procedure. Assessing smoke composition, they found high levels of carcinogens and irritants. Two compounds found in their assay—1,3-butadiene and benzene—also are found in secondhand cigarette smoke. However, the concentrations in the plume were 17-fold higher for 1,3-butadiene and 10-fold higher for benzene than those found in secondhand cigarette smoke. The risk from chronic, long-term exposure to these airborne contaminants is notable, as benzene (a known carcinogen as determined by the US Department of Health and Human Services) is known to cause leukemia. For example, a busy Mohs surgeon can reach the equivalent of as many as 50 hours of continuous smoke exposure over the course of a year.6
The Surgical Plume: Particle Concentration
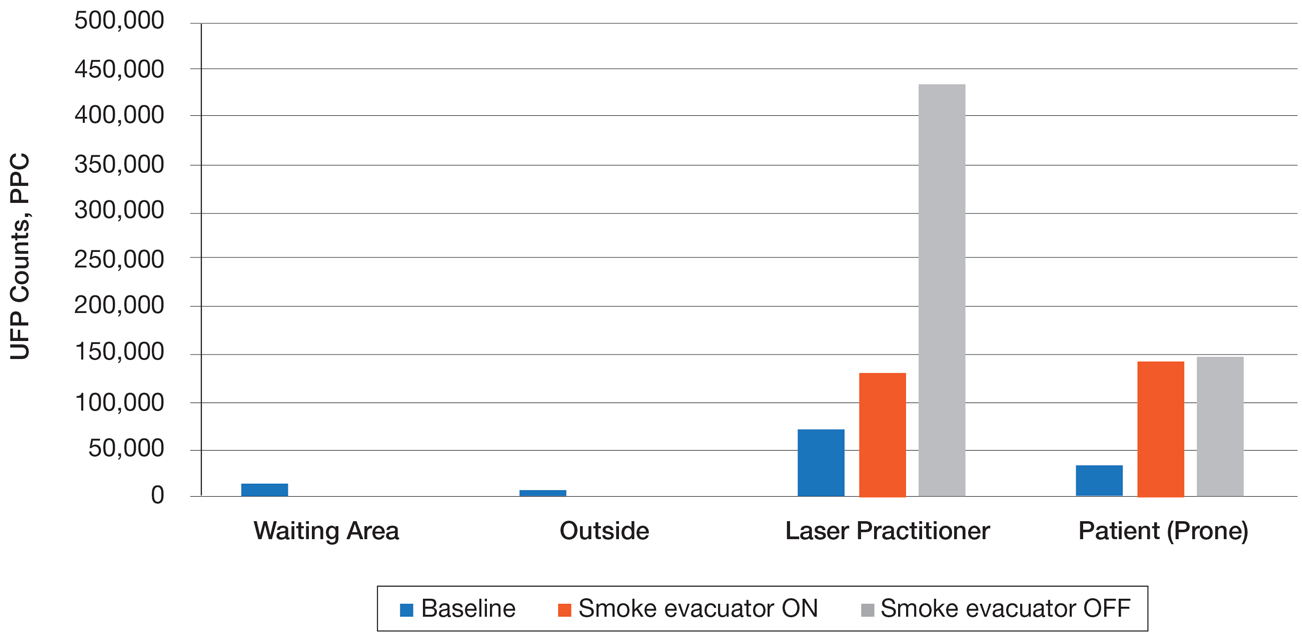
Ultrafine particles can bypass conventional filtering systems (surgical masks and N95 respirators) because of their extremely small size, which allows them to pass further into the lungs and all the way to the alveolar spaces. Geographic regions with high UFPs have been shown to have higher overall mortality rates, as well as higher rates of reactive airway disease, cardiovascular disease, and lung cancer. A 2016 study by Chuang et al7 published in JAMA Dermatology looked at the UFPs in the surgical plume from laser hair removal (LHR) procedures. The plume of LHR has a distinct odor and easily discernible particulates. The investigators measured the UFPs at the level of the laser practitioner and the patient’s face during LHR with a smoke evacuator turned on and again with it turned off for 30 seconds, and then compared them to UFPs measured in the treatment room, the waiting room, and outside the building. There were substantial increases in UFPs from the LHR procedure, especially for the laser practitioner, when the smoke evacuator was off. The ambient baseline particle count, as measured in the clinic waiting area, began at 15,300 particles per cubic centimeter (PPC), and once the LHR procedure began (smoke evacuator on), there was a greater than 8-fold PPC increase above baseline (15,300 PPC to 129,376 PPC) in UFPs measured for the laser practitioner. Importantly, during LHR when the smoke evacuator was turned off for 30 seconds, there was a more than 28-fold increase (15,300 PPC to 435,888 PPC) over baseline to the practitioner (Figure).7
The Surgical Plume: Viruses, Bacteria, and Aerosolized Blood Products
Viruses and bacteria are thought to be transmissible via the plume, and proviral human immunodeficiency virus DNA has been found in the plume as well as evacuator equipment used to reduce plume exposure.8 A study from 1988 found that CO2 laser users treating verrucae had human papillomavirus in the laser plume.9 A comparison study of CO2 laser users treating verrucae had an increased incidence of nasopharyngeal human papillomavirus infection when compared to a control group, and the plume also contained aerosolized blood.10 The American National Standards Institute, OSHA, and NIOSH all agree that LGAC control from lasers is necessary through respiratory protection and ventilation, but none of these organizations provides specific equipment recommendations. The American Society for Laser Medicine and Surgery has published a position statement on laser plume.11
The Surgical Plume: Smoke Management
Many virus particles and UFPs are less than 0.1 µm in size. It is important to note that neither surgical masks nor high-filtration masks, such as the N95 respirator, filter particles smaller than 0.1 µm. The first line of defense in smoke management is the local exhaust ventilation (LEV) system, which includes wall suction and/or a smoke evacuator. The smoke evacuator is considered the more important of the two. General filtration, such as wall suction, is a low-flow system and is really used for liquids. It can be used as a supplement to the smoke evacuator to control small amounts of plume if fitted with an in-line filter. There are 2 types of LEV filters: ultralow particulate air filters filter particles larger than 0.1
Of utmost importance when using a smoke evacuator system is suction tip placement. Placing the suction tip 1 cm from the tissue damage site has been shown to be 98.6% effective at removing laser plume. If moved to 2 cm, effectiveness decreases to less than 50%.11 Proper management recommendations based on current evidence suggest that use of a smoke evacuator and an approved fit-tested N95 respirator might provide maximum protection.6 In addition to plume exposure, tissue splatter can occur, especially during ablative (CO2) and tattoo laser therapy, which should prompt consideration of a face shield.11 There are several vendors and models available online, and a simple Internet search for surgical tissue splatter face shields will provide multiple options.
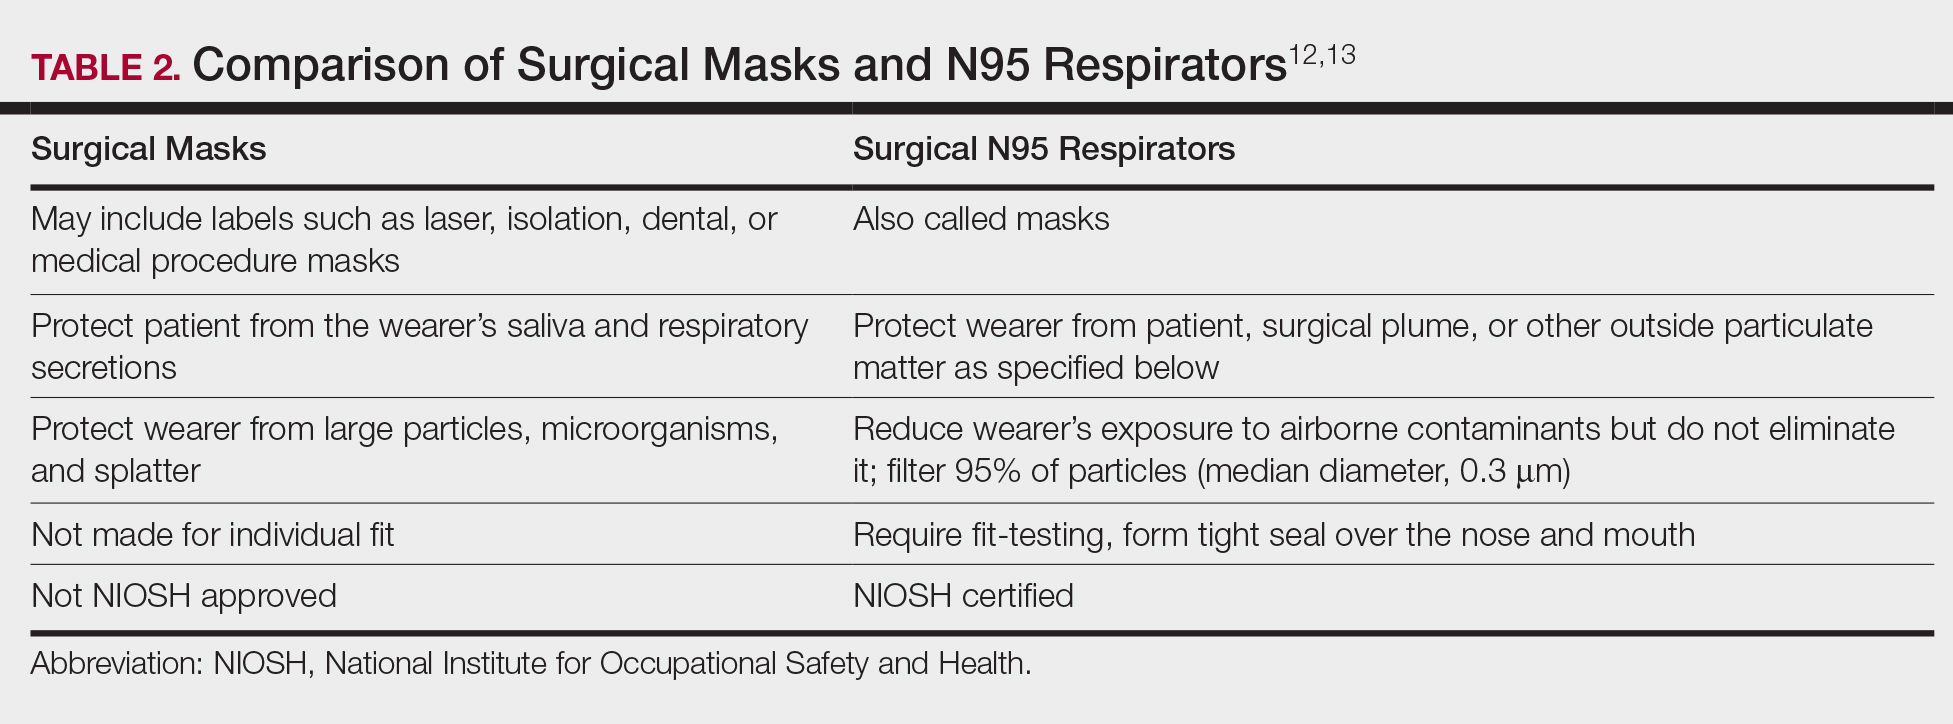
The standard surgical mask is not NIOSH approved and only effectively (99%) filters particles larger than 5 µm (vs 25% efficacy for 0.3-µm particles). Its main purpose is to protect the patient from the wearer.12
High-filtration masks, which capture particles as small as 0.1 µm, should be used instead. The surgical N95 respirator is a NIOSH-certified respirator and is recommended for use in cases when smoke management is necessary. The FDA does not test or certify these masks; it only clears them after reviewing manufacturer test data. Technically, to be called a surgical mask, it must be cleared by the FDA.12 The 95 of N95 indicates filter efficiency ratings of 95% when testing the filter efficiency using particles of approximately 0.3 µm in diameter (Table 2).13 Because 77% of surgical smoke particles are smaller than 1.1 µm, surgical masks and N95 respirators are never sufficient as stand-alone protection.14 An LEV system is much more important for safe surgical smoke management. However, recommendations call for the use of a smoke evacuator and a high-filtration mask together to obtain the most protection available.14
Fire Hazards
Fire hazards constitute another area of concern for the laser user and are seen with class 4 lasers. There usually are 2 types of fire hazards: electrical fires inside the laser (often faulty wiring) and flash fires (laser beam contacts flammable material). Flammable materials (eg, hair, hair products, makeup, fabrics, plastic, alcohol, chlorhexidine, aluminum chloride, elastic strap on safety goggles, gauze, drapes) should be identified and removed prior to laser use. CO2 and erbium:YAG lasers tend to pose the worst risk for flash fires.15
Precautions for fire control in the laser room should include fire extinguishers and/or fire extinguisher blankets, a water basin, and fire-resistant drapes available as needed. Flammable material such as gauze should be kept wet, or a nonflammable version should be used.3
Additional Safety Considerations
Whenever lasers are being used, it is important to cover any windows in the laser treatment area (LTA) to prevent the laser beam from passing through the glass window. Laser-blocking window covers are a requirement and are available from several vendors. Covers that block every laser class are available and come as a shade or a flat cover that is attached with Velcro or magnets. They also come with “Laser in Use” warning signs for additional safety. Access to the LTA when the laser is in use should be controlled and appropriate warning signs placed on the door to prevent inadvertent entry without proper PPE. Locking the door to the LTA while using the laser is an additional safety measure and can be included on a checklist.
For the dermatologist, the skin is a primary focus, and similar to the eye, can be at risk for injury. The most common type of injury resembles a sunburn, such as those seen in the UVB range, that appears as redness and sometimes blistering,15 which is an important consideration, and attention should be given to all those in the laser room.
Checklists
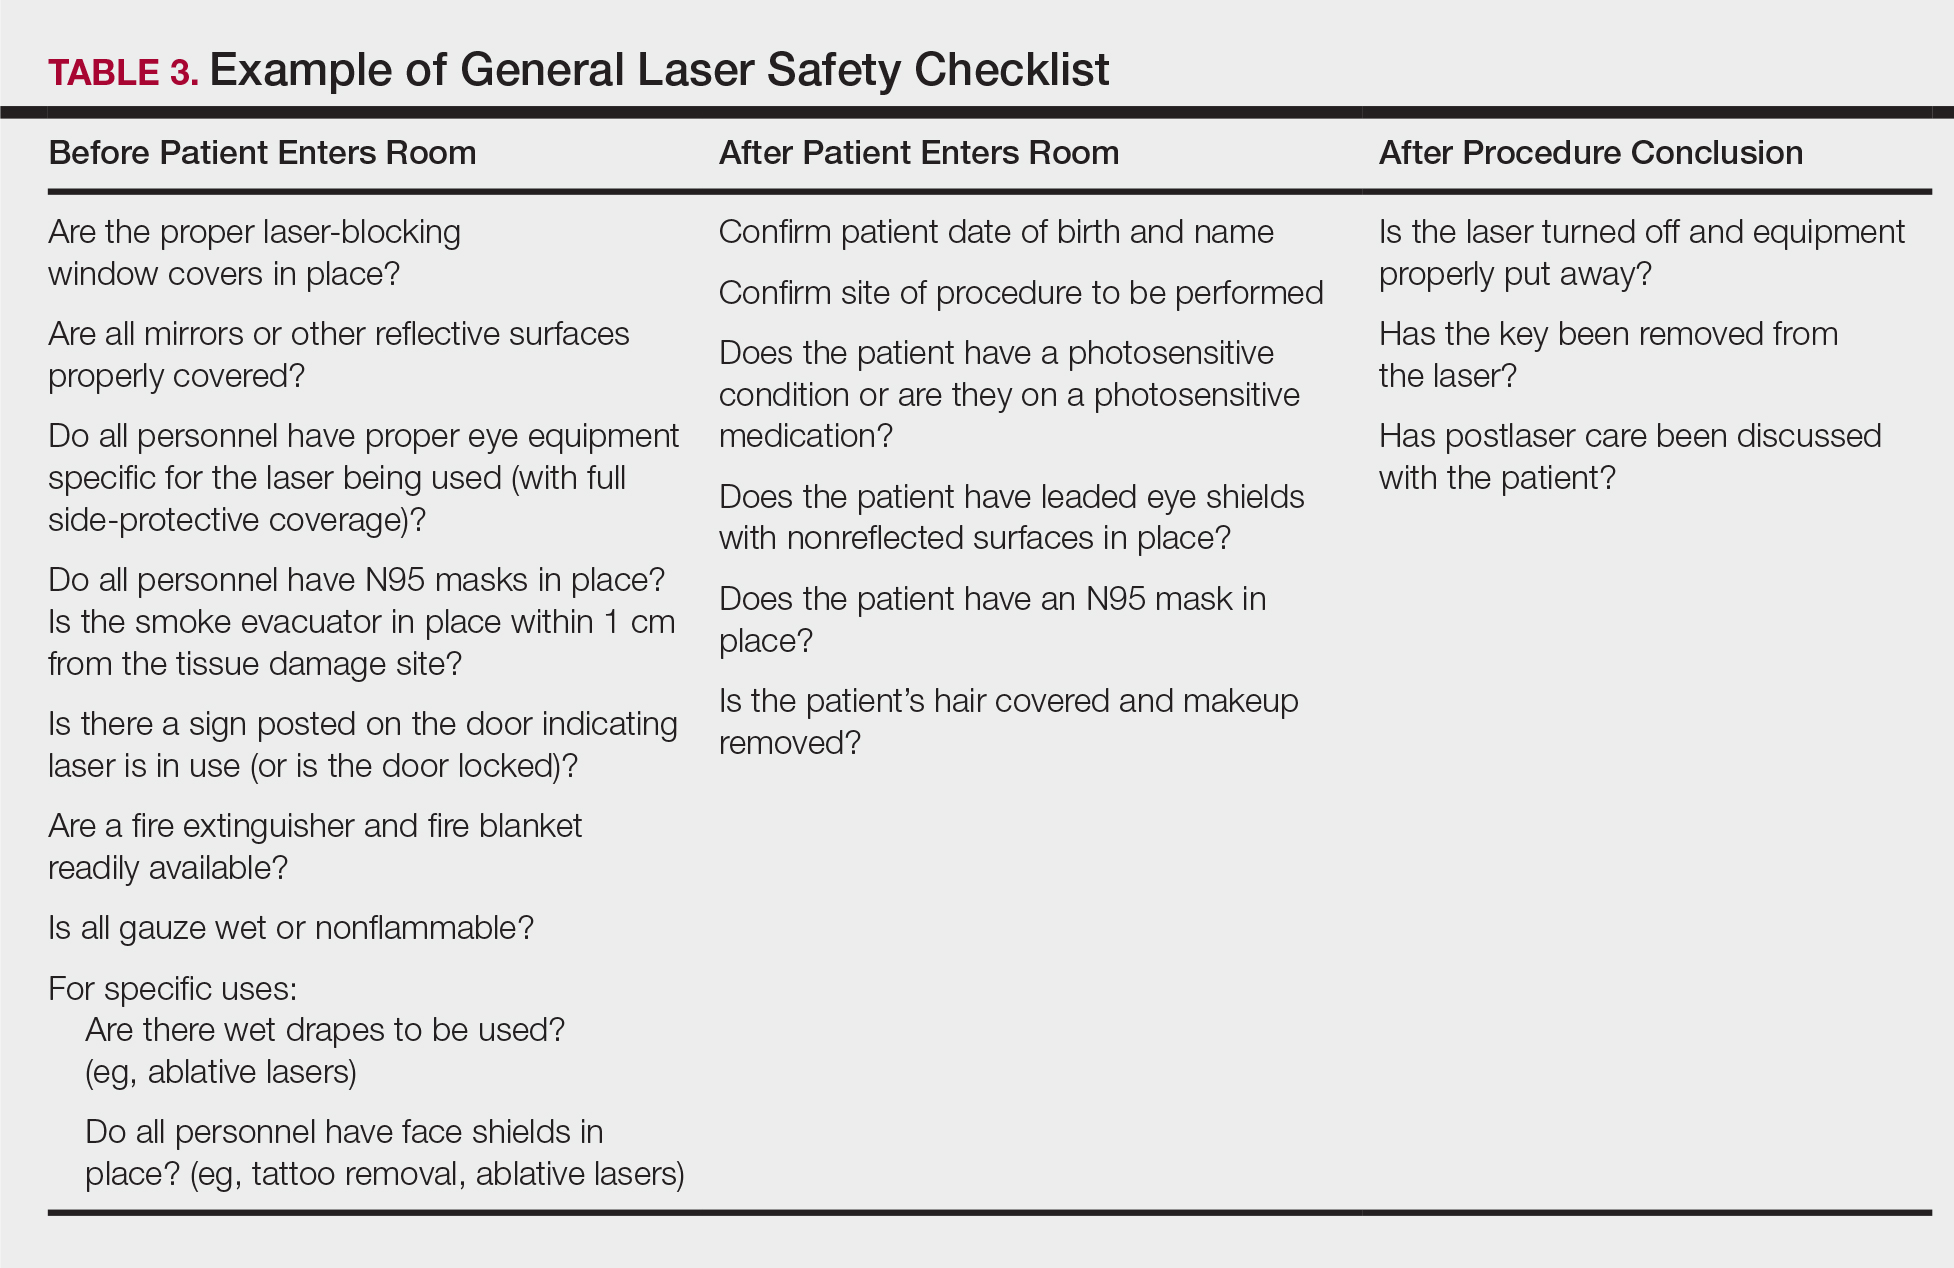
Checklists are ubiquitous throughout many occupations and many medical specialties. Their usefulness in preventing adverse events is well established. Any patient-provider encounter in which a series of sequential actions is required is a perfect situation for a checklist. In dermatologic laser surgery where the eye is uniquely susceptible to injury, a laser safety checklist is essential. Additionally, there are issues with LGACs and fire that are important to consider. Having protocols (ie, a checklist) in place that address these safety issues has been shown to reduce adverse outcomes.2 There are a number of templates available from various sources that can be customized to the laser treatment area. We provide a modifiable example (Table 3).
Conclusion
Laser usage in dermatologic surgery has increased. According to surveys from the American Society for Dermatologic Surgery, in 2012 there were approximately 2 million laser/light/energy-based procedures performed. By 2017, there were 3.27 million, up from 2.79 million in 2016, representing an approximate 1-year increase of 17%.16 Lasers have allowed interventions for skin, vascular, and aesthetic conditions that were once untreatable. As their use increases in number and broadens in scope, there also has been an increase in litigation alleging malpractice for misuse of the laser.17 Adverse events, which include photochemical or thermal injuries to the skin, pigmentation issues, scarring, plume-related issues, and fires, do occur. One solution to reduce the chance of an adverse outcome is to implement a checklist. Research using checklists has shown that adverse events are reduced when checklists are created and implemented properly. Improving checklist compliance also improves patient outcomes.17 The American National Standards Institute, in their ANSI Z136 series, and the World Health Organization provide checklist templates. We include our checklist for use in laser surgery (Table 3). Understanding that each laser treatment area is unique, the templates can serve as a starting point and can then be customized to suit the needs of each dermatologist.
- Goldman L, Blaney DJ, Kindel DJ, et al. Effect of the laser beam on the skin. J Invest Dermatol. 1963;40:121-122.
- Daggett C, Daggett A. The surgical check list revisited. Int J Surg Res Pract. 2017;4:051.
- Pritzker RN, Rohrer TE. Laser safety: standards and guidelines. In: Nouri K, ed. Handbook of Lasers in Dermatology. London, England: Springer; 2014:11-28.
- Husain Z, Alster TS. The role of lasers and intense pulsed light technology in dermatology. Clin Cosmet Investig Dermatol. 2016;9:29-40.
- Ries WR, Clymer MA, Reinisch L. Laser safety features of eye shields. Lasers Surg Med. 1996;18:309-315.
- Oganesyan G, Eimputh S, Kim SS, et al. Surgical smoke detection in dermatologic surgery. Dermatol Surg. 2014;40:1373-1377.
- Chuang GS, Farinelli W, Christiani DC, et al. Gaseous and particulate content of laser hair removal plume. JAMA Dermatol. 2016;152:1320-1326.
- Baggish MS, Poiesz BJ, Joret D, et al. Presence of human immunodeficiency DNA in laser smoke. Lasers Surg Med. 1991;11:197-203.
- Garden JM, O’Banion MK, Shelnitz LS, et al. Papilloma virus in the vapor of carbon dioxide laser-treated verrucae. JAMA. 1988;259:1199-1202.
- Gloster HM Jr, Roenigk RK. Risk of acquiring human papillomavirus from the plume produced by the carbon dioxide laser in the treatment of warts. J Am Acad Dermatol. 1995;32:436-441.
- American Society for Laser Medicine and Surgery. ASLMS laser and energy device plume position statement. http://www.aslms.org/for-professionals/professional-resources/safety-and-complications/aslms-laser-and-energy-device-plume-position-statement. Accessed October 4, 2019.
- A comparison of surgical masks, surgical N95 respirators, and industrial N95 respirators. OH&S website. https://ohsonline.com/Articles/2014/05/01/Comparison-Respiratory.aspx?Page=3. Published May 1, 2014. Accessed October 4, 2019.
- 3M Infection Prevention N95 particulate respirators, 1860/1860s and 1870. Frequently Asked Questions. http://multimedia.3m.com/mws/media/323208O/n95-particulate-respirators-1860-1860s-1870-faqs.pdf. Accessed October 4, 2019.
- Lewin JM, Brauer JA, Ostad A. Surgical smoke and the dermatologist. J Am Acad Dermatol. 2011;65:636-641.
- Arefiev K, Warycha M, Whiting D, et al. Flammability of topical preparations and surgical dressings in cutaneous and laser surgery: a controlled simulation study. J Am Acad Dermatol. 2012;67:700-705.
- ASDS survey on dermatologic procedures. American Society for Dermatologic Surgery website. https://www.asds.net/Medical-Professionals/Practice-Resources/ASDS-Survey-on-Dermatologic-Procedures. Accessed October 4, 2019.
- Jalian HR, Jalian CA, Avram MM. Common causes of injury and legal action in laser surgery. JAMA Dermatol. 2013;149:188-193.
The use of lasers in dermatology has evolved and expanded since their first cutaneous use in 1963.1 As the fundamental understanding of the interaction of laser energy with biological tissues increased, the need for laser safety became apparent. Since then, lasers of varying wavelengths have been developed, each with its specific chromophore target and specific safety need. Protocols, such as a checklist, that have been shown to reduce adverse events in surgery and in the intensive care unit can be borrowed to decrease risk from laser injury and optimize laser safety in dermatology.2 The safety of the patient, the laser operator, and the other health care providers involved in the delivery of laser therapy led to the first US Food and Drug Administration (FDA) guidelines for laser use in 1984.3
There are 4 regulatory organizations for laser safety in the United States: the American National Standards Institute (ANSI), the Occupational Health and Safety Administration (OSHA), the FDA’s Center for Devices and Radiological Health, and The Joint Commission.
Laser Principles
The basic principles of lasers include transmission, absorption, scatter, and reflection, all occurring when laser light is applied to biological tissues. The effects of the laser are a function of the target tissue (the chromophore) and the wavelength of light being used.4 In the skin, there are 3 main endogenous chromophores: water, hemoglobin, and melanin. Some experts consider collagen to be a fourth and separate entity as a chromophore. Tattoos are considered exogenous chromophores.3 The basic principles of lasers are important to understand and keep in mind when discussing laser safety, as they are the mechanisms through which unintended consequences can occur.
Laser Safety
Ocular Hazards
Ocular hazards are a notable concern in laser surgery. The eye is uniquely susceptible to laser light, and eye injuries represent a majority of reported injuries, which can occur through direct beam, mirror reflection by surgical instruments, and beam reflection off the skin (4%–7% of light that hits the skin is reflected because of the refractive index between air and the stratum corneum).3 The different wavelengths of lasers affect different parts of the eye. The 3 parts of the eye affected most are the retina, cornea, and lens. Not only is the lens primarily at risk for acute (lenticular burns) and chronic (cataracts) injury from the laser, but secondarily the lens also can concentrate a laser beam onto the retina by a factor of 100,000 (Table 1).3
The use of ocular protective equipment, sometimes referred to as personal protective eyewear (PPE), is essential and is mandated by ANSI and OSHA for all class 3 and class 4 lasers. The eyewear must be labeled with the wavelength and the degree of optical protection—termed the optical density (OD) or filter factor—of each lens and should match the laser being used. Laser manufacturers, as required by ANSI, must provide the wavelength and OD of their lasers, and both can be found on each laser as well as in ANSI Z136.1.3
Vendors supplying PPE generally provide the material, usually glass or polycarbonate; color; visible light transmission, which is the actual amount of light that reaches one’s eye through the lens; filter specifications, which contain the OD at certain wavelengths; and the types of lasers for which each specific PPE is used. It is important to match the laser to the correct PPE. The use of multiple types of lasers in the same office or laser treatment area can present challenges regarding eye safety. Matching the PPE to the laser in use is critical, and therefore all steps to prevent error for patients and personnel should be employed. One recommendation is to place each laser in a separate room with the appropriate PPE hung outside on the door of that room.
When the treatment area is in the periocular region, protection of the patient’s cornea is essential. Leaded eye shields with nonreflective surfaces have been shown to offer the best protection.5 Prior to placement, anesthetic eye drops and lubrication are important for patient comfort and protection from corneal injury.
Laser-Generated Airborne Contaminants
Other hazards associated with laser use not directly related to the beam are laser-generated airborne contaminants (LGACs), including chemicals, viruses, bacteria, aerosolized blood products, and nanoparticles (<1 µm) known as ultrafine particles (UFPs). According to ANSI, electrosurgical devices and lasers generate the same smoke. The plume (surgical smoke) is known to contain as many as 60 chemicals, including but not limited to carbon monoxide, acrylonitrite, hydrocyanide, benzene, toluene, naphthalene, and formaldehyde. Several are known carcinogens, and others are environmental toxins.6,7
Smoke management is an important consideration for dermatologists and their patients and generally includes respiratory protection via masks and ventilation techniques. However, the practice is not universal, and oversight agencies such as OSHA and the National Institute for Occupational Safety and Health (NIOSH) provide guidelines only; they do not enforce. As such, smoke management is voluntary and not widely practiced. In a 2014 survey of 997 dermatologic surgeons who were asked if smoke management is used in their practice, 77% of respondents indicated no smoke management was used.6
The Surgical Plume: Composition
A 2014 study from the University of California, San Diego Department of Dermatology analyzed surgical smoke.6 The researchers placed the smoke collection probe 16 to 18 inches above the electrocautery site, which approximates the location of the surgeon’s head during the procedure. Assessing smoke composition, they found high levels of carcinogens and irritants. Two compounds found in their assay—1,3-butadiene and benzene—also are found in secondhand cigarette smoke. However, the concentrations in the plume were 17-fold higher for 1,3-butadiene and 10-fold higher for benzene than those found in secondhand cigarette smoke. The risk from chronic, long-term exposure to these airborne contaminants is notable, as benzene (a known carcinogen as determined by the US Department of Health and Human Services) is known to cause leukemia. For example, a busy Mohs surgeon can reach the equivalent of as many as 50 hours of continuous smoke exposure over the course of a year.6
The Surgical Plume: Particle Concentration
Ultrafine particles can bypass conventional filtering systems (surgical masks and N95 respirators) because of their extremely small size, which allows them to pass further into the lungs and all the way to the alveolar spaces. Geographic regions with high UFPs have been shown to have higher overall mortality rates, as well as higher rates of reactive airway disease, cardiovascular disease, and lung cancer. A 2016 study by Chuang et al7 published in JAMA Dermatology looked at the UFPs in the surgical plume from laser hair removal (LHR) procedures. The plume of LHR has a distinct odor and easily discernible particulates. The investigators measured the UFPs at the level of the laser practitioner and the patient’s face during LHR with a smoke evacuator turned on and again with it turned off for 30 seconds, and then compared them to UFPs measured in the treatment room, the waiting room, and outside the building. There were substantial increases in UFPs from the LHR procedure, especially for the laser practitioner, when the smoke evacuator was off. The ambient baseline particle count, as measured in the clinic waiting area, began at 15,300 particles per cubic centimeter (PPC), and once the LHR procedure began (smoke evacuator on), there was a greater than 8-fold PPC increase above baseline (15,300 PPC to 129,376 PPC) in UFPs measured for the laser practitioner. Importantly, during LHR when the smoke evacuator was turned off for 30 seconds, there was a more than 28-fold increase (15,300 PPC to 435,888 PPC) over baseline to the practitioner (Figure).7
The Surgical Plume: Viruses, Bacteria, and Aerosolized Blood Products
Viruses and bacteria are thought to be transmissible via the plume, and proviral human immunodeficiency virus DNA has been found in the plume as well as evacuator equipment used to reduce plume exposure.8 A study from 1988 found that CO2 laser users treating verrucae had human papillomavirus in the laser plume.9 A comparison study of CO2 laser users treating verrucae had an increased incidence of nasopharyngeal human papillomavirus infection when compared to a control group, and the plume also contained aerosolized blood.10 The American National Standards Institute, OSHA, and NIOSH all agree that LGAC control from lasers is necessary through respiratory protection and ventilation, but none of these organizations provides specific equipment recommendations. The American Society for Laser Medicine and Surgery has published a position statement on laser plume.11
The Surgical Plume: Smoke Management
Many virus particles and UFPs are less than 0.1 µm in size. It is important to note that neither surgical masks nor high-filtration masks, such as the N95 respirator, filter particles smaller than 0.1 µm. The first line of defense in smoke management is the local exhaust ventilation (LEV) system, which includes wall suction and/or a smoke evacuator. The smoke evacuator is considered the more important of the two. General filtration, such as wall suction, is a low-flow system and is really used for liquids. It can be used as a supplement to the smoke evacuator to control small amounts of plume if fitted with an in-line filter. There are 2 types of LEV filters: ultralow particulate air filters filter particles larger than 0.1
Of utmost importance when using a smoke evacuator system is suction tip placement. Placing the suction tip 1 cm from the tissue damage site has been shown to be 98.6% effective at removing laser plume. If moved to 2 cm, effectiveness decreases to less than 50%.11 Proper management recommendations based on current evidence suggest that use of a smoke evacuator and an approved fit-tested N95 respirator might provide maximum protection.6 In addition to plume exposure, tissue splatter can occur, especially during ablative (CO2) and tattoo laser therapy, which should prompt consideration of a face shield.11 There are several vendors and models available online, and a simple Internet search for surgical tissue splatter face shields will provide multiple options.
The standard surgical mask is not NIOSH approved and only effectively (99%) filters particles larger than 5 µm (vs 25% efficacy for 0.3-µm particles). Its main purpose is to protect the patient from the wearer.12
High-filtration masks, which capture particles as small as 0.1 µm, should be used instead. The surgical N95 respirator is a NIOSH-certified respirator and is recommended for use in cases when smoke management is necessary. The FDA does not test or certify these masks; it only clears them after reviewing manufacturer test data. Technically, to be called a surgical mask, it must be cleared by the FDA.12 The 95 of N95 indicates filter efficiency ratings of 95% when testing the filter efficiency using particles of approximately 0.3 µm in diameter (Table 2).13 Because 77% of surgical smoke particles are smaller than 1.1 µm, surgical masks and N95 respirators are never sufficient as stand-alone protection.14 An LEV system is much more important for safe surgical smoke management. However, recommendations call for the use of a smoke evacuator and a high-filtration mask together to obtain the most protection available.14
Fire Hazards
Fire hazards constitute another area of concern for the laser user and are seen with class 4 lasers. There usually are 2 types of fire hazards: electrical fires inside the laser (often faulty wiring) and flash fires (laser beam contacts flammable material). Flammable materials (eg, hair, hair products, makeup, fabrics, plastic, alcohol, chlorhexidine, aluminum chloride, elastic strap on safety goggles, gauze, drapes) should be identified and removed prior to laser use. CO2 and erbium:YAG lasers tend to pose the worst risk for flash fires.15
Precautions for fire control in the laser room should include fire extinguishers and/or fire extinguisher blankets, a water basin, and fire-resistant drapes available as needed. Flammable material such as gauze should be kept wet, or a nonflammable version should be used.3
Additional Safety Considerations
Whenever lasers are being used, it is important to cover any windows in the laser treatment area (LTA) to prevent the laser beam from passing through the glass window. Laser-blocking window covers are a requirement and are available from several vendors. Covers that block every laser class are available and come as a shade or a flat cover that is attached with Velcro or magnets. They also come with “Laser in Use” warning signs for additional safety. Access to the LTA when the laser is in use should be controlled and appropriate warning signs placed on the door to prevent inadvertent entry without proper PPE. Locking the door to the LTA while using the laser is an additional safety measure and can be included on a checklist.
For the dermatologist, the skin is a primary focus, and similar to the eye, can be at risk for injury. The most common type of injury resembles a sunburn, such as those seen in the UVB range, that appears as redness and sometimes blistering,15 which is an important consideration, and attention should be given to all those in the laser room.
Checklists
Checklists are ubiquitous throughout many occupations and many medical specialties. Their usefulness in preventing adverse events is well established. Any patient-provider encounter in which a series of sequential actions is required is a perfect situation for a checklist. In dermatologic laser surgery where the eye is uniquely susceptible to injury, a laser safety checklist is essential. Additionally, there are issues with LGACs and fire that are important to consider. Having protocols (ie, a checklist) in place that address these safety issues has been shown to reduce adverse outcomes.2 There are a number of templates available from various sources that can be customized to the laser treatment area. We provide a modifiable example (Table 3).
Conclusion
Laser usage in dermatologic surgery has increased. According to surveys from the American Society for Dermatologic Surgery, in 2012 there were approximately 2 million laser/light/energy-based procedures performed. By 2017, there were 3.27 million, up from 2.79 million in 2016, representing an approximate 1-year increase of 17%.16 Lasers have allowed interventions for skin, vascular, and aesthetic conditions that were once untreatable. As their use increases in number and broadens in scope, there also has been an increase in litigation alleging malpractice for misuse of the laser.17 Adverse events, which include photochemical or thermal injuries to the skin, pigmentation issues, scarring, plume-related issues, and fires, do occur. One solution to reduce the chance of an adverse outcome is to implement a checklist. Research using checklists has shown that adverse events are reduced when checklists are created and implemented properly. Improving checklist compliance also improves patient outcomes.17 The American National Standards Institute, in their ANSI Z136 series, and the World Health Organization provide checklist templates. We include our checklist for use in laser surgery (Table 3). Understanding that each laser treatment area is unique, the templates can serve as a starting point and can then be customized to suit the needs of each dermatologist.
- Goldman L, Blaney DJ, Kindel DJ, et al. Effect of the laser beam on the skin. J Invest Dermatol. 1963;40:121-122.
- Daggett C, Daggett A. The surgical check list revisited. Int J Surg Res Pract. 2017;4:051.
- Pritzker RN, Rohrer TE. Laser safety: standards and guidelines. In: Nouri K, ed. Handbook of Lasers in Dermatology. London, England: Springer; 2014:11-28.
- Husain Z, Alster TS. The role of lasers and intense pulsed light technology in dermatology. Clin Cosmet Investig Dermatol. 2016;9:29-40.
- Ries WR, Clymer MA, Reinisch L. Laser safety features of eye shields. Lasers Surg Med. 1996;18:309-315.
- Oganesyan G, Eimputh S, Kim SS, et al. Surgical smoke detection in dermatologic surgery. Dermatol Surg. 2014;40:1373-1377.
- Chuang GS, Farinelli W, Christiani DC, et al. Gaseous and particulate content of laser hair removal plume. JAMA Dermatol. 2016;152:1320-1326.
- Baggish MS, Poiesz BJ, Joret D, et al. Presence of human immunodeficiency DNA in laser smoke. Lasers Surg Med. 1991;11:197-203.
- Garden JM, O’Banion MK, Shelnitz LS, et al. Papilloma virus in the vapor of carbon dioxide laser-treated verrucae. JAMA. 1988;259:1199-1202.
- Gloster HM Jr, Roenigk RK. Risk of acquiring human papillomavirus from the plume produced by the carbon dioxide laser in the treatment of warts. J Am Acad Dermatol. 1995;32:436-441.
- American Society for Laser Medicine and Surgery. ASLMS laser and energy device plume position statement. http://www.aslms.org/for-professionals/professional-resources/safety-and-complications/aslms-laser-and-energy-device-plume-position-statement. Accessed October 4, 2019.
- A comparison of surgical masks, surgical N95 respirators, and industrial N95 respirators. OH&S website. https://ohsonline.com/Articles/2014/05/01/Comparison-Respiratory.aspx?Page=3. Published May 1, 2014. Accessed October 4, 2019.
- 3M Infection Prevention N95 particulate respirators, 1860/1860s and 1870. Frequently Asked Questions. http://multimedia.3m.com/mws/media/323208O/n95-particulate-respirators-1860-1860s-1870-faqs.pdf. Accessed October 4, 2019.
- Lewin JM, Brauer JA, Ostad A. Surgical smoke and the dermatologist. J Am Acad Dermatol. 2011;65:636-641.
- Arefiev K, Warycha M, Whiting D, et al. Flammability of topical preparations and surgical dressings in cutaneous and laser surgery: a controlled simulation study. J Am Acad Dermatol. 2012;67:700-705.
- ASDS survey on dermatologic procedures. American Society for Dermatologic Surgery website. https://www.asds.net/Medical-Professionals/Practice-Resources/ASDS-Survey-on-Dermatologic-Procedures. Accessed October 4, 2019.
- Jalian HR, Jalian CA, Avram MM. Common causes of injury and legal action in laser surgery. JAMA Dermatol. 2013;149:188-193.
Practice Points
- Laser therapy has evolved and expanded since its first cutaneous use in 1963.
- The 4 regulatory agencies for laser safety in the United States establish standards and guidelines, but implementation is voluntary.
- Ocular hazards, laser-generated airborne contaminants, fires, and unintended laser beam injuries constitute the main safety concerns.
- Safety protocols with a laser checklist can reduce adverse outcomes.

APPlying Knowledge: Evidence for and Regulation of Mobile Apps for Dermatologists
Since the first mobile application (app) was developed in the 1990s, apps have become increasingly integrated into medical practice and training. More than 5.5 million apps were downloadable in 2019,1 of which more than 300,000 were health related.2 In the United States, more than 80% of physicians reported using smartphones for professional purposes in 2016.3 As the complexity of apps and their purpose of use has evolved, regulatory bodies have not adapted adequately to monitor apps that have broad-reaching consequences in medicine.
We review the primary literature on PubMed behind health-related apps that impact dermatologists as well as the government regulation of these apps, with a focus on the 3 most prevalent dermatology-related apps used by dermatology residents in the United States: VisualDx, UpToDate, and Mohs Surgery Appropriate Use Criteria. This prevalence is according to a survey emailed to all dermatology residents in the United States by the American Academy of Dermatology (AAD) in 2019 (unpublished data).
VisualDx
VisualDx, which aims to improve diagnostic accuracy and patient safety, contains peer-reviewed data and more than 32,000 images of dermatologic conditions. The editorial board includes more than 50 physicians. It provides opportunities for continuing medical education credit, is used in more than 2300 medical settings, and costs $399.99 annually for a subscription with partial features. Prior to the launch of the app in 2010, some health science professionals noted that the website version lacked references to primary sources.4 The same issue carried over to the app, which has evolved to offer artificial intelligence (AI) analysis of photographed skin lesions. However, there are no peer-reviewed publications showing positive impact of the app on diagnostic skills among dermatology residents or on patient outcomes.
UpToDate
UpToDate is a web-based database created in the early 1990s. A corresponding app was created around 2010. Both internal and independent research has demonstrated improved outcomes, and the app is advertised as the only clinical decision support resource associated with improved outcomes, as shown in more than 80 publications.5 UpToDate covers more than 11,800 medical topics and contains more than 35,000 graphics. It cites primary sources and uses a published system for grading recommendation strength and evidence quality. The data are processed and produced by a team of more than 7100 physicians as authors, editors, and reviewers. The platform grants continuing medical education credit and is used by more than 1.9 million clinicians in more than 190 countries. A 1-year subscription for an individual US-based physician costs $559. An observational study assessed UpToDate articles for potential conflicts of interest between authors and their recommendations. Of the 6 articles that met inclusion criteria of discussing management of medical conditions that have controversial or mostly brand-name treatment options, all had conflicts of interest, such as naming drugs from companies with which the authors and/or editors had financial relationships.6
Mohs Surgery Appropriate Use Criteria
The Mohs Surgery Appropriate Use Criteria app is a free clinical decision-making tool based on a consensus statement published in 2012 by the AAD, American College of Mohs Surgery, American Society for Dermatologic Surgery Association, and American Society for Mohs Surgery.7 It helps guide management of more than 200 dermatologic scenarios. Critique has been made that the criteria are partly based on expert opinion and data largely from the United States and has not been revised to incorporate newer data.8 There are no publications regarding the app itself.
Regulation of Health-Related Apps
Health-related apps that are designed for utilization by health care providers can be a valuable tool. However, given their prevalence, cost, and potential impact on patient lives, these apps should be well regulated and researched. The general paucity of peer-reviewed literature demonstrating the utility, safety, quality, and accuracy of health-related apps commonly used by providers is a reflection of insufficient mobile health regulation in the United States.
There are 3 primary government agencies responsible for regulating mobile medical apps: the US Food and Drug Administration (FDA), Federal Trade Commission, and Office for Civil Rights.9 The FDA does not regulate all medical devices. Apps intended for use in the diagnosis, cure, mitigation, prevention, or treatment of a disease or condition are considered to be medical devices.10 The FDA regulates those apps only if they are judged to pose more than minimal risk. Apps that are designed only to provide easy access to information related to health conditions or treatment are considered to be minimal risk but can develop into a different risk level such as by offering AI.11 Although the FDA does update its approach to medical devices, including apps and AI- and machine learning–based software, the rate and direction of update has not kept pace with the rapid evolution of apps.12 In 2019, the FDA began piloting a precertification program that grants long-term approval to organizations that develop apps instead of reviewing each app product individually.13 This decrease in premarket oversight is intended to expedite innovation with the hopeful upside of improving patient outcomes but is inconsistent, with the FDA still reviewing other types of medical devices individually.
For apps that are already in use, the Federal Trade Commission only gets involved in response to deceptive or unfair acts or practices relating to privacy, data security, and false or misleading claims about safety or performance. It may be more beneficial for consumers if those apps had a more stringent initial approval process. The Office for Civil Rights enforces the Health Insurance Portability and Accountability Act when relevant to apps.
Nongovernment agencies also are involved in app regulation. The FDA believes sharing more regulatory responsibility with private industry would promote efficiency.14 Google does not allow apps that contain false or misleading health claims,15 and Apple may scrutinize medical apps that could provide inaccurate data or be used for diagnosing or treating patients.16 Xcertia, a nonprofit organization founded by the American Medical Association and others, develops standards for the security, privacy, content, and operability of health-related apps, but those standards have not been adopted by other parties. Ultimately, nongovernment agencies are not responsible for public health and do not boast the government’s ability to enforce rules or ensure public safety.
Final Thoughts
The AAD survey of US dermatology residents found that the top consideration when choosing apps was up-to-date and accurate information; however, the 3 most prevalent apps among those same respondents did not need government approval and are not required to contain up-to-date data or to improve clinical outcomes, similar to most other health-related apps. This discrepancy is concerning considering the increasing utilization of apps for physician education and health care delivery and the increasing complexity of those apps. In light of these results, the potential decrease in federal premarket regulation suggested by the FDA’s precertification program seems inappropriate. It is important for the government to take responsibility for regulating health-related apps and to find a balance between too much regulation delaying innovation and too little regulation hurting physician training and patient care. It also is important for providers to be aware of the evidence and oversight behind the technologies they use for professional purposes.
- Clement J. Number of apps available in leading app stores as of 1st quarter 2020. Statista website. https://www.statista.com/statistics/276623/number-of-apps-available-in-leading-app-stores/. Published May 4, 2020. Accessed July 23, 2020.
- mHealth App Economics 2017/2018. Current Status and Future Trends in Mobile Health. Berlin, Germany: Research 2 Guidance; 2018.
- Healthcare Client Services. Professional usage of smartphones by doctors. Kantar website. https://www.kantarmedia.com/us/thinking-and-resources/blog/professional-usage-of-smartphones-by-doctors-2016. Published November 16, 2016. Accessed July 23, 2020.
- Skhal KJ, Koffel J. VisualDx. J Med Libr Assoc. 2007;95:470-471.
- UpToDate is the only clinical decision support resource associated with improved outcomes. UpToDate website. https://www.uptodate.com/home/research. Accessed July 29, 2020.
- Connolly SM, Baker DR, Coldiron BM, et al. AAD/ACMS/ASDSA/ASMS 2012 appropriate use criteria for Mohs micrographic surgery: a report of the American Academy of Dermatology, American College of Mohs Surgery, American Society for Dermatologic Surgery Association, and the American Society for Mohs Surgery. J Am Acad Dermatol. 2012;67:531-550.
- Amber KT, Dhiman G, Goodman KW. Conflict of interest in online point-of-care clinical support websites. J Med Ethics. 2014;40:578-580.
- Croley JA, Joseph AK, Wagner RF Jr. Discrepancies in the Mohs micrographic surgery appropriate use criteria. J Am Acad Dermatol. 2020;82:E55.
- Mobile health apps interactive tool. Federal Trade Commission website. https://www.ftc.gov/tips-advice/business-center/guidance/mobile-health-apps-interactive-tool. Published April 2016. Accessed May 23, 2020.
- Federal Food, Drug, and Cosmetic Act, 21 USC §321 (2018).
- US Food and Drug Administration. Examples of software functions for which the FDA will exercise enforcement discretion. https://www.fda.gov/medical-devices/device-software-functions-including-mobile-medical-applications/examples-software-functions-which-fda-will-exercise-enforcement-discretion. Updated September 26, 2019. Accessed July 29, 2020.
- US Food and Drug Administration. Proposed regulatory framework for modifications to artificial intelligence/machine learning (AI/ML)‐based software as a medical device (SaMD). https://www.fda.gov/downloads/MedicalDevices/DigitalHealth/SoftwareasaMedicalDevice/UCM635052.pdf. Accessed July 23, 2020.
- US Food and Drug Administration. Digital health software precertification (pre-cert) program. https://www.fda.gov/medical-devices/digital-health/digital-health-software-precertification-pre-cert-program. Updated July 18, 2019. Accessed July 23, 2020.
- Gottlieb S. Fostering medical innovation: a plan for digital health devices. US Food and Drug Administration website. https://www.fda.gov/news-events/fda-voices/fostering-medical-innovation-plan-digital-health-devices. Published June 15, 2017. Accessed July 23, 2020.
- Restricted content: unapproved substances. Google Play website. https://play.google.com/about/restricted-content/unapproved-substances. Accessed July 23, 2020.
- App store review guidelines. Apple Developer website. https://developer.apple.com/app-store/review/guidelines. Updated March 4, 2020. Accessed July 23, 2020.
Since the first mobile application (app) was developed in the 1990s, apps have become increasingly integrated into medical practice and training. More than 5.5 million apps were downloadable in 2019,1 of which more than 300,000 were health related.2 In the United States, more than 80% of physicians reported using smartphones for professional purposes in 2016.3 As the complexity of apps and their purpose of use has evolved, regulatory bodies have not adapted adequately to monitor apps that have broad-reaching consequences in medicine.
We review the primary literature on PubMed behind health-related apps that impact dermatologists as well as the government regulation of these apps, with a focus on the 3 most prevalent dermatology-related apps used by dermatology residents in the United States: VisualDx, UpToDate, and Mohs Surgery Appropriate Use Criteria. This prevalence is according to a survey emailed to all dermatology residents in the United States by the American Academy of Dermatology (AAD) in 2019 (unpublished data).
VisualDx
VisualDx, which aims to improve diagnostic accuracy and patient safety, contains peer-reviewed data and more than 32,000 images of dermatologic conditions. The editorial board includes more than 50 physicians. It provides opportunities for continuing medical education credit, is used in more than 2300 medical settings, and costs $399.99 annually for a subscription with partial features. Prior to the launch of the app in 2010, some health science professionals noted that the website version lacked references to primary sources.4 The same issue carried over to the app, which has evolved to offer artificial intelligence (AI) analysis of photographed skin lesions. However, there are no peer-reviewed publications showing positive impact of the app on diagnostic skills among dermatology residents or on patient outcomes.
UpToDate
UpToDate is a web-based database created in the early 1990s. A corresponding app was created around 2010. Both internal and independent research has demonstrated improved outcomes, and the app is advertised as the only clinical decision support resource associated with improved outcomes, as shown in more than 80 publications.5 UpToDate covers more than 11,800 medical topics and contains more than 35,000 graphics. It cites primary sources and uses a published system for grading recommendation strength and evidence quality. The data are processed and produced by a team of more than 7100 physicians as authors, editors, and reviewers. The platform grants continuing medical education credit and is used by more than 1.9 million clinicians in more than 190 countries. A 1-year subscription for an individual US-based physician costs $559. An observational study assessed UpToDate articles for potential conflicts of interest between authors and their recommendations. Of the 6 articles that met inclusion criteria of discussing management of medical conditions that have controversial or mostly brand-name treatment options, all had conflicts of interest, such as naming drugs from companies with which the authors and/or editors had financial relationships.6
Mohs Surgery Appropriate Use Criteria
The Mohs Surgery Appropriate Use Criteria app is a free clinical decision-making tool based on a consensus statement published in 2012 by the AAD, American College of Mohs Surgery, American Society for Dermatologic Surgery Association, and American Society for Mohs Surgery.7 It helps guide management of more than 200 dermatologic scenarios. Critique has been made that the criteria are partly based on expert opinion and data largely from the United States and has not been revised to incorporate newer data.8 There are no publications regarding the app itself.
Regulation of Health-Related Apps
Health-related apps that are designed for utilization by health care providers can be a valuable tool. However, given their prevalence, cost, and potential impact on patient lives, these apps should be well regulated and researched. The general paucity of peer-reviewed literature demonstrating the utility, safety, quality, and accuracy of health-related apps commonly used by providers is a reflection of insufficient mobile health regulation in the United States.
There are 3 primary government agencies responsible for regulating mobile medical apps: the US Food and Drug Administration (FDA), Federal Trade Commission, and Office for Civil Rights.9 The FDA does not regulate all medical devices. Apps intended for use in the diagnosis, cure, mitigation, prevention, or treatment of a disease or condition are considered to be medical devices.10 The FDA regulates those apps only if they are judged to pose more than minimal risk. Apps that are designed only to provide easy access to information related to health conditions or treatment are considered to be minimal risk but can develop into a different risk level such as by offering AI.11 Although the FDA does update its approach to medical devices, including apps and AI- and machine learning–based software, the rate and direction of update has not kept pace with the rapid evolution of apps.12 In 2019, the FDA began piloting a precertification program that grants long-term approval to organizations that develop apps instead of reviewing each app product individually.13 This decrease in premarket oversight is intended to expedite innovation with the hopeful upside of improving patient outcomes but is inconsistent, with the FDA still reviewing other types of medical devices individually.
For apps that are already in use, the Federal Trade Commission only gets involved in response to deceptive or unfair acts or practices relating to privacy, data security, and false or misleading claims about safety or performance. It may be more beneficial for consumers if those apps had a more stringent initial approval process. The Office for Civil Rights enforces the Health Insurance Portability and Accountability Act when relevant to apps.
Nongovernment agencies also are involved in app regulation. The FDA believes sharing more regulatory responsibility with private industry would promote efficiency.14 Google does not allow apps that contain false or misleading health claims,15 and Apple may scrutinize medical apps that could provide inaccurate data or be used for diagnosing or treating patients.16 Xcertia, a nonprofit organization founded by the American Medical Association and others, develops standards for the security, privacy, content, and operability of health-related apps, but those standards have not been adopted by other parties. Ultimately, nongovernment agencies are not responsible for public health and do not boast the government’s ability to enforce rules or ensure public safety.
Final Thoughts
The AAD survey of US dermatology residents found that the top consideration when choosing apps was up-to-date and accurate information; however, the 3 most prevalent apps among those same respondents did not need government approval and are not required to contain up-to-date data or to improve clinical outcomes, similar to most other health-related apps. This discrepancy is concerning considering the increasing utilization of apps for physician education and health care delivery and the increasing complexity of those apps. In light of these results, the potential decrease in federal premarket regulation suggested by the FDA’s precertification program seems inappropriate. It is important for the government to take responsibility for regulating health-related apps and to find a balance between too much regulation delaying innovation and too little regulation hurting physician training and patient care. It also is important for providers to be aware of the evidence and oversight behind the technologies they use for professional purposes.
- Clement J. Number of apps available in leading app stores as of 1st quarter 2020. Statista website. https://www.statista.com/statistics/276623/number-of-apps-available-in-leading-app-stores/. Published May 4, 2020. Accessed July 23, 2020.
- mHealth App Economics 2017/2018. Current Status and Future Trends in Mobile Health. Berlin, Germany: Research 2 Guidance; 2018.
- Healthcare Client Services. Professional usage of smartphones by doctors. Kantar website. https://www.kantarmedia.com/us/thinking-and-resources/blog/professional-usage-of-smartphones-by-doctors-2016. Published November 16, 2016. Accessed July 23, 2020.
- Skhal KJ, Koffel J. VisualDx. J Med Libr Assoc. 2007;95:470-471.
- UpToDate is the only clinical decision support resource associated with improved outcomes. UpToDate website. https://www.uptodate.com/home/research. Accessed July 29, 2020.
- Connolly SM, Baker DR, Coldiron BM, et al. AAD/ACMS/ASDSA/ASMS 2012 appropriate use criteria for Mohs micrographic surgery: a report of the American Academy of Dermatology, American College of Mohs Surgery, American Society for Dermatologic Surgery Association, and the American Society for Mohs Surgery. J Am Acad Dermatol. 2012;67:531-550.
- Amber KT, Dhiman G, Goodman KW. Conflict of interest in online point-of-care clinical support websites. J Med Ethics. 2014;40:578-580.
- Croley JA, Joseph AK, Wagner RF Jr. Discrepancies in the Mohs micrographic surgery appropriate use criteria. J Am Acad Dermatol. 2020;82:E55.
- Mobile health apps interactive tool. Federal Trade Commission website. https://www.ftc.gov/tips-advice/business-center/guidance/mobile-health-apps-interactive-tool. Published April 2016. Accessed May 23, 2020.
- Federal Food, Drug, and Cosmetic Act, 21 USC §321 (2018).
- US Food and Drug Administration. Examples of software functions for which the FDA will exercise enforcement discretion. https://www.fda.gov/medical-devices/device-software-functions-including-mobile-medical-applications/examples-software-functions-which-fda-will-exercise-enforcement-discretion. Updated September 26, 2019. Accessed July 29, 2020.
- US Food and Drug Administration. Proposed regulatory framework for modifications to artificial intelligence/machine learning (AI/ML)‐based software as a medical device (SaMD). https://www.fda.gov/downloads/MedicalDevices/DigitalHealth/SoftwareasaMedicalDevice/UCM635052.pdf. Accessed July 23, 2020.
- US Food and Drug Administration. Digital health software precertification (pre-cert) program. https://www.fda.gov/medical-devices/digital-health/digital-health-software-precertification-pre-cert-program. Updated July 18, 2019. Accessed July 23, 2020.
- Gottlieb S. Fostering medical innovation: a plan for digital health devices. US Food and Drug Administration website. https://www.fda.gov/news-events/fda-voices/fostering-medical-innovation-plan-digital-health-devices. Published June 15, 2017. Accessed July 23, 2020.
- Restricted content: unapproved substances. Google Play website. https://play.google.com/about/restricted-content/unapproved-substances. Accessed July 23, 2020.
- App store review guidelines. Apple Developer website. https://developer.apple.com/app-store/review/guidelines. Updated March 4, 2020. Accessed July 23, 2020.
Practice Points
- Physicians who are selecting an app for self-education or patient care should take into consideration the strength of the evidence supporting the app as well as the rigor of any approval process the app had to undergo.
- Only a minority of health-related apps are regulated by the government. This regulation has not kept up with the evolution of app software and may become more indirect.

Telemedicine in primary care
How to effectively utilize this tool
By now it is well known that the COVID-19 pandemic has significantly disrupted primary care. Office visits and revenues have precipitously dropped as physicians and patients alike fear in-person visits may increase their risks of contracting the virus. However, telemedicine has emerged as a lifeline of sorts for many practices, enabling them to conduct visits and maintain contact with patients.

Telemedicine is likely to continue to serve as a tool for primary care providers to improve access to convenient, cost-effective, high-quality care after the pandemic. Another benefit of telemedicine is it can help maintain a portion of a practice’s revenue stream for physicians during uncertain times.
Indeed, the nation has seen recent progress toward telemedicine parity, which refers to the concept of reimbursing providers’ telehealth visits at the same rates as similar in-person visits.
A challenge to adopting telemedicine is that it calls for adjusting established workflows for in-person encounters. A practice cannot simply replicate in-person processes to work for telehealth. While both in-person and virtual visits require adherence to HIPAA, for example, how you actually protect patient privacy will call for different measures. Harking back to the early days of EMR implementation, one does not need to like the telemedicine platform or process, but come to terms with the fact that it is a tool that is here to stay to deliver patient care.
Treat your practice like a laboratory
Adoption may vary between practices depending on many factors, including clinicians’ comfort with technology, clinical tolerance and triage rules for nontouch encounters, state regulations, and more. Every provider group should begin experimenting with telemedicine in specific ways that make sense for them.
One physician may practice telemedicine full-time while the rest abstain, or perhaps the practice prefers to offer telemedicine services during specific hours on specific days. Don’t be afraid to start slowly when you’re trying something new – but do get started with telehealth. It will increasingly be a mainstream medium and more patients will come to expect it.
Train the entire team
Many primary care practices do not enjoy the resources of an information technology team, so all team members essentially need to learn the new skill of telemedicine usage, in addition to assisting patients. That can’t happen without staff buy-in, so it is essential that everyone from the office manager to medical assistants have the training they need to make the technology work. Juggling schedules for telehealth and in-office, activating an account through email, starting and joining a telehealth meeting, and preparing a patient for a visit are just a handful of basic tasks your staff should be trained to do to contribute to the successful integration of telehealth.
Educate and encourage patients to use telehealth
While unfamiliarity with technology may represent a roadblock for some patients, others resist telemedicine simply because no one has explained to them why it’s so important and the benefits it can hold for them. Education and communication are critical, including the sometimes painstaking work of slowly walking patients through the process of performing important functions on the telemedicine app. By providing them with some friendly coaching, patients won’t feel lost or abandoned during what for some may be an unfamiliar and frustrating process.
Manage more behavioral health
Different states and health plans incentivize primary practices for integrating behavioral health into their offerings. Rather than dismiss this addition to your own practice as too cumbersome to take on, I would recommend using telehealth to expand behavioral health care services.
If your practice is working toward a team-based, interdisciplinary approach to care delivery, behavioral health is a critical component. While other elements of this “whole person” health care may be better suited for an office visit, the vast majority of behavioral health services can be delivered virtually.
To decide if your patient may benefit from behavioral health care, the primary care provider (PCP) can conduct a screening via telehealth. Once the screening is complete, the PCP can discuss results and refer the patient to a mental health professional – all via telehealth. While patients may be reluctant to receive behavioral health treatment, perhaps because of stigma or inexperience, they may appreciate the telemedicine option as they can remain in the comfort and familiarity of their homes.
Collaborative Care is both an in-person and virtual model that allows PCP practices to offer behavioral health services in a cost effective way by utilizing a psychiatrist as a “consultant” to the practice as opposed to hiring a full-time psychiatrist. All services within the Collaborative Care Model can be offered via telehealth, and all major insurance providers reimburse primary care providers for delivering Collaborative Care.
When PCPs provide behavioral health treatment as an “extension” of the primary care service offerings, the stigma is reduced and more patients are willing to accept the care they need.
Many areas of the country suffer from a lack of access to behavioral health specialists. In rural counties, for example, the nearest therapist may be located over an hour away. By integrating behavioral telehealth services into your practice’s offerings, you can remove geographic and transportation obstacles to care for your patient population.
Doing this can lead to providing more culturally competent care. It’s important that you’re able to offer mental health services to your patients from a professional with a similar ethnic or racial background. Language barriers and cultural differences may limit a provider’s ability to treat a patient, particularly if the patient faces health disparities related to race or ethnicity. If your practice needs to look outside of your community to tap into a more diverse pool of providers to better meet your patients’ needs, telehealth makes it easier to do that.
Adopting telemedicine for consultative patient visits offers primary care a path toward restoring patient volume and hope for a postpandemic future.
Mark Stephan, MD, is chief medical officer at Equality Health, a whole-health delivery system. He practiced family medicine for 19 years, including hospital medicine and obstetrics in rural and urban settings. Dr. Stephan has no conflicts related to the content of this piece.
How to effectively utilize this tool
How to effectively utilize this tool
By now it is well known that the COVID-19 pandemic has significantly disrupted primary care. Office visits and revenues have precipitously dropped as physicians and patients alike fear in-person visits may increase their risks of contracting the virus. However, telemedicine has emerged as a lifeline of sorts for many practices, enabling them to conduct visits and maintain contact with patients.
Telemedicine is likely to continue to serve as a tool for primary care providers to improve access to convenient, cost-effective, high-quality care after the pandemic. Another benefit of telemedicine is it can help maintain a portion of a practice’s revenue stream for physicians during uncertain times.
Indeed, the nation has seen recent progress toward telemedicine parity, which refers to the concept of reimbursing providers’ telehealth visits at the same rates as similar in-person visits.
A challenge to adopting telemedicine is that it calls for adjusting established workflows for in-person encounters. A practice cannot simply replicate in-person processes to work for telehealth. While both in-person and virtual visits require adherence to HIPAA, for example, how you actually protect patient privacy will call for different measures. Harking back to the early days of EMR implementation, one does not need to like the telemedicine platform or process, but come to terms with the fact that it is a tool that is here to stay to deliver patient care.
Treat your practice like a laboratory
Adoption may vary between practices depending on many factors, including clinicians’ comfort with technology, clinical tolerance and triage rules for nontouch encounters, state regulations, and more. Every provider group should begin experimenting with telemedicine in specific ways that make sense for them.
One physician may practice telemedicine full-time while the rest abstain, or perhaps the practice prefers to offer telemedicine services during specific hours on specific days. Don’t be afraid to start slowly when you’re trying something new – but do get started with telehealth. It will increasingly be a mainstream medium and more patients will come to expect it.
Train the entire team
Many primary care practices do not enjoy the resources of an information technology team, so all team members essentially need to learn the new skill of telemedicine usage, in addition to assisting patients. That can’t happen without staff buy-in, so it is essential that everyone from the office manager to medical assistants have the training they need to make the technology work. Juggling schedules for telehealth and in-office, activating an account through email, starting and joining a telehealth meeting, and preparing a patient for a visit are just a handful of basic tasks your staff should be trained to do to contribute to the successful integration of telehealth.
Educate and encourage patients to use telehealth
While unfamiliarity with technology may represent a roadblock for some patients, others resist telemedicine simply because no one has explained to them why it’s so important and the benefits it can hold for them. Education and communication are critical, including the sometimes painstaking work of slowly walking patients through the process of performing important functions on the telemedicine app. By providing them with some friendly coaching, patients won’t feel lost or abandoned during what for some may be an unfamiliar and frustrating process.
Manage more behavioral health
Different states and health plans incentivize primary practices for integrating behavioral health into their offerings. Rather than dismiss this addition to your own practice as too cumbersome to take on, I would recommend using telehealth to expand behavioral health care services.
If your practice is working toward a team-based, interdisciplinary approach to care delivery, behavioral health is a critical component. While other elements of this “whole person” health care may be better suited for an office visit, the vast majority of behavioral health services can be delivered virtually.
To decide if your patient may benefit from behavioral health care, the primary care provider (PCP) can conduct a screening via telehealth. Once the screening is complete, the PCP can discuss results and refer the patient to a mental health professional – all via telehealth. While patients may be reluctant to receive behavioral health treatment, perhaps because of stigma or inexperience, they may appreciate the telemedicine option as they can remain in the comfort and familiarity of their homes.
Collaborative Care is both an in-person and virtual model that allows PCP practices to offer behavioral health services in a cost effective way by utilizing a psychiatrist as a “consultant” to the practice as opposed to hiring a full-time psychiatrist. All services within the Collaborative Care Model can be offered via telehealth, and all major insurance providers reimburse primary care providers for delivering Collaborative Care.
When PCPs provide behavioral health treatment as an “extension” of the primary care service offerings, the stigma is reduced and more patients are willing to accept the care they need.
Many areas of the country suffer from a lack of access to behavioral health specialists. In rural counties, for example, the nearest therapist may be located over an hour away. By integrating behavioral telehealth services into your practice’s offerings, you can remove geographic and transportation obstacles to care for your patient population.
Doing this can lead to providing more culturally competent care. It’s important that you’re able to offer mental health services to your patients from a professional with a similar ethnic or racial background. Language barriers and cultural differences may limit a provider’s ability to treat a patient, particularly if the patient faces health disparities related to race or ethnicity. If your practice needs to look outside of your community to tap into a more diverse pool of providers to better meet your patients’ needs, telehealth makes it easier to do that.
Adopting telemedicine for consultative patient visits offers primary care a path toward restoring patient volume and hope for a postpandemic future.
Mark Stephan, MD, is chief medical officer at Equality Health, a whole-health delivery system. He practiced family medicine for 19 years, including hospital medicine and obstetrics in rural and urban settings. Dr. Stephan has no conflicts related to the content of this piece.
Health disparities training falls short for internal medicine residents
Less than half of internal medicine residency program directors report formal curricula on the topic of health disparities, according to findings of a survey of medical directors and residents across the United States.
Despite recommendations from the Institute of Medicine going back to 2002 calling for increased education on the topic for health care providers, data from a 2012 survey showed that only 17% of internal medicine programs had a health disparities curriculum, wrote Denise M. Dupras, MD, of the Mayo Medical School, Rochester, Minn., and colleagues.
To describe internal medicine residency training programs’ curricula and educational experiences on health disparities and to determine residents’ perceptions of training, the researchers designed a cross-sectional survey study including 227 program directors and 22,723 internal medicine residents. The survey was conducted from August to November 2015.
Overall, 91 program directors (40%) reported a curriculum in health disparities, but only 16 of them described the quality of their education as very good or excellent. In 56% of the programs, outcomes of the curriculum were not measured.
A majority (90%) of the programs included racial/ethnic diversity and socioeconomic status in their curricula, 58% included information about limited English proficiency, and 53% included information about gender identity and sexual orientation.
Reported barriers to curriculum development in 132 programs that did not have a health disparities curriculum included lack of time in the current curriculum, insufficient faculty skill to teach the topic, lack of institutional support, and lack of faculty interest, the researchers noted.
A total of 13,251 residents (70%) reported receiving some training in caring for patients at risk for health disparities over 3 years of training, and 10,494 (80%) of these rated the quality as very good or excellent. “Residents who cared for a larger proportion of underserved patients perceived that they received health disparities training at a higher rate,” the researchers wrote. However, increased care of at-risk populations does not necessarily translate into increased knowledge and skills. “Our finding that residents’ rating of the quality of their training was not associated with the presence of a curriculum in health disparities in their program also raises a concern that perceptions may overestimate the acquisition of needed skills,” they added.
The major limitation of the study was “that residents were not asked directly if they were exposed to a curriculum in health disparities but rather if they received training in the care of patients who would be at risk, which raises the concern that we cannot distinguish between their recognition of a formal and informal curriculum,” the researchers noted. In addition, the survey could not confirm that program directors were aware of all training. “Furthermore, because the survey items were embedded in larger program director survey, we were limited in the ability to ask them to define more specifically the components of their health disparities curricula,” they wrote.
However, the results were strengthened by the large and comprehensive study population, and highlight not only the need for standardized health disparities curricula, but also the need for research to determine the most effective domains for such curricula in graduate medical education, they emphasized.
“There are opportunities to explore partnerships among residencies, institutional clinical practices, and communities for productive collaborations around disparities-related quality improvement projects to address gaps in health care that are specific to the populations they serve,” they concluded.
The surveys were conducted in 2015 and the comparative work in 2018, prior to the COVID-19 pandemic and the subsequent increased concerns about disparities in health care, Dr. Dupras said in an interview.
“We conducted the survey because we recognized that health disparities were still prevalent in our society despite calls to improve the education of our learners to address them. We wanted to determine what our programs were providing for educational curriculum and what our learners were experiencing,” she said.
“We did not know what the surveys would show, so I cannot say that we were surprised by the findings,” said Dr. Dupras. “One of the challenges in interpreting our results is inherent in studies that rely on surveys. We cannot know how those filling out the surveys interpret the questions.” The study results yield several messages.
“First, residency training programs have opportunities to do a better job in developing educational opportunities related to health disparities; second, residents learn in the context of care and we must optimize education around these experiences; third, every patient is different. It is time to move towards cultural humility, since the risk for disparities is not associated with one patient characteristic, but composed of multiple factors,” she said.
“Given that 5 years has passed since our original survey, it would be important to repeat the survey and consider expanding it to include other training programs that provide frontline care, such as family medicine and pediatrics,” Dr. Dupras noted.
Dr. Dupras and colleagues had no financial conflicts to disclose.
SOURCE: Dupras DM et al. JAMA Netw Open. 2020 Aug 10. doi: 10.1001/jamanetworkopen.2020.12757.
FROM JAMA NETWORK OPEN
Medicare sticks with E/M pay plan over some groups’ objections
The Trump administration is sticking with a plan to boost certain Medicare pay for many primary care and other specialties focused heavily on office visits while lowering that for other groups to balance these increased costs.
On Aug. 4, the Centers for Medicare & Medicaid Services posted on the Federal Register draft versions of two of its major annual payment measures: the physician fee schedule and the payment rule for hospital outpatient services. On Aug. 3, the CMS informally posted a copy of the physician fee schedule on its own website, allowing medical groups to begin reading the more than 1,300-page rule.
Federal officials normally use annual Medicare payment rules to make many revisions to policies as well as adjust reimbursement.
The draft 2021 physician fee schedule, for example, calls for broadening the authority of clinicians other than physicians to authorize testing of people enrolled in Medicare.
The CMS intends to allow nurse practitioners, physician assistants, and certain other health care professionals to more widely supervise diagnostic psychological and neuropsychological tests, in keeping with applicable state laws.
The draft 2021 hospital outpatient rule proposes a gradual changeover to allow more procedures to be performed on an outpatient basis. This shift could save money for Medicare as well as for the people enrolled in the giant federal health program who need these services, the CMS explained.
Medicare would begin with a change in status for almost 300 musculoskeletal-related services, making them eligible for payment in the hospital outpatient setting when appropriate, CMS wrote in a fact sheet.
The initial reaction to Medicare’s proposed 2021 rules centered on its planned redistribution of funds among medical specialties. The CMS had outlined this plan last year. It is part of longstanding efforts to boost pay for primary care specialists and other physicians whose practice centers more around office visits than procedures.
There is broad support in health policy circles for raising pay for these specialties, but there also are strong objections to the cuts the CMS plans to offset the cost of rising pay for some fields.
Susan R. Bailey, MD, president of the American Medical Association, addressed both of these ideas in an AMA news release on the proposed 2021 physician fee schedule. The increase in pay for office visits, covered under evaluation and management services (E/M), stems from recommendations on resource costs from the AMA/Specialty Society RVS Update Committee, Dr. Bailey said.
“Unfortunately, these office visit payment increases, and a multitude of other new CMS proposed payment increases, are required by statute to be offset by payment reductions to other services, through an unsustainable reduction of nearly 11% to the Medicare conversion factor,” Dr. Bailey explained.
In the news release, Dr. Bailey asked Congress to waive Medicare’s budget-neutrality requirements to allow increases without the cuts.
“Physicians are already experiencing substantial economic hardships due to COVID-19, so these pay cuts could not come at a worse time,” she said.
Winners and losers
The CMS details the possible winners and losers in its payment reshuffle in Table 90 of the proposed 2021 physician fee schedule. In the proposed rule, CMS notes in the draft that these figures are based upon estimates of aggregate allowed charges across all services furnished by physicians and other clinicians.
“Therefore, they are averages, and may not necessarily be representative of what is happening to the particular services furnished by a single practitioner within any given specialty,” the CMS said.
Specialties in line for increases under the 2021 draft rule include allergy/immunology (9%), endocrinology (17%), family practice (13%), general practice (8%), geriatrics (4%), hematology/oncology (14%), internal medicine (4%), nephrology (6%), physician assistants (8%), psychiatry (8%), rheumatology (16%), and urology (8%).
In line for cuts would be anesthesiology (–8%), cardiac surgery (–9%), emergency medicine (–6%), general surgery (–7%), infectious disease (–4%), neurosurgery (–7%), physical/occupational therapy (–9%), plastic surgery (–7%), radiology (–11%), and thoracic surgery (–8%).
An umbrella group, the Surgical Care Coalition, on Aug. 3 had a quick statement ready about the CMS proposal. Writing on behalf of the group was David B. Hoyt, MD, executive director of the American College of Surgeons.
“Today’s proposed rule ignores both patients and the surgeons who care for them. The middle of a pandemic is no time for cuts to any form of health care, but today’s announcement moves ahead as if nothing has changed,” Hoyt said in the statement. “The Surgical Care Coalition believes no physician should see payment cuts that will reduce patients’ access to care.”
The Surgical Care Coalition already has been asking Congress to waive budget-neutrality requirements. Making a similar request Aug. 4 in a unified statement were the American Physical Therapy Association (APTA), the American Occupational Therapy Association (AOTA), and the American Speech-Language-Hearing Association (ASHA).
“Our organizations call on Congress and CMS to advance well-reasoned fee schedule payment policies and waive budget neutrality,” the groups said. “While APTA, AOTA, and ASHA do not oppose payment increases for primary care physicians, we believe these increases can be implemented without imposing payment reductions on other providers.”
A version of this article originally appeared on Medscape.com.
Septicemia first among hospital inpatient costs
according to a recent analysis from the Agency for Healthcare Research and Quality.
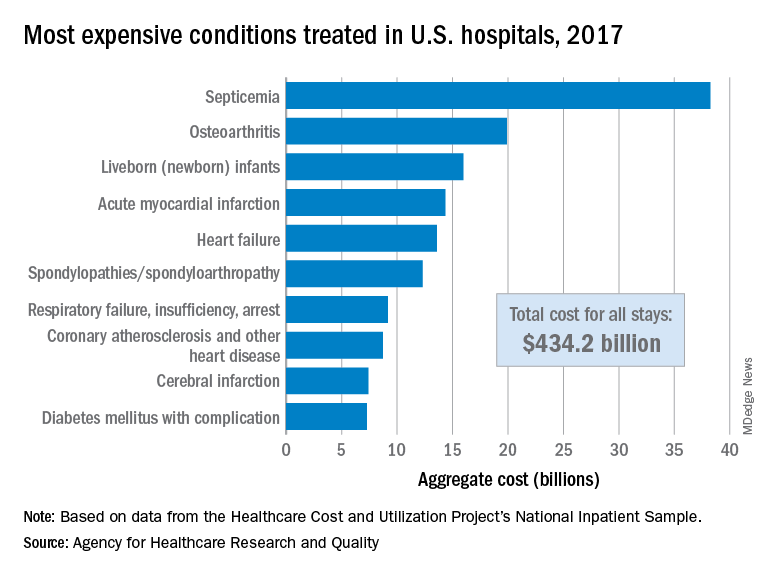
The single most expensive inpatient condition that year, representing about 8.8% of all hospital costs, was septicemia at $38.2 billion, nearly double the $19.9 billion spent on the next most expensive condition, osteoarthritis, Lan Liang, PhD, of the AHRQ, and associates said in a statistical brief.
These figures “represent the hospital’s costs to produce the services – not the amount paid for services by payers – and they do not include separately billed physician fees associated with the hospitalization,” they noted.
Third in overall cost for 2017 but first in total number of stays were live-born infants, with 3.7 million admissions costing just under $16 billion. Hospital costs for acute myocardial infarction ($14.3 billion) made it the fourth most expensive condition, with heart failure fifth at $13.6 billion, based on data from the Healthcare Cost and Utilization Project’s National Inpatient Sample.
The 20 most expensive conditions, which also included coronary atherosclerosis, pneumonia, renal failure, and lower-limb fracture, accounted for close to 47% of all hospital costs and over 43% of all stays in 2017. The total amount spent by hospitals that year, $1.1 trillion, constituted nearly a third of all health care expenditures and was 4.7% higher than in 2016, Dr. Liang and associates reported.
“Although this growth represented deceleration, compared with the 5.8% increase between 2014 and 2015, the consistent year-to-year rise in hospital-related expenses remains a central concern among policymakers,” they wrote.
according to a recent analysis from the Agency for Healthcare Research and Quality.
The single most expensive inpatient condition that year, representing about 8.8% of all hospital costs, was septicemia at $38.2 billion, nearly double the $19.9 billion spent on the next most expensive condition, osteoarthritis, Lan Liang, PhD, of the AHRQ, and associates said in a statistical brief.
These figures “represent the hospital’s costs to produce the services – not the amount paid for services by payers – and they do not include separately billed physician fees associated with the hospitalization,” they noted.
Third in overall cost for 2017 but first in total number of stays were live-born infants, with 3.7 million admissions costing just under $16 billion. Hospital costs for acute myocardial infarction ($14.3 billion) made it the fourth most expensive condition, with heart failure fifth at $13.6 billion, based on data from the Healthcare Cost and Utilization Project’s National Inpatient Sample.
The 20 most expensive conditions, which also included coronary atherosclerosis, pneumonia, renal failure, and lower-limb fracture, accounted for close to 47% of all hospital costs and over 43% of all stays in 2017. The total amount spent by hospitals that year, $1.1 trillion, constituted nearly a third of all health care expenditures and was 4.7% higher than in 2016, Dr. Liang and associates reported.
“Although this growth represented deceleration, compared with the 5.8% increase between 2014 and 2015, the consistent year-to-year rise in hospital-related expenses remains a central concern among policymakers,” they wrote.
The best and worst states for health care in 2020
according to the personal finance website WalletHub.
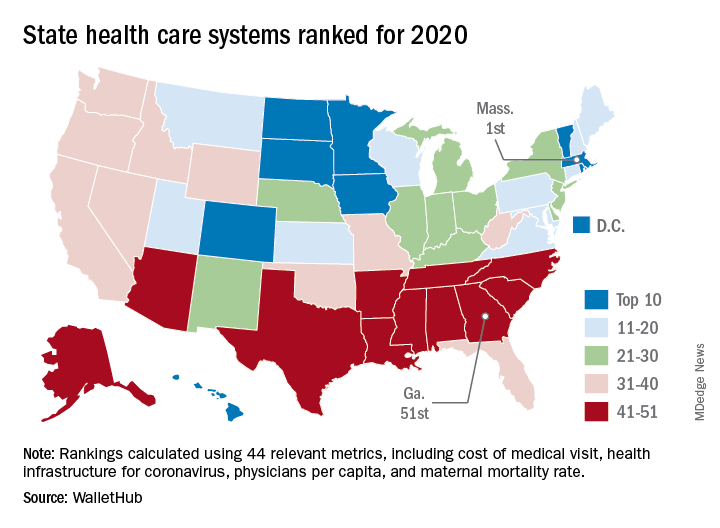
The Bay State finds itself at the top of the company’s annual ranking of state health care systems this year after finishing second in 2019 to Minnesota, which is now ranked second. Rhode Island is third this year, followed by Washington, D.C., and North Dakota, WalletHub reported Aug. 3.
The inclusion of Washington, D.C., allowed Georgia to finish 51st out of 50 states, just below the quartet of Louisiana (50th), Alabama (49th), North Carolina (48th), and Mississippi (47th). Alaska, which occupied the bottom spot in 2019, moved up to 42nd this year, the analysis showed.
The rankings are based on 44 (up from 43 last year) metrics that are grouped into three broad categories: cost (6 metrics), access (24 metrics), and outcomes (14 metrics). The one new measure added for 2020? That would be health infrastructure for coronavirus, which is itself based on a different WalletHub ranking.
Massachusetts’ top finish this year was driven by strong showings in such metrics as average monthly insurance premium (first), physicians per capita (second), insured children (first) and adults (first), and infant mortality rate (fourth). The state was 1st overall in outcomes and 4th in access but only 20th in cost, the company said.
Positive signs among the lowest-ranked states include Louisiana’s 18th-place finish in access, ahead of such top 10 states as Iowa and Hawaii, and Mississippi’s 17th in cost, which is higher than four of the states in the top 10, including Massachusetts, WalletHub said in the report.
Data for the analysis came from 22 different sources, including the Institute for Health Metrics and Evaluation, Centers for Medicare & Medicaid Services, Association of American Medical Colleges, and the American Telemedicine Association.
according to the personal finance website WalletHub.
The Bay State finds itself at the top of the company’s annual ranking of state health care systems this year after finishing second in 2019 to Minnesota, which is now ranked second. Rhode Island is third this year, followed by Washington, D.C., and North Dakota, WalletHub reported Aug. 3.
The inclusion of Washington, D.C., allowed Georgia to finish 51st out of 50 states, just below the quartet of Louisiana (50th), Alabama (49th), North Carolina (48th), and Mississippi (47th). Alaska, which occupied the bottom spot in 2019, moved up to 42nd this year, the analysis showed.
The rankings are based on 44 (up from 43 last year) metrics that are grouped into three broad categories: cost (6 metrics), access (24 metrics), and outcomes (14 metrics). The one new measure added for 2020? That would be health infrastructure for coronavirus, which is itself based on a different WalletHub ranking.
Massachusetts’ top finish this year was driven by strong showings in such metrics as average monthly insurance premium (first), physicians per capita (second), insured children (first) and adults (first), and infant mortality rate (fourth). The state was 1st overall in outcomes and 4th in access but only 20th in cost, the company said.
Positive signs among the lowest-ranked states include Louisiana’s 18th-place finish in access, ahead of such top 10 states as Iowa and Hawaii, and Mississippi’s 17th in cost, which is higher than four of the states in the top 10, including Massachusetts, WalletHub said in the report.
Data for the analysis came from 22 different sources, including the Institute for Health Metrics and Evaluation, Centers for Medicare & Medicaid Services, Association of American Medical Colleges, and the American Telemedicine Association.
Poll: Institutions should implement mandatory implicit bias training and policies for inclusion and diversity to address inequities in health care
[polldaddy:10586792]
[polldaddy:10586792]
[polldaddy:10586792]
The Role of Process Improvements in Reducing Heart Failure Readmissions
From the Department of Medicine, Division of Cardiology, Northwestern University Feinberg School of Medicine, Chicago, IL.
Objective: To review selected process-of-care interventions that can be applied both during the hospitalization and during the transitional care period to help address the persistent challenge of heart failure readmissions.
Methods: Review of the literature.
Results: Process-of-care interventions that can be implemented to reduce readmissions of heart failure patients include: accurately identifying heart failure patients; providing disease education; titrating guideline-directed medical therapy; ensuring discharge readiness; arranging close discharge follow-up; identifying and addressing social barriers; following up by telephone; using home health; and addressing comorbidities. Importantly, the heart failure hospitalization is an opportunity to set up outpatient success, and setting up feedback loops can aid in post-discharge monitoring.
Conclusion: We encourage teams to consider local capabilities when selecting processes to improve; begin by improving something small to build capacity and team morale, and continually iterate and reexamine processes, as health care systems are continually evolving.
Keywords: heart failure; process improvement; quality improvement; readmission; rehospitalization; transitional care.
The growing population of patients affected by heart failure continues to challenge health systems. The increasing prevalence is paralleled by the rising costs of managing heart failure, which are projected to grow from $30.7 billion in 2012 to $69.8 billion in 2030.1 A significant portion of these costs relate to readmission after an index heart failure hospitalization. The statistics are staggering: for patients hospitalized with heart failure, approximately 15% to 20% are readmitted within 30 days.2,3 Though recent temporal trends suggest a modest reduction in readmission rates, there is a concerning correlation with increasing mortality,3 and a recognition that readmission rate decreases may relate to subtle changes in coding-based risk adjustment.4 Despite these concerns, efforts to reduce readmissions after heart failure hospitalization command significant attention.
Process improvement methodologies may be helpful in reducing hospital readmissions. Various approaches have been employed, and results have been mixed. An analysis of 70 participating hospitals in the American Heart Association’s Get With the Guidelines initiative found that, while overall readmission rates declined by 1.0% over 3 years, only 1 hospital achieved a 20% reduction in readmission rates.5
It is notably difficult to reduce readmissions after heart failure hospitalization. One challenge is that patients with heart failure often have multiple comorbidities, and approximately 50% to 60% of 30-day readmissions after heart failure hospitalization arise from noncardiac causes.1 Another challenge is that a significant fraction of readmissions in general—perhaps 75%—may not be avoidable.6
Recent excellent systematic reviews and meta-analyses provide comprehensive overviews of process improvement strategies that can be used to reduce readmissions after heart failure hospitalizations.7-9 Yet despite this extensive knowledge, few reports discuss the process of actually implementing these changes: the process of process improvement. Here, we seek to not only highlight some of the most promising potential interventions to reduce heart failure readmissions, but also to discuss a process improvement framework to help engender success, using our experience as a case study. We schematize process improvement efforts as having several distinct phases (Figure 1): processes delivered during the hospitalization and prior to discharge; feedback loops set up to maintain clinical stability at home; and the postdischarge clinic visit as an opportunity to further stabilize the patient and advance the plan of care. The discussion of these interventions follows this organization.

During Hospitalization
The heart failure hospitalization can be used as an opportunity to set up outpatient success, with several goals to target during the index admission. One goal is identifying the root causes of the heart failure syndrome and correcting those root causes, if possible. For example, patients in whom the heart failure syndrome is secondary to valvular heart disease may benefit from transcatheter aortic valve replacement.10 Another clinical goal is decongesting the patient, which is associated with lower readmission rates.11,12 These goals focus on the medical aspects of heart failure care. However, beyond these medical aspects, a patient must be equipped to successfully manage the disease at home.
To support medical and nonmedical interventions for hospitalized heart failure patients, a critical first step is identifying patients with heart failure. This accomplishes at least 2 objectives. First, early identification allows early initiation of interventions, such as heart failure education and social work evaluation. Early initiation of these interventions allows sufficient time during the hospitalization to make meaningful progress on these fronts. Second, early identification allows an opportunity for the delivery of cardiology specialty care, which may help with identifying and correcting root causes of the heart failure syndrome. Such access to cardiology has been shown to improve inpatient mortality and readmission rates.13
In smaller hospitals, identification of patients with heart failure can be as simple as reviewing overnight admissions. More advanced strategies, such as screeners based on brain natriuretic peptide (BNP) levels and administration of intravenous diuretics, can be employed.14,15 In the near future, deep learning-based natural language processing will be applied to mine full-text data in the electronic health record to identify heart failure hospitalizations.16
In the hospital, patients can also receive education about heart failure disease management. This education is a cornerstone of reducing heart failure readmissions. A recent systematic review of nurse education interventions demonstrated reductions in readmissions, hospitalizations, and costs.17 However, the efficacy of heart failure education hinges on many other variables. For patients to adhere to water restriction and daily weights, for example, there must also be patient understanding, compliance, and accessibility to providers to recommend how to strike the fluid balance. Education is therefore necessary, but not sufficient, for setting up outpatient success.
The hospitalization also represents an important time to start or uptitrate guideline-directed medical therapy (GDMT) for heart failure. Doing so takes advantage of an important opportunity to reduce the risk of readmission and even reverse the disease process.18 Uptitration of GDMT in patients with heart failure with reduced ejection fraction is associated with a decreased risk of mortality, while discontinuation is associated with an increased risk of mortality.19 However, recent registry data indicate that intensity of GDMT is just as likely to be decreased as increased during the hospitalization.20 Nevertheless, predischarge initiation of medications may be associated with higher attained doses in follow-up.21
Preparing for Discharge
Preparing a patient for discharge after a heart failure hospitalization involves stabilizing the medical condition as well as ensuring that the patient and caregivers have the medication, equipment, and self-care resources at home necessary to manage the condition. Several frameworks have been put forth to help care teams analyze a patient’s readiness for discharge. One is the B-PREPARED score,22 a validated instrument to discriminate among patients with regard to their readiness to discharge from the hospital. This instrument highlights the importance of several key factors that should be addressed during the discharge process, including counseling and written instructions about medications and their side effects; information about equipment needs and community resources; and information on activity levels and restrictions. Nurse education and discharge coordination can improve patients’ perception of discharge readiness,23 although whether this discharge readiness translates into improved readmission rates appears to depend on the specific follow-up intervention design.9
Prior to discharge, it is important to arrange postdischarge follow-up appointments, as emphasized by the American College of Cardiology/American Heart Association (ACC/AHA) guidelines.24 The use of nurse navigators can help with planning follow-up appointments. For example, the ACC Patient Navigator Program was applied in a single-center study of 120 patients randomized to the program versus usual care.25 This study found a significant increase in patient education and follow-up appointments compared to usual care, and a numerical decrease in hospital readmissions, although the finding was not statistically significant.25
A third critical component of preparing for discharge is identifying and addressing social barriers to care. In a study of patients stratified by household income, patients in the lowest income quartile had a higher readmission rate than patients in the highest income quartile.26 Poverty also correlates with heart failure mortality.27 Social factors play an important role in many aspects of patients’ ability to manage their health, including self-care, medication adherence, and ability to follow-up. Identifying these social factors prior to discharge is the first step to addressing them. While few studies specifically address the role of social workers in the management of heart failure care, the general medical literature suggests that social workers embedded in transitional care teams can augment readmission reduction efforts.28
After Discharge
Patients recently discharged from the hospital who have not yet attended their postdischarge appointment are in an incredibly vulnerable phase of care. Patients who are discharged from the hospital may not yet be connected with outpatient care. During this initial transitional care period, feedback loops involving patient communication back to the clinic, and clinic communication back to the patient, are critical to helping patients remain stable. For example, consider monitoring weights daily after hospital discharge. A patient at home can report increasing weights to a provider, who can then recommend an increased dose of diuretic. The patient can complete the feedback loop by taking the extra medication and monitoring the return of weight back to normal.
While daily weight monitoring is a simple process improvement that relies on the principle of establishing feedback loops, many other strategies exist. One commonly employed tool is the postdischarge telephone follow-up call, which is often coupled with other interventions in a comprehensive care bundle.8 During the telephone call, several process-of-care defects can be corrected, including missing medications or missing information on appointment times.
Beyond the telephone, newer technologies show promise for helping develop feedback loops for patients at home. One such technology is telemonitoring, whereby physiologic information such as weight, heart rate, and blood pressure is collected and sent back to a monitoring center. While the principle holds promise, several studies have not demonstrated significantly different outcomes as compared to usual care.13,29 Another promising technology is the CardioMEMS device (Abbott, Inc., Atlanta, GA), which can remotely transmit the pulmonary artery pressure, a physiologic signal which correlates with volume overload. There is now strong evidence supporting the efficacy of pulmonary artery pressure–guided heart failure management.30,31
Finally, home visits can be an efficient way to communicate symptoms, enable clinical assessment, and provide recommendations. One program that implemented home visits, 24-hour nurses available by call, and telephone follow-up showed a statistically significant reduction in readmissions.32 Furthermore, a meta-analysis of randomized controlled trials comparing home health to usual care showed decreased readmissions and mortality.33 The efficacy may be in strengthening the feedback loop—home care improves compliance with weight monitoring, fluid restriction, and medications.34 These studies provide a strong rationale for the benefits of home health in stabilizing heart failure patients postdischarge. Indeed, nurse home visits were 1 of the 2 process interventions in a Cochrane review of randomized controlled trials that were shown to statistically significantly decrease readmissions and mortality.9 These data underscore the importance of feedback loops for helping ensure patients are clinically stable.
Postdischarge Follow-Up Clinic Visit
The first clinic appointment postdischarge is an important check-in to help advance patient care. Several key tasks can be achieved during the postdischarge visit. First, the patient can be clinically stabilized by adjusting diuretic therapy. If the patient is clinically stable, GDMT can be uptitrated. Second, education around symptoms, medications, diet, and exercise can be reinforced. Finally, clinicians can help connect patients to other members of the multidisciplinary care team, including specialist care, home health, or cardiac rehabilitation.
Achieving 7-day follow-up visits after discharge has been a point of emphasis in national guidelines.24 The ACC promotes a “See You in 7” challenge, advising that all patients discharged with a diagnosis of heart failure have a follow-up appointment within 7 days. Yet based on the latest available data, arrival rates to the postdischarge clinic are dismal, hovering around 30%.35 In a multicenter observational study of hospitals participating in the “See You in 7” collaborative, hospitals were able to increase their 7-day follow-up appointment rates by 2% to 3%, and also noted an absolute decrease in readmission rates by 1% to 2%.36 We have demonstrated, using a mathematical approach called queuing theory, that discharge appointment wait times and clinic access can be significantly improved by providing a modest capacity buffer to clinic availability.37 Those interested in applying this model to their own clinical practice may do so with a free online calculator at http://hfresearch.org.
Another important aspect of postdischarge follow-up is appropriate management of the comorbidity burden, which, as noted, is often significant in patients hospitalized with heart failure.38 For instance, in recent cohorts of hospitalized heart failure patients, the incidence of hypertension was 78%, coronary artery disease was more than 50%, atrial fibrillation was more than 40%, and diabetes was nearly 40%.39 Given this burden of comorbidity, it is not surprising that only 35% of readmissions after an index heart failure hospitalization are for recurrent heart failure.40 Coordinating care among primary care physicians and relevant subspecialists is thus essential. Phone calls and secure electronic messages are very helpful in achieving this. There is increasing interest in more nimble care models, such as the patient-centered specialty practice41 or the dyspnea clinic, to help bring coordinated resources to the patient.42
Process of Process Improvement: Our Experiences
The previous sections outline a series of potential process improvements clinical teams and health systems can implement to impact heart failure readmissions. A plan on paper, however, does not equal a plan in actuality. How does one go about implementing these changes? We offer our local experience starting a heart failure transitional care program as a case study, then draw lessons learned as a set of practical tips for local teams to employ. What we hope to highlight is that there is a large difference between a completed process for transitional care of heart failure patients, and the process of developing that process itself. The former is the hardware, the latter is the software. The latter does not typically get highlighted, but it is absolutely critical to unlocking the capabilities of a team and the institution.
In 2015, Northwestern Memorial Hospital adopted a novel payment arrangement from the Center for Medicare and Medicaid Services for Medicare patients being discharged from the hospital with heart failure. Known as Bundled Payments for Care Improvement,43 this bundled payment model incentivized Northwestern Memorial Hospital charge, principally by reducing hospital readmissions and by collaborating with skilled nursing facilities to control length of stay.
We approached this problem by drawing on the available literature,44,45 and by first creating a schematic of our high-level approach, which comprised 3 major elements (Figure 2): identification of hospitalized heart failure patients, delivery of a care bundle to hospitalized heart failure patients in hospital, and coordinating postdischarge care, centered on a telephone call and a postdischarge visit.

We then proceeded by building out, in stepwise fashion, each component of our value chain, using Agile techniques as a guiding principle.46 Agile, a productivity and process improvement mindset with roots in software development, emphasizes tackling 1 problem at a time, building out new features sequentially and completely, recognizing that the end user does not derive value from a program until new functionality is available for use. Rather than wholesale monolithic change, Agile emphasizes rapid iteration, prototyping, and discarding innovations not found to be helpful. The notion is to stand up new, incremental features rapidly, with each incremental improvement delivering value and helping to accelerate overall change.
Our experience building a robust way to identify heart failure cases is a good example of Agile process improvement in practice. At our hospital, identification of patients with heart failure was a challenge because more than half of heart failure patients are admitted to noncardiology floors. We developed a simple electronic health record query to detect heart failure patients, relying on parameters such as administration of intravenous diuretic or levels of BNP exceeding 100 ng/dL. We deployed this query, finding very high sensitivity for detection of heart failure patients.14 Patients found to have heart failure were then populated into a list in the electronic health record, which made patients’ heart failure status visible to all members of the health care team. Using this list, we were able to automate several processes necessary for heart failure care. For example, the list made it possible for cardiologists to know if there was a patient who perhaps needed cardiology consultation. Nurse navigators could know which patients needed heart failure education without having to be actively consulted by the admitting team. The same nurse navigators could then know upon discharge which patients needed a follow-up telephone call at 48 hours.
This list of heart failure patients was the end product, which was built through prototyping and iteration. For example, with our initial BNP cutoff of 300 ng/dL, we recognized we were missing several cases, and lowered the cutoff for the screener to 100 ng/dL. When we were satisfied this process was working well, we moved on to the next problem to tackle, avoiding trying to work on too many things at once. By doing so, we were able to focus our process improvement resources on 1 problem at a time, building up a suite of interventions. For our hospital, we settled on a bundle of interventions, captured by the mnemonic HEART:
Heart doctor sees patient in the hospital
Education about heart failure in the hospital
After-visit summary with 7-day appointment printed
Reach out to the patient by telephone within 72 hours
Treat the patient in clinic by the 7-day visit
Conclusion
We would like to emphasize that the elements of our heart failure readmissions interventions were not all put in place at once. This was an iterative process that proceeded in a stepwise fashion, with each step improving the care of our patients. We learned a number of lessons from our experience. First, we would advise that teams not try to do everything. One program simply cannot implement all possible readmission reduction interventions, and certainly not all at once. Trade-offs should be made, and interventions more likely to succeed in the local environment should be prioritized. In addition, interventions that do not fit and do not create synergy with the local practice environment should not be pursued.
Second, we would advise teams to start small, tackling a known problem in heart failure transitions of care first. This initial intuition is often right. An example might be improving 7-day appointments upon discharge. Starting with a problem that can be tackled builds process improvement muscle and improves team morale. Third, we would advise teams to consistently iterate on designs, tweaking and improving performance. Complex organizations always evolve; processes that work 1 year may fail the next because another element of the organization may have changed.
Finally, the framework presented in Figure 1 may be helpful in guiding how to structure interventions. Considering interventions to be delivered in the hospital, interventions to be delivered in the clinic, and how to set up feedback loops to support patients as outpatients help develop a comprehensive heart failure readmissions reduction program.
Corresponding author: R. Kannan Mutharasan, MD, Northwestern University Feinberg School of Medicine, 676 North Saint Clair St., Arkes Pavilion, Suite 7-038, Chicago, IL 60611;kannanm@northwestern.edu.
Financial disclosures: None.
1. Ziaeian B, Fonarow GC. The prevention of hospital readmissions in heart failure. Prog Cardiovasc Dis. 2016;58:379-385.
2. Kwok CS, Seferovic PM, Van Spall HG, et al. Early unplanned readmissions after admission to hospital with heart failure. Am J Cardiol. 2019;124:736-745.
3. Fonarow GC, Konstam MA, Yancy CW. The hospital readmission reduction program is associated with fewer readmissions, more deaths: time to reconsider. J Am Coll Cardiol. 2017;70:1931-1934.
4. Ody C, Msall L, Dafny LS, et al. Decreases in readmissions credited to medicare’s program to reduce hospital readmissions have been overstated. Health Aff (Millwood). 2019;38:36-43.
5. Bergethon KE, Ju C, DeVore AD, et al. Trends in 30-day readmission rates for patients hospitalized with heart failure: findings from the Get With The Guidelines-Heart Failure Registry. Circ Heart Fail. 2016;9.
6. van Walraven C, Jennings A, Forster AJ. A meta-analysis of hospital 30-day avoidable readmission rates. J Eval Clin Pract. 2012;18(6):1211-1218.
7. Albert NM. A systematic review of transitional-care strategies to reduce rehospitalization in patients with heart failure. Heart Lung. 2016;45:100-113.
8. Takeda A, Martin N, Taylor RS, Taylor SJ. Disease management interventions for heart failure. Cochrane Database Syst Rev. 2019;1:CD002752.
9. Van Spall HGC, Rahman T, Mytton O, et al. Comparative effectiveness of transitional care services in patients discharged from the hospital with heart failure: a systematic review and network meta-analysis. Eur J Heart Fail. 2017;19:1427-1443.
10. Reardon MJ, Van Mieghem NM, Popma JJ, et al. Surgical or transcatheter aortic-valve replacement in intermediate-risk patients. N Engl J Med. 2017;376:1321-1331.
11. Lala A, McNulty SE, Mentz RJ, et al. Relief and recurrence of congestion during and after hospitalization for acute heart failure: insights from Diuretic Optimization Strategy Evaluation in Acute Decompensated Heart Failure (DOSE-AHF) and Cardiorenal Rescue Study in Acute Decompensated Heart Failure (CARESS-HF). Circ Heart Fail. 2015;8:741-748.
12. Ambrosy AP, Pang PS, Khan S, et al. Clinical course and predictive value of congestion during hospitalization in patients admitted for worsening signs and symptoms of heart failure with reduced ejection fraction: findings from the EVEREST trial. Eur Heart J. 2013;34:835-843.
13. Driscoll A, Meagher S, Kennedy R, et al. What is the impact of systems of care for heart failure on patients diagnosed with heart failure: a systematic review. BMC Cardiovasc Disord. 2016;16(1):195.
14. Ahmad FS, Wehbe RM, Kansal P, et al. Targeting the correct population when designing transitional care programs for medicare patients hospitalized with heart failure. JAMA Cardiol. 2017;2:1274-1275.
15. Blecker S, Sontag D, Horwitz LI, et al. Early identification of patients with acute decompensated heart failure. J Card Fail. 2018;24:357-362.
16. Lee J, Yoon W, Kim S, et al. BioBERT: a pre-trained biomedical language representation model for biomedical text mining. Bioinformatics. 2020;36:1234-1240.
17. Rice H, Say R, Betihavas V. The effect of nurse-led education on hospitalisation, readmission, quality of life and cost in adults with heart failure. A systematic review. Patient Educ Couns. 2018;101:363-374.
18. Hollenberg SM, Warner Stevenson L, Ahmad T, et al. 2019 ACC expert consensus decision pathway on risk assessment, management, and clinical trajectory of patients hospitalized with heart failure: A report of the American College of Cardiology Solution Set Oversight Committee. J Am Coll Cardiol. 2019;74:1966-2011.
19. Tran RH, Aldemerdash A, Chang P, et al. Guideline-directed medical therapy and survival following hospitalization in patients with heart failure. Pharmacotherapy. 2018;38:406-416.
20. Greene SJ, Fonarow GC, DeVore AD, et al. Titration of medical therapy for heart failure with reduced ejection fraction. J Am Coll Cardiol. 2019;73:2365-2383.
21. Gattis WA, O’Connor CM, Gallup DS, et al;, IMPACT-HF Investigators and Coordinators. Predischarge initiation of carvedilol in patients hospitalized for decompensated heart failure: results of the Initiation Management Predischarge: Process for Assessment of Carvedilol Therapy in Heart Failure (IMPACT-HF) trial. J Am Coll Cardiol. 2004;43:1534-1541.
22. Graumlich JF, Novotny NL, Aldag JC. Brief scale measuring patient preparedness for hospital discharge to home: Psychometric properties. J Hosp Med. 2008;3:446-454.
23. Van Spall HGC, Lee SF, Xie F, et al. Effect of patient-centered transitional care services on clinical outcomes in patients hospitalized for heart failure: The PACT-HF Randomized Clinical Trial. JAMA. 2019;321:753-761.
24. Yancy CW, Jessup M, Bozkurt B, et al. 2013 ACCF/AHA guideline for the management of heart failure: a report of the American College of Cardiology Foundation/American Heart Association Task Force on practice guidelines. Circulation. 2013;128:e240-327.
25. Di Palo KE, Patel K, Assafin M, Piña IL. Implementation of a patient navigator program to reduce 30-day heart failure readmission rate. Prog Cardiovasc Dis. 2017;60:259-266.
26. Patil S, Shah M, Patel B, et al. Readmissions among patients admitted with acute decompensated heart failure based on income quartiles. Mayo Clin Proc. 2019;94:1939-1950.
27. Ahmad K, Chen EW, Nazir U, et al. Regional variation in the association of poverty and heart failure mortality in the 3135 counties of the united states. J Am Heart Assoc. 2019;8:e012422.
28. Bellon JE, Bilderback A, Ahuja-Yende NS, et al. University of Pittsburgh medical center home transitions multidisciplinary care coordination reduces readmissions for older adults. J Am Geriatr Soc. 2019;67:156-163.
29. Rosen D, McCall JD, Primack BA. Telehealth protocol to prevent readmission among high-risk patients with congestive heart failure. Am J Med. 2017;130:1326-1330.
30. Heywood JT, Jermyn R, Shavelle D, et al. Impact of practice-based management of pulmonary artery pressures in 2000 patients implanted with the CardioMEMS sensor. Circulation. 2017;135:1509-1517.
31. Abraham WT, Adamson PB, Bourge RC, et al. Wireless pulmonary artery haemodynamic monitoring in chronic heart failure: a randomised controlled trial. Lancet. 2011;377:658-666.
32. Drozda JP, Smith DA, Freiman PC, et al. Heart failure readmission reduction. Am J Med Qual. 2017;32:134-140.
33. Malik AH, Malik SS, Aronow WS; MAGIC (Meta-analysis And oriGinal Investigation in Cardiology) investigators. Effect of home-based follow-up intervention on readmissions and mortality in heart failure patients: a meta-analysis. Future Cardiol. 2019;15:377-386.
34. Strano A, Briggs A, Powell N, et al. Home healthcare visits following hospital discharge: does the timing of visits affect 30-day hospital readmission rates for heart failure patients? Home Healthc Now. 2019;37:152-157.
35. DeVore AD, Cox M, Eapen ZJ, et al. Temporal trends and variation in early scheduled follow-up after a hospitalization for heart failure: findings from get with the guidelines-heart failure. Circ Heart Fail. 2016;9.
36. Baker H, Oliver-McNeil S, Deng L, Hummel SL. Regional hospital collaboration and outcomes in medicare heart failure patients: see you in 7. JACC Heart Fail. 2015;3:765-773.
37. Mutharasan RK, Ahmad FS, Gurvich I, et al. Buffer or suffer: redesigning heart failure postdischarge clinic using queuing theory. Circ Cardiovasc Qual Outcomes. 2018;11:e004351.
38. Ziaeian B, Hernandez AF, DeVore AD, et al. Long-term outcomes for heart failure patients with and without diabetes: From the Get With The Guidelines-Heart Failure Registry. Am Heart J. 2019;211:1-10.
39. Greene SJ, Butler J, Albert NM, et al. Medical therapy for heart failure with reduced ejection fraction: The CHAMP-HF Registry. J Am Coll Cardiol. 2018;72:351-366.
40. Dharmarajan K, Hsieh AF, Lin Z, et al. Diagnoses and timing of 30-day readmissions after hospitalization for heart failure, acute myocardial infarction, or pneumonia. JAMA. 2013;309:355-363.
41. Ward L, Powell RE, Scharf ML, et al. Patient-centered specialty practice: defining the role of specialists in value-based health care. Chest. 2017;151:930-935.
42. Ryan JJ, Waxman AB. The dyspnea clinic. Circulation. 2018;137:1994-1996.
43. Oseran AS, Howard SE, Blumenthal DM. Factors associated with participation in cardiac episode payments included in medicare’s bundled payments for care improvement initiative. JAMA Cardiol. 2018;3:761-766.
44. Takeda A, Taylor SJC, Taylor RS, et al. Clinical service organisation for heart failure. Cochrane Database Syst Rev. 2012;(9):CD002752.
45. Albert NM, Barnason S, Deswal A, et al. Transitions of care in heart failure: a scientific statement from the American Heart Association. Circ Heart Fail. 2015;8:384-409.
46. Manifesto for Agile Software Development. http://agilemanifesto.org/ Accessed March 6, 2020.
From the Department of Medicine, Division of Cardiology, Northwestern University Feinberg School of Medicine, Chicago, IL.
Objective: To review selected process-of-care interventions that can be applied both during the hospitalization and during the transitional care period to help address the persistent challenge of heart failure readmissions.
Methods: Review of the literature.
Results: Process-of-care interventions that can be implemented to reduce readmissions of heart failure patients include: accurately identifying heart failure patients; providing disease education; titrating guideline-directed medical therapy; ensuring discharge readiness; arranging close discharge follow-up; identifying and addressing social barriers; following up by telephone; using home health; and addressing comorbidities. Importantly, the heart failure hospitalization is an opportunity to set up outpatient success, and setting up feedback loops can aid in post-discharge monitoring.
Conclusion: We encourage teams to consider local capabilities when selecting processes to improve; begin by improving something small to build capacity and team morale, and continually iterate and reexamine processes, as health care systems are continually evolving.
Keywords: heart failure; process improvement; quality improvement; readmission; rehospitalization; transitional care.
The growing population of patients affected by heart failure continues to challenge health systems. The increasing prevalence is paralleled by the rising costs of managing heart failure, which are projected to grow from $30.7 billion in 2012 to $69.8 billion in 2030.1 A significant portion of these costs relate to readmission after an index heart failure hospitalization. The statistics are staggering: for patients hospitalized with heart failure, approximately 15% to 20% are readmitted within 30 days.2,3 Though recent temporal trends suggest a modest reduction in readmission rates, there is a concerning correlation with increasing mortality,3 and a recognition that readmission rate decreases may relate to subtle changes in coding-based risk adjustment.4 Despite these concerns, efforts to reduce readmissions after heart failure hospitalization command significant attention.
Process improvement methodologies may be helpful in reducing hospital readmissions. Various approaches have been employed, and results have been mixed. An analysis of 70 participating hospitals in the American Heart Association’s Get With the Guidelines initiative found that, while overall readmission rates declined by 1.0% over 3 years, only 1 hospital achieved a 20% reduction in readmission rates.5
It is notably difficult to reduce readmissions after heart failure hospitalization. One challenge is that patients with heart failure often have multiple comorbidities, and approximately 50% to 60% of 30-day readmissions after heart failure hospitalization arise from noncardiac causes.1 Another challenge is that a significant fraction of readmissions in general—perhaps 75%—may not be avoidable.6
Recent excellent systematic reviews and meta-analyses provide comprehensive overviews of process improvement strategies that can be used to reduce readmissions after heart failure hospitalizations.7-9 Yet despite this extensive knowledge, few reports discuss the process of actually implementing these changes: the process of process improvement. Here, we seek to not only highlight some of the most promising potential interventions to reduce heart failure readmissions, but also to discuss a process improvement framework to help engender success, using our experience as a case study. We schematize process improvement efforts as having several distinct phases (Figure 1): processes delivered during the hospitalization and prior to discharge; feedback loops set up to maintain clinical stability at home; and the postdischarge clinic visit as an opportunity to further stabilize the patient and advance the plan of care. The discussion of these interventions follows this organization.
During Hospitalization
The heart failure hospitalization can be used as an opportunity to set up outpatient success, with several goals to target during the index admission. One goal is identifying the root causes of the heart failure syndrome and correcting those root causes, if possible. For example, patients in whom the heart failure syndrome is secondary to valvular heart disease may benefit from transcatheter aortic valve replacement.10 Another clinical goal is decongesting the patient, which is associated with lower readmission rates.11,12 These goals focus on the medical aspects of heart failure care. However, beyond these medical aspects, a patient must be equipped to successfully manage the disease at home.
To support medical and nonmedical interventions for hospitalized heart failure patients, a critical first step is identifying patients with heart failure. This accomplishes at least 2 objectives. First, early identification allows early initiation of interventions, such as heart failure education and social work evaluation. Early initiation of these interventions allows sufficient time during the hospitalization to make meaningful progress on these fronts. Second, early identification allows an opportunity for the delivery of cardiology specialty care, which may help with identifying and correcting root causes of the heart failure syndrome. Such access to cardiology has been shown to improve inpatient mortality and readmission rates.13
In smaller hospitals, identification of patients with heart failure can be as simple as reviewing overnight admissions. More advanced strategies, such as screeners based on brain natriuretic peptide (BNP) levels and administration of intravenous diuretics, can be employed.14,15 In the near future, deep learning-based natural language processing will be applied to mine full-text data in the electronic health record to identify heart failure hospitalizations.16
In the hospital, patients can also receive education about heart failure disease management. This education is a cornerstone of reducing heart failure readmissions. A recent systematic review of nurse education interventions demonstrated reductions in readmissions, hospitalizations, and costs.17 However, the efficacy of heart failure education hinges on many other variables. For patients to adhere to water restriction and daily weights, for example, there must also be patient understanding, compliance, and accessibility to providers to recommend how to strike the fluid balance. Education is therefore necessary, but not sufficient, for setting up outpatient success.
The hospitalization also represents an important time to start or uptitrate guideline-directed medical therapy (GDMT) for heart failure. Doing so takes advantage of an important opportunity to reduce the risk of readmission and even reverse the disease process.18 Uptitration of GDMT in patients with heart failure with reduced ejection fraction is associated with a decreased risk of mortality, while discontinuation is associated with an increased risk of mortality.19 However, recent registry data indicate that intensity of GDMT is just as likely to be decreased as increased during the hospitalization.20 Nevertheless, predischarge initiation of medications may be associated with higher attained doses in follow-up.21
Preparing for Discharge
Preparing a patient for discharge after a heart failure hospitalization involves stabilizing the medical condition as well as ensuring that the patient and caregivers have the medication, equipment, and self-care resources at home necessary to manage the condition. Several frameworks have been put forth to help care teams analyze a patient’s readiness for discharge. One is the B-PREPARED score,22 a validated instrument to discriminate among patients with regard to their readiness to discharge from the hospital. This instrument highlights the importance of several key factors that should be addressed during the discharge process, including counseling and written instructions about medications and their side effects; information about equipment needs and community resources; and information on activity levels and restrictions. Nurse education and discharge coordination can improve patients’ perception of discharge readiness,23 although whether this discharge readiness translates into improved readmission rates appears to depend on the specific follow-up intervention design.9
Prior to discharge, it is important to arrange postdischarge follow-up appointments, as emphasized by the American College of Cardiology/American Heart Association (ACC/AHA) guidelines.24 The use of nurse navigators can help with planning follow-up appointments. For example, the ACC Patient Navigator Program was applied in a single-center study of 120 patients randomized to the program versus usual care.25 This study found a significant increase in patient education and follow-up appointments compared to usual care, and a numerical decrease in hospital readmissions, although the finding was not statistically significant.25
A third critical component of preparing for discharge is identifying and addressing social barriers to care. In a study of patients stratified by household income, patients in the lowest income quartile had a higher readmission rate than patients in the highest income quartile.26 Poverty also correlates with heart failure mortality.27 Social factors play an important role in many aspects of patients’ ability to manage their health, including self-care, medication adherence, and ability to follow-up. Identifying these social factors prior to discharge is the first step to addressing them. While few studies specifically address the role of social workers in the management of heart failure care, the general medical literature suggests that social workers embedded in transitional care teams can augment readmission reduction efforts.28
After Discharge
Patients recently discharged from the hospital who have not yet attended their postdischarge appointment are in an incredibly vulnerable phase of care. Patients who are discharged from the hospital may not yet be connected with outpatient care. During this initial transitional care period, feedback loops involving patient communication back to the clinic, and clinic communication back to the patient, are critical to helping patients remain stable. For example, consider monitoring weights daily after hospital discharge. A patient at home can report increasing weights to a provider, who can then recommend an increased dose of diuretic. The patient can complete the feedback loop by taking the extra medication and monitoring the return of weight back to normal.
While daily weight monitoring is a simple process improvement that relies on the principle of establishing feedback loops, many other strategies exist. One commonly employed tool is the postdischarge telephone follow-up call, which is often coupled with other interventions in a comprehensive care bundle.8 During the telephone call, several process-of-care defects can be corrected, including missing medications or missing information on appointment times.
Beyond the telephone, newer technologies show promise for helping develop feedback loops for patients at home. One such technology is telemonitoring, whereby physiologic information such as weight, heart rate, and blood pressure is collected and sent back to a monitoring center. While the principle holds promise, several studies have not demonstrated significantly different outcomes as compared to usual care.13,29 Another promising technology is the CardioMEMS device (Abbott, Inc., Atlanta, GA), which can remotely transmit the pulmonary artery pressure, a physiologic signal which correlates with volume overload. There is now strong evidence supporting the efficacy of pulmonary artery pressure–guided heart failure management.30,31
Finally, home visits can be an efficient way to communicate symptoms, enable clinical assessment, and provide recommendations. One program that implemented home visits, 24-hour nurses available by call, and telephone follow-up showed a statistically significant reduction in readmissions.32 Furthermore, a meta-analysis of randomized controlled trials comparing home health to usual care showed decreased readmissions and mortality.33 The efficacy may be in strengthening the feedback loop—home care improves compliance with weight monitoring, fluid restriction, and medications.34 These studies provide a strong rationale for the benefits of home health in stabilizing heart failure patients postdischarge. Indeed, nurse home visits were 1 of the 2 process interventions in a Cochrane review of randomized controlled trials that were shown to statistically significantly decrease readmissions and mortality.9 These data underscore the importance of feedback loops for helping ensure patients are clinically stable.
Postdischarge Follow-Up Clinic Visit
The first clinic appointment postdischarge is an important check-in to help advance patient care. Several key tasks can be achieved during the postdischarge visit. First, the patient can be clinically stabilized by adjusting diuretic therapy. If the patient is clinically stable, GDMT can be uptitrated. Second, education around symptoms, medications, diet, and exercise can be reinforced. Finally, clinicians can help connect patients to other members of the multidisciplinary care team, including specialist care, home health, or cardiac rehabilitation.
Achieving 7-day follow-up visits after discharge has been a point of emphasis in national guidelines.24 The ACC promotes a “See You in 7” challenge, advising that all patients discharged with a diagnosis of heart failure have a follow-up appointment within 7 days. Yet based on the latest available data, arrival rates to the postdischarge clinic are dismal, hovering around 30%.35 In a multicenter observational study of hospitals participating in the “See You in 7” collaborative, hospitals were able to increase their 7-day follow-up appointment rates by 2% to 3%, and also noted an absolute decrease in readmission rates by 1% to 2%.36 We have demonstrated, using a mathematical approach called queuing theory, that discharge appointment wait times and clinic access can be significantly improved by providing a modest capacity buffer to clinic availability.37 Those interested in applying this model to their own clinical practice may do so with a free online calculator at http://hfresearch.org.
Another important aspect of postdischarge follow-up is appropriate management of the comorbidity burden, which, as noted, is often significant in patients hospitalized with heart failure.38 For instance, in recent cohorts of hospitalized heart failure patients, the incidence of hypertension was 78%, coronary artery disease was more than 50%, atrial fibrillation was more than 40%, and diabetes was nearly 40%.39 Given this burden of comorbidity, it is not surprising that only 35% of readmissions after an index heart failure hospitalization are for recurrent heart failure.40 Coordinating care among primary care physicians and relevant subspecialists is thus essential. Phone calls and secure electronic messages are very helpful in achieving this. There is increasing interest in more nimble care models, such as the patient-centered specialty practice41 or the dyspnea clinic, to help bring coordinated resources to the patient.42
Process of Process Improvement: Our Experiences
The previous sections outline a series of potential process improvements clinical teams and health systems can implement to impact heart failure readmissions. A plan on paper, however, does not equal a plan in actuality. How does one go about implementing these changes? We offer our local experience starting a heart failure transitional care program as a case study, then draw lessons learned as a set of practical tips for local teams to employ. What we hope to highlight is that there is a large difference between a completed process for transitional care of heart failure patients, and the process of developing that process itself. The former is the hardware, the latter is the software. The latter does not typically get highlighted, but it is absolutely critical to unlocking the capabilities of a team and the institution.
In 2015, Northwestern Memorial Hospital adopted a novel payment arrangement from the Center for Medicare and Medicaid Services for Medicare patients being discharged from the hospital with heart failure. Known as Bundled Payments for Care Improvement,43 this bundled payment model incentivized Northwestern Memorial Hospital charge, principally by reducing hospital readmissions and by collaborating with skilled nursing facilities to control length of stay.
We approached this problem by drawing on the available literature,44,45 and by first creating a schematic of our high-level approach, which comprised 3 major elements (Figure 2): identification of hospitalized heart failure patients, delivery of a care bundle to hospitalized heart failure patients in hospital, and coordinating postdischarge care, centered on a telephone call and a postdischarge visit.
We then proceeded by building out, in stepwise fashion, each component of our value chain, using Agile techniques as a guiding principle.46 Agile, a productivity and process improvement mindset with roots in software development, emphasizes tackling 1 problem at a time, building out new features sequentially and completely, recognizing that the end user does not derive value from a program until new functionality is available for use. Rather than wholesale monolithic change, Agile emphasizes rapid iteration, prototyping, and discarding innovations not found to be helpful. The notion is to stand up new, incremental features rapidly, with each incremental improvement delivering value and helping to accelerate overall change.
Our experience building a robust way to identify heart failure cases is a good example of Agile process improvement in practice. At our hospital, identification of patients with heart failure was a challenge because more than half of heart failure patients are admitted to noncardiology floors. We developed a simple electronic health record query to detect heart failure patients, relying on parameters such as administration of intravenous diuretic or levels of BNP exceeding 100 ng/dL. We deployed this query, finding very high sensitivity for detection of heart failure patients.14 Patients found to have heart failure were then populated into a list in the electronic health record, which made patients’ heart failure status visible to all members of the health care team. Using this list, we were able to automate several processes necessary for heart failure care. For example, the list made it possible for cardiologists to know if there was a patient who perhaps needed cardiology consultation. Nurse navigators could know which patients needed heart failure education without having to be actively consulted by the admitting team. The same nurse navigators could then know upon discharge which patients needed a follow-up telephone call at 48 hours.
This list of heart failure patients was the end product, which was built through prototyping and iteration. For example, with our initial BNP cutoff of 300 ng/dL, we recognized we were missing several cases, and lowered the cutoff for the screener to 100 ng/dL. When we were satisfied this process was working well, we moved on to the next problem to tackle, avoiding trying to work on too many things at once. By doing so, we were able to focus our process improvement resources on 1 problem at a time, building up a suite of interventions. For our hospital, we settled on a bundle of interventions, captured by the mnemonic HEART:
Heart doctor sees patient in the hospital
Education about heart failure in the hospital
After-visit summary with 7-day appointment printed
Reach out to the patient by telephone within 72 hours
Treat the patient in clinic by the 7-day visit
Conclusion
We would like to emphasize that the elements of our heart failure readmissions interventions were not all put in place at once. This was an iterative process that proceeded in a stepwise fashion, with each step improving the care of our patients. We learned a number of lessons from our experience. First, we would advise that teams not try to do everything. One program simply cannot implement all possible readmission reduction interventions, and certainly not all at once. Trade-offs should be made, and interventions more likely to succeed in the local environment should be prioritized. In addition, interventions that do not fit and do not create synergy with the local practice environment should not be pursued.
Second, we would advise teams to start small, tackling a known problem in heart failure transitions of care first. This initial intuition is often right. An example might be improving 7-day appointments upon discharge. Starting with a problem that can be tackled builds process improvement muscle and improves team morale. Third, we would advise teams to consistently iterate on designs, tweaking and improving performance. Complex organizations always evolve; processes that work 1 year may fail the next because another element of the organization may have changed.
Finally, the framework presented in Figure 1 may be helpful in guiding how to structure interventions. Considering interventions to be delivered in the hospital, interventions to be delivered in the clinic, and how to set up feedback loops to support patients as outpatients help develop a comprehensive heart failure readmissions reduction program.
Corresponding author: R. Kannan Mutharasan, MD, Northwestern University Feinberg School of Medicine, 676 North Saint Clair St., Arkes Pavilion, Suite 7-038, Chicago, IL 60611;kannanm@northwestern.edu.
Financial disclosures: None.
1. Ziaeian B, Fonarow GC. The prevention of hospital readmissions in heart failure. Prog Cardiovasc Dis. 2016;58:379-385.
2. Kwok CS, Seferovic PM, Van Spall HG, et al. Early unplanned readmissions after admission to hospital with heart failure. Am J Cardiol. 2019;124:736-745.
3. Fonarow GC, Konstam MA, Yancy CW. The hospital readmission reduction program is associated with fewer readmissions, more deaths: time to reconsider. J Am Coll Cardiol. 2017;70:1931-1934.
4. Ody C, Msall L, Dafny LS, et al. Decreases in readmissions credited to medicare’s program to reduce hospital readmissions have been overstated. Health Aff (Millwood). 2019;38:36-43.
5. Bergethon KE, Ju C, DeVore AD, et al. Trends in 30-day readmission rates for patients hospitalized with heart failure: findings from the Get With The Guidelines-Heart Failure Registry. Circ Heart Fail. 2016;9.
6. van Walraven C, Jennings A, Forster AJ. A meta-analysis of hospital 30-day avoidable readmission rates. J Eval Clin Pract. 2012;18(6):1211-1218.
7. Albert NM. A systematic review of transitional-care strategies to reduce rehospitalization in patients with heart failure. Heart Lung. 2016;45:100-113.
8. Takeda A, Martin N, Taylor RS, Taylor SJ. Disease management interventions for heart failure. Cochrane Database Syst Rev. 2019;1:CD002752.
9. Van Spall HGC, Rahman T, Mytton O, et al. Comparative effectiveness of transitional care services in patients discharged from the hospital with heart failure: a systematic review and network meta-analysis. Eur J Heart Fail. 2017;19:1427-1443.
10. Reardon MJ, Van Mieghem NM, Popma JJ, et al. Surgical or transcatheter aortic-valve replacement in intermediate-risk patients. N Engl J Med. 2017;376:1321-1331.
11. Lala A, McNulty SE, Mentz RJ, et al. Relief and recurrence of congestion during and after hospitalization for acute heart failure: insights from Diuretic Optimization Strategy Evaluation in Acute Decompensated Heart Failure (DOSE-AHF) and Cardiorenal Rescue Study in Acute Decompensated Heart Failure (CARESS-HF). Circ Heart Fail. 2015;8:741-748.
12. Ambrosy AP, Pang PS, Khan S, et al. Clinical course and predictive value of congestion during hospitalization in patients admitted for worsening signs and symptoms of heart failure with reduced ejection fraction: findings from the EVEREST trial. Eur Heart J. 2013;34:835-843.
13. Driscoll A, Meagher S, Kennedy R, et al. What is the impact of systems of care for heart failure on patients diagnosed with heart failure: a systematic review. BMC Cardiovasc Disord. 2016;16(1):195.
14. Ahmad FS, Wehbe RM, Kansal P, et al. Targeting the correct population when designing transitional care programs for medicare patients hospitalized with heart failure. JAMA Cardiol. 2017;2:1274-1275.
15. Blecker S, Sontag D, Horwitz LI, et al. Early identification of patients with acute decompensated heart failure. J Card Fail. 2018;24:357-362.
16. Lee J, Yoon W, Kim S, et al. BioBERT: a pre-trained biomedical language representation model for biomedical text mining. Bioinformatics. 2020;36:1234-1240.
17. Rice H, Say R, Betihavas V. The effect of nurse-led education on hospitalisation, readmission, quality of life and cost in adults with heart failure. A systematic review. Patient Educ Couns. 2018;101:363-374.
18. Hollenberg SM, Warner Stevenson L, Ahmad T, et al. 2019 ACC expert consensus decision pathway on risk assessment, management, and clinical trajectory of patients hospitalized with heart failure: A report of the American College of Cardiology Solution Set Oversight Committee. J Am Coll Cardiol. 2019;74:1966-2011.
19. Tran RH, Aldemerdash A, Chang P, et al. Guideline-directed medical therapy and survival following hospitalization in patients with heart failure. Pharmacotherapy. 2018;38:406-416.
20. Greene SJ, Fonarow GC, DeVore AD, et al. Titration of medical therapy for heart failure with reduced ejection fraction. J Am Coll Cardiol. 2019;73:2365-2383.
21. Gattis WA, O’Connor CM, Gallup DS, et al;, IMPACT-HF Investigators and Coordinators. Predischarge initiation of carvedilol in patients hospitalized for decompensated heart failure: results of the Initiation Management Predischarge: Process for Assessment of Carvedilol Therapy in Heart Failure (IMPACT-HF) trial. J Am Coll Cardiol. 2004;43:1534-1541.
22. Graumlich JF, Novotny NL, Aldag JC. Brief scale measuring patient preparedness for hospital discharge to home: Psychometric properties. J Hosp Med. 2008;3:446-454.
23. Van Spall HGC, Lee SF, Xie F, et al. Effect of patient-centered transitional care services on clinical outcomes in patients hospitalized for heart failure: The PACT-HF Randomized Clinical Trial. JAMA. 2019;321:753-761.
24. Yancy CW, Jessup M, Bozkurt B, et al. 2013 ACCF/AHA guideline for the management of heart failure: a report of the American College of Cardiology Foundation/American Heart Association Task Force on practice guidelines. Circulation. 2013;128:e240-327.
25. Di Palo KE, Patel K, Assafin M, Piña IL. Implementation of a patient navigator program to reduce 30-day heart failure readmission rate. Prog Cardiovasc Dis. 2017;60:259-266.
26. Patil S, Shah M, Patel B, et al. Readmissions among patients admitted with acute decompensated heart failure based on income quartiles. Mayo Clin Proc. 2019;94:1939-1950.
27. Ahmad K, Chen EW, Nazir U, et al. Regional variation in the association of poverty and heart failure mortality in the 3135 counties of the united states. J Am Heart Assoc. 2019;8:e012422.
28. Bellon JE, Bilderback A, Ahuja-Yende NS, et al. University of Pittsburgh medical center home transitions multidisciplinary care coordination reduces readmissions for older adults. J Am Geriatr Soc. 2019;67:156-163.
29. Rosen D, McCall JD, Primack BA. Telehealth protocol to prevent readmission among high-risk patients with congestive heart failure. Am J Med. 2017;130:1326-1330.
30. Heywood JT, Jermyn R, Shavelle D, et al. Impact of practice-based management of pulmonary artery pressures in 2000 patients implanted with the CardioMEMS sensor. Circulation. 2017;135:1509-1517.
31. Abraham WT, Adamson PB, Bourge RC, et al. Wireless pulmonary artery haemodynamic monitoring in chronic heart failure: a randomised controlled trial. Lancet. 2011;377:658-666.
32. Drozda JP, Smith DA, Freiman PC, et al. Heart failure readmission reduction. Am J Med Qual. 2017;32:134-140.
33. Malik AH, Malik SS, Aronow WS; MAGIC (Meta-analysis And oriGinal Investigation in Cardiology) investigators. Effect of home-based follow-up intervention on readmissions and mortality in heart failure patients: a meta-analysis. Future Cardiol. 2019;15:377-386.
34. Strano A, Briggs A, Powell N, et al. Home healthcare visits following hospital discharge: does the timing of visits affect 30-day hospital readmission rates for heart failure patients? Home Healthc Now. 2019;37:152-157.
35. DeVore AD, Cox M, Eapen ZJ, et al. Temporal trends and variation in early scheduled follow-up after a hospitalization for heart failure: findings from get with the guidelines-heart failure. Circ Heart Fail. 2016;9.
36. Baker H, Oliver-McNeil S, Deng L, Hummel SL. Regional hospital collaboration and outcomes in medicare heart failure patients: see you in 7. JACC Heart Fail. 2015;3:765-773.
37. Mutharasan RK, Ahmad FS, Gurvich I, et al. Buffer or suffer: redesigning heart failure postdischarge clinic using queuing theory. Circ Cardiovasc Qual Outcomes. 2018;11:e004351.
38. Ziaeian B, Hernandez AF, DeVore AD, et al. Long-term outcomes for heart failure patients with and without diabetes: From the Get With The Guidelines-Heart Failure Registry. Am Heart J. 2019;211:1-10.
39. Greene SJ, Butler J, Albert NM, et al. Medical therapy for heart failure with reduced ejection fraction: The CHAMP-HF Registry. J Am Coll Cardiol. 2018;72:351-366.
40. Dharmarajan K, Hsieh AF, Lin Z, et al. Diagnoses and timing of 30-day readmissions after hospitalization for heart failure, acute myocardial infarction, or pneumonia. JAMA. 2013;309:355-363.
41. Ward L, Powell RE, Scharf ML, et al. Patient-centered specialty practice: defining the role of specialists in value-based health care. Chest. 2017;151:930-935.
42. Ryan JJ, Waxman AB. The dyspnea clinic. Circulation. 2018;137:1994-1996.
43. Oseran AS, Howard SE, Blumenthal DM. Factors associated with participation in cardiac episode payments included in medicare’s bundled payments for care improvement initiative. JAMA Cardiol. 2018;3:761-766.
44. Takeda A, Taylor SJC, Taylor RS, et al. Clinical service organisation for heart failure. Cochrane Database Syst Rev. 2012;(9):CD002752.
45. Albert NM, Barnason S, Deswal A, et al. Transitions of care in heart failure: a scientific statement from the American Heart Association. Circ Heart Fail. 2015;8:384-409.
46. Manifesto for Agile Software Development. http://agilemanifesto.org/ Accessed March 6, 2020.
A Multidisciplinary Ambulation Protocol to Reduce Postoperative Venous Thromboembolism After Colorectal Surgery
From the Department of Surgery, Washington University School of Medicine, St. Louis, MO.
Abstract
Background: Patients undergoing colorectal surgery are at high risk for postoperative venous thromboembolism (VTE). Early ambulation has been encouraged to lower rates of VTE, but evidence demonstrating its effectiveness outside of a bundle is limited.
Objective: To create a multidisciplinary ambulation protocol in an effort to reduce postoperative VTE.
Methods: A single-center, retrospective, comparative study of patients who underwent colectomy or proctectomy was conducted. Outcomes of patients operated on prior to protocol implementation were compared with a cohort after implementation. The intervention studied was the implementation of a multidisciplinary ambulation protocol. The primary endpoint was postoperative VTE.
Results: There was no difference between the pre-intervention group (n = 1762) and the postintervention group (n = 253) in terms of sex, race, origin, emergency status, operative time, and the majority of medical comorbidities (with the exception of smoking status and congestive heart failure). After the protocol was implemented, ambulation rates on postoperative days 0, 1, and 2 improved from 36.4%, 47.3%, and 50.2% to 36.8%, 74.7%, and 82.6%, respectively The VTE rate in the pre-intervention group was 2.7% versus a rate of 0.4% in the postintervention group (P = 0.02).
Conclusion: Creation of an ambulation protocol is associated with a significant reduction in VTE. Commitment from patients, families, nurses, physician extenders, and physicians is critical to the success of the program.
Keywords: VTE; pulmonary embolism; deep vein thrombosis; postoperative; quality improvement.
Postoperative venous thromboembolism (VTE) is a significant source of morbidity, mortality, and cost.1,2 Colorectal surgery patients are at particularly high risk for VTE due to positioning during surgery, pelvic dissection, and other conditions often found in these patients, such as cancer and inflammatory bowel disease.3 A National Surgical Quality Improvement Program (NSQIP) analysis demonstrated an overall rate of VTE in colorectal surgery patients of 2.4%, although other studies have demonstrated rates up to 9%, even in those receiving appropriate chemoprophylaxis.4-6 Many of these VTEs occur in the postdischarge setting. In a NSQIP study of colorectal surgery patients, the rate of VTE between discharge and 30 days was 0.47%.7 The cost burdenfor a postoperative VTE has been estimated to be more than $18,000.8
Studies from NSQIP have identified multiple factors associated with VTE in colorectal surgery patients, but NSQIP does not record ambulation as a standard variable.9 Multiple strategies have been implemented to reduce postoperative VTE. Often, these studies focus on increasing compliance with appropriate chemoprophylaxis, risk stratification, or bundling multiple strategies.10,11 However, despite the fact that postsurgical ambulation is widely encouraged and recommended by the American Society of Colon and Rectal Surgeons clinical practice guidelines, there is little evidence demonstrating the role of ambulation alone in the reduction of VTE.4,12 The purpose of this study was to create a multidisciplinary protocol to increase postoperative ambulation and evaluate its effect on VTE.
Methods
Setting
This study was conducted at a single academic tertiary care center.
Patients and Outcome Measures
All patients undergoing colectomy or proctectomy by surgeons in the section of colon and rectal surgery at a single institution between January 2011 and March 2017 were included. Colectomy and proctectomy were defined by CPT codes 44140, 44141, 44143, 44144, 44145, 44146, 44147, 44150, 44151, 44155, 44156, 44157, 44158, 44160, 44204, 44205, 44206, 44207, 44208, 44210, 44211, 44212, 44213, 45110, 45111, 45112, 45113, 45114, 45116, 45119, 45120, 45121, 45123, 45126, 45160, 45395, and 45397. The primary outcome of VTE within 30 days, including deep venous thrombosis (DVT) and pulmonary embolism (PE), was measured using institution-specific data from NSQIP in both the pre-intervention and postintervention setting. The occurrence of both DVT and PE in 1 patient was counted as a single event of VTE. Ambulation rate on postoperative day (POD) 0, 1, and 2 was calculated by NSQIP in the pre-intervention setting (our institution-specific NSQIP recorded ambulation data for an unrelated project) and by review of the electronic health record in the postintervention setting, as this institution-specific variable was no longer being collected. Ambulation was defined as getting out of bed and taking at least 1 step. The threshold for ambulating each day was once on POD 0 and twice on PODs 1 and 2. Patients with missing ambulation data were excluded from the analysis. Both prior to and throughout the intervention, all patients were given VTE chemoprophylaxis with either low-dose unfractionated heparin or low-molecular-weight heparin prior to induction of anesthesia, with chemoprophylaxis extending an additional 21 days after discharge (unless specifically contraindicated); sequential compression devices; and standard orders to ambulate 3 times daily from POD 0 as part of the standard Enhanced Recovery After Surgery protocol.
Analysis
Statistical analysis was performed using univariate analysis. Chi-square test and univariate logistic regression were used to determine the association between ambulation rates and VTE in the pre-intervention group. Chi-square test was also used to compare ambulation and VTE rates between the pre-intervention and postintervention groups. Plan-Do-Study-Act (PDSA) cycle fidelity (the degree to which a PDSA cycle is carried out in accordance with the guiding principles of its use) was measured by recording the ambulation rates both before and after the intervention.13 Statistical analysis was performed using SAS Version 9.4 (SAS Institute, Cary, NC). This study was reviewed by the Washington University School of Medicine Institutional Review Board and deemed to be quality improvement, not human subjects research, and therefore did not require formal approval.
Baseline Outcome Rates
A total of 1762 patients were identified during the pre-intervention period. The overall VTE rate in the pre-intervention group was 2.7% (n = 48), with 39 DVTs (2.2%) and 13 PEs (0.7%). Pre-intervention ambulation data were available on 590 patients. Baseline ambulation rates on PODs 0, 1, and 2 were 36.4% (213/590), 47.3% (279/590), and 50.2% (296/590), respectively. Patients who did not ambulate on POD 0 had a VTE rate of 4.3%, as compared to 0.9% in those who did ambulate (Table 1). Patients who did not ambulate twice on POD 1 had a VTE rate of 4.8%, compared to 1.1% in those who did ambulate (odds ratio [OR], 4.66; 95% confidence interval [CI], 1.34 to 16.28). Patients who did not ambulate twice on POD 2 had a VTE rate of 5.4%, compared to 0.7% in those who did. Finally, those who ambulated twice on both PODs 1 and 2 had a 0% rate of VTE, compared to 4.9% in those who did not ambulate on both PODs.

Ambulation Protocol
After baseline outcome rates had been established, a multidisciplinary team of medical assistants, nurses, nurse practitioners, and physicians worked together to identify all processes that involved postoperative ambulation. Given the significant differences in VTE rates between patients who ambulated and those that did not, we created a multidisciplinary ambulation protocol using the PDSA method.14 Multiple points of patient contact were chosen for intervention, and the ambulation protocol was implemented in June 2018 and continued for 7 months.
Patients were observed from their initial office visit with a surgeon, during the preoperative education encounter, and in the operating room and on the surgical ward until discharge. Representatives from multiple disciplines who encountered patients at various times in the process, including medical assistants, patient care technicians, nurses, nurse practitioners, physical therapists, and physicians, participated in a kick-off meeting to identify difficulties they encounter when encouraging patient ambulation. The following 4 areas were identified.
Barriers to Patient Ambulation
Patient Expectations. Patients did not appear to have a clear expectation of what their ambulation goals were postoperatively, despite the fact that each patient is given an operative pathway booklet that includes their goals for each day, including ambulation. The consensus was that patients were overwhelmed with the amount of information and, oftentimes, the severity of their diagnosis, so the information regarding ambulation was not retained. Nurses commented that patients frequently stated that they did not think their surgeon wanted them to get out of bed postoperatively.
Electronic Orders. There was confusion within the nursing staff regarding orders in the electronic health record compared to physician expectations. Orders stated patients should ambulate 3 times daily, but did not specify on which postoperative day this should start. Often, nursing verbal sign-out from the post-anesthesia care unit (PACU) would be an order for bedrest, despite no clear origin of this order. This created confusion among the nursing staff as to what the appropriate ambulation orders should be.
Nursing Workflow. The initial state of the nursing workflow was not conducive to evaluating for, or assisting with, ambulation. With no set time to assist and evaluate patients for ambulation, it turned into a task nurses needed to accomplish when they had extra time. With increasing demands of charting in the electronic health record, nurses often had to skip ambulation in order to accomplish other tasks.
Family Expectations. In addition to patient expectations, family members often had expectations that were not congruent with the planned postoperative course. Nurses stated family members would often tell them that they did not feel that their family member should be ambulating so soon after surgery. Often these family members had not attended preoperative education sessions with the patient. This was compounded by the uncertainty among the nursing staff regarding what exactly the ambulation orders were.
Interventions
Targeted interventions were created to address these 4 barriers to ambulation identified by staff.
Preoperative Education. Although all elective patients received a printed operative pathway booklet describing daily goals, including ambulation, patients still did not have a sufficient understanding of what was expected of them. The education session was modified to increase the time spent on both the expectation for and the rationale behind ambulation. That section of the education session ended with a verbal commitment and read-back of the expectations for ambulation by the patient.
Clarification of Electronic Orders. Postoperative orders within the colorectal standard pathway were changed, including specific time frames and frequency, to match the information provided in the patient education booklet. These orders were for ambulation within 4 hours of arrival to the floor, and the orders also noted that no patient should be on bedrest unless explicitly stated. From POD 1, all patients were to ambulate at least twice daily for the remainder of the hospital stay (patients were encouraged to walk 4 times daily, but we set a minimum expectation of twice daily for the order set). These orders were clarified with in-person meetings with the nursing staff and leadership from the PACU and the colorectal surgical ward.
Adjusted Nursing Workflow. Nurses were interviewed and asked to create a plan regarding how they could better incorporate ambulation into their daily workflow. Ambulation assessment was incorporated into the twice-per-shift recording of vital signs and patient safety assessment. This was recorded into the electronic health record at the same time as the patients’ vital signs. This allowed nurses to keep track of which patients would need extra assistance in ambulation and which patients were doing well on their own with the assistance of family. It also helped focus the resources of physical therapy and the single ambulation technician on the floor and to assist patients who needed more assistance.
Creation of Ambulation Encouragement Signs. The authors discovered that despite patients being told preoperatively about ambulation expectations, friends and family are not always included in these conversations. As nurses frequently cited both patients and family as reasons patients thought they should not walk, multiple signs inviting patients to take an active role in their recovery by ambulating were created and placed around the unit. The signs outlined the expectations of being out of bed and taking at least 1 step on the day of surgery and walking at least 4 times per day thereafter. In addition, we addressed frequently asked questions around issues such as walking with intravenous poles and urinary catheters. The posters were signed by all staff colorectal surgeons.
Results
Over the course of 7 months (June 2018 to December 2018), 253 postintervention patients were identified (Table 2). There was no difference between the pre-intervention group (n = 1762) and the postintervention group in terms of sex, race, origin, emergency status, operative time, and the majority of medical comorbidities (with the exception of smoking status and congestive heart failure). The postintervention group was slightly older (60 versus 57 years) and had a higher percentage of patients with an American Society of Anesthesiologists physical status score greater than 2 (66.8% versus 51.2%). The postintervention group also had higher rates of both malignancy (53.4% versus 33.3%) and inflammatory bowel disease (18.2% versus 14.4%).

The fidelity of the PDSA cycle was measured by pre-intervention and postintervention ambulation rates. Ambulation rates on POD 0, 1, and 2 improved from 36.4%, 47.3%, and 50.2% to 36.8%, 74.7%, and 82.6%, respectively (Table 3). The VTE rate decreased from 2.7% to 0.4% (P = 0.02), with 1 DVT and 0 PEs. It should be noted that the only patient who developed a VTE postintervention did not ambulate on PODs 0, 1, or 2.

Discussion
Postoperative VTE is a severe complication for postoperative colorectal surgery patients. Previous studies have demonstrated that increasing ambulation is associated with a lower rate of overall complications, and, when incorporated into a bundle, is associated with decreased rates of VTE.11,15 However, this is the first study to our knowledge demonstrating that creation of an ambulation protocol alone is associated with a decrease in VTE.
Analysis of pre-intervention data demonstrated a strong association between ambulation and an absence of VTE. No patient who ambulated on PODs 0, 1, and 2 developed a VTE. Based on those results, we moved forward with creating the ambulation protocol. While ambulation stayed stable on POD 0, there were 60% and 65% increases on PODs 1 and 2, respectively. Nurses cited late arrival to the floor for second and third start cases as the primary difficulty in getting patients to ambulate more on POD 0.
We believe the key to the success of the ambulation protocol was its multidisciplinary nature. Certainly, the easiest way to create an ambulation protocol is to change the postoperative orders to state patients must walk 4 times per day. However, if the nursing staff is unable or unwilling to carry out these orders, the orders serve little purpose. In order to make lasting changes, all stakeholders in the process must be identified. In our case, stakeholders included surgery and nursing leadership, surgeons, nurse practitioners, nurses, medical assistants, physical therapists, patient care technicians, and patients. This is where we utilized kaizen, a core principle of Lean methodology that empowers employees at the level of the work being carried out to propose ideas for improvement.16 From the beginning of the patient experience, the health care practitioners who were carrying out each step of the process were best able to identify the problems and create solutions. In addition, stakeholders were given regular updates regarding how their efforts were increasing ambulation rates and the results at the end of the study period.
This study also demonstrates that, in a health care system increasingly focused on both quality and cost, significant improvements in quality can be made without increasing cost or resource utilization. Early in the process, it was proposed that the only way to increase the ambulation rate would be to increase the number of physical therapists, nurses, and nursing assistants. However, after identifying the root causes of the problem, the solutions had more to do with improving workflow and fixing problem areas identified by the staff.
In addition to having a positive effect on the outcome studied, collaborative projects such as this between physicians and nurses may lead to increased nursing job satisfaction. A meta-analysis of 31 studies identified nurse-physician collaboration and autonomy as 2 factors that correlate most strongly with nursing satisfaction.17 A Cochrane review also suggests that practice-based interprofessional collaboration may lead to improved health care processes and outcomes.18
This study has several limitations. Pre-intervention ambulation rates were abstracted from institution-specific NSQIP data, and missing data were excluded from analysis. Also, due to the retrospective collection of the pre-intervention data, the distance of ambulation could not be quantified. The bar for ambulation is low, as patients were only required to get out of bed and walk 1 step. However, we feel that getting out of bed and taking even 1 step is substantially better than complete bedrest. It is likely that once patients cross the threshold of taking 1 step, they are more likely to ambulate. An area of future study may be to more precisely define the relationship between the quantity of ambulation in steps and its effect on VTE. Finally, we acknowledge that while there is no direct increase in costs, implementing an ambulation protocol does take time from all who participate in the project.
Conclusion
Creation of an ambulation protocol is associated with a decrease in postoperative VTE rates in colorectal surgery patients. A multidisciplinary approach is critical to identify the underlying problems and propose effective solutions. Further studies are required to better correlate the distance of ambulation and its effect on VTE. However, this study shows that even a minimum of 1 step is associated with decreased VTE rates.
Corresponding author: Aneel Damle, MD, MBA, Colon & Rectal Surgery Associates, 3433 Broadway St. NE, Suite 115, Minneapolis, MN 55413; adamle@CRSAL.org.
Financial disclosures: None.
1. Gangireddy C, Rectenwald JR, Upchurch GR, et al. Risk factors and clinical impact of postoperative symptomatic venous thromboembolism. J Vasc Surg. 2007;45:341-342.
2. Newhook TE, LaPar DJ, Walters DM, et al. Impact of postoperative venous thromboembolism on postoperative morbidity, mortality, and resource utilization after hepatectomy. Am Surg. 2015;81:1216-1223.
3. Bergqvist D. Venous thromboembolism: a review of risk and prevention in colorectal surgery patients. Dis Colon Rectum. 2006;49:1620-1628.
4. Fleming F, Gaertner W, Ternent CA, et al. The American society of colon and rectal surgeons clinical practice guideline for the prevention of venous thromboembolic disease in colorectal surgery. Dis Colon Rectum. 2018;61:14-20.
5. McLeod RS, Geerts WH, Sniderman KW, et al. Canadian Colorectal Surgery DVT Prophylaxis Trial investigators. Subcutaneous heparin versus low-molecular-weight heparin as thromboprophylaxis in patients undergoing colorectal surgery: results of the Canadian colorectal DV prophylaxis trial: a randomized, double-blind trial. Ann Surg. 2001;233:438-444.
6. Shapiro R, Vogel JD, Kiran RP. Risk of postoperative venous thromboembolism after laparoscopic and open colorectal surgery: an additional benefit of the minimally invasive approach? Dis Colon Rectum. 2011;54:1496-1502.
7. Dimick JB, Chen SL, Taheri PA, et al. Hospital costs associated with surgical complications: a report from the private-sector National Surgical Quality Improvement Program. J Am Coll Surg. 2004;199:531-537.
8. Fleming FJ, Kim MJ, Salloum RM, et al. How much do we need to worry about venous thromboembolism after hospital discharge? A study of colorectal surgery patients using the National Surgical Quality Improvement Program database. Dis Colon Rectum. 2010;53:1355-1360.
9. ACS NSQIP. User guide for the 2016 ACS NSQIP participant use data file (PUF). 2017. www.facs.org/~/media/files/quality%20programs/nsqip/nsqip_puf_userguide_2016.ashx Accessed July 10, 2020.
10. Caprini JA. Risk assessment as a guide for the prevention of the many faces of venous thromboembolism. Am J Surg. 2010;199(1 Suppl):S3-S10.
11. Cassidy MR, Rosenkranz P, McAney D. Reducing postoperative venous thromboembolism complications with a standardized risk-stratified prophylaxis protocol and mobilization protocol. J Am Coll Surg. 2014;218:1095-1104.
12. Lau BD, Streiff MB, Kraus PS, et al. No evidence to support ambulation for reducing postoperative venous thromboembolism. J Am Coll Surg. 2014;219:1101-1103.
13. McNicholas C, Lennox L, Woodcock T, et al. Evolving quality improvement support strategies to improve Plan–Do–Study–Act cycle fidelity: a retrospective mixed-methods study. BMJ Qual Saf. 2019;28:356-365.
14. Taylor MJ, McNicholas C, Nicolay C, et al. Systematic review of the application of the plan–do–study–act method to improve quality in healthcare. BMC Qual Saf. 2014;23:290-298.
15. Nevo Y, Shaltiel T, Constantini N, et al. Effect of ambulation and physical activity on postoperative complications. J Am Coll Surg. 2016;223(Suppl 1):S61.
16. Mazzocato P, Stenfors-Hayes T, von Thiele Schwarz U, et al. Kaizen practice in healthcare: a qualitative analysis of hospital employees’ suggestions for improvement. BMJ Open. 2016;6:e012256.
17. Zangaro GA, Soeken KL. A meta-analysis of studies of nurses’ job satisfaction. Res Nursing Health. 2007;30:445-458.
18. Reeves S, Pelone F, Harrison R, et al. Interprofessional collaboration to improve professional practice and healthcare outcomes. Cochrane Database Syst Rev. 2017;6(6):CD000072.
From the Department of Surgery, Washington University School of Medicine, St. Louis, MO.
Abstract
Background: Patients undergoing colorectal surgery are at high risk for postoperative venous thromboembolism (VTE). Early ambulation has been encouraged to lower rates of VTE, but evidence demonstrating its effectiveness outside of a bundle is limited.
Objective: To create a multidisciplinary ambulation protocol in an effort to reduce postoperative VTE.
Methods: A single-center, retrospective, comparative study of patients who underwent colectomy or proctectomy was conducted. Outcomes of patients operated on prior to protocol implementation were compared with a cohort after implementation. The intervention studied was the implementation of a multidisciplinary ambulation protocol. The primary endpoint was postoperative VTE.
Results: There was no difference between the pre-intervention group (n = 1762) and the postintervention group (n = 253) in terms of sex, race, origin, emergency status, operative time, and the majority of medical comorbidities (with the exception of smoking status and congestive heart failure). After the protocol was implemented, ambulation rates on postoperative days 0, 1, and 2 improved from 36.4%, 47.3%, and 50.2% to 36.8%, 74.7%, and 82.6%, respectively The VTE rate in the pre-intervention group was 2.7% versus a rate of 0.4% in the postintervention group (P = 0.02).
Conclusion: Creation of an ambulation protocol is associated with a significant reduction in VTE. Commitment from patients, families, nurses, physician extenders, and physicians is critical to the success of the program.
Keywords: VTE; pulmonary embolism; deep vein thrombosis; postoperative; quality improvement.
Postoperative venous thromboembolism (VTE) is a significant source of morbidity, mortality, and cost.1,2 Colorectal surgery patients are at particularly high risk for VTE due to positioning during surgery, pelvic dissection, and other conditions often found in these patients, such as cancer and inflammatory bowel disease.3 A National Surgical Quality Improvement Program (NSQIP) analysis demonstrated an overall rate of VTE in colorectal surgery patients of 2.4%, although other studies have demonstrated rates up to 9%, even in those receiving appropriate chemoprophylaxis.4-6 Many of these VTEs occur in the postdischarge setting. In a NSQIP study of colorectal surgery patients, the rate of VTE between discharge and 30 days was 0.47%.7 The cost burdenfor a postoperative VTE has been estimated to be more than $18,000.8
Studies from NSQIP have identified multiple factors associated with VTE in colorectal surgery patients, but NSQIP does not record ambulation as a standard variable.9 Multiple strategies have been implemented to reduce postoperative VTE. Often, these studies focus on increasing compliance with appropriate chemoprophylaxis, risk stratification, or bundling multiple strategies.10,11 However, despite the fact that postsurgical ambulation is widely encouraged and recommended by the American Society of Colon and Rectal Surgeons clinical practice guidelines, there is little evidence demonstrating the role of ambulation alone in the reduction of VTE.4,12 The purpose of this study was to create a multidisciplinary protocol to increase postoperative ambulation and evaluate its effect on VTE.
Methods
Setting
This study was conducted at a single academic tertiary care center.
Patients and Outcome Measures
All patients undergoing colectomy or proctectomy by surgeons in the section of colon and rectal surgery at a single institution between January 2011 and March 2017 were included. Colectomy and proctectomy were defined by CPT codes 44140, 44141, 44143, 44144, 44145, 44146, 44147, 44150, 44151, 44155, 44156, 44157, 44158, 44160, 44204, 44205, 44206, 44207, 44208, 44210, 44211, 44212, 44213, 45110, 45111, 45112, 45113, 45114, 45116, 45119, 45120, 45121, 45123, 45126, 45160, 45395, and 45397. The primary outcome of VTE within 30 days, including deep venous thrombosis (DVT) and pulmonary embolism (PE), was measured using institution-specific data from NSQIP in both the pre-intervention and postintervention setting. The occurrence of both DVT and PE in 1 patient was counted as a single event of VTE. Ambulation rate on postoperative day (POD) 0, 1, and 2 was calculated by NSQIP in the pre-intervention setting (our institution-specific NSQIP recorded ambulation data for an unrelated project) and by review of the electronic health record in the postintervention setting, as this institution-specific variable was no longer being collected. Ambulation was defined as getting out of bed and taking at least 1 step. The threshold for ambulating each day was once on POD 0 and twice on PODs 1 and 2. Patients with missing ambulation data were excluded from the analysis. Both prior to and throughout the intervention, all patients were given VTE chemoprophylaxis with either low-dose unfractionated heparin or low-molecular-weight heparin prior to induction of anesthesia, with chemoprophylaxis extending an additional 21 days after discharge (unless specifically contraindicated); sequential compression devices; and standard orders to ambulate 3 times daily from POD 0 as part of the standard Enhanced Recovery After Surgery protocol.
Analysis
Statistical analysis was performed using univariate analysis. Chi-square test and univariate logistic regression were used to determine the association between ambulation rates and VTE in the pre-intervention group. Chi-square test was also used to compare ambulation and VTE rates between the pre-intervention and postintervention groups. Plan-Do-Study-Act (PDSA) cycle fidelity (the degree to which a PDSA cycle is carried out in accordance with the guiding principles of its use) was measured by recording the ambulation rates both before and after the intervention.13 Statistical analysis was performed using SAS Version 9.4 (SAS Institute, Cary, NC). This study was reviewed by the Washington University School of Medicine Institutional Review Board and deemed to be quality improvement, not human subjects research, and therefore did not require formal approval.
Baseline Outcome Rates
A total of 1762 patients were identified during the pre-intervention period. The overall VTE rate in the pre-intervention group was 2.7% (n = 48), with 39 DVTs (2.2%) and 13 PEs (0.7%). Pre-intervention ambulation data were available on 590 patients. Baseline ambulation rates on PODs 0, 1, and 2 were 36.4% (213/590), 47.3% (279/590), and 50.2% (296/590), respectively. Patients who did not ambulate on POD 0 had a VTE rate of 4.3%, as compared to 0.9% in those who did ambulate (Table 1). Patients who did not ambulate twice on POD 1 had a VTE rate of 4.8%, compared to 1.1% in those who did ambulate (odds ratio [OR], 4.66; 95% confidence interval [CI], 1.34 to 16.28). Patients who did not ambulate twice on POD 2 had a VTE rate of 5.4%, compared to 0.7% in those who did. Finally, those who ambulated twice on both PODs 1 and 2 had a 0% rate of VTE, compared to 4.9% in those who did not ambulate on both PODs.
Ambulation Protocol
After baseline outcome rates had been established, a multidisciplinary team of medical assistants, nurses, nurse practitioners, and physicians worked together to identify all processes that involved postoperative ambulation. Given the significant differences in VTE rates between patients who ambulated and those that did not, we created a multidisciplinary ambulation protocol using the PDSA method.14 Multiple points of patient contact were chosen for intervention, and the ambulation protocol was implemented in June 2018 and continued for 7 months.
Patients were observed from their initial office visit with a surgeon, during the preoperative education encounter, and in the operating room and on the surgical ward until discharge. Representatives from multiple disciplines who encountered patients at various times in the process, including medical assistants, patient care technicians, nurses, nurse practitioners, physical therapists, and physicians, participated in a kick-off meeting to identify difficulties they encounter when encouraging patient ambulation. The following 4 areas were identified.
Barriers to Patient Ambulation
Patient Expectations. Patients did not appear to have a clear expectation of what their ambulation goals were postoperatively, despite the fact that each patient is given an operative pathway booklet that includes their goals for each day, including ambulation. The consensus was that patients were overwhelmed with the amount of information and, oftentimes, the severity of their diagnosis, so the information regarding ambulation was not retained. Nurses commented that patients frequently stated that they did not think their surgeon wanted them to get out of bed postoperatively.
Electronic Orders. There was confusion within the nursing staff regarding orders in the electronic health record compared to physician expectations. Orders stated patients should ambulate 3 times daily, but did not specify on which postoperative day this should start. Often, nursing verbal sign-out from the post-anesthesia care unit (PACU) would be an order for bedrest, despite no clear origin of this order. This created confusion among the nursing staff as to what the appropriate ambulation orders should be.
Nursing Workflow. The initial state of the nursing workflow was not conducive to evaluating for, or assisting with, ambulation. With no set time to assist and evaluate patients for ambulation, it turned into a task nurses needed to accomplish when they had extra time. With increasing demands of charting in the electronic health record, nurses often had to skip ambulation in order to accomplish other tasks.
Family Expectations. In addition to patient expectations, family members often had expectations that were not congruent with the planned postoperative course. Nurses stated family members would often tell them that they did not feel that their family member should be ambulating so soon after surgery. Often these family members had not attended preoperative education sessions with the patient. This was compounded by the uncertainty among the nursing staff regarding what exactly the ambulation orders were.
Interventions
Targeted interventions were created to address these 4 barriers to ambulation identified by staff.
Preoperative Education. Although all elective patients received a printed operative pathway booklet describing daily goals, including ambulation, patients still did not have a sufficient understanding of what was expected of them. The education session was modified to increase the time spent on both the expectation for and the rationale behind ambulation. That section of the education session ended with a verbal commitment and read-back of the expectations for ambulation by the patient.
Clarification of Electronic Orders. Postoperative orders within the colorectal standard pathway were changed, including specific time frames and frequency, to match the information provided in the patient education booklet. These orders were for ambulation within 4 hours of arrival to the floor, and the orders also noted that no patient should be on bedrest unless explicitly stated. From POD 1, all patients were to ambulate at least twice daily for the remainder of the hospital stay (patients were encouraged to walk 4 times daily, but we set a minimum expectation of twice daily for the order set). These orders were clarified with in-person meetings with the nursing staff and leadership from the PACU and the colorectal surgical ward.
Adjusted Nursing Workflow. Nurses were interviewed and asked to create a plan regarding how they could better incorporate ambulation into their daily workflow. Ambulation assessment was incorporated into the twice-per-shift recording of vital signs and patient safety assessment. This was recorded into the electronic health record at the same time as the patients’ vital signs. This allowed nurses to keep track of which patients would need extra assistance in ambulation and which patients were doing well on their own with the assistance of family. It also helped focus the resources of physical therapy and the single ambulation technician on the floor and to assist patients who needed more assistance.
Creation of Ambulation Encouragement Signs. The authors discovered that despite patients being told preoperatively about ambulation expectations, friends and family are not always included in these conversations. As nurses frequently cited both patients and family as reasons patients thought they should not walk, multiple signs inviting patients to take an active role in their recovery by ambulating were created and placed around the unit. The signs outlined the expectations of being out of bed and taking at least 1 step on the day of surgery and walking at least 4 times per day thereafter. In addition, we addressed frequently asked questions around issues such as walking with intravenous poles and urinary catheters. The posters were signed by all staff colorectal surgeons.
Results
Over the course of 7 months (June 2018 to December 2018), 253 postintervention patients were identified (Table 2). There was no difference between the pre-intervention group (n = 1762) and the postintervention group in terms of sex, race, origin, emergency status, operative time, and the majority of medical comorbidities (with the exception of smoking status and congestive heart failure). The postintervention group was slightly older (60 versus 57 years) and had a higher percentage of patients with an American Society of Anesthesiologists physical status score greater than 2 (66.8% versus 51.2%). The postintervention group also had higher rates of both malignancy (53.4% versus 33.3%) and inflammatory bowel disease (18.2% versus 14.4%).
The fidelity of the PDSA cycle was measured by pre-intervention and postintervention ambulation rates. Ambulation rates on POD 0, 1, and 2 improved from 36.4%, 47.3%, and 50.2% to 36.8%, 74.7%, and 82.6%, respectively (Table 3). The VTE rate decreased from 2.7% to 0.4% (P = 0.02), with 1 DVT and 0 PEs. It should be noted that the only patient who developed a VTE postintervention did not ambulate on PODs 0, 1, or 2.
Discussion
Postoperative VTE is a severe complication for postoperative colorectal surgery patients. Previous studies have demonstrated that increasing ambulation is associated with a lower rate of overall complications, and, when incorporated into a bundle, is associated with decreased rates of VTE.11,15 However, this is the first study to our knowledge demonstrating that creation of an ambulation protocol alone is associated with a decrease in VTE.
Analysis of pre-intervention data demonstrated a strong association between ambulation and an absence of VTE. No patient who ambulated on PODs 0, 1, and 2 developed a VTE. Based on those results, we moved forward with creating the ambulation protocol. While ambulation stayed stable on POD 0, there were 60% and 65% increases on PODs 1 and 2, respectively. Nurses cited late arrival to the floor for second and third start cases as the primary difficulty in getting patients to ambulate more on POD 0.
We believe the key to the success of the ambulation protocol was its multidisciplinary nature. Certainly, the easiest way to create an ambulation protocol is to change the postoperative orders to state patients must walk 4 times per day. However, if the nursing staff is unable or unwilling to carry out these orders, the orders serve little purpose. In order to make lasting changes, all stakeholders in the process must be identified. In our case, stakeholders included surgery and nursing leadership, surgeons, nurse practitioners, nurses, medical assistants, physical therapists, patient care technicians, and patients. This is where we utilized kaizen, a core principle of Lean methodology that empowers employees at the level of the work being carried out to propose ideas for improvement.16 From the beginning of the patient experience, the health care practitioners who were carrying out each step of the process were best able to identify the problems and create solutions. In addition, stakeholders were given regular updates regarding how their efforts were increasing ambulation rates and the results at the end of the study period.
This study also demonstrates that, in a health care system increasingly focused on both quality and cost, significant improvements in quality can be made without increasing cost or resource utilization. Early in the process, it was proposed that the only way to increase the ambulation rate would be to increase the number of physical therapists, nurses, and nursing assistants. However, after identifying the root causes of the problem, the solutions had more to do with improving workflow and fixing problem areas identified by the staff.
In addition to having a positive effect on the outcome studied, collaborative projects such as this between physicians and nurses may lead to increased nursing job satisfaction. A meta-analysis of 31 studies identified nurse-physician collaboration and autonomy as 2 factors that correlate most strongly with nursing satisfaction.17 A Cochrane review also suggests that practice-based interprofessional collaboration may lead to improved health care processes and outcomes.18
This study has several limitations. Pre-intervention ambulation rates were abstracted from institution-specific NSQIP data, and missing data were excluded from analysis. Also, due to the retrospective collection of the pre-intervention data, the distance of ambulation could not be quantified. The bar for ambulation is low, as patients were only required to get out of bed and walk 1 step. However, we feel that getting out of bed and taking even 1 step is substantially better than complete bedrest. It is likely that once patients cross the threshold of taking 1 step, they are more likely to ambulate. An area of future study may be to more precisely define the relationship between the quantity of ambulation in steps and its effect on VTE. Finally, we acknowledge that while there is no direct increase in costs, implementing an ambulation protocol does take time from all who participate in the project.
Conclusion
Creation of an ambulation protocol is associated with a decrease in postoperative VTE rates in colorectal surgery patients. A multidisciplinary approach is critical to identify the underlying problems and propose effective solutions. Further studies are required to better correlate the distance of ambulation and its effect on VTE. However, this study shows that even a minimum of 1 step is associated with decreased VTE rates.
Corresponding author: Aneel Damle, MD, MBA, Colon & Rectal Surgery Associates, 3433 Broadway St. NE, Suite 115, Minneapolis, MN 55413; adamle@CRSAL.org.
Financial disclosures: None.
1. Gangireddy C, Rectenwald JR, Upchurch GR, et al. Risk factors and clinical impact of postoperative symptomatic venous thromboembolism. J Vasc Surg. 2007;45:341-342.
2. Newhook TE, LaPar DJ, Walters DM, et al. Impact of postoperative venous thromboembolism on postoperative morbidity, mortality, and resource utilization after hepatectomy. Am Surg. 2015;81:1216-1223.
3. Bergqvist D. Venous thromboembolism: a review of risk and prevention in colorectal surgery patients. Dis Colon Rectum. 2006;49:1620-1628.
4. Fleming F, Gaertner W, Ternent CA, et al. The American society of colon and rectal surgeons clinical practice guideline for the prevention of venous thromboembolic disease in colorectal surgery. Dis Colon Rectum. 2018;61:14-20.
5. McLeod RS, Geerts WH, Sniderman KW, et al. Canadian Colorectal Surgery DVT Prophylaxis Trial investigators. Subcutaneous heparin versus low-molecular-weight heparin as thromboprophylaxis in patients undergoing colorectal surgery: results of the Canadian colorectal DV prophylaxis trial: a randomized, double-blind trial. Ann Surg. 2001;233:438-444.
6. Shapiro R, Vogel JD, Kiran RP. Risk of postoperative venous thromboembolism after laparoscopic and open colorectal surgery: an additional benefit of the minimally invasive approach? Dis Colon Rectum. 2011;54:1496-1502.
7. Dimick JB, Chen SL, Taheri PA, et al. Hospital costs associated with surgical complications: a report from the private-sector National Surgical Quality Improvement Program. J Am Coll Surg. 2004;199:531-537.
8. Fleming FJ, Kim MJ, Salloum RM, et al. How much do we need to worry about venous thromboembolism after hospital discharge? A study of colorectal surgery patients using the National Surgical Quality Improvement Program database. Dis Colon Rectum. 2010;53:1355-1360.
9. ACS NSQIP. User guide for the 2016 ACS NSQIP participant use data file (PUF). 2017. www.facs.org/~/media/files/quality%20programs/nsqip/nsqip_puf_userguide_2016.ashx Accessed July 10, 2020.
10. Caprini JA. Risk assessment as a guide for the prevention of the many faces of venous thromboembolism. Am J Surg. 2010;199(1 Suppl):S3-S10.
11. Cassidy MR, Rosenkranz P, McAney D. Reducing postoperative venous thromboembolism complications with a standardized risk-stratified prophylaxis protocol and mobilization protocol. J Am Coll Surg. 2014;218:1095-1104.
12. Lau BD, Streiff MB, Kraus PS, et al. No evidence to support ambulation for reducing postoperative venous thromboembolism. J Am Coll Surg. 2014;219:1101-1103.
13. McNicholas C, Lennox L, Woodcock T, et al. Evolving quality improvement support strategies to improve Plan–Do–Study–Act cycle fidelity: a retrospective mixed-methods study. BMJ Qual Saf. 2019;28:356-365.
14. Taylor MJ, McNicholas C, Nicolay C, et al. Systematic review of the application of the plan–do–study–act method to improve quality in healthcare. BMC Qual Saf. 2014;23:290-298.
15. Nevo Y, Shaltiel T, Constantini N, et al. Effect of ambulation and physical activity on postoperative complications. J Am Coll Surg. 2016;223(Suppl 1):S61.
16. Mazzocato P, Stenfors-Hayes T, von Thiele Schwarz U, et al. Kaizen practice in healthcare: a qualitative analysis of hospital employees’ suggestions for improvement. BMJ Open. 2016;6:e012256.
17. Zangaro GA, Soeken KL. A meta-analysis of studies of nurses’ job satisfaction. Res Nursing Health. 2007;30:445-458.
18. Reeves S, Pelone F, Harrison R, et al. Interprofessional collaboration to improve professional practice and healthcare outcomes. Cochrane Database Syst Rev. 2017;6(6):CD000072.