User login
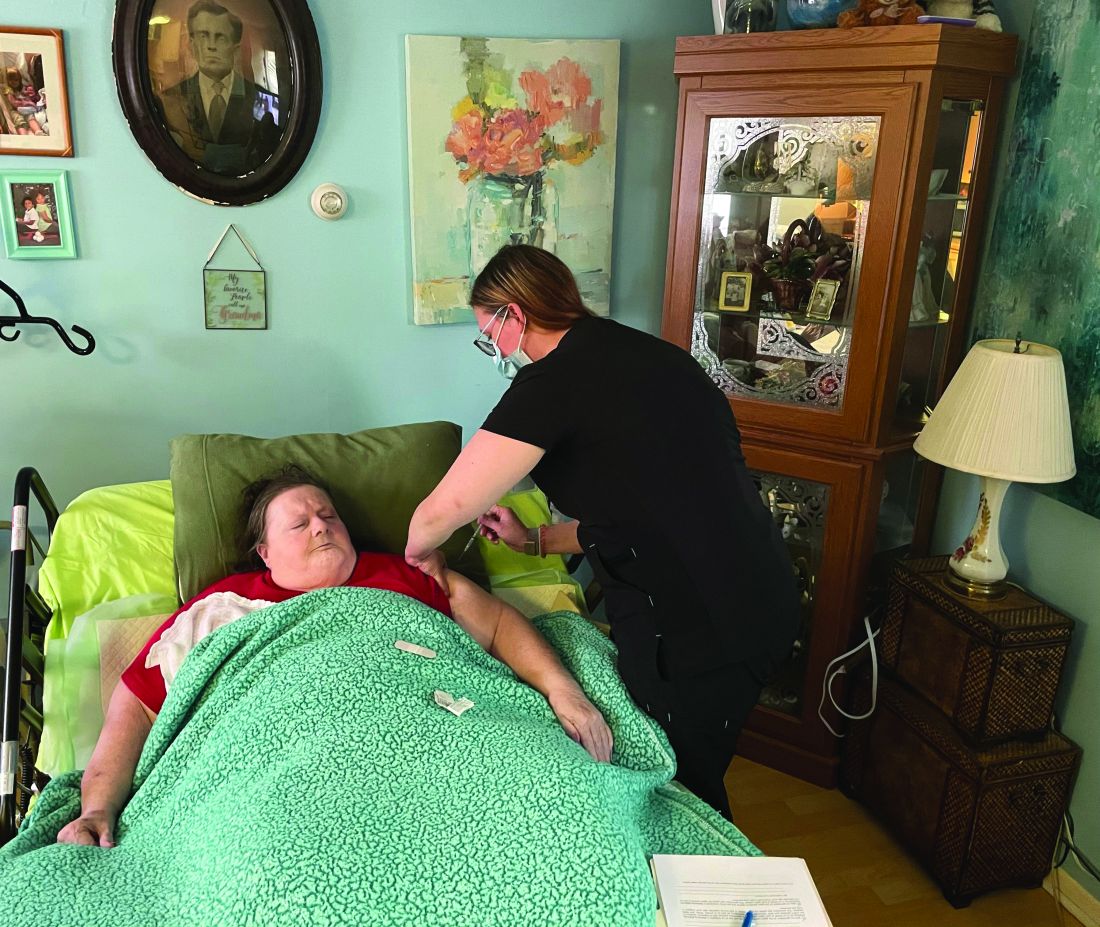
Vaccinating homebound patients is an uphill battle
There are about 2 million to 4 million homebound patients in the United States, according to a webinar from The Trust for America’s Health, which was broadcast in March. But many of these individuals have not been vaccinated yet because of logistical challenges.
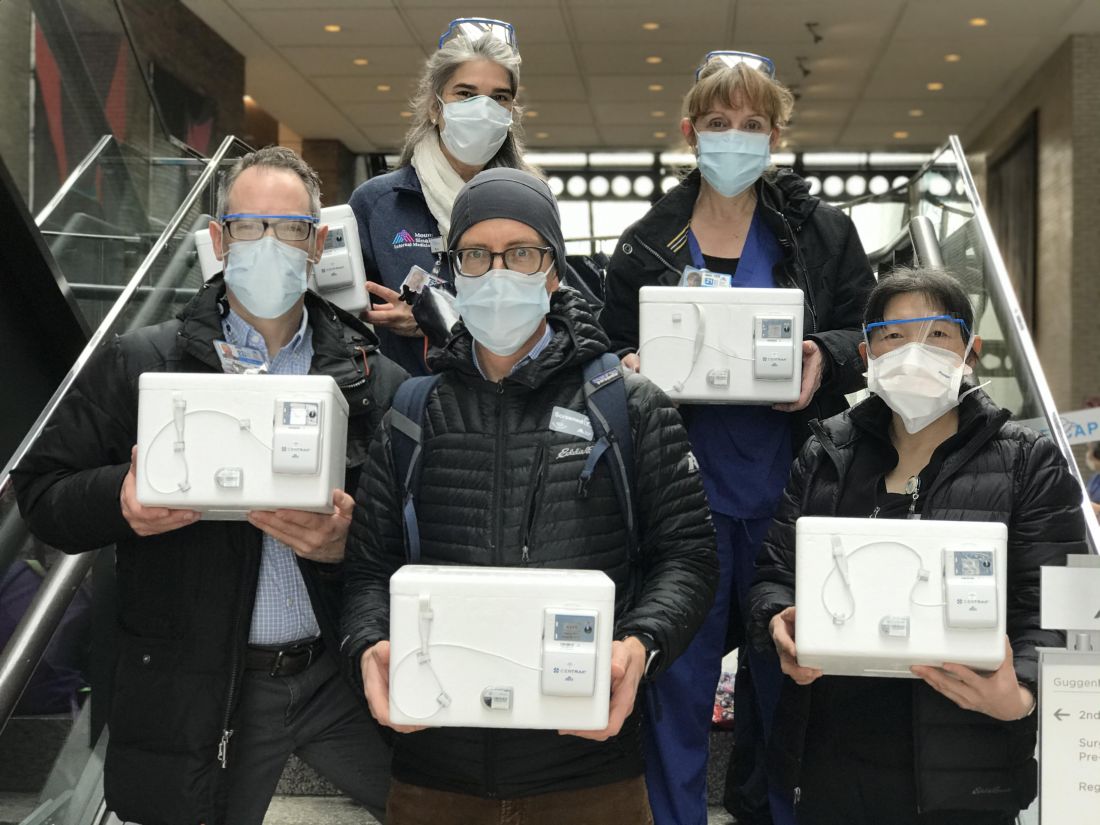
Some homebound COVID-19 immunization programs are administering Moderna and Pfizer vaccines to their patients, but many state, city, and local programs administered the Johnson & Johnson vaccine after it was cleared for use by the Food and Drug Administration in February 2021. The efficacy of the one-shot vaccine, as well as it being easier to store and ship than the Moderna and Pfizer vaccines, makes getting it to homebound patients less challenging.
“With Pfizer and Moderna, transportation is a challenge because the temperature demands and the fragility of [messenger] RNA–based vaccines,” Brent Feorene, executive director of the American Academy of Home Care Medicine, said in an interview. That’s why [the Johnson & Johnson] vaccine held such promise – it’s less fragile, [can be stored in] higher temperatures, and was a one shot.”
Other hurdles to getting homebound patients vaccinated had already been in place prior to the 10-day-pause on using the J&J vaccine that occurred for federal agencies to consider possible serious side effects linked to it.
Many roadblocks to vaccination
Although many homebound patients can’t readily go out into the community and be exposed to the COVID-19 virus themselves, they are dependent on caregivers and family members who do go out into the community.
“Their friends, family, neighbors, home health aides, and other kinds of health care workers come into the home,” said Shawn Amer, clinical program director at Central Ohio Primary Care in Columbus.
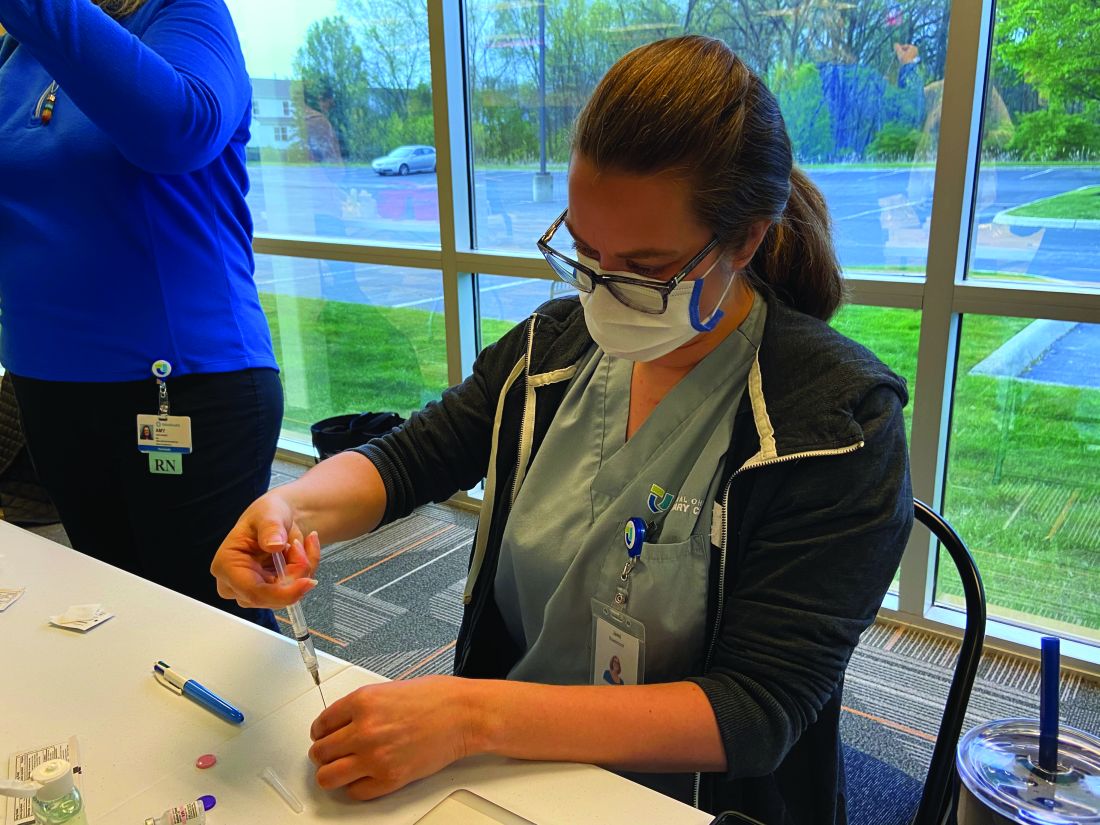
Nurses from Ms. Amer’s practice vaccinated approximately ten homebound patients with the J&J vaccine through a pilot program in March. Then on April 24, nurses from Central Ohio Primary Care vaccinated just under 40 homebound patients and about a handful of their caregivers who were not able to get their vaccines elsewhere, according to Ms. Amer. This time they used the Pfizer vaccine and will be returning to these patients’ homes on May 15 to administer the second dose.
“Any time you are getting in the car and adding miles, it adds complexity,” Ms. Amer said.
“We called patients 24 to 36 hours before coming to their homes to make sure they were ready, but we learned that just because the healthcare power of attorney agrees to a patient getting vaccinated does not mean that patient will be willing to get the vaccine when the nurse shows up," she noted.
Ms. Amer elaborated that three patients with dementia refused the vaccine when nurses arrived at their home on April 24.
“We had to pivot and find other people,” Ms. Amer. Her practice ended up having to waste one shot.
Expenses are greater
The higher costs of getting homebound patients vaccinated is an additional hurdle to getting these vulnerable individuals protected by COVID-19 shots.
Vaccinating patients in their homes “doesn’t require a lot of technology, but it does require a lot of time” and the staffing expense becomes part of the challenge, Ms. Amer noted.
For each of the two days that Central Ohio Primary Care provides the Pfizer vaccine to homebound patients, the practice needs to pay seven nurses to administer the vaccine, Ms. Amer explained.
There have also been reports of organizations that administer the vaccines – which are free for patients because the federal government is paying for them – not being paid enough by Medicare to cover staff time and efforts to vaccinate patients in their homes, Kaiser Health News reported. According to the Centers for Medicare & Medicaid Services, they pay $40 for the administration of a single-dose COVID-19 vaccine and, for COVID-19 vaccines requiring multiple doses, Medicare pays approximately $40 for each dose in the series. These rates were implemented after March 15. Before that date, the rates were even lower, with the Medicare reimbursement rates for initial doses of COVID-19 vaccines being $16.94 and final doses being $28.39.
William Dombi, president of the National Association for Home Care & Hospice, told Kaiser Health News that the actual cost of these homebound visits are closer to $150 or $160.
“The reimbursement for the injection is pretty minimal,” Mr. Feorene said. “So unless you’re a larger organization and able to have staff to deploy some of your smaller practices, just couldn’t afford to do it.”
Many homebound patients have also been unable to get the lifesaving shots because of logistical roadblocks and many practices not being able to do home visits.
“I think that initially when the [Centers for Disease Control and Prevention] came out with vaccine guidance for medical providers, they offered no guidance for in-home medical providers and we had to go back and ask for that, which they did produce,” Mr. Feorene said. “And we’re grateful for that. But I think just this general understanding that there is a population of folks that are [limited to their home], that they do receive medical care and other care in the home, and that we have to remember that the medical providers who provide care in the home are also primary care providers.”
Furthermore, trying to navigate or find programs delivering vaccines to the homebound can be difficult depending on where a patient lives.
While some programs have been launched on the country or city level – the New York Fire Department launched a pilot program to bring the Johnson & Johnson vaccine to homebound seniors – other programs have been spearheaded by hospital networks like Northwell and Mount Sinai. However, many of these hospital networks only reach out to people who already have a relationship with the hospital.
Ms Amer said identifying homebound patients and reaching out to them can be tough and can contribute to the logistics and time involved in setting patients up for the vaccine.
“Reaching some of these patients is difficult,” Ms. Amer noted. “Sometimes the best way to reach them or get a hold of them is through their caregiver. And so do you have the right phone number? Do you have the right name?”
Overcoming the challenges
With the absence of a national plan targeting homebound patients, many local initiatives were launched to help these individuals get vaccinated. Local fire department paramedics have gone door to door to administer the COVID-19 vaccine in cities like Chicago, New York, and Miami. The suspension of the Johnson & Johnson vaccine resulted in the suspension of in-home vaccinations for some people in New York City. However, the program resumed after the FDA and CDC lifted the pause on April 24.
Health systems like Mount Sinai vaccinated approximately 530 people through the Mount Sinai Visiting Doctors Program, including patients and their caregivers, according to Peter Gliatto, MD, associate director of the Mount Sinai Visiting Doctors Program.
“In different cities, townships, and jurisdictions, different health departments and different provider groups are approaching [the distribution of the COVID-19 vaccine] slightly differently,” Ms. Amer said. So a lot of the decisions surrounding the distribution of shots are local or dependent on local resourcing.
People who live in rural areas present a unique challenge, but Mr. Feorene said reaching out to local emergency medical services or the local health departments can provide some insight on what their town is doing to vaccinate homebound patients.
“I think understanding what a [public health department] is doing would be the very first place to start,” Mr. Feorene said in an interview.
If a patient is bedridden and is mobile enough to sit in a car, Mr. Feorene also recommends finding out if there are vaccine fairs “within a reasonable driving distance.”
Ms. Amer said continuing this mission of getting homebound patients vaccinated is necessary for public health.
“Even if it’s going to take longer to vaccinate these homebound patients, we still have to make an effort. So much of the country’s vaccine efforts have been focused on getting as many shots in as many arms as quickly as possible. And that is definitely super important,” she said.
Ms. Amer is working with her practice’s primary care physicians to try to identify all of those patients who are functionally debilitated or unable to leave their home to get vaccinated and that Central Ohio Primary Care will vaccinate more homebound patients, she added.
The experts interviewed in this article have no conflicts.
Katie Lennon contributed to this report.
This article was updated 4/29/21.
There are about 2 million to 4 million homebound patients in the United States, according to a webinar from The Trust for America’s Health, which was broadcast in March. But many of these individuals have not been vaccinated yet because of logistical challenges.
Some homebound COVID-19 immunization programs are administering Moderna and Pfizer vaccines to their patients, but many state, city, and local programs administered the Johnson & Johnson vaccine after it was cleared for use by the Food and Drug Administration in February 2021. The efficacy of the one-shot vaccine, as well as it being easier to store and ship than the Moderna and Pfizer vaccines, makes getting it to homebound patients less challenging.
“With Pfizer and Moderna, transportation is a challenge because the temperature demands and the fragility of [messenger] RNA–based vaccines,” Brent Feorene, executive director of the American Academy of Home Care Medicine, said in an interview. That’s why [the Johnson & Johnson] vaccine held such promise – it’s less fragile, [can be stored in] higher temperatures, and was a one shot.”
Other hurdles to getting homebound patients vaccinated had already been in place prior to the 10-day-pause on using the J&J vaccine that occurred for federal agencies to consider possible serious side effects linked to it.
Many roadblocks to vaccination
Although many homebound patients can’t readily go out into the community and be exposed to the COVID-19 virus themselves, they are dependent on caregivers and family members who do go out into the community.
“Their friends, family, neighbors, home health aides, and other kinds of health care workers come into the home,” said Shawn Amer, clinical program director at Central Ohio Primary Care in Columbus.
Nurses from Ms. Amer’s practice vaccinated approximately ten homebound patients with the J&J vaccine through a pilot program in March. Then on April 24, nurses from Central Ohio Primary Care vaccinated just under 40 homebound patients and about a handful of their caregivers who were not able to get their vaccines elsewhere, according to Ms. Amer. This time they used the Pfizer vaccine and will be returning to these patients’ homes on May 15 to administer the second dose.
“Any time you are getting in the car and adding miles, it adds complexity,” Ms. Amer said.
“We called patients 24 to 36 hours before coming to their homes to make sure they were ready, but we learned that just because the healthcare power of attorney agrees to a patient getting vaccinated does not mean that patient will be willing to get the vaccine when the nurse shows up," she noted.
Ms. Amer elaborated that three patients with dementia refused the vaccine when nurses arrived at their home on April 24.
“We had to pivot and find other people,” Ms. Amer. Her practice ended up having to waste one shot.
Expenses are greater
The higher costs of getting homebound patients vaccinated is an additional hurdle to getting these vulnerable individuals protected by COVID-19 shots.
Vaccinating patients in their homes “doesn’t require a lot of technology, but it does require a lot of time” and the staffing expense becomes part of the challenge, Ms. Amer noted.
For each of the two days that Central Ohio Primary Care provides the Pfizer vaccine to homebound patients, the practice needs to pay seven nurses to administer the vaccine, Ms. Amer explained.
There have also been reports of organizations that administer the vaccines – which are free for patients because the federal government is paying for them – not being paid enough by Medicare to cover staff time and efforts to vaccinate patients in their homes, Kaiser Health News reported. According to the Centers for Medicare & Medicaid Services, they pay $40 for the administration of a single-dose COVID-19 vaccine and, for COVID-19 vaccines requiring multiple doses, Medicare pays approximately $40 for each dose in the series. These rates were implemented after March 15. Before that date, the rates were even lower, with the Medicare reimbursement rates for initial doses of COVID-19 vaccines being $16.94 and final doses being $28.39.
William Dombi, president of the National Association for Home Care & Hospice, told Kaiser Health News that the actual cost of these homebound visits are closer to $150 or $160.
“The reimbursement for the injection is pretty minimal,” Mr. Feorene said. “So unless you’re a larger organization and able to have staff to deploy some of your smaller practices, just couldn’t afford to do it.”
Many homebound patients have also been unable to get the lifesaving shots because of logistical roadblocks and many practices not being able to do home visits.
“I think that initially when the [Centers for Disease Control and Prevention] came out with vaccine guidance for medical providers, they offered no guidance for in-home medical providers and we had to go back and ask for that, which they did produce,” Mr. Feorene said. “And we’re grateful for that. But I think just this general understanding that there is a population of folks that are [limited to their home], that they do receive medical care and other care in the home, and that we have to remember that the medical providers who provide care in the home are also primary care providers.”
Furthermore, trying to navigate or find programs delivering vaccines to the homebound can be difficult depending on where a patient lives.
While some programs have been launched on the country or city level – the New York Fire Department launched a pilot program to bring the Johnson & Johnson vaccine to homebound seniors – other programs have been spearheaded by hospital networks like Northwell and Mount Sinai. However, many of these hospital networks only reach out to people who already have a relationship with the hospital.
Ms Amer said identifying homebound patients and reaching out to them can be tough and can contribute to the logistics and time involved in setting patients up for the vaccine.
“Reaching some of these patients is difficult,” Ms. Amer noted. “Sometimes the best way to reach them or get a hold of them is through their caregiver. And so do you have the right phone number? Do you have the right name?”
Overcoming the challenges
With the absence of a national plan targeting homebound patients, many local initiatives were launched to help these individuals get vaccinated. Local fire department paramedics have gone door to door to administer the COVID-19 vaccine in cities like Chicago, New York, and Miami. The suspension of the Johnson & Johnson vaccine resulted in the suspension of in-home vaccinations for some people in New York City. However, the program resumed after the FDA and CDC lifted the pause on April 24.
Health systems like Mount Sinai vaccinated approximately 530 people through the Mount Sinai Visiting Doctors Program, including patients and their caregivers, according to Peter Gliatto, MD, associate director of the Mount Sinai Visiting Doctors Program.
“In different cities, townships, and jurisdictions, different health departments and different provider groups are approaching [the distribution of the COVID-19 vaccine] slightly differently,” Ms. Amer said. So a lot of the decisions surrounding the distribution of shots are local or dependent on local resourcing.
People who live in rural areas present a unique challenge, but Mr. Feorene said reaching out to local emergency medical services or the local health departments can provide some insight on what their town is doing to vaccinate homebound patients.
“I think understanding what a [public health department] is doing would be the very first place to start,” Mr. Feorene said in an interview.
If a patient is bedridden and is mobile enough to sit in a car, Mr. Feorene also recommends finding out if there are vaccine fairs “within a reasonable driving distance.”
Ms. Amer said continuing this mission of getting homebound patients vaccinated is necessary for public health.
“Even if it’s going to take longer to vaccinate these homebound patients, we still have to make an effort. So much of the country’s vaccine efforts have been focused on getting as many shots in as many arms as quickly as possible. And that is definitely super important,” she said.
Ms. Amer is working with her practice’s primary care physicians to try to identify all of those patients who are functionally debilitated or unable to leave their home to get vaccinated and that Central Ohio Primary Care will vaccinate more homebound patients, she added.
The experts interviewed in this article have no conflicts.
Katie Lennon contributed to this report.
This article was updated 4/29/21.
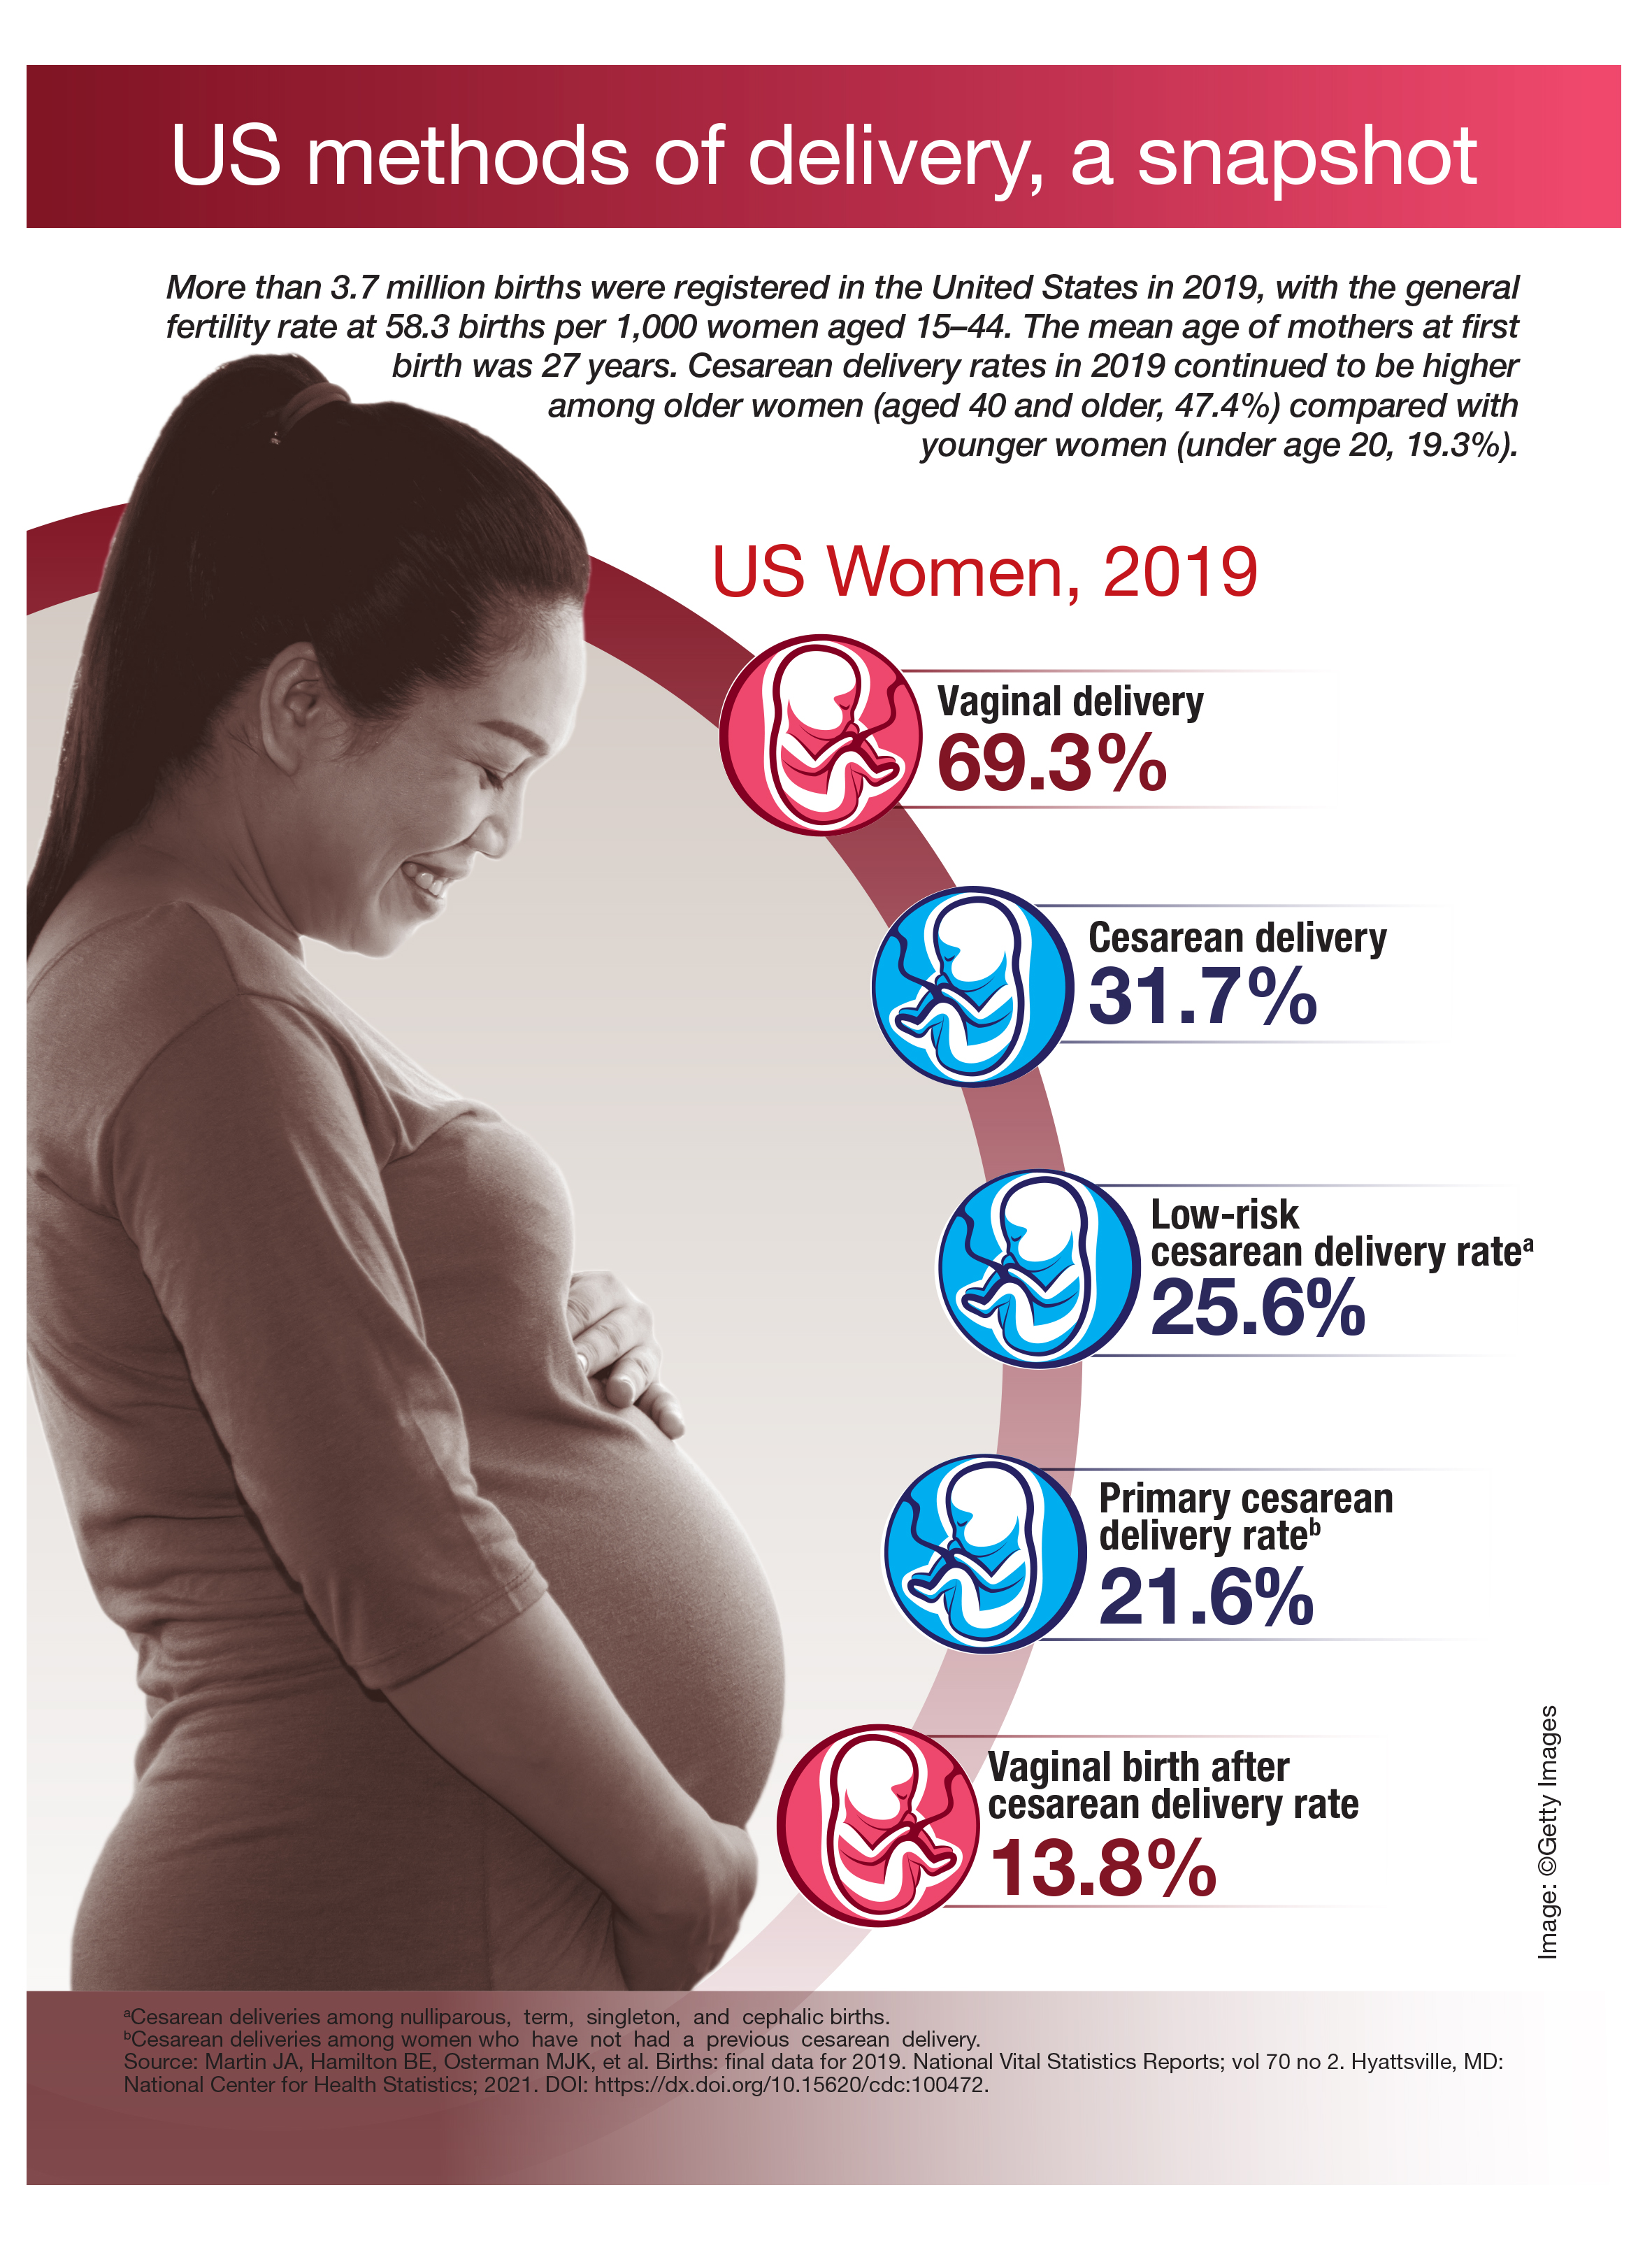
US methods of delivery, a snapshot
What COVID did to MD income in 2020
, according to the Medscape Physician Compensation Report 2021: The Recovery Begins.
Almost 18,000 physicians in more than 29 specialties told Medscape about their income, hours worked, greatest challenges, and the unexpected impact of COVID-19 on their compensation.
How many physicians avoided massive losses
When the pandemic started around March 2020, “a great many physicians saw reductions in volume at first,” says Robert Pearl, MD, former CEO of the Permanente Medical Group and a professor at Stanford (Calif.) University.
Medscape’s survey report shows that a staggering 44% saw a 1%-25% reduction in patient volume, and 9% saw a 26%-50% decline. “That is indeed breathtaking,” Dr. Pearl says.
Several key factors saved many practices from hemorrhaging money, says Michael Belkin, JD, divisional vice president at Merritt Hawkins and Associates in Dallas. “Many physicians used the federal Paycheck Protection Program [PPP] to help keep themselves afloat,” he says. “A large percentage reduced their staff, which reduced their expenses, and many got some of their volume back by transitioning to telemedicine.”
In a 2020 survey for the Physicians Foundation, conducted by Merritt Hawkins, 48% of physicians said their practice had received PPP support, and most of those said the support was enough to allow them to stay open without reducing staff. Only 6% of practices that received PPP support did not stay open.
Telemedicine helped many practices
Early in the pandemic, Medicare reimbursements for telemedicine were equal with those for face-to-face visits. “Since telemedicine takes a third less time than an inpatient visit, doctors could see more patients,” Dr. Pearl says.
The switch was almost instantaneous in some practices. Within 3 days, a 200-provider multispecialty practice in Wilmington, N.C., went from not using telehealth to its being used by all physicians, the Medical Group Management Association reported. By late April, the practice was already back up to about 70% of normal overall production.
However, telemedicine could not help every specialty equally. “Generally, allergists can’t do their allergy testing virtually, and patients with mild problems probably put off visits,” Dr. Pearl says. Allergists experienced a large percentage decline in compensation, according to Medscape’s survey. For some, income fell from $301,000 the prior year to $274,000 this year.
Primary care struggled
Primary care physicians posted lower compensation than they did the prior year, but most rebounded to some degree. A study released in June 2020 projected that, even with telemedicine, primary care physicians would lose an average of $67,774 for the year.
However, Medscape’s survey found that internists’ average compensation declined from $251,000 in the prior year to $248,000, and average family physicians’ compensation actually rose from $234,000.
Pediatricians had a harder slog. Their average compensation sank from $232,000 to $221,000, according to the report. Even with telemedicine, parents of young children were not contacting the doctor. In May 2020, visits by children aged 3-5 years were down by 56%.
Many proceduralists recovered
Procedure-oriented specialties were particularly hard-hit at first, because many hospitals and some states banned all elective surgeries at the beginning of the pandemic.
“In March and April, ophthalmology practices were virtually at a standstill,” says John B. Pinto, an ophthalmology practice management consultant in San Diego. “But by the fourth quarter, operations were back to normal. Practices were fully open, and patients were coming back in.”
Medscape’s survey shows that, by year’s end, compensation was about the same as the year before for orthopedic surgeons ($511,000 in both the 2020 and 2021 reports); cardiologists actually did better ($438,000 in our 2020 report and $459,000 in 2021); and ophthalmologists’ compensation was about the same ($378,000 in our prior report and $379,000 in 2021).
Some other proceduralists, however, did not do as well. Otolaryngologists’ compensation fell to $417,000, the second-biggest percentage drop. “This may be because otolaryngologists’ chief procedures are tonsillectomies, sinus surgery, and nasal surgery, which can be put off,” Dr. Pearl says.
Anesthesiologists, who depend on surgical volume, also did not earn as much in 2020. Their compensation declined from $398,000 in our 2020 report to $378,000 in Medscape’s 2021 report.
“Not only has 70% of our revenue disappeared, but our physicians are still working every day,” an independent anesthesiology practice in Alabama told the MGMA early in the pandemic.
Plastic surgeons now the top earners
The biggest increase in compensation by far was made by plastic surgeons, whose income rose 9.8% over the year before, to $526,000. This put them at the top of the list
Dr. Pearl adds that plastic surgeons can perform their procedures in their offices, rather than in a hospital, where elective surgeries were often canceled.
Mr. Belkin says specialties other than plastic surgery had been offering more boutique cosmetic care even before the pandemic. In 2020, nonsurgical cosmetic procedures such as neurotoxin therapy, dermal filler procedures, chemical peels, and hair removal earned $3.1 billion in revenue, according to a survey by the Aesthetic Society.
Other specialties that earned more even during COVID
In Medscape’s survey, several specialties actually earned more during the pandemic than in 2019. Some specialties, such as critical care and public health, were integral in managing COVID patients and the pandemic.
However, some specialties involved in COVID care did not see an increase. Compensation for infectious disease specialists (at $245,000) and emergency medicine specialists (at $354,000) remained basically unchanged from the prior year, and for pulmonologists, it was slightly down.
Emergency departments reported decreases in volume of 40% or more early in the pandemic, according to the American College of Emergency Physicians. It was reported that patients were avoiding EDs for fear of contracting COVID, and car accidents were down because people ventured out less.
In this year’s report, psychiatrists saw a modest rise in compensation, to $275,000. “There has been an increase in mental health visits in the pandemic,” Dr. Pearl says. In 2020, about 4 in 10 adults in the United States reported symptoms of anxiety or depressive disorder, up from 1 in 10 adults the prior year. In addition, psychiatrists were third on the list of Merritt Hawkins’ most requested recruiting engagements.
Oncologists saw a rise in compensation, from $377,000 to $403,000. “Volume likely did not fall because cancer patients would go through with their chemotherapy in spite of the pandemic,” Dr. Pearl says. “The increase in income might have to do with the usual inflation in the cost of chemotherapy drugs.” Dr. Pinto saw the same trend for retinal surgeons, whose care also cannot be delayed.
Medscape’s survey also reports increases in compensation for rheumatologists, endocrinologists, and neurologists, but it reports small declines among dermatologists, radiologists, and gastroenterologists.
Gender-based pay gap remains in place
The gender-based pay gap in this year’s report is similar to that seen in Medscape’s report for the prior year. Men earned 27% more than women in 2021, compared with 25% more the year before. Some physicians commented that more women physicians maintained flexible or shorter work schedules to help with children who could not go into school.
“Having to be a full-time physician, full-time mom, and full-time teacher during our surge was unbelievable,” a primary care pediatrician in group practice and mother of two reported in November. “I felt pulled in all directions and didn’t do anything well.”
In addition, “men dominate some specialties that seem to have seen a smaller drop in volume in the pandemic, such as emergency medicine, infectious disease, pulmonology, and oncology,” says Halee Fischer-Wright, MD, CEO of MGMA.
Employed physicians shared their employers’ pain
Employed physicians, who typically work at hospitals, shared the financial pains of their institutions, particularly in the early stages of the pandemic. In April, hospital admissions were 34.1% below prepandemic levels, according to a study published in Health Affairs. That figure had risen by June, but it was still 8.3% below prepandemic volume.
By the end of the year, many hospitals and hospital systems were in the black, thanks in large part to generous federal subsidies, but actual operations still lost money for the year. Altogether, 42% of them posted an operational loss in 2020, up from the 23% in 2019, according to a survey by Moody’s Investors Service.
Medscape’s report shows that many employed physicians lost pay in 2020, and for many, pay had not returned to pre-COVID levels. Only 28% of primary care physicians and 32% of specialists who lost pay have seen it restored, according to the report. In addition, 15% of surveyed physicians did not receive an annual raise.
Many employed doctors are paid on the basis of relative value units (RVUs), which is a measure of the value of their work. In many cases, there was not enough work to reach RVU thresholds. Would hospitals and other employers lower RVU targets to meet the problem? “I haven’t seen our clients make concessions to providers along those lines,” Mr. Belkin says.
Physicians had to work longer hours
The Medscape report also found that in 2020, physicians saw fewer patients because each visit took longer.
“With the threat of COVID, in-person visits take more time than before,” Mr. Belkin says. “Physicians and staff have to prepare the exam room after each visit, and doctors must spend more time answering patients’ questions about COVID.”
“The new protocols to keep everyone safe add time between patients, and physicians have to answer patients’ questions about the pandemic and vaccines,” Dr. Fischer-Wright says. “You might see a 20% increase in time spent just on these non–revenue-generating COVID activities.”
Physicians still like their specialty
Although 2020 was a challenging year for physicians, the percentage of those who were satisfied with their specialty choice generally did not slip from the year before. It actually rose for several specialties – most notably, rheumatology, pulmonology, physical medicine and rehabilitation, and nephrology.
One specialty saw a decline in satisfaction with their specialty choice, and that was public health and preventive medicine, which plummeted 16 percentage points to 67% – putting it at the bottom of the list.
Even before the pandemic, many public health departments were chronically underfunded. This problem was possibly exacerbated by the pressures to keep up with COVID reporting and testing responsibilities.
Conclusion
Although 2020 was a wild ride for many physicians, many came out of it with only minor reductions in overall compensation, and some saw increases. Still, some specialties and many individuals experienced terrible financial stress and had to make changes in their lives and their spending in order to stay afloat.
“The biggest inhibitor to getting back to normal had to do with doctors who did not want to return because they did not want to risk getting COVID,” Dr. Pinto reports. But he notes that by February 2021 most doctors were completely vaccinated and could feel safe again.
A version of this article first appeared on Medscape.com.
Mnemonics can be real lifesavers
Mnemonics are often used to help remember complex groups of individual items related to a common theme. Studies have shown that college students studying with mnemonics outperform students using rote learning, suggesting that mnemonics are useful in retention of facts. 1
In 1 study, researchers compared memory athletes and control subjects before and after mnemonic training. 2 Findings showed that mnemonics created connectivity changes in the control group similar to memory athletes at baseline. These changes persisted for as long as 4 months after training, demonstrating that mnemonics have long-lasting effects on memory capacity. 2
The most frequently used forms of medical mnemonics are acronyms or acrostics. Acronyms are words in which each letter in the word corresponds to a series of words to be remembered. 3 A familiar example of a medical acronym is “SLUDGE,” which represents the symptoms for cholinergic toxicity (salivation, lacrimation, urination, defecation, gastrointestinal upset, emesis). An acrostic involves a phrase in which the first letter of each word corresponds to the first letter of a word to be remembered. 3 A commonly used acrostic phrase for the memorization of the 12 cranial nerves is “On Old Olympus’ Towering Tops A Finn And German Viewed Some Hops”: olfactory, optic, oculomotor, trochlear, trigeminal, abducens, facial, auditory (vestibulocochlear), glossopharyngeal, vagus, spinal accessory, hypoglossal.
Mnemonics are an effective way for medical students, residents, and current practitioners to effortlessly recall information. For example, COVERABCD is an acronym that stands for circulation/capnograph/color, oxygen, ventilation, endotracheal tube, review of equipment, airway, breathing, circulation, and drugs. 4 Runciman et al showed that the use of the acronym COVERABCD could have prevented or mitigated 60% of 2000 anesthetic incidents. 4 Another mnemonic, FAST, used to assess for a stroke, reduced median hospital arrival times by more than an hour. 5
There are hundreds of mnemonics related to medical practice. Collections of those that might be useful for family practitioners and medical residents can be found at the following links:
https://epomedicine.com/medical-mnemonics/
www.oxfordmedicaleducation.com/medical-mnemonics/
Kristyn McKnight, PharmD candidate
Hannah Lutz, PharmD candidate
Tracy Mahvan, MBA, PharmD, BCGP
School of Pharmacy, University of Wyoming, Laramie
1. Dave H, Awasthi S. An investigation of the role of mnemonics in higher education. Paper presented at: International Conference on Digital Pedagogies (ICDP); April 1-3, 2019; New Delhi, India. +http://dx.doi.org/10.2139/ssrn.3375714
2. Dresler M, Shirer WR, Konrad BN, et al. Mnemonic training reshapes the brain networks to support memory. Neuron. 2017;93:1227-1235. https://doi.org/10.1016/j.neuron. 2017.02.003
3. Nolen J. Mnemonic. Encyclopedia Britannica. July 20, 1998. Updated September 18, 2019. Accessed March 16, 2021. www.britannica.com/science/short-term-memory
4. Runciman WB, Webb RK, Klepper ID, et al. The Australian Incident Monitoring Study. Crisis management—validation of an algorithm by analysis of 2000 incident reports. Anaesth Intensive Care. 1993;21:579-592. https://doi.org/10.1177/0310057X9302100515
5. Wolters FJ, Paul NLM, Li L, et al. Sustained impact of UK FAST-test public education on response to stroke: a population-based time-series study. Int J Stroke. 2015;10:1108-1114. https://doi.org/1111/ijs.12484
Mnemonics are often used to help remember complex groups of individual items related to a common theme. Studies have shown that college students studying with mnemonics outperform students using rote learning, suggesting that mnemonics are useful in retention of facts. 1
In 1 study, researchers compared memory athletes and control subjects before and after mnemonic training. 2 Findings showed that mnemonics created connectivity changes in the control group similar to memory athletes at baseline. These changes persisted for as long as 4 months after training, demonstrating that mnemonics have long-lasting effects on memory capacity. 2
The most frequently used forms of medical mnemonics are acronyms or acrostics. Acronyms are words in which each letter in the word corresponds to a series of words to be remembered. 3 A familiar example of a medical acronym is “SLUDGE,” which represents the symptoms for cholinergic toxicity (salivation, lacrimation, urination, defecation, gastrointestinal upset, emesis). An acrostic involves a phrase in which the first letter of each word corresponds to the first letter of a word to be remembered. 3 A commonly used acrostic phrase for the memorization of the 12 cranial nerves is “On Old Olympus’ Towering Tops A Finn And German Viewed Some Hops”: olfactory, optic, oculomotor, trochlear, trigeminal, abducens, facial, auditory (vestibulocochlear), glossopharyngeal, vagus, spinal accessory, hypoglossal.
Mnemonics are an effective way for medical students, residents, and current practitioners to effortlessly recall information. For example, COVERABCD is an acronym that stands for circulation/capnograph/color, oxygen, ventilation, endotracheal tube, review of equipment, airway, breathing, circulation, and drugs. 4 Runciman et al showed that the use of the acronym COVERABCD could have prevented or mitigated 60% of 2000 anesthetic incidents. 4 Another mnemonic, FAST, used to assess for a stroke, reduced median hospital arrival times by more than an hour. 5
There are hundreds of mnemonics related to medical practice. Collections of those that might be useful for family practitioners and medical residents can be found at the following links:
https://epomedicine.com/medical-mnemonics/
www.oxfordmedicaleducation.com/medical-mnemonics/
Kristyn McKnight, PharmD candidate
Hannah Lutz, PharmD candidate
Tracy Mahvan, MBA, PharmD, BCGP
School of Pharmacy, University of Wyoming, Laramie
1. Dave H, Awasthi S. An investigation of the role of mnemonics in higher education. Paper presented at: International Conference on Digital Pedagogies (ICDP); April 1-3, 2019; New Delhi, India. +http://dx.doi.org/10.2139/ssrn.3375714
2. Dresler M, Shirer WR, Konrad BN, et al. Mnemonic training reshapes the brain networks to support memory. Neuron. 2017;93:1227-1235. https://doi.org/10.1016/j.neuron. 2017.02.003
3. Nolen J. Mnemonic. Encyclopedia Britannica. July 20, 1998. Updated September 18, 2019. Accessed March 16, 2021. www.britannica.com/science/short-term-memory
4. Runciman WB, Webb RK, Klepper ID, et al. The Australian Incident Monitoring Study. Crisis management—validation of an algorithm by analysis of 2000 incident reports. Anaesth Intensive Care. 1993;21:579-592. https://doi.org/10.1177/0310057X9302100515
5. Wolters FJ, Paul NLM, Li L, et al. Sustained impact of UK FAST-test public education on response to stroke: a population-based time-series study. Int J Stroke. 2015;10:1108-1114. https://doi.org/1111/ijs.12484
Retail health clinics: What is their role in ObGyn care?
Retail Health Clinics (RHCs) are health care facilities located in high-traffic retail outlets with adjacent pharmacies that are intended to provide convenient and affordable care without sacrificing quality. The clinics add an option that complements services to individuals and families who otherwise would need to wait for an appointment with a traditional primary care physician or provider.1 Appointments are not necessary for episodic health needs. Usually open 7 days a week, RHCs offer extended hours on weekdays.2
The clinics are staffed by licensed, qualified advance practice providers, such as nurse practitioners and physician assistants, who are supervised by family physicians where required by state law. These clinicians have advanced education to diagnose, treat, and prescribe for nonemergent ailments such as colds and flu, rashes and skin irritation, and muscle strains or sprains.3 They are supported by an electronic health record that contains established evidence-based protocols.2,4
Evolution of retail health clinics
The first RHC, operated by QuickMedx, opened its doors in 2000 in Minneapolis– St. Paul.1,5 Only patients with a very limited number of illnesses were seen, and payment was cash. In 2005, this clinic was acquired by a major pharmacy retailer, which led to several acquisitions by other retailers and health care systems. In addition to accepting cash for a visit, the clinics formed contracts with health insurance companies. The average cost of a visit to an RHC in 2016 was estimated to be $70, considerably less than the cost at urgent care clinics ($124) and emergency rooms ($356).6
Today, more than 20 companies provide health care services at RHCs (TABLE 1). CVS (MinuteClinic) has the most retail clinics, followed by Walgreens, Kroger, Rite Aid, and Zoom+Care.1,2 There are now about 3,300 clinics in the United States, Canada, and Mexico (nearly all are located in the United States).2 Currently, RHCs are present in 44 states and the District of Columbia. Alabama, Alaska, Idaho, North Dakota, Vermont, and Wyoming are the only states without an RHC, while large-population states (California, Florida, Ohio, Pennsylvania, and Texas) have experienced an explosion in clinic openings.2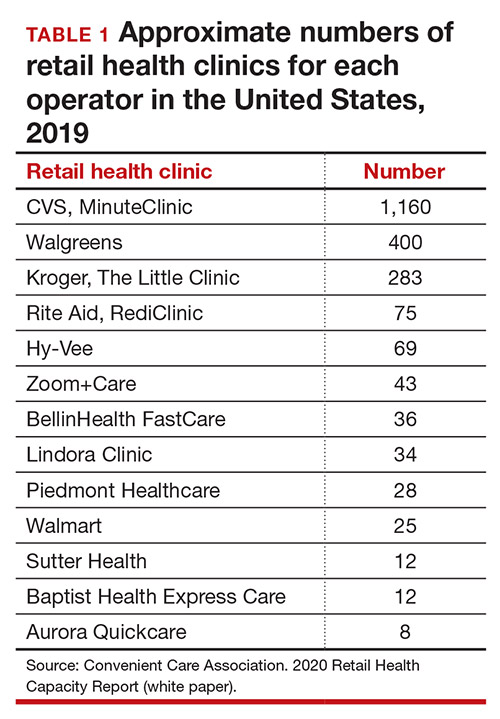
RHCs are found in high foot traffic locations, such as large retailers and grocery stores, and in prioritizing services such as drug stores. By analyzing 2019 clinic openings and population centers, the Convenient Care Association determined that more than half of the US population now lives within a 10-minute drive of an RHC.2 New locations are established on a regular basis, resulting in some flux in the total number of clinics.
Continue to: Services that RHCs provide...
Services that RHCs provide
As RHC locations expand, so do their services. Most RHCs pursue 1 of 2 models: health hubs or virtual care. Health hubs offer an expansion of services, which has resulted in retail health looking and operating more like the primary care providers in their communities.1,2 While most chains intend for patient visits to be brief, the growing health hub model intends to expand the period for patient visits. The major companies, CVS, Kroger, and Walmart, are offering an increase in their services and granting their providers a greater capacity to screen and treat patients for a wider range of conditions. By contrast, other clinic operators, such as Rite Aid RediClinics, are pursuing a more episodic and convenient care model with a greater adoption and expansion of telehealth and telemedicine.
Services at RHCs involve primarily acute care as well as some basic chronic disease management. About 90% of visits are for the following conditions: influenza, immunizations, upper respiratory infections, sinusitis, bronchitis, sore throat, inner ear infection, conjunctivitis, urinary tract infections, and blood tests.1-3 Other services available at most RHC locations involve screening and monitoring, wellness and physicals, travel health, treatment of minor injuries, and vaccinations and injections.
Women constitute half of all customers, and all RHCs offer women’s health services.7 Along with addressing acute care needs, women’s health services include contraception care and options, human papillomavirus (HPV) screening, pregnancy testing and initial prenatal evaluation, and evaluation for and treatment of urinary tract, bladder, and yeast infections.2,6
All RHCs provide counseling on sexual health concerns. Nearly all retail clinics in the United States provide screening and treatment for patients and their partners with sexually transmitted infections. RHC providers are required to follow up with patients regarding any blood work or culture results. When positive test results are confirmed for serious infections, such as hepatitis B and C, syphilis, and HIV, patients customarily are referred for treatment.2
The RHC patient base
RHCs serve an expanding base of patients who cite convenience as their primary motivation for utilizing these clinics. This consumer-driven market now encompasses, by some measures, nearly 50 million visits annually.2 These numbers have risen every year alongside a consistent increase in the number and spread of clinics across the country. During the COVID-19 pandemic, visits declined, consistent with other health care touchpoints, due to concerns about spreading the coronavirus.
The RHC industry has continued to adapt to a changing health care climate by embracing new telehealth solutions, enabling remote care, and expanding services by consumer demand.1,7 While convenience is a primary motivation for visiting an RHC, about two-thirds of RHC patients do not have a primary care provider.1 To support a broader continuum of care, RHCs regularly refer patients who do not have a primary care provider to other health care touchpoints when necessary.
Young and middle-aged adults (18–44 years) comprise the largest group of RHC patients. When patients were asked why they chose an RHC over “traditional doctors’ clinics,” many cited difficulties in accessing care, the appeal of lower costs, and proximity. The proportion of female RHC users was 50.9% and 56.8% for RHC nonusers.1-3
How RHCs compare with other episodic care clinics
The consumer has more choices to seek episodic care other than at physicians’ clinics or emergency rooms. An RHC, urgent care clinic, or freestanding emergency clinic increase access points for consumers. Along with the expanding number of RHCs, there are nearly 9,000 US urgent care centers, according to the Urgent Care Association, and more than 550 freestanding emergency rooms.8
The main differences between these episodic care clinics are shown in TABLE 2. Hours of operation, types of conditions, available providers, location of the facility, and estimated costs are compared. All provide expanded business hours. Retail clinics address some chronic disease management along with acute care, engage only advanced practitioners, use retail stores, and are less costly to consumers.3,4,9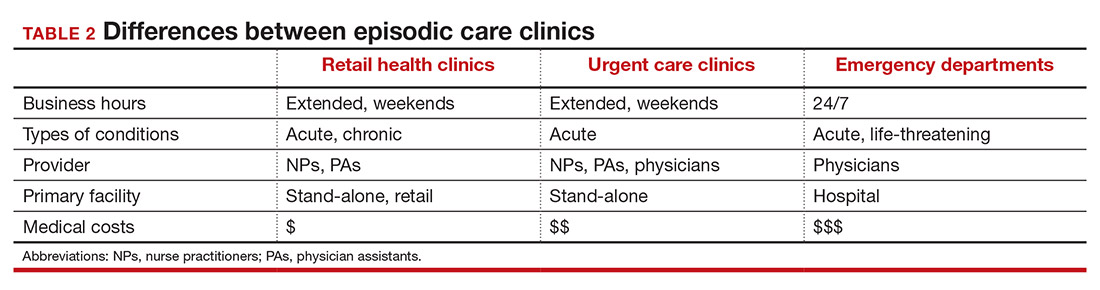
An RHC, urgent care clinic, or emergency department increases access points for consumers. Many emergency department visits can be handled in ambulatory settings such as RHCs and urgent care clinics.9,10 This can be helpful, especially in rural areas with a shortage of physicians. Most people want a relationship with a physician who will manage their care rather than seeing a different provider at every visit. While ObGyns deliver comprehensive care to women, however, in some underserved areas non-ObGyn clinics can fill the void. For example, RHCs can sometimes provide needed immunizations and health care information required in underserved areas.11
Many physicians are frustrated when they see patients who do not have a complete copy of their medical record and must piecemeal how to treat a patient. RHCs have adopted electronic medical records, and they regularly encourage patients to contact their physician (or find one, which can be difficult). Another limitation can be a referral from an RHC to a subspecialist rather than a primary care physician who could equally handle the condition.
Continue to: What ObGyns can do...
What ObGyns can do
Consumers have become accustomed to obtaining services where and when they want them, and they expect the same from their health care providers. While ObGyn practices are less affected by RHCs than family physicians or general internists, health care delivery in traditional clinics must be user friendly—that is, better, cheaper, and faster—for the patient-consumer to be more satisfied. Looking ahead, a nearby women’s health care group needs to have someone on call 24 hours a day, 7 days a week. That way, you can tell your patients that they can call you first if they need help. In the case of an ObGyn recommending that a patient go to an RHC or urgent care center, you will be aware of the visit and can follow up with your patient afterward.
Traditional clinics need to create ways for patients with acute illnesses to be seen that same day. Offering extended hours or technology options, such as online support, can help. Text message reminders, same-day access for appointments, and price transparency are necessary. It is important to encourage your women’s health patients to become more responsible for their own health and care, while taking into consideration their social determinants of health. While ObGyns should discuss with their patients when to visit an RHC (especially when their clinic is closed), emphasize that your own clinic is the patient’s medical home and encourage the importance of communicating what occurred during the RHC visit.
Working as a team by communicating well can create a community of health. It would be appropriate for you to represent your group by meeting practitioners at the nearby RHC. Being accessible and helpful would create a friendly and open professional relationship. Conversely, providers at retail clinics need to continually appreciate that women’s health clinics offer more comprehensive care. Select referrals from RHCs would help the most important person, the patient herself. ●
- Bachrach D, Frohlich J, Garcimonde A, et al. Building a culture of health: the value proposition of retail clinics. Robert Wood Johnson Foundation and Manatt Health. April 2015. https://www.rwjf.org/en/library/research/2015/04/the-value-proposition-of-retail-clinics.html. Accessed March 26, 2021.
- Bronstein N. Convenient Care Association–National Trade Association of Companies and Healthcare Systems for the Convenient Care Industry, January 1, 2020. https://www.ccaclinics.org/about-us/about-cca. Accessed January 10, 2021.
- Mehrotra A, Liu H, Adams JL, et al. Comparing costs and quality of care at retail clinics with that of other medical settings for 3 common illnesses. Ann Intern Med. 2009;151:321-328.
- Woodburn JD, Smith KL, Nelson GD. Quality of care in the retail health care setting using national clinical guidelines for acute pharyngitis. Am J Med Qual. 2007;22:457-462.
- Zamosky L. What retail clinic growth can teach physicians about patient demand. Threat or opportunity: retail clinic popularity is about convenience. Med Econ. 2014;91:22-24.
- SolvHealth website. Urgent care center vs emergency room. https://www.solvhealth.com/faq/urgent-care-center-vs-emergency-room. Accessed January, 13, 2021.
- Kvedar J, Coye MJ, Everett W. Connected health: a review of technologies and strategies to improve patient care with telemedicine and telehealth. Health Aff. 2014;33:194-199.
- Urgent Care Association website. Industry news: urgent care industry grows to more than 9,000 centers nationwide. February 24, 2020. https://www.ucaoa.org/About-UCA/Industry-News/ArtMID/10309/ArticleID/1468/INDUSTRY-NEWS-Urgent-Care-Industry-Grows-to-More-than-9000-Centers-Nationwide. Accessed March 26, 2021.
- Sussman A, Dunham L, Snower K, et al. Retail clinic utilization associated with lower total cost of care. Am J Manag Care. 2013;19:e148-57.
- Weinik RM, Burns RM, Mehrotra A. Many emergency department visits could be managed at urgent care centers and retail clinics. Health Aff. 2010;29:1630-1636.
- Goad JA, Taitel MS, Fensterheim LE, et al. Vaccinations administered during off-clinic hours at a national community pharmacy: implications for increasing patient access and convenience. Ann Fam Med. 2013;11:429-436.
Retail Health Clinics (RHCs) are health care facilities located in high-traffic retail outlets with adjacent pharmacies that are intended to provide convenient and affordable care without sacrificing quality. The clinics add an option that complements services to individuals and families who otherwise would need to wait for an appointment with a traditional primary care physician or provider.1 Appointments are not necessary for episodic health needs. Usually open 7 days a week, RHCs offer extended hours on weekdays.2
The clinics are staffed by licensed, qualified advance practice providers, such as nurse practitioners and physician assistants, who are supervised by family physicians where required by state law. These clinicians have advanced education to diagnose, treat, and prescribe for nonemergent ailments such as colds and flu, rashes and skin irritation, and muscle strains or sprains.3 They are supported by an electronic health record that contains established evidence-based protocols.2,4
Evolution of retail health clinics
The first RHC, operated by QuickMedx, opened its doors in 2000 in Minneapolis– St. Paul.1,5 Only patients with a very limited number of illnesses were seen, and payment was cash. In 2005, this clinic was acquired by a major pharmacy retailer, which led to several acquisitions by other retailers and health care systems. In addition to accepting cash for a visit, the clinics formed contracts with health insurance companies. The average cost of a visit to an RHC in 2016 was estimated to be $70, considerably less than the cost at urgent care clinics ($124) and emergency rooms ($356).6
Today, more than 20 companies provide health care services at RHCs (TABLE 1). CVS (MinuteClinic) has the most retail clinics, followed by Walgreens, Kroger, Rite Aid, and Zoom+Care.1,2 There are now about 3,300 clinics in the United States, Canada, and Mexico (nearly all are located in the United States).2 Currently, RHCs are present in 44 states and the District of Columbia. Alabama, Alaska, Idaho, North Dakota, Vermont, and Wyoming are the only states without an RHC, while large-population states (California, Florida, Ohio, Pennsylvania, and Texas) have experienced an explosion in clinic openings.2
RHCs are found in high foot traffic locations, such as large retailers and grocery stores, and in prioritizing services such as drug stores. By analyzing 2019 clinic openings and population centers, the Convenient Care Association determined that more than half of the US population now lives within a 10-minute drive of an RHC.2 New locations are established on a regular basis, resulting in some flux in the total number of clinics.
Continue to: Services that RHCs provide...
Services that RHCs provide
As RHC locations expand, so do their services. Most RHCs pursue 1 of 2 models: health hubs or virtual care. Health hubs offer an expansion of services, which has resulted in retail health looking and operating more like the primary care providers in their communities.1,2 While most chains intend for patient visits to be brief, the growing health hub model intends to expand the period for patient visits. The major companies, CVS, Kroger, and Walmart, are offering an increase in their services and granting their providers a greater capacity to screen and treat patients for a wider range of conditions. By contrast, other clinic operators, such as Rite Aid RediClinics, are pursuing a more episodic and convenient care model with a greater adoption and expansion of telehealth and telemedicine.
Services at RHCs involve primarily acute care as well as some basic chronic disease management. About 90% of visits are for the following conditions: influenza, immunizations, upper respiratory infections, sinusitis, bronchitis, sore throat, inner ear infection, conjunctivitis, urinary tract infections, and blood tests.1-3 Other services available at most RHC locations involve screening and monitoring, wellness and physicals, travel health, treatment of minor injuries, and vaccinations and injections.
Women constitute half of all customers, and all RHCs offer women’s health services.7 Along with addressing acute care needs, women’s health services include contraception care and options, human papillomavirus (HPV) screening, pregnancy testing and initial prenatal evaluation, and evaluation for and treatment of urinary tract, bladder, and yeast infections.2,6
All RHCs provide counseling on sexual health concerns. Nearly all retail clinics in the United States provide screening and treatment for patients and their partners with sexually transmitted infections. RHC providers are required to follow up with patients regarding any blood work or culture results. When positive test results are confirmed for serious infections, such as hepatitis B and C, syphilis, and HIV, patients customarily are referred for treatment.2
The RHC patient base
RHCs serve an expanding base of patients who cite convenience as their primary motivation for utilizing these clinics. This consumer-driven market now encompasses, by some measures, nearly 50 million visits annually.2 These numbers have risen every year alongside a consistent increase in the number and spread of clinics across the country. During the COVID-19 pandemic, visits declined, consistent with other health care touchpoints, due to concerns about spreading the coronavirus.
The RHC industry has continued to adapt to a changing health care climate by embracing new telehealth solutions, enabling remote care, and expanding services by consumer demand.1,7 While convenience is a primary motivation for visiting an RHC, about two-thirds of RHC patients do not have a primary care provider.1 To support a broader continuum of care, RHCs regularly refer patients who do not have a primary care provider to other health care touchpoints when necessary.
Young and middle-aged adults (18–44 years) comprise the largest group of RHC patients. When patients were asked why they chose an RHC over “traditional doctors’ clinics,” many cited difficulties in accessing care, the appeal of lower costs, and proximity. The proportion of female RHC users was 50.9% and 56.8% for RHC nonusers.1-3
How RHCs compare with other episodic care clinics
The consumer has more choices to seek episodic care other than at physicians’ clinics or emergency rooms. An RHC, urgent care clinic, or freestanding emergency clinic increase access points for consumers. Along with the expanding number of RHCs, there are nearly 9,000 US urgent care centers, according to the Urgent Care Association, and more than 550 freestanding emergency rooms.8
The main differences between these episodic care clinics are shown in TABLE 2. Hours of operation, types of conditions, available providers, location of the facility, and estimated costs are compared. All provide expanded business hours. Retail clinics address some chronic disease management along with acute care, engage only advanced practitioners, use retail stores, and are less costly to consumers.3,4,9
An RHC, urgent care clinic, or emergency department increases access points for consumers. Many emergency department visits can be handled in ambulatory settings such as RHCs and urgent care clinics.9,10 This can be helpful, especially in rural areas with a shortage of physicians. Most people want a relationship with a physician who will manage their care rather than seeing a different provider at every visit. While ObGyns deliver comprehensive care to women, however, in some underserved areas non-ObGyn clinics can fill the void. For example, RHCs can sometimes provide needed immunizations and health care information required in underserved areas.11
Many physicians are frustrated when they see patients who do not have a complete copy of their medical record and must piecemeal how to treat a patient. RHCs have adopted electronic medical records, and they regularly encourage patients to contact their physician (or find one, which can be difficult). Another limitation can be a referral from an RHC to a subspecialist rather than a primary care physician who could equally handle the condition.
Continue to: What ObGyns can do...
What ObGyns can do
Consumers have become accustomed to obtaining services where and when they want them, and they expect the same from their health care providers. While ObGyn practices are less affected by RHCs than family physicians or general internists, health care delivery in traditional clinics must be user friendly—that is, better, cheaper, and faster—for the patient-consumer to be more satisfied. Looking ahead, a nearby women’s health care group needs to have someone on call 24 hours a day, 7 days a week. That way, you can tell your patients that they can call you first if they need help. In the case of an ObGyn recommending that a patient go to an RHC or urgent care center, you will be aware of the visit and can follow up with your patient afterward.
Traditional clinics need to create ways for patients with acute illnesses to be seen that same day. Offering extended hours or technology options, such as online support, can help. Text message reminders, same-day access for appointments, and price transparency are necessary. It is important to encourage your women’s health patients to become more responsible for their own health and care, while taking into consideration their social determinants of health. While ObGyns should discuss with their patients when to visit an RHC (especially when their clinic is closed), emphasize that your own clinic is the patient’s medical home and encourage the importance of communicating what occurred during the RHC visit.
Working as a team by communicating well can create a community of health. It would be appropriate for you to represent your group by meeting practitioners at the nearby RHC. Being accessible and helpful would create a friendly and open professional relationship. Conversely, providers at retail clinics need to continually appreciate that women’s health clinics offer more comprehensive care. Select referrals from RHCs would help the most important person, the patient herself. ●
- Bachrach D, Frohlich J, Garcimonde A, et al. Building a culture of health: the value proposition of retail clinics. Robert Wood Johnson Foundation and Manatt Health. April 2015. https://www.rwjf.org/en/library/research/2015/04/the-value-proposition-of-retail-clinics.html. Accessed March 26, 2021.
- Bronstein N. Convenient Care Association–National Trade Association of Companies and Healthcare Systems for the Convenient Care Industry, January 1, 2020. https://www.ccaclinics.org/about-us/about-cca. Accessed January 10, 2021.
- Mehrotra A, Liu H, Adams JL, et al. Comparing costs and quality of care at retail clinics with that of other medical settings for 3 common illnesses. Ann Intern Med. 2009;151:321-328.
- Woodburn JD, Smith KL, Nelson GD. Quality of care in the retail health care setting using national clinical guidelines for acute pharyngitis. Am J Med Qual. 2007;22:457-462.
- Zamosky L. What retail clinic growth can teach physicians about patient demand. Threat or opportunity: retail clinic popularity is about convenience. Med Econ. 2014;91:22-24.
- SolvHealth website. Urgent care center vs emergency room. https://www.solvhealth.com/faq/urgent-care-center-vs-emergency-room. Accessed January, 13, 2021.
- Kvedar J, Coye MJ, Everett W. Connected health: a review of technologies and strategies to improve patient care with telemedicine and telehealth. Health Aff. 2014;33:194-199.
- Urgent Care Association website. Industry news: urgent care industry grows to more than 9,000 centers nationwide. February 24, 2020. https://www.ucaoa.org/About-UCA/Industry-News/ArtMID/10309/ArticleID/1468/INDUSTRY-NEWS-Urgent-Care-Industry-Grows-to-More-than-9000-Centers-Nationwide. Accessed March 26, 2021.
- Sussman A, Dunham L, Snower K, et al. Retail clinic utilization associated with lower total cost of care. Am J Manag Care. 2013;19:e148-57.
- Weinik RM, Burns RM, Mehrotra A. Many emergency department visits could be managed at urgent care centers and retail clinics. Health Aff. 2010;29:1630-1636.
- Goad JA, Taitel MS, Fensterheim LE, et al. Vaccinations administered during off-clinic hours at a national community pharmacy: implications for increasing patient access and convenience. Ann Fam Med. 2013;11:429-436.

COVID-19 apps for the ObGyn health care provider: An update
More than one year after COVID-19 was declared a worldwide pandemic by the World Health Organization on March 11, 2020, the disease continues to persist, infecting more than 110 million individuals to date globally.1 As new information emerges about the coronavirus, the literature on diagnosis and management also has grown exponentially over the last year, including specific guidance for obstetric populations. With abundant information available to health care providers, COVID-19 mobile apps have the advantage of summarizing and presenting information in an organized and easily accessible manner.2
This updated review expands on a previous article by Bogaert and Chen at the start of the COVID-19 pandemic.3 Using the same methodology, in March 2021 we searched the Apple iTunes and Google Play stores using the term “COVID.” The search yielded 230 unique applications available for download. We excluded apps that were primarily developed as geographic area-specific case trackers or personal symptom trackers (193), those that provide telemedicine services (7), and nonmedical apps or ones published in a language other than English (20).
Here, we focus on the 3 mobile apps previously discussed (CDC, My Osler, and Relief Central) and 7 additional apps (TABLE). Most summarize information on the prevention, diagnosis, and treatment of coronavirus, and several also provide information on the COVID-19 vaccine. One app (COVID-19 Resource for Midwives) is specifically designed for obstetric providers, and 4 others (CDC, COVID-19 Protocols, Medscape, and WHO Academy) contain information on specific guidance for obstetric and gynecologic patient populations.
Each app was evaluated based on a condensed version of the APPLICATIONS scoring system, APPLI (comprehensiveness, price, platform, literature used, and special features).4
We hope that these mobile apps will assist the ObGyn health care provider in continuing to care for patients during this pandemic.
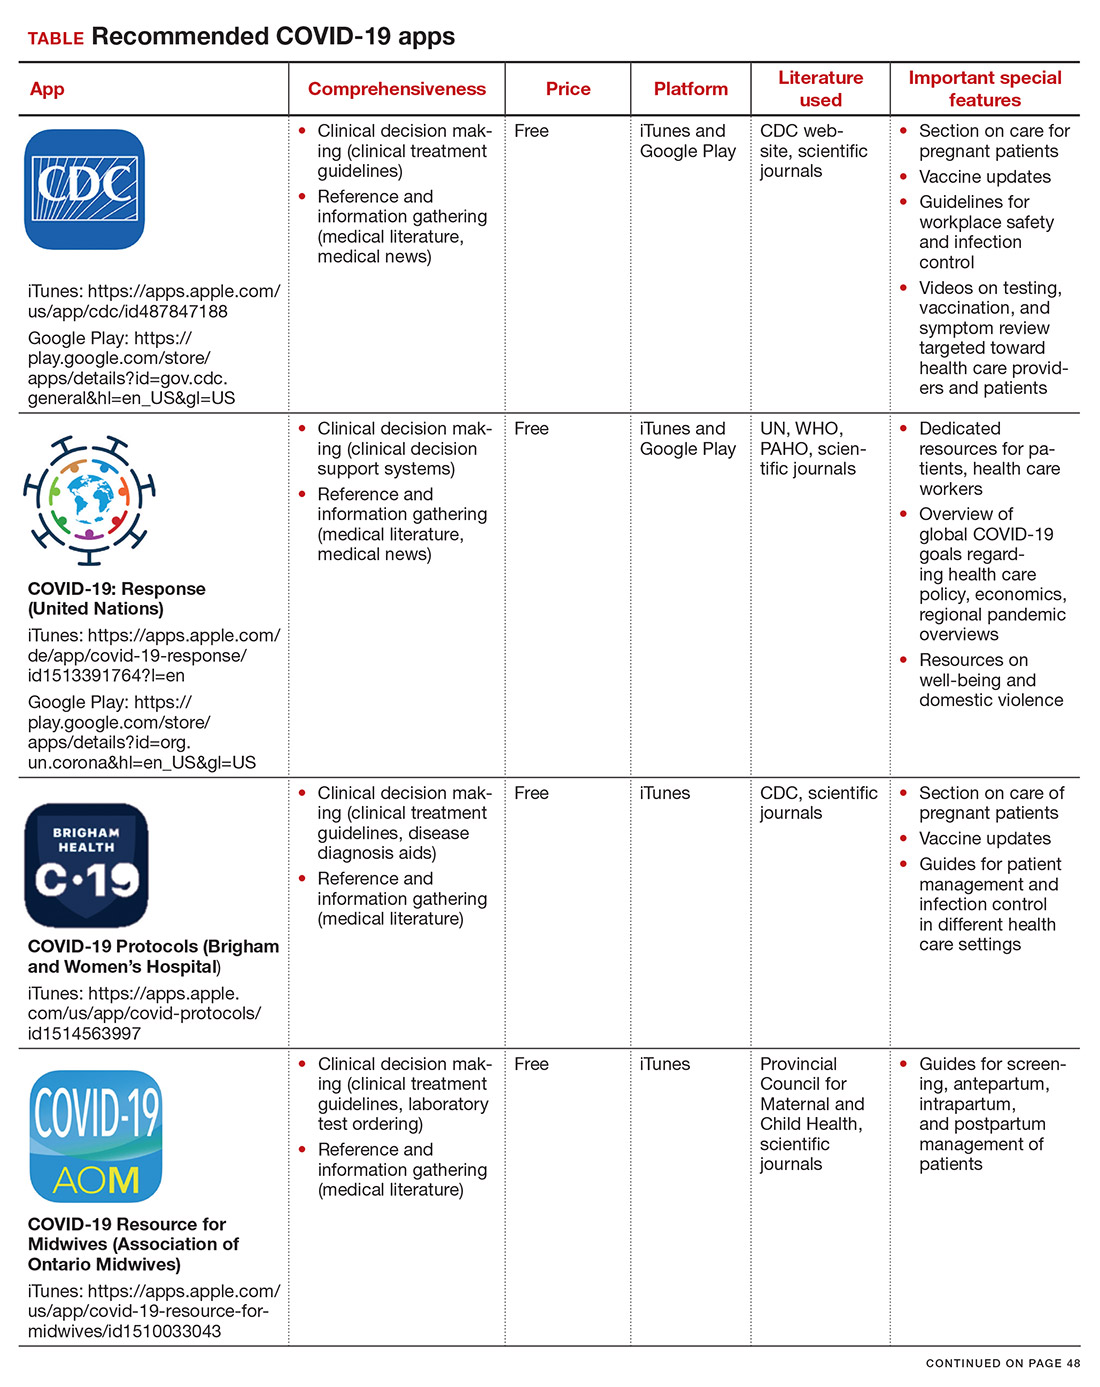
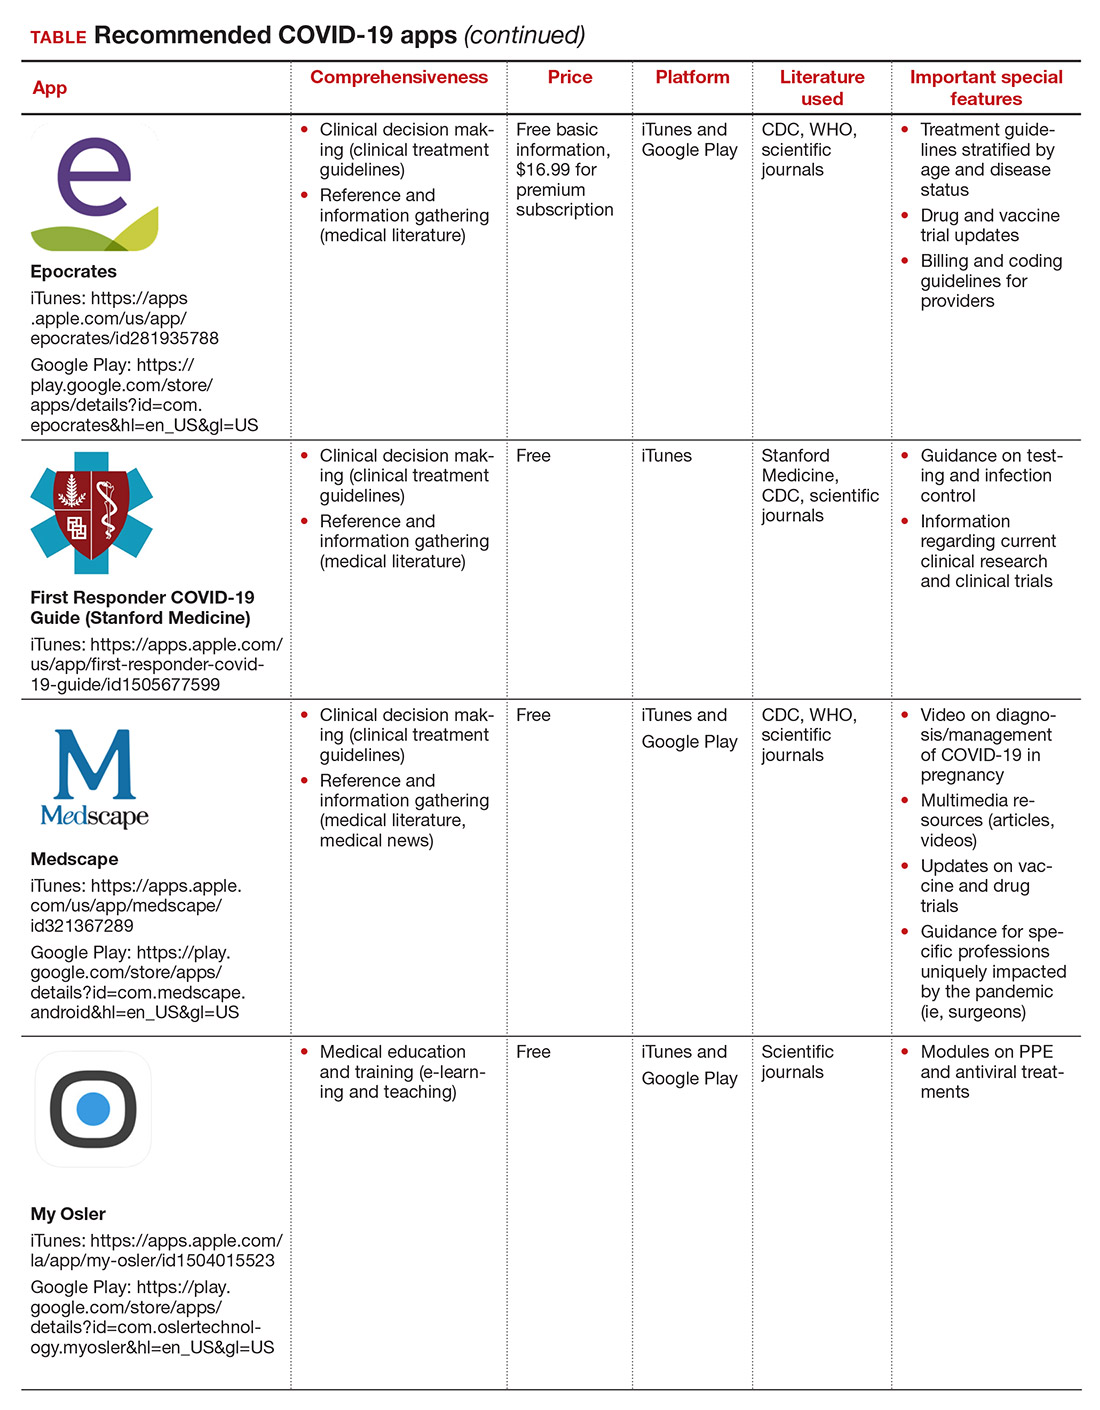
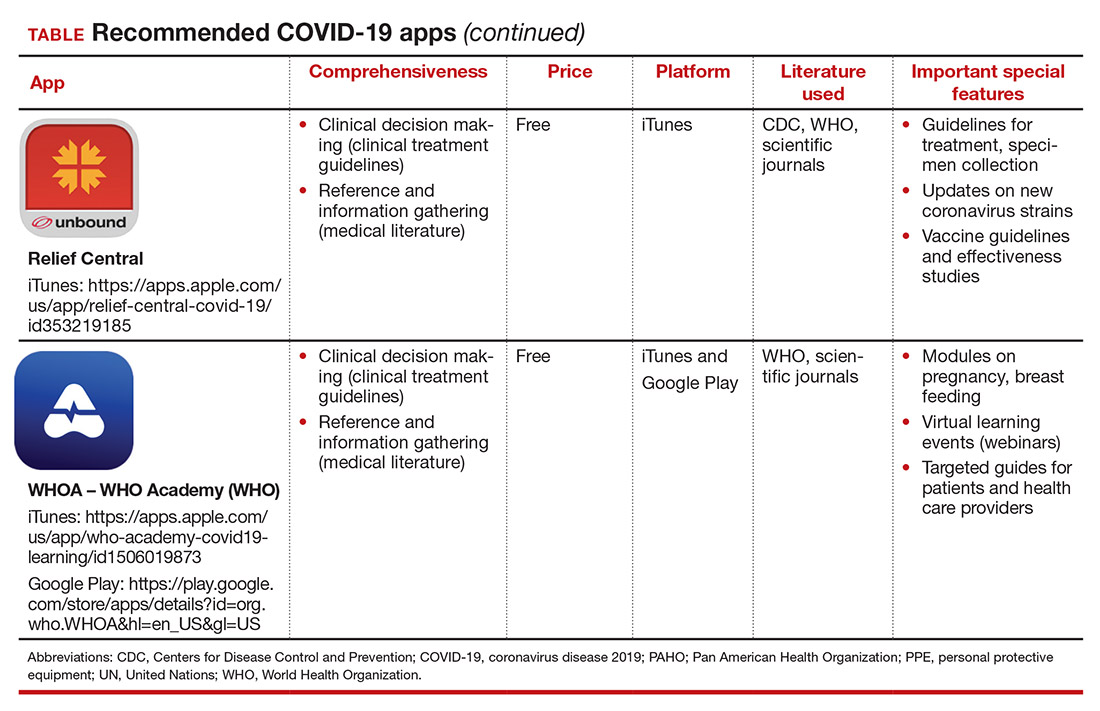
- World Health Organization. WHO coronavirus (COVID-19) dashboard. https://covid19.who.int/. Accessed March 12, 2021.
2. Kondylakis H, Katehakis DG, Kouroubali A, et al. COVID-19 mobile apps: a systematic review of the literature. J Med Internet Res. 2020;22:e23170.
3. Bogaert K, Chen KT. COVID-19 apps for the ObGyn health care provider. OBG Manag. 2020; 32(5):44, 46.
4. Chyjek K, Farag S, Chen KT. Rating pregnancy wheel applications using the APPLICATIONS scoring system. Obstet Gynecol. 2015;125:1478-1483.

Dr. Lillian Chen is a first-year resident in the Department of Obstetrics, Gynecology, and Reproductive Science, Icahn School of Medicine at Mount Sinai, New York, New York.

Dr. Katherine Chen is Professor of Obstetrics, Gynecology, and Reproductive Science and Medical Education, Vice-Chair of Ob-Gyn Education for the Mount Sinai Health System, Icahn School of Medicine at Mount Sinai, New York. She is an OBG Management Contributing Editor.
Dr. Katherine Chen reports being an advisory board member and receiving royalties from UpToDate, Inc. Dr. Lillian Chen reports no financial relationships relevant to this article.
Dr. Lillian Chen is a first-year resident in the Department of Obstetrics, Gynecology, and Reproductive Science, Icahn School of Medicine at Mount Sinai, New York, New York.
Dr. Katherine Chen is Professor of Obstetrics, Gynecology, and Reproductive Science and Medical Education, Vice-Chair of Ob-Gyn Education for the Mount Sinai Health System, Icahn School of Medicine at Mount Sinai, New York. She is an OBG Management Contributing Editor.
Dr. Katherine Chen reports being an advisory board member and receiving royalties from UpToDate, Inc. Dr. Lillian Chen reports no financial relationships relevant to this article.
More than one year after COVID-19 was declared a worldwide pandemic by the World Health Organization on March 11, 2020, the disease continues to persist, infecting more than 110 million individuals to date globally.1 As new information emerges about the coronavirus, the literature on diagnosis and management also has grown exponentially over the last year, including specific guidance for obstetric populations. With abundant information available to health care providers, COVID-19 mobile apps have the advantage of summarizing and presenting information in an organized and easily accessible manner.2
This updated review expands on a previous article by Bogaert and Chen at the start of the COVID-19 pandemic.3 Using the same methodology, in March 2021 we searched the Apple iTunes and Google Play stores using the term “COVID.” The search yielded 230 unique applications available for download. We excluded apps that were primarily developed as geographic area-specific case trackers or personal symptom trackers (193), those that provide telemedicine services (7), and nonmedical apps or ones published in a language other than English (20).
Here, we focus on the 3 mobile apps previously discussed (CDC, My Osler, and Relief Central) and 7 additional apps (TABLE). Most summarize information on the prevention, diagnosis, and treatment of coronavirus, and several also provide information on the COVID-19 vaccine. One app (COVID-19 Resource for Midwives) is specifically designed for obstetric providers, and 4 others (CDC, COVID-19 Protocols, Medscape, and WHO Academy) contain information on specific guidance for obstetric and gynecologic patient populations.
Each app was evaluated based on a condensed version of the APPLICATIONS scoring system, APPLI (comprehensiveness, price, platform, literature used, and special features).4
We hope that these mobile apps will assist the ObGyn health care provider in continuing to care for patients during this pandemic.
- World Health Organization. WHO coronavirus (COVID-19) dashboard. https://covid19.who.int/. Accessed March 12, 2021.
2. Kondylakis H, Katehakis DG, Kouroubali A, et al. COVID-19 mobile apps: a systematic review of the literature. J Med Internet Res. 2020;22:e23170.
3. Bogaert K, Chen KT. COVID-19 apps for the ObGyn health care provider. OBG Manag. 2020; 32(5):44, 46.
4. Chyjek K, Farag S, Chen KT. Rating pregnancy wheel applications using the APPLICATIONS scoring system. Obstet Gynecol. 2015;125:1478-1483.

Integrating primary care into a community mental health center
THE CASE
John C* is a 57-year-old man with hypertension, hyperlipidemia, and schizophrenia who followed up with a psychiatrist monthly at the community mental health center (CMHC). He had no primary care doctor. His psychiatrist referred him to our new Integrated Behavioral Health (IBH) clinic, also located in the CMHC, to see a family physician for complaints of urinary frequency, blurred vision, thirst, and weight loss. An on-site fingerstick revealed his blood glucose to be 357 mg/dL. Given the presumptive diagnosis of diabetes, we checked his bloodwork, prescribed metformin, and referred him for diabetes education. That evening, his lab results showed a hemoglobin A1C > 17%, a basic metabolic panel with an anion gap, ketones in the urine, and a low C-peptide level. We were unable to reach Mr. C by phone for further management.
● How would you proceed with this patient?
* The patient’s name has been changed to protect his identity.
Coordination of behavioral health and primary care can take many forms, from simple synchronized care via referral, to co-located services, to fully integrated care.1 Reverse integration, the subject of this article, is the provision of primary care in mental health or substance use disorder treatment settings. Published evidence to date regarding this model is minimal. This article describes our experience in developing a model of reverse integration in which family physicians and nurse practitioners are embedded in a CMHC with psychiatric providers, counselors, and social workers to jointly address physical and behavioral health care issues and address social determinants of health.
The rationale for reverse integration
Many individuals with serious mental illness (SMI), including schizophrenia and bipolar disorder, have rates of comorbid chronic physical health conditions that are higher than in the general population. These conditions include obesity, diabetes, metabolic syndrome, cardiovascular disease, chronic obstructive pulmonary disease, HIV, viral hepatitis, and tuberculosis.2 Outcomes in the SMI group are also considerably worse than in the general population. People with SMI have a demonstrated loss of up to 32 years of potential life per patient compared with the general-population average, primarily due to poor physical health.2 Maladaptive health behaviors such as poor diet, lack of physical activity, tobacco use, and substance use contribute to this increased mortality.2,3 Social determinants of poor health are more prevalent among individuals with SMI, and a relative inability to collaborate in one’s own health care due to psychiatric symptoms further exacerbates the challenges.
Many individuals with SMI receive psychiatric care, case management, counseling, and psychosocial services in CMHCs. Their psychiatric caregiver may be their only regular health care provider. Family physicians—who receive residency training in behavioral health and social determinants of health in community settings—are distinctively capable of improving overall health care outcomes of patients with SMI.
THE ADVANTAGES OF A REVERSE-INTEGRATION PRACTICE MODEL
Delivering primary care in a CMHC with a behavioral health team can benefit patients with SMI and be a satisfying practice for family physicians. Specifically, family physicians
- find that caring for complex patients can be less stressful because they benefit from the knowledge and resources of the CMHC team. The CMHC team offers case management, counseling, employment services, and housing assistance, so the primary care provider and patient are well supported.
- see fewer patients per hour due to higher visit complexity (and coding). In our experience, team-based care and additional time with patients make complex patient care more enjoyable and less frustrating.
- benefit from a situation in which patients feel safe because the CMHC support staff knows them well.
Continue to: Other benefits
Other benefits. When primary care is delivered in a CMHC, there are “huddles” and warm handoffs that allow for bidirectional collaboration and care coordination between the primary care and behavioral health teams in real time. In addition, family medicine residents, medical students, and other learners can be successfully included in an IBH clinic for patients with SMI. The behavioral health team provides the mentorship, education, and modelling of skills needed to work with this population, including limit-setting, empathy, patience, and motivational interviewing.
For their part, learners self-report increased comfort and interest in working with underserved populations and improved awareness of the social determinants of health after these experiences.4,5 Many patients at CMHCs are comfortable working with learners if continuity is maintained with a primary care provider.
Challenges we’ve faced, tips we can offer
For primary care providers, the unique workplace culture, terminology, and patient population encountered in a CMHC can be challenging. Also challenging can be the combining of things such as electronic medical records (EMRs).
Culture. The CMHC model focuses on team-based care spearheaded by case managers, in contrast to the traditional family medicine model wherein the physician coordinates services. Case managers provide assessments of client stability and readiness to be seen. They also attend primary care visits to support patient interactions, provide important psychosocial information, and assess adherence to care.
Terminology. It’s not always easy to shift to different terminology in this culture. Thus, orientation needs to address things such as the use of the word “patient,” rather than “client,” when charting.
Continue to: The complexities of the patient population
The complexities of the patient population. Many patients treated at a CMHC have a history of trauma, anxiety, and paranoia, requiring adjustments to exam practices such as using smaller speculums, providing more physical space, and offering to leave examination room doors open while patients are waiting.
In addition, individuals with SMI often have multiple health conditions, but they may become uncomfortable with physical closeness, grow tired of conversation, or feel overwhelmed when asked to complete multiple tasks in 1 visit. As a result, visits may need to be shorter and more frequent.
It’s also worth noting that, in our experience, CMHC patients may have a higher no-show rate than typical primary care clinics, requiring flexibility in scheduling. To fill vacant primary care time slots, our front desk staff uses strategies such as waiting lists and offering walk-in visits to patients who are on site for other services.
Ideally, IBH clinics use a single, fully integrated EMR, but this is not always possible. If the primary care and CMHC EMR systems do not connect, then record review and repeat documentation is needed, while care is taken to adhere to the confidentiality standards of a particular state.
Standards of care and state policies. Written standards of care, procedures, and accreditation in CMHCs rarely include provisions for common primary care practice, such as vaccines, in-clinic medications, and implements for simple procedures. To provide these services in our clinic, we ordered/stocked the needed supplies and instituted protocols that mirrored our other outpatient family medicine clinical sites.
Continue to: Some states may have...
Some states may have policies that prevent reimbursement for mental health and primary care services billed on the same day. Seeing a family physician and a psychiatry provider on the same day is convenient for patients and allows for collaboration between providers. But reimbursement rules can vary by state, so starting an IBH clinic like this requires research into local billing regulations.
WANT TO START AN INTEGRATED BEHAVIORAL HEALTH CLINIC?
Detailed instruction on starting a primary care clinic in a CMHC is beyond the scope of this article. However, the Substance Abuse and Mental Health Services Administration provides guidance on integrating primary care services into a local CMHC.6 Start by performing a baseline needs assessment of the CMHC and its patients to help guide clinic design. Leadership buy-in is key.
Leadership must provide adequate time and financial and technological support. This includes identifying appropriate space for primary care, offering training on using the EMR, and obtaining support from Finance to develop a realistic and competent business plan with an appropriate budgetary runway for start-up. (This may include securing grants in the beginning.)
We recommend starting small and expanding slowly. Once the clinic is operational, formal pathways for good communication are necessary. This includes holding regular team meetings to develop and revise clinic workflows—eg, patient enrollment, protocols, and administrative procedures such as managing medications and vaccinations—as well as addressing space, staffing, and training issues that arise. The IBH transitional leadership structure must include clinicians from both primary care and behavioral health, support staff, and the administration. Finally, you need the right staff—people who are passionate, flexible, and interested in trying something new.
THE CASE
The next day, an outreach was made to the CMHC nurse, who had the case manager go to Mr. C’s house and bring him to the CMHC for education on insulin injection, glucometer use, and diabetes nutrition. Mr. C was prescribed long-acting insulin at bedtime; his metformin was stopped and he was monitored closely.
Continue to: Mr. C now calls...
Mr. C now calls the CMHC nurse every few weeks to report his blood sugar levels, have his insulin dose adjusted, or just say “hello.” He continues to see his psychiatrist every month and his family physician every 4 months. The team collaborates as issues arise. His diabetes has been well controlled for more than 3 years.
The IBH clinic has grown in number of patients and family medicine providers, is self-sustaining, and has expanded services to include hepatitis C treatment.
1. Rajesh R, Tampi R, Balachandran S. The case for behavioral health integration into primary care. J Fam Pract. 2019;68:278-284.
2. Parks J, Svendsen D, Singer P, et al. Morbidity and Mortality in People with Serious Mental Illness. 2006. Accessed March 24, 2021. www.nasmhpd.org/sites/default/files/Mortality%20and%20Morbidity%20Final%20Report%208.18.08_0.pdf
3. Dickerson F, Stallings, CR, Origoni AE, et al. Cigarette Smoking among persons with schizophrenia or bipolar disorder in routine clinical settings, 1999-2011. Psychiatr Serv. 2013;64:44-50.
4. Raddock M, Antenucci C, Chrisman L. Innovative primary care training: caring for the urban underserved. Innovations in Education Poster Session, Case School of Medicine Annual Education Retreat, Cleveland, OH, March 3, 2016.
5. Berg K, Antenucci C, Raddock M, et al. Deciding to care: medical students and patients’ social circumstances. Poster: Annual meeting of the Society for Medical Decision Making. Pittsburgh, PA. October 2017.
6. Heath B, Wise Romero P, and Reynolds K. A standard framework for levels of integrated healthcare. Washington, D.C. SAMHSA-HRSA Center for Integrated Health Solutions. March 2013. Accessed March 24, 2021. www.pcpcc.org/resource/standard-framework-levels-integrated-healthcare
THE CASE
John C* is a 57-year-old man with hypertension, hyperlipidemia, and schizophrenia who followed up with a psychiatrist monthly at the community mental health center (CMHC). He had no primary care doctor. His psychiatrist referred him to our new Integrated Behavioral Health (IBH) clinic, also located in the CMHC, to see a family physician for complaints of urinary frequency, blurred vision, thirst, and weight loss. An on-site fingerstick revealed his blood glucose to be 357 mg/dL. Given the presumptive diagnosis of diabetes, we checked his bloodwork, prescribed metformin, and referred him for diabetes education. That evening, his lab results showed a hemoglobin A1C > 17%, a basic metabolic panel with an anion gap, ketones in the urine, and a low C-peptide level. We were unable to reach Mr. C by phone for further management.
● How would you proceed with this patient?
* The patient’s name has been changed to protect his identity.
Coordination of behavioral health and primary care can take many forms, from simple synchronized care via referral, to co-located services, to fully integrated care.1 Reverse integration, the subject of this article, is the provision of primary care in mental health or substance use disorder treatment settings. Published evidence to date regarding this model is minimal. This article describes our experience in developing a model of reverse integration in which family physicians and nurse practitioners are embedded in a CMHC with psychiatric providers, counselors, and social workers to jointly address physical and behavioral health care issues and address social determinants of health.
The rationale for reverse integration
Many individuals with serious mental illness (SMI), including schizophrenia and bipolar disorder, have rates of comorbid chronic physical health conditions that are higher than in the general population. These conditions include obesity, diabetes, metabolic syndrome, cardiovascular disease, chronic obstructive pulmonary disease, HIV, viral hepatitis, and tuberculosis.2 Outcomes in the SMI group are also considerably worse than in the general population. People with SMI have a demonstrated loss of up to 32 years of potential life per patient compared with the general-population average, primarily due to poor physical health.2 Maladaptive health behaviors such as poor diet, lack of physical activity, tobacco use, and substance use contribute to this increased mortality.2,3 Social determinants of poor health are more prevalent among individuals with SMI, and a relative inability to collaborate in one’s own health care due to psychiatric symptoms further exacerbates the challenges.
Many individuals with SMI receive psychiatric care, case management, counseling, and psychosocial services in CMHCs. Their psychiatric caregiver may be their only regular health care provider. Family physicians—who receive residency training in behavioral health and social determinants of health in community settings—are distinctively capable of improving overall health care outcomes of patients with SMI.
THE ADVANTAGES OF A REVERSE-INTEGRATION PRACTICE MODEL
Delivering primary care in a CMHC with a behavioral health team can benefit patients with SMI and be a satisfying practice for family physicians. Specifically, family physicians
- find that caring for complex patients can be less stressful because they benefit from the knowledge and resources of the CMHC team. The CMHC team offers case management, counseling, employment services, and housing assistance, so the primary care provider and patient are well supported.
- see fewer patients per hour due to higher visit complexity (and coding). In our experience, team-based care and additional time with patients make complex patient care more enjoyable and less frustrating.
- benefit from a situation in which patients feel safe because the CMHC support staff knows them well.
Continue to: Other benefits
Other benefits. When primary care is delivered in a CMHC, there are “huddles” and warm handoffs that allow for bidirectional collaboration and care coordination between the primary care and behavioral health teams in real time. In addition, family medicine residents, medical students, and other learners can be successfully included in an IBH clinic for patients with SMI. The behavioral health team provides the mentorship, education, and modelling of skills needed to work with this population, including limit-setting, empathy, patience, and motivational interviewing.
For their part, learners self-report increased comfort and interest in working with underserved populations and improved awareness of the social determinants of health after these experiences.4,5 Many patients at CMHCs are comfortable working with learners if continuity is maintained with a primary care provider.
Challenges we’ve faced, tips we can offer
For primary care providers, the unique workplace culture, terminology, and patient population encountered in a CMHC can be challenging. Also challenging can be the combining of things such as electronic medical records (EMRs).
Culture. The CMHC model focuses on team-based care spearheaded by case managers, in contrast to the traditional family medicine model wherein the physician coordinates services. Case managers provide assessments of client stability and readiness to be seen. They also attend primary care visits to support patient interactions, provide important psychosocial information, and assess adherence to care.
Terminology. It’s not always easy to shift to different terminology in this culture. Thus, orientation needs to address things such as the use of the word “patient,” rather than “client,” when charting.
Continue to: The complexities of the patient population
The complexities of the patient population. Many patients treated at a CMHC have a history of trauma, anxiety, and paranoia, requiring adjustments to exam practices such as using smaller speculums, providing more physical space, and offering to leave examination room doors open while patients are waiting.
In addition, individuals with SMI often have multiple health conditions, but they may become uncomfortable with physical closeness, grow tired of conversation, or feel overwhelmed when asked to complete multiple tasks in 1 visit. As a result, visits may need to be shorter and more frequent.
It’s also worth noting that, in our experience, CMHC patients may have a higher no-show rate than typical primary care clinics, requiring flexibility in scheduling. To fill vacant primary care time slots, our front desk staff uses strategies such as waiting lists and offering walk-in visits to patients who are on site for other services.
Ideally, IBH clinics use a single, fully integrated EMR, but this is not always possible. If the primary care and CMHC EMR systems do not connect, then record review and repeat documentation is needed, while care is taken to adhere to the confidentiality standards of a particular state.
Standards of care and state policies. Written standards of care, procedures, and accreditation in CMHCs rarely include provisions for common primary care practice, such as vaccines, in-clinic medications, and implements for simple procedures. To provide these services in our clinic, we ordered/stocked the needed supplies and instituted protocols that mirrored our other outpatient family medicine clinical sites.
Continue to: Some states may have...
Some states may have policies that prevent reimbursement for mental health and primary care services billed on the same day. Seeing a family physician and a psychiatry provider on the same day is convenient for patients and allows for collaboration between providers. But reimbursement rules can vary by state, so starting an IBH clinic like this requires research into local billing regulations.
WANT TO START AN INTEGRATED BEHAVIORAL HEALTH CLINIC?
Detailed instruction on starting a primary care clinic in a CMHC is beyond the scope of this article. However, the Substance Abuse and Mental Health Services Administration provides guidance on integrating primary care services into a local CMHC.6 Start by performing a baseline needs assessment of the CMHC and its patients to help guide clinic design. Leadership buy-in is key.
Leadership must provide adequate time and financial and technological support. This includes identifying appropriate space for primary care, offering training on using the EMR, and obtaining support from Finance to develop a realistic and competent business plan with an appropriate budgetary runway for start-up. (This may include securing grants in the beginning.)
We recommend starting small and expanding slowly. Once the clinic is operational, formal pathways for good communication are necessary. This includes holding regular team meetings to develop and revise clinic workflows—eg, patient enrollment, protocols, and administrative procedures such as managing medications and vaccinations—as well as addressing space, staffing, and training issues that arise. The IBH transitional leadership structure must include clinicians from both primary care and behavioral health, support staff, and the administration. Finally, you need the right staff—people who are passionate, flexible, and interested in trying something new.
THE CASE
The next day, an outreach was made to the CMHC nurse, who had the case manager go to Mr. C’s house and bring him to the CMHC for education on insulin injection, glucometer use, and diabetes nutrition. Mr. C was prescribed long-acting insulin at bedtime; his metformin was stopped and he was monitored closely.
Continue to: Mr. C now calls...
Mr. C now calls the CMHC nurse every few weeks to report his blood sugar levels, have his insulin dose adjusted, or just say “hello.” He continues to see his psychiatrist every month and his family physician every 4 months. The team collaborates as issues arise. His diabetes has been well controlled for more than 3 years.
The IBH clinic has grown in number of patients and family medicine providers, is self-sustaining, and has expanded services to include hepatitis C treatment.
THE CASE
John C* is a 57-year-old man with hypertension, hyperlipidemia, and schizophrenia who followed up with a psychiatrist monthly at the community mental health center (CMHC). He had no primary care doctor. His psychiatrist referred him to our new Integrated Behavioral Health (IBH) clinic, also located in the CMHC, to see a family physician for complaints of urinary frequency, blurred vision, thirst, and weight loss. An on-site fingerstick revealed his blood glucose to be 357 mg/dL. Given the presumptive diagnosis of diabetes, we checked his bloodwork, prescribed metformin, and referred him for diabetes education. That evening, his lab results showed a hemoglobin A1C > 17%, a basic metabolic panel with an anion gap, ketones in the urine, and a low C-peptide level. We were unable to reach Mr. C by phone for further management.
● How would you proceed with this patient?
* The patient’s name has been changed to protect his identity.
Coordination of behavioral health and primary care can take many forms, from simple synchronized care via referral, to co-located services, to fully integrated care.1 Reverse integration, the subject of this article, is the provision of primary care in mental health or substance use disorder treatment settings. Published evidence to date regarding this model is minimal. This article describes our experience in developing a model of reverse integration in which family physicians and nurse practitioners are embedded in a CMHC with psychiatric providers, counselors, and social workers to jointly address physical and behavioral health care issues and address social determinants of health.
The rationale for reverse integration
Many individuals with serious mental illness (SMI), including schizophrenia and bipolar disorder, have rates of comorbid chronic physical health conditions that are higher than in the general population. These conditions include obesity, diabetes, metabolic syndrome, cardiovascular disease, chronic obstructive pulmonary disease, HIV, viral hepatitis, and tuberculosis.2 Outcomes in the SMI group are also considerably worse than in the general population. People with SMI have a demonstrated loss of up to 32 years of potential life per patient compared with the general-population average, primarily due to poor physical health.2 Maladaptive health behaviors such as poor diet, lack of physical activity, tobacco use, and substance use contribute to this increased mortality.2,3 Social determinants of poor health are more prevalent among individuals with SMI, and a relative inability to collaborate in one’s own health care due to psychiatric symptoms further exacerbates the challenges.
Many individuals with SMI receive psychiatric care, case management, counseling, and psychosocial services in CMHCs. Their psychiatric caregiver may be their only regular health care provider. Family physicians—who receive residency training in behavioral health and social determinants of health in community settings—are distinctively capable of improving overall health care outcomes of patients with SMI.
THE ADVANTAGES OF A REVERSE-INTEGRATION PRACTICE MODEL
Delivering primary care in a CMHC with a behavioral health team can benefit patients with SMI and be a satisfying practice for family physicians. Specifically, family physicians
- find that caring for complex patients can be less stressful because they benefit from the knowledge and resources of the CMHC team. The CMHC team offers case management, counseling, employment services, and housing assistance, so the primary care provider and patient are well supported.
- see fewer patients per hour due to higher visit complexity (and coding). In our experience, team-based care and additional time with patients make complex patient care more enjoyable and less frustrating.
- benefit from a situation in which patients feel safe because the CMHC support staff knows them well.
Continue to: Other benefits
Other benefits. When primary care is delivered in a CMHC, there are “huddles” and warm handoffs that allow for bidirectional collaboration and care coordination between the primary care and behavioral health teams in real time. In addition, family medicine residents, medical students, and other learners can be successfully included in an IBH clinic for patients with SMI. The behavioral health team provides the mentorship, education, and modelling of skills needed to work with this population, including limit-setting, empathy, patience, and motivational interviewing.
For their part, learners self-report increased comfort and interest in working with underserved populations and improved awareness of the social determinants of health after these experiences.4,5 Many patients at CMHCs are comfortable working with learners if continuity is maintained with a primary care provider.
Challenges we’ve faced, tips we can offer
For primary care providers, the unique workplace culture, terminology, and patient population encountered in a CMHC can be challenging. Also challenging can be the combining of things such as electronic medical records (EMRs).
Culture. The CMHC model focuses on team-based care spearheaded by case managers, in contrast to the traditional family medicine model wherein the physician coordinates services. Case managers provide assessments of client stability and readiness to be seen. They also attend primary care visits to support patient interactions, provide important psychosocial information, and assess adherence to care.
Terminology. It’s not always easy to shift to different terminology in this culture. Thus, orientation needs to address things such as the use of the word “patient,” rather than “client,” when charting.
Continue to: The complexities of the patient population
The complexities of the patient population. Many patients treated at a CMHC have a history of trauma, anxiety, and paranoia, requiring adjustments to exam practices such as using smaller speculums, providing more physical space, and offering to leave examination room doors open while patients are waiting.
In addition, individuals with SMI often have multiple health conditions, but they may become uncomfortable with physical closeness, grow tired of conversation, or feel overwhelmed when asked to complete multiple tasks in 1 visit. As a result, visits may need to be shorter and more frequent.
It’s also worth noting that, in our experience, CMHC patients may have a higher no-show rate than typical primary care clinics, requiring flexibility in scheduling. To fill vacant primary care time slots, our front desk staff uses strategies such as waiting lists and offering walk-in visits to patients who are on site for other services.
Ideally, IBH clinics use a single, fully integrated EMR, but this is not always possible. If the primary care and CMHC EMR systems do not connect, then record review and repeat documentation is needed, while care is taken to adhere to the confidentiality standards of a particular state.
Standards of care and state policies. Written standards of care, procedures, and accreditation in CMHCs rarely include provisions for common primary care practice, such as vaccines, in-clinic medications, and implements for simple procedures. To provide these services in our clinic, we ordered/stocked the needed supplies and instituted protocols that mirrored our other outpatient family medicine clinical sites.
Continue to: Some states may have...
Some states may have policies that prevent reimbursement for mental health and primary care services billed on the same day. Seeing a family physician and a psychiatry provider on the same day is convenient for patients and allows for collaboration between providers. But reimbursement rules can vary by state, so starting an IBH clinic like this requires research into local billing regulations.
WANT TO START AN INTEGRATED BEHAVIORAL HEALTH CLINIC?
Detailed instruction on starting a primary care clinic in a CMHC is beyond the scope of this article. However, the Substance Abuse and Mental Health Services Administration provides guidance on integrating primary care services into a local CMHC.6 Start by performing a baseline needs assessment of the CMHC and its patients to help guide clinic design. Leadership buy-in is key.
Leadership must provide adequate time and financial and technological support. This includes identifying appropriate space for primary care, offering training on using the EMR, and obtaining support from Finance to develop a realistic and competent business plan with an appropriate budgetary runway for start-up. (This may include securing grants in the beginning.)
We recommend starting small and expanding slowly. Once the clinic is operational, formal pathways for good communication are necessary. This includes holding regular team meetings to develop and revise clinic workflows—eg, patient enrollment, protocols, and administrative procedures such as managing medications and vaccinations—as well as addressing space, staffing, and training issues that arise. The IBH transitional leadership structure must include clinicians from both primary care and behavioral health, support staff, and the administration. Finally, you need the right staff—people who are passionate, flexible, and interested in trying something new.
THE CASE
The next day, an outreach was made to the CMHC nurse, who had the case manager go to Mr. C’s house and bring him to the CMHC for education on insulin injection, glucometer use, and diabetes nutrition. Mr. C was prescribed long-acting insulin at bedtime; his metformin was stopped and he was monitored closely.
Continue to: Mr. C now calls...
Mr. C now calls the CMHC nurse every few weeks to report his blood sugar levels, have his insulin dose adjusted, or just say “hello.” He continues to see his psychiatrist every month and his family physician every 4 months. The team collaborates as issues arise. His diabetes has been well controlled for more than 3 years.
The IBH clinic has grown in number of patients and family medicine providers, is self-sustaining, and has expanded services to include hepatitis C treatment.
1. Rajesh R, Tampi R, Balachandran S. The case for behavioral health integration into primary care. J Fam Pract. 2019;68:278-284.
2. Parks J, Svendsen D, Singer P, et al. Morbidity and Mortality in People with Serious Mental Illness. 2006. Accessed March 24, 2021. www.nasmhpd.org/sites/default/files/Mortality%20and%20Morbidity%20Final%20Report%208.18.08_0.pdf
3. Dickerson F, Stallings, CR, Origoni AE, et al. Cigarette Smoking among persons with schizophrenia or bipolar disorder in routine clinical settings, 1999-2011. Psychiatr Serv. 2013;64:44-50.
4. Raddock M, Antenucci C, Chrisman L. Innovative primary care training: caring for the urban underserved. Innovations in Education Poster Session, Case School of Medicine Annual Education Retreat, Cleveland, OH, March 3, 2016.
5. Berg K, Antenucci C, Raddock M, et al. Deciding to care: medical students and patients’ social circumstances. Poster: Annual meeting of the Society for Medical Decision Making. Pittsburgh, PA. October 2017.
6. Heath B, Wise Romero P, and Reynolds K. A standard framework for levels of integrated healthcare. Washington, D.C. SAMHSA-HRSA Center for Integrated Health Solutions. March 2013. Accessed March 24, 2021. www.pcpcc.org/resource/standard-framework-levels-integrated-healthcare

Urine drug screening: A guide to monitoring Tx with controlled substances
An estimated 20 million patients in the United States have a substance use disorder (SUD), with hundreds of millions of prescriptions for controlled substances written annually. Consequently, urine drug screening (UDS) has become widely utilized to evaluate and treat patients with an SUD or on chronic opioid or benzodiazepine therapy.1
Used appropriately, UDS can be a valuable tool; there is ample evidence, however, that it has been misused, by some physicians, to stigmatize patients who use drugs of abuse,2 profile patients racially,2 profit from excessive testing,3 and inappropriately discontinue treatment.4

A patient-centered approach. We have extensive clinical experience in the use and interpretation of urine toxicology, serving as clinical leads in busy family medicine residency practices that care for patients with SUDs, and are often consulted regarding patients on chronic opioid or benzodiazepine therapy. We have encountered countless situations in which the correct interpretation of UDS is critical to providing care.
Over time, and after considerable trial and error, we developed the patient-centered approach to urine toxicology described in this article. We believe that the medical evidence strongly supports our approach to the appropriate use and interpretation of urine toxicology in clinical practice. Our review here is intended as a resource when you consider implementing a UDS protocol or are struggling with the management of unexpected results.
Urine toxicology for therapeutic drug monitoring
Prescribing a controlled substance carries inherent risks, including diversion, nonmedical use, and development of an SUD. Prescribed medications, particularly opioids and benzodiazepines, have been linked to a large increase in overdose deaths over the past decade.5 Several strategies have been investigated to mitigate risk (see “How frequently should a patient be tested?,” later in the article).
Clinical judgment—ie, when a physician orders a drug test upon suspecting that a patient is diverting a prescribed drug or has developed an SUD—has been shown to be highly inaccurate. Implicit racial bias might affect the physician’s judgment, leading to changes in testing and test interpretation. For example, Black patients were found to be 10% more likely to have drug screening ordered while being treated with long-term opioid therapy and 2 to 3 times more likely to have their medication discontinued as a result of a marijuana- or cocaine-positive test.2
Other studies have shown that testing patients for “bad behavior,” so to speak—reporting a prescription lost or stolen, consuming more than the prescribed dosage, visiting the office without an appointment, having multiple drug intolerances and allergies, and making frequent telephone calls to the practice—is ineffective.6 Patients with these behaviors were slightly more likely to unexpectedly test positive, or negative, on their UDS; however, many patients without suspect behavior also were found to have abnormal toxicology results.6 Data do not support therapeutic drug monitoring only of patients selected on the basis of aberrant behavior.6
Continue to: Questions and concerns about urine drug screening
Questions and concerns about urine drug screening
Why not just ask the patient? Studies have evaluated whether patient self-reporting of adherence is a feasible alternative to laboratory drug screening. Regrettably, patients have repeatedly been shown to underreport their use of both prescribed and illicit drugs.7,8
That question leads to another: Why do patients lie to their physician? It is easy to assume malicious intent, but a variety of obstacles might dissuade a patient from being fully truthful with their physician:
- Monetary gain. A small, but real, percentage of medications are diverted by patients for this reason.9
- Addiction, pseudo-addiction due to tolerance, and self-medication for psychological symptoms are clinically treatable syndromes that can lead to underreporting of prescribed and nonprescribed drug and alcohol use.
- Shame. Addiction is a highly stigmatized disease, and patients might simply be ashamed to admit that they need treatment: 13% to 38% of patients receiving chronic opioid therapy in a pain management or primary care setting have a clinically diagnosable SUD.10,11
Is consent needed to test or to share test results? Historically, UDS has been performed on patients without their consent or knowledge.12 Patients give a urine specimen to their physician for a variety of reasons; it seems easy to “add on” UDS. Evidence is clear, however, that confronting a patient about an unexpected test result can make the clinical outcome worse—often resulting in irreparable damage to the patient–physician relationship.12,13 Unless the patient is experiencing a medical emergency, guidelines unanimously recommend obtaining consent prior to testing.1,5,14
Federal law requires written permission from the patient for the physician to disclose information about alcohol or substance use, unless the information is expressly needed to provide care during a medical emergency. Substance use is highly stigmatized, and patients might—legitimately—fear that sharing their history could undermine their care.1,12,14
How frequently should a patient be tested? Experts recommend utilizing a risk-based strategy to determine the frequency of UDS.1,5,15 Validated risk-assessment questionnaires include:
- Opioid Risk Tool for Opioid Use Disorder (ORT-OUD)a
- Screener and Opioid Assessment for Patients With Pain–Revised (SOAPP-R)b
- Diagnosis, Intractability, Risk and Efficacy (DIRE)c
- Addiction Behaviors Checklist (ABC).d
Continue to: Each of these tools...
Each of these tools takes less than 5 minutes to administer and can be used by a primary care physician to objectively quantify the risk of prescribing; there is no evidence for the use of 1 of these screeners over the others.15 It is recommended that you choose a questionnaire that works for you and incorporate the risk assessment into prescribing any high-risk medication.1,5,15
Once you have completed an initial risk assessment, the frequency of UDS can be based on ongoing assessment that incorporates baseline testing, patient self-reporting, toxicology results, behavioral monitoring, and state database monitoring through a prescription drug monitoring program. Annual screening is appropriate in low-risk patients; moderate-risk patients should be screened twice a year, and high-risk patients should be screened at least every 4 months (FIGURE).15

Many state and federal agencies, health systems, employers, and insurers mandate the frequency of testing through guidelines or legislation. These regulations often are inconsistent with the newest medical evidence.15 Consult local guidelines and review the medical evidence and consensus recommendations on UDS.
What are the cost considerations in providing UDS? Insurers have been billed as much as $4000 for definitive chromatography testing (described later).3 This has led to insurance fraud, when drug-testing practices with a financial interest routinely use large and expensive test panels, test too frequently, or unnecessarily send for confirmatory or quantitative analysis of all positive tests.3,14 Often, insurers refuse to pay for unnecessary testing, leaving patients with significant indebtedness.3,14 Take time to review the evidence and consensus recommendations on UDS to avoid waste, potential accusations of fraud, and financial burden on your patients.
Urine toxicology for addiction treatment
UDS protocols in addiction settings are often different from those in which a controlled substance is being prescribed.
Continue to: Routine and random testing
Routine and random testing. Two common practices when treating addiction are to perform UDS on all patients, at every visit, or to test randomly.1 These practices can be problematic, however. Routine testing at every visit can make urine-tampering more likely and is often unnecessary for stable patients. Random testing can reduce the risk of urine-tampering, but it is often difficult for primary care clinics to institute such a protocol. Some clinics have patients provide a urine specimen at every visit and then only send tests to the lab based on randomization.1
Contingency management—a behavioral intervention in which a patient is rewarded, or their performance is reinforced, when they display evidence of positive change—is the most effective strategy used in addiction medicine to determine the frequency of patient visits and UDS.14,16 High-risk patients with self-reported active substance use or UDS results consistent with substance use, or both, are seen more often; as their addiction behavior diminishes, visits and UDS become less frequent. If addiction behavior increases, the patient is seen more often. Keep in mind that addiction behavior decreases over months of treatment, not immediately upon initiation.14,17 For contingency management to be successful, patient-centered interviewing and UDS will need to be employed frequently as the patient works toward meaningful change.14
The technology of urine drug screening
Two general techniques are used for UDS: immunoassay and chromatography. Each plays an important role in clinical practice; physicians must therefore maintain a basic understanding of the mechanism of each technique and their comparable advantages and disadvantages. Such an understanding allows for (1) matching the appropriate technique to the individual clinical scenario and (2) correctly interpreting results.
Immunoassay technology is used for point-of-care and rapid laboratory UDS, using antibodies to detect the drug or drug metabolite of interest. Antibodies utilized in immunoassays are designed to selectively bind a specific antigen—ie, a unique chemical structure within the drug of choice. Once bound, the antigen–antibody complex can be exploited for detection through various methods.
Chromatography–mass spectrometry is considered the gold standard for UDS, yielding confirmatory results. This is a 2-step process: Chromatography separates components within a specimen; mass spectrometry then identifies those components. Most laboratories employ liquid, rather than gas, chromatography. The specificity of the liquid chromatography–mass spectrometry method is such that a false-positive result is, essentially, impossible.18
Continue to: How is the appropriate tests elected for urine drug screening?
How is the appropriate tests elected for urine drug screening?
Variables that influence your choice of the proper test method include the clinical question at hand; cost; the urgency of obtaining results; and the stakes in that decision (ie, will the results be used to simply change the dosage of a medication or, of greater consequence, to determine fitness for employment or inform criminal justice decisions?). Each method of UDS has advantages that can be utilized and disadvantages that must be considered to obtain an accurate and useful result.
Immunoassay provides rapid results, is relatively easy to perform, and is, comparatively, inexpensive.1,14 The speed of results makes this method particularly useful in settings such as the emergency department, where rapid results are crucial. Ease of use makes immunoassay ideal for the office, where non-laboratory staff can be trained to properly administer the test.
A major disadvantage of immunoassay technology, however, is interference resulting in both false-positive and false-negative results, which is discussed in detail in the next section. Immunoassay should be considered a screening test that yields presumptive results.
Liquid chromatography–mass spectrometry is exquisitely specific and provides confirmatory test results—major advantages of the method. However, specificity comes at a price: significantly increased cost and longer wait time for results (typically days, if specimens are sent out to a laboratory). These barriers can make it impractical to employ this method in routine practice.
Interpretation of results: Not so fast
Interpreting UDS results is not as simple as noting a positive or negative result. Physicians must understand the concept of interference, so that results can be appropriately interpreted and confirmed. This is crucial when results influence clinical decisions; inappropriate action, taken on the basis of presumptive results, can have severe consequences for the patient–provider relationship and the treatment plan.1,14
Continue to: Interference falls into 2 categories...
Interference falls into 2 categories: variables inherent in the testing process and patient variables.
Antibody cross-reactivity. A major disadvantage of immunoassay technology is interference that results in false-positive and false-negative results.19,20 The source of this interference is antibody cross-reactivity—the degree to which an antibody binds to structurally similar compounds. Antibody–antigen interactions are incredibly complex; although assay antibodies are engineered to specifically detect a drug class of interest, reactivity with other, structurally similar compounds is unavoidable.
Nevertheless, cross-reactivity is a useful phenomenon that allows broad testing for multiple drugs within a class. For example, most point-of-care tests for benzodiazepines reliably detect diazepam and chlordiazepoxide. Likewise, opiate tests reliably detect natural opiates, such as morphine and codeine. Cross-reactivity is not limitless, however; most benzodiazepine immunoassays have poor reactivity to clonazepam and lorazepam, making it possible that a patient taking clonazepam tests negative for benzodiazepine on an immunoassay.14,20 Similarly, standard opioid tests have only moderate cross-reactivity for semisynthetic opioids, such as hydrocodone and hydromorphone; poor cross-reactivity for oxycodone and oxymorphone; and essentially no cross-reactivity for full synthetics, such as fentanyl and methadone.14
It is the responsibility of the ordering physician to understand cross-reactivity to various drugs within a testing class.
Whereas weak cross-reactivity to drugs within a class can be a source of false-negative results, cross-reactivity to drugs outside the class of interest is a source of false-positive results. An extensive review of drugs that cause false-positive immunoassay screening tests is outside the scope of this article; commonly prescribed medications implicated in false-positive results are listed in TABLE 1.19

Continue to: In general...
In general, amphetamine immunoassays produce frequent false-positive results, whereas cocaine and cannabinoid assays are more specific.1,18 Common over-the-counter medications, including nonsteroidal anti-inflammatory drugs, decongestants, and antacids, can yield false-positive results, highlighting the need to obtain a comprehensive medication list from patients, including over-the-counter and herbal medications, before ordering UDS. Because of the complexity of cross-reactivity, it might not be possible to identify the source of a false-positive result.14
Patient variables. Intentional effort to skew results is another source of interference. The frequency of this effort varies by setting and the potential consequences of results—eg, employment testing or substance use treatment—and a range of attempts have been reported in the literature.21,22 Common practices are dilution, adulteration, and substitution.20,23
- Dilution lowers the concentration of the drug of interest below the detection limit of the assay by directly adding water to the urine specimen, drinking copious amounts of fluid, taking a diuretic, or a combination of these practices.
- Adulteration involves adding a substance to urine that interferes with the testing mechanism: for example, bleach, household cleaners, eye drops, and even commercially available products expressly marketed to interfere with UDS.24
- Substitution involves providing urine or a urine-like substance for testing that did not originate from the patient.
Methods to minimize patient-related interference include observed collection and specimen validity testing for pH, creatinine, and adulterants (TABLE 2).1,15 Efforts to detect patient interference must be balanced against concerns about privacy, personnel resources, and the cost of expanded testing.14,19,20

Additional aspects inherent to the testing process, such as cutoff concentrations and detection windows, can lead to interference. Laboratories must set reporting cutoffs, and specimens with a drug concentration present but below the cutoff value are reported as a negative result. Detection windows are complex and are influenced by inherent properties of the drug, including metabolic pathway and route and frequency of use.1 A given patient might well be using a substance, but if the specimen was obtained outside the detection window, a false-negative result might be reported (TABLE 31,23).

Managing test results
Appropriate management of UDS results is built on the foundation of understanding the testing mechanism, selecting the correct test, and properly interpreting results. Drug testing is, ultimately, a therapeutic tool used to monitor treatment, provide reinforcement, and explore substance use behavior; results of testing should be employed to achieve those objectives.1,4,14 A negative or expected UDS result can be utilized as positive reinforcement for a patient who is adherent to the treatment plan—much the way objective weight loss in an obese patient can provide encouragement to continue lifestyle changes.
Continue to: Test results should be presented...
Test results should be presented in an objective, nonconfrontational, and compassionate manner, not with stigmatizing language, such as “clean” or “dirty.”1,13,14 Using stigmatizing terms such as “substance abuser” instead of “person with a substance use disorder” has been shown, even among highly trained health care professionals, to have a negative effect on patient care.13
Inevitably, you will encounter an unexpected result, and therefore must develop a rational, systematic, and compassionate management approach. “Unexpected result” is a broad term that includes results that conflict with
- a patient’s self-report
- your understanding of what the patient is taking (using)
- prescribed medications
- a patient’s typical substance use pattern.
When faced with an unexpected test result, first, ensure that the result in question is reliable. If a screening test yields an unanticipated finding—especially if it conflicts with the patient’s self-reporting—make every effort to seek confirmation if you are going to be making a significant clinical decision because of the result.1,14
Second, use your understanding of interference to consider the result in a broader context. If confirmatory results are inconsistent with a patient’s self-report, discuss whether there has been a break in the physician–patient relationship and emphasize that recurrent use or failure to adhere to a treatment plan has clear consequences.1,14 Modify the treatment plan to address the inconsistent finding by escalating care, adjusting medications, and connecting the patient to additional resources.
Third, keep in mind that a positive urine test is not diagnostic of an SUD. Occasional drug use is extremely common17 and should not categorically lead to a change in the treatment plan. Addiction is, fundamentally, a disease of disordered reward, motivation, and behavior that is defined by the consequences of substance use, not substance use per se,25 and an SUD diagnosis is complex, based on clinical history, physical examination, and laboratory testing. Similarly, a negative UDS result does not rule out an SUD.4,10
Continue to: Fourth, patient dismissal...
Fourth, patient dismissal is rarely an appropriate initial response to UDS results. Regrettably, some physicians misinterpret urine toxicology results and inappropriately discharge patients on that basis.
The Centers for Disease Control and Prevention guideline for prescribing opioids has increased utilization of UDS in primary care settings but does not provide the necessary education on proper use of the tool, which has resulted in a rise in misinterpretation and inappropriate discharge.13,26
If recurrent aberrant behavior is detected (by history or urine toxicology), do not abruptly discontinue the patient’s medication(s). Inform the patient of your concern, taper medication, and refer the patient to addiction treatment. Abrupt discontinuation of an opioid or benzodiazepine can lead to significant harm.1,14
CORRESPONDENCE
John Hayes, DO, Department of Family and Community Medicine, Medical College of Wisconsin, 1121 E North Avenue, Milwaukee, WI, 53212; jrhayes@mcw.edu
1. TAP 32: Clinical drug testing in primary care. Rockville, MD: Substance Abuse and Mental Health Services Administration, US Department of Health & Human Services; 2012. Technical Assistance Publication (TAP) 32; HHS Publication No. (SMA) 12-4668. 2012. Accessed March 19, 2021. https://store.samhsa.gov/sites/default/files/d7/priv/sma12-4668.pdf
2. Gaither JR, Gordon K, Crystal S, et al. Racial disparities in discontinuation of long-term opioid therapy following illicit drug use among black and white patients. Drug Alcohol Depend. 2018;192:371-376. https://doi.org/10.1016/j.drugalcdep.2018.05.033
3. Segal, David. In pursuit of liquid gold. The New York Times. December 27, 2017. Accessed March 19, 2021. https://nyti.ms/2E2GTOU
4. Ceasar R, Chang J, Zamora K, et al. Primary care providers’ experiences with urine toxicology tests to manage prescription opioid misuse and substance use among chronic noncancer pain patients in safety net health care settings. Subst Abus. 2016;37:154-160. https://doi.org/10.1080/08897077.2015.1132293
5. Dowell D, Haegerich TM, Chou R. CDC guideline for prescribing opioids for chronic pain — United States, 2016. MMWR Recomm Rep. 2016;65:1-49. https://doi.org/10.15585/mmwr.rr6501e1
6. Katz NP, Sherburne S, Beach M, et al. Behavioral monitoring and urine toxicology testing in patients receiving long-term opioid therapy. Anesth Analg. 2003;97:1097-1102. https://doi.org/ 10.1213/01.ane.0000080159.83342.b5
7. Wilcox CE, Bogenschutz MP, Nakazawa M, et al. Concordance between self-report and urine drug screen data in adolescent opioid dependent clinical trial participants. Addict Behav. 2013;38:2568-2574. https://doi.org/10.1016/j.addbeh.2013.05.015
8. Zanis DA, McLellan AT, Randall M. Can you trust patient self-reports of drug use during treatment? Drug Alcohol Depend. 1994;35:127-132. https://doi.org/10.1016/0376-8716(94)90119-8
9. Jones CM, Paulozzi LJ, Mack KA. Sources of prescription opioid pain relievers by frequency of past-year nonmedical use: United States, 2008-2011. JAMA Intern Med. 2014;174:802-803. https://doi.org/10.1001/jamainternmed.2013.12809
10. Katz N, Fanciullo GJ. Role of urine toxicology testing in the management of chronic opioid therapy. Clin J Pain. 2002;18(4 suppl):S76-S82. https://doi.org/10.1097/00002508-200207001-00009
11. Vowles KE, McEntee ML, Julnes PS, et al. Rates of opioid misuse, abuse, and addiction in chronic pain: a systematic review and data synthesis. Pain. 2015;156:569-576. https://doi.org/10.1097/01.j.pain.0000460357.01998.f1
12. Warner EA, Walker RM, Friedmann PD. Should informed consent be required for laboratory testing for drugs of abuse in medical settings? Am J Med. 2003;115:54-58. https://doi.org/10.1016/s0002-9343(03)00236-5
13. Kelly JF, Wakeman SE, Saitz R. Stop talking ‘dirty’: clinicians, language, and quality of care for the leading cause of preventable death in the United States. Am J Med. 2015;128:8-9. https://doi.org/10.1016/j.amjmed.2014.07.043
14. Jarvis M, Williams J, Hurford M, et al. Appropriate use of drug testing in clinical addiction medicine. J Addict Med. 2017;11:163-173. https://doi.org/10.1097/ADM.0000000000000323
15. Argoff CE, Alford DP, Fudin J, et al. Rational urine drug monitoring in patients receiving opioids for chronic pain: consensus recommendations. Pain Med. 2018;19:97-117. https://doi.org/10.1093/pm/pnx285
16 Ainscough TS, McNeill A, Strang J, et al. Contingency management interventions for non-prescribed drug use during treatment for opiate addiction: a systematic review and meta-analysis. Drug Alcohol Depend. 2017;178:318-339. https://doi.org/10.1016/j.drugalcdep.2017.05.028
17. Blum K, Han D, Femino J, et al. Systematic evaluation of “compliance” to prescribed treatment medications and “abstinence” from psychoactive drug abuse in chemical dependence programs: data from the comprehensive analysis of reported drugs. PLoS One. 2014;9:e104275. https://doi.org/10.1371/journal.pone.0104275
18. Miller SC, Fiellin DA, Rosenthal RN, et al. The ASAM Principles of Addiction Medicine. 6th ed. Wolters Kluwer; 2018.
19. Saitman A, Park H-D, Fitzgerald RL. False-positive interferences of common urine drug screen immunoassays: a review. J Anal Toxicol. 2014;38:387-396. https://doi.org/10.1093/jat/bku075
20. Smith MP, Bluth MH. Common interferences in drug testing. Clin Lab Med. 2016;36:663-671. https://doi.org/10.1016/j.cll.2016.07.006
21. George S, Braithwaite RA. An investigation into the extent of possible dilution of specimens received for urinary drugs of abuse screening. Addiction. 1995;90:967-970. https://doi.org/10.1046/j.1360-0443.1995.9079679.x
22. Beck O, Bohlin M, Bragd F, et al. Adulteration of urine drug testing—an exaggerated cause of concern. [Article in Swedish] Lakartidningen. 2000;97:703-706.
23. Kale N. Urine drug tests: ordering and interpreting results. Am Fam Physician. 2019;99:33-39.
24. Dasgupta A. The effects of adulterants and selected ingested compounds on drugs-of-abuse testing in urine. Am J Clin Pathol. 2007;128:491-503. https://doi.org/10.1309/FQY06F8XKTQPM149
25. Definition of addiction. American Society of Addiction Medicine Web site. Updated October 21, 2019. Accessed February 20, 2021. https://www.asam.org/resources/definition-of-addiction
26. Kroenke K, Alford DP, Argoff C, et al. Challenges with Implementing the Centers for Disease Control and Prevention Opioid Guideline: A Consensus Panel Report. Pain Med. 2019;20:724-735. https://doi.org/10.1093/pm/pny307
An estimated 20 million patients in the United States have a substance use disorder (SUD), with hundreds of millions of prescriptions for controlled substances written annually. Consequently, urine drug screening (UDS) has become widely utilized to evaluate and treat patients with an SUD or on chronic opioid or benzodiazepine therapy.1
Used appropriately, UDS can be a valuable tool; there is ample evidence, however, that it has been misused, by some physicians, to stigmatize patients who use drugs of abuse,2 profile patients racially,2 profit from excessive testing,3 and inappropriately discontinue treatment.4
A patient-centered approach. We have extensive clinical experience in the use and interpretation of urine toxicology, serving as clinical leads in busy family medicine residency practices that care for patients with SUDs, and are often consulted regarding patients on chronic opioid or benzodiazepine therapy. We have encountered countless situations in which the correct interpretation of UDS is critical to providing care.
Over time, and after considerable trial and error, we developed the patient-centered approach to urine toxicology described in this article. We believe that the medical evidence strongly supports our approach to the appropriate use and interpretation of urine toxicology in clinical practice. Our review here is intended as a resource when you consider implementing a UDS protocol or are struggling with the management of unexpected results.
Urine toxicology for therapeutic drug monitoring
Prescribing a controlled substance carries inherent risks, including diversion, nonmedical use, and development of an SUD. Prescribed medications, particularly opioids and benzodiazepines, have been linked to a large increase in overdose deaths over the past decade.5 Several strategies have been investigated to mitigate risk (see “How frequently should a patient be tested?,” later in the article).
Clinical judgment—ie, when a physician orders a drug test upon suspecting that a patient is diverting a prescribed drug or has developed an SUD—has been shown to be highly inaccurate. Implicit racial bias might affect the physician’s judgment, leading to changes in testing and test interpretation. For example, Black patients were found to be 10% more likely to have drug screening ordered while being treated with long-term opioid therapy and 2 to 3 times more likely to have their medication discontinued as a result of a marijuana- or cocaine-positive test.2
Other studies have shown that testing patients for “bad behavior,” so to speak—reporting a prescription lost or stolen, consuming more than the prescribed dosage, visiting the office without an appointment, having multiple drug intolerances and allergies, and making frequent telephone calls to the practice—is ineffective.6 Patients with these behaviors were slightly more likely to unexpectedly test positive, or negative, on their UDS; however, many patients without suspect behavior also were found to have abnormal toxicology results.6 Data do not support therapeutic drug monitoring only of patients selected on the basis of aberrant behavior.6
Continue to: Questions and concerns about urine drug screening
Questions and concerns about urine drug screening
Why not just ask the patient? Studies have evaluated whether patient self-reporting of adherence is a feasible alternative to laboratory drug screening. Regrettably, patients have repeatedly been shown to underreport their use of both prescribed and illicit drugs.7,8
That question leads to another: Why do patients lie to their physician? It is easy to assume malicious intent, but a variety of obstacles might dissuade a patient from being fully truthful with their physician:
- Monetary gain. A small, but real, percentage of medications are diverted by patients for this reason.9
- Addiction, pseudo-addiction due to tolerance, and self-medication for psychological symptoms are clinically treatable syndromes that can lead to underreporting of prescribed and nonprescribed drug and alcohol use.
- Shame. Addiction is a highly stigmatized disease, and patients might simply be ashamed to admit that they need treatment: 13% to 38% of patients receiving chronic opioid therapy in a pain management or primary care setting have a clinically diagnosable SUD.10,11
Is consent needed to test or to share test results? Historically, UDS has been performed on patients without their consent or knowledge.12 Patients give a urine specimen to their physician for a variety of reasons; it seems easy to “add on” UDS. Evidence is clear, however, that confronting a patient about an unexpected test result can make the clinical outcome worse—often resulting in irreparable damage to the patient–physician relationship.12,13 Unless the patient is experiencing a medical emergency, guidelines unanimously recommend obtaining consent prior to testing.1,5,14
Federal law requires written permission from the patient for the physician to disclose information about alcohol or substance use, unless the information is expressly needed to provide care during a medical emergency. Substance use is highly stigmatized, and patients might—legitimately—fear that sharing their history could undermine their care.1,12,14
How frequently should a patient be tested? Experts recommend utilizing a risk-based strategy to determine the frequency of UDS.1,5,15 Validated risk-assessment questionnaires include:
- Opioid Risk Tool for Opioid Use Disorder (ORT-OUD)a
- Screener and Opioid Assessment for Patients With Pain–Revised (SOAPP-R)b
- Diagnosis, Intractability, Risk and Efficacy (DIRE)c
- Addiction Behaviors Checklist (ABC).d
Continue to: Each of these tools...
Each of these tools takes less than 5 minutes to administer and can be used by a primary care physician to objectively quantify the risk of prescribing; there is no evidence for the use of 1 of these screeners over the others.15 It is recommended that you choose a questionnaire that works for you and incorporate the risk assessment into prescribing any high-risk medication.1,5,15
Once you have completed an initial risk assessment, the frequency of UDS can be based on ongoing assessment that incorporates baseline testing, patient self-reporting, toxicology results, behavioral monitoring, and state database monitoring through a prescription drug monitoring program. Annual screening is appropriate in low-risk patients; moderate-risk patients should be screened twice a year, and high-risk patients should be screened at least every 4 months (FIGURE).15
Many state and federal agencies, health systems, employers, and insurers mandate the frequency of testing through guidelines or legislation. These regulations often are inconsistent with the newest medical evidence.15 Consult local guidelines and review the medical evidence and consensus recommendations on UDS.
What are the cost considerations in providing UDS? Insurers have been billed as much as $4000 for definitive chromatography testing (described later).3 This has led to insurance fraud, when drug-testing practices with a financial interest routinely use large and expensive test panels, test too frequently, or unnecessarily send for confirmatory or quantitative analysis of all positive tests.3,14 Often, insurers refuse to pay for unnecessary testing, leaving patients with significant indebtedness.3,14 Take time to review the evidence and consensus recommendations on UDS to avoid waste, potential accusations of fraud, and financial burden on your patients.
Urine toxicology for addiction treatment
UDS protocols in addiction settings are often different from those in which a controlled substance is being prescribed.
Continue to: Routine and random testing
Routine and random testing. Two common practices when treating addiction are to perform UDS on all patients, at every visit, or to test randomly.1 These practices can be problematic, however. Routine testing at every visit can make urine-tampering more likely and is often unnecessary for stable patients. Random testing can reduce the risk of urine-tampering, but it is often difficult for primary care clinics to institute such a protocol. Some clinics have patients provide a urine specimen at every visit and then only send tests to the lab based on randomization.1
Contingency management—a behavioral intervention in which a patient is rewarded, or their performance is reinforced, when they display evidence of positive change—is the most effective strategy used in addiction medicine to determine the frequency of patient visits and UDS.14,16 High-risk patients with self-reported active substance use or UDS results consistent with substance use, or both, are seen more often; as their addiction behavior diminishes, visits and UDS become less frequent. If addiction behavior increases, the patient is seen more often. Keep in mind that addiction behavior decreases over months of treatment, not immediately upon initiation.14,17 For contingency management to be successful, patient-centered interviewing and UDS will need to be employed frequently as the patient works toward meaningful change.14
The technology of urine drug screening
Two general techniques are used for UDS: immunoassay and chromatography. Each plays an important role in clinical practice; physicians must therefore maintain a basic understanding of the mechanism of each technique and their comparable advantages and disadvantages. Such an understanding allows for (1) matching the appropriate technique to the individual clinical scenario and (2) correctly interpreting results.
Immunoassay technology is used for point-of-care and rapid laboratory UDS, using antibodies to detect the drug or drug metabolite of interest. Antibodies utilized in immunoassays are designed to selectively bind a specific antigen—ie, a unique chemical structure within the drug of choice. Once bound, the antigen–antibody complex can be exploited for detection through various methods.
Chromatography–mass spectrometry is considered the gold standard for UDS, yielding confirmatory results. This is a 2-step process: Chromatography separates components within a specimen; mass spectrometry then identifies those components. Most laboratories employ liquid, rather than gas, chromatography. The specificity of the liquid chromatography–mass spectrometry method is such that a false-positive result is, essentially, impossible.18
Continue to: How is the appropriate tests elected for urine drug screening?
How is the appropriate tests elected for urine drug screening?
Variables that influence your choice of the proper test method include the clinical question at hand; cost; the urgency of obtaining results; and the stakes in that decision (ie, will the results be used to simply change the dosage of a medication or, of greater consequence, to determine fitness for employment or inform criminal justice decisions?). Each method of UDS has advantages that can be utilized and disadvantages that must be considered to obtain an accurate and useful result.
Immunoassay provides rapid results, is relatively easy to perform, and is, comparatively, inexpensive.1,14 The speed of results makes this method particularly useful in settings such as the emergency department, where rapid results are crucial. Ease of use makes immunoassay ideal for the office, where non-laboratory staff can be trained to properly administer the test.
A major disadvantage of immunoassay technology, however, is interference resulting in both false-positive and false-negative results, which is discussed in detail in the next section. Immunoassay should be considered a screening test that yields presumptive results.
Liquid chromatography–mass spectrometry is exquisitely specific and provides confirmatory test results—major advantages of the method. However, specificity comes at a price: significantly increased cost and longer wait time for results (typically days, if specimens are sent out to a laboratory). These barriers can make it impractical to employ this method in routine practice.
Interpretation of results: Not so fast
Interpreting UDS results is not as simple as noting a positive or negative result. Physicians must understand the concept of interference, so that results can be appropriately interpreted and confirmed. This is crucial when results influence clinical decisions; inappropriate action, taken on the basis of presumptive results, can have severe consequences for the patient–provider relationship and the treatment plan.1,14
Continue to: Interference falls into 2 categories...
Interference falls into 2 categories: variables inherent in the testing process and patient variables.
Antibody cross-reactivity. A major disadvantage of immunoassay technology is interference that results in false-positive and false-negative results.19,20 The source of this interference is antibody cross-reactivity—the degree to which an antibody binds to structurally similar compounds. Antibody–antigen interactions are incredibly complex; although assay antibodies are engineered to specifically detect a drug class of interest, reactivity with other, structurally similar compounds is unavoidable.
Nevertheless, cross-reactivity is a useful phenomenon that allows broad testing for multiple drugs within a class. For example, most point-of-care tests for benzodiazepines reliably detect diazepam and chlordiazepoxide. Likewise, opiate tests reliably detect natural opiates, such as morphine and codeine. Cross-reactivity is not limitless, however; most benzodiazepine immunoassays have poor reactivity to clonazepam and lorazepam, making it possible that a patient taking clonazepam tests negative for benzodiazepine on an immunoassay.14,20 Similarly, standard opioid tests have only moderate cross-reactivity for semisynthetic opioids, such as hydrocodone and hydromorphone; poor cross-reactivity for oxycodone and oxymorphone; and essentially no cross-reactivity for full synthetics, such as fentanyl and methadone.14
It is the responsibility of the ordering physician to understand cross-reactivity to various drugs within a testing class.
Whereas weak cross-reactivity to drugs within a class can be a source of false-negative results, cross-reactivity to drugs outside the class of interest is a source of false-positive results. An extensive review of drugs that cause false-positive immunoassay screening tests is outside the scope of this article; commonly prescribed medications implicated in false-positive results are listed in TABLE 1.19
Continue to: In general...
In general, amphetamine immunoassays produce frequent false-positive results, whereas cocaine and cannabinoid assays are more specific.1,18 Common over-the-counter medications, including nonsteroidal anti-inflammatory drugs, decongestants, and antacids, can yield false-positive results, highlighting the need to obtain a comprehensive medication list from patients, including over-the-counter and herbal medications, before ordering UDS. Because of the complexity of cross-reactivity, it might not be possible to identify the source of a false-positive result.14
Patient variables. Intentional effort to skew results is another source of interference. The frequency of this effort varies by setting and the potential consequences of results—eg, employment testing or substance use treatment—and a range of attempts have been reported in the literature.21,22 Common practices are dilution, adulteration, and substitution.20,23
- Dilution lowers the concentration of the drug of interest below the detection limit of the assay by directly adding water to the urine specimen, drinking copious amounts of fluid, taking a diuretic, or a combination of these practices.
- Adulteration involves adding a substance to urine that interferes with the testing mechanism: for example, bleach, household cleaners, eye drops, and even commercially available products expressly marketed to interfere with UDS.24
- Substitution involves providing urine or a urine-like substance for testing that did not originate from the patient.
Methods to minimize patient-related interference include observed collection and specimen validity testing for pH, creatinine, and adulterants (TABLE 2).1,15 Efforts to detect patient interference must be balanced against concerns about privacy, personnel resources, and the cost of expanded testing.14,19,20
Additional aspects inherent to the testing process, such as cutoff concentrations and detection windows, can lead to interference. Laboratories must set reporting cutoffs, and specimens with a drug concentration present but below the cutoff value are reported as a negative result. Detection windows are complex and are influenced by inherent properties of the drug, including metabolic pathway and route and frequency of use.1 A given patient might well be using a substance, but if the specimen was obtained outside the detection window, a false-negative result might be reported (TABLE 31,23).
Managing test results
Appropriate management of UDS results is built on the foundation of understanding the testing mechanism, selecting the correct test, and properly interpreting results. Drug testing is, ultimately, a therapeutic tool used to monitor treatment, provide reinforcement, and explore substance use behavior; results of testing should be employed to achieve those objectives.1,4,14 A negative or expected UDS result can be utilized as positive reinforcement for a patient who is adherent to the treatment plan—much the way objective weight loss in an obese patient can provide encouragement to continue lifestyle changes.
Continue to: Test results should be presented...
Test results should be presented in an objective, nonconfrontational, and compassionate manner, not with stigmatizing language, such as “clean” or “dirty.”1,13,14 Using stigmatizing terms such as “substance abuser” instead of “person with a substance use disorder” has been shown, even among highly trained health care professionals, to have a negative effect on patient care.13
Inevitably, you will encounter an unexpected result, and therefore must develop a rational, systematic, and compassionate management approach. “Unexpected result” is a broad term that includes results that conflict with
- a patient’s self-report
- your understanding of what the patient is taking (using)
- prescribed medications
- a patient’s typical substance use pattern.
When faced with an unexpected test result, first, ensure that the result in question is reliable. If a screening test yields an unanticipated finding—especially if it conflicts with the patient’s self-reporting—make every effort to seek confirmation if you are going to be making a significant clinical decision because of the result.1,14
Second, use your understanding of interference to consider the result in a broader context. If confirmatory results are inconsistent with a patient’s self-report, discuss whether there has been a break in the physician–patient relationship and emphasize that recurrent use or failure to adhere to a treatment plan has clear consequences.1,14 Modify the treatment plan to address the inconsistent finding by escalating care, adjusting medications, and connecting the patient to additional resources.
Third, keep in mind that a positive urine test is not diagnostic of an SUD. Occasional drug use is extremely common17 and should not categorically lead to a change in the treatment plan. Addiction is, fundamentally, a disease of disordered reward, motivation, and behavior that is defined by the consequences of substance use, not substance use per se,25 and an SUD diagnosis is complex, based on clinical history, physical examination, and laboratory testing. Similarly, a negative UDS result does not rule out an SUD.4,10
Continue to: Fourth, patient dismissal...
Fourth, patient dismissal is rarely an appropriate initial response to UDS results. Regrettably, some physicians misinterpret urine toxicology results and inappropriately discharge patients on that basis.
The Centers for Disease Control and Prevention guideline for prescribing opioids has increased utilization of UDS in primary care settings but does not provide the necessary education on proper use of the tool, which has resulted in a rise in misinterpretation and inappropriate discharge.13,26
If recurrent aberrant behavior is detected (by history or urine toxicology), do not abruptly discontinue the patient’s medication(s). Inform the patient of your concern, taper medication, and refer the patient to addiction treatment. Abrupt discontinuation of an opioid or benzodiazepine can lead to significant harm.1,14
CORRESPONDENCE
John Hayes, DO, Department of Family and Community Medicine, Medical College of Wisconsin, 1121 E North Avenue, Milwaukee, WI, 53212; jrhayes@mcw.edu
1. TAP 32: Clinical drug testing in primary care. Rockville, MD: Substance Abuse and Mental Health Services Administration, US Department of Health & Human Services; 2012. Technical Assistance Publication (TAP) 32; HHS Publication No. (SMA) 12-4668. 2012. Accessed March 19, 2021. https://store.samhsa.gov/sites/default/files/d7/priv/sma12-4668.pdf
2. Gaither JR, Gordon K, Crystal S, et al. Racial disparities in discontinuation of long-term opioid therapy following illicit drug use among black and white patients. Drug Alcohol Depend. 2018;192:371-376. https://doi.org/10.1016/j.drugalcdep.2018.05.033
3. Segal, David. In pursuit of liquid gold. The New York Times. December 27, 2017. Accessed March 19, 2021. https://nyti.ms/2E2GTOU
4. Ceasar R, Chang J, Zamora K, et al. Primary care providers’ experiences with urine toxicology tests to manage prescription opioid misuse and substance use among chronic noncancer pain patients in safety net health care settings. Subst Abus. 2016;37:154-160. https://doi.org/10.1080/08897077.2015.1132293
5. Dowell D, Haegerich TM, Chou R. CDC guideline for prescribing opioids for chronic pain — United States, 2016. MMWR Recomm Rep. 2016;65:1-49. https://doi.org/10.15585/mmwr.rr6501e1
6. Katz NP, Sherburne S, Beach M, et al. Behavioral monitoring and urine toxicology testing in patients receiving long-term opioid therapy. Anesth Analg. 2003;97:1097-1102. https://doi.org/ 10.1213/01.ane.0000080159.83342.b5
7. Wilcox CE, Bogenschutz MP, Nakazawa M, et al. Concordance between self-report and urine drug screen data in adolescent opioid dependent clinical trial participants. Addict Behav. 2013;38:2568-2574. https://doi.org/10.1016/j.addbeh.2013.05.015
8. Zanis DA, McLellan AT, Randall M. Can you trust patient self-reports of drug use during treatment? Drug Alcohol Depend. 1994;35:127-132. https://doi.org/10.1016/0376-8716(94)90119-8
9. Jones CM, Paulozzi LJ, Mack KA. Sources of prescription opioid pain relievers by frequency of past-year nonmedical use: United States, 2008-2011. JAMA Intern Med. 2014;174:802-803. https://doi.org/10.1001/jamainternmed.2013.12809
10. Katz N, Fanciullo GJ. Role of urine toxicology testing in the management of chronic opioid therapy. Clin J Pain. 2002;18(4 suppl):S76-S82. https://doi.org/10.1097/00002508-200207001-00009
11. Vowles KE, McEntee ML, Julnes PS, et al. Rates of opioid misuse, abuse, and addiction in chronic pain: a systematic review and data synthesis. Pain. 2015;156:569-576. https://doi.org/10.1097/01.j.pain.0000460357.01998.f1
12. Warner EA, Walker RM, Friedmann PD. Should informed consent be required for laboratory testing for drugs of abuse in medical settings? Am J Med. 2003;115:54-58. https://doi.org/10.1016/s0002-9343(03)00236-5
13. Kelly JF, Wakeman SE, Saitz R. Stop talking ‘dirty’: clinicians, language, and quality of care for the leading cause of preventable death in the United States. Am J Med. 2015;128:8-9. https://doi.org/10.1016/j.amjmed.2014.07.043
14. Jarvis M, Williams J, Hurford M, et al. Appropriate use of drug testing in clinical addiction medicine. J Addict Med. 2017;11:163-173. https://doi.org/10.1097/ADM.0000000000000323
15. Argoff CE, Alford DP, Fudin J, et al. Rational urine drug monitoring in patients receiving opioids for chronic pain: consensus recommendations. Pain Med. 2018;19:97-117. https://doi.org/10.1093/pm/pnx285
16 Ainscough TS, McNeill A, Strang J, et al. Contingency management interventions for non-prescribed drug use during treatment for opiate addiction: a systematic review and meta-analysis. Drug Alcohol Depend. 2017;178:318-339. https://doi.org/10.1016/j.drugalcdep.2017.05.028
17. Blum K, Han D, Femino J, et al. Systematic evaluation of “compliance” to prescribed treatment medications and “abstinence” from psychoactive drug abuse in chemical dependence programs: data from the comprehensive analysis of reported drugs. PLoS One. 2014;9:e104275. https://doi.org/10.1371/journal.pone.0104275
18. Miller SC, Fiellin DA, Rosenthal RN, et al. The ASAM Principles of Addiction Medicine. 6th ed. Wolters Kluwer; 2018.
19. Saitman A, Park H-D, Fitzgerald RL. False-positive interferences of common urine drug screen immunoassays: a review. J Anal Toxicol. 2014;38:387-396. https://doi.org/10.1093/jat/bku075
20. Smith MP, Bluth MH. Common interferences in drug testing. Clin Lab Med. 2016;36:663-671. https://doi.org/10.1016/j.cll.2016.07.006
21. George S, Braithwaite RA. An investigation into the extent of possible dilution of specimens received for urinary drugs of abuse screening. Addiction. 1995;90:967-970. https://doi.org/10.1046/j.1360-0443.1995.9079679.x
22. Beck O, Bohlin M, Bragd F, et al. Adulteration of urine drug testing—an exaggerated cause of concern. [Article in Swedish] Lakartidningen. 2000;97:703-706.
23. Kale N. Urine drug tests: ordering and interpreting results. Am Fam Physician. 2019;99:33-39.
24. Dasgupta A. The effects of adulterants and selected ingested compounds on drugs-of-abuse testing in urine. Am J Clin Pathol. 2007;128:491-503. https://doi.org/10.1309/FQY06F8XKTQPM149
25. Definition of addiction. American Society of Addiction Medicine Web site. Updated October 21, 2019. Accessed February 20, 2021. https://www.asam.org/resources/definition-of-addiction
26. Kroenke K, Alford DP, Argoff C, et al. Challenges with Implementing the Centers for Disease Control and Prevention Opioid Guideline: A Consensus Panel Report. Pain Med. 2019;20:724-735. https://doi.org/10.1093/pm/pny307
PRACTICE RECOMMENDATIONS
› Consider developing a risk-based urine drug testing protocol for all patients who are on chronic opioid therapy. C
› Consider urine drug testing to augment a thorough history when identifying and offering treatment to patients with a substance use disorder. A
› Do not change your management plan based on results of a single screening urine test. Revisit unexpected positive or negative results with a thorough history or confirmatory testing. A
Strength of recommendation (SOR)
A Good-quality patient-oriented evidence
B Inconsistent or limited-quality patient-oriented evidence
C Consensus, usual practice, opinion, disease-oriented evidence, case series

Comparison of Dermatologist Ratings on Health Care–Specific and General Consumer Websites
Health care–specific (eg, Healthgrades, Zocdoc, Vitals, WebMD) and general consumer websites (eg, Google, Yelp) are popular platforms for patients to find physicians, schedule appointments, and review physician experiences. Patients find ratings on these websites more trustworthy than standardized surveys distributed by hospitals, but many physicians do not trust the reviews on these sites. For example, in a survey of both physicians (n=828) and patients (n=494), 36% of physicians trusted online reviews compared to 57% of patients.1 The objective of this study was to determine if health care–specific or general consumer websites more accurately reflect overall patient sentiment. This knowledge can help physicians who are seeking to improve the patient experience understand which websites have more accurate and trustworthy reviews.
Methods
A list of dermatologists from the top 10 most and least dermatologist–dense areas in the United States was compiled to examine different physician populations.2 Equal numbers of male and female dermatologists were randomly selected from the most dense areas. All physicians were included from the least dense areas because of limited sample size. Ratings were collected from websites most likely to appear on the first page of a Google search for a physician name, as these are most likely to be seen by patients. Descriptive statistics were generated to describe the study population; mean and median physician rating (using a scale of 1–5); SD; and minimum, maximum, and interquartile ranges. Spearman correlation coefficients were generated to examine the strength of association between ratings from website pairs. P<.05 was considered statistically significant, with analyses performed in R (3.6.2) for Windows (the R Foundation).
Results
A total of 167 representative physicians were included in this analysis; 141 from the most dense areas, and 26 from the least dense areas. The lowest average ratings for the entire sample and most dermatologist–dense areas were found on Yelp (3.61 and 3.60, respectively), and the lowest ratings in the least dermatologist–dense areas were found on Google (3.45)(Table 1). Correlation coefficient values were lowest for Zocdoc and Healthgrades (0.263) and highest for Vitals and WebMD (0.963)(Table 2). The health care–specific sites were closer to the overall average (4.06) than the general consumer sites (eFigure).
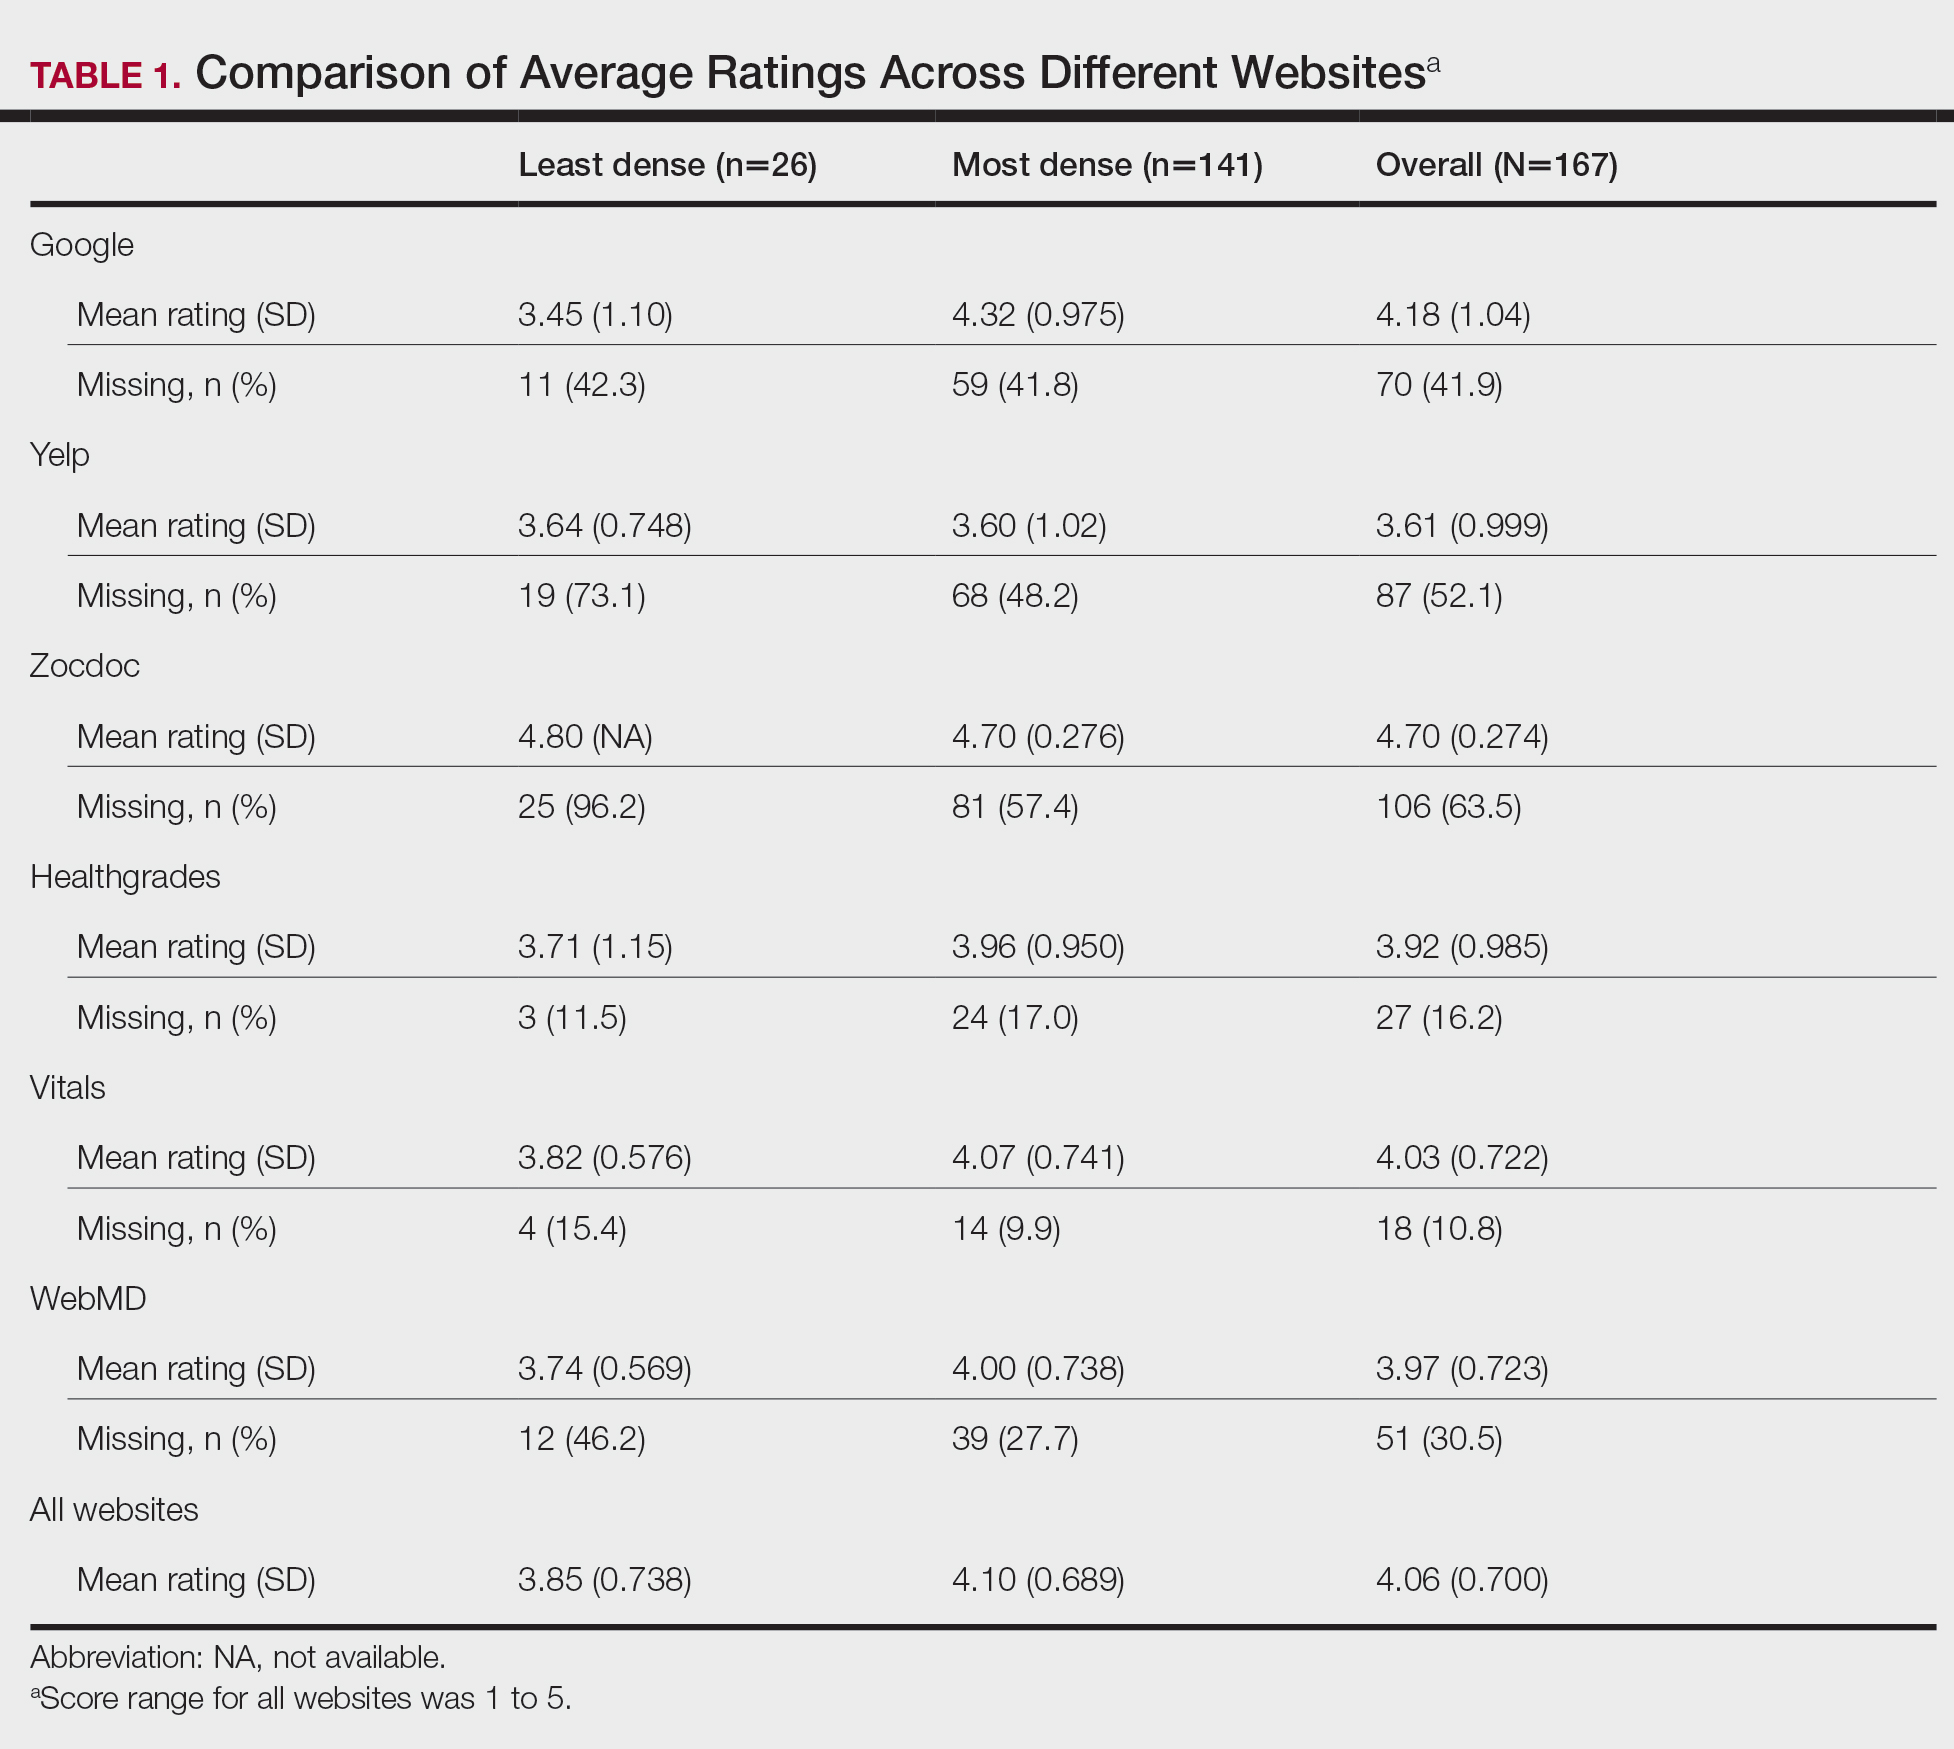
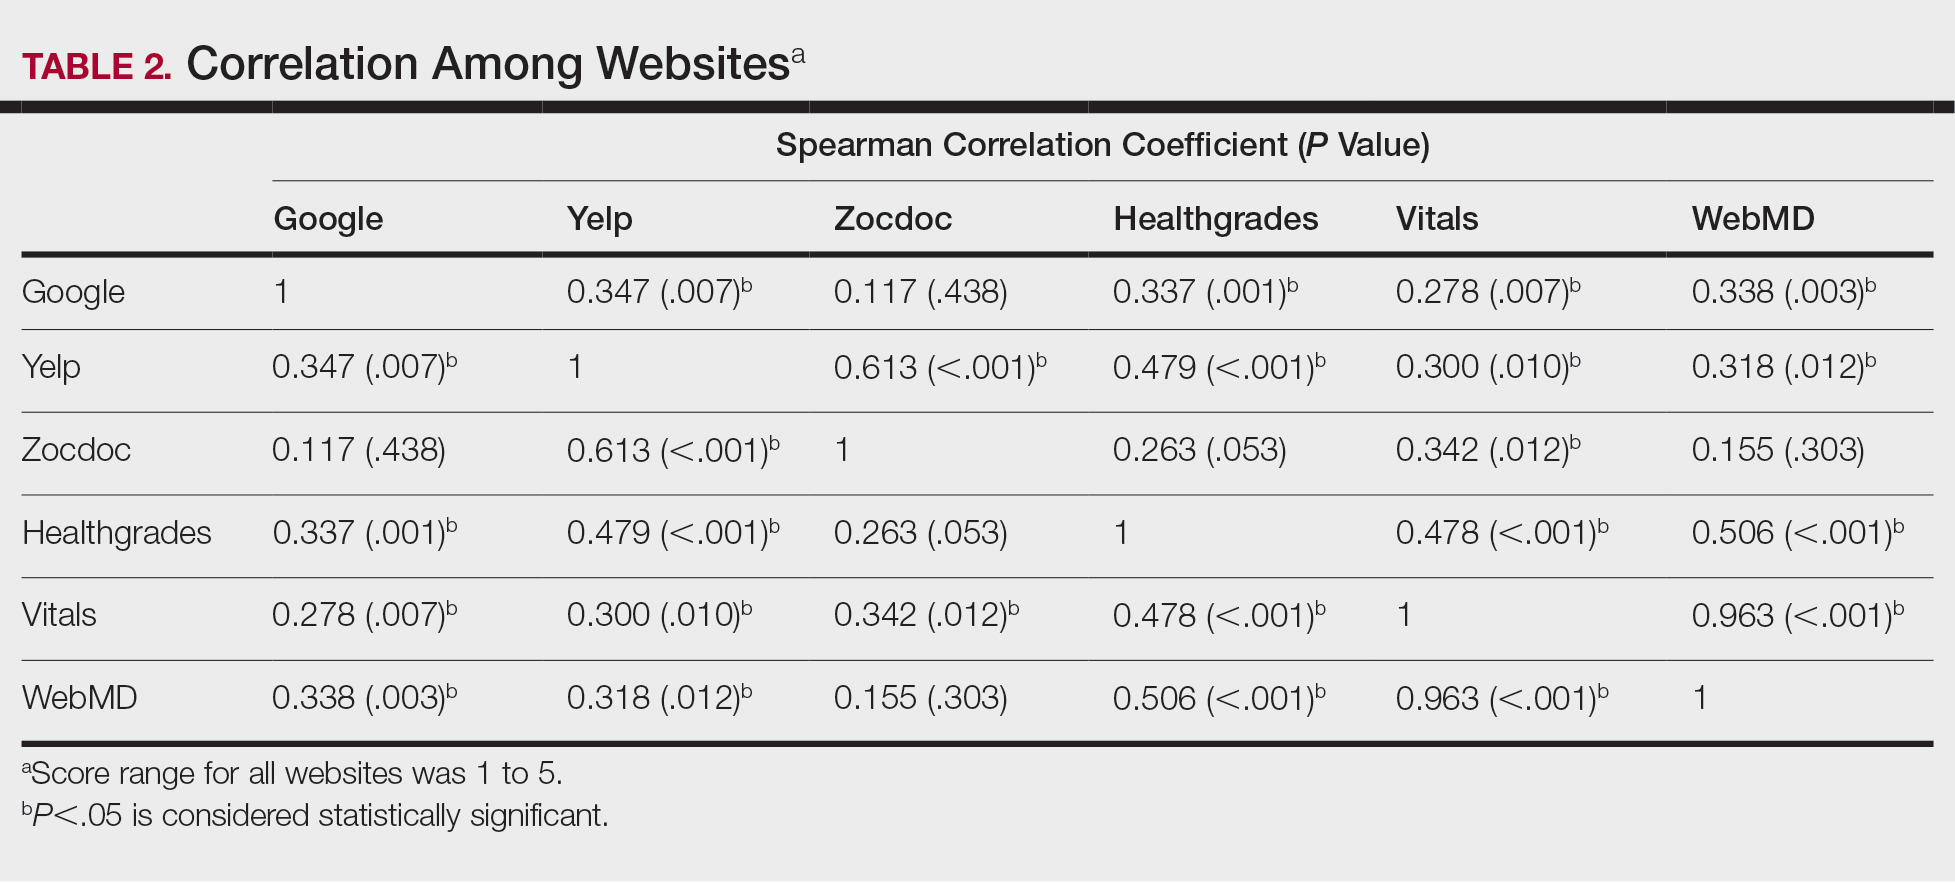
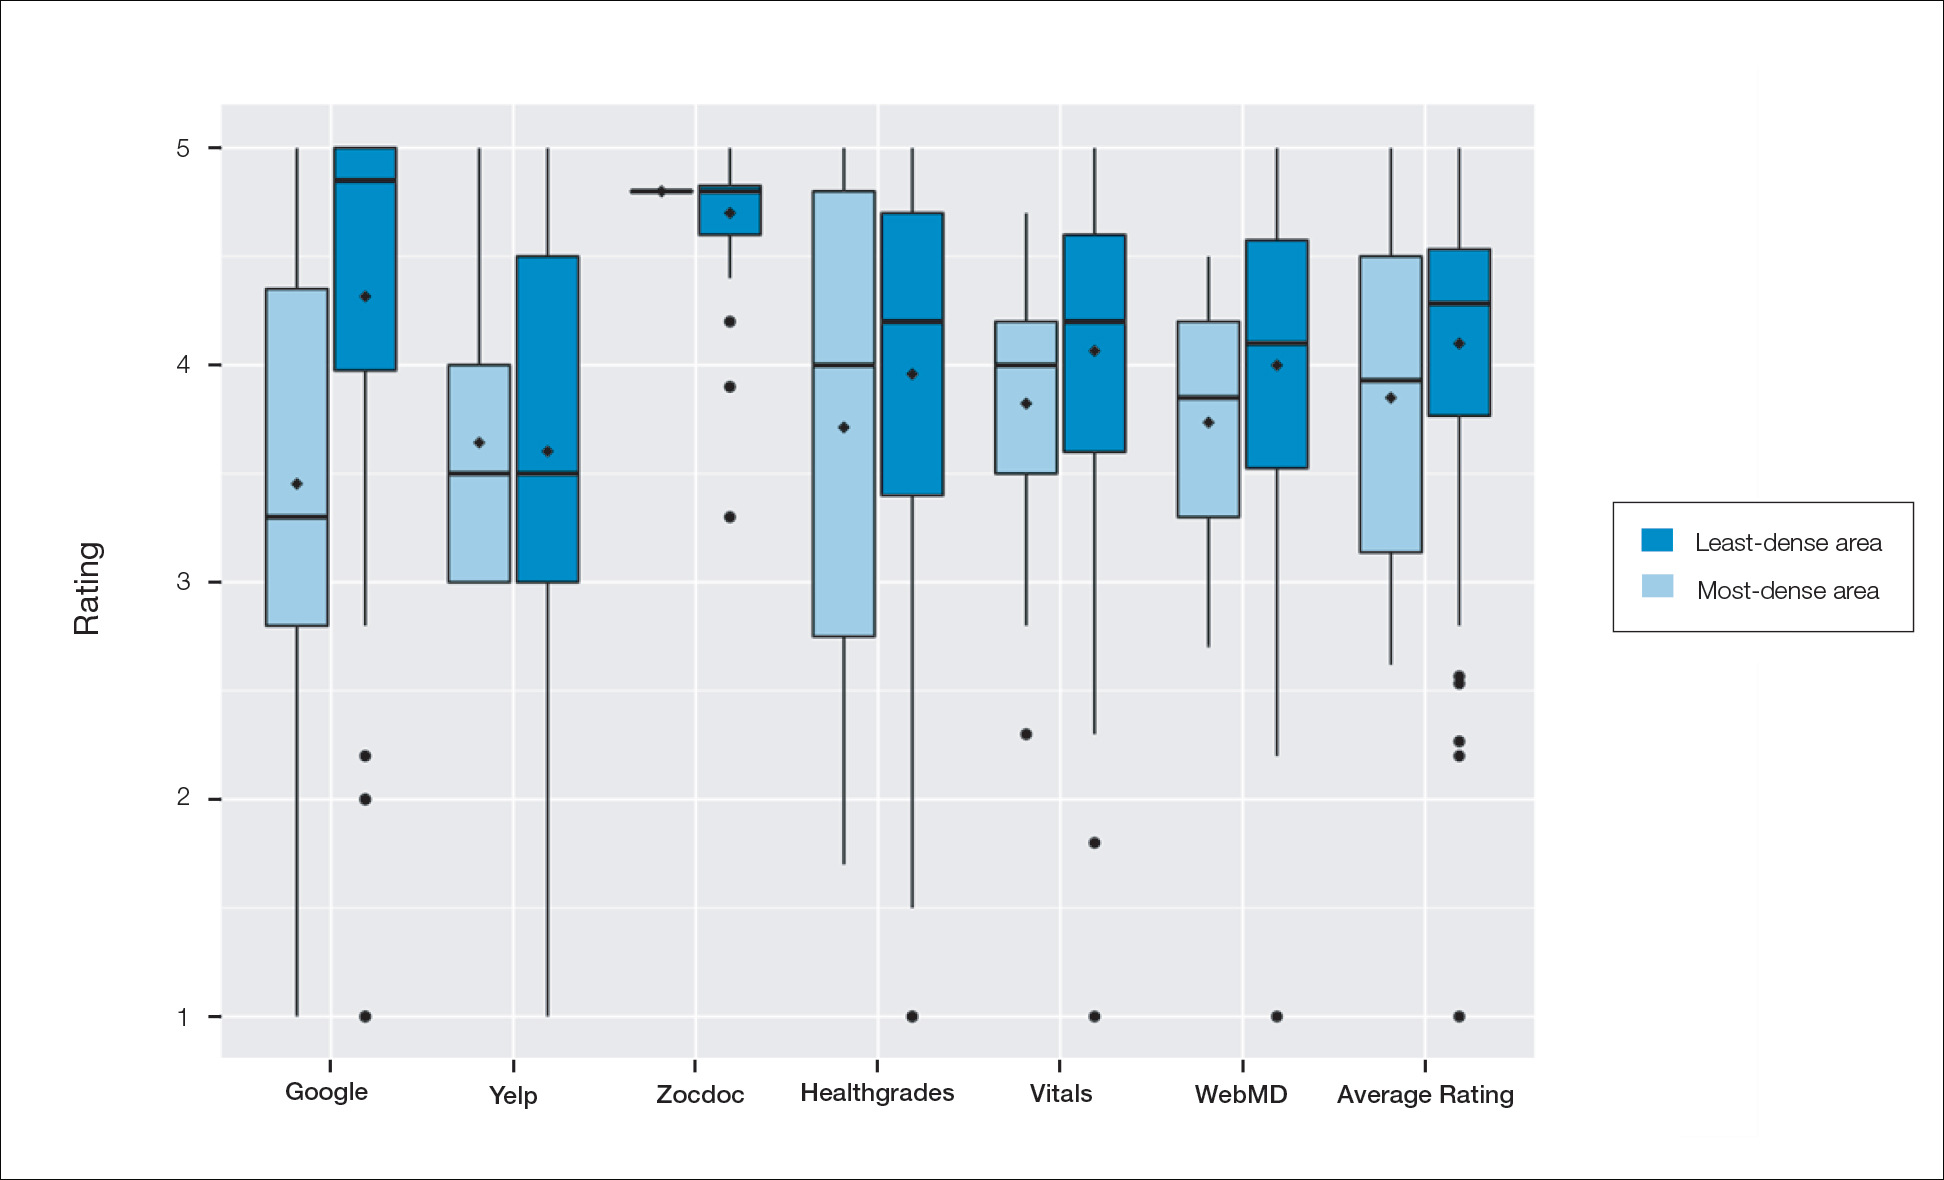
Comment
Although dermatologist ratings on each site had a broad range, we found that patients typically expressed negative interactions on general consumer websites rather than health care–specific websites. When comparing the ratings of the same group of dermatologists across different sites, ratings on health care–specific sites had a higher degree of correlation, with physician ratings more similar between 2 health care–specific sites and less similar between a health care–specific and a general consumer website. This pattern was consistent in both dermatologist-dense and dermatologist-poor areas, despite patients having varying levels of access to dermatologic care and medical resources and potentially different regional preferences of consumer websites. Taken together, these findings imply that health care–specific websites more consistently reflect overall patient sentiment.
Although one 2016 study comparing reviews of dermatology practices on Zocdoc and Yelp also demonstrated lower average ratings on Yelp,3 our study suggests that this trend is not isolated to these 2 sites but can be seen when comparing many health care–specific sites vs general consumer sites.
Our study compared ratings of dermatologists among popular websites to understand those that are most representative of patient attitudes toward physicians. These findings are important because online reviews reflect the entire patient experience, not just the patient-physician interaction, which may explain why physician scores on standardized questionnaires, such as Press Ganey surveys, do not correlate well with their online reviews.4 In a study comparing 98 physicians with negative online ratings to 82 physicians in similar departments with positive ratings, there was no significant difference in scores on patient-physician interaction questions on the Press Ganey survey.5 However, physicians who received negative online reviews scored lower on Press Ganey questions related to nonphysician interactions (eg, office cleanliness, interactions with staff).
The current study was subject to several limitations. Our analysis included all physicians in our random selection without accounting for those physicians with a greater online presence who might be more cognizant of these ratings and try to manipulate them through a reputation-management company or public relations consultant.
Conclusion
Our study suggests that consumer websites are not primarily used by disgruntled patients wishing to express grievances; instead, on average, most physicians received positive reviews. Furthermore, health care–specific websites show a higher degree of concordance than and may more accurately reflect overall patient attitudes toward their physicians than general consumer sites. Reviews from these health care–specific sites may be more helpful than general consumer websites in allowing physicians to understand patient sentiment and improve patient experiences.
- Frost C, Mesfin A. Online reviews of orthopedic surgeons: an emerging trend. Orthopedics. 2015;38:e257-e262. doi:10.3928/01477447-20150402-52
- Waqas B, Cooley V, Lipner SR. Association of sex, location, and experience with online patient ratings of dermatologists. J Am Acad Dermatol. 2020;83:954-955.
- Smith RJ, Lipoff JB. Evaluation of dermatology practice online reviews: lessons from qualitative analysis. JAMA Dermatol. 2016;152:153-157. doi:10.1001/jamadermatol.2015.3950
- Chen J, Presson A, Zhang C, et al. Online physician review websites poorly correlate to a validated metric of patient satisfaction. J Surg Res. 2018;227:1-6.
- Widmer RJ, Maurer MJ, Nayar VR, et al. Online physician reviews do not reflect patient satisfaction survey responses. Mayo Clinic Proc. 2018;93:453-457.
Health care–specific (eg, Healthgrades, Zocdoc, Vitals, WebMD) and general consumer websites (eg, Google, Yelp) are popular platforms for patients to find physicians, schedule appointments, and review physician experiences. Patients find ratings on these websites more trustworthy than standardized surveys distributed by hospitals, but many physicians do not trust the reviews on these sites. For example, in a survey of both physicians (n=828) and patients (n=494), 36% of physicians trusted online reviews compared to 57% of patients.1 The objective of this study was to determine if health care–specific or general consumer websites more accurately reflect overall patient sentiment. This knowledge can help physicians who are seeking to improve the patient experience understand which websites have more accurate and trustworthy reviews.
Methods
A list of dermatologists from the top 10 most and least dermatologist–dense areas in the United States was compiled to examine different physician populations.2 Equal numbers of male and female dermatologists were randomly selected from the most dense areas. All physicians were included from the least dense areas because of limited sample size. Ratings were collected from websites most likely to appear on the first page of a Google search for a physician name, as these are most likely to be seen by patients. Descriptive statistics were generated to describe the study population; mean and median physician rating (using a scale of 1–5); SD; and minimum, maximum, and interquartile ranges. Spearman correlation coefficients were generated to examine the strength of association between ratings from website pairs. P<.05 was considered statistically significant, with analyses performed in R (3.6.2) for Windows (the R Foundation).
Results
A total of 167 representative physicians were included in this analysis; 141 from the most dense areas, and 26 from the least dense areas. The lowest average ratings for the entire sample and most dermatologist–dense areas were found on Yelp (3.61 and 3.60, respectively), and the lowest ratings in the least dermatologist–dense areas were found on Google (3.45)(Table 1). Correlation coefficient values were lowest for Zocdoc and Healthgrades (0.263) and highest for Vitals and WebMD (0.963)(Table 2). The health care–specific sites were closer to the overall average (4.06) than the general consumer sites (eFigure).
Comment
Although dermatologist ratings on each site had a broad range, we found that patients typically expressed negative interactions on general consumer websites rather than health care–specific websites. When comparing the ratings of the same group of dermatologists across different sites, ratings on health care–specific sites had a higher degree of correlation, with physician ratings more similar between 2 health care–specific sites and less similar between a health care–specific and a general consumer website. This pattern was consistent in both dermatologist-dense and dermatologist-poor areas, despite patients having varying levels of access to dermatologic care and medical resources and potentially different regional preferences of consumer websites. Taken together, these findings imply that health care–specific websites more consistently reflect overall patient sentiment.
Although one 2016 study comparing reviews of dermatology practices on Zocdoc and Yelp also demonstrated lower average ratings on Yelp,3 our study suggests that this trend is not isolated to these 2 sites but can be seen when comparing many health care–specific sites vs general consumer sites.
Our study compared ratings of dermatologists among popular websites to understand those that are most representative of patient attitudes toward physicians. These findings are important because online reviews reflect the entire patient experience, not just the patient-physician interaction, which may explain why physician scores on standardized questionnaires, such as Press Ganey surveys, do not correlate well with their online reviews.4 In a study comparing 98 physicians with negative online ratings to 82 physicians in similar departments with positive ratings, there was no significant difference in scores on patient-physician interaction questions on the Press Ganey survey.5 However, physicians who received negative online reviews scored lower on Press Ganey questions related to nonphysician interactions (eg, office cleanliness, interactions with staff).
The current study was subject to several limitations. Our analysis included all physicians in our random selection without accounting for those physicians with a greater online presence who might be more cognizant of these ratings and try to manipulate them through a reputation-management company or public relations consultant.
Conclusion
Our study suggests that consumer websites are not primarily used by disgruntled patients wishing to express grievances; instead, on average, most physicians received positive reviews. Furthermore, health care–specific websites show a higher degree of concordance than and may more accurately reflect overall patient attitudes toward their physicians than general consumer sites. Reviews from these health care–specific sites may be more helpful than general consumer websites in allowing physicians to understand patient sentiment and improve patient experiences.
- Frost C, Mesfin A. Online reviews of orthopedic surgeons: an emerging trend. Orthopedics. 2015;38:e257-e262. doi:10.3928/01477447-20150402-52
- Waqas B, Cooley V, Lipner SR. Association of sex, location, and experience with online patient ratings of dermatologists. J Am Acad Dermatol. 2020;83:954-955.
- Smith RJ, Lipoff JB. Evaluation of dermatology practice online reviews: lessons from qualitative analysis. JAMA Dermatol. 2016;152:153-157. doi:10.1001/jamadermatol.2015.3950
- Chen J, Presson A, Zhang C, et al. Online physician review websites poorly correlate to a validated metric of patient satisfaction. J Surg Res. 2018;227:1-6.
- Widmer RJ, Maurer MJ, Nayar VR, et al. Online physician reviews do not reflect patient satisfaction survey responses. Mayo Clinic Proc. 2018;93:453-457.
Practice Points
- Online physician-rating websites are commonly used by patients to find physicians and review experiences.
- Health care–specific sites may more accurately reflect patient sentiment than general consumer sites.
- Dermatologists can use health care–specific sites to understand patient sentiment and learn how to improve patient experiences.
Starting April 5, patients can read your notes: 5 things to consider
Change in writing style is not mandated
The mandate, called “open notes” by many, is part of the 21st Century Cures Act, a wide-ranging piece of federal health care legislation. The previous deadline of Nov. 2, 2020, for enacting open notes was extended last year because of the exigencies of the COVID-19 pandemic.
Organizations must provide access via patient portals to the following types of notes: consultations, discharge summaries, histories, physical examination findings, imaging narratives, laboratory and pathology report narratives, and procedure and progress notes. Noncompliant organizations will eventually be subject to fines from the Department of Health & Human Services for “information blocking.”
This news organization reported on the mandate in 2020, and some readers said it was an unwelcome intrusion into practice. Since then, this news organization has run additional open notes stories about physician concerns, a perspective essay addressing those fears, and a reader poll about the phenomenon.
Now, as the legislation turns into a practical clinical matter, there are five key points clinicians should consider.
Clinicians don’t have to change writing style.
The new law mandates timely patient access to notes and test results, but it doesn’t require that clinicians alter their writing, said Scott MacDonald, MD, an internist and electronic health record medical director at University of California Davis Health in Sacramento.
“You don’t have to change your notes,” he said. However, patients are now part of the note audience and some health care systems are directing clinicians to make patient-friendly style changes.
Everyday experience should guide clinicians when writing notes, said one expert.
“When you’re not sure [of how to write a note], just mirror the way you would speak in the office – that’s going to get you right, including for mental health issues,” advised Leonor Fernandez, MD, an internist at Beth Deaconess Israel Medical Center, Boston, in her “take-away” comments in the online video, How to Write an Open Note.
According to a 2020 Medscape poll of 1,050 physicians, a majority (56%) anticipate that they will write notes differently, knowing that patients can read them via open notes. Nearly two-thirds (64%) believe that this new wrinkle in medical records will increase their workload. However, actual practice suggests that this is true for a minority of practitioners, according to the results from a recent study of more than 1,000 physicians in Boston, Seattle, and rural Pennsylvania, who already work in open notes settings. Only about one-third (37%) reported “spending more time on documentation.”
Note writing is going to change because of the addition of the patient reader, and something will be lost, argued Steven Reidbord, MD, a psychiatrist in private practice in San Francisco. By watering down the language for patients, “you are trading away the technical precision and other advantages of having a professional language,” commented Dr. Reidbord, who blogs for Psychology Today and has criticized the open notes movement in the past.
However, years of investigation from OpenNotes, the Boston-based advocacy and research organization, indicates that there are many gains with patient-accessible notes, including improved medical record accuracy, greater medication adherence, and potentially improved health care disparities among a range of patient types. In a 2019 study, researchers said that worry and confusion among note-reading patients are uncommon (5% and 3%, respectively), which addresses two criticisms voiced by multiple people last year.
Some clinical notes can be withheld.
The new rules from the federal government permit information blocking if there is clear evidence that doing so “will substantially reduce the risk of harm” to patients or to other third parties, Tom Delbanco, MD, and Charlotte Blease, PhD, of OpenNotes in Boston wrote in a commentary in February 2021.
There are also state-level laws that can supersede the new U.S. law and block access to notes, points out MacDonald. For example, California law dictates that providers cannot post cancer test results without talking with the patient first.
The OpenNotes organization also points out that, with regard to sensitive psychotherapy notes that are separated from the rest of a medical record, those notes “can be kept from patients without their permission, and such rules vary state by state.”
Some patients are more likely readers.
Some patients are more likely to peer into their files than others, said Liz Salmi, senior strategist at OpenNotes, who is also a brain cancer patient.
“Those patients who have more serious or chronic conditions ... are more likely to read their notes,” she said in an interview.
A new study of nearly 6,000 medical oncology patients at the University of Wisconsin confirmed that opinion. Patients with incurable metastatic disease were much more likely than those with early-stage, curable disease to read notes. Notably, younger patients were more likely than older ones to access notes, likely the result of generational tech savvy.
Despite the unpredictability of serious disease such as cancer, oncology patients find satisfaction in reading their notes, say experts. “We’ve overwhelmingly heard that patients like it,” Thomas LeBlanc, MD, medical oncologist at Duke University, Durham, N.C., where all patients already have access to clinicians’ notes, told this news organization in 2018.
You are part of the avant garde.
The United States and Scandinavian countries are the world leaders in implementing open notes in clinical practice, Dr. Blease said in an interview.
“It’s a phenomenal achievement” to have enacted open notes nationally, she said. For example, there are no open notes in Northern Ireland, Dr. Blease’s home country, or most of Europe.
In the United States, there are more than 200 medical organizations, including at least one in every state, that were voluntarily providing open notes before April 5, including interstate giants such as Banner Health and big-name medical centers such as Cleveland Clinic.
It may be hard for the United States to top Sweden’s embrace of the practice. The national open notes program now has 7.2 million patient accounts in a country of 10 million people, noted Maria Häggland, PhD, of Uppsala (Sweden) MedTech Science Innovation Center during a webinar last year.
The start day will come, and you may not notice.
“When April 5 happens, something brand new is going to happen symbolically,” Ms. Salmi said. Its importance is hard to measure.
“Patients say they trust their doctor more because they understand their thinking with open notes. How do you value that? We don’t have metrics for that,” she said.
Dr. MacDonald suggested that open notes are both new and not new. In the fall of 2020, he predicted that the launch day would come, and few clinicians would notice, in part because many patients already access truncated information via patient portals.
However, there are “sensitive issues,” such as with adolescents and reproductive health, where “we know that some parents have sign-in information for their teen’s portal,” he commented. With clinical notes now on full display, potential problems “may be out of our control.”
Still, the Sacramento-based physician and IT officer acknowledged that concerns about open notes may be a bit inflated. “I’ve been more worried about reassuring physicians that everything will be okay than what’s actually going to happen [as the law takes effect],” Dr. MacDonald said.
The OpenNotes organization is grant funded, and staff disclosed no relevant financial relationships.
A version of this article first appeared on Medscape.com.
Change in writing style is not mandated
Change in writing style is not mandated
The mandate, called “open notes” by many, is part of the 21st Century Cures Act, a wide-ranging piece of federal health care legislation. The previous deadline of Nov. 2, 2020, for enacting open notes was extended last year because of the exigencies of the COVID-19 pandemic.
Organizations must provide access via patient portals to the following types of notes: consultations, discharge summaries, histories, physical examination findings, imaging narratives, laboratory and pathology report narratives, and procedure and progress notes. Noncompliant organizations will eventually be subject to fines from the Department of Health & Human Services for “information blocking.”
This news organization reported on the mandate in 2020, and some readers said it was an unwelcome intrusion into practice. Since then, this news organization has run additional open notes stories about physician concerns, a perspective essay addressing those fears, and a reader poll about the phenomenon.
Now, as the legislation turns into a practical clinical matter, there are five key points clinicians should consider.
Clinicians don’t have to change writing style.
The new law mandates timely patient access to notes and test results, but it doesn’t require that clinicians alter their writing, said Scott MacDonald, MD, an internist and electronic health record medical director at University of California Davis Health in Sacramento.
“You don’t have to change your notes,” he said. However, patients are now part of the note audience and some health care systems are directing clinicians to make patient-friendly style changes.
Everyday experience should guide clinicians when writing notes, said one expert.
“When you’re not sure [of how to write a note], just mirror the way you would speak in the office – that’s going to get you right, including for mental health issues,” advised Leonor Fernandez, MD, an internist at Beth Deaconess Israel Medical Center, Boston, in her “take-away” comments in the online video, How to Write an Open Note.
According to a 2020 Medscape poll of 1,050 physicians, a majority (56%) anticipate that they will write notes differently, knowing that patients can read them via open notes. Nearly two-thirds (64%) believe that this new wrinkle in medical records will increase their workload. However, actual practice suggests that this is true for a minority of practitioners, according to the results from a recent study of more than 1,000 physicians in Boston, Seattle, and rural Pennsylvania, who already work in open notes settings. Only about one-third (37%) reported “spending more time on documentation.”
Note writing is going to change because of the addition of the patient reader, and something will be lost, argued Steven Reidbord, MD, a psychiatrist in private practice in San Francisco. By watering down the language for patients, “you are trading away the technical precision and other advantages of having a professional language,” commented Dr. Reidbord, who blogs for Psychology Today and has criticized the open notes movement in the past.
However, years of investigation from OpenNotes, the Boston-based advocacy and research organization, indicates that there are many gains with patient-accessible notes, including improved medical record accuracy, greater medication adherence, and potentially improved health care disparities among a range of patient types. In a 2019 study, researchers said that worry and confusion among note-reading patients are uncommon (5% and 3%, respectively), which addresses two criticisms voiced by multiple people last year.
Some clinical notes can be withheld.
The new rules from the federal government permit information blocking if there is clear evidence that doing so “will substantially reduce the risk of harm” to patients or to other third parties, Tom Delbanco, MD, and Charlotte Blease, PhD, of OpenNotes in Boston wrote in a commentary in February 2021.
There are also state-level laws that can supersede the new U.S. law and block access to notes, points out MacDonald. For example, California law dictates that providers cannot post cancer test results without talking with the patient first.
The OpenNotes organization also points out that, with regard to sensitive psychotherapy notes that are separated from the rest of a medical record, those notes “can be kept from patients without their permission, and such rules vary state by state.”
Some patients are more likely readers.
Some patients are more likely to peer into their files than others, said Liz Salmi, senior strategist at OpenNotes, who is also a brain cancer patient.
“Those patients who have more serious or chronic conditions ... are more likely to read their notes,” she said in an interview.
A new study of nearly 6,000 medical oncology patients at the University of Wisconsin confirmed that opinion. Patients with incurable metastatic disease were much more likely than those with early-stage, curable disease to read notes. Notably, younger patients were more likely than older ones to access notes, likely the result of generational tech savvy.
Despite the unpredictability of serious disease such as cancer, oncology patients find satisfaction in reading their notes, say experts. “We’ve overwhelmingly heard that patients like it,” Thomas LeBlanc, MD, medical oncologist at Duke University, Durham, N.C., where all patients already have access to clinicians’ notes, told this news organization in 2018.
You are part of the avant garde.
The United States and Scandinavian countries are the world leaders in implementing open notes in clinical practice, Dr. Blease said in an interview.
“It’s a phenomenal achievement” to have enacted open notes nationally, she said. For example, there are no open notes in Northern Ireland, Dr. Blease’s home country, or most of Europe.
In the United States, there are more than 200 medical organizations, including at least one in every state, that were voluntarily providing open notes before April 5, including interstate giants such as Banner Health and big-name medical centers such as Cleveland Clinic.
It may be hard for the United States to top Sweden’s embrace of the practice. The national open notes program now has 7.2 million patient accounts in a country of 10 million people, noted Maria Häggland, PhD, of Uppsala (Sweden) MedTech Science Innovation Center during a webinar last year.
The start day will come, and you may not notice.
“When April 5 happens, something brand new is going to happen symbolically,” Ms. Salmi said. Its importance is hard to measure.
“Patients say they trust their doctor more because they understand their thinking with open notes. How do you value that? We don’t have metrics for that,” she said.
Dr. MacDonald suggested that open notes are both new and not new. In the fall of 2020, he predicted that the launch day would come, and few clinicians would notice, in part because many patients already access truncated information via patient portals.
However, there are “sensitive issues,” such as with adolescents and reproductive health, where “we know that some parents have sign-in information for their teen’s portal,” he commented. With clinical notes now on full display, potential problems “may be out of our control.”
Still, the Sacramento-based physician and IT officer acknowledged that concerns about open notes may be a bit inflated. “I’ve been more worried about reassuring physicians that everything will be okay than what’s actually going to happen [as the law takes effect],” Dr. MacDonald said.
The OpenNotes organization is grant funded, and staff disclosed no relevant financial relationships.
A version of this article first appeared on Medscape.com.