User login
Algorithm reduces CT use in pediatric appendicitis
CHICAGO – Use of a diagnostic algorithm for pediatric appendicitis significantly decreases computed tomography utilization without compromising high sensitivity and specificity, according to findings from a study of emergency cases.
Of 840 patients seen in an academic children’s hospital emergency department from Aug. 1, 2014 to July 31, 2015, after implementation of the diagnostic algorithm, 267 were diagnosed with appendicitis. CT utilization was 27.3% overall, and 24.2% in patients with appendicitis, compared with 75.4% among 557 patients with appendicitis seen from Jan. 1, 2011 to February 28, 2014, before implementation, Dr. Sohail R. Shah of Baylor College of Medicine/Texas Children’s Hospital, Houston reported at the annual meeting of the American Surgical Association

The work was completed at his prior position at Children’s Mercy Hospital Kansas City.
“Additionally, utilization of ultrasound prior to CT went from 24% up to 95%, surgical consultation prior to CT increased from 14.7% to 76.1% after implementation, and operative intervention without any imaging went from just under 2% to almost 10% after implementation of the diagnostic algorithm,” Dr. Shah said, adding that the pre- and postimplementation patient groups were similar with respect to demographics.
The diagnostic pathway had a sensitivity of 98.6% and specificity of 94.4%, he said.
Appendicitis is the most common abdominal condition leading to the hospitalization of children, and it accounts for about 70,000 children hospitalized annually in the United States, with an average related healthcare cost of $675 million each year, he said.
The diagnosis in children can be difficult, thus many centers rely heavily on CT scans. However, increasing use of CT in children could lead to an increased lifetime risk of radiation-induced malignancy.
“In fact, the American College of Radiology currently recommends that a CT scan not be done for the diagnosis of appendicitis until after ultrasound has been considered as an option. Our objective with this work was to decrease CT utilization for the diagnosis of appendicitis in children at our academic free-standing children’s hospital emergency department through the introduction of a diagnostic algorithm,” he said.
A multidisciplinary team at Children’s Mercy Hospital worked to develop an algorithm, which promoted earlier surgical consultation and prioritized ultrasound imaging over CT scans. The algorithm involved the use of the 10-point Pediatric Appendicitis Score for risk stratification. For a score of 1-3, with low probability of appendicitis, the patient was discharged home or received further work-up for an alternative diagnosis. For a score of 4-6, with intermediate probability of appendicitis, an ultrasound was ordered. If the ultrasound was negative, the patient was discharged home or received further work-up for an alternative diagnosis; if the ultrasound was positive, surgery was consulted; if the ultrasound was indeterminate, surgery was consulted prior to consideration of CT scan. For a score of 7-10, surgery was immediately consulted for further management.
“If this algorithm is followed appropriately for all patients, then no patient should have a CT scan without first having an ultrasound and surgical consultation,” Dr. Shah said.
He reported having no disclosures.
The complete manuscript of this presentation is anticipated to be published in the Annals of Surgery pending editorial review.
CHICAGO – Use of a diagnostic algorithm for pediatric appendicitis significantly decreases computed tomography utilization without compromising high sensitivity and specificity, according to findings from a study of emergency cases.
Of 840 patients seen in an academic children’s hospital emergency department from Aug. 1, 2014 to July 31, 2015, after implementation of the diagnostic algorithm, 267 were diagnosed with appendicitis. CT utilization was 27.3% overall, and 24.2% in patients with appendicitis, compared with 75.4% among 557 patients with appendicitis seen from Jan. 1, 2011 to February 28, 2014, before implementation, Dr. Sohail R. Shah of Baylor College of Medicine/Texas Children’s Hospital, Houston reported at the annual meeting of the American Surgical Association
The work was completed at his prior position at Children’s Mercy Hospital Kansas City.
“Additionally, utilization of ultrasound prior to CT went from 24% up to 95%, surgical consultation prior to CT increased from 14.7% to 76.1% after implementation, and operative intervention without any imaging went from just under 2% to almost 10% after implementation of the diagnostic algorithm,” Dr. Shah said, adding that the pre- and postimplementation patient groups were similar with respect to demographics.
The diagnostic pathway had a sensitivity of 98.6% and specificity of 94.4%, he said.
Appendicitis is the most common abdominal condition leading to the hospitalization of children, and it accounts for about 70,000 children hospitalized annually in the United States, with an average related healthcare cost of $675 million each year, he said.
The diagnosis in children can be difficult, thus many centers rely heavily on CT scans. However, increasing use of CT in children could lead to an increased lifetime risk of radiation-induced malignancy.
“In fact, the American College of Radiology currently recommends that a CT scan not be done for the diagnosis of appendicitis until after ultrasound has been considered as an option. Our objective with this work was to decrease CT utilization for the diagnosis of appendicitis in children at our academic free-standing children’s hospital emergency department through the introduction of a diagnostic algorithm,” he said.
A multidisciplinary team at Children’s Mercy Hospital worked to develop an algorithm, which promoted earlier surgical consultation and prioritized ultrasound imaging over CT scans. The algorithm involved the use of the 10-point Pediatric Appendicitis Score for risk stratification. For a score of 1-3, with low probability of appendicitis, the patient was discharged home or received further work-up for an alternative diagnosis. For a score of 4-6, with intermediate probability of appendicitis, an ultrasound was ordered. If the ultrasound was negative, the patient was discharged home or received further work-up for an alternative diagnosis; if the ultrasound was positive, surgery was consulted; if the ultrasound was indeterminate, surgery was consulted prior to consideration of CT scan. For a score of 7-10, surgery was immediately consulted for further management.
“If this algorithm is followed appropriately for all patients, then no patient should have a CT scan without first having an ultrasound and surgical consultation,” Dr. Shah said.
He reported having no disclosures.
The complete manuscript of this presentation is anticipated to be published in the Annals of Surgery pending editorial review.
CHICAGO – Use of a diagnostic algorithm for pediatric appendicitis significantly decreases computed tomography utilization without compromising high sensitivity and specificity, according to findings from a study of emergency cases.
Of 840 patients seen in an academic children’s hospital emergency department from Aug. 1, 2014 to July 31, 2015, after implementation of the diagnostic algorithm, 267 were diagnosed with appendicitis. CT utilization was 27.3% overall, and 24.2% in patients with appendicitis, compared with 75.4% among 557 patients with appendicitis seen from Jan. 1, 2011 to February 28, 2014, before implementation, Dr. Sohail R. Shah of Baylor College of Medicine/Texas Children’s Hospital, Houston reported at the annual meeting of the American Surgical Association
The work was completed at his prior position at Children’s Mercy Hospital Kansas City.
“Additionally, utilization of ultrasound prior to CT went from 24% up to 95%, surgical consultation prior to CT increased from 14.7% to 76.1% after implementation, and operative intervention without any imaging went from just under 2% to almost 10% after implementation of the diagnostic algorithm,” Dr. Shah said, adding that the pre- and postimplementation patient groups were similar with respect to demographics.
The diagnostic pathway had a sensitivity of 98.6% and specificity of 94.4%, he said.
Appendicitis is the most common abdominal condition leading to the hospitalization of children, and it accounts for about 70,000 children hospitalized annually in the United States, with an average related healthcare cost of $675 million each year, he said.
The diagnosis in children can be difficult, thus many centers rely heavily on CT scans. However, increasing use of CT in children could lead to an increased lifetime risk of radiation-induced malignancy.
“In fact, the American College of Radiology currently recommends that a CT scan not be done for the diagnosis of appendicitis until after ultrasound has been considered as an option. Our objective with this work was to decrease CT utilization for the diagnosis of appendicitis in children at our academic free-standing children’s hospital emergency department through the introduction of a diagnostic algorithm,” he said.
A multidisciplinary team at Children’s Mercy Hospital worked to develop an algorithm, which promoted earlier surgical consultation and prioritized ultrasound imaging over CT scans. The algorithm involved the use of the 10-point Pediatric Appendicitis Score for risk stratification. For a score of 1-3, with low probability of appendicitis, the patient was discharged home or received further work-up for an alternative diagnosis. For a score of 4-6, with intermediate probability of appendicitis, an ultrasound was ordered. If the ultrasound was negative, the patient was discharged home or received further work-up for an alternative diagnosis; if the ultrasound was positive, surgery was consulted; if the ultrasound was indeterminate, surgery was consulted prior to consideration of CT scan. For a score of 7-10, surgery was immediately consulted for further management.
“If this algorithm is followed appropriately for all patients, then no patient should have a CT scan without first having an ultrasound and surgical consultation,” Dr. Shah said.
He reported having no disclosures.
The complete manuscript of this presentation is anticipated to be published in the Annals of Surgery pending editorial review.
AT THE ASA ANNUAL MEETING
Key clinical point: Use of a diagnostic algorithm for pediatric appendicitis significantly decreases computed tomography utilization without compromising high sensitivity and specificity, according to findings from a study of nearly 1,400 cases.
Major finding: CT utilization in patients with appendicitis was 24.2% before, and 75.4% after, implementation of the algorithm.
Data source: A review of nearly 1,400 pediatric appendicitis cases.
Disclosures: Dr. Shah reported having no disclosures.

Vaccination Rates High at Kindergarten Entry, but Gaps Remain
BALTIMORE – Most families’ kindergarteners met the full vaccination requirements of their state in a 2013 national survey, although 17% of parents were notified that their children still needed vaccines to comply with state requirements.
Of those 17% of families, however, 7.5% claimed exemptions from their states’ vaccination requirements at school entry, according to a study conducted by Philip Smith, Ph.D., and his associates at the Centers for Disease Control and Prevention.

Using data from the 1,465 parents who participated in the 2013 National Immunization Survey–Kindergarten (NIS-K,), Dr. Smith and his colleagues found that among the required vaccines, full coverage (five or more doses) was lowest for the DTaP vaccine, at 88.5% of 5- to 7-year-olds. Next was the varicella vaccine, with 89.4% of children having received at least two doses. For the inactivated polio vaccine, 90.9% of children had received at least four doses. The highest rate of full coverage – 91.8% – was for the MMR vaccine.
Whether children attended public or private school didn’t make a difference in vaccination rates. However, for children who had not entered kindergarten, “vaccination coverage was significantly lower than coverage for children who had entered kindergarten,” at least in part because those children were younger than those who had entered kindergarten, said Dr. Smith.
Health insurance status did not make a difference in the likelihood that a family would receive notification that their kindergartener needed vaccinations, implying that the differences “may not be attributable to access to primary care,” wrote Dr. Smith, presenting his work at a poster session of the annual meeting of the Pediatric Academic Societies.
The number of parents overall who claimed an exemption was “really, really small,” said Dr. Smith, just 1.9% of all families surveyed. He noted that his work shows that most of the children who have not met their state’s full immunization requirements for school entry do not come from families who seek exemption from the requirements.
Limitations of the survey, said Dr. Smith and his colleagues, included the inability to determine vaccination rates at the precise time of kindergarten entry. “As a consequence, our estimates of differences in vaccination coverage that is associated with notification as of the date of school entry may underestimate the true differences,” they wrote. Also, the small sample size made it difficult to ascertain the proportion of parents who took exemptions from vaccination of their child for medical, religious, or philosophical reasons.
“While our findings show that national vaccination coverage at school entry was high and exemption levels were low, some children remained undervaccinated after the start of the school year despite efforts of school vaccination programs to notify parents about needed vaccines,” wrote Dr. Smith and his coauthors.
The NIS-K is conducted by the Centers for Disease Control and Prevention, where Dr. Smith is employed. Dr. Smith reported no relevant financial disclosures.
BALTIMORE – Most families’ kindergarteners met the full vaccination requirements of their state in a 2013 national survey, although 17% of parents were notified that their children still needed vaccines to comply with state requirements.
Of those 17% of families, however, 7.5% claimed exemptions from their states’ vaccination requirements at school entry, according to a study conducted by Philip Smith, Ph.D., and his associates at the Centers for Disease Control and Prevention.
Using data from the 1,465 parents who participated in the 2013 National Immunization Survey–Kindergarten (NIS-K,), Dr. Smith and his colleagues found that among the required vaccines, full coverage (five or more doses) was lowest for the DTaP vaccine, at 88.5% of 5- to 7-year-olds. Next was the varicella vaccine, with 89.4% of children having received at least two doses. For the inactivated polio vaccine, 90.9% of children had received at least four doses. The highest rate of full coverage – 91.8% – was for the MMR vaccine.
Whether children attended public or private school didn’t make a difference in vaccination rates. However, for children who had not entered kindergarten, “vaccination coverage was significantly lower than coverage for children who had entered kindergarten,” at least in part because those children were younger than those who had entered kindergarten, said Dr. Smith.
Health insurance status did not make a difference in the likelihood that a family would receive notification that their kindergartener needed vaccinations, implying that the differences “may not be attributable to access to primary care,” wrote Dr. Smith, presenting his work at a poster session of the annual meeting of the Pediatric Academic Societies.
The number of parents overall who claimed an exemption was “really, really small,” said Dr. Smith, just 1.9% of all families surveyed. He noted that his work shows that most of the children who have not met their state’s full immunization requirements for school entry do not come from families who seek exemption from the requirements.
Limitations of the survey, said Dr. Smith and his colleagues, included the inability to determine vaccination rates at the precise time of kindergarten entry. “As a consequence, our estimates of differences in vaccination coverage that is associated with notification as of the date of school entry may underestimate the true differences,” they wrote. Also, the small sample size made it difficult to ascertain the proportion of parents who took exemptions from vaccination of their child for medical, religious, or philosophical reasons.
“While our findings show that national vaccination coverage at school entry was high and exemption levels were low, some children remained undervaccinated after the start of the school year despite efforts of school vaccination programs to notify parents about needed vaccines,” wrote Dr. Smith and his coauthors.
The NIS-K is conducted by the Centers for Disease Control and Prevention, where Dr. Smith is employed. Dr. Smith reported no relevant financial disclosures.
BALTIMORE – Most families’ kindergarteners met the full vaccination requirements of their state in a 2013 national survey, although 17% of parents were notified that their children still needed vaccines to comply with state requirements.
Of those 17% of families, however, 7.5% claimed exemptions from their states’ vaccination requirements at school entry, according to a study conducted by Philip Smith, Ph.D., and his associates at the Centers for Disease Control and Prevention.
Using data from the 1,465 parents who participated in the 2013 National Immunization Survey–Kindergarten (NIS-K,), Dr. Smith and his colleagues found that among the required vaccines, full coverage (five or more doses) was lowest for the DTaP vaccine, at 88.5% of 5- to 7-year-olds. Next was the varicella vaccine, with 89.4% of children having received at least two doses. For the inactivated polio vaccine, 90.9% of children had received at least four doses. The highest rate of full coverage – 91.8% – was for the MMR vaccine.
Whether children attended public or private school didn’t make a difference in vaccination rates. However, for children who had not entered kindergarten, “vaccination coverage was significantly lower than coverage for children who had entered kindergarten,” at least in part because those children were younger than those who had entered kindergarten, said Dr. Smith.
Health insurance status did not make a difference in the likelihood that a family would receive notification that their kindergartener needed vaccinations, implying that the differences “may not be attributable to access to primary care,” wrote Dr. Smith, presenting his work at a poster session of the annual meeting of the Pediatric Academic Societies.
The number of parents overall who claimed an exemption was “really, really small,” said Dr. Smith, just 1.9% of all families surveyed. He noted that his work shows that most of the children who have not met their state’s full immunization requirements for school entry do not come from families who seek exemption from the requirements.
Limitations of the survey, said Dr. Smith and his colleagues, included the inability to determine vaccination rates at the precise time of kindergarten entry. “As a consequence, our estimates of differences in vaccination coverage that is associated with notification as of the date of school entry may underestimate the true differences,” they wrote. Also, the small sample size made it difficult to ascertain the proportion of parents who took exemptions from vaccination of their child for medical, religious, or philosophical reasons.
“While our findings show that national vaccination coverage at school entry was high and exemption levels were low, some children remained undervaccinated after the start of the school year despite efforts of school vaccination programs to notify parents about needed vaccines,” wrote Dr. Smith and his coauthors.
The NIS-K is conducted by the Centers for Disease Control and Prevention, where Dr. Smith is employed. Dr. Smith reported no relevant financial disclosures.
AT THE PAS ANNUAL MEETING

Vaccination rates high at kindergarten entry, but gaps remain
BALTIMORE – Most families’ kindergarteners met the full vaccination requirements of their state in a 2013 national survey, although 17% of parents were notified that their children still needed vaccines to comply with state requirements.
Of those 17% of families, however, 7.5% claimed exemptions from their states’ vaccination requirements at school entry, according to a study conducted by Philip Smith, Ph.D., and his associates at the Centers for Disease Control and Prevention.

Using data from the 1,465 parents who participated in the 2013 National Immunization Survey–Kindergarten (NIS-K,), Dr. Smith and his colleagues found that among the required vaccines, full coverage (five or more doses) was lowest for the DTaP vaccine, at 88.5% of 5- to 7-year-olds. Next was the varicella vaccine, with 89.4% of children having received at least two doses. For the inactivated polio vaccine, 90.9% of children had received at least four doses. The highest rate of full coverage – 91.8% – was for the MMR vaccine.
Whether children attended public or private school didn’t make a difference in vaccination rates. However, for children who had not entered kindergarten, “vaccination coverage was significantly lower than coverage for children who had entered kindergarten,” at least in part because those children were younger than those who had entered kindergarten, said Dr. Smith.
Health insurance status did not make a difference in the likelihood that a family would receive notification that their kindergartener needed vaccinations, implying that the differences “may not be attributable to access to primary care,” wrote Dr. Smith, presenting his work at a poster session of the annual meeting of the Pediatric Academic Societies.
The number of parents overall who claimed an exemption was “really, really small,” said Dr. Smith, just 1.9% of all families surveyed. He noted that his work shows that most of the children who have not met their state’s full immunization requirements for school entry do not come from families who seek exemption from the requirements.
Limitations of the survey, said Dr. Smith and his colleagues, included the inability to determine vaccination rates at the precise time of kindergarten entry. “As a consequence, our estimates of differences in vaccination coverage that is associated with notification as of the date of school entry may underestimate the true differences,” they wrote. Also, the small sample size made it difficult to ascertain the proportion of parents who took exemptions from vaccination of their child for medical, religious, or philosophical reasons.
“While our findings show that national vaccination coverage at school entry was high and exemption levels were low, some children remained undervaccinated after the start of the school year despite efforts of school vaccination programs to notify parents about needed vaccines,” wrote Dr. Smith and his coauthors.
The NIS-K is conducted by the Centers for Disease Control and Prevention, where Dr. Smith is employed. Dr. Smith reported no relevant financial disclosures.
On Twitter @karioakes
BALTIMORE – Most families’ kindergarteners met the full vaccination requirements of their state in a 2013 national survey, although 17% of parents were notified that their children still needed vaccines to comply with state requirements.
Of those 17% of families, however, 7.5% claimed exemptions from their states’ vaccination requirements at school entry, according to a study conducted by Philip Smith, Ph.D., and his associates at the Centers for Disease Control and Prevention.
Using data from the 1,465 parents who participated in the 2013 National Immunization Survey–Kindergarten (NIS-K,), Dr. Smith and his colleagues found that among the required vaccines, full coverage (five or more doses) was lowest for the DTaP vaccine, at 88.5% of 5- to 7-year-olds. Next was the varicella vaccine, with 89.4% of children having received at least two doses. For the inactivated polio vaccine, 90.9% of children had received at least four doses. The highest rate of full coverage – 91.8% – was for the MMR vaccine.
Whether children attended public or private school didn’t make a difference in vaccination rates. However, for children who had not entered kindergarten, “vaccination coverage was significantly lower than coverage for children who had entered kindergarten,” at least in part because those children were younger than those who had entered kindergarten, said Dr. Smith.
Health insurance status did not make a difference in the likelihood that a family would receive notification that their kindergartener needed vaccinations, implying that the differences “may not be attributable to access to primary care,” wrote Dr. Smith, presenting his work at a poster session of the annual meeting of the Pediatric Academic Societies.
The number of parents overall who claimed an exemption was “really, really small,” said Dr. Smith, just 1.9% of all families surveyed. He noted that his work shows that most of the children who have not met their state’s full immunization requirements for school entry do not come from families who seek exemption from the requirements.
Limitations of the survey, said Dr. Smith and his colleagues, included the inability to determine vaccination rates at the precise time of kindergarten entry. “As a consequence, our estimates of differences in vaccination coverage that is associated with notification as of the date of school entry may underestimate the true differences,” they wrote. Also, the small sample size made it difficult to ascertain the proportion of parents who took exemptions from vaccination of their child for medical, religious, or philosophical reasons.
“While our findings show that national vaccination coverage at school entry was high and exemption levels were low, some children remained undervaccinated after the start of the school year despite efforts of school vaccination programs to notify parents about needed vaccines,” wrote Dr. Smith and his coauthors.
The NIS-K is conducted by the Centers for Disease Control and Prevention, where Dr. Smith is employed. Dr. Smith reported no relevant financial disclosures.
On Twitter @karioakes
BALTIMORE – Most families’ kindergarteners met the full vaccination requirements of their state in a 2013 national survey, although 17% of parents were notified that their children still needed vaccines to comply with state requirements.
Of those 17% of families, however, 7.5% claimed exemptions from their states’ vaccination requirements at school entry, according to a study conducted by Philip Smith, Ph.D., and his associates at the Centers for Disease Control and Prevention.
Using data from the 1,465 parents who participated in the 2013 National Immunization Survey–Kindergarten (NIS-K,), Dr. Smith and his colleagues found that among the required vaccines, full coverage (five or more doses) was lowest for the DTaP vaccine, at 88.5% of 5- to 7-year-olds. Next was the varicella vaccine, with 89.4% of children having received at least two doses. For the inactivated polio vaccine, 90.9% of children had received at least four doses. The highest rate of full coverage – 91.8% – was for the MMR vaccine.
Whether children attended public or private school didn’t make a difference in vaccination rates. However, for children who had not entered kindergarten, “vaccination coverage was significantly lower than coverage for children who had entered kindergarten,” at least in part because those children were younger than those who had entered kindergarten, said Dr. Smith.
Health insurance status did not make a difference in the likelihood that a family would receive notification that their kindergartener needed vaccinations, implying that the differences “may not be attributable to access to primary care,” wrote Dr. Smith, presenting his work at a poster session of the annual meeting of the Pediatric Academic Societies.
The number of parents overall who claimed an exemption was “really, really small,” said Dr. Smith, just 1.9% of all families surveyed. He noted that his work shows that most of the children who have not met their state’s full immunization requirements for school entry do not come from families who seek exemption from the requirements.
Limitations of the survey, said Dr. Smith and his colleagues, included the inability to determine vaccination rates at the precise time of kindergarten entry. “As a consequence, our estimates of differences in vaccination coverage that is associated with notification as of the date of school entry may underestimate the true differences,” they wrote. Also, the small sample size made it difficult to ascertain the proportion of parents who took exemptions from vaccination of their child for medical, religious, or philosophical reasons.
“While our findings show that national vaccination coverage at school entry was high and exemption levels were low, some children remained undervaccinated after the start of the school year despite efforts of school vaccination programs to notify parents about needed vaccines,” wrote Dr. Smith and his coauthors.
The NIS-K is conducted by the Centers for Disease Control and Prevention, where Dr. Smith is employed. Dr. Smith reported no relevant financial disclosures.
On Twitter @karioakes
AT THE PAS ANNUAL MEETING
Key clinical point: All but 17% of 5- to 7-year-olds received their full complement of childhood immunizations in a 2013 study.
Major finding: Of the 17% of 1,465 who were notified of missing immunizations, 7.5% claimed an exemption from vaccination. This is just 1.9% of the total.
Data source: The 2013 National Immunization Survey–Kindergarten (NIS-K), a physician record–verified phone survey of 1,465 parents.
Disclosures: The NIS-K is conducted by the Centers for Disease Control and Prevention, where Dr. Smith is employed. Dr. Smith reported no relevant financial disclosures.

Benign Lesion on the Posterior Aspect of the Neck
Nuchal-Type Fibroma
Nuchal-type fibroma (NTF) is a rare benign proliferation of the dermis and subcutis associated with diabetes mellitus and Gardner syndrome.1,2 Forty-four percent of patients with NTF have diabetes mellitus.2 The posterior aspect of the neck is the most frequently affected site, but lesions also may present on the upper back, lumbosacral area, buttocks, and face. Physical examination generally reveals an indurated, asymptomatic, ill-defined, 3-cm or smaller nodule that is hard and white, unencapsulated, and poorly circumscribed.
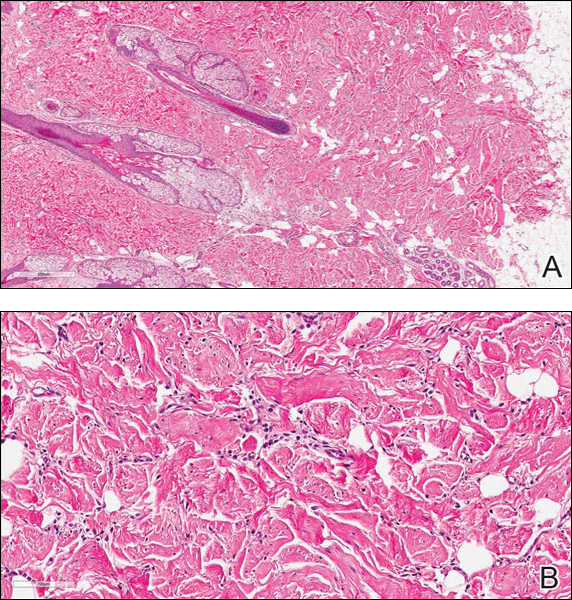
Histopathologic examination of NTF typically reveals a nodular paucicellular proliferation of thick collagen bundles with inconspicuous fibroblasts, radiation of collagenous septa into the subcutaneous fat, and entrapment of mature adipose tissue and small nerves (quiz image A). Collagen bundles are thickened with entrapment of adipose tissue without increased cellularity (quiz image B). S-100 staining can show the entrapped nerves.
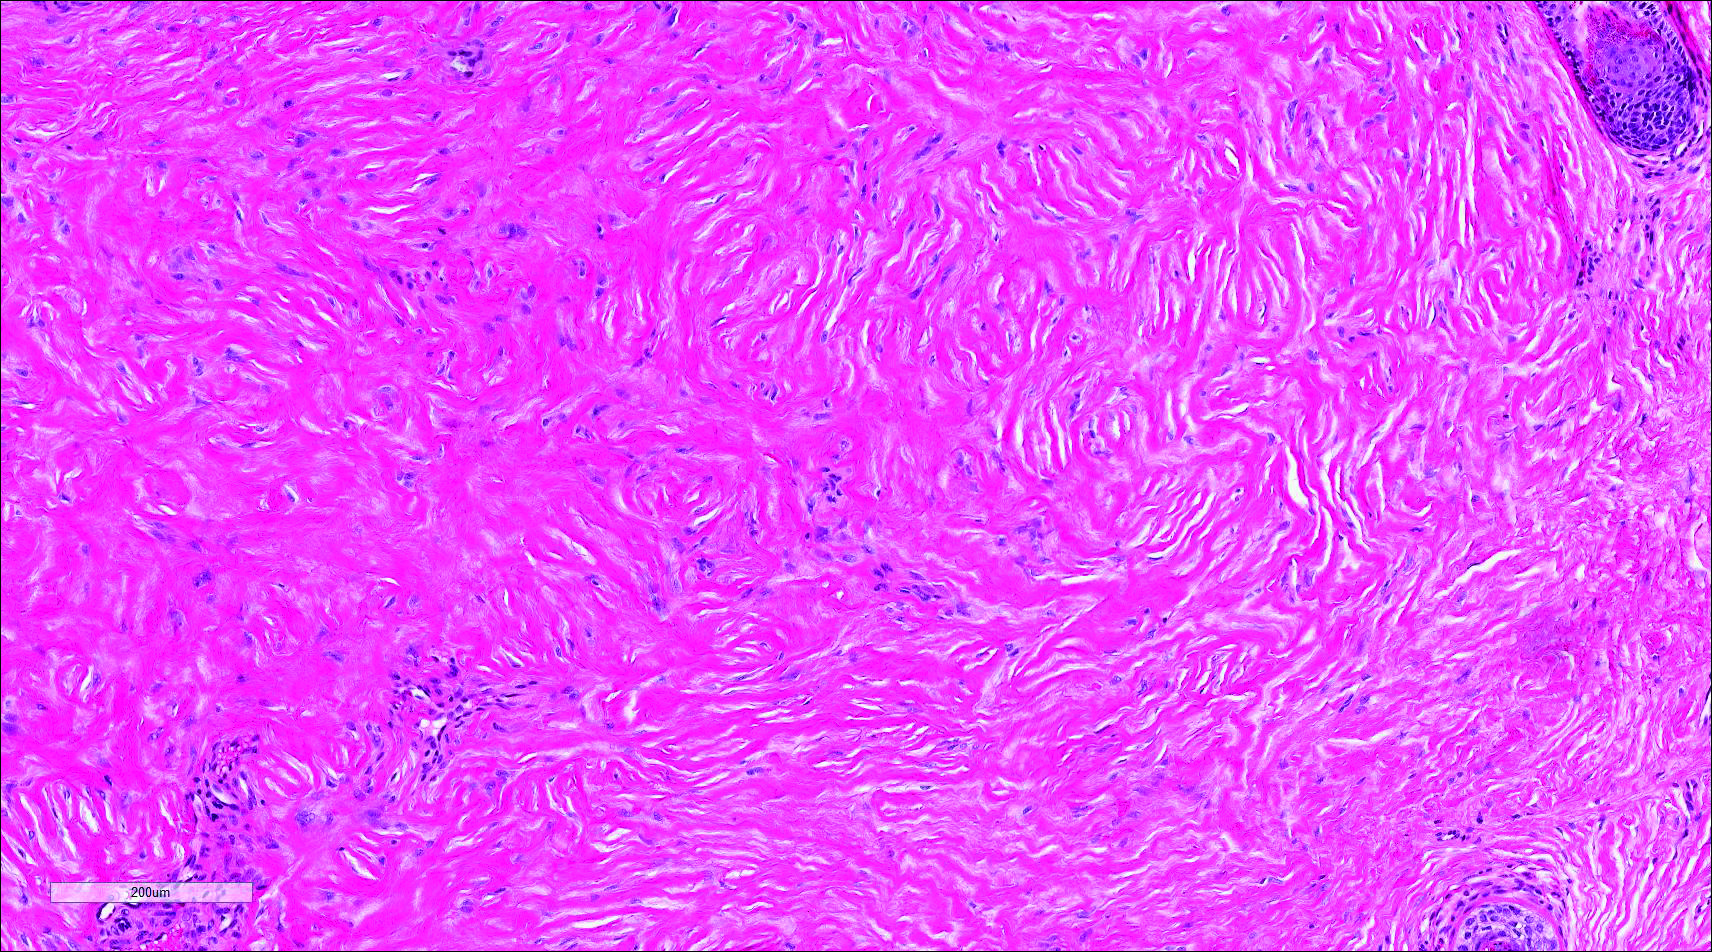
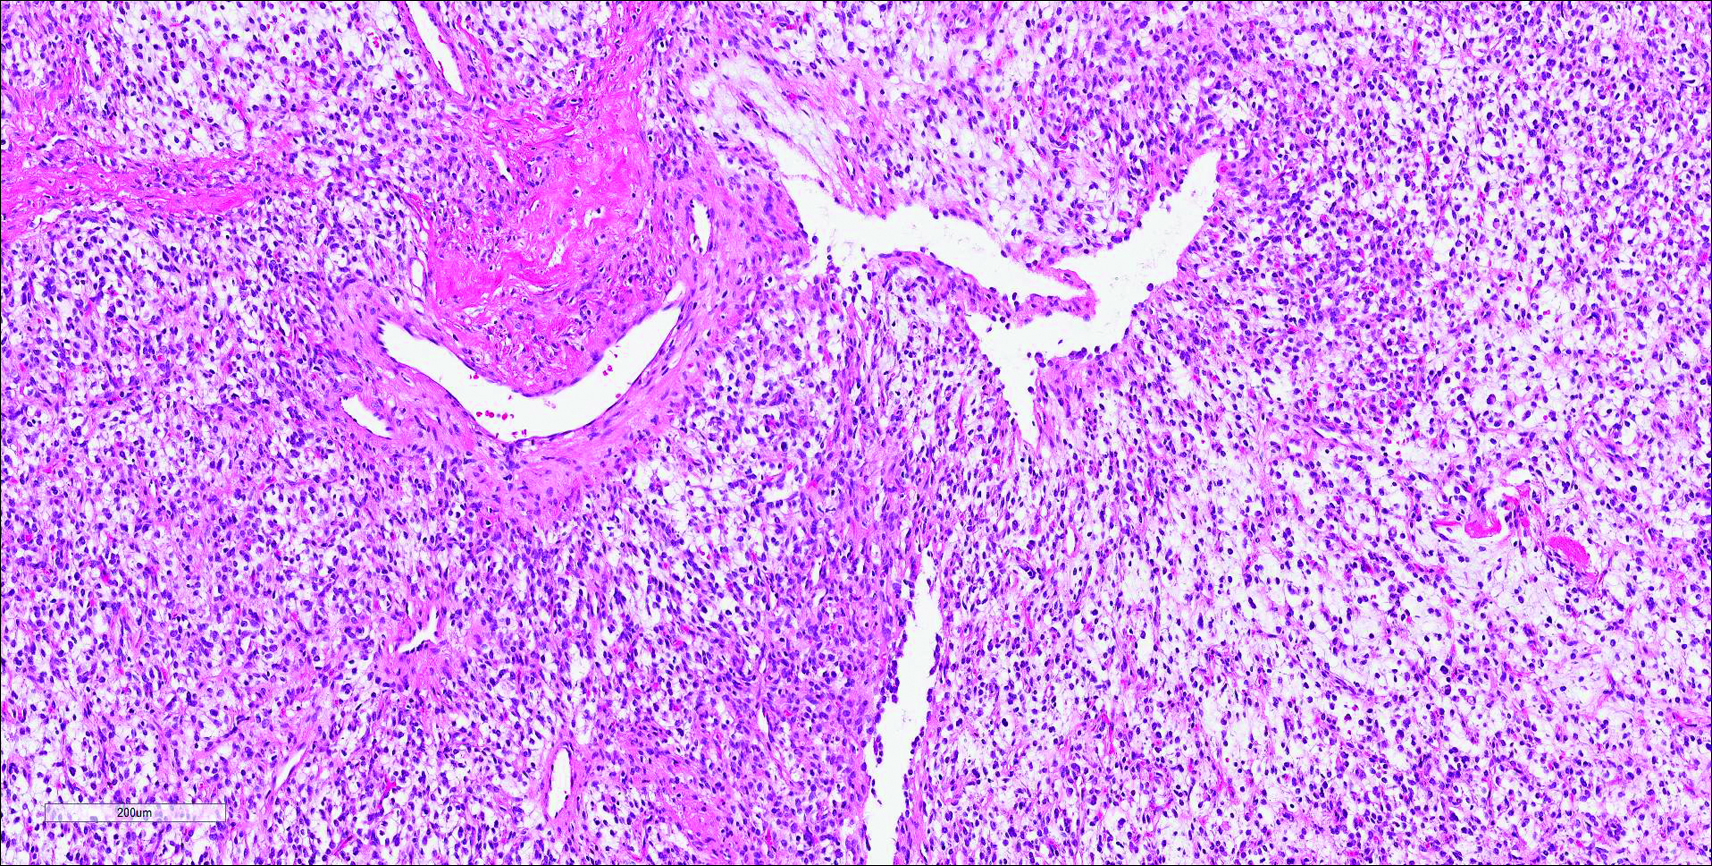
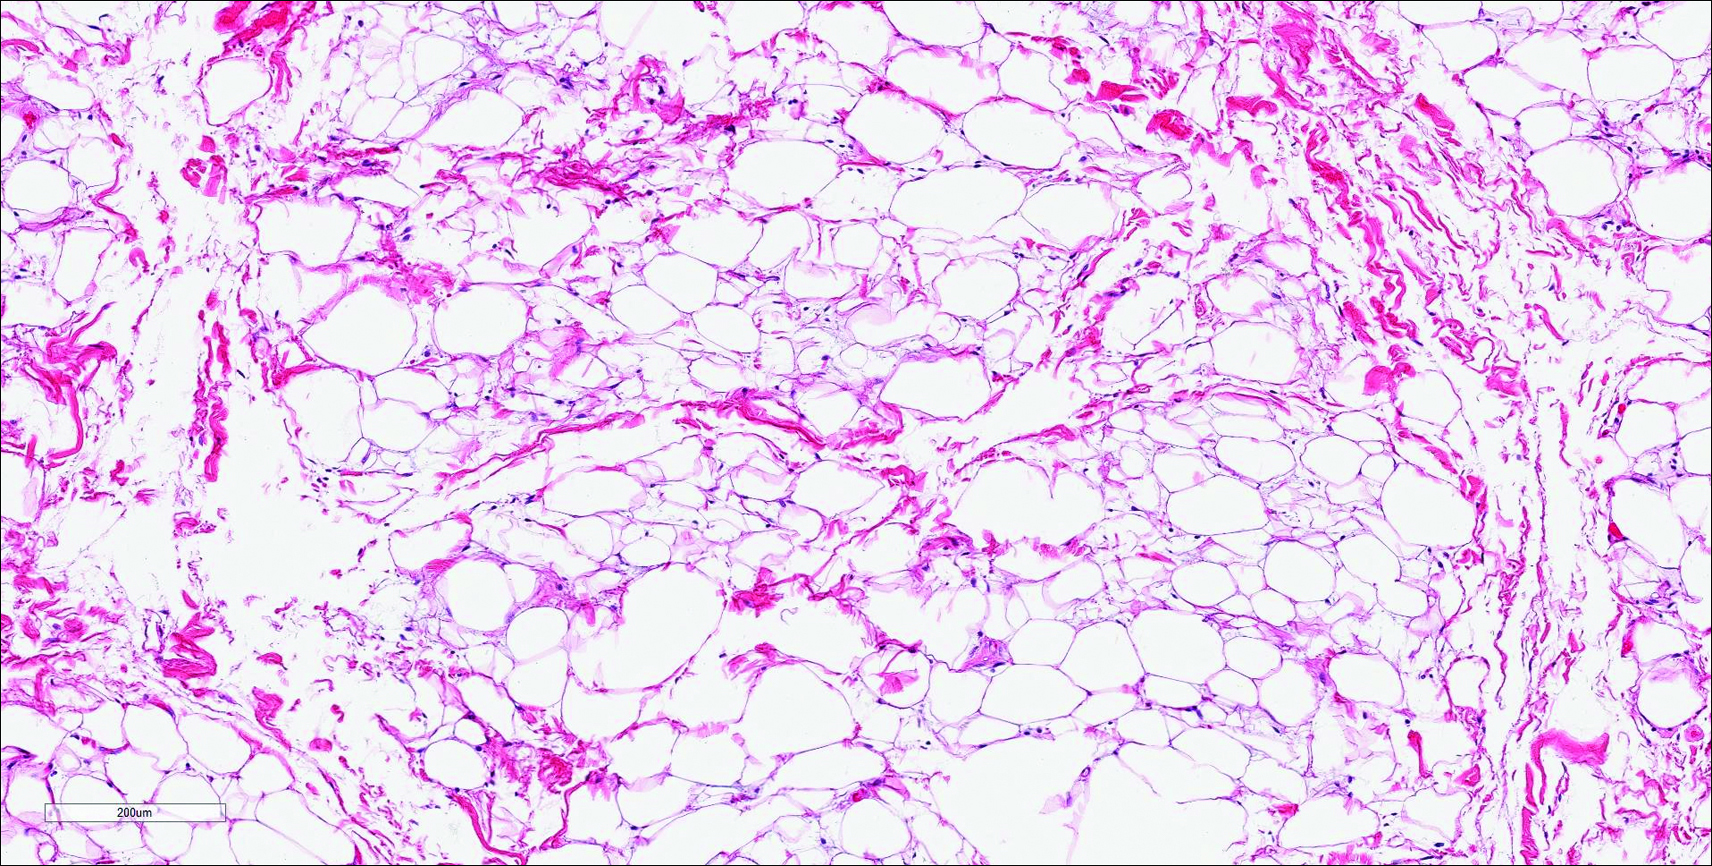
Similar to NTF, sclerotic fibroma is a firm dermal nodule with histologic examination usually demonstrating a paucicellular collagenous tumor. In sclerotic fibromas, the collagen pattern resembles Vincent van Gogh’s painting “The Starry Night” and may be a marker for Cowden disease (Figure 1).3 Solitary fibrous tumors are distinguished by more hypercellular areas, patternless pattern, and staghorn-shaped blood vessels (Figure 2).4 Spindle cell lipoma classically demonstrates a mixture of mature adipocytes and bland spindle cells in a mucinous or fibrous background with thick collagen bundles with no storiform pattern (Figure 3). Some variants of spindle cell lipoma have minimal or no fat.5 All of these conditions have positive immunohistochemical staining for CD34.
However, dermatofibroma is CD34‒. Dermatofibroma is characterized by an interstitial spindle cell proliferation with a loose storiform pattern, collagen trapping at the outer edges of the tumor, overlying platelike acanthosis, and sometimes follicular induction (Figure 4).

Nuchal-type fibroma also can resemble scleredema. Both lesions can show increased and thickened collagen bundles without notable fibroblast proliferation; the difference is the occurrence of mucin in scleredema. However, incases of late-stage scleredema, mucin is not always demonstrated. Therefore, one can conclude that histologically NTF is closely associated with late-stage scleredema.6
- Dawes LC, La Hei ER, Tobias V, et al. Nuchal fibroma should be recognized as a new extracolonic manifestation of Gardner-variant familial adenomatous polyposis. Aust N Z J Surg. 2000;70:824-826.
- Michal M, Fetsch JF, Hes O, et al. Nuchal-type fibroma: a clinicopathologic study of 52 cases. Cancer. 1999;85:156-163.
- Pernet C, Durand L, Bessis D, et al. Solitary sclerotic fibroma of the skin: a possible clue for Cowden syndrome. Eur J Dermatol. 2012;22:278-279.
- Omori Y, Saeki H, Ito K, et al. Solitary fibrous tumour of the scalp. Clin Exp Dermatol. 2014;39:539-541.
- Billings SD, Folpe AL. Diagnostically challenging spindle cell lipomas: a report of 34 “low-fat” and “fat-free” variants. Am J Dermatopathol. 2007;29:437-442.
- Banney LA, Weedon D, Muir JB. Nuchal fibroma associated with scleredema, diabetes mellitus and organic solvent exposure. Australas J Dermatol. 2000;41:39-41.
Nuchal-Type Fibroma
Nuchal-type fibroma (NTF) is a rare benign proliferation of the dermis and subcutis associated with diabetes mellitus and Gardner syndrome.1,2 Forty-four percent of patients with NTF have diabetes mellitus.2 The posterior aspect of the neck is the most frequently affected site, but lesions also may present on the upper back, lumbosacral area, buttocks, and face. Physical examination generally reveals an indurated, asymptomatic, ill-defined, 3-cm or smaller nodule that is hard and white, unencapsulated, and poorly circumscribed.
Histopathologic examination of NTF typically reveals a nodular paucicellular proliferation of thick collagen bundles with inconspicuous fibroblasts, radiation of collagenous septa into the subcutaneous fat, and entrapment of mature adipose tissue and small nerves (quiz image A). Collagen bundles are thickened with entrapment of adipose tissue without increased cellularity (quiz image B). S-100 staining can show the entrapped nerves.
Similar to NTF, sclerotic fibroma is a firm dermal nodule with histologic examination usually demonstrating a paucicellular collagenous tumor. In sclerotic fibromas, the collagen pattern resembles Vincent van Gogh’s painting “The Starry Night” and may be a marker for Cowden disease (Figure 1).3 Solitary fibrous tumors are distinguished by more hypercellular areas, patternless pattern, and staghorn-shaped blood vessels (Figure 2).4 Spindle cell lipoma classically demonstrates a mixture of mature adipocytes and bland spindle cells in a mucinous or fibrous background with thick collagen bundles with no storiform pattern (Figure 3). Some variants of spindle cell lipoma have minimal or no fat.5 All of these conditions have positive immunohistochemical staining for CD34.
However, dermatofibroma is CD34‒. Dermatofibroma is characterized by an interstitial spindle cell proliferation with a loose storiform pattern, collagen trapping at the outer edges of the tumor, overlying platelike acanthosis, and sometimes follicular induction (Figure 4).
Nuchal-type fibroma also can resemble scleredema. Both lesions can show increased and thickened collagen bundles without notable fibroblast proliferation; the difference is the occurrence of mucin in scleredema. However, incases of late-stage scleredema, mucin is not always demonstrated. Therefore, one can conclude that histologically NTF is closely associated with late-stage scleredema.6
Nuchal-Type Fibroma
Nuchal-type fibroma (NTF) is a rare benign proliferation of the dermis and subcutis associated with diabetes mellitus and Gardner syndrome.1,2 Forty-four percent of patients with NTF have diabetes mellitus.2 The posterior aspect of the neck is the most frequently affected site, but lesions also may present on the upper back, lumbosacral area, buttocks, and face. Physical examination generally reveals an indurated, asymptomatic, ill-defined, 3-cm or smaller nodule that is hard and white, unencapsulated, and poorly circumscribed.
Histopathologic examination of NTF typically reveals a nodular paucicellular proliferation of thick collagen bundles with inconspicuous fibroblasts, radiation of collagenous septa into the subcutaneous fat, and entrapment of mature adipose tissue and small nerves (quiz image A). Collagen bundles are thickened with entrapment of adipose tissue without increased cellularity (quiz image B). S-100 staining can show the entrapped nerves.
Similar to NTF, sclerotic fibroma is a firm dermal nodule with histologic examination usually demonstrating a paucicellular collagenous tumor. In sclerotic fibromas, the collagen pattern resembles Vincent van Gogh’s painting “The Starry Night” and may be a marker for Cowden disease (Figure 1).3 Solitary fibrous tumors are distinguished by more hypercellular areas, patternless pattern, and staghorn-shaped blood vessels (Figure 2).4 Spindle cell lipoma classically demonstrates a mixture of mature adipocytes and bland spindle cells in a mucinous or fibrous background with thick collagen bundles with no storiform pattern (Figure 3). Some variants of spindle cell lipoma have minimal or no fat.5 All of these conditions have positive immunohistochemical staining for CD34.
However, dermatofibroma is CD34‒. Dermatofibroma is characterized by an interstitial spindle cell proliferation with a loose storiform pattern, collagen trapping at the outer edges of the tumor, overlying platelike acanthosis, and sometimes follicular induction (Figure 4).
Nuchal-type fibroma also can resemble scleredema. Both lesions can show increased and thickened collagen bundles without notable fibroblast proliferation; the difference is the occurrence of mucin in scleredema. However, incases of late-stage scleredema, mucin is not always demonstrated. Therefore, one can conclude that histologically NTF is closely associated with late-stage scleredema.6
- Dawes LC, La Hei ER, Tobias V, et al. Nuchal fibroma should be recognized as a new extracolonic manifestation of Gardner-variant familial adenomatous polyposis. Aust N Z J Surg. 2000;70:824-826.
- Michal M, Fetsch JF, Hes O, et al. Nuchal-type fibroma: a clinicopathologic study of 52 cases. Cancer. 1999;85:156-163.
- Pernet C, Durand L, Bessis D, et al. Solitary sclerotic fibroma of the skin: a possible clue for Cowden syndrome. Eur J Dermatol. 2012;22:278-279.
- Omori Y, Saeki H, Ito K, et al. Solitary fibrous tumour of the scalp. Clin Exp Dermatol. 2014;39:539-541.
- Billings SD, Folpe AL. Diagnostically challenging spindle cell lipomas: a report of 34 “low-fat” and “fat-free” variants. Am J Dermatopathol. 2007;29:437-442.
- Banney LA, Weedon D, Muir JB. Nuchal fibroma associated with scleredema, diabetes mellitus and organic solvent exposure. Australas J Dermatol. 2000;41:39-41.
- Dawes LC, La Hei ER, Tobias V, et al. Nuchal fibroma should be recognized as a new extracolonic manifestation of Gardner-variant familial adenomatous polyposis. Aust N Z J Surg. 2000;70:824-826.
- Michal M, Fetsch JF, Hes O, et al. Nuchal-type fibroma: a clinicopathologic study of 52 cases. Cancer. 1999;85:156-163.
- Pernet C, Durand L, Bessis D, et al. Solitary sclerotic fibroma of the skin: a possible clue for Cowden syndrome. Eur J Dermatol. 2012;22:278-279.
- Omori Y, Saeki H, Ito K, et al. Solitary fibrous tumour of the scalp. Clin Exp Dermatol. 2014;39:539-541.
- Billings SD, Folpe AL. Diagnostically challenging spindle cell lipomas: a report of 34 “low-fat” and “fat-free” variants. Am J Dermatopathol. 2007;29:437-442.
- Banney LA, Weedon D, Muir JB. Nuchal fibroma associated with scleredema, diabetes mellitus and organic solvent exposure. Australas J Dermatol. 2000;41:39-41.
The best diagnosis is:
a. dermatofibroma
b. nuchal-type fibroma
c. sclerotic fibroma
d. solitary fibrous tumor
e. spindle cell lipoma
Continue to the next page for the diagnosis >>
SIDS most likely in swaddled infants placed on front or side
Sudden infant death syndrome is significantly more likely in infants who are swaddled and placed on the front or side, according to a meta-analysis by Anna S. Pease of the University of Bristol (England), and her associates.
They looked at four studies covering 760 cases of SIDS and 1,759 controls. The odds ratio for swaddling when infant death occurred was 1.58. Risk was highest when swaddled infants were placed on their stomachs, with an OR of 12.99, though risk was also high for children placed on their sides, with an OR of 3.16. Swaddled infants placed on their backs had the lowest risk, with an OR of 1.93.

Some evidence suggested that swaddling risk increased as the infant got older, with an odds ratio of 2.53 in children older than 6 months; however, cases were uncommon and the relationship is not definitive.
“Given the marked increase in infants swaddled and found prone (rather than placed prone), coupled with an increased risk of swaddling with increased age regardless of sleeping position, health professionals and current guidelines should consider an appropriate age limit at which swaddling should be discouraged,” the investigators concluded.
Find the full study in Pediatrics (2016. doi: 10.1542/peds.2015-3275).
Sudden infant death syndrome is significantly more likely in infants who are swaddled and placed on the front or side, according to a meta-analysis by Anna S. Pease of the University of Bristol (England), and her associates.
They looked at four studies covering 760 cases of SIDS and 1,759 controls. The odds ratio for swaddling when infant death occurred was 1.58. Risk was highest when swaddled infants were placed on their stomachs, with an OR of 12.99, though risk was also high for children placed on their sides, with an OR of 3.16. Swaddled infants placed on their backs had the lowest risk, with an OR of 1.93.
Some evidence suggested that swaddling risk increased as the infant got older, with an odds ratio of 2.53 in children older than 6 months; however, cases were uncommon and the relationship is not definitive.
“Given the marked increase in infants swaddled and found prone (rather than placed prone), coupled with an increased risk of swaddling with increased age regardless of sleeping position, health professionals and current guidelines should consider an appropriate age limit at which swaddling should be discouraged,” the investigators concluded.
Find the full study in Pediatrics (2016. doi: 10.1542/peds.2015-3275).
Sudden infant death syndrome is significantly more likely in infants who are swaddled and placed on the front or side, according to a meta-analysis by Anna S. Pease of the University of Bristol (England), and her associates.
They looked at four studies covering 760 cases of SIDS and 1,759 controls. The odds ratio for swaddling when infant death occurred was 1.58. Risk was highest when swaddled infants were placed on their stomachs, with an OR of 12.99, though risk was also high for children placed on their sides, with an OR of 3.16. Swaddled infants placed on their backs had the lowest risk, with an OR of 1.93.
Some evidence suggested that swaddling risk increased as the infant got older, with an odds ratio of 2.53 in children older than 6 months; however, cases were uncommon and the relationship is not definitive.
“Given the marked increase in infants swaddled and found prone (rather than placed prone), coupled with an increased risk of swaddling with increased age regardless of sleeping position, health professionals and current guidelines should consider an appropriate age limit at which swaddling should be discouraged,” the investigators concluded.
Find the full study in Pediatrics (2016. doi: 10.1542/peds.2015-3275).
FROM PEDIATRICS

E-cigarettes fuel increase in nicotine exposures in young children
The incidence of exposure to nicotine and tobacco products in children less than 6 years old increased significantly from 2012 to 2015, according to Alisha Kamboj and her associates.
From January 2012 to April 2015, the National Poison Data System received 29,141 reports of nicotine and tobacco product exposure in children under 6 years of age, averaging 729 children per month. The annual rate of exposure increased from 3.0/100,000 children in 2012 to 4.2/100,000 in 2014. A dramatic increase in exposure to e-cigarettes drove the overall increase, with monthly reports of e-cigarette use rising nearly 1,500% from January 2012 to April 2015.

Nearly 80% of children exposed were younger than 2 years old, and the median age of exposed children was 1.1 years. Children younger than 2 accounted for 44.1% of e-cigarette exposures, 91.6% of cigarette exposures, and 75.4% of exposures to other tobacco products, the investigators noted.
Children exposed to e-cigarettes were significantly more likely to be admitted to a health care facility and to have severe outcomes than were children exposed to cigarettes, with odds ratios of 5.19 and 2.6, respectively. One death – of a 1-year-old child – was associated with nicotine liquid.
“Educating child caregivers about potential clinical effects and outcomes associated with nicotine exposure may help motivate adoption of safety behaviors and aid in identification of symptoms in the event of an exposure. Adults in households with children [younger than] 6 years should be counseled on vaping cessation and strongly encouraged not to use or store e-cigarettes, e-liquid, and related products in the home,” the investigators recommended.
Find the full study in Pediatrics (doi: 10.1542/peds.2016-0041).
The incidence of exposure to nicotine and tobacco products in children less than 6 years old increased significantly from 2012 to 2015, according to Alisha Kamboj and her associates.
From January 2012 to April 2015, the National Poison Data System received 29,141 reports of nicotine and tobacco product exposure in children under 6 years of age, averaging 729 children per month. The annual rate of exposure increased from 3.0/100,000 children in 2012 to 4.2/100,000 in 2014. A dramatic increase in exposure to e-cigarettes drove the overall increase, with monthly reports of e-cigarette use rising nearly 1,500% from January 2012 to April 2015.
Nearly 80% of children exposed were younger than 2 years old, and the median age of exposed children was 1.1 years. Children younger than 2 accounted for 44.1% of e-cigarette exposures, 91.6% of cigarette exposures, and 75.4% of exposures to other tobacco products, the investigators noted.
Children exposed to e-cigarettes were significantly more likely to be admitted to a health care facility and to have severe outcomes than were children exposed to cigarettes, with odds ratios of 5.19 and 2.6, respectively. One death – of a 1-year-old child – was associated with nicotine liquid.
“Educating child caregivers about potential clinical effects and outcomes associated with nicotine exposure may help motivate adoption of safety behaviors and aid in identification of symptoms in the event of an exposure. Adults in households with children [younger than] 6 years should be counseled on vaping cessation and strongly encouraged not to use or store e-cigarettes, e-liquid, and related products in the home,” the investigators recommended.
Find the full study in Pediatrics (doi: 10.1542/peds.2016-0041).
The incidence of exposure to nicotine and tobacco products in children less than 6 years old increased significantly from 2012 to 2015, according to Alisha Kamboj and her associates.
From January 2012 to April 2015, the National Poison Data System received 29,141 reports of nicotine and tobacco product exposure in children under 6 years of age, averaging 729 children per month. The annual rate of exposure increased from 3.0/100,000 children in 2012 to 4.2/100,000 in 2014. A dramatic increase in exposure to e-cigarettes drove the overall increase, with monthly reports of e-cigarette use rising nearly 1,500% from January 2012 to April 2015.
Nearly 80% of children exposed were younger than 2 years old, and the median age of exposed children was 1.1 years. Children younger than 2 accounted for 44.1% of e-cigarette exposures, 91.6% of cigarette exposures, and 75.4% of exposures to other tobacco products, the investigators noted.
Children exposed to e-cigarettes were significantly more likely to be admitted to a health care facility and to have severe outcomes than were children exposed to cigarettes, with odds ratios of 5.19 and 2.6, respectively. One death – of a 1-year-old child – was associated with nicotine liquid.
“Educating child caregivers about potential clinical effects and outcomes associated with nicotine exposure may help motivate adoption of safety behaviors and aid in identification of symptoms in the event of an exposure. Adults in households with children [younger than] 6 years should be counseled on vaping cessation and strongly encouraged not to use or store e-cigarettes, e-liquid, and related products in the home,” the investigators recommended.
Find the full study in Pediatrics (doi: 10.1542/peds.2016-0041).
FROM PEDIATRICS

Congenital Heart Disease Screening Cuts Infant Mortality
BALTIMORE – The mandate to screen all U.S.-born neonates for critical congenital heart disease that started in 2011 has had an apparent effect on infant mortality.
By 2013, national U.S. data showed that the number of U.S. infants who died attributable to congenital heart disease had dropped by a small but statistically significant percentage, compared with a reference year prior to initiation of the mandate, 2006, Dr. Jagjit S. Teji reported in a poster at the annual meeting of the Pediatric Academic Societies.
“This is the first report on the impact of newborn screening for critical congenital heart disease,” said Dr. Teji, a neonatologist at Northwestern University in Chicago.

He analyzed birth and death records from the U.S. National Center for Health Statistics and calculated that infant mortality in 2013, compared with 2006, included roughly 100 fewer infants deaths attributable to congenital heart disease, a statistically significant difference, after adjusting for differences in variables between the 2 years that could affect mortality, including gestational ages at delivery, birth weight, maternal age, race, ethnicity, and marital status. The decrease occurred despite an overall increase in U.S. births of about 8% from 2006 to 2013.
In 2013, the rate of infant mortality was 0.027%, while in 2006 it was 0.032%, Dr. Teji reported. The decrease that appeared attributable to early screening for critical congenital heart disease was especially notable because by 2013 only two-thirds of states had a rule in place mandating newborn screening following the 2011 recommendation from the Department of Health & Human Services to U.S. clinicians to noninvasively measure blood oxygenation levels in the upper and lower limbs of newborns, using pulse oximetry, Dr. Teji said. By April 2016, this had grown to 48 states with mandates for newborn screening of critical congenital heart disease, usually performed just before newborns are discharged or after they are 24 hours old. Idaho and Wyoming are the exceptions.
Dr. Teji had no relevant financial disclosures.
BALTIMORE – The mandate to screen all U.S.-born neonates for critical congenital heart disease that started in 2011 has had an apparent effect on infant mortality.
By 2013, national U.S. data showed that the number of U.S. infants who died attributable to congenital heart disease had dropped by a small but statistically significant percentage, compared with a reference year prior to initiation of the mandate, 2006, Dr. Jagjit S. Teji reported in a poster at the annual meeting of the Pediatric Academic Societies.
“This is the first report on the impact of newborn screening for critical congenital heart disease,” said Dr. Teji, a neonatologist at Northwestern University in Chicago.
He analyzed birth and death records from the U.S. National Center for Health Statistics and calculated that infant mortality in 2013, compared with 2006, included roughly 100 fewer infants deaths attributable to congenital heart disease, a statistically significant difference, after adjusting for differences in variables between the 2 years that could affect mortality, including gestational ages at delivery, birth weight, maternal age, race, ethnicity, and marital status. The decrease occurred despite an overall increase in U.S. births of about 8% from 2006 to 2013.
In 2013, the rate of infant mortality was 0.027%, while in 2006 it was 0.032%, Dr. Teji reported. The decrease that appeared attributable to early screening for critical congenital heart disease was especially notable because by 2013 only two-thirds of states had a rule in place mandating newborn screening following the 2011 recommendation from the Department of Health & Human Services to U.S. clinicians to noninvasively measure blood oxygenation levels in the upper and lower limbs of newborns, using pulse oximetry, Dr. Teji said. By April 2016, this had grown to 48 states with mandates for newborn screening of critical congenital heart disease, usually performed just before newborns are discharged or after they are 24 hours old. Idaho and Wyoming are the exceptions.
Dr. Teji had no relevant financial disclosures.
BALTIMORE – The mandate to screen all U.S.-born neonates for critical congenital heart disease that started in 2011 has had an apparent effect on infant mortality.
By 2013, national U.S. data showed that the number of U.S. infants who died attributable to congenital heart disease had dropped by a small but statistically significant percentage, compared with a reference year prior to initiation of the mandate, 2006, Dr. Jagjit S. Teji reported in a poster at the annual meeting of the Pediatric Academic Societies.
“This is the first report on the impact of newborn screening for critical congenital heart disease,” said Dr. Teji, a neonatologist at Northwestern University in Chicago.
He analyzed birth and death records from the U.S. National Center for Health Statistics and calculated that infant mortality in 2013, compared with 2006, included roughly 100 fewer infants deaths attributable to congenital heart disease, a statistically significant difference, after adjusting for differences in variables between the 2 years that could affect mortality, including gestational ages at delivery, birth weight, maternal age, race, ethnicity, and marital status. The decrease occurred despite an overall increase in U.S. births of about 8% from 2006 to 2013.
In 2013, the rate of infant mortality was 0.027%, while in 2006 it was 0.032%, Dr. Teji reported. The decrease that appeared attributable to early screening for critical congenital heart disease was especially notable because by 2013 only two-thirds of states had a rule in place mandating newborn screening following the 2011 recommendation from the Department of Health & Human Services to U.S. clinicians to noninvasively measure blood oxygenation levels in the upper and lower limbs of newborns, using pulse oximetry, Dr. Teji said. By April 2016, this had grown to 48 states with mandates for newborn screening of critical congenital heart disease, usually performed just before newborns are discharged or after they are 24 hours old. Idaho and Wyoming are the exceptions.
Dr. Teji had no relevant financial disclosures.
AT THE PAS ANNUAL MEETING

Congenital heart disease screening cuts infant mortality
BALTIMORE – The mandate to screen all U.S.-born neonates for critical congenital heart disease that started in 2011 has had an apparent effect on infant mortality.
By 2013, national U.S. data showed that the number of U.S. infants who died attributable to congenital heart disease had dropped by a small but statistically significant percentage, compared with a reference year prior to initiation of the mandate, 2006, Dr. Jagjit S. Teji reported in a poster at the annual meeting of the Pediatric Academic Societies.
“This is the first report on the impact of newborn screening for critical congenital heart disease,” said Dr. Teji, a neonatologist at Northwestern University in Chicago.

He analyzed birth and death records from the U.S. National Center for Health Statistics and calculated that infant mortality in 2013, compared with 2006, included roughly 100 fewer infants deaths attributable to congenital heart disease, a statistically significant difference, after adjusting for differences in variables between the 2 years that could affect mortality, including gestational ages at delivery, birth weight, maternal age, race, ethnicity, and marital status. The decrease occurred despite an overall increase in U.S. births of about 8% from 2006 to 2013.
In 2013, the rate of infant mortality was 0.027%, while in 2006 it was 0.032%, Dr. Teji reported. The decrease that appeared attributable to early screening for critical congenital heart disease was especially notable because by 2013 only two-thirds of states had a rule in place mandating newborn screening following the 2011 recommendation from the Department of Health & Human Services to U.S. clinicians to noninvasively measure blood oxygenation levels in the upper and lower limbs of newborns, using pulse oximetry, Dr. Teji said. By April 2016, this had grown to 48 states with mandates for newborn screening of critical congenital heart disease, usually performed just before newborns are discharged or after they are 24 hours old. Idaho and Wyoming are the exceptions.
Dr. Teji had no relevant financial disclosures.
On Twitter @mitchelzoler
BALTIMORE – The mandate to screen all U.S.-born neonates for critical congenital heart disease that started in 2011 has had an apparent effect on infant mortality.
By 2013, national U.S. data showed that the number of U.S. infants who died attributable to congenital heart disease had dropped by a small but statistically significant percentage, compared with a reference year prior to initiation of the mandate, 2006, Dr. Jagjit S. Teji reported in a poster at the annual meeting of the Pediatric Academic Societies.
“This is the first report on the impact of newborn screening for critical congenital heart disease,” said Dr. Teji, a neonatologist at Northwestern University in Chicago.
He analyzed birth and death records from the U.S. National Center for Health Statistics and calculated that infant mortality in 2013, compared with 2006, included roughly 100 fewer infants deaths attributable to congenital heart disease, a statistically significant difference, after adjusting for differences in variables between the 2 years that could affect mortality, including gestational ages at delivery, birth weight, maternal age, race, ethnicity, and marital status. The decrease occurred despite an overall increase in U.S. births of about 8% from 2006 to 2013.
In 2013, the rate of infant mortality was 0.027%, while in 2006 it was 0.032%, Dr. Teji reported. The decrease that appeared attributable to early screening for critical congenital heart disease was especially notable because by 2013 only two-thirds of states had a rule in place mandating newborn screening following the 2011 recommendation from the Department of Health & Human Services to U.S. clinicians to noninvasively measure blood oxygenation levels in the upper and lower limbs of newborns, using pulse oximetry, Dr. Teji said. By April 2016, this had grown to 48 states with mandates for newborn screening of critical congenital heart disease, usually performed just before newborns are discharged or after they are 24 hours old. Idaho and Wyoming are the exceptions.
Dr. Teji had no relevant financial disclosures.
On Twitter @mitchelzoler
BALTIMORE – The mandate to screen all U.S.-born neonates for critical congenital heart disease that started in 2011 has had an apparent effect on infant mortality.
By 2013, national U.S. data showed that the number of U.S. infants who died attributable to congenital heart disease had dropped by a small but statistically significant percentage, compared with a reference year prior to initiation of the mandate, 2006, Dr. Jagjit S. Teji reported in a poster at the annual meeting of the Pediatric Academic Societies.
“This is the first report on the impact of newborn screening for critical congenital heart disease,” said Dr. Teji, a neonatologist at Northwestern University in Chicago.
He analyzed birth and death records from the U.S. National Center for Health Statistics and calculated that infant mortality in 2013, compared with 2006, included roughly 100 fewer infants deaths attributable to congenital heart disease, a statistically significant difference, after adjusting for differences in variables between the 2 years that could affect mortality, including gestational ages at delivery, birth weight, maternal age, race, ethnicity, and marital status. The decrease occurred despite an overall increase in U.S. births of about 8% from 2006 to 2013.
In 2013, the rate of infant mortality was 0.027%, while in 2006 it was 0.032%, Dr. Teji reported. The decrease that appeared attributable to early screening for critical congenital heart disease was especially notable because by 2013 only two-thirds of states had a rule in place mandating newborn screening following the 2011 recommendation from the Department of Health & Human Services to U.S. clinicians to noninvasively measure blood oxygenation levels in the upper and lower limbs of newborns, using pulse oximetry, Dr. Teji said. By April 2016, this had grown to 48 states with mandates for newborn screening of critical congenital heart disease, usually performed just before newborns are discharged or after they are 24 hours old. Idaho and Wyoming are the exceptions.
Dr. Teji had no relevant financial disclosures.
On Twitter @mitchelzoler
AT THE PAS ANNUAL MEETING
Key clinical point: Universal screening of U.S. neonates for critical congenital heart disease appeared to result in a significant reduction in infant mortality by 2013.
Major finding: U.S. infant mortality fell from an adjusted rate of 0.032% in 2006 to 0.027% in 2013, a statistically significant difference.
Data source: U.S. birth and death records from the National Center for Health Statistics.
Disclosures: Dr. Teji had no relevant financial disclosures.

Behavioral seminars for parents can improve child’s behavior, decrease corporal punishment
BALTIMORE – Parents who take behavior seminars for dealing with their children, such as one known as Child-Adult Relationship Enhancement (CARE), can significantly improve a child’s behavior and the parent/child relationship while reducing dependence on corporal punishment as a disciplinary tool.
“[CARE] is a group-based parenting program that involves parents coming into six sessions over 6 weeks, and each session is facilitated by two mental health therapists [who] teach parents different positive parenting skills,” explained Dr. Samantha Schilling of the University of North Carolina at Chapel Hill, adding that parents are taught how to “increase or reinforce positive behaviors [through] different techniques, such as what we call the three Ps: praising, paraphrasing, and pointing out good child behavior.”
In an interview at the annual meeting of the Pediatric Academic Societies, Dr. Schilling discussed the importance of implementing CARE programs and, more specifically, colocating such programs in primary care practices.
Dr. Schilling did not report any relevant financial disclosures.
The video associated with this article is no longer available on this site. Please view all of our videos on the MDedge YouTube channel
BALTIMORE – Parents who take behavior seminars for dealing with their children, such as one known as Child-Adult Relationship Enhancement (CARE), can significantly improve a child’s behavior and the parent/child relationship while reducing dependence on corporal punishment as a disciplinary tool.
“[CARE] is a group-based parenting program that involves parents coming into six sessions over 6 weeks, and each session is facilitated by two mental health therapists [who] teach parents different positive parenting skills,” explained Dr. Samantha Schilling of the University of North Carolina at Chapel Hill, adding that parents are taught how to “increase or reinforce positive behaviors [through] different techniques, such as what we call the three Ps: praising, paraphrasing, and pointing out good child behavior.”
In an interview at the annual meeting of the Pediatric Academic Societies, Dr. Schilling discussed the importance of implementing CARE programs and, more specifically, colocating such programs in primary care practices.
Dr. Schilling did not report any relevant financial disclosures.
The video associated with this article is no longer available on this site. Please view all of our videos on the MDedge YouTube channel
BALTIMORE – Parents who take behavior seminars for dealing with their children, such as one known as Child-Adult Relationship Enhancement (CARE), can significantly improve a child’s behavior and the parent/child relationship while reducing dependence on corporal punishment as a disciplinary tool.
“[CARE] is a group-based parenting program that involves parents coming into six sessions over 6 weeks, and each session is facilitated by two mental health therapists [who] teach parents different positive parenting skills,” explained Dr. Samantha Schilling of the University of North Carolina at Chapel Hill, adding that parents are taught how to “increase or reinforce positive behaviors [through] different techniques, such as what we call the three Ps: praising, paraphrasing, and pointing out good child behavior.”
In an interview at the annual meeting of the Pediatric Academic Societies, Dr. Schilling discussed the importance of implementing CARE programs and, more specifically, colocating such programs in primary care practices.
Dr. Schilling did not report any relevant financial disclosures.
The video associated with this article is no longer available on this site. Please view all of our videos on the MDedge YouTube channel
AT THE PAS ANNUAL MEETING

Onychomadesis Following Hand-foot-and-mouth Disease
To the Editor:
Onychomadesis is characterized by separation of the nail plate from the matrix due to a temporary arrest in nail matrix activity. Hand-foot-and-mouth disease (HFMD) is a relatively common viral infection, especially in children. Although the relationship between onychomadesis and HFMD has been noted, there are few reports in the literature.1-9 We present 2 cases of onychomadesis following HFMD in Taiwanese siblings.
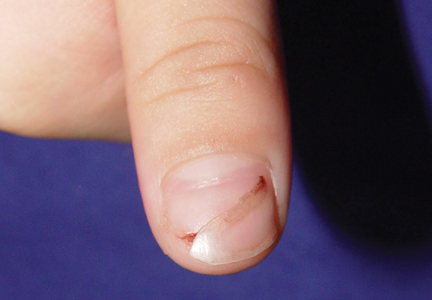
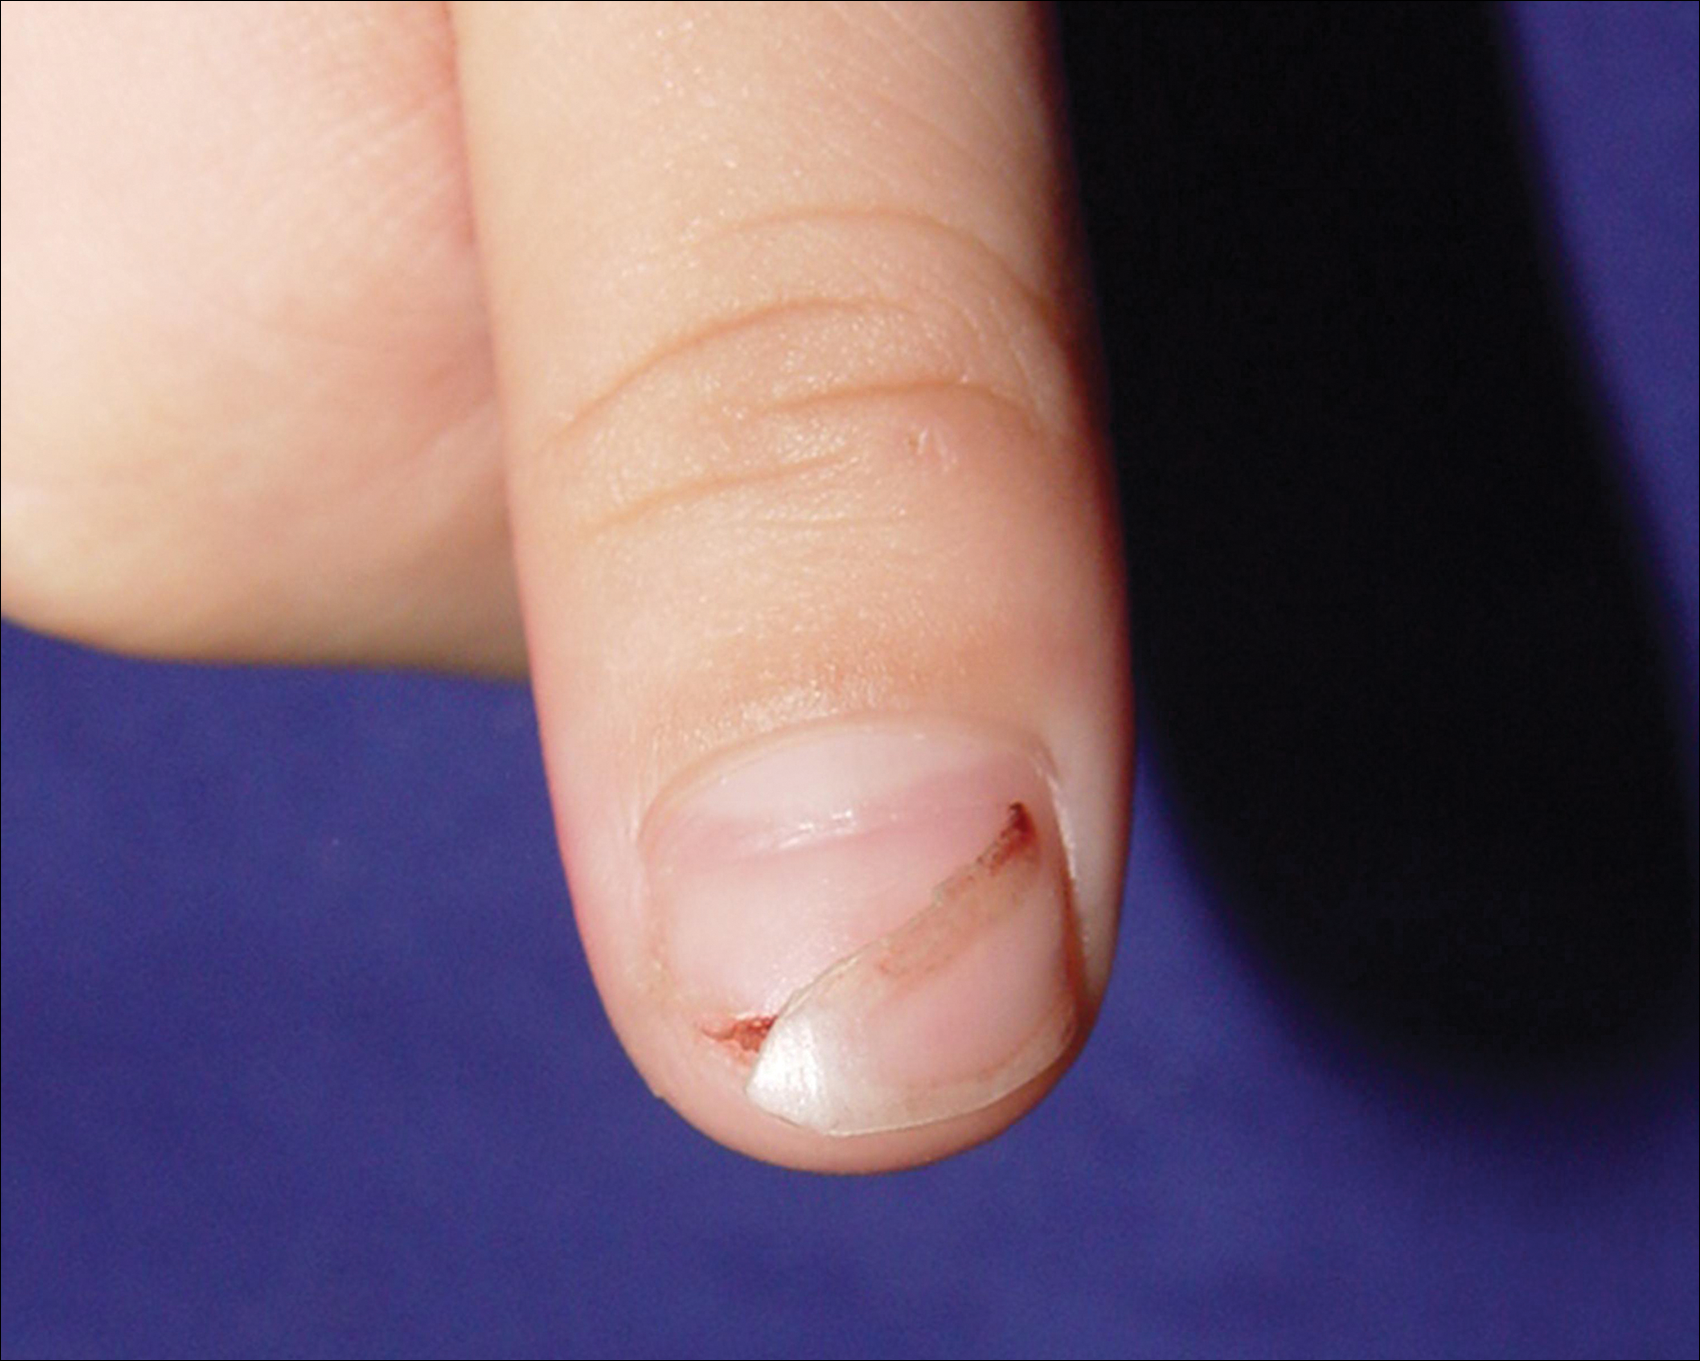
A 3-year-old girl presented with proximal nail plate detachment from the proximal nail fold on the bilateral great toenails (Figure 1) and a transverse whole-thickness sulcus on the bilateral thumbnails (Figure 2) of several weeks’ duration. Her 6-year-old sister had similar nail changes. Hand-foot-and-mouth disease was diagnosed about 4 weeks prior to nail changes. The mother reported that only the younger sister experienced fever. There was no history of notable medication intake, nail trauma, periungual erythema, vesicular lesion, or dermatitis. In both patients, the nail changes were temporary with spontaneous normal nail plate regrowth several months later. A diagnosis of onychomadesis was made.
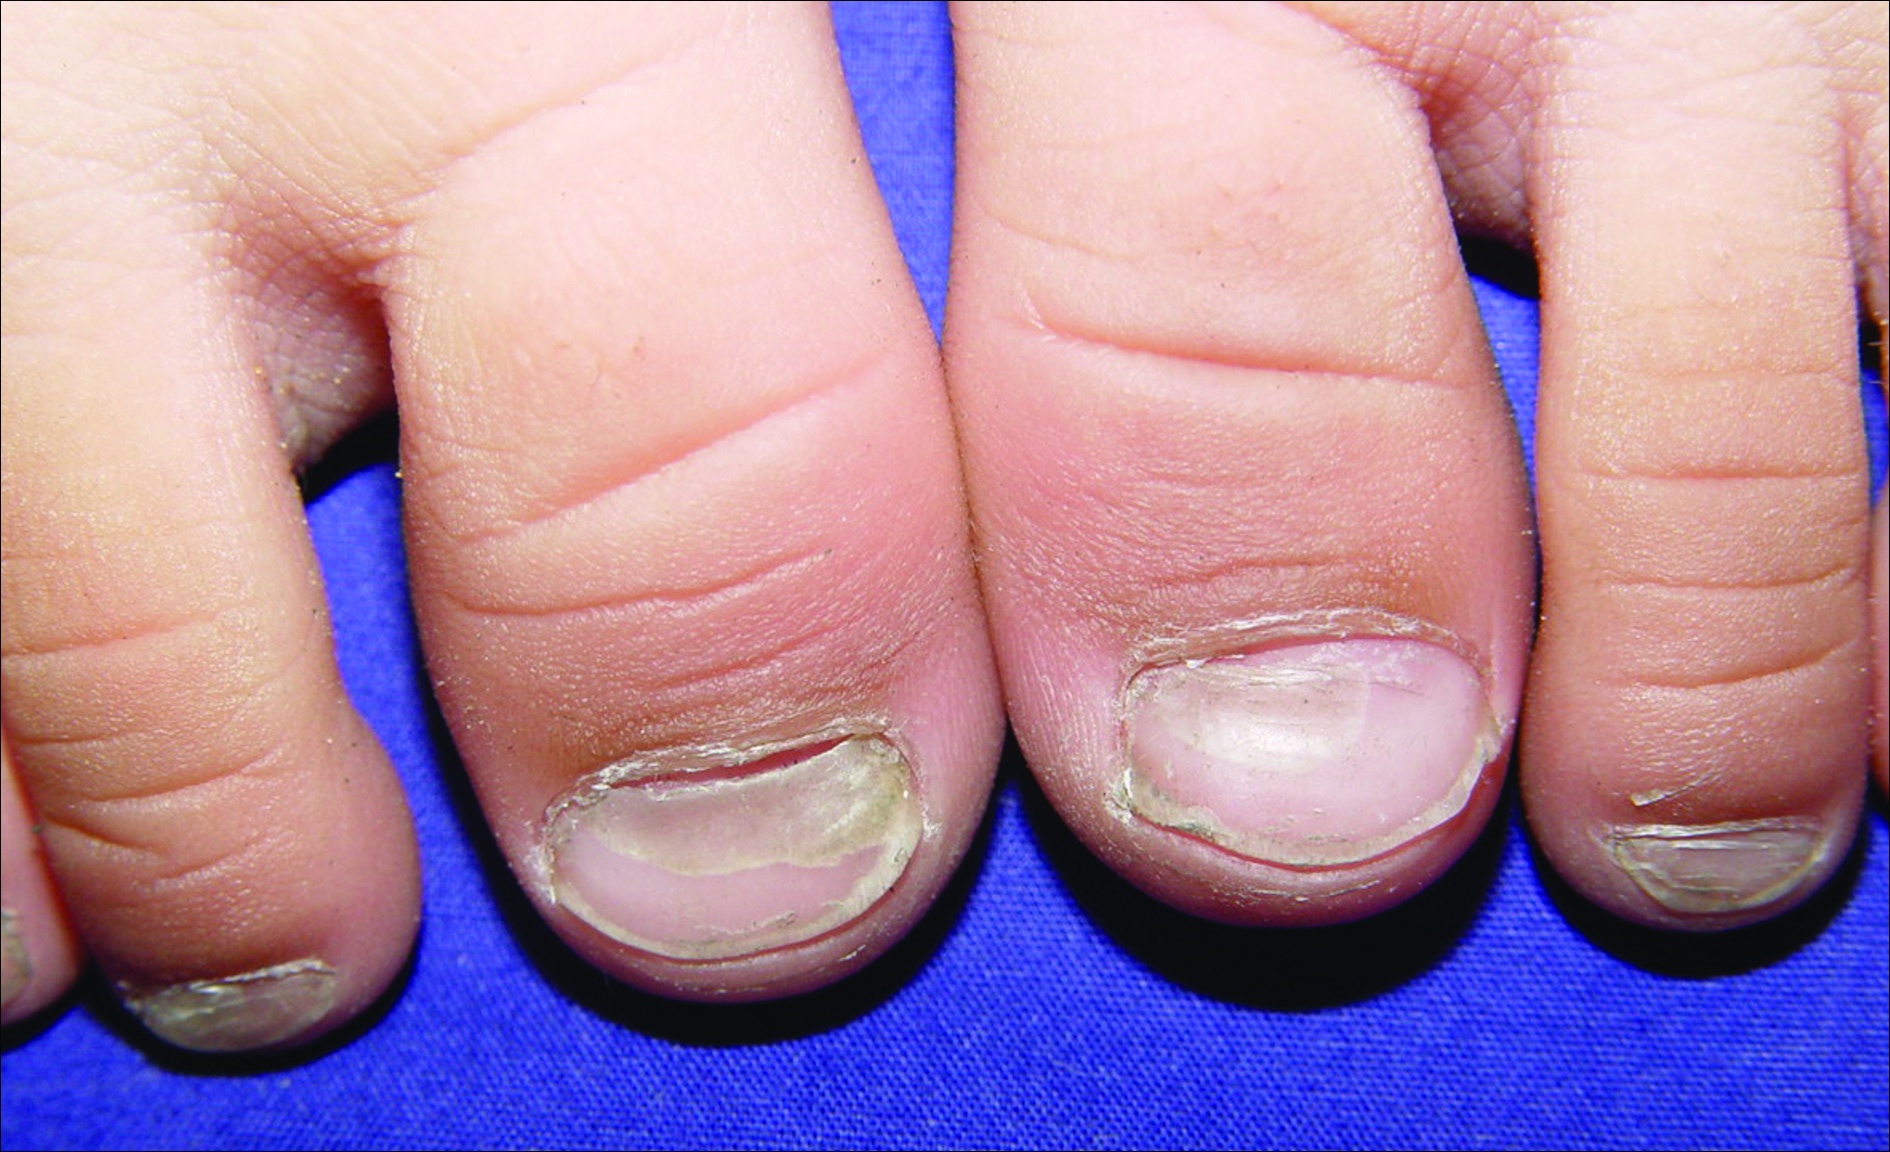
The etiology of onychomadesis includes drug ingestion, especially chemotherapy; severe systemic diseases; high fever; infection, including viral illnesses such as influenza, measles, and HFMD; and idiopathic onychomadesis.1,2,5,10 In 2000, Clementz and Mancini1 reported 5 children with nail matrix arrest following HFMD and suggested an epidemic caused by the same virus strain. Bernier et al2 reported another 4 cases and suggested more than one viral strain may have been implicated in the nail matrix arrest. Although these authors list HFMD as one of the causes of onychomadesis,1,2 the number of cases reported was small; however, studies with a larger number of cases and even outbreak have been reported more recently.3-8 Salazar et al3 reported an onychomadesis outbreak associated with HFMD in Valencia, Spain, in 2008 (N=298). This outbreak primarily was caused by coxsackievirus (CV) A10 (49% of cases).5 Another onychomadesis outbreak occurred in Saragossa, Spain, in 2008, and CV B1, B2, and unidentified nonpoliovirus enterovirus were isolated.6 Outbreaks also occurred in Finland in 2008, and the causative agents were identified as CV A6 and A10.7,8 The latency period for onychomadesis following HFMD was 1 to 2 months (mean, 40 days), and the majority of cases occurred in patients younger than 6 years.1-5 Not all of the nails were involved; in one report, each patient shed only 4 nails on average.6
Although there is a definite relationship between HFMD and onychomadesis, the mechanism is still unclear. Some authors claim that nail matrix arrest is caused by high fever10; however, we found that 40% (2/5)1 to 63% (10/16)4 of reported cases did not have a fever. Additionally, only 1 of our patients had fever. Therefore high fever–induced nail matrix arrest is not a reasonable explanation. Davia et al5 observed no relationship between onychomadesis and the severity of HFMD. In addition, no serious complications of HFMD were mentioned in prior reports.
We propose that HFMD-related onychomadesis is caused by the viral infection itself, rather than by severe systemic disease.1-5,7 Certain viral strains associated with HFMD can induce arrest of nail matrix activity. Osterback et al7 detected CV A6 in shed nail fragments and suggested that virus replication damaged the nail matrix and resulted in temporary nail dystrophy. This hypothesis can explain that only some nails, not all, were involved. In our cases, we noted an incomplete and slanted cleft on the thumbnail (Figure 2). We also found that incomplete onychomadesis appeared in the clinical photograph from a prior report.5 The slanted cleft in our case may be caused by secondary external force after original incomplete onychomadesis or a different rate of nail regrowth because of different intensity of nail matrix damage. The phenomenon of incomplete onychomadesis in the same nail further suggests the mechanism of onychomadesis following HFMD is localized nail matrix damage.
In conclusion, we report 2 cases of onychomadesis associated with HFMD. Our report highlights that there is no racial difference in post-HFMD onychomadesis. These cases highlight that HFMD is an important cause of onychomadesis, especially in children. We suggest that certain viral strains associated with HFMD may specifically arrest nail matrix growth activity, regardless of fever or disease severity.
- Clementz GC, Mancini AJ. Nail matrix arrest following hand-foot-mouth disease: a report of five children. Pediatr Dermatol. 2000;17:7-11.
- Bernier V, Labreze C, Bury F, et al. Nail matrix arrest in the course of hand, foot and mouth disease. Eur J Pediatr. 2001;160:649-651.
- Salazar A, Febrer I, Guiral S, et al. Onychomadesis outbreak in Valencia, Spain, June 2008. Euro Surveill. 2008;13:18917.
- Redondo Granado MJ, Torres Hinojal MC, Izquierdo López B. Post viral onychomadesis outbreak in Valladolid [in Spanish]. An Pediatr (Barc). 2009;71:436-439.
- Davia JL, Bel PH, Ninet VZ, et al. Onychomadesis outbreak in Valencia, Spain associated with hand, foot, and mouth disease caused by enteroviruses. Pediatr Dermatol. 2011;28:1-5.
- Guimbao J, Rodrigo P, Alberto MJ, et al. Onychomadesis outbreak linked to hand, foot, and mouth disease, Spain, July 2008. Euro Surveill. 2010;15:19663.
- Osterback R, Vuorinen T, Linna M, et al. Coxsackievirus A6 and hand, foot, and mouth disease, Finland. Emerg Infect Dis. 2009;15:1485-1488.
- Blomqvist S, Klemola P, Kaijalainen S, et al. Co-circulation of coxsackieviruses A6 and A10 in hand, foot and mouth disease outbreak in Finland. J Clin Virol. 2010;48:49-54.
- Clark CM, Silverberg NB, Weinberg JM. What is your diagnosis? onychomadesis following hand-foot-and-mouth disease. Cutis. 2015;95:312, 319-320.
- Habif TP. Nail diseases. In: Habif TP, ed. Clinical Dermatology: A Color Guide to Diagnosis and Therapy. 5th ed. Philadelphia, PA: Mosby/Elsevier; 2010:947-973.
To the Editor:
Onychomadesis is characterized by separation of the nail plate from the matrix due to a temporary arrest in nail matrix activity. Hand-foot-and-mouth disease (HFMD) is a relatively common viral infection, especially in children. Although the relationship between onychomadesis and HFMD has been noted, there are few reports in the literature.1-9 We present 2 cases of onychomadesis following HFMD in Taiwanese siblings.
A 3-year-old girl presented with proximal nail plate detachment from the proximal nail fold on the bilateral great toenails (Figure 1) and a transverse whole-thickness sulcus on the bilateral thumbnails (Figure 2) of several weeks’ duration. Her 6-year-old sister had similar nail changes. Hand-foot-and-mouth disease was diagnosed about 4 weeks prior to nail changes. The mother reported that only the younger sister experienced fever. There was no history of notable medication intake, nail trauma, periungual erythema, vesicular lesion, or dermatitis. In both patients, the nail changes were temporary with spontaneous normal nail plate regrowth several months later. A diagnosis of onychomadesis was made.
The etiology of onychomadesis includes drug ingestion, especially chemotherapy; severe systemic diseases; high fever; infection, including viral illnesses such as influenza, measles, and HFMD; and idiopathic onychomadesis.1,2,5,10 In 2000, Clementz and Mancini1 reported 5 children with nail matrix arrest following HFMD and suggested an epidemic caused by the same virus strain. Bernier et al2 reported another 4 cases and suggested more than one viral strain may have been implicated in the nail matrix arrest. Although these authors list HFMD as one of the causes of onychomadesis,1,2 the number of cases reported was small; however, studies with a larger number of cases and even outbreak have been reported more recently.3-8 Salazar et al3 reported an onychomadesis outbreak associated with HFMD in Valencia, Spain, in 2008 (N=298). This outbreak primarily was caused by coxsackievirus (CV) A10 (49% of cases).5 Another onychomadesis outbreak occurred in Saragossa, Spain, in 2008, and CV B1, B2, and unidentified nonpoliovirus enterovirus were isolated.6 Outbreaks also occurred in Finland in 2008, and the causative agents were identified as CV A6 and A10.7,8 The latency period for onychomadesis following HFMD was 1 to 2 months (mean, 40 days), and the majority of cases occurred in patients younger than 6 years.1-5 Not all of the nails were involved; in one report, each patient shed only 4 nails on average.6
Although there is a definite relationship between HFMD and onychomadesis, the mechanism is still unclear. Some authors claim that nail matrix arrest is caused by high fever10; however, we found that 40% (2/5)1 to 63% (10/16)4 of reported cases did not have a fever. Additionally, only 1 of our patients had fever. Therefore high fever–induced nail matrix arrest is not a reasonable explanation. Davia et al5 observed no relationship between onychomadesis and the severity of HFMD. In addition, no serious complications of HFMD were mentioned in prior reports.
We propose that HFMD-related onychomadesis is caused by the viral infection itself, rather than by severe systemic disease.1-5,7 Certain viral strains associated with HFMD can induce arrest of nail matrix activity. Osterback et al7 detected CV A6 in shed nail fragments and suggested that virus replication damaged the nail matrix and resulted in temporary nail dystrophy. This hypothesis can explain that only some nails, not all, were involved. In our cases, we noted an incomplete and slanted cleft on the thumbnail (Figure 2). We also found that incomplete onychomadesis appeared in the clinical photograph from a prior report.5 The slanted cleft in our case may be caused by secondary external force after original incomplete onychomadesis or a different rate of nail regrowth because of different intensity of nail matrix damage. The phenomenon of incomplete onychomadesis in the same nail further suggests the mechanism of onychomadesis following HFMD is localized nail matrix damage.
In conclusion, we report 2 cases of onychomadesis associated with HFMD. Our report highlights that there is no racial difference in post-HFMD onychomadesis. These cases highlight that HFMD is an important cause of onychomadesis, especially in children. We suggest that certain viral strains associated with HFMD may specifically arrest nail matrix growth activity, regardless of fever or disease severity.
To the Editor:
Onychomadesis is characterized by separation of the nail plate from the matrix due to a temporary arrest in nail matrix activity. Hand-foot-and-mouth disease (HFMD) is a relatively common viral infection, especially in children. Although the relationship between onychomadesis and HFMD has been noted, there are few reports in the literature.1-9 We present 2 cases of onychomadesis following HFMD in Taiwanese siblings.
A 3-year-old girl presented with proximal nail plate detachment from the proximal nail fold on the bilateral great toenails (Figure 1) and a transverse whole-thickness sulcus on the bilateral thumbnails (Figure 2) of several weeks’ duration. Her 6-year-old sister had similar nail changes. Hand-foot-and-mouth disease was diagnosed about 4 weeks prior to nail changes. The mother reported that only the younger sister experienced fever. There was no history of notable medication intake, nail trauma, periungual erythema, vesicular lesion, or dermatitis. In both patients, the nail changes were temporary with spontaneous normal nail plate regrowth several months later. A diagnosis of onychomadesis was made.
The etiology of onychomadesis includes drug ingestion, especially chemotherapy; severe systemic diseases; high fever; infection, including viral illnesses such as influenza, measles, and HFMD; and idiopathic onychomadesis.1,2,5,10 In 2000, Clementz and Mancini1 reported 5 children with nail matrix arrest following HFMD and suggested an epidemic caused by the same virus strain. Bernier et al2 reported another 4 cases and suggested more than one viral strain may have been implicated in the nail matrix arrest. Although these authors list HFMD as one of the causes of onychomadesis,1,2 the number of cases reported was small; however, studies with a larger number of cases and even outbreak have been reported more recently.3-8 Salazar et al3 reported an onychomadesis outbreak associated with HFMD in Valencia, Spain, in 2008 (N=298). This outbreak primarily was caused by coxsackievirus (CV) A10 (49% of cases).5 Another onychomadesis outbreak occurred in Saragossa, Spain, in 2008, and CV B1, B2, and unidentified nonpoliovirus enterovirus were isolated.6 Outbreaks also occurred in Finland in 2008, and the causative agents were identified as CV A6 and A10.7,8 The latency period for onychomadesis following HFMD was 1 to 2 months (mean, 40 days), and the majority of cases occurred in patients younger than 6 years.1-5 Not all of the nails were involved; in one report, each patient shed only 4 nails on average.6
Although there is a definite relationship between HFMD and onychomadesis, the mechanism is still unclear. Some authors claim that nail matrix arrest is caused by high fever10; however, we found that 40% (2/5)1 to 63% (10/16)4 of reported cases did not have a fever. Additionally, only 1 of our patients had fever. Therefore high fever–induced nail matrix arrest is not a reasonable explanation. Davia et al5 observed no relationship between onychomadesis and the severity of HFMD. In addition, no serious complications of HFMD were mentioned in prior reports.
We propose that HFMD-related onychomadesis is caused by the viral infection itself, rather than by severe systemic disease.1-5,7 Certain viral strains associated with HFMD can induce arrest of nail matrix activity. Osterback et al7 detected CV A6 in shed nail fragments and suggested that virus replication damaged the nail matrix and resulted in temporary nail dystrophy. This hypothesis can explain that only some nails, not all, were involved. In our cases, we noted an incomplete and slanted cleft on the thumbnail (Figure 2). We also found that incomplete onychomadesis appeared in the clinical photograph from a prior report.5 The slanted cleft in our case may be caused by secondary external force after original incomplete onychomadesis or a different rate of nail regrowth because of different intensity of nail matrix damage. The phenomenon of incomplete onychomadesis in the same nail further suggests the mechanism of onychomadesis following HFMD is localized nail matrix damage.
In conclusion, we report 2 cases of onychomadesis associated with HFMD. Our report highlights that there is no racial difference in post-HFMD onychomadesis. These cases highlight that HFMD is an important cause of onychomadesis, especially in children. We suggest that certain viral strains associated with HFMD may specifically arrest nail matrix growth activity, regardless of fever or disease severity.
- Clementz GC, Mancini AJ. Nail matrix arrest following hand-foot-mouth disease: a report of five children. Pediatr Dermatol. 2000;17:7-11.
- Bernier V, Labreze C, Bury F, et al. Nail matrix arrest in the course of hand, foot and mouth disease. Eur J Pediatr. 2001;160:649-651.
- Salazar A, Febrer I, Guiral S, et al. Onychomadesis outbreak in Valencia, Spain, June 2008. Euro Surveill. 2008;13:18917.
- Redondo Granado MJ, Torres Hinojal MC, Izquierdo López B. Post viral onychomadesis outbreak in Valladolid [in Spanish]. An Pediatr (Barc). 2009;71:436-439.
- Davia JL, Bel PH, Ninet VZ, et al. Onychomadesis outbreak in Valencia, Spain associated with hand, foot, and mouth disease caused by enteroviruses. Pediatr Dermatol. 2011;28:1-5.
- Guimbao J, Rodrigo P, Alberto MJ, et al. Onychomadesis outbreak linked to hand, foot, and mouth disease, Spain, July 2008. Euro Surveill. 2010;15:19663.
- Osterback R, Vuorinen T, Linna M, et al. Coxsackievirus A6 and hand, foot, and mouth disease, Finland. Emerg Infect Dis. 2009;15:1485-1488.
- Blomqvist S, Klemola P, Kaijalainen S, et al. Co-circulation of coxsackieviruses A6 and A10 in hand, foot and mouth disease outbreak in Finland. J Clin Virol. 2010;48:49-54.
- Clark CM, Silverberg NB, Weinberg JM. What is your diagnosis? onychomadesis following hand-foot-and-mouth disease. Cutis. 2015;95:312, 319-320.
- Habif TP. Nail diseases. In: Habif TP, ed. Clinical Dermatology: A Color Guide to Diagnosis and Therapy. 5th ed. Philadelphia, PA: Mosby/Elsevier; 2010:947-973.
- Clementz GC, Mancini AJ. Nail matrix arrest following hand-foot-mouth disease: a report of five children. Pediatr Dermatol. 2000;17:7-11.
- Bernier V, Labreze C, Bury F, et al. Nail matrix arrest in the course of hand, foot and mouth disease. Eur J Pediatr. 2001;160:649-651.
- Salazar A, Febrer I, Guiral S, et al. Onychomadesis outbreak in Valencia, Spain, June 2008. Euro Surveill. 2008;13:18917.
- Redondo Granado MJ, Torres Hinojal MC, Izquierdo López B. Post viral onychomadesis outbreak in Valladolid [in Spanish]. An Pediatr (Barc). 2009;71:436-439.
- Davia JL, Bel PH, Ninet VZ, et al. Onychomadesis outbreak in Valencia, Spain associated with hand, foot, and mouth disease caused by enteroviruses. Pediatr Dermatol. 2011;28:1-5.
- Guimbao J, Rodrigo P, Alberto MJ, et al. Onychomadesis outbreak linked to hand, foot, and mouth disease, Spain, July 2008. Euro Surveill. 2010;15:19663.
- Osterback R, Vuorinen T, Linna M, et al. Coxsackievirus A6 and hand, foot, and mouth disease, Finland. Emerg Infect Dis. 2009;15:1485-1488.
- Blomqvist S, Klemola P, Kaijalainen S, et al. Co-circulation of coxsackieviruses A6 and A10 in hand, foot and mouth disease outbreak in Finland. J Clin Virol. 2010;48:49-54.
- Clark CM, Silverberg NB, Weinberg JM. What is your diagnosis? onychomadesis following hand-foot-and-mouth disease. Cutis. 2015;95:312, 319-320.
- Habif TP. Nail diseases. In: Habif TP, ed. Clinical Dermatology: A Color Guide to Diagnosis and Therapy. 5th ed. Philadelphia, PA: Mosby/Elsevier; 2010:947-973.
Practice Points
- Onychomadesis is a late complication of hand-foot-and-mouth disease (HFMD) with a latency period of 1 to 2 months.
- Although the mechanism between onychomadesis and HFMD is still unclear, we propose that it is caused by the viral infection itself rather than severe systemic disease.