User login
Benefits of dental sealant programs for low-income children exceed costs
Cavities and fillings were approximately three times more likely among low-income children aged 7-11 years whose teeth were not treated with dental sealants, compared to those treated with sealants, based on data from the National Health and Nutrition Examination Survey (NHANES) from 2011-2014.
Overall, 43% of children and 39% of low-income children in the United States were treated at least once with dental sealant.
Although sealant use in children increased overall from 31% to 44% in a comparison of 1999-2004 and 2011-2014 NHANES data, sealant use was less common among low-income children compared with high-income children (39% vs. 48%) in the 2011-2014 period after increases of 16% and 9%, respectively, during 2011-2014.
School-based programs to provide sealants could increase their use among low-income children, wrote Susan O. Griffin, PhD, of the Centers for Disease Control and Prevention in Atlanta, and her associates. The researchers reviewed data from 1,371 low-income children aged 6-11 years, and found that 60% (approximately 6.5 million children), had not been treated with dental sealants. “The systematic review of economic evaluations of school-based sealant programs (SBSP) conducted for the Task Force found that SBSP became cost-saving within 2 years of placing sealants,” the researchers noted.
The data were published in the CDC’s Morbidity and Mortality Weekly Report (MMWR 2016 Oct 21;65[41];1141-5).
Cavities and fillings were approximately three times more likely among low-income children aged 7-11 years whose teeth were not treated with dental sealants, compared to those treated with sealants, based on data from the National Health and Nutrition Examination Survey (NHANES) from 2011-2014.
Overall, 43% of children and 39% of low-income children in the United States were treated at least once with dental sealant.
Although sealant use in children increased overall from 31% to 44% in a comparison of 1999-2004 and 2011-2014 NHANES data, sealant use was less common among low-income children compared with high-income children (39% vs. 48%) in the 2011-2014 period after increases of 16% and 9%, respectively, during 2011-2014.
School-based programs to provide sealants could increase their use among low-income children, wrote Susan O. Griffin, PhD, of the Centers for Disease Control and Prevention in Atlanta, and her associates. The researchers reviewed data from 1,371 low-income children aged 6-11 years, and found that 60% (approximately 6.5 million children), had not been treated with dental sealants. “The systematic review of economic evaluations of school-based sealant programs (SBSP) conducted for the Task Force found that SBSP became cost-saving within 2 years of placing sealants,” the researchers noted.
The data were published in the CDC’s Morbidity and Mortality Weekly Report (MMWR 2016 Oct 21;65[41];1141-5).
Cavities and fillings were approximately three times more likely among low-income children aged 7-11 years whose teeth were not treated with dental sealants, compared to those treated with sealants, based on data from the National Health and Nutrition Examination Survey (NHANES) from 2011-2014.
Overall, 43% of children and 39% of low-income children in the United States were treated at least once with dental sealant.
Although sealant use in children increased overall from 31% to 44% in a comparison of 1999-2004 and 2011-2014 NHANES data, sealant use was less common among low-income children compared with high-income children (39% vs. 48%) in the 2011-2014 period after increases of 16% and 9%, respectively, during 2011-2014.
School-based programs to provide sealants could increase their use among low-income children, wrote Susan O. Griffin, PhD, of the Centers for Disease Control and Prevention in Atlanta, and her associates. The researchers reviewed data from 1,371 low-income children aged 6-11 years, and found that 60% (approximately 6.5 million children), had not been treated with dental sealants. “The systematic review of economic evaluations of school-based sealant programs (SBSP) conducted for the Task Force found that SBSP became cost-saving within 2 years of placing sealants,” the researchers noted.
The data were published in the CDC’s Morbidity and Mortality Weekly Report (MMWR 2016 Oct 21;65[41];1141-5).
FROM MMWR
CMS offering educational webinars on MACRA
The Centers for Medicare & Medicaid Services is offering a pair of webinars aimed at helping physicians navigate the new regulation that operationalizes the Medicare Access and CHIP Reauthorization Act (MACRA).
The first webinar, scheduled for Oct. 26, will provide an overview of the two components of the Quality Payment Program – the Merit-Based Incentive Payment System (MIPS) and advanced Alternative Payment Models (APMs).
The second webinar, scheduled for Nov. 15, is targeted to Medicare Part B fee-for-service clinicians, office managers and administrators, state and national associations that represent health care providers, and other stakeholders and will feature a question-and-answer session.
The webinars are part of the agency’s ongoing efforts to help educate practitioners on the provisions of the final MACRA regulation, which was issued on Oct. 14. CMS also recently launched a website to help in that regard.
The Centers for Medicare & Medicaid Services is offering a pair of webinars aimed at helping physicians navigate the new regulation that operationalizes the Medicare Access and CHIP Reauthorization Act (MACRA).
The first webinar, scheduled for Oct. 26, will provide an overview of the two components of the Quality Payment Program – the Merit-Based Incentive Payment System (MIPS) and advanced Alternative Payment Models (APMs).
The second webinar, scheduled for Nov. 15, is targeted to Medicare Part B fee-for-service clinicians, office managers and administrators, state and national associations that represent health care providers, and other stakeholders and will feature a question-and-answer session.
The webinars are part of the agency’s ongoing efforts to help educate practitioners on the provisions of the final MACRA regulation, which was issued on Oct. 14. CMS also recently launched a website to help in that regard.
The Centers for Medicare & Medicaid Services is offering a pair of webinars aimed at helping physicians navigate the new regulation that operationalizes the Medicare Access and CHIP Reauthorization Act (MACRA).
The first webinar, scheduled for Oct. 26, will provide an overview of the two components of the Quality Payment Program – the Merit-Based Incentive Payment System (MIPS) and advanced Alternative Payment Models (APMs).
The second webinar, scheduled for Nov. 15, is targeted to Medicare Part B fee-for-service clinicians, office managers and administrators, state and national associations that represent health care providers, and other stakeholders and will feature a question-and-answer session.
The webinars are part of the agency’s ongoing efforts to help educate practitioners on the provisions of the final MACRA regulation, which was issued on Oct. 14. CMS also recently launched a website to help in that regard.
Use of 2D bar coding with vaccines may be the future in pediatric practice
ATLANTA – Since the first bar coded consumer product, a pack of gum, was scanned in June of 1974, the soon widespread use of bar codes changed little until 2D bar codes arrived toward the end of last century. Today, the increasing use of 2D bar code technology with vaccines offers practices the potential for greater accuracy and efficiency with vaccine administration and data entry – if they have the resources to take the plunge.
An overview of 2D bar code use with vaccines, presented at a conference sponsored by the Centers for Disease Control and Prevention, provided a glimpse into both the types of changes practices might see with adoption of the technology and the way some clinics have made the transition.
Ken Gerlach, MPH, of the Immunization Services Division at the CDC in Atlanta, outlined the history of bar code use in immunizations, starting with a November 1999 Institute of Medicine report that identified the contribution of human error to disease and led the Food and Drug Administration to begin requiring linear bar codes on pharmaceutical unit-of-use products to reduce errors.
Then, a meeting organized by the American Academy of Pediatrics in January 2009 with the FDA, CDC, vaccine manufacturers, and other stakeholders led to a bar code rule change by the FDA in August 2011 that allowed alternatives to the traditional linear bar codes on vaccine vials and syringes.
“They essentially indicated to the pharmaceutical companies that it’s okay to add 2D bar codes, and this is essentially the point where things began to take off,” Mr. Gerlach explained. Until then, there had been no 2D bar codes on vaccines, but today the majority of vaccine products have them, as do all Vaccine Information Statements. In addition to the standard information included on traditional bar codes – Global Trade Item Number (GTIN), lot and serial numbers, and the expiration date – 2D bar codes also can include most relevant patient information that would go into the EMR except the injection site and immunization route. But a practice cannot simply jump over to scanning the 2D bar codes without ensuring that its EMR system is configured to accept the scanning.
Mr. Gerlach described a three-part project by the CDC, from 2011 through 2017, that assesses the impact of 2D coding on vaccination data quality and work flow, facilitates the adoption of 2D bar code scanning in health care practices, and then assesses the potential for expanding 2D bar code use in a large health care system. The first part of the project, which ran from 2011 to 2014, involved two vaccine manufacturers and 217 health care practices with more than 1.4 million de-identified vaccination records, 18.1% of which had been 2D bar coded.
Analysis of data quality from that pilot revealed an 8% increase in the correctness of lot numbers and 11% increase for expiration dates, with a time savings of 3.4 seconds per vaccine administration. Among the 116 staff users who completed surveys, 86% agreed that 2D bar coding improves accuracy and completeness, and 60% agreed it was easy to integrate the bar coding into their usual data recording process.
The pilot revealed challenges as well, however: not all individuals units of vaccines were 2D bar coded, users did not always consistently scan the bar codes, and some bar codes were difficult to read, such as one that was brown and wouldn’t scan. Another obstacle was having different lot numbers on the unit of use versus the unit of sale with 10% of the vaccines. Further, because inventory management typically involves unit of sale, it does not always match well with scanning unit of use.
Clinicians’ beliefs and attitudes toward 2D bar coding
As more practices consider adopting the technology, buy-in will important. At the conference, Sharon Humiston, MD, and Jill Hernandez, MPH, of Children’s Mercy Hospital in Kansas City, Mo., shared the findings of an online questionnaire about 2D bar coding and practices’ current systems for vaccine inventory and recording patient immunization information. The researchers distributed the questionnaire link to various AAP sections and committees in listservs and emails. Those eligible to complete the 15-minute survey were primary care personnel who used EMRs but not 2D bar code scanning for vaccines. They also needed to be key decision makers in the process of purchasing technology for the practice, and their practice needed to be enrolled in the Vaccines for Children program.
Among the 77 respondents who met all the inclusion criteria (61% of all who started the survey), 1 in 5 were private practices with one or two physicians, just over a third (36%) were private practices with more than two physicians, and a quarter were multispecialty group practices. Overall, respondents administered an average 116 doses of DTaP and 50 doses of Tdap each month.
Protocols for immunization management varied considerably across the respondents. For recording vaccine information, 49% reported that an administrator pre-entered it into an EMR, but 43% reported that staff manually enter it into an EMR. About 55% of practices entered the information before vaccine administration, and 42% entered it afterward. Although 57% of respondents’ practices upload the vaccination information directly from the EMR to their state’s Immunization Information System (IIS), 30% must enter it both into the EMR and into the state IIS separately, and 11% don’t enter it into a state IIS.
More than half (56%) of the respondents were extremely interested in having a bar code scanner system, and 31% were moderately to strongly interested, rating a 6 to 9 on a scale of 1 to 10. If provided evidence that 2D bar codes reduced errors in vaccine documentation, 56% of respondents said it would greatly increase their interest, and 32% said it would somewhat increase it. Only 23% said their interest would greatly increase if the bar code technology allowed the vaccine information statement to be scanned into EMRs.
Nearly all the respondents agreed that 2D bar code scanning technology would improve efficiency and accuracy of entering vaccine information into medical records and tracking vaccine inventory. Further, 81% believed it would reduce medical malpractice liability, and 85% believed it would reduce risk of harm to patients. However, 23% thought bar code technology would disrupt office work flow, and a quarter believed the technology’s costs would exceeds its benefits.
Despite the strong interest overall, respondents reported a number of barriers to adopting 2D bar code technology. The greatest barrier, reported by more than 70%, was the upfront cost of purchasing software for the EMR interface, followed by the cost of the bar code scanners. Other barriers, reported by 25%-45% of respondents, were the need for staff training, the need to service and maintain electronics for the technology, and the purchase of additional computers for scanner sites. If a bar code system cost less than $5,000, then 80% of the respondents would definitely or probably adopt such a system. Few would adopt it if the system cost $10,000 or more, but 42% probably would if it cost between $5,000 and $9,999. Even this small survey of self-selected volunteers, however, suggested strong interest in using 2D bar code technology for vaccines – although initial costs for a system presented a significant barrier to most practices.
One influenza vaccine clinic’s experience
Interest based on hypothetical questions is one thing. The process of actually implementing a 2D bar code scanning system into a health care center is another. In a separate presentation, Jane Glaser, MSN, RN, executive director of Campbell County Public Health in Gillette, Wyo., reviewed how such a system was implemented for mass influenza vaccination.
Campbell County, in the northeast corner of Wyoming, covers more than 4,800 square miles, has a population base of nearly 50,000 people, and also serves individuals from Montana, South Dakota, and North Dakota. Although the community as a whole works 24/7 in the county because of the oil, mining, and farming industries, the mass flu clinic is open 7 a.m. to 7 p.m., during which it provides an estimated 700 to 1,500 flu vaccines daily. Personnel comprises 13 public health nurses, 5 administrative assistants, and 3-4 community volunteers.
After 20 years of using an IIS, the clinic’s leadership decided to begin using 2D bar code scanners in October 2011 after observing it at a state immunization conference. Their goals in changing systems were to increase clinic flow, decrease registration time, and decrease overtime due to data entry. The new work flow went as follows: Those with Wyoming driver licenses or state ID cards have the linear bar code on their ID scanned in the immunization registry, which automatically populates the patient’s record. Then the staff member enters the vaccine information directly into the IIS registry in real time after the client receives the vaccine.
Ms. Glaser describes a number of improvements that resulted from use of the bar code scanning system, starting with reduced time for clinic registration and improved clinic flow. They also found that using bar code scanning reduced manual entry errors and improved the efficiency of assessing vaccination status and needed vaccines. Entering data in real time at point of care reduced time spent on data entry later on, thereby leading to a decrease in overtime and subsequent cost savings.
For providers and practices interested in learning more about 2D bar coding, the CDC offers a current list of 2D bar coded vaccines, data from the pilot program, training materials, and AAP guidance about 2D bar code use.
None of three presentations noted external funding, and all the researchers reported no financial relationships with companies that profit from bar code scanning technology. Deloitte Consulting, was involved in the three-part project conducted by the CDC.
ATLANTA – Since the first bar coded consumer product, a pack of gum, was scanned in June of 1974, the soon widespread use of bar codes changed little until 2D bar codes arrived toward the end of last century. Today, the increasing use of 2D bar code technology with vaccines offers practices the potential for greater accuracy and efficiency with vaccine administration and data entry – if they have the resources to take the plunge.
An overview of 2D bar code use with vaccines, presented at a conference sponsored by the Centers for Disease Control and Prevention, provided a glimpse into both the types of changes practices might see with adoption of the technology and the way some clinics have made the transition.
Ken Gerlach, MPH, of the Immunization Services Division at the CDC in Atlanta, outlined the history of bar code use in immunizations, starting with a November 1999 Institute of Medicine report that identified the contribution of human error to disease and led the Food and Drug Administration to begin requiring linear bar codes on pharmaceutical unit-of-use products to reduce errors.
Then, a meeting organized by the American Academy of Pediatrics in January 2009 with the FDA, CDC, vaccine manufacturers, and other stakeholders led to a bar code rule change by the FDA in August 2011 that allowed alternatives to the traditional linear bar codes on vaccine vials and syringes.
“They essentially indicated to the pharmaceutical companies that it’s okay to add 2D bar codes, and this is essentially the point where things began to take off,” Mr. Gerlach explained. Until then, there had been no 2D bar codes on vaccines, but today the majority of vaccine products have them, as do all Vaccine Information Statements. In addition to the standard information included on traditional bar codes – Global Trade Item Number (GTIN), lot and serial numbers, and the expiration date – 2D bar codes also can include most relevant patient information that would go into the EMR except the injection site and immunization route. But a practice cannot simply jump over to scanning the 2D bar codes without ensuring that its EMR system is configured to accept the scanning.
Mr. Gerlach described a three-part project by the CDC, from 2011 through 2017, that assesses the impact of 2D coding on vaccination data quality and work flow, facilitates the adoption of 2D bar code scanning in health care practices, and then assesses the potential for expanding 2D bar code use in a large health care system. The first part of the project, which ran from 2011 to 2014, involved two vaccine manufacturers and 217 health care practices with more than 1.4 million de-identified vaccination records, 18.1% of which had been 2D bar coded.
Analysis of data quality from that pilot revealed an 8% increase in the correctness of lot numbers and 11% increase for expiration dates, with a time savings of 3.4 seconds per vaccine administration. Among the 116 staff users who completed surveys, 86% agreed that 2D bar coding improves accuracy and completeness, and 60% agreed it was easy to integrate the bar coding into their usual data recording process.
The pilot revealed challenges as well, however: not all individuals units of vaccines were 2D bar coded, users did not always consistently scan the bar codes, and some bar codes were difficult to read, such as one that was brown and wouldn’t scan. Another obstacle was having different lot numbers on the unit of use versus the unit of sale with 10% of the vaccines. Further, because inventory management typically involves unit of sale, it does not always match well with scanning unit of use.
Clinicians’ beliefs and attitudes toward 2D bar coding
As more practices consider adopting the technology, buy-in will important. At the conference, Sharon Humiston, MD, and Jill Hernandez, MPH, of Children’s Mercy Hospital in Kansas City, Mo., shared the findings of an online questionnaire about 2D bar coding and practices’ current systems for vaccine inventory and recording patient immunization information. The researchers distributed the questionnaire link to various AAP sections and committees in listservs and emails. Those eligible to complete the 15-minute survey were primary care personnel who used EMRs but not 2D bar code scanning for vaccines. They also needed to be key decision makers in the process of purchasing technology for the practice, and their practice needed to be enrolled in the Vaccines for Children program.
Among the 77 respondents who met all the inclusion criteria (61% of all who started the survey), 1 in 5 were private practices with one or two physicians, just over a third (36%) were private practices with more than two physicians, and a quarter were multispecialty group practices. Overall, respondents administered an average 116 doses of DTaP and 50 doses of Tdap each month.
Protocols for immunization management varied considerably across the respondents. For recording vaccine information, 49% reported that an administrator pre-entered it into an EMR, but 43% reported that staff manually enter it into an EMR. About 55% of practices entered the information before vaccine administration, and 42% entered it afterward. Although 57% of respondents’ practices upload the vaccination information directly from the EMR to their state’s Immunization Information System (IIS), 30% must enter it both into the EMR and into the state IIS separately, and 11% don’t enter it into a state IIS.
More than half (56%) of the respondents were extremely interested in having a bar code scanner system, and 31% were moderately to strongly interested, rating a 6 to 9 on a scale of 1 to 10. If provided evidence that 2D bar codes reduced errors in vaccine documentation, 56% of respondents said it would greatly increase their interest, and 32% said it would somewhat increase it. Only 23% said their interest would greatly increase if the bar code technology allowed the vaccine information statement to be scanned into EMRs.
Nearly all the respondents agreed that 2D bar code scanning technology would improve efficiency and accuracy of entering vaccine information into medical records and tracking vaccine inventory. Further, 81% believed it would reduce medical malpractice liability, and 85% believed it would reduce risk of harm to patients. However, 23% thought bar code technology would disrupt office work flow, and a quarter believed the technology’s costs would exceeds its benefits.
Despite the strong interest overall, respondents reported a number of barriers to adopting 2D bar code technology. The greatest barrier, reported by more than 70%, was the upfront cost of purchasing software for the EMR interface, followed by the cost of the bar code scanners. Other barriers, reported by 25%-45% of respondents, were the need for staff training, the need to service and maintain electronics for the technology, and the purchase of additional computers for scanner sites. If a bar code system cost less than $5,000, then 80% of the respondents would definitely or probably adopt such a system. Few would adopt it if the system cost $10,000 or more, but 42% probably would if it cost between $5,000 and $9,999. Even this small survey of self-selected volunteers, however, suggested strong interest in using 2D bar code technology for vaccines – although initial costs for a system presented a significant barrier to most practices.
One influenza vaccine clinic’s experience
Interest based on hypothetical questions is one thing. The process of actually implementing a 2D bar code scanning system into a health care center is another. In a separate presentation, Jane Glaser, MSN, RN, executive director of Campbell County Public Health in Gillette, Wyo., reviewed how such a system was implemented for mass influenza vaccination.
Campbell County, in the northeast corner of Wyoming, covers more than 4,800 square miles, has a population base of nearly 50,000 people, and also serves individuals from Montana, South Dakota, and North Dakota. Although the community as a whole works 24/7 in the county because of the oil, mining, and farming industries, the mass flu clinic is open 7 a.m. to 7 p.m., during which it provides an estimated 700 to 1,500 flu vaccines daily. Personnel comprises 13 public health nurses, 5 administrative assistants, and 3-4 community volunteers.
After 20 years of using an IIS, the clinic’s leadership decided to begin using 2D bar code scanners in October 2011 after observing it at a state immunization conference. Their goals in changing systems were to increase clinic flow, decrease registration time, and decrease overtime due to data entry. The new work flow went as follows: Those with Wyoming driver licenses or state ID cards have the linear bar code on their ID scanned in the immunization registry, which automatically populates the patient’s record. Then the staff member enters the vaccine information directly into the IIS registry in real time after the client receives the vaccine.
Ms. Glaser describes a number of improvements that resulted from use of the bar code scanning system, starting with reduced time for clinic registration and improved clinic flow. They also found that using bar code scanning reduced manual entry errors and improved the efficiency of assessing vaccination status and needed vaccines. Entering data in real time at point of care reduced time spent on data entry later on, thereby leading to a decrease in overtime and subsequent cost savings.
For providers and practices interested in learning more about 2D bar coding, the CDC offers a current list of 2D bar coded vaccines, data from the pilot program, training materials, and AAP guidance about 2D bar code use.
None of three presentations noted external funding, and all the researchers reported no financial relationships with companies that profit from bar code scanning technology. Deloitte Consulting, was involved in the three-part project conducted by the CDC.
ATLANTA – Since the first bar coded consumer product, a pack of gum, was scanned in June of 1974, the soon widespread use of bar codes changed little until 2D bar codes arrived toward the end of last century. Today, the increasing use of 2D bar code technology with vaccines offers practices the potential for greater accuracy and efficiency with vaccine administration and data entry – if they have the resources to take the plunge.
An overview of 2D bar code use with vaccines, presented at a conference sponsored by the Centers for Disease Control and Prevention, provided a glimpse into both the types of changes practices might see with adoption of the technology and the way some clinics have made the transition.
Ken Gerlach, MPH, of the Immunization Services Division at the CDC in Atlanta, outlined the history of bar code use in immunizations, starting with a November 1999 Institute of Medicine report that identified the contribution of human error to disease and led the Food and Drug Administration to begin requiring linear bar codes on pharmaceutical unit-of-use products to reduce errors.
Then, a meeting organized by the American Academy of Pediatrics in January 2009 with the FDA, CDC, vaccine manufacturers, and other stakeholders led to a bar code rule change by the FDA in August 2011 that allowed alternatives to the traditional linear bar codes on vaccine vials and syringes.
“They essentially indicated to the pharmaceutical companies that it’s okay to add 2D bar codes, and this is essentially the point where things began to take off,” Mr. Gerlach explained. Until then, there had been no 2D bar codes on vaccines, but today the majority of vaccine products have them, as do all Vaccine Information Statements. In addition to the standard information included on traditional bar codes – Global Trade Item Number (GTIN), lot and serial numbers, and the expiration date – 2D bar codes also can include most relevant patient information that would go into the EMR except the injection site and immunization route. But a practice cannot simply jump over to scanning the 2D bar codes without ensuring that its EMR system is configured to accept the scanning.
Mr. Gerlach described a three-part project by the CDC, from 2011 through 2017, that assesses the impact of 2D coding on vaccination data quality and work flow, facilitates the adoption of 2D bar code scanning in health care practices, and then assesses the potential for expanding 2D bar code use in a large health care system. The first part of the project, which ran from 2011 to 2014, involved two vaccine manufacturers and 217 health care practices with more than 1.4 million de-identified vaccination records, 18.1% of which had been 2D bar coded.
Analysis of data quality from that pilot revealed an 8% increase in the correctness of lot numbers and 11% increase for expiration dates, with a time savings of 3.4 seconds per vaccine administration. Among the 116 staff users who completed surveys, 86% agreed that 2D bar coding improves accuracy and completeness, and 60% agreed it was easy to integrate the bar coding into their usual data recording process.
The pilot revealed challenges as well, however: not all individuals units of vaccines were 2D bar coded, users did not always consistently scan the bar codes, and some bar codes were difficult to read, such as one that was brown and wouldn’t scan. Another obstacle was having different lot numbers on the unit of use versus the unit of sale with 10% of the vaccines. Further, because inventory management typically involves unit of sale, it does not always match well with scanning unit of use.
Clinicians’ beliefs and attitudes toward 2D bar coding
As more practices consider adopting the technology, buy-in will important. At the conference, Sharon Humiston, MD, and Jill Hernandez, MPH, of Children’s Mercy Hospital in Kansas City, Mo., shared the findings of an online questionnaire about 2D bar coding and practices’ current systems for vaccine inventory and recording patient immunization information. The researchers distributed the questionnaire link to various AAP sections and committees in listservs and emails. Those eligible to complete the 15-minute survey were primary care personnel who used EMRs but not 2D bar code scanning for vaccines. They also needed to be key decision makers in the process of purchasing technology for the practice, and their practice needed to be enrolled in the Vaccines for Children program.
Among the 77 respondents who met all the inclusion criteria (61% of all who started the survey), 1 in 5 were private practices with one or two physicians, just over a third (36%) were private practices with more than two physicians, and a quarter were multispecialty group practices. Overall, respondents administered an average 116 doses of DTaP and 50 doses of Tdap each month.
Protocols for immunization management varied considerably across the respondents. For recording vaccine information, 49% reported that an administrator pre-entered it into an EMR, but 43% reported that staff manually enter it into an EMR. About 55% of practices entered the information before vaccine administration, and 42% entered it afterward. Although 57% of respondents’ practices upload the vaccination information directly from the EMR to their state’s Immunization Information System (IIS), 30% must enter it both into the EMR and into the state IIS separately, and 11% don’t enter it into a state IIS.
More than half (56%) of the respondents were extremely interested in having a bar code scanner system, and 31% were moderately to strongly interested, rating a 6 to 9 on a scale of 1 to 10. If provided evidence that 2D bar codes reduced errors in vaccine documentation, 56% of respondents said it would greatly increase their interest, and 32% said it would somewhat increase it. Only 23% said their interest would greatly increase if the bar code technology allowed the vaccine information statement to be scanned into EMRs.
Nearly all the respondents agreed that 2D bar code scanning technology would improve efficiency and accuracy of entering vaccine information into medical records and tracking vaccine inventory. Further, 81% believed it would reduce medical malpractice liability, and 85% believed it would reduce risk of harm to patients. However, 23% thought bar code technology would disrupt office work flow, and a quarter believed the technology’s costs would exceeds its benefits.
Despite the strong interest overall, respondents reported a number of barriers to adopting 2D bar code technology. The greatest barrier, reported by more than 70%, was the upfront cost of purchasing software for the EMR interface, followed by the cost of the bar code scanners. Other barriers, reported by 25%-45% of respondents, were the need for staff training, the need to service and maintain electronics for the technology, and the purchase of additional computers for scanner sites. If a bar code system cost less than $5,000, then 80% of the respondents would definitely or probably adopt such a system. Few would adopt it if the system cost $10,000 or more, but 42% probably would if it cost between $5,000 and $9,999. Even this small survey of self-selected volunteers, however, suggested strong interest in using 2D bar code technology for vaccines – although initial costs for a system presented a significant barrier to most practices.
One influenza vaccine clinic’s experience
Interest based on hypothetical questions is one thing. The process of actually implementing a 2D bar code scanning system into a health care center is another. In a separate presentation, Jane Glaser, MSN, RN, executive director of Campbell County Public Health in Gillette, Wyo., reviewed how such a system was implemented for mass influenza vaccination.
Campbell County, in the northeast corner of Wyoming, covers more than 4,800 square miles, has a population base of nearly 50,000 people, and also serves individuals from Montana, South Dakota, and North Dakota. Although the community as a whole works 24/7 in the county because of the oil, mining, and farming industries, the mass flu clinic is open 7 a.m. to 7 p.m., during which it provides an estimated 700 to 1,500 flu vaccines daily. Personnel comprises 13 public health nurses, 5 administrative assistants, and 3-4 community volunteers.
After 20 years of using an IIS, the clinic’s leadership decided to begin using 2D bar code scanners in October 2011 after observing it at a state immunization conference. Their goals in changing systems were to increase clinic flow, decrease registration time, and decrease overtime due to data entry. The new work flow went as follows: Those with Wyoming driver licenses or state ID cards have the linear bar code on their ID scanned in the immunization registry, which automatically populates the patient’s record. Then the staff member enters the vaccine information directly into the IIS registry in real time after the client receives the vaccine.
Ms. Glaser describes a number of improvements that resulted from use of the bar code scanning system, starting with reduced time for clinic registration and improved clinic flow. They also found that using bar code scanning reduced manual entry errors and improved the efficiency of assessing vaccination status and needed vaccines. Entering data in real time at point of care reduced time spent on data entry later on, thereby leading to a decrease in overtime and subsequent cost savings.
For providers and practices interested in learning more about 2D bar coding, the CDC offers a current list of 2D bar coded vaccines, data from the pilot program, training materials, and AAP guidance about 2D bar code use.
None of three presentations noted external funding, and all the researchers reported no financial relationships with companies that profit from bar code scanning technology. Deloitte Consulting, was involved in the three-part project conducted by the CDC.
EXPERT ANALYSIS FROM AAP 16
Key clinical point: 2D bar coding with vaccines offers benefits and challenges.
Major finding:
Data source: A CDC study, an online questionnaire, and experience in a Wyoming flu clinic.
Disclosures: None of three presentations noted external funding, and all researchers reported no financial relationships with companies that profit from bar code scanning technology. Deloitte Consulting was involved in the three-part project conducted by the CDC.
Frailty stratifies pediatric liver disease severity
MONTREAL – A newly devised measurement of frailty in children effectively determined the severity of liver disease in pediatric patients and might serve as a useful, independent predictor of outcomes following liver transplantations in children and adolescents.
The adapted pediatric frailty assessment formula is a “very valid, feasible, and valuable tool” for assessing children with chronic liver disease, Eberhard Lurz, MD, said at the World Congress of Pediatric Gastroenterology, Hepatology and Nutrition. “Frailty captures an additional marker of ill health that is independent of the MELD-Na [Model for End-Stage Liver Disease–Na] and PELD,” [Pediatric End-Stage Liver Disease] said Dr. Lurz, a pediatric gastroenterologist at the Hospital for Sick Children in Toronto.

The idea of frailty assessment of children with liver disease sprang from a 2014 report that showed a five-item frailty index could predict mortality in adults with liver disease who were listed for liver transplantation and that this predictive power was independent of the patients’ MELD scores (Am J Transplant. 2014 Aug;14[8]:1870-9). That study used a five-item frailty index developed for adults (J Gerontol A Biol Sci Med Sci. 2001;56[3]:M146-57).
Dr. Lurz came up with a pediatric version of this frailty score using pediatric-oriented measures for each of the five items. To measure exhaustion he used the PedsQL (Pediatric Quality of Life Inventory) Multidimensional Fatigue Scale; for slowness he used a 6-minute walk test; for weakness he measured grip strength; for shrinkage he measured triceps skinfold thickness; and for diminished activity he used an age-appropriate physical activity questionnaire. He prespecified that a patient’s scores for each of these five measures are calculated by comparing their test results against age-specific norms. A patient with a value that fell more than one standard deviation below the normal range scores one point for the item and those with values more than two standard deviations below the normal range score two points. Hence the maximum score for all five items is 10.
Researchers at the collaborating centers completed full assessments for 71 of 85 pediatric patients with chronic liver disease in their clinics, and each full assessment took a median of 60 minutes. The patients ranged from 8-16 years old, with an average age of 13. The cohort included 36 patients with compensated chronic liver disease (CCLD) and 35 with end-stage liver disease (ESLD) who were listed for liver transplantation.
The median frailty score of the CCLD patients was 3 and the median score for those with ESLD was 5, a statistically significant difference that was largely driven by between-group differences in fatigue scores and physical activity scores. A receiver operating characteristic curve analysis by area under the curve showed that the frailty score accounted for 83% of the difference between patients with CCLD and ESLD, comparable to the distinguishing power of the MELD-Na score. Using a cutoff on the score of 6 or greater identified patients with ESLD with 47% sensitivity and 98% specificity, and this diagnostic capability was independent of a patient’s MELD-Na or PELD score.
The five elements that contribute to this pediatric frailty score could be the focus for targeted interventions to improve the outcomes of patients scheduled to undergo liver transplantation, Dr. Lurz said.
Dr. Lurz had no relevant financial disclosures.
mzoler@frontlinemedcom.com
On Twitter @mitchelzoler
MONTREAL – A newly devised measurement of frailty in children effectively determined the severity of liver disease in pediatric patients and might serve as a useful, independent predictor of outcomes following liver transplantations in children and adolescents.
The adapted pediatric frailty assessment formula is a “very valid, feasible, and valuable tool” for assessing children with chronic liver disease, Eberhard Lurz, MD, said at the World Congress of Pediatric Gastroenterology, Hepatology and Nutrition. “Frailty captures an additional marker of ill health that is independent of the MELD-Na [Model for End-Stage Liver Disease–Na] and PELD,” [Pediatric End-Stage Liver Disease] said Dr. Lurz, a pediatric gastroenterologist at the Hospital for Sick Children in Toronto.
The idea of frailty assessment of children with liver disease sprang from a 2014 report that showed a five-item frailty index could predict mortality in adults with liver disease who were listed for liver transplantation and that this predictive power was independent of the patients’ MELD scores (Am J Transplant. 2014 Aug;14[8]:1870-9). That study used a five-item frailty index developed for adults (J Gerontol A Biol Sci Med Sci. 2001;56[3]:M146-57).
Dr. Lurz came up with a pediatric version of this frailty score using pediatric-oriented measures for each of the five items. To measure exhaustion he used the PedsQL (Pediatric Quality of Life Inventory) Multidimensional Fatigue Scale; for slowness he used a 6-minute walk test; for weakness he measured grip strength; for shrinkage he measured triceps skinfold thickness; and for diminished activity he used an age-appropriate physical activity questionnaire. He prespecified that a patient’s scores for each of these five measures are calculated by comparing their test results against age-specific norms. A patient with a value that fell more than one standard deviation below the normal range scores one point for the item and those with values more than two standard deviations below the normal range score two points. Hence the maximum score for all five items is 10.
Researchers at the collaborating centers completed full assessments for 71 of 85 pediatric patients with chronic liver disease in their clinics, and each full assessment took a median of 60 minutes. The patients ranged from 8-16 years old, with an average age of 13. The cohort included 36 patients with compensated chronic liver disease (CCLD) and 35 with end-stage liver disease (ESLD) who were listed for liver transplantation.
The median frailty score of the CCLD patients was 3 and the median score for those with ESLD was 5, a statistically significant difference that was largely driven by between-group differences in fatigue scores and physical activity scores. A receiver operating characteristic curve analysis by area under the curve showed that the frailty score accounted for 83% of the difference between patients with CCLD and ESLD, comparable to the distinguishing power of the MELD-Na score. Using a cutoff on the score of 6 or greater identified patients with ESLD with 47% sensitivity and 98% specificity, and this diagnostic capability was independent of a patient’s MELD-Na or PELD score.
The five elements that contribute to this pediatric frailty score could be the focus for targeted interventions to improve the outcomes of patients scheduled to undergo liver transplantation, Dr. Lurz said.
Dr. Lurz had no relevant financial disclosures.
mzoler@frontlinemedcom.com
On Twitter @mitchelzoler
MONTREAL – A newly devised measurement of frailty in children effectively determined the severity of liver disease in pediatric patients and might serve as a useful, independent predictor of outcomes following liver transplantations in children and adolescents.
The adapted pediatric frailty assessment formula is a “very valid, feasible, and valuable tool” for assessing children with chronic liver disease, Eberhard Lurz, MD, said at the World Congress of Pediatric Gastroenterology, Hepatology and Nutrition. “Frailty captures an additional marker of ill health that is independent of the MELD-Na [Model for End-Stage Liver Disease–Na] and PELD,” [Pediatric End-Stage Liver Disease] said Dr. Lurz, a pediatric gastroenterologist at the Hospital for Sick Children in Toronto.
The idea of frailty assessment of children with liver disease sprang from a 2014 report that showed a five-item frailty index could predict mortality in adults with liver disease who were listed for liver transplantation and that this predictive power was independent of the patients’ MELD scores (Am J Transplant. 2014 Aug;14[8]:1870-9). That study used a five-item frailty index developed for adults (J Gerontol A Biol Sci Med Sci. 2001;56[3]:M146-57).
Dr. Lurz came up with a pediatric version of this frailty score using pediatric-oriented measures for each of the five items. To measure exhaustion he used the PedsQL (Pediatric Quality of Life Inventory) Multidimensional Fatigue Scale; for slowness he used a 6-minute walk test; for weakness he measured grip strength; for shrinkage he measured triceps skinfold thickness; and for diminished activity he used an age-appropriate physical activity questionnaire. He prespecified that a patient’s scores for each of these five measures are calculated by comparing their test results against age-specific norms. A patient with a value that fell more than one standard deviation below the normal range scores one point for the item and those with values more than two standard deviations below the normal range score two points. Hence the maximum score for all five items is 10.
Researchers at the collaborating centers completed full assessments for 71 of 85 pediatric patients with chronic liver disease in their clinics, and each full assessment took a median of 60 minutes. The patients ranged from 8-16 years old, with an average age of 13. The cohort included 36 patients with compensated chronic liver disease (CCLD) and 35 with end-stage liver disease (ESLD) who were listed for liver transplantation.
The median frailty score of the CCLD patients was 3 and the median score for those with ESLD was 5, a statistically significant difference that was largely driven by between-group differences in fatigue scores and physical activity scores. A receiver operating characteristic curve analysis by area under the curve showed that the frailty score accounted for 83% of the difference between patients with CCLD and ESLD, comparable to the distinguishing power of the MELD-Na score. Using a cutoff on the score of 6 or greater identified patients with ESLD with 47% sensitivity and 98% specificity, and this diagnostic capability was independent of a patient’s MELD-Na or PELD score.
The five elements that contribute to this pediatric frailty score could be the focus for targeted interventions to improve the outcomes of patients scheduled to undergo liver transplantation, Dr. Lurz said.
Dr. Lurz had no relevant financial disclosures.
mzoler@frontlinemedcom.com
On Twitter @mitchelzoler
AT WCPGHAN 2016
Key clinical point:
Major finding: The pediatric frailty score identified patients with end-stage liver disease with sensitivity of 47% and specificity of 98%.
Data source: A series of 71 pediatric patients with liver disease compiled from 17 U.S. and Canadian centers.
Disclosures: Dr. Lurz had no relevant financial disclosures.
Vedolizumab shows safety, efficacy for pediatric IBD
MONTREAL – Vedolizumab, 2 years out from its entry onto the U.S. market as an option for treating adults with inflammatory bowel disease, also has shown early safety and efficacy in 52 pediatric patients with ulcerative colitis or Crohn’s disease.
Retrospective review of a patients series assembled from three U.S. centers showed 13 (76%) ulcerative colitis patients in remission among 17 treated and followed for 14 weeks, the study’s primary outcome. Among 24 Crohn’s disease patients treated and followed for 14 weeks, 10 (42%) had remissions, Namita Singh, MD, said at the World Congress of Pediatric Gastroenterology, Hepatology, and Nutrition.
Treatment with vedolizumab (Entyvio), an anti-integrin with highly gut-specific activity that limits its systemic effects, was especially potent for the five patients in the series who were naive to treatment with an anti–tumor necrosis factor (TNF) agent. All five patients were in remission at 14 weeks, said Dr. Singh, a pediatric gastroenterologist at Cedars-Sinai Medical Center, Los Angeles.
“From this and other data it seems like there is a potential role for vedolizumab as first-line treatment” for selected patients, Dr. Singh said in an interview. “The attraction of vedolizumab is its gut selectivity.”
The American Gastroenterological Association lists vedolizumab as an equal alternative to an anti-TNF agent in its recommended algorithm for treating ulcerative colitis, but vedolizumab is not mentioned in the association’s posted guidance for treating Crohn’s disease. ”Prospective studies are needed” to generate more definitive evidence on how to use vedolizumab, she acknowledged, but added that pediatric gastroenterological societies “need to come up with guidelines on where to place vedolizumab.”Dr. Singh said she discusses with patients and their families the potential risks and benefits of the various treatment options available when inflammatory bowel disease (IBD) doesn’t respond to mesalamine: an anti-TNF agent, an immunomodulator like methotrexate or azathioprine, or vedolizumab. One important issue when deciding which drug class to try first is the cost of treatment and whether it will be covered by insurance.
The combined series included pediatric IBD patients less than 18 years old, with an actual median age of just under 15 years. They had been diagnosed with ulcerative colitis or Crohn’s disease for a median of 3 years. The 30 Crohn’s disease patients had received a median of two anti-TNF agents prior to starting vedolizumab, while the ulcerative colitis patients had received a median of one anti-TNF drug before vedolizumab. Three-quarters of the patients received the adult dose of 300 mg per infusion. A fifth of the patients received a dosage of 6 mg/kg, and the remaining patients received 5 mg/kg.
Although the 24 Crohn’s disease patients followed through 14 weeks of therapy had a 42% remission rate, the remission rate jumped sharply to more than 70% among the 11 patients followed to 30 weeks.
One limitation to vedolizumab is its relatively slow onset of action, slower than anti-TNF agents, which makes vedolizumab less suitable for patients with acute, severe colitis, although short-term improvement of acute colitis can be achieved with a corticosteroid when starting a patient on vedolizumab, Dr. Singh said. A trial currently underway is collecting prospective data on vedolizumab in pediatric IBD patients that could result in pediatric labeling for the drug, she added.
Until those data are available, current experience suggests vedolizumab “is good for ulcerative colitis patients,” she said. “Our data encourage us to continue” offering vedolizumab to selected pediatric IBD patients.
Dr. Singh has been a consultant to Janssen and Prometheus and received grant support from Janssen.
mzoler@frontlinemedcom.com
On Twitter @mitchelzoler
MONTREAL – Vedolizumab, 2 years out from its entry onto the U.S. market as an option for treating adults with inflammatory bowel disease, also has shown early safety and efficacy in 52 pediatric patients with ulcerative colitis or Crohn’s disease.
Retrospective review of a patients series assembled from three U.S. centers showed 13 (76%) ulcerative colitis patients in remission among 17 treated and followed for 14 weeks, the study’s primary outcome. Among 24 Crohn’s disease patients treated and followed for 14 weeks, 10 (42%) had remissions, Namita Singh, MD, said at the World Congress of Pediatric Gastroenterology, Hepatology, and Nutrition.
Treatment with vedolizumab (Entyvio), an anti-integrin with highly gut-specific activity that limits its systemic effects, was especially potent for the five patients in the series who were naive to treatment with an anti–tumor necrosis factor (TNF) agent. All five patients were in remission at 14 weeks, said Dr. Singh, a pediatric gastroenterologist at Cedars-Sinai Medical Center, Los Angeles.
“From this and other data it seems like there is a potential role for vedolizumab as first-line treatment” for selected patients, Dr. Singh said in an interview. “The attraction of vedolizumab is its gut selectivity.”
The American Gastroenterological Association lists vedolizumab as an equal alternative to an anti-TNF agent in its recommended algorithm for treating ulcerative colitis, but vedolizumab is not mentioned in the association’s posted guidance for treating Crohn’s disease. ”Prospective studies are needed” to generate more definitive evidence on how to use vedolizumab, she acknowledged, but added that pediatric gastroenterological societies “need to come up with guidelines on where to place vedolizumab.”Dr. Singh said she discusses with patients and their families the potential risks and benefits of the various treatment options available when inflammatory bowel disease (IBD) doesn’t respond to mesalamine: an anti-TNF agent, an immunomodulator like methotrexate or azathioprine, or vedolizumab. One important issue when deciding which drug class to try first is the cost of treatment and whether it will be covered by insurance.
The combined series included pediatric IBD patients less than 18 years old, with an actual median age of just under 15 years. They had been diagnosed with ulcerative colitis or Crohn’s disease for a median of 3 years. The 30 Crohn’s disease patients had received a median of two anti-TNF agents prior to starting vedolizumab, while the ulcerative colitis patients had received a median of one anti-TNF drug before vedolizumab. Three-quarters of the patients received the adult dose of 300 mg per infusion. A fifth of the patients received a dosage of 6 mg/kg, and the remaining patients received 5 mg/kg.
Although the 24 Crohn’s disease patients followed through 14 weeks of therapy had a 42% remission rate, the remission rate jumped sharply to more than 70% among the 11 patients followed to 30 weeks.
One limitation to vedolizumab is its relatively slow onset of action, slower than anti-TNF agents, which makes vedolizumab less suitable for patients with acute, severe colitis, although short-term improvement of acute colitis can be achieved with a corticosteroid when starting a patient on vedolizumab, Dr. Singh said. A trial currently underway is collecting prospective data on vedolizumab in pediatric IBD patients that could result in pediatric labeling for the drug, she added.
Until those data are available, current experience suggests vedolizumab “is good for ulcerative colitis patients,” she said. “Our data encourage us to continue” offering vedolizumab to selected pediatric IBD patients.
Dr. Singh has been a consultant to Janssen and Prometheus and received grant support from Janssen.
mzoler@frontlinemedcom.com
On Twitter @mitchelzoler
MONTREAL – Vedolizumab, 2 years out from its entry onto the U.S. market as an option for treating adults with inflammatory bowel disease, also has shown early safety and efficacy in 52 pediatric patients with ulcerative colitis or Crohn’s disease.
Retrospective review of a patients series assembled from three U.S. centers showed 13 (76%) ulcerative colitis patients in remission among 17 treated and followed for 14 weeks, the study’s primary outcome. Among 24 Crohn’s disease patients treated and followed for 14 weeks, 10 (42%) had remissions, Namita Singh, MD, said at the World Congress of Pediatric Gastroenterology, Hepatology, and Nutrition.
Treatment with vedolizumab (Entyvio), an anti-integrin with highly gut-specific activity that limits its systemic effects, was especially potent for the five patients in the series who were naive to treatment with an anti–tumor necrosis factor (TNF) agent. All five patients were in remission at 14 weeks, said Dr. Singh, a pediatric gastroenterologist at Cedars-Sinai Medical Center, Los Angeles.
“From this and other data it seems like there is a potential role for vedolizumab as first-line treatment” for selected patients, Dr. Singh said in an interview. “The attraction of vedolizumab is its gut selectivity.”
The American Gastroenterological Association lists vedolizumab as an equal alternative to an anti-TNF agent in its recommended algorithm for treating ulcerative colitis, but vedolizumab is not mentioned in the association’s posted guidance for treating Crohn’s disease. ”Prospective studies are needed” to generate more definitive evidence on how to use vedolizumab, she acknowledged, but added that pediatric gastroenterological societies “need to come up with guidelines on where to place vedolizumab.”Dr. Singh said she discusses with patients and their families the potential risks and benefits of the various treatment options available when inflammatory bowel disease (IBD) doesn’t respond to mesalamine: an anti-TNF agent, an immunomodulator like methotrexate or azathioprine, or vedolizumab. One important issue when deciding which drug class to try first is the cost of treatment and whether it will be covered by insurance.
The combined series included pediatric IBD patients less than 18 years old, with an actual median age of just under 15 years. They had been diagnosed with ulcerative colitis or Crohn’s disease for a median of 3 years. The 30 Crohn’s disease patients had received a median of two anti-TNF agents prior to starting vedolizumab, while the ulcerative colitis patients had received a median of one anti-TNF drug before vedolizumab. Three-quarters of the patients received the adult dose of 300 mg per infusion. A fifth of the patients received a dosage of 6 mg/kg, and the remaining patients received 5 mg/kg.
Although the 24 Crohn’s disease patients followed through 14 weeks of therapy had a 42% remission rate, the remission rate jumped sharply to more than 70% among the 11 patients followed to 30 weeks.
One limitation to vedolizumab is its relatively slow onset of action, slower than anti-TNF agents, which makes vedolizumab less suitable for patients with acute, severe colitis, although short-term improvement of acute colitis can be achieved with a corticosteroid when starting a patient on vedolizumab, Dr. Singh said. A trial currently underway is collecting prospective data on vedolizumab in pediatric IBD patients that could result in pediatric labeling for the drug, she added.
Until those data are available, current experience suggests vedolizumab “is good for ulcerative colitis patients,” she said. “Our data encourage us to continue” offering vedolizumab to selected pediatric IBD patients.
Dr. Singh has been a consultant to Janssen and Prometheus and received grant support from Janssen.
mzoler@frontlinemedcom.com
On Twitter @mitchelzoler
AT WCPGHAN 2016
Key clinical point:
Major finding: Fourteen weeks of treatment with vedolizumab produced remission in 76% of ulcerative colitis patients and 42% of Crohn’s disease patients.
Data source: Retrospective review of 52 pediatric patients with inflammatory bowel disease at seen at any of three U.S. centers.
Disclosures: Dr. Singh has been a consultant to Janssen and Prometheus and received grant support from Janssen.
ACIP approves change to hepatitis B vaccination guidelines
The Centers for Disease Control and Prevention’s Advisory Committee on Immunization Practices voted in favor of changes to the current recommendations that would remove the permissive language for the hepatitis B birth dose to be administered after discharge from the hospital.
The revised language will state that for all medically stable infants weighing greater than or equal to 2,000 g at birth and born to hepatitis B surface antigen–negative mothers, the first dose of vaccine should be administered within 24 hours of birth. Originally, the recommendations were to state that vaccination should take place before hospital discharge, but this language was changed via a unanimously approved amendment to broaden the scope of the guidelines. Furthermore, the recommendations state that only single-antigen hepatitis B vaccine should be used for the birth dose.
“The language regarding vaccination within 24 hours of birth is consistent with what the [World Health Organization] says,” she explained.
The proposed changes came after the hepatitis B workgroup held five teleconference meetings between February and September of this year to discuss and determine what changes, if any, need to be made. A draft was prepared and presented at the ACIP meeting, at which the changes were unanimously approved by the 14-member advisory committee.
The recommendations agreed upon will be submitted for approval to CDC Director Tom Frieden, MD, and, if approved, will be published by Jan. 1, 2017, at which point they will go into effect.
The Centers for Disease Control and Prevention’s Advisory Committee on Immunization Practices voted in favor of changes to the current recommendations that would remove the permissive language for the hepatitis B birth dose to be administered after discharge from the hospital.
The revised language will state that for all medically stable infants weighing greater than or equal to 2,000 g at birth and born to hepatitis B surface antigen–negative mothers, the first dose of vaccine should be administered within 24 hours of birth. Originally, the recommendations were to state that vaccination should take place before hospital discharge, but this language was changed via a unanimously approved amendment to broaden the scope of the guidelines. Furthermore, the recommendations state that only single-antigen hepatitis B vaccine should be used for the birth dose.
“The language regarding vaccination within 24 hours of birth is consistent with what the [World Health Organization] says,” she explained.
The proposed changes came after the hepatitis B workgroup held five teleconference meetings between February and September of this year to discuss and determine what changes, if any, need to be made. A draft was prepared and presented at the ACIP meeting, at which the changes were unanimously approved by the 14-member advisory committee.
The recommendations agreed upon will be submitted for approval to CDC Director Tom Frieden, MD, and, if approved, will be published by Jan. 1, 2017, at which point they will go into effect.
The Centers for Disease Control and Prevention’s Advisory Committee on Immunization Practices voted in favor of changes to the current recommendations that would remove the permissive language for the hepatitis B birth dose to be administered after discharge from the hospital.
The revised language will state that for all medically stable infants weighing greater than or equal to 2,000 g at birth and born to hepatitis B surface antigen–negative mothers, the first dose of vaccine should be administered within 24 hours of birth. Originally, the recommendations were to state that vaccination should take place before hospital discharge, but this language was changed via a unanimously approved amendment to broaden the scope of the guidelines. Furthermore, the recommendations state that only single-antigen hepatitis B vaccine should be used for the birth dose.
“The language regarding vaccination within 24 hours of birth is consistent with what the [World Health Organization] says,” she explained.
The proposed changes came after the hepatitis B workgroup held five teleconference meetings between February and September of this year to discuss and determine what changes, if any, need to be made. A draft was prepared and presented at the ACIP meeting, at which the changes were unanimously approved by the 14-member advisory committee.
The recommendations agreed upon will be submitted for approval to CDC Director Tom Frieden, MD, and, if approved, will be published by Jan. 1, 2017, at which point they will go into effect.
Pyuria is an important tool in diagnosing UTI in infants
Diagnosing urinary tract infections can be achieved by determining the white blood cell concentration of the patient’s urine, according to a new study.
“Previously recommended pyuria thresholds for the presumptive diagnosis of UTI in young infants were based on manual microscopy of centrifuged urine [but] test performance has not been studied in newer automated systems that analyze uncentrifuged urine,” wrote Pradip P. Chaudhari, MD, and his associates at Harvard University in Boston.
Of these 2,700 infants with a median age of 1.7 months, 211 (7.8%) had a urine culture come back positive for UTI. Likelihood ratio (LR) positive and negative were calculated to determine the microscopic pyuria thresholds at which UTIs became more likely in both dilute and concentrated urine. A white blood cell to high-power field (WBC/HPF) count of 3 yielded an LR-positive of 9.9 and LR-negative of just 0.15, making it the cutoff for dilute urine samples. For concentrated urine samples, 6 WBC/HPF had an LR-positive of 10.1 and LR-negative of 0.17, making it the cutoff for those samples. Leukocyte esterase (LE) thresholds also were determined for dipstick testing, with investigators finding that any positive result on the dipstick was a strong indicator of UTI.
“The optimal diagnostic threshold for microscopic pyuria varies by urine concentration,” the authors concluded. “For young infants, urine concentration should be incorporated into the interpretation of uncentrifuged urine analyzed by automated microscopic urinalysis systems.”
There was no external funding for this study. Dr. Chaudhari and his coauthors did not report any relevant financial disclosures.
In this issue of Pediatrics, Chaudhari et al. share the results of a study of the impact of urine concentration on the optimal threshold in the new era of automated urinalysis. Centrifugation of urine specimens has long been standard laboratory practice, presumably performed to concentrate sediment and facilitate the detection of cellular elements and bacteria.
However, for the many sites that do not have machines for automated urinalyses (virtually all office practices, for example), the most important finding in this study may well be how well LE [leukocyte esterase] performs regardless of urine concentration. The optimal threshold for LE is not clear, however. The authors use “small” as their threshold for LE. At any threshold, can a negative urinalysis be relied on to exclude the diagnosis of UTI? A “positive” culture without inflammation evident in the urine is likely due to contamination, very early infection (rare), or asymptomatic bacteriuria (positive urine cultures in febrile children can still represent asymptomatic bacteriuria, because the fever may be due to a source other than the urinary tract).
If there are, in fact, some true UTIs without evidence of inflammation from the urinalysis, are they as harmful as those with “pyuria”?
Animal data demonstrate it is the inflammatory response, not the presence of organisms, that causes renal damage in the form of scarring. So the role of using evidence of inflammation in the urine to screen for who needs a culture seems justified on the basis not only of practicality at point of care and likelihood of UTI, but also sparing individuals at low to no risk of scarring from invasive urine collection. Moreover, using the urinalysis as a screen permits selecting individuals for antimicrobial treatment 24 hours sooner than if clinicians were to wait for culture results before treating. The urinalysis provides a practical window for clinicians to render prompt treatment. And Chaudhari et al. provide valuable assistance for interpreting the results of automated urinalyses.
Kenneth B. Roberts, MD , is a professor of therapeutic radiology at Yale University, New Haven, Conn. He did not report any relevant financial disclosures. These comments are excerpted from a commentary that accompanied Dr. Chaudhari and his associates’ study ( Pediatrics. 2016;138(5):e20162877 ).
In this issue of Pediatrics, Chaudhari et al. share the results of a study of the impact of urine concentration on the optimal threshold in the new era of automated urinalysis. Centrifugation of urine specimens has long been standard laboratory practice, presumably performed to concentrate sediment and facilitate the detection of cellular elements and bacteria.
However, for the many sites that do not have machines for automated urinalyses (virtually all office practices, for example), the most important finding in this study may well be how well LE [leukocyte esterase] performs regardless of urine concentration. The optimal threshold for LE is not clear, however. The authors use “small” as their threshold for LE. At any threshold, can a negative urinalysis be relied on to exclude the diagnosis of UTI? A “positive” culture without inflammation evident in the urine is likely due to contamination, very early infection (rare), or asymptomatic bacteriuria (positive urine cultures in febrile children can still represent asymptomatic bacteriuria, because the fever may be due to a source other than the urinary tract).
If there are, in fact, some true UTIs without evidence of inflammation from the urinalysis, are they as harmful as those with “pyuria”?
Animal data demonstrate it is the inflammatory response, not the presence of organisms, that causes renal damage in the form of scarring. So the role of using evidence of inflammation in the urine to screen for who needs a culture seems justified on the basis not only of practicality at point of care and likelihood of UTI, but also sparing individuals at low to no risk of scarring from invasive urine collection. Moreover, using the urinalysis as a screen permits selecting individuals for antimicrobial treatment 24 hours sooner than if clinicians were to wait for culture results before treating. The urinalysis provides a practical window for clinicians to render prompt treatment. And Chaudhari et al. provide valuable assistance for interpreting the results of automated urinalyses.
Kenneth B. Roberts, MD , is a professor of therapeutic radiology at Yale University, New Haven, Conn. He did not report any relevant financial disclosures. These comments are excerpted from a commentary that accompanied Dr. Chaudhari and his associates’ study ( Pediatrics. 2016;138(5):e20162877 ).
In this issue of Pediatrics, Chaudhari et al. share the results of a study of the impact of urine concentration on the optimal threshold in the new era of automated urinalysis. Centrifugation of urine specimens has long been standard laboratory practice, presumably performed to concentrate sediment and facilitate the detection of cellular elements and bacteria.
However, for the many sites that do not have machines for automated urinalyses (virtually all office practices, for example), the most important finding in this study may well be how well LE [leukocyte esterase] performs regardless of urine concentration. The optimal threshold for LE is not clear, however. The authors use “small” as their threshold for LE. At any threshold, can a negative urinalysis be relied on to exclude the diagnosis of UTI? A “positive” culture without inflammation evident in the urine is likely due to contamination, very early infection (rare), or asymptomatic bacteriuria (positive urine cultures in febrile children can still represent asymptomatic bacteriuria, because the fever may be due to a source other than the urinary tract).
If there are, in fact, some true UTIs without evidence of inflammation from the urinalysis, are they as harmful as those with “pyuria”?
Animal data demonstrate it is the inflammatory response, not the presence of organisms, that causes renal damage in the form of scarring. So the role of using evidence of inflammation in the urine to screen for who needs a culture seems justified on the basis not only of practicality at point of care and likelihood of UTI, but also sparing individuals at low to no risk of scarring from invasive urine collection. Moreover, using the urinalysis as a screen permits selecting individuals for antimicrobial treatment 24 hours sooner than if clinicians were to wait for culture results before treating. The urinalysis provides a practical window for clinicians to render prompt treatment. And Chaudhari et al. provide valuable assistance for interpreting the results of automated urinalyses.
Kenneth B. Roberts, MD , is a professor of therapeutic radiology at Yale University, New Haven, Conn. He did not report any relevant financial disclosures. These comments are excerpted from a commentary that accompanied Dr. Chaudhari and his associates’ study ( Pediatrics. 2016;138(5):e20162877 ).
Diagnosing urinary tract infections can be achieved by determining the white blood cell concentration of the patient’s urine, according to a new study.
“Previously recommended pyuria thresholds for the presumptive diagnosis of UTI in young infants were based on manual microscopy of centrifuged urine [but] test performance has not been studied in newer automated systems that analyze uncentrifuged urine,” wrote Pradip P. Chaudhari, MD, and his associates at Harvard University in Boston.
Of these 2,700 infants with a median age of 1.7 months, 211 (7.8%) had a urine culture come back positive for UTI. Likelihood ratio (LR) positive and negative were calculated to determine the microscopic pyuria thresholds at which UTIs became more likely in both dilute and concentrated urine. A white blood cell to high-power field (WBC/HPF) count of 3 yielded an LR-positive of 9.9 and LR-negative of just 0.15, making it the cutoff for dilute urine samples. For concentrated urine samples, 6 WBC/HPF had an LR-positive of 10.1 and LR-negative of 0.17, making it the cutoff for those samples. Leukocyte esterase (LE) thresholds also were determined for dipstick testing, with investigators finding that any positive result on the dipstick was a strong indicator of UTI.
“The optimal diagnostic threshold for microscopic pyuria varies by urine concentration,” the authors concluded. “For young infants, urine concentration should be incorporated into the interpretation of uncentrifuged urine analyzed by automated microscopic urinalysis systems.”
There was no external funding for this study. Dr. Chaudhari and his coauthors did not report any relevant financial disclosures.
Diagnosing urinary tract infections can be achieved by determining the white blood cell concentration of the patient’s urine, according to a new study.
“Previously recommended pyuria thresholds for the presumptive diagnosis of UTI in young infants were based on manual microscopy of centrifuged urine [but] test performance has not been studied in newer automated systems that analyze uncentrifuged urine,” wrote Pradip P. Chaudhari, MD, and his associates at Harvard University in Boston.
Of these 2,700 infants with a median age of 1.7 months, 211 (7.8%) had a urine culture come back positive for UTI. Likelihood ratio (LR) positive and negative were calculated to determine the microscopic pyuria thresholds at which UTIs became more likely in both dilute and concentrated urine. A white blood cell to high-power field (WBC/HPF) count of 3 yielded an LR-positive of 9.9 and LR-negative of just 0.15, making it the cutoff for dilute urine samples. For concentrated urine samples, 6 WBC/HPF had an LR-positive of 10.1 and LR-negative of 0.17, making it the cutoff for those samples. Leukocyte esterase (LE) thresholds also were determined for dipstick testing, with investigators finding that any positive result on the dipstick was a strong indicator of UTI.
“The optimal diagnostic threshold for microscopic pyuria varies by urine concentration,” the authors concluded. “For young infants, urine concentration should be incorporated into the interpretation of uncentrifuged urine analyzed by automated microscopic urinalysis systems.”
There was no external funding for this study. Dr. Chaudhari and his coauthors did not report any relevant financial disclosures.
FROM PEDIATRICS
Key clinical point:
Major finding: UTIs can be safely diagnosed if the patient has a pyuria threshold of at least 3 WBC/HPF in dilute urine and 6 WBC/HPF in concentrated urine.
Data source: Retrospective cross-sectional study of 2,700 infants younger than 3 months between May 2009 and December 2014.
Disclosures: No external funding for this study; authors did not report any relevant financial disclosures.
Dengue vaccine beneficial only in moderate to high transmission settings
Pediatric patients with previous natural exposure to dengue virus benefit from the dengue virus vaccine, while vaccination of seronegative patients leads to an increased risk for hospitalization because of dengue, according to the results of a mathematical model simulation.
Because of the first approved dengue vaccine’s highly variable efficacy rates among pediatric patients, the vaccine should only be used in moderate to high transmission settings, the investigators who designed the model concluded in a paper published in Science.

Dengvaxia, developed by Sanofi-Pasteur, is a recombinant chimeric live attenuated dengue virus vaccine based on a yellow fever vaccine backbone. The vaccine’s development was “considerably more challenging than for other Flavivirus infections because of the immunological interactions between the four dengue virus serotypes and the risk of immune-mediated enhancement of disease” which causes secondary infections to lead to more severe disease, Neil Ferguson, PhD, of the Imperial College of London and his associates wrote (Science. 2016 Sep 2;353:1033-6. doi: 10.1126/science.aaf9590).
Despite the complexity of the virus and vaccine, Dengvaxia was recently approved for use in six countries, and two large multicenter phase III clinical trials recently concluded. Investigators for the trials, which involved over 30,000 children in Southeast Asia and Latin America, reported an overall vaccine efficacy of about 60% in cases of symptomatic dengue disease. However, the vaccine’s efficacy varied by severity of dengue infection and by age and serotype of the patient at time of vaccination. Investigators for both trials reported higher efficacy in patients with severe infection and in patients who were seropositive for dengue virus (indicating previous exposure to the virus) at the time of vaccination. In addition, investigators for both trials reported lower vaccine efficacies in younger patients, a pattern “consistent with reduced efficacy in individuals who have not lived long enough to experience a natural infection,” the authors noted.
In an effort to provide guidance for future clinical trials and to predict the impact of wide-scale use of Dengvaxia, investigators developed a mathematical model of dengue transmission based on data from the two trials.
The model confirmed that secondary infections were nearly twice as likely to cause symptomatic infection, compared with primary and postsecondary infections.
In a highly important result, the model simulation showed that seropositive recipients always gained a substantial benefit – more than a 90% reduction in the risk of hospitalization because of dengue – from vaccination. However, among seronegative recipients, the vaccine initially induced near-perfect protection, but this protection rapidly decayed (mean duration, 7 months). Moreover, the model showed that seronegative recipients who received the vaccine were at an increased risk for hospitalization with dengue.
“This is true both in the short term and in the long term and raises fundamental issues about individual versus population benefits of vaccination,” investigators wrote. “Individual serological testing, if feasible, might radically improve the benefit-risk trade-off.”
The model also demonstrated that the optimal age for vaccination depends on the transmission intensity rate in a region where a child lives. In high-transmission settings, the optimal age to target for vaccination can be 9 years or younger, and as intensity of transmission decreases, optimal age of vaccination should increase, according to investigators.
The study was funded by the UK Medical Research Council, the UK National Institute of Health Research, the National Institutes of Health, and the Bill and Melinda Gates Foundation. Authors did not report any relevant disclosures.
jcraig@frontlinemedcom.com
On Twitter @jessnicolecraig
Pediatric patients with previous natural exposure to dengue virus benefit from the dengue virus vaccine, while vaccination of seronegative patients leads to an increased risk for hospitalization because of dengue, according to the results of a mathematical model simulation.
Because of the first approved dengue vaccine’s highly variable efficacy rates among pediatric patients, the vaccine should only be used in moderate to high transmission settings, the investigators who designed the model concluded in a paper published in Science.
Dengvaxia, developed by Sanofi-Pasteur, is a recombinant chimeric live attenuated dengue virus vaccine based on a yellow fever vaccine backbone. The vaccine’s development was “considerably more challenging than for other Flavivirus infections because of the immunological interactions between the four dengue virus serotypes and the risk of immune-mediated enhancement of disease” which causes secondary infections to lead to more severe disease, Neil Ferguson, PhD, of the Imperial College of London and his associates wrote (Science. 2016 Sep 2;353:1033-6. doi: 10.1126/science.aaf9590).
Despite the complexity of the virus and vaccine, Dengvaxia was recently approved for use in six countries, and two large multicenter phase III clinical trials recently concluded. Investigators for the trials, which involved over 30,000 children in Southeast Asia and Latin America, reported an overall vaccine efficacy of about 60% in cases of symptomatic dengue disease. However, the vaccine’s efficacy varied by severity of dengue infection and by age and serotype of the patient at time of vaccination. Investigators for both trials reported higher efficacy in patients with severe infection and in patients who were seropositive for dengue virus (indicating previous exposure to the virus) at the time of vaccination. In addition, investigators for both trials reported lower vaccine efficacies in younger patients, a pattern “consistent with reduced efficacy in individuals who have not lived long enough to experience a natural infection,” the authors noted.
In an effort to provide guidance for future clinical trials and to predict the impact of wide-scale use of Dengvaxia, investigators developed a mathematical model of dengue transmission based on data from the two trials.
The model confirmed that secondary infections were nearly twice as likely to cause symptomatic infection, compared with primary and postsecondary infections.
In a highly important result, the model simulation showed that seropositive recipients always gained a substantial benefit – more than a 90% reduction in the risk of hospitalization because of dengue – from vaccination. However, among seronegative recipients, the vaccine initially induced near-perfect protection, but this protection rapidly decayed (mean duration, 7 months). Moreover, the model showed that seronegative recipients who received the vaccine were at an increased risk for hospitalization with dengue.
“This is true both in the short term and in the long term and raises fundamental issues about individual versus population benefits of vaccination,” investigators wrote. “Individual serological testing, if feasible, might radically improve the benefit-risk trade-off.”
The model also demonstrated that the optimal age for vaccination depends on the transmission intensity rate in a region where a child lives. In high-transmission settings, the optimal age to target for vaccination can be 9 years or younger, and as intensity of transmission decreases, optimal age of vaccination should increase, according to investigators.
The study was funded by the UK Medical Research Council, the UK National Institute of Health Research, the National Institutes of Health, and the Bill and Melinda Gates Foundation. Authors did not report any relevant disclosures.
jcraig@frontlinemedcom.com
On Twitter @jessnicolecraig
Pediatric patients with previous natural exposure to dengue virus benefit from the dengue virus vaccine, while vaccination of seronegative patients leads to an increased risk for hospitalization because of dengue, according to the results of a mathematical model simulation.
Because of the first approved dengue vaccine’s highly variable efficacy rates among pediatric patients, the vaccine should only be used in moderate to high transmission settings, the investigators who designed the model concluded in a paper published in Science.
Dengvaxia, developed by Sanofi-Pasteur, is a recombinant chimeric live attenuated dengue virus vaccine based on a yellow fever vaccine backbone. The vaccine’s development was “considerably more challenging than for other Flavivirus infections because of the immunological interactions between the four dengue virus serotypes and the risk of immune-mediated enhancement of disease” which causes secondary infections to lead to more severe disease, Neil Ferguson, PhD, of the Imperial College of London and his associates wrote (Science. 2016 Sep 2;353:1033-6. doi: 10.1126/science.aaf9590).
Despite the complexity of the virus and vaccine, Dengvaxia was recently approved for use in six countries, and two large multicenter phase III clinical trials recently concluded. Investigators for the trials, which involved over 30,000 children in Southeast Asia and Latin America, reported an overall vaccine efficacy of about 60% in cases of symptomatic dengue disease. However, the vaccine’s efficacy varied by severity of dengue infection and by age and serotype of the patient at time of vaccination. Investigators for both trials reported higher efficacy in patients with severe infection and in patients who were seropositive for dengue virus (indicating previous exposure to the virus) at the time of vaccination. In addition, investigators for both trials reported lower vaccine efficacies in younger patients, a pattern “consistent with reduced efficacy in individuals who have not lived long enough to experience a natural infection,” the authors noted.
In an effort to provide guidance for future clinical trials and to predict the impact of wide-scale use of Dengvaxia, investigators developed a mathematical model of dengue transmission based on data from the two trials.
The model confirmed that secondary infections were nearly twice as likely to cause symptomatic infection, compared with primary and postsecondary infections.
In a highly important result, the model simulation showed that seropositive recipients always gained a substantial benefit – more than a 90% reduction in the risk of hospitalization because of dengue – from vaccination. However, among seronegative recipients, the vaccine initially induced near-perfect protection, but this protection rapidly decayed (mean duration, 7 months). Moreover, the model showed that seronegative recipients who received the vaccine were at an increased risk for hospitalization with dengue.
“This is true both in the short term and in the long term and raises fundamental issues about individual versus population benefits of vaccination,” investigators wrote. “Individual serological testing, if feasible, might radically improve the benefit-risk trade-off.”
The model also demonstrated that the optimal age for vaccination depends on the transmission intensity rate in a region where a child lives. In high-transmission settings, the optimal age to target for vaccination can be 9 years or younger, and as intensity of transmission decreases, optimal age of vaccination should increase, according to investigators.
The study was funded by the UK Medical Research Council, the UK National Institute of Health Research, the National Institutes of Health, and the Bill and Melinda Gates Foundation. Authors did not report any relevant disclosures.
jcraig@frontlinemedcom.com
On Twitter @jessnicolecraig
FROM SCIENCE
Key clinical point:
Major finding: Vaccine should only be used in moderate to high transmission settings. In high-transmission settings, the optimal age to target for vaccination is 9 years or younger.
Data source: Mathematical model simulation based on two large, multicenter, phase III clinical trials.
Disclosures: This study was funded by the UK Medical Research Council, the UK National Institute of Health Research, the National Institutes of Health, and the Bill and Melinda Gates Foundation. Authors did not report any relevant disclosures.
CD64 validated as biomarker for pediatric Crohn’s disease
MONTREAL – Blood levels of a neutrophil receptor protein, CD64, proved to be a reliable, noninvasive marker of both Crohn’s disease activity and the risk for relapse from remission in children and adolescents in a pair of single-center studies with a total of 140 patients.
An elevation in blood levels of CD64, a marker for inflammation, in asymptomatic patients with Crohn’s disease “is a significant risk factor for treatment failure or complications during infliximab maintenance,” Phillip Minar, MD, said at the World Congress of Pediatric Gastroenterology, Hepatology and Nutrition. Although Dr. Minar acknowledged that larger validation studies are still needed, neutrophil CD64 levels can potentially serve as a “treat-to-target” biomarker of disease status in selected pediatric Crohn’s disease patients.
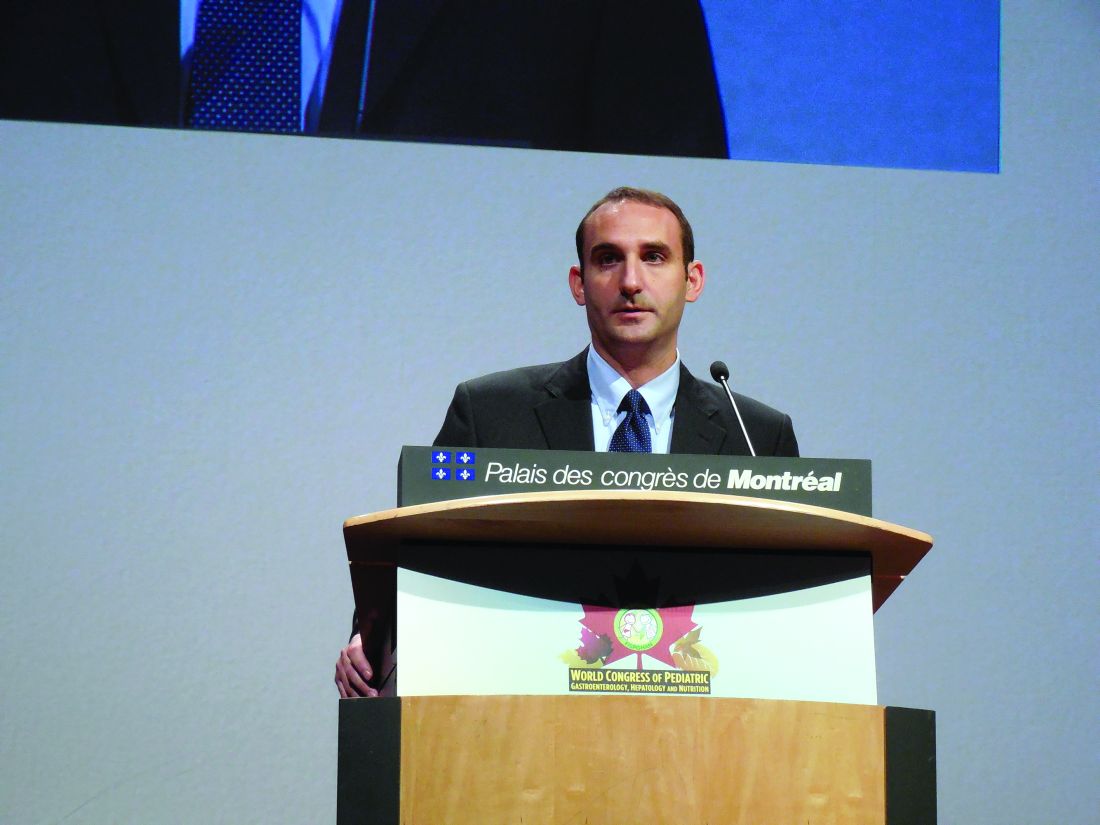
Dr. Minar cautioned that in some pediatric patients with Crohn’s disease CD64 is not an effective marker for inflammation and a change in their Crohn’s disease status. In his study, the sensitivity of an elevated CD64 level was 64% as a surrogate marker for mucosal damage seen with endoscopy.
“I get a CD64 level at the time we diagnose Crohn’s disease. If it is elevated, then I will follow it; if it is not elevated, then I won’t use it for that patient. It’s patient specific,” he explained in an interview.
Dr. Minar and his associates first established the prognostic value of elevated CD64 levels in patients with Crohn’s disease in a study with 208 pediatric patients with inflammatory bowel disease and 43 controls (Inflam Bowel Dis. 2014, Jun;20[6]:1037-48). His new validation study included 105 pediatric patients with Crohn’s disease, of whom 54 were newly diagnosed. Among the 51 previously diagnosed patients, 18 had inactive disease. The patients averaged 14 years old, and all 105 underwent endoscopy to directly examine their Crohn’s disease activity.
The results showed clear and statistically significant correlations among the average CD64 levels in the patients and the blinded endoscopic evaluations that categorized the patients as having inactive Crohn’s disease, mild disease, or moderate to severe disease. The results also suggested that a useful dichotomous cut point for CD64 was an index of 1. Among patients with a level above 1, diagnostic sensitivity for mucosal damage was 64% and specificity was 100%, he reported. In these studies as well as their routine practice, Dr. Minar and his associates use a commercially available immunoassay for quantifying blood levels of CD64.
The second study he reported on assessed the ability of CD64 levels to predict a patient’s status on infliximab (Remicade) maintenance treatment. This study enrolled 35 pediatric patients, who averaged about 15 years old, had been diagnosed with Crohn’s disease for an average of about 2 years and were in remission after having received at least four serial infliximab doses. During 1 year of follow-up, 15 patients relapsed and 21 remained in remission.
The researchers measured CD64 levels at baseline and found that, during the next year, those who had a CD64 index of less than 1 at baseline had a relapse rate of less than 40% during follow-up, while those with a CD64 index of 1 or greater at baseline had a relapse rate of more than 70% during follow-up, a statistically significant difference between the two subgroups. The analysis also showed that lower CD64 levels linked with higher trough levels of infliximab.
A multivariate analysis showed that a CD64 index level of 1 or greater at baseline linked with a statistically significant, 4.5-fold increased risk for relapse, compared with patients with a baseline CD64 level below 1. This analysis identified three additional significant correlates of an elevated risk for relapse: nonwhite race, a baseline serum albumin level of less than 3.9 g/dL, and a baseline infliximab serum level of less than 5 mcg/mL.
The CD64 test that his group has been using typically has a work week turnaround time of about an hour, and costs less than $100 per test per patient. Blood levels of CD64 are stable for 48 hours in the refrigerator, so specimens can sit over a weekend without compromising results. The Cincinnati group is planning to soon change to an in-house test that will cost about $10-$20 per test per patient, Dr. Minar said.
Dr. Minar had no relevant financial disclosures.
mzoler@frontlinemedcom.com
On Twitter @mitchelzoler
We are in desperate need of more reliable biomarkers of disease activity in patients with Crohn’s disease. Identifying effective noninvasive biomarkers has been a holy grail that we have pursued for many years because what we currently have is imperfect. CD64 appears to be a very reliable and specific biomarker of disease activity.

I think pediatric gastroenterologists will pay attention to Dr. Minar’s report. The entire community is very interested in this and will be watching the evolution of the science behind CD64 assessment.
John A. Barnard, MD , is chief of pediatrics at Nationwide Children’s Hospital and professor and chairman of pediatrics at Ohio State University, both in Columbus. He had no relevant disclosures. He made these comments in an interview.
We are in desperate need of more reliable biomarkers of disease activity in patients with Crohn’s disease. Identifying effective noninvasive biomarkers has been a holy grail that we have pursued for many years because what we currently have is imperfect. CD64 appears to be a very reliable and specific biomarker of disease activity.
I think pediatric gastroenterologists will pay attention to Dr. Minar’s report. The entire community is very interested in this and will be watching the evolution of the science behind CD64 assessment.
John A. Barnard, MD , is chief of pediatrics at Nationwide Children’s Hospital and professor and chairman of pediatrics at Ohio State University, both in Columbus. He had no relevant disclosures. He made these comments in an interview.
We are in desperate need of more reliable biomarkers of disease activity in patients with Crohn’s disease. Identifying effective noninvasive biomarkers has been a holy grail that we have pursued for many years because what we currently have is imperfect. CD64 appears to be a very reliable and specific biomarker of disease activity.
I think pediatric gastroenterologists will pay attention to Dr. Minar’s report. The entire community is very interested in this and will be watching the evolution of the science behind CD64 assessment.
John A. Barnard, MD , is chief of pediatrics at Nationwide Children’s Hospital and professor and chairman of pediatrics at Ohio State University, both in Columbus. He had no relevant disclosures. He made these comments in an interview.
MONTREAL – Blood levels of a neutrophil receptor protein, CD64, proved to be a reliable, noninvasive marker of both Crohn’s disease activity and the risk for relapse from remission in children and adolescents in a pair of single-center studies with a total of 140 patients.
An elevation in blood levels of CD64, a marker for inflammation, in asymptomatic patients with Crohn’s disease “is a significant risk factor for treatment failure or complications during infliximab maintenance,” Phillip Minar, MD, said at the World Congress of Pediatric Gastroenterology, Hepatology and Nutrition. Although Dr. Minar acknowledged that larger validation studies are still needed, neutrophil CD64 levels can potentially serve as a “treat-to-target” biomarker of disease status in selected pediatric Crohn’s disease patients.
Dr. Minar cautioned that in some pediatric patients with Crohn’s disease CD64 is not an effective marker for inflammation and a change in their Crohn’s disease status. In his study, the sensitivity of an elevated CD64 level was 64% as a surrogate marker for mucosal damage seen with endoscopy.
“I get a CD64 level at the time we diagnose Crohn’s disease. If it is elevated, then I will follow it; if it is not elevated, then I won’t use it for that patient. It’s patient specific,” he explained in an interview.
Dr. Minar and his associates first established the prognostic value of elevated CD64 levels in patients with Crohn’s disease in a study with 208 pediatric patients with inflammatory bowel disease and 43 controls (Inflam Bowel Dis. 2014, Jun;20[6]:1037-48). His new validation study included 105 pediatric patients with Crohn’s disease, of whom 54 were newly diagnosed. Among the 51 previously diagnosed patients, 18 had inactive disease. The patients averaged 14 years old, and all 105 underwent endoscopy to directly examine their Crohn’s disease activity.
The results showed clear and statistically significant correlations among the average CD64 levels in the patients and the blinded endoscopic evaluations that categorized the patients as having inactive Crohn’s disease, mild disease, or moderate to severe disease. The results also suggested that a useful dichotomous cut point for CD64 was an index of 1. Among patients with a level above 1, diagnostic sensitivity for mucosal damage was 64% and specificity was 100%, he reported. In these studies as well as their routine practice, Dr. Minar and his associates use a commercially available immunoassay for quantifying blood levels of CD64.
The second study he reported on assessed the ability of CD64 levels to predict a patient’s status on infliximab (Remicade) maintenance treatment. This study enrolled 35 pediatric patients, who averaged about 15 years old, had been diagnosed with Crohn’s disease for an average of about 2 years and were in remission after having received at least four serial infliximab doses. During 1 year of follow-up, 15 patients relapsed and 21 remained in remission.
The researchers measured CD64 levels at baseline and found that, during the next year, those who had a CD64 index of less than 1 at baseline had a relapse rate of less than 40% during follow-up, while those with a CD64 index of 1 or greater at baseline had a relapse rate of more than 70% during follow-up, a statistically significant difference between the two subgroups. The analysis also showed that lower CD64 levels linked with higher trough levels of infliximab.
A multivariate analysis showed that a CD64 index level of 1 or greater at baseline linked with a statistically significant, 4.5-fold increased risk for relapse, compared with patients with a baseline CD64 level below 1. This analysis identified three additional significant correlates of an elevated risk for relapse: nonwhite race, a baseline serum albumin level of less than 3.9 g/dL, and a baseline infliximab serum level of less than 5 mcg/mL.
The CD64 test that his group has been using typically has a work week turnaround time of about an hour, and costs less than $100 per test per patient. Blood levels of CD64 are stable for 48 hours in the refrigerator, so specimens can sit over a weekend without compromising results. The Cincinnati group is planning to soon change to an in-house test that will cost about $10-$20 per test per patient, Dr. Minar said.
Dr. Minar had no relevant financial disclosures.
mzoler@frontlinemedcom.com
On Twitter @mitchelzoler
MONTREAL – Blood levels of a neutrophil receptor protein, CD64, proved to be a reliable, noninvasive marker of both Crohn’s disease activity and the risk for relapse from remission in children and adolescents in a pair of single-center studies with a total of 140 patients.
An elevation in blood levels of CD64, a marker for inflammation, in asymptomatic patients with Crohn’s disease “is a significant risk factor for treatment failure or complications during infliximab maintenance,” Phillip Minar, MD, said at the World Congress of Pediatric Gastroenterology, Hepatology and Nutrition. Although Dr. Minar acknowledged that larger validation studies are still needed, neutrophil CD64 levels can potentially serve as a “treat-to-target” biomarker of disease status in selected pediatric Crohn’s disease patients.
Dr. Minar cautioned that in some pediatric patients with Crohn’s disease CD64 is not an effective marker for inflammation and a change in their Crohn’s disease status. In his study, the sensitivity of an elevated CD64 level was 64% as a surrogate marker for mucosal damage seen with endoscopy.
“I get a CD64 level at the time we diagnose Crohn’s disease. If it is elevated, then I will follow it; if it is not elevated, then I won’t use it for that patient. It’s patient specific,” he explained in an interview.
Dr. Minar and his associates first established the prognostic value of elevated CD64 levels in patients with Crohn’s disease in a study with 208 pediatric patients with inflammatory bowel disease and 43 controls (Inflam Bowel Dis. 2014, Jun;20[6]:1037-48). His new validation study included 105 pediatric patients with Crohn’s disease, of whom 54 were newly diagnosed. Among the 51 previously diagnosed patients, 18 had inactive disease. The patients averaged 14 years old, and all 105 underwent endoscopy to directly examine their Crohn’s disease activity.
The results showed clear and statistically significant correlations among the average CD64 levels in the patients and the blinded endoscopic evaluations that categorized the patients as having inactive Crohn’s disease, mild disease, or moderate to severe disease. The results also suggested that a useful dichotomous cut point for CD64 was an index of 1. Among patients with a level above 1, diagnostic sensitivity for mucosal damage was 64% and specificity was 100%, he reported. In these studies as well as their routine practice, Dr. Minar and his associates use a commercially available immunoassay for quantifying blood levels of CD64.
The second study he reported on assessed the ability of CD64 levels to predict a patient’s status on infliximab (Remicade) maintenance treatment. This study enrolled 35 pediatric patients, who averaged about 15 years old, had been diagnosed with Crohn’s disease for an average of about 2 years and were in remission after having received at least four serial infliximab doses. During 1 year of follow-up, 15 patients relapsed and 21 remained in remission.
The researchers measured CD64 levels at baseline and found that, during the next year, those who had a CD64 index of less than 1 at baseline had a relapse rate of less than 40% during follow-up, while those with a CD64 index of 1 or greater at baseline had a relapse rate of more than 70% during follow-up, a statistically significant difference between the two subgroups. The analysis also showed that lower CD64 levels linked with higher trough levels of infliximab.
A multivariate analysis showed that a CD64 index level of 1 or greater at baseline linked with a statistically significant, 4.5-fold increased risk for relapse, compared with patients with a baseline CD64 level below 1. This analysis identified three additional significant correlates of an elevated risk for relapse: nonwhite race, a baseline serum albumin level of less than 3.9 g/dL, and a baseline infliximab serum level of less than 5 mcg/mL.
The CD64 test that his group has been using typically has a work week turnaround time of about an hour, and costs less than $100 per test per patient. Blood levels of CD64 are stable for 48 hours in the refrigerator, so specimens can sit over a weekend without compromising results. The Cincinnati group is planning to soon change to an in-house test that will cost about $10-$20 per test per patient, Dr. Minar said.
Dr. Minar had no relevant financial disclosures.
mzoler@frontlinemedcom.com
On Twitter @mitchelzoler
AT WCPGHAN 2016
Key clinical point: Results from two studies further validated neutrophil CD64 as a highly specific biomarker for Crohn’s disease severity in children and adolescents and suggested that CD64 could serve as a treat-to-target guide for infliximab treatment.
Major finding: During infliximab maintenance, relapses occurred in fewer than 40% of pediatric Crohn’s disease patients with low CD64 and in more than 70% with high CD64.
Data source: A single-center study of 105 pediatric patients with Crohn’s disease to assess disease severity correlates, and 35 patients in remission on infliximab to assess predicted efficacy.
Disclosures: Dr. Minar had no relevant financial disclosures.
Psychiatric patients face inordinately long wait times in emergency departments
Individuals with psychiatric conditions are facing increasingly longer wait times in emergency departments across the country, including children, according to a pair of studies presented by the American College of Emergency Physicians.
“I really started doing this research because of my clinical experience,” explained Suzanne Catherine Lippert, MD, of Stanford (Calif.) University and the lead author of both studies during an Oct. 17 conference call, saying that seeing patients sit in the ED for days prompted her to finally look into this issue.
Patients with bipolar disorder had the highest likelihood of waiting more than 24 hours in the ED, with an odds ratio of 3.7 (95% confidence interval, 1.5-9.4). This was followed by patients with a diagnosis of psychosis, a dual diagnosis of psychiatric disorders, multiple psychiatric diagnoses, or depression. The most common diagnoses were substance abuse, anxiety, and depression, which constituted 41%, 26%, and 23% of the diagnoses, respectively. Patients with psychosis were admitted 34% of the time and transferred 24% of the time; those who self-harmed were admitted 33% of the time and transferred 29% of the time; and patients with bipolar disorder were admitted 29% of the time and transferred 40% of the time. Patients who had either two or three diagnoses were admitted 9% and 10% of the time, respectively.
“Further investigation of the systems affecting these patients, including placement of involuntary holds, availability of ED psychiatric consultants, or outpatient resources would delineate potential intervention points for the care of these vulnerable patients,” Dr. Lippert and her coauthors wrote.
The second study looked at the differences in waiting for care at EDs between psychiatric patients and medical patients. Length of stay was defined the same way it was in the previous study, with disposition meaning either “discharge, admission to medical or psychiatric bed, [or] transfer to any acute facility.” Length of stay was divided into the same three categories as the previous study, too.
Psychiatric patients were more likely than were medical patients to wait more than 6 hours for disposition, regardless of what the disposition itself ended up being, by a rate of 23% vs. 10%. Similarly, 7% of psychiatric patients vs. just 2.3% of medical patients had to wait longer than 12 hours in the ED, while 1.3% of psychiatric had to wait longer than 24 hours, compared with only 0.5% of medical patients. The average length of stay was significantly longer for psychiatric patients: 194 minutes vs. 138 minutes for medical patients (P less than .01).
Additionally, psychiatric patients were more likely to be uninsured, with 22% not having insurance, compared with 15% of medical patients being uninsured. Furthermore, 4.6% of the psychiatric patients’ previous visit to the ED had been within the prior 72 hours, compared with 3.6% of medical patients. A total of 21% of psychiatric patients required admittance, compared with 13% of medical patients, while 11% of psychiatric patients were transferred, compared with just 1.4% of medical patients.
“These results compel us to further investigate the potential causes of prolonged length of stay in psychiatric patients and to further characterize the population of psychiatric patients most at risk of prolonged stays,” Dr. Lippert and her coinvestigators concluded.
ACEP President Rebecca B. Parker, MD, chimed in during the conference call, explaining that a survey of more than 1,700 emergency physicians revealed some “troubling” findings about the state of emergency departments over the last year.
The nation’s dwindling mental health resources are having a direct impact on patients having psychiatric emergencies, including children,” Dr. Parker explained. “These patients are waiting longer for care, especially those patients who require hospitalization.”
Findings of the survey indicate that 48% of ED physicians witness psychiatric patients being “boarded” in their EDs at least once a day while they wait for a bed. Additionally, less than 17% of respondents said their ED has a psychiatrist on call to respond to psychiatric emergencies, with 11.7% responding that they have no psychiatrist on call to deal with such emergencies. And 52% of respondents said the mental health system in their community has gotten noticeably worse in just the last year.
In a separate statement, Dr. Parker voiced outrage about the situation. “Psychiatric patients wait in the emergency department for hours and even days for a bed, which delays the psychiatric care they so desperately need,” she said. “It also leads to delays in care and diminished resources for other emergency patients. The emergency department has become the dumping ground for these vulnerable patients who have been abandoned by every other part of the health care system.”
ACEP presented the findings during its annual meeting in Las Vegas. No funding sources for these studies were disclosed; Dr. Lippert did not report any financial disclosures.
Individuals with psychiatric conditions are facing increasingly longer wait times in emergency departments across the country, including children, according to a pair of studies presented by the American College of Emergency Physicians.
“I really started doing this research because of my clinical experience,” explained Suzanne Catherine Lippert, MD, of Stanford (Calif.) University and the lead author of both studies during an Oct. 17 conference call, saying that seeing patients sit in the ED for days prompted her to finally look into this issue.
Patients with bipolar disorder had the highest likelihood of waiting more than 24 hours in the ED, with an odds ratio of 3.7 (95% confidence interval, 1.5-9.4). This was followed by patients with a diagnosis of psychosis, a dual diagnosis of psychiatric disorders, multiple psychiatric diagnoses, or depression. The most common diagnoses were substance abuse, anxiety, and depression, which constituted 41%, 26%, and 23% of the diagnoses, respectively. Patients with psychosis were admitted 34% of the time and transferred 24% of the time; those who self-harmed were admitted 33% of the time and transferred 29% of the time; and patients with bipolar disorder were admitted 29% of the time and transferred 40% of the time. Patients who had either two or three diagnoses were admitted 9% and 10% of the time, respectively.
“Further investigation of the systems affecting these patients, including placement of involuntary holds, availability of ED psychiatric consultants, or outpatient resources would delineate potential intervention points for the care of these vulnerable patients,” Dr. Lippert and her coauthors wrote.
The second study looked at the differences in waiting for care at EDs between psychiatric patients and medical patients. Length of stay was defined the same way it was in the previous study, with disposition meaning either “discharge, admission to medical or psychiatric bed, [or] transfer to any acute facility.” Length of stay was divided into the same three categories as the previous study, too.
Psychiatric patients were more likely than were medical patients to wait more than 6 hours for disposition, regardless of what the disposition itself ended up being, by a rate of 23% vs. 10%. Similarly, 7% of psychiatric patients vs. just 2.3% of medical patients had to wait longer than 12 hours in the ED, while 1.3% of psychiatric had to wait longer than 24 hours, compared with only 0.5% of medical patients. The average length of stay was significantly longer for psychiatric patients: 194 minutes vs. 138 minutes for medical patients (P less than .01).
Additionally, psychiatric patients were more likely to be uninsured, with 22% not having insurance, compared with 15% of medical patients being uninsured. Furthermore, 4.6% of the psychiatric patients’ previous visit to the ED had been within the prior 72 hours, compared with 3.6% of medical patients. A total of 21% of psychiatric patients required admittance, compared with 13% of medical patients, while 11% of psychiatric patients were transferred, compared with just 1.4% of medical patients.
“These results compel us to further investigate the potential causes of prolonged length of stay in psychiatric patients and to further characterize the population of psychiatric patients most at risk of prolonged stays,” Dr. Lippert and her coinvestigators concluded.
ACEP President Rebecca B. Parker, MD, chimed in during the conference call, explaining that a survey of more than 1,700 emergency physicians revealed some “troubling” findings about the state of emergency departments over the last year.
The nation’s dwindling mental health resources are having a direct impact on patients having psychiatric emergencies, including children,” Dr. Parker explained. “These patients are waiting longer for care, especially those patients who require hospitalization.”
Findings of the survey indicate that 48% of ED physicians witness psychiatric patients being “boarded” in their EDs at least once a day while they wait for a bed. Additionally, less than 17% of respondents said their ED has a psychiatrist on call to respond to psychiatric emergencies, with 11.7% responding that they have no psychiatrist on call to deal with such emergencies. And 52% of respondents said the mental health system in their community has gotten noticeably worse in just the last year.
In a separate statement, Dr. Parker voiced outrage about the situation. “Psychiatric patients wait in the emergency department for hours and even days for a bed, which delays the psychiatric care they so desperately need,” she said. “It also leads to delays in care and diminished resources for other emergency patients. The emergency department has become the dumping ground for these vulnerable patients who have been abandoned by every other part of the health care system.”
ACEP presented the findings during its annual meeting in Las Vegas. No funding sources for these studies were disclosed; Dr. Lippert did not report any financial disclosures.
Individuals with psychiatric conditions are facing increasingly longer wait times in emergency departments across the country, including children, according to a pair of studies presented by the American College of Emergency Physicians.
“I really started doing this research because of my clinical experience,” explained Suzanne Catherine Lippert, MD, of Stanford (Calif.) University and the lead author of both studies during an Oct. 17 conference call, saying that seeing patients sit in the ED for days prompted her to finally look into this issue.
Patients with bipolar disorder had the highest likelihood of waiting more than 24 hours in the ED, with an odds ratio of 3.7 (95% confidence interval, 1.5-9.4). This was followed by patients with a diagnosis of psychosis, a dual diagnosis of psychiatric disorders, multiple psychiatric diagnoses, or depression. The most common diagnoses were substance abuse, anxiety, and depression, which constituted 41%, 26%, and 23% of the diagnoses, respectively. Patients with psychosis were admitted 34% of the time and transferred 24% of the time; those who self-harmed were admitted 33% of the time and transferred 29% of the time; and patients with bipolar disorder were admitted 29% of the time and transferred 40% of the time. Patients who had either two or three diagnoses were admitted 9% and 10% of the time, respectively.
“Further investigation of the systems affecting these patients, including placement of involuntary holds, availability of ED psychiatric consultants, or outpatient resources would delineate potential intervention points for the care of these vulnerable patients,” Dr. Lippert and her coauthors wrote.
The second study looked at the differences in waiting for care at EDs between psychiatric patients and medical patients. Length of stay was defined the same way it was in the previous study, with disposition meaning either “discharge, admission to medical or psychiatric bed, [or] transfer to any acute facility.” Length of stay was divided into the same three categories as the previous study, too.
Psychiatric patients were more likely than were medical patients to wait more than 6 hours for disposition, regardless of what the disposition itself ended up being, by a rate of 23% vs. 10%. Similarly, 7% of psychiatric patients vs. just 2.3% of medical patients had to wait longer than 12 hours in the ED, while 1.3% of psychiatric had to wait longer than 24 hours, compared with only 0.5% of medical patients. The average length of stay was significantly longer for psychiatric patients: 194 minutes vs. 138 minutes for medical patients (P less than .01).
Additionally, psychiatric patients were more likely to be uninsured, with 22% not having insurance, compared with 15% of medical patients being uninsured. Furthermore, 4.6% of the psychiatric patients’ previous visit to the ED had been within the prior 72 hours, compared with 3.6% of medical patients. A total of 21% of psychiatric patients required admittance, compared with 13% of medical patients, while 11% of psychiatric patients were transferred, compared with just 1.4% of medical patients.
“These results compel us to further investigate the potential causes of prolonged length of stay in psychiatric patients and to further characterize the population of psychiatric patients most at risk of prolonged stays,” Dr. Lippert and her coinvestigators concluded.
ACEP President Rebecca B. Parker, MD, chimed in during the conference call, explaining that a survey of more than 1,700 emergency physicians revealed some “troubling” findings about the state of emergency departments over the last year.
The nation’s dwindling mental health resources are having a direct impact on patients having psychiatric emergencies, including children,” Dr. Parker explained. “These patients are waiting longer for care, especially those patients who require hospitalization.”
Findings of the survey indicate that 48% of ED physicians witness psychiatric patients being “boarded” in their EDs at least once a day while they wait for a bed. Additionally, less than 17% of respondents said their ED has a psychiatrist on call to respond to psychiatric emergencies, with 11.7% responding that they have no psychiatrist on call to deal with such emergencies. And 52% of respondents said the mental health system in their community has gotten noticeably worse in just the last year.
In a separate statement, Dr. Parker voiced outrage about the situation. “Psychiatric patients wait in the emergency department for hours and even days for a bed, which delays the psychiatric care they so desperately need,” she said. “It also leads to delays in care and diminished resources for other emergency patients. The emergency department has become the dumping ground for these vulnerable patients who have been abandoned by every other part of the health care system.”
ACEP presented the findings during its annual meeting in Las Vegas. No funding sources for these studies were disclosed; Dr. Lippert did not report any financial disclosures.
FROM AN ACEP TELECONFERENCE
Key clinical point:
Major finding: Higher percentages of psychiatric patients have to wait more than a day before disposition, compared with medical patients.
Data source: Two retrospective reviews of more than 65 million ED visits in the NHAMCS database from 2001-2011.
Disclosures: No funding sources or disclosures were reported.