User login
A Multi-Membership Approach for Attributing Patient-Level Outcomes to Providers in an Inpatient Setting
From Banner Health Corporation, Phoenix, AZ.
Background: Health care providers are routinely incentivized with pay-for-performance (P4P) metrics to increase the quality of care. In an inpatient setting, P4P models typically measure quality by attributing each patient’s outcome to a single provider even though many providers routinely care for the patient. This study investigates a new attribution approach aiming to distribute each outcome across all providers who provided care.
Methods: The methodology relies on a multi-membership model and is demonstrated in the Banner Health system using 3 clinical outcome measures (length of stay, 30-day readmissions, and mortality) and responses to 3 survey questions that measure a patient’s perception of their care. The new approach is compared to the “standard” method, which attributes each patient to only 1 provider.
Results: When ranking by clinical outcomes, both methods were concordant 72.1% to 82.1% of the time for top-half/bottom-half rankings, with a median percentile difference between 7 and 15. When ranking by survey scores, there was more agreement, with concordance between 84.1% and 86.6% and a median percentile difference between 11 and 13. Last, Pearson correlation coefficients of the paired percentiles ranged from 0.56 to 0.78.
Conclusion: The new approach provides a fairer solution when measuring provider performance.
Keywords: patient attribution; PAMM; PAPR; random effect model; pay for performance.
Providers practicing in hospitals are routinely evaluated based on their performance and, in many cases, are financially incentivized for a better-than-average performance within a pay-for-performance (P4P) model. The use of P4P models is based on the belief that they will “improve, motivate, and enhance providers to pursue aggressively and ultimately achieve the quality performance targets thus decreasing the number of medical errors with less malpractice events.”1 Although P4P models continue to be a movement in health care, they have been challenging to implement.
One concern involves the general quality of implementation, such as defining metrics and targets, setting payout amounts, managing technology and market conditions, and gauging the level of transparency to the provider.2 Another challenge, and the focus of this project, are concerns around measuring performance to avoid perceptions of unfairness. This concern can be minimized if the attribution is handled in a fairer way, by spreading it across all providers who affected the outcome, both in a positive or negative direction.3
To implement these models, the performance of providers needs to be measured and tracked periodically. This requires linking, or attributing, a patient’s outcome to a provider, which is almost always the attending or discharging provider (ie, a single provider).3 In this single-provider attribution approach, one provider will receive all the credit (good or bad) for their respective patients’ outcomes, even though the provider may have seen the patient only a fraction of the time during the hospitalization. Attributing outcomes—for example, length of stay (LOS), readmission rate, mortality rate, net promoter score (NPS)—using this approach reduces the validity of metrics designed to measure provider performance, especially in a rotating provider environment where many providers interact with and care for a patient. For example, the quality of providers’ interpersonal skills and competence were among the strongest determinants of patient satisfaction,4 but it is not credible that this is solely based on the last provider during a hospitalization.
Proportionally distributing the attribution of an outcome has been used successfully in other contexts. Typically, a statistical modeling approach using a multi-membership framework is used because it can handle the sometimes-complicated relationships within the hierarchy. It also allows for auxiliary variables to be introduced, which can help explain and control for exogenous effects.5-7 For example, in the education setting, standardized testing is administered to students at defined years of schooling: at grades 4, 8, and 10, for instance. The progress of students, measured as the academic gains between test years, are proportionally attributed to all the teachers who the student has had between the test years. These partial attributions are combined to evaluate an overall teacher performance.8,9
Although the multi-membership framework has been used in other industries, it has yet to be applied in measuring provider performance. The purpose of this project is to investigate the impact of using a multi-provider approach compared to the standard single-provider approach. The findings may lead to modifications in the way a provider’s performance is measured and, thus, how providers are compensated. A similar study investigated the impact of proportionally distributing patients’ outcomes across all rotating providers using a weighting method based on billing practices to measure the partial impact of each provider.3
This study is different in 2 fundamental ways. First, attribution is weighted based on the number of clinically documented interactions (via clinical notes) between a patient and all rotating providers during the hospitalization. Second, performance is measured via multi-membership models, which can estimate the effect (both positive and negative) that a provider has on an outcome, even when caring for a patient a fraction of the time during the hospitalization.
Methods
Setting
Banner Health is a non-profit, multi-hospital health care system across 6 states in the western United States that is uniquely positioned to study provider quality attribution models. It not only has a large number of providers and serves a broad patient population, but Banner Health also uses an instance of Cerner (Kansas City, MO), an enterprise-level electronic health record (EHR) system that connects all its facilities and allows for advanced analytics across its system.
For this study, we included only general medicine and surgery patients admitted and discharged from the inpatient setting between January 1, 2018, and December 31, 2018, who were between 18 and 89 years old at admission, and who had a LOS between 1 and 14 days. Visit- and patient-level data were collected from Cerner, while outcome data, and corresponding expected outcome data, were obtained from Premier, Inc. (Charlotte, NC) using their CareScience methodologies.10 To measure patient experience, response data were extracted from post-discharge surveys administered by InMoment (Salt Lake City, UT).
Provider Attribution Models
Provider Attribution by Physician of Record (PAPR). In the standard approach, denoted here as the PAPR model, 1 provider—typically the attending or discharging provider, which may be the same person—is attributed to the entire hospitalization. This provider is responsible for the patient’s care, and all patient outcomes are aggregated and attributed to the provider to gauge his or her performance. The PAPR model is the most popular form of attribution across many health care systems and is routinely used for P4P incentives.
In this study, the discharging provider was used when attributing hospitalizations using the PAPR model. Providers responsible for fewer than 12 discharges in the calendar year were excluded. Because of the directness of this type of attribution, the performance of 1 provider does not account for the performance of the other rotating providers during hospitalizations.
Provider Attribution by Multiple Membership (PAMM). In contrast, we introduce another attribution approach here that is designed to assign partial attribution to each provider who cares for the patient during the hospitalization. To aggregate the partial attributions, and possibly control for any exogenous or risk-based factors, a multiple-membership, or multi-member (MM), model is used. The MM model can measure the effect of a provider on an outcome even when the patient-to-provider relationship is complex, such as in a rotating provider environment.8
The purpose of this study is to compare attribution models and to determine whether there are meaningful differences between them. Therefore, for comparison purposes, the same discharging providers using the PAPR approach are eligible for the PAMM approach, so that both attribution models are using the same set of providers. All other providers are excluded because their performance would not be comparable to the PAPR approach.
While there are many ways to document provider-to-patient interactions, 2 methods are available in almost all health care systems. The first method is to link a provider’s billing charges to each patient-day combination. This approach limits the attribution to 1 provider per patient per day because multiple rotating providers cannot charge for the same patient-day combination.3 However, many providers interact with a patient on the same day, so using this approach excludes non-billed provider-to-patient interactions.
The second method, which was used in this study, relies on documented clinical notes within the EHR to determine how attribution is shared. In this approach, attribution is weighted based on the authorship of 3 types of eligible clinical notes: admitting history/physical notes (during admission), progress notes (during subsequent days), and discharge summary notes (during final discharge). This will (likely) result in many providers being linked to a patient on each day, which better reflects the clinical setting (Figure). Recently, clinical notes were used to attribute care of patients in an inpatient setting, and it was found that this approach provides a reliable way of tracking interactions and assigning ownership.11

The provider-level attribution weights are based on the share of authorships of eligible note types. Specifically, for each provider j, let aij be the total count of eligible note types for hospitalization i authored by provider j, and let ai be the overall total count of eligible note types for hospitalization i. Then the attribution weight is
(Eq. 1)

for hospitalization i and provider j. Note that ∑jwij = 1: in other words, the total attribution, summed across all providers, is constrained to be 1 for each hospitalization.
Patient Outcomes
Outcomes were chosen based on their routine use in health care systems as standards when evaluating provider performance. This study included 6 outcomes: inpatient LOS, inpatient mortality, 30-day inpatient readmission, and patient responses from 3 survey questions. These outcomes can be collected without any manual chart reviews, and therefore are viewed as objective outcomes of provider performance.
Each outcome was aggregated for each provider using both attribution methods independently. For the PAPR method, observed-to-expected (OE) indices for LOS, mortality, and readmissions were calculated along with average patient survey scores. For the PAMM method, provider-level random effects from the fitted models were used. In both cases, the calculated measures were used for ranking purposes when determining top (or bottom) providers for each outcome.
Individual Provider Metrics for the PAPR Method
Inpatient LOS Index. Hospital inpatient LOS was measured as the number of days between admission date and discharge date. For each hospital visit, an expected LOS was determined using Premier’s CareScience Analytics (CSA) risk-adjustment methodology.10 The CSA methodology for LOS incorporates a patient’s clinical history, demographics, and visit-related administrative information.
Let nj be the number of hospitalizations attributed to provider j. Let oij and eij be the observed and expected LOS, respectively, for hospitalization i = 1,…,nj attributed to provider j. Then the inpatient LOS index for provider j is Lj = ∑ioij⁄∑ieij.
Inpatient Mortality Index. Inpatient mortality was defined as the death of the patient during hospitalization. For each hospitalization, an expected mortality probability was determined using Premier’s CSA risk-adjustment methodology.10 The CSA methodology for mortality incorporates a patient’s demographics and comorbidities.
Just as before, let nj be the number of hospitalizations attributed to provider j. Let mij = 1 if the patient died during hospitalization i = 1, … , nj attributed to provider j; mij = 0 otherwise. Let pij(m) be the corresponding expected mortality probability. Then the inpatient mortality index for provider j is Mj = ∑imij⁄∑ipij(m).
30-Day Inpatient Readmission Index. A 30-day inpatient readmission was defined as the event when a patient is discharged and readmits back into the inpatient setting within 30 days. The inclusion criteria defined by the Centers for Medicare and Medicaid Services (CMS) all-cause hospital-wide readmission measure was used and, consequently, planned readmissions were excluded.12 Readmissions could occur at any Banner hospital, including the same hospital. For each hospital visit, an expected readmission probability was derived using Premier’s CSA risk-adjustment methodology.10 The CSA methodology for readmissions incorporates a patient’s clinical history, demographics, and visit-related administrative information.
Let nj be the number of hospitalizations attributed to provider j. Let rij = 1 if the patient had a readmission following hospitalization i = 1, … , nj attributed to provider j; rij = 0 otherwise. Let pij(r) be the corresponding expected readmission probability. Then the 30-day inpatient readmission index for provider j is Rj = ∑irij ⁄∑ipij(r).
Patient Survey Scores. The satisfaction of the patient’s experience during hospitalization was measured via post-discharge surveys administered by InMoment. Two survey questions were selected because they related directly to a provider’s interaction with the patient: “My interactions with doctors were excellent” (Doctor) and “I received the best possible care” (Care). A third question, “I would recommend this hospital to my family and friends,” was selected as a proxy measure of the overall experience and, in the aggregate, is referred to as the net promoter score (NPS).13,14 The responses were measured on an 11-point Likert scale, ranging from “Strongly Disagree” (0) to “Strongly Agree” (10); “N/A” or missing responses were excluded.
The Likert responses were coded to 3 discrete values as follows: if the value was between 0 and 6, then -1 (ie, detractor); between 7 and 8 (ie, neutral), then 0; otherwise 1 (ie, promoter). Averaging these coded responses results in a patient survey score for each question. Specifically, let nj be the number of hospitalizations attributed to provider j in which the patient responded to the survey question. Let sij ∈{−1, 0, 1} be the coded response linked to hospitalization i = 1, … , nj attributed to provider j. Then the patient experience score for provider j is Sj = ∑isij⁄nj.
Handling Ties in Provider Performance Measures. Because ties can occur in the PAPR approach for all measures, a tie-breaking strategy is needed. For LOS indices, ties are less likely because their numerator is strictly greater than 0, and expected LOS values are typically distinct enough. Indeed, no ties were found in this study for LOS indices. However, mortality and readmission indices can routinely result in ties when the best possible index is achieved, such as 0 deaths or readmissions among attributed hospitalizations. To help differentiate between those indices in the PAPR approach, the total estimated risk (denominator) was utilized as a secondary scoring criterion.
Mortality and readmission metrics were addressed by sorting first by the outcome (mortality index), and second by the denominator (total estimated risk). For example, if provider A has the same mortality rate as provider B, then provider A would be ranked higher if the denominator was larger, indicating a higher risk for mortality.
Similarly, it was very common for providers to have the same overall average rating for a survey question. Therefore, the denominator (number of respondents) was used to break ties. However, the denominator sorting was bidirectional. For example, if the tied score was positive (more promoters than detractors) for providers A and B, then provider A would be ranked higher if the denominator was larger. Conversely, if the tied score between providers A and B was neutral or negative (more detractors than promoters), then provider A would be ranked lower if the denominator was larger.
Individual Provider Metrics for the PAMM Method
For the PAMM method, model-based metrics were derived using a MM model.8 Specifically, let J be the number of rotating providers in a health care system. Let Yi be an outcome of interest from hospitalization i, X1i, …, Xpi be fixed effects or covariates, and ß1, …, ßp be the coefficients for the respective covariates. Then the generalized MM statistical model is
(Eq. 2)

where g(μi ) is a link function between the mean of the outcome, μi, and its linear predictor, ß0, is the marginal intercept, wij represents the attribution weight of provider j on hospitalization i (described in Equation 1), and γj represents the random effect of provider j on the outcome with γj~N(0,σγ2).
For the mortality and readmission binary outcomes, logistic regression was performed using a logit link function, with the corresponding expected probability as the only fixed covariate. The expected probabilities were first converted into odds and then log-transformed before entering the model. For LOS, Poisson regression was performed using a log link function with the log-transformed expected LOS as the only fixed covariate. For coded patient experience responses, an ordered logistic regression was performed using a cumulative logit link function (no fixed effects were added).
MM Model-based Metrics. Each fitted MM model produces a predicted random effect for each provider. The provider-specific random effects can be interpreted as the unobserved influence of each provider on the outcome after controlling for any fixed effect included in the model. Therefore, the provider-specific random effects were used to evaluate the relative provider performance, which is analogous to the individual provider-level metrics used in the PAPR method.
Measuring provider performance using a MM model is more flexible and robust to outliers compared to the standard approach using OE indices or simple averages. First, although not investigated here, the effect of patient-, visit-, provider-, and/or temporal-level covariates can be controlled when evaluating provider performance. For example, a patient’s socioeconomic status, a provider’s workload, and seasonal factors can be added to the MM model. These external factors are not accounted for in OE indices.
Another advantage of using predicted random effects is the concept of “shrinkage.” The process of estimating random effects inherently accounts for small sample sizes (when providers do not treat a large enough sample of patients) and/or when there is a large ratio of patient variance to provider variance (for instance, when patient outcome variability is much higher compared to provider performance variability). In both cases, the estimation of the random effect is pulled ever closer to 0, signaling that the provider performance is closer to the population average. See Henderson15 and Mood16 for further details.
In contrast, OE indices can result in unreliable estimates when a provider has not cared for many patients. This is especially prevalent when the outcome is binary with a low probability of occurring, such as mortality. Indeed, provider-level mortality OE indices are routinely 0 when the patient counts are low, which skews performance rankings unfairly. Finally, OE indices also ignore the magnitude of the variance of an outcome between providers and patients, which can be large.
Comparison Methodology
In this study, we seek to compare the 2 methods of attribution, PAPR and PAMM, to determine whether there are meaningful differences between them when measuring provider performance. Using retrospective data described in the next section, each attribution method was used independently to derive provider-level metrics. To assess relative performance, percentiles were assigned to each provider based on their metric values so that, in the end, there were 2 percentile ranks for each provider for each metric.
Using these paired percentiles, we derived the following measures of concordance, similar to Herzke, Michtalik3: (1) the percent concordance measure—defined as the number of providers who landed in the top half (greater than the median) or bottom half under both attribution models—divided by the total number of providers; (2) the median of the absolute difference in percentiles under both attribution models; and (3) the Pearson correlation coefficient of the paired provider ranks. The first measure is a global measure of concordance between the 2 approaches and would be expected to be 50% by chance. The second measure gauges how an individual provider’s rank is affected by the change in attribution methodologies. The third measure is a statistical measure of linear correlation of the paired percentiles and was not included in the Herzke, Michtalik3 study.
All statistical analyses were performed on SAS (version 9.4; Cary, NC) and the MM models were fitted using PROC GLIMMIX with the EFFECT statement. The Banner Health Institutional Review Board approved this study.
Results
Descriptive Statistics
A total of

Multi-Membership Model Results
Table 3 displays the results after independently fitting MM models to each of the 3 clinical outcomes. Along with a marginal intercept, the only covariate in each model was the corresponding expected value after a transformation. This was added to use the same information that is typically used in OE indices, therefore allowing for a proper comparison between the 2 attribution methods. The provider-level variance represents the between-provider variation and measures the amount of influence providers have on the corresponding outcome after controlling for any covariates in the model. A provider-level variance of 0 would indicate that providers do not have any influence on the outcome. While the mortality and readmission model results can be compared to each other, the LOS model cannot given its different scale and transformation altogether.

The results in Table 3 suggest that each expected value covariate is highly correlated with its corresponding outcome, which is the anticipated conclusion given that they are constructed in this fashion. The estimated provider-level variances indicate that, after including an expected value in the model, providers have less of an influence on a patient’s LOS and likelihood of being readmitted. On the other hand, the results suggest that providers have much more influence on the likelihood of a patient dying in the hospital, even after controlling for an expected mortality covariate.

Table 4 shows the results after independently fitting MM-ordered logistic models to each of the 3 survey questions. The similar provider-level variances suggest that providers have the same influence on the patient’s perception of the quality of their interactions with the doctor (Doctor), the quality of the care they received (Care), and their likelihood to recommend a friend or family member to the hospital (NPS).

Comparison Results Between Both Attribution Methods
Table 5 compares the 2 attribution methods when ranking providers based on their performance on each outcome measure. The comparison metrics gauge how well the 2 methods agree overall (percent concordance), agree at the provider level (absolute percentile difference and interquartile range [IQR]), and how the paired percentiles linearly correlate to each other (Pearson correlation coefficient).
 Approach vs a Multi-Membership (PAMM) Approach")
LOS, by a small margin, had the lowest concordance of clinical outcomes (72.1%), followed by mortality (75.9%) and readmissions (82.1%). Generally, the survey scores had higher percent concordance than the clinical outcome measures, with Doctor at 84.1%, Care at 85.9%, and NPS having the highest percent concordance at 86.6%. Given that by chance the percent concordance is expected to be 50%, there was notable discordance, especially with the clinical outcome measures. Using LOS performance as an example, one attribution methodology would rank a provider in the top half or bottom half, while the other attribution methodology would rank the same provider exactly the opposite way about 28% of the time.
The median absolute percentile difference between the 2 methods was more modest (between 7 and 15). Still, there were some providers whose performance ranking was heavily impacted by the attribution methodology that was used. This was especially true when evaluating performance for certain clinical measures, where the attribution method that was used could change the provider performance percentile by up to 90 levels.
The paired percentiles were positively correlated when ranking performance using any of the 6 measures. This suggests that both methodologies assess performance generally in the same direction, irrespective of the methodology and measure. We did not investigate more complex correlation measures and left this for future research.
It should be noted that ties occurred much more frequently with the PAPR method than when using PAMM and therefore required tie-breaking rules to be designed. Given the nature of OE indices, PAPR methodology is especially sensitive to ties whenever the measure includes counting the number of events (for example, mortality and readmissions) and whenever there are many providers with very few attributed patients. On the other hand, using the PAMM method is much more robust against ties given that the summation of all the weighted attributed outcomes will rarely result in ties, even with a nominal set of providers.
Discussion
In this study, the PAMM methodology was introduced and was used to assess relative provider performance on 3 clinical outcome measures and 3 patient survey scores. The new approach aims to distribute each outcome among all providers who provided care for a patient in an inpatient setting. Clinical notes were used to account for patient-to-provider interactions, and fitted MM statistical models were used to compute the effects that each provider had on each outcome. The provider effect was introduced as a random effect, and the set of predicted random effects was used to rank the performance of each provider.
The PAMM approach was compared to the more traditional methodology, PAPR, where each patient is attributed to only 1 provider: the discharging physician in this study. Using this approach, OE indices of clinical outcomes and averages of survey scores were used to rank the performance of each provider. This approach resulted in many ties, which were broken based on the number of hospitalizations, although other tie-breaking methods may be used in practice.
Both methodologies showed modest concordance with each other for the clinical outcomes, but higher concordance for the patient survey scores. This was also true when using the Pearson correlation coefficient to assess agreement. The 1 outcome measure that showed the least concordance and least linear correlation between methods was LOS, which would suggest that LOS performance is more sensitive to the attribution methodology that is used. However, it was the least concordant by a small margin.
Furthermore, although the medians of the absolute percentile differences were small, there were some providers who had large deviations, suggesting that some providers would move from being shown as high-performers to low-performers and vice versa based on the chosen attribution method. We investigated examples of this and determined that the root cause was the difference in effective sample sizes for a provider. For the PAPR method, the effective sample size is simply the number of hospitalizations attributed to the provider. For the PAMM method, the effective sample size is the sum of all non-zero weights across all hospitalizations where the provider cared for a patient. By and large, the PAMM methodology provides more information of the provider effect on an outcome than the PAPR approach because every provider-patient interaction is considered. For example, providers who do not routinely discharge patients, but often care for patients, will have rankings that differ dramatically between the 2 methods.
The PAMM methodology has many statistical advantages that were not fully utilized in this comparative study. For example, we did not include any covariates in the MM models except for the expected value of the outcome, when it was available. Still, it is known that other covariates can impact an outcome as well, such as the patient’s age, socioeconomic indicators, existing chronic conditions, and severity of hospitalization, which can be added to the MM models as fixed effects. In this way, the PAMM approach can control for these other covariates, which are typically outside of the control of providers but typically ignored using OE indices. Therefore, using the PAMM approach would provide a fairer comparison of provider performance.
Using the PAMM method, most providers had a large sample size to assess their performance once all the weighted interactions were included. Still, there were a few who did not care for many patients for a variety of reasons. In these scenarios, MM models “borrow” strength from other providers to produce a more robust predicted provider effect by using a weighted average between the overall population trend and the specific provider outcomes (see Rao and Molina17). As a result, PAMM is a more suitable approach when the sample sizes of patients attributed to providers can be small.
One of the most interesting findings of this study was the relative size of the provider-level variance to the size of the fixed effect in each model (Table 3). Except for mortality, these variances suggest that there is a small difference in performance from one provider to another. However, these should be interpreted as the variance when only 1 provider is involved in the care of a patient. When multiple providers are involved, using basic statistical theory, the overall provider-level variance will be σγ2 ∑wij2 (see Equation 2). For example, the estimated variance among providers for LOS was 0.03 (on a log scale), but, using the scenario in the Figure, the overall provider-level variance for this hospitalization will be 0.03 (0.3752 + 0.1252 + 0.52) = 0.012. Hence, the combined effect of providers on LOS is less than would be expected. Indeed, as more providers are involved with a patient’s care, the more their combined influence on an outcome is diluted.
In this study, the PAMM approach placed an equal weight on all provider-patient interactions via clinical note authorship, but that may not be optimal in some settings. For example, it may make more sense to set a higher weight on the provider who admitted or discharged the patient while placing less (or 0) weight on all other interactions. In the extreme, if the full weight were placed on 1 provider interaction (eg, during discharge, then the MM model would be reduced to a one-way random effects model. The flexibility of weighting interactions is a feature of the PAMM approach, but any weighting framework must be transparent to the providers before implementation.
Conclusion
This study demonstrates that the PAMM approach is a feasible option within a large health care organization. For P4P programs to be successful, providers must be able to trust that their performance will be fairly assessed and that all provider-patient interactions are captured to provide a full comparison amongst their peers. The PAMM methodology is one solution to spread the positive (and negative) outcomes across all providers who cared for a patient and therefore, if implemented, would add trust and fairness when measuring and assessing provider performance.
Acknowledgments: The authors thank Barrie Bradley for his support in the initial stages of this research and Dr. Syed Ismail Jafri for his help and support on the standard approaches of assessing and measuring provider performances.
Corresponding author: Rachel Ginn, MS, Banner Health Corporation, 2901 N. Central Ave., Phoenix, AZ 85012; rachel.ginn@gmail.com.
Financial disclosures: None.
1. Abduljawad A, Al-Assaf AF. Incentives for better performance in health care. Sultan Qaboos Univ Med J. 2011;11:201-206.
2. Milstein R, Schreyoegg J. Pay for performance in the inpatient sector: a review of 34 P4P programs in 14 OECD countries. Health Policy. 2016;120:1125-1140.
3. Herzke CA, Michtalik HJ, Durkin N, et al. A method for attributing patient-level metrics to rotating providers in an inpatient setting. J Hosp Med. 2018;13:470-475.
4. Batbaatar E, Dorjdagva J, Luvsannyam A, Savino MM, Amenta P. Determinants of patient satisfaction: a systematic review. Perspect Public Health. 2017;137:89-101.
5. Ballou D, Sanders W, Wright P. Controlling for student background in value-added assessment of teachers. J Educ Behav Stat. 2004;29:37-65.
6. Hill PW, Goldstein H. Multilevel modeling of educational data with cross-classification and missing identification for units. J Educ Behav Stat. 1998;23:117-128.
7. Rasbash J, Browne WJ. Handbook of Multilevel Analysis. Springer; 2007.
8. Brown WJ, Goldstein H, Rasbash J. Multiple membership multiple classification (MMMC) models. Statistical Modeling. 2001;1:103-124.
9. Sanders WL, Horn SP. The Tennessee Value-Added Assessment System (TVAAS)—mixed-model methodology in educational assessment. J Pers Eval Educ. 1994;8:299-311.
10. Kroch EA, Duan M. CareScience Risk Assessment Model: Hospital Performance Measurement. Premier, Inc., 2008. http://www.ahrq.gov/qual/mortality/KrochRisk.htm
11. Schumacher DJ, Wu DTY, Meganathan K, et al. A feasibility study to attribute patients to primary interns on inpatient ward teams using electronic health record data. Acad Med. 2019;94:1376-1383.
12. Simoes J, Krumholz HM, Lin Z. Hospital-level 30-day risk-standardized readmission measure. Centers for Medicare & Medicaid Services, 2018. https://www.cms.gov/Medicare/Quality-Initiatives-Patient-Assessment-Instruments/HospitalQualityInits/Downloads/Hospital-Wide-All-Cause-Readmission-Updates.zip
13. Krol MW, de Boer D, Delnoij DM, Rademakers JJDJM. The Net Promoter Score: an asset to patient experience surveys? Health Expect. 2015;18:3099-3109.
14. Doyle C, Lennox L, Bell D. A systematic review of evidence on the links between patient experience and clinical safety and effectiveness. BMJ Open. 2013;3:e001570.
15. Henderson CR. Sire evaluation and genetic trends. J Anim Sci. 1973;1973:10-41.
16. Mood AM. Introduction to the Theory of Statistics. McGraw-Hill; 1950:xiii, 433-xiii.
17. Rao JNK, Molina I. Small Area Estimation. Wiley; 2015.
From Banner Health Corporation, Phoenix, AZ.
Background: Health care providers are routinely incentivized with pay-for-performance (P4P) metrics to increase the quality of care. In an inpatient setting, P4P models typically measure quality by attributing each patient’s outcome to a single provider even though many providers routinely care for the patient. This study investigates a new attribution approach aiming to distribute each outcome across all providers who provided care.
Methods: The methodology relies on a multi-membership model and is demonstrated in the Banner Health system using 3 clinical outcome measures (length of stay, 30-day readmissions, and mortality) and responses to 3 survey questions that measure a patient’s perception of their care. The new approach is compared to the “standard” method, which attributes each patient to only 1 provider.
Results: When ranking by clinical outcomes, both methods were concordant 72.1% to 82.1% of the time for top-half/bottom-half rankings, with a median percentile difference between 7 and 15. When ranking by survey scores, there was more agreement, with concordance between 84.1% and 86.6% and a median percentile difference between 11 and 13. Last, Pearson correlation coefficients of the paired percentiles ranged from 0.56 to 0.78.
Conclusion: The new approach provides a fairer solution when measuring provider performance.
Keywords: patient attribution; PAMM; PAPR; random effect model; pay for performance.
Providers practicing in hospitals are routinely evaluated based on their performance and, in many cases, are financially incentivized for a better-than-average performance within a pay-for-performance (P4P) model. The use of P4P models is based on the belief that they will “improve, motivate, and enhance providers to pursue aggressively and ultimately achieve the quality performance targets thus decreasing the number of medical errors with less malpractice events.”1 Although P4P models continue to be a movement in health care, they have been challenging to implement.
One concern involves the general quality of implementation, such as defining metrics and targets, setting payout amounts, managing technology and market conditions, and gauging the level of transparency to the provider.2 Another challenge, and the focus of this project, are concerns around measuring performance to avoid perceptions of unfairness. This concern can be minimized if the attribution is handled in a fairer way, by spreading it across all providers who affected the outcome, both in a positive or negative direction.3
To implement these models, the performance of providers needs to be measured and tracked periodically. This requires linking, or attributing, a patient’s outcome to a provider, which is almost always the attending or discharging provider (ie, a single provider).3 In this single-provider attribution approach, one provider will receive all the credit (good or bad) for their respective patients’ outcomes, even though the provider may have seen the patient only a fraction of the time during the hospitalization. Attributing outcomes—for example, length of stay (LOS), readmission rate, mortality rate, net promoter score (NPS)—using this approach reduces the validity of metrics designed to measure provider performance, especially in a rotating provider environment where many providers interact with and care for a patient. For example, the quality of providers’ interpersonal skills and competence were among the strongest determinants of patient satisfaction,4 but it is not credible that this is solely based on the last provider during a hospitalization.
Proportionally distributing the attribution of an outcome has been used successfully in other contexts. Typically, a statistical modeling approach using a multi-membership framework is used because it can handle the sometimes-complicated relationships within the hierarchy. It also allows for auxiliary variables to be introduced, which can help explain and control for exogenous effects.5-7 For example, in the education setting, standardized testing is administered to students at defined years of schooling: at grades 4, 8, and 10, for instance. The progress of students, measured as the academic gains between test years, are proportionally attributed to all the teachers who the student has had between the test years. These partial attributions are combined to evaluate an overall teacher performance.8,9
Although the multi-membership framework has been used in other industries, it has yet to be applied in measuring provider performance. The purpose of this project is to investigate the impact of using a multi-provider approach compared to the standard single-provider approach. The findings may lead to modifications in the way a provider’s performance is measured and, thus, how providers are compensated. A similar study investigated the impact of proportionally distributing patients’ outcomes across all rotating providers using a weighting method based on billing practices to measure the partial impact of each provider.3
This study is different in 2 fundamental ways. First, attribution is weighted based on the number of clinically documented interactions (via clinical notes) between a patient and all rotating providers during the hospitalization. Second, performance is measured via multi-membership models, which can estimate the effect (both positive and negative) that a provider has on an outcome, even when caring for a patient a fraction of the time during the hospitalization.
Methods
Setting
Banner Health is a non-profit, multi-hospital health care system across 6 states in the western United States that is uniquely positioned to study provider quality attribution models. It not only has a large number of providers and serves a broad patient population, but Banner Health also uses an instance of Cerner (Kansas City, MO), an enterprise-level electronic health record (EHR) system that connects all its facilities and allows for advanced analytics across its system.
For this study, we included only general medicine and surgery patients admitted and discharged from the inpatient setting between January 1, 2018, and December 31, 2018, who were between 18 and 89 years old at admission, and who had a LOS between 1 and 14 days. Visit- and patient-level data were collected from Cerner, while outcome data, and corresponding expected outcome data, were obtained from Premier, Inc. (Charlotte, NC) using their CareScience methodologies.10 To measure patient experience, response data were extracted from post-discharge surveys administered by InMoment (Salt Lake City, UT).
Provider Attribution Models
Provider Attribution by Physician of Record (PAPR). In the standard approach, denoted here as the PAPR model, 1 provider—typically the attending or discharging provider, which may be the same person—is attributed to the entire hospitalization. This provider is responsible for the patient’s care, and all patient outcomes are aggregated and attributed to the provider to gauge his or her performance. The PAPR model is the most popular form of attribution across many health care systems and is routinely used for P4P incentives.
In this study, the discharging provider was used when attributing hospitalizations using the PAPR model. Providers responsible for fewer than 12 discharges in the calendar year were excluded. Because of the directness of this type of attribution, the performance of 1 provider does not account for the performance of the other rotating providers during hospitalizations.
Provider Attribution by Multiple Membership (PAMM). In contrast, we introduce another attribution approach here that is designed to assign partial attribution to each provider who cares for the patient during the hospitalization. To aggregate the partial attributions, and possibly control for any exogenous or risk-based factors, a multiple-membership, or multi-member (MM), model is used. The MM model can measure the effect of a provider on an outcome even when the patient-to-provider relationship is complex, such as in a rotating provider environment.8
The purpose of this study is to compare attribution models and to determine whether there are meaningful differences between them. Therefore, for comparison purposes, the same discharging providers using the PAPR approach are eligible for the PAMM approach, so that both attribution models are using the same set of providers. All other providers are excluded because their performance would not be comparable to the PAPR approach.
While there are many ways to document provider-to-patient interactions, 2 methods are available in almost all health care systems. The first method is to link a provider’s billing charges to each patient-day combination. This approach limits the attribution to 1 provider per patient per day because multiple rotating providers cannot charge for the same patient-day combination.3 However, many providers interact with a patient on the same day, so using this approach excludes non-billed provider-to-patient interactions.
The second method, which was used in this study, relies on documented clinical notes within the EHR to determine how attribution is shared. In this approach, attribution is weighted based on the authorship of 3 types of eligible clinical notes: admitting history/physical notes (during admission), progress notes (during subsequent days), and discharge summary notes (during final discharge). This will (likely) result in many providers being linked to a patient on each day, which better reflects the clinical setting (Figure). Recently, clinical notes were used to attribute care of patients in an inpatient setting, and it was found that this approach provides a reliable way of tracking interactions and assigning ownership.11
The provider-level attribution weights are based on the share of authorships of eligible note types. Specifically, for each provider j, let aij be the total count of eligible note types for hospitalization i authored by provider j, and let ai be the overall total count of eligible note types for hospitalization i. Then the attribution weight is
(Eq. 1)
for hospitalization i and provider j. Note that ∑jwij = 1: in other words, the total attribution, summed across all providers, is constrained to be 1 for each hospitalization.
Patient Outcomes
Outcomes were chosen based on their routine use in health care systems as standards when evaluating provider performance. This study included 6 outcomes: inpatient LOS, inpatient mortality, 30-day inpatient readmission, and patient responses from 3 survey questions. These outcomes can be collected without any manual chart reviews, and therefore are viewed as objective outcomes of provider performance.
Each outcome was aggregated for each provider using both attribution methods independently. For the PAPR method, observed-to-expected (OE) indices for LOS, mortality, and readmissions were calculated along with average patient survey scores. For the PAMM method, provider-level random effects from the fitted models were used. In both cases, the calculated measures were used for ranking purposes when determining top (or bottom) providers for each outcome.
Individual Provider Metrics for the PAPR Method
Inpatient LOS Index. Hospital inpatient LOS was measured as the number of days between admission date and discharge date. For each hospital visit, an expected LOS was determined using Premier’s CareScience Analytics (CSA) risk-adjustment methodology.10 The CSA methodology for LOS incorporates a patient’s clinical history, demographics, and visit-related administrative information.
Let nj be the number of hospitalizations attributed to provider j. Let oij and eij be the observed and expected LOS, respectively, for hospitalization i = 1,…,nj attributed to provider j. Then the inpatient LOS index for provider j is Lj = ∑ioij⁄∑ieij.
Inpatient Mortality Index. Inpatient mortality was defined as the death of the patient during hospitalization. For each hospitalization, an expected mortality probability was determined using Premier’s CSA risk-adjustment methodology.10 The CSA methodology for mortality incorporates a patient’s demographics and comorbidities.
Just as before, let nj be the number of hospitalizations attributed to provider j. Let mij = 1 if the patient died during hospitalization i = 1, … , nj attributed to provider j; mij = 0 otherwise. Let pij(m) be the corresponding expected mortality probability. Then the inpatient mortality index for provider j is Mj = ∑imij⁄∑ipij(m).
30-Day Inpatient Readmission Index. A 30-day inpatient readmission was defined as the event when a patient is discharged and readmits back into the inpatient setting within 30 days. The inclusion criteria defined by the Centers for Medicare and Medicaid Services (CMS) all-cause hospital-wide readmission measure was used and, consequently, planned readmissions were excluded.12 Readmissions could occur at any Banner hospital, including the same hospital. For each hospital visit, an expected readmission probability was derived using Premier’s CSA risk-adjustment methodology.10 The CSA methodology for readmissions incorporates a patient’s clinical history, demographics, and visit-related administrative information.
Let nj be the number of hospitalizations attributed to provider j. Let rij = 1 if the patient had a readmission following hospitalization i = 1, … , nj attributed to provider j; rij = 0 otherwise. Let pij(r) be the corresponding expected readmission probability. Then the 30-day inpatient readmission index for provider j is Rj = ∑irij ⁄∑ipij(r).
Patient Survey Scores. The satisfaction of the patient’s experience during hospitalization was measured via post-discharge surveys administered by InMoment. Two survey questions were selected because they related directly to a provider’s interaction with the patient: “My interactions with doctors were excellent” (Doctor) and “I received the best possible care” (Care). A third question, “I would recommend this hospital to my family and friends,” was selected as a proxy measure of the overall experience and, in the aggregate, is referred to as the net promoter score (NPS).13,14 The responses were measured on an 11-point Likert scale, ranging from “Strongly Disagree” (0) to “Strongly Agree” (10); “N/A” or missing responses were excluded.
The Likert responses were coded to 3 discrete values as follows: if the value was between 0 and 6, then -1 (ie, detractor); between 7 and 8 (ie, neutral), then 0; otherwise 1 (ie, promoter). Averaging these coded responses results in a patient survey score for each question. Specifically, let nj be the number of hospitalizations attributed to provider j in which the patient responded to the survey question. Let sij ∈{−1, 0, 1} be the coded response linked to hospitalization i = 1, … , nj attributed to provider j. Then the patient experience score for provider j is Sj = ∑isij⁄nj.
Handling Ties in Provider Performance Measures. Because ties can occur in the PAPR approach for all measures, a tie-breaking strategy is needed. For LOS indices, ties are less likely because their numerator is strictly greater than 0, and expected LOS values are typically distinct enough. Indeed, no ties were found in this study for LOS indices. However, mortality and readmission indices can routinely result in ties when the best possible index is achieved, such as 0 deaths or readmissions among attributed hospitalizations. To help differentiate between those indices in the PAPR approach, the total estimated risk (denominator) was utilized as a secondary scoring criterion.
Mortality and readmission metrics were addressed by sorting first by the outcome (mortality index), and second by the denominator (total estimated risk). For example, if provider A has the same mortality rate as provider B, then provider A would be ranked higher if the denominator was larger, indicating a higher risk for mortality.
Similarly, it was very common for providers to have the same overall average rating for a survey question. Therefore, the denominator (number of respondents) was used to break ties. However, the denominator sorting was bidirectional. For example, if the tied score was positive (more promoters than detractors) for providers A and B, then provider A would be ranked higher if the denominator was larger. Conversely, if the tied score between providers A and B was neutral or negative (more detractors than promoters), then provider A would be ranked lower if the denominator was larger.
Individual Provider Metrics for the PAMM Method
For the PAMM method, model-based metrics were derived using a MM model.8 Specifically, let J be the number of rotating providers in a health care system. Let Yi be an outcome of interest from hospitalization i, X1i, …, Xpi be fixed effects or covariates, and ß1, …, ßp be the coefficients for the respective covariates. Then the generalized MM statistical model is
(Eq. 2)
where g(μi ) is a link function between the mean of the outcome, μi, and its linear predictor, ß0, is the marginal intercept, wij represents the attribution weight of provider j on hospitalization i (described in Equation 1), and γj represents the random effect of provider j on the outcome with γj~N(0,σγ2).
For the mortality and readmission binary outcomes, logistic regression was performed using a logit link function, with the corresponding expected probability as the only fixed covariate. The expected probabilities were first converted into odds and then log-transformed before entering the model. For LOS, Poisson regression was performed using a log link function with the log-transformed expected LOS as the only fixed covariate. For coded patient experience responses, an ordered logistic regression was performed using a cumulative logit link function (no fixed effects were added).
MM Model-based Metrics. Each fitted MM model produces a predicted random effect for each provider. The provider-specific random effects can be interpreted as the unobserved influence of each provider on the outcome after controlling for any fixed effect included in the model. Therefore, the provider-specific random effects were used to evaluate the relative provider performance, which is analogous to the individual provider-level metrics used in the PAPR method.
Measuring provider performance using a MM model is more flexible and robust to outliers compared to the standard approach using OE indices or simple averages. First, although not investigated here, the effect of patient-, visit-, provider-, and/or temporal-level covariates can be controlled when evaluating provider performance. For example, a patient’s socioeconomic status, a provider’s workload, and seasonal factors can be added to the MM model. These external factors are not accounted for in OE indices.
Another advantage of using predicted random effects is the concept of “shrinkage.” The process of estimating random effects inherently accounts for small sample sizes (when providers do not treat a large enough sample of patients) and/or when there is a large ratio of patient variance to provider variance (for instance, when patient outcome variability is much higher compared to provider performance variability). In both cases, the estimation of the random effect is pulled ever closer to 0, signaling that the provider performance is closer to the population average. See Henderson15 and Mood16 for further details.
In contrast, OE indices can result in unreliable estimates when a provider has not cared for many patients. This is especially prevalent when the outcome is binary with a low probability of occurring, such as mortality. Indeed, provider-level mortality OE indices are routinely 0 when the patient counts are low, which skews performance rankings unfairly. Finally, OE indices also ignore the magnitude of the variance of an outcome between providers and patients, which can be large.
Comparison Methodology
In this study, we seek to compare the 2 methods of attribution, PAPR and PAMM, to determine whether there are meaningful differences between them when measuring provider performance. Using retrospective data described in the next section, each attribution method was used independently to derive provider-level metrics. To assess relative performance, percentiles were assigned to each provider based on their metric values so that, in the end, there were 2 percentile ranks for each provider for each metric.
Using these paired percentiles, we derived the following measures of concordance, similar to Herzke, Michtalik3: (1) the percent concordance measure—defined as the number of providers who landed in the top half (greater than the median) or bottom half under both attribution models—divided by the total number of providers; (2) the median of the absolute difference in percentiles under both attribution models; and (3) the Pearson correlation coefficient of the paired provider ranks. The first measure is a global measure of concordance between the 2 approaches and would be expected to be 50% by chance. The second measure gauges how an individual provider’s rank is affected by the change in attribution methodologies. The third measure is a statistical measure of linear correlation of the paired percentiles and was not included in the Herzke, Michtalik3 study.
All statistical analyses were performed on SAS (version 9.4; Cary, NC) and the MM models were fitted using PROC GLIMMIX with the EFFECT statement. The Banner Health Institutional Review Board approved this study.
Results
Descriptive Statistics
A total of
Multi-Membership Model Results
Table 3 displays the results after independently fitting MM models to each of the 3 clinical outcomes. Along with a marginal intercept, the only covariate in each model was the corresponding expected value after a transformation. This was added to use the same information that is typically used in OE indices, therefore allowing for a proper comparison between the 2 attribution methods. The provider-level variance represents the between-provider variation and measures the amount of influence providers have on the corresponding outcome after controlling for any covariates in the model. A provider-level variance of 0 would indicate that providers do not have any influence on the outcome. While the mortality and readmission model results can be compared to each other, the LOS model cannot given its different scale and transformation altogether.
The results in Table 3 suggest that each expected value covariate is highly correlated with its corresponding outcome, which is the anticipated conclusion given that they are constructed in this fashion. The estimated provider-level variances indicate that, after including an expected value in the model, providers have less of an influence on a patient’s LOS and likelihood of being readmitted. On the other hand, the results suggest that providers have much more influence on the likelihood of a patient dying in the hospital, even after controlling for an expected mortality covariate.
Table 4 shows the results after independently fitting MM-ordered logistic models to each of the 3 survey questions. The similar provider-level variances suggest that providers have the same influence on the patient’s perception of the quality of their interactions with the doctor (Doctor), the quality of the care they received (Care), and their likelihood to recommend a friend or family member to the hospital (NPS).
Comparison Results Between Both Attribution Methods
Table 5 compares the 2 attribution methods when ranking providers based on their performance on each outcome measure. The comparison metrics gauge how well the 2 methods agree overall (percent concordance), agree at the provider level (absolute percentile difference and interquartile range [IQR]), and how the paired percentiles linearly correlate to each other (Pearson correlation coefficient).
LOS, by a small margin, had the lowest concordance of clinical outcomes (72.1%), followed by mortality (75.9%) and readmissions (82.1%). Generally, the survey scores had higher percent concordance than the clinical outcome measures, with Doctor at 84.1%, Care at 85.9%, and NPS having the highest percent concordance at 86.6%. Given that by chance the percent concordance is expected to be 50%, there was notable discordance, especially with the clinical outcome measures. Using LOS performance as an example, one attribution methodology would rank a provider in the top half or bottom half, while the other attribution methodology would rank the same provider exactly the opposite way about 28% of the time.
The median absolute percentile difference between the 2 methods was more modest (between 7 and 15). Still, there were some providers whose performance ranking was heavily impacted by the attribution methodology that was used. This was especially true when evaluating performance for certain clinical measures, where the attribution method that was used could change the provider performance percentile by up to 90 levels.
The paired percentiles were positively correlated when ranking performance using any of the 6 measures. This suggests that both methodologies assess performance generally in the same direction, irrespective of the methodology and measure. We did not investigate more complex correlation measures and left this for future research.
It should be noted that ties occurred much more frequently with the PAPR method than when using PAMM and therefore required tie-breaking rules to be designed. Given the nature of OE indices, PAPR methodology is especially sensitive to ties whenever the measure includes counting the number of events (for example, mortality and readmissions) and whenever there are many providers with very few attributed patients. On the other hand, using the PAMM method is much more robust against ties given that the summation of all the weighted attributed outcomes will rarely result in ties, even with a nominal set of providers.
Discussion
In this study, the PAMM methodology was introduced and was used to assess relative provider performance on 3 clinical outcome measures and 3 patient survey scores. The new approach aims to distribute each outcome among all providers who provided care for a patient in an inpatient setting. Clinical notes were used to account for patient-to-provider interactions, and fitted MM statistical models were used to compute the effects that each provider had on each outcome. The provider effect was introduced as a random effect, and the set of predicted random effects was used to rank the performance of each provider.
The PAMM approach was compared to the more traditional methodology, PAPR, where each patient is attributed to only 1 provider: the discharging physician in this study. Using this approach, OE indices of clinical outcomes and averages of survey scores were used to rank the performance of each provider. This approach resulted in many ties, which were broken based on the number of hospitalizations, although other tie-breaking methods may be used in practice.
Both methodologies showed modest concordance with each other for the clinical outcomes, but higher concordance for the patient survey scores. This was also true when using the Pearson correlation coefficient to assess agreement. The 1 outcome measure that showed the least concordance and least linear correlation between methods was LOS, which would suggest that LOS performance is more sensitive to the attribution methodology that is used. However, it was the least concordant by a small margin.
Furthermore, although the medians of the absolute percentile differences were small, there were some providers who had large deviations, suggesting that some providers would move from being shown as high-performers to low-performers and vice versa based on the chosen attribution method. We investigated examples of this and determined that the root cause was the difference in effective sample sizes for a provider. For the PAPR method, the effective sample size is simply the number of hospitalizations attributed to the provider. For the PAMM method, the effective sample size is the sum of all non-zero weights across all hospitalizations where the provider cared for a patient. By and large, the PAMM methodology provides more information of the provider effect on an outcome than the PAPR approach because every provider-patient interaction is considered. For example, providers who do not routinely discharge patients, but often care for patients, will have rankings that differ dramatically between the 2 methods.
The PAMM methodology has many statistical advantages that were not fully utilized in this comparative study. For example, we did not include any covariates in the MM models except for the expected value of the outcome, when it was available. Still, it is known that other covariates can impact an outcome as well, such as the patient’s age, socioeconomic indicators, existing chronic conditions, and severity of hospitalization, which can be added to the MM models as fixed effects. In this way, the PAMM approach can control for these other covariates, which are typically outside of the control of providers but typically ignored using OE indices. Therefore, using the PAMM approach would provide a fairer comparison of provider performance.
Using the PAMM method, most providers had a large sample size to assess their performance once all the weighted interactions were included. Still, there were a few who did not care for many patients for a variety of reasons. In these scenarios, MM models “borrow” strength from other providers to produce a more robust predicted provider effect by using a weighted average between the overall population trend and the specific provider outcomes (see Rao and Molina17). As a result, PAMM is a more suitable approach when the sample sizes of patients attributed to providers can be small.
One of the most interesting findings of this study was the relative size of the provider-level variance to the size of the fixed effect in each model (Table 3). Except for mortality, these variances suggest that there is a small difference in performance from one provider to another. However, these should be interpreted as the variance when only 1 provider is involved in the care of a patient. When multiple providers are involved, using basic statistical theory, the overall provider-level variance will be σγ2 ∑wij2 (see Equation 2). For example, the estimated variance among providers for LOS was 0.03 (on a log scale), but, using the scenario in the Figure, the overall provider-level variance for this hospitalization will be 0.03 (0.3752 + 0.1252 + 0.52) = 0.012. Hence, the combined effect of providers on LOS is less than would be expected. Indeed, as more providers are involved with a patient’s care, the more their combined influence on an outcome is diluted.
In this study, the PAMM approach placed an equal weight on all provider-patient interactions via clinical note authorship, but that may not be optimal in some settings. For example, it may make more sense to set a higher weight on the provider who admitted or discharged the patient while placing less (or 0) weight on all other interactions. In the extreme, if the full weight were placed on 1 provider interaction (eg, during discharge, then the MM model would be reduced to a one-way random effects model. The flexibility of weighting interactions is a feature of the PAMM approach, but any weighting framework must be transparent to the providers before implementation.
Conclusion
This study demonstrates that the PAMM approach is a feasible option within a large health care organization. For P4P programs to be successful, providers must be able to trust that their performance will be fairly assessed and that all provider-patient interactions are captured to provide a full comparison amongst their peers. The PAMM methodology is one solution to spread the positive (and negative) outcomes across all providers who cared for a patient and therefore, if implemented, would add trust and fairness when measuring and assessing provider performance.
Acknowledgments: The authors thank Barrie Bradley for his support in the initial stages of this research and Dr. Syed Ismail Jafri for his help and support on the standard approaches of assessing and measuring provider performances.
Corresponding author: Rachel Ginn, MS, Banner Health Corporation, 2901 N. Central Ave., Phoenix, AZ 85012; rachel.ginn@gmail.com.
Financial disclosures: None.
1. Abduljawad A, Al-Assaf AF. Incentives for better performance in health care. Sultan Qaboos Univ Med J. 2011;11:201-206.
2. Milstein R, Schreyoegg J. Pay for performance in the inpatient sector: a review of 34 P4P programs in 14 OECD countries. Health Policy. 2016;120:1125-1140.
3. Herzke CA, Michtalik HJ, Durkin N, et al. A method for attributing patient-level metrics to rotating providers in an inpatient setting. J Hosp Med. 2018;13:470-475.
4. Batbaatar E, Dorjdagva J, Luvsannyam A, Savino MM, Amenta P. Determinants of patient satisfaction: a systematic review. Perspect Public Health. 2017;137:89-101.
5. Ballou D, Sanders W, Wright P. Controlling for student background in value-added assessment of teachers. J Educ Behav Stat. 2004;29:37-65.
6. Hill PW, Goldstein H. Multilevel modeling of educational data with cross-classification and missing identification for units. J Educ Behav Stat. 1998;23:117-128.
7. Rasbash J, Browne WJ. Handbook of Multilevel Analysis. Springer; 2007.
8. Brown WJ, Goldstein H, Rasbash J. Multiple membership multiple classification (MMMC) models. Statistical Modeling. 2001;1:103-124.
9. Sanders WL, Horn SP. The Tennessee Value-Added Assessment System (TVAAS)—mixed-model methodology in educational assessment. J Pers Eval Educ. 1994;8:299-311.
10. Kroch EA, Duan M. CareScience Risk Assessment Model: Hospital Performance Measurement. Premier, Inc., 2008. http://www.ahrq.gov/qual/mortality/KrochRisk.htm
11. Schumacher DJ, Wu DTY, Meganathan K, et al. A feasibility study to attribute patients to primary interns on inpatient ward teams using electronic health record data. Acad Med. 2019;94:1376-1383.
12. Simoes J, Krumholz HM, Lin Z. Hospital-level 30-day risk-standardized readmission measure. Centers for Medicare & Medicaid Services, 2018. https://www.cms.gov/Medicare/Quality-Initiatives-Patient-Assessment-Instruments/HospitalQualityInits/Downloads/Hospital-Wide-All-Cause-Readmission-Updates.zip
13. Krol MW, de Boer D, Delnoij DM, Rademakers JJDJM. The Net Promoter Score: an asset to patient experience surveys? Health Expect. 2015;18:3099-3109.
14. Doyle C, Lennox L, Bell D. A systematic review of evidence on the links between patient experience and clinical safety and effectiveness. BMJ Open. 2013;3:e001570.
15. Henderson CR. Sire evaluation and genetic trends. J Anim Sci. 1973;1973:10-41.
16. Mood AM. Introduction to the Theory of Statistics. McGraw-Hill; 1950:xiii, 433-xiii.
17. Rao JNK, Molina I. Small Area Estimation. Wiley; 2015.
President Biden signs 10 new orders to help fight COVID-19

“For the past year, we couldn’t rely on the federal government to act with the urgency and focus and coordination we needed, and we have seen the tragic cost of that failure,” Mr. Biden said in remarks from the White House, unveiling his 198-page National Strategy for the COVID-19 Response and Pandemic Preparedness.
He said as many as 500,000 Americans will have died by February. “It’s going to take months for us to turn things around,” he said.
“Our national strategy is comprehensive – it’s based on science, not politics; it’s based on truth, not denial,” Mr. Biden said. He also promised to restore public trust, in part by having scientists and public health experts speak to the public. “That’s why you’ll be hearing a lot more from Dr. Fauci again, not from the president,” he said, adding that the experts will be “free from political interference.”
While the president’s executive orders can help accomplish some of the plan’s proposals, the majority will require new funding from Congress and will be included in the $1.9 trillion American Rescue package that Mr. Biden hopes legislators will approve.
Ten new orders
The 10 new pandemic-related orders Biden signed on Jan. 21 follow two he signed on his first day in office.
One establishes a COVID-19 Response Office responsible for coordinating the pandemic response across all federal departments and agencies and also reestablishes the White House Directorate on Global Health Security and Biodefense, which was disabled by the Trump administration.
The other order requires masks and physical distancing in all federal buildings, on all federal lands, and by federal employees and contractors.
Among the new orders will be directives that:
- Require individuals to also wear masks in airports and planes, and when using other modes of public transportation including trains, boats, and intercity buses, and also require international travelers to produce proof of a recent negative COVID-19 test prior to entry and to quarantine after entry.
- Federal agencies use all powers, including the Defense Production Act, to accelerate manufacturing and delivery of supplies such as N95 masks, gowns, gloves, swabs, reagents, pipette tips, rapid test kits, and nitrocellulose material for rapid antigen tests, and all equipment and material needed to accelerate manufacture, delivery, and administration of COVID-19 vaccine.
- Create a Pandemic Testing Board to expand supply and access, to promote more surge capacity, and to ensure equitable access to tests.
- Facilitate discovery, development, and trials of potential COVID-19 treatments, as well as expand access to programs that can meet the long-term health needs of those recovering from the disease.
- Facilitate more and better data sharing that will allow businesses, schools, hospitals, and individuals to make real-time decisions based on spread in their community.
- Direct the Education and Health & Human Services departments to provide schools and child-care operations guidance on how to reopen and operate safely.
- Direct the Occupational Safety and Health Administration (OSHA) to immediately release clear guidance for employers to help keep workers safe and to enforce health and safety requirements.
The plan also sets goals for vaccination – including 100 million shots in the administration’s first 100 days. President Biden had already previewed his goals for vaccination, including setting up mass vaccination sites and mobile vaccination sites. During his remarks, Mr. Biden said that he had already directed the Federal Emergency Management Agency (FEMA) to begin setting up the vaccination centers.
The administration is also going to look into improving reimbursement for giving vaccines. As a start, the HHS will ask the Centers for Medicare & Medicaid Services to consider if a higher rate “may more accurately compensate providers,” according to the Biden plan.
“But the brutal truth is it will take months before we can get the majority of Americans vaccinated,” said Mr. Biden.
As part of the goal of ensuring an equitable pandemic response, the president will sign an order that establishes a COVID-19 Health Equity Task Force. The task force is charged with providing recommendations for allocating resources and funding in communities with inequities in COVID-19 outcomes by race, ethnicity, geography, disability, and other considerations.
Finally, the administration has committed to being more transparent and sharing more information. The national plan calls for the federal government to conduct regular, expert-led, science-based public briefings and to release regular reports on the pandemic. The administration said it will launch massive science-based public information campaigns – in multiple languages – to educate Americans on masks, testing, and vaccines, and also work to counter misinformation and disinformation.
The American Academy of Family Physicians (AAFP) applauded Mr. Biden’s initiative. “If enacted, this bold legislative agenda will provide much-needed support to American families struggling during the pandemic – especially communities of color and those hardest hit by the virus,” Ada D. Stewart, MD, AAFP president, said in a statement.
Dr. Stewart also noted that family physicians “are uniquely positioned in their communities to educate patients, prioritize access, and coordinate administration of the COVID-19 vaccines,” and urged the administration to ensure that family physicians and staff be vaccinated as soon as possible, to help them “more safely provide care to their communities.”
A version of this article first appeared on Medscape.com.
Seven ways President Biden could now change health care
President Joe Biden has come into office after an unexpected shift in Congress. On Jan. 5, Democrats scored an upset by winning two U.S. Senate seats in runoff elections in Georgia, giving them control of the Senate.
Now the Democrats have control of all three levers of power – the Senate, the House, and the presidency – for the first time since the early years of the Obama administration.
How will President Biden use this new concentration of power to shape health care policy?
Democrats’ small majorities in both houses of Congress suggest that moderation and bipartisanship will be necessary to get things done. Moreover, Mr. Biden himself is calling for bipartisanship. “On this January day,” he said in his inauguration speech, “my whole soul is in this: Bringing America together, uniting our people, uniting our nation.”
Key health care actions that Mr. Biden could pursue include the following.
1. Passing a new COVID-19 relief bill
Above all, Mr. Biden is focused on overcoming the COVID-19 pandemic, which has been registering record deaths recently, and getting newly released vaccines to Americans.
“Dealing with the coronavirus pandemic is one of the most important battles our administration will face, and I will be informed by science and by experts,” the president said.
“There is no question that the pandemic is the highest priority for the Biden administration,” said Larry Levitt, executive vice president for health policy at the Henry J. Kaiser Family Foundation. “COVID will dominate the early weeks and months of this administration. His success rests, in particular, on improving the rollout of vaccines.”
Five days before his inauguration, the president-elect unveiled the American Rescue Plan, a massive, $1.9 trillion legislative package intended to hasten rollout of COVID-19 vaccines, improve COVID-19 testing, and provide financial help to businesses and individuals, among many other things.
The bill would add $1,400 to the recently passed $600 government relief payments for each American, amounting to a $2,000 check. It would also enact many non-COVID-19 measures, such as a $15-an-hour minimum wage and measures to bolster the Affordable Care Act (ACA).
If Democrats cannot reach a deal with the Republicans, they might turn the proposal into a reconciliation bill, which could then be passed with a simple majority. However, drafting a reconciliation bill is a long, complicated process that would require removing provisions that don’t meet the requirements of reconciliation, said Hazen Marshall, a Washington lobbyist and former staffer for Sen. Mitch McConnell.
Most importantly, Mr. Marshall said, reconciliation bills bring out diehard partisanship. “They involve a sledgehammer mentality,” he says. “You’re telling the other side that their views aren’t going to matter.” The final version of the ACA, for example, was passed as a reconciliation bill, with not one Republican vote.
In the Trump years, “the last four reconciliation bills did not get any votes from the minority,” added Rodney Whitlock, PhD, a political consultant at McDermott+Consulting, who worked 21 years for Republicans in the House. “When the majority chooses to use reconciliation, it is an admission that it has no interest in working with the minority.”
Hammering out a compromise will be tough, but Robert Pearl MD, former CEO of the Permanente Medical Group and a professor at Stanford (Calif.) University, said that if anyone can do it, it would be President Biden. Having served in the Senate for 36 years, “Biden knows Congress better than any president since Lyndon Johnson,” he said. “He can reach across the aisle and get legislation passed as much as anyone could these days.”
2. Restoring Obamacare
Mr. Biden has vowed to undo a gradual dismantling of the ACA that went on during the Trump administration through executive orders, rule-making, and new laws. “Reinvigorating the ACA was a central part of Biden’s platform as a candidate,” Mr. Levitt said.
Each Trump action against the ACA must be undone in the same way. Presidential orders must be met with presidential orders, regulations with regulations, and legislation with legislation.
The ACA is also being challenged in the Supreme Court. Republicans under Trump passed a law that reduced the penalty for not buying health insurance under the ACA to zero. Then a group of 20 states, led by Texas, filed a lawsuit asserting that this change makes the ACA unconstitutional.
The lawsuit was heard by the Supreme Court in November. From remarks made by the justices then, it appears that the court might well uphold the law when a verdict comes down in June.
But just in case, Mr. Biden wants Congress to enact a small penalty for not buying health insurance, which would remove the basis of the lawsuit.
Mr. Biden’s choice for secretary of Health and Human Services shows his level of commitment to protecting the ACA. His HHS nominee is California Attorney General Xavier Becerra, who led a group of 17 states defending the ACA in the current lawsuit.
In addition to undoing Trump’s changes, Mr. Biden plans to expand the ACA beyond the original legislation. The new COVID-19 bill contains provisions that would expand subsidies to buy insurance on the exchanges and would lower the maximum percentage of income that anyone has to pay for health insurance to 8.5%.
Dealing with Medicaid is also related to the ACA. In 2012, the Supreme Court struck down a mandate that states expand their Medicaid programs, with substantial funding from the federal government.
To date, 12 states still do not participate in the Medicaid expansion. To lure them into the expansion, the Democrat-controlled House last session passed a bill that would offer to pay the entire bill for the first 3 years of Medicaid expansion if they chose to enact an expansion.
3. Undoing other Trump actions in health care
In addition to changes in the ACA, Trump also enacted a number of other changes in health care that President Biden could undo. For example, Mr. Biden says he will reenter the World Health Organization (WHO) so that the United States could better coordinate a COVID-19 response with other nations. Trump exited the WHO with the stroke of a pen, and Mr. Biden can do the same in reverse.
Under Trump, the Centers for Medicare & Medicaid Services used waivers to weaken the ACA and allow states to alter their Medicaid programs. One waiver allows Georgia to leave the ACA exchanges and put brokers in charge of buying coverage. Other waivers allow states to transform federal Medicaid payments into block grants, which several states are planning to do.
The Trump CMS has allowed several states to use Medicaid waivers to add work requirements for Medicaid recipients. The courts have blocked the work rules so far, and the Biden CMS may decide to reverse these waivers or modify them.
“Undoing waivers is normally a fairly simple thing,” Mr. Levitt said. In January, however, the Trump CMS asked some waiver states to sign new contracts in which the CMS pledges not to end a waiver without 9 months’ notice. It’s unclear how many states signed such contracts and what obligation the Biden CMS has to enforce them.
The Trump CMS also stopped reimbursing insurers for waiving deductibles and copayments for low-income customers, as directed by the ACA. Without federal reimbursement, some insurers raised premiums by as much as 20% to cover the costs. It is unclear how the Biden CMS would tackle this change.
4. Negotiating lower drug prices
Allowing Medicare to negotiate drug prices, a major plank in Mr. Biden’s campaign, would seem like a slam dunk for the Democrats. This approach is backed by 89% of Americans, including 84% of Republicans, according to a Kaiser Family Foundation survey in December.
“With that level of support, it’s hard to go wrong politically on this issue,” Mr. Levitt said.
Many Republicans, however, do not favor negotiating drug prices, and the two parties continue to be far apart on how to control drug prices. Trump signed an action that allows Americans to buy cheaper drugs abroad, an approach that Mr. Biden also supports, but it is now tied up in the courts.
“A drug pricing bill has always been difficult to pass,” Dr. Whitlock said. “The issue is popular with the public, but change does not come easily. The drug lobby is one the strongest in Washington, and now it may be even stronger, since it was the drug companies that gave us the COVID vaccines.”
Dr. Whitlock said Republicans will want Democrats to compromise on drug pricing, but he doubts they will do so. The House passed a bill to negotiate drug prices last year, which never was voted on in the Senate. “It is difficult to imagine that the Democrats will be able to move rightward from that House bill,” Dr. Whitlock said. “Democrats are likely to stand pat on drug pricing.”
5. Introducing a public option
President Biden’s campaign proposal for a public option – health insurance offered by the federal government – and to lower the age for Medicare eligibility from 65 years to 60 years, resulted from a compromise between two factions of the Democratic party on how to expand coverage.
Although Mr. Biden and other moderates wanted to focus on fixing the ACA, Democrats led by Sen. Bernie Sanders of Vermont called for a single-payer system, dubbed “Medicare for all.” A public option was seen as the middle ground between the two camps.
“A public option would be a very controversial,” Dr. Whitlock said. Critics say it would pay at Medicare rates, which would reduce doctors’ reimbursements, and save very little money compared with a single-payer system.
Dr. Pearl sees similar problems with lowering the Medicare age. “This would be an expensive change that the federal government could not afford, particularly with all the spending on the pandemic,” he said. “And it would be tough on doctors and hospitals, because Medicare pays less than the private insurance payment they are now getting.”
“The public option is likely to get serious discussion within the Democratic caucus and get onto the Senate floor,” Mr. Levitt said. “The party won’t ignore it.” He notes that in the new Senate, Sen. Sanders chairs the budget committee, and from that position he is likely to push for expanding access to care.
Mr. Levitt says the Biden CMS might allow states to experiment with a statewide public option or even a single-payer model, but he concedes that states, with their budgets ravaged by COVID-19, do not currently have the money to launch such programs.
6. Reviving the CMS
Under President Obama, the CMS was the engine that implemented the ACA and shepherded wider use of value-based reimbursements, which reward providers for quality and outcomes rather than volume.
Under the Trump administration, CMS leadership continued to uphold value-based reimbursement, Dr. Pearl observed. “CMS leadership championed value-based payments, but they encountered a lot of pushback from doctors and hospitals and had to scale back their goals,” he said.
On the other hand, the Trump CMS took a 180-degree turn on the ACA and worked to take it apart. This took a toll on staff morale, according to Donald M. Berwick, MD, who ran the CMS under President Obama. “Many people in CMS did not feel supported during the Trump administration, and some of them left,” Dr. Berwick said.
The CMS needs experienced staff on board to write comprehensible rules and regulations that can overcome court challenges.
Having a fully functioning CMS also requires consistent leadership, which was a problem for Obama. When Mr. Obama nominated Dr. Berwick, 60 Senate votes were needed to confirm him, and Republicans would not vote for him. Mr. Obama eventually brought Dr. Berwick in as a recess appointment, but it meant he could serve for only 17 months.
Since then, Senate confirmation rules have changed so that only a simple majority is needed to confirm appointments. This is important for Biden’s nominees, Dr. Berwick said. “For a president, having your team in place means you are able to execute the policies you want,” he said. “You need to have consistent leadership.”
7. Potentially changing health care without Congress
Even with their newly won control of the Senate, the Democrats’ thin majorities in both houses of Congress may not be enough to pass much legislation if Republicans are solidly opposed.
Democrats in the House also have a narrow path this session in which to pass legislation. The Democratic leadership has an 11-vote majority, but it must contend with 15 moderate representatives in purple districts (where Democrats and Republicans have about equal support).
A bigger problem looms before the Democrats. In 2022, the party may well lose its majorities in both houses. Mr. Whitlock notes that the party of an incoming president normally loses seats in the first midterm election. “The last incoming president to keep both houses of Congress in his first midterm was Jimmy Carter,” he said.
If this happens, President Biden would have to govern without the support of Congress, which is what Barack Obama had to do through most of his presidency. As Mr. Obama’s vice president, Mr. Biden is well aware how that goes. Governing without Congress means relying on presidential orders and decrees.
In health care, Mr. Biden has a powerful policy-making tool, the Center for Medicare & Medicaid Innovation (CMMI). The CMMI was empowered by the ACA to initiate pilot programs for new payment models.
So far, the CMMI’s work has been mainly limited to accountable care organizations, bundled payments, and patient-centered medical homes, but it could also be used to enact new federal policies that would normally require Congressional action, Mr. Levitt said.
Conclusion
Expectations have been very high for what President Joe Biden can do in health care. He needs to unite a very divided political system to defeat a deadly pandemic, restore Obamacare, and sign landmark legislation, such as a drug-pricing bill.
But shepherding bills through Congress will be a challenge. “You need to have accountability, unity, and civility, which is a Herculean task,” Mr. Whitlock said. “You have to keep policies off the table that could blow up the bipartisanship.”
A version of this article first appeared on Medscape.com.
President Biden kicks off health agenda with COVID actions, WHO outreach
President Joe Biden kicked off his new administration Jan. 20 with an immediate focus on attempts to stop the spread of COVID-19, including closer coordination with other nations.
Mr. Biden signed 17 executive orders, memoranda, and directives addressing not only the pandemic but also economic concerns, climate change, and racial inequity.
At the top of the list of actions was what his transition team called a “100 Days Masking Challenge.” Mr. Biden issued an executive order requiring masks and physical distancing in all federal buildings, on all federal lands, and by federal employees and contractors.
The president also halted the Trump administration’s process of withdrawing from the World Health Organization. Instead, Mr. Biden named Anthony Fauci, MD, the director of the National Institute for Allergy and Infectious Diseases, as the head of a delegation to participate in the WHO executive board meeting that is being held this week.
Mr. Biden also signed an executive order creating the position of COVID-19 response coordinator, which will report directly to the president and be responsible for coordinating all elements of the COVID-19 response across government, including the production and distribution of vaccines and medical supplies.
The newly inaugurated president also intends to restore the National Security Council’s Directorate for Global Health Security and Biodefense, which will aid in the response to the pandemic, his transition team said.
The American Medical Association was among the first to commend the first-day actions.
“Defeating COVID-19 requires bold, coordinated federal leadership and strong adherence to the public health steps we know stop the spread of this virus – wearing masks, practicing physical distancing, and washing hands,” said AMA President Susan R. Bailey, MD in a news release. “We are pleased by the Biden administration’s steps today, including universal mask wearing within federal jurisdictions, providing federal leadership for COVID-19 response, and reengaging with the World Health Organization. Taking these actions on day 1 of the administration sends the right message – that our nation is laser focused on stopping the ravages of COVID-19.”
A version of this article first appeared on Medscape.com.
Biden’s COVID-19 challenge: 100 million vaccinations in the first 100 days. It won’t be easy.
It’s in the nature of presidential candidates and new presidents to promise big things. Just months after his 1961 inauguration, President John F. Kennedy vowed to send a man to the moon by the end of the decade. That pledge was kept, but many others haven’t been, such as candidate Bill Clinton’s promise to provide universal health care and presidential hopeful George H.W. Bush’s guarantee of no new taxes.
Now, during a once-in-a-century pandemic, incoming President Joe Biden has promised to provide 100 million COVID-19 vaccinations in his first 100 days in office.
“This team will help get … at least 100 million covid vaccine shots into the arms of the American people in the first 100 days,” Biden said during a Dec. 8 news conference introducing key members of his health team.
When first asked about his pledge, the Biden team said the president-elect meant 50 million people would get their two-dose regimen. The incoming administration has since updated this plan, saying it will release vaccine doses as soon as they’re available instead of holding back some of that supply for second doses.
Either way, Biden may run into difficulty meeting that 100 million mark.
“I think it’s an attainable goal. I think it’s going to be extremely challenging,” said Claire Hannan, executive director of the Association of Immunization Managers.
While a pace of 1 million doses a day is “somewhat of an increase over what we’re already doing,” a much higher rate of vaccinations will be necessary to stem the pandemic, said Larry Levitt, executive vice president for health policy at Kaiser Family Foundation. (KHN is an editorially independent program of KFF.) “The Biden administration has plans to rationalize vaccine distribution, but increasing the supply quickly” could be a difficult task.
Under the Trump administration, vaccine deployment has been much slower than Biden’s plan. The rollout began on Dec. 14. Since then, 12 million shots have been given and 31 million doses have been shipped out, according to the Centers for Disease Control and Prevention’s vaccine tracker.
This sluggishness has been attributed to a lack of communication between the federal government and state and local health departments, not enough funding for large-scale vaccination efforts, and confusing federal guidance on distribution of the vaccines.
The same problems could plague the Biden administration, said experts.
States still aren’t sure how much vaccine they’ll get and whether there will be a sufficient supply, said Dr. Marcus Plescia, chief medical officer for the Association of State and Territorial Health Officials, which represents state public health agencies.
“We have been given little information about the amount of vaccine the states will receive in the near future and are of the impression that there may not be 1 million doses available per day in the first 100 days of the Biden administration,” said Dr. Plescia. “Or at least not in the early stages of the 100 days.”
Another challenge has been a lack of funding. Public health departments have had to start vaccination campaigns while also operating testing centers and conducting contact tracing efforts with budgets that have been critically underfunded for years.
“States have to pay for creating the systems, identifying the personnel, training, staffing, tracking people, information campaigns – all the things that go into getting a shot in someone’s arm,” said Jennifer Kates, director of global health & HIV policy at KFF. “They’re having to create an unprecedented mass vaccination program on a shaky foundation.”
The latest covid stimulus bill, signed into law in December, allocates almost $9 billion in funding to the CDC for vaccination efforts. About $4.5 billion is supposed to go to states, territories and tribal organizations, and $3 billion of that is slated to arrive soon.
But it’s not clear that level of funding can sustain mass vaccination campaigns as more groups become eligible for the vaccine.
Biden released a $1.9 trillion plan last week to address covid and the struggling economy. It includes $160 billion to create national vaccination and testing programs, but also earmarks funds for $1,400 stimulus payments to individuals, state and local government aid, extension of unemployment insurance, and financial assistance for schools to reopen safely.
Though it took Congress almost eight months to pass the last covid relief bill after Republican objections to the cost, Biden seems optimistic he’ll get some Republicans on board for his plan. But it’s not yet clear that will work.
There’s also the question of whether outgoing President Donald Trump’s impeachment trial will get in the way of Biden’s legislative priorities.
In addition, states have complained about a lack of guidance and confusing instructions on which groups should be given priority status for vaccination, an issue the Biden administration will need to address.
On Dec. 3, the CDC recommended health care personnel, residents of long-term care facilities, those 75 and older, and front-line essential workers should be immunized first. But on Jan. 12, the CDC shifted course and recommended that everyone over age 65 should be immunized. In a speech Biden gave on Jan. 15 detailing his vaccination plan, he said he would stick to the CDC’s recommendation to prioritize those over 65.
Outgoing Health and Human Services Secretary Alex Azar also said on Jan. 12 that states that moved their vaccine supply fastest would be prioritized in getting more shipments. It’s not known yet whether the Biden administration’s CDC will stick to this guidance. Critics have said it could make vaccine distribution less equitable.
In general, taking over with a strong vision and clear communication will be key to ramping up vaccine distribution, said Ms. Hannan.
“Everyone needs to understand what the goal is and how it’s going to work,” she said.
A challenge for Biden will be tamping expectations that the vaccine is all that is needed to end the pandemic. Across the country, covid cases are higher than ever, and in many locations officials cannot control the spread.
Public health experts said Biden must amp up efforts to increase testing across the country, as he has suggested he will do by promising to establish a national pandemic testing board.
With so much focus on vaccine distribution, it’s important that this part of the equation not be lost. Right now, “it’s completely all over the map,” said KFF’s Ms. Kates, adding that the federal government will need a “good sense” of who is and is not being tested in different areas in order to “fix” public health capacity.
Jan. 20, 2021, marks the launch of The Biden Promise Tracker, which monitors the 100 most important campaign promises of President Joseph R. Biden. Biden listed the coronavirus and a variety of other health-related issues among his top priorities. You can see the entire list – including improving the economy, responding to calls for racial justice and combating climate change – here. As part of KHN’s partnership with PolitiFact, we will follow the health-related issues and then rate them on whether the promise was achieved: Promise Kept, Promise Broken, Compromise, Stalled, In the Works or Not Yet Rated. We rate the promise not on the president’s intentions or effort, but on verifiable outcomes. PolitiFact previously tracked the promises of President Donald Trump and President Barack Obama.
Kaiser Health News is a nonprofit news service covering health issues. It is an editorially independent program of KFF, which is not affiliated with Kaiser Permanente.
HHS will drop buprenorphine waiver rule for most physicians
Federal officials on Thursday announced a plan to largely drop the so-called X-waiver requirement for buprenorphine prescriptions for physicians in a bid to remove an administrative procedure widely seen as a barrier to opioid use disorder (OUD) treatment.

The Department of Health & Human Services unveiled new practice guidelines that include an exemption from current certification requirements. The exemption applies to physicians already registered with the Drug Enforcement Administration.
A restriction included in the new HHS policy is a limit of treating no more than 30 patients with buprenorphine for OUD at any one time. There is an exception to this limit for hospital-based physicians, such as those working in emergency departments, HHS said.
, such as buprenorphine, and does not apply to methadone. The new guidelines say the date on which they will take effect will be added after publication in the Federal Register. HHS did not immediately answer a request from this news organization for a more specific timeline.
Welcomed change
The change in prescribing rule was widely welcomed, with the American Medical Association issuing a statement endorsing the revision. The AMA and many prescribers and researchers had seen the X-waiver as a hurdle to address the nation’s opioid epidemic.
There were more than 83,000 deaths attributed to drug overdoses in the United States in the 12 months ending in June 2020. This is the highest number of overdose deaths ever recorded in a 12-month period, HHS said in a press release, which cited data from the Centers for Disease Control and Prevention.
In a tweet about the new policy, Peter Grinspoon, MD, a Boston internist and author of the memoir “Free Refills: A Doctor Confronts His Addiction,” contrasted the relative ease with which clinicians can give medicines that carry a risk for abuse with the challenge that has existed in trying to provide patients with buprenorphine.
“Absolutely insane that we need a special waiver for buprenorphine to TREAT opioid addiction, but not to prescribe oxycodone, Vicodin, etc., which can get people in trouble in the first place!!” Dr. Grinspoon tweeted.
Patrice Harris, MD, chair of the AMA’s Opioid Task Force and the organization’s immediate past president, said removing the X-waiver requirement can help lessen the stigma associated with this OUD treatment. The AMA had urged HHS to change the regulation.
“With this change, office-based physicians and physician-led teams working with patients to manage their other medical conditions can also treat them for their opioid use disorder without being subjected to a separate and burdensome regulatory regime,” Dr. Harris said in the AMA statement.
Researchers have in recent years sought to highlight what they described as missed opportunities for OUD treatment because of the need for the X-waiver.
Buprenorphine is a cost-effective treatment for opioid use disorder, which reduces the risk of injection-related infections and mortality risk, notes a study published online last month in JAMA Network Open.
However, results showed that fewer than 2% of obstetrician-gynecologists who examined women enrolled in Medicaid were trained to prescribe buprenorphine. The study, which was based on data from 31, 211 ob.gyns. who accepted Medicaid insurance, was created to quantify how many were on the list of Drug Addiction Treatment Act buprenorphine-waived clinicians.
The Drug Addiction Treatment Act has required 8 hours of training for physicians and 24 hours for nurse practitioners and physician assistants for the X-waiver needed to prescribe buprenorphine, the investigators report.
‘X the X-waiver’
Only 10% of recent family residency graduates reported being adequately trained to prescribe buprenorphine and only 7% reported actually prescribing the drug, write Kevin Fiscella, MD, University of Rochester (N.Y.) Medical Center and colleagues in a 2018 Viewpoint article published in JAMA Psychiatry.
In the article, which was subtitled “X the X Waiver,” they called for deregulation of buprenorphine as a way of mainstreaming treatment for OUD.
“The DATA 2000 has failed – too few physicians have obtained X-waivers,” the authors write. “Regulations reinforce the stigma surrounding buprenorphine prescribers and patients who receive it while constraining access and discouraging patient engagement and retention in treatment.”
The change, announced Jan. 14, leaves in place restrictions on prescribing for clinicians other than physicians. On a call with reporters, Adm. Brett P. Giroir, MD, assistant secretary for health, suggested that federal officials should take further steps to remove hurdles to buprenorphine prescriptions.
“Many people will say this has gone too far,” Dr. Giroir said of the drive to end the X-waiver for clinicians. “But I believe more people will say this has not gone far enough.”
A version of this article first appeared on Medscape.com.
Federal officials on Thursday announced a plan to largely drop the so-called X-waiver requirement for buprenorphine prescriptions for physicians in a bid to remove an administrative procedure widely seen as a barrier to opioid use disorder (OUD) treatment.
The Department of Health & Human Services unveiled new practice guidelines that include an exemption from current certification requirements. The exemption applies to physicians already registered with the Drug Enforcement Administration.
A restriction included in the new HHS policy is a limit of treating no more than 30 patients with buprenorphine for OUD at any one time. There is an exception to this limit for hospital-based physicians, such as those working in emergency departments, HHS said.
, such as buprenorphine, and does not apply to methadone. The new guidelines say the date on which they will take effect will be added after publication in the Federal Register. HHS did not immediately answer a request from this news organization for a more specific timeline.
Welcomed change
The change in prescribing rule was widely welcomed, with the American Medical Association issuing a statement endorsing the revision. The AMA and many prescribers and researchers had seen the X-waiver as a hurdle to address the nation’s opioid epidemic.
There were more than 83,000 deaths attributed to drug overdoses in the United States in the 12 months ending in June 2020. This is the highest number of overdose deaths ever recorded in a 12-month period, HHS said in a press release, which cited data from the Centers for Disease Control and Prevention.
In a tweet about the new policy, Peter Grinspoon, MD, a Boston internist and author of the memoir “Free Refills: A Doctor Confronts His Addiction,” contrasted the relative ease with which clinicians can give medicines that carry a risk for abuse with the challenge that has existed in trying to provide patients with buprenorphine.
“Absolutely insane that we need a special waiver for buprenorphine to TREAT opioid addiction, but not to prescribe oxycodone, Vicodin, etc., which can get people in trouble in the first place!!” Dr. Grinspoon tweeted.
Patrice Harris, MD, chair of the AMA’s Opioid Task Force and the organization’s immediate past president, said removing the X-waiver requirement can help lessen the stigma associated with this OUD treatment. The AMA had urged HHS to change the regulation.
“With this change, office-based physicians and physician-led teams working with patients to manage their other medical conditions can also treat them for their opioid use disorder without being subjected to a separate and burdensome regulatory regime,” Dr. Harris said in the AMA statement.
Researchers have in recent years sought to highlight what they described as missed opportunities for OUD treatment because of the need for the X-waiver.
Buprenorphine is a cost-effective treatment for opioid use disorder, which reduces the risk of injection-related infections and mortality risk, notes a study published online last month in JAMA Network Open.
However, results showed that fewer than 2% of obstetrician-gynecologists who examined women enrolled in Medicaid were trained to prescribe buprenorphine. The study, which was based on data from 31, 211 ob.gyns. who accepted Medicaid insurance, was created to quantify how many were on the list of Drug Addiction Treatment Act buprenorphine-waived clinicians.
The Drug Addiction Treatment Act has required 8 hours of training for physicians and 24 hours for nurse practitioners and physician assistants for the X-waiver needed to prescribe buprenorphine, the investigators report.
‘X the X-waiver’
Only 10% of recent family residency graduates reported being adequately trained to prescribe buprenorphine and only 7% reported actually prescribing the drug, write Kevin Fiscella, MD, University of Rochester (N.Y.) Medical Center and colleagues in a 2018 Viewpoint article published in JAMA Psychiatry.
In the article, which was subtitled “X the X Waiver,” they called for deregulation of buprenorphine as a way of mainstreaming treatment for OUD.
“The DATA 2000 has failed – too few physicians have obtained X-waivers,” the authors write. “Regulations reinforce the stigma surrounding buprenorphine prescribers and patients who receive it while constraining access and discouraging patient engagement and retention in treatment.”
The change, announced Jan. 14, leaves in place restrictions on prescribing for clinicians other than physicians. On a call with reporters, Adm. Brett P. Giroir, MD, assistant secretary for health, suggested that federal officials should take further steps to remove hurdles to buprenorphine prescriptions.
“Many people will say this has gone too far,” Dr. Giroir said of the drive to end the X-waiver for clinicians. “But I believe more people will say this has not gone far enough.”
A version of this article first appeared on Medscape.com.
Eliminating hepatitis by 2030: HHS releases new strategic plan
In an effort to counteract alarming trends in rising hepatitis infections, the U.S. Department of Health and Human Services has developed and released its Viral Hepatitis National Strategic Plan 2021-2025, which aims to eliminate viral hepatitis infection in the United States by 2030.

An estimated 3.3 million people in the United States were chronically infected with hepatitis B (HBV) and hepatitis C (HCV) as of 2016. In addition, the country “is currently facing unprecedented hepatitis A (HAV) outbreaks, while progress in preventing hepatitis B has stalled, and hepatitis C rates nearly tripled from 2011 to 2018,” according to the HHS.
The new plan, “A Roadmap to Elimination for the United States,” builds upon previous initiatives the HHS has made to tackle the diseases and was coordinated by the Office of the Assistant Secretary for Health through the Office of Infectious Disease and HIV/AIDS Policy.
The plan focuses on HAV, HBV, and HCV, which have the largest impact on the health of the nation, according to the HHS. The plan addresses populations with the highest burden of viral hepatitis based on nationwide data so that resources can be focused there to achieve the greatest impact. Persons who inject drugs are a priority population for all three hepatitis viruses. HAV efforts will also include a focus on the homeless population. HBV efforts will also focus on Asian and Pacific Islander and the Black, non-Hispanic populations, while HCV efforts will include a focus on Black, non-Hispanic people, people born during 1945-1965, people with HIV, and the American Indian/Alaska Native population.
Goal-setting
There are five main goals outlined in the plan, according to the HHS:
- Prevent new hepatitis infections.
- Improve hepatitis-related health outcomes of people with viral hepatitis.
- Reduce hepatitis-related disparities and health inequities.
- Improve hepatitis surveillance and data use.
- Achieve integrated, coordinated efforts that address the viral hepatitis epidemics among all partners and stakeholders.
“The United States will be a place where new viral hepatitis infections are prevented, every person knows their status, and every person with viral hepatitis has high-quality health care and treatment and lives free from stigma and discrimination. This vision includes all people, regardless of age, sex, gender identity, sexual orientation, race, ethnicity, religion, disability, geographic location, or socioeconomic circumstance,” according to the HHS vision statement.
In an effort to counteract alarming trends in rising hepatitis infections, the U.S. Department of Health and Human Services has developed and released its Viral Hepatitis National Strategic Plan 2021-2025, which aims to eliminate viral hepatitis infection in the United States by 2030.
An estimated 3.3 million people in the United States were chronically infected with hepatitis B (HBV) and hepatitis C (HCV) as of 2016. In addition, the country “is currently facing unprecedented hepatitis A (HAV) outbreaks, while progress in preventing hepatitis B has stalled, and hepatitis C rates nearly tripled from 2011 to 2018,” according to the HHS.
The new plan, “A Roadmap to Elimination for the United States,” builds upon previous initiatives the HHS has made to tackle the diseases and was coordinated by the Office of the Assistant Secretary for Health through the Office of Infectious Disease and HIV/AIDS Policy.
The plan focuses on HAV, HBV, and HCV, which have the largest impact on the health of the nation, according to the HHS. The plan addresses populations with the highest burden of viral hepatitis based on nationwide data so that resources can be focused there to achieve the greatest impact. Persons who inject drugs are a priority population for all three hepatitis viruses. HAV efforts will also include a focus on the homeless population. HBV efforts will also focus on Asian and Pacific Islander and the Black, non-Hispanic populations, while HCV efforts will include a focus on Black, non-Hispanic people, people born during 1945-1965, people with HIV, and the American Indian/Alaska Native population.
Goal-setting
There are five main goals outlined in the plan, according to the HHS:
- Prevent new hepatitis infections.
- Improve hepatitis-related health outcomes of people with viral hepatitis.
- Reduce hepatitis-related disparities and health inequities.
- Improve hepatitis surveillance and data use.
- Achieve integrated, coordinated efforts that address the viral hepatitis epidemics among all partners and stakeholders.
“The United States will be a place where new viral hepatitis infections are prevented, every person knows their status, and every person with viral hepatitis has high-quality health care and treatment and lives free from stigma and discrimination. This vision includes all people, regardless of age, sex, gender identity, sexual orientation, race, ethnicity, religion, disability, geographic location, or socioeconomic circumstance,” according to the HHS vision statement.
Pressure builds on CDC to prioritize both diabetes types for vaccine
The American Diabetes Association, along with 18 other organizations, has sent a letter to the U.S. Centers for Disease Control and Prevention urging them to rank people with type 1 diabetes as equally high risk for COVID-19 severity, and therefore vaccination, as those with type 2 diabetes.
On Jan. 12, the CDC recommended states vaccinate all Americans over age 65 and those with underlying health conditions that make them more vulnerable to COVID-19.
Currently, type 2 diabetes is listed among 12 conditions that place adults “at increased risk of severe illness from the virus that causes COVID-19,” with the latter defined as “hospitalization, admission to the intensive care unit, intubation or mechanical ventilation, or death.”
On the other hand, the autoimmune condition type 1 diabetes is among 11 conditions the CDC says “might be at increased risk” for COVID-19, but limited data were available at the time of the last update on Dec. 23, 2020.
“States are utilizing the CDC risk classification when designing their vaccine distribution plans. This raises an obvious concern as it could result in the approximately 1.6 million with type 1 diabetes receiving the vaccination later than others with the same risk,” states the ADA letter, sent to the CDC on Jan. 13.
Representatives from the Endocrine Society, American Association of Clinical Endocrinology, Pediatric Endocrine Society, Association of Diabetes Care & Education Specialists, and JDRF, among others, cosigned the letter.
Newer data show those with type 1 diabetes at equally high risk
While acknowledging that “early data did not provide as much clarity about the extent to which those with type 1 diabetes are at high risk,” the ADA says newer evidence has emerged, as previously reported by this news organization, that “convincingly demonstrates that COVID-19 severity is more than tripled in individuals with type 1 diabetes.”
The letter also cites another study showing that people with type 1 diabetes “have a 3.3-fold greater risk of severe illness, are 3.9 times more likely to be hospitalized with COVID-19, and have a 3-fold increase in mortality compared to those without type 1 diabetes.”
Those risks, they note, are comparable to the increased risk established for those with type 2 diabetes, as shown in a third study from Scotland, published last month.
Asked for comment, CDC representative Kirsten Nordlund said in an interview, “This list is a living document that will be periodically updated by CDC, and it could rapidly change as the science evolves.”
In addition, Ms. Nordlund said, “Decisions about transitioning to subsequent phases should depend on supply; demand; equitable vaccine distribution; and local, state, or territorial context.”
“Phased vaccine recommendations are meant to be fluid and not restrictive for jurisdictions. It is not necessary to vaccinate all individuals in one phase before initiating the next phase; phases may overlap,” she noted. More information is available here.
Tennessee gives type 1 and type 2 diabetes equal priority for vaccination
Meanwhile, at least one state, Tennessee, has updated its guidance to include both types of diabetes as being priority for COVID-19 vaccination.
Vanderbilt University pediatric endocrinologist Justin M. Gregory, MD, said in an interview: “I was thrilled when our state modified its guidance on December 30th to include both type 1 and type 2 diabetes in the ‘high-risk category.’ Other states have not modified that guidance though.”
It’s unclear how this might play out on the ground, noted Dr. Gregory, who led one of the three studies demonstrating increased COVID-19 risk for people with type 1 diabetes.
“To tell you the truth, I don’t really know how individual organizations dispensing the vaccination [will handle] people who come to their facility saying they have ‘diabetes.’ Individual states set the vaccine-dispensing guidance and individual county health departments and health care systems mirror that guidance,” he said.
Thus, he added, “Although it’s possible an individual nurse may take the ‘I’ll ask you no questions, and you’ll tell me no lies’ approach if someone with type 1 diabetes says they have ‘diabetes’, websites and health department–recorded telephone messages are going to tell people with type 1 diabetes they have to wait further back in line if that is what their state’s guidance directs.”
A version of this article first appeared on Medscape.com.
Feds authorize $3 billion to boost vaccine rollout
The CDC will send $3 billion to the states to boost a lagging national COVID-19 vaccination program.
The Department of Health and Human Services announced the new funding as only 30% of the more than 22 million doses of vaccine distributed in the U.S. has been injected into Americans’ arms.
Along with the $3 billion, HHS said another $19 billion is headed to states and jurisdictions to boost COVID-19 testing programs. The amount each state will receive will be determined by population.
The news comes days after President-elect Joe Biden said he planned to release all available doses of vaccine after he takes office on Jan. 20. The Trump administration has been holding back millions of doses to ensure supply of vaccine to provide the necessary second dose for those who received the first shot.
“This funding is another timely investment that will strengthen our nation’s efforts to stop the COVID-19 pandemic in America,” CDC Director Robert Redfield, MD, said in a statement. “Particularly now, it is crucial that states and communities have the resources they need to conduct testing, and to distribute and administer safe, high-quality COVID-19 vaccines safely and equitably.”
Federal officials and public health experts, however, expressed concerns this weekend about Biden’s plan.
Outgoing Trump administration officials and others said they worry that doing so will leave providers without enough second doses for people getting the two-shot vaccines.
If Biden releases all available doses and the vaccine-making process has an issue, they said, that could pose a supply risk.
“We have product that is going through QC right now – quality control – for sterility, identity check that we have tens and tens of millions of product. We always will. But batches fail. Sterility fails ... and then you don’t have a product for that second dose,” Alex Azar, secretary of health and human services, told the American Hospital Association on Jan. 8, according to CNN.
“And frankly, talking about that or encouraging that can really undermine a critical public health need, which is that people come back for their second vaccine,” he said.
One of the main roadblocks in the vaccine rollout has been administering the doses that have already been distributed. The U.S. has shipped 22.1 million doses, and 6.6 million first shots have been given, according to the latest CDC data updated Jan. 8. Mr. Azar and other federal health officials have encouraged states to use their current supply and expand vaccine access to more priority groups.
“We would be delighted to learn that jurisdictions have actually administered many more doses than they are presently reporting,” a spokesman for the U.S. Department of Health and Human Services told CNN. “We are encouraging jurisdictions to expand their priority groups as needed to ensure no vaccine is sitting on the shelf after having been delivered to the jurisdiction-directed locations.”
Releasing more vaccines for first doses could create ethical concerns as well, since people getting vaccines expect to get a second dose in the proper amount of time, according to The Week. Biden’s transition team said on Jan. 8 that he won’t delay the second dose but, instead, plans to ramp up production to stay on track.
To do this well, the federal government should create a coordinated vaccine strategy that sets expectations for an around-the-clock operation and help state and local vaccination programs meet their goals, Leana Wen, MD, a professor at George Washington University, wrote in an editorial for The Washington Post.
“The Biden team’s urgency around vaccinations is commendable,” she added in a Twitter post on Jan. 11. “I’d like to see a guarantee that every 1st dose given will be followed with a timely 2nd dose. Otherwise, there are ethical concerns that could add to vaccine hesitancy.”
Biden has pledged that 100 million doses will be administered in his first 100 days in office. He has grown frustrated as concerns grow that his administration could fall short of the promise, according to Politico. His coronavirus response team has noted several challenges, including what they say is a lack of long-term planning by the Trump administration and an initial refusal to share key information.
“We’re uncovering new information each day, and we’re unearthing – of course – more work to be done,” Vivek Murthy, MD, Biden’s nominee for surgeon general, told Politico.
The team has uncovered staffing shortages, technology problems, and issues with health care insurance coverage. The incoming Biden team has developed several initiatives, such as mobile vaccination units and new federal sites to give shots. It could take weeks to get the vaccine rollout on track, the news outlet reported.
“Will this be challenging? Absolutely,” Anthony Fauci, MD, director of the National Institute of Allergy and Infectious Diseases and Biden’s incoming chief medical adviser on the coronavirus, told Politico. “This is an unprecedented effort to vaccinate the entire country over a period of time that’s fighting against people dying at record numbers. To say it’s not a challenge would be unrealistic. Do I think it can be done? Yes.”
A version of this article first appeared on WebMD.com.
Examining the Interfacility Variation of Social Determinants of Health in the Veterans Health Administration
Social determinants of health (SDoH) are social, economic, environmental, and occupational factors that are known to influence an individual’s health care utilization and clinical outcomes.1,2 Because the Veterans Health Administration (VHA) is charged to address both the medical and nonmedical needs of the veteran population, it is increasingly interested in the impact SDoH have on veteran care.3,4 To combat the adverse impact of such factors, the VHA has implemented several large-scale programs across the US that focus on prevalent SDoH, such as homelessness, substance abuse, and alcohol use disorders.5,6 While such risk factors are generally universal in their distribution, variation across regions, between urban and rural spaces, and even within cities has been shown to exist in private settings.7 Understanding such variability potentially could be helpful to US Department of Veterans Affairs (VA) policymakers and leaders to better allocate funding and resources to address such issues.
Although previous work has highlighted regional and neighborhood-level variability of SDoH, no study has examined the facility-level variability of commonly encountered social risk factors within the VHA.4,8 The aim of this study was to describe the interfacility variation of 5 common SDoH known to influence health and health outcomes among a national cohort of veterans hospitalized for common medical issues by using administrative data.
Methods
We used a national cohort of veterans aged ≥ 65 years who were hospitalized at a VHA acute care facility with a primary discharge diagnosis of acute myocardial infarction (AMI), heart failure (HF), or pneumonia in 2012. These conditions were chosen because they are publicly reported and frequently used for interfacility comparison.
Using the International Classification of Diseases–9th Revision (ICD-9) and VHA clinical stop codes, we calculated the median documented proportion of patients with any of the following 5 SDoH: lived alone, marginal housing, alcohol use disorder, substance use disorder, and use of substance use services for patients presenting with HF, MI, and pneumonia (Table). These SDoH were chosen because they are intervenable risk factors for which the VHA has several programs (eg, homeless outreach, substance abuse, and tobacco cessation). To examine the variability of these SDoH across VHA facilities, we determined the number of hospitals that had a sufficient number of admissions (≥ 50) to be included in the analyses. We then examined the administratively documented, facility-level variation in the proportion of individuals with any of the 5 SDoH administrative codes and examined the distribution of their use across all qualifying facilities.
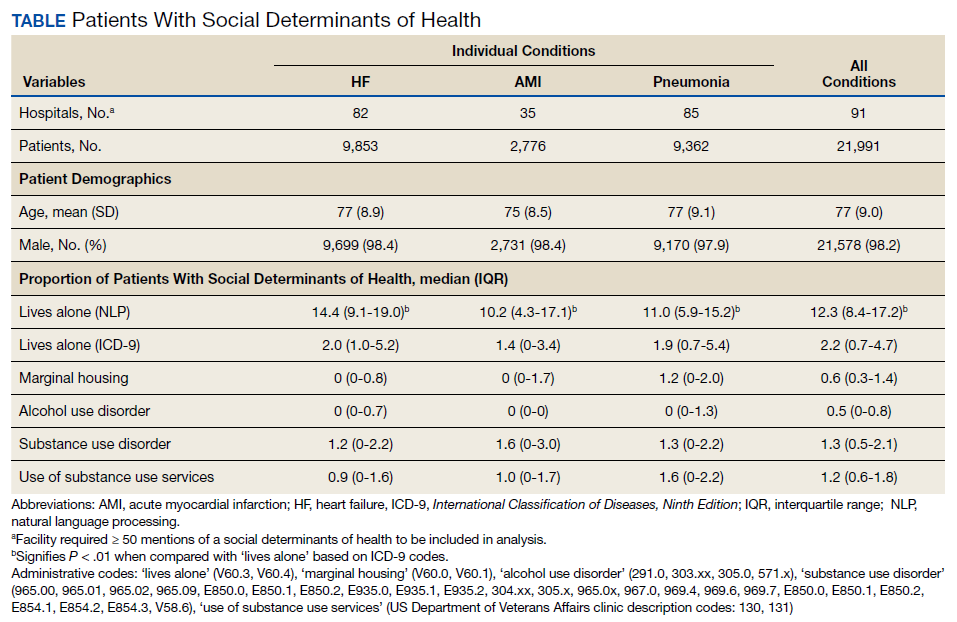
Because variability may be due to regional coding differences, we examined the difference in the estimated prevalence of the risk factor lives alone by using a previously developed natural language processing (NLP) program.9 The NLP program is a rule-based system designed to automatically extract information that requires inferencing from clinical notes (eg, discharge summaries and nursing, social work, emergency department physician, primary care, and hospital admission notes). For instance, the program identifies whether there was direct or indirect evidence that the patient did or did not live alone. In addition to extracting data on lives alone, the NLP program has the capacity to extract information on lack of social support and living alone—2 characteristics without VHA interventions, which were not examined here. The NLP program was developed and evaluated using at least 1 year of notes prior to index hospitalization. Because this program was developed and validated on a 2012 data set, we were limited to using a cohort from this year as well.
All analyses were conducted using SAS Version 9.4. The San Francisco VA Medical Center Institutional Review Board approved this study.
Results
In total, 21,991 patients with either HF (9,853), pneumonia (9,362), or AMI (2,776) were identified across 91 VHA facilities. The majority were male (98%) and had a median (SD) age of 77.0 (9.0) years. The median facility-level proportion of veterans who had any of the SDoH risk factors extracted through administrative codes was low across all conditions, ranging from 0.5 to 2.2%. The most prevalent factors among patients admitted for HF, AMI, and pneumonia were lives alone (2.0% [Interquartile range (IQR), 1.0-5.2], 1.4% [IQR, 0-3.4], and 1.9% [IQR, 0.7-5.4]), substance use disorder (1.2% [IQR, 0-2.2], 1.6% [IQR: 0-3.0], and 1.3% [IQR, 0-2.2] and use of substance use services (0.9% [IQR, 0-1.6%], 1.0% [IQR, 0-1.7%], and 1.6% [IQR, 0-2.2%], respectively [Table]).
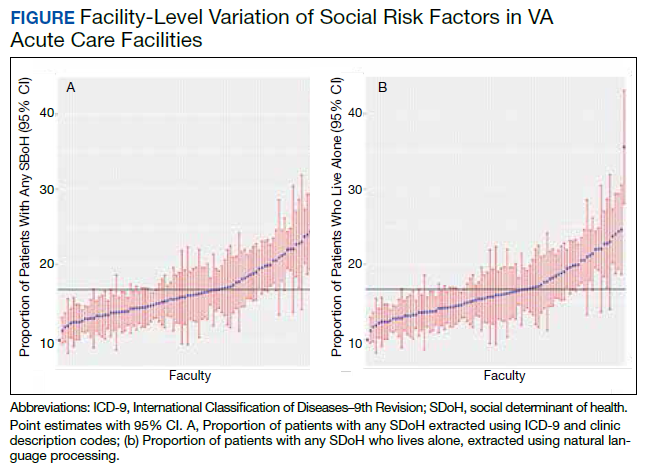
When utilizing the NLP algorithm, the documented prevalence of lives alone in the free text of the medical record was higher than administrative coding across all conditions (12.3% vs. 2.2%; P < .01). Among each of the 3 assessed conditions, HF (14.4% vs 2.0%, P < .01) had higher levels of lives alone compared with pneumonia (11% vs 1.9%, P < .01), and AMI (10.2% vs 1.4%, P < .01) when using the NLP algorithm. When we examined the documented facility-level variation in the proportion of individuals with any of the 5 SDoH administrative codes or NLP, we found large variability across all facilities—regardless of extraction method (Figure).
Discussion
While SDoH are known to impact health outcomes, the presence of these risk factors in administrative data among individuals hospitalized for common medical issues is low and variable across VHA facilities. Understanding the documented, facility-level variability of these measures may assist the VHA in determining how it invests time and resources—as different facilities may disproportionately serve a higher number of vulnerable individuals. Beyond the VHA, these findings have generalizable lessons for the US health care system, which has come to recognize how these risk factors impact patients’ health.10
Although the proportion of individuals with any of the assessed SDoH identified by administrative data was low, our findings are in line with recent studies that showed other risk factors such as social isolation (0.65%), housing issues (0.19%), and financial strain (0.07%) had similarly low prevalence.8,11 Although the exact prevalence of such factors remains unclear, these findings highlight that SDoH do not appear to be well documented in administrative data. Low coding rates are likely due to the fact that SDoH administrative codes are not tied to financial reimbursement—thus not incentivizing their use by clinicians or hospital systems.
In 2014, an Institute of Medicine report suggested that collection of SDoH in electronic health data as a means to better empower clinicians and health care systems to address social disparities and further support research in SDoH.12 Since then, data collection using SDoH screening tools has become more common across settings, but is not consistently translated to standardized data due to lack of industry consensus and technical barriers.13 To improve this process, the Centers for Medicare and Medicaid Services created “z-codes” for the ICD-10 classification system—a subset of codes that are meant to better capture patients’ underlying social risk.14 It remains to be seen if such administrative codes have improved the documentation of SDoH.
As health care systems have grown to understand the impact of SDoH on health outcomes,other means of collecting these data have evolved.1,10 For example, NLP-based extraction methods and electronic screening tools have been proposed and utilized as alternative for obtaining this information. Our findings suggest that some of these measures (eg, lives alone) often may be documented as part of routine care in the electronic health record, thus highlighting NLP as a tool to obtain such data. However, other studies using NLP technology to extract SDoH have shown this technology is often complicated by quality issues (ie, missing data), complex methods, and poor integration with current information technology infrastructures—thus limiting its use in health care delivery.15-18
While variance among SDoH across a national health care system is natural, it remains an important systems-level characteristic that health care leaders and policymakers should appreciate. As health care systems disperse financial resources and initiate quality improvement initiatives to address SDoH, knowing that not all facilities are equally affected by SDoH should impact allocation of such resources and energies. Although previous work has highlighted regional and neighborhood levels of variation within the VHA and other health care systems, to our knowledge, this is the first study to examine variability at the facility-level within the VHA.2,4,13,19
Limitations
There are several limitations to this study. First, though our findings are in line with previous data in other health care systems, generalizability beyond the VA, which primarily cares for older, male patients, may be limited.8 Though, as the nation’s largest health care system, lessons from the VHA can still be useful for other health care systems as they consider SDoH variation. Second, among the many SDoH previously identified to impact health, our analysis only focused on 5 such variables. Administrative and medical record documentation of other SDoH may be more common and less variable across institutions. Third, while our data suggests facility-level variation in these measures, this may be in part related to variation in coding across facilities. However, the single SDoH variable extracted using NLP also varied at the facility-level, suggesting that coding may not entirely drive the variation observed.
Conclusions
As US health care systems continue to address SDoH, our findings highlight the various challenges in obtaining accurate data on a patient’s social risk. Moreover, these findings highlight the large variability that exists among institutions in a national integrated health care system. Future work should explore the prevalence and variance of other SDoH as a means to help guide resource allocation and prioritize spending to better address SDoH where it is most needed.
Acknowledgments
This work was supported by NHLBI R01 RO1 HL116522-01A1. Support for VA/CMS data is provided by the US Department of Veterans Affairs, Veterans Health Administration, Office of Research and Development, Health Services Research and Development, VA Information Resource Center (Project Numbers SDR 02-237 and 98-004).
1. Social determinants of health (SDOH). https://catalyst.nejm.org/doi/full/10.1056/CAT.17.0312. Published December 1, 2017. Accessed December 8, 2020.
2. Hatef E, Searle KM, Predmore Z, et al. The Impact of Social Determinants of Health on hospitalization in the Veterans Health Administration. Am J Prev Med. 2019;56(6):811-818. doi:10.1016/j.amepre.2018.12.012
3. Lushniak BD, Alley DE, Ulin B, Graffunder C. The National Prevention Strategy: leveraging multiple sectors to improve population health. Am J Public Health. 2015;105(2):229-231. doi:10.2105/AJPH.2014.302257
4. Nelson K, Schwartz G, Hernandez S, Simonetti J, Curtis I, Fihn SD. The association between neighborhood environment and mortality: results from a national study of veterans. J Gen Intern Med. 2017;32(4):416-422. doi:10.1007/s11606-016-3905-x
5. Gundlapalli AV, Redd A, Bolton D, et al. Patient-aligned care team engagement to connect veterans experiencing homelessness with appropriate health care. Med Care. 2017;55 Suppl 9 Suppl 2:S104-S110. doi:10.1097/MLR.0000000000000770
6. Rash CJ, DePhilippis D. Considerations for implementing contingency management in substance abuse treatment clinics: the Veterans Affairs initiative as a model. Perspect Behav Sci. 2019;42(3):479-499. doi:10.1007/s40614-019-00204-3.
7. Ompad DC, Galea S, Caiaffa WT, Vlahov D. Social determinants of the health of urban populations: methodologic considerations. J Urban Health. 2007;84(3 Suppl):i42-i53. doi:10.1007/s11524-007-9168-4
8. Hatef E, Rouhizadeh M, Tia I, et al. Assessing the availability of data on social and behavioral determinants in structured and unstructured electronic health records: a retrospective analysis of a multilevel health care system. JMIR Med Inform. 2019;7(3):e13802. doi:10.2196/13802
9. Conway M, Keyhani S, Christensen L, et al. Moonstone: a novel natural language processing system for inferring social risk from clinical narratives. J Biomed Semantics. 2019;10(1):6. doi:10.1186/s13326-019-0198-0
10. Adler NE, Cutler DM, Fielding JE, et al. Addressing social determinants of health and health disparities: a vital direction for health and health care. Discussion Paper. NAM Perspectives. National Academy of Medicine, Washington, DC. doi:10.31478/201609t
11. Cottrell EK, Dambrun K, Cowburn S, et al. Variation in electronic health record documentation of social determinants of health across a national network of community health centers. Am J Prev Med. 2019;57(6):S65-S73. doi:10.1016/j.amepre.2019.07.014
12. Committee on the Recommended Social and Behavioral Domains and Measures for Electronic Health Records, Board on Population Health and Public Health Practice, Institute of Medicine. Capturing Social and Behavioral Domains and Measures in Electronic Health Records: Phase 2. National Academies Press (US); 2015.
13. Gottlieb L, Tobey R, Cantor J, Hessler D, Adler NE. Integrating Social And Medical Data To Improve Population Health: Opportunities And Barriers. Health Aff (Millwood). 2016;35(11):2116-2123. doi:10.1377/hlthaff.2016.0723
14. Centers for Medicare and Medicaid Service, Office of Minority Health. Z codes utilization among medicare fee-for-service (FFS) beneficiaries in 2017. Published January 2020. Accessed December 8, 2020. https://www.cms.gov/files/document/cms-omh-january2020-zcode-data-highlightpdf.pdf
15. Kharrazi H, Wang C, Scharfstein D. Prospective EHR-based clinical trials: the challenge of missing data. J Gen Intern Med. 2014;29(7):976-978. doi:10.1007/s11606-014-2883-0
16. Weiskopf NG, Weng C. Methods and dimensions of electronic health record data quality assessment: enabling reuse for clinical research. J Am Med Inform Assoc. 2013;20(1):144-151. doi:10.1136/amiajnl-2011-000681
17. Anzaldi LJ, Davison A, Boyd CM, Leff B, Kharrazi H. Comparing clinician descriptions of frailty and geriatric syndromes using electronic health records: a retrospective cohort study. BMC Geriatr. 2017;17(1):248. doi:10.1186/s12877-017-0645-7
18. Chen T, Dredze M, Weiner JP, Kharrazi H. Identifying vulnerable older adult populations by contextualizing geriatric syndrome information in clinical notes of electronic health records. J Am Med Inform Assoc. 2019;26(8-9):787-795. doi:10.1093/jamia/ocz093
19. Raphael E, Gaynes R, Hamad R. Cross-sectional analysis of place-based and racial disparities in hospitalisation rates by disease category in California in 2001 and 2011. BMJ Open. 2019;9(10):e031556. doi:10.1136/bmjopen-2019-031556
Social determinants of health (SDoH) are social, economic, environmental, and occupational factors that are known to influence an individual’s health care utilization and clinical outcomes.1,2 Because the Veterans Health Administration (VHA) is charged to address both the medical and nonmedical needs of the veteran population, it is increasingly interested in the impact SDoH have on veteran care.3,4 To combat the adverse impact of such factors, the VHA has implemented several large-scale programs across the US that focus on prevalent SDoH, such as homelessness, substance abuse, and alcohol use disorders.5,6 While such risk factors are generally universal in their distribution, variation across regions, between urban and rural spaces, and even within cities has been shown to exist in private settings.7 Understanding such variability potentially could be helpful to US Department of Veterans Affairs (VA) policymakers and leaders to better allocate funding and resources to address such issues.
Although previous work has highlighted regional and neighborhood-level variability of SDoH, no study has examined the facility-level variability of commonly encountered social risk factors within the VHA.4,8 The aim of this study was to describe the interfacility variation of 5 common SDoH known to influence health and health outcomes among a national cohort of veterans hospitalized for common medical issues by using administrative data.
Methods
We used a national cohort of veterans aged ≥ 65 years who were hospitalized at a VHA acute care facility with a primary discharge diagnosis of acute myocardial infarction (AMI), heart failure (HF), or pneumonia in 2012. These conditions were chosen because they are publicly reported and frequently used for interfacility comparison.
Using the International Classification of Diseases–9th Revision (ICD-9) and VHA clinical stop codes, we calculated the median documented proportion of patients with any of the following 5 SDoH: lived alone, marginal housing, alcohol use disorder, substance use disorder, and use of substance use services for patients presenting with HF, MI, and pneumonia (Table). These SDoH were chosen because they are intervenable risk factors for which the VHA has several programs (eg, homeless outreach, substance abuse, and tobacco cessation). To examine the variability of these SDoH across VHA facilities, we determined the number of hospitals that had a sufficient number of admissions (≥ 50) to be included in the analyses. We then examined the administratively documented, facility-level variation in the proportion of individuals with any of the 5 SDoH administrative codes and examined the distribution of their use across all qualifying facilities.
Because variability may be due to regional coding differences, we examined the difference in the estimated prevalence of the risk factor lives alone by using a previously developed natural language processing (NLP) program.9 The NLP program is a rule-based system designed to automatically extract information that requires inferencing from clinical notes (eg, discharge summaries and nursing, social work, emergency department physician, primary care, and hospital admission notes). For instance, the program identifies whether there was direct or indirect evidence that the patient did or did not live alone. In addition to extracting data on lives alone, the NLP program has the capacity to extract information on lack of social support and living alone—2 characteristics without VHA interventions, which were not examined here. The NLP program was developed and evaluated using at least 1 year of notes prior to index hospitalization. Because this program was developed and validated on a 2012 data set, we were limited to using a cohort from this year as well.
All analyses were conducted using SAS Version 9.4. The San Francisco VA Medical Center Institutional Review Board approved this study.
Results
In total, 21,991 patients with either HF (9,853), pneumonia (9,362), or AMI (2,776) were identified across 91 VHA facilities. The majority were male (98%) and had a median (SD) age of 77.0 (9.0) years. The median facility-level proportion of veterans who had any of the SDoH risk factors extracted through administrative codes was low across all conditions, ranging from 0.5 to 2.2%. The most prevalent factors among patients admitted for HF, AMI, and pneumonia were lives alone (2.0% [Interquartile range (IQR), 1.0-5.2], 1.4% [IQR, 0-3.4], and 1.9% [IQR, 0.7-5.4]), substance use disorder (1.2% [IQR, 0-2.2], 1.6% [IQR: 0-3.0], and 1.3% [IQR, 0-2.2] and use of substance use services (0.9% [IQR, 0-1.6%], 1.0% [IQR, 0-1.7%], and 1.6% [IQR, 0-2.2%], respectively [Table]).
When utilizing the NLP algorithm, the documented prevalence of lives alone in the free text of the medical record was higher than administrative coding across all conditions (12.3% vs. 2.2%; P < .01). Among each of the 3 assessed conditions, HF (14.4% vs 2.0%, P < .01) had higher levels of lives alone compared with pneumonia (11% vs 1.9%, P < .01), and AMI (10.2% vs 1.4%, P < .01) when using the NLP algorithm. When we examined the documented facility-level variation in the proportion of individuals with any of the 5 SDoH administrative codes or NLP, we found large variability across all facilities—regardless of extraction method (Figure).
Discussion
While SDoH are known to impact health outcomes, the presence of these risk factors in administrative data among individuals hospitalized for common medical issues is low and variable across VHA facilities. Understanding the documented, facility-level variability of these measures may assist the VHA in determining how it invests time and resources—as different facilities may disproportionately serve a higher number of vulnerable individuals. Beyond the VHA, these findings have generalizable lessons for the US health care system, which has come to recognize how these risk factors impact patients’ health.10
Although the proportion of individuals with any of the assessed SDoH identified by administrative data was low, our findings are in line with recent studies that showed other risk factors such as social isolation (0.65%), housing issues (0.19%), and financial strain (0.07%) had similarly low prevalence.8,11 Although the exact prevalence of such factors remains unclear, these findings highlight that SDoH do not appear to be well documented in administrative data. Low coding rates are likely due to the fact that SDoH administrative codes are not tied to financial reimbursement—thus not incentivizing their use by clinicians or hospital systems.
In 2014, an Institute of Medicine report suggested that collection of SDoH in electronic health data as a means to better empower clinicians and health care systems to address social disparities and further support research in SDoH.12 Since then, data collection using SDoH screening tools has become more common across settings, but is not consistently translated to standardized data due to lack of industry consensus and technical barriers.13 To improve this process, the Centers for Medicare and Medicaid Services created “z-codes” for the ICD-10 classification system—a subset of codes that are meant to better capture patients’ underlying social risk.14 It remains to be seen if such administrative codes have improved the documentation of SDoH.
As health care systems have grown to understand the impact of SDoH on health outcomes,other means of collecting these data have evolved.1,10 For example, NLP-based extraction methods and electronic screening tools have been proposed and utilized as alternative for obtaining this information. Our findings suggest that some of these measures (eg, lives alone) often may be documented as part of routine care in the electronic health record, thus highlighting NLP as a tool to obtain such data. However, other studies using NLP technology to extract SDoH have shown this technology is often complicated by quality issues (ie, missing data), complex methods, and poor integration with current information technology infrastructures—thus limiting its use in health care delivery.15-18
While variance among SDoH across a national health care system is natural, it remains an important systems-level characteristic that health care leaders and policymakers should appreciate. As health care systems disperse financial resources and initiate quality improvement initiatives to address SDoH, knowing that not all facilities are equally affected by SDoH should impact allocation of such resources and energies. Although previous work has highlighted regional and neighborhood levels of variation within the VHA and other health care systems, to our knowledge, this is the first study to examine variability at the facility-level within the VHA.2,4,13,19
Limitations
There are several limitations to this study. First, though our findings are in line with previous data in other health care systems, generalizability beyond the VA, which primarily cares for older, male patients, may be limited.8 Though, as the nation’s largest health care system, lessons from the VHA can still be useful for other health care systems as they consider SDoH variation. Second, among the many SDoH previously identified to impact health, our analysis only focused on 5 such variables. Administrative and medical record documentation of other SDoH may be more common and less variable across institutions. Third, while our data suggests facility-level variation in these measures, this may be in part related to variation in coding across facilities. However, the single SDoH variable extracted using NLP also varied at the facility-level, suggesting that coding may not entirely drive the variation observed.
Conclusions
As US health care systems continue to address SDoH, our findings highlight the various challenges in obtaining accurate data on a patient’s social risk. Moreover, these findings highlight the large variability that exists among institutions in a national integrated health care system. Future work should explore the prevalence and variance of other SDoH as a means to help guide resource allocation and prioritize spending to better address SDoH where it is most needed.
Acknowledgments
This work was supported by NHLBI R01 RO1 HL116522-01A1. Support for VA/CMS data is provided by the US Department of Veterans Affairs, Veterans Health Administration, Office of Research and Development, Health Services Research and Development, VA Information Resource Center (Project Numbers SDR 02-237 and 98-004).
1. Social determinants of health (SDOH). https://catalyst.nejm.org/doi/full/10.1056/CAT.17.0312. Published December 1, 2017. Accessed December 8, 2020.
2. Hatef E, Searle KM, Predmore Z, et al. The Impact of Social Determinants of Health on hospitalization in the Veterans Health Administration. Am J Prev Med. 2019;56(6):811-818. doi:10.1016/j.amepre.2018.12.012
3. Lushniak BD, Alley DE, Ulin B, Graffunder C. The National Prevention Strategy: leveraging multiple sectors to improve population health. Am J Public Health. 2015;105(2):229-231. doi:10.2105/AJPH.2014.302257
4. Nelson K, Schwartz G, Hernandez S, Simonetti J, Curtis I, Fihn SD. The association between neighborhood environment and mortality: results from a national study of veterans. J Gen Intern Med. 2017;32(4):416-422. doi:10.1007/s11606-016-3905-x
5. Gundlapalli AV, Redd A, Bolton D, et al. Patient-aligned care team engagement to connect veterans experiencing homelessness with appropriate health care. Med Care. 2017;55 Suppl 9 Suppl 2:S104-S110. doi:10.1097/MLR.0000000000000770
6. Rash CJ, DePhilippis D. Considerations for implementing contingency management in substance abuse treatment clinics: the Veterans Affairs initiative as a model. Perspect Behav Sci. 2019;42(3):479-499. doi:10.1007/s40614-019-00204-3.
7. Ompad DC, Galea S, Caiaffa WT, Vlahov D. Social determinants of the health of urban populations: methodologic considerations. J Urban Health. 2007;84(3 Suppl):i42-i53. doi:10.1007/s11524-007-9168-4
8. Hatef E, Rouhizadeh M, Tia I, et al. Assessing the availability of data on social and behavioral determinants in structured and unstructured electronic health records: a retrospective analysis of a multilevel health care system. JMIR Med Inform. 2019;7(3):e13802. doi:10.2196/13802
9. Conway M, Keyhani S, Christensen L, et al. Moonstone: a novel natural language processing system for inferring social risk from clinical narratives. J Biomed Semantics. 2019;10(1):6. doi:10.1186/s13326-019-0198-0
10. Adler NE, Cutler DM, Fielding JE, et al. Addressing social determinants of health and health disparities: a vital direction for health and health care. Discussion Paper. NAM Perspectives. National Academy of Medicine, Washington, DC. doi:10.31478/201609t
11. Cottrell EK, Dambrun K, Cowburn S, et al. Variation in electronic health record documentation of social determinants of health across a national network of community health centers. Am J Prev Med. 2019;57(6):S65-S73. doi:10.1016/j.amepre.2019.07.014
12. Committee on the Recommended Social and Behavioral Domains and Measures for Electronic Health Records, Board on Population Health and Public Health Practice, Institute of Medicine. Capturing Social and Behavioral Domains and Measures in Electronic Health Records: Phase 2. National Academies Press (US); 2015.
13. Gottlieb L, Tobey R, Cantor J, Hessler D, Adler NE. Integrating Social And Medical Data To Improve Population Health: Opportunities And Barriers. Health Aff (Millwood). 2016;35(11):2116-2123. doi:10.1377/hlthaff.2016.0723
14. Centers for Medicare and Medicaid Service, Office of Minority Health. Z codes utilization among medicare fee-for-service (FFS) beneficiaries in 2017. Published January 2020. Accessed December 8, 2020. https://www.cms.gov/files/document/cms-omh-january2020-zcode-data-highlightpdf.pdf
15. Kharrazi H, Wang C, Scharfstein D. Prospective EHR-based clinical trials: the challenge of missing data. J Gen Intern Med. 2014;29(7):976-978. doi:10.1007/s11606-014-2883-0
16. Weiskopf NG, Weng C. Methods and dimensions of electronic health record data quality assessment: enabling reuse for clinical research. J Am Med Inform Assoc. 2013;20(1):144-151. doi:10.1136/amiajnl-2011-000681
17. Anzaldi LJ, Davison A, Boyd CM, Leff B, Kharrazi H. Comparing clinician descriptions of frailty and geriatric syndromes using electronic health records: a retrospective cohort study. BMC Geriatr. 2017;17(1):248. doi:10.1186/s12877-017-0645-7
18. Chen T, Dredze M, Weiner JP, Kharrazi H. Identifying vulnerable older adult populations by contextualizing geriatric syndrome information in clinical notes of electronic health records. J Am Med Inform Assoc. 2019;26(8-9):787-795. doi:10.1093/jamia/ocz093
19. Raphael E, Gaynes R, Hamad R. Cross-sectional analysis of place-based and racial disparities in hospitalisation rates by disease category in California in 2001 and 2011. BMJ Open. 2019;9(10):e031556. doi:10.1136/bmjopen-2019-031556