User login
Food Insecurity Among Veterans: Resources to Screen and Intervene
Nearly 1 in 8 households—and 1 in 6 households with children—experienced food insecurity in 2017, defined as limited or uncertain availability of nutritionally adequate and safe foods.1 Food insecurity is often even more pronounced among households with individuals with acute or chronic medical conditions.2-6 Moreover, food insecurity is independently associated with a range of adverse health outcomes, including poorer control of diabetes mellitus, hypertension, depression and other major psychiatric disorders, HIV, and chronic lung and kidney disease, as well as poorer overall health status.7-14 Food insecurity also has been associated with increased health care costs and acute care utilization as well as increased probability of delayed or missed care.15-19
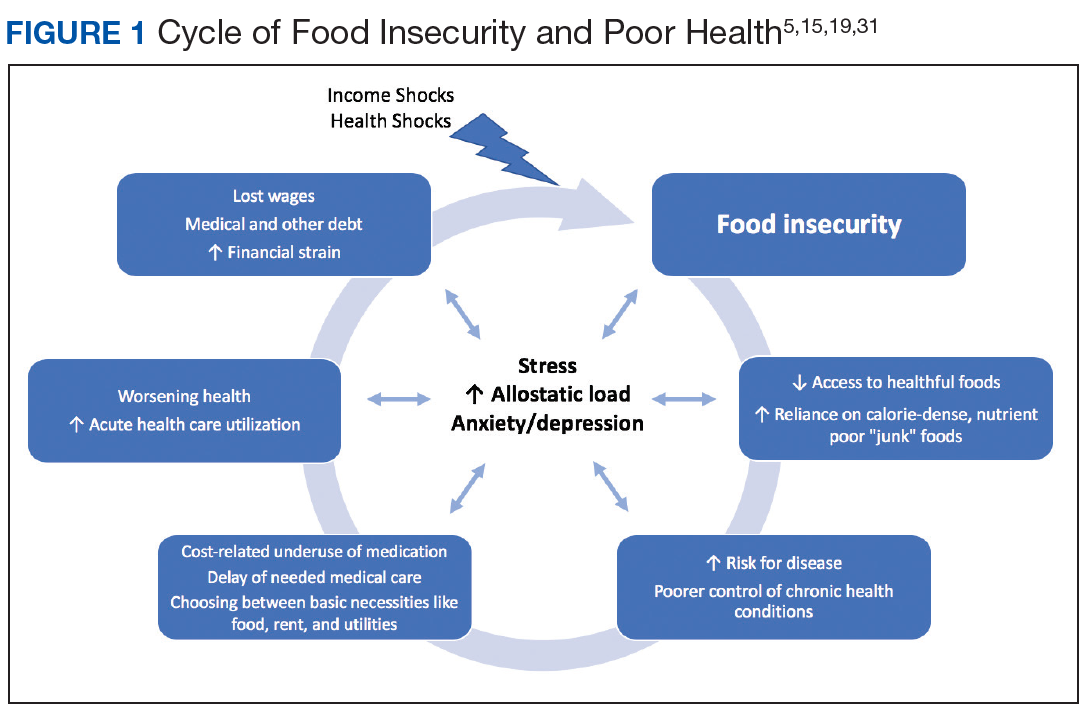
The relationship between food insecurity and poor health outcomes is a complex and often cyclic phenomenon (Figure 1). Poor nutritional status is fueled by limited access to healthful foods as well as increased reliance on calorie-dense and nutrient-poor “junk” foods, which are less expensive and often more readily available in low-income neighborhoods.5,20-24 These compensatory dietary patterns place individuals at higher risk for developing cardiometabolic conditions and for poor control of these conditions.5,8,9,12,25,26 Additionally, the physiological and psychological stressors of food insecurity may precipitate depression and anxiety or worsen existing mental health conditions, resulting in feelings of overwhelm and decreased self-management capacity.5,8,27-31 Food insecurity has further been associated with poor sleep, declines in cognitive function, and increased falls, particularly among the frail and elderly.32-34
Individuals experiencing food insecurity often report having to make trade-offs between food and other necessities, such as paying rent or utilities. Additional strategies to stretch limited resources include cost-related underuse of medication and delays in needed medical care.4,17,31,35 In a nationally representative survey among adults with at least 1 chronic medical condition, 1 in 3 reported having to choose between food and medicine; 11% were unable to afford either.3 Furthermore, the inability to reliably adhere to medication regimens that need to be taken with food can result in potentially life-threatening hypoglycemia (as can lack of food regardless of medication use).5,26,36 In addition to the more obvious risks of glucose-lowering medications, such as insulin and long-acting sulfonylureas in patients experiencing food insecurity, many drugs commonly used among nondiabetic adults such as ACE-inhibitors, β blockers, quinolones, and salicylates can also precipitate hypoglycemia, and food insecurity has been associated with experiences of hypoglycemia even among individuals without diabetes mellitus.32,37 In one study the risk for hospital admissions for hypoglycemia among low-income populations increased by 27% at the end of the month when food budgets were more likely to be exhausted.38 Worsening health status and increased emergency department visits and hospitalizations may then result in lost wages and mounting medical bills, contributing to further financial strain and worsening food insecurity.
Prevalence and Importance of Food Insecurity Among US Veterans
Nearly 1.5 million veterans in the US are living below the federal poverty level (FPL).39 An additional 2.4 million veterans are living paycheck to paycheck at < 200% of the FPL.40 Veterans living in poverty are at even higher risk than nonveterans for food insecurity, homelessness, and other material hardship.41
Estimates of food insecurity among veterans vary widely, ranging from 6% to 24%—nearly twice that of the general US population.8,42-45 Higher rates of food insecurity have been reported among certain high-risk subgroups, including veterans who served in Iraq and Afghanistan (27%), female veterans (28%), homeless and formerly homeless veterans (49%), and veterans with serious mental illness (35%).6,32,43,46 Additional risk factors for food insecurity specific to veteran populations include younger age, having recently left active-duty military service, and lower final military paygrade.42,45-47 As in the general population, veteran food insecurity is associated with a range of adverse health outcomes, including poorer overall health status as well as increased probability of delayed or missed care.6,8,32,42-44,46
Even among veterans enrolled in federal food assistance programs, many still struggle to afford nutritionally adequate foods. As one example, in a study of mostly male homeless and formerly homeless veterans, O’Toole and colleagues found that nearly half of those reporting food insecurity were already receiving federal food assistance benefits, and 22% relied on emergency food resources.32 Of households served by Feeding America food pantries and meal programs, 20% have a member who has served in the US military.48
Federal Programs To Address Food Insecurity
There are several important federal food assistance programs designed to help alleviate food insecurity. The Supplemental Nutrition Assistance Program (SNAP, formerly the Food Stamp program) is the largest federal food assistance program and provides low-income Americans with cash benefits to purchase food. SNAP has been shown to substantially reduce food insecurity.7,49 The program also is associated with significant decreases in cost-related medication nonadherence as well as reductions in health care costs and both acute care and nursing home utilization.16,50-54 Although nearly 1.4 million veterans live in SNAP-enrolled households, 59% of eligible veterans are not enrolled.43,55 Closing this SNAP eligibility-enrollment gap, has been a focus of recent efforts to improve long-term food security among veterans. There also are several federal food assistance programs for households with children, including the Special Supplemental Nutrition Program for Women, Infants, and Children (WIC) and school meals programs. Among federal nutrition programs for seniors, the Older American’s Act contains designated funding to support nutrition services for older adults, including congregate meal programs in community settings like senior centers, places of worship, and housing communities, and home-delivered meals through programs like Meals on Wheels.56
VHA Response to Food Insecurity
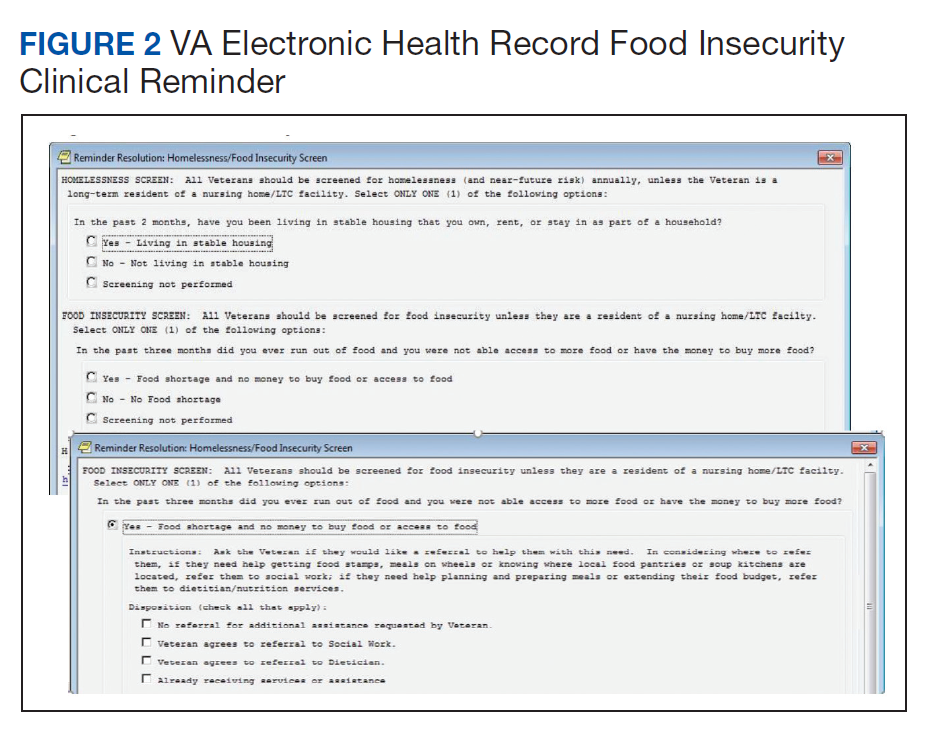
The Veterans Health Administration (VHA) is the country’s largest integrated, federally funded health care system.57 In November 2015, congressional briefings on veteran food insecurity organized by the national non-profit organization MAZON: A Jewish Response to Hunger and hosted with bipartisan support were provided to the US House and Senate. As a result of these briefings, VHA chartered the national Ensuring Veteran Food Security Workgroup with a mandate to partner with governmental and nonprofit agencies to “focus on the issue of food insecurity, the identification of veterans at risk, the needed training of VHA staff and the coordination of resources and initiatives to support the veterans for whom we care.” Building off a pilot in US Department of Veterans Affairs (VA) Homeless Patient Aligned Care Teams (H-PACTs),32 VHA subsequently integrated a single-item food insecurity screening tool into the VA electronic health record (EHR) clinical reminder system (Figure 2). The clinical reminder, which was rolled out across VA medical centers nationally in October 2017, provides an alert to screen all noninstitutionalized veterans for food insecurity. To date, nearly 5 million veterans have been screened. When a veteran endorses food insecurity based on the initial screening question, a prompt appears to offer the veteran a referral to a social worker and/or dietitian. Positive screening results also should be communicated to the patient’s primary care provider. Depending on site-specific clinical flow, the reminders are typically completed in the outpatient setting either by nurses or medical assistants during intake or by providers as part of the clinical visit. However, any member of the health care team can complete the clinical reminder at any time. As of September 2019, approximately 74,000 veterans have been identified as food insecure.58
Addressing Food Insecurity
VHA has been a recognized leader in addressing homelessness and other social determinants of health through its integrated care and PACT delivery models.59-61 The food insecurity clinical reminder was designed to facilitate a tailored, interdisciplinary approach to identify and address food insecurity. Interdisciplinary care team members—including medical assistants, clinicians, social workers, registered dietitians, nurse care managers, occupational or physical therapists, and pharmacists—are uniquely positioned to identify veterans impacted by food insecurity, assess for associated clinical and/or social risk factors, and offer appropriate medical and nutrition interventions and resource referrals.
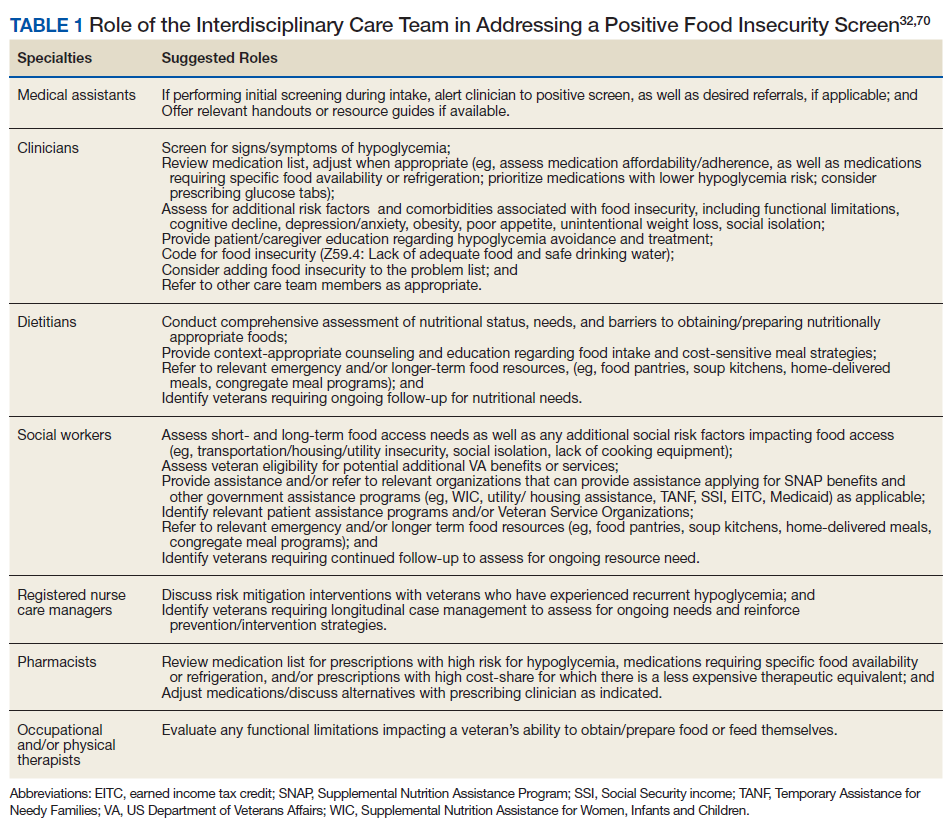
This interdisciplinary team-based model is essential given the range of potential drivers underlying veteran experiences of food insecurity and subsequent health outcomes. It is critically important for clinicians to review the medication list with veterans screening positive for food insecurity to assess for risk of hypoglycemia and/or cost-related nonadherence, make any necessary adjustments to therapeutic regimens, and assess for additional risk factors associated with food insecurity. Examples of tailored nutrition counseling that clinical dietitians may provide include meal preparation strategies for veterans who only have access to a microwave or hotplate, or recommendations for how veterans on medically restricted diets can best navigate food selection at soup kitchens or food pantries. Resource referrals provided by social workers or other care team members may include both emergency food resources to address immediate shortages (eg, food pantries, soup kitchens, or vouchers for free lunch) as well as resources focused on improving longer term food security (eg, federal food assistance programs or home delivered meal programs). Importantly, although providing a list of food resources may be helpful for some patients, such lists are often insufficient.62,63 Many patients require active assistance with program enrollment either onsite the day of their clinic visit or through connection with a partnering community-based organization that can, in turn, identify appropriate resources and facilitate program enrollment.63,64 Planned follow-up is also crucial to determine whether referrals are successful and to assess for ongoing need. Proposed roles for interdisciplinary care team members in addressing a positive food insecurity screen are outlined in Table 1.
VHA-Community Partnerships
In addition to services offered within VA, public and private sector partnerships can greatly enhance the range of resources available to food insecure veterans. Several VA facilities have developed formal community partnerships, such as the Veterans Pantry Pilot (VPP) program, a national partnership between Feeding America food banks and VA medical centers to establish onsite or mobile food pantries. There are currently 17 active Feeding America VPP sites, with a number of additional sites under development. Several of the VPP sites also include other “wraparound services,” such as SNAP application assistance.65,66
State Veterans Affairs offices67 and Veterans Service Organizations (VSOs)68 also can serve as valuable partners for connecting veterans with needed resources. VSOs offer a range of services, including assistancewith benefit claims, employment and housing assistance, emergency food assistance, and transportation to medical appointments. Some VSOs also have established local affiliations with Meals on Wheels focused on veteran outreach and providing hot meals for low-income, homebound, and disabled veterans.
Additional Resources
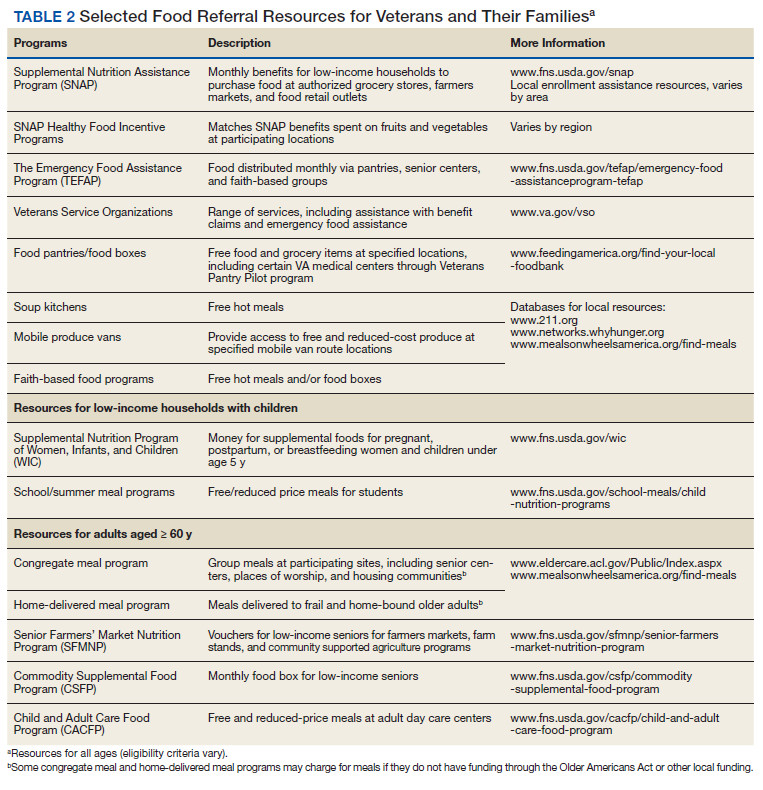
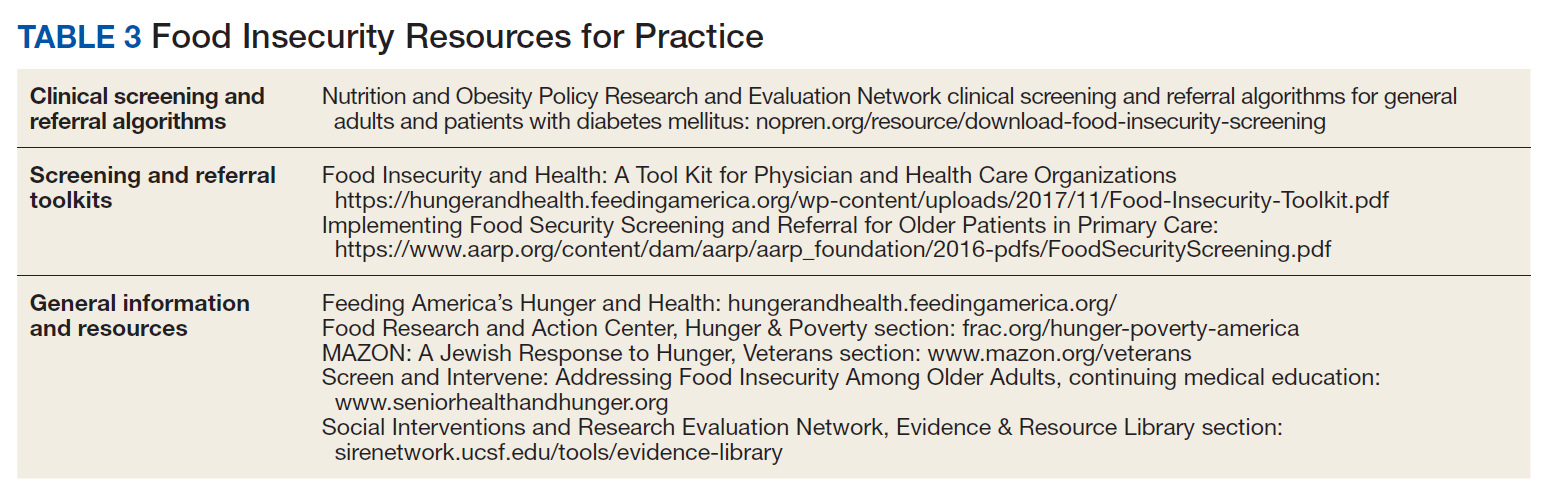
Although resources vary by regional setting, several key governmental and community-based food assistance programs are summarized in Table 2. Local community partners and online/phone-based directories, such as United Way’s 2-1-1 can help identify additional local resources. For older adults and individuals with disabilities, local Aging and Disability Resources Centers can provide information and assistance connecting to needed resources.69 Finally, there are a number of online resources available for clinicians interested in learning more about the impact of food insecurity on health and tools to use in the clinical setting (Table 3).
Conclusion
The VA has recognized food insecurity as a critical concern for the well-being of our nation’s veterans. Use of the EHR clinical reminder represents a crucial first step toward increasing provider awareness about veteran food insecurity and improving clinical efforts to address food insecurity once identified. Through the reminder, health care teams can connect veterans to needed resources and create both the individual and population-level data necessary to inform VHA and community efforts to address veteran food insecurity. Clinical reminder data are currently being used for local quality improvement efforts and have established the need nationally for formalized partnerships between VHA Social Work Services and Nutrition and Food Services to connect veterans with food and provide them with strategies to best use available food resources.
Moving forward, the Ensuring Veteran Food Security Workgroup continues to work with agencies and organizations across the country to improve food insecure veterans’ access to needed services. In addition to existing VA partnerships with Feeding America for the VPP, memorandums of understanding are currently underway to formalize partnerships with both the Food Research and Action Center (FRAC) and MAZON. Additional research is needed both to formally validate the current food insecurity clinical reminder screening question and to identify best practices and potential models for how to most effectively use VHA-community partnerships to address the unique needs of the veteran population.
Ensuring the food security of our nation’s veterans is essential to VA’s commitment to providing integrated, veteran-centered, whole person care. Toward that goal, VA health care teams are urged to use the clinical reminder and help connect food insecure veterans with relevant resources both within and outside of the VA health care system.
1. Coleman-Jensen A, Rabbitt MP, Gregory CA, Singh A. Household food security in the United States in 2017. http://www.ers.usda.gov/publications/pub-details/?pubid=90022. Published September 2018. Accessed December 9, 2019.
2. Berkowitz SA, Meigs JB, DeWalt D, et al. Material need insecurities, control of diabetes mellitus, and use of health care resources: results of the Measuring Economic Insecurity in Diabetes study. JAMA Intern Med. 2015;175(2):257-265.
3. Berkowitz SA, Seligman HK, Choudhry NK. Treat or eat: food insecurity, cost-related medication underuse, and unmet needs. Am J Med. 2014;127(4):303-310.e3.
4. Lyles CR, Seligman HK, Parker MM, et al. Financial strain and medication adherence among diabetes patients in an integrated health care delivery system: The Diabetes Study of Northern California (DISTANCE). Health Serv Res. 2016;51(2):610-624.
5. Seligman HK, Schillinger D. Hunger and socioeconomic disparities in chronic disease. N Engl J Med. 2010;363(1):6-9.
6. Narain K, Bean-Mayberry B, Washington DL, Canelo IA, Darling JE, Yano EM. Access to care and health outcomes among women veterans using veterans administration health care: association with food insufficiency. Womens Health Issues. 2018;28(3):267-272.
7. Gundersen C, Ziliak JP. Food insecurity and health outcomes. Health Aff. 2015;34(11):1830-1839.
8. Wang EA, McGinnis KA, Goulet J, et al; Veterans Aging Cohort Study Project Team. Food insecurity and health: data from the Veterans Aging Cohort Study. Public Health Rep. 2015;130(3):261-268.
9. Berkowitz SA, Berkowitz TSZ, Meigs JB, Wexler DJ. Trends in food insecurity for adults with cardiometabolic disease in the United States: 2005-2012. PloS One. 2017;12(6):e0179172.
10. Seligman HK, Laraia BA, Kushel MB. Food insecurity is associated with chronic disease among low-income NHANES participants. J Nutr. 2010;140(2):304-310.
11. Berkowitz SA, Baggett TP, Wexler DJ, Huskey KW, Wee CC. Food insecurity and metabolic control among U.S. adults with diabetes. Diabetes Care. 2013;36(10):3093-3099.
12. Seligman HK, Jacobs EA, López A, Tschann J, Fernandez A. Food insecurity and glycemic control among low-income patients with type 2 diabetes. Diabetes Care. 2012;35(2):233-238.
13. Banerjee T, Crews DC, Wesson DE, et al; CDC CKD Surveillance Team. Food insecurity, CKD, and subsequent ESRD in US adults. Am J Kidney Dis. 2017;70(1):38-47.
14. Bruening M, Dinour LM, Chavez JBR. Food insecurity and emotional health in the USA: a systematic narrative review of longitudinal research. Public Health Nutr. 2017;20(17):3200-3208.
15. Berkowitz SA, Basu S, Meigs JB, Seligman HK. Food insecurity and health care expenditures in the United States, 2011-2013. Health Serv Res. 2018;53(3):1600-1620.
16. Berkowitz SA, Seligman HK, Basu S. Impact of food insecurity and SNAP participation on healthcare utilization and expenditures. http://www.ukcpr.org/research/discussion-papers. Published 2017. Accessed December 9, 2019.
17. Kushel MB, Gupta R, Gee L, Haas JS. Housing instability and food insecurity as barriers to health care among low-income Americans. J Gen Intern Med. 2006;21(1):71-77.
18. Garcia SP, Haddix A, Barnett K. Incremental health care costs associated with food insecurity and chronic conditions among older adults. Chronic Dis. 2018;15:180058.
19. Berkowitz SA, Seligman HK, Meigs JB, Basu S. Food insecurity, healthcare utilization, and high cost: a longitudinal cohort study. Am J Manag Care. 2018;24(9):399-404.
20. Larson NI, Story MT, Nelson MC. Neighborhood environments: disparities in access to healthy foods in the U.S. Am J Prev Med. 2009;36(1):74-81.
21. Darmon N, Drewnowski A. Contribution of food prices and diet cost to socioeconomic disparities in diet quality and health: a systematic review and analysis. Nutr Rev. 2015;73(10):643-660.
22. Darmon N, Drewnowski A. Does social class predict diet quality? Am J Clin Nutr. 2008;87(5):1107-1117.
23. Drewnowski A. The cost of US foods as related to their nutritive value. Am J Clin Nutr. 2010;92(5):1181-1188.
24. Lucan SC, Maroko AR, Seitchik JL, Yoon DH, Sperry LE, Schechter CB. Unexpected neighborhood sources of food and drink: implications for research and community health. Am J Prev Med. 2018;55(2):e29-e38.
25. Castillo DC, Ramsey NL, Yu SS, Ricks M, Courville AB, Sumner AE. Inconsistent access to food and cardiometabolic disease: the effect of food insecurity. Curr Cardiovasc Risk Rep. 2012;6(3):245-250.
26. Seligman HK, Davis TC, Schillinger D, Wolf MS. Food insecurity is associated with hypoglycemia and poor diabetes self-management in a low-income sample with diabetes. J Health Care Poor Underserved. 2010;21(4):1227-1233.
27. Siefert K, Heflin CM, Corcoran ME, Williams DR. Food insufficiency and physical and mental health in a longitudinal survey of welfare recipients. J Health Soc Behav. 2004;45(2):171-186.
28. Mangurian C, Sreshta N, Seligman H. Food insecurity among adults with severe mental illness. Psychiatr Serv. 2013;64(9):931-932.
29. Melchior M, Caspi A, Howard LM, et al. Mental health context of food insecurity: a representative cohort of families with young children. Pediatrics. 2009;124(4):e564-e572.
30. Brostow DP, Gunzburger E, Abbate LM, Brenner LA, Thomas KS. Mental illness, not obesity status, is associated with food insecurity among the elderly in the health and retirement study. J Nutr Gerontol Geriatr. 2019;38(2):149-172.
31. Higashi RT, Craddock Lee SJ, Pezzia C, Quirk L, Leonard T, Pruitt SL. Family and social context contributes to the interplay of economic insecurity, food insecurity, and health. Ann Anthropol Pract. 2017;41(2):67-77.
32. O’Toole TP, Roberts CB, Johnson EE. Screening for food insecurity in six Veterans Administration clinics for the homeless, June-December 2015. Prev Chronic Dis. 2017;14:160375.
33. Feil DG, Pogach LM. Cognitive impairment is a major risk factor for serious hypoglycaemia; public health intervention is warranted. Evid Based Med. 2014;19(2):77.
34. Frith E, Loprinzi PD. Food insecurity and cognitive function in older adults: Brief report. Clin Nutr. 2018;37(5):1765-1768.
35. Herman D, Afulani P, Coleman-Jensen A, Harrison GG. Food insecurity and cost-related medication underuse among nonelderly adults in a nationally representative sample. Am J Public Health. 2015;105(10):e48-e59.
36. Tseng C-L, Soroka O, Maney M, Aron DC, Pogach LM. Assessing potential glycemic overtreatment in persons at hypoglycemic risk. JAMA Intern Med. 2014;174(2):259-268.
37. Vue MH, Setter SM. Drug-induced glucose alterations part 1: drug-induced hypoglycemia. Diabetes Spectr. 2011;24(3):171-177.
38. Seligman HK, Bolger AF, Guzman D, López A, Bibbins-Domingo K. Exhaustion of food budgets at month’s end and hospital admissions for hypoglycemia. Health Aff (Millwood). 2014;33(1):116-123.
39. US Department of Veterans Affairs, National Center for Veterans Analysis and Statistics. Veteran poverty trends. https://www.va.gov/vetdata/docs/specialreports/veteran_poverty_trends.pdf. Published May 2015. Accessed December 9, 2019.
40. Robbins KG, Ravi A. Veterans living paycheck to paycheck are under threat during budget debates. https://www.americanprogress.org/issues/poverty/news/2017/09/19/439023/veterans-living-paycheck-paycheck-threat-budget-debates. Published September 19, 2017. Accessed December 9, 2019.
41. Wilmoth JM, London AS, Heflin CM. Economic well-being among older-adult households: variation by veteran and disability status. J Gerontol Soc Work. 2015;58(4):399-419.
42. Brostow DP, Gunzburger E, Thomas KS. Food insecurity among veterans: findings from the health and retirement study. J Nutr Health Aging. 2017;21(10):1358-1364.
43. Pooler J, Mian P, Srinivasan M, Miller Z. Veterans and food insecurity. https://www.impaqint.com/sites/default/files/issue-briefs/VeteransFoodInsecurity_IssueBrief_V1.3.pdf. Published November 2018. Accessed December 9, 2019.
44. Schure MB, Katon JG, Wong E, Liu C-F. Food and housing insecurity and health status among U.S. adults with and without prior military service. SSM Popul Health. 2016;29(2):244-248.
45. Miller DP, Larson MJ, Byrne T, DeVoe E. Food insecurity in veteran households: findings from nationally representative data. Public Health Nutr. 2016;19(10):1731-1740.
46. Widome R, Jensen A, Bangerter A, Fu SS. Food insecurity among veterans of the US wars in Iraq and Afghanistan. Public Health Nutr. 2015;18(5):844-849.
47. London AS, Heflin CM. Supplemental Nutrition Assistance Program (SNAP) use among active-duty military personnel, veterans, and reservists. Popul Res Policy Rev. 2015;34(6):805-826.
48. Weinfield NS, Mills G, Borger C, et al. Hunger in America 2014. Natl rep prepared for Feeding America. https://www.feedingamerica.org/research/hunger-in-america. Published 2014. Accessed December 9, 2019.
49. Mabli J, Ohls J, Dragoset L, Castner L, Santos B. Measuring the Effect of Supplemental Nutrition Assistance Program (SNAP) Participation on Food Security. Washington, DC: US Department of Agriculture, Food and Nutrition Service; 2013.
50. Srinivasan M, Pooler JA. Cost-related medication nonadherence for older adults participating in SNAP, 2013–2015. Am J Public Health. 2017;108(2):224-230.
51. Heflin C, Hodges L, Mueser P. Supplemental Nutrition Assistance Progam benefits and emergency room visits for hypoglycaemia. Public Health Nutr. 2017;20(7):1314-1321.
52. Samuel LJ, Szanton SL, Cahill R, et al. Does the Supplemental Nutrition Assistance Program affect hospital utilization among older adults? The case of Maryland. Popul Health Manag. 2018;21(2):88-95.
53. Szanton SL, Samuel LJ, Cahill R, et al. Food assistance is associated with decreased nursing home admissions for Maryland’s dually eligible older adults. BMC Geriatr. 2017;17(1):162.
54. Carlson S, Keith-Jennings B. SNAP is linked with improved nutritional outcomes and lower health care costs. https://www.cbpp.org/research/food-assistance/snap-is-linked-with-improved-nutritional-outcomes-and-lower-health-care. Published January 17, 2018. Accessed December 10, 2019.
55. Keith-Jennings B, Cai L. SNAP helps almost 1.4 million low-income veterans, including thousands in every state. https://www.cbpp.org/research/food-assistance/snap-helps-almost-14-million-low-income-veterans-including-thousands-in. Updated November 8, 2018. Accessed December 10, 2019.
56. US Department of Health and Human Services. Older Americans Act nutrition programs. https://acl.gov/sites/default/files/news%202017-03/OAA-Nutrition_Programs_Fact_Sheet.pdf. Accessed December 10, 2019.
57. US Department of Veterans Affairs. About VHA. https://www.va.gov/health/aboutvha.asp. Accessed December 10, 2019.
58. US Department of Veterans Affairs. VA Corporate Data Warehouse.
59. Yano EM, Bair MJ, Carrasquillo O, Krein SL, Rubenstein LV. Patient aligned care teams (PACT): VA’s journey to implement patient-centered medical homes. J Gen Intern Med. 2014;29(suppl 2):S547-s549.
60. O’Toole TP, Pape L. Innovative efforts to address homelessness among veterans. N C Med J. 2015;76(5):311-314.
61. O’Toole TP, Johnson EE, Aiello R, Kane V, Pape L. Tailoring care to vulnerable populations by incorporating social determinants of health: the Veterans Health Administration’s “Homeless Patient Aligned Care Team” Program. Prev Chronic Dis. 2016;13:150567.
62. Marpadga S, Fernandez A, Leung J, Tang A, Seligman H, Murphy EJ. Challenges and successes with food resource referrals for food-insecure patients with diabetes. Perm J. 2019;23.
63. Stenmark SH, Steiner JF, Marpadga S, Debor M, Underhill K, Seligman H. Lessons learned from implementation of the food insecurity screening and referral program at Kaiser Permanente Colorado. Perm J. 2018;22.
64. Martel ML, Klein LR, Hager KA, Cutts DB. Emergency department experience with novel electronic medical record order for referral to food resources. West J Emerg Med. 2018;19(2):232-237.
65. Going C, Cohen AJ, Bares M, Christensen M. Interdisciplinary approaches to addressing the food insecure veteran. Veterans Health Administration Employee Education System webinar; October 30, 2018.
66. Feeding America Announces New Partnership With U.S. Department Of Veterans Affairs. https://www.prnewswire.com/news-releases/feeding-america-announces-new-partnership-with-us-department-of-veterans-affairs-300481891.html. Published June 29, 2017. Accessed December 10, 2019.
67. US Department of Veterans Affairs. State Veterans Affairs offices. https://www.va.gov/statedva.htm. Updated March 20, 2019. Accessed December 10, 2019.
68. US Department of Veterans Affairs. Directory of veterans service organizations. https://www.va.gov/vso. Updated December 24, 2013. Accessed December 10, 2019.
69. ACL Administration for Community Living. Aging and disability resource centers. https://acl.gov/programs/aging-and-disability-networks/aging-and-disability-resource-centers. Updated December 13, 2017. Accessed December 10, 2019.
70. Nutrition and Obesity Policy Research and Evaluation Network (NOPREN). Clinical screening algorithms. https://nopren.org/resource/download-food-insecurity-screening-and-referral-algorithms-for-adults-patients-living-with-diabetes-and-pediatric-patients. Accessed December 10, 2019.
Nearly 1 in 8 households—and 1 in 6 households with children—experienced food insecurity in 2017, defined as limited or uncertain availability of nutritionally adequate and safe foods.1 Food insecurity is often even more pronounced among households with individuals with acute or chronic medical conditions.2-6 Moreover, food insecurity is independently associated with a range of adverse health outcomes, including poorer control of diabetes mellitus, hypertension, depression and other major psychiatric disorders, HIV, and chronic lung and kidney disease, as well as poorer overall health status.7-14 Food insecurity also has been associated with increased health care costs and acute care utilization as well as increased probability of delayed or missed care.15-19
The relationship between food insecurity and poor health outcomes is a complex and often cyclic phenomenon (Figure 1). Poor nutritional status is fueled by limited access to healthful foods as well as increased reliance on calorie-dense and nutrient-poor “junk” foods, which are less expensive and often more readily available in low-income neighborhoods.5,20-24 These compensatory dietary patterns place individuals at higher risk for developing cardiometabolic conditions and for poor control of these conditions.5,8,9,12,25,26 Additionally, the physiological and psychological stressors of food insecurity may precipitate depression and anxiety or worsen existing mental health conditions, resulting in feelings of overwhelm and decreased self-management capacity.5,8,27-31 Food insecurity has further been associated with poor sleep, declines in cognitive function, and increased falls, particularly among the frail and elderly.32-34
Individuals experiencing food insecurity often report having to make trade-offs between food and other necessities, such as paying rent or utilities. Additional strategies to stretch limited resources include cost-related underuse of medication and delays in needed medical care.4,17,31,35 In a nationally representative survey among adults with at least 1 chronic medical condition, 1 in 3 reported having to choose between food and medicine; 11% were unable to afford either.3 Furthermore, the inability to reliably adhere to medication regimens that need to be taken with food can result in potentially life-threatening hypoglycemia (as can lack of food regardless of medication use).5,26,36 In addition to the more obvious risks of glucose-lowering medications, such as insulin and long-acting sulfonylureas in patients experiencing food insecurity, many drugs commonly used among nondiabetic adults such as ACE-inhibitors, β blockers, quinolones, and salicylates can also precipitate hypoglycemia, and food insecurity has been associated with experiences of hypoglycemia even among individuals without diabetes mellitus.32,37 In one study the risk for hospital admissions for hypoglycemia among low-income populations increased by 27% at the end of the month when food budgets were more likely to be exhausted.38 Worsening health status and increased emergency department visits and hospitalizations may then result in lost wages and mounting medical bills, contributing to further financial strain and worsening food insecurity.
Prevalence and Importance of Food Insecurity Among US Veterans
Nearly 1.5 million veterans in the US are living below the federal poverty level (FPL).39 An additional 2.4 million veterans are living paycheck to paycheck at < 200% of the FPL.40 Veterans living in poverty are at even higher risk than nonveterans for food insecurity, homelessness, and other material hardship.41
Estimates of food insecurity among veterans vary widely, ranging from 6% to 24%—nearly twice that of the general US population.8,42-45 Higher rates of food insecurity have been reported among certain high-risk subgroups, including veterans who served in Iraq and Afghanistan (27%), female veterans (28%), homeless and formerly homeless veterans (49%), and veterans with serious mental illness (35%).6,32,43,46 Additional risk factors for food insecurity specific to veteran populations include younger age, having recently left active-duty military service, and lower final military paygrade.42,45-47 As in the general population, veteran food insecurity is associated with a range of adverse health outcomes, including poorer overall health status as well as increased probability of delayed or missed care.6,8,32,42-44,46
Even among veterans enrolled in federal food assistance programs, many still struggle to afford nutritionally adequate foods. As one example, in a study of mostly male homeless and formerly homeless veterans, O’Toole and colleagues found that nearly half of those reporting food insecurity were already receiving federal food assistance benefits, and 22% relied on emergency food resources.32 Of households served by Feeding America food pantries and meal programs, 20% have a member who has served in the US military.48
Federal Programs To Address Food Insecurity
There are several important federal food assistance programs designed to help alleviate food insecurity. The Supplemental Nutrition Assistance Program (SNAP, formerly the Food Stamp program) is the largest federal food assistance program and provides low-income Americans with cash benefits to purchase food. SNAP has been shown to substantially reduce food insecurity.7,49 The program also is associated with significant decreases in cost-related medication nonadherence as well as reductions in health care costs and both acute care and nursing home utilization.16,50-54 Although nearly 1.4 million veterans live in SNAP-enrolled households, 59% of eligible veterans are not enrolled.43,55 Closing this SNAP eligibility-enrollment gap, has been a focus of recent efforts to improve long-term food security among veterans. There also are several federal food assistance programs for households with children, including the Special Supplemental Nutrition Program for Women, Infants, and Children (WIC) and school meals programs. Among federal nutrition programs for seniors, the Older American’s Act contains designated funding to support nutrition services for older adults, including congregate meal programs in community settings like senior centers, places of worship, and housing communities, and home-delivered meals through programs like Meals on Wheels.56
VHA Response to Food Insecurity
The Veterans Health Administration (VHA) is the country’s largest integrated, federally funded health care system.57 In November 2015, congressional briefings on veteran food insecurity organized by the national non-profit organization MAZON: A Jewish Response to Hunger and hosted with bipartisan support were provided to the US House and Senate. As a result of these briefings, VHA chartered the national Ensuring Veteran Food Security Workgroup with a mandate to partner with governmental and nonprofit agencies to “focus on the issue of food insecurity, the identification of veterans at risk, the needed training of VHA staff and the coordination of resources and initiatives to support the veterans for whom we care.” Building off a pilot in US Department of Veterans Affairs (VA) Homeless Patient Aligned Care Teams (H-PACTs),32 VHA subsequently integrated a single-item food insecurity screening tool into the VA electronic health record (EHR) clinical reminder system (Figure 2). The clinical reminder, which was rolled out across VA medical centers nationally in October 2017, provides an alert to screen all noninstitutionalized veterans for food insecurity. To date, nearly 5 million veterans have been screened. When a veteran endorses food insecurity based on the initial screening question, a prompt appears to offer the veteran a referral to a social worker and/or dietitian. Positive screening results also should be communicated to the patient’s primary care provider. Depending on site-specific clinical flow, the reminders are typically completed in the outpatient setting either by nurses or medical assistants during intake or by providers as part of the clinical visit. However, any member of the health care team can complete the clinical reminder at any time. As of September 2019, approximately 74,000 veterans have been identified as food insecure.58
Addressing Food Insecurity
VHA has been a recognized leader in addressing homelessness and other social determinants of health through its integrated care and PACT delivery models.59-61 The food insecurity clinical reminder was designed to facilitate a tailored, interdisciplinary approach to identify and address food insecurity. Interdisciplinary care team members—including medical assistants, clinicians, social workers, registered dietitians, nurse care managers, occupational or physical therapists, and pharmacists—are uniquely positioned to identify veterans impacted by food insecurity, assess for associated clinical and/or social risk factors, and offer appropriate medical and nutrition interventions and resource referrals.
This interdisciplinary team-based model is essential given the range of potential drivers underlying veteran experiences of food insecurity and subsequent health outcomes. It is critically important for clinicians to review the medication list with veterans screening positive for food insecurity to assess for risk of hypoglycemia and/or cost-related nonadherence, make any necessary adjustments to therapeutic regimens, and assess for additional risk factors associated with food insecurity. Examples of tailored nutrition counseling that clinical dietitians may provide include meal preparation strategies for veterans who only have access to a microwave or hotplate, or recommendations for how veterans on medically restricted diets can best navigate food selection at soup kitchens or food pantries. Resource referrals provided by social workers or other care team members may include both emergency food resources to address immediate shortages (eg, food pantries, soup kitchens, or vouchers for free lunch) as well as resources focused on improving longer term food security (eg, federal food assistance programs or home delivered meal programs). Importantly, although providing a list of food resources may be helpful for some patients, such lists are often insufficient.62,63 Many patients require active assistance with program enrollment either onsite the day of their clinic visit or through connection with a partnering community-based organization that can, in turn, identify appropriate resources and facilitate program enrollment.63,64 Planned follow-up is also crucial to determine whether referrals are successful and to assess for ongoing need. Proposed roles for interdisciplinary care team members in addressing a positive food insecurity screen are outlined in Table 1.
VHA-Community Partnerships
In addition to services offered within VA, public and private sector partnerships can greatly enhance the range of resources available to food insecure veterans. Several VA facilities have developed formal community partnerships, such as the Veterans Pantry Pilot (VPP) program, a national partnership between Feeding America food banks and VA medical centers to establish onsite or mobile food pantries. There are currently 17 active Feeding America VPP sites, with a number of additional sites under development. Several of the VPP sites also include other “wraparound services,” such as SNAP application assistance.65,66
State Veterans Affairs offices67 and Veterans Service Organizations (VSOs)68 also can serve as valuable partners for connecting veterans with needed resources. VSOs offer a range of services, including assistancewith benefit claims, employment and housing assistance, emergency food assistance, and transportation to medical appointments. Some VSOs also have established local affiliations with Meals on Wheels focused on veteran outreach and providing hot meals for low-income, homebound, and disabled veterans.
Additional Resources
Although resources vary by regional setting, several key governmental and community-based food assistance programs are summarized in Table 2. Local community partners and online/phone-based directories, such as United Way’s 2-1-1 can help identify additional local resources. For older adults and individuals with disabilities, local Aging and Disability Resources Centers can provide information and assistance connecting to needed resources.69 Finally, there are a number of online resources available for clinicians interested in learning more about the impact of food insecurity on health and tools to use in the clinical setting (Table 3).
Conclusion
The VA has recognized food insecurity as a critical concern for the well-being of our nation’s veterans. Use of the EHR clinical reminder represents a crucial first step toward increasing provider awareness about veteran food insecurity and improving clinical efforts to address food insecurity once identified. Through the reminder, health care teams can connect veterans to needed resources and create both the individual and population-level data necessary to inform VHA and community efforts to address veteran food insecurity. Clinical reminder data are currently being used for local quality improvement efforts and have established the need nationally for formalized partnerships between VHA Social Work Services and Nutrition and Food Services to connect veterans with food and provide them with strategies to best use available food resources.
Moving forward, the Ensuring Veteran Food Security Workgroup continues to work with agencies and organizations across the country to improve food insecure veterans’ access to needed services. In addition to existing VA partnerships with Feeding America for the VPP, memorandums of understanding are currently underway to formalize partnerships with both the Food Research and Action Center (FRAC) and MAZON. Additional research is needed both to formally validate the current food insecurity clinical reminder screening question and to identify best practices and potential models for how to most effectively use VHA-community partnerships to address the unique needs of the veteran population.
Ensuring the food security of our nation’s veterans is essential to VA’s commitment to providing integrated, veteran-centered, whole person care. Toward that goal, VA health care teams are urged to use the clinical reminder and help connect food insecure veterans with relevant resources both within and outside of the VA health care system.
1. Coleman-Jensen A, Rabbitt MP, Gregory CA, Singh A. Household food security in the United States in 2017. http://www.ers.usda.gov/publications/pub-details/?pubid=90022. Published September 2018. Accessed December 9, 2019.
2. Berkowitz SA, Meigs JB, DeWalt D, et al. Material need insecurities, control of diabetes mellitus, and use of health care resources: results of the Measuring Economic Insecurity in Diabetes study. JAMA Intern Med. 2015;175(2):257-265.
3. Berkowitz SA, Seligman HK, Choudhry NK. Treat or eat: food insecurity, cost-related medication underuse, and unmet needs. Am J Med. 2014;127(4):303-310.e3.
4. Lyles CR, Seligman HK, Parker MM, et al. Financial strain and medication adherence among diabetes patients in an integrated health care delivery system: The Diabetes Study of Northern California (DISTANCE). Health Serv Res. 2016;51(2):610-624.
5. Seligman HK, Schillinger D. Hunger and socioeconomic disparities in chronic disease. N Engl J Med. 2010;363(1):6-9.
6. Narain K, Bean-Mayberry B, Washington DL, Canelo IA, Darling JE, Yano EM. Access to care and health outcomes among women veterans using veterans administration health care: association with food insufficiency. Womens Health Issues. 2018;28(3):267-272.
7. Gundersen C, Ziliak JP. Food insecurity and health outcomes. Health Aff. 2015;34(11):1830-1839.
8. Wang EA, McGinnis KA, Goulet J, et al; Veterans Aging Cohort Study Project Team. Food insecurity and health: data from the Veterans Aging Cohort Study. Public Health Rep. 2015;130(3):261-268.
9. Berkowitz SA, Berkowitz TSZ, Meigs JB, Wexler DJ. Trends in food insecurity for adults with cardiometabolic disease in the United States: 2005-2012. PloS One. 2017;12(6):e0179172.
10. Seligman HK, Laraia BA, Kushel MB. Food insecurity is associated with chronic disease among low-income NHANES participants. J Nutr. 2010;140(2):304-310.
11. Berkowitz SA, Baggett TP, Wexler DJ, Huskey KW, Wee CC. Food insecurity and metabolic control among U.S. adults with diabetes. Diabetes Care. 2013;36(10):3093-3099.
12. Seligman HK, Jacobs EA, López A, Tschann J, Fernandez A. Food insecurity and glycemic control among low-income patients with type 2 diabetes. Diabetes Care. 2012;35(2):233-238.
13. Banerjee T, Crews DC, Wesson DE, et al; CDC CKD Surveillance Team. Food insecurity, CKD, and subsequent ESRD in US adults. Am J Kidney Dis. 2017;70(1):38-47.
14. Bruening M, Dinour LM, Chavez JBR. Food insecurity and emotional health in the USA: a systematic narrative review of longitudinal research. Public Health Nutr. 2017;20(17):3200-3208.
15. Berkowitz SA, Basu S, Meigs JB, Seligman HK. Food insecurity and health care expenditures in the United States, 2011-2013. Health Serv Res. 2018;53(3):1600-1620.
16. Berkowitz SA, Seligman HK, Basu S. Impact of food insecurity and SNAP participation on healthcare utilization and expenditures. http://www.ukcpr.org/research/discussion-papers. Published 2017. Accessed December 9, 2019.
17. Kushel MB, Gupta R, Gee L, Haas JS. Housing instability and food insecurity as barriers to health care among low-income Americans. J Gen Intern Med. 2006;21(1):71-77.
18. Garcia SP, Haddix A, Barnett K. Incremental health care costs associated with food insecurity and chronic conditions among older adults. Chronic Dis. 2018;15:180058.
19. Berkowitz SA, Seligman HK, Meigs JB, Basu S. Food insecurity, healthcare utilization, and high cost: a longitudinal cohort study. Am J Manag Care. 2018;24(9):399-404.
20. Larson NI, Story MT, Nelson MC. Neighborhood environments: disparities in access to healthy foods in the U.S. Am J Prev Med. 2009;36(1):74-81.
21. Darmon N, Drewnowski A. Contribution of food prices and diet cost to socioeconomic disparities in diet quality and health: a systematic review and analysis. Nutr Rev. 2015;73(10):643-660.
22. Darmon N, Drewnowski A. Does social class predict diet quality? Am J Clin Nutr. 2008;87(5):1107-1117.
23. Drewnowski A. The cost of US foods as related to their nutritive value. Am J Clin Nutr. 2010;92(5):1181-1188.
24. Lucan SC, Maroko AR, Seitchik JL, Yoon DH, Sperry LE, Schechter CB. Unexpected neighborhood sources of food and drink: implications for research and community health. Am J Prev Med. 2018;55(2):e29-e38.
25. Castillo DC, Ramsey NL, Yu SS, Ricks M, Courville AB, Sumner AE. Inconsistent access to food and cardiometabolic disease: the effect of food insecurity. Curr Cardiovasc Risk Rep. 2012;6(3):245-250.
26. Seligman HK, Davis TC, Schillinger D, Wolf MS. Food insecurity is associated with hypoglycemia and poor diabetes self-management in a low-income sample with diabetes. J Health Care Poor Underserved. 2010;21(4):1227-1233.
27. Siefert K, Heflin CM, Corcoran ME, Williams DR. Food insufficiency and physical and mental health in a longitudinal survey of welfare recipients. J Health Soc Behav. 2004;45(2):171-186.
28. Mangurian C, Sreshta N, Seligman H. Food insecurity among adults with severe mental illness. Psychiatr Serv. 2013;64(9):931-932.
29. Melchior M, Caspi A, Howard LM, et al. Mental health context of food insecurity: a representative cohort of families with young children. Pediatrics. 2009;124(4):e564-e572.
30. Brostow DP, Gunzburger E, Abbate LM, Brenner LA, Thomas KS. Mental illness, not obesity status, is associated with food insecurity among the elderly in the health and retirement study. J Nutr Gerontol Geriatr. 2019;38(2):149-172.
31. Higashi RT, Craddock Lee SJ, Pezzia C, Quirk L, Leonard T, Pruitt SL. Family and social context contributes to the interplay of economic insecurity, food insecurity, and health. Ann Anthropol Pract. 2017;41(2):67-77.
32. O’Toole TP, Roberts CB, Johnson EE. Screening for food insecurity in six Veterans Administration clinics for the homeless, June-December 2015. Prev Chronic Dis. 2017;14:160375.
33. Feil DG, Pogach LM. Cognitive impairment is a major risk factor for serious hypoglycaemia; public health intervention is warranted. Evid Based Med. 2014;19(2):77.
34. Frith E, Loprinzi PD. Food insecurity and cognitive function in older adults: Brief report. Clin Nutr. 2018;37(5):1765-1768.
35. Herman D, Afulani P, Coleman-Jensen A, Harrison GG. Food insecurity and cost-related medication underuse among nonelderly adults in a nationally representative sample. Am J Public Health. 2015;105(10):e48-e59.
36. Tseng C-L, Soroka O, Maney M, Aron DC, Pogach LM. Assessing potential glycemic overtreatment in persons at hypoglycemic risk. JAMA Intern Med. 2014;174(2):259-268.
37. Vue MH, Setter SM. Drug-induced glucose alterations part 1: drug-induced hypoglycemia. Diabetes Spectr. 2011;24(3):171-177.
38. Seligman HK, Bolger AF, Guzman D, López A, Bibbins-Domingo K. Exhaustion of food budgets at month’s end and hospital admissions for hypoglycemia. Health Aff (Millwood). 2014;33(1):116-123.
39. US Department of Veterans Affairs, National Center for Veterans Analysis and Statistics. Veteran poverty trends. https://www.va.gov/vetdata/docs/specialreports/veteran_poverty_trends.pdf. Published May 2015. Accessed December 9, 2019.
40. Robbins KG, Ravi A. Veterans living paycheck to paycheck are under threat during budget debates. https://www.americanprogress.org/issues/poverty/news/2017/09/19/439023/veterans-living-paycheck-paycheck-threat-budget-debates. Published September 19, 2017. Accessed December 9, 2019.
41. Wilmoth JM, London AS, Heflin CM. Economic well-being among older-adult households: variation by veteran and disability status. J Gerontol Soc Work. 2015;58(4):399-419.
42. Brostow DP, Gunzburger E, Thomas KS. Food insecurity among veterans: findings from the health and retirement study. J Nutr Health Aging. 2017;21(10):1358-1364.
43. Pooler J, Mian P, Srinivasan M, Miller Z. Veterans and food insecurity. https://www.impaqint.com/sites/default/files/issue-briefs/VeteransFoodInsecurity_IssueBrief_V1.3.pdf. Published November 2018. Accessed December 9, 2019.
44. Schure MB, Katon JG, Wong E, Liu C-F. Food and housing insecurity and health status among U.S. adults with and without prior military service. SSM Popul Health. 2016;29(2):244-248.
45. Miller DP, Larson MJ, Byrne T, DeVoe E. Food insecurity in veteran households: findings from nationally representative data. Public Health Nutr. 2016;19(10):1731-1740.
46. Widome R, Jensen A, Bangerter A, Fu SS. Food insecurity among veterans of the US wars in Iraq and Afghanistan. Public Health Nutr. 2015;18(5):844-849.
47. London AS, Heflin CM. Supplemental Nutrition Assistance Program (SNAP) use among active-duty military personnel, veterans, and reservists. Popul Res Policy Rev. 2015;34(6):805-826.
48. Weinfield NS, Mills G, Borger C, et al. Hunger in America 2014. Natl rep prepared for Feeding America. https://www.feedingamerica.org/research/hunger-in-america. Published 2014. Accessed December 9, 2019.
49. Mabli J, Ohls J, Dragoset L, Castner L, Santos B. Measuring the Effect of Supplemental Nutrition Assistance Program (SNAP) Participation on Food Security. Washington, DC: US Department of Agriculture, Food and Nutrition Service; 2013.
50. Srinivasan M, Pooler JA. Cost-related medication nonadherence for older adults participating in SNAP, 2013–2015. Am J Public Health. 2017;108(2):224-230.
51. Heflin C, Hodges L, Mueser P. Supplemental Nutrition Assistance Progam benefits and emergency room visits for hypoglycaemia. Public Health Nutr. 2017;20(7):1314-1321.
52. Samuel LJ, Szanton SL, Cahill R, et al. Does the Supplemental Nutrition Assistance Program affect hospital utilization among older adults? The case of Maryland. Popul Health Manag. 2018;21(2):88-95.
53. Szanton SL, Samuel LJ, Cahill R, et al. Food assistance is associated with decreased nursing home admissions for Maryland’s dually eligible older adults. BMC Geriatr. 2017;17(1):162.
54. Carlson S, Keith-Jennings B. SNAP is linked with improved nutritional outcomes and lower health care costs. https://www.cbpp.org/research/food-assistance/snap-is-linked-with-improved-nutritional-outcomes-and-lower-health-care. Published January 17, 2018. Accessed December 10, 2019.
55. Keith-Jennings B, Cai L. SNAP helps almost 1.4 million low-income veterans, including thousands in every state. https://www.cbpp.org/research/food-assistance/snap-helps-almost-14-million-low-income-veterans-including-thousands-in. Updated November 8, 2018. Accessed December 10, 2019.
56. US Department of Health and Human Services. Older Americans Act nutrition programs. https://acl.gov/sites/default/files/news%202017-03/OAA-Nutrition_Programs_Fact_Sheet.pdf. Accessed December 10, 2019.
57. US Department of Veterans Affairs. About VHA. https://www.va.gov/health/aboutvha.asp. Accessed December 10, 2019.
58. US Department of Veterans Affairs. VA Corporate Data Warehouse.
59. Yano EM, Bair MJ, Carrasquillo O, Krein SL, Rubenstein LV. Patient aligned care teams (PACT): VA’s journey to implement patient-centered medical homes. J Gen Intern Med. 2014;29(suppl 2):S547-s549.
60. O’Toole TP, Pape L. Innovative efforts to address homelessness among veterans. N C Med J. 2015;76(5):311-314.
61. O’Toole TP, Johnson EE, Aiello R, Kane V, Pape L. Tailoring care to vulnerable populations by incorporating social determinants of health: the Veterans Health Administration’s “Homeless Patient Aligned Care Team” Program. Prev Chronic Dis. 2016;13:150567.
62. Marpadga S, Fernandez A, Leung J, Tang A, Seligman H, Murphy EJ. Challenges and successes with food resource referrals for food-insecure patients with diabetes. Perm J. 2019;23.
63. Stenmark SH, Steiner JF, Marpadga S, Debor M, Underhill K, Seligman H. Lessons learned from implementation of the food insecurity screening and referral program at Kaiser Permanente Colorado. Perm J. 2018;22.
64. Martel ML, Klein LR, Hager KA, Cutts DB. Emergency department experience with novel electronic medical record order for referral to food resources. West J Emerg Med. 2018;19(2):232-237.
65. Going C, Cohen AJ, Bares M, Christensen M. Interdisciplinary approaches to addressing the food insecure veteran. Veterans Health Administration Employee Education System webinar; October 30, 2018.
66. Feeding America Announces New Partnership With U.S. Department Of Veterans Affairs. https://www.prnewswire.com/news-releases/feeding-america-announces-new-partnership-with-us-department-of-veterans-affairs-300481891.html. Published June 29, 2017. Accessed December 10, 2019.
67. US Department of Veterans Affairs. State Veterans Affairs offices. https://www.va.gov/statedva.htm. Updated March 20, 2019. Accessed December 10, 2019.
68. US Department of Veterans Affairs. Directory of veterans service organizations. https://www.va.gov/vso. Updated December 24, 2013. Accessed December 10, 2019.
69. ACL Administration for Community Living. Aging and disability resource centers. https://acl.gov/programs/aging-and-disability-networks/aging-and-disability-resource-centers. Updated December 13, 2017. Accessed December 10, 2019.
70. Nutrition and Obesity Policy Research and Evaluation Network (NOPREN). Clinical screening algorithms. https://nopren.org/resource/download-food-insecurity-screening-and-referral-algorithms-for-adults-patients-living-with-diabetes-and-pediatric-patients. Accessed December 10, 2019.
Top research findings of 2018-2019 for clinical practice
Medical knowledge is growing faster than ever, as is the challenge of keeping up with this ever-growing body of information. Clinicians need a system or method to help them sort and evaluate the quality of new information before they can apply it to clinical care. Without such a system, when facing an overload of information, most of us tend to take the first or the most easily accessed information, without considering the quality of such information. As a result, the use of poor-quality information affects the quality and outcome of care we provide, and costs billions of dollars annually in problems associated with underuse, overuse, and misuse of treatments.
In an effort to sort and evaluate recently published research that is ready for clinical use, the first author (SAS) used the following 3-step methodology:
1. Searched literature for research findings suggesting readiness for clinical utilization published between July 1, 2018 and June 30, 2019.
2. Surveyed members of the American Association of Chairs of Departments of Psychiatry, the American Association of Community Psychiatrists, the American Association of Psychiatric Administrators, the North Carolina Psychiatric Association, the Group for the Advancement of Psychiatry, and many other colleagues by asking them: “Among the articles published from July 1, 2018 to June 30, 2019, which ones in your opinion have (or are likely to have or should have) affected/changed the clinical practice of psychiatry?”
3. Looked for appraisals in post-publication reviews such as NEJM Journal Watch, F1000 Prime, Evidence-Based Mental Health, commentaries in peer-reviewed journals, and other sources (see Related Resources).
We chose 12 articles based on their clinical relevance/applicability. Here in Part 1 we present brief descriptions of the 6 of top 12 papers chosen by this methodology; these studies are summarized in the Table.1-6 The order in which they appear in this article is arbitrary. The remaining 6 studies will be reviewed in Part 2 in the February 2020 issue of

1. Ray WA, Stein CM, Murray KT, et al. Association of antipsychotic treatment with risk of unexpected death among children and youths. JAMA Psychiatry. 2019;76(2):162-171.
Children and young adults are increasingly being prescribed antipsychotic medications. Studies have suggested that when these medications are used in adults and older patients, they are associated with an increased risk of death.7-9 Whether or not these medications are associated with an increased risk of death in children and youth has been unknown. Ray et al1 compared the risk of unexpected death among children and youths who were beginning treatment with an antipsychotic or control medications.
Study design
- This retrospective cohort study evaluated children and young adults age 5 to 24 who were enrolled in Medicaid in Tennessee between 1999 and 2014.
- New antipsychotic use at both a higher dose (>50 mg chlorpromazine equivalents) and a lower dose (≤50 mg chlorpromazine equivalents) was compared with new use of a control medication, including attention-deficit/hyperactivity disorder medications, antidepressants, and mood stabilizers.
- There were 189,361 participants in the control group, 28,377 participants in the lower-dose antipsychotic group, and 30,120 participants in the higher-dose antipsychotic group.
Outcomes
- The primary outcome was death due to injury or suicide or unexpected death occurring during study follow-up.
- The incidence of death in the higher-dose antipsychotic group (146.2 per 100,000 person-years) was significantly higher (P < .001) than the incidence of death in the control medications group (54.5 per 100,000 person years).
- There was no similar significant difference between the lower-dose antipsychotic group and the control medications group.
Continue to: Conclusion
Conclusion
- Higher-dose antipsychotic use is associated with increased rates of unexpected deaths in children and young adults.
- As with all association studies, no direct line connected cause and effect. However, these results reinforce recommendations for careful prescribing and monitoring of antipsychotic regimens for children and youths, and the need for larger antipsychotic safety studies in this population.
- Examining risks associated with specific antipsychotics will require larger datasets, but will be critical for our understanding of the risks and benefits.
2. Daly EJ, Trivedi MH, Janik A, et al. Efficacy of esketamine nasal spray plus oral antidepressant treatment for relapse prevention in patients with treatment-resistant depression: a randomized clinical trial. JAMA Psychiatry. 2019;76(9):893-903.
Controlled studies have shown esketamine has efficacy for treatment-resistant depression (TRD), but these studies have been only short-term, and the long-term effects of esketamine for TRD have not been established. To fill that gap, Daly et al2 assessed the efficacy of esketamine nasal spray plus an oral antidepressant vs a placebo nasal spray plus an oral antidepressant in delaying relapse of depressive symptoms in patients with TRD. All patients were in stable remission after an optimization course of esketamine nasal spray plus an oral antidepressant.
Study design
- Between October 2015 and February 2018, researchers conducted a phase III, multicenter, double-blind, randomized withdrawal study to evaluate the effect of continuation of esketamine on rates of relapse in patients with TRD who had responded to initial treatment with esketamine.
- Initially, 705 adults were enrolled. Of these participants, 455 proceeded to the optimization phase, in which they were treated with esketamine nasal spray plus an oral antidepressant.
- After 16 weeks of optimization treatment, 297 participants achieved remission or stable response and were randomized to a treatment group, which received continued esketamine nasal spray plus an oral antidepressant, or to a control group, which received a placebo nasal spray plus an oral antidepressant.
Outcomes
- Treatment with esketamine nasal spray and an oral antidepressant was associated with decreased rates of relapse compared with treatment with placebo nasal spray and an oral antidepressant. This was the case among patients who had achieved remission as well as those who had achieved stable response.
- Continued treatment with esketamine decreased the risk of relapse by 51%, with 40 participants in the treatment group experiencing relapse compared with 73 participants in the placebo group.
Continue to: Conclusion
Conclusion
- In patients with TRD who responded to initial treatment with esketamine, continuing esketamine plus an oral antidepressant resulted in clinically meaningful superiority in preventing relapse compared with a placebo nasal spray plus an oral antidepressant.
3. Williams NR, Heifets BD, Blasey C, et al. Attenuation of antidepressant effects of ketamine by opioid receptor antagonism. Am J Psychiatry. 2018;175(12):1205-1215.
Many studies have documented the efficacy of ketamine as a rapid-onset antidepressant. Studies investigating the mechanism of this effect have focused on antagonism of N-methyl-
Study design
- This double-blind crossover study evaluated if opioid receptor activation is necessary for ketamine to have an antidepressant effect in patients with TRD.
- Twelve participants completed both sides of the study in a randomized order. Participants received placebo or naltrexone prior to an IV infusion of ketamine.
- Researchers measured patients’ scores on the Hamilton Depression Rating Scale (HAM-D) at baseline and 1 day after infusion. Response was defined as a ≥50% reduction in HAM-D score.
Outcomes
- Reductions in HAM-D scores among participants in the ketamine plus naltrexone group were significantly lower than those of participants in the ketamine plus placebo group.
- Dissociation related to ketamine use did not differ significantly between the naltrexone group and the placebo group.
Continue to: Conclusion
Conclusion
- This small study found a significant decrease in the antidepressant effect of ketamine infusion in patients with TRD when opioid receptors are blocked with naltrexone prior to infusion, which suggests opioid receptor activation is necessary for ketamine to be effective as an antidepressant.
- This appears to be consistent with observations of buprenorphine’s antidepressant effects. Caution is indicated until additional studies can further elucidate the mechanism of action of ketamine’s antidepressant effects (see "Ketamine/esketamine: Putative mechanism of action," page 32).
4. Nidich S, Mills PJ, Rainforth M, et al. Non-trauma-focused meditation versus exposure therapy in veterans with post-traumatic stress disorder: a randomised controlled trial. Lancet Psychiatry. 2018;5(12):975-986.
Posttraumatic stress disorder (PTSD) is a common and important public health problem. Evidence-based treatments for PTSD include trauma-focused therapies such as prolonged exposure therapy (PE). However, some patients may not respond to PE, drop out, or elect not to pursue it. Researchers continue to explore treatments that are non-trauma-focused, such as mindfulness meditation and interpersonal psychotherapy. In a 3-group comparative effectiveness trial, Nidich et al4 examined the efficacy of a non-trauma-focused intervention, transcendental meditation (TM), in reducing PTSD symptom severity and depression in veterans.
Study design
- Researchers recruited 203 veterans with PTSD from the Department of Veterans Affairs (VA) San Diego Healthcare System between June 2013 and October 2016.
- Participants were randomly assigned to 1 of 3 groups: 68 to TM, 68 to PE, and 67 to PTSD health education (HE).
- Each group received 12 sessions over 12 weeks. In addition to group and individual sessions, all participants received daily practice or assignments.
- The Clinician-Administered PTSD Scale (CAPS) was used to assess symptoms before and after treatment.
Outcomes
- The primary outcome assessed was change in PTSD symptom severity at the end of the study compared with baseline as measured by change in CAPS score.
- Transcendental meditation was found to be significantly non-inferior to PE, with a mean change in CAPS score of −16.1 in the TM group and −11.2 in the PE group.
- Both the TM and PE groups also had significant reductions in CAPS scores compared with the HE group, which had a mean change in CAPS score of −2.5.
Continue to: Conclusion
Conclusion
- Transcendental meditation is significantly not inferior to PE in the treatment of veterans with PTSD.
- The findings from this first comparative effectiveness trial comparing TM with an established psychotherapy for PTSD suggests the feasibility and efficacy of TM as an alternative therapy for veterans with PTSD.
- Because TM is self-administered after an initial expert training, it may offer an easy-to-implement approach that may be more accessible to veterans than other treatments.
5. Raskind MA, Peskind ER, Chow B, et al. Trial of prazosin for post-traumatic stress disorder in military veterans. N Engl J Med. 2018;378(6):507-517.
Several smaller randomized trials of prazosin involving a total of 283 active-duty service members, veterans, and civilian participants have shown efficacy of prazosin for PTSD-related nightmares, sleep disturbance, and overall clinical functioning. However, in a recent trial, Raskind et al5 failed to demonstrate such efficacy.
Study design
- Veterans with chronic PTSD nightmares were recruited from 13 VA medical centers to participate in a 26-week, double-blind, randomized controlled trial.
- A total of 304 participants were randomized to a prazosin treatment group (n = 152) or a placebo control group (n = 152).
- During the first 10 weeks, prazosin or placebo were administered in an escalating fashion up to a maximum dose.
- The CAPS, Pittsburgh Sleep Quality Index (PSQI), and Clinical Global Impressions of Change (CGIC) scores were measured at baseline, after 10 weeks, and after 26 weeks.
Outcomes
- Three primary outcomes measures were assessed: change in score from baseline to 10 weeks on CAPS item B2, the PSQI, and the CGIC.
- A secondary measure was change in score from baseline of the same measures at 26 weeks.
- There was no significant difference between the prazosin group and the placebo group in any of the primary or secondary measures.
Continue to: Conclusion
Conclusion
- Compared with placebo, prazosin was not associated with improvement in nightmares or sleep quality for veterans with chronic PTSD nightmares.
- Because psychosocial instability was an exclusion criterion, it is possible that a selection bias resulting from recruitment of patients who were mainly in clinically stable condition accounted for these negative results, since symptoms in such patients were less likely to be ameliorated with antiadrenergic treatment.
Treatment-resistant depression in veterans is a major clinical challenge because of these patients’ increased risk of suicide. Repetitive transcranial magnetic stimulation (rTMS) has shown promising results for TRD. In a randomized trial, Yesavage et al6 compared rTMS vs sham rTMS in veterans with TRD.
Study design
- Veterans with TRD were recruited from 9 VA medical centers throughout the United States between September 2012 and May 2016.
- Researchers randomized 164 participants into 1 of 2 groups in a double-blind fashion. The treatment group (n = 81) received left prefrontal rTMS, and the control group (n = 83) received sham rTMS.
Outcomes
- In an intention-to-treat analysis, remission rate (defined as a HAM-D score of ≤10) was assessed as the primary outcome measure.
- Remission was seen in both groups, with 40.7% of the treatment group achieving remission and 37.4% of the control group achieving remission. However, the difference between the 2 groups was not significant (P = .67), with an odds ratio of 1.16.
Continue to: Conclusion
Conclusion
- In this study, treatment with rTMS did not show a statistically significant difference in rates of remission from TRD in veterans compared with sham rTMS. This differs from previous rTMS trials in non-veteran patients.
- The findings of this study also differed from those of other rTMS research in terms of the high remission rates that were seen in both the active and sham groups.
Bottom Line
The risk of death might be increased in children and young adults who receive highdose antipsychotics. Continued treatment with intranasal esketamine may help prevent relapse in patients with treatment-resistant depression (TRD) who initially respond to esketamine. The antidepressant effects of ketamine might be associated with opioid receptor activation. Transcendental meditation may be helpful for patients with posttraumatic stress disorder (PTSD), while prazosin might not improve nightmares or sleep quality in patients with PTSD. Repetitive transcranial magnetic stimulation (rTMS) might not be any more effective than sham rTMS for veterans with TRD.
Related Resources
- NEJM Journal Watch. www.jwatch.org.
- F1000 Prime. https://f1000.com/prime/home.
- BMJ Journals Evidence-Based Mental Health. https://ebmh.bmj.com.
Drug Brand Names
Buprenorphine • Subutex
Chlorpromazine • Thorazine
Esketamine nasal spray • Spravato
Ketamine • Ketalar
Naltrexone • Narcan
Prazosin • Minipress
1. Ray WA, Stein CM, Murray KT, et al. Association of antipsychotic treatment with risk of unexpected death among children and youths. JAMA Psychiatry. 2019;76(2):162-171.
2. Daly EJ, Trivedi MH, Janik A, et al. Efficacy of esketamine nasal spray plus oral antidepressant treatment for relapse prevention in patients with treatment-resistant depression: a randomized clinical trial. JAMA Psychiatry. 2019;76(9):893-903.
3. Williams NR, Heifets BD, Blasey C, et al. Attenuation of antidepressant effects of ketamine by opioid receptor antagonism. Am J Psychiatry. 2018;175(12):1205-1215.
4. Nidich S, Mills PJ, Rainforth M, et al. Non-trauma-focused meditation versus exposure therapy in veterans with post-traumatic stress disorder: a randomized controlled trial. Lancet Psychiatry. 2018;5(12):975-986.
5. Raskind MA, Peskind ER, Chow B, et al. Trial of prazosin for post-traumatic stress disorder in military veterans. N Engl J Med. 2018;378(6):507-517.
6. Yesavage JA, Fairchild JK, Mi Z, et al. Effect of repetitive transcranial magnetic stimulation on treatment-resistant major depression in US veterans: a randomized clinical trial. JAMA Psychiatry. 2018;75(9):884-893.
7. Ray WA, Meredith S, Thapa PB, et al. Antipsychotics and the risk of sudden cardiac death. Arch Gen Psychiatry. 2001;58(12):1161-1167.
8. Ray WA, Chung CP, Murray KT, Hall K, Stein CM. Atypical antipsychotic drugs and the risk of sudden cardiac death. N Engl J Med. 2009;360(3):225-235.
9. Jeste DV, Blazer D, Casey D, et al. ACNP White Paper: update on use of antipsychotic drugs in elderly persons with dementia. Neuropsychopharmacology. 2008;33(5):957-970.
Medical knowledge is growing faster than ever, as is the challenge of keeping up with this ever-growing body of information. Clinicians need a system or method to help them sort and evaluate the quality of new information before they can apply it to clinical care. Without such a system, when facing an overload of information, most of us tend to take the first or the most easily accessed information, without considering the quality of such information. As a result, the use of poor-quality information affects the quality and outcome of care we provide, and costs billions of dollars annually in problems associated with underuse, overuse, and misuse of treatments.
In an effort to sort and evaluate recently published research that is ready for clinical use, the first author (SAS) used the following 3-step methodology:
1. Searched literature for research findings suggesting readiness for clinical utilization published between July 1, 2018 and June 30, 2019.
2. Surveyed members of the American Association of Chairs of Departments of Psychiatry, the American Association of Community Psychiatrists, the American Association of Psychiatric Administrators, the North Carolina Psychiatric Association, the Group for the Advancement of Psychiatry, and many other colleagues by asking them: “Among the articles published from July 1, 2018 to June 30, 2019, which ones in your opinion have (or are likely to have or should have) affected/changed the clinical practice of psychiatry?”
3. Looked for appraisals in post-publication reviews such as NEJM Journal Watch, F1000 Prime, Evidence-Based Mental Health, commentaries in peer-reviewed journals, and other sources (see Related Resources).
We chose 12 articles based on their clinical relevance/applicability. Here in Part 1 we present brief descriptions of the 6 of top 12 papers chosen by this methodology; these studies are summarized in the Table.1-6 The order in which they appear in this article is arbitrary. The remaining 6 studies will be reviewed in Part 2 in the February 2020 issue of
1. Ray WA, Stein CM, Murray KT, et al. Association of antipsychotic treatment with risk of unexpected death among children and youths. JAMA Psychiatry. 2019;76(2):162-171.
Children and young adults are increasingly being prescribed antipsychotic medications. Studies have suggested that when these medications are used in adults and older patients, they are associated with an increased risk of death.7-9 Whether or not these medications are associated with an increased risk of death in children and youth has been unknown. Ray et al1 compared the risk of unexpected death among children and youths who were beginning treatment with an antipsychotic or control medications.
Study design
- This retrospective cohort study evaluated children and young adults age 5 to 24 who were enrolled in Medicaid in Tennessee between 1999 and 2014.
- New antipsychotic use at both a higher dose (>50 mg chlorpromazine equivalents) and a lower dose (≤50 mg chlorpromazine equivalents) was compared with new use of a control medication, including attention-deficit/hyperactivity disorder medications, antidepressants, and mood stabilizers.
- There were 189,361 participants in the control group, 28,377 participants in the lower-dose antipsychotic group, and 30,120 participants in the higher-dose antipsychotic group.
Outcomes
- The primary outcome was death due to injury or suicide or unexpected death occurring during study follow-up.
- The incidence of death in the higher-dose antipsychotic group (146.2 per 100,000 person-years) was significantly higher (P < .001) than the incidence of death in the control medications group (54.5 per 100,000 person years).
- There was no similar significant difference between the lower-dose antipsychotic group and the control medications group.
Continue to: Conclusion
Conclusion
- Higher-dose antipsychotic use is associated with increased rates of unexpected deaths in children and young adults.
- As with all association studies, no direct line connected cause and effect. However, these results reinforce recommendations for careful prescribing and monitoring of antipsychotic regimens for children and youths, and the need for larger antipsychotic safety studies in this population.
- Examining risks associated with specific antipsychotics will require larger datasets, but will be critical for our understanding of the risks and benefits.
2. Daly EJ, Trivedi MH, Janik A, et al. Efficacy of esketamine nasal spray plus oral antidepressant treatment for relapse prevention in patients with treatment-resistant depression: a randomized clinical trial. JAMA Psychiatry. 2019;76(9):893-903.
Controlled studies have shown esketamine has efficacy for treatment-resistant depression (TRD), but these studies have been only short-term, and the long-term effects of esketamine for TRD have not been established. To fill that gap, Daly et al2 assessed the efficacy of esketamine nasal spray plus an oral antidepressant vs a placebo nasal spray plus an oral antidepressant in delaying relapse of depressive symptoms in patients with TRD. All patients were in stable remission after an optimization course of esketamine nasal spray plus an oral antidepressant.
Study design
- Between October 2015 and February 2018, researchers conducted a phase III, multicenter, double-blind, randomized withdrawal study to evaluate the effect of continuation of esketamine on rates of relapse in patients with TRD who had responded to initial treatment with esketamine.
- Initially, 705 adults were enrolled. Of these participants, 455 proceeded to the optimization phase, in which they were treated with esketamine nasal spray plus an oral antidepressant.
- After 16 weeks of optimization treatment, 297 participants achieved remission or stable response and were randomized to a treatment group, which received continued esketamine nasal spray plus an oral antidepressant, or to a control group, which received a placebo nasal spray plus an oral antidepressant.
Outcomes
- Treatment with esketamine nasal spray and an oral antidepressant was associated with decreased rates of relapse compared with treatment with placebo nasal spray and an oral antidepressant. This was the case among patients who had achieved remission as well as those who had achieved stable response.
- Continued treatment with esketamine decreased the risk of relapse by 51%, with 40 participants in the treatment group experiencing relapse compared with 73 participants in the placebo group.
Continue to: Conclusion
Conclusion
- In patients with TRD who responded to initial treatment with esketamine, continuing esketamine plus an oral antidepressant resulted in clinically meaningful superiority in preventing relapse compared with a placebo nasal spray plus an oral antidepressant.
3. Williams NR, Heifets BD, Blasey C, et al. Attenuation of antidepressant effects of ketamine by opioid receptor antagonism. Am J Psychiatry. 2018;175(12):1205-1215.
Many studies have documented the efficacy of ketamine as a rapid-onset antidepressant. Studies investigating the mechanism of this effect have focused on antagonism of N-methyl-
Study design
- This double-blind crossover study evaluated if opioid receptor activation is necessary for ketamine to have an antidepressant effect in patients with TRD.
- Twelve participants completed both sides of the study in a randomized order. Participants received placebo or naltrexone prior to an IV infusion of ketamine.
- Researchers measured patients’ scores on the Hamilton Depression Rating Scale (HAM-D) at baseline and 1 day after infusion. Response was defined as a ≥50% reduction in HAM-D score.
Outcomes
- Reductions in HAM-D scores among participants in the ketamine plus naltrexone group were significantly lower than those of participants in the ketamine plus placebo group.
- Dissociation related to ketamine use did not differ significantly between the naltrexone group and the placebo group.
Continue to: Conclusion
Conclusion
- This small study found a significant decrease in the antidepressant effect of ketamine infusion in patients with TRD when opioid receptors are blocked with naltrexone prior to infusion, which suggests opioid receptor activation is necessary for ketamine to be effective as an antidepressant.
- This appears to be consistent with observations of buprenorphine’s antidepressant effects. Caution is indicated until additional studies can further elucidate the mechanism of action of ketamine’s antidepressant effects (see "Ketamine/esketamine: Putative mechanism of action," page 32).
4. Nidich S, Mills PJ, Rainforth M, et al. Non-trauma-focused meditation versus exposure therapy in veterans with post-traumatic stress disorder: a randomised controlled trial. Lancet Psychiatry. 2018;5(12):975-986.
Posttraumatic stress disorder (PTSD) is a common and important public health problem. Evidence-based treatments for PTSD include trauma-focused therapies such as prolonged exposure therapy (PE). However, some patients may not respond to PE, drop out, or elect not to pursue it. Researchers continue to explore treatments that are non-trauma-focused, such as mindfulness meditation and interpersonal psychotherapy. In a 3-group comparative effectiveness trial, Nidich et al4 examined the efficacy of a non-trauma-focused intervention, transcendental meditation (TM), in reducing PTSD symptom severity and depression in veterans.
Study design
- Researchers recruited 203 veterans with PTSD from the Department of Veterans Affairs (VA) San Diego Healthcare System between June 2013 and October 2016.
- Participants were randomly assigned to 1 of 3 groups: 68 to TM, 68 to PE, and 67 to PTSD health education (HE).
- Each group received 12 sessions over 12 weeks. In addition to group and individual sessions, all participants received daily practice or assignments.
- The Clinician-Administered PTSD Scale (CAPS) was used to assess symptoms before and after treatment.
Outcomes
- The primary outcome assessed was change in PTSD symptom severity at the end of the study compared with baseline as measured by change in CAPS score.
- Transcendental meditation was found to be significantly non-inferior to PE, with a mean change in CAPS score of −16.1 in the TM group and −11.2 in the PE group.
- Both the TM and PE groups also had significant reductions in CAPS scores compared with the HE group, which had a mean change in CAPS score of −2.5.
Continue to: Conclusion
Conclusion
- Transcendental meditation is significantly not inferior to PE in the treatment of veterans with PTSD.
- The findings from this first comparative effectiveness trial comparing TM with an established psychotherapy for PTSD suggests the feasibility and efficacy of TM as an alternative therapy for veterans with PTSD.
- Because TM is self-administered after an initial expert training, it may offer an easy-to-implement approach that may be more accessible to veterans than other treatments.
5. Raskind MA, Peskind ER, Chow B, et al. Trial of prazosin for post-traumatic stress disorder in military veterans. N Engl J Med. 2018;378(6):507-517.
Several smaller randomized trials of prazosin involving a total of 283 active-duty service members, veterans, and civilian participants have shown efficacy of prazosin for PTSD-related nightmares, sleep disturbance, and overall clinical functioning. However, in a recent trial, Raskind et al5 failed to demonstrate such efficacy.
Study design
- Veterans with chronic PTSD nightmares were recruited from 13 VA medical centers to participate in a 26-week, double-blind, randomized controlled trial.
- A total of 304 participants were randomized to a prazosin treatment group (n = 152) or a placebo control group (n = 152).
- During the first 10 weeks, prazosin or placebo were administered in an escalating fashion up to a maximum dose.
- The CAPS, Pittsburgh Sleep Quality Index (PSQI), and Clinical Global Impressions of Change (CGIC) scores were measured at baseline, after 10 weeks, and after 26 weeks.
Outcomes
- Three primary outcomes measures were assessed: change in score from baseline to 10 weeks on CAPS item B2, the PSQI, and the CGIC.
- A secondary measure was change in score from baseline of the same measures at 26 weeks.
- There was no significant difference between the prazosin group and the placebo group in any of the primary or secondary measures.
Continue to: Conclusion
Conclusion
- Compared with placebo, prazosin was not associated with improvement in nightmares or sleep quality for veterans with chronic PTSD nightmares.
- Because psychosocial instability was an exclusion criterion, it is possible that a selection bias resulting from recruitment of patients who were mainly in clinically stable condition accounted for these negative results, since symptoms in such patients were less likely to be ameliorated with antiadrenergic treatment.
Treatment-resistant depression in veterans is a major clinical challenge because of these patients’ increased risk of suicide. Repetitive transcranial magnetic stimulation (rTMS) has shown promising results for TRD. In a randomized trial, Yesavage et al6 compared rTMS vs sham rTMS in veterans with TRD.
Study design
- Veterans with TRD were recruited from 9 VA medical centers throughout the United States between September 2012 and May 2016.
- Researchers randomized 164 participants into 1 of 2 groups in a double-blind fashion. The treatment group (n = 81) received left prefrontal rTMS, and the control group (n = 83) received sham rTMS.
Outcomes
- In an intention-to-treat analysis, remission rate (defined as a HAM-D score of ≤10) was assessed as the primary outcome measure.
- Remission was seen in both groups, with 40.7% of the treatment group achieving remission and 37.4% of the control group achieving remission. However, the difference between the 2 groups was not significant (P = .67), with an odds ratio of 1.16.
Continue to: Conclusion
Conclusion
- In this study, treatment with rTMS did not show a statistically significant difference in rates of remission from TRD in veterans compared with sham rTMS. This differs from previous rTMS trials in non-veteran patients.
- The findings of this study also differed from those of other rTMS research in terms of the high remission rates that were seen in both the active and sham groups.
Bottom Line
The risk of death might be increased in children and young adults who receive highdose antipsychotics. Continued treatment with intranasal esketamine may help prevent relapse in patients with treatment-resistant depression (TRD) who initially respond to esketamine. The antidepressant effects of ketamine might be associated with opioid receptor activation. Transcendental meditation may be helpful for patients with posttraumatic stress disorder (PTSD), while prazosin might not improve nightmares or sleep quality in patients with PTSD. Repetitive transcranial magnetic stimulation (rTMS) might not be any more effective than sham rTMS for veterans with TRD.
Related Resources
- NEJM Journal Watch. www.jwatch.org.
- F1000 Prime. https://f1000.com/prime/home.
- BMJ Journals Evidence-Based Mental Health. https://ebmh.bmj.com.
Drug Brand Names
Buprenorphine • Subutex
Chlorpromazine • Thorazine
Esketamine nasal spray • Spravato
Ketamine • Ketalar
Naltrexone • Narcan
Prazosin • Minipress
1. Ray WA, Stein CM, Murray KT, et al. Association of antipsychotic treatment with risk of unexpected death among children and youths. JAMA Psychiatry. 2019;76(2):162-171.
2. Daly EJ, Trivedi MH, Janik A, et al. Efficacy of esketamine nasal spray plus oral antidepressant treatment for relapse prevention in patients with treatment-resistant depression: a randomized clinical trial. JAMA Psychiatry. 2019;76(9):893-903.
3. Williams NR, Heifets BD, Blasey C, et al. Attenuation of antidepressant effects of ketamine by opioid receptor antagonism. Am J Psychiatry. 2018;175(12):1205-1215.
4. Nidich S, Mills PJ, Rainforth M, et al. Non-trauma-focused meditation versus exposure therapy in veterans with post-traumatic stress disorder: a randomized controlled trial. Lancet Psychiatry. 2018;5(12):975-986.
5. Raskind MA, Peskind ER, Chow B, et al. Trial of prazosin for post-traumatic stress disorder in military veterans. N Engl J Med. 2018;378(6):507-517.
6. Yesavage JA, Fairchild JK, Mi Z, et al. Effect of repetitive transcranial magnetic stimulation on treatment-resistant major depression in US veterans: a randomized clinical trial. JAMA Psychiatry. 2018;75(9):884-893.
7. Ray WA, Meredith S, Thapa PB, et al. Antipsychotics and the risk of sudden cardiac death. Arch Gen Psychiatry. 2001;58(12):1161-1167.
8. Ray WA, Chung CP, Murray KT, Hall K, Stein CM. Atypical antipsychotic drugs and the risk of sudden cardiac death. N Engl J Med. 2009;360(3):225-235.
9. Jeste DV, Blazer D, Casey D, et al. ACNP White Paper: update on use of antipsychotic drugs in elderly persons with dementia. Neuropsychopharmacology. 2008;33(5):957-970.

Medical Comanagement of Hip Fracture Patients Is Not Associated with Superior Perioperative Outcomes: A Propensity Score-Matched Retrospective Cohort Analysis of the National Surgical Quality Improvement Project
Hip fractures are a large source of morbidity and mortality in the United States, with >1.5 million patients affected every year.1 These patients are primarily older adults with a significant burden of associated medical comorbidities.2 The outcomes of nonoperative management are poor with regard to mortality,3 although operative management of hip fractures remains associated with a high rate of morbidity and mortality compared with several other surgical procedures, substantial resources remain devoted to the operative repair of hip fractures and to process improvement strategies for perioperative care.
Medical comanagement involves having a second nonsurgical primary team—often an internist, a hospitalist, a geriatrician, or an anesthesiologist—who would follow the patient during the hip fracture admission, and provide daily care directed toward both the hip fracture and its associated management challenges and the patient’s underlying comorbidities. This includes taking a primary or shared role in daily rounding, writing progress notes, writing orders, managing medications and therapies, disposition planning, and discharge. One argument for this practice has centered around an efficiency proposition for surgeons to spend more of their time operating and less time in these tasks of acute care management. The primary argument, though, for medical comanagement has been an outcomes proposition that frail, elderly patients with significant medical comorbidities benefit from a nonsurgeon’s focused attention to their coexisting medical problems and the interaction with the surgical issues posed by operative intervention for hip fracture. A number of previous studies have demonstrated an association between comanagement and improved perioperative outcomes.4,5 However, the most convincing improvements in several studies have been process indicators (eg, time from admission to surgery, length of stay, nurse/surgeon satisfaction) without significant differences in mortality or major morbidity.6-8 Several studies were methodologically limited due to the use of historical controls,9,10 and several were conducted in focused clinical settings (eg, a single tertiary academic center), leaving uncertainty about external validity for other care environments.6,7 To our knowledge, comanagement has not been examined in the American College of Surgeons (ACS) National Surgical Quality Improvement Program (NSQIP) dataset of hip fracture patients.
The NSQIP database offers a unique tool for clinical outcomes research because its variables are prospectively collected by a trained clinical reviewer at each participating site. Data are deidentified and aggregated into a national database, which has grown from 121 participating sites in 2005 to 708 participating sites in 2017 and now contains data on more than 6.6 million patients. The targeted hip fracture participant use file (PUF) adds additional variables and is available beginning with 2016. Internal audits ensure a high level of data reliability.11 The NSQIP has compared favorably with single-institution morbidity and mortality conference systems,12 multi-institution clinical databases,13 and administrative databases14 in accurately capturing 30-day outcomes. Unlike other databases, outcomes are recorded within 30 days even if they occur after the initial postoperative discharge. Comanagement is a dedicated variable in the NSQIP hip fracture dataset.
This study sought to examine the effect of medical comanagement on perioperative outcomes in this contemporary NSQIP database.
METHODS
This study was exempt from the Institutional Review Board review because it uses deidentified data.
We used the targeted hip fracture NSQIP PUF for 2016-2017 to examine perioperative outcomes among patients undergoing hip fracture repair and assess the relationship with medical comanagement, which is a dedicated variable in the NSQIP hip fracture database. We included patients in the comanagement cohort if they received comanagement for part or all of their hip fracture hospitalization.
Demographic, comorbidity, and preoperative variables were examined between the two cohorts. Hypoalbuminemia, as a marker of malnutrition and frailty, was defined as a preoperative serum albumin level <3.5 g/dL, which has demonstrated independent predictive value for adverse outcomes in hip fracture patients in the NSQIP.15,16 Predicted morbidity and mortality rates are calculated as probabilities available for each patient in the PUF based on a NSQIP hierarchical regression analysis of patient-level factors to predict outcomes (eg, not including hospital or provider factors). We also examined the relationship in regard to participation in a standardized hip fracture program (SHFP), which is a multidisciplinary protocolized pathway for hip fracture patients that may include order sets, structured care coordination, involvement of multidisciplinary therapy personnel, and daily milestones and discharge criteria. Participation in an SHFP is recorded in the NSQIP and has demonstrated an association with significantly improved outcomes in this same dataset, the targeted hip fracture PUF.17
Logistic regression was performed using all baseline variables identified to be significantly different between the cohorts, as well as the following variables with a priori potential importance in predicting membership in the comanagement cohort: admission year, sex, American Society of Anesthesiologists (ASA) physical status ≥4, and participation in an SHFP. Propensity scores were calculated using the significant variables from this model (Table 1) and the abovementioned a priori potential confounders, and then propensity score matching was performed using a greedy matching algorithm (matching ratio 1:1, caliper width = 0.1 pooled standard deviations of the logit of the propensity score) to create comanagement and control cohorts for matched analysis.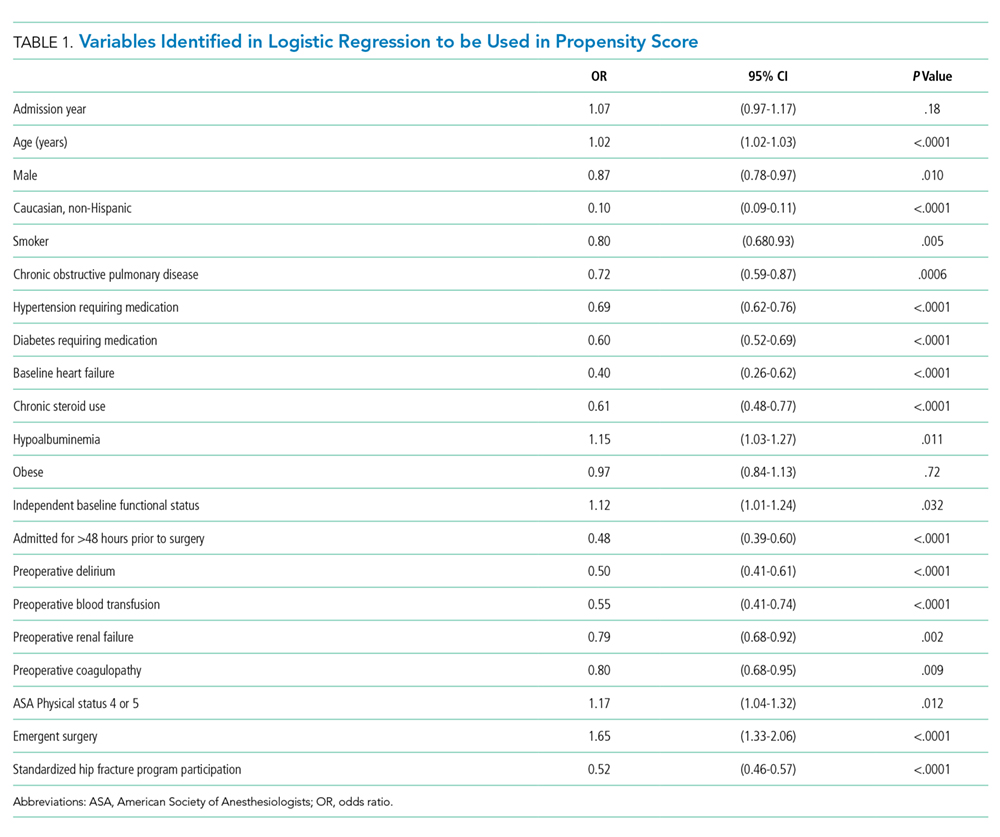
The primary outcomes were 30-day mortality and a composite endpoint of major morbidity, including readmission, pulmonary complications (pneumonia, reintubation, prolonged mechanical ventilation, and pulmonary embolism [PE]), septic shock, stroke, myocardial infarction, cardiac arrest, or death. Secondary outcomes included postoperative length of stay, disposition at postoperative day 30, and process compliance measures (proportion of patients allowed to be weight-bearing as tolerated on postoperative day 1, and proportion of patients appropriately prescribed deep venous thrombosis [DVT] prophylaxis for 28 days, proportion of patients appropriately prescribed bone protective medication [eg, vitamin D, bisphosphonates, teriparatide, denosumab, and raloxifene] postoperatively).
Descriptive variables are reported as median (interquartile range) and number (percentage), unless otherwise noted. Continuous outcomes were compared using a Mann–Whitney–Wilcoxon test. Binary outcomes were compared using Fisher’s exact tests (or a Pearson’s Chi-square for more than two response levels) and odds ratios with 95% confidence intervals.
RESULTS
A total of 19,896 Hip fracture patients were categorized into a medical comanagement cohort of 17,600 (88.5%) patients and a cohort without comanagement of 2,296 patients (11.5%). Baseline characteristics of the two unadjusted cohorts before propensity score matching are presented in Table 2.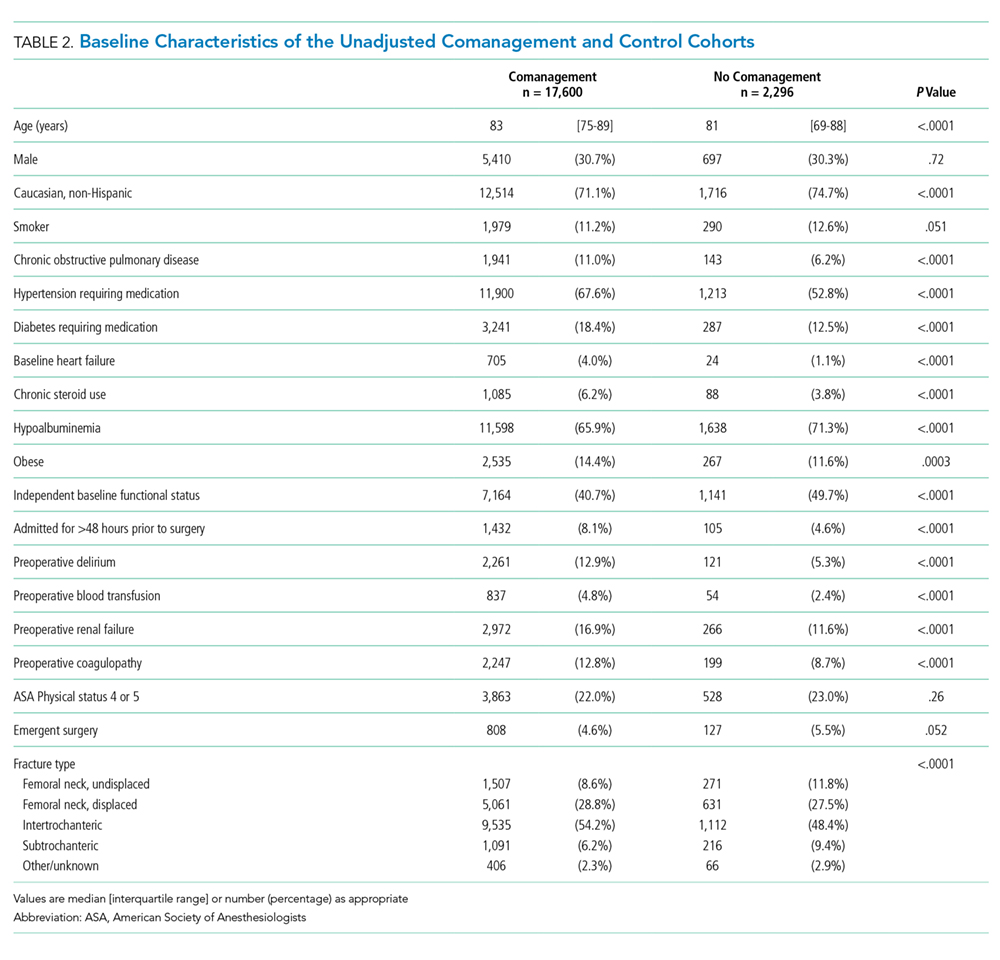
Patients in the comanagement cohort were older and sicker in terms of almost every comorbidity and condition evaluated (Table 2). These differences were also reflected in a higher predicted mortality by the NSQIP hierarchical regression-based equations for mortality (3.5% [1.7%-7.0%] vs 2.5% [0.9%-6.1%], P < .0001) and morbidity (9.1% [6.9%-12.5%] vs 8.5% [6.1%-12.1%], P ≤ .0001). As predicted, the observed, unadjusted rate of death in the comanagement cohort was higher than that in the cohort without comanagement: n = 1,210 (6.9%) vs n = 91 (4.0%), odds ratio (OR) 1.79: 1.44-2.22; P < .0001, as was the unadjusted rate of the composite endpoint of major morbidity: n = 3,425 (19.5%) vs n = 220 (9.6%), OR 2.28: 1.98-2.63, P < .0001. There was no difference in the prevalence of using an SHFP in the comanagement and noncomanagement cohorts (n = 9,441, 53.6% vs n = 1,232, 53.7%, P > .05).
Logistic regression modeling of the probability of membership in the comanagement cohort yielded satisfactory results (convergent model, null hypothesis rejected, area under the curve of the model receiver operating curve [AUROC] = 0.81). Propensity scores were calculated using the significant variables from this model, as detailed in Table 1. Propensity score matching was then performed with excellent results as follows: n = 2,278 of 2,296 (99.2%) potential pairs were successfully matched, residual absolute standardized difference = 0.0039 (99.7% reduction), variance ratio = 1.01. This satisfies the traditional criterion for a satisfactory variable balance in propensity score matching of a standardized difference ≤0.25 and a variance ratio between 0.5 and 2.0. It is also worthy of note that the propensity score matching process successfully eliminated the baseline difference in the NSQIP-predicted probability of mortality (2.7% [1.1%-5.8%] vs 2.5% [0.9%-6.2%], P = .15) and morbidity (8.6% [6.5%-11.7%] vs 8.6% [6.1%-12.2%], P = .80).
The characteristics of the propensity score-matched cohorts (n = 2,278 each) are shown in Table 3. Matching resulted in a satisfactory balance of measurable covariates between the two cohorts, with the exception of small (but statistically significant) differences in the prevalence of hypoalbuminemia and the distribution of fracture type.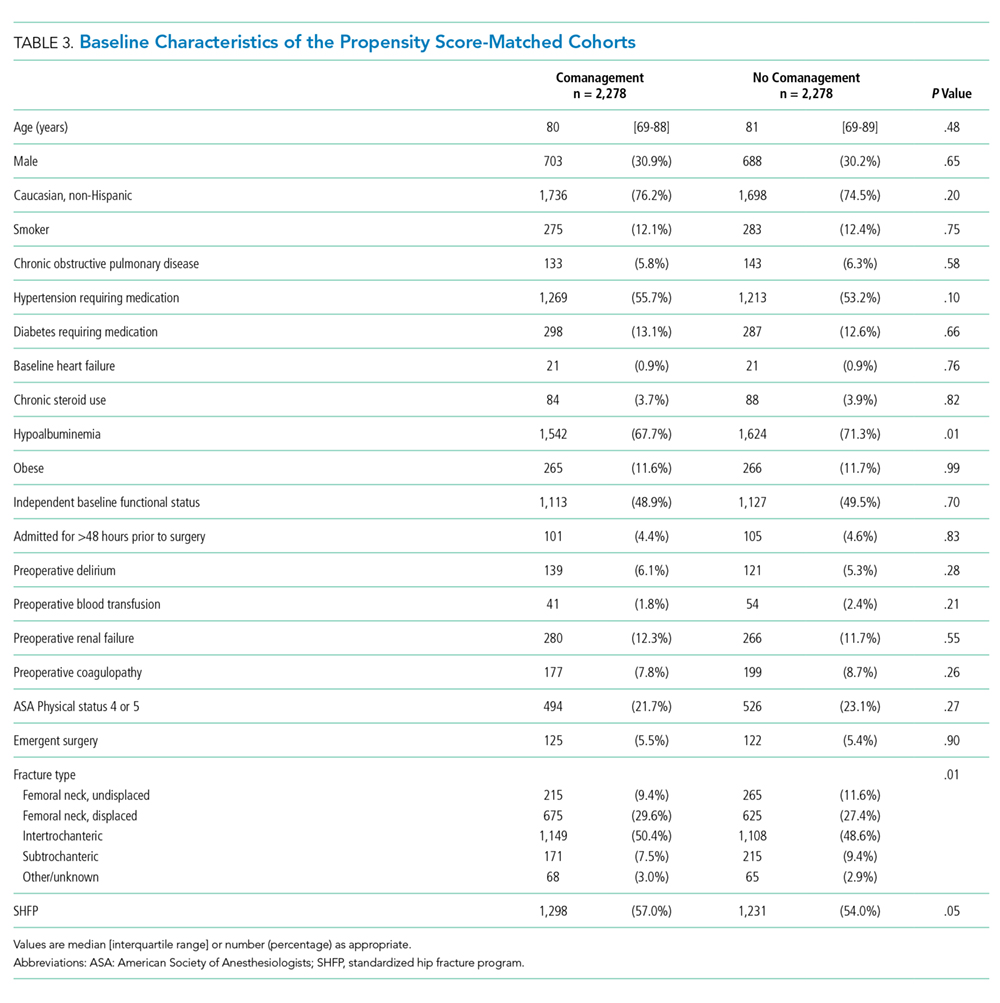
The comanagement cohort did not experience superior results for either of the two primary outcomes mortality (OR 1.36: 1.02-1.81; P = .033) or in the composite endpoint of morbidity (OR 1.82: 1.52-2.20; P < .0001). The secondary outcomes of the two cohorts of patients are shown in Table 4. The comanagement cohort did not have superior outcomes in any variable examined, except for a slightly higher proportion of patients who were appropriately prescribed DVT prophylaxis. Despite the prophylaxis, the comanagement cohort did not have a smaller proportion of patients who experienced a DVT or PE.
Post hoc subgroup analysis was performed to assess whether comanagement demonstrated an association with improved outcomes depending on whether patients were or were not treated in an SHFP. This stratified analysis produced the same results as the primary analysis; ie, comanagement was not associated with improved outcomes in either subgroup.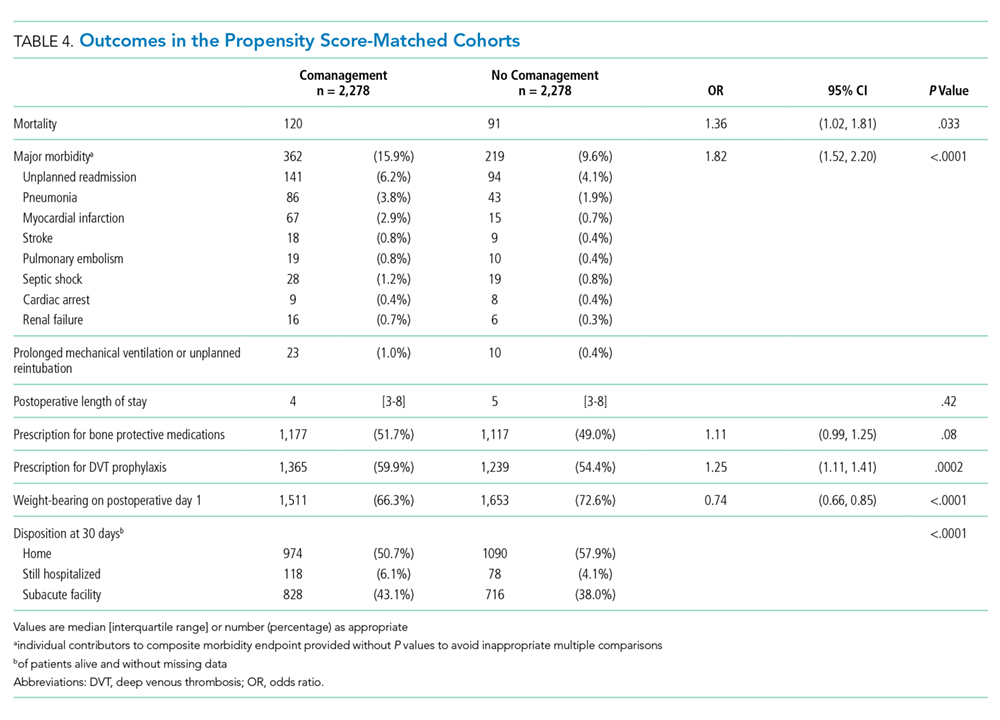
DISCUSSION
The primary finding of this study is that even once propensity score matching eliminated nearly all discernible baseline differences between the cohorts of hip fracture patients with and without medical comanagement during their hospitalization, and comanagement was not associated with superior (and in fact was associated with still inferior) perioperative outcomes.
As is evident from the baseline differences shown in Table 2, medical comanagement is utilized in a patient population that has significant comorbidities and adverse patient factors. The NSQIP provides a robust opportunity to remove the effects of these confounding variables because of the richness of variables in the dataset. For instance, some studies used a summary score for patient frailty, which has been an apparent predictor of worse clinical outcomes in this population.18,19 The NSQIP analyzes each component of the frailty score (diabetic status, history of COPD or current pneumonia, congestive heart failure, hypertension requiring medication, and nonindependent functional status) as well as to add additional variables (eg, low serum albumin level) and propensity score matching on each of these variables individually.
It is also important to note that although prior analyses have demonstrated that SHFPs are associated with better outcomes in this database,17 comanagement did not correlate with the use of an SHFP, nor did comanagement demonstrate any association with better outcomes in the subgroup who participated in an SHFP or in the subgroup who did not.
This retrospective cohort analysis cannot, of course, demonstrate causation. Several limitations are worth noting. The ability to use any retrospective dataset depends on the quality of the variable definitions and the data quality contained in it. Although the NSQIP has demonstrated high validity and interobserver variability compared with other data sources, some imperfections and heterogeneity (for instance, in the way two different institutions may define comanagement) may be present.
It is important to note that any propensity score-matched analysis incurs the risk of residual/unmeasured confounding, since the power of this technique still depends on the presence of measured variables to match, and no match is ever perfect. For instance, some variables remain imperfectly balanced in the matched cohorts (eg, hypoalbuminemia and fracture type, Table 3). These differences may reach statistical significance because of large sample size without obvious clinical significance, but they illustrate the point that residual confounding may persist. It is also possible that some detection bias is present in the comanagement cohort, if dedicated comanagement personnel are more likely to diagnose complications (eg, pneumonia, PE) that require some clinical suspicion to be identified. We doubt that this plays a dominant role, for the NSQIP is relatively robust to this potential bias because of its rigorous process of relying on a trained clinical reviewer at each site (as opposed, for instance, to using billing codes), and several components of the composite morbidity endpoint (eg, reintubation, prolonged mechanical ventilation, stroke, cardiac arrest, or death) would be difficult to miss even if clinicians have low clinical suspicion or attentiveness. However, some potential remains.
It is also possible that comanagement is applied to sicker patients and functions more as a marker of that population than an intervention that improves results. To take a similar example, past literature has demonstrated a strong association between do-not-resuscitate (DNR) status and adverse outcomes.20-24 In all likelihood, the DNR status does not directly cause worse outcomes so much as it marks a sick and vulnerable population. Selection bias at the individual patient level may contribute to an association between comanagement and worse outcomes.
Similarly, institutions that routinely apply comanagement may care for a sicker patient population. To this end, institution-level variables may modulate the relationship between comanagement, SHFP participation, and outcomes. Comanagement and SHFP participation may cluster according to the surgeon, the institution, or the patient subtype (eg, ICU vs ward status). Unfortunately, individual hospital and surgeon identifiers are explicitly excluded from the publicly available NSQIP PUF to protect program and patient confidentiality, so that advanced hierarchical modeling techniques cannot explore these relationships with this dataset.
Beyond these limitations, one plausible explanation for the lack of an association between comanagement and improved outcomes is that standardization and other continuous quality improvement processes have already accomplished a great deal, and the addition of comanagement of individual patients is not having an appreciably positive additional impact. Although the acuity and prevalence of comorbidities in the hip fracture population are high, many of their issues may be stereotyped enough that thoughtful, well-designed algorithms and protocols may serve them nearly as well, if not better than individual comanagement.
This admittedly speculative explanation has significant implications for resource utilization and patient care. Medical comanagement involves a heavy investment of time, energy, and money on the part of a second medical team to deliberately duplicate some aspects of daily care with the intended goal of improving patient outcomes. The results of this study may provide motivation for efforts to hybridize or modify the involvement of comanaging physicians and teams—for instance, to guide and refine the creation and revision of SHFP protocols without providing daily comanagement to each individual patient and/or to implement more iterative, continuous process improvement initiatives.25 Our results may also help direct healthcare systems to focus elsewhere in the search for modifiable process and care delivery variables that can move the needle on the significant morbidity and mortality that still exist in this population.
1. Arneson TJ, Li S, Liu J, Kilpatrick RD, Newsome BB, St. Peter WL. Trends in hip fracture rates in US hemodialysis patients, 1993-2010. Am J Kidney Dis. 2013;62(4):747-754. https://doi.org/10.1053/j.ajkd.2013.02.368.
2. Brauer CA, Coca-Perraillon M, Cutler DM, Rosen AB. Incidence and mortality of hip fractures in the United States. JAMA. 2009;302(14):1573-1579. https://doi.org/10.1001/jama.2009.1462.
3. Chlebeck JD, Birch CE, Blankstein M, Kristiansen T, Bartlett CS, Schottel PC. Nonoperative geriatric hip fracture treatment is associated with increased mortality. J Orthop Trauma. 2019;33(7):346-350. https://doi.org/10.1097/BOT.0000000000001460.
4. Wu X, Tian M, Zhang J, et al. The effect of a multidisciplinary co-management program for the older hip fracture patients in Beijing: a “pre- and post-” retrospective study. Arch Osteoporos. 2019;14(1):43. https://doi.org/10.1007/s11657-019-0594-1.
5. Stephens JR, Chang JW, Liles EA, Adem M, Moore C. Impact of hospitalist vs. non-hospitalist services on length of stay and 30-day readmission rate in hip fracture patients. Hosp Pract. 2019;47(1):24-27. https://doi.org/10.1080/21548331.2019.1537850.
6. Phy MP, Vanness DJ, Melton LJ, et al. Effects of a hospitalist model on elderly patients with hip fracture. Arch Intern Med. 2005;165(7):796-801. https://doi.org/10.1001/archinte.165.7.796.
7. Batsis JA, Phy MP, Melton LJ, et al. Effects of a hospitalist care model on mortality of elderly patients with hip fractures. J Hosp Med. 2007;2(4):219-225. https://doi.org/10.1002/jhm.207
8. Huddleston JM, Long KH, Naessens JM, et al. Medical and surgical comanagement after elective hip and knee arthroplasty: a randomized, controlled trial. Ann Intern Med. 2004;141(1):28-38. https://doi.org/10.7326/0003-4819-141-1-200407060-00012.
9. Gosch M, Hoffmann-Weltin Y, Roth T, Blauth M, Nicholas JA, Kammerlander C. Orthogeriatric co-management improves the outcome of long-term care residents with fragility fractures. Arch Orthop Trauma Surg. 2016;136(10):1403-1409. https://doi.org/10.1007/s00402-016-2543-4.
10. Folbert EC, Hegeman JH, Vermeer M, et al. Improved 1-year mortality in elderly patients with a hip fracture following integrated orthogeriatric treatment. Osteoporos Int. 2017;28(1):269-277. https://doi.org/10.1007/s00198-016-3711-7.
11. Shiloach M, Frencher SK, Steeger JE, et al. Toward robust information: data quality and inter-rater reliability in the American College of Surgeons National Surgical Quality Improvement Program. J Am Coll Surg. 2010;210(1):6-16. https://doi.org/10.1016/j.jamcollsurg.2009.09.031.
12. Hutter MM, Rowell KS, Devaney LA, et al. Identification of surgical complications and deaths: an assessment of the traditional surgical morbidity and mortality conference compared with the American College of Surgeons-National Surgical Quality Improvement Program. J Am Coll Surg. 2006;203(5):618-624. https://doi.org/10.1016/j.jamcollsurg.2006.07.010.
13. Davenport DL, Holsapple CW, Conigliaro J. Assessing surgical quality using administrative and clinical data sets: a direct comparison of the University HealthSystem Consortium Clinical Database and the National Surgical Quality Improvement Program data set. Am J Med Qual. 2009;24(5):395-402. https://doi.org/10.1177/1062860609339936.
14. Yu P, Chang DC, Osen HB, Talamini MA. NSQIP reveals significant incidence of death following discharge. J Surg Res. 2011;170(2):e217-e224. https://doi.org/10.1016/j.jss.2011.05.040.
15. Wilson J, Lunati M, Grabel Z, Staley C, Schwartz A, Schenker M. Hypoalbuminemia is an independent risk factor for 30-day mortality, postoperative complications, readmission, and reoperation in the operative lower extremity orthopedic trauma patient. J Orthop Trauma. 2019;33(6):284-291. https://doi.org/10.1097/BOT.0000000000001448.
16. Bohl DD, Shen MR, Hannon CP, Fillingham YA, Darrith B, Della Valle CJ. Serum albumin predicts survival and postoperative course following surgery for geriatric hip fracture. J Bone Jt Surg. 2017;99(24):2110-2118. https://doi.org/10.2106/JBJS.16.01620.
17. Arshi A, Rezzadeh K, Stavrakis AI, Bukata S V, Zeegen EN. Standardized hospital-based care programs improve geriatric hip fracture outcomes: an analysis of the ACS-NSQIP targeted hip fracture series. J Orthop Trauma. 2019;33(6): e223-e228. https://doi.org/10.1097/BOT.0000000000001443.
18. Traven SA, Reeves RA, Althoff AD, Slone HS, Walton ZJ. New 5-factor modified frailty index predicts morbidity and mortality in geriatric hip fractures. J Orthop Trauma. 2019;33(7):319-323. https://doi.org/10.1097/BOT.0000000000001455.
19. Wilson JM, Boissonneault AR, Schwartz AM, Staley CA, Schenker ML. Frailty and malnutrition are associated with inpatient post-operative complications and mortality in hip fracture patients. J Orthop Trauma. 2018;33(3):143-148. https://doi.org/10.1097/BOT.0000000000001386.
20. Brovman EY, Pisansky AJ, Beverly A, Bader AM, Urman RD. Do Not Resuscitate Status as an independent risk factor for patients undergoing surgery for hip fracture. World J Orthop. 2017;8(12):902-912. https://doi.org/10.5312/wjo.v8.i12.902.
21. Brovman EY, Walsh EC, Burton BN, et al. Postoperative outcomes in patients with a do-not-resuscitate (DNR) order undergoing elective procedures. J Clin Anesth. 2018;48:81-88. https://doi.org/10.1016/j.jclinane.2018.05.007.
22. Beverly A, Brovman EY, Urman RD. Comparison of postoperative outcomes in elderly patients with a do-not-resuscitate order undergoing elective and nonelective hip surgery. Geriatr Orthop Surg Rehabil. 2017;8(2):78-86. https://doi.org/10.1177/2151458516685826.
23. Maxwell BG, Lobato RL, Cason MB, Wong JK. Perioperative morbidity and mortality of cardiothoracic surgery in patients with a do-not-resuscitate order. PeerJ. 2014;2013(1):1-10. https://doi.org/10.7717/peerj.245.
24. Kazaure H, Roman S, Sosa JA. High mortality in surgical patients with do-not-resuscitate orders: analysis of 8256 patients. Arch Surg. 2011;146(8):922-928. https://doi.org/10.1001/archsurg.2011.69.
25. Brañas F, Ruiz-Pinto A, Fernández E, et al. Beyond orthogeriatric co-management model: benefits of implementing a process management system for hip fracture. Arch Osteoporos. 2018;13(1):81. https://doi.org/10.1007/s11657-018-0497-6.
Hip fractures are a large source of morbidity and mortality in the United States, with >1.5 million patients affected every year.1 These patients are primarily older adults with a significant burden of associated medical comorbidities.2 The outcomes of nonoperative management are poor with regard to mortality,3 although operative management of hip fractures remains associated with a high rate of morbidity and mortality compared with several other surgical procedures, substantial resources remain devoted to the operative repair of hip fractures and to process improvement strategies for perioperative care.
Medical comanagement involves having a second nonsurgical primary team—often an internist, a hospitalist, a geriatrician, or an anesthesiologist—who would follow the patient during the hip fracture admission, and provide daily care directed toward both the hip fracture and its associated management challenges and the patient’s underlying comorbidities. This includes taking a primary or shared role in daily rounding, writing progress notes, writing orders, managing medications and therapies, disposition planning, and discharge. One argument for this practice has centered around an efficiency proposition for surgeons to spend more of their time operating and less time in these tasks of acute care management. The primary argument, though, for medical comanagement has been an outcomes proposition that frail, elderly patients with significant medical comorbidities benefit from a nonsurgeon’s focused attention to their coexisting medical problems and the interaction with the surgical issues posed by operative intervention for hip fracture. A number of previous studies have demonstrated an association between comanagement and improved perioperative outcomes.4,5 However, the most convincing improvements in several studies have been process indicators (eg, time from admission to surgery, length of stay, nurse/surgeon satisfaction) without significant differences in mortality or major morbidity.6-8 Several studies were methodologically limited due to the use of historical controls,9,10 and several were conducted in focused clinical settings (eg, a single tertiary academic center), leaving uncertainty about external validity for other care environments.6,7 To our knowledge, comanagement has not been examined in the American College of Surgeons (ACS) National Surgical Quality Improvement Program (NSQIP) dataset of hip fracture patients.
The NSQIP database offers a unique tool for clinical outcomes research because its variables are prospectively collected by a trained clinical reviewer at each participating site. Data are deidentified and aggregated into a national database, which has grown from 121 participating sites in 2005 to 708 participating sites in 2017 and now contains data on more than 6.6 million patients. The targeted hip fracture participant use file (PUF) adds additional variables and is available beginning with 2016. Internal audits ensure a high level of data reliability.11 The NSQIP has compared favorably with single-institution morbidity and mortality conference systems,12 multi-institution clinical databases,13 and administrative databases14 in accurately capturing 30-day outcomes. Unlike other databases, outcomes are recorded within 30 days even if they occur after the initial postoperative discharge. Comanagement is a dedicated variable in the NSQIP hip fracture dataset.
This study sought to examine the effect of medical comanagement on perioperative outcomes in this contemporary NSQIP database.
METHODS
This study was exempt from the Institutional Review Board review because it uses deidentified data.
We used the targeted hip fracture NSQIP PUF for 2016-2017 to examine perioperative outcomes among patients undergoing hip fracture repair and assess the relationship with medical comanagement, which is a dedicated variable in the NSQIP hip fracture database. We included patients in the comanagement cohort if they received comanagement for part or all of their hip fracture hospitalization.
Demographic, comorbidity, and preoperative variables were examined between the two cohorts. Hypoalbuminemia, as a marker of malnutrition and frailty, was defined as a preoperative serum albumin level <3.5 g/dL, which has demonstrated independent predictive value for adverse outcomes in hip fracture patients in the NSQIP.15,16 Predicted morbidity and mortality rates are calculated as probabilities available for each patient in the PUF based on a NSQIP hierarchical regression analysis of patient-level factors to predict outcomes (eg, not including hospital or provider factors). We also examined the relationship in regard to participation in a standardized hip fracture program (SHFP), which is a multidisciplinary protocolized pathway for hip fracture patients that may include order sets, structured care coordination, involvement of multidisciplinary therapy personnel, and daily milestones and discharge criteria. Participation in an SHFP is recorded in the NSQIP and has demonstrated an association with significantly improved outcomes in this same dataset, the targeted hip fracture PUF.17
Logistic regression was performed using all baseline variables identified to be significantly different between the cohorts, as well as the following variables with a priori potential importance in predicting membership in the comanagement cohort: admission year, sex, American Society of Anesthesiologists (ASA) physical status ≥4, and participation in an SHFP. Propensity scores were calculated using the significant variables from this model (Table 1) and the abovementioned a priori potential confounders, and then propensity score matching was performed using a greedy matching algorithm (matching ratio 1:1, caliper width = 0.1 pooled standard deviations of the logit of the propensity score) to create comanagement and control cohorts for matched analysis.
The primary outcomes were 30-day mortality and a composite endpoint of major morbidity, including readmission, pulmonary complications (pneumonia, reintubation, prolonged mechanical ventilation, and pulmonary embolism [PE]), septic shock, stroke, myocardial infarction, cardiac arrest, or death. Secondary outcomes included postoperative length of stay, disposition at postoperative day 30, and process compliance measures (proportion of patients allowed to be weight-bearing as tolerated on postoperative day 1, and proportion of patients appropriately prescribed deep venous thrombosis [DVT] prophylaxis for 28 days, proportion of patients appropriately prescribed bone protective medication [eg, vitamin D, bisphosphonates, teriparatide, denosumab, and raloxifene] postoperatively).
Descriptive variables are reported as median (interquartile range) and number (percentage), unless otherwise noted. Continuous outcomes were compared using a Mann–Whitney–Wilcoxon test. Binary outcomes were compared using Fisher’s exact tests (or a Pearson’s Chi-square for more than two response levels) and odds ratios with 95% confidence intervals.
RESULTS
A total of 19,896 Hip fracture patients were categorized into a medical comanagement cohort of 17,600 (88.5%) patients and a cohort without comanagement of 2,296 patients (11.5%). Baseline characteristics of the two unadjusted cohorts before propensity score matching are presented in Table 2.
Patients in the comanagement cohort were older and sicker in terms of almost every comorbidity and condition evaluated (Table 2). These differences were also reflected in a higher predicted mortality by the NSQIP hierarchical regression-based equations for mortality (3.5% [1.7%-7.0%] vs 2.5% [0.9%-6.1%], P < .0001) and morbidity (9.1% [6.9%-12.5%] vs 8.5% [6.1%-12.1%], P ≤ .0001). As predicted, the observed, unadjusted rate of death in the comanagement cohort was higher than that in the cohort without comanagement: n = 1,210 (6.9%) vs n = 91 (4.0%), odds ratio (OR) 1.79: 1.44-2.22; P < .0001, as was the unadjusted rate of the composite endpoint of major morbidity: n = 3,425 (19.5%) vs n = 220 (9.6%), OR 2.28: 1.98-2.63, P < .0001. There was no difference in the prevalence of using an SHFP in the comanagement and noncomanagement cohorts (n = 9,441, 53.6% vs n = 1,232, 53.7%, P > .05).
Logistic regression modeling of the probability of membership in the comanagement cohort yielded satisfactory results (convergent model, null hypothesis rejected, area under the curve of the model receiver operating curve [AUROC] = 0.81). Propensity scores were calculated using the significant variables from this model, as detailed in Table 1. Propensity score matching was then performed with excellent results as follows: n = 2,278 of 2,296 (99.2%) potential pairs were successfully matched, residual absolute standardized difference = 0.0039 (99.7% reduction), variance ratio = 1.01. This satisfies the traditional criterion for a satisfactory variable balance in propensity score matching of a standardized difference ≤0.25 and a variance ratio between 0.5 and 2.0. It is also worthy of note that the propensity score matching process successfully eliminated the baseline difference in the NSQIP-predicted probability of mortality (2.7% [1.1%-5.8%] vs 2.5% [0.9%-6.2%], P = .15) and morbidity (8.6% [6.5%-11.7%] vs 8.6% [6.1%-12.2%], P = .80).
The characteristics of the propensity score-matched cohorts (n = 2,278 each) are shown in Table 3. Matching resulted in a satisfactory balance of measurable covariates between the two cohorts, with the exception of small (but statistically significant) differences in the prevalence of hypoalbuminemia and the distribution of fracture type.
The comanagement cohort did not experience superior results for either of the two primary outcomes mortality (OR 1.36: 1.02-1.81; P = .033) or in the composite endpoint of morbidity (OR 1.82: 1.52-2.20; P < .0001). The secondary outcomes of the two cohorts of patients are shown in Table 4. The comanagement cohort did not have superior outcomes in any variable examined, except for a slightly higher proportion of patients who were appropriately prescribed DVT prophylaxis. Despite the prophylaxis, the comanagement cohort did not have a smaller proportion of patients who experienced a DVT or PE.
Post hoc subgroup analysis was performed to assess whether comanagement demonstrated an association with improved outcomes depending on whether patients were or were not treated in an SHFP. This stratified analysis produced the same results as the primary analysis; ie, comanagement was not associated with improved outcomes in either subgroup.
DISCUSSION
The primary finding of this study is that even once propensity score matching eliminated nearly all discernible baseline differences between the cohorts of hip fracture patients with and without medical comanagement during their hospitalization, and comanagement was not associated with superior (and in fact was associated with still inferior) perioperative outcomes.
As is evident from the baseline differences shown in Table 2, medical comanagement is utilized in a patient population that has significant comorbidities and adverse patient factors. The NSQIP provides a robust opportunity to remove the effects of these confounding variables because of the richness of variables in the dataset. For instance, some studies used a summary score for patient frailty, which has been an apparent predictor of worse clinical outcomes in this population.18,19 The NSQIP analyzes each component of the frailty score (diabetic status, history of COPD or current pneumonia, congestive heart failure, hypertension requiring medication, and nonindependent functional status) as well as to add additional variables (eg, low serum albumin level) and propensity score matching on each of these variables individually.
It is also important to note that although prior analyses have demonstrated that SHFPs are associated with better outcomes in this database,17 comanagement did not correlate with the use of an SHFP, nor did comanagement demonstrate any association with better outcomes in the subgroup who participated in an SHFP or in the subgroup who did not.
This retrospective cohort analysis cannot, of course, demonstrate causation. Several limitations are worth noting. The ability to use any retrospective dataset depends on the quality of the variable definitions and the data quality contained in it. Although the NSQIP has demonstrated high validity and interobserver variability compared with other data sources, some imperfections and heterogeneity (for instance, in the way two different institutions may define comanagement) may be present.
It is important to note that any propensity score-matched analysis incurs the risk of residual/unmeasured confounding, since the power of this technique still depends on the presence of measured variables to match, and no match is ever perfect. For instance, some variables remain imperfectly balanced in the matched cohorts (eg, hypoalbuminemia and fracture type, Table 3). These differences may reach statistical significance because of large sample size without obvious clinical significance, but they illustrate the point that residual confounding may persist. It is also possible that some detection bias is present in the comanagement cohort, if dedicated comanagement personnel are more likely to diagnose complications (eg, pneumonia, PE) that require some clinical suspicion to be identified. We doubt that this plays a dominant role, for the NSQIP is relatively robust to this potential bias because of its rigorous process of relying on a trained clinical reviewer at each site (as opposed, for instance, to using billing codes), and several components of the composite morbidity endpoint (eg, reintubation, prolonged mechanical ventilation, stroke, cardiac arrest, or death) would be difficult to miss even if clinicians have low clinical suspicion or attentiveness. However, some potential remains.
It is also possible that comanagement is applied to sicker patients and functions more as a marker of that population than an intervention that improves results. To take a similar example, past literature has demonstrated a strong association between do-not-resuscitate (DNR) status and adverse outcomes.20-24 In all likelihood, the DNR status does not directly cause worse outcomes so much as it marks a sick and vulnerable population. Selection bias at the individual patient level may contribute to an association between comanagement and worse outcomes.
Similarly, institutions that routinely apply comanagement may care for a sicker patient population. To this end, institution-level variables may modulate the relationship between comanagement, SHFP participation, and outcomes. Comanagement and SHFP participation may cluster according to the surgeon, the institution, or the patient subtype (eg, ICU vs ward status). Unfortunately, individual hospital and surgeon identifiers are explicitly excluded from the publicly available NSQIP PUF to protect program and patient confidentiality, so that advanced hierarchical modeling techniques cannot explore these relationships with this dataset.
Beyond these limitations, one plausible explanation for the lack of an association between comanagement and improved outcomes is that standardization and other continuous quality improvement processes have already accomplished a great deal, and the addition of comanagement of individual patients is not having an appreciably positive additional impact. Although the acuity and prevalence of comorbidities in the hip fracture population are high, many of their issues may be stereotyped enough that thoughtful, well-designed algorithms and protocols may serve them nearly as well, if not better than individual comanagement.
This admittedly speculative explanation has significant implications for resource utilization and patient care. Medical comanagement involves a heavy investment of time, energy, and money on the part of a second medical team to deliberately duplicate some aspects of daily care with the intended goal of improving patient outcomes. The results of this study may provide motivation for efforts to hybridize or modify the involvement of comanaging physicians and teams—for instance, to guide and refine the creation and revision of SHFP protocols without providing daily comanagement to each individual patient and/or to implement more iterative, continuous process improvement initiatives.25 Our results may also help direct healthcare systems to focus elsewhere in the search for modifiable process and care delivery variables that can move the needle on the significant morbidity and mortality that still exist in this population.
1. Arneson TJ, Li S, Liu J, Kilpatrick RD, Newsome BB, St. Peter WL. Trends in hip fracture rates in US hemodialysis patients, 1993-2010. Am J Kidney Dis. 2013;62(4):747-754. https://doi.org/10.1053/j.ajkd.2013.02.368.
2. Brauer CA, Coca-Perraillon M, Cutler DM, Rosen AB. Incidence and mortality of hip fractures in the United States. JAMA. 2009;302(14):1573-1579. https://doi.org/10.1001/jama.2009.1462.
3. Chlebeck JD, Birch CE, Blankstein M, Kristiansen T, Bartlett CS, Schottel PC. Nonoperative geriatric hip fracture treatment is associated with increased mortality. J Orthop Trauma. 2019;33(7):346-350. https://doi.org/10.1097/BOT.0000000000001460.
4. Wu X, Tian M, Zhang J, et al. The effect of a multidisciplinary co-management program for the older hip fracture patients in Beijing: a “pre- and post-” retrospective study. Arch Osteoporos. 2019;14(1):43. https://doi.org/10.1007/s11657-019-0594-1.
5. Stephens JR, Chang JW, Liles EA, Adem M, Moore C. Impact of hospitalist vs. non-hospitalist services on length of stay and 30-day readmission rate in hip fracture patients. Hosp Pract. 2019;47(1):24-27. https://doi.org/10.1080/21548331.2019.1537850.
6. Phy MP, Vanness DJ, Melton LJ, et al. Effects of a hospitalist model on elderly patients with hip fracture. Arch Intern Med. 2005;165(7):796-801. https://doi.org/10.1001/archinte.165.7.796.
7. Batsis JA, Phy MP, Melton LJ, et al. Effects of a hospitalist care model on mortality of elderly patients with hip fractures. J Hosp Med. 2007;2(4):219-225. https://doi.org/10.1002/jhm.207
8. Huddleston JM, Long KH, Naessens JM, et al. Medical and surgical comanagement after elective hip and knee arthroplasty: a randomized, controlled trial. Ann Intern Med. 2004;141(1):28-38. https://doi.org/10.7326/0003-4819-141-1-200407060-00012.
9. Gosch M, Hoffmann-Weltin Y, Roth T, Blauth M, Nicholas JA, Kammerlander C. Orthogeriatric co-management improves the outcome of long-term care residents with fragility fractures. Arch Orthop Trauma Surg. 2016;136(10):1403-1409. https://doi.org/10.1007/s00402-016-2543-4.
10. Folbert EC, Hegeman JH, Vermeer M, et al. Improved 1-year mortality in elderly patients with a hip fracture following integrated orthogeriatric treatment. Osteoporos Int. 2017;28(1):269-277. https://doi.org/10.1007/s00198-016-3711-7.
11. Shiloach M, Frencher SK, Steeger JE, et al. Toward robust information: data quality and inter-rater reliability in the American College of Surgeons National Surgical Quality Improvement Program. J Am Coll Surg. 2010;210(1):6-16. https://doi.org/10.1016/j.jamcollsurg.2009.09.031.
12. Hutter MM, Rowell KS, Devaney LA, et al. Identification of surgical complications and deaths: an assessment of the traditional surgical morbidity and mortality conference compared with the American College of Surgeons-National Surgical Quality Improvement Program. J Am Coll Surg. 2006;203(5):618-624. https://doi.org/10.1016/j.jamcollsurg.2006.07.010.
13. Davenport DL, Holsapple CW, Conigliaro J. Assessing surgical quality using administrative and clinical data sets: a direct comparison of the University HealthSystem Consortium Clinical Database and the National Surgical Quality Improvement Program data set. Am J Med Qual. 2009;24(5):395-402. https://doi.org/10.1177/1062860609339936.
14. Yu P, Chang DC, Osen HB, Talamini MA. NSQIP reveals significant incidence of death following discharge. J Surg Res. 2011;170(2):e217-e224. https://doi.org/10.1016/j.jss.2011.05.040.
15. Wilson J, Lunati M, Grabel Z, Staley C, Schwartz A, Schenker M. Hypoalbuminemia is an independent risk factor for 30-day mortality, postoperative complications, readmission, and reoperation in the operative lower extremity orthopedic trauma patient. J Orthop Trauma. 2019;33(6):284-291. https://doi.org/10.1097/BOT.0000000000001448.
16. Bohl DD, Shen MR, Hannon CP, Fillingham YA, Darrith B, Della Valle CJ. Serum albumin predicts survival and postoperative course following surgery for geriatric hip fracture. J Bone Jt Surg. 2017;99(24):2110-2118. https://doi.org/10.2106/JBJS.16.01620.
17. Arshi A, Rezzadeh K, Stavrakis AI, Bukata S V, Zeegen EN. Standardized hospital-based care programs improve geriatric hip fracture outcomes: an analysis of the ACS-NSQIP targeted hip fracture series. J Orthop Trauma. 2019;33(6): e223-e228. https://doi.org/10.1097/BOT.0000000000001443.
18. Traven SA, Reeves RA, Althoff AD, Slone HS, Walton ZJ. New 5-factor modified frailty index predicts morbidity and mortality in geriatric hip fractures. J Orthop Trauma. 2019;33(7):319-323. https://doi.org/10.1097/BOT.0000000000001455.
19. Wilson JM, Boissonneault AR, Schwartz AM, Staley CA, Schenker ML. Frailty and malnutrition are associated with inpatient post-operative complications and mortality in hip fracture patients. J Orthop Trauma. 2018;33(3):143-148. https://doi.org/10.1097/BOT.0000000000001386.
20. Brovman EY, Pisansky AJ, Beverly A, Bader AM, Urman RD. Do Not Resuscitate Status as an independent risk factor for patients undergoing surgery for hip fracture. World J Orthop. 2017;8(12):902-912. https://doi.org/10.5312/wjo.v8.i12.902.
21. Brovman EY, Walsh EC, Burton BN, et al. Postoperative outcomes in patients with a do-not-resuscitate (DNR) order undergoing elective procedures. J Clin Anesth. 2018;48:81-88. https://doi.org/10.1016/j.jclinane.2018.05.007.
22. Beverly A, Brovman EY, Urman RD. Comparison of postoperative outcomes in elderly patients with a do-not-resuscitate order undergoing elective and nonelective hip surgery. Geriatr Orthop Surg Rehabil. 2017;8(2):78-86. https://doi.org/10.1177/2151458516685826.
23. Maxwell BG, Lobato RL, Cason MB, Wong JK. Perioperative morbidity and mortality of cardiothoracic surgery in patients with a do-not-resuscitate order. PeerJ. 2014;2013(1):1-10. https://doi.org/10.7717/peerj.245.
24. Kazaure H, Roman S, Sosa JA. High mortality in surgical patients with do-not-resuscitate orders: analysis of 8256 patients. Arch Surg. 2011;146(8):922-928. https://doi.org/10.1001/archsurg.2011.69.
25. Brañas F, Ruiz-Pinto A, Fernández E, et al. Beyond orthogeriatric co-management model: benefits of implementing a process management system for hip fracture. Arch Osteoporos. 2018;13(1):81. https://doi.org/10.1007/s11657-018-0497-6.
© 2019 Society of Hospital Medicine
Overcoming barriers to clinical trial enrollment in patients with bone and soft tissue sarcoma: a paradigm for an increasingly heterogeneous cancer population
Introduction
The development of new cancer therapies relies on the successful development and completion of clinical trials. While clinical trials have led to significant improvements in cancer treatment, the success is dependent upon patient enrollment and participation. Unfortunately, fewer than 5% of adult patients enroll in trials.1-3 This represents a significant barrier to the development and approval of new cancer treatments. Reasons for low accrual into trials are multifactorial, but include structural barriers (eg, clinic access), clinical barriers (eg, eligibility criteria), and physician and patient attitudes towards trial enrollment.4,5 One study at the University of California Davis Cancer Center reported 49% of patients declined participation despite meeting eligibility criteria,3,6 suggesting that psychosocial barriers such as knowledge of trials and attitudes towards clinical research are a major impediment to accrual.7-9
Bone and soft tissue sarcoma represent a heterogeneous group of tumors of mesenchymal origin that are an important cause of morbidity and mortality. Local disease is often treated with a multidisciplinary approach including surgery, radiation, and systemic therapy. Metastatic disease is predominantly treated palliatively with systemic therapy.10 Given its rarity and heterogeneity, trial accrual is of particular importance in sarcoma and often requires multiple sites to enroll adequate numbers of patients. While sarcoma represents <1% of adult malignancies overall, it constitutes ~15% of malignancies in the adolescent and young adult (AYA) population (15- 39 years old).11,12 Sarcoma represents a patient population in which low trial accrual has been correlated with lack of progress in cancer-related outcomes in both the adult and AYA populations.13 The reasons for low accrual rates among patients with sarcoma are poorly understood.
Sarcomas represent a molecularly and biologically heterogeneous group of malignancies with over 100 different subtypes.12 As a result, there has been significant interest in performing molecular profiling, or genetic sequencing, to identify “targetable” mutations. Targetable mutations refer to a specific genetic change identified within the tumor molecular profile for which there is a specific drug that may demonstrate activity against a particular tumor. Given the widespread utilization of this technology in sarcoma, identifying and understanding patient perceptions with regard to molecular profiling is critically important in this disease.14
In this study, we use a cross-sectional design to describe patient perceptions of trial enrollment among patients with bone and soft tissue sarcoma through validated measures, including attitudes towards clinical trials, knowledge of clinical trials, and perceived ability (ie, self-efficacy) to carry out actions involved in making an informed decision about clinical trial participation, receptivity to learning more about clinical trials, and willingness to participate in clinical trials.6 In addition, we describe this patient cohort’s perceptions of molecular profiling, as current and future trials are increasingly driven by molecular or other biomarkers.
Methods
This was a cross-sectional electronic survey study of patients with bone and soft tissue sarcoma treated at Northwestern Medicine (NM) over a 5-year period. NM Enterprise Data Warehouse (NMEDW) is a single, comprehensive, and integrated repository of all clinical and research data sources within NM. The study was approved by the Northwestern University Institutional Review Board.
Survey
The investigators designed a self-administered, online survey, which was built using Research Electronic Data Capture (REDCap). The survey consisted of three sections that were answered using skip logic—a custom path through the survey that varied based on patients’ answers: (1) Patient demographic information and trial perceptions (answered by all patients); (2) Thoughts about molecular profiling (answered by patients who answered “yes” to the question, “Have you heard about molecular profiling of tumors?”); and (3) Considerations to undergo molecular profiling (answered by patients who answered “yes” to the question, “Have you undergone profiling of your cancer?”).
Clinical trial perceptions included questions assessing (1) patient knowledge about trials; (2) patient attitudes toward trials; (3) perceived ability (ie, self-efficacy) to carry out actions involved in making an informed decision about trial participation; (4) receptivity to learning more about trials; and (5) willingness to participate in trials. These outcome measures had been previously developed and pilot tested for reliability and validity (TABLE 1).6
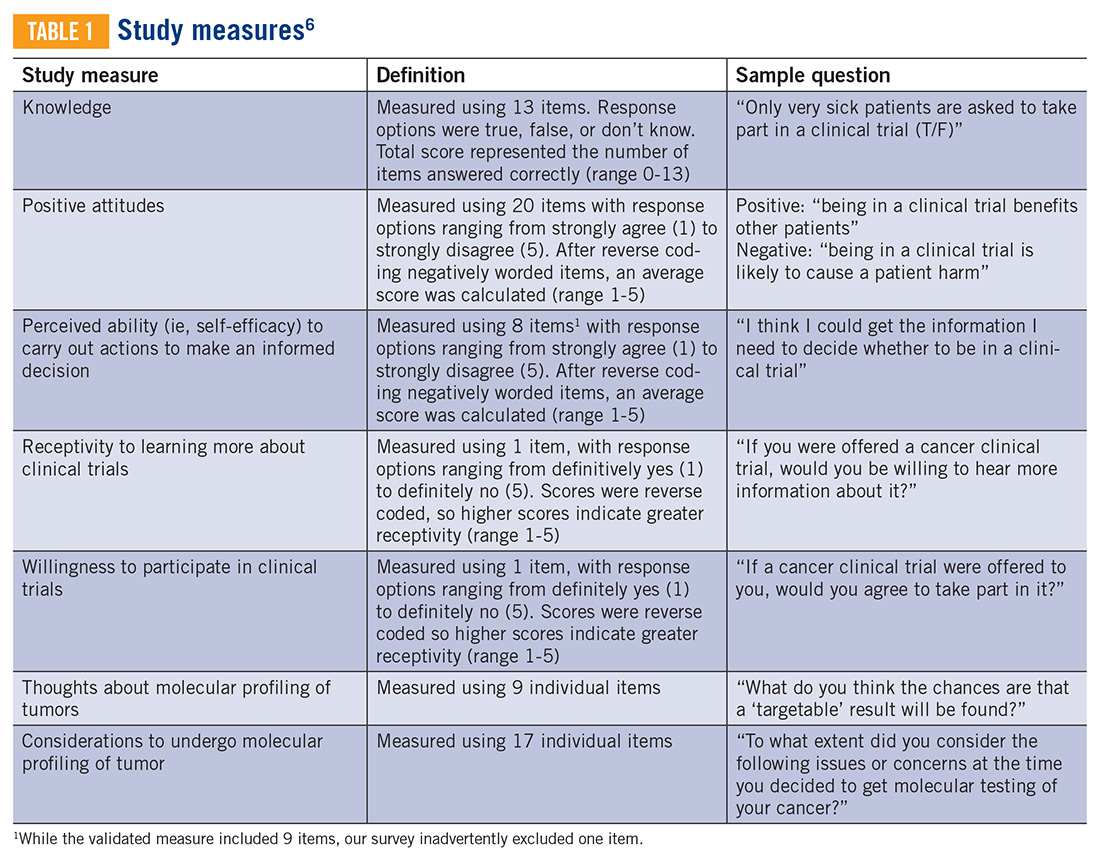
Thoughts about molecular profiling of tumors were assessed using nine items (TABLE 1). Of these, items assessing potential benefit or harm of molecular profiling were assessed using a 7-step Likert scale. Items assessing maximal benefit or harm of therapy, importance of quality vs length of life, and concern about the cost of molecular testing were assessed using a 5-step Likert scale. The study team developed and piloted these questions because there is no validated survey assessing these domains.
Considerations to undergo molecular profiling were assessed using 17 items. Items were in response to the question, “To what extent did you consider the following issues or concerns at the time you decided to get molecular testing of your cancer?” Responses were assessed using a 5-point Likert scale.
Data Collection
Patients 18 years and older evaluated at NM between November 20, 2012, and November 20, 2017, with a diagnosis of sarcoma were identified by query of the NMEDW by ICD-10 codes (C40, C41.9, C44.99, C45-49, C55, C71.9, D48, D49.9, and M12.20) or equivalent ICD-9 codes. Patients were subsequently excluded if they did not have a diagnosis of bone or soft tissue sarcoma, no e-mail address listed, had died, or had not been evaluated at an NM clinic in the previous 5 years. Patients with a diagnosis of gastrointestinal stromal tumor and Kaposi’s sarcoma were also excluded.
A personalized contact e-mail was sent to patients containing an explanation of the survey and an internet link to the electronic survey through REDCap from January 2018 to March 2018. If patients did not respond to the survey, two follow-up reminder e-mails were sent 2 and 4 days following the initial survey. The link was protected so that each patient could complete the survey only once. Responses were collected through the REDCap platform. Patients read and signed an electronic consent form prior to completing the survey.
Upon completion of the survey, patients were offered a $50 VISA gift card as compensation, with an option to donate their compensation to the Robert H. Lurie Comprehensive Cancer Center Sarcoma Research Fund.
Over the described survey period, open clinical trials for patients with bone and soft tissue sarcoma available at NM were evaluated. The number of patients screened and accrued to each trial were recorded.
Statistical analysis
Responses were separated from the personal data for complete anonymization. Descriptive statistical analysis was performed for demographics and disease variables and were summarized using frequencies and percentages. Median and range were used for age. Correlations between continuous variables were analyzed using Spearman correlations. Scores were compared between subgroups using the Mann-Whitney test. Descriptive statistics for knowledge, attitude, and ability scores include means and 95% confidence intervals. Correlations were interpreted as small (r=0.10), medium (r=0.30), or large (r=0.50).15 Statistical significance was indicated when P<0.05.
Results
Patients
Seven hundred fifty patients were eligible to participate in the survey and received the initial and two follow-up e-mails. Twenty e-mailed surveys bounced back. Three hundred nine patients opened the initial e-mail and 283 patients (37.7% of total and 91.6% of opened) completed at least a portion of the survey, with 182 patients completing the entire survey (FIGURE 1). Data for analysis were used from patients who completed at least a portion of the survey.
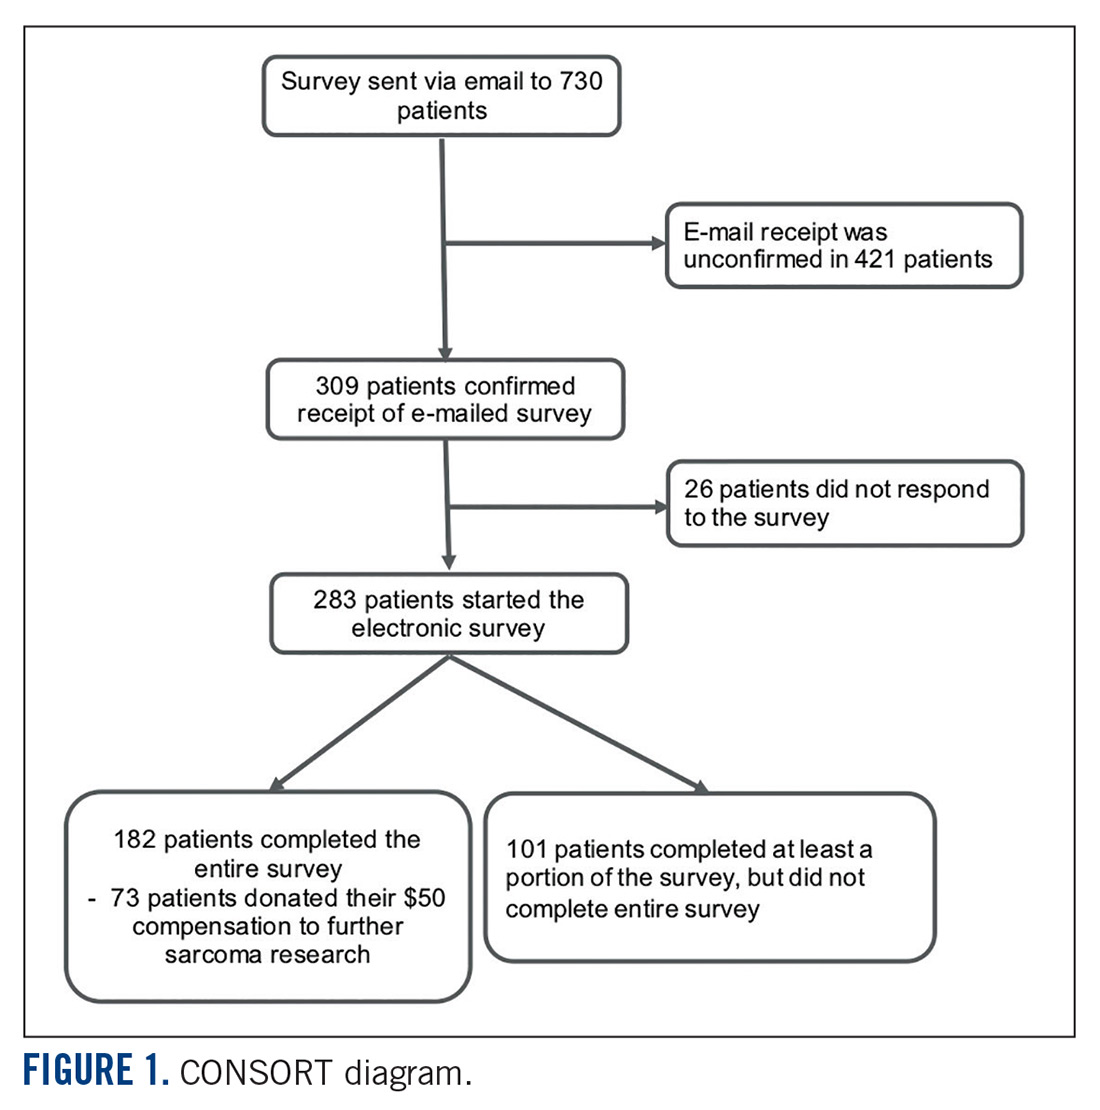
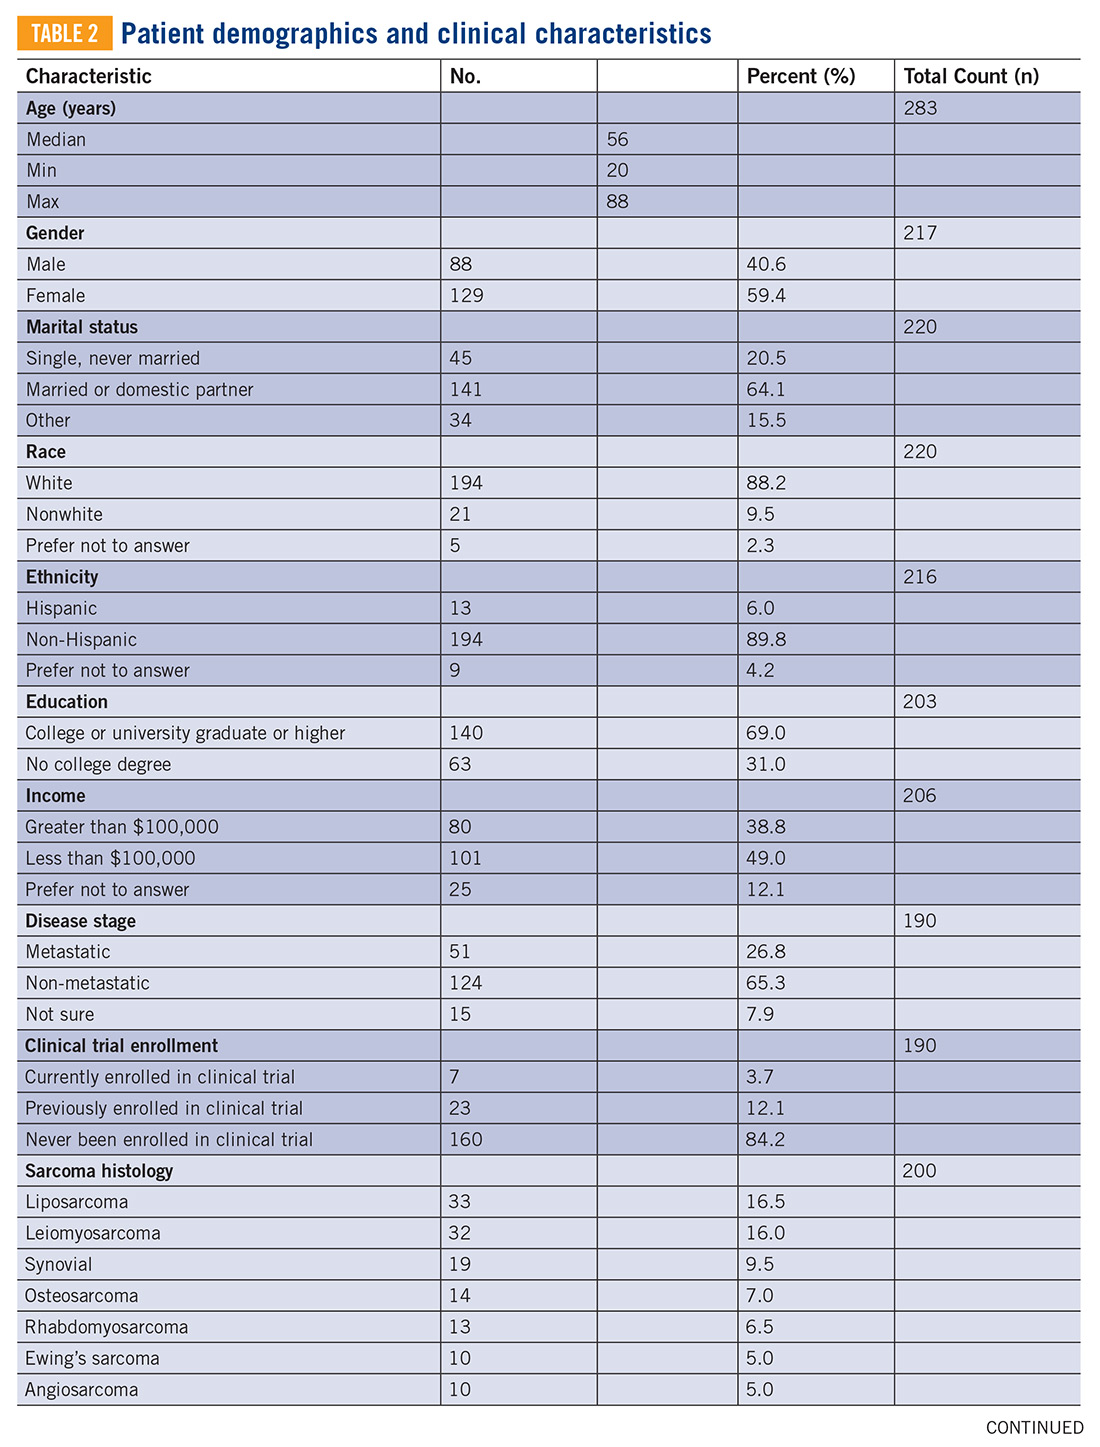
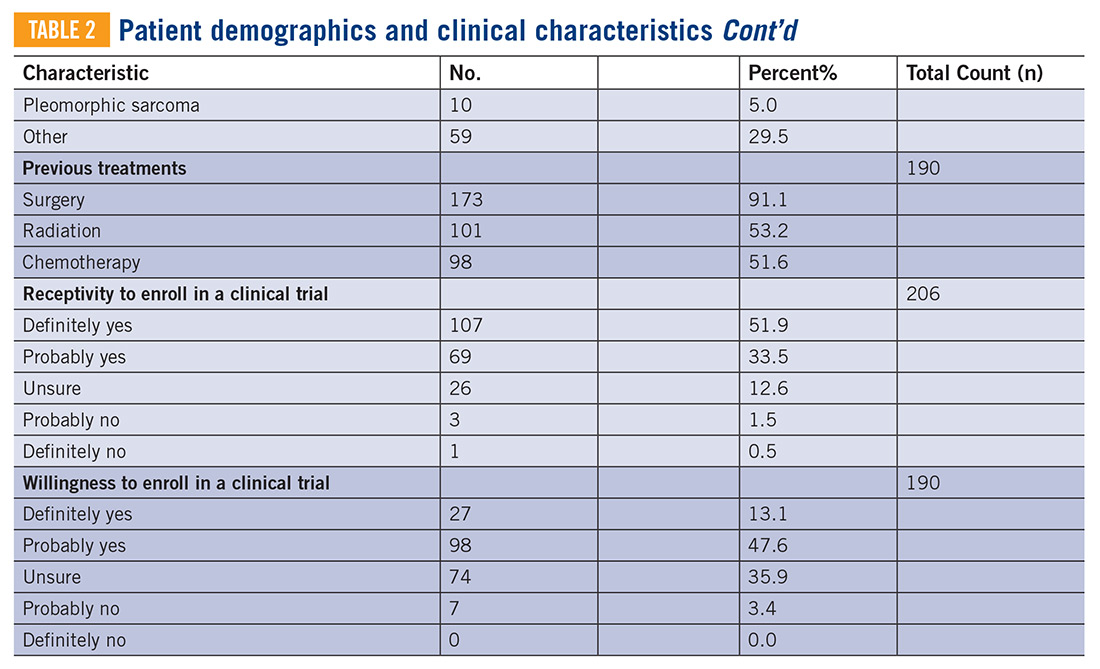
Baseline characteristics of patients who responded can be seen in TABLE 2. Patients had a median age of 56, the majority were female (59.4%), white (88.2%), and most had college or university graduate degrees or higher educational level (69.0%). Patients had various different histological subtypes, with the most common being liposarcoma (16.5%) and leiomyosarcoma (16.0%). Slightly more than a quarter (26.8%) of patients had metastatic disease, and 84.2% had never been enrolled in a clinical trial. Previous treatments included surgery (91.1%), radiation (53.2%), and chemotherapy (51.6%). Prior to completing the survey, 85.4% reported being receptive to a cancer clinical trial, while 60.7% of patients reported willingness to participate in a clinical trial.
Knowledge, attitudes, and perceived ability
A statistically significant correlation was observed between greater knowledge of trials and more positive attitudes towards trials (P<0.001; r=0.5, FIGURE 2A). In relating patient attitudes with perceived ability, again a significant correlation was seen (P<0.001; r=0.4, FIGURE 2B). In contrast, knowledge had a weak correlation with perceived ability (P=0.024; r=0.2, FIGURE 2C). There was no difference regarding patient knowledge, attitudes, or perceived ability by age, gender, race, or income.
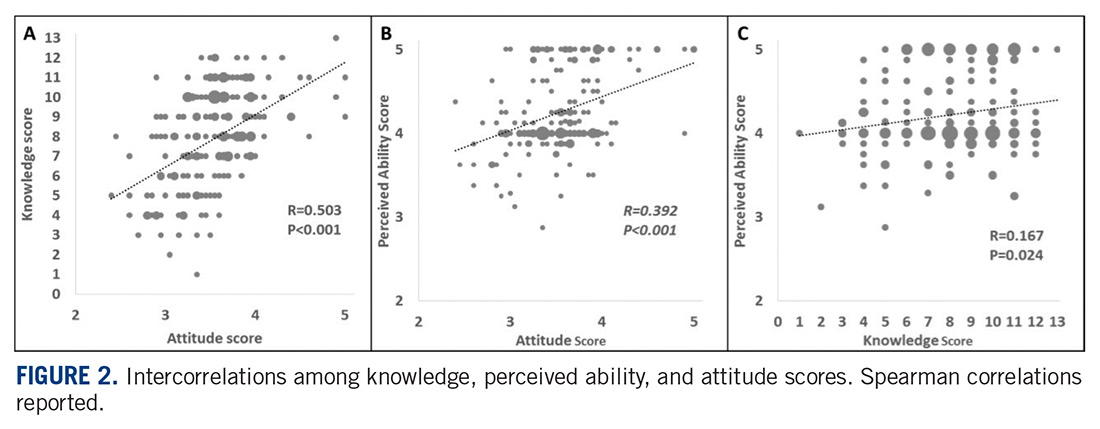
Knowledge, attitudes, perceived ability, and clinical trial enrollment
Thirty patients reported clinical trial experience (either previously or currently enrolled in trials) and 160 patients were never enrolled. Of the 30 patients with trial experience, 7 reported being currently enrolled, while 23 reported previous enrollment. Of these patients, 16 had metastatic disease, while 12 had non-metastatic disease, and 2 were unsure whether or not they had metastatic disease.
Patients with previous clinical trial exposure (currently or previously enrolled in clinical trials) demonstrated significantly greater trial knowledge, with a mean knowledge score of 9.3 (CI 8.5-10.0) compared with 7.7 (CI 7.3-8.1) among patients without trial exposure (P=0.002; FIGURE 3A). Similarly, patients with trial experience also had statistically significant more positive attitudes towards trials as compared with patients with no trial experience, with a mean attitude score of 3.8 (CI 3.6-4.0) and 3.5 (CI 3.4-3.6), respectively (P=0.001; FIGURE 3B). While numerically patients with trial experience have greater perceived ability compared with patients with no trial experience, with a mean score of 4.4 (CI 4.2-4.6) and 4.2 (CI 4.1-4.3), respectively, this difference did not reach statistical significance (FIGURE 3C).
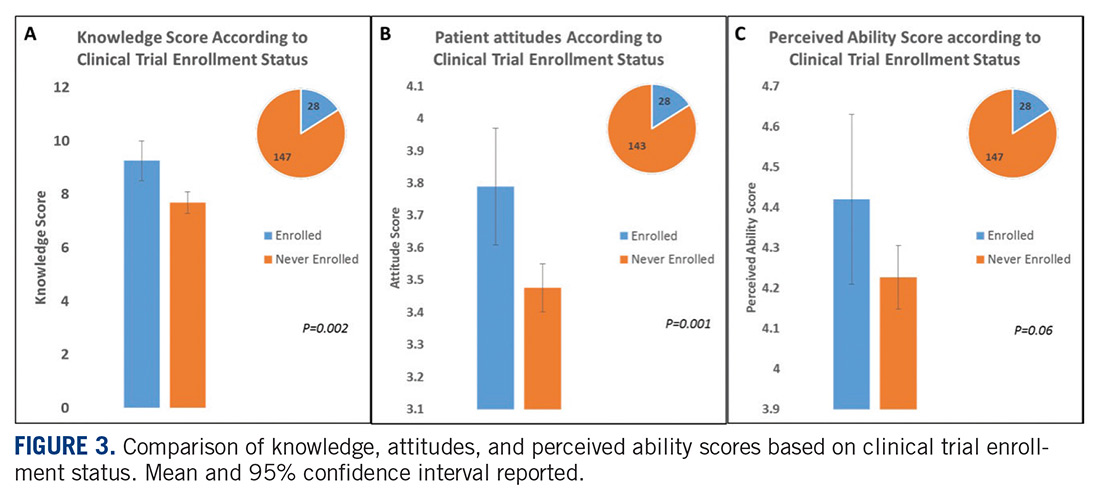
Knowledge, attitudes, perceived ability, and disease stage
An analysis was performed comparing patients with metastatic vs non-metastatic disease. It was observed that patients with metastatic disease had similar knowledge of trials compared with non-metastatic patients, with a mean knowledge score of 8.4 (CI 7.7- 9.1) and 7.9 (CI 7.5-8.4), respectively, (P=0.3; FIGURE 4A). In contrast, patients with metastatic disease had more positive attitudes compared with non-metastatic patients, with a mean score of 3.7 (CI 3.5-3.8) and 3.5 (CI 3.4-3.6), respectively, which was statistically significant (P=0.03; FIGURE 4B). There was no difference in perceived ability in metastatic vs non-metastatic patients (FIGURE 4C).
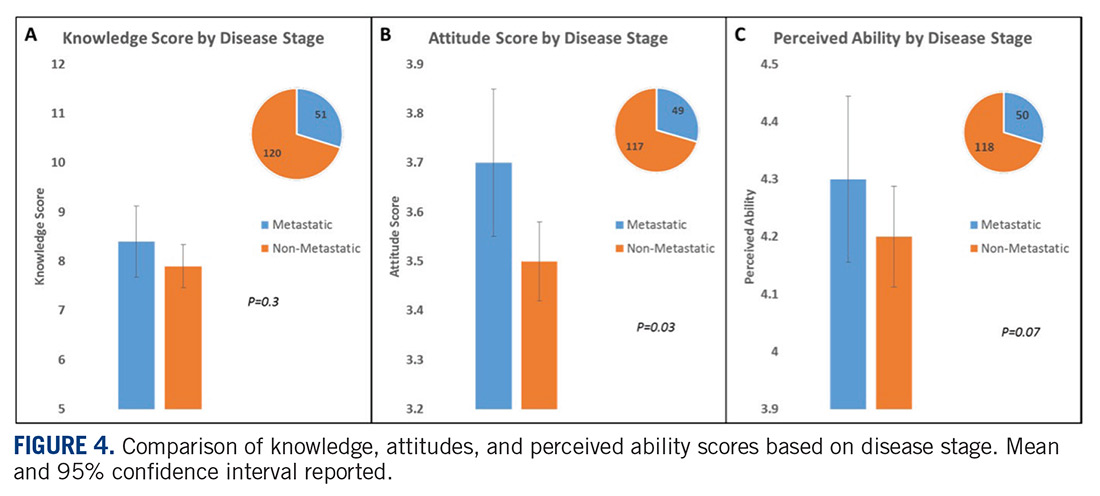
Thoughts about molecular profiling
Of the total number of patients, 46 patients had heard of molecular profiling and were presented with questions regarding their thoughts (TABLE 3). Approximately two-thirds (65.2%) thought there would be a 50% or greater likelihood of finding a targetable result in their tumor molecular profile. A majority (71.7%) of patients thought that a new experimental therapy chosen based on a patient’s tumor molecular profile would have at least a 50% chance of controlling the cancer. Somewhat less than a third (30.4%) of patients thought that total cure is the maximal benefit a patient could experience as a result of a treatment on a clinical trial using a drug chosen based on molecular tests. About half (52.2%) of patients agreed with the statement, “I am concerned about the cost of the test to molecularly profile my cancer.”
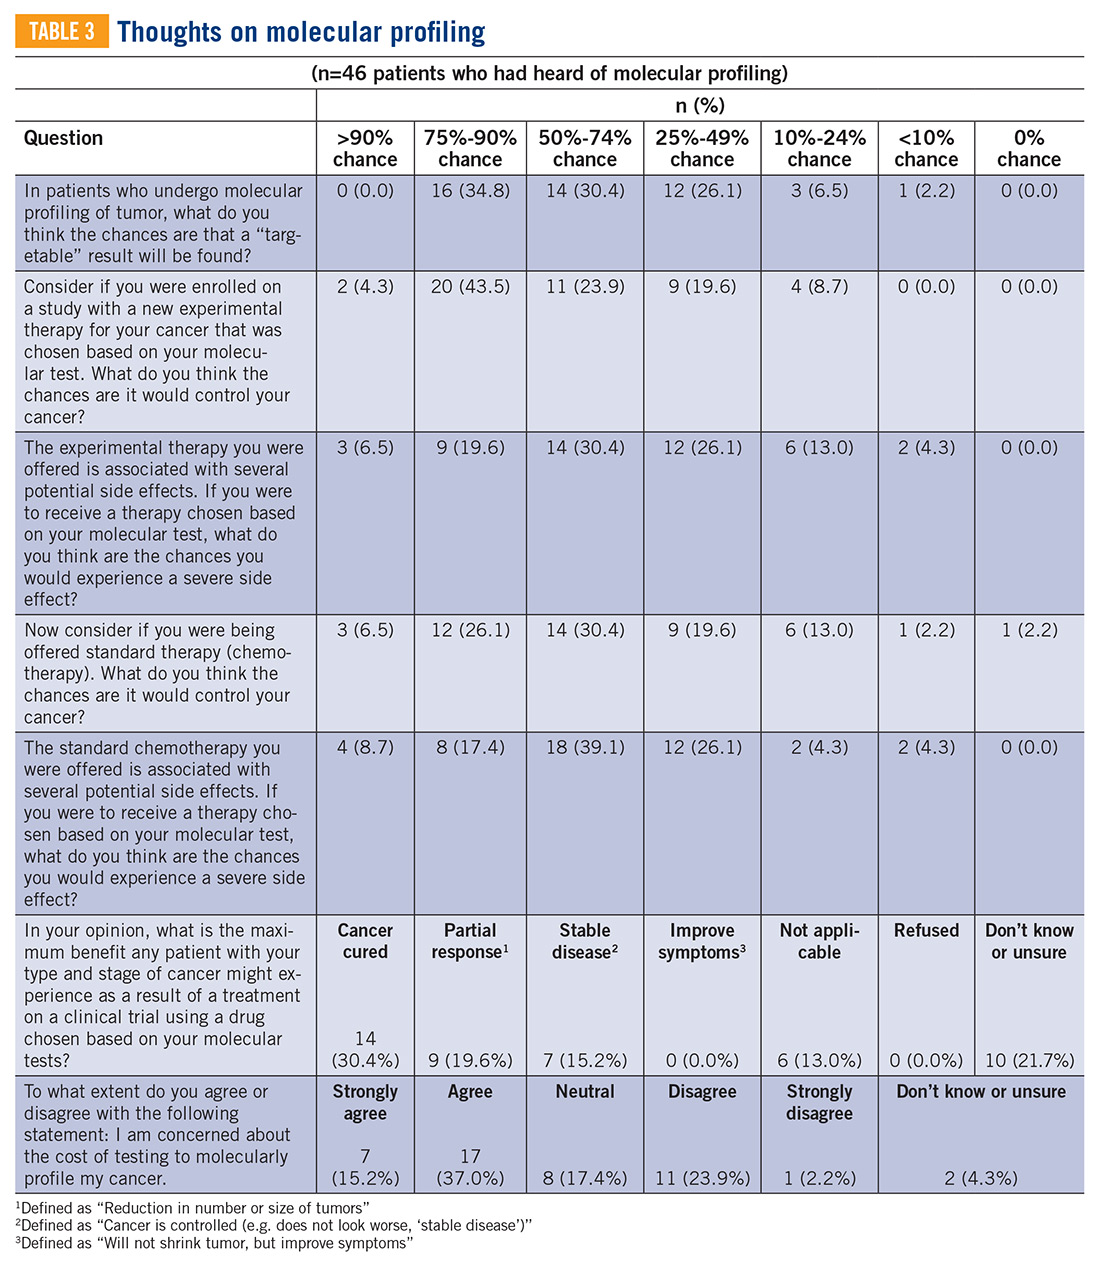
Considerations to undergo molecular profiling
Eighteen patients had undergone molecular profiling of their tumor. These patients were posed the question, “To what extent did you consider the following issues or concerns at the time you decided to get molecular testing of your cancer?” (TABLE 4). A majority (83.3%) of patients stated that wanting to live as long as possible was important, and 72.2% of patients stated that quality of life was important. A majority (83.3%) of patients stated that hope for a cure was an extremely or quite a bit important consideration. Helping future cancer patients was extremely or quite a bit important for 77.8% of patients, while wanting to be a part of research was not at all or of little importance in 50.0% of patients.
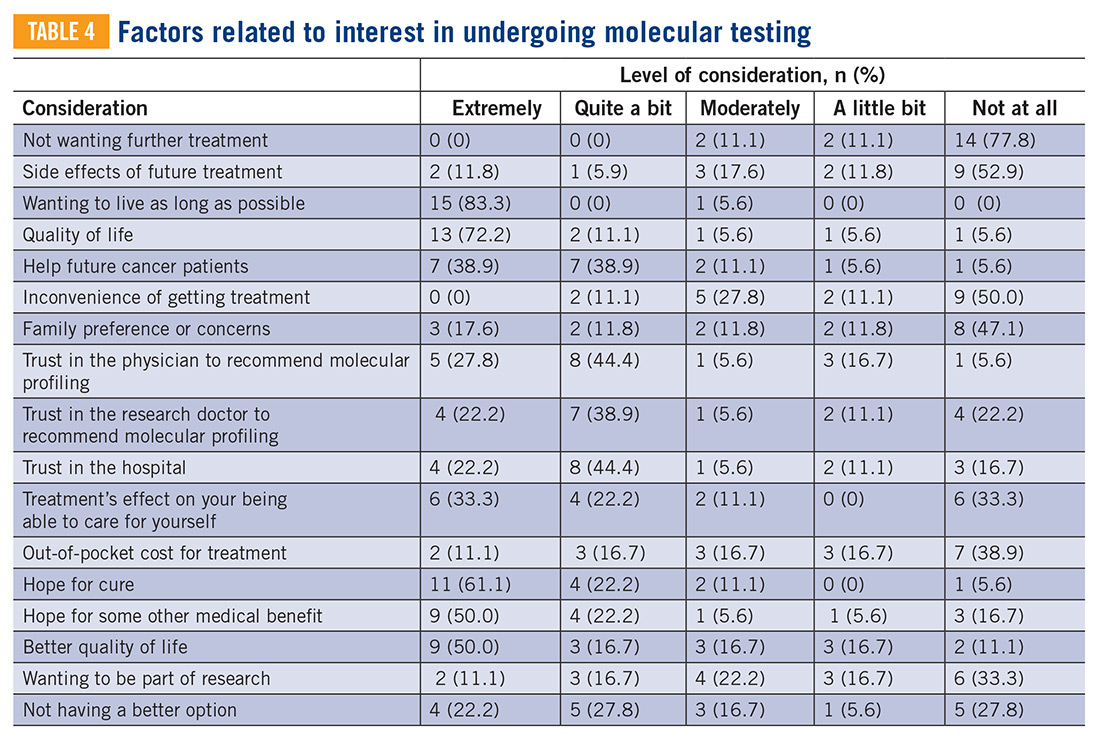
Clinical trials at NM
Twenty-four clinical trials were available at NM between the years 2012 and 2017 for patients with bone and soft tissue sarcoma. Of these trials, 3 of 24 were for non-metastatic patients, while the remaining 21 were open only to metastatic patients. The median number of patients screened per trial was 11 (range 0-66) and the median number of patients accrued per trial was 9 (range 0-58). Of the 24 trials, 17 were not subtype specific (13 included soft tissue sarcoma alone while 4 included both bone and soft tissue sarcoma). The remaining 7 trials were sarcoma subtype specific (eg, angiosarcoma, liposarcoma, etc). Trials available at NM during this period are included in TABLE 5. There were 318 patients screened and 262 patients accrued to sarcoma trials over this time period, with a screen failure rate of 17.6% overall.
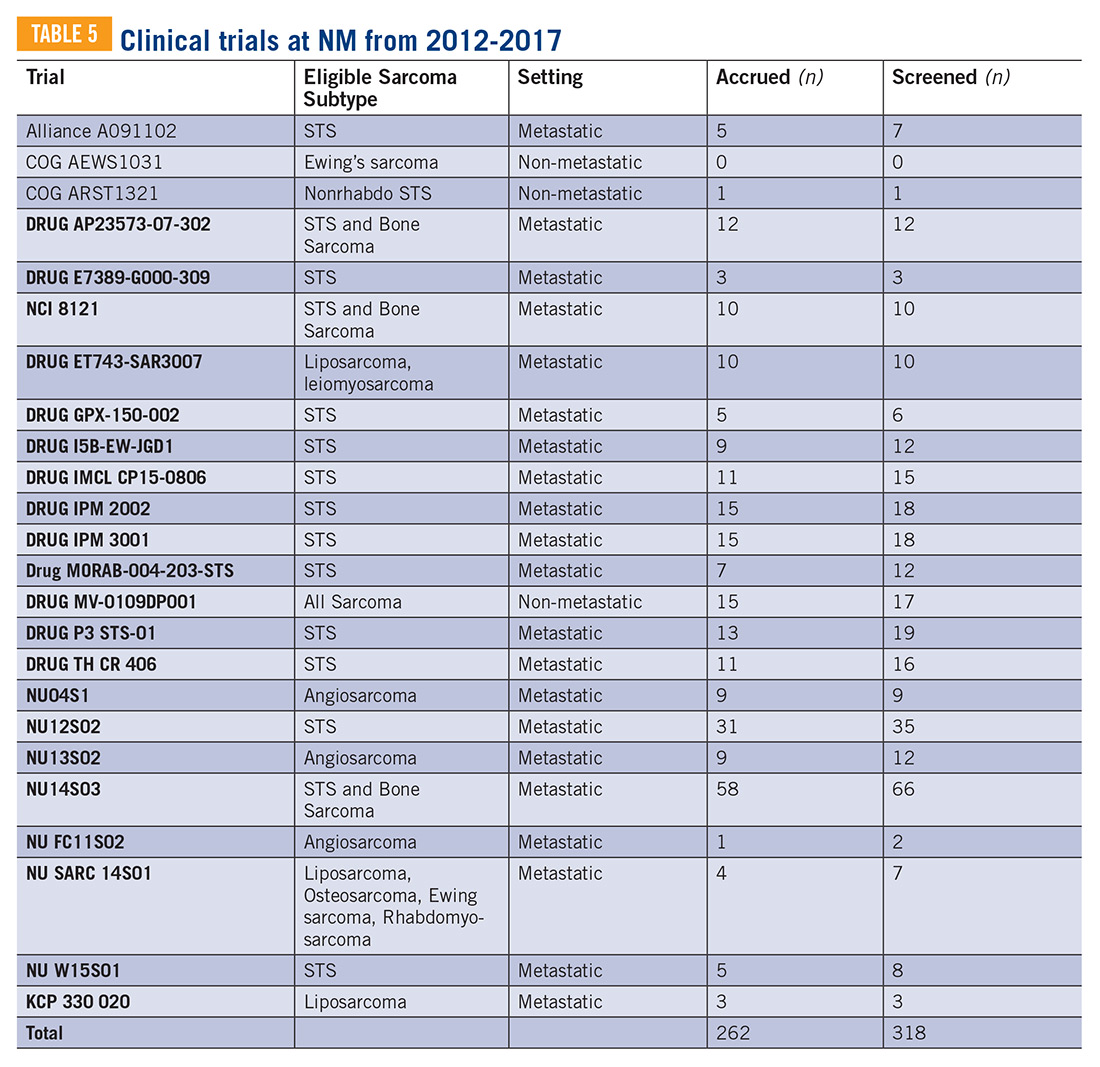
Discussion
Our study sought to describe perceptions of clinical trial enrollment among patients with bone and soft tissue sarcoma in order to elucidate and overcome barriers to enrollment, which to the best of our knowledge had not been previously described. Using previously validated patient- reported outcomes in the literature,6 our data reveal a correlation between knowledge of trials and more positive attitudes towards trials. This underscores the importance of awareness and educational strategies in this cancer population as a whole. Interventions should focus on patient perceptions that contribute to lack of participation, such as fear of side effects, loss of control (eg, idea of placebo or randomization), logistical challenges (eg, additional time or convenient location), and cost.3,5,7,16,17 For example, patients concerned about randomization should be educated on equipoise and other ethical considerations in trial design.5 Previous research has suggested that a multimedia psychoeducational intervention was effective in improving attitudes toward trials.6 Educating patients on the essential role of trials in oncology care, as demonstrated by the vast number of new drug approvals in recent years, is an essential strategy to improve attitudes, and subsequently leads to higher patient accrual rates.
In our study, both knowledge and at titudes were increased in patients with previous trial exposure. This suggests that either patients with greater knowledge and more positive attitudes are more likely to enroll in trials, or that patients with direct trial exposure are more knowledgeable and develop more positive attitudes. Our patient population was overall receptive to learning more about clinical trials (85.4%) and willing to participate (65.8%). At the same time, our study demonstrated low to medium correlations between attitudes and perceived ability to take steps towards making an informed decision to enroll in a trial (r=0.4), which may partially be explained by the absence of a tangible trial opportunity. While we did not assess specifically whether patients in our study were offered a trial, there was a substantial trial menu at NM with limited screen failures and decent trial accrual over the time frame of our study. This underscores the importance not only of patient-focused strategies to increase educational and attitudinal resources, but also a need to focus on research-site optimization that includes opening of multiple trials in various settings, systematic pre-screening of patients, and eligibility criteria that are inclusive and rational.5
The patient population with metastatic disease demonstrated more positive attitudes towards enrolling in clinical trials. This cohort accrued well to clinical trials, with 21 of 24 trials enrolling specifically patients with metastatic disease. Of the patients who responded to our survey, patients with previous trial exposure were enriched for patients with metastatic disease (53.3% metastatic among previous trial exposure versus 26.8% metastatic overall). These observations are likely reflective of the need for novel therapies in this disease setting. At the same time, approximately 25% of patients with localized soft tissue sarcoma will develop distant metastatic disease after successful treatment of their primary tumor, which increases to 40% to 50% in larger and higher-grade tumors.18 Three of 24 trials were open for patients with non-metastatic disease, of which one managed to accrue patients. Patients with non-metastatic disease had more negative attitudes towards trial enrollment. These disproportionate findings suggest a need for interventions to increase patient awareness and attitudes towards trial enrollment among this patient population and the importance of research-site optimization for trial opportunities across disease states.
Molecular profiling of tumors and biomarker identification has become a critical component of further characterizing cancer subtypes. In our study, a majority (65.2%) thought there would be a 50% or greater likelihood of finding a targetable result in their molecular profile. Molecular data on 5,749 bone and soft tissue sarcomas suggested that 9.5% of tumors demonstrate a “targetable result,” defined as a new molecular finding for which there is an FDA-approved drug for malignancies other than sarcoma (eg, BRAF V600E, Her2, etc.),19 suggesting an overestimation in our patient cohort of the likelihood of benefit of molecular profiling. These results highlight that the growing use of molecular profiling has increased the need for educational and supportive resources to help patients understand the utility of molecular profiling and aid in shared decision-making surrounding the results.
At the same time, the importance of identifying a targetable mutation in patients with sarcoma cannot be understated. As a recent example of this paradigm, tumors that harbor fusions with the neurotrophic receptor tyrosine kinase 1, 2, or 3 (NTRK1, 2, and 3) have a high response rate (~75%) to drugs that target these fusions, such as larotrectinib and entrectinib.13 Molecular profiling and identification of predictive biomarkers in small patient subsets has led to great challenges in trial design and research-site optimization. Novel designs that incorporate molecular profiling,20 such as the Lung- MAP trial21 and NCI’s Molecular Analysis for Therapy Choice (MATCH) trial,22 are emerging to identify new therapies for small patient subsets. As a rare and increasingly heterogeneous cancer, sarcoma represents a paradigm to provide insight into optimizing patient perceptions and research enterprises to maximize clinical trial enrollment.
Some limitations of our study include a homogeneous and selected patient population that was predominantly Caucasian and highly educated. Therefore, these findings should not be extrapolated to other populations with barriers to trial accrual, such as lower socioeconomic or minority populations. The low response rate and failure of some to complete the survey may have introduced some bias. Additionally, our data include self-reported outcomes, which could have affected our results. Finally, the limited number of patients who had undergone or heard of molecular profiling limited our ability to draw definitive conclusions, and should be assessed in larger patient cohorts.
While our paper addresses a unique population—the sarcoma patient—similar themes and issues pertain to all oncology patients. A recent review was published in the American Society of Clinical Oncology Educational Book23 looking at methods to overcome barriers to clinical trial enrollment. Their paper clearly illustrates mechanisms to assist with overcoming financial burdens associated with cancer clinical trials, overcoming barriers as they relate to patient and clinician difficulty in coping with the uncertainty inherent in clinical trial participation, and highlight the role of a patient navigator in clinical trial participation.
Conclusions
Interventions aimed at increasing awareness, knowledge, and attitudes towards clinical trials among sarcoma patients may lead to increased trial enrollment and greater progress in cancer treatment in this population. In addition to patient- focused interventions, thoughtful and strategic clinical trial designs that allow for the development of biomarker- driven therapeutics, while at the same time optimizing patient accrual rates, should be developed. Evaluation of barriers to clinical trial enrollment and molecular profiling of tumors among bone and soft tissue sarcoma patients at an academic center can serve as a paradigm to overcome barriers to enrollment in the era of an increasingly heterogeneous cancer population. TSJ
1. Go RS, Frisby KA, Lee JA, et al. Clinical trial accrual among new cancer patients at a community-based cancer center. Cancer. 2006;106(2):426-433.
2. Murthy VH, Krumholz HM, Gross CP. Participation in cancer clinical trials: Race-, sex-, and age-based disparities. JAMA. 2004; 291(22):2720-2726.
3. Lara PN Jr, Higdon R, Lim N, et al. Prospective evaluation of cancer clinical trial accrual patterns: identifying potential barriers to enrollment. J Clin Oncol. 2001;19(6):1728-1733.
4. Unger JM, Cook E, Tai E, Bleyer A. The role of clinical trial participation in cancer research: barriers, evidence, and strategies. Am Soc Clin Oncol Educ Book. 2016;35:185-198.
5. Cancer Action Network American Cancer Society. Barriers to patient enrollment in therapeutic clinical trials for cancer. 2018: https:// www.fightcancer.org/policy-resources/clinical- trial-barriers#figures. Accessed March 14, 2019.
6. Jacobsen PB, Wells KJ, Meade CD, et al. Effects of a brief multimedia psychoeducational intervention on the attitudes and interest of patients with cancer regarding clinical trial participation: a multicenter randomized controlled trial. J Clin Oncol. 2012;30(20):2516-2521.
7. Meropol NJ, Buzaglo JS, Millard J, et al. Barriers to clinical trial participation as perceived by oncologists and patients. J Natl Compr Canc Netw. 2007;5(8):655-664.
8. Cox K, McGarry J. Why patients don’t take part in cancer clinical trials: an overview of the literature. Eur J Cancer Care (Engl). 2003;12(2): 114-122.
9. Mills EJ, Seely D, Rachlis B, et al. Barriers to participation in clinical trials of cancer: a meta- analysis and systematic review of patient-reported factors. Lancet Oncol. 2006;7(2):141-148.
10. National Comprehensive Cancer Network. Soft Tissue Sarcoma (Version 4.2019). https:// www.nccn.org/professionals/physician_gls/ pdf/sarcoma.pdf. Accessed October 30, 2019.
11. Nass SJ, Beaupin LK, Demark-Wahnefried W, et al. Identifying and addressing the needs of adolescents and young adults with cancer: summary of an Institute of Medicine workshop. Oncologist. 2015;20(2):186-195.
12. Wilky BA, Villalobos VM. Emerging role for precision therapy through next-generation sequencing for sarcomas. JCO Precision Oncol. 2018(2):1-4.
13. Bleyer A, Montello M, Budd T, Saxman S. National survival trends of young adults with sarcoma: lack of progress is associated with lack of clinical trial participation. Cancer. 2005;103(9):1891-1897.
14. Gornick MC, Cobain E, Le LQ, et al. Oncologists’ use of genomic sequencing data to inform clinical management. JCO Precision Oncol. 2018(2):1-13.
15. Cohen J. Statistical Power Analysis for the Behavioral Sciences. 2nd ed. Hillsdale, NJ: L. Erlbaum Associates; 1988.
16. Unger JM, Hershman DL, Albain KS, et al. Patient income level and cancer clinical trial participation. J Clin Oncol. 2013;31(5):536- 542.
17. Javid SH, Unger JM, Gralow JR, et al. A prospective analysis of the influence of older age on physician and patient decision-making when considering enrollment in breast cancer clinical trials (SWOG S0316). Oncologist. 2012;17(9):1180-1190.
18. Singhi EK, Moore DC, Muslimani A. Metastatic soft tissue sarcomas: a review of treatment and new pharmacotherapies. P T. 2018;43(7): 410-429.
19. Gounder MM, Ali SM, Robinson V, et al. Impact of next-generation sequencing (NGS) on diagnostic and therapeutic options in soft-tissue and bone sarcoma. J Clin Oncol. 2017;35(15_suppl):abstr 11001.
20. Woodcock J, LaVange LM. Master protocols to study multiple therapies, multiple diseases, or both. N Engl J Med. 2017;377(1):62-70.
21. Steuer CE, Papadimitrakopoulou V, Herbst RS, et al. Innovative clinical trials: the LUNGMAP study. Clin Pharmacol Ther. 2015;97(5): 488-491.
22. McNeil C. NCI-MATCH launch highlights new trial design in precision-medicine era. J Natl Cancer Inst. 2015;107(7).
23. Nipp RD, Hong K, Paskett ED. Overcoming barriers to clinical trial enrollment. Am Soc Clin Oncol Educ Book. 2019;39:105-114.
Introduction
The development of new cancer therapies relies on the successful development and completion of clinical trials. While clinical trials have led to significant improvements in cancer treatment, the success is dependent upon patient enrollment and participation. Unfortunately, fewer than 5% of adult patients enroll in trials.1-3 This represents a significant barrier to the development and approval of new cancer treatments. Reasons for low accrual into trials are multifactorial, but include structural barriers (eg, clinic access), clinical barriers (eg, eligibility criteria), and physician and patient attitudes towards trial enrollment.4,5 One study at the University of California Davis Cancer Center reported 49% of patients declined participation despite meeting eligibility criteria,3,6 suggesting that psychosocial barriers such as knowledge of trials and attitudes towards clinical research are a major impediment to accrual.7-9
Bone and soft tissue sarcoma represent a heterogeneous group of tumors of mesenchymal origin that are an important cause of morbidity and mortality. Local disease is often treated with a multidisciplinary approach including surgery, radiation, and systemic therapy. Metastatic disease is predominantly treated palliatively with systemic therapy.10 Given its rarity and heterogeneity, trial accrual is of particular importance in sarcoma and often requires multiple sites to enroll adequate numbers of patients. While sarcoma represents <1% of adult malignancies overall, it constitutes ~15% of malignancies in the adolescent and young adult (AYA) population (15- 39 years old).11,12 Sarcoma represents a patient population in which low trial accrual has been correlated with lack of progress in cancer-related outcomes in both the adult and AYA populations.13 The reasons for low accrual rates among patients with sarcoma are poorly understood.
Sarcomas represent a molecularly and biologically heterogeneous group of malignancies with over 100 different subtypes.12 As a result, there has been significant interest in performing molecular profiling, or genetic sequencing, to identify “targetable” mutations. Targetable mutations refer to a specific genetic change identified within the tumor molecular profile for which there is a specific drug that may demonstrate activity against a particular tumor. Given the widespread utilization of this technology in sarcoma, identifying and understanding patient perceptions with regard to molecular profiling is critically important in this disease.14
In this study, we use a cross-sectional design to describe patient perceptions of trial enrollment among patients with bone and soft tissue sarcoma through validated measures, including attitudes towards clinical trials, knowledge of clinical trials, and perceived ability (ie, self-efficacy) to carry out actions involved in making an informed decision about clinical trial participation, receptivity to learning more about clinical trials, and willingness to participate in clinical trials.6 In addition, we describe this patient cohort’s perceptions of molecular profiling, as current and future trials are increasingly driven by molecular or other biomarkers.
Methods
This was a cross-sectional electronic survey study of patients with bone and soft tissue sarcoma treated at Northwestern Medicine (NM) over a 5-year period. NM Enterprise Data Warehouse (NMEDW) is a single, comprehensive, and integrated repository of all clinical and research data sources within NM. The study was approved by the Northwestern University Institutional Review Board.
Survey
The investigators designed a self-administered, online survey, which was built using Research Electronic Data Capture (REDCap). The survey consisted of three sections that were answered using skip logic—a custom path through the survey that varied based on patients’ answers: (1) Patient demographic information and trial perceptions (answered by all patients); (2) Thoughts about molecular profiling (answered by patients who answered “yes” to the question, “Have you heard about molecular profiling of tumors?”); and (3) Considerations to undergo molecular profiling (answered by patients who answered “yes” to the question, “Have you undergone profiling of your cancer?”).
Clinical trial perceptions included questions assessing (1) patient knowledge about trials; (2) patient attitudes toward trials; (3) perceived ability (ie, self-efficacy) to carry out actions involved in making an informed decision about trial participation; (4) receptivity to learning more about trials; and (5) willingness to participate in trials. These outcome measures had been previously developed and pilot tested for reliability and validity (TABLE 1).6
Thoughts about molecular profiling of tumors were assessed using nine items (TABLE 1). Of these, items assessing potential benefit or harm of molecular profiling were assessed using a 7-step Likert scale. Items assessing maximal benefit or harm of therapy, importance of quality vs length of life, and concern about the cost of molecular testing were assessed using a 5-step Likert scale. The study team developed and piloted these questions because there is no validated survey assessing these domains.
Considerations to undergo molecular profiling were assessed using 17 items. Items were in response to the question, “To what extent did you consider the following issues or concerns at the time you decided to get molecular testing of your cancer?” Responses were assessed using a 5-point Likert scale.
Data Collection
Patients 18 years and older evaluated at NM between November 20, 2012, and November 20, 2017, with a diagnosis of sarcoma were identified by query of the NMEDW by ICD-10 codes (C40, C41.9, C44.99, C45-49, C55, C71.9, D48, D49.9, and M12.20) or equivalent ICD-9 codes. Patients were subsequently excluded if they did not have a diagnosis of bone or soft tissue sarcoma, no e-mail address listed, had died, or had not been evaluated at an NM clinic in the previous 5 years. Patients with a diagnosis of gastrointestinal stromal tumor and Kaposi’s sarcoma were also excluded.
A personalized contact e-mail was sent to patients containing an explanation of the survey and an internet link to the electronic survey through REDCap from January 2018 to March 2018. If patients did not respond to the survey, two follow-up reminder e-mails were sent 2 and 4 days following the initial survey. The link was protected so that each patient could complete the survey only once. Responses were collected through the REDCap platform. Patients read and signed an electronic consent form prior to completing the survey.
Upon completion of the survey, patients were offered a $50 VISA gift card as compensation, with an option to donate their compensation to the Robert H. Lurie Comprehensive Cancer Center Sarcoma Research Fund.
Over the described survey period, open clinical trials for patients with bone and soft tissue sarcoma available at NM were evaluated. The number of patients screened and accrued to each trial were recorded.
Statistical analysis
Responses were separated from the personal data for complete anonymization. Descriptive statistical analysis was performed for demographics and disease variables and were summarized using frequencies and percentages. Median and range were used for age. Correlations between continuous variables were analyzed using Spearman correlations. Scores were compared between subgroups using the Mann-Whitney test. Descriptive statistics for knowledge, attitude, and ability scores include means and 95% confidence intervals. Correlations were interpreted as small (r=0.10), medium (r=0.30), or large (r=0.50).15 Statistical significance was indicated when P<0.05.
Results
Patients
Seven hundred fifty patients were eligible to participate in the survey and received the initial and two follow-up e-mails. Twenty e-mailed surveys bounced back. Three hundred nine patients opened the initial e-mail and 283 patients (37.7% of total and 91.6% of opened) completed at least a portion of the survey, with 182 patients completing the entire survey (FIGURE 1). Data for analysis were used from patients who completed at least a portion of the survey.
Baseline characteristics of patients who responded can be seen in TABLE 2. Patients had a median age of 56, the majority were female (59.4%), white (88.2%), and most had college or university graduate degrees or higher educational level (69.0%). Patients had various different histological subtypes, with the most common being liposarcoma (16.5%) and leiomyosarcoma (16.0%). Slightly more than a quarter (26.8%) of patients had metastatic disease, and 84.2% had never been enrolled in a clinical trial. Previous treatments included surgery (91.1%), radiation (53.2%), and chemotherapy (51.6%). Prior to completing the survey, 85.4% reported being receptive to a cancer clinical trial, while 60.7% of patients reported willingness to participate in a clinical trial.
Knowledge, attitudes, and perceived ability
A statistically significant correlation was observed between greater knowledge of trials and more positive attitudes towards trials (P<0.001; r=0.5, FIGURE 2A). In relating patient attitudes with perceived ability, again a significant correlation was seen (P<0.001; r=0.4, FIGURE 2B). In contrast, knowledge had a weak correlation with perceived ability (P=0.024; r=0.2, FIGURE 2C). There was no difference regarding patient knowledge, attitudes, or perceived ability by age, gender, race, or income.
Knowledge, attitudes, perceived ability, and clinical trial enrollment
Thirty patients reported clinical trial experience (either previously or currently enrolled in trials) and 160 patients were never enrolled. Of the 30 patients with trial experience, 7 reported being currently enrolled, while 23 reported previous enrollment. Of these patients, 16 had metastatic disease, while 12 had non-metastatic disease, and 2 were unsure whether or not they had metastatic disease.
Patients with previous clinical trial exposure (currently or previously enrolled in clinical trials) demonstrated significantly greater trial knowledge, with a mean knowledge score of 9.3 (CI 8.5-10.0) compared with 7.7 (CI 7.3-8.1) among patients without trial exposure (P=0.002; FIGURE 3A). Similarly, patients with trial experience also had statistically significant more positive attitudes towards trials as compared with patients with no trial experience, with a mean attitude score of 3.8 (CI 3.6-4.0) and 3.5 (CI 3.4-3.6), respectively (P=0.001; FIGURE 3B). While numerically patients with trial experience have greater perceived ability compared with patients with no trial experience, with a mean score of 4.4 (CI 4.2-4.6) and 4.2 (CI 4.1-4.3), respectively, this difference did not reach statistical significance (FIGURE 3C).
Knowledge, attitudes, perceived ability, and disease stage
An analysis was performed comparing patients with metastatic vs non-metastatic disease. It was observed that patients with metastatic disease had similar knowledge of trials compared with non-metastatic patients, with a mean knowledge score of 8.4 (CI 7.7- 9.1) and 7.9 (CI 7.5-8.4), respectively, (P=0.3; FIGURE 4A). In contrast, patients with metastatic disease had more positive attitudes compared with non-metastatic patients, with a mean score of 3.7 (CI 3.5-3.8) and 3.5 (CI 3.4-3.6), respectively, which was statistically significant (P=0.03; FIGURE 4B). There was no difference in perceived ability in metastatic vs non-metastatic patients (FIGURE 4C).
Thoughts about molecular profiling
Of the total number of patients, 46 patients had heard of molecular profiling and were presented with questions regarding their thoughts (TABLE 3). Approximately two-thirds (65.2%) thought there would be a 50% or greater likelihood of finding a targetable result in their tumor molecular profile. A majority (71.7%) of patients thought that a new experimental therapy chosen based on a patient’s tumor molecular profile would have at least a 50% chance of controlling the cancer. Somewhat less than a third (30.4%) of patients thought that total cure is the maximal benefit a patient could experience as a result of a treatment on a clinical trial using a drug chosen based on molecular tests. About half (52.2%) of patients agreed with the statement, “I am concerned about the cost of the test to molecularly profile my cancer.”
Considerations to undergo molecular profiling
Eighteen patients had undergone molecular profiling of their tumor. These patients were posed the question, “To what extent did you consider the following issues or concerns at the time you decided to get molecular testing of your cancer?” (TABLE 4). A majority (83.3%) of patients stated that wanting to live as long as possible was important, and 72.2% of patients stated that quality of life was important. A majority (83.3%) of patients stated that hope for a cure was an extremely or quite a bit important consideration. Helping future cancer patients was extremely or quite a bit important for 77.8% of patients, while wanting to be a part of research was not at all or of little importance in 50.0% of patients.
Clinical trials at NM
Twenty-four clinical trials were available at NM between the years 2012 and 2017 for patients with bone and soft tissue sarcoma. Of these trials, 3 of 24 were for non-metastatic patients, while the remaining 21 were open only to metastatic patients. The median number of patients screened per trial was 11 (range 0-66) and the median number of patients accrued per trial was 9 (range 0-58). Of the 24 trials, 17 were not subtype specific (13 included soft tissue sarcoma alone while 4 included both bone and soft tissue sarcoma). The remaining 7 trials were sarcoma subtype specific (eg, angiosarcoma, liposarcoma, etc). Trials available at NM during this period are included in TABLE 5. There were 318 patients screened and 262 patients accrued to sarcoma trials over this time period, with a screen failure rate of 17.6% overall.
Discussion
Our study sought to describe perceptions of clinical trial enrollment among patients with bone and soft tissue sarcoma in order to elucidate and overcome barriers to enrollment, which to the best of our knowledge had not been previously described. Using previously validated patient- reported outcomes in the literature,6 our data reveal a correlation between knowledge of trials and more positive attitudes towards trials. This underscores the importance of awareness and educational strategies in this cancer population as a whole. Interventions should focus on patient perceptions that contribute to lack of participation, such as fear of side effects, loss of control (eg, idea of placebo or randomization), logistical challenges (eg, additional time or convenient location), and cost.3,5,7,16,17 For example, patients concerned about randomization should be educated on equipoise and other ethical considerations in trial design.5 Previous research has suggested that a multimedia psychoeducational intervention was effective in improving attitudes toward trials.6 Educating patients on the essential role of trials in oncology care, as demonstrated by the vast number of new drug approvals in recent years, is an essential strategy to improve attitudes, and subsequently leads to higher patient accrual rates.
In our study, both knowledge and at titudes were increased in patients with previous trial exposure. This suggests that either patients with greater knowledge and more positive attitudes are more likely to enroll in trials, or that patients with direct trial exposure are more knowledgeable and develop more positive attitudes. Our patient population was overall receptive to learning more about clinical trials (85.4%) and willing to participate (65.8%). At the same time, our study demonstrated low to medium correlations between attitudes and perceived ability to take steps towards making an informed decision to enroll in a trial (r=0.4), which may partially be explained by the absence of a tangible trial opportunity. While we did not assess specifically whether patients in our study were offered a trial, there was a substantial trial menu at NM with limited screen failures and decent trial accrual over the time frame of our study. This underscores the importance not only of patient-focused strategies to increase educational and attitudinal resources, but also a need to focus on research-site optimization that includes opening of multiple trials in various settings, systematic pre-screening of patients, and eligibility criteria that are inclusive and rational.5
The patient population with metastatic disease demonstrated more positive attitudes towards enrolling in clinical trials. This cohort accrued well to clinical trials, with 21 of 24 trials enrolling specifically patients with metastatic disease. Of the patients who responded to our survey, patients with previous trial exposure were enriched for patients with metastatic disease (53.3% metastatic among previous trial exposure versus 26.8% metastatic overall). These observations are likely reflective of the need for novel therapies in this disease setting. At the same time, approximately 25% of patients with localized soft tissue sarcoma will develop distant metastatic disease after successful treatment of their primary tumor, which increases to 40% to 50% in larger and higher-grade tumors.18 Three of 24 trials were open for patients with non-metastatic disease, of which one managed to accrue patients. Patients with non-metastatic disease had more negative attitudes towards trial enrollment. These disproportionate findings suggest a need for interventions to increase patient awareness and attitudes towards trial enrollment among this patient population and the importance of research-site optimization for trial opportunities across disease states.
Molecular profiling of tumors and biomarker identification has become a critical component of further characterizing cancer subtypes. In our study, a majority (65.2%) thought there would be a 50% or greater likelihood of finding a targetable result in their molecular profile. Molecular data on 5,749 bone and soft tissue sarcomas suggested that 9.5% of tumors demonstrate a “targetable result,” defined as a new molecular finding for which there is an FDA-approved drug for malignancies other than sarcoma (eg, BRAF V600E, Her2, etc.),19 suggesting an overestimation in our patient cohort of the likelihood of benefit of molecular profiling. These results highlight that the growing use of molecular profiling has increased the need for educational and supportive resources to help patients understand the utility of molecular profiling and aid in shared decision-making surrounding the results.
At the same time, the importance of identifying a targetable mutation in patients with sarcoma cannot be understated. As a recent example of this paradigm, tumors that harbor fusions with the neurotrophic receptor tyrosine kinase 1, 2, or 3 (NTRK1, 2, and 3) have a high response rate (~75%) to drugs that target these fusions, such as larotrectinib and entrectinib.13 Molecular profiling and identification of predictive biomarkers in small patient subsets has led to great challenges in trial design and research-site optimization. Novel designs that incorporate molecular profiling,20 such as the Lung- MAP trial21 and NCI’s Molecular Analysis for Therapy Choice (MATCH) trial,22 are emerging to identify new therapies for small patient subsets. As a rare and increasingly heterogeneous cancer, sarcoma represents a paradigm to provide insight into optimizing patient perceptions and research enterprises to maximize clinical trial enrollment.
Some limitations of our study include a homogeneous and selected patient population that was predominantly Caucasian and highly educated. Therefore, these findings should not be extrapolated to other populations with barriers to trial accrual, such as lower socioeconomic or minority populations. The low response rate and failure of some to complete the survey may have introduced some bias. Additionally, our data include self-reported outcomes, which could have affected our results. Finally, the limited number of patients who had undergone or heard of molecular profiling limited our ability to draw definitive conclusions, and should be assessed in larger patient cohorts.
While our paper addresses a unique population—the sarcoma patient—similar themes and issues pertain to all oncology patients. A recent review was published in the American Society of Clinical Oncology Educational Book23 looking at methods to overcome barriers to clinical trial enrollment. Their paper clearly illustrates mechanisms to assist with overcoming financial burdens associated with cancer clinical trials, overcoming barriers as they relate to patient and clinician difficulty in coping with the uncertainty inherent in clinical trial participation, and highlight the role of a patient navigator in clinical trial participation.
Conclusions
Interventions aimed at increasing awareness, knowledge, and attitudes towards clinical trials among sarcoma patients may lead to increased trial enrollment and greater progress in cancer treatment in this population. In addition to patient- focused interventions, thoughtful and strategic clinical trial designs that allow for the development of biomarker- driven therapeutics, while at the same time optimizing patient accrual rates, should be developed. Evaluation of barriers to clinical trial enrollment and molecular profiling of tumors among bone and soft tissue sarcoma patients at an academic center can serve as a paradigm to overcome barriers to enrollment in the era of an increasingly heterogeneous cancer population. TSJ
1. Go RS, Frisby KA, Lee JA, et al. Clinical trial accrual among new cancer patients at a community-based cancer center. Cancer. 2006;106(2):426-433.
2. Murthy VH, Krumholz HM, Gross CP. Participation in cancer clinical trials: Race-, sex-, and age-based disparities. JAMA. 2004; 291(22):2720-2726.
3. Lara PN Jr, Higdon R, Lim N, et al. Prospective evaluation of cancer clinical trial accrual patterns: identifying potential barriers to enrollment. J Clin Oncol. 2001;19(6):1728-1733.
4. Unger JM, Cook E, Tai E, Bleyer A. The role of clinical trial participation in cancer research: barriers, evidence, and strategies. Am Soc Clin Oncol Educ Book. 2016;35:185-198.
5. Cancer Action Network American Cancer Society. Barriers to patient enrollment in therapeutic clinical trials for cancer. 2018: https:// www.fightcancer.org/policy-resources/clinical- trial-barriers#figures. Accessed March 14, 2019.
6. Jacobsen PB, Wells KJ, Meade CD, et al. Effects of a brief multimedia psychoeducational intervention on the attitudes and interest of patients with cancer regarding clinical trial participation: a multicenter randomized controlled trial. J Clin Oncol. 2012;30(20):2516-2521.
7. Meropol NJ, Buzaglo JS, Millard J, et al. Barriers to clinical trial participation as perceived by oncologists and patients. J Natl Compr Canc Netw. 2007;5(8):655-664.
8. Cox K, McGarry J. Why patients don’t take part in cancer clinical trials: an overview of the literature. Eur J Cancer Care (Engl). 2003;12(2): 114-122.
9. Mills EJ, Seely D, Rachlis B, et al. Barriers to participation in clinical trials of cancer: a meta- analysis and systematic review of patient-reported factors. Lancet Oncol. 2006;7(2):141-148.
10. National Comprehensive Cancer Network. Soft Tissue Sarcoma (Version 4.2019). https:// www.nccn.org/professionals/physician_gls/ pdf/sarcoma.pdf. Accessed October 30, 2019.
11. Nass SJ, Beaupin LK, Demark-Wahnefried W, et al. Identifying and addressing the needs of adolescents and young adults with cancer: summary of an Institute of Medicine workshop. Oncologist. 2015;20(2):186-195.
12. Wilky BA, Villalobos VM. Emerging role for precision therapy through next-generation sequencing for sarcomas. JCO Precision Oncol. 2018(2):1-4.
13. Bleyer A, Montello M, Budd T, Saxman S. National survival trends of young adults with sarcoma: lack of progress is associated with lack of clinical trial participation. Cancer. 2005;103(9):1891-1897.
14. Gornick MC, Cobain E, Le LQ, et al. Oncologists’ use of genomic sequencing data to inform clinical management. JCO Precision Oncol. 2018(2):1-13.
15. Cohen J. Statistical Power Analysis for the Behavioral Sciences. 2nd ed. Hillsdale, NJ: L. Erlbaum Associates; 1988.
16. Unger JM, Hershman DL, Albain KS, et al. Patient income level and cancer clinical trial participation. J Clin Oncol. 2013;31(5):536- 542.
17. Javid SH, Unger JM, Gralow JR, et al. A prospective analysis of the influence of older age on physician and patient decision-making when considering enrollment in breast cancer clinical trials (SWOG S0316). Oncologist. 2012;17(9):1180-1190.
18. Singhi EK, Moore DC, Muslimani A. Metastatic soft tissue sarcomas: a review of treatment and new pharmacotherapies. P T. 2018;43(7): 410-429.
19. Gounder MM, Ali SM, Robinson V, et al. Impact of next-generation sequencing (NGS) on diagnostic and therapeutic options in soft-tissue and bone sarcoma. J Clin Oncol. 2017;35(15_suppl):abstr 11001.
20. Woodcock J, LaVange LM. Master protocols to study multiple therapies, multiple diseases, or both. N Engl J Med. 2017;377(1):62-70.
21. Steuer CE, Papadimitrakopoulou V, Herbst RS, et al. Innovative clinical trials: the LUNGMAP study. Clin Pharmacol Ther. 2015;97(5): 488-491.
22. McNeil C. NCI-MATCH launch highlights new trial design in precision-medicine era. J Natl Cancer Inst. 2015;107(7).
23. Nipp RD, Hong K, Paskett ED. Overcoming barriers to clinical trial enrollment. Am Soc Clin Oncol Educ Book. 2019;39:105-114.
Patient-Driven Management Using Same-Day Noninvasive Diagnosis and Complete Laser Treatment of Basal Cell Carcinomas: A Pilot Study
The increasing incidence of nonmelanoma skin cancer (NMSC) is a serious public health concern.1 Lesions often are identified on routine total-body examination, and there is a considerate burden on dermatologists to diagnose these lesions, which is both costly and results in a long wait time to see a specialist. Furthermore, standard care requires patients to attend multiple visits for the diagnosis and treatment of NMSC.
In recent decades, diagnosing basal cell carcinoma (BCC) has been facilitated by the handheld dermatoscope. The advent of dermoscopy has led to increased sensitivity and specificity of the NMSC diagnosis (estimated at 95%–99%) and has helped facilitate earlier diagnosis of BCC and reduce unnecessary biopsy of benign lesions.2-5 Dermoscopy also can be useful in monitoring response to treatment.5 Lesions that are detected early tend to be easier and less expensive to treat, a strong argument for the use of early detection techniques.6-8
More recently, in vivo reflectance confocal microscopy (RCM)(Vivascope 1500 [Caliber I.D.]) has become an acceptable means for confirming a BCC diagnosis, offering an alternative to tissue biopsy. Reflectance confocal microscopy can be reimbursed under Category I Current Procedural Terminology codes 96931 to 96936.9 Reflectance confocal microscopy is a noninvasive diagnostic technique that uses an 830-nm diode laser to enable visualization of a 0.5×0.5-mm patch of skin to a depth of 200 to 300 μm, which corresponds roughly to the papillary dermis. Reflectance confocal microscopy has the advantage of providing real-time diagnosis, enabling same-day treatment of BCC, and providing an efficient alternative to biopsy. Ultimately, these advantages are beneficial and time-saving for patients because biopsies can be painful; create a delay in diagnosis; and require further follow-up visits for treatment, which may be of importance to patients who have trouble attending multiple appointments.
Optical coherence tomography (OCT) is another noninvasive imaging device that is useful in BCC management. It uses an infrared broadband light source to visualize skin architecture to 2-mm deep with a 6×6-mm field of view.10 Although OCT does not offer the same cellular clarity as RCM, it allows visualization of a greater depth of skin and a wider field of view, making it a useful tool both in marginating NMSCs prior to treatment and monitoring response to treatment over time.11-16 Optical coherence tomography has demonstrated a high negative predictive value (92.1%) for BCC, which makes it useful for ruling out residual tumor in lesions undergoing management.17-19
With all available options, BCC management benefits from care that is tailored to the individual and the lesion, taking into account size and subtype because not every available treatment is appropriate. Lasers, including solid state, diode, dye, and gas types, are emerging as promising minimally invasive treatment modalities.20,21
Nonablative laser therapy with a pulsed dye laser (PDL) and fractional laser is an example; the principal investigator (PI) of this study (O.M.) recently reported a 95.70% clearance rate utilizing a PDL and fractional laser protocol.22 The 1064-nm Nd:YAG laser also has been used with PDL and as a stand-alone treatment. Jalian et al23 used PDL and the Nd:YAG laser on 13 BCC lesions, with a 58% (7/12) clearance rate after 4 treatments; all nonresponders were taking an anticoagulant, which inhibited the laser’s mechanism of action, according to the researchers.
Moskalik et al24 published a report of 3346 facial BCC lesions treated with pulsed Nd and pulsed Nd:YAG lasers, and included follow-up for as long as 5 years, with a 3.7% recurrence rate. Another report by Moskalik et al25 recorded a recurrence rate of 2.2% to 3.1% for BCCs that were followed for at least 5 years.
Ortiz et al26 reported use of the long-pulsed 1064-nm Nd:YAG laser to treat 13 lesions with biopsy-confirmed BCC on the trunk and extremities, with a 92% (12/13) clearance rate based on histologic analysis 1 month after laser treatment. In an expanded study of 31 patients by Ortiz et al,27 the histologic clearance rate was 90.3% (28/31)—also obtained after 1 month—after 1 Nd:YAG laser treatment, also treating lesions on the trunk and extremities. A further retrospective review of Nd:YAG laser treatment of BCC revealed a 100% clearance rate for 16 lesions (including lesions on the face) that were monitored for at least 6 months (mean duration, 9 months; range, 6–15 months).28 Optical coherence tomography imaging was used for one of the review’s lesions before and after treatment and suggested that the Nd:YAG laser works by selectively destroying the vasculature supplying BCC tumors while preserving surrounding healthy tissue.28
Apart from Moskalik et al,24,25 these studies are limited by a relatively short follow-up time to confirm tumor clearance. Prior studies utilizing the Nd:YAG laser to treat BCC are summarized in the eTable.
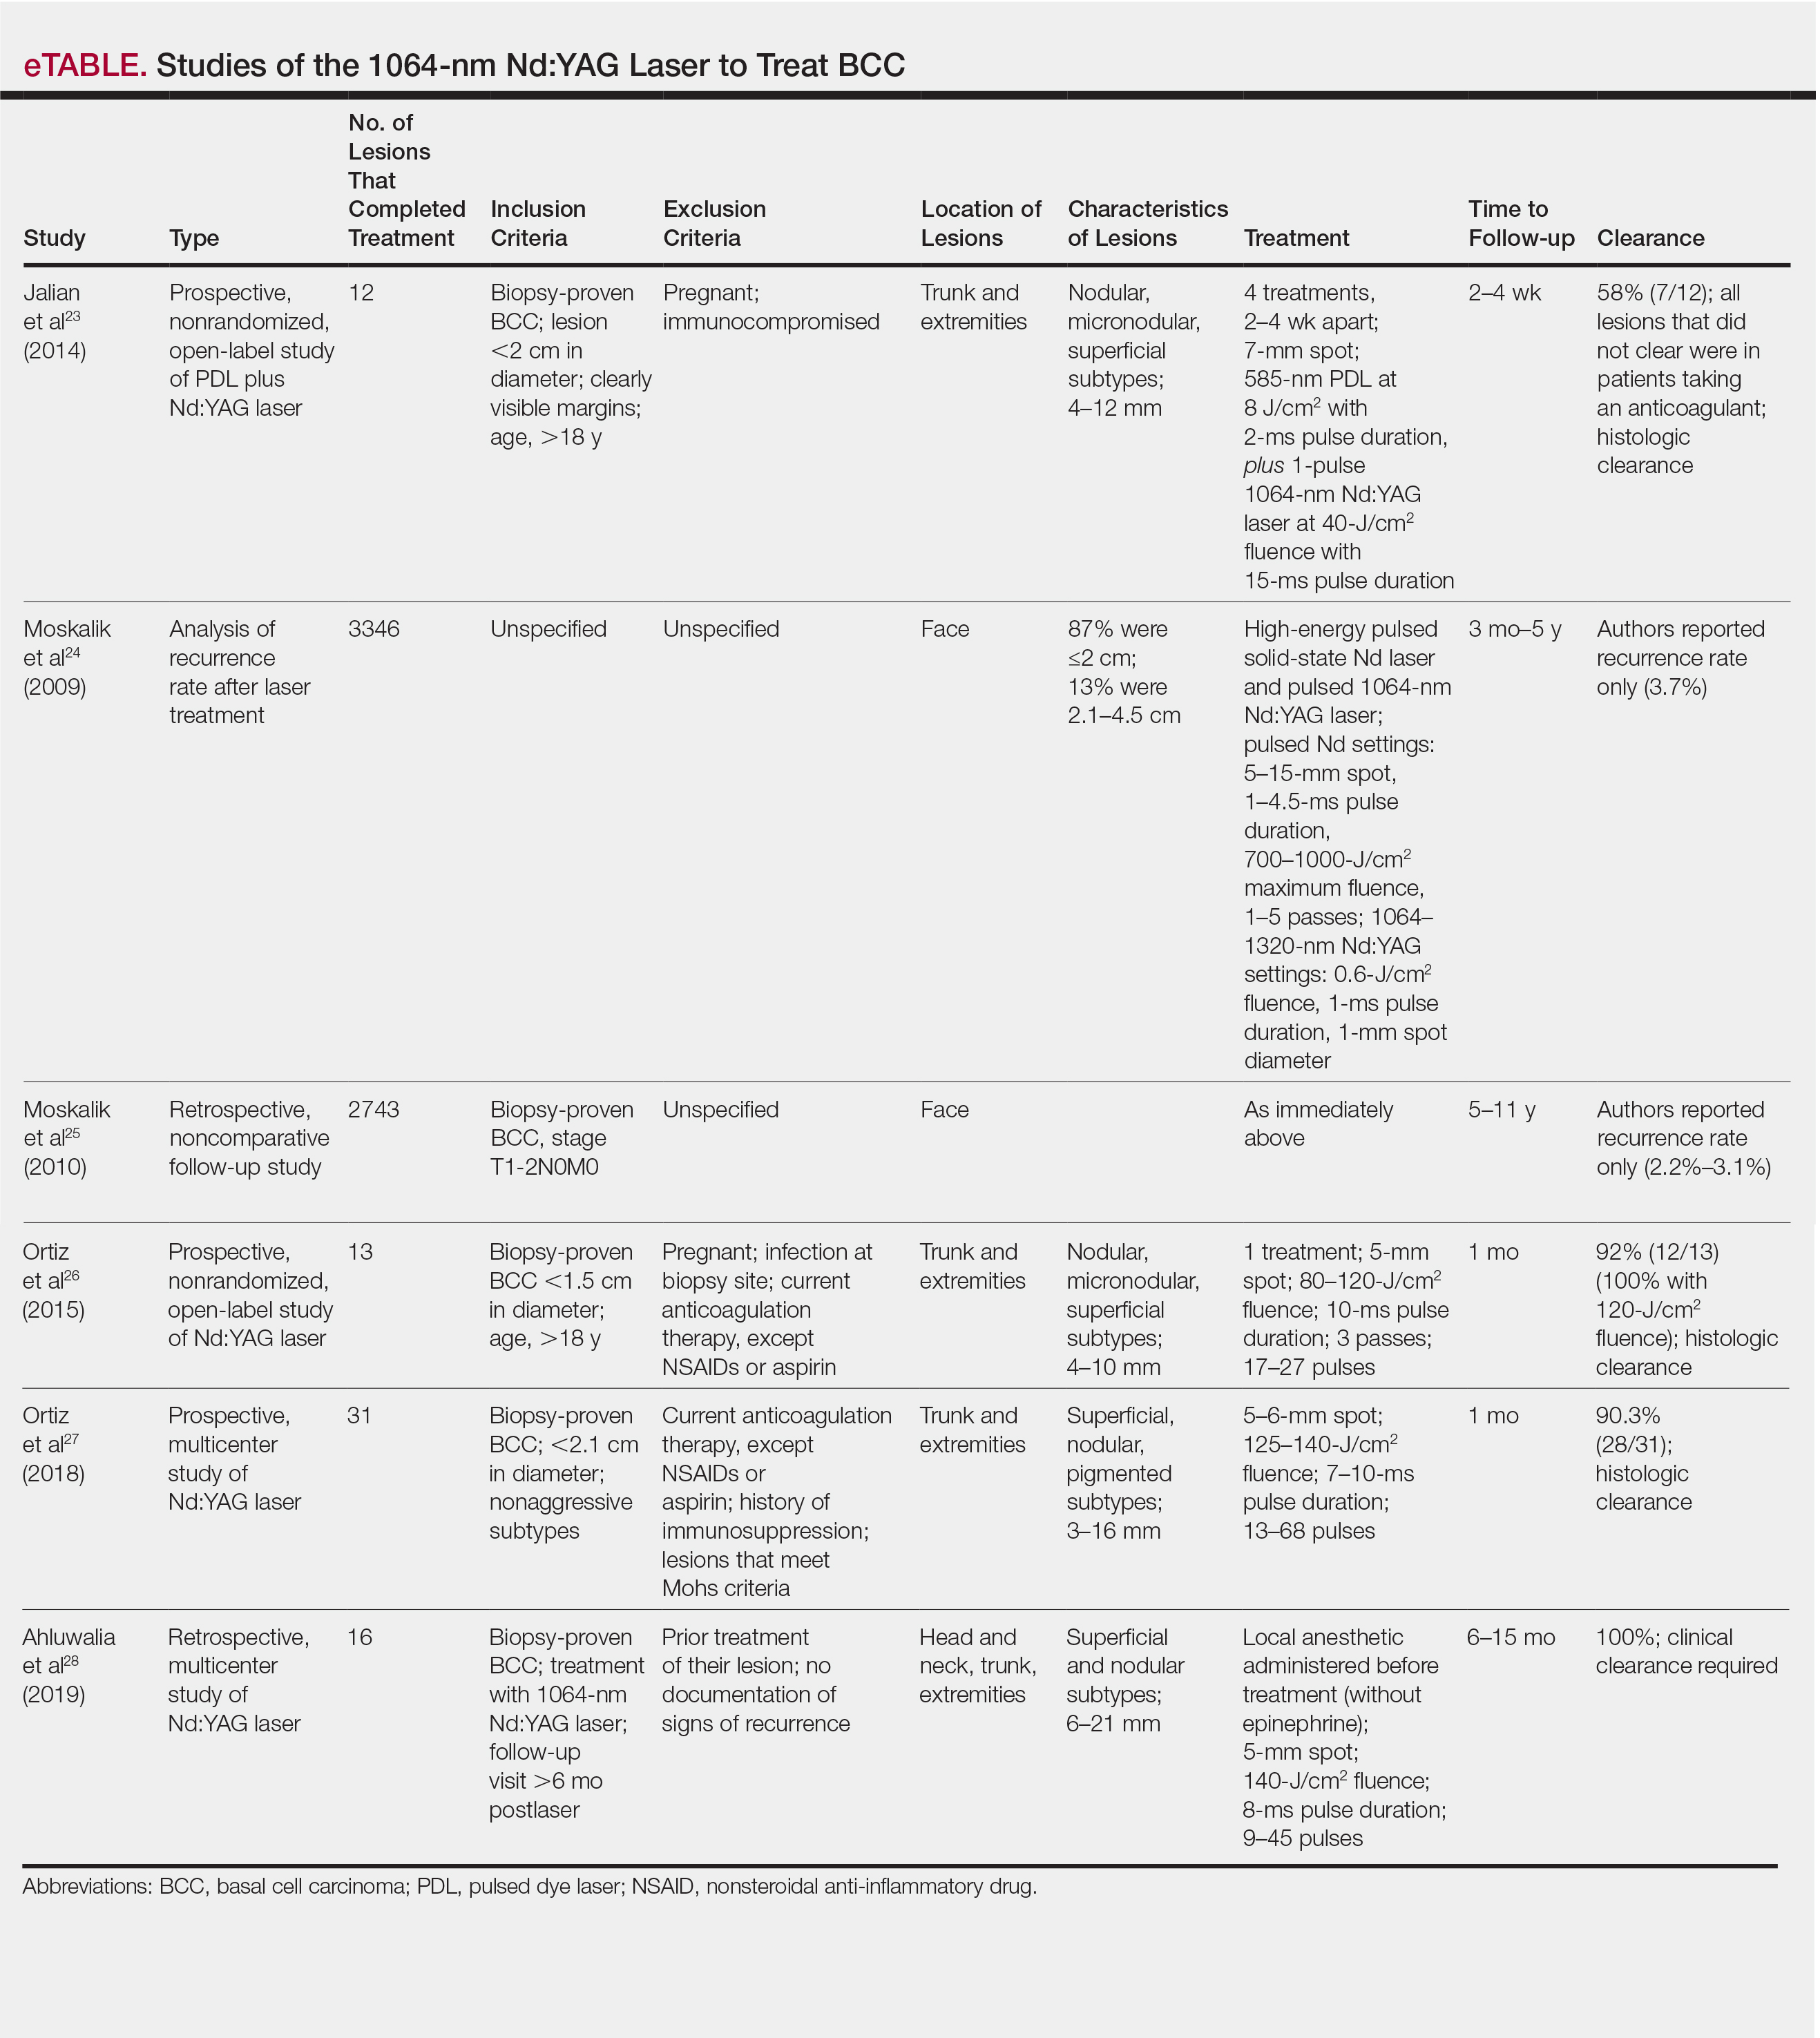
This pilot study describes a model of care that aims to alleviate some of the demand placed both on the specialty and on patients by utilizing a novel same-day approach to BCC management. We sought to evaluate management using noninvasive diagnosis with RCM; same-day laser treatment; and follow-up examination with clinical, dermoscopic, and noninvasive imaging using OCT. This method focuses on patient-driven health care from various perspectives. Patients are given real-time information about their diagnosis using RCM, leading to an increased level of information flow and immediate transparency regarding their diagnosis and management options. Patients also are receiving tailored care by incorporating noninvasive imaging and same-day laser treatment, allowing collaboration between patient and physician. Patients have more choices—to undergo surgical care; other at-home topical regimens; or laser management with potentially fewer visits, immediate results, a clearance rate similar to surgery, and improved cosmetic outcome.
Our study attempts to further evaluate the efficacy of the 1064-nm Nd:YAG laser in treating BCC while leveraging noninvasive imaging technology. The objective was to perform a retrospective review of medical records of a subgroup of patients with BCC diagnosed by RCM who were treated with the 1064-nm Nd:YAG laser and monitored for clearance using OCT imaging, in addition to clinical and dermoscopic examination. Similar to prior long-term Nd:YAG laser follow-up studies, we aimed to demonstrate the possibility of a minimally invasive BCC management approach—in our protocol, utilizing imaging instead of biopsy to facilitate long-term follow-up and by offering a model for patient-driven care.
Methods
Study Design
Institutional review board approval was received from Icahn School of Medicine at Mount Sinai Program for the Protection of Human Subjects (New York, New York). We performed a retrospective review of medical records of patients diagnosed by RCM and treated with a 1064-nm Nd:YAG laser, as an alternative to surgery, at the Mount Sinai Faculty Practice Associates between March 2018 and August 2018. Included in this pilot study are 17 lesions in 16 patients.
Inclusion Criteria
Patients were enrolled based on the following criteria: BCCs diagnosed by clinical and dermoscopic examination followed by RCM imaging; treatment with the 1064-nm Nd:YAG laser, because of patients’ preference for this modality over surgery, superficial radiation therapy, topical regimens, and other laser therapies that require more visits; eligibility by PI included limited clinical ulceration or bleeding (or both) and a safe distance from the eye when wearing an external eye shield (ie, outside the orbital rim). The PI performed a detailed and thorough clinical and dermoscopic skin examination, enabling early detection of the BCCs. Basal cell carcinomas were not included if they exhibited rolled borders, visible ulceration, or oozing growths that allowed for treatment of less-advanced tumors. The PI utilized a clinical and dermoscopic color wheel algorithm to identify suspicious lesions combined with RCM for diagnostic confirmation.29
Two of 17 lesions that did not present as early lesions were included in the study due to patient refusal of surgery or radiation. We consider more advanced tumors to be exophytic, bleeding, crusting, nonhealing ulcerative growths. Patients who had received prior laser treatment with the PI’s PDL with fractional laser protocol with subsequent recurrence at the treatment site were included in the study. Lesions receiving concurrent or prior nonsurgical therapy, such as a topical immunomodulator or oral hedgehog inhibitor, were excluded.
Treatment Protocol
All patients attended the private clinic at Mount Sinai Hospital of a pigmented lesion expert (O.M.) for routine skin cancer screening. Patients with lesions suspicious for BCC—based on clinical and dermoscopic features—were offered tissue biopsy or RCM. Following diagnosis with RCM, treatment options were discussed, and patients were offered laser treatment when surgical options were declined. Topical treatment options were not emphasized because they require weeks of application to be effective and have been studied mainly in superficial BCC management.30,31
Patients with early lesions were offered either the PDL with fractional laser or Nd:YAG protocol, with their understanding that the Nd:YAG laser protocol would likely involve fewer treatments but a higher likelihood of residual hyperpigmentation or potential scarring (or both) than the more gentle PDL with fractional laser treatment.
All lesions on the face were premarginated using OCT by obtaining central scans and 4 additional scans—above, below, to the left, and to the right of the lesion—to ensure targeted laser treatment with desirable cosmetic results. Facial premargination scans were mandatory; however, patients with lesions on the trunk or extremities were offered the option to have pretreatment margination as an out-of-pocket expense. We did not require premargination of lesions on the body because of their location on less cosmetically critical areas. Most patients declined the optional scans.
This can be considered analogous to the situation in which more insurers reimburse Mohs surgery for cosmetically challenging areas such as the head and neck, while limiting reimbursement for treatment of lesions on the trunk and upper extremities to simple excision. Given cosmetic concerns on the head and neck compared to the body, some patients found it acceptable to have slightly increased dyschromia over a broader treatment area of non–cosmetically critical locations on the body.
Optical coherence tomography imaging was required for all anatomic locations at follow-up visits to detect residual disease or confirm clearance. All patients were given thorough information about the treatment, additional costs, treatment alternatives, potential adverse effects, and complications.
Clinical and dermoscopic images were obtained at every visit using a commercially available point-and-shoot digital single-lens reflex camera for clinical photographs, with an attached DermLite DL3N (3Gen) dermatoscope for all contact polarized dermoscopic photography.
Laser treatment was carried out with the 1064-nm Nd:YAG laser. Setting ranges were similar to previously published studies that used the 1064-nm Nd:YAG laser to treat BCCs (spot sizes, 5–6 mm; fluences, 125–140 J/cm2; pulse durations, 7–10 milliseconds).26-28 The exact settings and number of passes were tailored to the individual lesion based on skin type, anatomic location, extent of tumor involvement by depth (and margin on facial lesions), and posttreatment dermoscopic confirmation of clearance; additionally, for facial lesions, OCT confirmation of clearance.
Laser treatment was provided by the PI. Patients were instructed to apply a thick emollient (ie, formulation of petrolatum or 100% petrolatum) after treatment and until the area healed.
All tumors received 1 to 3 treatments at an interval of 1 to 2 months. The treatment end point was complete clearance, judged by absence of skin cancer clinically, dermoscopically, and on OCT scan. More specifically, the PI looked for vascular changes and echogenic changes on OCT consistent with tumor clearance as well as dermoscopic disappearance of recognized BCC features.
Patients were asked to return for follow-up visits 2 months after the final treatment to evaluate tumor clearance. They were asked to return subsequently every 6 to 12 months for routine care and long-term follow-up.
Results
Patient Characteristics
A total of 16 patients (6 female, 10 male) with 17 BCCs were included in this study. Mean age was 68 years (median, 71.5 years; range; 48–89 years). Mean lesion size was 7.1 mm (median, 6 mm; range, 3–15 mm). Eight lesions were on the face; 9 were on extrafacial sites. Two lesions had a history of laser treatment with the PI’s PDL with fractional laser treatment protocol and had locally recurred. Subtypes of lesions were not elicited by RCM.
Outcomes
Fourteen lesions (14/17 [82.4%]) required 1 treatment to achieve clearance, as confirmed clinically, dermoscopically, and by OCT scanning. One lesion on the back (1/17 [5.8%]) required 2 treatments (70 days between treatments). Two lesions (2/17 [11.8%]) required 3 treatments (time between treatments: 49 and 61 days [lesion 1]; 62 and 64 days [lesion 2]). Lesion 1 was on the face; lesion 2 was on the back. Mean time between last treatment and OCT clearance scan was 103 days (median, 64 days; range, 48–371 days).
Comment
Our study supports the notion that the 1064-nm Nd:YAG laser is a viable option for treating BCC. All (100%) lesions cleared, most (82.4%) with a single treatment. Of course, for patients who required more than 1 treatment (17.6%), we cannot make an argument for fewer patient visits because those patients had to return for multiple laser treatments, but they were able to avoid surgery, as they had wanted. Overall, our diagnostic approach utilizing RCM as opposed to traditional tissue biopsy meant that patients’ skin cancers were diagnosed and treated the same day.
A one-stop shop for diagnosis and treatment model has been reported by Kadouch et al32 as part of a randomized controlled trial in which patients were randomly assigned to receive standard care for BCC—biopsy followed by surgical excision—or RCM diagnosis followed by surgical excision. Their outcome was tumor-free margins after surgical treatment; the RCM approach was found to be noninferior to standard care.32 Our retrospective study differs, of course, in its laser treatment approach; however, both studies investigated a potentially more efficient pathway to BCC management, which becomes increasingly relevant given the rising incidence of NMSC.
A real-time, image-based diagnostic approach combined with laser treatment delivers patient-driven care, offering choice and convenience. It might be optimal for patients who have an extensive history of BCC, are poor surgical candidates, have difficulty with the logistics of the multiple visits required for surgical management, cannot (for practical reasons) spend multiple hours in office between Mohs stages, and do not want potentially disfiguring scars, making a minimally invasive treatment preferable.
As we found in our sample, not all patients are amenable to undergoing what is regarded now as the most definitive treatment—namely, surgical options. This subset of patients, whose lesions require more definitive treatment but who do not desire invasive management, need alternative approaches to BCC treatment. The present study proposes a model of patient-driven care that requires collaboration between physician and patient, offering more customized care that takes into account patient choice.
In our study, most patients had lesions that were detected early in their evolution; these lesions might be particularly amenable to laser management. The 2 resistant lesions in our set—requiring 3 treatments—appeared more aggressive clinically at initial evaluation but still had posttreatment outcomes with mild dyschromia similar to the lesions only treated once (Figure, A–D). Of those 2 lesions, the 9-mm lesion on the back (Figure, C and D) might have been larger than clinically apparent; in hindsight, it might have responded to a single treatment had it been premarginated. (An additional factor to have considered is the patient’s immunosuppressed status, which might have led to a more resistant lesion. Larger trials would help elucidate whether an immunosuppressed patient requires a different treatment approach, broader treatment area, OCT premargination regardless of anatomic location, or a greater number of treatments.) Nevertheless, the 2 aforementioned patients were offered treatment with the 1064-nm Nd:YAG laser because they refused surgery, radiation, and other more aggressive modalities. The patients were given advanced warning of an increased possibility of recurrence or nonclearance.
The lesion that required 2 treatments did not appear to be an aggressive subtype; however, it was considerably larger than most other treated lesions (1.5 cm)(Figure, E and F). In this patient, as with the others, we utilized milder (700–1000 J) fluence settings than those used in the Moskalik et al24 study; however, we were optimizing for patient comfort, overall downtime, and cosmetic outcomes.
Clearance in this study was assessed by OCT scanning. Scans were obtained 2 months after the last treatment to avoid detecting inflammation and early scar tissue. We opted not to perform biopsies to determine clearance, as done in prior studies, because we were investigating a fully nonsurgical protocol and wanted to enable patients to avoid surgical intervention, as they had requested. Clinical and dermoscopic examinations by a world expert in dermoscopy and OCT (O.M.) provided additional reassurance of lesion clearance.
Limitations
The retrospective study design with a limited sample size was a main limitation of our study. Our limited data suggest that there is value in further investigation and prospective trials of minimally invasive skin cancer management with the pulsed 1064-nm Nd:YAG laser.
Limitations or disadvantages of this nonablative laser treatment include dyschromia and minimal scarring. Furthermore, at fluence settings utilized, treatment can be painful. Without use of a local anesthetic, treatment is limited to what patients can tolerate.
The percentage of BCCs located on the body (53%) was higher in our study than in the general population, estimated in a study to be approximately 20%.33 This percentage might have been an effect of the larger Vivascope 1500 RCM probe, which made certain areas of the face difficult to access, therefore excluding certain facial lesions encountered in our practice from the initial noninvasive diagnosis.
Most lesions in our study have not been followed long-term; median noninvasive OCT follow-up was 64 days; however, the longest follow-up from our data set is longer than 1 year posttreatment (371 days). We have used OCT to establish clearance, which also will allow us to continue using imaging to monitor for changes that might indicate recurrence. Although OCT is not approved by the US Food and Drug Administration as a validated means of diagnosing and detecting BCC, numerous studies have suggested that this modality has high sensitivity (95.7%) and specificity (75.3%) for features of BCC as well as the more critical high negative predictive value (92.1%) for noninvasive management.22-24
Furthermore, setting up the lesions to be monitored long-term using OCT is likely to be more sensitive than monitoring lesions by clinical examination alone, as they have been followed in studies to date. In fact, an earlier study of 115 lesions by the PI found that utilizing OCT significantly improved sensitivity and specificity for detecting BCC (P<.01); improved diagnostic certainty by a factor of 4 compared to clinical examination alone; and improved overall diagnostic accuracy by 50% compared to clinical and dermoscopic examinations.19
Conclusion
Traditional approaches to BCC management usually involve multiple visits: the initial encounter, which might or might not include biopsy, and a return visit for more definitive management. Reflectance confocal microscopy enables live diagnosis and facilitates targeted same-day treatment of BCC. Our pilot study has contributed data to support the further investigation and use of the Nd:YAG laser to treat BCC in combination with early detection with noninvasive diagnosis for a more patient-driven approach. For some patients as well as for dermatologists, the potential for increased efficiency of same-day diagnosis and treatment might provide a clear advantage.
- Rogers HW, Weinstock MA, Feldman SR, et al. Incidence estimate of nonmelanoma skin cancer (keratinocyte carcinomas) in the US population, 2012. JAMA Dermatol. 2015;151:1081-1086.
- Menzies SW, Westerhoff K, Rabinovitz H, et al. Surface microscopy of pigmented basal cell carcinoma. Arch Dermatol. 2000;136:1012-1016.
- Altamura D, Menzies SW, Argenziano G, et al. Dermatoscopy of basal cell carcinoma: morphologic variability of global and local features and accuracy of diagnosis. J Am Acad Dermatol. 2010;62:67-75.
- Rosendahl C, Tschandl P, Cameron A, et al. Diagnostic accuracy of dermatoscopy for melanocytic and nonmelanocytic pigmented lesions. J Am Acad Dermatol. 2011;64:1068-1073.
- Lallas A, Apalla Z, Ioannides D, et al. Dermoscopy in the diagnosis and management of basal cell carcinoma. Futur Oncol. 2015;11:2975-2984.
- Ulrich M, Lange-Asschenfeldt S, Gonzalez S. The use of reflectance confocal microscopy for monitoring response to therapy of skin malignancies. Dermatol Pract Concept. 2012;2:202a10.
- Kauvar AN, Cronin T Jr, Roenigk R, et al; American Society for Dermatologic Surgery. Consensus for nonmelanoma skin cancer treatment: basal cell carcinoma, including a cost analysis of treatment methods. Dermatol Surg. 2015;41:550-571.
- Hoorens I, Vossaert K, Ongenae K, et al. Is early detection of basal cell carcinoma worthwhile? Systematic review based on the WHO criteria for screening. Br J Dermatol. 2016;174:1258-1265.
- Levine A, Markowitz O. In vivo reflectance confocal microscopy. Cutis. 2017;99:399-402.
- Levine A, Wang K, Markowitz O. Optical coherence tomography in the diagnosis of skin cancer. Dermatol Clin. 2017;35:465-488.
- Pomerantz R, Zell D, McKenzie G, et al. Optical coherence tomography used as a modality to delineate basal cell carcinoma prior to Mohs micrographic surgery. Case Rep Dermatol. 2011;3:212-218.
- Alawi SA, Kuck M, Wahrlich C, et al. Optical coherence tomography for presurgical margin assessment of non-melanoma skin cancer - a practical approach. Exp Dermatol. 2013;22:547-551.
- Wang KX, Meekings A, Fluhr JW, et al. Optical coherence tomography-based optimization of Mohs micrographic surgery of basal cell carcinoma: a pilot study. Dermatol Surg. 2013;39:627-633.
- van Manen L, Dijkstra J, Boccara C, et al. The clinical usefulness of optical coherence tomography during cancer interventions. J Cancer Res Clin Oncol. 2018;144:1967-1990.
- Banzhaf CA, Themstrup L, Ring HC, et al. Optical coherence tomography imaging of non-melanoma skin cancer undergoing imiquimod therapy. Ski Res Technol. 2014;20:170-176.
- Markowitz O, Schwartz M. The use of noninvasive optical coherence tomography to monitor the treatment progress of vismodegib and imiquimod 5% cream in a transplant patient with advanced basal cell carcinoma of the nose. J Clin Aesthet Dermatol. 2016;9:37-41.
- Cheng HM, Guitera P. Systematic review of optical coherence tomography usage in the diagnosis and management of basal cell carcinoma. Br J Dermatol. 2015;173:1371-1380.
- Ulrich M, von Braunmuehl T, Kurzen H, et al. The sensitivity and specificity of optical coherence tomography for the assisted diagnosis of nonpigmented basal cell carcinoma: an observational study. Br J Dermatol. 2015;173:428-435.
- Markowitz O, Schwartz M, Feldman E, et al. Evaluation of optical coherence tomography as a means of identifying earlier stage basal cell carcinomas while reducing the use of diagnostic biopsy. J Clin Aesthet Dermatol. 2015;8:14-20.
- Mirza FN, Khatri KA. The use of lasers in the treatment of skin cancer: a review. J Cosmet Laser Ther. 2017;19:451-458.
- Soleymani T, Abrouk M, Kelly KM. An analysis of laser therapy for the treatment of nonmelanoma skin cancer. Dermatol Surg. 2017;43:615-624.
- Markowitz O, Tongdee E, Levine A. Optimal cosmetic outcomes for basal cell carcinoma: a retrospective study of nonablative laser management. Cutis. 2019;103:292-297.
- Jalian HR, Avram MM, Stankiewicz KJ, et al. Combined 585 nm pulsed-dye and 1,064 nm Nd:YAG lasers for the treatment of basal cell carcinoma. Lasers Surg Med. 2014;46:1-7.
- Moskalik K, Kozlov A, Demin E, et al. The efficacy of facial skin cancer treatment with high-energy pulsed neodymium and Nd:YAG lasers. Photomed Laser Surg. 2009;27:345-349.
- Moskalik K, Kozlow A, Demin E, et al. Powerful neodymium laser radiation for the treatment of facial carcinoma: 5 year follow-up data. Eur J Dermatol. 2010;20:738-742.
- Ortiz AE, Anderson RR, Avram MM. 1064 nm long-pulsed Nd:YAG laser treatment of basal cell carcinoma. Lasers Surg Med. 2015;47:106-110.
- Ortiz AE, Anderson RR, DiGiorgio C, et al. An expanded study of long-pulsed 1064 nm Nd:YAG laser treatment of basal cell carcinoma. Lasers Surg Med. 2018;50:727-731.
- Ahluwalia J, Avram MM, Ortiz AE. Outcomes of long-pulsed 1064 nm Nd:YAG laser treatment of basal cell carcinoma: a retrospective review. Lasers Surg Med. 2019;51:34-39.
- Markowitz O. A Practical Guide to Dermoscopy. Philadelphia, PA: Wolters Kluwer; 2017.
- Papakostas D, Stockfleth E. Topical treatment of basal cell carcinoma with the immune response modifier imiquimod. Futur Oncol. 2015;11:2985-2990.
- Jansen MHE, Mosterd K, Arits AHMM, et al. Five-year results of a randomized controlled trial comparing effectiveness of photodynamic therapy, topical imiquimod, and topical 5-fluorouracil in patients with superficial basal cell carcinoma. J Invest Dermatol. 2018;138:527-533.
- Kadouch DJ, Elshot YS, Zupan-Kajcovski B, et al. One-stop-shop with confocal microscopy imaging vs. standard care for surgical treatment of basal cell carcinoma: an open-label, noninferiority, randomized controlled multicentre trial. Br J Dermatol. 2017;177:735-741.
- Scrivener Y, Grosshans E, Cribier B. Variations of basal cell carcinomas according to gender, age, location and histopathological subtype. Br J Dermatol. 2002;147:41-47.
The increasing incidence of nonmelanoma skin cancer (NMSC) is a serious public health concern.1 Lesions often are identified on routine total-body examination, and there is a considerate burden on dermatologists to diagnose these lesions, which is both costly and results in a long wait time to see a specialist. Furthermore, standard care requires patients to attend multiple visits for the diagnosis and treatment of NMSC.
In recent decades, diagnosing basal cell carcinoma (BCC) has been facilitated by the handheld dermatoscope. The advent of dermoscopy has led to increased sensitivity and specificity of the NMSC diagnosis (estimated at 95%–99%) and has helped facilitate earlier diagnosis of BCC and reduce unnecessary biopsy of benign lesions.2-5 Dermoscopy also can be useful in monitoring response to treatment.5 Lesions that are detected early tend to be easier and less expensive to treat, a strong argument for the use of early detection techniques.6-8
More recently, in vivo reflectance confocal microscopy (RCM)(Vivascope 1500 [Caliber I.D.]) has become an acceptable means for confirming a BCC diagnosis, offering an alternative to tissue biopsy. Reflectance confocal microscopy can be reimbursed under Category I Current Procedural Terminology codes 96931 to 96936.9 Reflectance confocal microscopy is a noninvasive diagnostic technique that uses an 830-nm diode laser to enable visualization of a 0.5×0.5-mm patch of skin to a depth of 200 to 300 μm, which corresponds roughly to the papillary dermis. Reflectance confocal microscopy has the advantage of providing real-time diagnosis, enabling same-day treatment of BCC, and providing an efficient alternative to biopsy. Ultimately, these advantages are beneficial and time-saving for patients because biopsies can be painful; create a delay in diagnosis; and require further follow-up visits for treatment, which may be of importance to patients who have trouble attending multiple appointments.
Optical coherence tomography (OCT) is another noninvasive imaging device that is useful in BCC management. It uses an infrared broadband light source to visualize skin architecture to 2-mm deep with a 6×6-mm field of view.10 Although OCT does not offer the same cellular clarity as RCM, it allows visualization of a greater depth of skin and a wider field of view, making it a useful tool both in marginating NMSCs prior to treatment and monitoring response to treatment over time.11-16 Optical coherence tomography has demonstrated a high negative predictive value (92.1%) for BCC, which makes it useful for ruling out residual tumor in lesions undergoing management.17-19
With all available options, BCC management benefits from care that is tailored to the individual and the lesion, taking into account size and subtype because not every available treatment is appropriate. Lasers, including solid state, diode, dye, and gas types, are emerging as promising minimally invasive treatment modalities.20,21
Nonablative laser therapy with a pulsed dye laser (PDL) and fractional laser is an example; the principal investigator (PI) of this study (O.M.) recently reported a 95.70% clearance rate utilizing a PDL and fractional laser protocol.22 The 1064-nm Nd:YAG laser also has been used with PDL and as a stand-alone treatment. Jalian et al23 used PDL and the Nd:YAG laser on 13 BCC lesions, with a 58% (7/12) clearance rate after 4 treatments; all nonresponders were taking an anticoagulant, which inhibited the laser’s mechanism of action, according to the researchers.
Moskalik et al24 published a report of 3346 facial BCC lesions treated with pulsed Nd and pulsed Nd:YAG lasers, and included follow-up for as long as 5 years, with a 3.7% recurrence rate. Another report by Moskalik et al25 recorded a recurrence rate of 2.2% to 3.1% for BCCs that were followed for at least 5 years.
Ortiz et al26 reported use of the long-pulsed 1064-nm Nd:YAG laser to treat 13 lesions with biopsy-confirmed BCC on the trunk and extremities, with a 92% (12/13) clearance rate based on histologic analysis 1 month after laser treatment. In an expanded study of 31 patients by Ortiz et al,27 the histologic clearance rate was 90.3% (28/31)—also obtained after 1 month—after 1 Nd:YAG laser treatment, also treating lesions on the trunk and extremities. A further retrospective review of Nd:YAG laser treatment of BCC revealed a 100% clearance rate for 16 lesions (including lesions on the face) that were monitored for at least 6 months (mean duration, 9 months; range, 6–15 months).28 Optical coherence tomography imaging was used for one of the review’s lesions before and after treatment and suggested that the Nd:YAG laser works by selectively destroying the vasculature supplying BCC tumors while preserving surrounding healthy tissue.28
Apart from Moskalik et al,24,25 these studies are limited by a relatively short follow-up time to confirm tumor clearance. Prior studies utilizing the Nd:YAG laser to treat BCC are summarized in the eTable.
This pilot study describes a model of care that aims to alleviate some of the demand placed both on the specialty and on patients by utilizing a novel same-day approach to BCC management. We sought to evaluate management using noninvasive diagnosis with RCM; same-day laser treatment; and follow-up examination with clinical, dermoscopic, and noninvasive imaging using OCT. This method focuses on patient-driven health care from various perspectives. Patients are given real-time information about their diagnosis using RCM, leading to an increased level of information flow and immediate transparency regarding their diagnosis and management options. Patients also are receiving tailored care by incorporating noninvasive imaging and same-day laser treatment, allowing collaboration between patient and physician. Patients have more choices—to undergo surgical care; other at-home topical regimens; or laser management with potentially fewer visits, immediate results, a clearance rate similar to surgery, and improved cosmetic outcome.
Our study attempts to further evaluate the efficacy of the 1064-nm Nd:YAG laser in treating BCC while leveraging noninvasive imaging technology. The objective was to perform a retrospective review of medical records of a subgroup of patients with BCC diagnosed by RCM who were treated with the 1064-nm Nd:YAG laser and monitored for clearance using OCT imaging, in addition to clinical and dermoscopic examination. Similar to prior long-term Nd:YAG laser follow-up studies, we aimed to demonstrate the possibility of a minimally invasive BCC management approach—in our protocol, utilizing imaging instead of biopsy to facilitate long-term follow-up and by offering a model for patient-driven care.
Methods
Study Design
Institutional review board approval was received from Icahn School of Medicine at Mount Sinai Program for the Protection of Human Subjects (New York, New York). We performed a retrospective review of medical records of patients diagnosed by RCM and treated with a 1064-nm Nd:YAG laser, as an alternative to surgery, at the Mount Sinai Faculty Practice Associates between March 2018 and August 2018. Included in this pilot study are 17 lesions in 16 patients.
Inclusion Criteria
Patients were enrolled based on the following criteria: BCCs diagnosed by clinical and dermoscopic examination followed by RCM imaging; treatment with the 1064-nm Nd:YAG laser, because of patients’ preference for this modality over surgery, superficial radiation therapy, topical regimens, and other laser therapies that require more visits; eligibility by PI included limited clinical ulceration or bleeding (or both) and a safe distance from the eye when wearing an external eye shield (ie, outside the orbital rim). The PI performed a detailed and thorough clinical and dermoscopic skin examination, enabling early detection of the BCCs. Basal cell carcinomas were not included if they exhibited rolled borders, visible ulceration, or oozing growths that allowed for treatment of less-advanced tumors. The PI utilized a clinical and dermoscopic color wheel algorithm to identify suspicious lesions combined with RCM for diagnostic confirmation.29
Two of 17 lesions that did not present as early lesions were included in the study due to patient refusal of surgery or radiation. We consider more advanced tumors to be exophytic, bleeding, crusting, nonhealing ulcerative growths. Patients who had received prior laser treatment with the PI’s PDL with fractional laser protocol with subsequent recurrence at the treatment site were included in the study. Lesions receiving concurrent or prior nonsurgical therapy, such as a topical immunomodulator or oral hedgehog inhibitor, were excluded.
Treatment Protocol
All patients attended the private clinic at Mount Sinai Hospital of a pigmented lesion expert (O.M.) for routine skin cancer screening. Patients with lesions suspicious for BCC—based on clinical and dermoscopic features—were offered tissue biopsy or RCM. Following diagnosis with RCM, treatment options were discussed, and patients were offered laser treatment when surgical options were declined. Topical treatment options were not emphasized because they require weeks of application to be effective and have been studied mainly in superficial BCC management.30,31
Patients with early lesions were offered either the PDL with fractional laser or Nd:YAG protocol, with their understanding that the Nd:YAG laser protocol would likely involve fewer treatments but a higher likelihood of residual hyperpigmentation or potential scarring (or both) than the more gentle PDL with fractional laser treatment.
All lesions on the face were premarginated using OCT by obtaining central scans and 4 additional scans—above, below, to the left, and to the right of the lesion—to ensure targeted laser treatment with desirable cosmetic results. Facial premargination scans were mandatory; however, patients with lesions on the trunk or extremities were offered the option to have pretreatment margination as an out-of-pocket expense. We did not require premargination of lesions on the body because of their location on less cosmetically critical areas. Most patients declined the optional scans.
This can be considered analogous to the situation in which more insurers reimburse Mohs surgery for cosmetically challenging areas such as the head and neck, while limiting reimbursement for treatment of lesions on the trunk and upper extremities to simple excision. Given cosmetic concerns on the head and neck compared to the body, some patients found it acceptable to have slightly increased dyschromia over a broader treatment area of non–cosmetically critical locations on the body.
Optical coherence tomography imaging was required for all anatomic locations at follow-up visits to detect residual disease or confirm clearance. All patients were given thorough information about the treatment, additional costs, treatment alternatives, potential adverse effects, and complications.
Clinical and dermoscopic images were obtained at every visit using a commercially available point-and-shoot digital single-lens reflex camera for clinical photographs, with an attached DermLite DL3N (3Gen) dermatoscope for all contact polarized dermoscopic photography.
Laser treatment was carried out with the 1064-nm Nd:YAG laser. Setting ranges were similar to previously published studies that used the 1064-nm Nd:YAG laser to treat BCCs (spot sizes, 5–6 mm; fluences, 125–140 J/cm2; pulse durations, 7–10 milliseconds).26-28 The exact settings and number of passes were tailored to the individual lesion based on skin type, anatomic location, extent of tumor involvement by depth (and margin on facial lesions), and posttreatment dermoscopic confirmation of clearance; additionally, for facial lesions, OCT confirmation of clearance.
Laser treatment was provided by the PI. Patients were instructed to apply a thick emollient (ie, formulation of petrolatum or 100% petrolatum) after treatment and until the area healed.
All tumors received 1 to 3 treatments at an interval of 1 to 2 months. The treatment end point was complete clearance, judged by absence of skin cancer clinically, dermoscopically, and on OCT scan. More specifically, the PI looked for vascular changes and echogenic changes on OCT consistent with tumor clearance as well as dermoscopic disappearance of recognized BCC features.
Patients were asked to return for follow-up visits 2 months after the final treatment to evaluate tumor clearance. They were asked to return subsequently every 6 to 12 months for routine care and long-term follow-up.
Results
Patient Characteristics
A total of 16 patients (6 female, 10 male) with 17 BCCs were included in this study. Mean age was 68 years (median, 71.5 years; range; 48–89 years). Mean lesion size was 7.1 mm (median, 6 mm; range, 3–15 mm). Eight lesions were on the face; 9 were on extrafacial sites. Two lesions had a history of laser treatment with the PI’s PDL with fractional laser treatment protocol and had locally recurred. Subtypes of lesions were not elicited by RCM.
Outcomes
Fourteen lesions (14/17 [82.4%]) required 1 treatment to achieve clearance, as confirmed clinically, dermoscopically, and by OCT scanning. One lesion on the back (1/17 [5.8%]) required 2 treatments (70 days between treatments). Two lesions (2/17 [11.8%]) required 3 treatments (time between treatments: 49 and 61 days [lesion 1]; 62 and 64 days [lesion 2]). Lesion 1 was on the face; lesion 2 was on the back. Mean time between last treatment and OCT clearance scan was 103 days (median, 64 days; range, 48–371 days).
Comment
Our study supports the notion that the 1064-nm Nd:YAG laser is a viable option for treating BCC. All (100%) lesions cleared, most (82.4%) with a single treatment. Of course, for patients who required more than 1 treatment (17.6%), we cannot make an argument for fewer patient visits because those patients had to return for multiple laser treatments, but they were able to avoid surgery, as they had wanted. Overall, our diagnostic approach utilizing RCM as opposed to traditional tissue biopsy meant that patients’ skin cancers were diagnosed and treated the same day.
A one-stop shop for diagnosis and treatment model has been reported by Kadouch et al32 as part of a randomized controlled trial in which patients were randomly assigned to receive standard care for BCC—biopsy followed by surgical excision—or RCM diagnosis followed by surgical excision. Their outcome was tumor-free margins after surgical treatment; the RCM approach was found to be noninferior to standard care.32 Our retrospective study differs, of course, in its laser treatment approach; however, both studies investigated a potentially more efficient pathway to BCC management, which becomes increasingly relevant given the rising incidence of NMSC.
A real-time, image-based diagnostic approach combined with laser treatment delivers patient-driven care, offering choice and convenience. It might be optimal for patients who have an extensive history of BCC, are poor surgical candidates, have difficulty with the logistics of the multiple visits required for surgical management, cannot (for practical reasons) spend multiple hours in office between Mohs stages, and do not want potentially disfiguring scars, making a minimally invasive treatment preferable.
As we found in our sample, not all patients are amenable to undergoing what is regarded now as the most definitive treatment—namely, surgical options. This subset of patients, whose lesions require more definitive treatment but who do not desire invasive management, need alternative approaches to BCC treatment. The present study proposes a model of patient-driven care that requires collaboration between physician and patient, offering more customized care that takes into account patient choice.
In our study, most patients had lesions that were detected early in their evolution; these lesions might be particularly amenable to laser management. The 2 resistant lesions in our set—requiring 3 treatments—appeared more aggressive clinically at initial evaluation but still had posttreatment outcomes with mild dyschromia similar to the lesions only treated once (Figure, A–D). Of those 2 lesions, the 9-mm lesion on the back (Figure, C and D) might have been larger than clinically apparent; in hindsight, it might have responded to a single treatment had it been premarginated. (An additional factor to have considered is the patient’s immunosuppressed status, which might have led to a more resistant lesion. Larger trials would help elucidate whether an immunosuppressed patient requires a different treatment approach, broader treatment area, OCT premargination regardless of anatomic location, or a greater number of treatments.) Nevertheless, the 2 aforementioned patients were offered treatment with the 1064-nm Nd:YAG laser because they refused surgery, radiation, and other more aggressive modalities. The patients were given advanced warning of an increased possibility of recurrence or nonclearance.
The lesion that required 2 treatments did not appear to be an aggressive subtype; however, it was considerably larger than most other treated lesions (1.5 cm)(Figure, E and F). In this patient, as with the others, we utilized milder (700–1000 J) fluence settings than those used in the Moskalik et al24 study; however, we were optimizing for patient comfort, overall downtime, and cosmetic outcomes.
Clearance in this study was assessed by OCT scanning. Scans were obtained 2 months after the last treatment to avoid detecting inflammation and early scar tissue. We opted not to perform biopsies to determine clearance, as done in prior studies, because we were investigating a fully nonsurgical protocol and wanted to enable patients to avoid surgical intervention, as they had requested. Clinical and dermoscopic examinations by a world expert in dermoscopy and OCT (O.M.) provided additional reassurance of lesion clearance.
Limitations
The retrospective study design with a limited sample size was a main limitation of our study. Our limited data suggest that there is value in further investigation and prospective trials of minimally invasive skin cancer management with the pulsed 1064-nm Nd:YAG laser.
Limitations or disadvantages of this nonablative laser treatment include dyschromia and minimal scarring. Furthermore, at fluence settings utilized, treatment can be painful. Without use of a local anesthetic, treatment is limited to what patients can tolerate.
The percentage of BCCs located on the body (53%) was higher in our study than in the general population, estimated in a study to be approximately 20%.33 This percentage might have been an effect of the larger Vivascope 1500 RCM probe, which made certain areas of the face difficult to access, therefore excluding certain facial lesions encountered in our practice from the initial noninvasive diagnosis.
Most lesions in our study have not been followed long-term; median noninvasive OCT follow-up was 64 days; however, the longest follow-up from our data set is longer than 1 year posttreatment (371 days). We have used OCT to establish clearance, which also will allow us to continue using imaging to monitor for changes that might indicate recurrence. Although OCT is not approved by the US Food and Drug Administration as a validated means of diagnosing and detecting BCC, numerous studies have suggested that this modality has high sensitivity (95.7%) and specificity (75.3%) for features of BCC as well as the more critical high negative predictive value (92.1%) for noninvasive management.22-24
Furthermore, setting up the lesions to be monitored long-term using OCT is likely to be more sensitive than monitoring lesions by clinical examination alone, as they have been followed in studies to date. In fact, an earlier study of 115 lesions by the PI found that utilizing OCT significantly improved sensitivity and specificity for detecting BCC (P<.01); improved diagnostic certainty by a factor of 4 compared to clinical examination alone; and improved overall diagnostic accuracy by 50% compared to clinical and dermoscopic examinations.19
Conclusion
Traditional approaches to BCC management usually involve multiple visits: the initial encounter, which might or might not include biopsy, and a return visit for more definitive management. Reflectance confocal microscopy enables live diagnosis and facilitates targeted same-day treatment of BCC. Our pilot study has contributed data to support the further investigation and use of the Nd:YAG laser to treat BCC in combination with early detection with noninvasive diagnosis for a more patient-driven approach. For some patients as well as for dermatologists, the potential for increased efficiency of same-day diagnosis and treatment might provide a clear advantage.
- Rogers HW, Weinstock MA, Feldman SR, et al. Incidence estimate of nonmelanoma skin cancer (keratinocyte carcinomas) in the US population, 2012. JAMA Dermatol. 2015;151:1081-1086.
- Menzies SW, Westerhoff K, Rabinovitz H, et al. Surface microscopy of pigmented basal cell carcinoma. Arch Dermatol. 2000;136:1012-1016.
- Altamura D, Menzies SW, Argenziano G, et al. Dermatoscopy of basal cell carcinoma: morphologic variability of global and local features and accuracy of diagnosis. J Am Acad Dermatol. 2010;62:67-75.
- Rosendahl C, Tschandl P, Cameron A, et al. Diagnostic accuracy of dermatoscopy for melanocytic and nonmelanocytic pigmented lesions. J Am Acad Dermatol. 2011;64:1068-1073.
- Lallas A, Apalla Z, Ioannides D, et al. Dermoscopy in the diagnosis and management of basal cell carcinoma. Futur Oncol. 2015;11:2975-2984.
- Ulrich M, Lange-Asschenfeldt S, Gonzalez S. The use of reflectance confocal microscopy for monitoring response to therapy of skin malignancies. Dermatol Pract Concept. 2012;2:202a10.
- Kauvar AN, Cronin T Jr, Roenigk R, et al; American Society for Dermatologic Surgery. Consensus for nonmelanoma skin cancer treatment: basal cell carcinoma, including a cost analysis of treatment methods. Dermatol Surg. 2015;41:550-571.
- Hoorens I, Vossaert K, Ongenae K, et al. Is early detection of basal cell carcinoma worthwhile? Systematic review based on the WHO criteria for screening. Br J Dermatol. 2016;174:1258-1265.
- Levine A, Markowitz O. In vivo reflectance confocal microscopy. Cutis. 2017;99:399-402.
- Levine A, Wang K, Markowitz O. Optical coherence tomography in the diagnosis of skin cancer. Dermatol Clin. 2017;35:465-488.
- Pomerantz R, Zell D, McKenzie G, et al. Optical coherence tomography used as a modality to delineate basal cell carcinoma prior to Mohs micrographic surgery. Case Rep Dermatol. 2011;3:212-218.
- Alawi SA, Kuck M, Wahrlich C, et al. Optical coherence tomography for presurgical margin assessment of non-melanoma skin cancer - a practical approach. Exp Dermatol. 2013;22:547-551.
- Wang KX, Meekings A, Fluhr JW, et al. Optical coherence tomography-based optimization of Mohs micrographic surgery of basal cell carcinoma: a pilot study. Dermatol Surg. 2013;39:627-633.
- van Manen L, Dijkstra J, Boccara C, et al. The clinical usefulness of optical coherence tomography during cancer interventions. J Cancer Res Clin Oncol. 2018;144:1967-1990.
- Banzhaf CA, Themstrup L, Ring HC, et al. Optical coherence tomography imaging of non-melanoma skin cancer undergoing imiquimod therapy. Ski Res Technol. 2014;20:170-176.
- Markowitz O, Schwartz M. The use of noninvasive optical coherence tomography to monitor the treatment progress of vismodegib and imiquimod 5% cream in a transplant patient with advanced basal cell carcinoma of the nose. J Clin Aesthet Dermatol. 2016;9:37-41.
- Cheng HM, Guitera P. Systematic review of optical coherence tomography usage in the diagnosis and management of basal cell carcinoma. Br J Dermatol. 2015;173:1371-1380.
- Ulrich M, von Braunmuehl T, Kurzen H, et al. The sensitivity and specificity of optical coherence tomography for the assisted diagnosis of nonpigmented basal cell carcinoma: an observational study. Br J Dermatol. 2015;173:428-435.
- Markowitz O, Schwartz M, Feldman E, et al. Evaluation of optical coherence tomography as a means of identifying earlier stage basal cell carcinomas while reducing the use of diagnostic biopsy. J Clin Aesthet Dermatol. 2015;8:14-20.
- Mirza FN, Khatri KA. The use of lasers in the treatment of skin cancer: a review. J Cosmet Laser Ther. 2017;19:451-458.
- Soleymani T, Abrouk M, Kelly KM. An analysis of laser therapy for the treatment of nonmelanoma skin cancer. Dermatol Surg. 2017;43:615-624.
- Markowitz O, Tongdee E, Levine A. Optimal cosmetic outcomes for basal cell carcinoma: a retrospective study of nonablative laser management. Cutis. 2019;103:292-297.
- Jalian HR, Avram MM, Stankiewicz KJ, et al. Combined 585 nm pulsed-dye and 1,064 nm Nd:YAG lasers for the treatment of basal cell carcinoma. Lasers Surg Med. 2014;46:1-7.
- Moskalik K, Kozlov A, Demin E, et al. The efficacy of facial skin cancer treatment with high-energy pulsed neodymium and Nd:YAG lasers. Photomed Laser Surg. 2009;27:345-349.
- Moskalik K, Kozlow A, Demin E, et al. Powerful neodymium laser radiation for the treatment of facial carcinoma: 5 year follow-up data. Eur J Dermatol. 2010;20:738-742.
- Ortiz AE, Anderson RR, Avram MM. 1064 nm long-pulsed Nd:YAG laser treatment of basal cell carcinoma. Lasers Surg Med. 2015;47:106-110.
- Ortiz AE, Anderson RR, DiGiorgio C, et al. An expanded study of long-pulsed 1064 nm Nd:YAG laser treatment of basal cell carcinoma. Lasers Surg Med. 2018;50:727-731.
- Ahluwalia J, Avram MM, Ortiz AE. Outcomes of long-pulsed 1064 nm Nd:YAG laser treatment of basal cell carcinoma: a retrospective review. Lasers Surg Med. 2019;51:34-39.
- Markowitz O. A Practical Guide to Dermoscopy. Philadelphia, PA: Wolters Kluwer; 2017.
- Papakostas D, Stockfleth E. Topical treatment of basal cell carcinoma with the immune response modifier imiquimod. Futur Oncol. 2015;11:2985-2990.
- Jansen MHE, Mosterd K, Arits AHMM, et al. Five-year results of a randomized controlled trial comparing effectiveness of photodynamic therapy, topical imiquimod, and topical 5-fluorouracil in patients with superficial basal cell carcinoma. J Invest Dermatol. 2018;138:527-533.
- Kadouch DJ, Elshot YS, Zupan-Kajcovski B, et al. One-stop-shop with confocal microscopy imaging vs. standard care for surgical treatment of basal cell carcinoma: an open-label, noninferiority, randomized controlled multicentre trial. Br J Dermatol. 2017;177:735-741.
- Scrivener Y, Grosshans E, Cribier B. Variations of basal cell carcinomas according to gender, age, location and histopathological subtype. Br J Dermatol. 2002;147:41-47.
Practice Points
- Novel imaging modalities such as reflectance confocal microscopy and optical coherence tomography can be used to diagnose, monitor treatment response, and confirm clearance of basal cell carcinoma.
- Leveraging new imaging technologies can enable a streamlined patient experience, with same-day diagnosis and management of skin cancer.
- For patients who do not desire surgical management of nonmelanoma skin cancer, laser treatment with Nd:YAG is a promising emerging therapeutic option.
Millennials in Medicine: Cross-Trained Physicians Not Valued in Medical Marketplace
Millennials, defined as those born between 1981 and 1996, currently comprise 15% of all active physicians in the US.1,2 A recent survey found that nearly 4 of 5 US millennial physicians have a desire for cross-sectional work in areas beyond patient care, such as academic research, health care consulting, entrepreneurship, and health care administration.3
For employers and educators, a better understanding of these preferences, through consideration of the unique education and skill set of the millennial physician workforce, may lead to more effective recruitment of young physicians and improved health systems, avoiding a mismatch between health care provider skills and available jobs that can be costly for both employers and employees.4
This article describes how US millennial physicians are choosing to cross-train (obtaining multiple degrees and/or completing combined medical residency training) throughout undergraduate, medical, and graduate medical education. We also outline ways in which the current physician marketplace may not match the skills of this population and suggest some ways that health care organizations could capitalize on this trend toward more cross-trained personnel in order to effectively recruit and retain the next generation of physicians.
Millennial Education
Undergraduates
The number of interdisciplinary undergraduate majors increased by almost 250% from 1975 to 2000.5 In 2010, nearly 20% of US college students graduated with 2 majors, representing a 70% increase in double majors between 2001 and 2011.6,7 One emerging category of interdisciplinary majors in US colleges is health humanities programs, which have quadrupled since 2000.8
Medical school applicants and matriculants reflect this trend. Whereas in 1994, only 19% of applicants to medical school held nonscience degrees, about one-third of applicants now hold such degrees.9,10 We have found no aggregated data on double majors entering US medical schools, but public class profiles suggest that medical school matriculants mirror their undergraduate counterparts in their tendency to hold double majors. In 2016, for example, 15% of the incoming class at the University of Michigan Medical School was composed of double majors, increasing to over 25% in 2017.11
Medical Students
Early dual-degree programs in undergraduate medical training were reserved for MD/PhD programs.12 Most US MD/PhD programs (90 out of 151) now offer doctorates in social sciences, humanities, or other nontraditional fields of graduate medical study, reflecting a shift in interests of those seeking dual-degree training in undergraduate medical education.13 While only 3 MD/PhD programs in the 1970s included trainees in the social sciences, 17 such programs exist today.14
Interest in dual-degree programs offering master’s level study has also increased over the past decade. In 2017, 87 medical schools offered programs for students to pursue a master of public health (MPH) and 41 offered master of science degrees in various fields, up from 52 and 37 institutions, respectively in 2006.15 The number of schools offering combined training in nonscience fields has also grown, with 63 institutions now offering a master of business administration (MBA), nearly double the number offered in 2006.15 At some institutions more than 20% of students are earning a master’s degree or doctorate in addition to their MD degree.16
Residents
The authors found no documentation of US residency training programs, outside of those in the specialty of preventive medicine, providing trainees with formal opportunities to obtain an MBA or MPH prior to 2001.17 However, of the 510 internal medicine residency programs listed on the American Medical Association residency and fellowship database (freida.ama-assn.org), 45 identified as having established a pathway for residents to pursue an MBA, MPH, or PhD during residency.18
Over the past 20 years, combined residency programs have increased 49% (from 128 to 191), which is triple the 16% rate (1,350 to 1,562) of increase in programs in internal medicine, pediatrics, family medicine, psychiatry, and emergency medicine.19,20 A 2009 moratorium on the creation of new combined residency programs in psychiatry and neurology was lifted in 2016and is likely to increase the rate of total combined programs.21
The Table shows the number of categorical and combined residency programs available in 1996 and in 2016. Over 2 decades, 17 new specialty combinations became available for residency training. While there were no combined training programs within these 17 new combinations in 1996,there were 66 programs with these combinations in 2016.19,20
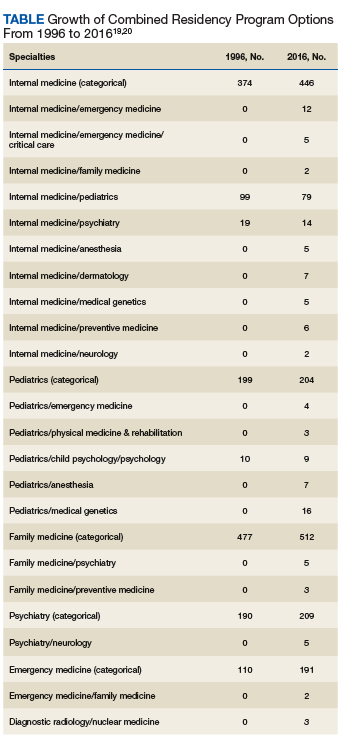
Although surgical specialties are notably absent from the list of combined residency options, likely due to the duration of surgical training, some surgical training programs do offer pathways that culminate in combined degrees,22 and a high number of surgery program directors agree that residents should receive formal training in business and practice management.23
The Medical Job Market
Although today’s young physicians are cross-trained in multiple disciplines, the current job market may not directly match these skill sets. Of the 7,235 jobs listed by the New England Journal of Medicine (NEJM) career center (www.nejmcareercenter.org/jobs), only 54 were targeted at those with combined training, the majority of which were aimed at those trained in internal medicine/pediatrics. Of the combined specialties in the Table, formal positions were listed for only 6.24 A search of nearly 1,500 federal medical positions on USAJOBS (www.usajobs.gov) found only 4 jobs that combined specialties, all restricted to internal medicine/pediatrics.25 When searching for jobs containing the terms MBA, MPH, and public health there were only 8 such positions on NEJM and 7 on USAJOBS.24,25 Although the totality of the medical marketplace may not be best encompassed by these sources, the authors believe NEJM and USAJOBS are somewhat representative of the opportunities for physicians in the US.
Medical jobs tailored to cross-trained physicians do not appear to have kept pace with the numbers of such specialists currently in medical school and residency training. Though millennials are cross-training in increasing numbers, we surmise that they are not doing so as a direct result of the job market.
Future Medicine
Regardless of the mismatch between cross-trained physicians and the current job market, millennials may be well suited for future health systems. In 2001, the National Academies of Sciences, Engineering and Medicine (NASEM) called for increasing interdisciplinary training and improving cross-functional team performance as a major goal for health care providers in twenty-first century health systems.26 NASEM also recommended that academic medical centers develop medical leaders who can manage systems changes required to enhance health, a proposal supported by the fact that hospitals with medically trained CEOs outperform others.27,28
Public Health 3.0, a federal initiative to improve and integrate public health efforts, also emphasizes cross-disciplinary teams and cross-sector partnerships,29 while the Centers for Medicare and Medicaid Services (CMS) has incentivized the development of interprofessional health care teams.30 While cross-training does not automatically connote interdisciplinary training, we believe that cross-training may reveal or develop an interdisciplinary mind-set that may support and embrace interdisciplinary performance. Finally, the US Department of Health and Human Services’ (HHS) Strategic Goals emphasize integrated care for vulnerable populations, something that cross-trained physicians may be especially poised to accomplish.31
A Path Forward
The education, training, and priorities of young physicians demonstrates career interests that diverge from mainstream, traditional options. Data provided herein describe the increasing rates at which millennial physicians are cross-training and have suggested that the current marketplace may not match the interests of this population. The ultimate question is where such cross-trained physicians fit into today’s (or tomorrow’s) health system?
It may be easiest to deploy cross-trained physicians in their respective clinical departments (eg, having a physician trained in internal medicine and pediatrics perform clinical duties in both a medicine department and a pediatrics department). But < 40% of dual-boarded physicians practice both specialties in which they’re trained, so other opportunities should be pursued.32,33 One strategy may be to embrace the promise of interdisciplinary care, as supported by Public Health 3.0 and NASEM.26,29 Our evidence may demonstrate that the interdisciplinary mind-set may be more readily evident in the millennial generation, and that this mind-set may improve interdisciplinary care.
As health is impacted both by direct clinical care as well as programs designed to address population health, cross-trained physicians may be better equipped to integrate aspects of clinical care spanning a variety of clinical fields as well as orchestrating programs designed to improve health at the population level. This mind-set may be best captured by organizations willing to adapt their medical positions to emphasize multidisciplinary training, skills, and capabilities. For example, a physician trained in internal medicine and psychiatry may have the unique training and skill-set to establish an integrated behavioral health clinic that crosses boundaries between traditional departments, emphasizing the whole health of the clinic’s population and not simply focusing on providing services of a particular specialty. Hiring cross-trained physicians throughout such a clinic may benefit the operations of the clinic and improve not only the services provided, but ultimately, the health of that clinic’s patients. By embracing cross-trained physicians, health care organizations and educators may better meet the needs of their employees, likely resulting in a more cost-effective investment for employers, employees, and the health system as a whole.4 Additionally, patient health may also improve.
There is evidence that cross-trained physicians are already likely to hold leadership positions compared with their categorically-trained counterparts, and this may reflect the benefits of an interdisciplinary mind-set.33 Perhaps a cross-trained physician is more likely to see beyond standard, specialty-based institutional barriers and develop processes and programs designed for overall patient benefit. Leadership is a skill that many millennials clearly wish to enhance throughout their career.34 Recruiting cross-trained physicians for leadership positions may reveal synergies between such training and an ability to lead health care organizations into the future.
Many millennial physicians are bringing a new set of skills into the medical marketplace. Health organizations should identify ways to recruit for these skills and deploy them within their systems in order to have more dedicated, engaged employees, more effective health systems, and ultimately, healthier patients.
Acknowledgments
Data from this analysis were presented at the 10th Consortium of Universities for Global Health conference in 2019.35
1. Dimock M. Defining generations: where millennials end and generation Z begins. http://www.pewresearch.org/fact-tank/2018/03/01/defining-generations-where-millennials-end-and-post-millennials-begin/. Published January 17, 2019. Accessed November 7, 2019.
2. IHS Inc. The complexities of physician supply and demand: projections from 2014 to 2025. Final report. https://www.modernhealthcare.com/assets/pdf/CH10888123.pdf. Published April 5, 2016. Accessed November 7, 2019.
3. Miller RN. Millennial physicians sound off on state of medicine today. https://wire.ama-assn.org/life-career/millennial-physicians-sound-state-medicine-today. Published March 27, 2017. Accessed November 7, 2019.
4. World Economic Forum. Matching skills and labour market needs: building social partnerships for better skills and better jobs. http://www3.weforum.org/docs/GAC/2014/WEF_GAC_Employment_MatchingSkillsLabourMarket_Report_2014.pdf. Published January 2014. Accessed November 7, 2019.
5. Brint SG, Turk-Bicakci L, Proctor K, Murphy SP. Expanding the social frame of knowledge: interdisciplinary, degree-granting fields in American Colleges and Universities, 1975–2000. Rev High Ed. 2009;32(2):155-183.
6. National Science Foundation. National survey of college graduates. https://www.nsf.gov/statistics/srvygrads. Updated February 2019. Accessed November 7, 2019.
7. Simon CC. Major decisions. New York Times. November 2, 2012. http://www.nytimes.com/2012/11/04/education/edlife/choosing-one-college-major-out-of-hundreds.html. Accessed November 7, 2019.
8. Berry SL, Erin GL, Therese J. Health humanities baccalaureate programs in the United States. http://www.hiram.edu/wp-content/uploads/2017/09/HHBP2017.pdf. Published September 2017. Accessed November 7, 2019.
9. Sorensen NE, Jackson JR. Science majors and nonscience majors entering medical school: acceptance rates and academic performance. NACADA J. 1997;17(1):32-41.
10. Association of American Medical Colleges. Table A-17: MCAT and GPAs for applicants and matriculants to U.S. medical schools by primary undergraduate major, 2019-2020. https://www.aamc.org/download/321496/data/factstablea17.pdf. Published October 16, 2019. Accessed November 7, 2019.
11. University of Michigan Medical School. Many paths, one destination: medical school welcomes its 170th class of medical students. https://medicine.umich.edu/medschool/news/many-paths-one-destination-medical-school-welcomes-its-170th-class-medical-students. Updated July 29, 2016. Accessed November 7, 2019.
12. Harding CV, Akabas MH, Andersen OS. History and outcomes of 50 years of physician-scientist training in medical scientist training programs. Acad Med. 2017; 92(10):1390-1398.
13. Association of American Medical Colleges. MD-PhD in “social sciences or humanities” and “other non-traditional fields of graduate study” - by school. https://students-residents.aamc.org/choosing-medical-career/careers-medical-research/md-phd-dual-degree-training/non-basic-science-phd-training-school/. Accessed November 8, 2019.
14. Holmes SM, Karlin J, Stonington SD, Gottheil DL. The first nationwide survey of MD-PhDs in the social sciences and humanities: training patterns and career choices. BMC Med Educ. 2017;17(1):60.
15. Association of American Medical Colleges Combined degrees and early acceptance programs. https://www.aamc.org/data-reports/curriculum-reports/interactive-data/combined-degrees-and-early-acceptance-programs. Accessed November 8, 2019.
16. Tufts University School of Medicine. 2023 class profile. http://medicine.tufts.edu/Education/MD-Programs/Doctor-of-Medicine/Class-Profile. Published 2015. Accessed November 8, 2019.
17. Zweifler J, Evan R. Development of a residency/MPH program. Family Med. 2001;33(6):453-458.
18. American Medical Association. The AMA residency and fellowship database. http://freida.ama-assn.org/Freida. Accessed November 7, 2019.
19. National Resident Matching Program. NRMP data. http://www.nrmp.org/wp-content/uploads/2013/08/resultsanddata1996.pdf. Published March 1996. Accessed November 7, 2019.
20. Brotherton SE, Etzel SI. Graduate medical education, 2016-2017. JAMA. 2017;318(23):2368-2387.
21. American Board of Psychiatry and Neurology. Update for psychiatry GME programs on combined training program accreditation/approval February 2012. https://www.umassmed.edu/globalassets/neuropsychiatry/files/combined-program-letter.pdf. Accessed November 7, 2019.
22. Massachusetts General Hospital. Surgical residency program. https://www.massgeneral.org/surgery/education/residency.aspx?id=77. Accessed November 7, 2019.
23. Lusco VC, Martinez SA, Polk HC Jr. Program directors in surgery agree that residents should be formally trained in business and practice management. Am J Surg. 2005;189(1):11-13.
24. New England Journal of Medicine. NEJM CareerCenter. http://www.nejmcareercenter.org. Accessed November 7, 2019.
25. US Office of Personnel Management. USAJOBS. https://www.usajobs.gov. Accessed November 7, 2019.
26. Institute of Medicine. Crossing the quality chasm: a new health system for the 21st century. http://www.nationalacademies.org/hmd/~/media/Files/Report%20Files/2001/Crossing-the-Quality-Chasm/Quality%20Chasm%202001%20%20report%20brief.pdf. Published March 2001. Accessed November 7, 2019.
27. Kohn LT, ed; Committee on the Roles of Academic Health Centers in the 21st Century; Institute of Medicine of the National Academies. Academic Health Centers: Leading Change in the 21st Century. National Academy Press: Washington, DC; 2004.
28. Goodall AH. Physician-leaders and hospital performance: is there an association? http://ftp.iza.org/dp5830.pdf. Published July 2011. Accessed November 7, 2019.
29. US Department of Health and Human Services, Office of the Assistant Secretary for Health. Public health 3.0: a call to action to create a 21st century public health infrastructure. https://www.healthypeople.gov/sites/default/files/Public-Health-3.0-White-Paper.pdf. Accessed November 7, 2019.
30. Centers for Medicare and Medicaid Services. Health care innovation awards round one project profiles. http://innovation.cms.gov/files/x/hcia-project-profiles.pdf. Updated December 2013. Accessed November 7, 2019.
31. US Department of Health and Human Services. Strategic Objective 1.3: Improve Americans’ access to healthcare and expand choices of care and service options. https://www.hhs.gov/about/strategic-plan/strategic-goal-1/index.html#obj_1_3. Updated March 18, 2019. Accessed November 7, 2019.
32. Kessler CS, Stallings LA, Gonzalez AA, Templeman TA. Combined residency training in emergency medicine and internal medicine: an update on career outcomes and job satisfaction. Acad Emerg Med. 2009;16(9):894-899.
33. Summergrad P, Silberman E, Price LL. Practice and career outcomes of double-boarded psychiatrists. Psychosomatics. 2011;52(6):537-543.
34. Rigoni B, Adkins A. What millennials want from a new job. Harvard Business Rev. May 11, 2016. https://hbr.org/2016/05/what-millennials-want-from-a-new-job. Accessed November 7, 2019.
35. Jung P, Smith C. Medical millennials: a mismatch between training preferences and employment opportunities. Lancet Glob Health. 2019;7(suppl 1):S38.
Millennials, defined as those born between 1981 and 1996, currently comprise 15% of all active physicians in the US.1,2 A recent survey found that nearly 4 of 5 US millennial physicians have a desire for cross-sectional work in areas beyond patient care, such as academic research, health care consulting, entrepreneurship, and health care administration.3
For employers and educators, a better understanding of these preferences, through consideration of the unique education and skill set of the millennial physician workforce, may lead to more effective recruitment of young physicians and improved health systems, avoiding a mismatch between health care provider skills and available jobs that can be costly for both employers and employees.4
This article describes how US millennial physicians are choosing to cross-train (obtaining multiple degrees and/or completing combined medical residency training) throughout undergraduate, medical, and graduate medical education. We also outline ways in which the current physician marketplace may not match the skills of this population and suggest some ways that health care organizations could capitalize on this trend toward more cross-trained personnel in order to effectively recruit and retain the next generation of physicians.
Millennial Education
Undergraduates
The number of interdisciplinary undergraduate majors increased by almost 250% from 1975 to 2000.5 In 2010, nearly 20% of US college students graduated with 2 majors, representing a 70% increase in double majors between 2001 and 2011.6,7 One emerging category of interdisciplinary majors in US colleges is health humanities programs, which have quadrupled since 2000.8
Medical school applicants and matriculants reflect this trend. Whereas in 1994, only 19% of applicants to medical school held nonscience degrees, about one-third of applicants now hold such degrees.9,10 We have found no aggregated data on double majors entering US medical schools, but public class profiles suggest that medical school matriculants mirror their undergraduate counterparts in their tendency to hold double majors. In 2016, for example, 15% of the incoming class at the University of Michigan Medical School was composed of double majors, increasing to over 25% in 2017.11
Medical Students
Early dual-degree programs in undergraduate medical training were reserved for MD/PhD programs.12 Most US MD/PhD programs (90 out of 151) now offer doctorates in social sciences, humanities, or other nontraditional fields of graduate medical study, reflecting a shift in interests of those seeking dual-degree training in undergraduate medical education.13 While only 3 MD/PhD programs in the 1970s included trainees in the social sciences, 17 such programs exist today.14
Interest in dual-degree programs offering master’s level study has also increased over the past decade. In 2017, 87 medical schools offered programs for students to pursue a master of public health (MPH) and 41 offered master of science degrees in various fields, up from 52 and 37 institutions, respectively in 2006.15 The number of schools offering combined training in nonscience fields has also grown, with 63 institutions now offering a master of business administration (MBA), nearly double the number offered in 2006.15 At some institutions more than 20% of students are earning a master’s degree or doctorate in addition to their MD degree.16
Residents
The authors found no documentation of US residency training programs, outside of those in the specialty of preventive medicine, providing trainees with formal opportunities to obtain an MBA or MPH prior to 2001.17 However, of the 510 internal medicine residency programs listed on the American Medical Association residency and fellowship database (freida.ama-assn.org), 45 identified as having established a pathway for residents to pursue an MBA, MPH, or PhD during residency.18
Over the past 20 years, combined residency programs have increased 49% (from 128 to 191), which is triple the 16% rate (1,350 to 1,562) of increase in programs in internal medicine, pediatrics, family medicine, psychiatry, and emergency medicine.19,20 A 2009 moratorium on the creation of new combined residency programs in psychiatry and neurology was lifted in 2016and is likely to increase the rate of total combined programs.21
The Table shows the number of categorical and combined residency programs available in 1996 and in 2016. Over 2 decades, 17 new specialty combinations became available for residency training. While there were no combined training programs within these 17 new combinations in 1996,there were 66 programs with these combinations in 2016.19,20
Although surgical specialties are notably absent from the list of combined residency options, likely due to the duration of surgical training, some surgical training programs do offer pathways that culminate in combined degrees,22 and a high number of surgery program directors agree that residents should receive formal training in business and practice management.23
The Medical Job Market
Although today’s young physicians are cross-trained in multiple disciplines, the current job market may not directly match these skill sets. Of the 7,235 jobs listed by the New England Journal of Medicine (NEJM) career center (www.nejmcareercenter.org/jobs), only 54 were targeted at those with combined training, the majority of which were aimed at those trained in internal medicine/pediatrics. Of the combined specialties in the Table, formal positions were listed for only 6.24 A search of nearly 1,500 federal medical positions on USAJOBS (www.usajobs.gov) found only 4 jobs that combined specialties, all restricted to internal medicine/pediatrics.25 When searching for jobs containing the terms MBA, MPH, and public health there were only 8 such positions on NEJM and 7 on USAJOBS.24,25 Although the totality of the medical marketplace may not be best encompassed by these sources, the authors believe NEJM and USAJOBS are somewhat representative of the opportunities for physicians in the US.
Medical jobs tailored to cross-trained physicians do not appear to have kept pace with the numbers of such specialists currently in medical school and residency training. Though millennials are cross-training in increasing numbers, we surmise that they are not doing so as a direct result of the job market.
Future Medicine
Regardless of the mismatch between cross-trained physicians and the current job market, millennials may be well suited for future health systems. In 2001, the National Academies of Sciences, Engineering and Medicine (NASEM) called for increasing interdisciplinary training and improving cross-functional team performance as a major goal for health care providers in twenty-first century health systems.26 NASEM also recommended that academic medical centers develop medical leaders who can manage systems changes required to enhance health, a proposal supported by the fact that hospitals with medically trained CEOs outperform others.27,28
Public Health 3.0, a federal initiative to improve and integrate public health efforts, also emphasizes cross-disciplinary teams and cross-sector partnerships,29 while the Centers for Medicare and Medicaid Services (CMS) has incentivized the development of interprofessional health care teams.30 While cross-training does not automatically connote interdisciplinary training, we believe that cross-training may reveal or develop an interdisciplinary mind-set that may support and embrace interdisciplinary performance. Finally, the US Department of Health and Human Services’ (HHS) Strategic Goals emphasize integrated care for vulnerable populations, something that cross-trained physicians may be especially poised to accomplish.31
A Path Forward
The education, training, and priorities of young physicians demonstrates career interests that diverge from mainstream, traditional options. Data provided herein describe the increasing rates at which millennial physicians are cross-training and have suggested that the current marketplace may not match the interests of this population. The ultimate question is where such cross-trained physicians fit into today’s (or tomorrow’s) health system?
It may be easiest to deploy cross-trained physicians in their respective clinical departments (eg, having a physician trained in internal medicine and pediatrics perform clinical duties in both a medicine department and a pediatrics department). But < 40% of dual-boarded physicians practice both specialties in which they’re trained, so other opportunities should be pursued.32,33 One strategy may be to embrace the promise of interdisciplinary care, as supported by Public Health 3.0 and NASEM.26,29 Our evidence may demonstrate that the interdisciplinary mind-set may be more readily evident in the millennial generation, and that this mind-set may improve interdisciplinary care.
As health is impacted both by direct clinical care as well as programs designed to address population health, cross-trained physicians may be better equipped to integrate aspects of clinical care spanning a variety of clinical fields as well as orchestrating programs designed to improve health at the population level. This mind-set may be best captured by organizations willing to adapt their medical positions to emphasize multidisciplinary training, skills, and capabilities. For example, a physician trained in internal medicine and psychiatry may have the unique training and skill-set to establish an integrated behavioral health clinic that crosses boundaries between traditional departments, emphasizing the whole health of the clinic’s population and not simply focusing on providing services of a particular specialty. Hiring cross-trained physicians throughout such a clinic may benefit the operations of the clinic and improve not only the services provided, but ultimately, the health of that clinic’s patients. By embracing cross-trained physicians, health care organizations and educators may better meet the needs of their employees, likely resulting in a more cost-effective investment for employers, employees, and the health system as a whole.4 Additionally, patient health may also improve.
There is evidence that cross-trained physicians are already likely to hold leadership positions compared with their categorically-trained counterparts, and this may reflect the benefits of an interdisciplinary mind-set.33 Perhaps a cross-trained physician is more likely to see beyond standard, specialty-based institutional barriers and develop processes and programs designed for overall patient benefit. Leadership is a skill that many millennials clearly wish to enhance throughout their career.34 Recruiting cross-trained physicians for leadership positions may reveal synergies between such training and an ability to lead health care organizations into the future.
Many millennial physicians are bringing a new set of skills into the medical marketplace. Health organizations should identify ways to recruit for these skills and deploy them within their systems in order to have more dedicated, engaged employees, more effective health systems, and ultimately, healthier patients.
Acknowledgments
Data from this analysis were presented at the 10th Consortium of Universities for Global Health conference in 2019.35
1. Dimock M. Defining generations: where millennials end and generation Z begins. http://www.pewresearch.org/fact-tank/2018/03/01/defining-generations-where-millennials-end-and-post-millennials-begin/. Published January 17, 2019. Accessed November 7, 2019.
2. IHS Inc. The complexities of physician supply and demand: projections from 2014 to 2025. Final report. https://www.modernhealthcare.com/assets/pdf/CH10888123.pdf. Published April 5, 2016. Accessed November 7, 2019.
3. Miller RN. Millennial physicians sound off on state of medicine today. https://wire.ama-assn.org/life-career/millennial-physicians-sound-state-medicine-today. Published March 27, 2017. Accessed November 7, 2019.
4. World Economic Forum. Matching skills and labour market needs: building social partnerships for better skills and better jobs. http://www3.weforum.org/docs/GAC/2014/WEF_GAC_Employment_MatchingSkillsLabourMarket_Report_2014.pdf. Published January 2014. Accessed November 7, 2019.
5. Brint SG, Turk-Bicakci L, Proctor K, Murphy SP. Expanding the social frame of knowledge: interdisciplinary, degree-granting fields in American Colleges and Universities, 1975–2000. Rev High Ed. 2009;32(2):155-183.
6. National Science Foundation. National survey of college graduates. https://www.nsf.gov/statistics/srvygrads. Updated February 2019. Accessed November 7, 2019.
7. Simon CC. Major decisions. New York Times. November 2, 2012. http://www.nytimes.com/2012/11/04/education/edlife/choosing-one-college-major-out-of-hundreds.html. Accessed November 7, 2019.
8. Berry SL, Erin GL, Therese J. Health humanities baccalaureate programs in the United States. http://www.hiram.edu/wp-content/uploads/2017/09/HHBP2017.pdf. Published September 2017. Accessed November 7, 2019.
9. Sorensen NE, Jackson JR. Science majors and nonscience majors entering medical school: acceptance rates and academic performance. NACADA J. 1997;17(1):32-41.
10. Association of American Medical Colleges. Table A-17: MCAT and GPAs for applicants and matriculants to U.S. medical schools by primary undergraduate major, 2019-2020. https://www.aamc.org/download/321496/data/factstablea17.pdf. Published October 16, 2019. Accessed November 7, 2019.
11. University of Michigan Medical School. Many paths, one destination: medical school welcomes its 170th class of medical students. https://medicine.umich.edu/medschool/news/many-paths-one-destination-medical-school-welcomes-its-170th-class-medical-students. Updated July 29, 2016. Accessed November 7, 2019.
12. Harding CV, Akabas MH, Andersen OS. History and outcomes of 50 years of physician-scientist training in medical scientist training programs. Acad Med. 2017; 92(10):1390-1398.
13. Association of American Medical Colleges. MD-PhD in “social sciences or humanities” and “other non-traditional fields of graduate study” - by school. https://students-residents.aamc.org/choosing-medical-career/careers-medical-research/md-phd-dual-degree-training/non-basic-science-phd-training-school/. Accessed November 8, 2019.
14. Holmes SM, Karlin J, Stonington SD, Gottheil DL. The first nationwide survey of MD-PhDs in the social sciences and humanities: training patterns and career choices. BMC Med Educ. 2017;17(1):60.
15. Association of American Medical Colleges Combined degrees and early acceptance programs. https://www.aamc.org/data-reports/curriculum-reports/interactive-data/combined-degrees-and-early-acceptance-programs. Accessed November 8, 2019.
16. Tufts University School of Medicine. 2023 class profile. http://medicine.tufts.edu/Education/MD-Programs/Doctor-of-Medicine/Class-Profile. Published 2015. Accessed November 8, 2019.
17. Zweifler J, Evan R. Development of a residency/MPH program. Family Med. 2001;33(6):453-458.
18. American Medical Association. The AMA residency and fellowship database. http://freida.ama-assn.org/Freida. Accessed November 7, 2019.
19. National Resident Matching Program. NRMP data. http://www.nrmp.org/wp-content/uploads/2013/08/resultsanddata1996.pdf. Published March 1996. Accessed November 7, 2019.
20. Brotherton SE, Etzel SI. Graduate medical education, 2016-2017. JAMA. 2017;318(23):2368-2387.
21. American Board of Psychiatry and Neurology. Update for psychiatry GME programs on combined training program accreditation/approval February 2012. https://www.umassmed.edu/globalassets/neuropsychiatry/files/combined-program-letter.pdf. Accessed November 7, 2019.
22. Massachusetts General Hospital. Surgical residency program. https://www.massgeneral.org/surgery/education/residency.aspx?id=77. Accessed November 7, 2019.
23. Lusco VC, Martinez SA, Polk HC Jr. Program directors in surgery agree that residents should be formally trained in business and practice management. Am J Surg. 2005;189(1):11-13.
24. New England Journal of Medicine. NEJM CareerCenter. http://www.nejmcareercenter.org. Accessed November 7, 2019.
25. US Office of Personnel Management. USAJOBS. https://www.usajobs.gov. Accessed November 7, 2019.
26. Institute of Medicine. Crossing the quality chasm: a new health system for the 21st century. http://www.nationalacademies.org/hmd/~/media/Files/Report%20Files/2001/Crossing-the-Quality-Chasm/Quality%20Chasm%202001%20%20report%20brief.pdf. Published March 2001. Accessed November 7, 2019.
27. Kohn LT, ed; Committee on the Roles of Academic Health Centers in the 21st Century; Institute of Medicine of the National Academies. Academic Health Centers: Leading Change in the 21st Century. National Academy Press: Washington, DC; 2004.
28. Goodall AH. Physician-leaders and hospital performance: is there an association? http://ftp.iza.org/dp5830.pdf. Published July 2011. Accessed November 7, 2019.
29. US Department of Health and Human Services, Office of the Assistant Secretary for Health. Public health 3.0: a call to action to create a 21st century public health infrastructure. https://www.healthypeople.gov/sites/default/files/Public-Health-3.0-White-Paper.pdf. Accessed November 7, 2019.
30. Centers for Medicare and Medicaid Services. Health care innovation awards round one project profiles. http://innovation.cms.gov/files/x/hcia-project-profiles.pdf. Updated December 2013. Accessed November 7, 2019.
31. US Department of Health and Human Services. Strategic Objective 1.3: Improve Americans’ access to healthcare and expand choices of care and service options. https://www.hhs.gov/about/strategic-plan/strategic-goal-1/index.html#obj_1_3. Updated March 18, 2019. Accessed November 7, 2019.
32. Kessler CS, Stallings LA, Gonzalez AA, Templeman TA. Combined residency training in emergency medicine and internal medicine: an update on career outcomes and job satisfaction. Acad Emerg Med. 2009;16(9):894-899.
33. Summergrad P, Silberman E, Price LL. Practice and career outcomes of double-boarded psychiatrists. Psychosomatics. 2011;52(6):537-543.
34. Rigoni B, Adkins A. What millennials want from a new job. Harvard Business Rev. May 11, 2016. https://hbr.org/2016/05/what-millennials-want-from-a-new-job. Accessed November 7, 2019.
35. Jung P, Smith C. Medical millennials: a mismatch between training preferences and employment opportunities. Lancet Glob Health. 2019;7(suppl 1):S38.
Aging and Trauma: Post Traumatic Stress Disorder Among Korean War Veterans
The Korean War lasted from June 25, 1950 through July 27, 1953. Although many veterans of the Korean War experienced traumas during extremely stressful combat conditions. However, they would not have been diagnosed with posttraumatic stress disorder (PTSD) at the time because the latter did not exist as a formal diagnosis until the publication of the third edition of the Diagnostic and Statistical Manual (DSM) in 1980.1 Prior to 1980, psychiatric syndromes resulting from war and combat exposure where known by numerous other terms including shell shock, chronic traumatic war neurosis, and combat fatigue/combat exhaustion.2,3 Military psychiatrists attended to combat fatigue during the course of the Korean War, but as was true of World War I and II, the focus was on returning soldiers to duty. Combat fatigue was generally viewed as a transient condition.4-8
Although now octo- and nonagenarians, in 2019 there are 1.2 million living Korean War veterans in the US, representing 6.7% of all current veterans.9 Understanding their war experiences and the nature of their current and past presentation of PTSD is relevant not only in formal mental health settings, but in primary care settings, including home-based primary care, as well as community living centers, skilled nursing facilities and assisted living facilities. Older adults with PTSD often present with somatic concerns rather than spontaneously reporting mental health symptoms.10 Beyond the short-term clinical management of Korean War veterans with PTSD, consideration of their experiences also has long-term relevance for the appropriate treatment of other veteran cohorts as they age in coming decades.
The purpose of this article is to provide a clinically focused overview of PTSD in Korean War veterans, to help promote understanding of this often-forgotten group of veterans, and to foster optimized personalized care. This overview will include a description of the Korean War veteran population and the Korean War itself, the manifestations and identification of PTSD among Korean War veterans, and treatment approaches using evidence-based psychotherapies and pharmacotherapies. Finally, we provide recommendations for future research to address present empirical gaps in the understanding and treatment of Korean War veterans with PTSD.
Causes and Course of the Korean War
When working with Korean War veterans it is important to consider the special nature of that specific conflict. Space considerations limit our ability to do justice to the complex history and numerous battles of the Korean War, but information in the following summary was gleaned from several excellent histories.11-13
The Korean War has been referred to as The Forgotten War, a concern expressed even during the latter parts of the war.14,15 But the war and its veterans warrant remembering. The root and proximal causes of the Korean War are complex and not fully agreed upon by the main participants.16-19 In part this may reflect the fact that there was no clear victor in the Korean War, so that the different protagonists have developed their own versions of the history of the conflict. Also, US involvement and the public reaction to the war must be viewed within the larger historical context of that time. This context included the recent end of 4 years of US involvement in World War II (1941-1945) and the subsequent rapid rise of Cold War tensions between the US and the Soviet Union. The latter also included a worldwide fear of nuclear war and the US fear of the global spread of communism. These fears were fueled by the Soviet-led Berlin Blockade from June 1948 through May 1949, the Soviet Union’s successful atomic bomb test in August 1949, the founding of the People’s Republic of China in October 1949, and the February 1950 Sino-Soviet Treaty of Friendship and Alliance.13
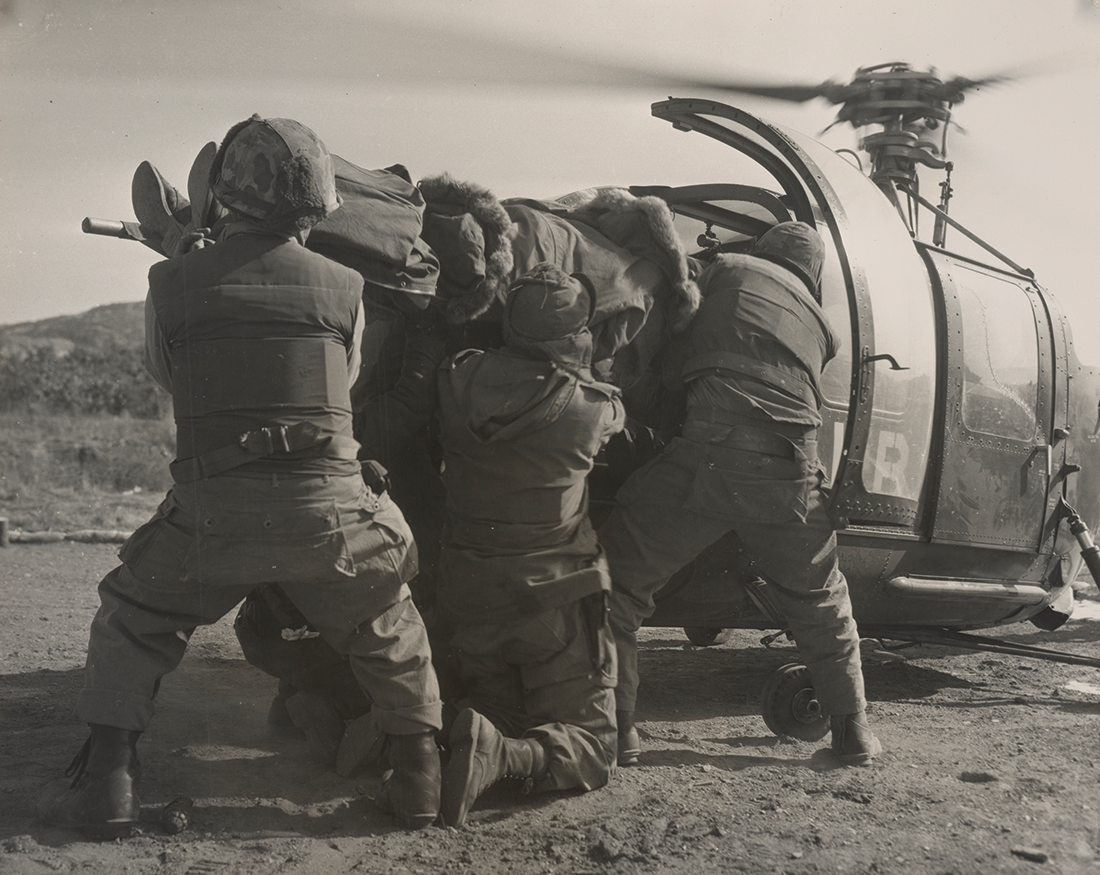
In the closing days of World War II, the US and Soviet Union agreed to a temporary division of Korea along the 38th parallel to facilitate timely and efficient surrender of Japanese troops. But as Cold War tensions rose, the temporary division became permanent, and Soviet- and US-backed governments of the north and south, respectively, were officially established on the Korean peninsula in 1948. Although by 1949 the Soviets and US had withdrawn most troops from the peninsula, tensions between the north and south continued to mount and hostilities increased. To this day the exact causes of the eruption of war remain disputed, although it is clear that ideological as well as economic factors played a role, and both leaders of North and South Korea were pledging to reunite the peninsula under their respective leadership.16-19 The tension culminated on June 25, 1950, when North Korean troops crossed the 38th parallel and invaded South Korea. On June 27, 1950, President Truman ordered US naval and air forces to support South Korea and then ordered the involvement of ground troops on June 30.16,17,19
Although several other member countries of the United Nations (UN) provided troops, 90% of the troops were from the US. About 5.7 million US military personnel served during the war, including about 1.8 million in Korea itself. The US forces experienced approximately 34,000 battle-related deaths, 103,000 were wounded, and 7,000 were prisoners of war (POWs).11,20-22 The nature and events of the Korean War made it particularly stressful and traumatizing for the soldiers, sailors, and marines involved throughout its entire course. These included near defeat in the early months, a widely alternating war front along the north/south axis during the first year, and subsequently, not only intense constant battles on the fronts, but also a demanding and exhausting guerrilla war in the south, which lasted throughout the remainder of the conflict.11,15 The US troops during the initial months of the war have been described as outnumbered and underprepared, as many in the initial phase were reassigned from peace-time occupation duty in Japan.7
The first year of war was characterized by a repeated north-to-south/south-to-north shifts in control of territory. During the first 3 months, the North Korean forces overwhelmed the South and captured control of all but 2 South Korean cities in the far southeastern region (Pusan, now Busan; and Daegu), and US and UN forces were forced to retreat to the perimeter around Pusan. The intense Battle of Pusan Perimeter lasted from August 4, 1950 to September 18, 1950, and resulted in massive causalities as well as a flood of civilian refugees.
The course of the war began to change in early September 1950 with the landing of amphibious US/UN forces at Inchon, behind North Korean lines, which cut off southern supply routes for the North Korean troops.11 US/UN forces soon crossed to the north of the 38th parallel and captured the North Korean capital, Pyongyang, on October 19, 1950. They continued to push north and approached the Yalu River border with China by late November 1950, but then the Chinese introduced their own troops forcing a southward retreat of US/UN troops during which there were again numerous US/UN casualties. Chinese troops retook Seoul in late December 1950/early January 1951. However, the US/UN forces soon recaptured Seoul and advanced back to the 38th parallel. This back-and-forth across the 38th parallel continued until July 1951 when the front line of battle stabilized there. Although the line stabilized, intense battles and casualties continued for 2 more years. During this period US/UN troops also had to deal with guerrilla warfare behind the front lines due to the actions of communist partisans and isolated North Korean troops. This situation continued until the armistice was signed July 27, 1953.
Trauma and Characteristic Stresses of the War
There were many factors that made the Korean War experience different from previous wars, particularly World War II. For example, in contrast to the strong public support during and after World War II, public support for the Korean War in the US was low, particularly during its final year.23 In public opinion polls from October 1952 through April 1953, only 23% to 39% reported feeling that the war was worth fighting.23 A retrospective 1985 survey also found that 70% of World War II veterans, but only 33% of Korean War veterans reported feeling appreciated by the US public on their return from the war.24
Those fighting in the initial months of the war faced a particularly grim situation. According to LTC Philip Smith, who served as Division Psychiatrist on the Masan Front (Pusan Perimeter) during August and September of 1950, “Fighting was almost continuous and all available troops were on the fighting front… For the most part these soldiers were soft from occupation duty, many had not received adequate combat basic training, no refresher combat training in Korea had as yet been instituted,” he reported.7 “The extremes of climate coupled with the generally rugged mountainous terrain in Korea were physical factors of importance…These men were psychologically unprepared for the horrors and isolation of war.” LTC Smith noted that the change in status from civilian or occupation life to the marked deprivation of the war in Korea had been “too abrupt to allow as yet for a reasonable adjustment to the new setting” and that as a result “the highest rate of wounded and neuropsychiatric casualties in the Korean campaign resulted.”7

Even after this initial period, the nature of the shifting war, the challenging terrain, the high military casualty rate, and the high rate of civilian casualties and displacement continued throughout the war.
PTSD in Korean War Veterans
It is clear that Korean War combat veterans were exposed to traumatic events. It is unknown how many developed PTSD. While notions of psychological distress and disability related to combat trauma exposure have existed for centuries, Korean War and World War II veterans are a remaining link to pre-DSM PTSD mental health in the military. Military/forward psychiatry—psychiatric services near the battle zone rather than requiring evacuation of patients—was present in Korea from the early months of the war, but the focus of forward psychiatry was to reduce psychiatric causalities from combat fatigue and maximize rapid return-to-duty.4-6 With no real conception of PTSD, there were limited treatments available, and evidenced-based trauma-focused treatments for PTSD would not be introduced for at least another 4 decades.27-29
Skinner and Kaplick conducted a historical review of case descriptions of trauma-related conditions from World War I through the Vietnam War and noted the consistent inclusion of hyperarousal and intrusive symptoms, although there also was a greater emphasis on somatic conversion or hysteria symptoms in the earlier descriptions.30 By the Korean War, descriptions of combat fatigue included a number of symptoms that overlap with PTSD, including preoccupation with the traumatic stressor, nightmares, irritability/anger, increased startle, and hyperarousal.31 But following the acute phases, attention to any chronic problems associated with these conditions waned. As was acknowledged by a military psychiatrist in a 1954 talk, studies of the long-term adjustment of those who had “broken down in combat” were sorely needed.6 In a small 1965 study reported by Archibald and Tuddenham, persistent symptoms of combat fatigue among Korean War veterans were definitely present, and there was even a suggestion that the symptoms had increased over the decade since the war.32
Given the stoicism that typified cultural expectations for military men during this period, Korean War veterans may also have been reluctant to seek mental health treatment either at the time or later. In short, it is likely that a nontrivial proportion of Korean War veterans with PTSD were underdiagnosed and received suboptimal or no mental health treatment for decades following their war experiences.33 Although the nature of the war, deployment, and public support were distinct in World War II vs the Korean War, the absence of attention to the long-term effects of disorders related to combat trauma and the cultural expectations for stoicism suggest that PTSD among aging World War II veterans may also have gone underrecognized and undertreated.
Apart from the lack of interest in chronic effects of stressors, another problem that has plagued the limited empirical research on Korean War veterans has been the propensity to combine Korean War with World War II veteran samples in studies. Because World War II veterans have outnumbered Korean War veterans until recently, combined samples tended to have relatively few Korean War veterans. Nevertheless, from those studies that have been reported in which 2 groups were compared, important differences have been revealed. Specifically, although precise estimates of the prevalence of PTSD among Korean War combat veterans have varied depending on sampling and method, studies from the 1990s and early 2000s suggested that the prevalence of PTSD and other mental health concerns as well as the severity of symptoms, suicide risk, and psychosocial adjustment difficulties were worse among Korean War combat veterans relative to those among World War II combat veterans; however, both groups had lower prevalence than did Vietnam War combat veterans.21,34-37 Several authors speculated that these differences in outcome were at least partially due to differences in public support for the respective wars.36,37
Although there has been a paucity of research on psychiatric issues and PTSD in Korean War veterans, POWs who were very likely to have been exposed to extreme psychological traumas have received some attention. There have been comparisons of mortality and morbidity among POWs from the Korean War (PWK), World War II Pacific Theater (PWJ), and Europe (PWE).38 Among measures that were administered to the former POWs, the overall pattern seen from survey data in the mid-1960s revealed significantly worse health and functioning among the PWK and PWJ groups relative to the PWE group, with psychiatric difficulties being the most commonly reported impairments among the former 2 groups. This pattern was found most strongly with regards to objective measures, such as hospitalizations for “psychoneuroses,” and US Department of Veterans Affairs (VA) disability records, as well as based on self-reported psychosocial/recreational difficulties measured using the Cornell Medical Index (CMI).38
Gold and colleagues reported a follow-up study of more than 700 former POWs who were reinterviewed between 1989 and 1992.39 Although there was no scale of PTSD symptoms prior to formulation of the diagnosis in 1980, the CMI was a self-reported checklist that included a large range of both medical as well as behavioral and psychiatric symptoms. Thus, using CMI survey responses from 1965, the authors examined the factor structure (ie, the correlational relationships between multiple scale items and subgroupings of items) of the CMI relative to diagnosis of PTSD in 1989 to 1992 based on results from the Structured Clinical Interview for the DSM-III-R (SCID). The intent was to help discern whether the component domains of PTSD were present and intercorrelated in a pattern similar to that of the contemporary diagnosis. The investigators examined the factor structure of 20 psychological items from the CMI that appeared relevant to PTSD criteria using the 1965 data. Three factors (subgroups of highly intercorrelated items) were found: irritability (31% of variance), fearfulness/anxiousness (9% of the variance), and social withdrawal (7% of the variance). Although these did not directly correspond to, or fully cover, DSM PTSD domains or criteria, there does appear to be a thematic resemblance of the CMI findings with PTSD, including alterations in arousal and mood, vigilance, and startle.
Identification and Treatment of PTSD in Older Veterans
Of the 1.2 million living Korean War veterans in the US, 36.3% use VA provided health care.40 There are a number of complicating factors to consider in the current identification and treatment of PTSD in this cohort, including their advanced age; physical, cognitive, and social changes associated with normal aging; the associated medical and cognitive comorbidities; and the specific social-contextual factors in that age cohort. Any combination of these factors may complicate recognition, diagnosis, and treatment. It is also important to be cognizant of the additional stressors that may have been experienced by ethnic minorites and women serving in Korea, which are poorly documented and studied. Racial integration of the US military began during the Korean War, but the general pattern was for African American soldiers to be assigned to all-white units, rather than the reverse.14,41,42 And although the majority of military personnel serving in Korea were male, there were women serving in health care positions at mobile army surgical hospital (MASH) units, medical air evacuation (Medevac) aircraft, and off-shore hospital ships.
The clinical presentation of PTSD in older adults has varied, which may partially relate to the time elapsed since the index trauma. For example, older veterans in general may show less avoidance behavior as a part of PTSD, but in those who experience trauma later in life there may actually be greater avoidance.43,44 There have also been discrepant reports of intrusion or reexperiencing of symptoms, with these also potentially reduced in older veterans.43,44 However, sleep disturbances seem to be very common among elderly combat veterans, and attention should be paid to the possible presence of sleep apnea, which may be more common in veterans with PTSD in general.43,45,46
PTSD symptoms may reemerge after decades of remission or quiescence during retirement and/or with the emergence of neurocognitive impairment, such as Alzheimer disease or dementia. These individuals may have more difficulty engaging in distracting activities and work and spend more time engaging in reminiscence about the past, which can include increased focus on traumatic memories.45,47 Davison and colleagues have suggested a concept they call later-adulthood trauma reengagement (LATR) where later in life combat veterans may “confront and rework their wartime memories in an effort to find meaning and build coherence.”48 This process can be a double-edged sword, leading at times positively to enhanced personal growth or negatively to increased symptoms; preventive interventions may be able foster a more positive outcome.48
There is some evidence supporting the validity of the Clinician Administered PTSD Scale (CAPS) for the evaluation of PTSD in older adults, although this was based on the DSM-III-revised criteria for PTSD and an earlier version of CAPS.49 Bhattarai and colleagues examined responses to the 35-item Mississippi Scale for Combat-Related PTSD (M-PTSD) using VA clinical data collected between 2008 and 2015 on veterans of each combat era from World War II through the post-9/11.50 Strong internal consistency and test-retest reliability of the M-PTSD was observed within each veteran era sample. However, using chart diagnosis of PTSD as the criterion standard, the cut-scores for optimal balance of sensitivity and specificity of the M-PTSD scores were substantially lower for the older cohorts (World War II and Korean War veterans) relative to those for Vietnam and more recent veteran cohorts. The authors concluded that M-PTSD can be validly used to screen for PTSD in veterans within each of these cohorts but recommended using lower than standard cut-scores for Korean War and World War II veterans.50
This is also consistent with reports that suggest the use of lower cut-scores on self-administered PTSD symptom screens.43,44 For the clinician interested in quantifying the severity of PTSD, the most recent tools available are the CAPS-5 and the PCL-5, which have both been created in accordance with the DSM-5. The CAPS-5 is a rater-administered tool, and the PCL-5 is self-administered by the veteran. Although there has been little research using these newer tools in geriatric populations, they can currently serve as a means of tracking the severity of PTSD while we await measures that are better validated in Korean War and other older veterans.
Beyond specific empirical guidance, VA clinicians must presently rely on clinical observations and experience. Patients from the Korean War cohort often present at the insistence of a family member for changes in sleep, mood, behavior, or cognition. When the veterans themselves present, older adults with PTSD often focus more on somatic concerns (including pain, sleep, and gastrointestinal disturbance) than psychiatric problems per se. The latter tendency may in part be due to the salience of such symptoms for them, but perhaps also due to considerable stigma of mental health care that is still largely present in this group.43,44
Psychotherapy
Current VA treatment guidelines recommend trauma-focused therapies, with the strongest evidence base for prolonged exposure (PE), cognitive processing therapy (CPT), and eye movement desensitization and reprocessing (EMDR) therapies.51
There have been several excellent prior reviews discussing treatment of PTSD in older adults generally.10,43,44,52 These reviews have invariably expressed concern about the lack of sufficient empirical studies, but based on evidence from studies and case reports, there seems to be tentative support that trauma-focused therapies are acceptable and efficacious for use with older adults with PTSD. In their recent scoping review, Pless Kaiser and colleagues made several recommendations for trauma-focused therapy with older adults, including slow/careful pacing and use of compensatory aids for cognitive and sensory deficits.44 When cognitive impairment has exacerbated PTSD symptoms, they suggest therapists consider using an adapted form of CPT completed without a trauma narrative. For PE they recommend extending content across sessions and involving spouse or caregivers to assist with in vivo exposure and homework completion.44
Recent studies suggest that PTSD may be a risk factor for the later development of neurodegenerative disorders, and it is often during assessments for dementia that a revelation of PTSD occurs.10,43,47,55 Cognitive impairment may also be of relevance in deciding on the type of psychotherapy to be implemented, as it may have more adverse effects on the effectiveness of CPT than of exposure-based treatments (PE or EMDR). It may be useful to perform a cognitive assessment prior to initiation of a cognitive-based therapy, although extensive cognitive testing may not be practical or may be contraindicated because of fatigue. A brief screening tool such as the Montreal Cognitive Assessment or the Mini-Mental State Examinationmay be helpful.56, 57
Prolonged exposure has been reported by many clinicians to be effective in older adults with PTSD; however, due consideration should be given to the needs of individuals, as many have functioned for decades by suppressing memories.
Apart from the treatment needs for specific PTSD symptoms, the decades-long effects of poor sleep, irritability, hypervigilance, and dissociation also have social consequences for patients, including marital discord and divorce, and social and family isolation that should be addressed in therapy when appropriate. In addition, many Korean War veterans, like all veterans, sought postmilitary employment in professions that are associated with higher rates of exposure to psychological trauma, such as police or fire departments, and this may have an exacerbating effect on PTSD.58
Pharmacotherapy
There is very little empirical evidence guiding pharmacologic approaches to PTSD in older veterans. This population is at increased risk for many comorbidities, and pharmacologic treatments many require dosage adjustments, as is the case for any geriatric patient. Selective serotonin reuptake inhibitor (SSRI) and serotonin norepinephrine reuptake inhibitor (SNRI) medications have been proposed for some cases of PTSD.59,60 Health care providers may consider the SSRIs escitalopram or sertraline preferentially given their decreased potential for drug-drug interactions, anticholinergic effects, or cardiac toxicity compared with that of other drugs in this class.60,61 As venlafaxine can increase blood pressure, especially at higher doses, prescribers may choose duloxetine as an alternative if a SNRI is indicated.60 For veterans when prazosin is being considered for nightmare control, monitoring for hypotension, orthostasis, and the administration of other antihypertensives or prostatic hypertrophy medications is necessary.61 The use of benzodiazepines, while not recommended for PTSD, should be viewed with even greater trepidation in a geriatric population given enhanced risk of falls and confusion in the geriatric veteran population.60,62
Conclusions
Many of the oldest veterans (aged > 80 years) are from the Korean War era. The harsh and unique nature of the war, as well as the differences in context and support from the US public, and the outcome of the war, may have all contributed to and elevation of “combat fatigue” and PTSD among combat veterans from the Korean War. As the “forgotten war” cohort also has been forgotten by researchers, relatively little is known about posttraumatic stress sequelae of these veterans in the decades following the war.
From available evidence, we can readily surmise that problems were underrecognized and suboptimally diagnosed and treated. There is tentative evidence supporting the use of standard interviews and rating scales, such as the CAPS, M-PTSD, and PCL, but lower cut-scores than applied with Vietnam and later veteran cohorts are generally recommended to avoid excessive false negative errors. In terms of psychotherapy treatment, there is again a stark paucity of systematic research, but the limited evidence from studies of PTSD treatment in older adults from the general population tentatively support the acceptability and potential efficacy of recognized evidence-based trauma-focused psychotherapies for PTSD. Research on medication treatment is similarly lacking, but the general recommendations for the use of SSRI or SNRI medications seem to be valid, at least in our clinical experience, and the general rules for geriatric psychopharmacology definitely apply here—start low, go slow.
There are several important avenues for future research. Most pressing among these are establishing the effectiveness of existing treatments, and the modifications that may be needed in the broader context of the above factors, as well as the physical and cognitive changes associated with advanced age. Further research on the phenomenologic aspects of PTSD among Korean War and subsequent cohorts are also needed, as the information obtained will not only guide more effective personalized treatment of the Korean War veterans who remain with us, but also inform future generations of care in terms of the degree and dimensions of variability that may present between cohorts and within cohorts over the life span.
1. American Psychiatric Association. Diagnostic and Statistical Manual of Mental Disorders, 3rd ed. Arlington VA: American Psychiatric Association; 1980.
2. Friedman MJ, Schnurr PP, McDonagh-Coyle A. Posttraumatic stress disorder in the military veteran. Psychiatr Clin North Am. 1994;17(2):265-277.
3. Salmon TW. The Care and Treatment of Mental Diseases and War Neuroses (“Shell Shock”) in the British Army. New York: War Work Committee of the National Committee for Mental Hygiene, Inc; 1917.
4. Jones E, Wessely S. “Forward psychiatry” in the military: its origins and effectiveness. J Trauma Stress. 2003;16(4):411-419.
5. Newman RA. Combat fatigue: a review to the Korean conflict. Mil Med. 1964;129:921-928.
6. Harris FG. Some comments on the differential diagnosis and treatment of psychiatric breakdowns in Korea. https://history.amedd.army.mil/booksdocs/korea/recad2/ch9-2.html. Published April 30, 1954. Accessed November 8, 2019.
7. Smith PB. Psychiatric experiences during the Korean conflict. Am Pract Dig Treat. 1955;6(2):183-189.
8. Koontz AR. Psychiatry in the Korean War. Military Surg.
1950;107(6):444-445.
9. US Department of Veterans Affairs. National Center for Veterans Analysis and Statistics. Population Tables - Table 2L: VETPOP2016 Living Veterans by period of service, gender, 2015-2045. https://www.va.gov/vetdata/docs/Demographics/New_Vetpop_Model/2L_VetPop2016
_POS_National.xlsx. Accessed November 8, 2019.
10. Cook JM, McCarthy E, Thorp SR. Older adults with PTSD: brief state of research and evidence-based psychotherapy case illustration. Am J Geriatr Psychiatry. 2017;25(5):522-530.
11. Millett AR. Korean War: 1950-1953. Encylopaedia Britannica. https://www.britannica.com/event/Korean-War#accordion-article-history. Updated Nov 7, 2019. Accessed November 8, 2019.
12. Stack L. Korean War, a ‘forgotten’ conflict that shaped the modern world. The New York Times. January 2, 2018. https://www.nytimes.com/2018/01/01/world/asia/korean-war-history.html. Accessed November 8, 2019.
13. Westad OA. The Cold War: A World History. New York: Basic Books; 2018.
14. Young C, Conard PL, Armstrong ML, Lacy D. Older military veteran care: many still believe they are forgotten. J Holist Nurs. 2018;36(3):291-300.
15. Huebner AJ. Kilroy is back, 1950-1953. In: The Warrior Image: Soldiers in American Culture From the Second World War to the Vietnam Era. Chapel Hill, NC: The University of North Carolina Press; 2008:97-131.
16. The annexation of Korea (editorial). Japan Times. https://www.japantimes.co.jp/opinion/2010/08/29/editorials/the-annexation-of-korea/#.XPgvJvlKhhE. Published August 29, 2010. Accessed November 8, 2019.
17. Gupta K. How did the Korean war begin? China Q. 1972;52:699-716.
18. Lin L, Zhao Y, Ogawa M, Hoge J, Kim BY. Whose history? An analysis of the Korean War in history textbooks from the United States, South Korea, Japan, and China. Social Studies. 2009;100(5):222-232.
19. Weathersby K. The Korean War revisited. Wilson Q. 1999;23(3):91.
20. US Department of Veterans Affairs, Office of Program and Data Analyses, Assistant Secretary for Planning and Analysis. Data on veterans of the Korean War. https://www.va.gov/vetdata/docs/SpecialReports/KW2000.pdf. Published June 2000. Accessed November 8, 2019.
21. Brooks MS, Fulton L. Evidence of poorer life-course mental health outcomes among veterans of the Korean War cohort. Aging Ment Health. 2010;14(2):177-183.
22. US Department of Veterans Affairs, Office of Public Affairs. America’s wars. https://www.va.gov/opa/publications/factsheets/fs_americas_wars.pdf. Accessed November 8, 2019.
23. Memorandum on recent polls on Korea. https://www.eisenhowerlibrary.gov/sites/default/files/research/online-documents/korean-war/public-opinion-1953-06-02.pdf. Published June 2, 1953. Accessed November 8, 2019.
24. Elder GH Jr, Clipp EC. Combat experience and emotional health: impairment and resilience in later life. J Pers. 1989;57(2):311-341.
25. US Department of Veterans Affairs. Public health: cold injuries. https://www.publichealth.va.gov/PUBLICHEALTH/exposures/cold-injuries/index.asp. Updated July 31, 2019. Accessed November 8, 2019.
26. US Department of Veterans Affairs. Korean War veterans health issues. https://www.va.gov/health-care/health-needs-conditions/health-issues-related-to-service-era
/korean-war/. Updated June 14, 2019. Accessed November 8, 2019.
27. Shapiro F. Efficacy of the eye movement desensitization procedure in the treatment of traumatic memories. J Trauma Stress. 1989;2(2):199-223.
28. Resick PA, Schnicke MK. Cognitive processing therapy for sexual assault victims. J Consul Clin Psychol. 1992;60(5):748-756.
29. Foa EB, Rothbaum BO. Treating Trauma of Rape: Cognitive-Behavioral Therapy for PTSD. New York: Guilford; 2001.
30. Skinner R, Kaplick PM. Cultural shift in mental illness: a comparison of stress responses in World War I and the Vietnam War. JRSM Open. 2017;8(12):2054270417746061.
31. Kardiner A, Spiegel H. War Stress and Neurotic Illness. New York: Hoeber; 1947.
32. Archibald HC, Tuddenham RD. Persistent stress reaction after combat: a 20-year follow-up. Arch Gen Psychiatry. 1965;12:475-481.
33. Cook JM, Simiola V. Trauma and aging. Curr Psychiatry Rep. 2018;20(10):93.
34. Rosenheck R, Fontana A. Long-term sequelae of combat in World War II, Korea and Vietnam: a comparative study. In: McCaughey BG, Fullerton CS, Ursano RJ, eds. Individual
and Community Responses to Trauma and Disaster: The Structure of Human Chaos. New York: Cambridge University Press; 1994:330-359.
35. Blake DD, Keane TM, Wine PR, Mora C, Taylor KL, Lyons JA. Prevalence of PTSD symptoms in combat veterans seeking medical treatment. J Trauma Stress. 1990;3(1):15-27.
36. McCranie EW, Hyer LA. Posttraumatic stress disorder symptoms in Korean conflict and World War II combat veterans seeking outpatient treatment. J Trauma Stress. 2000;13(3):427-439.
37. Fontana A, Rosenheck R. Traumatic war stressors and psychiatric symptoms among World War II, Korean, and Vietnam War veterans. Psychology Aging. 1994;9(1):27-33.
38. Beebe GW. Follow-up studies of World War II and Korean war prisoners. II. Morbidity, disability, and maladjustments. Am J Epidemiol. 1975;101(5):400-422.
39. Gold PB, Engdahl BE, Eberly RE, Blake RJ, Page WF, Frueh BC. Trauma exposure, resilience, social support, and PTSD construct validity among former prisoners of war. Social Psychiatry Psychiatr Epidemiol. 2000;35(1):36-42.
40. US Department of Veterans Affairs. Key statistics by veteran status and period of service. https://www.va.gov/vetdata/docs/SpecialReports/KeyStats.pdf. Accessed November 11, 2019.
41. Bowers WT, Hammond WM, MacGarrigle GL. Black Soldier, White Army. Washington DC: US Army Center of Military History; 1996.
42. Black HK. Three generations, three wars: African American veterans. Gerontologist. 2016;56(1):33-41.
43. Thorp SR, Sones HM, Cook JM. Posttraumatic stress disorder among older adults. In: Sorocco KH, Lauderdale S, eds. Cognitive Behavior Therapy With Older Adults: Innovations Across Care Settings. New York: Springer; 2011:189-217.
44. Pless Kaiser A, Cook JM, Glick DM, Moye J. Posttraumatic stress disorder in older adults: a conceptual review. Clinical Gerontol. 2019;42(4):359-376.
45. Sadavoy J. Survivors. A review of the late-life effects of prior psychological trauma. Am J Geriatr Psychiatry. 1997;5(4):287-301.
46. Tamanna S, Parker JD, Lyons J, Ullah MI. The effect of continuous positive air pressure (CPAP) on nightmares in patients with posttraumatic stress disorder (PTSD) and obstructive sleep apnea (OSA). J Clin Sleep Med. 2014;10(6):631-636.
47. Mota N, Tsai J, Kirwin PD, et al. Late-life exacerbation of PTSD symptoms in US veterans: results from the National Health and Resilience in Veterans Study. J Clin Psychiatry. 2016;77(3):348-354.
48. Davison EH, Kaiser AP, Spiro A 3rd, Moye J, King LA, King DW. From Late-onset stress symptomatology to later-adulthood trauma reengagement in aging combat veterans: taking a broader view. Gerontologist. 2016;56(1):14-21.
49. Hyer L, Summers MN, Boyd S, Litaker M, Boudewyns P. Assessment of older combat veterans with the clinician-administered PTSD scale. J Trauma Stress. 1996;9(3):587-593.
50. Bhattarai JJ, Oehlert ME, Weber DK. Psychometric properties of the Mississippi Scale for combat-related posttraumatic stress disorder based on veterans’ period of service. Psychol Serv. 2018. [Epub ahead of print]
51. US Department of Veterans Affairs, US Department of Defense. VA/DOD Clinical practice guideline for the management of posttraumatic stress disorder and acute stress disorder. Version 3.0. https://www.healthquality.va.gov/guidelines/MH/ptsd/VADoDPTSDCPGFinal012418.pdf.
Updated 2017. Accessed November 11, 2019.
52. Dinnen S, Simiola V, Cook JM. Post-traumatic stress disorder in older adults: a systematic review of the psychotherapy treatment literature. Aging Ment Health. 2015;19(2):144-150.
53. Jakel RJ. Posttraumatic Stress Disorder in the Elderly. Psychiatr Clin North Am. 2018;41(1):165-175.
54. Thorp SR, Glassman LH, Wells SY, et al. A randomized controlled trial of prolonged exposure therapy versus relaxation training for older veterans with military-related PTSD. J Anxiety Disord. 2019;64:45-54.
55. Kang B, Xu H, McConnell ES. Neurocognitive and psychiatric comorbidities of posttraumatic stress disorder among older veterans: a systematic review. Int J Geriatr Psychiatry. 2019;34(4):522-538.
56. Nasreddine ZS, Phillips NA, Bédirian V, et al. The Montreal Cognitive Assessment, MoCA: a brief screening tool for mild cognitive impairment. J Am Geriatr Soc. 2005;53(4):695-699.
57. Folstein MF, Folstein SE, McHugh PR. “Mini-mental state”. A practical method for grading the cognitive state of patients for the clinician. J Psychiatr Res. 1975;12(3):189-198.
58. Paton D. Traumatic Stress in Police Officers a Career-Length Assessment From Recruitment to Retirement. Springfield, IL: Charles C. Thomas; 2009.
59. Alexander W. Pharmacotherapy for post-traumatic stress disorder in combat veterans: focus on antidepressants and atypical antipsychotic agents. P T. 2012;37(1):32-38.
60. Beck JG, Sloan DM, Friedman MJ. Pharmacotherapy for PTSD. In: The Oxford Handbook of Traumatic Stress Disorders. Oxford University Press; 2012.
61. Waltman SH, Shearer D, Moore BA. Management of posttraumatic nightmares: a review of pharmacologic and nonpharmacologic treatments since 2013. Curr Psychiatry Rep. 2018;20(12):108.
62. Díaz-Gutiérrez MJ, Martínez-Cengotitabengoa M, Sáez de Adana E, et al. Relationship between the use of benzodiazepines and falls in older adults: a systematic review. Maturitas. 2017;101:17-22.
The Korean War lasted from June 25, 1950 through July 27, 1953. Although many veterans of the Korean War experienced traumas during extremely stressful combat conditions. However, they would not have been diagnosed with posttraumatic stress disorder (PTSD) at the time because the latter did not exist as a formal diagnosis until the publication of the third edition of the Diagnostic and Statistical Manual (DSM) in 1980.1 Prior to 1980, psychiatric syndromes resulting from war and combat exposure where known by numerous other terms including shell shock, chronic traumatic war neurosis, and combat fatigue/combat exhaustion.2,3 Military psychiatrists attended to combat fatigue during the course of the Korean War, but as was true of World War I and II, the focus was on returning soldiers to duty. Combat fatigue was generally viewed as a transient condition.4-8
Although now octo- and nonagenarians, in 2019 there are 1.2 million living Korean War veterans in the US, representing 6.7% of all current veterans.9 Understanding their war experiences and the nature of their current and past presentation of PTSD is relevant not only in formal mental health settings, but in primary care settings, including home-based primary care, as well as community living centers, skilled nursing facilities and assisted living facilities. Older adults with PTSD often present with somatic concerns rather than spontaneously reporting mental health symptoms.10 Beyond the short-term clinical management of Korean War veterans with PTSD, consideration of their experiences also has long-term relevance for the appropriate treatment of other veteran cohorts as they age in coming decades.
The purpose of this article is to provide a clinically focused overview of PTSD in Korean War veterans, to help promote understanding of this often-forgotten group of veterans, and to foster optimized personalized care. This overview will include a description of the Korean War veteran population and the Korean War itself, the manifestations and identification of PTSD among Korean War veterans, and treatment approaches using evidence-based psychotherapies and pharmacotherapies. Finally, we provide recommendations for future research to address present empirical gaps in the understanding and treatment of Korean War veterans with PTSD.
Causes and Course of the Korean War
When working with Korean War veterans it is important to consider the special nature of that specific conflict. Space considerations limit our ability to do justice to the complex history and numerous battles of the Korean War, but information in the following summary was gleaned from several excellent histories.11-13
The Korean War has been referred to as The Forgotten War, a concern expressed even during the latter parts of the war.14,15 But the war and its veterans warrant remembering. The root and proximal causes of the Korean War are complex and not fully agreed upon by the main participants.16-19 In part this may reflect the fact that there was no clear victor in the Korean War, so that the different protagonists have developed their own versions of the history of the conflict. Also, US involvement and the public reaction to the war must be viewed within the larger historical context of that time. This context included the recent end of 4 years of US involvement in World War II (1941-1945) and the subsequent rapid rise of Cold War tensions between the US and the Soviet Union. The latter also included a worldwide fear of nuclear war and the US fear of the global spread of communism. These fears were fueled by the Soviet-led Berlin Blockade from June 1948 through May 1949, the Soviet Union’s successful atomic bomb test in August 1949, the founding of the People’s Republic of China in October 1949, and the February 1950 Sino-Soviet Treaty of Friendship and Alliance.13
In the closing days of World War II, the US and Soviet Union agreed to a temporary division of Korea along the 38th parallel to facilitate timely and efficient surrender of Japanese troops. But as Cold War tensions rose, the temporary division became permanent, and Soviet- and US-backed governments of the north and south, respectively, were officially established on the Korean peninsula in 1948. Although by 1949 the Soviets and US had withdrawn most troops from the peninsula, tensions between the north and south continued to mount and hostilities increased. To this day the exact causes of the eruption of war remain disputed, although it is clear that ideological as well as economic factors played a role, and both leaders of North and South Korea were pledging to reunite the peninsula under their respective leadership.16-19 The tension culminated on June 25, 1950, when North Korean troops crossed the 38th parallel and invaded South Korea. On June 27, 1950, President Truman ordered US naval and air forces to support South Korea and then ordered the involvement of ground troops on June 30.16,17,19
Although several other member countries of the United Nations (UN) provided troops, 90% of the troops were from the US. About 5.7 million US military personnel served during the war, including about 1.8 million in Korea itself. The US forces experienced approximately 34,000 battle-related deaths, 103,000 were wounded, and 7,000 were prisoners of war (POWs).11,20-22 The nature and events of the Korean War made it particularly stressful and traumatizing for the soldiers, sailors, and marines involved throughout its entire course. These included near defeat in the early months, a widely alternating war front along the north/south axis during the first year, and subsequently, not only intense constant battles on the fronts, but also a demanding and exhausting guerrilla war in the south, which lasted throughout the remainder of the conflict.11,15 The US troops during the initial months of the war have been described as outnumbered and underprepared, as many in the initial phase were reassigned from peace-time occupation duty in Japan.7
The first year of war was characterized by a repeated north-to-south/south-to-north shifts in control of territory. During the first 3 months, the North Korean forces overwhelmed the South and captured control of all but 2 South Korean cities in the far southeastern region (Pusan, now Busan; and Daegu), and US and UN forces were forced to retreat to the perimeter around Pusan. The intense Battle of Pusan Perimeter lasted from August 4, 1950 to September 18, 1950, and resulted in massive causalities as well as a flood of civilian refugees.
The course of the war began to change in early September 1950 with the landing of amphibious US/UN forces at Inchon, behind North Korean lines, which cut off southern supply routes for the North Korean troops.11 US/UN forces soon crossed to the north of the 38th parallel and captured the North Korean capital, Pyongyang, on October 19, 1950. They continued to push north and approached the Yalu River border with China by late November 1950, but then the Chinese introduced their own troops forcing a southward retreat of US/UN troops during which there were again numerous US/UN casualties. Chinese troops retook Seoul in late December 1950/early January 1951. However, the US/UN forces soon recaptured Seoul and advanced back to the 38th parallel. This back-and-forth across the 38th parallel continued until July 1951 when the front line of battle stabilized there. Although the line stabilized, intense battles and casualties continued for 2 more years. During this period US/UN troops also had to deal with guerrilla warfare behind the front lines due to the actions of communist partisans and isolated North Korean troops. This situation continued until the armistice was signed July 27, 1953.
Trauma and Characteristic Stresses of the War
There were many factors that made the Korean War experience different from previous wars, particularly World War II. For example, in contrast to the strong public support during and after World War II, public support for the Korean War in the US was low, particularly during its final year.23 In public opinion polls from October 1952 through April 1953, only 23% to 39% reported feeling that the war was worth fighting.23 A retrospective 1985 survey also found that 70% of World War II veterans, but only 33% of Korean War veterans reported feeling appreciated by the US public on their return from the war.24
Those fighting in the initial months of the war faced a particularly grim situation. According to LTC Philip Smith, who served as Division Psychiatrist on the Masan Front (Pusan Perimeter) during August and September of 1950, “Fighting was almost continuous and all available troops were on the fighting front… For the most part these soldiers were soft from occupation duty, many had not received adequate combat basic training, no refresher combat training in Korea had as yet been instituted,” he reported.7 “The extremes of climate coupled with the generally rugged mountainous terrain in Korea were physical factors of importance…These men were psychologically unprepared for the horrors and isolation of war.” LTC Smith noted that the change in status from civilian or occupation life to the marked deprivation of the war in Korea had been “too abrupt to allow as yet for a reasonable adjustment to the new setting” and that as a result “the highest rate of wounded and neuropsychiatric casualties in the Korean campaign resulted.”7
Even after this initial period, the nature of the shifting war, the challenging terrain, the high military casualty rate, and the high rate of civilian casualties and displacement continued throughout the war.
PTSD in Korean War Veterans
It is clear that Korean War combat veterans were exposed to traumatic events. It is unknown how many developed PTSD. While notions of psychological distress and disability related to combat trauma exposure have existed for centuries, Korean War and World War II veterans are a remaining link to pre-DSM PTSD mental health in the military. Military/forward psychiatry—psychiatric services near the battle zone rather than requiring evacuation of patients—was present in Korea from the early months of the war, but the focus of forward psychiatry was to reduce psychiatric causalities from combat fatigue and maximize rapid return-to-duty.4-6 With no real conception of PTSD, there were limited treatments available, and evidenced-based trauma-focused treatments for PTSD would not be introduced for at least another 4 decades.27-29
Skinner and Kaplick conducted a historical review of case descriptions of trauma-related conditions from World War I through the Vietnam War and noted the consistent inclusion of hyperarousal and intrusive symptoms, although there also was a greater emphasis on somatic conversion or hysteria symptoms in the earlier descriptions.30 By the Korean War, descriptions of combat fatigue included a number of symptoms that overlap with PTSD, including preoccupation with the traumatic stressor, nightmares, irritability/anger, increased startle, and hyperarousal.31 But following the acute phases, attention to any chronic problems associated with these conditions waned. As was acknowledged by a military psychiatrist in a 1954 talk, studies of the long-term adjustment of those who had “broken down in combat” were sorely needed.6 In a small 1965 study reported by Archibald and Tuddenham, persistent symptoms of combat fatigue among Korean War veterans were definitely present, and there was even a suggestion that the symptoms had increased over the decade since the war.32
Given the stoicism that typified cultural expectations for military men during this period, Korean War veterans may also have been reluctant to seek mental health treatment either at the time or later. In short, it is likely that a nontrivial proportion of Korean War veterans with PTSD were underdiagnosed and received suboptimal or no mental health treatment for decades following their war experiences.33 Although the nature of the war, deployment, and public support were distinct in World War II vs the Korean War, the absence of attention to the long-term effects of disorders related to combat trauma and the cultural expectations for stoicism suggest that PTSD among aging World War II veterans may also have gone underrecognized and undertreated.
Apart from the lack of interest in chronic effects of stressors, another problem that has plagued the limited empirical research on Korean War veterans has been the propensity to combine Korean War with World War II veteran samples in studies. Because World War II veterans have outnumbered Korean War veterans until recently, combined samples tended to have relatively few Korean War veterans. Nevertheless, from those studies that have been reported in which 2 groups were compared, important differences have been revealed. Specifically, although precise estimates of the prevalence of PTSD among Korean War combat veterans have varied depending on sampling and method, studies from the 1990s and early 2000s suggested that the prevalence of PTSD and other mental health concerns as well as the severity of symptoms, suicide risk, and psychosocial adjustment difficulties were worse among Korean War combat veterans relative to those among World War II combat veterans; however, both groups had lower prevalence than did Vietnam War combat veterans.21,34-37 Several authors speculated that these differences in outcome were at least partially due to differences in public support for the respective wars.36,37
Although there has been a paucity of research on psychiatric issues and PTSD in Korean War veterans, POWs who were very likely to have been exposed to extreme psychological traumas have received some attention. There have been comparisons of mortality and morbidity among POWs from the Korean War (PWK), World War II Pacific Theater (PWJ), and Europe (PWE).38 Among measures that were administered to the former POWs, the overall pattern seen from survey data in the mid-1960s revealed significantly worse health and functioning among the PWK and PWJ groups relative to the PWE group, with psychiatric difficulties being the most commonly reported impairments among the former 2 groups. This pattern was found most strongly with regards to objective measures, such as hospitalizations for “psychoneuroses,” and US Department of Veterans Affairs (VA) disability records, as well as based on self-reported psychosocial/recreational difficulties measured using the Cornell Medical Index (CMI).38
Gold and colleagues reported a follow-up study of more than 700 former POWs who were reinterviewed between 1989 and 1992.39 Although there was no scale of PTSD symptoms prior to formulation of the diagnosis in 1980, the CMI was a self-reported checklist that included a large range of both medical as well as behavioral and psychiatric symptoms. Thus, using CMI survey responses from 1965, the authors examined the factor structure (ie, the correlational relationships between multiple scale items and subgroupings of items) of the CMI relative to diagnosis of PTSD in 1989 to 1992 based on results from the Structured Clinical Interview for the DSM-III-R (SCID). The intent was to help discern whether the component domains of PTSD were present and intercorrelated in a pattern similar to that of the contemporary diagnosis. The investigators examined the factor structure of 20 psychological items from the CMI that appeared relevant to PTSD criteria using the 1965 data. Three factors (subgroups of highly intercorrelated items) were found: irritability (31% of variance), fearfulness/anxiousness (9% of the variance), and social withdrawal (7% of the variance). Although these did not directly correspond to, or fully cover, DSM PTSD domains or criteria, there does appear to be a thematic resemblance of the CMI findings with PTSD, including alterations in arousal and mood, vigilance, and startle.
Identification and Treatment of PTSD in Older Veterans
Of the 1.2 million living Korean War veterans in the US, 36.3% use VA provided health care.40 There are a number of complicating factors to consider in the current identification and treatment of PTSD in this cohort, including their advanced age; physical, cognitive, and social changes associated with normal aging; the associated medical and cognitive comorbidities; and the specific social-contextual factors in that age cohort. Any combination of these factors may complicate recognition, diagnosis, and treatment. It is also important to be cognizant of the additional stressors that may have been experienced by ethnic minorites and women serving in Korea, which are poorly documented and studied. Racial integration of the US military began during the Korean War, but the general pattern was for African American soldiers to be assigned to all-white units, rather than the reverse.14,41,42 And although the majority of military personnel serving in Korea were male, there were women serving in health care positions at mobile army surgical hospital (MASH) units, medical air evacuation (Medevac) aircraft, and off-shore hospital ships.
The clinical presentation of PTSD in older adults has varied, which may partially relate to the time elapsed since the index trauma. For example, older veterans in general may show less avoidance behavior as a part of PTSD, but in those who experience trauma later in life there may actually be greater avoidance.43,44 There have also been discrepant reports of intrusion or reexperiencing of symptoms, with these also potentially reduced in older veterans.43,44 However, sleep disturbances seem to be very common among elderly combat veterans, and attention should be paid to the possible presence of sleep apnea, which may be more common in veterans with PTSD in general.43,45,46
PTSD symptoms may reemerge after decades of remission or quiescence during retirement and/or with the emergence of neurocognitive impairment, such as Alzheimer disease or dementia. These individuals may have more difficulty engaging in distracting activities and work and spend more time engaging in reminiscence about the past, which can include increased focus on traumatic memories.45,47 Davison and colleagues have suggested a concept they call later-adulthood trauma reengagement (LATR) where later in life combat veterans may “confront and rework their wartime memories in an effort to find meaning and build coherence.”48 This process can be a double-edged sword, leading at times positively to enhanced personal growth or negatively to increased symptoms; preventive interventions may be able foster a more positive outcome.48
There is some evidence supporting the validity of the Clinician Administered PTSD Scale (CAPS) for the evaluation of PTSD in older adults, although this was based on the DSM-III-revised criteria for PTSD and an earlier version of CAPS.49 Bhattarai and colleagues examined responses to the 35-item Mississippi Scale for Combat-Related PTSD (M-PTSD) using VA clinical data collected between 2008 and 2015 on veterans of each combat era from World War II through the post-9/11.50 Strong internal consistency and test-retest reliability of the M-PTSD was observed within each veteran era sample. However, using chart diagnosis of PTSD as the criterion standard, the cut-scores for optimal balance of sensitivity and specificity of the M-PTSD scores were substantially lower for the older cohorts (World War II and Korean War veterans) relative to those for Vietnam and more recent veteran cohorts. The authors concluded that M-PTSD can be validly used to screen for PTSD in veterans within each of these cohorts but recommended using lower than standard cut-scores for Korean War and World War II veterans.50
This is also consistent with reports that suggest the use of lower cut-scores on self-administered PTSD symptom screens.43,44 For the clinician interested in quantifying the severity of PTSD, the most recent tools available are the CAPS-5 and the PCL-5, which have both been created in accordance with the DSM-5. The CAPS-5 is a rater-administered tool, and the PCL-5 is self-administered by the veteran. Although there has been little research using these newer tools in geriatric populations, they can currently serve as a means of tracking the severity of PTSD while we await measures that are better validated in Korean War and other older veterans.
Beyond specific empirical guidance, VA clinicians must presently rely on clinical observations and experience. Patients from the Korean War cohort often present at the insistence of a family member for changes in sleep, mood, behavior, or cognition. When the veterans themselves present, older adults with PTSD often focus more on somatic concerns (including pain, sleep, and gastrointestinal disturbance) than psychiatric problems per se. The latter tendency may in part be due to the salience of such symptoms for them, but perhaps also due to considerable stigma of mental health care that is still largely present in this group.43,44
Psychotherapy
Current VA treatment guidelines recommend trauma-focused therapies, with the strongest evidence base for prolonged exposure (PE), cognitive processing therapy (CPT), and eye movement desensitization and reprocessing (EMDR) therapies.51
There have been several excellent prior reviews discussing treatment of PTSD in older adults generally.10,43,44,52 These reviews have invariably expressed concern about the lack of sufficient empirical studies, but based on evidence from studies and case reports, there seems to be tentative support that trauma-focused therapies are acceptable and efficacious for use with older adults with PTSD. In their recent scoping review, Pless Kaiser and colleagues made several recommendations for trauma-focused therapy with older adults, including slow/careful pacing and use of compensatory aids for cognitive and sensory deficits.44 When cognitive impairment has exacerbated PTSD symptoms, they suggest therapists consider using an adapted form of CPT completed without a trauma narrative. For PE they recommend extending content across sessions and involving spouse or caregivers to assist with in vivo exposure and homework completion.44
Recent studies suggest that PTSD may be a risk factor for the later development of neurodegenerative disorders, and it is often during assessments for dementia that a revelation of PTSD occurs.10,43,47,55 Cognitive impairment may also be of relevance in deciding on the type of psychotherapy to be implemented, as it may have more adverse effects on the effectiveness of CPT than of exposure-based treatments (PE or EMDR). It may be useful to perform a cognitive assessment prior to initiation of a cognitive-based therapy, although extensive cognitive testing may not be practical or may be contraindicated because of fatigue. A brief screening tool such as the Montreal Cognitive Assessment or the Mini-Mental State Examinationmay be helpful.56, 57
Prolonged exposure has been reported by many clinicians to be effective in older adults with PTSD; however, due consideration should be given to the needs of individuals, as many have functioned for decades by suppressing memories.
Apart from the treatment needs for specific PTSD symptoms, the decades-long effects of poor sleep, irritability, hypervigilance, and dissociation also have social consequences for patients, including marital discord and divorce, and social and family isolation that should be addressed in therapy when appropriate. In addition, many Korean War veterans, like all veterans, sought postmilitary employment in professions that are associated with higher rates of exposure to psychological trauma, such as police or fire departments, and this may have an exacerbating effect on PTSD.58
Pharmacotherapy
There is very little empirical evidence guiding pharmacologic approaches to PTSD in older veterans. This population is at increased risk for many comorbidities, and pharmacologic treatments many require dosage adjustments, as is the case for any geriatric patient. Selective serotonin reuptake inhibitor (SSRI) and serotonin norepinephrine reuptake inhibitor (SNRI) medications have been proposed for some cases of PTSD.59,60 Health care providers may consider the SSRIs escitalopram or sertraline preferentially given their decreased potential for drug-drug interactions, anticholinergic effects, or cardiac toxicity compared with that of other drugs in this class.60,61 As venlafaxine can increase blood pressure, especially at higher doses, prescribers may choose duloxetine as an alternative if a SNRI is indicated.60 For veterans when prazosin is being considered for nightmare control, monitoring for hypotension, orthostasis, and the administration of other antihypertensives or prostatic hypertrophy medications is necessary.61 The use of benzodiazepines, while not recommended for PTSD, should be viewed with even greater trepidation in a geriatric population given enhanced risk of falls and confusion in the geriatric veteran population.60,62
Conclusions
Many of the oldest veterans (aged > 80 years) are from the Korean War era. The harsh and unique nature of the war, as well as the differences in context and support from the US public, and the outcome of the war, may have all contributed to and elevation of “combat fatigue” and PTSD among combat veterans from the Korean War. As the “forgotten war” cohort also has been forgotten by researchers, relatively little is known about posttraumatic stress sequelae of these veterans in the decades following the war.
From available evidence, we can readily surmise that problems were underrecognized and suboptimally diagnosed and treated. There is tentative evidence supporting the use of standard interviews and rating scales, such as the CAPS, M-PTSD, and PCL, but lower cut-scores than applied with Vietnam and later veteran cohorts are generally recommended to avoid excessive false negative errors. In terms of psychotherapy treatment, there is again a stark paucity of systematic research, but the limited evidence from studies of PTSD treatment in older adults from the general population tentatively support the acceptability and potential efficacy of recognized evidence-based trauma-focused psychotherapies for PTSD. Research on medication treatment is similarly lacking, but the general recommendations for the use of SSRI or SNRI medications seem to be valid, at least in our clinical experience, and the general rules for geriatric psychopharmacology definitely apply here—start low, go slow.
There are several important avenues for future research. Most pressing among these are establishing the effectiveness of existing treatments, and the modifications that may be needed in the broader context of the above factors, as well as the physical and cognitive changes associated with advanced age. Further research on the phenomenologic aspects of PTSD among Korean War and subsequent cohorts are also needed, as the information obtained will not only guide more effective personalized treatment of the Korean War veterans who remain with us, but also inform future generations of care in terms of the degree and dimensions of variability that may present between cohorts and within cohorts over the life span.
1. American Psychiatric Association. Diagnostic and Statistical Manual of Mental Disorders, 3rd ed. Arlington VA: American Psychiatric Association; 1980.
2. Friedman MJ, Schnurr PP, McDonagh-Coyle A. Posttraumatic stress disorder in the military veteran. Psychiatr Clin North Am. 1994;17(2):265-277.
3. Salmon TW. The Care and Treatment of Mental Diseases and War Neuroses (“Shell Shock”) in the British Army. New York: War Work Committee of the National Committee for Mental Hygiene, Inc; 1917.
4. Jones E, Wessely S. “Forward psychiatry” in the military: its origins and effectiveness. J Trauma Stress. 2003;16(4):411-419.
5. Newman RA. Combat fatigue: a review to the Korean conflict. Mil Med. 1964;129:921-928.
6. Harris FG. Some comments on the differential diagnosis and treatment of psychiatric breakdowns in Korea. https://history.amedd.army.mil/booksdocs/korea/recad2/ch9-2.html. Published April 30, 1954. Accessed November 8, 2019.
7. Smith PB. Psychiatric experiences during the Korean conflict. Am Pract Dig Treat. 1955;6(2):183-189.
8. Koontz AR. Psychiatry in the Korean War. Military Surg.
1950;107(6):444-445.
9. US Department of Veterans Affairs. National Center for Veterans Analysis and Statistics. Population Tables - Table 2L: VETPOP2016 Living Veterans by period of service, gender, 2015-2045. https://www.va.gov/vetdata/docs/Demographics/New_Vetpop_Model/2L_VetPop2016
_POS_National.xlsx. Accessed November 8, 2019.
10. Cook JM, McCarthy E, Thorp SR. Older adults with PTSD: brief state of research and evidence-based psychotherapy case illustration. Am J Geriatr Psychiatry. 2017;25(5):522-530.
11. Millett AR. Korean War: 1950-1953. Encylopaedia Britannica. https://www.britannica.com/event/Korean-War#accordion-article-history. Updated Nov 7, 2019. Accessed November 8, 2019.
12. Stack L. Korean War, a ‘forgotten’ conflict that shaped the modern world. The New York Times. January 2, 2018. https://www.nytimes.com/2018/01/01/world/asia/korean-war-history.html. Accessed November 8, 2019.
13. Westad OA. The Cold War: A World History. New York: Basic Books; 2018.
14. Young C, Conard PL, Armstrong ML, Lacy D. Older military veteran care: many still believe they are forgotten. J Holist Nurs. 2018;36(3):291-300.
15. Huebner AJ. Kilroy is back, 1950-1953. In: The Warrior Image: Soldiers in American Culture From the Second World War to the Vietnam Era. Chapel Hill, NC: The University of North Carolina Press; 2008:97-131.
16. The annexation of Korea (editorial). Japan Times. https://www.japantimes.co.jp/opinion/2010/08/29/editorials/the-annexation-of-korea/#.XPgvJvlKhhE. Published August 29, 2010. Accessed November 8, 2019.
17. Gupta K. How did the Korean war begin? China Q. 1972;52:699-716.
18. Lin L, Zhao Y, Ogawa M, Hoge J, Kim BY. Whose history? An analysis of the Korean War in history textbooks from the United States, South Korea, Japan, and China. Social Studies. 2009;100(5):222-232.
19. Weathersby K. The Korean War revisited. Wilson Q. 1999;23(3):91.
20. US Department of Veterans Affairs, Office of Program and Data Analyses, Assistant Secretary for Planning and Analysis. Data on veterans of the Korean War. https://www.va.gov/vetdata/docs/SpecialReports/KW2000.pdf. Published June 2000. Accessed November 8, 2019.
21. Brooks MS, Fulton L. Evidence of poorer life-course mental health outcomes among veterans of the Korean War cohort. Aging Ment Health. 2010;14(2):177-183.
22. US Department of Veterans Affairs, Office of Public Affairs. America’s wars. https://www.va.gov/opa/publications/factsheets/fs_americas_wars.pdf. Accessed November 8, 2019.
23. Memorandum on recent polls on Korea. https://www.eisenhowerlibrary.gov/sites/default/files/research/online-documents/korean-war/public-opinion-1953-06-02.pdf. Published June 2, 1953. Accessed November 8, 2019.
24. Elder GH Jr, Clipp EC. Combat experience and emotional health: impairment and resilience in later life. J Pers. 1989;57(2):311-341.
25. US Department of Veterans Affairs. Public health: cold injuries. https://www.publichealth.va.gov/PUBLICHEALTH/exposures/cold-injuries/index.asp. Updated July 31, 2019. Accessed November 8, 2019.
26. US Department of Veterans Affairs. Korean War veterans health issues. https://www.va.gov/health-care/health-needs-conditions/health-issues-related-to-service-era
/korean-war/. Updated June 14, 2019. Accessed November 8, 2019.
27. Shapiro F. Efficacy of the eye movement desensitization procedure in the treatment of traumatic memories. J Trauma Stress. 1989;2(2):199-223.
28. Resick PA, Schnicke MK. Cognitive processing therapy for sexual assault victims. J Consul Clin Psychol. 1992;60(5):748-756.
29. Foa EB, Rothbaum BO. Treating Trauma of Rape: Cognitive-Behavioral Therapy for PTSD. New York: Guilford; 2001.
30. Skinner R, Kaplick PM. Cultural shift in mental illness: a comparison of stress responses in World War I and the Vietnam War. JRSM Open. 2017;8(12):2054270417746061.
31. Kardiner A, Spiegel H. War Stress and Neurotic Illness. New York: Hoeber; 1947.
32. Archibald HC, Tuddenham RD. Persistent stress reaction after combat: a 20-year follow-up. Arch Gen Psychiatry. 1965;12:475-481.
33. Cook JM, Simiola V. Trauma and aging. Curr Psychiatry Rep. 2018;20(10):93.
34. Rosenheck R, Fontana A. Long-term sequelae of combat in World War II, Korea and Vietnam: a comparative study. In: McCaughey BG, Fullerton CS, Ursano RJ, eds. Individual
and Community Responses to Trauma and Disaster: The Structure of Human Chaos. New York: Cambridge University Press; 1994:330-359.
35. Blake DD, Keane TM, Wine PR, Mora C, Taylor KL, Lyons JA. Prevalence of PTSD symptoms in combat veterans seeking medical treatment. J Trauma Stress. 1990;3(1):15-27.
36. McCranie EW, Hyer LA. Posttraumatic stress disorder symptoms in Korean conflict and World War II combat veterans seeking outpatient treatment. J Trauma Stress. 2000;13(3):427-439.
37. Fontana A, Rosenheck R. Traumatic war stressors and psychiatric symptoms among World War II, Korean, and Vietnam War veterans. Psychology Aging. 1994;9(1):27-33.
38. Beebe GW. Follow-up studies of World War II and Korean war prisoners. II. Morbidity, disability, and maladjustments. Am J Epidemiol. 1975;101(5):400-422.
39. Gold PB, Engdahl BE, Eberly RE, Blake RJ, Page WF, Frueh BC. Trauma exposure, resilience, social support, and PTSD construct validity among former prisoners of war. Social Psychiatry Psychiatr Epidemiol. 2000;35(1):36-42.
40. US Department of Veterans Affairs. Key statistics by veteran status and period of service. https://www.va.gov/vetdata/docs/SpecialReports/KeyStats.pdf. Accessed November 11, 2019.
41. Bowers WT, Hammond WM, MacGarrigle GL. Black Soldier, White Army. Washington DC: US Army Center of Military History; 1996.
42. Black HK. Three generations, three wars: African American veterans. Gerontologist. 2016;56(1):33-41.
43. Thorp SR, Sones HM, Cook JM. Posttraumatic stress disorder among older adults. In: Sorocco KH, Lauderdale S, eds. Cognitive Behavior Therapy With Older Adults: Innovations Across Care Settings. New York: Springer; 2011:189-217.
44. Pless Kaiser A, Cook JM, Glick DM, Moye J. Posttraumatic stress disorder in older adults: a conceptual review. Clinical Gerontol. 2019;42(4):359-376.
45. Sadavoy J. Survivors. A review of the late-life effects of prior psychological trauma. Am J Geriatr Psychiatry. 1997;5(4):287-301.
46. Tamanna S, Parker JD, Lyons J, Ullah MI. The effect of continuous positive air pressure (CPAP) on nightmares in patients with posttraumatic stress disorder (PTSD) and obstructive sleep apnea (OSA). J Clin Sleep Med. 2014;10(6):631-636.
47. Mota N, Tsai J, Kirwin PD, et al. Late-life exacerbation of PTSD symptoms in US veterans: results from the National Health and Resilience in Veterans Study. J Clin Psychiatry. 2016;77(3):348-354.
48. Davison EH, Kaiser AP, Spiro A 3rd, Moye J, King LA, King DW. From Late-onset stress symptomatology to later-adulthood trauma reengagement in aging combat veterans: taking a broader view. Gerontologist. 2016;56(1):14-21.
49. Hyer L, Summers MN, Boyd S, Litaker M, Boudewyns P. Assessment of older combat veterans with the clinician-administered PTSD scale. J Trauma Stress. 1996;9(3):587-593.
50. Bhattarai JJ, Oehlert ME, Weber DK. Psychometric properties of the Mississippi Scale for combat-related posttraumatic stress disorder based on veterans’ period of service. Psychol Serv. 2018. [Epub ahead of print]
51. US Department of Veterans Affairs, US Department of Defense. VA/DOD Clinical practice guideline for the management of posttraumatic stress disorder and acute stress disorder. Version 3.0. https://www.healthquality.va.gov/guidelines/MH/ptsd/VADoDPTSDCPGFinal012418.pdf.
Updated 2017. Accessed November 11, 2019.
52. Dinnen S, Simiola V, Cook JM. Post-traumatic stress disorder in older adults: a systematic review of the psychotherapy treatment literature. Aging Ment Health. 2015;19(2):144-150.
53. Jakel RJ. Posttraumatic Stress Disorder in the Elderly. Psychiatr Clin North Am. 2018;41(1):165-175.
54. Thorp SR, Glassman LH, Wells SY, et al. A randomized controlled trial of prolonged exposure therapy versus relaxation training for older veterans with military-related PTSD. J Anxiety Disord. 2019;64:45-54.
55. Kang B, Xu H, McConnell ES. Neurocognitive and psychiatric comorbidities of posttraumatic stress disorder among older veterans: a systematic review. Int J Geriatr Psychiatry. 2019;34(4):522-538.
56. Nasreddine ZS, Phillips NA, Bédirian V, et al. The Montreal Cognitive Assessment, MoCA: a brief screening tool for mild cognitive impairment. J Am Geriatr Soc. 2005;53(4):695-699.
57. Folstein MF, Folstein SE, McHugh PR. “Mini-mental state”. A practical method for grading the cognitive state of patients for the clinician. J Psychiatr Res. 1975;12(3):189-198.
58. Paton D. Traumatic Stress in Police Officers a Career-Length Assessment From Recruitment to Retirement. Springfield, IL: Charles C. Thomas; 2009.
59. Alexander W. Pharmacotherapy for post-traumatic stress disorder in combat veterans: focus on antidepressants and atypical antipsychotic agents. P T. 2012;37(1):32-38.
60. Beck JG, Sloan DM, Friedman MJ. Pharmacotherapy for PTSD. In: The Oxford Handbook of Traumatic Stress Disorders. Oxford University Press; 2012.
61. Waltman SH, Shearer D, Moore BA. Management of posttraumatic nightmares: a review of pharmacologic and nonpharmacologic treatments since 2013. Curr Psychiatry Rep. 2018;20(12):108.
62. Díaz-Gutiérrez MJ, Martínez-Cengotitabengoa M, Sáez de Adana E, et al. Relationship between the use of benzodiazepines and falls in older adults: a systematic review. Maturitas. 2017;101:17-22.
Patient Safety Indicator-12 Rarely Identifies Problems with Quality of Care in Perioperative Venous Thromboembolism
Perioperative venous thromboembolism (VTE) is a major contributor to the morbidity and mortality of hospitalized patients. The historical incidence of postoperative VTE varied between 15%-80% depending on the type of procedure and monitoring strategies. Higher incidences of VTE occurred with major surgery (15%-40%), knee or hip arthroplasty (40%-60%), and trauma (60%-80%).1 The use of VTE prophylaxis with subcutaneous heparin reduced DVTs by 70% and PEs by 50%.2 A recent study from Olmstead County showed improved adherence to inpatient VTE prophylaxis from 2005 to 2010 but no difference in VTE incidence. However, 52% of VTE events were associated with hospitalization.3 As such, VTE continues to be a healthcare-associated adverse event, and surgery remains a significant risk factor for thrombosis.4
The Agency for Healthcare Research and Quality (AHRQ) released Patient Safety Indicators (PSI) in 2003 to provide a means of screening for adverse events.5 Over time, PSIs have been adopted as a measure of hospital performance and are utilized in several pay-for-performance programs. PSI-90 is a composite measure of several other PSIs and is a core metric in the Centers for Medicare and Medicaid Services (CMS) Hospital-Acquired Condition Reduction Program and the Hospital Value-Based Purchasing Program which impacts up to 2% of a hospital’s Medicare payments.6,7 One component of PSI-90 is PSI-12, which captures perioperative VTE. PSI-12 events are identified using software that screens medical records based on International Classification of Diseases (ICD)-9/10 codes for thrombosis and procedure codes at time of discharge.8
Over the last several years, there has been concern regarding the validity of including PSI-12 in pay-for-performance metrics. Common areas for concern include PSI-12’s accuracy in detecting true postoperative VTE9 in addition to surveillance bias.10,11 However, some note that PSI-12 is useful when applied with its original intent: as a screening tool for hospitals to identify specific areas to implement improvements.9,12The aim of our study was to review all PSI-12 events at our institution to evaluate the accuracy of PSI-12 and identify areas for improvement to prevent VTE events in surgical patients. While several other studies have looked at the positive predictive values, accuracy, or surveillance bias of PSI-12, to the best of our knowledge, few, if any, previous studies have reported PSI-12 events in relation to their timing, type of prophylaxis used, and mitigating factors to identify areas for quality improvement.
METHODS
PSI-12 events were identified between June 2015 and June 2017 using AHRQ software (version 5). Cases were also identified through Vizient and reviewed to ensure congruence between the methods. Patients’ electronic medical records were reviewed for patient demographics, type of VTE event, platelet count at VTE diagnosis, procedure type, and both the timing and type of VTE prophylaxis. Summary statistics were calculated.
We considered perioperative VTE pharmacologic prophylaxis appropriate if started within 24 hours of a low bleeding risk procedure or 72 hours of a high-bleeding risk procedure.13 Mechanical prophylaxis was considered appropriate if pharmacologic prophylaxis was not used because of procedure risk, thrombocytopenia, or active bleeding. The medication administration record was reviewed to determine if prophylaxis was ordered, given, and/or refused.
RESULTS
During the two-year period, 18,084 surgeries were performed, and 161 cases of VTE events were identified. A detailed chart review and correction of documentation led to the exclusion of seven cases (4%) because the VTE event occurred prior to admission (n = 5) or were incidental findings that did not meet the Uniform Hospital Discharge Data Set definition for reporting (n = 2). In total, 154 (0.9% of all surgeries) cases were considered PSI-12 events. Pulmonary embolism (PE) occurred in most cases (n = 97, 62.9%), followed by deep vein thrombosis (DVT) (n = 37, 24.0%). Twenty cases (12.9%) experienced concurrent PE and DVT. Within the PE group, 16 cases (14%) were subsegmental PE only. Eight patients (14% of DVT cases) had only a distal DVT. The mean age of patients was 56 years (+/− 16 years), and the majority (59%) were male. The clinical specialties with the most events included neurosurgery (21%), orthopedics (14%), general surgery (13%), and trauma (11%). Fourteen patients (9%) died during the hospitalization, and of these, six (43%) had either sudden death or death attributed to PE (Table 1).
Cases were also reviewed for the type of VTE prophylactic strategy administered at the time of the event. The top three prophylactic strategies were subcutaneous unfractionated heparin (61%), mechanical prophylaxis only (51%), and enoxaparin (31%). Nine cases of VTE occurred during therapeutic anticoagulation (6%; Table 1).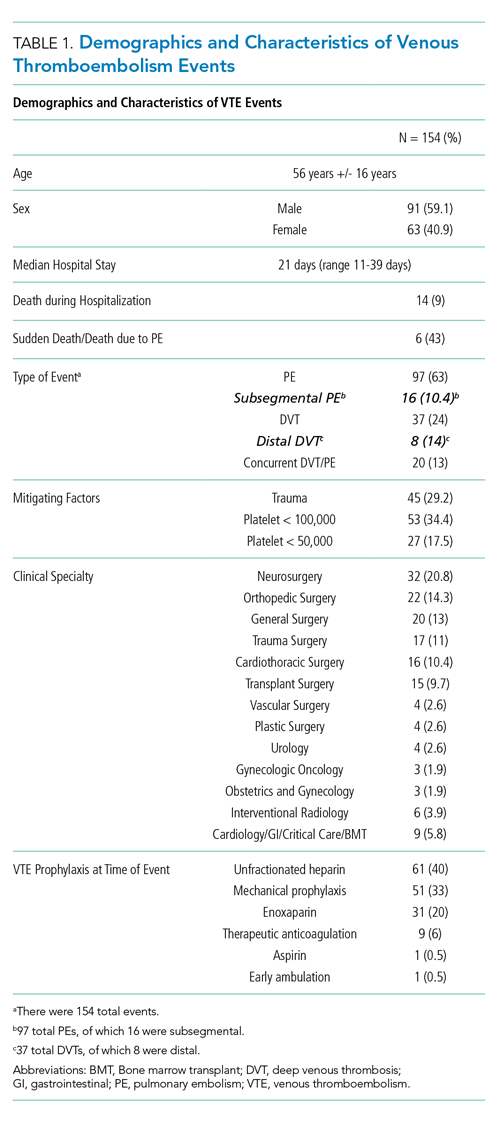
We also evaluated the timing of VTE in relation to hospitalization and procedure. Overall, the median length of hospital stay was 21 days (range: 11-39 days). VTE occurred early in the hospitalization; 21% of cases of VTE occurred within three days of admission, and 43.5% occurred within seven days of admission (Figure 1). With regard to VTE timing in relation to the procedure, 4.5% of cases of VTE occurred prior to the procedure, 33% occurred within three days of the procedure, and 53% occurred within seven days (Figure 2).
Absence of guideline-appropriate VTE prophylaxis was identified in only nine (6%) cases: seven patients had delayed initiation of pharmacologic prophylaxis, and two had pharmacologic prophylaxis held for unknown reasons. When accounting for pharmacologic prophylaxis missed based on patient refusal (n = 10 patients), the number of patients without guideline- appropriate VTE prophylaxis increased to 17 cases (11%), as two of the cases with patient refusal were found to have other quality issues present. Pharmacologic prophylaxis was given to 125 patients during their hospitalization. A median of 8% of ordered doses was refused, and an additional 8% of doses were held for a procedure (Table 2). We evaluated other factors that could have influenced the rate or type of VTE prophylactic strategies toward the use of mechanical prophylaxis, including thrombocytopenia and trauma. Although 11% of cases were treated primarily by the trauma teams (Table 1), a trauma-related procedure accounted for 29% of PSI-12 cases. Thrombocytopenia (platelets of less than 100,000) occurred in 53 cases (34%), with 27 patients (18%) having a platelet count of less than 50,000.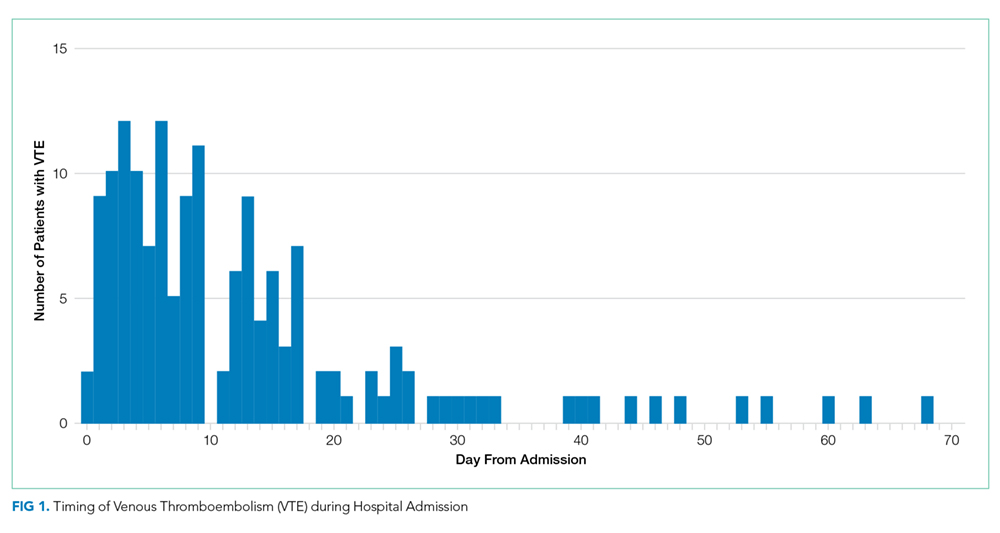
DISCUSSION
Utilizing AHRQ version 5 software for PSI-12, our institution identified 154 cases of perioperative VTE. Most of these cases were a pulmonary embolism, occurred within a week of admission, and were associated with surgical specialties that portend a higher risk of VTE. Very few of these cases were deficient in guideline-directed VTE prophylaxis, and several cases had associated factors such as trauma and thrombocytopenia that may have appropriately influenced the decision to use mechanical only prophylaxis. Sixteen percent of pharmacologic VTE prophylactic doses were refused or held for a procedure, a known but rarely quantified influence on rates of pharmacologic prophylaxis. The use of patient-level data and adjudication of the clinical decision that affected the administration of VTE prophylaxis is a major strength of this work. In all, our data raise several questions about the accuracy of PSI-12 in identifying preventable postoperative VTE, especially as it is utilized as a marker for pay-for-performance measures in addition to identifying further areas for research and improvement.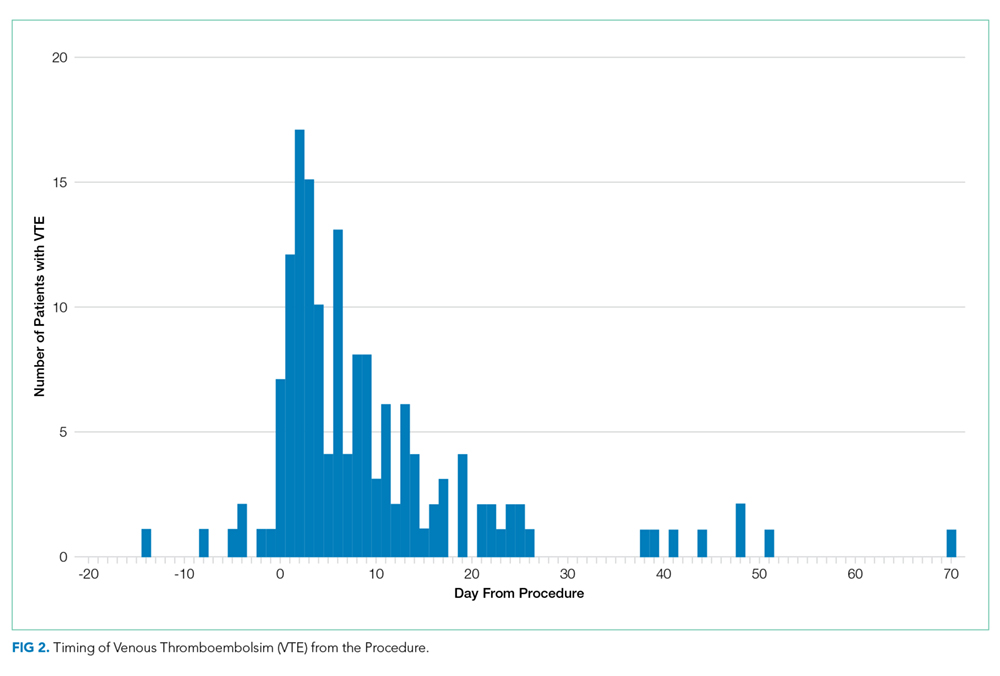
Our results align with previous studies that suggest that PSI-12 is an inaccurate measure of performance quality. A study by Bilimoria et al. in 2013 noted that surveillance biases associated with PSI-12, showing that hospitals with higher compliance to appropriate VTE prophylaxis paradoxically had worse outcomes.10 Furthermore, Blay et al. recently published a study evaluating PSI-90 scores for hospitals with and without the VTE measure included. Their results indicated that larger hospitals (teaching hospitals, level I trauma centers, etc) caring for sicker patients were noted to improve by 8%-25% when the VTE measure was removed.11 Similarly, our data indicate that the PSI-12 may not be an accurate measure of quality performance, as only 6% of cases were noted to be deficient in appropriate guideline-directed prophylaxis. Even when accounting for the refusal of doses of pharmacologic prophylaxis, this figure only increased to 11%.
Procedures included in the current PSI-12 algorithm also vary in the risk they pose to developing VTE. For example, the current version of PSI-12 includes surgical Medicare Severity Diagnosis Related Groups (MS-DRGs) for procedures with a high risk of VTE such as orthopedic, abdominal, or thoracic procedures.14,15, However, it is worth noting that procedures such as tracheostomy and ocular surgery are also included.14 The variation in risk for development of VTE is reflected in the Caprini score, a perioperative risk stratification tool. These latter procedures only contribute one point, whereas trauma would add five points each to the total score, and make the patient a high VTE risk from the procedure alone.16 
While most of our cases of VTE occurred within higher risk surgical subspecialties, 15 (10%) of our cases were within the clinical specialties of interventional radiology, cardiology, gastroenterology, and bone marrow transplant. One procedure of notable conflict includes bronchoalveolar lavage (BAL), which is included as an operating room procedure per the current version of PSI-12 software,17 but is no longer recognized by CMS as a surgical MS-DRG for reimbursement. The PSI-12 observed-to-expected rates take the DRG and comorbidity codes into consideration, but which DRG is selected does not always reflect the procedure type or the risk of VTE associated with the procedure.
Regarding the type of VTE event, our data revealed that PE was the predominant event, accounting for 62% of cases. This is different compared with other studies, such as the population-based studies in which PE and DVT account for approximately 40%-42% of events, respectively, and approximately 15% with concurrent PE and DVT. 9,18 Borzecki et al. however, noted similar rates to our study, with 55% as PE only, 38% as DVT only, and 8% had both PE and DVT. This study also found a positive correlation between PSI-12 rates and VTE imaging rates, such that if more CT scans were completed, more PEs could be found.19 Our data identified 16 of the 97 cases of PE were subsegmental PE, a subset of VTE whose clinical significance has been questioned.20 Excluding these cases brings the percentage closer to 52%. Also, screening ultrasounds are not performed at our institution. Asymptomatic or minimally symptomatic DVTs could be missed.
Further, this study also highlights that the reliability of PSI-12 is dependent on accurate documentation and coding. This is most evident when reviewing studies that evaluated the positive predictive value (PPV) of this measure.9,12,21 A study of 28 Veteran’s Affairs hospitals from 2003 to 2007 used the AHRQ version 3 software to assess the PPV of PSI-12. Out of the 112 cases flagged by the AHRQ PSI software, only 48 were true events of postoperative DVT, yielding a PPV of only 43%. False-positive results were primarily patients with VTE present on admission and cases that were diagnosed after admission but prior to the index procedure. They also noted that coding inaccuracies were present in 38% of cases.9 Similarly, Henderson et al. conducted a retrospective review of 112 postsurgical discharges noting a PPV of 54%, with most false-positives resulting from superficial clots identified by PSI-12 related to coding ambiguity.12 Our data similarly showed false-positive results as seven cases were excluded based on chart review and documentation correction, and 4.5% were preprocedural. However, there is some discordance with previous studies, as our data yields a PPV of 91% for VTE when accounting for preprocedural events as well as those excluded based on chart review. One explanation is an improvement in documentation strategies and coding, as our institution has adopted strategies to review cases and clarify documentation prior to billing to improve accuracy, and inclusion of a checkbox to indicate that a diagnosis was present on admission. Another possibility is improved accuracy with ICD-10 coding, as shown in a paper by Quan et al. that found a 79% PPV of PSI-12, which improved to 89% when cases present on admission were excluded.21 Lastly, we used newer versions of the AHRQ software, which could have improved the accuracy of detection. Despite these improvements in PSI-12 identifying true cases of postoperative VTE, as our data show, there is still much to be desired in terms of identifying issues with the quality of care and inclusion of PSI-12 in pay-for-performance.
Our study has several limitations. As a retrospective review, a major limiting factor is that data obtained are subject to the accuracy of documentation within the provider and nursing notes. As such, we focused on broad topics such as VTE events, the type of VTE event, and timing of the event in relation to admission and procedure. We actively review cases at discharge prior to billing to correct documentation if required. However, a prolonged hospital stay could lead to a review of the case weeks to months later. A real-time alert for a VTE event in a patient with surgery could improve documentation.
Further, although mechanical only prophylaxis was present on chart review, it is impossible to know both the rate of compliance with this method and whether it contributed to some events.
Despite these limitations, our goals of evaluating the validity of PSI-12 and identifying areas for improved measurement and techniques for DVT prophylaxis were met. As previously discussed, our data suggest that PSI-12 has several limitations in identifying quality of care issues with the prevention of DVT. For example, PSI-12 included many cases in which pharmacologic prophylaxis was appropriately not given. Approximately 50% of cases occurred in patients who were thrombocytopenic (platelets < 100,000), and 29% of events occurred in trauma patients. In addition, 33% of cases identified were within three days of the procedure, which, in cases of high-bleeding risk procedures, is an appropriate time to refrain from pharmacologic anticoagulation.13 In cases such as these, it may be worth evaluating alternative forms of mechanical only prophylaxis, or other strategies to mitigate this risk.
This study also highlights areas for further research. Many of the VTE events in this study occurred while patients were treated with appropriate prophylaxis, as other studies have also shown.22,23 Gangireddy et al. looked at demographic and clinical information surrounding postoperative VTE and found several other risk factors that incur a higher risk of VTE, including steroid use, infections, and myocardial infarction.24 Perhaps future studies could target these groups as potential points for increased prophylactic strategies. As noted by Lau et al. appropriate VTE prophylaxis involves risk stratification, ordering the appropriate prophylaxis by clinicians, patient acceptance of prescribed therapy, and nursing administration of prescribed therapy.25 As exemplified by our data, despite appropriate prophylaxis being ordered, eight events were associated solely with the refusal of pharmacologic prophylaxis. An ideal VTE metric would identify patients with a VTE who had a defective VTE prophylactic process,25 but the cost associated with manual data abstraction may limit the inclusion of a process metric into pay-for-performance. Additional research also needs to identify whether modifications to PSI-12 can improve its accuracy and predictive value, such as the exclusion of VTE prior to a procedure, modifications to what counts as a procedure, or utilizing markers to assess adherence to VTE prophylactic rates. These points are especially important to consider if PSI-12 is to remain as one of the key factors in pay-for-performance outcome measures. Lastly, understanding the effectiveness and patient adherence to oral VTE prophylactic regimens could also decrease the rates of refusal of VTE prophylaxis.
Overall, VTE remains a large contributor to morbidity and mortality among hospitalized surgical patients. While there is utility in PSI-12 as a screening tool to identify these events and potential areas for improved processes to decrease VTE, its usefulness for detection of true quality issues and its utilization in pay-for-performance is questionable. The universally high rates of VTE prophylaxis question the need for a VTE prophylactic metric. However, if these metrics are going to continue to be used in determining payments, modifications to the current processes and algorithms are needed to improve accuracy in identifying issues in quality of care.
1. Valsami S, Asmis LM. A brief review of 50 years of perioperative thrombosis and hemostasis management. Semin Hematol. 2013;50(2):79-87. https://doi.org/10.1053/j.seminhematol.2013.04.001.
2. Collins R, Scrimgeour A, Yusuf S, Peto R. Reduction in fatal pulmonary embolism and venous thrombosis by perioperative administration of subcutaneous heparin. N Engl J Med. 1988;318(18):1162-1173. https://doi.org/10.1056/NEJM198805053181805.
3. Heit JA, Crusan DJ, Ashrani AA, Petterson TM, Bailey KR. Effect of a near-universal hospitalization-based prophylaxis regimen on annual number of venous thromboembolism events in the US. Blood. 2017;130(2):109-114. https://doi.org/10.1182/blood-2016-12-758995.
4. Landrigan CP, Parry GJ, Bones CB, Hackbarth AD, Goldmann DA, Sharek PJ. Temporal trends in rates of patient harm resulting from medical care. N Engl J Med. 2010;363(22):2124-2134. https://doi.org/10.1056/NEJMsa1004404.
5. Agency for Healthcare Research and Quality. Patient Safety Indicators Brochure. 2015 Edition. https://www.qualityindicators.ahrq.gov/Downloads/Modules/PSI/V50/PSI_Brochure.pdf. Accessed 10 Jun 2019.
6. Centers for Medicare & Medicaid Services. CMS Hospital Value-Based Purchasing Program Results for Fiscal Year 2018. 2017. https://www.cms.gov/newsroom/fact-sheets/cms-hospital-value-based-purchasing-program-results-fiscal-year-2018. Accessed June 10, 2019.
7. Rajaram R, Barnard C, Bilimoria KY. Concerns about using the patient safety indicator-90 composite in pay-for-performance programs. JAMA. 2015;313(9):897-898. https://doi.org/10.1001/jamacardio.2018.2382.
8. Agency for Healthcare Research and Quality. Patient Safety Indicator 12 (PSI 12) Perioperative Pulmonary Embolism or Deep Vein Thrombosis Rate. 2017. https://www.qualityindicators.ahrq.gov/Downloads/Modules/PSI/V60-ICD09/TechSpecs/PSI_12_Perioperative_Pulmonary_Embolism_or_Deep_Vein_Thrombosis_Rate.pdf. Accessed June 9, 2019.
9. Kaafarani HM, Borzecki AM, Itani KM, et al. Validity of selected patient safety indicators: opportunities and concerns. J Am Coll Surg. 2011;212(6):924-934. https://doi.org/10.1016/j.jamcollsurg.2010.07.007.
10. Bilimoria KY, Chung J, Ju MH, et al. Evaluation of surveillance bias and the validity of the venous thromboembolism quality measure. JAMA. 2013;310(14):1482-1489. https://doi.org/10.1001/jama.2013.280048.
11. Blay E, Jr., Huang R, Chung JW, et al. Evaluating the impact of the venous thromboembolism outcome measure on the PSI 90 composite quality metric. Jt Comm J Qual Patient Saf. 2019;45(3):148-155. https://doi.org/10.1016/j.jcjq.2018.08.009
12. Henderson KE, Recktenwald A, Reichley RM, et al. Clinical validation of the AHRQ postoperative venous thromboembolism patient safety indicator. Jt Comm J Qual Patient Saf. 2009;35(7):370-376.
13. Douketis JD, Spyropoulos AC, Spencer FA, et al. Perioperative management of antithrombotic therapy: antithrombotic therapy and prevention of thrombosis, 9th ed: American College of Chest Physicians Evidence-Based Clinical Practice Guidelines. Chest. 2012;141(2):e326S-e350S. https://doi.org/10.1378/chest.11-2298.
14. Agency for Healthcare Research and Quality. Appendix E: Surgical Discharge MS-DRGs. 2018. https://www.qualityindicators.ahrq.gov/Downloads/Modules/PSI/V2018/TechSpecs/PSI_Appendix_E.pdf. Accessed June 9, 2019.
15. Anderson FA, Jr., Spencer FA. Risk factors for venous thromboembolism. Circulation. 2003;107(23 Suppl 1):I9-16. https://doi.org/10.1161/01.CIR.0000078469.07362.E6.
16. Caprini JA. Thrombosis risk assessment as a guide to quality patient care. Dis Mon. 2005;51(2-3):70-78. https://doi.org/10.1016/j.disamonth.2005.02.003.
17. Agency for Healthcare Research and Quality. Appendix A: Operating Room Procedure Codes. 2018. https://www.qualityindicators.ahrq.gov/Downloads/Modules/PSI/V2018/TechSpecs/PSI_Appendix_A.pdf. Accessed June 9, 2019
18. Silverstein MD, Heit JA, Mohr DN, Petterson TM, O’Fallon WM, Melton LJ, 3rd. Trends in the incidence of deep vein thrombosis and pulmonary embolism: a 25-year population-based study. Arch Intern Med. 1998;158(6):585-593. https://doi.org/10.1001/archinte.158.6.585.
19. Borzecki AM, Chen Q, O’Brien W, et al. The patient safety indicator perioperative pulmonary embolism or deep vein thrombosis: is there associated surveillance bias in the veterans health administration? Am J Surg. 2018;216(5):974-979. https://doi.org/10.1016/j.amjsurg.2018.06.023.
20. Carrier M, Righini M, Wells PS, et al. Subsegmental pulmonary embolism diagnosed by computed tomography: incidence and clinical implications. A systematic review and meta-analysis of the management outcome studies. J Thromb Haemost. 2010;8(8):1716-1722. https://doi.org/10.1111/j.1538-7836.2010.03938.x.
21. Quan H, Eastwood C, Cunningham CT, et al. Validity of AHRQ patient safety indicators derived from ICD-10 hospital discharge abstract data (chart review study). BMJ Open. 2013;3(10):e003716. https://doi.org/10.1136/bmjopen-2013-003716.
22. Flanders SA, Greene MT, Grant P, et al. Hospital performance for pharmacologic venous thromboembolism prophylaxis and rate of venous thromboembolism: a cohort study. JAMA Intern Med. 2014;174(10):1577-1584. https://doi.org/10.1001/jamainternmed.2014.3384.
23. Wang TF, Wong CA, Milligan PE, Thoelke MS, Woeltje KF, Gage BF. Risk factors for inpatient venous thromboembolism despite thromboprophylaxis. Thromb Res. 2014;133(1):25-29. https://doi.org/10.1016/j.thromres.2013.09.011.
24. Gangireddy C, Rectenwald JR, Upchurch GR, et al. Risk factors and clinical impact of postoperative symptomatic venous thromboembolism. J Vass Surg. 2007;45(2):335-341; discussion 341-332. https://doi.org/10.1016/j.jvs.2006.10.034.
25. Lau BD, Streiff MB, Pronovost PJ, Haut ER. Venous thromboembolism quality measures fail to accurately measure quality. Circulation. 2018;137(12):1278-1284. https://doi.org/10.1161/CIRCULATIONAHA.116.026897.
Perioperative venous thromboembolism (VTE) is a major contributor to the morbidity and mortality of hospitalized patients. The historical incidence of postoperative VTE varied between 15%-80% depending on the type of procedure and monitoring strategies. Higher incidences of VTE occurred with major surgery (15%-40%), knee or hip arthroplasty (40%-60%), and trauma (60%-80%).1 The use of VTE prophylaxis with subcutaneous heparin reduced DVTs by 70% and PEs by 50%.2 A recent study from Olmstead County showed improved adherence to inpatient VTE prophylaxis from 2005 to 2010 but no difference in VTE incidence. However, 52% of VTE events were associated with hospitalization.3 As such, VTE continues to be a healthcare-associated adverse event, and surgery remains a significant risk factor for thrombosis.4
The Agency for Healthcare Research and Quality (AHRQ) released Patient Safety Indicators (PSI) in 2003 to provide a means of screening for adverse events.5 Over time, PSIs have been adopted as a measure of hospital performance and are utilized in several pay-for-performance programs. PSI-90 is a composite measure of several other PSIs and is a core metric in the Centers for Medicare and Medicaid Services (CMS) Hospital-Acquired Condition Reduction Program and the Hospital Value-Based Purchasing Program which impacts up to 2% of a hospital’s Medicare payments.6,7 One component of PSI-90 is PSI-12, which captures perioperative VTE. PSI-12 events are identified using software that screens medical records based on International Classification of Diseases (ICD)-9/10 codes for thrombosis and procedure codes at time of discharge.8
Over the last several years, there has been concern regarding the validity of including PSI-12 in pay-for-performance metrics. Common areas for concern include PSI-12’s accuracy in detecting true postoperative VTE9 in addition to surveillance bias.10,11 However, some note that PSI-12 is useful when applied with its original intent: as a screening tool for hospitals to identify specific areas to implement improvements.9,12The aim of our study was to review all PSI-12 events at our institution to evaluate the accuracy of PSI-12 and identify areas for improvement to prevent VTE events in surgical patients. While several other studies have looked at the positive predictive values, accuracy, or surveillance bias of PSI-12, to the best of our knowledge, few, if any, previous studies have reported PSI-12 events in relation to their timing, type of prophylaxis used, and mitigating factors to identify areas for quality improvement.
METHODS
PSI-12 events were identified between June 2015 and June 2017 using AHRQ software (version 5). Cases were also identified through Vizient and reviewed to ensure congruence between the methods. Patients’ electronic medical records were reviewed for patient demographics, type of VTE event, platelet count at VTE diagnosis, procedure type, and both the timing and type of VTE prophylaxis. Summary statistics were calculated.
We considered perioperative VTE pharmacologic prophylaxis appropriate if started within 24 hours of a low bleeding risk procedure or 72 hours of a high-bleeding risk procedure.13 Mechanical prophylaxis was considered appropriate if pharmacologic prophylaxis was not used because of procedure risk, thrombocytopenia, or active bleeding. The medication administration record was reviewed to determine if prophylaxis was ordered, given, and/or refused.
RESULTS
During the two-year period, 18,084 surgeries were performed, and 161 cases of VTE events were identified. A detailed chart review and correction of documentation led to the exclusion of seven cases (4%) because the VTE event occurred prior to admission (n = 5) or were incidental findings that did not meet the Uniform Hospital Discharge Data Set definition for reporting (n = 2). In total, 154 (0.9% of all surgeries) cases were considered PSI-12 events. Pulmonary embolism (PE) occurred in most cases (n = 97, 62.9%), followed by deep vein thrombosis (DVT) (n = 37, 24.0%). Twenty cases (12.9%) experienced concurrent PE and DVT. Within the PE group, 16 cases (14%) were subsegmental PE only. Eight patients (14% of DVT cases) had only a distal DVT. The mean age of patients was 56 years (+/− 16 years), and the majority (59%) were male. The clinical specialties with the most events included neurosurgery (21%), orthopedics (14%), general surgery (13%), and trauma (11%). Fourteen patients (9%) died during the hospitalization, and of these, six (43%) had either sudden death or death attributed to PE (Table 1).
Cases were also reviewed for the type of VTE prophylactic strategy administered at the time of the event. The top three prophylactic strategies were subcutaneous unfractionated heparin (61%), mechanical prophylaxis only (51%), and enoxaparin (31%). Nine cases of VTE occurred during therapeutic anticoagulation (6%; Table 1).
We also evaluated the timing of VTE in relation to hospitalization and procedure. Overall, the median length of hospital stay was 21 days (range: 11-39 days). VTE occurred early in the hospitalization; 21% of cases of VTE occurred within three days of admission, and 43.5% occurred within seven days of admission (Figure 1). With regard to VTE timing in relation to the procedure, 4.5% of cases of VTE occurred prior to the procedure, 33% occurred within three days of the procedure, and 53% occurred within seven days (Figure 2).
Absence of guideline-appropriate VTE prophylaxis was identified in only nine (6%) cases: seven patients had delayed initiation of pharmacologic prophylaxis, and two had pharmacologic prophylaxis held for unknown reasons. When accounting for pharmacologic prophylaxis missed based on patient refusal (n = 10 patients), the number of patients without guideline- appropriate VTE prophylaxis increased to 17 cases (11%), as two of the cases with patient refusal were found to have other quality issues present. Pharmacologic prophylaxis was given to 125 patients during their hospitalization. A median of 8% of ordered doses was refused, and an additional 8% of doses were held for a procedure (Table 2). We evaluated other factors that could have influenced the rate or type of VTE prophylactic strategies toward the use of mechanical prophylaxis, including thrombocytopenia and trauma. Although 11% of cases were treated primarily by the trauma teams (Table 1), a trauma-related procedure accounted for 29% of PSI-12 cases. Thrombocytopenia (platelets of less than 100,000) occurred in 53 cases (34%), with 27 patients (18%) having a platelet count of less than 50,000.
DISCUSSION
Utilizing AHRQ version 5 software for PSI-12, our institution identified 154 cases of perioperative VTE. Most of these cases were a pulmonary embolism, occurred within a week of admission, and were associated with surgical specialties that portend a higher risk of VTE. Very few of these cases were deficient in guideline-directed VTE prophylaxis, and several cases had associated factors such as trauma and thrombocytopenia that may have appropriately influenced the decision to use mechanical only prophylaxis. Sixteen percent of pharmacologic VTE prophylactic doses were refused or held for a procedure, a known but rarely quantified influence on rates of pharmacologic prophylaxis. The use of patient-level data and adjudication of the clinical decision that affected the administration of VTE prophylaxis is a major strength of this work. In all, our data raise several questions about the accuracy of PSI-12 in identifying preventable postoperative VTE, especially as it is utilized as a marker for pay-for-performance measures in addition to identifying further areas for research and improvement.
Our results align with previous studies that suggest that PSI-12 is an inaccurate measure of performance quality. A study by Bilimoria et al. in 2013 noted that surveillance biases associated with PSI-12, showing that hospitals with higher compliance to appropriate VTE prophylaxis paradoxically had worse outcomes.10 Furthermore, Blay et al. recently published a study evaluating PSI-90 scores for hospitals with and without the VTE measure included. Their results indicated that larger hospitals (teaching hospitals, level I trauma centers, etc) caring for sicker patients were noted to improve by 8%-25% when the VTE measure was removed.11 Similarly, our data indicate that the PSI-12 may not be an accurate measure of quality performance, as only 6% of cases were noted to be deficient in appropriate guideline-directed prophylaxis. Even when accounting for the refusal of doses of pharmacologic prophylaxis, this figure only increased to 11%.
Procedures included in the current PSI-12 algorithm also vary in the risk they pose to developing VTE. For example, the current version of PSI-12 includes surgical Medicare Severity Diagnosis Related Groups (MS-DRGs) for procedures with a high risk of VTE such as orthopedic, abdominal, or thoracic procedures.14,15, However, it is worth noting that procedures such as tracheostomy and ocular surgery are also included.14 The variation in risk for development of VTE is reflected in the Caprini score, a perioperative risk stratification tool. These latter procedures only contribute one point, whereas trauma would add five points each to the total score, and make the patient a high VTE risk from the procedure alone.16
While most of our cases of VTE occurred within higher risk surgical subspecialties, 15 (10%) of our cases were within the clinical specialties of interventional radiology, cardiology, gastroenterology, and bone marrow transplant. One procedure of notable conflict includes bronchoalveolar lavage (BAL), which is included as an operating room procedure per the current version of PSI-12 software,17 but is no longer recognized by CMS as a surgical MS-DRG for reimbursement. The PSI-12 observed-to-expected rates take the DRG and comorbidity codes into consideration, but which DRG is selected does not always reflect the procedure type or the risk of VTE associated with the procedure.
Regarding the type of VTE event, our data revealed that PE was the predominant event, accounting for 62% of cases. This is different compared with other studies, such as the population-based studies in which PE and DVT account for approximately 40%-42% of events, respectively, and approximately 15% with concurrent PE and DVT. 9,18 Borzecki et al. however, noted similar rates to our study, with 55% as PE only, 38% as DVT only, and 8% had both PE and DVT. This study also found a positive correlation between PSI-12 rates and VTE imaging rates, such that if more CT scans were completed, more PEs could be found.19 Our data identified 16 of the 97 cases of PE were subsegmental PE, a subset of VTE whose clinical significance has been questioned.20 Excluding these cases brings the percentage closer to 52%. Also, screening ultrasounds are not performed at our institution. Asymptomatic or minimally symptomatic DVTs could be missed.
Further, this study also highlights that the reliability of PSI-12 is dependent on accurate documentation and coding. This is most evident when reviewing studies that evaluated the positive predictive value (PPV) of this measure.9,12,21 A study of 28 Veteran’s Affairs hospitals from 2003 to 2007 used the AHRQ version 3 software to assess the PPV of PSI-12. Out of the 112 cases flagged by the AHRQ PSI software, only 48 were true events of postoperative DVT, yielding a PPV of only 43%. False-positive results were primarily patients with VTE present on admission and cases that were diagnosed after admission but prior to the index procedure. They also noted that coding inaccuracies were present in 38% of cases.9 Similarly, Henderson et al. conducted a retrospective review of 112 postsurgical discharges noting a PPV of 54%, with most false-positives resulting from superficial clots identified by PSI-12 related to coding ambiguity.12 Our data similarly showed false-positive results as seven cases were excluded based on chart review and documentation correction, and 4.5% were preprocedural. However, there is some discordance with previous studies, as our data yields a PPV of 91% for VTE when accounting for preprocedural events as well as those excluded based on chart review. One explanation is an improvement in documentation strategies and coding, as our institution has adopted strategies to review cases and clarify documentation prior to billing to improve accuracy, and inclusion of a checkbox to indicate that a diagnosis was present on admission. Another possibility is improved accuracy with ICD-10 coding, as shown in a paper by Quan et al. that found a 79% PPV of PSI-12, which improved to 89% when cases present on admission were excluded.21 Lastly, we used newer versions of the AHRQ software, which could have improved the accuracy of detection. Despite these improvements in PSI-12 identifying true cases of postoperative VTE, as our data show, there is still much to be desired in terms of identifying issues with the quality of care and inclusion of PSI-12 in pay-for-performance.
Our study has several limitations. As a retrospective review, a major limiting factor is that data obtained are subject to the accuracy of documentation within the provider and nursing notes. As such, we focused on broad topics such as VTE events, the type of VTE event, and timing of the event in relation to admission and procedure. We actively review cases at discharge prior to billing to correct documentation if required. However, a prolonged hospital stay could lead to a review of the case weeks to months later. A real-time alert for a VTE event in a patient with surgery could improve documentation.
Further, although mechanical only prophylaxis was present on chart review, it is impossible to know both the rate of compliance with this method and whether it contributed to some events.
Despite these limitations, our goals of evaluating the validity of PSI-12 and identifying areas for improved measurement and techniques for DVT prophylaxis were met. As previously discussed, our data suggest that PSI-12 has several limitations in identifying quality of care issues with the prevention of DVT. For example, PSI-12 included many cases in which pharmacologic prophylaxis was appropriately not given. Approximately 50% of cases occurred in patients who were thrombocytopenic (platelets < 100,000), and 29% of events occurred in trauma patients. In addition, 33% of cases identified were within three days of the procedure, which, in cases of high-bleeding risk procedures, is an appropriate time to refrain from pharmacologic anticoagulation.13 In cases such as these, it may be worth evaluating alternative forms of mechanical only prophylaxis, or other strategies to mitigate this risk.
This study also highlights areas for further research. Many of the VTE events in this study occurred while patients were treated with appropriate prophylaxis, as other studies have also shown.22,23 Gangireddy et al. looked at demographic and clinical information surrounding postoperative VTE and found several other risk factors that incur a higher risk of VTE, including steroid use, infections, and myocardial infarction.24 Perhaps future studies could target these groups as potential points for increased prophylactic strategies. As noted by Lau et al. appropriate VTE prophylaxis involves risk stratification, ordering the appropriate prophylaxis by clinicians, patient acceptance of prescribed therapy, and nursing administration of prescribed therapy.25 As exemplified by our data, despite appropriate prophylaxis being ordered, eight events were associated solely with the refusal of pharmacologic prophylaxis. An ideal VTE metric would identify patients with a VTE who had a defective VTE prophylactic process,25 but the cost associated with manual data abstraction may limit the inclusion of a process metric into pay-for-performance. Additional research also needs to identify whether modifications to PSI-12 can improve its accuracy and predictive value, such as the exclusion of VTE prior to a procedure, modifications to what counts as a procedure, or utilizing markers to assess adherence to VTE prophylactic rates. These points are especially important to consider if PSI-12 is to remain as one of the key factors in pay-for-performance outcome measures. Lastly, understanding the effectiveness and patient adherence to oral VTE prophylactic regimens could also decrease the rates of refusal of VTE prophylaxis.
Overall, VTE remains a large contributor to morbidity and mortality among hospitalized surgical patients. While there is utility in PSI-12 as a screening tool to identify these events and potential areas for improved processes to decrease VTE, its usefulness for detection of true quality issues and its utilization in pay-for-performance is questionable. The universally high rates of VTE prophylaxis question the need for a VTE prophylactic metric. However, if these metrics are going to continue to be used in determining payments, modifications to the current processes and algorithms are needed to improve accuracy in identifying issues in quality of care.
1. Valsami S, Asmis LM. A brief review of 50 years of perioperative thrombosis and hemostasis management. Semin Hematol. 2013;50(2):79-87. https://doi.org/10.1053/j.seminhematol.2013.04.001.
2. Collins R, Scrimgeour A, Yusuf S, Peto R. Reduction in fatal pulmonary embolism and venous thrombosis by perioperative administration of subcutaneous heparin. N Engl J Med. 1988;318(18):1162-1173. https://doi.org/10.1056/NEJM198805053181805.
3. Heit JA, Crusan DJ, Ashrani AA, Petterson TM, Bailey KR. Effect of a near-universal hospitalization-based prophylaxis regimen on annual number of venous thromboembolism events in the US. Blood. 2017;130(2):109-114. https://doi.org/10.1182/blood-2016-12-758995.
4. Landrigan CP, Parry GJ, Bones CB, Hackbarth AD, Goldmann DA, Sharek PJ. Temporal trends in rates of patient harm resulting from medical care. N Engl J Med. 2010;363(22):2124-2134. https://doi.org/10.1056/NEJMsa1004404.
5. Agency for Healthcare Research and Quality. Patient Safety Indicators Brochure. 2015 Edition. https://www.qualityindicators.ahrq.gov/Downloads/Modules/PSI/V50/PSI_Brochure.pdf. Accessed 10 Jun 2019.
6. Centers for Medicare & Medicaid Services. CMS Hospital Value-Based Purchasing Program Results for Fiscal Year 2018. 2017. https://www.cms.gov/newsroom/fact-sheets/cms-hospital-value-based-purchasing-program-results-fiscal-year-2018. Accessed June 10, 2019.
7. Rajaram R, Barnard C, Bilimoria KY. Concerns about using the patient safety indicator-90 composite in pay-for-performance programs. JAMA. 2015;313(9):897-898. https://doi.org/10.1001/jamacardio.2018.2382.
8. Agency for Healthcare Research and Quality. Patient Safety Indicator 12 (PSI 12) Perioperative Pulmonary Embolism or Deep Vein Thrombosis Rate. 2017. https://www.qualityindicators.ahrq.gov/Downloads/Modules/PSI/V60-ICD09/TechSpecs/PSI_12_Perioperative_Pulmonary_Embolism_or_Deep_Vein_Thrombosis_Rate.pdf. Accessed June 9, 2019.
9. Kaafarani HM, Borzecki AM, Itani KM, et al. Validity of selected patient safety indicators: opportunities and concerns. J Am Coll Surg. 2011;212(6):924-934. https://doi.org/10.1016/j.jamcollsurg.2010.07.007.
10. Bilimoria KY, Chung J, Ju MH, et al. Evaluation of surveillance bias and the validity of the venous thromboembolism quality measure. JAMA. 2013;310(14):1482-1489. https://doi.org/10.1001/jama.2013.280048.
11. Blay E, Jr., Huang R, Chung JW, et al. Evaluating the impact of the venous thromboembolism outcome measure on the PSI 90 composite quality metric. Jt Comm J Qual Patient Saf. 2019;45(3):148-155. https://doi.org/10.1016/j.jcjq.2018.08.009
12. Henderson KE, Recktenwald A, Reichley RM, et al. Clinical validation of the AHRQ postoperative venous thromboembolism patient safety indicator. Jt Comm J Qual Patient Saf. 2009;35(7):370-376.
13. Douketis JD, Spyropoulos AC, Spencer FA, et al. Perioperative management of antithrombotic therapy: antithrombotic therapy and prevention of thrombosis, 9th ed: American College of Chest Physicians Evidence-Based Clinical Practice Guidelines. Chest. 2012;141(2):e326S-e350S. https://doi.org/10.1378/chest.11-2298.
14. Agency for Healthcare Research and Quality. Appendix E: Surgical Discharge MS-DRGs. 2018. https://www.qualityindicators.ahrq.gov/Downloads/Modules/PSI/V2018/TechSpecs/PSI_Appendix_E.pdf. Accessed June 9, 2019.
15. Anderson FA, Jr., Spencer FA. Risk factors for venous thromboembolism. Circulation. 2003;107(23 Suppl 1):I9-16. https://doi.org/10.1161/01.CIR.0000078469.07362.E6.
16. Caprini JA. Thrombosis risk assessment as a guide to quality patient care. Dis Mon. 2005;51(2-3):70-78. https://doi.org/10.1016/j.disamonth.2005.02.003.
17. Agency for Healthcare Research and Quality. Appendix A: Operating Room Procedure Codes. 2018. https://www.qualityindicators.ahrq.gov/Downloads/Modules/PSI/V2018/TechSpecs/PSI_Appendix_A.pdf. Accessed June 9, 2019
18. Silverstein MD, Heit JA, Mohr DN, Petterson TM, O’Fallon WM, Melton LJ, 3rd. Trends in the incidence of deep vein thrombosis and pulmonary embolism: a 25-year population-based study. Arch Intern Med. 1998;158(6):585-593. https://doi.org/10.1001/archinte.158.6.585.
19. Borzecki AM, Chen Q, O’Brien W, et al. The patient safety indicator perioperative pulmonary embolism or deep vein thrombosis: is there associated surveillance bias in the veterans health administration? Am J Surg. 2018;216(5):974-979. https://doi.org/10.1016/j.amjsurg.2018.06.023.
20. Carrier M, Righini M, Wells PS, et al. Subsegmental pulmonary embolism diagnosed by computed tomography: incidence and clinical implications. A systematic review and meta-analysis of the management outcome studies. J Thromb Haemost. 2010;8(8):1716-1722. https://doi.org/10.1111/j.1538-7836.2010.03938.x.
21. Quan H, Eastwood C, Cunningham CT, et al. Validity of AHRQ patient safety indicators derived from ICD-10 hospital discharge abstract data (chart review study). BMJ Open. 2013;3(10):e003716. https://doi.org/10.1136/bmjopen-2013-003716.
22. Flanders SA, Greene MT, Grant P, et al. Hospital performance for pharmacologic venous thromboembolism prophylaxis and rate of venous thromboembolism: a cohort study. JAMA Intern Med. 2014;174(10):1577-1584. https://doi.org/10.1001/jamainternmed.2014.3384.
23. Wang TF, Wong CA, Milligan PE, Thoelke MS, Woeltje KF, Gage BF. Risk factors for inpatient venous thromboembolism despite thromboprophylaxis. Thromb Res. 2014;133(1):25-29. https://doi.org/10.1016/j.thromres.2013.09.011.
24. Gangireddy C, Rectenwald JR, Upchurch GR, et al. Risk factors and clinical impact of postoperative symptomatic venous thromboembolism. J Vass Surg. 2007;45(2):335-341; discussion 341-332. https://doi.org/10.1016/j.jvs.2006.10.034.
25. Lau BD, Streiff MB, Pronovost PJ, Haut ER. Venous thromboembolism quality measures fail to accurately measure quality. Circulation. 2018;137(12):1278-1284. https://doi.org/10.1161/CIRCULATIONAHA.116.026897.
© 2019 Society of Hospital Medicine