User login
Prevalence and Predictors of Lower Limb Amputation in the Spinal Cord Injury Population
At the James A. Haley Veterans’ Hospital (JAHVH) in Tampa, Florida, the prevalence of amputations among patients at the spinal cord injury (SCI) center seems high. Despite limited data demonstrating altered hemodynamics in the lower extremities (LEs) among the SCI population and increased frequency of peripheral arterial disease (PAD), amputations among patients with SCI have received little attention in research.1-3
In the United States, most amputations are caused by vascular disease related to peripheral arterial disease (PAD) and diabetes mellitus (DM).4 PAD primarily affects the LEs and is caused by atherosclerotic obstruction leading to insufficient blood flow. PAD can present clinically as LE pain, nonhealing ulcers, nonpalpable distal pulses, shiny or cold skin, absence of hair on the LE, or distal extremity pallor when the affected extremity is elevated. However, PAD is often asymptomatic. The diagnosis of PAD is typically made with an ankle-brachial index (ABI) ≤ 0.9.5 The prevalence of PAD is about 4.3% in Americans aged ≥ 40 years, increases with age, and is almost twice as common among Black Americans compared with that of White Americans.6 Many studies in SCI populations have documented an increased prevalence of DM, dyslipidemia, obesity, hypertension (HTN), and cigarette smoking.7-9 PAD shares these risk factors with coronary artery disease (CAD), but relative to CAD, tobacco smoking was a more substantial causative factor for PAD.10 Given the preponderance of associated risk factors in this population, PAD is likely more prevalent among patients with SCI than in the population without disabilities. Beyond these known risk factors, researchers hypothesized that SCI contributes to vascular disease by altering arterial function. However, this is still a topic of debate.11-13 Trauma also is a common cause of amputation, accounting for 45% of amputations in 2005.4 Patients with SCI may experience traumatic amputations simultaneously as their SCI, but they may also be predisposed to traumatic amputations related to osteopenia and impaired sensation.
Since amputation is an invasive surgery, knowing the severity of this issue is important in the SCI population. This study quantifies the prevalence of amputations of the LEs among the patients at our SCI center. It then characterizes these amputations’ etiology, their relationship with medical comorbidities, and certain SCI classifications.
Methods
This retrospective cohort study used the US Department of Veterans Affairs (VA) Computerized Patient Record System. The cohort was defined as all patients who received an annual examination at our SCI center over 4 years from October 1, 2009 to September 30, 2013. Annual examination includes a physical examination, relevant surveillance laboratory tests, and imaging, such as renal ultrasound for those with indwelling urinary catheters. One characteristic of the patient population in the VA system is that diagnoses, such as multiple sclerosis (MS) and amyotrophic lateral sclerosis (ALS), that involve spinal cord lesions causing symptoms are included in the registry, besides those with other traumatic or nontraumatic SCI. October 1 to September 30 was chosen based on the VA fiscal year (FY).
During this period, 1678 patients had an annual examination. Of those, 299 patients had an SCI etiology of ALS or MS, and 41 had nonfocal SCI etiology that could not be assessed using the American Spinal Injury Association Impairment Scale (AIS) and were excluded. Also excluded were 283 patients who did not have an annual examination during the specified time span. Some patients do not have an annual examination every year; for those with multiple annual examinations during that time frame, the most recent was used.
One thousand fifty-five patients were included in the statistical analysis. Date of birth, sex, race, ethnicity, date of death, smoking status, DM diagnosis, HTN diagnosis, use of an antiplatelet, antihypertensive, or lipid-lowering agent, blood pressure, hemoglobin A1c, and lipid panel were collected. The amputation level and etiology were noted. The levels of amputation were classified as toe/partial foot,
Statistical Analysis
Descriptive data were summarized as the median and IQR for continuous variables or the number and percentage for categorical variables. The χ2 test was used to analyze the association between categorical variables and amputation status. A nonparametric Wilcoxon test was used to investigate the distribution of continuous variables across patients with amputation and patients without amputation. Binary logistic regression analysis was used to investigate amputation risk factors. We report goodness of fit using the Hosmer and Lemeshow test and the area under the curve (AUC) for the multivariate model. Statistical significance was prespecified at a 2-sided P < .05. SAS version 9.4 was used for all statistical analyses.
Results
Mean age was approximately 61 years for the 91 patients at the time of the most recent amputation (Table 1). Among those with amputation, 63% were paraplegic and 37% were tetraplegic.
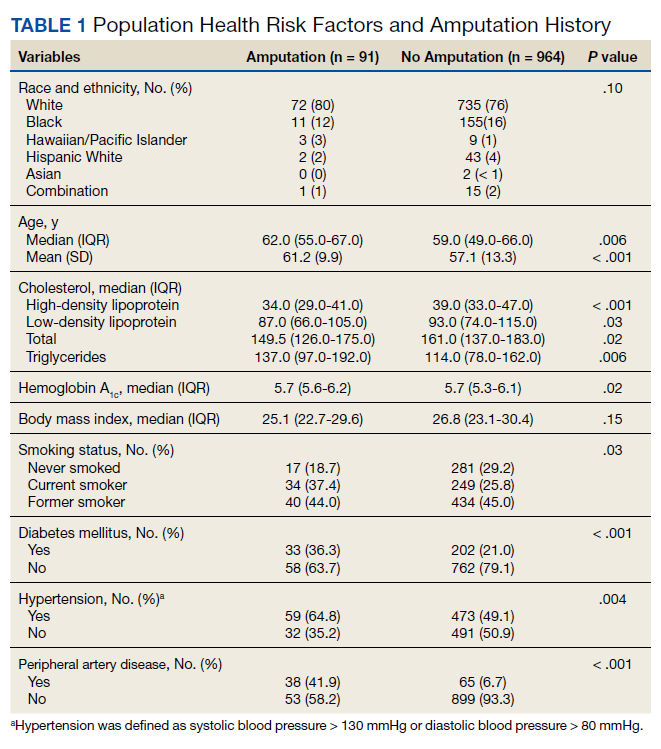
Of 1055 patients with SCI, 91 (8.6%) patients had an amputation. Of those, 70 (76.1%) were from nontraumatic causes (dysvascular), 17 (18.5%) were traumatic, 4 (4.3%) were from other causes (ie, cancer), and only 1 (1.1%) was of unknown cause.
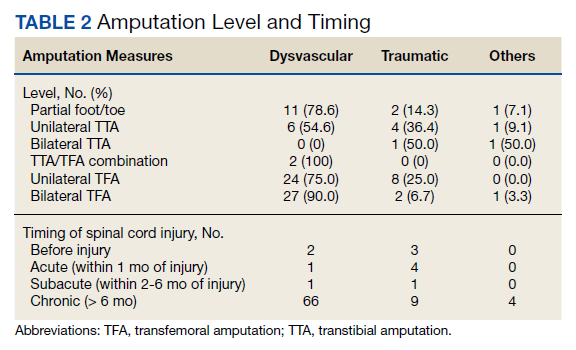
Of the 91 patients with amputation, 64 (69.6%) had at least 1 TFA—33 were unilateral and 31 were bilateral. Two patients had a TFA on one side and a TTA on the other. Partial foot/toe and TTA were less common amputation levels with 14 (15.4%) and 13 (14.3%), respectively. Most amputations (86.8%) occurred over 6 months from the day of initial SCI, and were most commonly dysvascular (Table 2). Traumatic amputation occurred more evenly at various stages, pre-SCI, during acute SCI, subacute SCI, and chronic SCI.
Injury by Impairment Scale Level
Forty-nine (11.5%) of 426 patients with AIS level A SCI had undergone amputation. In order of prevalence, 23 (46.9%) were unilateral TFA, 17 (34.6%) were bilateral TFA, 10.2% were partial foot/toe, 4.1% were unilateral TTA, and 4.1% were a TTA/TFA combination. Both hip and knee disarticulations were classified in the TFA category.
Sixteen (13.0%) of 123 patients with AIS level B SCI had undergone amputation; 5 (31.3%) of those amputations were unilateral TFA, 6 (37.5%) were bilateral TFA, 3 (18.8%) were partial toe or foot, and 1 (6.3%) was for unilateral and bilateral TTA each.
Twelve (8.4%) of 143 patients with AIS level C SCI had undergone amputation: 6 (50.0%) were bilateral TFA; 3 (25.0%) were unilateral TFA; and 3 (25.0%) were unilateral TTA.
Fourteen (3.9%) of 356 patients with AIS level D SCI had undergone amputation. Of those 6 (42.9%) underwent a partial foot/toe amputation; 5 (35.7%) had undergone a unilateral TTA, and 1 (7.1%) underwent amputation in each of the following categories: bilateral TTA, unilateral TFA, and bilateral TFA each.
None of the 7 individuals with AIS E level SCI had undergone amputation.
Health Risk Factors
Of the 91 patients with amputation, the majority (81.3%) were either former or current smokers. Thirty-six percent of those who had undergone amputation had a diagnosis of DM, while only 21% of those who had not undergone amputation had a diagnosis of DM.
At the time of their annual examination 532 patients had a diagnosis of HTN while 523 patients did not. Among patients with amputations, 59 (64.8%) had HTN, while 32 (35.2%) did not. Of the 964 patients without amputation, the prevalence of HTN was 50.9%
.Of 1055 patients with SCI, only 103 (9.8%) had a PAD diagnosis, including 38 (41.9%) patients with amputation. Just 65 (6.7%) patients with SCI without amputation had PAD (P < .001). PAD is highly correlated with dysvascular causes of amputation. Among those with amputations due to dysvascular etiology, 50.0% (35/70) had PAD, but for the 21 amputations due to nondysvascular etiology, only 3 (14.3%) had PAD (P = .004).
Amputation Predictive Model
A multivariate logistic regression analysis was used to build a predictive model for amputation among patients with SCI while controlling for covariates. In our multivariate analysis, high-density lipoprotein cholesterol (HDL-C), tetraplegia, and PAD were predictive factors for amputation. Patients with SCI who had PAD were 8.6 times more likely to undergo amputation compared to those without PAD (odds ratio [OR], 9.8; P < .001; 95% CI, 5.9-16.3). Every unit of HDL-C decreased the odds of amputation by 5% (OR, 0.95; P < .001; 95% CI, 0.93-0.98).
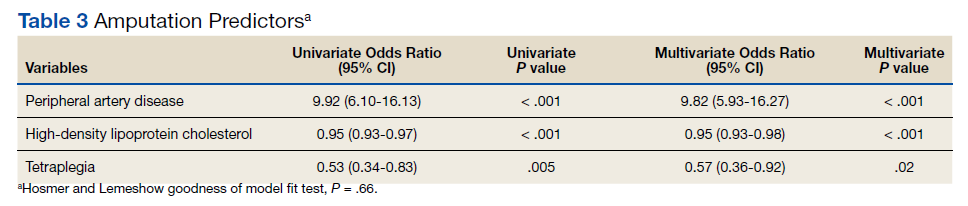
Having tetraplegia decreased the odds of amputation by 43%, compared with those with paraplegia (OR, 0.57; P = .02; 95% CI, 0.36 - 0.92). AUC was 0.76, and the Hosmer and Lemeshow goodness of model fit test P value was .66, indicating the good predictive power of the model (Table 3).
Discussion
In the US, 54 to 82% of amputations occur secondary to chronic vascular disease. Our study showed similar results: 76.1% of amputations were dysvascular.4,16 Even in a 2019 systematic review, the most recent prevalence of amputation data was in 2005.17 The study concluded that among the general population in the US, prevalence of amputation was estimated to be 1 in 190 people, or about 0.5% of the population.4 We found that the prevalence of amputation among the SCI population in this study was 8.7%. This result is consistent with our initial hypothesis that the prevalence of amputation would be higher among the people with SCI. Using a different case acquisition method, Svircev and colleagues reported that about a 4% prevalence of LE amputation among veterans with chronic SCI (over 1 year from the initial SCI), with an emphasis that it was not a study of amputation incidence.18 In comparison, we calculated a 7.5% prevalence of amputation during the chronic SCI stage, which showed institutional variation and a consistent observation that LE amputations occurred more frequently in the SCI population.
Our results showed a positive correlation between the completeness of injury and the prevalence of amputation. Those individuals with a motor complete injury, AIS A (40.3%) or AIS B (11.7%) account for approximately half of all amputations in our population with SCI. Another finding was that proximal amputations were more frequent with more neurologically complete SCIs. Of those with an injury classified as AIS A and an amputation, 42 of 49 subjects underwent at least 1 TFA (23 were unilateral TFA, 17 were bilateral TFA, 2 were a TFA/TTA combination). Of those with an AIS B injury and an amputation, 11 of 16 subjects (68.8%) had at least 1 TFA (5 unilateral TFA and 6 bilateral TFA). Among patients with AIS C injury and amputation, 75% had a TFA. At the same time, only 13.3% of all amputations were at the transfemoral level in those with an AIS D injury. None of the participants with an injury classified as AIS E had undergone an amputation.
Given a paucity of literature available regarding amputation levels in patients with SCI, a discussion with a JAHVH vascular surgeon helped explain the rationale behind different levels of amputation among the SCI population—TFA was performed in 64 of 91 cases (70%). Institutionally, TFAs were performed more often because this level had the greatest chance of healing, avoiding infection, and eliminating knee contracture issues, which may affect quality of life. This was believed to be the best option in those individuals who were already nonambulatory. Although this study did not collect data on ambulatory status, this helps explain why those with an SCI classification of AIS D were more likely to have had a more distal amputation to preserve current or a future chance of ambulation, provided that whether the limb is salvageable is the priority of surgical decision.
The prevalence of PAD among veterans is generally higher than it is in the nonveteran population. Studies show that the prevalence of PAD risk factors in the veteran population exceeds national estimates. Nearly two-thirds of veterans have HTN, 1 in 4 has DM, and 1 in 4 is a current smoker, placing veterans at a significantly increased risk of PADand, therefore, amputation.19,20 These rates were about the same or greater in our SCI population: 50.4% had HTN, 22.3% had a diagnosis of DM, and 71.8% smoked previously or currently smoked. In 3 large studies, HTN was second only to current smoking as the most attributable risk factor for PAD.21
Ongoing research by JAHVH vascular surgeons suggests that patients with SCI were younger and less likely to have HTN, PAD, and/or CAD compared with patients undergoing TFA without SCI. Additionally, patients with SCI had better postoperative outcomes in terms of 30-day mortality, 3-year mortality, and had no increased rate of surgical revisions, strokes, or wound-healing complications. This supports the previous thought that the AIS classification plays a large role in determining amputation levels.
One result in this study is that paraplegia is one of the predictors of future amputation compared with tetraplegia. To our knowledge, there is no literature that supports or explains this finding. A hypothetical factor that could explain this observation is the difference in duration of survival—those with paraplegia who live longer are more likely to experience end-stage consequence of vascular diseases. Another proposed factor is that those with paraplegia are generally more active and have a higher likelihood of sustaining a traumatic cause of amputation, even though this etiology of amputation is minor.An unexpected finding in our study was that of 1055 patients with SCI, only 9.8% had a PAD diagnosis. In contrast, 41.3% of those with amputation had a PAD diagnosis. JAHVH does not screen for PAD, so this likely represents only the symptomatic cases.
Diagnosing PAD in patients with SCI is challenging as they may lack classic clinical symptoms, such as pain with ambulation and impotence, secondary to their neurologic injury. Instead, the health care practitioner must rely on physical signs, such as necrosis.22 Of note given the undetermined utility of diagnosing PAD in patients with SCI, early endovascular interventions are not typically performed. We could not find literature regarding when intervention for PAD in patients with SCI should be performed or how frequently those with SCI should be assessed for PAD. One study showed impaired ambulation prior to limb salvage procedures was associated with poor functional outcomes in terms of survival, independent living, and ambulatory status.23 This could help explain why endovascular procedures are done relatively infrequently in this population. With the lack of studies regarding PAD in the SCI population, outcomes analysis of these patients, including the rate of initial interventions, re-intervention for re-amputation (possibly at a higher level), or vascular inflow procedures, are needed.
It would be beneficial for future studies to examine whether inflammatory markers, such as C-reactive protein (CRP), were more elevated in patients with SCI who underwent amputation compared with those who did not. Chronic underlying inflammation has been shown to be a risk factor for PAD. One study showed that, independently of other risk factors, elevated CRP levels roughly tripled the risk of developing PAD.24 This study suggested that there is an increased risk of dysvascular amputation among the SCI population at this center. This information is significant because it can help influence JAHVH clinical practice for veterans with SCI and vascular diseases.
Limitations
As a single-center study carried out at an SCI specialized center of a VA hospital, this study's finding may not be generalizable. Incomplete documentation in the health record may have led to underreporting of amputations and other information. The practice of the vascular surgeons at JAHVH may not represent the approach of vascular surgeons nationwide. Another limitation of this study is that the duration of SCI was not considered when looking at health risk factors associated with amputation in the SCI population (ie, total cholesterol, hemoglobin A1c, etc). Finally, the medication regimens were not reviewed to determine whether they meet the standard of care in relation to eventual diagnosis of PAD.
A prospective study comparing the prevalence of amputation between veterans with SCI vs veterans without SCI could better investigate the difference in amputation risks. This study only compared our veterans with SCI in reference to the general population. Veterans are more likely to be smokers than the general population, contributing to PAD.17 In addition, data regarding patients’ functional status in regard to transferring and ambulation before and after amputation were not collected, which would have contributed to an understanding of how amputation affects functional status in this population.
Conclusions
There is an increased prevalence of amputation among veterans with SCI compared with that of the nationwide population and a plurality were TFAs. This data suggest that those with a motor complete SCI are more likely to undergo a more proximal amputation. This is likely secondary to a lower likelihood of ambulation with more neurologically complete injuries along with a greater chance of healing with a more proximal amputation. It is challenging to correlate any variables specific to SCI (ie, immobility, time since injury, level of injury, etc) with an increased risk of amputation as the known comorbidities associated with PAD are highly prevalent in this population. Having PAD, low HDL-C (< 40 mg/dL), and paraplegia instead of tetraplegia were independent predictors of amputation.
Health care professionals need to be aware of the high prevalence of amputation in the SCI population. Comorbidities should be aggressively treated as PAD, in addition to being associated with amputation, has been linked with increased mortality.25 Studies using a larger population and multiple centers are needed to confirm such a concerning finding.
Acknowledgments
This material is based on work supported (or supported in part) with resources and the use of facilities at the James A. Haley Veterans’ Hospital (JAHVH). Authors gratefully acknowledge the inputs and support of Dr. James Brooks, MD, RPVI, assistant professor of surgery, University of South Florida (USF), and attending surgeon, vascular surgery service, medical director of the peripheral vascular laboratory, JAHVH; and Dr. Kevin White, MD, assistant professor, USF, and Chief of Spinal Cord Injury Center, JAHVH.
1. Hopman MT, Nommensen E, van Asten WN, Oeseburg B, Binkhorst RA. Properties of the venous vascular system in the lower extremities of individuals with paraplegia. Paraplegia. 1994;32(12):810-816. doi:10.1038/sc.1994.128
2. Theisen D, Vanlandewijck Y, Sturbois X, Francaux M. Central and peripheral haemodynamics in individuals with paraplegia during light and heavy exercise. J Rehabil Med. 2001;33(1):16-20. doi:10.1080/165019701300006489
3. Bell JW, Chen D, Bahls M, Newcomer SC. Evidence for greater burden of peripheral arterial disease in lower extremity arteries of spinal cord-injured individuals. Am J Physiol Heart Circ Physiol. 2011;301(3):H766-H772. doi:10.1152/ajpheart.00507.2011
4. Ziegler-Graham K, MacKenzie EJ, Ephraim PL, Travison TG, Brookmeyer R. Estimating the prevalence of limb loss in the United States: 2005 to 2050. Arch Phys Med Rehabil. 2008;89(3):422-429. doi:10.1016/j.apmr.2007.11.005
5. Hennion DR, Siano KA. Diagnosis and treatment of peripheral arterial disease. Am Fam Physician. 2013;88(5):306-310.
6. Selvin E, Erlinger TP. Prevalence of and risk factors for peripheral arterial disease in the United States: results from the National Health and Nutrition Examination Survey, 1999-2000. Circulation. 2004;110(6):738-743. doi:10.1161/01.CIR.0000137913.26087.F0
7. Bauman WA, Spungen AM. Disorders of carbohydrate and lipid metabolism in veterans with paraplegia or quadriplegia: a model of premature aging. Metabolism. 1994;43(6):749-756. doi:10.1016/0026-0495(94)90126-0
8. Jörgensen S, Hill M, Lexell J. Cardiovascular risk factors among older adults with long-term spinal cord injury. PM R. 2019;11(1):8-16. doi:10.1016/j.pmrj.2018.06.008
9. Wu JC, Chen YC, Liu L, et al. Increased risk of stroke after spinal cord injury: a nationwide 4-year follow-up cohort study. Neurology. 2012;78(14):1051-1057. doi:10.1212/WNL.0b013e31824e8eaa
10. Price JF, Mowbray PI, Lee AJ, Rumley A, Lowe GD, Fowkes FG. Relationship between smoking and cardiovascular risk factors in the development of peripheral arterial disease and coronary artery disease: Edinburgh Artery Study. Eur Heart J. 1999;20(5):344-353. doi:10.1053/euhj.1998.1194
11. Bell JW, Chen D, Bahls M, Newcomer SC. Altered resting hemodynamics in lower-extremity arteries of individuals with spinal cord injury. J Spinal Cord Med. 2013;36(2):104-111. doi:10.1179/2045772312Y.0000000052
12. Miyatani M, Masani K, Oh PI, Miyachi M, Popovic MR, Craven BC. Pulse wave velocity for assessment of arterial stiffness among people with spinal cord injury: a pilot study. J Spinal Cord Med. 2009;32(1):72-78. doi:10.1080/10790268.2009.11760755
13. Oliver JJ, Webb DJ. Noninvasive assessment of arterial stiffness and risk of atherosclerotic events. Arterioscler Thromb Vasc Biol. 2003;23(4):554-566. doi:10.1161/01.ATV.0000060460.52916.D6
14. Ephraim PL, Dillifngham TR, Sector M, Pezzin LE, MacKenzie EJ. Epidemiology of limb loss and congenital limb deficiency: a review of the literature. Arch Phys Med Rehabil. 2003;84(5): 747-761. doi:10.1016/s0003-9993(02)04932-8.15. Levin ME. Preventing amputation in the patient with diabetes. Diabetes Care. 1995;18(10)1383-1394. doi:10.2337/diacare.18.10.1383
16. Dillingham TR, Pezzin LE, MacKenzie EJ. Limb amputation and limb deficiency: epidemiology and recent trends in the United States. South Med J. 2002;95(8):875-883. doi:10.1097/00007611- 200208000-00018
17. Lo J, Chan L, Flynn S. A systematic review of the incidence, prevalence, costs, and activity and work limitations of amputation, osteoarthritis, rheumatoid arthritis, back pain, multiple sclerosis, spinal cord injury, stroke, and traumatic brain injury in the United States: a 2019 update. Arch Phys Med Rehabil. 2021;102:115-131. doi:10.1016/j.apmr.2020.04.001
18. Svircev, J, Tan D, Garrison A, Pennelly, B, Burns SP. Limb loss in individuals with chronic spinal cord injury. J Spinal Cord Med. doi:10.1080/10790268.2020.1800964
19. Brown DW. Smoking prevalence among US veterans. J Gen Intern Med. 2010;25(2):147-149. doi:10.1007/s11606-009-1160-0
20. Selim AJ, Berlowitz DR, Fincke G, et al. The health status of elderly veteran enrollees in the Veterans Health Administration. J Am Geriatr Soc. 2004;52(8):1271-1276. doi:10.1111/j.1532-5415.2004.52355.x
21. Criqui MH, Aboyans V. Epidemiology of peripheral artery disease. Circ Res. 2015;116(9):1509-1526. doi:10.1161/CIRCRESAHA.116.303849
22. Yokoo KM, Kronon M, Lewis VL Jr, McCarthy WJ, McMillan WD, Meyer PR Jr. Peripheral vascular disease in spinal cord injury patients: a difficult diagnosis. Ann Plast Surg. 1996;37(5):495-499. doi:10.1097/00000637-199611000-00007
23. Taylor SM, Kalbaugh CA, Blackhurst DW, Cass, et al. Determinants of functional outcome after revascularization for critical limb ischemia: an analysis of 1000 consecutive vascular interventions. J Vasc Surg. 2006;44(4):747–756. doi:10.1016/j.jvs.2006.06.015
24. Abdellaoui A, Al-Khaffaf H. C-reactive protein (CRP) as a marker in peripheral vascular disease. Eur J Vasc Endovasc Surg. 2007;34(1):18-22. doi:10.1016/j.ejvs.2006.10.040
25. Caro J, Migliaccio-Walle K, Ishak KJ, Proskorovsky I. The morbidity and mortality following a diagnosis of peripheral arterial disease: long-term follow-up of a large database. BMC Cardiovasc Disord. 2005;5:14. doi:10.1186/1471-2261-5-14
At the James A. Haley Veterans’ Hospital (JAHVH) in Tampa, Florida, the prevalence of amputations among patients at the spinal cord injury (SCI) center seems high. Despite limited data demonstrating altered hemodynamics in the lower extremities (LEs) among the SCI population and increased frequency of peripheral arterial disease (PAD), amputations among patients with SCI have received little attention in research.1-3
In the United States, most amputations are caused by vascular disease related to peripheral arterial disease (PAD) and diabetes mellitus (DM).4 PAD primarily affects the LEs and is caused by atherosclerotic obstruction leading to insufficient blood flow. PAD can present clinically as LE pain, nonhealing ulcers, nonpalpable distal pulses, shiny or cold skin, absence of hair on the LE, or distal extremity pallor when the affected extremity is elevated. However, PAD is often asymptomatic. The diagnosis of PAD is typically made with an ankle-brachial index (ABI) ≤ 0.9.5 The prevalence of PAD is about 4.3% in Americans aged ≥ 40 years, increases with age, and is almost twice as common among Black Americans compared with that of White Americans.6 Many studies in SCI populations have documented an increased prevalence of DM, dyslipidemia, obesity, hypertension (HTN), and cigarette smoking.7-9 PAD shares these risk factors with coronary artery disease (CAD), but relative to CAD, tobacco smoking was a more substantial causative factor for PAD.10 Given the preponderance of associated risk factors in this population, PAD is likely more prevalent among patients with SCI than in the population without disabilities. Beyond these known risk factors, researchers hypothesized that SCI contributes to vascular disease by altering arterial function. However, this is still a topic of debate.11-13 Trauma also is a common cause of amputation, accounting for 45% of amputations in 2005.4 Patients with SCI may experience traumatic amputations simultaneously as their SCI, but they may also be predisposed to traumatic amputations related to osteopenia and impaired sensation.
Since amputation is an invasive surgery, knowing the severity of this issue is important in the SCI population. This study quantifies the prevalence of amputations of the LEs among the patients at our SCI center. It then characterizes these amputations’ etiology, their relationship with medical comorbidities, and certain SCI classifications.
Methods
This retrospective cohort study used the US Department of Veterans Affairs (VA) Computerized Patient Record System. The cohort was defined as all patients who received an annual examination at our SCI center over 4 years from October 1, 2009 to September 30, 2013. Annual examination includes a physical examination, relevant surveillance laboratory tests, and imaging, such as renal ultrasound for those with indwelling urinary catheters. One characteristic of the patient population in the VA system is that diagnoses, such as multiple sclerosis (MS) and amyotrophic lateral sclerosis (ALS), that involve spinal cord lesions causing symptoms are included in the registry, besides those with other traumatic or nontraumatic SCI. October 1 to September 30 was chosen based on the VA fiscal year (FY).
During this period, 1678 patients had an annual examination. Of those, 299 patients had an SCI etiology of ALS or MS, and 41 had nonfocal SCI etiology that could not be assessed using the American Spinal Injury Association Impairment Scale (AIS) and were excluded. Also excluded were 283 patients who did not have an annual examination during the specified time span. Some patients do not have an annual examination every year; for those with multiple annual examinations during that time frame, the most recent was used.
One thousand fifty-five patients were included in the statistical analysis. Date of birth, sex, race, ethnicity, date of death, smoking status, DM diagnosis, HTN diagnosis, use of an antiplatelet, antihypertensive, or lipid-lowering agent, blood pressure, hemoglobin A1c, and lipid panel were collected. The amputation level and etiology were noted. The levels of amputation were classified as toe/partial foot,
Statistical Analysis
Descriptive data were summarized as the median and IQR for continuous variables or the number and percentage for categorical variables. The χ2 test was used to analyze the association between categorical variables and amputation status. A nonparametric Wilcoxon test was used to investigate the distribution of continuous variables across patients with amputation and patients without amputation. Binary logistic regression analysis was used to investigate amputation risk factors. We report goodness of fit using the Hosmer and Lemeshow test and the area under the curve (AUC) for the multivariate model. Statistical significance was prespecified at a 2-sided P < .05. SAS version 9.4 was used for all statistical analyses.
Results
Mean age was approximately 61 years for the 91 patients at the time of the most recent amputation (Table 1). Among those with amputation, 63% were paraplegic and 37% were tetraplegic.
Of 1055 patients with SCI, 91 (8.6%) patients had an amputation. Of those, 70 (76.1%) were from nontraumatic causes (dysvascular), 17 (18.5%) were traumatic, 4 (4.3%) were from other causes (ie, cancer), and only 1 (1.1%) was of unknown cause.
Of the 91 patients with amputation, 64 (69.6%) had at least 1 TFA—33 were unilateral and 31 were bilateral. Two patients had a TFA on one side and a TTA on the other. Partial foot/toe and TTA were less common amputation levels with 14 (15.4%) and 13 (14.3%), respectively. Most amputations (86.8%) occurred over 6 months from the day of initial SCI, and were most commonly dysvascular (Table 2). Traumatic amputation occurred more evenly at various stages, pre-SCI, during acute SCI, subacute SCI, and chronic SCI.
Injury by Impairment Scale Level
Forty-nine (11.5%) of 426 patients with AIS level A SCI had undergone amputation. In order of prevalence, 23 (46.9%) were unilateral TFA, 17 (34.6%) were bilateral TFA, 10.2% were partial foot/toe, 4.1% were unilateral TTA, and 4.1% were a TTA/TFA combination. Both hip and knee disarticulations were classified in the TFA category.
Sixteen (13.0%) of 123 patients with AIS level B SCI had undergone amputation; 5 (31.3%) of those amputations were unilateral TFA, 6 (37.5%) were bilateral TFA, 3 (18.8%) were partial toe or foot, and 1 (6.3%) was for unilateral and bilateral TTA each.
Twelve (8.4%) of 143 patients with AIS level C SCI had undergone amputation: 6 (50.0%) were bilateral TFA; 3 (25.0%) were unilateral TFA; and 3 (25.0%) were unilateral TTA.
Fourteen (3.9%) of 356 patients with AIS level D SCI had undergone amputation. Of those 6 (42.9%) underwent a partial foot/toe amputation; 5 (35.7%) had undergone a unilateral TTA, and 1 (7.1%) underwent amputation in each of the following categories: bilateral TTA, unilateral TFA, and bilateral TFA each.
None of the 7 individuals with AIS E level SCI had undergone amputation.
Health Risk Factors
Of the 91 patients with amputation, the majority (81.3%) were either former or current smokers. Thirty-six percent of those who had undergone amputation had a diagnosis of DM, while only 21% of those who had not undergone amputation had a diagnosis of DM.
At the time of their annual examination 532 patients had a diagnosis of HTN while 523 patients did not. Among patients with amputations, 59 (64.8%) had HTN, while 32 (35.2%) did not. Of the 964 patients without amputation, the prevalence of HTN was 50.9%
.Of 1055 patients with SCI, only 103 (9.8%) had a PAD diagnosis, including 38 (41.9%) patients with amputation. Just 65 (6.7%) patients with SCI without amputation had PAD (P < .001). PAD is highly correlated with dysvascular causes of amputation. Among those with amputations due to dysvascular etiology, 50.0% (35/70) had PAD, but for the 21 amputations due to nondysvascular etiology, only 3 (14.3%) had PAD (P = .004).
Amputation Predictive Model
A multivariate logistic regression analysis was used to build a predictive model for amputation among patients with SCI while controlling for covariates. In our multivariate analysis, high-density lipoprotein cholesterol (HDL-C), tetraplegia, and PAD were predictive factors for amputation. Patients with SCI who had PAD were 8.6 times more likely to undergo amputation compared to those without PAD (odds ratio [OR], 9.8; P < .001; 95% CI, 5.9-16.3). Every unit of HDL-C decreased the odds of amputation by 5% (OR, 0.95; P < .001; 95% CI, 0.93-0.98).
Having tetraplegia decreased the odds of amputation by 43%, compared with those with paraplegia (OR, 0.57; P = .02; 95% CI, 0.36 - 0.92). AUC was 0.76, and the Hosmer and Lemeshow goodness of model fit test P value was .66, indicating the good predictive power of the model (Table 3).
Discussion
In the US, 54 to 82% of amputations occur secondary to chronic vascular disease. Our study showed similar results: 76.1% of amputations were dysvascular.4,16 Even in a 2019 systematic review, the most recent prevalence of amputation data was in 2005.17 The study concluded that among the general population in the US, prevalence of amputation was estimated to be 1 in 190 people, or about 0.5% of the population.4 We found that the prevalence of amputation among the SCI population in this study was 8.7%. This result is consistent with our initial hypothesis that the prevalence of amputation would be higher among the people with SCI. Using a different case acquisition method, Svircev and colleagues reported that about a 4% prevalence of LE amputation among veterans with chronic SCI (over 1 year from the initial SCI), with an emphasis that it was not a study of amputation incidence.18 In comparison, we calculated a 7.5% prevalence of amputation during the chronic SCI stage, which showed institutional variation and a consistent observation that LE amputations occurred more frequently in the SCI population.
Our results showed a positive correlation between the completeness of injury and the prevalence of amputation. Those individuals with a motor complete injury, AIS A (40.3%) or AIS B (11.7%) account for approximately half of all amputations in our population with SCI. Another finding was that proximal amputations were more frequent with more neurologically complete SCIs. Of those with an injury classified as AIS A and an amputation, 42 of 49 subjects underwent at least 1 TFA (23 were unilateral TFA, 17 were bilateral TFA, 2 were a TFA/TTA combination). Of those with an AIS B injury and an amputation, 11 of 16 subjects (68.8%) had at least 1 TFA (5 unilateral TFA and 6 bilateral TFA). Among patients with AIS C injury and amputation, 75% had a TFA. At the same time, only 13.3% of all amputations were at the transfemoral level in those with an AIS D injury. None of the participants with an injury classified as AIS E had undergone an amputation.
Given a paucity of literature available regarding amputation levels in patients with SCI, a discussion with a JAHVH vascular surgeon helped explain the rationale behind different levels of amputation among the SCI population—TFA was performed in 64 of 91 cases (70%). Institutionally, TFAs were performed more often because this level had the greatest chance of healing, avoiding infection, and eliminating knee contracture issues, which may affect quality of life. This was believed to be the best option in those individuals who were already nonambulatory. Although this study did not collect data on ambulatory status, this helps explain why those with an SCI classification of AIS D were more likely to have had a more distal amputation to preserve current or a future chance of ambulation, provided that whether the limb is salvageable is the priority of surgical decision.
The prevalence of PAD among veterans is generally higher than it is in the nonveteran population. Studies show that the prevalence of PAD risk factors in the veteran population exceeds national estimates. Nearly two-thirds of veterans have HTN, 1 in 4 has DM, and 1 in 4 is a current smoker, placing veterans at a significantly increased risk of PADand, therefore, amputation.19,20 These rates were about the same or greater in our SCI population: 50.4% had HTN, 22.3% had a diagnosis of DM, and 71.8% smoked previously or currently smoked. In 3 large studies, HTN was second only to current smoking as the most attributable risk factor for PAD.21
Ongoing research by JAHVH vascular surgeons suggests that patients with SCI were younger and less likely to have HTN, PAD, and/or CAD compared with patients undergoing TFA without SCI. Additionally, patients with SCI had better postoperative outcomes in terms of 30-day mortality, 3-year mortality, and had no increased rate of surgical revisions, strokes, or wound-healing complications. This supports the previous thought that the AIS classification plays a large role in determining amputation levels.
One result in this study is that paraplegia is one of the predictors of future amputation compared with tetraplegia. To our knowledge, there is no literature that supports or explains this finding. A hypothetical factor that could explain this observation is the difference in duration of survival—those with paraplegia who live longer are more likely to experience end-stage consequence of vascular diseases. Another proposed factor is that those with paraplegia are generally more active and have a higher likelihood of sustaining a traumatic cause of amputation, even though this etiology of amputation is minor.An unexpected finding in our study was that of 1055 patients with SCI, only 9.8% had a PAD diagnosis. In contrast, 41.3% of those with amputation had a PAD diagnosis. JAHVH does not screen for PAD, so this likely represents only the symptomatic cases.
Diagnosing PAD in patients with SCI is challenging as they may lack classic clinical symptoms, such as pain with ambulation and impotence, secondary to their neurologic injury. Instead, the health care practitioner must rely on physical signs, such as necrosis.22 Of note given the undetermined utility of diagnosing PAD in patients with SCI, early endovascular interventions are not typically performed. We could not find literature regarding when intervention for PAD in patients with SCI should be performed or how frequently those with SCI should be assessed for PAD. One study showed impaired ambulation prior to limb salvage procedures was associated with poor functional outcomes in terms of survival, independent living, and ambulatory status.23 This could help explain why endovascular procedures are done relatively infrequently in this population. With the lack of studies regarding PAD in the SCI population, outcomes analysis of these patients, including the rate of initial interventions, re-intervention for re-amputation (possibly at a higher level), or vascular inflow procedures, are needed.
It would be beneficial for future studies to examine whether inflammatory markers, such as C-reactive protein (CRP), were more elevated in patients with SCI who underwent amputation compared with those who did not. Chronic underlying inflammation has been shown to be a risk factor for PAD. One study showed that, independently of other risk factors, elevated CRP levels roughly tripled the risk of developing PAD.24 This study suggested that there is an increased risk of dysvascular amputation among the SCI population at this center. This information is significant because it can help influence JAHVH clinical practice for veterans with SCI and vascular diseases.
Limitations
As a single-center study carried out at an SCI specialized center of a VA hospital, this study's finding may not be generalizable. Incomplete documentation in the health record may have led to underreporting of amputations and other information. The practice of the vascular surgeons at JAHVH may not represent the approach of vascular surgeons nationwide. Another limitation of this study is that the duration of SCI was not considered when looking at health risk factors associated with amputation in the SCI population (ie, total cholesterol, hemoglobin A1c, etc). Finally, the medication regimens were not reviewed to determine whether they meet the standard of care in relation to eventual diagnosis of PAD.
A prospective study comparing the prevalence of amputation between veterans with SCI vs veterans without SCI could better investigate the difference in amputation risks. This study only compared our veterans with SCI in reference to the general population. Veterans are more likely to be smokers than the general population, contributing to PAD.17 In addition, data regarding patients’ functional status in regard to transferring and ambulation before and after amputation were not collected, which would have contributed to an understanding of how amputation affects functional status in this population.
Conclusions
There is an increased prevalence of amputation among veterans with SCI compared with that of the nationwide population and a plurality were TFAs. This data suggest that those with a motor complete SCI are more likely to undergo a more proximal amputation. This is likely secondary to a lower likelihood of ambulation with more neurologically complete injuries along with a greater chance of healing with a more proximal amputation. It is challenging to correlate any variables specific to SCI (ie, immobility, time since injury, level of injury, etc) with an increased risk of amputation as the known comorbidities associated with PAD are highly prevalent in this population. Having PAD, low HDL-C (< 40 mg/dL), and paraplegia instead of tetraplegia were independent predictors of amputation.
Health care professionals need to be aware of the high prevalence of amputation in the SCI population. Comorbidities should be aggressively treated as PAD, in addition to being associated with amputation, has been linked with increased mortality.25 Studies using a larger population and multiple centers are needed to confirm such a concerning finding.
Acknowledgments
This material is based on work supported (or supported in part) with resources and the use of facilities at the James A. Haley Veterans’ Hospital (JAHVH). Authors gratefully acknowledge the inputs and support of Dr. James Brooks, MD, RPVI, assistant professor of surgery, University of South Florida (USF), and attending surgeon, vascular surgery service, medical director of the peripheral vascular laboratory, JAHVH; and Dr. Kevin White, MD, assistant professor, USF, and Chief of Spinal Cord Injury Center, JAHVH.
1. Hopman MT, Nommensen E, van Asten WN, Oeseburg B, Binkhorst RA. Properties of the venous vascular system in the lower extremities of individuals with paraplegia. Paraplegia. 1994;32(12):810-816. doi:10.1038/sc.1994.128
2. Theisen D, Vanlandewijck Y, Sturbois X, Francaux M. Central and peripheral haemodynamics in individuals with paraplegia during light and heavy exercise. J Rehabil Med. 2001;33(1):16-20. doi:10.1080/165019701300006489
3. Bell JW, Chen D, Bahls M, Newcomer SC. Evidence for greater burden of peripheral arterial disease in lower extremity arteries of spinal cord-injured individuals. Am J Physiol Heart Circ Physiol. 2011;301(3):H766-H772. doi:10.1152/ajpheart.00507.2011
4. Ziegler-Graham K, MacKenzie EJ, Ephraim PL, Travison TG, Brookmeyer R. Estimating the prevalence of limb loss in the United States: 2005 to 2050. Arch Phys Med Rehabil. 2008;89(3):422-429. doi:10.1016/j.apmr.2007.11.005
5. Hennion DR, Siano KA. Diagnosis and treatment of peripheral arterial disease. Am Fam Physician. 2013;88(5):306-310.
6. Selvin E, Erlinger TP. Prevalence of and risk factors for peripheral arterial disease in the United States: results from the National Health and Nutrition Examination Survey, 1999-2000. Circulation. 2004;110(6):738-743. doi:10.1161/01.CIR.0000137913.26087.F0
7. Bauman WA, Spungen AM. Disorders of carbohydrate and lipid metabolism in veterans with paraplegia or quadriplegia: a model of premature aging. Metabolism. 1994;43(6):749-756. doi:10.1016/0026-0495(94)90126-0
8. Jörgensen S, Hill M, Lexell J. Cardiovascular risk factors among older adults with long-term spinal cord injury. PM R. 2019;11(1):8-16. doi:10.1016/j.pmrj.2018.06.008
9. Wu JC, Chen YC, Liu L, et al. Increased risk of stroke after spinal cord injury: a nationwide 4-year follow-up cohort study. Neurology. 2012;78(14):1051-1057. doi:10.1212/WNL.0b013e31824e8eaa
10. Price JF, Mowbray PI, Lee AJ, Rumley A, Lowe GD, Fowkes FG. Relationship between smoking and cardiovascular risk factors in the development of peripheral arterial disease and coronary artery disease: Edinburgh Artery Study. Eur Heart J. 1999;20(5):344-353. doi:10.1053/euhj.1998.1194
11. Bell JW, Chen D, Bahls M, Newcomer SC. Altered resting hemodynamics in lower-extremity arteries of individuals with spinal cord injury. J Spinal Cord Med. 2013;36(2):104-111. doi:10.1179/2045772312Y.0000000052
12. Miyatani M, Masani K, Oh PI, Miyachi M, Popovic MR, Craven BC. Pulse wave velocity for assessment of arterial stiffness among people with spinal cord injury: a pilot study. J Spinal Cord Med. 2009;32(1):72-78. doi:10.1080/10790268.2009.11760755
13. Oliver JJ, Webb DJ. Noninvasive assessment of arterial stiffness and risk of atherosclerotic events. Arterioscler Thromb Vasc Biol. 2003;23(4):554-566. doi:10.1161/01.ATV.0000060460.52916.D6
14. Ephraim PL, Dillifngham TR, Sector M, Pezzin LE, MacKenzie EJ. Epidemiology of limb loss and congenital limb deficiency: a review of the literature. Arch Phys Med Rehabil. 2003;84(5): 747-761. doi:10.1016/s0003-9993(02)04932-8.15. Levin ME. Preventing amputation in the patient with diabetes. Diabetes Care. 1995;18(10)1383-1394. doi:10.2337/diacare.18.10.1383
16. Dillingham TR, Pezzin LE, MacKenzie EJ. Limb amputation and limb deficiency: epidemiology and recent trends in the United States. South Med J. 2002;95(8):875-883. doi:10.1097/00007611- 200208000-00018
17. Lo J, Chan L, Flynn S. A systematic review of the incidence, prevalence, costs, and activity and work limitations of amputation, osteoarthritis, rheumatoid arthritis, back pain, multiple sclerosis, spinal cord injury, stroke, and traumatic brain injury in the United States: a 2019 update. Arch Phys Med Rehabil. 2021;102:115-131. doi:10.1016/j.apmr.2020.04.001
18. Svircev, J, Tan D, Garrison A, Pennelly, B, Burns SP. Limb loss in individuals with chronic spinal cord injury. J Spinal Cord Med. doi:10.1080/10790268.2020.1800964
19. Brown DW. Smoking prevalence among US veterans. J Gen Intern Med. 2010;25(2):147-149. doi:10.1007/s11606-009-1160-0
20. Selim AJ, Berlowitz DR, Fincke G, et al. The health status of elderly veteran enrollees in the Veterans Health Administration. J Am Geriatr Soc. 2004;52(8):1271-1276. doi:10.1111/j.1532-5415.2004.52355.x
21. Criqui MH, Aboyans V. Epidemiology of peripheral artery disease. Circ Res. 2015;116(9):1509-1526. doi:10.1161/CIRCRESAHA.116.303849
22. Yokoo KM, Kronon M, Lewis VL Jr, McCarthy WJ, McMillan WD, Meyer PR Jr. Peripheral vascular disease in spinal cord injury patients: a difficult diagnosis. Ann Plast Surg. 1996;37(5):495-499. doi:10.1097/00000637-199611000-00007
23. Taylor SM, Kalbaugh CA, Blackhurst DW, Cass, et al. Determinants of functional outcome after revascularization for critical limb ischemia: an analysis of 1000 consecutive vascular interventions. J Vasc Surg. 2006;44(4):747–756. doi:10.1016/j.jvs.2006.06.015
24. Abdellaoui A, Al-Khaffaf H. C-reactive protein (CRP) as a marker in peripheral vascular disease. Eur J Vasc Endovasc Surg. 2007;34(1):18-22. doi:10.1016/j.ejvs.2006.10.040
25. Caro J, Migliaccio-Walle K, Ishak KJ, Proskorovsky I. The morbidity and mortality following a diagnosis of peripheral arterial disease: long-term follow-up of a large database. BMC Cardiovasc Disord. 2005;5:14. doi:10.1186/1471-2261-5-14
Exercise to Reduce Posttraumatic Stress Disorder Symptoms in Veterans
Physical exercise offers preventative and therapeutic benefits for a range of chronic health conditions, including cardiovascular disease, type 2 diabetes mellitus, Alzheimer disease, and depression.1,2 Exercise has been well studied for its antidepressant effects, its ability to reduce risk of aging-related dementia, and favorable effects on a range of cognitive functions.2 Lesser evidence exists regarding the impact of exercise on other mental health concerns. Therefore, an accurate understanding of whether physical exercise may ameliorate other conditions is important.
A small meta-analysis by Rosenbaum and colleagues found that exercise interventions were superior to control conditions for symptom reduction in study participants with posttraumatic stress disorder (PTSD).3 This meta-analysis included 4 randomized clinical trials representing 200 cases. The trial included a variety of physical activities (eg, yoga, aerobic, and strength-building exercises) and control conditions, and participants recruited from online, community, inpatient, and outpatient settings. The standardized mean difference (SMD) produced by the analysis indicated a small-to-medium effect (Hedges g, -0.35), with the authors reporting no evidence of publication bias, although an assessment of potential bias associated with individual trial design characteristics was not conducted. Of note, a meta-analysis by Watts and colleagues found that effect sizes for PTSD treatments tend to be smaller in veteran populations.4 Therefore, how much the mean effect size estimate in the study is applicable to veterans with PTSD is unknown.3
Veterans represent a unique subpopulation in which PTSD is common, although no meta-analysis yet published has synthesized the effects of exercise interventions from trials of veterans with PTSD.5 A recent systematic review by Whitworth and Ciccolo concluded that exercise may be associated with reduced risk of PTSD, a briefer course of PTSD symptoms, and/or reduced sleep- and depression-related difficulties.6 However, that review primarily included observational, cross-sectional, and qualitative works. No trials included in our meta-analysis were included in that review.6
Evidence-based psychotherapies like cognitive processing therapy and prolonged exposure have been shown to be effective for treating PTSD in veterans; however, these modalities are accompanied by high rates of dropout (eg, 40-60%), thereby limiting their clinical utility.7 The use of complementary and alternative approaches for treatment in the United States has increased in recent years, and exercise represents an important complementary treatment option.8 In a study by Baldwin and colleagues, nearly 50% of veterans reported using complementary or alternative approaches, and veterans with PTSD were among those likely to use such approaches.9 However, current studies of the effects of exercise interventions on PTSD symptom reduction are mostly small and varied, making determinations difficult regarding the potential utility of exercise for treating this condition in veterans.
Literature Search
No previous research has synthesized the literature on the effects of exercise on PTSD in the veteran population. The current meta-analysis aims to provide a synthesis of systematically selected studies on this topic to determine whether exercise-based interventions are effective at reducing veterans’ symptoms of PTSD. Our hypothesis was that, when used as a primary or adjuvant intervention for PTSD, physical exercise would be associated with a reduction of PTSD symptom scale scores. We planned a priori to produce separate estimates for single-arm and multi-arm trials. We also wanted to conduct a careful risk of bias assessment—or evaluation of study features that may have systematically influenced results—for included trials, not only to provide context for interpretation of results, but also to inform suggestions for research to advance this field of inquiry.10
Methods
This study was preregistered on PROSPERO and followed PRISMA guidelines for meta-analyses and systematic reviews.11 Supplementary materials, such as the PRISMA checklist, study data, and funnel plots, are available online (doi.org/10.6084/m9.figshare.c.5618437.v1). Conference abstracts were omitted due to a lack of necessary information. We decided early in the planning process to include both randomized and single-arm trials, expecting the number of completed studies in the area of exercise for PTSD symptom reduction in veterans, and particularly randomized trials of such, would be relatively small.
Studies were included if they met the following criteria: (1) the study was a single- or multi-arm interventional trial; (2) participants were veterans; (3) participants had a current diagnosis of PTSD or exhibited subthreshold PTSD symptoms, as established by authors of the individual studies and supported by a structured clinical interview, semistructured interview, or elevated scores on PTSD symptom self-report measures; (4) the study included an intervention in which exercise (physical activity that is planned, structured, repetitive, and purposive in the sense that improvement or maintenance of physical fitness or health is an objective) was the primary component; (5) PTSD symptom severity was by a clinician-rated or self-report measure; and (6) the study was published in a peer-reviewed journal.12 Studies were excluded if means, standard deviations, and sample sizes were not available or the full text of the study was not available in English.

The systematic review was conducted using PubMed, PsycINFO, and Cochrane Library databases, from the earliest record to February 2021. The following search phrase was used, without additional limits, to acquire a list of potential studies: (“PTSD” or “post-traumatic stress disorder” or “posttraumatic stress disorder” or “post traumatic stress disorder”) and (“veteran” or “veterans”) and (“exercise” or “aerobic” or “activity” or “physical activity”). The references of identified publications also were searched for additional studies. Then, study titles and abstracts were evaluated and finally, full texts were evaluated to determine study inclusion. All screening, study selection, and risk of bias and data extraction activities were performed by 2 independent reviewers (DR and MJ) with disagreements resolved through discussion and consensus (Figure 1). A list of studies excluded during full-text review and rationales can be viewed online (doi.org/10.6084/m9.figshare.c.5618437.v1).
Data Collection
Data were extracted from included studies using custom forms and included the following information based on PRISMA guidelines: (1) study design characteristics; (2) intervention details; and (3) PTSD outcome information.11 PTSD symptom severity was the primary outcome of interest. Outcome data were included if they were derived from a measure of PTSD symptoms—equivalency across measures was assumed for meta-analyses. Potential study bias for each outcome was evaluated using the ROBINS-I and Cochrane Collaboration’s RoB 2 tools for single-arm and multi-arm trials, respectively.13,14 These tools evaluate domains related to the design, conduct, and analysis of studies that are associated with bias (ie, systematic error in findings, such as under- or overestimation of results).10 Examples include how well authors performed and concealed randomization procedures, addressed missing data, and measured study outcomes.13,14 The risk of bias (eg, low, moderate, serious) associated with each domain is rated and, based on the domain ratings, each study is then given an overall rating regarding how much risk influences bias.13,14 Broadly, lower risk of bias corresponds to higher confidence in the validity of results.
Finally, 4 authors (associated with 2 single- and 2 multi-arm studies) were contacted and asked to provide further information. Data for 1 additional multi-arm study were obtained from these communications and included in the final study selection.15 These authors were also asked for information about any unpublished works of which they were aware, although no additional works were identified.
Statistical Analyses
Analyses were performed with R Studio R 3.6.0 software.16 An SMD (also known as Hedges g) was calculated for each study outcome: for single-arm trials, this was the SMD between pre- and postintervention scores, whereas for multi-arm trials, this was the SMD between postintervention outcome scores across groups. CIs for each SMD were calculated using a standard normal distribution. Combined SMDs were estimated separately for single- and multi-arm studies, using random-effects meta-analyses. In order to include multiple relevant outcomes from a single trial (ie, for studies using multiple PTSD symptom measures), robust variance estimation was used.17 Precision was used to weight SMDs.
Correlations between pre- and postintervention scores were not available for 1 single-arm study.18 A correlation coefficient of 0.8 was imputed to calculate the standard error of the of the SMDs for the Clinician-Administered PTSD Scale (CAPS) and the PTSD Checklist (PCL), as this value is consistent with past findings regarding the test-retest reliability of these measures.19-22 A sensitivity analysis, using several alternative correlational values, revealed that the choice of correlation coefficient did not impact the overall results of the meta-analysis.
I2 was used to evaluate between-study heterogeneity. Values of I2 > 25%, 50%, and 75% were selected to reflect low, moderate, and high heterogeneity, respectively, in accordance with guidelines described by Higgins and colleagues.23 Potential publication bias was assessed via funnel plot and Egger test.24 Finally, although collection of depressive symptom scores was proposed as a secondary outcome in the study protocol, such data were available only for 1 multi-arm study. As a result, this outcome was not evaluated.
Results
Six studies with 101 total participants were included in the single-arm analyses (Table 1).18,25-29 Participants consisted of veterans with chronic pain, post-9/11 veterans, female veterans of childbearing age, veterans with a history of trauma therapy, and other veterans. Types of exercise included moderate aerobic exercise and yoga. PTSD symptom measures included the CAPS and the PCL (PCL-5 or PCL-M versions). Reported financial sources for included studies included federal grant funding, nonprofit material support, outside organization support, use of US Department of Veterans Affairs (VA) resources, and no reported financial support.
With respect to individual studies, Shivakumar and colleagues found that completion of an aerobic exercise program was associated with reduced scores on 2 different PTSD symptom scales (PCL and CAPS) in 16 women veterans.18 A trauma-informed yoga intervention study with 18 participants by Cushing and colleagues demonstrated veteran participation to be associated with large reductions in PTSD, anxiety, and depression scale scores.25 In a study with 34 veterans, Chopin and colleagues found that a trauma-informed yoga intervention was associated with a statistically significant reduction in PTSD symptoms, as did a study by Zaccari and colleagues with 17 veterans.26,29 Justice and Brems also found some evidence that trauma-informed yoga interventions helped PTSD symptoms in a small sample of 4 veterans, although these results were not quantitatively analyzed.27 In contrast, a small pilot study (n = 12) by Staples and colleagues testing a biweekly, 6-week yoga program did not show a significant effect on PTSD symptoms.28
Three studies with 217 total veteran participants were included in the multi-arm analyses (Table 2).15,30,31 As all multi-arm trials incorporated randomization, they will be referred to as randomized controlled trials (RCTs). On contact, Davis and colleagues provided veteran-specific results for their trial; as such, our data differ from those within the published article.15 Participants from all included studies were veterans currently experiencing symptoms of PTSD. Types of exercise included yoga and combined methods (eg, aerobic and strength training).15,30,31 PTSD symptom measures included the CAPS or the PCL-5.15,30,31 Reported financial sources for included studies included federal grant funding, as well as nonprofit support, private donations, and VA and Department of Defense resources.
Davis and colleagues conducted a recently concluded RCT with > 130 veteran participants and found that a novel manualized yoga program was superior to an attention control in reducing PTSD symptom scale scores for veterans.15 Goldstein and colleagues found that a program consisting of both aerobic and resistance exercises reduced PTSD symptoms to a greater extent than a waitlist control condition, with 47 veterans randomized in this trial.30 Likewise, Hall and colleagues conducted a pilot RCT in which an intervention that integrated exercise and cognitive behavioral techniques was compared to a waitlist control condition.31 For the 48 veterans included in the analyses, the authors reported greater PTSD symptom reduction associated with integrated exercise than that of the control condition; however, the study was not powered to detect statistically significant differences between groups.
Bias Assessment
Results for the risk of bias assessments can be viewed in Tables 3 and 4. For single-arm studies, overall risk of bias was serious for all included trials. Serious risk of bias was found in 2 domains: confounding, due to a lack of accounting for potential preexisting baseline trends (eg, regression to the mean) that could have impacted study results; and measurement, due to the use of a self-report symptom measure (PCL) or CAPS with unblinded assessors. Multiple studies also showed moderate risk in the missing data domain due to participant dropout without appropriate analytic methods to address potential bias.
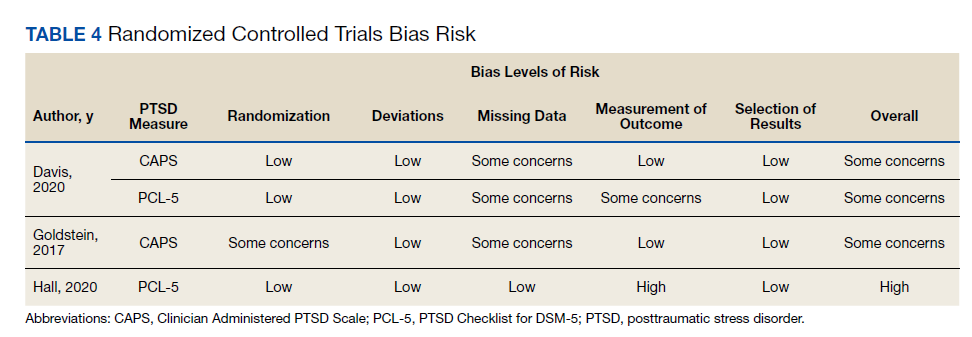
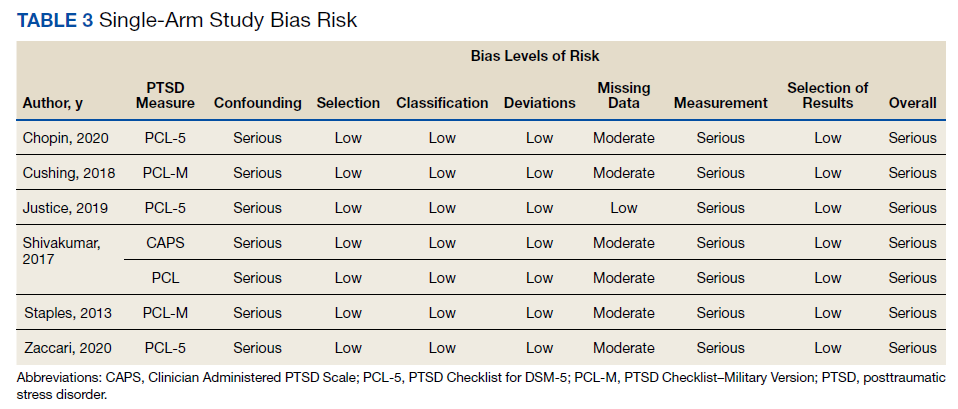
For RCTs, overall risk of bias ranged from some concerns to high risk. High risk of bias was found in 1 domain, measurement of outcome, due to use of a self-report symptom measure (PCL) with unblinded groups.31 The other 2 studies all had some concern of bias in at least 1 of the following domains: randomization, missing data, and measurement of outcome.
Pooled Standardized Mean Differences
Meta-analytic results can be viewed in Figure 2. The pooled SMD for the 6 single-arm studies was -0.60 (df = 4.41, 95% CI, -1.08 to -0.12, P = .03), indicating a statistically significant reduction in PTSD symptoms over the course of an exercise intervention. Combining SMDs for the 3 included RCTs revealed a pooled SMD of -0.40 (df = 1.57, 95% CI, -0.86 to 0.06, P = .06), indicating that exercise did not result in a statistically significant reduction in PTSD symptoms compared with control conditions.
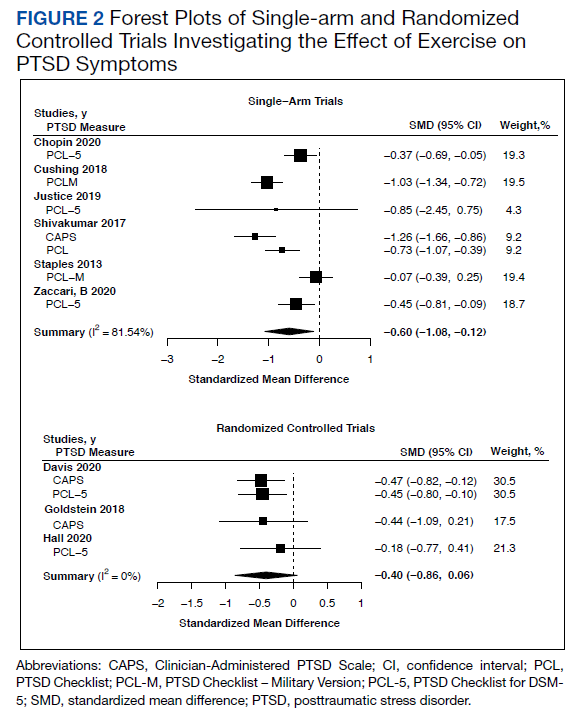
Publication Bias and Heterogeneity
Visual inspection funnel plots and Egger test did not suggest the presence of publication bias for RCTs (t = 1.21, df = 2, P = .35) or single-arm studies (t = -0.36, df = 5, P = .73).
Single-arm studies displayed a high degree of heterogeneity (I2 = 81.5%). Including sample size or exercise duration as variables in meta-regressions did not reduce heterogeneity (I2 = 85.2% and I2 = 83.8%, respectively). Performing a subgroup analysis only on studies using yoga as an intervention also did not reduce heterogeneity (I2 = 79.2%). Due to the small number of studies, no further exploration of heterogeneity was conducted on single-arm studies. RCTs did not display any heterogeneity (I2 = 0%).
Discussion
Our report represents an early synthesis of the first prospective studies of physical exercise interventions for PTSD in veterans. Results from meta-analyses of 6 single-arm studies (101 participants) and 3 RCTs (217 participants) provide early evidence that exercise may reduce PTSD symptoms in veterans. Yoga was the most common form of exercise used in single-arm studies, whereas RCTs used a wider range of interventions. The pooled SMD of -0.60 for single-arm longitudinal studies suggest a medium decrease in PTSD symptoms for veterans who engage in exercise interventions. Analysis of the RCTs supported this finding, with a pooled SMD of -0.40 reflecting a small-to-medium effect of exercise on PTSD symptoms over control conditions, although this result did not achieve statistical significance. Of note, while the nonsignificant finding for RCTs may have been due to insufficient power caused by the limited number of included studies, possibly exercise was not more efficacious than were the control conditions.
Although RCTs represented a variety of exercise types, PTSD symptom measures, and veteran subgroups, statistical results were not indicative of heterogeneity. However, only the largest and most comprehensive study of exercise for PTSD in veterans to date by Davis and colleagues had a statistically significant SMD.15 Of note, one of the other 2 RCTs displayed an SMD of a similar magnitude, but this study had a much smaller sample size and was underpowered to detect significance.30 Additionally, risk of bias assessments for single-arm studies and RCTs revealed study characteristics that suggest possible inflation of absolute effect sizes for individual studies. Therefore, the pooled SMDs we report are interpretable but may exceed the true effect of exercise for PTSD symptom reduction in veterans.
Based on results of our analyses, it is reasonable, albeit preliminary, to conclude that exercise interventions may result in reduced PTSD symptoms among veterans. At the very least, these findings support the continued investigation of such interventions for veterans. Given the unique and salubrious characteristics of physical exercise, such results, if supported by further research, suggest that exercise-based interventions may be particularly valuable within the trauma treatment realm. For example, exercise can be less expensive and more convenient than attending traditional treatment, and for veterans reluctant to engage in standard treatment approaches such as psychiatric and psychosocial modalities, complementary approaches entailing exercise may be viewed as particularly acceptable or enjoyable.32 In addition to possibly reducing PTSD symptoms, exercise is a well-established treatment for conditions commonly comorbid with PTSD, including depression, anxiety disorders, cognitive difficulties, and certain chronic pain conditions.6 As such, exercise represents a holistic treatment option that has the potential to augment standard PTSD care.
Limitations
The present study has several important limitations. First, few studies were found that met the broad eligibility criteria and those that did often had a small sample size. Besides highlighting a gap in the extant research, the limited studies available for meta-analysis means that caution must be taken when interpreting results. Fortunately, this issue will likely resolve once additional studies investigating the impact of exercise on PTSD symptoms in veterans are available for synthesis.
Relatedly, the included study interventions varied considerably, both in the types of exercise used and the characteristics of the exercises (eg, frequency, duration, and intensity), which is relevant as different exercise modalities are associated with differential physical effects.33 Including such a mixture of exercises may have given an incomplete picture of their potential therapeutic effects. Also, none of the RCTs compared exercise against first-line treatments for PTSD, such as prolonged exposure or cognitive processing therapy, which would have provided further insight into the role exercise could play in clinical settings.7
Another limitation is the elevated risk of bias found in most studies, particularly present in the longitudinal single-arm studies, all of which were rated at serious risk. For instance, no single-arm study controlled for preexisting baseline trends: without such (and lacking a comparison control group like in RCTs), it is possible that the observed effects were due to extraneous factors, rather than the exercise intervention. Although not as severe, the multi-arm RCTs also displayed at least moderate risk of bias. Therefore, SMDs may have been overestimated for each group of studies.
Finally, the results of the single-arm meta-analysis displayed high statistical heterogeneity, reducing the generalizability of the results. One possible cause of this heterogeneity may have been the yoga interventions, as a separate analysis removing the only nonyoga study did not reduce heterogeneity. This result was surprising, as the included yoga interventions seemed similar across studies. While the presence of high heterogeneity does require some caution when applying these results to outside interventions, the present study made use of random-effects meta-analysis, a technique that incorporates study heterogeneity into the statistical model, thereby strengthening the findings compared with that of a traditional fixed-effects approach.10
Future Steps
Several future steps are warranted to improve knowledge of exercise as a treatment for PTSD in veterans and in the general population. With current meta-analyses limited to small numbers of studies, additional studies of the efficacy of exercise for treating PTSD could help in several ways. A larger pool of studies would enable future meta-analyses to explore related questions, such as those regarding the impact of exercise on quality of life or depressive symptom reduction among veterans with PTSD. A greater number of studies also would enable meta-analysts to explore potentially critical moderators. For example, the duration, frequency, or type of exercise may moderate the effect of exercise on PTSD symptom reduction. Moderators related to patient or study design characteristics also should be explored in future studies.
Future work also should evaluate the impact that specific features of exercise regimens have on PTSD. Knowing whether the type or structure of exercise affects its clinical use would be invaluable in developing and implementing efficient exercise-based interventions. For example, if facilitated exercise was found to be significantly more effective at reducing PTSD symptoms than exercise completed independently, the development of exercise intervention programs in the VA and other facilities that commonly treat PTSD may be warranted. Additionally, it may be useful to identify specific mechanisms through which exercise reduces PTSD symptoms. For example, in addition to its beneficial biological effects, exercise also promotes psychological health through behavioral activation and alterations within reinforcement/reward systems, suggesting that exercise regularity may be more important than intensity.34,35 Understanding which mechanisms contribute most to change will aid in the development of more efficient interventions.
Given that veterans are demonstrating considerable interest in complementary and alternative PTSD treatments, it is critical that researchers focus on high-quality randomized tests of these interventions. Therefore, in addition to greater quality of exercise intervention studies, future efforts should be focused on RCTs that are designed in such a way as to limit potential introduction of bias. For example, assessment data should be completed by blinded assessors using standardized measures, and analyses should account for missing data and unequal participant attrition between groups. Ideally, pre-intervention trends across multiple baseline datapoints also would be collected in single-arm studies to avoid confounding related to regression to the mean. It is also recommended that future meta-analyses use risk of bias assessments and consider how the results of such assessments may impact the interpretation of results.
Conclusions
Findings from both single-arm studies and RCTs suggest possible benefit of exercise on PTSD symptom reduction, although confirmation of findings is needed. No study found increased symptoms following exercise intervention. Thus, it is reasonable to consider physical exercise, such as yoga, as an adjunct, whole-health consistent treatment. HCPs working with veterans with past traumatic experiences should consider incorporating exercise into patient care. Enhanced educational efforts emphasizing the psychotherapeutic impact of exercise may also have value for the veteran population. Furthermore, the current risk of bias assessments highlights the need for additional high-quality RCTs evaluating the specific impact of exercise on PTSD symptom reduction in veterans. In particular, this field of inquiry would benefit from larger samples and design characteristics to reduce bias (eg, blinding when possible, use of CAPS vs only self-report symptom measures, reducing problematic attrition, corrections for missing data, etc).
Acknowledgments
This research is the result of work supported with resources and the use of facilities at the VA Eastern Kansas Healthcare System (Dwight D. Eisenhower VA Medical Center). It was also supported by the Department of Veterans Affairs Office of Academic Affiliations Advanced Fellowship Program in Mental Illness Research and Treatment, as well as the Rocky Mountain Mental Illness Research, Education, and Clinical Center. Since Dr. Reis and Dr. Gaddy are employees of the US Government and contributed to this manuscript as part of their official duties, the work is not subject to US copyright. This study was preregistered on PROSPERO (https://www.crd.york.ac.uk/prospero/; ID: CRD42020153419).
1. Reiner M, Niermann C, Jekauc D, Woll A. Long-term health benefits of physical activity—a systematic review of longitudinal studies. BMC Public Health. 2013;13:813. doi:10.1186/1471-2458-13-813
2. Walsh R. Lifestyle and mental health. Am Psychol. 2011;66(7):579-592. doi:10.1037/a0021769
3. Rosenbaum S, Vancampfort D, Steel Z, Newby J, Ward PB, Stubbs B. Physical activity in the treatment of posttraumatic stress disorder: a systematic review and meta-analysis. Psychiatry Res. 2015;230(2):130-136. doi:10.1016/j.psychres.2015.10.017
4. Watts BV, Schnurr PP, Mayo L, Young-Xu Y, Weeks WB, Friedman MJ. Meta-analysis of the efficacy of treatments for posttraumatic stress disorder. J Clin Psychiatry. 2013;74(6):e541-550. doi:10.4088/JCP.12r08225
5. Tanielian T, Jaycox L, eds. Invisible Wounds of War: Psychological and Cognitive Injuries, Their Consequences, and Services to Assist Recovery. RAND Corporation; 2008
6. Whitworth JW, Ciccolo JT. Exercise and post-traumatic stress disorder in military veterans: a systematic review. Mil Med. 2016;181(9):953-960. doi:10.7205/MILMED-D-15-00488
7. Rutt BT, Oehlert ME, Krieshok TS, Lichtenberg JW. Effectiveness of cognitive processing therapy and prolonged exposure in the Department of Veterans Affairs. Psychol Rep. 2018;121(2):282-302. doi:10.1177/0033294117727746
8. Clarke TC, Black LI, Stussman BJ, Barnes PM, Nahin RL. Trends in the use of complementary health approaches among adults: United States, 2002-2012. Natl Health Stat Report. 2015(79):1-16.
9. Baldwin CM, Long K, Kroesen K, Brooks AJ, Bell IR. A profile of military veterans in the southwestern United States who use complementary and alternative medicine: Implications for integrated care. Arch Intern Med. 2002;162(15):1697-1704. doi:10.1001/archinte.162.15.1697
10. Higgins JPT, Thomas J, Chanlder J, et al, eds. Cochrane Handbook for Systematic Reviews of Interventions. Version 6.2 (updated February 2021). Cochrane; 2021.
11. Liberati A, Altman DG, Tetzlaff J, et al. The PRISMA statement for reporting systematic reviews and meta-analyses of studies that evaluate health care interventions: explanation and elaboration. PLoS Med. 2009;6(7):e1000100. doi:10.1371/journal.pmed.1000100
12. Caspersen CJ, Powell KE, Christenson GM. Physical activity, exercise, and physical fitness: definitions and distinctions for health-related research. Public Health Rep. 1985;100(2):126-131.
13. Sterne JAC, Hernán MA, Reeves BC, et al. ROBINS-I: a tool for assessing risk of bias in non-randomised studies of interventions. BMJ. 2016;355:i4919. doi:10.1136/bmj.i4919
14. Sterne JAC, Savovic´ J, Page MJ, et al. RoB 2: a revised tool for assessing risk of bias in randomised trials. BMJ. 2019;366:l4898. doi:10.1136/bmj.l4898
15. Davis LW, Schmid AA, Daggy JK, et al. Symptoms improve after a yoga program designed for PTSD in a randomized controlled trial with veterans and civilians. Psychol Trauma. 2020;12(8):904-912. doi:10.1037/tra0000564
16. R Core Team. R: a language and environment for statistical computing. R Foundation for Statistical Computing; 2019.
17. Tipton E. Small sample adjustments for robust variance estimation with meta-regression. Psychol Methods .2015;20(3):375-393. doi:10.1037/met0000011
18. Shivakumar G, Anderson EH, Surís AM, North CS. Exercise for PTSD in women veterans: a proof-of-concept study. Mil Med. 2017;182(11):e1809-e1814. doi:10.7205/MILMED-D-16-00440
19. Blake DD, Weathers FW, Nagy LM, et al. The development of a Clinician-Administered PTSD Scale. J Trauma Stress. 1995;8(1):75-90. doi:10.1007/BF02105408
20. Blanchard EB, Jones-Alexander J, Buckley TC, Forneris CA. Psychometric properties of the PTSD Checklist (PCL). Behav Res Ther. 1996;34(8):669-673. doi:10.1016/0005-7967(96)00033-2
21. Weathers FW, Bovin MJ, Lee DJ, et al. The Clinician- Administered PTSD Scale for DSM-5 (CAPS- 5): Development and initial psychometric evaluation in military veterans. Psychol Assess. 2018;30(3):383-395.doi:10.1037/pas0000486
22. Wilkins KC, Lang AJ, Norman SB. Synthesis of the psychometric properties of the PTSD checklist (PCL) military, civilian, and specific versions. Depress Anxiety. 2011;28(7):596-606. doi:10.1002/da.20837
23. Higgins JP, Thompson SG, Deeks JJ, Altman DG. Measuring inconsistency in meta-analyses. BMJ. 2003;327(7414):557-560. doi:10.1136/bmj.327.7414.557
24. Egger M, Davey Smith G, Schneider M, Minder C. Bias in meta-analysis detected by a simple, graphical test. BMJ. 1997;315(7109):629-634. doi:10.1136/bmj.315.7109.629
25. Cushing RE, Braun KL, Alden CISW, Katz AR. Military- tailored yoga for veterans with post-traumatic stress disorder. Mil Med. 2018;183(5-6):e223-e231. doi:10.1093/milmed/usx071
26. Chopin SM, Sheerin CM, Meyer BL. Yoga for warriors: An intervention for veterans with comorbid chronic pain and PTSD. Psychol Trauma. 2020;12(8):888-896. doi:10.1037/tra0000649
27. Justice L, Brems C. Bridging body and mind: case series of a 10-week trauma-informed yoga protocol for veterans. Int J Yoga Therap. 2019;29(1):65-79. doi:10.17761/D-17-2019-00029
28. Staples JK, Hamilton MF, Uddo M. A yoga program for the symptoms of post-traumatic stress disorder in veterans. Mil Med. 2013;178(8):854-860. doi:10.7205/MILMED-D-12-00536
29. Zaccari B, Callahan ML, Storzbach D, McFarlane N, Hudson R, Loftis JM. Yoga for veterans with PTSD: Cognitive functioning, mental health, and salivary cortisol. Psychol Trauma. 2020;12(8):913-917. doi:10.1037/tra0000909
30. Goldstein LA, Mehling WE, Metzler TJ, et al. Veterans Group Exercise: A randomized pilot trial of an Integrative Exercise program for veterans with posttraumatic stress. J Affect Disord. 2018;227:345-352. doi:10.1016/j.jad.2017.11.002
31. Hall KS, Morey MC, Bosworth HB, et al. Pilot randomized controlled trial of exercise training for older veterans with PTSD. J Behav Med. 2020;43(4):648-659. doi:10.1007/s10865-019-00073-w
32. Gaddy MA. Implementation of an integrative medicine treatment program at a Veterans Health Administration residential mental health facility. Psychol Serv. 2018;15(4):503- 509. doi:10.1037/ser0000189
33. Werner CM, Hecksteden A, Morsch A, et al. Differential effects of endurance, interval, and resistance training on telomerase activity and telomere length in a randomized, controlled study. Eur Heart J. 2019;40(1):34- 46. doi:10.1093/eurheartj/ehy585
34. Silverman MN, Deuster PA. Biological mechanisms underlying the role of physical fitness in health and resilience. Interface Focus. 2014;4(5):20140040. doi:10.1098/rsfs.2014.0040
35. Smith PJ, Merwin RM. The role of exercise in management of mental health disorders: an integrative review. Annu Rev Med. 2021;72:45-62. doi:10.1146/annurev-med-060619-022943.
Physical exercise offers preventative and therapeutic benefits for a range of chronic health conditions, including cardiovascular disease, type 2 diabetes mellitus, Alzheimer disease, and depression.1,2 Exercise has been well studied for its antidepressant effects, its ability to reduce risk of aging-related dementia, and favorable effects on a range of cognitive functions.2 Lesser evidence exists regarding the impact of exercise on other mental health concerns. Therefore, an accurate understanding of whether physical exercise may ameliorate other conditions is important.
A small meta-analysis by Rosenbaum and colleagues found that exercise interventions were superior to control conditions for symptom reduction in study participants with posttraumatic stress disorder (PTSD).3 This meta-analysis included 4 randomized clinical trials representing 200 cases. The trial included a variety of physical activities (eg, yoga, aerobic, and strength-building exercises) and control conditions, and participants recruited from online, community, inpatient, and outpatient settings. The standardized mean difference (SMD) produced by the analysis indicated a small-to-medium effect (Hedges g, -0.35), with the authors reporting no evidence of publication bias, although an assessment of potential bias associated with individual trial design characteristics was not conducted. Of note, a meta-analysis by Watts and colleagues found that effect sizes for PTSD treatments tend to be smaller in veteran populations.4 Therefore, how much the mean effect size estimate in the study is applicable to veterans with PTSD is unknown.3
Veterans represent a unique subpopulation in which PTSD is common, although no meta-analysis yet published has synthesized the effects of exercise interventions from trials of veterans with PTSD.5 A recent systematic review by Whitworth and Ciccolo concluded that exercise may be associated with reduced risk of PTSD, a briefer course of PTSD symptoms, and/or reduced sleep- and depression-related difficulties.6 However, that review primarily included observational, cross-sectional, and qualitative works. No trials included in our meta-analysis were included in that review.6
Evidence-based psychotherapies like cognitive processing therapy and prolonged exposure have been shown to be effective for treating PTSD in veterans; however, these modalities are accompanied by high rates of dropout (eg, 40-60%), thereby limiting their clinical utility.7 The use of complementary and alternative approaches for treatment in the United States has increased in recent years, and exercise represents an important complementary treatment option.8 In a study by Baldwin and colleagues, nearly 50% of veterans reported using complementary or alternative approaches, and veterans with PTSD were among those likely to use such approaches.9 However, current studies of the effects of exercise interventions on PTSD symptom reduction are mostly small and varied, making determinations difficult regarding the potential utility of exercise for treating this condition in veterans.
Literature Search
No previous research has synthesized the literature on the effects of exercise on PTSD in the veteran population. The current meta-analysis aims to provide a synthesis of systematically selected studies on this topic to determine whether exercise-based interventions are effective at reducing veterans’ symptoms of PTSD. Our hypothesis was that, when used as a primary or adjuvant intervention for PTSD, physical exercise would be associated with a reduction of PTSD symptom scale scores. We planned a priori to produce separate estimates for single-arm and multi-arm trials. We also wanted to conduct a careful risk of bias assessment—or evaluation of study features that may have systematically influenced results—for included trials, not only to provide context for interpretation of results, but also to inform suggestions for research to advance this field of inquiry.10
Methods
This study was preregistered on PROSPERO and followed PRISMA guidelines for meta-analyses and systematic reviews.11 Supplementary materials, such as the PRISMA checklist, study data, and funnel plots, are available online (doi.org/10.6084/m9.figshare.c.5618437.v1). Conference abstracts were omitted due to a lack of necessary information. We decided early in the planning process to include both randomized and single-arm trials, expecting the number of completed studies in the area of exercise for PTSD symptom reduction in veterans, and particularly randomized trials of such, would be relatively small.
Studies were included if they met the following criteria: (1) the study was a single- or multi-arm interventional trial; (2) participants were veterans; (3) participants had a current diagnosis of PTSD or exhibited subthreshold PTSD symptoms, as established by authors of the individual studies and supported by a structured clinical interview, semistructured interview, or elevated scores on PTSD symptom self-report measures; (4) the study included an intervention in which exercise (physical activity that is planned, structured, repetitive, and purposive in the sense that improvement or maintenance of physical fitness or health is an objective) was the primary component; (5) PTSD symptom severity was by a clinician-rated or self-report measure; and (6) the study was published in a peer-reviewed journal.12 Studies were excluded if means, standard deviations, and sample sizes were not available or the full text of the study was not available in English.
The systematic review was conducted using PubMed, PsycINFO, and Cochrane Library databases, from the earliest record to February 2021. The following search phrase was used, without additional limits, to acquire a list of potential studies: (“PTSD” or “post-traumatic stress disorder” or “posttraumatic stress disorder” or “post traumatic stress disorder”) and (“veteran” or “veterans”) and (“exercise” or “aerobic” or “activity” or “physical activity”). The references of identified publications also were searched for additional studies. Then, study titles and abstracts were evaluated and finally, full texts were evaluated to determine study inclusion. All screening, study selection, and risk of bias and data extraction activities were performed by 2 independent reviewers (DR and MJ) with disagreements resolved through discussion and consensus (Figure 1). A list of studies excluded during full-text review and rationales can be viewed online (doi.org/10.6084/m9.figshare.c.5618437.v1).
Data Collection
Data were extracted from included studies using custom forms and included the following information based on PRISMA guidelines: (1) study design characteristics; (2) intervention details; and (3) PTSD outcome information.11 PTSD symptom severity was the primary outcome of interest. Outcome data were included if they were derived from a measure of PTSD symptoms—equivalency across measures was assumed for meta-analyses. Potential study bias for each outcome was evaluated using the ROBINS-I and Cochrane Collaboration’s RoB 2 tools for single-arm and multi-arm trials, respectively.13,14 These tools evaluate domains related to the design, conduct, and analysis of studies that are associated with bias (ie, systematic error in findings, such as under- or overestimation of results).10 Examples include how well authors performed and concealed randomization procedures, addressed missing data, and measured study outcomes.13,14 The risk of bias (eg, low, moderate, serious) associated with each domain is rated and, based on the domain ratings, each study is then given an overall rating regarding how much risk influences bias.13,14 Broadly, lower risk of bias corresponds to higher confidence in the validity of results.
Finally, 4 authors (associated with 2 single- and 2 multi-arm studies) were contacted and asked to provide further information. Data for 1 additional multi-arm study were obtained from these communications and included in the final study selection.15 These authors were also asked for information about any unpublished works of which they were aware, although no additional works were identified.
Statistical Analyses
Analyses were performed with R Studio R 3.6.0 software.16 An SMD (also known as Hedges g) was calculated for each study outcome: for single-arm trials, this was the SMD between pre- and postintervention scores, whereas for multi-arm trials, this was the SMD between postintervention outcome scores across groups. CIs for each SMD were calculated using a standard normal distribution. Combined SMDs were estimated separately for single- and multi-arm studies, using random-effects meta-analyses. In order to include multiple relevant outcomes from a single trial (ie, for studies using multiple PTSD symptom measures), robust variance estimation was used.17 Precision was used to weight SMDs.
Correlations between pre- and postintervention scores were not available for 1 single-arm study.18 A correlation coefficient of 0.8 was imputed to calculate the standard error of the of the SMDs for the Clinician-Administered PTSD Scale (CAPS) and the PTSD Checklist (PCL), as this value is consistent with past findings regarding the test-retest reliability of these measures.19-22 A sensitivity analysis, using several alternative correlational values, revealed that the choice of correlation coefficient did not impact the overall results of the meta-analysis.
I2 was used to evaluate between-study heterogeneity. Values of I2 > 25%, 50%, and 75% were selected to reflect low, moderate, and high heterogeneity, respectively, in accordance with guidelines described by Higgins and colleagues.23 Potential publication bias was assessed via funnel plot and Egger test.24 Finally, although collection of depressive symptom scores was proposed as a secondary outcome in the study protocol, such data were available only for 1 multi-arm study. As a result, this outcome was not evaluated.
Results
Six studies with 101 total participants were included in the single-arm analyses (Table 1).18,25-29 Participants consisted of veterans with chronic pain, post-9/11 veterans, female veterans of childbearing age, veterans with a history of trauma therapy, and other veterans. Types of exercise included moderate aerobic exercise and yoga. PTSD symptom measures included the CAPS and the PCL (PCL-5 or PCL-M versions). Reported financial sources for included studies included federal grant funding, nonprofit material support, outside organization support, use of US Department of Veterans Affairs (VA) resources, and no reported financial support.
With respect to individual studies, Shivakumar and colleagues found that completion of an aerobic exercise program was associated with reduced scores on 2 different PTSD symptom scales (PCL and CAPS) in 16 women veterans.18 A trauma-informed yoga intervention study with 18 participants by Cushing and colleagues demonstrated veteran participation to be associated with large reductions in PTSD, anxiety, and depression scale scores.25 In a study with 34 veterans, Chopin and colleagues found that a trauma-informed yoga intervention was associated with a statistically significant reduction in PTSD symptoms, as did a study by Zaccari and colleagues with 17 veterans.26,29 Justice and Brems also found some evidence that trauma-informed yoga interventions helped PTSD symptoms in a small sample of 4 veterans, although these results were not quantitatively analyzed.27 In contrast, a small pilot study (n = 12) by Staples and colleagues testing a biweekly, 6-week yoga program did not show a significant effect on PTSD symptoms.28
Three studies with 217 total veteran participants were included in the multi-arm analyses (Table 2).15,30,31 As all multi-arm trials incorporated randomization, they will be referred to as randomized controlled trials (RCTs). On contact, Davis and colleagues provided veteran-specific results for their trial; as such, our data differ from those within the published article.15 Participants from all included studies were veterans currently experiencing symptoms of PTSD. Types of exercise included yoga and combined methods (eg, aerobic and strength training).15,30,31 PTSD symptom measures included the CAPS or the PCL-5.15,30,31 Reported financial sources for included studies included federal grant funding, as well as nonprofit support, private donations, and VA and Department of Defense resources.
Davis and colleagues conducted a recently concluded RCT with > 130 veteran participants and found that a novel manualized yoga program was superior to an attention control in reducing PTSD symptom scale scores for veterans.15 Goldstein and colleagues found that a program consisting of both aerobic and resistance exercises reduced PTSD symptoms to a greater extent than a waitlist control condition, with 47 veterans randomized in this trial.30 Likewise, Hall and colleagues conducted a pilot RCT in which an intervention that integrated exercise and cognitive behavioral techniques was compared to a waitlist control condition.31 For the 48 veterans included in the analyses, the authors reported greater PTSD symptom reduction associated with integrated exercise than that of the control condition; however, the study was not powered to detect statistically significant differences between groups.
Bias Assessment
Results for the risk of bias assessments can be viewed in Tables 3 and 4. For single-arm studies, overall risk of bias was serious for all included trials. Serious risk of bias was found in 2 domains: confounding, due to a lack of accounting for potential preexisting baseline trends (eg, regression to the mean) that could have impacted study results; and measurement, due to the use of a self-report symptom measure (PCL) or CAPS with unblinded assessors. Multiple studies also showed moderate risk in the missing data domain due to participant dropout without appropriate analytic methods to address potential bias.
For RCTs, overall risk of bias ranged from some concerns to high risk. High risk of bias was found in 1 domain, measurement of outcome, due to use of a self-report symptom measure (PCL) with unblinded groups.31 The other 2 studies all had some concern of bias in at least 1 of the following domains: randomization, missing data, and measurement of outcome.
Pooled Standardized Mean Differences
Meta-analytic results can be viewed in Figure 2. The pooled SMD for the 6 single-arm studies was -0.60 (df = 4.41, 95% CI, -1.08 to -0.12, P = .03), indicating a statistically significant reduction in PTSD symptoms over the course of an exercise intervention. Combining SMDs for the 3 included RCTs revealed a pooled SMD of -0.40 (df = 1.57, 95% CI, -0.86 to 0.06, P = .06), indicating that exercise did not result in a statistically significant reduction in PTSD symptoms compared with control conditions.
Publication Bias and Heterogeneity
Visual inspection funnel plots and Egger test did not suggest the presence of publication bias for RCTs (t = 1.21, df = 2, P = .35) or single-arm studies (t = -0.36, df = 5, P = .73).
Single-arm studies displayed a high degree of heterogeneity (I2 = 81.5%). Including sample size or exercise duration as variables in meta-regressions did not reduce heterogeneity (I2 = 85.2% and I2 = 83.8%, respectively). Performing a subgroup analysis only on studies using yoga as an intervention also did not reduce heterogeneity (I2 = 79.2%). Due to the small number of studies, no further exploration of heterogeneity was conducted on single-arm studies. RCTs did not display any heterogeneity (I2 = 0%).
Discussion
Our report represents an early synthesis of the first prospective studies of physical exercise interventions for PTSD in veterans. Results from meta-analyses of 6 single-arm studies (101 participants) and 3 RCTs (217 participants) provide early evidence that exercise may reduce PTSD symptoms in veterans. Yoga was the most common form of exercise used in single-arm studies, whereas RCTs used a wider range of interventions. The pooled SMD of -0.60 for single-arm longitudinal studies suggest a medium decrease in PTSD symptoms for veterans who engage in exercise interventions. Analysis of the RCTs supported this finding, with a pooled SMD of -0.40 reflecting a small-to-medium effect of exercise on PTSD symptoms over control conditions, although this result did not achieve statistical significance. Of note, while the nonsignificant finding for RCTs may have been due to insufficient power caused by the limited number of included studies, possibly exercise was not more efficacious than were the control conditions.
Although RCTs represented a variety of exercise types, PTSD symptom measures, and veteran subgroups, statistical results were not indicative of heterogeneity. However, only the largest and most comprehensive study of exercise for PTSD in veterans to date by Davis and colleagues had a statistically significant SMD.15 Of note, one of the other 2 RCTs displayed an SMD of a similar magnitude, but this study had a much smaller sample size and was underpowered to detect significance.30 Additionally, risk of bias assessments for single-arm studies and RCTs revealed study characteristics that suggest possible inflation of absolute effect sizes for individual studies. Therefore, the pooled SMDs we report are interpretable but may exceed the true effect of exercise for PTSD symptom reduction in veterans.
Based on results of our analyses, it is reasonable, albeit preliminary, to conclude that exercise interventions may result in reduced PTSD symptoms among veterans. At the very least, these findings support the continued investigation of such interventions for veterans. Given the unique and salubrious characteristics of physical exercise, such results, if supported by further research, suggest that exercise-based interventions may be particularly valuable within the trauma treatment realm. For example, exercise can be less expensive and more convenient than attending traditional treatment, and for veterans reluctant to engage in standard treatment approaches such as psychiatric and psychosocial modalities, complementary approaches entailing exercise may be viewed as particularly acceptable or enjoyable.32 In addition to possibly reducing PTSD symptoms, exercise is a well-established treatment for conditions commonly comorbid with PTSD, including depression, anxiety disorders, cognitive difficulties, and certain chronic pain conditions.6 As such, exercise represents a holistic treatment option that has the potential to augment standard PTSD care.
Limitations
The present study has several important limitations. First, few studies were found that met the broad eligibility criteria and those that did often had a small sample size. Besides highlighting a gap in the extant research, the limited studies available for meta-analysis means that caution must be taken when interpreting results. Fortunately, this issue will likely resolve once additional studies investigating the impact of exercise on PTSD symptoms in veterans are available for synthesis.
Relatedly, the included study interventions varied considerably, both in the types of exercise used and the characteristics of the exercises (eg, frequency, duration, and intensity), which is relevant as different exercise modalities are associated with differential physical effects.33 Including such a mixture of exercises may have given an incomplete picture of their potential therapeutic effects. Also, none of the RCTs compared exercise against first-line treatments for PTSD, such as prolonged exposure or cognitive processing therapy, which would have provided further insight into the role exercise could play in clinical settings.7
Another limitation is the elevated risk of bias found in most studies, particularly present in the longitudinal single-arm studies, all of which were rated at serious risk. For instance, no single-arm study controlled for preexisting baseline trends: without such (and lacking a comparison control group like in RCTs), it is possible that the observed effects were due to extraneous factors, rather than the exercise intervention. Although not as severe, the multi-arm RCTs also displayed at least moderate risk of bias. Therefore, SMDs may have been overestimated for each group of studies.
Finally, the results of the single-arm meta-analysis displayed high statistical heterogeneity, reducing the generalizability of the results. One possible cause of this heterogeneity may have been the yoga interventions, as a separate analysis removing the only nonyoga study did not reduce heterogeneity. This result was surprising, as the included yoga interventions seemed similar across studies. While the presence of high heterogeneity does require some caution when applying these results to outside interventions, the present study made use of random-effects meta-analysis, a technique that incorporates study heterogeneity into the statistical model, thereby strengthening the findings compared with that of a traditional fixed-effects approach.10
Future Steps
Several future steps are warranted to improve knowledge of exercise as a treatment for PTSD in veterans and in the general population. With current meta-analyses limited to small numbers of studies, additional studies of the efficacy of exercise for treating PTSD could help in several ways. A larger pool of studies would enable future meta-analyses to explore related questions, such as those regarding the impact of exercise on quality of life or depressive symptom reduction among veterans with PTSD. A greater number of studies also would enable meta-analysts to explore potentially critical moderators. For example, the duration, frequency, or type of exercise may moderate the effect of exercise on PTSD symptom reduction. Moderators related to patient or study design characteristics also should be explored in future studies.
Future work also should evaluate the impact that specific features of exercise regimens have on PTSD. Knowing whether the type or structure of exercise affects its clinical use would be invaluable in developing and implementing efficient exercise-based interventions. For example, if facilitated exercise was found to be significantly more effective at reducing PTSD symptoms than exercise completed independently, the development of exercise intervention programs in the VA and other facilities that commonly treat PTSD may be warranted. Additionally, it may be useful to identify specific mechanisms through which exercise reduces PTSD symptoms. For example, in addition to its beneficial biological effects, exercise also promotes psychological health through behavioral activation and alterations within reinforcement/reward systems, suggesting that exercise regularity may be more important than intensity.34,35 Understanding which mechanisms contribute most to change will aid in the development of more efficient interventions.
Given that veterans are demonstrating considerable interest in complementary and alternative PTSD treatments, it is critical that researchers focus on high-quality randomized tests of these interventions. Therefore, in addition to greater quality of exercise intervention studies, future efforts should be focused on RCTs that are designed in such a way as to limit potential introduction of bias. For example, assessment data should be completed by blinded assessors using standardized measures, and analyses should account for missing data and unequal participant attrition between groups. Ideally, pre-intervention trends across multiple baseline datapoints also would be collected in single-arm studies to avoid confounding related to regression to the mean. It is also recommended that future meta-analyses use risk of bias assessments and consider how the results of such assessments may impact the interpretation of results.
Conclusions
Findings from both single-arm studies and RCTs suggest possible benefit of exercise on PTSD symptom reduction, although confirmation of findings is needed. No study found increased symptoms following exercise intervention. Thus, it is reasonable to consider physical exercise, such as yoga, as an adjunct, whole-health consistent treatment. HCPs working with veterans with past traumatic experiences should consider incorporating exercise into patient care. Enhanced educational efforts emphasizing the psychotherapeutic impact of exercise may also have value for the veteran population. Furthermore, the current risk of bias assessments highlights the need for additional high-quality RCTs evaluating the specific impact of exercise on PTSD symptom reduction in veterans. In particular, this field of inquiry would benefit from larger samples and design characteristics to reduce bias (eg, blinding when possible, use of CAPS vs only self-report symptom measures, reducing problematic attrition, corrections for missing data, etc).
Acknowledgments
This research is the result of work supported with resources and the use of facilities at the VA Eastern Kansas Healthcare System (Dwight D. Eisenhower VA Medical Center). It was also supported by the Department of Veterans Affairs Office of Academic Affiliations Advanced Fellowship Program in Mental Illness Research and Treatment, as well as the Rocky Mountain Mental Illness Research, Education, and Clinical Center. Since Dr. Reis and Dr. Gaddy are employees of the US Government and contributed to this manuscript as part of their official duties, the work is not subject to US copyright. This study was preregistered on PROSPERO (https://www.crd.york.ac.uk/prospero/; ID: CRD42020153419).
1. Reiner M, Niermann C, Jekauc D, Woll A. Long-term health benefits of physical activity—a systematic review of longitudinal studies. BMC Public Health. 2013;13:813. doi:10.1186/1471-2458-13-813
2. Walsh R. Lifestyle and mental health. Am Psychol. 2011;66(7):579-592. doi:10.1037/a0021769
3. Rosenbaum S, Vancampfort D, Steel Z, Newby J, Ward PB, Stubbs B. Physical activity in the treatment of posttraumatic stress disorder: a systematic review and meta-analysis. Psychiatry Res. 2015;230(2):130-136. doi:10.1016/j.psychres.2015.10.017
4. Watts BV, Schnurr PP, Mayo L, Young-Xu Y, Weeks WB, Friedman MJ. Meta-analysis of the efficacy of treatments for posttraumatic stress disorder. J Clin Psychiatry. 2013;74(6):e541-550. doi:10.4088/JCP.12r08225
5. Tanielian T, Jaycox L, eds. Invisible Wounds of War: Psychological and Cognitive Injuries, Their Consequences, and Services to Assist Recovery. RAND Corporation; 2008
6. Whitworth JW, Ciccolo JT. Exercise and post-traumatic stress disorder in military veterans: a systematic review. Mil Med. 2016;181(9):953-960. doi:10.7205/MILMED-D-15-00488
7. Rutt BT, Oehlert ME, Krieshok TS, Lichtenberg JW. Effectiveness of cognitive processing therapy and prolonged exposure in the Department of Veterans Affairs. Psychol Rep. 2018;121(2):282-302. doi:10.1177/0033294117727746
8. Clarke TC, Black LI, Stussman BJ, Barnes PM, Nahin RL. Trends in the use of complementary health approaches among adults: United States, 2002-2012. Natl Health Stat Report. 2015(79):1-16.
9. Baldwin CM, Long K, Kroesen K, Brooks AJ, Bell IR. A profile of military veterans in the southwestern United States who use complementary and alternative medicine: Implications for integrated care. Arch Intern Med. 2002;162(15):1697-1704. doi:10.1001/archinte.162.15.1697
10. Higgins JPT, Thomas J, Chanlder J, et al, eds. Cochrane Handbook for Systematic Reviews of Interventions. Version 6.2 (updated February 2021). Cochrane; 2021.
11. Liberati A, Altman DG, Tetzlaff J, et al. The PRISMA statement for reporting systematic reviews and meta-analyses of studies that evaluate health care interventions: explanation and elaboration. PLoS Med. 2009;6(7):e1000100. doi:10.1371/journal.pmed.1000100
12. Caspersen CJ, Powell KE, Christenson GM. Physical activity, exercise, and physical fitness: definitions and distinctions for health-related research. Public Health Rep. 1985;100(2):126-131.
13. Sterne JAC, Hernán MA, Reeves BC, et al. ROBINS-I: a tool for assessing risk of bias in non-randomised studies of interventions. BMJ. 2016;355:i4919. doi:10.1136/bmj.i4919
14. Sterne JAC, Savovic´ J, Page MJ, et al. RoB 2: a revised tool for assessing risk of bias in randomised trials. BMJ. 2019;366:l4898. doi:10.1136/bmj.l4898
15. Davis LW, Schmid AA, Daggy JK, et al. Symptoms improve after a yoga program designed for PTSD in a randomized controlled trial with veterans and civilians. Psychol Trauma. 2020;12(8):904-912. doi:10.1037/tra0000564
16. R Core Team. R: a language and environment for statistical computing. R Foundation for Statistical Computing; 2019.
17. Tipton E. Small sample adjustments for robust variance estimation with meta-regression. Psychol Methods .2015;20(3):375-393. doi:10.1037/met0000011
18. Shivakumar G, Anderson EH, Surís AM, North CS. Exercise for PTSD in women veterans: a proof-of-concept study. Mil Med. 2017;182(11):e1809-e1814. doi:10.7205/MILMED-D-16-00440
19. Blake DD, Weathers FW, Nagy LM, et al. The development of a Clinician-Administered PTSD Scale. J Trauma Stress. 1995;8(1):75-90. doi:10.1007/BF02105408
20. Blanchard EB, Jones-Alexander J, Buckley TC, Forneris CA. Psychometric properties of the PTSD Checklist (PCL). Behav Res Ther. 1996;34(8):669-673. doi:10.1016/0005-7967(96)00033-2
21. Weathers FW, Bovin MJ, Lee DJ, et al. The Clinician- Administered PTSD Scale for DSM-5 (CAPS- 5): Development and initial psychometric evaluation in military veterans. Psychol Assess. 2018;30(3):383-395.doi:10.1037/pas0000486
22. Wilkins KC, Lang AJ, Norman SB. Synthesis of the psychometric properties of the PTSD checklist (PCL) military, civilian, and specific versions. Depress Anxiety. 2011;28(7):596-606. doi:10.1002/da.20837
23. Higgins JP, Thompson SG, Deeks JJ, Altman DG. Measuring inconsistency in meta-analyses. BMJ. 2003;327(7414):557-560. doi:10.1136/bmj.327.7414.557
24. Egger M, Davey Smith G, Schneider M, Minder C. Bias in meta-analysis detected by a simple, graphical test. BMJ. 1997;315(7109):629-634. doi:10.1136/bmj.315.7109.629
25. Cushing RE, Braun KL, Alden CISW, Katz AR. Military- tailored yoga for veterans with post-traumatic stress disorder. Mil Med. 2018;183(5-6):e223-e231. doi:10.1093/milmed/usx071
26. Chopin SM, Sheerin CM, Meyer BL. Yoga for warriors: An intervention for veterans with comorbid chronic pain and PTSD. Psychol Trauma. 2020;12(8):888-896. doi:10.1037/tra0000649
27. Justice L, Brems C. Bridging body and mind: case series of a 10-week trauma-informed yoga protocol for veterans. Int J Yoga Therap. 2019;29(1):65-79. doi:10.17761/D-17-2019-00029
28. Staples JK, Hamilton MF, Uddo M. A yoga program for the symptoms of post-traumatic stress disorder in veterans. Mil Med. 2013;178(8):854-860. doi:10.7205/MILMED-D-12-00536
29. Zaccari B, Callahan ML, Storzbach D, McFarlane N, Hudson R, Loftis JM. Yoga for veterans with PTSD: Cognitive functioning, mental health, and salivary cortisol. Psychol Trauma. 2020;12(8):913-917. doi:10.1037/tra0000909
30. Goldstein LA, Mehling WE, Metzler TJ, et al. Veterans Group Exercise: A randomized pilot trial of an Integrative Exercise program for veterans with posttraumatic stress. J Affect Disord. 2018;227:345-352. doi:10.1016/j.jad.2017.11.002
31. Hall KS, Morey MC, Bosworth HB, et al. Pilot randomized controlled trial of exercise training for older veterans with PTSD. J Behav Med. 2020;43(4):648-659. doi:10.1007/s10865-019-00073-w
32. Gaddy MA. Implementation of an integrative medicine treatment program at a Veterans Health Administration residential mental health facility. Psychol Serv. 2018;15(4):503- 509. doi:10.1037/ser0000189
33. Werner CM, Hecksteden A, Morsch A, et al. Differential effects of endurance, interval, and resistance training on telomerase activity and telomere length in a randomized, controlled study. Eur Heart J. 2019;40(1):34- 46. doi:10.1093/eurheartj/ehy585
34. Silverman MN, Deuster PA. Biological mechanisms underlying the role of physical fitness in health and resilience. Interface Focus. 2014;4(5):20140040. doi:10.1098/rsfs.2014.0040
35. Smith PJ, Merwin RM. The role of exercise in management of mental health disorders: an integrative review. Annu Rev Med. 2021;72:45-62. doi:10.1146/annurev-med-060619-022943.
Review of Ethnoracial Representation in Clinical Trials (Phases 1 Through 4) of Atopic Dermatitis Therapies
To the Editor:
Atopic dermatitis (AD) affects an estimated 7.2% of adults and 10.7% of children in the United States; however, AD might affect different races at a varying rate.1 Compared to their European American counterparts, Asian/Pacific Islanders and African Americans are 7 and 3 times more likely, respectively, to be given a diagnosis of AD.2
Despite being disproportionately affected by AD, minority groups might be underrepresented in clinical trials of AD treatments.3 One explanation for this imbalance might be that ethnoracial representation differs across regions in the United States, perhaps in regions where clinical trials are conducted. Price et al3 investigated racial representation in clinical trials of AD globally and found that patients of color are consistently underrepresented.
Research on racial representation in clinical trials within the United States—on national and regional scales—is lacking from the current AD literature. We conducted a study to compare racial and ethnic disparities in AD clinical trials across regions of the United States.
Using the ClinicalTrials.gov database (www.clinicaltrials.gov) of the National Library of Medicine, we identified clinical trials of AD treatments (encompassing phases 1 through 4) in the United States that were completed before March 14, 2021, with the earliest data from 2013. Search terms included atopic dermatitis, with an advanced search for interventional (clinical trials) and with results.
In total, 95 completed clinical trials were identified, of which 26 (27.4%) reported ethnoracial demographic data. One trial was excluded due to misrepresentation regarding the classification of individuals who identified as more than 1 racial category. Clinical trials for systemic treatments (7 [28%]) and topical treatments (18 [72%]) were identified.
All ethnoracial data were self-reported by trial participants based on US Food and Drug Administration guidelines for racial and ethnic categorization.4 Trial participants who identified ethnically as Hispanic or Latino might have been a part of any racial group. Only 7 of the 25 included clinical trials (28%) provided ethnic demographic data (Hispanic [Latino] or non-Hispanic); 72% of trials failed to report ethnicity. Ethnic data included in our analysis came from only the 7 clinical trials that included these data. International multicenter trials that included a US site were excluded.
Ultimately, the number of trials included in our analysis was 25, comprised of 2443 participants. Data were further organized by US geographic region (Northeast, Midwest, South, West, and multiregion trials [ie, conducted in ≥2 regions]). No AD clinical trials were conducted solely in the Midwest; it was only included within multiregion trials.
Compared to their representation in the 2019 US Census, most minority groups were overrepresented in clinical trials, while White individuals were underrepresented (eTable). The percentages of our findings on representation for race are as follows (US Census data are listed in parentheses for comparison5):
- White: 56.8% (72.5%)
- Black/African American: 28.3% (12.7%)
- Asian: 10.3% (5.5%)
- Multiracial: 1.1% (3.3%)
- Native Hawaiian or other Pacific Islander: 0.3% (0.2%)
- American Indian or Alaska Native: 0.2% (0.8%)
- Other: 0.5% (4.9%).
 of Atopic Dermatitis Therapies")
Our findings on representation for ethnicity are as follows (US Census data is listed in parentheses for comparison5):
- Hispanic or Latino: 21.4% (18.0%)
Although representation of Black/African American and Asian participants in clinical trials was higher than their representation in US Census data and representation of White participants was lower in clinical trials than their representation in census data, equal representation among all racial and ethnic groups is still lacking. A potential explanation for this finding might be that requirements for trial inclusion selected for more minority patients, given the propensity for greater severity of AD among those racial groups.2 Another explanation might be that efforts to include minority patients in clinical trials are improving.
There were great differences in ethnoracial representation in clinical trials when regions within the United States were compared. Based on census population data by region, the West had the highest percentage (29.9%) of Hispanic or Latino residents; however, this group represented only 11.7% of participants in AD clinical trials in that region.5
The South had the greatest number of participants in AD clinical trials of any region, which was consistent with research findings on an association between severity of AD and heat.6 With a warmer climate correlating with an increased incidence of AD, it is possible that more people are willing to participate in clinical trials in the South.
The Midwest was the only region in which region-specific clinical trials were not conducted. Recent studies have shown that individuals with AD who live in the Midwest have comparatively less access to health care associated with AD treatment and are more likely to visit an emergency department because of AD than individuals in any other US region.7 This discrepancy highlights the need for increased access to resources and clinical trials focused on the treatment of AD in the Midwest.
In 1993, the National Institutes of Health Revitalization Act established a federal legislative mandate to encourage inclusion of women and people of color in clinical trials.8 During the last 2 decades, there have been improvements in ethnoracial reporting. A 2020 global study found that 81.1% of randomized controlled trials (phases 2 and 3) of AD treatments reported ethnoracial data.3
Equal representation in clinical trials allows for further investigation of the connection between race, AD severity, and treatment efficacy. Clinical trials need to have equal representation of ethnoracial categories across all regions of the United States. If one group is notably overrepresented, ethnoracial associations related to the treatment of AD might go undetected.9 Similarly, if representation is unequal, relationships of treatment efficacy within ethnoracial groups also might go undetected. None of the clinical trials that we analyzed investigated treatment efficacy by race, suggesting that there is a need for future research in this area.
It also is important to note that broad classifications of race and ethnicity are limiting and therefore overlook differences within ethnoracial categories. Although representation of minority patients in clinical trials for AD treatments is improving, we conclude that there remains a need for greater and equal representation of minority groups in clinical trials of AD treatments in the United States.
- Avena-Woods C. Overview of atopic dermatitis. Am J Manag Care. 2017;23(8 suppl):S115-S123.
- Kaufman BP, Guttman‐Yassky E, Alexis AF. Atopic dermatitis in diverse racial and ethnic groups—variations in epidemiology, genetics, clinical presentation and treatment. Exp Dermatol. 2018;27:340-357. doi:10.1111/exd.13514
- Price KN, Krase JM, Loh TY, et al. Racial and ethnic disparities in global atopic dermatitis clinical trials. Br J Dermatol. 2020;183:378-380. doi:10.1111/bjd.18938
- Collection of race and ethnicity data in clinical trials: guidance for industry and Food and Drug Administration staff. US Food and Drug Administration; October 26, 2016. Accessed February 20, 2022. https://www.fda.gov/media/75453/download
- United States Census Bureau. 2019 Population estimates by age, sex, race and Hispanic origin. Published June 25, 2020. Accessed March 22, 2022. https://www.census.gov/newsroom/press-kits/2020/population-estimates-detailed.html
- Fleischer AB Jr. Atopic dermatitis: the relationship to temperature and seasonality in the United States. Int J Dermatol. 2019;58:465-471. doi:10.1111/ijd.14289
- Wu KK, Nguyen KB, Sandhu JK, et al. Does location matter? geographic variations in healthcare resource use for atopic dermatitis in the United States. J Dermatolog Treat. 2021;32:314-320. doi:10.1080/09546634.2019.1656796
- National Institutes of Health Revitalization Act of 1993, 42 USC 201 (1993). Accessed February 20, 2022. https://www.govinfo.gov/content/pkg/STATUTE-107/pdf/STATUTE-107-Pg122.pdf
- Hirano SA, Murray SB, Harvey VM. Reporting, representation, and subgroup analysis of race and ethnicity in published clinical trials of atopic dermatitis in the United States between 2000 and 2009. Pediatr Dermatol. 2012;29:749-755. doi:10.1111/j.1525-1470.2012.01797.x
To the Editor:
Atopic dermatitis (AD) affects an estimated 7.2% of adults and 10.7% of children in the United States; however, AD might affect different races at a varying rate.1 Compared to their European American counterparts, Asian/Pacific Islanders and African Americans are 7 and 3 times more likely, respectively, to be given a diagnosis of AD.2
Despite being disproportionately affected by AD, minority groups might be underrepresented in clinical trials of AD treatments.3 One explanation for this imbalance might be that ethnoracial representation differs across regions in the United States, perhaps in regions where clinical trials are conducted. Price et al3 investigated racial representation in clinical trials of AD globally and found that patients of color are consistently underrepresented.
Research on racial representation in clinical trials within the United States—on national and regional scales—is lacking from the current AD literature. We conducted a study to compare racial and ethnic disparities in AD clinical trials across regions of the United States.
Using the ClinicalTrials.gov database (www.clinicaltrials.gov) of the National Library of Medicine, we identified clinical trials of AD treatments (encompassing phases 1 through 4) in the United States that were completed before March 14, 2021, with the earliest data from 2013. Search terms included atopic dermatitis, with an advanced search for interventional (clinical trials) and with results.
In total, 95 completed clinical trials were identified, of which 26 (27.4%) reported ethnoracial demographic data. One trial was excluded due to misrepresentation regarding the classification of individuals who identified as more than 1 racial category. Clinical trials for systemic treatments (7 [28%]) and topical treatments (18 [72%]) were identified.
All ethnoracial data were self-reported by trial participants based on US Food and Drug Administration guidelines for racial and ethnic categorization.4 Trial participants who identified ethnically as Hispanic or Latino might have been a part of any racial group. Only 7 of the 25 included clinical trials (28%) provided ethnic demographic data (Hispanic [Latino] or non-Hispanic); 72% of trials failed to report ethnicity. Ethnic data included in our analysis came from only the 7 clinical trials that included these data. International multicenter trials that included a US site were excluded.
Ultimately, the number of trials included in our analysis was 25, comprised of 2443 participants. Data were further organized by US geographic region (Northeast, Midwest, South, West, and multiregion trials [ie, conducted in ≥2 regions]). No AD clinical trials were conducted solely in the Midwest; it was only included within multiregion trials.
Compared to their representation in the 2019 US Census, most minority groups were overrepresented in clinical trials, while White individuals were underrepresented (eTable). The percentages of our findings on representation for race are as follows (US Census data are listed in parentheses for comparison5):
- White: 56.8% (72.5%)
- Black/African American: 28.3% (12.7%)
- Asian: 10.3% (5.5%)
- Multiracial: 1.1% (3.3%)
- Native Hawaiian or other Pacific Islander: 0.3% (0.2%)
- American Indian or Alaska Native: 0.2% (0.8%)
- Other: 0.5% (4.9%).
Our findings on representation for ethnicity are as follows (US Census data is listed in parentheses for comparison5):
- Hispanic or Latino: 21.4% (18.0%)
Although representation of Black/African American and Asian participants in clinical trials was higher than their representation in US Census data and representation of White participants was lower in clinical trials than their representation in census data, equal representation among all racial and ethnic groups is still lacking. A potential explanation for this finding might be that requirements for trial inclusion selected for more minority patients, given the propensity for greater severity of AD among those racial groups.2 Another explanation might be that efforts to include minority patients in clinical trials are improving.
There were great differences in ethnoracial representation in clinical trials when regions within the United States were compared. Based on census population data by region, the West had the highest percentage (29.9%) of Hispanic or Latino residents; however, this group represented only 11.7% of participants in AD clinical trials in that region.5
The South had the greatest number of participants in AD clinical trials of any region, which was consistent with research findings on an association between severity of AD and heat.6 With a warmer climate correlating with an increased incidence of AD, it is possible that more people are willing to participate in clinical trials in the South.
The Midwest was the only region in which region-specific clinical trials were not conducted. Recent studies have shown that individuals with AD who live in the Midwest have comparatively less access to health care associated with AD treatment and are more likely to visit an emergency department because of AD than individuals in any other US region.7 This discrepancy highlights the need for increased access to resources and clinical trials focused on the treatment of AD in the Midwest.
In 1993, the National Institutes of Health Revitalization Act established a federal legislative mandate to encourage inclusion of women and people of color in clinical trials.8 During the last 2 decades, there have been improvements in ethnoracial reporting. A 2020 global study found that 81.1% of randomized controlled trials (phases 2 and 3) of AD treatments reported ethnoracial data.3
Equal representation in clinical trials allows for further investigation of the connection between race, AD severity, and treatment efficacy. Clinical trials need to have equal representation of ethnoracial categories across all regions of the United States. If one group is notably overrepresented, ethnoracial associations related to the treatment of AD might go undetected.9 Similarly, if representation is unequal, relationships of treatment efficacy within ethnoracial groups also might go undetected. None of the clinical trials that we analyzed investigated treatment efficacy by race, suggesting that there is a need for future research in this area.
It also is important to note that broad classifications of race and ethnicity are limiting and therefore overlook differences within ethnoracial categories. Although representation of minority patients in clinical trials for AD treatments is improving, we conclude that there remains a need for greater and equal representation of minority groups in clinical trials of AD treatments in the United States.
- Avena-Woods C. Overview of atopic dermatitis. Am J Manag Care. 2017;23(8 suppl):S115-S123.
- Kaufman BP, Guttman‐Yassky E, Alexis AF. Atopic dermatitis in diverse racial and ethnic groups—variations in epidemiology, genetics, clinical presentation and treatment. Exp Dermatol. 2018;27:340-357. doi:10.1111/exd.13514
- Price KN, Krase JM, Loh TY, et al. Racial and ethnic disparities in global atopic dermatitis clinical trials. Br J Dermatol. 2020;183:378-380. doi:10.1111/bjd.18938
- Collection of race and ethnicity data in clinical trials: guidance for industry and Food and Drug Administration staff. US Food and Drug Administration; October 26, 2016. Accessed February 20, 2022. https://www.fda.gov/media/75453/download
- United States Census Bureau. 2019 Population estimates by age, sex, race and Hispanic origin. Published June 25, 2020. Accessed March 22, 2022. https://www.census.gov/newsroom/press-kits/2020/population-estimates-detailed.html
- Fleischer AB Jr. Atopic dermatitis: the relationship to temperature and seasonality in the United States. Int J Dermatol. 2019;58:465-471. doi:10.1111/ijd.14289
- Wu KK, Nguyen KB, Sandhu JK, et al. Does location matter? geographic variations in healthcare resource use for atopic dermatitis in the United States. J Dermatolog Treat. 2021;32:314-320. doi:10.1080/09546634.2019.1656796
- National Institutes of Health Revitalization Act of 1993, 42 USC 201 (1993). Accessed February 20, 2022. https://www.govinfo.gov/content/pkg/STATUTE-107/pdf/STATUTE-107-Pg122.pdf
- Hirano SA, Murray SB, Harvey VM. Reporting, representation, and subgroup analysis of race and ethnicity in published clinical trials of atopic dermatitis in the United States between 2000 and 2009. Pediatr Dermatol. 2012;29:749-755. doi:10.1111/j.1525-1470.2012.01797.x
Practice Points
- Although minority groups are disproportionally affected by atopic dermatitis (AD), they may be underrepresented in clinical trials for AD in the United States.
- Equal representation among ethnoracial groups in clinical trials is important to allow for a more thorough investigation of the efficacy of treatments for AD.
Verrucous Carcinoma of the Foot: A Retrospective Study of 19 Cases and Analysis of Prognostic Factors Influencing Recurrence
Verrucous carcinoma is a rare cancer with the greatest predilection for the foot. Multiple case reports with only a few large case series have been published. 1-3 Plantar verrucous carcinoma is characterized as a slowly but relentlessly enlarging warty tumor with low metastatic potential and high risk for local invasion. The tumor occurs most frequently in patients aged 60 to 70 years, predominantly in White males. 1 It often is misdiagnosed for years as an ulcer or wart that is highly resistant to therapy. Size typically ranges from 1 to 12 cm in greatest dimension. 1
The pathogenesis of plantar verrucous carcinoma remains unclear, but some contributing factors have been proposed, including trauma, chronic irritation, infection, and poor local hygiene.2 This tumor has been reported to occur in chronic foot ulcerations, particularly in the diabetic population.4 It has been proposed that abnormal expression of the p53 tumor suppressor protein and several types of human papillomavirus (HPV) may have a role in the pathogenesis of verrucous carcinoma.5
The pathologic hallmarks of this tumor include a verrucous/hyperkeratotic surface with a deeply endophytic, broad, pushing base. Tumor cells are well differentiated, and atypia is either absent or confined to 1 or 2 layers at the base of the tumor. Overt invasion at the base is lacking, except in cases with a component of conventional invasive squamous cell carcinoma. Human papillomavirus viropathic changes are classically absent.1,3 Studies of the histopathology of verrucous carcinoma have been complicated by similar entities, nomenclatural uncertainty, and variable diagnostic criteria. For example, epithelioma cuniculatum variously has been defined as being synonymous with verrucous carcinoma, a distinct clinical verrucous carcinoma subtype occurring on the soles, a histologic subtype (characterized by prominent burrowing sinuses), or a separate entity entirely.1,2,6,7 Furthermore, in the genital area, several different types of carcinomas have verruciform features but display distinct microscopic findings and outcomes from verrucous carcinoma.8
Verrucous carcinoma represents an unusual variant of squamous cell carcinoma and is treated as such. Treatments have included laser surgery; immunotherapy; retinoid therapy; and chemotherapy by oral, intralesional, or iontophoretic routes in select patients.9 Radiotherapy presents another option, though reports have described progression to aggressive squamous cell carcinoma in some cases.9 Surgery is the best course of treatment, and as more case reports have been published, a transition from radical resection to wide excision with tumor-free margins is the treatment of choice.2,3,10,11 To minimize soft-tissue deficits, Mohs micrographic surgery has been discussed as a treatment option for verrucous carcinoma.11-13
Few studies have described verrucous carcinoma recurrence, and none have systematically examined recurrence rate, risk factors, or prognosis
Methods
Patient cases were
Of the 19 cases, 16 were treated at the University of Michigan and are included in the treatment analyses. Specific attention was then paid to the cases with a clinical recurrence despite negative surgical margins. We compared the clinical and surgical differences between recurrent cases and nonrecurrent cases.
Pathology was rereviewed for selected cases, including 2 cases with recurrence and matched primary, 2 cases with recurrence (for which the matched primary was unavailable for review), and 5 representative primary cases that were not complicated by recurrence. Pathology review was conducted in a blinded manner by one of the authors (P.W.H) who is a board-certified dermatopathologist for approximate depth of invasion from the granular layer, perineural invasion, bone invasion, infiltrative growth, presence of conventional squamous cell carcinoma, and margin status.
Statistical analysis was performed when appropriate using an N1 χ2 test or Student t test.
Results
Demographics and Comorbidities—The median age of the patients at the time of diagnosis was 55 years (range, 34–77 years). There were 12 males and 7 females (Table 1). Two patients were Black and 17 were White. Almost all patients had additional comorbidities including tobacco use (68%), alcohol use (47%), and diabetes (47%). Only 1 patient had an autoimmune disease and was on chronic steroids. No significant difference was found between the demographics of patients with recurrent lesions and those without recurrence.

Tumor Location and Clinical Presentation—The most common clinical presentation included a nonhealing ulceration with warty edges, pain, bleeding, and lowered mobility. In most cases, there was history of prior treatment over a duration ranging from 1 to 8 years, with a median of 5 years prior to biopsy-based diagnosis (Table 1). Six patients had a history of osteomyelitis, diagnosed by imaging or biopsy, within a year before tumor diagnosis. The size of the primary tumor ranged from 2.4 to 6 cm, with a mean of 4 cm (P=.20). The clinical presentation, time before diagnosis, and size of the tumors did not differ significantly between recurrent and nonrecurrent cases.
The tumor location for the recurrent cases differed significantly compared to nonrecurrent cases. All 5 of the patients with a recurrence presented with a tumor on the nonglabrous part of the foot. Four patients (80%) had lesions on the dorsal or lateral aspect of the great toe (P=.002), and 1 patient (20%) had a lesion on the low ankle (P=.09)(Table 1). Of the nonrecurrent cases, 1 patient (7%) presented with a tumor on the plantar surface of the great toe (P=.002), 13 patients (93%) presented with tumors on the distal plantar surface of the foot (P=.0002), and 1 patient with a plantar foot tumor (Figure 1) also had verrucous carcinoma on the thumb (Table 1 and Figure 2).

Histopathology—Available pathology slides for recurrent cases of verrucous carcinoma were reviewed alongside representative cases of verrucous carcinomas that did not progress to recurrence. The diagnosis of verrucous carcinoma was confirmed in all cases, with no evidence of conventional squamous cell carcinoma, perineural invasion, extension beyond the dermis, or bone invasion in any case. The median size of the tumors was 4.2 cm and 4 cm for nonrecurrent and recurrent specimens, respectively. Recurrences displayed a trend toward increased depth compared to primary tumors without recurrence (average depth, 5.5 mm vs 3.7 mm); however, this did not reach statistical significance (P=.24). Primary tumors that progressed to recurrence (n=2) displayed similar findings to the other cases, with invasive depths of 3.5 and 5.5 mm, and there was no evidence of conventional squamous cell carcinoma, perineural invasion, or extension beyond the dermis.

Treatment of Nonrecurrent Cases—Of the 16 total cases treated at the University of Michigan, surgery was the primary mode of therapy in every case (Tables 2 and 3). Of the 11 nonrecurrent cases, 7 patients had wide local excision with a dermal regeneration template, and delayed split-thickness graft reconstruction. Three cases had wide local excision with metatarsal resection, dermal regeneration template, and delayed skin grafting. One case had a great toe amputation

Treatment of Recurrent Cases—For the 5 patients with recurrence, surgical margins were not reported in all the cases but ranged from 0.5 to 2 cm (4/5 [80%] reported). On average, follow-up for this group of patients was 29 months, with a range of 12 to 60 months (Table 3).

The first case with a recurrence (patient 12) initially presented with a chronic calluslike growth of the medial ankle. The lesion initially was treated with wide local excision with negative margins. Reconstruction was performed in a staged fashion with use of a dermal regenerative template followed later by split-thickness skin grafting. Tumor recurrence with negative margins occurred 3 times over the next 2 years despite re-resections with negative pathologic margins. Each recurrence presented as graft breakdown and surrounding hyperkeratosis (Figure 3). After the third graft placement failed, the patient elected for a BKA. There has not been recurrence since the BKA after 5 years total follow-up from the time of primary tumor resection. Of note, this was the only patient in our cohort who was immunosuppressed and evaluated for regional nodal involvement by positron emission tomography.

Another patient with recurrence (patient 13) presented with a chronic great toe ulcer of 5 years’ duration that formed on the dorsal aspect of the great toe after a previously excised wart (Figure 4A). This patient underwent mid-proximal metatarsal amputation with 2-cm margins and subsequent skin graft. Pathologic margins were negative. Within 6 months, there was hyperkeratosis and a draining wound (Figure 4B). Biopsy results confirmed recurrent disease that was treated with re-resection, including complete metatarsal amputation with negative margins and skin graft placement. Verrucous carcinoma recurred at the edges of the graft within 8 months, and the patient elected for a BKA. In addition, this patient also presented with a verrucous carcinoma of the contralateral great toe. The tumor presented as a warty ulcer of 4 months’ duration in the setting of osteomyelitis and was resected by great toe amputation that was performed concurrently with the opposite leg BKA; there has been no recurrence. Of note, this was the only patient to have right inguinal sentinel lymph node tissue sampled and HPV testing conducted, which were negative for verrucous carcinoma and high or low strains of HPV.

Another recurrent case (patient 14) presented with a large warty lesion on the dorsal great toe positive for verrucous carcinoma. He underwent a complete great toe amputation with skin graft placement. Verrucous carcinoma recurred on the edges of the graft within 6 months, and the patient was lost to follow-up when a BKA was suggested.
The fourth recurrent case (patient 15) initially had been treated for 1 year as a viral verruca of the dorsal aspect of the great toe. He had an exophytic mass positive for verrucous carcinoma growing on the dorsal aspect of the great toe around the prior excision site. After primary wide excision with negative 1-cm margins and graft placement, the tumor was re-excised twice within the next 2 years with pathologic negative margins. The patient underwent a foot amputation due to a severe osteomyelitis infection at the reconstruction site.
The final recurrent case (patient 16) presented with a mass on the lateral great toe that initially was treated as a viral verruca (for unknown duration) that had begun to ulcerate. The patient underwent wide excision with 1-cm margins and graft placement. Final pathology was consistent with verrucous carcinoma with negative margins. Recurrence occurred within 11 months on the edge of the graft, and a great toe amputation through the metatarsal phalangeal joint was performed.
Comment
Our series of 19 cases of verrucous carcinoma adds to the limited number of reported cases in the literature. We sought to evaluate the potential risk factors for early recurrence. Consistent with prior studies, our series found verrucous carcinoma of the foot to occur most frequently in patients aged 50 to 70 years, predominantly in White men.1 These tumors grew in the setting of chronic inflammation, tissue regeneration, multiple comorbidities, and poor wound hygiene. Misdiagnosis of verrucous carcinoma often leads to ineffective treatments and local invasion of nerves, muscle, and bone tissue.9,15,16 Our case series also clearly demonstrated the diagnostic challenge verrucous carcinoma presents, with an average delay in diagnosis of 5 years; correct diagnosis often did not occur until the tumor was 4 cm in size (average) and more than 50% had chronic ulceration.
The histologic features of the tumors showed striking uniformity. Within the literature, there is confusion regarding the use of the terms verrucous carcinoma and carcinoma (epithelioma) cuniculatum and the possible pathologic differences between the two. The World Health Organization’s classification of skin tumors describes epithelioma cuniculatum as verrucous carcinoma located on the sole of the foot.7 Kubik and Rhatigan6 pointed out that carcinoma cuniculatum does not have a warty or verrucous surface, which is a defining feature of verrucous carcinoma. Multiple authors have further surmised that the deep burrowing sinus tracts of epithelioma cuniculatum are different than those seen in verrucous carcinoma formed by the undulations extending from the papillomatous and verrucous surface.1,6 We did not observe these notable pathologic differences in recurrent or nonrecurrent primary tumors or differences between primary and recurrent cases. Although our cohort was small, the findings suggest that standard histologic features do not predict aggressive behavior in verrucous carcinomas. Furthermore, our observations support a model wherein recurrence is an inherent property of certain verrucous carcinomas rather than a consequence of histologic progression to conventional squamous cell carcinoma. The lack of overt malignant features in such cases underscores the need for distinction of verrucous carcinoma from benign mimics such as viral verruca or reactive epidermal hyperplasia.
Our recurrent cases showed a greater predilection for nonplantar surfaces and the great toe (P=.002). Five of 6 cases on the nonplantar surface—1 on the ankle and 5 on the great toe—recurred despite negative pathologic margins. There was no significant difference in demographics, pathogenesis, tumor size, chronicity, phenotype, or metastatic spread in recurrent and nonrecurrent cases in our cohort.
The tumor has only been described in rare instances at extrapedal cutaneous sites including the hand, scalp, and abdomen.14,17,18 Our series did include a case of synchronous presentation with a verrucous carcinoma on the thumb. Given the rarity of this presentation, thus far there are no data supporting any atypical locations of verrucous carcinoma having greater instances of recurrence. Our recurrent cases displaying atypical location on nonglabrous skin could suggest an underlying pathologic mechanism distinct from tumors on glabrous skin and relevant to increased recurrence risk. Such a mechanism might relate to distinct genetic insults, tumor-microenvironment interactions, or field effects. There are few studies regarding physiologic differences between the plantar surface and the nonglabrous surface and how that influences cancer genesis. Within acral melanoma studies, nonglabrous skin of more sun-exposed surfaces has a higher burden of genetic insults including BRAF mutations.19 Genetic testing of verrucous carcinoma is highly limited, with abnormal expression of the p53 tumor suppressor protein and possible association with several types of HPV. Verrucous carcinoma in general has been found to contain HPV types 6 and 11, nononcogenic forms, and higher risk from HPV types 16 and 18.9,20 However, only a few cases of HPV type 16 as well as 1 case each of HPV type 2 and type 11 have been found within verrucous carcinoma of the foot.21,22 In squamous cell carcinoma of the head and neck, HPV-positive tumors have shown better response to treatment. Further investigation of HPV and genetic contributors in verrucous carcinoma is warranted.
There is notable evidence that surgical resection is the best mode of treatment of verrucous carcinoma.2,3,10,11 Our case series was treated with wide local excision, with partial metatarsal amputation or great toe amputation, in cases with bone invasion or osteomyelitis. Surgical margins were not reported in all the cases but ranged from 0.5 to 2 cm with no significant differences between the recurrent and nonrecurrent groups. After excision, closure was conducted by incorporating primary, secondary, and delayed closure techniques, along with skin grafts for larger defects. Lymph node biopsy traditionally has not been recommended due to reported low metastatic potential. In all 5 recurrent cases, the tumors recurred after multiple attempts at wide excision and greater resection of bone and tissue, with negative margins. The tumors regrew quickly, within months, on the edges of the new graft or in the middle of the graft. The sites of recurrent tumor growth would suggest regrowth in the areas of greatest tissue stress and proliferation. We recommend a low threshold for biopsy and aggressive retreatment in the setting of exophytic growth at reconstruction sites.
Recurrence is uncommon in the setting of verrucous carcinoma, with our series being the first to analyze prognostic factors.3,9,14 Our findings indicate that
- Kao GF, Graham JH, Helwig EB. Carcinoma cuniculatum (verrucous carcinoma of the skin): a clinicopathologic study of 46 cases with ultrastructural observations. Cancer. 1982;49:2395-2403.
- McKee PH, Wilkinson JD, Black M, et al. Carcinoma (epithelioma) cuniculatum: a clinic-pathologic study of nineteen cases and review of the literature. Histopathology. 1981;5:425-436.
- Penera KE, Manji KA, Craig AB, et al. Atypical presentation of verrucous carcinoma: a case study and review of the literature. Foot Ankle Spec. 2013;6:318-322.
- Rosales MA, Martin BR, Armstrong DG, et al. Verrucous hyperplasia: a common and problematic finding in the high-risk diabetic foot. J Am Podiatr Assoc. 2006:4:348-350.
- Noel JC, Peny MO, De Dobbeleer G, et al. p53 Protein overexpression in verrucous carcinoma of the skin. Dermatology. 1996;192:12-15.
- Kubik MJ, Rhatigan RM. Carcinoma cuniculatum: not a verrucous carcinoma. J Cutan Pathol. 2012;39:1083-1087
- Elder D, Massi D, Scolver R, et al. Verrucous squamous cell carcinoma. WHO Classification of Tumours (Medicine). Vol 11. 4th ed. International Agency for Research on Cancer: 2018;35-57.
- Chan MP. Verruciform and condyloma-like squamous proliferations in the anogenital region. Arch Pathol Lab Med. 2019;143:821-831
- Schwartz RA. Verrucous carcinoma of the skin and mucosa. J Am Acad Dermatol. 1995;32:1-21.
- Flynn K, Wiemer D. Treatment of an epithelioma cuniculatum plantare by local excision and a plantar skin flap. J Dermatol Surg Oncol. 1978;4:773-775.
- Spyriounis P, Tentis D, Sparveri I, et al. Plantar epithelioma cuniculatum: a case report with review of the literature. Eur J Plast Surg. 2004;27:253-256.
- Swanson NA, Taylor WB. Plantar verrucous carcinoma: literature review and treatment by the Moh’s chemosurgery technique. Arch Dermatol. 1980;116:794-797.
- Alkalay R, Alcalay J, Shiri J. Plantar verrucous carcinoma treated with Mohs micrographic surgery: a case report and literature review. J Drugs Dermatol. 2006:5:68-73.
- Kotwal M, Poflee S, Bobhate, S. Carcinoma cuniculatum at various anatomical sites. Indian J Dermatol. 2005;50:216-220.
- Nagarajan D, Chandrasekhar M, Jebakumar J, et al. Verrucous carcinoma of foot at an unusual site: lessons to be learnt. South Asian J Cancer. 2017;6:63.
- Pempinello C, Bova A, Pempinello R, et al Verrucous carcinoma of the foot with bone invasion: a case report. Case Rep Oncol Med. 2013;2013:135307.
- Vandeweyer E, Sales F, Deramaecker R. Cutaneous verrucous carcinoma. Br J Plastic Surg. 2001;54:168-170.
- Joybari A, Azadeh P, Honar B. Cutaneous verrucous carcinoma superimposed on chronically inflamed ileostomy site skin. Iran J Pathol. 2018;13:285-288.
- Davis EJ, Johnson DB, Sosman JA, et al. Melanoma: what do all the mutations mean? Cancer. 2018;124:3490-3499.
- Gissmann L, Wolnik L, Ikenberg H, et al. Human papillomavirus types 6 and 11 DNA sequences in genital and laryngeal papillomas and in some cervical cancers. Proc Natl Acad Sci U S A. 1983;80:560-563.
- Knobler RM, Schneider S, Neumann RA, et al. DNA dot-blot hybridization implicates human papillomavirus type 11-DNA in epithelioma cuniculatum. J Med Virol. 1989;29:33-37.
- Noel JC, Peny MO, Detremmerie O, et al. Demonstration of human papillomavirus type 2 in a verrucous carcinoma of the foot. Dermatology. 1993;187:58-61.
Verrucous carcinoma is a rare cancer with the greatest predilection for the foot. Multiple case reports with only a few large case series have been published. 1-3 Plantar verrucous carcinoma is characterized as a slowly but relentlessly enlarging warty tumor with low metastatic potential and high risk for local invasion. The tumor occurs most frequently in patients aged 60 to 70 years, predominantly in White males. 1 It often is misdiagnosed for years as an ulcer or wart that is highly resistant to therapy. Size typically ranges from 1 to 12 cm in greatest dimension. 1
The pathogenesis of plantar verrucous carcinoma remains unclear, but some contributing factors have been proposed, including trauma, chronic irritation, infection, and poor local hygiene.2 This tumor has been reported to occur in chronic foot ulcerations, particularly in the diabetic population.4 It has been proposed that abnormal expression of the p53 tumor suppressor protein and several types of human papillomavirus (HPV) may have a role in the pathogenesis of verrucous carcinoma.5
The pathologic hallmarks of this tumor include a verrucous/hyperkeratotic surface with a deeply endophytic, broad, pushing base. Tumor cells are well differentiated, and atypia is either absent or confined to 1 or 2 layers at the base of the tumor. Overt invasion at the base is lacking, except in cases with a component of conventional invasive squamous cell carcinoma. Human papillomavirus viropathic changes are classically absent.1,3 Studies of the histopathology of verrucous carcinoma have been complicated by similar entities, nomenclatural uncertainty, and variable diagnostic criteria. For example, epithelioma cuniculatum variously has been defined as being synonymous with verrucous carcinoma, a distinct clinical verrucous carcinoma subtype occurring on the soles, a histologic subtype (characterized by prominent burrowing sinuses), or a separate entity entirely.1,2,6,7 Furthermore, in the genital area, several different types of carcinomas have verruciform features but display distinct microscopic findings and outcomes from verrucous carcinoma.8
Verrucous carcinoma represents an unusual variant of squamous cell carcinoma and is treated as such. Treatments have included laser surgery; immunotherapy; retinoid therapy; and chemotherapy by oral, intralesional, or iontophoretic routes in select patients.9 Radiotherapy presents another option, though reports have described progression to aggressive squamous cell carcinoma in some cases.9 Surgery is the best course of treatment, and as more case reports have been published, a transition from radical resection to wide excision with tumor-free margins is the treatment of choice.2,3,10,11 To minimize soft-tissue deficits, Mohs micrographic surgery has been discussed as a treatment option for verrucous carcinoma.11-13
Few studies have described verrucous carcinoma recurrence, and none have systematically examined recurrence rate, risk factors, or prognosis
Methods
Patient cases were
Of the 19 cases, 16 were treated at the University of Michigan and are included in the treatment analyses. Specific attention was then paid to the cases with a clinical recurrence despite negative surgical margins. We compared the clinical and surgical differences between recurrent cases and nonrecurrent cases.
Pathology was rereviewed for selected cases, including 2 cases with recurrence and matched primary, 2 cases with recurrence (for which the matched primary was unavailable for review), and 5 representative primary cases that were not complicated by recurrence. Pathology review was conducted in a blinded manner by one of the authors (P.W.H) who is a board-certified dermatopathologist for approximate depth of invasion from the granular layer, perineural invasion, bone invasion, infiltrative growth, presence of conventional squamous cell carcinoma, and margin status.
Statistical analysis was performed when appropriate using an N1 χ2 test or Student t test.
Results
Demographics and Comorbidities—The median age of the patients at the time of diagnosis was 55 years (range, 34–77 years). There were 12 males and 7 females (Table 1). Two patients were Black and 17 were White. Almost all patients had additional comorbidities including tobacco use (68%), alcohol use (47%), and diabetes (47%). Only 1 patient had an autoimmune disease and was on chronic steroids. No significant difference was found between the demographics of patients with recurrent lesions and those without recurrence.
Tumor Location and Clinical Presentation—The most common clinical presentation included a nonhealing ulceration with warty edges, pain, bleeding, and lowered mobility. In most cases, there was history of prior treatment over a duration ranging from 1 to 8 years, with a median of 5 years prior to biopsy-based diagnosis (Table 1). Six patients had a history of osteomyelitis, diagnosed by imaging or biopsy, within a year before tumor diagnosis. The size of the primary tumor ranged from 2.4 to 6 cm, with a mean of 4 cm (P=.20). The clinical presentation, time before diagnosis, and size of the tumors did not differ significantly between recurrent and nonrecurrent cases.
The tumor location for the recurrent cases differed significantly compared to nonrecurrent cases. All 5 of the patients with a recurrence presented with a tumor on the nonglabrous part of the foot. Four patients (80%) had lesions on the dorsal or lateral aspect of the great toe (P=.002), and 1 patient (20%) had a lesion on the low ankle (P=.09)(Table 1). Of the nonrecurrent cases, 1 patient (7%) presented with a tumor on the plantar surface of the great toe (P=.002), 13 patients (93%) presented with tumors on the distal plantar surface of the foot (P=.0002), and 1 patient with a plantar foot tumor (Figure 1) also had verrucous carcinoma on the thumb (Table 1 and Figure 2).
Histopathology—Available pathology slides for recurrent cases of verrucous carcinoma were reviewed alongside representative cases of verrucous carcinomas that did not progress to recurrence. The diagnosis of verrucous carcinoma was confirmed in all cases, with no evidence of conventional squamous cell carcinoma, perineural invasion, extension beyond the dermis, or bone invasion in any case. The median size of the tumors was 4.2 cm and 4 cm for nonrecurrent and recurrent specimens, respectively. Recurrences displayed a trend toward increased depth compared to primary tumors without recurrence (average depth, 5.5 mm vs 3.7 mm); however, this did not reach statistical significance (P=.24). Primary tumors that progressed to recurrence (n=2) displayed similar findings to the other cases, with invasive depths of 3.5 and 5.5 mm, and there was no evidence of conventional squamous cell carcinoma, perineural invasion, or extension beyond the dermis.
Treatment of Nonrecurrent Cases—Of the 16 total cases treated at the University of Michigan, surgery was the primary mode of therapy in every case (Tables 2 and 3). Of the 11 nonrecurrent cases, 7 patients had wide local excision with a dermal regeneration template, and delayed split-thickness graft reconstruction. Three cases had wide local excision with metatarsal resection, dermal regeneration template, and delayed skin grafting. One case had a great toe amputation
Treatment of Recurrent Cases—For the 5 patients with recurrence, surgical margins were not reported in all the cases but ranged from 0.5 to 2 cm (4/5 [80%] reported). On average, follow-up for this group of patients was 29 months, with a range of 12 to 60 months (Table 3).
The first case with a recurrence (patient 12) initially presented with a chronic calluslike growth of the medial ankle. The lesion initially was treated with wide local excision with negative margins. Reconstruction was performed in a staged fashion with use of a dermal regenerative template followed later by split-thickness skin grafting. Tumor recurrence with negative margins occurred 3 times over the next 2 years despite re-resections with negative pathologic margins. Each recurrence presented as graft breakdown and surrounding hyperkeratosis (Figure 3). After the third graft placement failed, the patient elected for a BKA. There has not been recurrence since the BKA after 5 years total follow-up from the time of primary tumor resection. Of note, this was the only patient in our cohort who was immunosuppressed and evaluated for regional nodal involvement by positron emission tomography.
Another patient with recurrence (patient 13) presented with a chronic great toe ulcer of 5 years’ duration that formed on the dorsal aspect of the great toe after a previously excised wart (Figure 4A). This patient underwent mid-proximal metatarsal amputation with 2-cm margins and subsequent skin graft. Pathologic margins were negative. Within 6 months, there was hyperkeratosis and a draining wound (Figure 4B). Biopsy results confirmed recurrent disease that was treated with re-resection, including complete metatarsal amputation with negative margins and skin graft placement. Verrucous carcinoma recurred at the edges of the graft within 8 months, and the patient elected for a BKA. In addition, this patient also presented with a verrucous carcinoma of the contralateral great toe. The tumor presented as a warty ulcer of 4 months’ duration in the setting of osteomyelitis and was resected by great toe amputation that was performed concurrently with the opposite leg BKA; there has been no recurrence. Of note, this was the only patient to have right inguinal sentinel lymph node tissue sampled and HPV testing conducted, which were negative for verrucous carcinoma and high or low strains of HPV.
Another recurrent case (patient 14) presented with a large warty lesion on the dorsal great toe positive for verrucous carcinoma. He underwent a complete great toe amputation with skin graft placement. Verrucous carcinoma recurred on the edges of the graft within 6 months, and the patient was lost to follow-up when a BKA was suggested.
The fourth recurrent case (patient 15) initially had been treated for 1 year as a viral verruca of the dorsal aspect of the great toe. He had an exophytic mass positive for verrucous carcinoma growing on the dorsal aspect of the great toe around the prior excision site. After primary wide excision with negative 1-cm margins and graft placement, the tumor was re-excised twice within the next 2 years with pathologic negative margins. The patient underwent a foot amputation due to a severe osteomyelitis infection at the reconstruction site.
The final recurrent case (patient 16) presented with a mass on the lateral great toe that initially was treated as a viral verruca (for unknown duration) that had begun to ulcerate. The patient underwent wide excision with 1-cm margins and graft placement. Final pathology was consistent with verrucous carcinoma with negative margins. Recurrence occurred within 11 months on the edge of the graft, and a great toe amputation through the metatarsal phalangeal joint was performed.
Comment
Our series of 19 cases of verrucous carcinoma adds to the limited number of reported cases in the literature. We sought to evaluate the potential risk factors for early recurrence. Consistent with prior studies, our series found verrucous carcinoma of the foot to occur most frequently in patients aged 50 to 70 years, predominantly in White men.1 These tumors grew in the setting of chronic inflammation, tissue regeneration, multiple comorbidities, and poor wound hygiene. Misdiagnosis of verrucous carcinoma often leads to ineffective treatments and local invasion of nerves, muscle, and bone tissue.9,15,16 Our case series also clearly demonstrated the diagnostic challenge verrucous carcinoma presents, with an average delay in diagnosis of 5 years; correct diagnosis often did not occur until the tumor was 4 cm in size (average) and more than 50% had chronic ulceration.
The histologic features of the tumors showed striking uniformity. Within the literature, there is confusion regarding the use of the terms verrucous carcinoma and carcinoma (epithelioma) cuniculatum and the possible pathologic differences between the two. The World Health Organization’s classification of skin tumors describes epithelioma cuniculatum as verrucous carcinoma located on the sole of the foot.7 Kubik and Rhatigan6 pointed out that carcinoma cuniculatum does not have a warty or verrucous surface, which is a defining feature of verrucous carcinoma. Multiple authors have further surmised that the deep burrowing sinus tracts of epithelioma cuniculatum are different than those seen in verrucous carcinoma formed by the undulations extending from the papillomatous and verrucous surface.1,6 We did not observe these notable pathologic differences in recurrent or nonrecurrent primary tumors or differences between primary and recurrent cases. Although our cohort was small, the findings suggest that standard histologic features do not predict aggressive behavior in verrucous carcinomas. Furthermore, our observations support a model wherein recurrence is an inherent property of certain verrucous carcinomas rather than a consequence of histologic progression to conventional squamous cell carcinoma. The lack of overt malignant features in such cases underscores the need for distinction of verrucous carcinoma from benign mimics such as viral verruca or reactive epidermal hyperplasia.
Our recurrent cases showed a greater predilection for nonplantar surfaces and the great toe (P=.002). Five of 6 cases on the nonplantar surface—1 on the ankle and 5 on the great toe—recurred despite negative pathologic margins. There was no significant difference in demographics, pathogenesis, tumor size, chronicity, phenotype, or metastatic spread in recurrent and nonrecurrent cases in our cohort.
The tumor has only been described in rare instances at extrapedal cutaneous sites including the hand, scalp, and abdomen.14,17,18 Our series did include a case of synchronous presentation with a verrucous carcinoma on the thumb. Given the rarity of this presentation, thus far there are no data supporting any atypical locations of verrucous carcinoma having greater instances of recurrence. Our recurrent cases displaying atypical location on nonglabrous skin could suggest an underlying pathologic mechanism distinct from tumors on glabrous skin and relevant to increased recurrence risk. Such a mechanism might relate to distinct genetic insults, tumor-microenvironment interactions, or field effects. There are few studies regarding physiologic differences between the plantar surface and the nonglabrous surface and how that influences cancer genesis. Within acral melanoma studies, nonglabrous skin of more sun-exposed surfaces has a higher burden of genetic insults including BRAF mutations.19 Genetic testing of verrucous carcinoma is highly limited, with abnormal expression of the p53 tumor suppressor protein and possible association with several types of HPV. Verrucous carcinoma in general has been found to contain HPV types 6 and 11, nononcogenic forms, and higher risk from HPV types 16 and 18.9,20 However, only a few cases of HPV type 16 as well as 1 case each of HPV type 2 and type 11 have been found within verrucous carcinoma of the foot.21,22 In squamous cell carcinoma of the head and neck, HPV-positive tumors have shown better response to treatment. Further investigation of HPV and genetic contributors in verrucous carcinoma is warranted.
There is notable evidence that surgical resection is the best mode of treatment of verrucous carcinoma.2,3,10,11 Our case series was treated with wide local excision, with partial metatarsal amputation or great toe amputation, in cases with bone invasion or osteomyelitis. Surgical margins were not reported in all the cases but ranged from 0.5 to 2 cm with no significant differences between the recurrent and nonrecurrent groups. After excision, closure was conducted by incorporating primary, secondary, and delayed closure techniques, along with skin grafts for larger defects. Lymph node biopsy traditionally has not been recommended due to reported low metastatic potential. In all 5 recurrent cases, the tumors recurred after multiple attempts at wide excision and greater resection of bone and tissue, with negative margins. The tumors regrew quickly, within months, on the edges of the new graft or in the middle of the graft. The sites of recurrent tumor growth would suggest regrowth in the areas of greatest tissue stress and proliferation. We recommend a low threshold for biopsy and aggressive retreatment in the setting of exophytic growth at reconstruction sites.
Recurrence is uncommon in the setting of verrucous carcinoma, with our series being the first to analyze prognostic factors.3,9,14 Our findings indicate that
- Kao GF, Graham JH, Helwig EB. Carcinoma cuniculatum (verrucous carcinoma of the skin): a clinicopathologic study of 46 cases with ultrastructural observations. Cancer. 1982;49:2395-2403.
- McKee PH, Wilkinson JD, Black M, et al. Carcinoma (epithelioma) cuniculatum: a clinic-pathologic study of nineteen cases and review of the literature. Histopathology. 1981;5:425-436.
- Penera KE, Manji KA, Craig AB, et al. Atypical presentation of verrucous carcinoma: a case study and review of the literature. Foot Ankle Spec. 2013;6:318-322.
- Rosales MA, Martin BR, Armstrong DG, et al. Verrucous hyperplasia: a common and problematic finding in the high-risk diabetic foot. J Am Podiatr Assoc. 2006:4:348-350.
- Noel JC, Peny MO, De Dobbeleer G, et al. p53 Protein overexpression in verrucous carcinoma of the skin. Dermatology. 1996;192:12-15.
- Kubik MJ, Rhatigan RM. Carcinoma cuniculatum: not a verrucous carcinoma. J Cutan Pathol. 2012;39:1083-1087
- Elder D, Massi D, Scolver R, et al. Verrucous squamous cell carcinoma. WHO Classification of Tumours (Medicine). Vol 11. 4th ed. International Agency for Research on Cancer: 2018;35-57.
- Chan MP. Verruciform and condyloma-like squamous proliferations in the anogenital region. Arch Pathol Lab Med. 2019;143:821-831
- Schwartz RA. Verrucous carcinoma of the skin and mucosa. J Am Acad Dermatol. 1995;32:1-21.
- Flynn K, Wiemer D. Treatment of an epithelioma cuniculatum plantare by local excision and a plantar skin flap. J Dermatol Surg Oncol. 1978;4:773-775.
- Spyriounis P, Tentis D, Sparveri I, et al. Plantar epithelioma cuniculatum: a case report with review of the literature. Eur J Plast Surg. 2004;27:253-256.
- Swanson NA, Taylor WB. Plantar verrucous carcinoma: literature review and treatment by the Moh’s chemosurgery technique. Arch Dermatol. 1980;116:794-797.
- Alkalay R, Alcalay J, Shiri J. Plantar verrucous carcinoma treated with Mohs micrographic surgery: a case report and literature review. J Drugs Dermatol. 2006:5:68-73.
- Kotwal M, Poflee S, Bobhate, S. Carcinoma cuniculatum at various anatomical sites. Indian J Dermatol. 2005;50:216-220.
- Nagarajan D, Chandrasekhar M, Jebakumar J, et al. Verrucous carcinoma of foot at an unusual site: lessons to be learnt. South Asian J Cancer. 2017;6:63.
- Pempinello C, Bova A, Pempinello R, et al Verrucous carcinoma of the foot with bone invasion: a case report. Case Rep Oncol Med. 2013;2013:135307.
- Vandeweyer E, Sales F, Deramaecker R. Cutaneous verrucous carcinoma. Br J Plastic Surg. 2001;54:168-170.
- Joybari A, Azadeh P, Honar B. Cutaneous verrucous carcinoma superimposed on chronically inflamed ileostomy site skin. Iran J Pathol. 2018;13:285-288.
- Davis EJ, Johnson DB, Sosman JA, et al. Melanoma: what do all the mutations mean? Cancer. 2018;124:3490-3499.
- Gissmann L, Wolnik L, Ikenberg H, et al. Human papillomavirus types 6 and 11 DNA sequences in genital and laryngeal papillomas and in some cervical cancers. Proc Natl Acad Sci U S A. 1983;80:560-563.
- Knobler RM, Schneider S, Neumann RA, et al. DNA dot-blot hybridization implicates human papillomavirus type 11-DNA in epithelioma cuniculatum. J Med Virol. 1989;29:33-37.
- Noel JC, Peny MO, Detremmerie O, et al. Demonstration of human papillomavirus type 2 in a verrucous carcinoma of the foot. Dermatology. 1993;187:58-61.
Practice Points
- Clinicians should have a high suspicion for verrucous carcinoma in the setting of a chronic ulceration or warty lesion that is resistant to traditional treatment. Early biopsy with tissue collection of the raised ulcer borders and the deep dermis layer of warty lesions is imperative for diagnosis.
- Verrucous carcinoma originating on the nonglabrous surface of the foot may have a higher rate of recurrence often occurring within months of previous treatment. Patients presenting with nonhealing surgical sites in this area should be treated with a high level of suspicion for recurrence.

Inpatient Dermatology Consultations for Suspected Skin Cancer: A Retrospective Review
To the Editor:
Dermatologists sometimes are consulted in the inpatient setting to rule out possible skin cancer. This scenario provides an opportunity to facilitate the diagnosis and treatment of cutaneous malignancy, often in patients who might not have sought regular outpatient dermatology care. Few studies have described the outcomes of inpatient biopsies to identify skin cancer.1,2
Seeking to better understand the nature of these patient encounters, we reviewed all consultations at a medical center for which the referring physician suspected skin cancer rather than only those lesions that were biopsied by the dermatologist. We also collected data about subsequent treatment to better understand the outcomes of these patient encounters.
We conducted a retrospective review of inpatient dermatology referrals at an academic-affiliated tertiary medical center. We identified all patients who were provided with an inpatient dermatology consultation for suspected skin cancer or what was identified as a “skin lesion” between July 1, 2013, and July 1, 2019. We collected information on each patient’s sex, age at time of consultation, and race, as well as the specialty of the referring provider, lesion location, maximum diameter of the lesion, whether a biopsy was performed, where the biopsy was performed (inpatient or outpatient setting), clinical diagnosis, histopathologic diagnosis, and subsequent treatment.
The institutional review board at Eastern Virginia Medical School (Norfolk, Virginia) approved this study, and all protocol conformed to the ethical guidelines of the Declaration of Helsinki.
Thirty-eight patients met the inclusion criteria. Their characteristics are listed in the Table. Consultations for possible skin cancer accounted for 4% (38/950) of all inpatient dermatology consultations over the study period. Outcomes of the referrals are shown in the Figure. Consultations were received from 12 different physician specialties.
")
In the 38 patients, 47 lesions were identified; most (66% [31/47]) were on the head and neck. Twenty of 38 patients were found to have at least 1 biopsy-confirmed cutaneous malignancy (23 total tumors). Of those 23 identified malignancies, 10 were basal cell carcinoma, 11 squamous cell carcinoma, 1 malignant melanoma, and 1 anaplastic T-cell lymphoma. Of note, 17 of 23 (74%) identified cutaneous malignancies were 2.0 cm in diameter at biopsy or larger. Subsequently performed treatments for these patients included wide local excision (n=3), Mohs micrographic surgery (n=5), radiation therapy (n=3), topical fluorouracil (n=1), electrodesiccation and curettage (n=4), and chemotherapy or immunotherapy (n=2). Two patients who were diagnosed with skin cancer died of unrelated causes before treatment was completed.

In 10 of 38 patients, only nonmalignant entities were diagnosed, including seborrheic keratosis (n=6), benign melanocytic nevus (n=1), epidermal inclusion cyst (n=1), actinic keratosis (n=1), and radiation-induced necrosis (n=1). Of the 8 remaining patients, 4 were ultimately lost to follow-up before planned outpatient biopsy could be completed; 1 opted to follow up for biopsy at an unaffiliated outpatient dermatology provider. For 2 patients, the decision was made to forgo biopsy despite clinical suspicion of skin cancer because of overall poor health status, and 1 additional patient died before a planned outpatient biopsy could be performed.
In summary, approximately half of the inpatient dermatology consultations for suspected cutaneous malignancy resulted in a diagnosis of skin cancer. The patients in this population were admitted for a range of diagnoses, most unrelated to their cutaneous malignancy, suggesting that the inpatient setting offers the opportunity for physicians in a variety of specialties to help identify skin cancer that might otherwise be unaddressed and then facilitate management, whether ultimately in an inpatient or outpatient setting.
In many of these cases, it might be most appropriate to arrange subsequent outpatient dermatology follow-up after hospitalization, rather than making an inpatient consultation, as these situations usually are nonurgent and not directly related to hospitalization. However, in cases in which the lesion is directly related to admission, the lesion is advanced, there is concern for metastatic disease, or extenuating circumstances make outpatient follow-up difficult, inpatient dermatology consultation may be reasonable. There sometimes can be compelling reasons to expedite diagnosis and treatment as an inpatient.
In hospitalized, medically complex patients, in whom a new cutaneous malignancy is identified, dermatologists should discuss the situation thoughtfully with the patient, the patient’s family (when appropriate), and other physicians on the treatment team to determine the most appropriate course of action. In some cases, the most appropriate course might be to delay biopsy or treatment until the outpatient setting or to even defer further action completely when the prognosis is very limited. Consulting dermatologists must be mindful of patients’ overall medical situation in planning care for a cutaneous malignancy in these inpatient situations.
This study also highlights the surprising number of large-diameter, high-risk tumors identified in these scenarios. Limitations of this study include a relatively small sample size from a single facility that might not be representative of other practice settings and locations. Future multicenter studies could further explore the impact of inpatient dermatologic consultation on the diagnosis and management of skin cancer.
- Bauer J, Maroon M. Dermatology inpatient consultations: a retrospective study. J Am Acad Dermatol. 2010;62:518-519. doi:10.1016/j.jaad.2009.06.030
- Tsai S, Scott JF, Keller JJ, et al. Cutaneous malignancies identified in an inpatient dermatology consultation service. Br J Dermatol. 2017;177:E116-E118. doi:10.1111/bjd.15401
To the Editor:
Dermatologists sometimes are consulted in the inpatient setting to rule out possible skin cancer. This scenario provides an opportunity to facilitate the diagnosis and treatment of cutaneous malignancy, often in patients who might not have sought regular outpatient dermatology care. Few studies have described the outcomes of inpatient biopsies to identify skin cancer.1,2
Seeking to better understand the nature of these patient encounters, we reviewed all consultations at a medical center for which the referring physician suspected skin cancer rather than only those lesions that were biopsied by the dermatologist. We also collected data about subsequent treatment to better understand the outcomes of these patient encounters.
We conducted a retrospective review of inpatient dermatology referrals at an academic-affiliated tertiary medical center. We identified all patients who were provided with an inpatient dermatology consultation for suspected skin cancer or what was identified as a “skin lesion” between July 1, 2013, and July 1, 2019. We collected information on each patient’s sex, age at time of consultation, and race, as well as the specialty of the referring provider, lesion location, maximum diameter of the lesion, whether a biopsy was performed, where the biopsy was performed (inpatient or outpatient setting), clinical diagnosis, histopathologic diagnosis, and subsequent treatment.
The institutional review board at Eastern Virginia Medical School (Norfolk, Virginia) approved this study, and all protocol conformed to the ethical guidelines of the Declaration of Helsinki.
Thirty-eight patients met the inclusion criteria. Their characteristics are listed in the Table. Consultations for possible skin cancer accounted for 4% (38/950) of all inpatient dermatology consultations over the study period. Outcomes of the referrals are shown in the Figure. Consultations were received from 12 different physician specialties.
In the 38 patients, 47 lesions were identified; most (66% [31/47]) were on the head and neck. Twenty of 38 patients were found to have at least 1 biopsy-confirmed cutaneous malignancy (23 total tumors). Of those 23 identified malignancies, 10 were basal cell carcinoma, 11 squamous cell carcinoma, 1 malignant melanoma, and 1 anaplastic T-cell lymphoma. Of note, 17 of 23 (74%) identified cutaneous malignancies were 2.0 cm in diameter at biopsy or larger. Subsequently performed treatments for these patients included wide local excision (n=3), Mohs micrographic surgery (n=5), radiation therapy (n=3), topical fluorouracil (n=1), electrodesiccation and curettage (n=4), and chemotherapy or immunotherapy (n=2). Two patients who were diagnosed with skin cancer died of unrelated causes before treatment was completed.
In 10 of 38 patients, only nonmalignant entities were diagnosed, including seborrheic keratosis (n=6), benign melanocytic nevus (n=1), epidermal inclusion cyst (n=1), actinic keratosis (n=1), and radiation-induced necrosis (n=1). Of the 8 remaining patients, 4 were ultimately lost to follow-up before planned outpatient biopsy could be completed; 1 opted to follow up for biopsy at an unaffiliated outpatient dermatology provider. For 2 patients, the decision was made to forgo biopsy despite clinical suspicion of skin cancer because of overall poor health status, and 1 additional patient died before a planned outpatient biopsy could be performed.
In summary, approximately half of the inpatient dermatology consultations for suspected cutaneous malignancy resulted in a diagnosis of skin cancer. The patients in this population were admitted for a range of diagnoses, most unrelated to their cutaneous malignancy, suggesting that the inpatient setting offers the opportunity for physicians in a variety of specialties to help identify skin cancer that might otherwise be unaddressed and then facilitate management, whether ultimately in an inpatient or outpatient setting.
In many of these cases, it might be most appropriate to arrange subsequent outpatient dermatology follow-up after hospitalization, rather than making an inpatient consultation, as these situations usually are nonurgent and not directly related to hospitalization. However, in cases in which the lesion is directly related to admission, the lesion is advanced, there is concern for metastatic disease, or extenuating circumstances make outpatient follow-up difficult, inpatient dermatology consultation may be reasonable. There sometimes can be compelling reasons to expedite diagnosis and treatment as an inpatient.
In hospitalized, medically complex patients, in whom a new cutaneous malignancy is identified, dermatologists should discuss the situation thoughtfully with the patient, the patient’s family (when appropriate), and other physicians on the treatment team to determine the most appropriate course of action. In some cases, the most appropriate course might be to delay biopsy or treatment until the outpatient setting or to even defer further action completely when the prognosis is very limited. Consulting dermatologists must be mindful of patients’ overall medical situation in planning care for a cutaneous malignancy in these inpatient situations.
This study also highlights the surprising number of large-diameter, high-risk tumors identified in these scenarios. Limitations of this study include a relatively small sample size from a single facility that might not be representative of other practice settings and locations. Future multicenter studies could further explore the impact of inpatient dermatologic consultation on the diagnosis and management of skin cancer.
- Bauer J, Maroon M. Dermatology inpatient consultations: a retrospective study. J Am Acad Dermatol. 2010;62:518-519. doi:10.1016/j.jaad.2009.06.030
- Tsai S, Scott JF, Keller JJ, et al. Cutaneous malignancies identified in an inpatient dermatology consultation service. Br J Dermatol. 2017;177:E116-E118. doi:10.1111/bjd.15401
Practice Points
- Dermatologists who perform inpatient consultations should be prepared to be consulted for cutaneous malignancies.
- Relatively large skin tumors may be identified, often incidentally, in the inpatient population.
- Careful consideration should be involved when deciding how to diagnose and manage cutaneous malignancies identified in the inpatient setting, taking the overall medical and social context into account.
Acute STEMI During the COVID-19 Pandemic at a Regional Hospital: Incidence, Clinical Characteristics, and Outcomes
From the Department of Medicine, Medical College of Georgia at the Augusta University-University of Georgia Medical Partnership, Athens, GA (Syed H. Ali, Syed Hyder, and Dr. Murrow), and the Department of Cardiology, Piedmont Heart Institute, Piedmont Athens Regional, Athens, GA (Dr. Murrow and Mrs. Davis).
Abstract
Objectives: The aim of this study was to describe the characteristics and in-hospital outcomes of patients with acute ST-segment elevation myocardial infarction (STEMI) during the early COVID-19 pandemic at Piedmont Athens Regional (PAR), a 330-bed tertiary referral center in Northeast Georgia.
Methods: A retrospective study was conducted at PAR to evaluate patients with acute STEMI admitted over an 8-week period during the initial COVID-19 outbreak. This study group was compared to patients admitted during the corresponding period in 2019. The primary endpoint of this study was defined as a composite of sustained ventricular arrhythmia, congestive heart failure (CHF) with pulmonary congestion, and/or in-hospital mortality.
Results: This study cohort was composed of 64 patients with acute STEMI; 30 patients (46.9%) were hospitalized during the COVID-19 pandemic. Patients with STEMI in both the COVID-19 and control groups had similar comorbidities, Killip classification score, and clinical presentations. The median (interquartile range) time from symptom onset to reperfusion (total ischemic time) increased from 99.5 minutes (84.8-132) in 2019 to 149 minutes (96.3-231.8; P = .032) in 2020. Hospitalization during the COVID-19 period was associated with an increased risk for combined in-hospital outcome (odds ratio, 3.96; P = .046).
Conclusion: Patients with STEMI admitted during the first wave of the COVID-19 outbreak experienced longer total ischemic time and increased risk for combined in-hospital outcomes compared to patients admitted during the corresponding period in 2019.
Keywords: myocardial infarction, acute coronary syndrome, hospitalization, outcomes.

The emergence of the SARS-Cov-2 virus in December 2019 caused a worldwide shift in resource allocation and the restructuring of health care systems within the span of a few months. With the rapid spread of infection, the World Health Organization officially declared a pandemic in March 2020. The pandemic led to the deferral and cancellation of in-person patient visits, routine diagnostic studies, and nonessential surgeries and procedures. This response occurred secondary to a joint effort to reduce transmission via stay-at-home mandates and appropriate social distancing.1
Alongside the reduction in elective procedures and health care visits, significant reductions in hospitalization rates due to decreases in acute ST-segment elevation myocardial infarction (STEMI) and catheterization laboratory utilization have been reported in many studies from around the world.2-7 Comprehensive data demonstrating the impact of the COVID-19 pandemic on acute STEMI patient characteristics, clinical presentation, and in-hospital outcomes are lacking. Although patients with previously diagnosed cardiovascular disease are more likely to encounter worse outcomes in the setting of COVID-19, there may also be an indirect impact of the pandemic on high-risk patients, including those without the infection.8 Several theories have been hypothesized to explain this phenomenon. One theory postulates that the fear of contracting the virus during hospitalization is great enough to prevent patients from seeking care.2 Another theory suggests that the increased utilization of telemedicine prevents exacerbation of chronic conditions and the need for hospitalization.9 Contrary to this trend, previous studies have shown an increased incidence of acute STEMI following stressful events such as natural disasters.10
The aim of this study was to describe trends pertaining to clinical characteristics and in-hospital outcomes of patients with acute STEMI during the early COVID-19 pandemic at Piedmont Athens Regional (PAR), a 330-bed tertiary referral center in Northeast Georgia.
Methods
A retrospective cohort study was conducted at PAR to evaluate patients with STEMI admitted to the cardiovascular intensive care unit over an 8-week period (March 5 to May 5, 2020) during the COVID-19 outbreak. COVID-19 was declared a national emergency on March 13, 2020, in the United States. The institutional review board at PAR approved the study; the need for individual consent was waived under the condition that participant data would undergo de-identification and be strictly safeguarded.
Data Collection
Because there are seasonal variations in cardiovascular admissions, patient data from a control period (March 9 to May 9, 2019) were obtained to compare with data from the 2020 period. The number of patients with the diagnosis of acute STEMI during the COVID-19 period was recorded. Demographic data, clinical characteristics, and primary angiographic findings were gathered for all patients. Time from symptom onset to hospital admission and time from hospital admission to reperfusion (defined as door-to-balloon time) were documented for each patient. Killip classification was used to assess patients’ clinical status on admission. Length of stay was determined as days from hospital admission to discharge or death (if occurring during the same hospitalization).
Adverse in-hospital complications were also recorded. These were selected based on inclusion of the following categories of acute STEMI complications: ischemic, mechanical, arrhythmic, embolic, and inflammatory. The following complications occurred in our patient cohort: sustained ventricular arrhythmia, congestive heart failure (CHF) defined as congestion requiring intravenous diuretics, re-infarction, mechanical complications (free-wall rupture, ventricular septal defect, or mitral regurgitation), second- or third-degree atrioventricular block, atrial fibrillation, stroke, mechanical ventilation, major bleeding, pericarditis, cardiogenic shock, cardiac arrest, and in-hospital mortality. The primary outcome of this study was defined as a composite of sustained ventricular arrhythmia, CHF with congestion requiring intravenous diuretics, and/or in-hospital mortality. Ventricular arrythmia and CHF were included in the composite outcome because they are defined as the 2 most common causes of sudden cardiac death following acute STEMI.11,12
Statistical Analysis
Normally distributed continuous variables and categorical variables were compared using the paired t-test. A 2-sided P value <.05 was considered to be statistically significant. Mean admission rates for acute STEMI hospitalizations were determined by dividing the number of admissions by the number of days in each time period. The daily rate of COVID-19 cases per 100,000 individuals was obtained from the Centers for Disease Control and Prevention COVID-19 database. All data analyses were performed using Microsoft Excel.
Results
The study cohort consisted of 64 patients, of whom 30 (46.9%) were hospitalized between March 5 and May 5, 2020, and 34 (53.1%) who were admitted during the analogous time period in 2019. This reflected a 6% decrease in STEMI admissions at PAR in the COVID-19 cohort.
Acute STEMI Hospitalization Rates and COVID-19 Incidence
The mean daily acute STEMI admission rate was 0.50 during the study period compared to 0.57 during the control period. During the study period in 2020 in the state of Georgia, the daily rate of newly confirmed COVID-19 cases ranged from 0.194 per 100,000 on March 5 to 8.778 per 100,000 on May 5. Results of COVID-19 testing were available for 9 STEMI patients, and of these 0 tests were positive.
Baseline Characteristics
Baseline characteristics of the acute STEMI cohorts are presented in Table 1. Approximately 75% were male; median (interquartile range [IQR]) age was 60 (51-72) years. There were no significant differences in age and gender between the study periods. Three-quarters of patients had a history of hypertension, and 87.5% had a history of dyslipidemia. There was no significant difference in baseline comorbidity profiles between the 2 study periods; therefore, our sample populations shared similar characteristics.
Clinical Presentation
Significant differences were observed regarding the time intervals of STEMI patients in the COVID-19 period and the control period (Table 2). Median time from symptom onset to hospital admission (patient delay) was extended from 57.5 minutes (IQR, 40.3-106) in 2019 to 93 minutes (IQR, 48.8-132) in 2020; however, this difference was not statistically significant (P = .697). Median time from hospital admission to reperfusion (system delay) was prolonged from 45 minutes (IQR, 28-61) in 2019 to 78 minutes (IQR, 50-110) in 2020 (P < .001). Overall time from symptom onset to reperfusion (total ischemic time) increased from 99.5 minutes (IQR, 84.8-132) in 2019 to 149 minutes (IQR, 96.3-231.8) in 2020 (P = .032).
Regarding mode of transportation, 23.5% of patients in 2019 were walk-in admissions to the emergency department. During the COVID-19 period, walk-in admissions decreased to 6.7% (P = .065). There were no significant differences between emergency medical service, transfer, or in-patient admissions for STEMI cases between the 2 study periods.
Killip classification scores were calculated for all patients on admission; 90.6% of patients were classified as Killip Class 1. There was no significant difference between hemodynamic presentations during the COVID-19 period compared to the control period.
Angiographic Data
Overall, 53 (82.8%) patients admitted with acute STEMI underwent coronary angiography during their hospital stay. The proportion of patients who underwent primary reperfusion was greater in the control period than in the COVID-19 period (85.3% vs 80%; P = .582). Angiographic characteristics and findings were similar between the 2 study groups (Table 2).
In-Hospital Outcomes
In-hospital outcome data were available for all patients. As shown in Table 3, hospitalization during the COVID-19 period was independently associated with an increased risk for combined in-hospital outcome (odds ratio, 3.96; P = .046). The rate of in-hospital mortality was greater in the COVID-19 period (P = .013). We found no significant difference when comparing secondary outcomes from admissions during the COVID-19 period and the control period in 2019. For the 5 patients who died during the study period, the primary diagnosis at death was acute STEMI complicated by CHF (3 patients) or cardiogenic shock (2 patients).
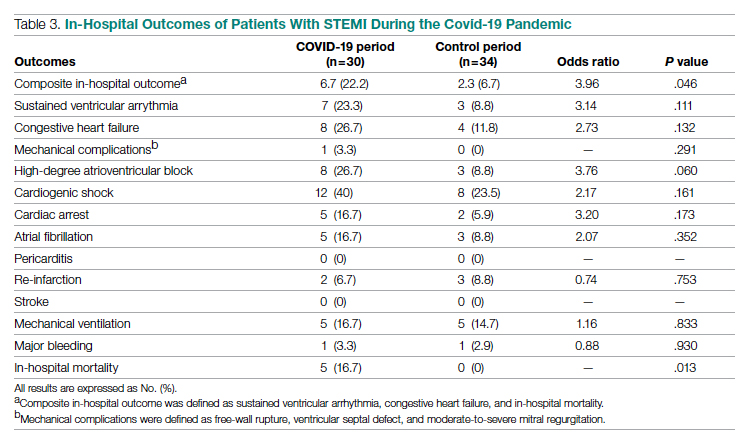
Discussion
This single-center retrospective study at PAR looks at the impact of COVID-19 on hospitalizations for acute STEMI during the initial peak of the pandemic. The key findings of this study show a significant increase in ischemic time parameters (symptom onset to reperfusion, hospital admission to reperfusion), in-hospital mortality, and combined in-hospital outcomes.
There was a 49.5-minute increase in total ischemic time noted in this study (P = .032). Though there was a numerical increase in time of symptom onset to hospital admission by 23.5 minutes, this difference was not statistically significant (P = .697). However, this study observed a statistically significant 33-minute increase in ischemic time from hospital admission to reperfusion (P < .001). Multiple studies globally have found a similar increase in total ischemic times, including those conducted in China and Europe.13-15 Every level of potential delay must be considered, including pre-hospital, triage and emergency department, and/or reperfusion team. Pre-hospital sources of delays that have been suggested include “stay-at-home” orders and apprehension to seek medical care due to concern about contracting the virus or overwhelming the health care facilities. There was a clinically significant 4-fold decrease in the number of walk-in acute STEMI cases in the study period. In 2019, there were 8 walk-in cases compared to 2 cases in 2020 (P = .065). However, this change was not statistically significant. In-hospital/systemic sources of delays have been mentioned in other studies; they include increased time taken to rule out COVID-19 (nasopharyngeal swab/chest x-ray) and increased time due to the need for intensive gowning and gloving procedures by staff. It was difficult to objectively determine the sources of system delay by the reperfusion team due to a lack of quantitative data.
In the current study, we found a significant increase in in-hospital mortality during the COVID-19 period compared to a parallel time frame in 2019. This finding is contrary to a multicenter study from Spain that reported no difference in in-hospital outcomes or mortality rates among all acute coronary syndrome cases.16 The worsening outcomes and prognosis may simply be a result of increased ischemic time; however, the virus that causes COVID-19 itself may play a role as well. Studies have found that SARS-Cov-2 infection places patients at greater risk for cardiovascular conditions such as hypercoagulability, myocarditis, and arrhythmias.17 In our study, however, there were no acute STEMI patients who tested positive for COVID-19. Therefore, we cannot discuss the impact of increased thrombus burden in patients with COVID-19. Piedmont Healthcare published a STEMI treatment protocol in May 2020 that advised increased use of tissue plasminogen activator (tPA) in COVID-19-positive cases; during the study period, however, there were no occasions when tPA use was deemed appropriate based on clinical judgment.
Our findings align with previous studies that describe an increase in combined in-hospital adverse outcomes during the COVID-19 era. Previous studies detected a higher rate of complications in the COVID-19 cohort, but in the current study, the adverse in-hospital course is unrelated to underlying infection.18,19 This study reports a higher incidence of major in-hospital outcomes, including a 65% increase in the rate of combined in-hospital outcomes, which is similar to a multicenter study conducted in Israel.19 There was a 2.3-fold numerical increase in sustained ventricular arrhythmias and a 2.5-fold numerical increase in the incidence of cardiac arrest in the study period. This phenomenon was observed despite a similar rate of reperfusion procedures in both groups.
Acute STEMI is a highly fatal condition with an incidence of 8.5 in 10,000 annually in the United States. While studies across the world have shown a 25% to 40% reduction in the rate of hospitalized acute coronary syndrome cases during the COVID-19 pandemic, the decrease from 34 to 30 STEMI admissions at PAR is not statistically significant.20 Possible reasons for the reduction globally include increased out-of-hospital mortality and decreased incidence of acute STEMI across the general population as a result of improved access to telemedicine or decreased levels of life stressors.20
In summary, there was an increase in ischemic time to reperfusion, in-hospital mortality, and combined in-hospital outcomes for acute STEMI patients at PAR during the COVID period.
Limitations
This study has several limitations. This is a single-center study, so the sample size is small and may not be generalizable to a larger population. This is a retrospective observational study, so causation cannot be inferred. This study analyzed ischemic time parameters as average rates over time rather than in an interrupted time series. Post-reperfusion outcomes were limited to hospital stay. Post-hospital follow-up would provide a better picture of the effects of STEMI intervention. There is no account of patients who died out-of-hospital secondary to acute STEMI. COVID-19 testing was not introduced until midway in our study period. Therefore, we cannot rule out the possibility of the SARS-Cov-2 virus inciting acute STEMI and subsequently leading to worse outcomes and poor prognosis.
Conclusions
This study provides an analysis of the incidence, characteristics, and clinical outcomes of patients presenting with acute STEMI during the early period of the COVID-19 pandemic. In-hospital mortality and ischemic time to reperfusion increased while combined in-hospital outcomes worsened.
Acknowledgment: The authors thank Piedmont Athens Regional IRB for approving this project and allowing access to patient data.
Corresponding author: Syed H. Ali; Department of Medicine, Medical College of Georgia at the Augusta University-University of Georgia Medical Partnership, 30606, Athens, GA; syedha.ali@gmail.com
Disclosures: None reported.
doi:10.12788/jcom.0085
1. Bhatt AS, Moscone A, McElrath EE, et al. Fewer hospitalizations for acute cardiovascular conditions during the COVID-19 pandemic. J Am Coll Cardiol. 2020;76(3):280-288. doi:10.1016/j.jacc.2020.05.038
2. Metzler B, Siostrzonek P, Binder RK, Bauer A, Reinstadler SJR. Decline of acute coronary syndrome admissions in Austria since the outbreak of Covid-19: the pandemic response causes cardiac collateral damage. Eur Heart J. 2020;41:1852-1853. doi:10.1093/eurheartj/ehaa314
3. De Rosa S, Spaccarotella C, Basso C, et al. Reduction of hospitalizations for myocardial infarction in Italy in the Covid-19 era. Eur Heart J. 2020;41(22):2083-2088.
4. Wilson SJ, Connolly MJ, Elghamry Z, et al. Effect of the COVID-19 pandemic on ST-segment-elevation myocardial infarction presentations and in-hospital outcomes. Circ Cardiovasc Interv. 2020; 13(7):e009438. doi:10.1161/CIRCINTERVENTIONS.120.009438
5. Mafham MM, Spata E, Goldacre R, et al. Covid-19 pandemic and admission rates for and management of acute coronary syndromes in England. Lancet. 2020;396 (10248):381-389. doi:10.1016/S0140-6736(20)31356-8
6. Bhatt AS, Moscone A, McElrath EE, et al. Fewer Hospitalizations for acute cardiovascular conditions during the COVID-19 pandemic. J Am Coll Cardiol. 2020;76(3):280-288. doi:10.1016/j.jacc.2020.05.038
7. Tam CF, Cheung KS, Lam S, et al. Impact of Coronavirus disease 2019 (Covid-19) outbreak on ST-segment elevation myocardial infarction care in Hong Kong, China. Circ Cardiovasc Qual Outcomes. 2020;13(4):e006631. doi:10.1161/CIRCOUTCOMES.120.006631
8. Clerkin KJ, Fried JA, Raikhelkar J, et al. Coronavirus disease 2019 (COVID-19) and cardiovascular disease. Circulation. 2020;141:1648-1655. doi:10.1161/CIRCULATIONAHA.120.046941
9. Ebinger JE, Shah PK. Declining admissions for acute cardiovascular illness: The Covid-19 paradox. J Am Coll Cardiol. 2020;76(3):289-291. doi:10.1016/j.jacc.2020.05.039
10 Leor J, Poole WK, Kloner RA. Sudden cardiac death triggered by an earthquake. N Engl J Med. 1996;334(7):413-419. doi:10.1056/NEJM199602153340701
11. Hiramori K. Major causes of death from acute myocardial infarction in a coronary care unit. Jpn Circ J. 1987;51(9):1041-1047. doi:10.1253/jcj.51.1041
12. Bui AH, Waks JW. Risk stratification of sudden cardiac death after acute myocardial infarction. J Innov Card Rhythm Manag. 2018;9(2):3035-3049. doi:10.19102/icrm.2018.090201
13. Xiang D, Xiang X, Zhang W, et al. Management and outcomes of patients with STEMI during the COVID-19 pandemic in China. J Am Coll Cardiol. 2020;76(11):1318-1324. doi:10.1016/j.jacc.2020.06.039
14. Hakim R, Motreff P, Rangé G. COVID-19 and STEMI. [Article in French]. Ann Cardiol Angeiol (Paris). 2020;69(6):355-359. doi:10.1016/j.ancard.2020.09.034
15. Soylu K, Coksevim M, Yanık A, Bugra Cerik I, Aksan G. Effect of Covid-19 pandemic process on STEMI patients timeline. Int J Clin Pract. 2021;75(5):e14005. doi:10.1111/ijcp.14005
16. Salinas P, Travieso A, Vergara-Uzcategui C, et al. Clinical profile and 30-day mortality of invasively managed patients with suspected acute coronary syndrome during the COVID-19 outbreak. Int Heart J. 2021;62(2):274-281. doi:10.1536/ihj.20-574
17. Hu Y, Sun J, Dai Z, et al. Prevalence and severity of corona virus disease 2019 (Covid-19): a systematic review and meta-analysis. J Clin Virol. 2020;127:104371. doi:10.1016/j.jcv.2020.104371
18. Rodriguez-Leor O, Cid Alvarez AB, Perez de Prado A, et al. In-hospital outcomes of COVID-19 ST-elevation myocardial infarction patients. EuroIntervention. 2021;16(17):1426-1433. doi:10.4244/EIJ-D-20-00935
19. Fardman A, Zahger D, Orvin K, et al. Acute myocardial infarction in the Covid-19 era: incidence, clinical characteristics and in-hospital outcomes—A multicenter registry. PLoS ONE. 2021;16(6): e0253524. doi:10.1371/journal.pone.0253524
20. Pessoa-Amorim G, Camm CF, Gajendragadkar P, et al. Admission of patients with STEMI since the outbreak of the COVID-19 pandemic: a survey by the European Society of Cardiology. Eur Heart J Qual Care Clin Outcomes. 2020;6(3):210-216. doi:10.1093/ehjqcco/qcaa046
From the Department of Medicine, Medical College of Georgia at the Augusta University-University of Georgia Medical Partnership, Athens, GA (Syed H. Ali, Syed Hyder, and Dr. Murrow), and the Department of Cardiology, Piedmont Heart Institute, Piedmont Athens Regional, Athens, GA (Dr. Murrow and Mrs. Davis).
Abstract
Objectives: The aim of this study was to describe the characteristics and in-hospital outcomes of patients with acute ST-segment elevation myocardial infarction (STEMI) during the early COVID-19 pandemic at Piedmont Athens Regional (PAR), a 330-bed tertiary referral center in Northeast Georgia.
Methods: A retrospective study was conducted at PAR to evaluate patients with acute STEMI admitted over an 8-week period during the initial COVID-19 outbreak. This study group was compared to patients admitted during the corresponding period in 2019. The primary endpoint of this study was defined as a composite of sustained ventricular arrhythmia, congestive heart failure (CHF) with pulmonary congestion, and/or in-hospital mortality.
Results: This study cohort was composed of 64 patients with acute STEMI; 30 patients (46.9%) were hospitalized during the COVID-19 pandemic. Patients with STEMI in both the COVID-19 and control groups had similar comorbidities, Killip classification score, and clinical presentations. The median (interquartile range) time from symptom onset to reperfusion (total ischemic time) increased from 99.5 minutes (84.8-132) in 2019 to 149 minutes (96.3-231.8; P = .032) in 2020. Hospitalization during the COVID-19 period was associated with an increased risk for combined in-hospital outcome (odds ratio, 3.96; P = .046).
Conclusion: Patients with STEMI admitted during the first wave of the COVID-19 outbreak experienced longer total ischemic time and increased risk for combined in-hospital outcomes compared to patients admitted during the corresponding period in 2019.
Keywords: myocardial infarction, acute coronary syndrome, hospitalization, outcomes.
The emergence of the SARS-Cov-2 virus in December 2019 caused a worldwide shift in resource allocation and the restructuring of health care systems within the span of a few months. With the rapid spread of infection, the World Health Organization officially declared a pandemic in March 2020. The pandemic led to the deferral and cancellation of in-person patient visits, routine diagnostic studies, and nonessential surgeries and procedures. This response occurred secondary to a joint effort to reduce transmission via stay-at-home mandates and appropriate social distancing.1
Alongside the reduction in elective procedures and health care visits, significant reductions in hospitalization rates due to decreases in acute ST-segment elevation myocardial infarction (STEMI) and catheterization laboratory utilization have been reported in many studies from around the world.2-7 Comprehensive data demonstrating the impact of the COVID-19 pandemic on acute STEMI patient characteristics, clinical presentation, and in-hospital outcomes are lacking. Although patients with previously diagnosed cardiovascular disease are more likely to encounter worse outcomes in the setting of COVID-19, there may also be an indirect impact of the pandemic on high-risk patients, including those without the infection.8 Several theories have been hypothesized to explain this phenomenon. One theory postulates that the fear of contracting the virus during hospitalization is great enough to prevent patients from seeking care.2 Another theory suggests that the increased utilization of telemedicine prevents exacerbation of chronic conditions and the need for hospitalization.9 Contrary to this trend, previous studies have shown an increased incidence of acute STEMI following stressful events such as natural disasters.10
The aim of this study was to describe trends pertaining to clinical characteristics and in-hospital outcomes of patients with acute STEMI during the early COVID-19 pandemic at Piedmont Athens Regional (PAR), a 330-bed tertiary referral center in Northeast Georgia.
Methods
A retrospective cohort study was conducted at PAR to evaluate patients with STEMI admitted to the cardiovascular intensive care unit over an 8-week period (March 5 to May 5, 2020) during the COVID-19 outbreak. COVID-19 was declared a national emergency on March 13, 2020, in the United States. The institutional review board at PAR approved the study; the need for individual consent was waived under the condition that participant data would undergo de-identification and be strictly safeguarded.
Data Collection
Because there are seasonal variations in cardiovascular admissions, patient data from a control period (March 9 to May 9, 2019) were obtained to compare with data from the 2020 period. The number of patients with the diagnosis of acute STEMI during the COVID-19 period was recorded. Demographic data, clinical characteristics, and primary angiographic findings were gathered for all patients. Time from symptom onset to hospital admission and time from hospital admission to reperfusion (defined as door-to-balloon time) were documented for each patient. Killip classification was used to assess patients’ clinical status on admission. Length of stay was determined as days from hospital admission to discharge or death (if occurring during the same hospitalization).
Adverse in-hospital complications were also recorded. These were selected based on inclusion of the following categories of acute STEMI complications: ischemic, mechanical, arrhythmic, embolic, and inflammatory. The following complications occurred in our patient cohort: sustained ventricular arrhythmia, congestive heart failure (CHF) defined as congestion requiring intravenous diuretics, re-infarction, mechanical complications (free-wall rupture, ventricular septal defect, or mitral regurgitation), second- or third-degree atrioventricular block, atrial fibrillation, stroke, mechanical ventilation, major bleeding, pericarditis, cardiogenic shock, cardiac arrest, and in-hospital mortality. The primary outcome of this study was defined as a composite of sustained ventricular arrhythmia, CHF with congestion requiring intravenous diuretics, and/or in-hospital mortality. Ventricular arrythmia and CHF were included in the composite outcome because they are defined as the 2 most common causes of sudden cardiac death following acute STEMI.11,12
Statistical Analysis
Normally distributed continuous variables and categorical variables were compared using the paired t-test. A 2-sided P value <.05 was considered to be statistically significant. Mean admission rates for acute STEMI hospitalizations were determined by dividing the number of admissions by the number of days in each time period. The daily rate of COVID-19 cases per 100,000 individuals was obtained from the Centers for Disease Control and Prevention COVID-19 database. All data analyses were performed using Microsoft Excel.
Results
The study cohort consisted of 64 patients, of whom 30 (46.9%) were hospitalized between March 5 and May 5, 2020, and 34 (53.1%) who were admitted during the analogous time period in 2019. This reflected a 6% decrease in STEMI admissions at PAR in the COVID-19 cohort.
Acute STEMI Hospitalization Rates and COVID-19 Incidence
The mean daily acute STEMI admission rate was 0.50 during the study period compared to 0.57 during the control period. During the study period in 2020 in the state of Georgia, the daily rate of newly confirmed COVID-19 cases ranged from 0.194 per 100,000 on March 5 to 8.778 per 100,000 on May 5. Results of COVID-19 testing were available for 9 STEMI patients, and of these 0 tests were positive.
Baseline Characteristics
Baseline characteristics of the acute STEMI cohorts are presented in Table 1. Approximately 75% were male; median (interquartile range [IQR]) age was 60 (51-72) years. There were no significant differences in age and gender between the study periods. Three-quarters of patients had a history of hypertension, and 87.5% had a history of dyslipidemia. There was no significant difference in baseline comorbidity profiles between the 2 study periods; therefore, our sample populations shared similar characteristics.
Clinical Presentation
Significant differences were observed regarding the time intervals of STEMI patients in the COVID-19 period and the control period (Table 2). Median time from symptom onset to hospital admission (patient delay) was extended from 57.5 minutes (IQR, 40.3-106) in 2019 to 93 minutes (IQR, 48.8-132) in 2020; however, this difference was not statistically significant (P = .697). Median time from hospital admission to reperfusion (system delay) was prolonged from 45 minutes (IQR, 28-61) in 2019 to 78 minutes (IQR, 50-110) in 2020 (P < .001). Overall time from symptom onset to reperfusion (total ischemic time) increased from 99.5 minutes (IQR, 84.8-132) in 2019 to 149 minutes (IQR, 96.3-231.8) in 2020 (P = .032).
Regarding mode of transportation, 23.5% of patients in 2019 were walk-in admissions to the emergency department. During the COVID-19 period, walk-in admissions decreased to 6.7% (P = .065). There were no significant differences between emergency medical service, transfer, or in-patient admissions for STEMI cases between the 2 study periods.
Killip classification scores were calculated for all patients on admission; 90.6% of patients were classified as Killip Class 1. There was no significant difference between hemodynamic presentations during the COVID-19 period compared to the control period.
Angiographic Data
Overall, 53 (82.8%) patients admitted with acute STEMI underwent coronary angiography during their hospital stay. The proportion of patients who underwent primary reperfusion was greater in the control period than in the COVID-19 period (85.3% vs 80%; P = .582). Angiographic characteristics and findings were similar between the 2 study groups (Table 2).
In-Hospital Outcomes
In-hospital outcome data were available for all patients. As shown in Table 3, hospitalization during the COVID-19 period was independently associated with an increased risk for combined in-hospital outcome (odds ratio, 3.96; P = .046). The rate of in-hospital mortality was greater in the COVID-19 period (P = .013). We found no significant difference when comparing secondary outcomes from admissions during the COVID-19 period and the control period in 2019. For the 5 patients who died during the study period, the primary diagnosis at death was acute STEMI complicated by CHF (3 patients) or cardiogenic shock (2 patients).
Discussion
This single-center retrospective study at PAR looks at the impact of COVID-19 on hospitalizations for acute STEMI during the initial peak of the pandemic. The key findings of this study show a significant increase in ischemic time parameters (symptom onset to reperfusion, hospital admission to reperfusion), in-hospital mortality, and combined in-hospital outcomes.
There was a 49.5-minute increase in total ischemic time noted in this study (P = .032). Though there was a numerical increase in time of symptom onset to hospital admission by 23.5 minutes, this difference was not statistically significant (P = .697). However, this study observed a statistically significant 33-minute increase in ischemic time from hospital admission to reperfusion (P < .001). Multiple studies globally have found a similar increase in total ischemic times, including those conducted in China and Europe.13-15 Every level of potential delay must be considered, including pre-hospital, triage and emergency department, and/or reperfusion team. Pre-hospital sources of delays that have been suggested include “stay-at-home” orders and apprehension to seek medical care due to concern about contracting the virus or overwhelming the health care facilities. There was a clinically significant 4-fold decrease in the number of walk-in acute STEMI cases in the study period. In 2019, there were 8 walk-in cases compared to 2 cases in 2020 (P = .065). However, this change was not statistically significant. In-hospital/systemic sources of delays have been mentioned in other studies; they include increased time taken to rule out COVID-19 (nasopharyngeal swab/chest x-ray) and increased time due to the need for intensive gowning and gloving procedures by staff. It was difficult to objectively determine the sources of system delay by the reperfusion team due to a lack of quantitative data.
In the current study, we found a significant increase in in-hospital mortality during the COVID-19 period compared to a parallel time frame in 2019. This finding is contrary to a multicenter study from Spain that reported no difference in in-hospital outcomes or mortality rates among all acute coronary syndrome cases.16 The worsening outcomes and prognosis may simply be a result of increased ischemic time; however, the virus that causes COVID-19 itself may play a role as well. Studies have found that SARS-Cov-2 infection places patients at greater risk for cardiovascular conditions such as hypercoagulability, myocarditis, and arrhythmias.17 In our study, however, there were no acute STEMI patients who tested positive for COVID-19. Therefore, we cannot discuss the impact of increased thrombus burden in patients with COVID-19. Piedmont Healthcare published a STEMI treatment protocol in May 2020 that advised increased use of tissue plasminogen activator (tPA) in COVID-19-positive cases; during the study period, however, there were no occasions when tPA use was deemed appropriate based on clinical judgment.
Our findings align with previous studies that describe an increase in combined in-hospital adverse outcomes during the COVID-19 era. Previous studies detected a higher rate of complications in the COVID-19 cohort, but in the current study, the adverse in-hospital course is unrelated to underlying infection.18,19 This study reports a higher incidence of major in-hospital outcomes, including a 65% increase in the rate of combined in-hospital outcomes, which is similar to a multicenter study conducted in Israel.19 There was a 2.3-fold numerical increase in sustained ventricular arrhythmias and a 2.5-fold numerical increase in the incidence of cardiac arrest in the study period. This phenomenon was observed despite a similar rate of reperfusion procedures in both groups.
Acute STEMI is a highly fatal condition with an incidence of 8.5 in 10,000 annually in the United States. While studies across the world have shown a 25% to 40% reduction in the rate of hospitalized acute coronary syndrome cases during the COVID-19 pandemic, the decrease from 34 to 30 STEMI admissions at PAR is not statistically significant.20 Possible reasons for the reduction globally include increased out-of-hospital mortality and decreased incidence of acute STEMI across the general population as a result of improved access to telemedicine or decreased levels of life stressors.20
In summary, there was an increase in ischemic time to reperfusion, in-hospital mortality, and combined in-hospital outcomes for acute STEMI patients at PAR during the COVID period.
Limitations
This study has several limitations. This is a single-center study, so the sample size is small and may not be generalizable to a larger population. This is a retrospective observational study, so causation cannot be inferred. This study analyzed ischemic time parameters as average rates over time rather than in an interrupted time series. Post-reperfusion outcomes were limited to hospital stay. Post-hospital follow-up would provide a better picture of the effects of STEMI intervention. There is no account of patients who died out-of-hospital secondary to acute STEMI. COVID-19 testing was not introduced until midway in our study period. Therefore, we cannot rule out the possibility of the SARS-Cov-2 virus inciting acute STEMI and subsequently leading to worse outcomes and poor prognosis.
Conclusions
This study provides an analysis of the incidence, characteristics, and clinical outcomes of patients presenting with acute STEMI during the early period of the COVID-19 pandemic. In-hospital mortality and ischemic time to reperfusion increased while combined in-hospital outcomes worsened.
Acknowledgment: The authors thank Piedmont Athens Regional IRB for approving this project and allowing access to patient data.
Corresponding author: Syed H. Ali; Department of Medicine, Medical College of Georgia at the Augusta University-University of Georgia Medical Partnership, 30606, Athens, GA; syedha.ali@gmail.com
Disclosures: None reported.
doi:10.12788/jcom.0085
1. Bhatt AS, Moscone A, McElrath EE, et al. Fewer hospitalizations for acute cardiovascular conditions during the COVID-19 pandemic. J Am Coll Cardiol. 2020;76(3):280-288. doi:10.1016/j.jacc.2020.05.038
2. Metzler B, Siostrzonek P, Binder RK, Bauer A, Reinstadler SJR. Decline of acute coronary syndrome admissions in Austria since the outbreak of Covid-19: the pandemic response causes cardiac collateral damage. Eur Heart J. 2020;41:1852-1853. doi:10.1093/eurheartj/ehaa314
3. De Rosa S, Spaccarotella C, Basso C, et al. Reduction of hospitalizations for myocardial infarction in Italy in the Covid-19 era. Eur Heart J. 2020;41(22):2083-2088.
4. Wilson SJ, Connolly MJ, Elghamry Z, et al. Effect of the COVID-19 pandemic on ST-segment-elevation myocardial infarction presentations and in-hospital outcomes. Circ Cardiovasc Interv. 2020; 13(7):e009438. doi:10.1161/CIRCINTERVENTIONS.120.009438
5. Mafham MM, Spata E, Goldacre R, et al. Covid-19 pandemic and admission rates for and management of acute coronary syndromes in England. Lancet. 2020;396 (10248):381-389. doi:10.1016/S0140-6736(20)31356-8
6. Bhatt AS, Moscone A, McElrath EE, et al. Fewer Hospitalizations for acute cardiovascular conditions during the COVID-19 pandemic. J Am Coll Cardiol. 2020;76(3):280-288. doi:10.1016/j.jacc.2020.05.038
7. Tam CF, Cheung KS, Lam S, et al. Impact of Coronavirus disease 2019 (Covid-19) outbreak on ST-segment elevation myocardial infarction care in Hong Kong, China. Circ Cardiovasc Qual Outcomes. 2020;13(4):e006631. doi:10.1161/CIRCOUTCOMES.120.006631
8. Clerkin KJ, Fried JA, Raikhelkar J, et al. Coronavirus disease 2019 (COVID-19) and cardiovascular disease. Circulation. 2020;141:1648-1655. doi:10.1161/CIRCULATIONAHA.120.046941
9. Ebinger JE, Shah PK. Declining admissions for acute cardiovascular illness: The Covid-19 paradox. J Am Coll Cardiol. 2020;76(3):289-291. doi:10.1016/j.jacc.2020.05.039
10 Leor J, Poole WK, Kloner RA. Sudden cardiac death triggered by an earthquake. N Engl J Med. 1996;334(7):413-419. doi:10.1056/NEJM199602153340701
11. Hiramori K. Major causes of death from acute myocardial infarction in a coronary care unit. Jpn Circ J. 1987;51(9):1041-1047. doi:10.1253/jcj.51.1041
12. Bui AH, Waks JW. Risk stratification of sudden cardiac death after acute myocardial infarction. J Innov Card Rhythm Manag. 2018;9(2):3035-3049. doi:10.19102/icrm.2018.090201
13. Xiang D, Xiang X, Zhang W, et al. Management and outcomes of patients with STEMI during the COVID-19 pandemic in China. J Am Coll Cardiol. 2020;76(11):1318-1324. doi:10.1016/j.jacc.2020.06.039
14. Hakim R, Motreff P, Rangé G. COVID-19 and STEMI. [Article in French]. Ann Cardiol Angeiol (Paris). 2020;69(6):355-359. doi:10.1016/j.ancard.2020.09.034
15. Soylu K, Coksevim M, Yanık A, Bugra Cerik I, Aksan G. Effect of Covid-19 pandemic process on STEMI patients timeline. Int J Clin Pract. 2021;75(5):e14005. doi:10.1111/ijcp.14005
16. Salinas P, Travieso A, Vergara-Uzcategui C, et al. Clinical profile and 30-day mortality of invasively managed patients with suspected acute coronary syndrome during the COVID-19 outbreak. Int Heart J. 2021;62(2):274-281. doi:10.1536/ihj.20-574
17. Hu Y, Sun J, Dai Z, et al. Prevalence and severity of corona virus disease 2019 (Covid-19): a systematic review and meta-analysis. J Clin Virol. 2020;127:104371. doi:10.1016/j.jcv.2020.104371
18. Rodriguez-Leor O, Cid Alvarez AB, Perez de Prado A, et al. In-hospital outcomes of COVID-19 ST-elevation myocardial infarction patients. EuroIntervention. 2021;16(17):1426-1433. doi:10.4244/EIJ-D-20-00935
19. Fardman A, Zahger D, Orvin K, et al. Acute myocardial infarction in the Covid-19 era: incidence, clinical characteristics and in-hospital outcomes—A multicenter registry. PLoS ONE. 2021;16(6): e0253524. doi:10.1371/journal.pone.0253524
20. Pessoa-Amorim G, Camm CF, Gajendragadkar P, et al. Admission of patients with STEMI since the outbreak of the COVID-19 pandemic: a survey by the European Society of Cardiology. Eur Heart J Qual Care Clin Outcomes. 2020;6(3):210-216. doi:10.1093/ehjqcco/qcaa046
Oxygen Therapies and Clinical Outcomes for Patients Hospitalized With COVID-19: First Surge vs Second Surge
From Lahey Hospital and Medical Center, Burlington, MA (Drs. Liesching and Lei), and Tufts University School of Medicine, Boston, MA (Dr. Liesching)
ABSTRACT
Objective: To compare the utilization of oxygen therapies and clinical outcomes of patients admitted for COVID-19 during the second surge of the pandemic to that of patients admitted during the first surge.
Design: Observational study using a registry database.
Setting: Three hospitals (791 inpatient beds and 76 intensive care unit [ICU] beds) within the Beth Israel Lahey Health system in Massachusetts.
Participants: We included 3183 patients with COVID-19 admitted to hospitals.
Measurements: Baseline data included demographics and comorbidities. Treatments included low-flow supplemental oxygen (2-6 L/min), high-flow oxygen via nasal cannula, and invasive mechanical ventilation. Outcomes included ICU admission, length of stay, ventilator days, and mortality.
Results: A total of 3183 patients were included: 1586 during the first surge and 1597 during the second surge. Compared to the first surge, patients admitted during the second surge had a similar rate of receiving low-flow supplemental oxygen (65.8% vs 64.1%, P = .3), a higher rate of receiving high-flow nasal cannula (15.4% vs 10.8%, P = .0001), and a lower ventilation rate (5.6% vs 9.7%, P < .0001). The outcomes during the second surge were better than those during the first surge: lower ICU admission rate (8.1% vs 12.7%, P < .0001), shorter length of hospital stay (5 vs 6 days, P < .0001), fewer ventilator days (10 vs 16, P = .01), and lower mortality (8.3% vs 19.2%, P < .0001). Among ventilated patients, those who received high-flow nasal cannula had lower mortality.
Conclusion: Compared to the first surge of the COVID-19 pandemic, patients admitted during the second surge had similar likelihood of receiving low-flow supplemental oxygen, were more likely to receive high-flow nasal cannula, were less likely to be ventilated, and had better outcomes.
Keywords: supplemental oxygen, high-flow nasal cannula, ventilator.
The respiratory system receives the major impact of SARS-CoV-2 virus, and hypoxemia has been the predominant diagnosis for patients hospitalized with COVID-19.1,2 During the initial stage of the pandemic, oxygen therapies and mechanical ventilation were the only choices for these patients.3-6 Standard-of-care treatment for patients with COVID-19 during the initial surge included oxygen therapies and mechanical ventilation for hypoxemia and medications for comorbidities and COVID-19–associated sequelae, such as multi-organ dysfunction and failure. A report from New York during the first surge (May 2020) showed that among 5700 hospitalized patients with COVID-19, 27.8% received supplemental oxygen and 12.2% received invasive mechanical ventilation.7 High-flow nasal cannula (HFNC) oxygen delivery has been utilized widely throughout the pandemic due to its superiority over other noninvasive respiratory support techniques.8-12 Mechanical ventilation is always necessary for critically ill patients with acute respiratory distress syndrome. However, ventilator scarcity has become a bottleneck in caring for severely ill patients with COVID-19 during the pandemic.13
The clinical outcomes of hospitalized COVID-19 patients include a high intubation rate, long length of hospital and intensive care unit (ICU) stay, and high mortality.14,15 As the pandemic evolved, new medications, including remdesivir, hydroxychloroquine, lopinavir, or interferon β-1a, were used in addition to the standard of care, but these did not result in significantly different mortality from standard of care.16 Steroids are becoming foundational to the treatment of severe COVID-19 pneumonia, but evidence from high-quality randomized controlled clinical trials is lacking.17
During the first surge from March to May 2020, Massachusetts had the third highest number of COVID-19 cases among states in the United States.18 In early 2021, COVID-19 cases were climbing close to the peak of the second surge in Massachusetts. In this study, we compared utilization of low-flow supplemental oxygen, HFNC, and mechanical ventilation and clinical outcomes of patients admitted to 3 hospitals in Massachusetts during the second surge of the pandemic to that of patients admitted during the first surge.
Methods
Setting
Beth Israel Lahey Health is a system of academic and teaching hospitals with primary care and specialty care providers. We included 3 centers within the Beth Israel Lahey Health system in Massachusetts: Lahey Hospital and Medical Center, with 335 inpatient hospital beds and 52 critical care beds; Beverly Hospital, with 227 beds and 14 critical care beds; and Winchester Hospital, with 229 beds and 10 ICU beds.
Participants
We included patients admitted to the 3 hospitals with COVID-19 as a primary or secondary diagnosis during the first surge of the pandemic (March 1, 2020 to June 15, 2020) and the second surge (November 15, 2020 to January 27, 2021). The timeframe of the first surge was defined as the window between the start date and the end date of data collection. During the time window of the first surge, 1586 patients were included. The start time of the second surge was defined as the date when the data collection was restarted; the end date was set when the number of patients (1597) accumulated was close to the number of patients in the first surge (1586), so that the two groups had similar sample size.
Study Design
A data registry of COVID-19 patients was created by our institution, and the data were prospectively collected starting in March 2020. We retrospectively extracted data on the following from the registry database for this observational study: demographics and baseline comorbidities; the use of low-flow supplemental oxygen, HFNC, and invasive mechanical ventilator; and ICU admission, length of hospital stay, length of ICU stay, and hospital discharge disposition. Start and end times for each oxygen therapy were not entered in the registry. Data about other oxygen therapies, such as noninvasive positive-pressure ventilation, were not collected in the registry database, and therefore were not included in the analysis.
Statistical Analysis
Continuous variables (eg, age) were tested for data distribution normality using the Shapiro-Wilk test. Normally distributed data were tested using unpaired t-tests and displayed as mean (SD). The skewed data were tested using the Wilcoxon rank sum test and displayed as median (interquartile range [IQR]). The categorical variables were compared using chi-square test. Comparisons with P ≤ .05 were considered significantly different. Statistical analysis for this study was generated using Statistical Analysis Software (SAS), version 9.4 for Windows (SAS Institute Inc.).
Results
Baseline Characteristics
We included 3183 patients: 1586 admitted during the first surge and 1597 admitted during the second surge. Baseline characteristics of patients with COVID-19 admitted during the first and second surges are shown in Table 1. Patients admitted during the second surge were older (73 years vs 71 years, P = .01) and had higher rates of hypertension (64.8% vs 59.6%, P = .003) and asthma (12.9% vs 10.7%, P = .049) but a lower rate of interstitial lung disease (3.3% vs 7.7%, P < .001). Sequential organ failure assessment scores at admission and the rates of other comorbidities were not significantly different between the 2 surges.

Oxygen Therapies
The number of patients who were hospitalized and received low-flow supplemental oxygen, and/or HFNC, and/or ventilator in the first surge and the second surge is shown in the Figure. Of all patients included, 2067 (64.9%) received low-flow supplemental oxygen; of these, 374 (18.1%) subsequently received HFNC, and 85 (22.7%) of these subsequently received mechanical ventilation. Of all 3183 patients, 417 (13.1%) received HFNC; 43 of these patients received HFNC without receiving low-flow supplemental oxygen, and 98 (23.5%) subsequently received mechanical ventilation. Out of all 3183 patients, 244 (7.7%) received mechanical ventilation; 98 (40.2%) of these received HFNC while the remaining 146 (59.8%) did not. At the beginning of the first surge, the ratio of patients who received invasive mechanical ventilation to patients who received HFNC was close to 1:1 (10/10); the ratio decreased to 6:10 in May and June 2020. At the beginning of the second surge, the ratio was 8:10 and then decreased to 3:10 in December 2020 and January 2021.
As shown in Table 2, the proportion of patients who received low-flow supplemental oxygen during the second surge was similar to that during the first surge (65.8% vs 64.1%, P = .3). Patients admitted during the second surge were more likely to receive HFNC than patients admitted during the first surge (15.4% vs 10.8%, P = .0001). Patients admitted during the second surge were less likely to be ventilated than the patients admitted during the first surge (5.6% vs 9.7%, P < .0001).
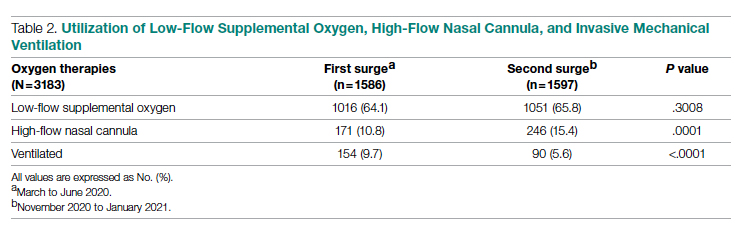
Clinical Outcomes
As shown in Table 3, second surge outcomes were much better than first surge outcomes: the ICU admission rate was lower (8.1% vs 12.7%, P < .0001); patients were more likely to be discharged to home (60.2% vs 47.4%, P < .0001), had a shorter length of hospital stay (5 vs 6 days, P < .0001), and had fewer ventilator days (10 vs 16, P = .01); and mortality was lower (8.3% vs 19.2%, P < .0001). There was a trend that length of ICU stay was shorter during the second surge than during the first surge (7 days vs 9 days, P = .09).
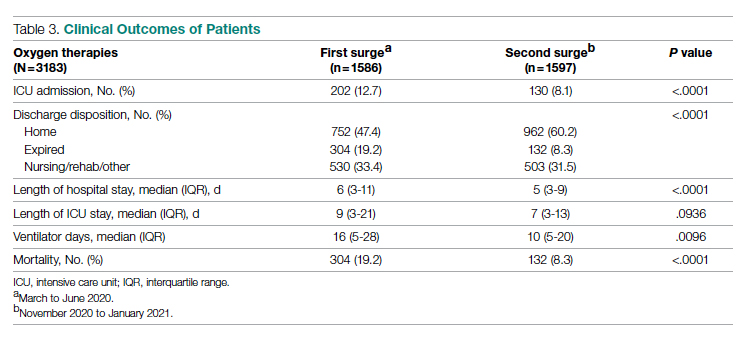
As noted (Figure), the ratio of patients who received invasive mechanical ventilation to patients who received HFNC was decreasing during both the first surge and the second surge. To further analyze the relation between ventilator and HFNC, we performed a subgroup analysis for 244 ventilated patients during both surges to compare outcomes between patients who received HFNC and those who did not receive HFNC (Table 4). Ninety-eight (40%) patients received HFNC. Ventilated patients who received HFNC had lower mortality than those patients who did not receive HFNC (31.6% vs 48%, P = .01), but had a longer length of hospital stay (29 days vs 14 days, P < .0001), longer length of ICU stay (17 days vs 9 days, P < .0001), and a higher number of ventilator days (16 vs 11, P = .001).
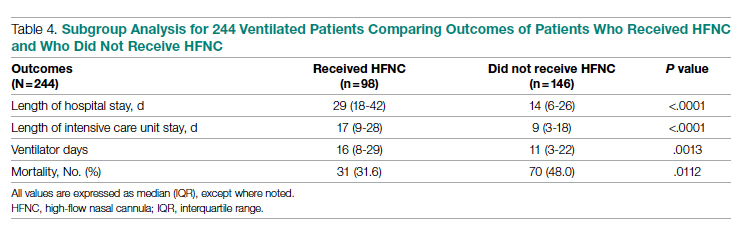
Discussion
Our study compared the baseline patient characteristics; utilization of low-flow supplemental oxygen therapy, HFNC, and mechanical ventilation; and clinical outcomes between the first surge (n = 1586) and the second surge (n = 1597) of the COVID-19 pandemic. During both surges, about two-thirds of admitted patients received low-flow supplemental oxygen. A higher proportion of the admitted patients received HFNC during the second surge than during the first surge, while the intubation rate was lower during the second surge than during the first surge.
Reported low-flow supplemental oxygen use ranged from 28% to 63% depending on the cohort characteristics and location during the first surge.6,7,19 A report from New York during the first surge (March 1 to April 4, 2020) showed that among 5700 hospitalized patients with COVID-19, 27.8% received low-flow supplemental oxygen.7 HFNC is recommended in guidelines on management of patients with acute respiratory failure due to COVID-19.20 In our study, HFNC was utilized in a higher proportion of patients admitted for COVID-19 during the second surge (15.5% vs 10.8%, P = .0001). During the early pandemic period in Wuhan, China, 11% to 21% of admitted COVID-19 patients received HFNC.21,22 Utilization of HFNC in New York during the first surge (March to May 2020) varied from 5% to 14.3% of patients admitted with COVID-19.23,24 Our subgroup analysis of the ventilated patients showed that patients who received HFNC had lower mortality than those who did not (31.6% vs 48.0%, P = .011). Comparably, a report from Paris, France, showed that among patients admitted to ICUs for acute hypoxemic respiratory failure, those who received HFNC had lower mortality at day 60 than those who did not (21% vs 31%, P = .052).25 Our recent analysis showed that patients treated with HFNC prior to mechanical ventilation had lower mortality than those treated with only conventional oxygen (30% vs 52%, P = .05).26 In this subgroup analysis, we could not determine if HFNC treatment was administered before or after ventilation because HFNC was entered as dichotomous data (“Yes” or “No”) in the registry database. We merely showed the beneficial effect of HFNC on reducing mortality for ventilated COVID-19 patients, but did not mean to focus on how and when to apply HFNC.
We observed that the patients admitted during the second surge were less likely to be ventilated than the patients admitted during the first surge (5.6% vs 9.7%, P < .0001). During the first surge in New York, among 5700 patients admitted with COVID-19, 12.2% received invasive mechanical ventilation.7 In another report, also from New York during the first surge, 26.1% of 2015 hospitalized COVID-19 patients received mechanical ventilation.27 In our study, the ventilation rate of 9.7% during the first surge was lower.
Outcomes during the second surge were better than during the first surge, including ICU admission rate, hospital and ICU length of stay, ventilator days, and mortality. The mortality was 19.2% during the first surge vs 8.3% during the second surge (P < .0001). The mortality of 19.2% was lower than the 30.6% mortality reported for 2015 hospitalized COVID-19 patients in New York during the first surge.27 A retrospective study showed that early administration of remdesivir was associated with reduced ICU admission, ventilation use, and mortality.28 The RECOVERY clinical trial showed that dexamethasone improved mortality for COVID-19 patients who received respiratory support, but not for patients who did not receive any respiratory support.29 Perhaps some, if not all, of the improvement in ICU admission and mortality during the second surge was attributed to the new medications, such as antivirals and steroids.
The length of hospital stay for patients with moderate to severe COVID-19 varied from 4 to 53 days at different locations of the world, as shown in a meta-analysis by Rees and colleagues.30 Our results showing a length of stay of 6 days during the first surge and 5 days during the second surge fell into the shorter end of this range. In a retrospective analysis of 1643 adults with severe COVID-19 admitted to hospitals in New York City between March 9, 2020 and April 23, 2020, median hospital length of stay was 7 (IQR, 3-14) days.31 For the ventilated patients in our study, the length of stay of 14 days (did not receive HFNC) and 29 days (received HFNC) was much longer. This longer length of stay might be attributed to the patients in our study being older and having more severe comorbidities.
The main purpose of this study was to compare the oxygen therapies and outcomes between 2 surges. It is difficult to associate the clinical outcomes with the oxygen therapies because new therapies and medications were available after the first surge. It was not possible to adjust the outcomes with confounders (other therapies and medications) because the registry data did not include the new therapies and medications.
A strength of this study was that we included a large, balanced number of patients in the first surge and the second surge. We did not plan the sample size in both groups as we could not predict the number of admissions. We set the end date of data collection for analysis as the time when the number of patients admitted during the second surge was similar to the number of patients admitted during the first surge. A limitation was that the registry database was created by the institution and was not designed solely for this study. The data for oxygen therapies were limited to low-flow supplemental oxygen, HFNC, and invasive mechanical ventilation; data for noninvasive ventilation were not included.
Conclusion
At our centers, during the second surge of COVID-19 pandemic, patients hospitalized with COVID-19 infection were more likely to receive HFNC but less likely to be ventilated. Compared to the first surge, the hospitalized patients with COVID-19 infection had a lower ICU admission rate, shorter length of hospital stay, fewer ventilator days, and lower mortality. For ventilated patients, those who received HFNC had lower mortality than those who did not.
Corresponding author: Timothy N. Liesching, MD, 41 Mall Road, Burlington, MA 01805; Timothy.N.Liesching@lahey.org
Disclosures: None reported.
doi:10.12788/jcom.0086
1. Xie J, Covassin N, Fan Z, et al. Association between hypoxemia and mortality in patients with COVID-19. Mayo Clin Proc. 2020;95(6):1138-1147. doi:10.1016/j.mayocp.2020.04.006
2. Asleh R, Asher E, Yagel O, et al. Predictors of hypoxemia and related adverse outcomes in patients hospitalized with COVID-19: a double-center retrospective study. J Clin Med. 2021;10(16):3581. doi:10.3390/jcm10163581
3. Choi KJ, Hong HL, Kim EJ. Association between oxygen saturation/fraction of inhaled oxygen and mortality in patients with COVID-19 associated pneumonia requiring oxygen therapy. Tuberc Respir Dis (Seoul). 2021;84(2):125-133. doi:10.4046/trd.2020.0126
4. Dixit SB. Role of noninvasive oxygen therapy strategies in COVID-19 patients: Where are we going? Indian J Crit Care Med. 2020;24(10):897-898. doi:10.5005/jp-journals-10071-23625
5. Gonzalez-Castro A, Fajardo Campoverde A, Medina A, et al. Non-invasive mechanical ventilation and high-flow oxygen therapy in the COVID-19 pandemic: the value of a draw. Med Intensiva (Engl Ed). 2021;45(5):320-321. doi:10.1016/j.medine.2021.04.001
6. Pan W, Li J, Ou Y, et al. Clinical outcome of standardized oxygen therapy nursing strategy in COVID-19. Ann Palliat Med. 2020;9(4):2171-2177. doi:10.21037/apm-20-1272
7. Richardson S, Hirsch JS, Narasimhan M, et al. Presenting characteristics, comorbidities, and outcomes among 5700 patients hospitalized with COVID-19 in the New York City area. JAMA. 2020;323(20):2052-2059. doi:10.1001/jama.2020.6775
8. He G, Han Y, Fang Q, et al. Clinical experience of high-flow nasal cannula oxygen therapy in severe COVID-19 patients. Article in Chinese. Zhejiang Da Xue Xue Bao Yi Xue Ban. 2020;49(2):232-239. doi:10.3785/j.issn.1008-9292.2020.03.13
9. Lalla U, Allwood BW, Louw EH, et al. The utility of high-flow nasal cannula oxygen therapy in the management of respiratory failure secondary to COVID-19 pneumonia. S Afr Med J. 2020;110(6):12941.
10. Zhang TT, Dai B, Wang W. Should the high-flow nasal oxygen therapy be used or avoided in COVID-19? J Transl Int Med. 2020;8(2):57-58. doi:10.2478/jtim-2020-0018
11. Agarwal A, Basmaji J, Muttalib F, et al. High-flow nasal cannula for acute hypoxemic respiratory failure in patients with COVID-19: systematic reviews of effectiveness and its risks of aerosolization, dispersion, and infection transmission. Can J Anaesth. 2020;67(9):1217-1248. doi:10.1007/s12630-020-01740-2
12. Geng S, Mei Q, Zhu C, et al. High flow nasal cannula is a good treatment option for COVID-19. Heart Lung. 2020;49(5):444-445. doi:10.1016/j.hrtlng.2020.03.018
13. Feinstein MM, Niforatos JD, Hyun I, et al. Considerations for ventilator triage during the COVID-19 pandemic. Lancet Respir Med. 2020;8(6):e53. doi:10.1016/S2213-2600(20)30192-2
14. Wu Z, McGoogan JM. Characteristics of and important lessons from the coronavirus disease 2019 (COVID-19) outbreak in China: summary of a report of 72314 cases from the Chinese Center for Disease Control and Prevention. JAMA. 2020;323(13):1239-1242. doi:10.1001/jama.2020.2648
15. Rojas-Marte G, Hashmi AT, Khalid M, et al. Outcomes in patients with COVID-19 disease and high oxygen requirements. J Clin Med Res. 2021;13(1):26-37. doi:10.14740/jocmr4405
16. Zhang R, Mylonakis E. In inpatients with COVID-19, none of remdesivir, hydroxychloroquine, lopinavir, or interferon β-1a differed from standard care for in-hospital mortality. Ann Intern Med. 2021;174(2):JC17. doi:10.7326/ACPJ202102160-017
17. Rello J, Waterer GW, Bourdiol A, Roquilly A. COVID-19, steroids and other immunomodulators: The jigsaw is not complete. Anaesth Crit Care Pain Med. 2020;39(6):699-701. doi:10.1016/j.accpm.2020.10.011
18. Dargin J, Stempek S, Lei Y, Gray Jr. A, Liesching T. The effect of a tiered provider staffing model on patient outcomes during the coronavirus disease 2019 pandemic: A single-center observational study. Int J Crit Illn Inj Sci. 2021;11(3). doi:10.4103/ijciis.ijciis_37_21
19. Ni YN, Wang T, Liang BM, Liang ZA. The independent factors associated with oxygen therapy in COVID-19 patients under 65 years old. PLoS One. 2021;16(1):e0245690. doi:10.1371/journal.pone.0245690
20. Alhazzani W, Moller MH, Arabi YM, et al. Surviving Sepsis Campaign: guidelines on the management of critically ill adults with coronavirus disease 2019 (COVID-19). Crit Care Med. 2020;48(6):e440-e469. doi:10.1097/CCM.0000000000004363
21. Wang D, Hu B, Hu C, et al. Clinical characteristics of 138 hospitalized patients with 2019 novel coronavirus-infected pneumonia in Wuhan, China. JAMA. 2020;323(11):1061-1069. doi:10.1001/jama.2020.1585
22. Zhou F, Yu T, Du R, et al. Clinical course and risk factors for mortality of adult inpatients with COVID-19 in Wuhan, China: a retrospective cohort study. Lancet. 2020;395(10229):1054-1062. doi:10.1016/S0140-6736(20)30566-3
23. Argenziano MG, Bruce SL, Slater CL, et al. Characterization and clinical course of 1000 patients with coronavirus disease 2019 in New York: retrospective case series. BMJ. 2020;369:m1996. doi:10.1136/bmj.m1996
24. Cummings MJ, Baldwin MR, Abrams D, et al. Epidemiology, clinical course, and outcomes of critically ill adults with COVID-19 in New York City: a prospective cohort study. Lancet. 2020;395(10239):1763-1770. doi:10.1016/S0140-6736(20)31189-2
25. Demoule A, Vieillard Baron A, Darmon M, et al. High-flow nasal cannula in critically ill patients with severe COVID-19. Am J Respir Crit Care Med. 2020;202(7):1039-1042. doi:10.1164/rccm.202005-2007LE
26. Hansen CK, Stempek S, Liesching T, Lei Y, Dargin J. Characteristics and outcomes of patients receiving high flow nasal cannula therapy prior to mechanical ventilation in COVID-19 respiratory failure: a prospective observational study. Int J Crit Illn Inj Sci. 2021;11(2):56-60. doi:10.4103/IJCIIS.IJCIIS_181_20
27. van Gerwen M, Alsen M, Little C, et al. Risk factors and outcomes of COVID-19 in New York City; a retrospective cohort study. J Med Virol. 2021;93(2):907-915. doi:10.1002/jmv.26337
28. Hussain Alsayed HA, Saheb Sharif-Askari F, Saheb Sharif-Askari N, Hussain AAS, Hamid Q, Halwani R. Early administration of remdesivir to COVID-19 patients associates with higher recovery rate and lower need for ICU admission: A retrospective cohort study. PLoS One. 2021;16(10):e0258643. doi:10.1371/journal.pone.0258643
29. RECOVERY Collaborative Group, Horby P, Lim WS, et al. Dexamethasone in hospitalized patients with Covid-19. N Engl J Med. 2021;384(8):693-704. doi:10.1056/NEJMoa2021436
30. Rees EM, Nightingale ES, Jafari Y, et al. COVID-19 length of hospital stay: a systematic review and data synthesis. BMC Med. 2020;18(1):270. doi:10.1186/s12916-020-01726-3
31. Anderson M, Bach P, Baldwin MR. Hospital length of stay for severe COVID-19: implications for Remdesivir’s value. medRxiv. 2020;2020.08.10.20171637. doi:10.1101/2020.08.10.20171637
From Lahey Hospital and Medical Center, Burlington, MA (Drs. Liesching and Lei), and Tufts University School of Medicine, Boston, MA (Dr. Liesching)
ABSTRACT
Objective: To compare the utilization of oxygen therapies and clinical outcomes of patients admitted for COVID-19 during the second surge of the pandemic to that of patients admitted during the first surge.
Design: Observational study using a registry database.
Setting: Three hospitals (791 inpatient beds and 76 intensive care unit [ICU] beds) within the Beth Israel Lahey Health system in Massachusetts.
Participants: We included 3183 patients with COVID-19 admitted to hospitals.
Measurements: Baseline data included demographics and comorbidities. Treatments included low-flow supplemental oxygen (2-6 L/min), high-flow oxygen via nasal cannula, and invasive mechanical ventilation. Outcomes included ICU admission, length of stay, ventilator days, and mortality.
Results: A total of 3183 patients were included: 1586 during the first surge and 1597 during the second surge. Compared to the first surge, patients admitted during the second surge had a similar rate of receiving low-flow supplemental oxygen (65.8% vs 64.1%, P = .3), a higher rate of receiving high-flow nasal cannula (15.4% vs 10.8%, P = .0001), and a lower ventilation rate (5.6% vs 9.7%, P < .0001). The outcomes during the second surge were better than those during the first surge: lower ICU admission rate (8.1% vs 12.7%, P < .0001), shorter length of hospital stay (5 vs 6 days, P < .0001), fewer ventilator days (10 vs 16, P = .01), and lower mortality (8.3% vs 19.2%, P < .0001). Among ventilated patients, those who received high-flow nasal cannula had lower mortality.
Conclusion: Compared to the first surge of the COVID-19 pandemic, patients admitted during the second surge had similar likelihood of receiving low-flow supplemental oxygen, were more likely to receive high-flow nasal cannula, were less likely to be ventilated, and had better outcomes.
Keywords: supplemental oxygen, high-flow nasal cannula, ventilator.
The respiratory system receives the major impact of SARS-CoV-2 virus, and hypoxemia has been the predominant diagnosis for patients hospitalized with COVID-19.1,2 During the initial stage of the pandemic, oxygen therapies and mechanical ventilation were the only choices for these patients.3-6 Standard-of-care treatment for patients with COVID-19 during the initial surge included oxygen therapies and mechanical ventilation for hypoxemia and medications for comorbidities and COVID-19–associated sequelae, such as multi-organ dysfunction and failure. A report from New York during the first surge (May 2020) showed that among 5700 hospitalized patients with COVID-19, 27.8% received supplemental oxygen and 12.2% received invasive mechanical ventilation.7 High-flow nasal cannula (HFNC) oxygen delivery has been utilized widely throughout the pandemic due to its superiority over other noninvasive respiratory support techniques.8-12 Mechanical ventilation is always necessary for critically ill patients with acute respiratory distress syndrome. However, ventilator scarcity has become a bottleneck in caring for severely ill patients with COVID-19 during the pandemic.13
The clinical outcomes of hospitalized COVID-19 patients include a high intubation rate, long length of hospital and intensive care unit (ICU) stay, and high mortality.14,15 As the pandemic evolved, new medications, including remdesivir, hydroxychloroquine, lopinavir, or interferon β-1a, were used in addition to the standard of care, but these did not result in significantly different mortality from standard of care.16 Steroids are becoming foundational to the treatment of severe COVID-19 pneumonia, but evidence from high-quality randomized controlled clinical trials is lacking.17
During the first surge from March to May 2020, Massachusetts had the third highest number of COVID-19 cases among states in the United States.18 In early 2021, COVID-19 cases were climbing close to the peak of the second surge in Massachusetts. In this study, we compared utilization of low-flow supplemental oxygen, HFNC, and mechanical ventilation and clinical outcomes of patients admitted to 3 hospitals in Massachusetts during the second surge of the pandemic to that of patients admitted during the first surge.
Methods
Setting
Beth Israel Lahey Health is a system of academic and teaching hospitals with primary care and specialty care providers. We included 3 centers within the Beth Israel Lahey Health system in Massachusetts: Lahey Hospital and Medical Center, with 335 inpatient hospital beds and 52 critical care beds; Beverly Hospital, with 227 beds and 14 critical care beds; and Winchester Hospital, with 229 beds and 10 ICU beds.
Participants
We included patients admitted to the 3 hospitals with COVID-19 as a primary or secondary diagnosis during the first surge of the pandemic (March 1, 2020 to June 15, 2020) and the second surge (November 15, 2020 to January 27, 2021). The timeframe of the first surge was defined as the window between the start date and the end date of data collection. During the time window of the first surge, 1586 patients were included. The start time of the second surge was defined as the date when the data collection was restarted; the end date was set when the number of patients (1597) accumulated was close to the number of patients in the first surge (1586), so that the two groups had similar sample size.
Study Design
A data registry of COVID-19 patients was created by our institution, and the data were prospectively collected starting in March 2020. We retrospectively extracted data on the following from the registry database for this observational study: demographics and baseline comorbidities; the use of low-flow supplemental oxygen, HFNC, and invasive mechanical ventilator; and ICU admission, length of hospital stay, length of ICU stay, and hospital discharge disposition. Start and end times for each oxygen therapy were not entered in the registry. Data about other oxygen therapies, such as noninvasive positive-pressure ventilation, were not collected in the registry database, and therefore were not included in the analysis.
Statistical Analysis
Continuous variables (eg, age) were tested for data distribution normality using the Shapiro-Wilk test. Normally distributed data were tested using unpaired t-tests and displayed as mean (SD). The skewed data were tested using the Wilcoxon rank sum test and displayed as median (interquartile range [IQR]). The categorical variables were compared using chi-square test. Comparisons with P ≤ .05 were considered significantly different. Statistical analysis for this study was generated using Statistical Analysis Software (SAS), version 9.4 for Windows (SAS Institute Inc.).
Results
Baseline Characteristics
We included 3183 patients: 1586 admitted during the first surge and 1597 admitted during the second surge. Baseline characteristics of patients with COVID-19 admitted during the first and second surges are shown in Table 1. Patients admitted during the second surge were older (73 years vs 71 years, P = .01) and had higher rates of hypertension (64.8% vs 59.6%, P = .003) and asthma (12.9% vs 10.7%, P = .049) but a lower rate of interstitial lung disease (3.3% vs 7.7%, P < .001). Sequential organ failure assessment scores at admission and the rates of other comorbidities were not significantly different between the 2 surges.
Oxygen Therapies
The number of patients who were hospitalized and received low-flow supplemental oxygen, and/or HFNC, and/or ventilator in the first surge and the second surge is shown in the Figure. Of all patients included, 2067 (64.9%) received low-flow supplemental oxygen; of these, 374 (18.1%) subsequently received HFNC, and 85 (22.7%) of these subsequently received mechanical ventilation. Of all 3183 patients, 417 (13.1%) received HFNC; 43 of these patients received HFNC without receiving low-flow supplemental oxygen, and 98 (23.5%) subsequently received mechanical ventilation. Out of all 3183 patients, 244 (7.7%) received mechanical ventilation; 98 (40.2%) of these received HFNC while the remaining 146 (59.8%) did not. At the beginning of the first surge, the ratio of patients who received invasive mechanical ventilation to patients who received HFNC was close to 1:1 (10/10); the ratio decreased to 6:10 in May and June 2020. At the beginning of the second surge, the ratio was 8:10 and then decreased to 3:10 in December 2020 and January 2021.
As shown in Table 2, the proportion of patients who received low-flow supplemental oxygen during the second surge was similar to that during the first surge (65.8% vs 64.1%, P = .3). Patients admitted during the second surge were more likely to receive HFNC than patients admitted during the first surge (15.4% vs 10.8%, P = .0001). Patients admitted during the second surge were less likely to be ventilated than the patients admitted during the first surge (5.6% vs 9.7%, P < .0001).
Clinical Outcomes
As shown in Table 3, second surge outcomes were much better than first surge outcomes: the ICU admission rate was lower (8.1% vs 12.7%, P < .0001); patients were more likely to be discharged to home (60.2% vs 47.4%, P < .0001), had a shorter length of hospital stay (5 vs 6 days, P < .0001), and had fewer ventilator days (10 vs 16, P = .01); and mortality was lower (8.3% vs 19.2%, P < .0001). There was a trend that length of ICU stay was shorter during the second surge than during the first surge (7 days vs 9 days, P = .09).
As noted (Figure), the ratio of patients who received invasive mechanical ventilation to patients who received HFNC was decreasing during both the first surge and the second surge. To further analyze the relation between ventilator and HFNC, we performed a subgroup analysis for 244 ventilated patients during both surges to compare outcomes between patients who received HFNC and those who did not receive HFNC (Table 4). Ninety-eight (40%) patients received HFNC. Ventilated patients who received HFNC had lower mortality than those patients who did not receive HFNC (31.6% vs 48%, P = .01), but had a longer length of hospital stay (29 days vs 14 days, P < .0001), longer length of ICU stay (17 days vs 9 days, P < .0001), and a higher number of ventilator days (16 vs 11, P = .001).
Discussion
Our study compared the baseline patient characteristics; utilization of low-flow supplemental oxygen therapy, HFNC, and mechanical ventilation; and clinical outcomes between the first surge (n = 1586) and the second surge (n = 1597) of the COVID-19 pandemic. During both surges, about two-thirds of admitted patients received low-flow supplemental oxygen. A higher proportion of the admitted patients received HFNC during the second surge than during the first surge, while the intubation rate was lower during the second surge than during the first surge.
Reported low-flow supplemental oxygen use ranged from 28% to 63% depending on the cohort characteristics and location during the first surge.6,7,19 A report from New York during the first surge (March 1 to April 4, 2020) showed that among 5700 hospitalized patients with COVID-19, 27.8% received low-flow supplemental oxygen.7 HFNC is recommended in guidelines on management of patients with acute respiratory failure due to COVID-19.20 In our study, HFNC was utilized in a higher proportion of patients admitted for COVID-19 during the second surge (15.5% vs 10.8%, P = .0001). During the early pandemic period in Wuhan, China, 11% to 21% of admitted COVID-19 patients received HFNC.21,22 Utilization of HFNC in New York during the first surge (March to May 2020) varied from 5% to 14.3% of patients admitted with COVID-19.23,24 Our subgroup analysis of the ventilated patients showed that patients who received HFNC had lower mortality than those who did not (31.6% vs 48.0%, P = .011). Comparably, a report from Paris, France, showed that among patients admitted to ICUs for acute hypoxemic respiratory failure, those who received HFNC had lower mortality at day 60 than those who did not (21% vs 31%, P = .052).25 Our recent analysis showed that patients treated with HFNC prior to mechanical ventilation had lower mortality than those treated with only conventional oxygen (30% vs 52%, P = .05).26 In this subgroup analysis, we could not determine if HFNC treatment was administered before or after ventilation because HFNC was entered as dichotomous data (“Yes” or “No”) in the registry database. We merely showed the beneficial effect of HFNC on reducing mortality for ventilated COVID-19 patients, but did not mean to focus on how and when to apply HFNC.
We observed that the patients admitted during the second surge were less likely to be ventilated than the patients admitted during the first surge (5.6% vs 9.7%, P < .0001). During the first surge in New York, among 5700 patients admitted with COVID-19, 12.2% received invasive mechanical ventilation.7 In another report, also from New York during the first surge, 26.1% of 2015 hospitalized COVID-19 patients received mechanical ventilation.27 In our study, the ventilation rate of 9.7% during the first surge was lower.
Outcomes during the second surge were better than during the first surge, including ICU admission rate, hospital and ICU length of stay, ventilator days, and mortality. The mortality was 19.2% during the first surge vs 8.3% during the second surge (P < .0001). The mortality of 19.2% was lower than the 30.6% mortality reported for 2015 hospitalized COVID-19 patients in New York during the first surge.27 A retrospective study showed that early administration of remdesivir was associated with reduced ICU admission, ventilation use, and mortality.28 The RECOVERY clinical trial showed that dexamethasone improved mortality for COVID-19 patients who received respiratory support, but not for patients who did not receive any respiratory support.29 Perhaps some, if not all, of the improvement in ICU admission and mortality during the second surge was attributed to the new medications, such as antivirals and steroids.
The length of hospital stay for patients with moderate to severe COVID-19 varied from 4 to 53 days at different locations of the world, as shown in a meta-analysis by Rees and colleagues.30 Our results showing a length of stay of 6 days during the first surge and 5 days during the second surge fell into the shorter end of this range. In a retrospective analysis of 1643 adults with severe COVID-19 admitted to hospitals in New York City between March 9, 2020 and April 23, 2020, median hospital length of stay was 7 (IQR, 3-14) days.31 For the ventilated patients in our study, the length of stay of 14 days (did not receive HFNC) and 29 days (received HFNC) was much longer. This longer length of stay might be attributed to the patients in our study being older and having more severe comorbidities.
The main purpose of this study was to compare the oxygen therapies and outcomes between 2 surges. It is difficult to associate the clinical outcomes with the oxygen therapies because new therapies and medications were available after the first surge. It was not possible to adjust the outcomes with confounders (other therapies and medications) because the registry data did not include the new therapies and medications.
A strength of this study was that we included a large, balanced number of patients in the first surge and the second surge. We did not plan the sample size in both groups as we could not predict the number of admissions. We set the end date of data collection for analysis as the time when the number of patients admitted during the second surge was similar to the number of patients admitted during the first surge. A limitation was that the registry database was created by the institution and was not designed solely for this study. The data for oxygen therapies were limited to low-flow supplemental oxygen, HFNC, and invasive mechanical ventilation; data for noninvasive ventilation were not included.
Conclusion
At our centers, during the second surge of COVID-19 pandemic, patients hospitalized with COVID-19 infection were more likely to receive HFNC but less likely to be ventilated. Compared to the first surge, the hospitalized patients with COVID-19 infection had a lower ICU admission rate, shorter length of hospital stay, fewer ventilator days, and lower mortality. For ventilated patients, those who received HFNC had lower mortality than those who did not.
Corresponding author: Timothy N. Liesching, MD, 41 Mall Road, Burlington, MA 01805; Timothy.N.Liesching@lahey.org
Disclosures: None reported.
doi:10.12788/jcom.0086
1. Xie J, Covassin N, Fan Z, et al. Association between hypoxemia and mortality in patients with COVID-19. Mayo Clin Proc. 2020;95(6):1138-1147. doi:10.1016/j.mayocp.2020.04.006
2. Asleh R, Asher E, Yagel O, et al. Predictors of hypoxemia and related adverse outcomes in patients hospitalized with COVID-19: a double-center retrospective study. J Clin Med. 2021;10(16):3581. doi:10.3390/jcm10163581
3. Choi KJ, Hong HL, Kim EJ. Association between oxygen saturation/fraction of inhaled oxygen and mortality in patients with COVID-19 associated pneumonia requiring oxygen therapy. Tuberc Respir Dis (Seoul). 2021;84(2):125-133. doi:10.4046/trd.2020.0126
4. Dixit SB. Role of noninvasive oxygen therapy strategies in COVID-19 patients: Where are we going? Indian J Crit Care Med. 2020;24(10):897-898. doi:10.5005/jp-journals-10071-23625
5. Gonzalez-Castro A, Fajardo Campoverde A, Medina A, et al. Non-invasive mechanical ventilation and high-flow oxygen therapy in the COVID-19 pandemic: the value of a draw. Med Intensiva (Engl Ed). 2021;45(5):320-321. doi:10.1016/j.medine.2021.04.001
6. Pan W, Li J, Ou Y, et al. Clinical outcome of standardized oxygen therapy nursing strategy in COVID-19. Ann Palliat Med. 2020;9(4):2171-2177. doi:10.21037/apm-20-1272
7. Richardson S, Hirsch JS, Narasimhan M, et al. Presenting characteristics, comorbidities, and outcomes among 5700 patients hospitalized with COVID-19 in the New York City area. JAMA. 2020;323(20):2052-2059. doi:10.1001/jama.2020.6775
8. He G, Han Y, Fang Q, et al. Clinical experience of high-flow nasal cannula oxygen therapy in severe COVID-19 patients. Article in Chinese. Zhejiang Da Xue Xue Bao Yi Xue Ban. 2020;49(2):232-239. doi:10.3785/j.issn.1008-9292.2020.03.13
9. Lalla U, Allwood BW, Louw EH, et al. The utility of high-flow nasal cannula oxygen therapy in the management of respiratory failure secondary to COVID-19 pneumonia. S Afr Med J. 2020;110(6):12941.
10. Zhang TT, Dai B, Wang W. Should the high-flow nasal oxygen therapy be used or avoided in COVID-19? J Transl Int Med. 2020;8(2):57-58. doi:10.2478/jtim-2020-0018
11. Agarwal A, Basmaji J, Muttalib F, et al. High-flow nasal cannula for acute hypoxemic respiratory failure in patients with COVID-19: systematic reviews of effectiveness and its risks of aerosolization, dispersion, and infection transmission. Can J Anaesth. 2020;67(9):1217-1248. doi:10.1007/s12630-020-01740-2
12. Geng S, Mei Q, Zhu C, et al. High flow nasal cannula is a good treatment option for COVID-19. Heart Lung. 2020;49(5):444-445. doi:10.1016/j.hrtlng.2020.03.018
13. Feinstein MM, Niforatos JD, Hyun I, et al. Considerations for ventilator triage during the COVID-19 pandemic. Lancet Respir Med. 2020;8(6):e53. doi:10.1016/S2213-2600(20)30192-2
14. Wu Z, McGoogan JM. Characteristics of and important lessons from the coronavirus disease 2019 (COVID-19) outbreak in China: summary of a report of 72314 cases from the Chinese Center for Disease Control and Prevention. JAMA. 2020;323(13):1239-1242. doi:10.1001/jama.2020.2648
15. Rojas-Marte G, Hashmi AT, Khalid M, et al. Outcomes in patients with COVID-19 disease and high oxygen requirements. J Clin Med Res. 2021;13(1):26-37. doi:10.14740/jocmr4405
16. Zhang R, Mylonakis E. In inpatients with COVID-19, none of remdesivir, hydroxychloroquine, lopinavir, or interferon β-1a differed from standard care for in-hospital mortality. Ann Intern Med. 2021;174(2):JC17. doi:10.7326/ACPJ202102160-017
17. Rello J, Waterer GW, Bourdiol A, Roquilly A. COVID-19, steroids and other immunomodulators: The jigsaw is not complete. Anaesth Crit Care Pain Med. 2020;39(6):699-701. doi:10.1016/j.accpm.2020.10.011
18. Dargin J, Stempek S, Lei Y, Gray Jr. A, Liesching T. The effect of a tiered provider staffing model on patient outcomes during the coronavirus disease 2019 pandemic: A single-center observational study. Int J Crit Illn Inj Sci. 2021;11(3). doi:10.4103/ijciis.ijciis_37_21
19. Ni YN, Wang T, Liang BM, Liang ZA. The independent factors associated with oxygen therapy in COVID-19 patients under 65 years old. PLoS One. 2021;16(1):e0245690. doi:10.1371/journal.pone.0245690
20. Alhazzani W, Moller MH, Arabi YM, et al. Surviving Sepsis Campaign: guidelines on the management of critically ill adults with coronavirus disease 2019 (COVID-19). Crit Care Med. 2020;48(6):e440-e469. doi:10.1097/CCM.0000000000004363
21. Wang D, Hu B, Hu C, et al. Clinical characteristics of 138 hospitalized patients with 2019 novel coronavirus-infected pneumonia in Wuhan, China. JAMA. 2020;323(11):1061-1069. doi:10.1001/jama.2020.1585
22. Zhou F, Yu T, Du R, et al. Clinical course and risk factors for mortality of adult inpatients with COVID-19 in Wuhan, China: a retrospective cohort study. Lancet. 2020;395(10229):1054-1062. doi:10.1016/S0140-6736(20)30566-3
23. Argenziano MG, Bruce SL, Slater CL, et al. Characterization and clinical course of 1000 patients with coronavirus disease 2019 in New York: retrospective case series. BMJ. 2020;369:m1996. doi:10.1136/bmj.m1996
24. Cummings MJ, Baldwin MR, Abrams D, et al. Epidemiology, clinical course, and outcomes of critically ill adults with COVID-19 in New York City: a prospective cohort study. Lancet. 2020;395(10239):1763-1770. doi:10.1016/S0140-6736(20)31189-2
25. Demoule A, Vieillard Baron A, Darmon M, et al. High-flow nasal cannula in critically ill patients with severe COVID-19. Am J Respir Crit Care Med. 2020;202(7):1039-1042. doi:10.1164/rccm.202005-2007LE
26. Hansen CK, Stempek S, Liesching T, Lei Y, Dargin J. Characteristics and outcomes of patients receiving high flow nasal cannula therapy prior to mechanical ventilation in COVID-19 respiratory failure: a prospective observational study. Int J Crit Illn Inj Sci. 2021;11(2):56-60. doi:10.4103/IJCIIS.IJCIIS_181_20
27. van Gerwen M, Alsen M, Little C, et al. Risk factors and outcomes of COVID-19 in New York City; a retrospective cohort study. J Med Virol. 2021;93(2):907-915. doi:10.1002/jmv.26337
28. Hussain Alsayed HA, Saheb Sharif-Askari F, Saheb Sharif-Askari N, Hussain AAS, Hamid Q, Halwani R. Early administration of remdesivir to COVID-19 patients associates with higher recovery rate and lower need for ICU admission: A retrospective cohort study. PLoS One. 2021;16(10):e0258643. doi:10.1371/journal.pone.0258643
29. RECOVERY Collaborative Group, Horby P, Lim WS, et al. Dexamethasone in hospitalized patients with Covid-19. N Engl J Med. 2021;384(8):693-704. doi:10.1056/NEJMoa2021436
30. Rees EM, Nightingale ES, Jafari Y, et al. COVID-19 length of hospital stay: a systematic review and data synthesis. BMC Med. 2020;18(1):270. doi:10.1186/s12916-020-01726-3
31. Anderson M, Bach P, Baldwin MR. Hospital length of stay for severe COVID-19: implications for Remdesivir’s value. medRxiv. 2020;2020.08.10.20171637. doi:10.1101/2020.08.10.20171637
Characterizing Opioid Response in Older Veterans in the Post-Acute Setting
Older adults admitted to post-acute settings frequently have complex rehabilitation needs and multimorbidity, which predisposes them to pain management challenges.1,2 The prevalence of pain in post-acute and long-term care is as high as 65%, and opioid use is common among this population with 1 in 7 residents receiving long-term opioids.3,4
Opioids that do not adequately control pain represent a missed opportunity for deprescribing. There is limited evidence regarding efficacy of long-term opioid use (> 90 days) for improving pain and physical functioning.5 In addition, long-term opioid use carries significant risks, including overdose-related death, dependence, and increased emergency department visits.5 These risks are likely to be pronounced among veterans receiving post-acute care (PAC) who are older, have comorbid psychiatric disorders, are prescribed several centrally acting medications, and experience substance use disorder (SUD).6
Older adults are at increased risk for opioid toxicity because of reduced drug clearance and smaller therapeutic window.5 Centers for Disease Control and Prevention (CDC) guidelines recommend frequently assessing patients for benefit in terms of sustained improvement in pain as well as physical function.5 If pain and functional improvements are minimal, opioid use and nonopioid pain management strategies should be considered. Some patients will struggle with this approach. Directly asking patients about the effectiveness of opioids is challenging. Opioid users with chronic pain frequently report problems with opioids even as they describe them as indispensable for pain management.7,8
Earlier studies have assessed patient perspectives regarding opioid difficulties as well as their helpfulness, which could introduce recall bias. Patient-level factors that contribute to a global sense of distress, in addition to the presence of painful physical conditions, also could contribute to patients requesting opioids without experiencing adequate pain relief. One study in veterans residing in PAC facilities found that individuals with depression, posttraumatic stress disorder (PTSD), and SUD were more likely to report pain and receive scheduled analgesics; this effect persisted in individuals with PTSD even after adjusting for demographic and functional status variables.9 The study looked only at analgesics as a class and did not examine opioids specifically. It is possible that distressed individuals, such as those with uncontrolled depression, PTSD, and SUD, might be more likely to report high pain levels and receive opioids with inadequate benefit and increased risk. Identifying the primary condition causing distress and targeting treatment to that condition (ie, depression) is preferable to escalating opioids in an attempt to treat pain in the context of nonresponse. Assessing an individual’s aggregate response to opioids rather than relying on a single self-report is a useful addition to current pain management strategies.
The goal of this study was to pilot a method of identifying opioid-nonresponsive pain using administrative data, measure its prevalence in a PAC population of veterans, and explore clinical and demographic correlates with particular attention to variates that could indicate high levels of psychological and physical distress. Identifying pain that is poorly responsive to opioids would give clinicians the opportunity to avoid or minimize opioid use and prioritize treatments that are likely to improve the resident’s pain, quality of life, and physical function while minimizing recall bias. We hypothesized that pain that responds poorly to opioids would be prevalent among veterans residing in a PAC unit. We considered that veterans with pain poorly responsive to opioids would be more likely to have factors that would place them at increased risk of adverse effects, such as comorbid psychiatric conditions, history of SUD, and multimorbidity, providing further rationale for clinical equipoise in that population.6
Methods
This was a small, retrospective cross-sectional study using administrative data and chart review. The study included veterans who were administered opioids while residing in a single US Department of Veterans Affairs (VA) community living center PAC (CLC-PAC) unit during at least 1 of 4 nonconsecutive, random days in 2016 and 2017. The study was approved by the institutional review board of the Ann Arbor VA Health System (#2017-1034) as part of a larger project involving models of care in vulnerable older veterans.
Inclusion criteria were the presence of at least moderate pain (≥ 4 on a 0 to 10 scale); receiving ≥ 2 opioids ordered as needed over the prespecified 24-hour observation period; and having ≥ 2 pre-and postopioid administration pain scores during the observation period. Veterans who did not meet these criteria were excluded. At the time of initial sample selection, we did not capture information related to coprescribed analgesics, including a standing order of opioids. To obtain the sample, we initially characterized all veterans on the 4 days residing in the CLC-PAC unit as those reporting at least moderate pain (≥ 4) and those who reported no or mild pain (< 4). The cut point of 4 of 10 is consistent with moderate pain based on earlier work showing higher likelihood of pain that interferes with physical function.10 We then restricted the sample to veterans who received ≥ 2 opioids ordered as needed for pain and had ≥ 2 pre- and postopioid administration numeric pain rating scores during the 24-hour observation period. This methodology was chosen to enrich our sample for those who received opioids regularly for ongoing pain. Opioids were defined as full µ-opioid receptor agonists and included hydrocodone, oxycodone, morphine, hydromorphone, fentanyl, tramadol, and methadone.
Medication administration data were obtained from the VA corporate data warehouse, which houses all barcode medication administration data collected at the point of care. The dataset includes pain scores gathered by nursing staff before and after administering an as-needed analgesic. The corporate data warehouse records data/time of pain scores and the analgesic name, dosage, formulation, and date/time of administration. Using a standardized assessment form developed iteratively, we calculated opioid dosage in oral morphine equivalents (OME) for comparison.11,12 All abstracted data were reexamined for accuracy. Data initially were collected in an anonymized, blinded fashion. Participants were then unblinded for chart review. Initial data was captured in resident-days instead of unique residents because an individual resident might have been admitted on several observation days. We were primarily interested in how pain responded to opioids administered in response to resident request; therefore, we did not examine response to opioids that were continuously ordered (ie, scheduled). We did consider scheduled opioids when calculating total daily opioid dosage during the chart review.
Outcome of Interest
The primary outcome of interest was an individual’s response to as-needed opioids, which we defined as change in the pain score after opioid administration. The pre-opioid pain score was the score that immediately preceded administration of an as-needed opioid. The postopioid administration pain score was the first score after opioid administration if obtained within 3 hours of administration. Scores collected > 3 hours after opioid administration were excluded because they no longer accurately reflected the impact of the opioid due to the short half-lives. Observations were excluded if an opioid was administered without a recorded pain score; this occurred once for 6 individuals. Observations also were excluded if an opioid was administered but the data were captured on the following day (outside of the 24-hour window); this occurred once for 3 individuals.
We calculated a ∆ score by subtracting the postopioid pain rating score from the pre-opioid score. Individual ∆ scores were then averaged over the 24-hour period (range, 2-5 opioid doses). For example, if an individual reported a pre-opioid pain score of 10, and a postopioid pain score of 2, the ∆ was recorded as 8. If the individual’s next pre-opioid score was 10, and post-opioid score was 6, the ∆ was recorded as 4. ∆ scores over the 24-hour period were averaged together to determine that individual’s response to as-needed opioids. In the previous example, the mean ∆ score is 6. Lower mean ∆ scores reflect decreased responsiveness to opioids’ analgesic effect.
Demographic and clinical data were obtained from electronic health record review using a standardized assessment form. These data included information about medical and psychiatric comorbidities, specialist consultations, and CLC-PAC unit admission indications and diagnoses. Medications of interest were categorized as antidepressants, antipsychotics, benzodiazepines, muscle relaxants, hypnotics, stimulants, antiepileptic drugs/mood stabilizers (including gabapentin and pregabalin), and all adjuvant analgesics. Adjuvant analgesics were defined as medications administered for pain as documented by chart notes or those ordered as needed for pain, and analyzed as a composite variable. Antidepressants with analgesic properties (serotonin-norepinephrine reuptake inhibitors and tricyclic antidepressants) were considered adjuvant analgesics. Psychiatric information collected included presence of mood, anxiety, and psychotic disorders, and PTSD. SUD information was collected separately from other psychiatric disorders.
Analyses
The study population was described using tabulations for categorical data and means and standard deviations for continuous data. Responsiveness to opioids was analyzed as a continuous variable. Those with higher mean ∆ scores were considered to have pain relatively more responsive to opioids, while lower mean ∆ scores indicated pain less responsive to opioids. We constructed linear regression models controlling for average pre-opioid pain rating scores to explore associations between opioid responsiveness and variables of interest. All analyses were completed using Stata version 15. This study was not adequately powered to detect differences across the spectrum of opioid responsiveness, although the authors have reported differences in this article.
Results
Over the 4-day observational period there were 146 resident-days. Of these, 88 (60.3%) reported at least 1 pain score of ≥ 4. Of those, 61 (41.8%) received ≥ 1 as-needed opioid for pain. We identified 46 resident-days meeting study criteria of ≥ 2 pre- and postanalgesic scores. We identified 41 unique individuals (Figure 1). Two individuals were admitted to the CLC-PAC unit on 2 of the 4 observation days, and 1 individual was admitted to the CLC-PAC unit on 3 of the 4 observation days. For individuals admitted several days, we included data only from the initial observation day.
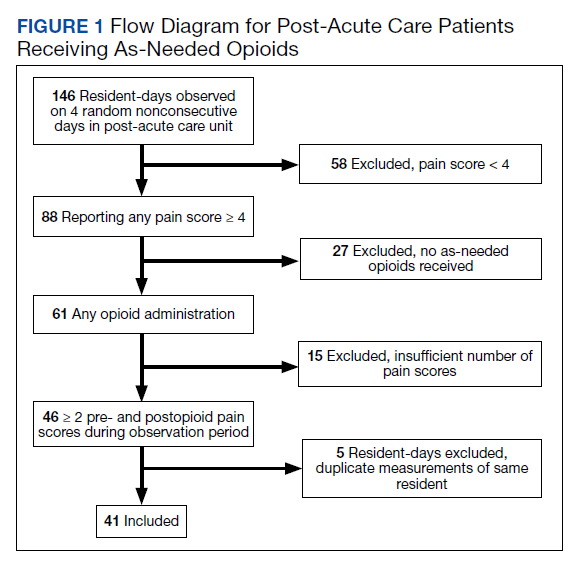
Response to opioids varied greatly in this sample. The mean (SD) ∆ pain score was 3.4 (1.6) and ranged from 0.5 to 6.3. Using linear regression, we found no relationship between admission indication, medical comorbidities (including active cancer), and opioid responsiveness (Table).
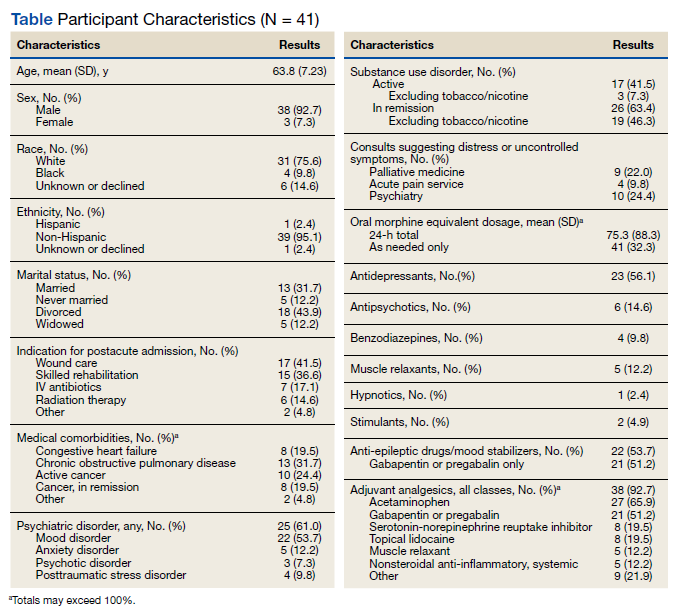
Psychiatric disorders were highly prevalent, with 25 individuals (61.0%) having ≥ 1 any psychiatric diagnosis identified on chart review. The presence of any psychiatric diagnosis was significantly associated with reduced responsiveness to opioids (β = −1.08; 95% CI, −2.04 to −0.13; P = .03). SUDs also were common, with 17 individuals (41.5%) having an active SUD; most were tobacco/nicotine. Twenty-six veterans (63.4%) had documentation of SUD in remission with 19 (46.3%) for substances other than tobacco/nicotine. There was no indication that any veteran in the sample was prescribed medication for opioid use disorder (OUD) at the time of observation. There was no relationship between opioid responsiveness and SUDs, neither active or in remission. Consults to other services that suggested distress or difficult-to-control symptoms also were frequent. Consults to the pain service were significantly associated with reduced responsiveness to opioids (β = −1.75; 95% CI, −3.33 to −0.17; P = .03). Association between psychiatry consultation and reduced opioid responsiveness trended toward significance (β = −0.95; 95% CI, −2.06 to 0.17; P = .09) (Figures 2 and 3). There was no significant association with palliative medicine consultation and opioid responsiveness.
A poorer response to opioids was associated with a significantly higher as-needed opioid dosage (β = −0.02; 95% CI, −0.04 to −0.01; P = .002) as well as a trend toward higher total opioid dosage (β = −0.005; 95% CI, −0.01 to 0.0003; P = .06) (Figure 4). Thirty-eight (92.7%) participants received nonopioid adjuvant analgesics for pain. More than half (56.1%) received antidepressants or gabapentinoids (51.2%), although we did not assess whether they were prescribed for pain or another indication. We did not identify a relationship between any specific psychoactive drug class and opioid responsiveness in this sample.
Discussion
This exploratory study used readily available administrative data in a CLC-PAC unit to assess responsiveness to opioids via a numeric mean ∆ score, with higher values indicating more pain relief in response to opioids. We then constructed linear regression models to characterize the relationship between the mean ∆ score and factors known to be associated with difficult-to-control pain and psychosocial distress. As expected, opioid responsiveness was highly variable among residents; some residents experienced essentially no reduction in pain, on average, despite receiving opioids. Psychiatric comorbidity, higher dosage in OMEs, and the presence of a pain service consult significantly correlated with poorer response to opioids. To our knowledge, this is the first study to quantify opioid responsiveness and describe the relationship with clinical correlates in the understudied PAC population.
Earlier research has demonstrated a relationship between the presence of psychiatric disorders and increased likelihood of receiving any analgesics among veterans residing in PAC.9 Our study adds to the literature by quantifying opioid response using readily available administrative data and examining associations with psychiatric diagnoses. These findings highlight the possibility that attempting to treat high levels of pain by escalating the opioid dosage in patients with a comorbid psychiatric diagnosis should be re-addressed, particularly if there is no meaningful pain reduction at lower opioid dosages. Our sample had a variety of admission diagnoses and medical comorbidities, however, we did not identify a relationship with opioid responsiveness, including an active cancer diagnosis. Although SUDs were highly prevalent in our sample, there was no relationship with opioid responsiveness. This suggests that lack of response to opioids is not merely a matter of drug tolerance or an indication of drug-seeking behavior.
Factors Impacting Response
Many factors could affect whether an individual obtains an adequate analgesic response to opioids or other pain medications, including variations in genes encoding opioid receptors and hepatic enzymes involved in drug metabolism and an individual’s opioid exposure history.13 The phenomenon of requiring more drug to produce the same relief after repeated exposures (ie, tolerance) is well known.14 Opioid-induced hyperalgesia is a phenomenon whereby a patient’s overall pain increases while receiving opioids, but each opioid dose might be perceived as beneficial.15 Increasingly, psychosocial distress is an important factor in opioid response. Adverse selection is the process culminating in those with psychosocial distress and/or SUDs being prescribed more opioids for longer durations.16 Our data suggests that this process could play a role in PAC settings. In addition, exaggerating pain to obtain additional opioids for nonmedical purposes, such as euphoria or relaxation, also is possible.17
When clinically assessing an individual whose pain is not well controlled despite escalating opioid dosages, prescribers must consider which of these factors likely is predominant. However, the first step of determining who has a poor opioid response is not straightforward. Directly asking patients is challenging; many individuals perceive opioids to be helpful while simultaneously reporting inadequately controlled pain.7,8 The primary value of this study is the possibility of providing prescribers a quick, simple method of assessing a patient’s response to opioids. Using this method, individuals who are responding poorly to opioids, including those who might exaggerate pain for secondary gain, could be identified. Health care professionals could consider revisiting pain management strategies, assess for the presence of OUD, or evaluate other contributors to inadequately controlled pain. Although we only collected data regarding response to opioids in this study, any pain medication administered as needed (ie, nonsteroidal anti-inflammatory drugs, acetaminophen) could be analyzed using this methodology, allowing identification of other helpful pain management strategies. We began the validation process with extensive chart review, but further validation is required before this method can be applied to routine clinical practice.
Patients who report uncontrolled pain despite receiving opioids are a clinically challenging population. The traditional strategy has been to escalate opioids, which is recommended by the World Health Organization stepladder approach for patients with cancer pain and limited life expectancy.18 Applying this approach to a general population of patients with chronic pain is ineffective and dangerous.19 The CDC and the VA/US Department of Defense (VA/DoD) guidelines both recommend carefully reassessing risks and benefits at total daily dosages > 50 OME and avoid increasing dosages to > 90 OME daily in most circumstances.5,20 Our finding that participants taking higher dosages of opioids were not more likely to have better control over their pain supports this recommendation.
Limitations
This study has several limitations, the most significant is its small sample size because of the exploratory nature of the project. Results are based on a small pilot sample enriched to include individuals with at least moderate pain who receive opioids frequently at 1 VA CLC-PAC unit; therefore, the results might not be representative of all veterans or a more general population. Our small sample size limits power to detect small differences. Data collected should be used to inform formal power calculations before subsequent larger studies to select adequate sample size. Validation studies, including samples from the same population using different dates, which reproduce findings are an important step. Moreover, we only had data on a single dimension of pain (intensity/severity), as measured by the pain scale, which nursing staff used to make a real-time clinical decision of whether to administer an as-needed opioid. Future studies should consider using pain measures that provide multidimensional assessment (ie, severity, functional interference) and/or were developed specifically for veterans, such as the Defense and Veterans Pain Rating Scale.21
Our study was cross-sectional in nature and addressed a single 24-hour period of data per participant. The years of data collection (2016 and 2017) followed a decline in overall opioid prescribing that has continued, likely influenced by CDC and VA/DoD guidelines.22 It is unclear whether our observations are an accurate reflection of individuals’ response over time or whether prescribing practices in PAC have shifted.
We did not consider the type of pain being treated or explore clinicians’ reasons for prescribing opioids, therefore limiting our ability to know whether opioids were indicated. Information regarding OUD and other SUDs was limited to what was documented in the chart during the CLC-PAC unit admission. We did not have information on length of exposure to opioids. It is possible that opioid tolerance could play a role in reducing opioid responsiveness. However, simple tolerance would not be expected to explain robust correlations with psychiatric comorbidities. Also, simple tolerance would be expected to be overcome with higher opioid dosages, whereas our study demonstrates less responsiveness. These data suggests that some individuals’ pain might be poorly opioid responsive, and psychiatric factors could increase this risk. We used a novel data source in combination with chart review; to our knowledge, barcode medication administration data have not been used in this manner previously. Future work needs to validate this method, using larger sample sizes and several clinical sites. Finally, we used regression models that controlled for average pre-opioid pain rating scores, which is only 1 covariate important for examining effects. Larger studies with adequate power should control for multiple covariates known to be associated with pain and opioid response.
Conclusions
Opioid responsiveness is important clinically yet challenging to assess. This pilot study identifies a way of classifying pain as relatively opioid nonresponsive using administrative data but requires further validation before considering scaling for more general use. The possibility that a substantial percentage of residents in a CLC-PAC unit could be receiving increasing dosages of opioids without adequate benefit justifies the need for more research and underscores the need for prescribers to assess individuals frequently for ongoing benefit of opioids regardless of diagnosis or mechanism of pain.
Acknowledgments
The authors thank Andrzej Galecki, Corey Powell, and the University of Michigan Consulting for Statistics, Computing and Analytics Research Center for assistance with statistical analysis.
1. Marshall TL, Reinhardt JP. Pain management in the last 6 months of life: predictors of opioid and non-opioid use. J Am Med Dir Assoc. 2019;20(6):789-790. doi:10.1016/j.jamda.2019.02.026
2. Tait RC, Chibnall JT. Pain in older subacute care patients: associations with clinical status and treatment. Pain Med. 2002;3(3):231-239. doi:10.1046/j.1526-4637.2002.02031.x
3. Pimentel CB, Briesacher BA, Gurwitz JH, Rosen AB, Pimentel MT, Lapane KL. Pain management in nursing home residents with cancer. J Am Geriatr Soc. 2015;63(4):633-641. doi:10.1111/jgs.13345
4. Hunnicutt JN, Tjia J, Lapane KL. Hospice use and pain management in elderly nursing home residents with cancer. J Pain Symptom Manage. 2017;53(3):561-570. doi:10.1016/j.jpainsymman.2016.10.369
5. Dowell D, Haegerich TM, Chou R. CDC guideline for prescribing opioids for chronic pain — United States, 2016. MMWR Recomm Rep. 2016;65(No. RR-1):1-49. doi:10.15585/mmwr.rr6501e1
6. Oliva EM, Bowe T, Tavakoli S, et al. Development and applications of the Veterans Health Administration’s Stratification Tool for Opioid Risk Mitigation (STORM) to improve opioid safety and prevent overdose and suicide. Psychol Serv. 2017;14(1):34-49. doi:10.1037/ser0000099
7. Goesling J, Moser SE, Lin LA, Hassett AL, Wasserman RA, Brummett CM. Discrepancies between perceived benefit of opioids and self-reported patient outcomes. Pain Med. 2018;19(2):297-306. doi:10.1093/pm/pnw263
8. Sullivan M, Von Korff M, Banta-Green C. Problems and concerns of patients receiving chronic opioid therapy for chronic non-cancer pain. Pain. 2010;149(2):345-353. doi:10.1016/j.pain.2010.02.037
9. Brennan PL, Greenbaum MA, Lemke S, Schutte KK. Mental health disorder, pain, and pain treatment among long-term care residents: evidence from the Minimum Data Set 3.0. Aging Ment Health. 2019;23(9):1146-1155. doi:10.1080/13607863.2018.1481922
10. Woo A, Lechner B, Fu T, et al. Cut points for mild, moderate, and severe pain among cancer and non-cancer patients: a literature review. Ann Palliat Med. 2015;4(4):176-183. doi:10.3978/j.issn.2224-5820.2015.09.04
11. Centers for Disease Control and Prevention. Calculating total daily dose of opioids for safer dosage. 2017. Accessed December 15, 2021. https://www.cdc.gov/drugoverdose/pdf/calculating_total_daily_dose-a.pdf
12. Nielsen S, Degenhardt L, Hoban B, Gisev N. Comparing opioids: a guide to estimating oral morphine equivalents (OME) in research. NDARC Technical Report No. 329. National Drug and Alcohol Research Centre; 2014. Accessed December 15, 2021. http://www.drugsandalcohol.ie/22703/1/NDARC Comparing opioids.pdf
13. Smith HS. Variations in opioid responsiveness. Pain Physician. 2008;11(2):237-248.
14. Collin E, Cesselin F. Neurobiological mechanisms of opioid tolerance and dependence. Clin Neuropharmacol. 1991;14(6):465-488. doi:10.1097/00002826-199112000-00001
15. Higgins C, Smith BH, Matthews K. Evidence of opioid-induced hyperalgesia in clinical populations after chronic opioid exposure: a systematic review and meta-analysis. Br J Anaesth. 2019;122(6):e114-e126. doi:10.1016/j.bja.2018.09.019
16. Howe CQ, Sullivan MD. The missing ‘P’ in pain management: how the current opioid epidemic highlights the need for psychiatric services in chronic pain care. Gen Hosp Psychiatry. 2014;36(1):99-104. doi:10.1016/j.genhosppsych.2013.10.003
17. Substance Abuse and Mental Health Services Administration. Key substance use and mental health indicators in the United States: results from the 2018 National Survey on Drug Use and Health. HHS Publ No PEP19-5068, NSDUH Ser H-54. 2019;170:51-58. Accessed December 15, 2021. https://www.samhsa.gov/data/sites/default/files/cbhsq-reports/NSDUHNationalFindingsReport2018/NSDUHNationalFindingsReport2018.pdf
18. World Health Organization. WHO’s cancer pain ladder for adults. Accessed September 21, 2018. www.who.int/ncds/management/palliative-care/Infographic-cancer-pain-lowres.pdf
19. Ballantyne JC, Kalso E, Stannard C. WHO analgesic ladder: a good concept gone astray. BMJ. 2016;352:i20. doi:10.1136/bmj.i20
20. The Opioid Therapy for Chronic Pain Work Group. VA/DoD clinical practice guideline for opioid therapy for chronic pain. US Dept of Veterans Affairs and Dept of Defense; 2017. Accessed December 15, 2021. https://www.healthquality.va.gov/guidelines/Pain/cot/VADoDOTCPG022717.pdf
21. Defense & Veterans Pain Rating Scale (DVPRS). Defense & Veterans Center for Integrative Pain Management. Accessed July 21, 2021. https://www.dvcipm.org/clinical-resources/defense-veterans-pain-rating-scale-dvprs/
22. Guy GP Jr, Zhang K, Bohm MK, et al. Vital signs: changes in opioid prescribing in the United States, 2006–2015. MMWR Morb Mortal Wkly Rep. 2017;66(26):697-704. doi:10.15585/mmwr.mm6626a4
Older adults admitted to post-acute settings frequently have complex rehabilitation needs and multimorbidity, which predisposes them to pain management challenges.1,2 The prevalence of pain in post-acute and long-term care is as high as 65%, and opioid use is common among this population with 1 in 7 residents receiving long-term opioids.3,4
Opioids that do not adequately control pain represent a missed opportunity for deprescribing. There is limited evidence regarding efficacy of long-term opioid use (> 90 days) for improving pain and physical functioning.5 In addition, long-term opioid use carries significant risks, including overdose-related death, dependence, and increased emergency department visits.5 These risks are likely to be pronounced among veterans receiving post-acute care (PAC) who are older, have comorbid psychiatric disorders, are prescribed several centrally acting medications, and experience substance use disorder (SUD).6
Older adults are at increased risk for opioid toxicity because of reduced drug clearance and smaller therapeutic window.5 Centers for Disease Control and Prevention (CDC) guidelines recommend frequently assessing patients for benefit in terms of sustained improvement in pain as well as physical function.5 If pain and functional improvements are minimal, opioid use and nonopioid pain management strategies should be considered. Some patients will struggle with this approach. Directly asking patients about the effectiveness of opioids is challenging. Opioid users with chronic pain frequently report problems with opioids even as they describe them as indispensable for pain management.7,8
Earlier studies have assessed patient perspectives regarding opioid difficulties as well as their helpfulness, which could introduce recall bias. Patient-level factors that contribute to a global sense of distress, in addition to the presence of painful physical conditions, also could contribute to patients requesting opioids without experiencing adequate pain relief. One study in veterans residing in PAC facilities found that individuals with depression, posttraumatic stress disorder (PTSD), and SUD were more likely to report pain and receive scheduled analgesics; this effect persisted in individuals with PTSD even after adjusting for demographic and functional status variables.9 The study looked only at analgesics as a class and did not examine opioids specifically. It is possible that distressed individuals, such as those with uncontrolled depression, PTSD, and SUD, might be more likely to report high pain levels and receive opioids with inadequate benefit and increased risk. Identifying the primary condition causing distress and targeting treatment to that condition (ie, depression) is preferable to escalating opioids in an attempt to treat pain in the context of nonresponse. Assessing an individual’s aggregate response to opioids rather than relying on a single self-report is a useful addition to current pain management strategies.
The goal of this study was to pilot a method of identifying opioid-nonresponsive pain using administrative data, measure its prevalence in a PAC population of veterans, and explore clinical and demographic correlates with particular attention to variates that could indicate high levels of psychological and physical distress. Identifying pain that is poorly responsive to opioids would give clinicians the opportunity to avoid or minimize opioid use and prioritize treatments that are likely to improve the resident’s pain, quality of life, and physical function while minimizing recall bias. We hypothesized that pain that responds poorly to opioids would be prevalent among veterans residing in a PAC unit. We considered that veterans with pain poorly responsive to opioids would be more likely to have factors that would place them at increased risk of adverse effects, such as comorbid psychiatric conditions, history of SUD, and multimorbidity, providing further rationale for clinical equipoise in that population.6
Methods
This was a small, retrospective cross-sectional study using administrative data and chart review. The study included veterans who were administered opioids while residing in a single US Department of Veterans Affairs (VA) community living center PAC (CLC-PAC) unit during at least 1 of 4 nonconsecutive, random days in 2016 and 2017. The study was approved by the institutional review board of the Ann Arbor VA Health System (#2017-1034) as part of a larger project involving models of care in vulnerable older veterans.
Inclusion criteria were the presence of at least moderate pain (≥ 4 on a 0 to 10 scale); receiving ≥ 2 opioids ordered as needed over the prespecified 24-hour observation period; and having ≥ 2 pre-and postopioid administration pain scores during the observation period. Veterans who did not meet these criteria were excluded. At the time of initial sample selection, we did not capture information related to coprescribed analgesics, including a standing order of opioids. To obtain the sample, we initially characterized all veterans on the 4 days residing in the CLC-PAC unit as those reporting at least moderate pain (≥ 4) and those who reported no or mild pain (< 4). The cut point of 4 of 10 is consistent with moderate pain based on earlier work showing higher likelihood of pain that interferes with physical function.10 We then restricted the sample to veterans who received ≥ 2 opioids ordered as needed for pain and had ≥ 2 pre- and postopioid administration numeric pain rating scores during the 24-hour observation period. This methodology was chosen to enrich our sample for those who received opioids regularly for ongoing pain. Opioids were defined as full µ-opioid receptor agonists and included hydrocodone, oxycodone, morphine, hydromorphone, fentanyl, tramadol, and methadone.
Medication administration data were obtained from the VA corporate data warehouse, which houses all barcode medication administration data collected at the point of care. The dataset includes pain scores gathered by nursing staff before and after administering an as-needed analgesic. The corporate data warehouse records data/time of pain scores and the analgesic name, dosage, formulation, and date/time of administration. Using a standardized assessment form developed iteratively, we calculated opioid dosage in oral morphine equivalents (OME) for comparison.11,12 All abstracted data were reexamined for accuracy. Data initially were collected in an anonymized, blinded fashion. Participants were then unblinded for chart review. Initial data was captured in resident-days instead of unique residents because an individual resident might have been admitted on several observation days. We were primarily interested in how pain responded to opioids administered in response to resident request; therefore, we did not examine response to opioids that were continuously ordered (ie, scheduled). We did consider scheduled opioids when calculating total daily opioid dosage during the chart review.
Outcome of Interest
The primary outcome of interest was an individual’s response to as-needed opioids, which we defined as change in the pain score after opioid administration. The pre-opioid pain score was the score that immediately preceded administration of an as-needed opioid. The postopioid administration pain score was the first score after opioid administration if obtained within 3 hours of administration. Scores collected > 3 hours after opioid administration were excluded because they no longer accurately reflected the impact of the opioid due to the short half-lives. Observations were excluded if an opioid was administered without a recorded pain score; this occurred once for 6 individuals. Observations also were excluded if an opioid was administered but the data were captured on the following day (outside of the 24-hour window); this occurred once for 3 individuals.
We calculated a ∆ score by subtracting the postopioid pain rating score from the pre-opioid score. Individual ∆ scores were then averaged over the 24-hour period (range, 2-5 opioid doses). For example, if an individual reported a pre-opioid pain score of 10, and a postopioid pain score of 2, the ∆ was recorded as 8. If the individual’s next pre-opioid score was 10, and post-opioid score was 6, the ∆ was recorded as 4. ∆ scores over the 24-hour period were averaged together to determine that individual’s response to as-needed opioids. In the previous example, the mean ∆ score is 6. Lower mean ∆ scores reflect decreased responsiveness to opioids’ analgesic effect.
Demographic and clinical data were obtained from electronic health record review using a standardized assessment form. These data included information about medical and psychiatric comorbidities, specialist consultations, and CLC-PAC unit admission indications and diagnoses. Medications of interest were categorized as antidepressants, antipsychotics, benzodiazepines, muscle relaxants, hypnotics, stimulants, antiepileptic drugs/mood stabilizers (including gabapentin and pregabalin), and all adjuvant analgesics. Adjuvant analgesics were defined as medications administered for pain as documented by chart notes or those ordered as needed for pain, and analyzed as a composite variable. Antidepressants with analgesic properties (serotonin-norepinephrine reuptake inhibitors and tricyclic antidepressants) were considered adjuvant analgesics. Psychiatric information collected included presence of mood, anxiety, and psychotic disorders, and PTSD. SUD information was collected separately from other psychiatric disorders.
Analyses
The study population was described using tabulations for categorical data and means and standard deviations for continuous data. Responsiveness to opioids was analyzed as a continuous variable. Those with higher mean ∆ scores were considered to have pain relatively more responsive to opioids, while lower mean ∆ scores indicated pain less responsive to opioids. We constructed linear regression models controlling for average pre-opioid pain rating scores to explore associations between opioid responsiveness and variables of interest. All analyses were completed using Stata version 15. This study was not adequately powered to detect differences across the spectrum of opioid responsiveness, although the authors have reported differences in this article.
Results
Over the 4-day observational period there were 146 resident-days. Of these, 88 (60.3%) reported at least 1 pain score of ≥ 4. Of those, 61 (41.8%) received ≥ 1 as-needed opioid for pain. We identified 46 resident-days meeting study criteria of ≥ 2 pre- and postanalgesic scores. We identified 41 unique individuals (Figure 1). Two individuals were admitted to the CLC-PAC unit on 2 of the 4 observation days, and 1 individual was admitted to the CLC-PAC unit on 3 of the 4 observation days. For individuals admitted several days, we included data only from the initial observation day.
Response to opioids varied greatly in this sample. The mean (SD) ∆ pain score was 3.4 (1.6) and ranged from 0.5 to 6.3. Using linear regression, we found no relationship between admission indication, medical comorbidities (including active cancer), and opioid responsiveness (Table).
Psychiatric disorders were highly prevalent, with 25 individuals (61.0%) having ≥ 1 any psychiatric diagnosis identified on chart review. The presence of any psychiatric diagnosis was significantly associated with reduced responsiveness to opioids (β = −1.08; 95% CI, −2.04 to −0.13; P = .03). SUDs also were common, with 17 individuals (41.5%) having an active SUD; most were tobacco/nicotine. Twenty-six veterans (63.4%) had documentation of SUD in remission with 19 (46.3%) for substances other than tobacco/nicotine. There was no indication that any veteran in the sample was prescribed medication for opioid use disorder (OUD) at the time of observation. There was no relationship between opioid responsiveness and SUDs, neither active or in remission. Consults to other services that suggested distress or difficult-to-control symptoms also were frequent. Consults to the pain service were significantly associated with reduced responsiveness to opioids (β = −1.75; 95% CI, −3.33 to −0.17; P = .03). Association between psychiatry consultation and reduced opioid responsiveness trended toward significance (β = −0.95; 95% CI, −2.06 to 0.17; P = .09) (Figures 2 and 3). There was no significant association with palliative medicine consultation and opioid responsiveness.
A poorer response to opioids was associated with a significantly higher as-needed opioid dosage (β = −0.02; 95% CI, −0.04 to −0.01; P = .002) as well as a trend toward higher total opioid dosage (β = −0.005; 95% CI, −0.01 to 0.0003; P = .06) (Figure 4). Thirty-eight (92.7%) participants received nonopioid adjuvant analgesics for pain. More than half (56.1%) received antidepressants or gabapentinoids (51.2%), although we did not assess whether they were prescribed for pain or another indication. We did not identify a relationship between any specific psychoactive drug class and opioid responsiveness in this sample.
Discussion
This exploratory study used readily available administrative data in a CLC-PAC unit to assess responsiveness to opioids via a numeric mean ∆ score, with higher values indicating more pain relief in response to opioids. We then constructed linear regression models to characterize the relationship between the mean ∆ score and factors known to be associated with difficult-to-control pain and psychosocial distress. As expected, opioid responsiveness was highly variable among residents; some residents experienced essentially no reduction in pain, on average, despite receiving opioids. Psychiatric comorbidity, higher dosage in OMEs, and the presence of a pain service consult significantly correlated with poorer response to opioids. To our knowledge, this is the first study to quantify opioid responsiveness and describe the relationship with clinical correlates in the understudied PAC population.
Earlier research has demonstrated a relationship between the presence of psychiatric disorders and increased likelihood of receiving any analgesics among veterans residing in PAC.9 Our study adds to the literature by quantifying opioid response using readily available administrative data and examining associations with psychiatric diagnoses. These findings highlight the possibility that attempting to treat high levels of pain by escalating the opioid dosage in patients with a comorbid psychiatric diagnosis should be re-addressed, particularly if there is no meaningful pain reduction at lower opioid dosages. Our sample had a variety of admission diagnoses and medical comorbidities, however, we did not identify a relationship with opioid responsiveness, including an active cancer diagnosis. Although SUDs were highly prevalent in our sample, there was no relationship with opioid responsiveness. This suggests that lack of response to opioids is not merely a matter of drug tolerance or an indication of drug-seeking behavior.
Factors Impacting Response
Many factors could affect whether an individual obtains an adequate analgesic response to opioids or other pain medications, including variations in genes encoding opioid receptors and hepatic enzymes involved in drug metabolism and an individual’s opioid exposure history.13 The phenomenon of requiring more drug to produce the same relief after repeated exposures (ie, tolerance) is well known.14 Opioid-induced hyperalgesia is a phenomenon whereby a patient’s overall pain increases while receiving opioids, but each opioid dose might be perceived as beneficial.15 Increasingly, psychosocial distress is an important factor in opioid response. Adverse selection is the process culminating in those with psychosocial distress and/or SUDs being prescribed more opioids for longer durations.16 Our data suggests that this process could play a role in PAC settings. In addition, exaggerating pain to obtain additional opioids for nonmedical purposes, such as euphoria or relaxation, also is possible.17
When clinically assessing an individual whose pain is not well controlled despite escalating opioid dosages, prescribers must consider which of these factors likely is predominant. However, the first step of determining who has a poor opioid response is not straightforward. Directly asking patients is challenging; many individuals perceive opioids to be helpful while simultaneously reporting inadequately controlled pain.7,8 The primary value of this study is the possibility of providing prescribers a quick, simple method of assessing a patient’s response to opioids. Using this method, individuals who are responding poorly to opioids, including those who might exaggerate pain for secondary gain, could be identified. Health care professionals could consider revisiting pain management strategies, assess for the presence of OUD, or evaluate other contributors to inadequately controlled pain. Although we only collected data regarding response to opioids in this study, any pain medication administered as needed (ie, nonsteroidal anti-inflammatory drugs, acetaminophen) could be analyzed using this methodology, allowing identification of other helpful pain management strategies. We began the validation process with extensive chart review, but further validation is required before this method can be applied to routine clinical practice.
Patients who report uncontrolled pain despite receiving opioids are a clinically challenging population. The traditional strategy has been to escalate opioids, which is recommended by the World Health Organization stepladder approach for patients with cancer pain and limited life expectancy.18 Applying this approach to a general population of patients with chronic pain is ineffective and dangerous.19 The CDC and the VA/US Department of Defense (VA/DoD) guidelines both recommend carefully reassessing risks and benefits at total daily dosages > 50 OME and avoid increasing dosages to > 90 OME daily in most circumstances.5,20 Our finding that participants taking higher dosages of opioids were not more likely to have better control over their pain supports this recommendation.
Limitations
This study has several limitations, the most significant is its small sample size because of the exploratory nature of the project. Results are based on a small pilot sample enriched to include individuals with at least moderate pain who receive opioids frequently at 1 VA CLC-PAC unit; therefore, the results might not be representative of all veterans or a more general population. Our small sample size limits power to detect small differences. Data collected should be used to inform formal power calculations before subsequent larger studies to select adequate sample size. Validation studies, including samples from the same population using different dates, which reproduce findings are an important step. Moreover, we only had data on a single dimension of pain (intensity/severity), as measured by the pain scale, which nursing staff used to make a real-time clinical decision of whether to administer an as-needed opioid. Future studies should consider using pain measures that provide multidimensional assessment (ie, severity, functional interference) and/or were developed specifically for veterans, such as the Defense and Veterans Pain Rating Scale.21
Our study was cross-sectional in nature and addressed a single 24-hour period of data per participant. The years of data collection (2016 and 2017) followed a decline in overall opioid prescribing that has continued, likely influenced by CDC and VA/DoD guidelines.22 It is unclear whether our observations are an accurate reflection of individuals’ response over time or whether prescribing practices in PAC have shifted.
We did not consider the type of pain being treated or explore clinicians’ reasons for prescribing opioids, therefore limiting our ability to know whether opioids were indicated. Information regarding OUD and other SUDs was limited to what was documented in the chart during the CLC-PAC unit admission. We did not have information on length of exposure to opioids. It is possible that opioid tolerance could play a role in reducing opioid responsiveness. However, simple tolerance would not be expected to explain robust correlations with psychiatric comorbidities. Also, simple tolerance would be expected to be overcome with higher opioid dosages, whereas our study demonstrates less responsiveness. These data suggests that some individuals’ pain might be poorly opioid responsive, and psychiatric factors could increase this risk. We used a novel data source in combination with chart review; to our knowledge, barcode medication administration data have not been used in this manner previously. Future work needs to validate this method, using larger sample sizes and several clinical sites. Finally, we used regression models that controlled for average pre-opioid pain rating scores, which is only 1 covariate important for examining effects. Larger studies with adequate power should control for multiple covariates known to be associated with pain and opioid response.
Conclusions
Opioid responsiveness is important clinically yet challenging to assess. This pilot study identifies a way of classifying pain as relatively opioid nonresponsive using administrative data but requires further validation before considering scaling for more general use. The possibility that a substantial percentage of residents in a CLC-PAC unit could be receiving increasing dosages of opioids without adequate benefit justifies the need for more research and underscores the need for prescribers to assess individuals frequently for ongoing benefit of opioids regardless of diagnosis or mechanism of pain.
Acknowledgments
The authors thank Andrzej Galecki, Corey Powell, and the University of Michigan Consulting for Statistics, Computing and Analytics Research Center for assistance with statistical analysis.
1. Marshall TL, Reinhardt JP. Pain management in the last 6 months of life: predictors of opioid and non-opioid use. J Am Med Dir Assoc. 2019;20(6):789-790. doi:10.1016/j.jamda.2019.02.026
2. Tait RC, Chibnall JT. Pain in older subacute care patients: associations with clinical status and treatment. Pain Med. 2002;3(3):231-239. doi:10.1046/j.1526-4637.2002.02031.x
3. Pimentel CB, Briesacher BA, Gurwitz JH, Rosen AB, Pimentel MT, Lapane KL. Pain management in nursing home residents with cancer. J Am Geriatr Soc. 2015;63(4):633-641. doi:10.1111/jgs.13345
4. Hunnicutt JN, Tjia J, Lapane KL. Hospice use and pain management in elderly nursing home residents with cancer. J Pain Symptom Manage. 2017;53(3):561-570. doi:10.1016/j.jpainsymman.2016.10.369
5. Dowell D, Haegerich TM, Chou R. CDC guideline for prescribing opioids for chronic pain — United States, 2016. MMWR Recomm Rep. 2016;65(No. RR-1):1-49. doi:10.15585/mmwr.rr6501e1
6. Oliva EM, Bowe T, Tavakoli S, et al. Development and applications of the Veterans Health Administration’s Stratification Tool for Opioid Risk Mitigation (STORM) to improve opioid safety and prevent overdose and suicide. Psychol Serv. 2017;14(1):34-49. doi:10.1037/ser0000099
7. Goesling J, Moser SE, Lin LA, Hassett AL, Wasserman RA, Brummett CM. Discrepancies between perceived benefit of opioids and self-reported patient outcomes. Pain Med. 2018;19(2):297-306. doi:10.1093/pm/pnw263
8. Sullivan M, Von Korff M, Banta-Green C. Problems and concerns of patients receiving chronic opioid therapy for chronic non-cancer pain. Pain. 2010;149(2):345-353. doi:10.1016/j.pain.2010.02.037
9. Brennan PL, Greenbaum MA, Lemke S, Schutte KK. Mental health disorder, pain, and pain treatment among long-term care residents: evidence from the Minimum Data Set 3.0. Aging Ment Health. 2019;23(9):1146-1155. doi:10.1080/13607863.2018.1481922
10. Woo A, Lechner B, Fu T, et al. Cut points for mild, moderate, and severe pain among cancer and non-cancer patients: a literature review. Ann Palliat Med. 2015;4(4):176-183. doi:10.3978/j.issn.2224-5820.2015.09.04
11. Centers for Disease Control and Prevention. Calculating total daily dose of opioids for safer dosage. 2017. Accessed December 15, 2021. https://www.cdc.gov/drugoverdose/pdf/calculating_total_daily_dose-a.pdf
12. Nielsen S, Degenhardt L, Hoban B, Gisev N. Comparing opioids: a guide to estimating oral morphine equivalents (OME) in research. NDARC Technical Report No. 329. National Drug and Alcohol Research Centre; 2014. Accessed December 15, 2021. http://www.drugsandalcohol.ie/22703/1/NDARC Comparing opioids.pdf
13. Smith HS. Variations in opioid responsiveness. Pain Physician. 2008;11(2):237-248.
14. Collin E, Cesselin F. Neurobiological mechanisms of opioid tolerance and dependence. Clin Neuropharmacol. 1991;14(6):465-488. doi:10.1097/00002826-199112000-00001
15. Higgins C, Smith BH, Matthews K. Evidence of opioid-induced hyperalgesia in clinical populations after chronic opioid exposure: a systematic review and meta-analysis. Br J Anaesth. 2019;122(6):e114-e126. doi:10.1016/j.bja.2018.09.019
16. Howe CQ, Sullivan MD. The missing ‘P’ in pain management: how the current opioid epidemic highlights the need for psychiatric services in chronic pain care. Gen Hosp Psychiatry. 2014;36(1):99-104. doi:10.1016/j.genhosppsych.2013.10.003
17. Substance Abuse and Mental Health Services Administration. Key substance use and mental health indicators in the United States: results from the 2018 National Survey on Drug Use and Health. HHS Publ No PEP19-5068, NSDUH Ser H-54. 2019;170:51-58. Accessed December 15, 2021. https://www.samhsa.gov/data/sites/default/files/cbhsq-reports/NSDUHNationalFindingsReport2018/NSDUHNationalFindingsReport2018.pdf
18. World Health Organization. WHO’s cancer pain ladder for adults. Accessed September 21, 2018. www.who.int/ncds/management/palliative-care/Infographic-cancer-pain-lowres.pdf
19. Ballantyne JC, Kalso E, Stannard C. WHO analgesic ladder: a good concept gone astray. BMJ. 2016;352:i20. doi:10.1136/bmj.i20
20. The Opioid Therapy for Chronic Pain Work Group. VA/DoD clinical practice guideline for opioid therapy for chronic pain. US Dept of Veterans Affairs and Dept of Defense; 2017. Accessed December 15, 2021. https://www.healthquality.va.gov/guidelines/Pain/cot/VADoDOTCPG022717.pdf
21. Defense & Veterans Pain Rating Scale (DVPRS). Defense & Veterans Center for Integrative Pain Management. Accessed July 21, 2021. https://www.dvcipm.org/clinical-resources/defense-veterans-pain-rating-scale-dvprs/
22. Guy GP Jr, Zhang K, Bohm MK, et al. Vital signs: changes in opioid prescribing in the United States, 2006–2015. MMWR Morb Mortal Wkly Rep. 2017;66(26):697-704. doi:10.15585/mmwr.mm6626a4
Morphology of Mycosis Fungoides and Sézary Syndrome in Skin of Color
Mycosis fungoides (MF) and Sézary syndrome (SS) are non-Hodgkin T-cell lymphomas that make up the majority of cutaneous T-cell lymphomas. These conditions commonly affect Black patients, with an incidence rate of 12.6 cases of cutaneous T-cell lymphomas per million individuals vs 9.8 per million individuals in non–skin of color (SoC) patients.1 However, educational resources tend to focus on the clinical manifestations of MF/SS in lighter skin types, describing MF as erythematous patches, plaques, or tumors presenting in non–sun-exposed areas of the skin and SS as generalized erythroderma.2 Skin of color, comprised of Fitzpatrick skin types (FSTs) IV to VI,3 is poorly represented across dermatology textbooks,4,5 medical student resources,6 and peer-reviewed publications,7 raising awareness for the need to address this disparity.
Skin of color patients with MF/SS display variable morphologies, including features such as hyperpigmentation and hypopigmentation,8 the latter being exceedingly rare in non-SoC patients.9 Familiarity with these differences among providers is essential to allow for equitable diagnosis and treatment across all skin types, especially in light of data predicting that by 2044 more than 50% of the US population will be people of color.10 Patients with SoC are of many ethnic and racial backgrounds, including Black, Hispanic, American Indian, Pacific Islander, and Asian.11
Along with morphologic differences, there also are several racial disparities in the prognosis and survival of patients with MF/SS. Black patients diagnosed with MF present with greater body surface area affected, and Black women with MF have reduced survival rates compared to their White counterparts.12 Given these racial disparities in survival and representation in educational resources, we aimed to quantify the frequency of various morphologic characteristics of MF/SS in patients with SoC vs non-SoC patients to facilitate better recognition of early MF/SS in SoC patients by medical providers.
Methods
We performed a retrospective chart review following approval from the institutional review board at Northwestern University (Chicago, Illinois). We identified all patients with FSTs IV to VI and biopsy-proven MF/SS who had been clinically photographed in our clinic from January 1998 to December 2019. Only photographs that were high quality enough to review morphologic features were included in our review. Fitzpatrick skin type was determined based on electronic medical record documentation. If photographs were available from multiple visits for the same patient, only those showing posttreatment nonactive lesions were included. Additionally, 36 patients with FSTs I to III (non-SoC) and biopsy-proven MF/SS were included in our review as a comparison with the SoC cohort. The primary outcomes for this study included the presence of scale, erythema, hyperpigmentation, hypopigmentation, violaceous color, lichenification, silver hue, dyschromia, alopecia, poikiloderma, atrophy, and ulceration in active lesions. Dyschromia was defined by the presence of both hypopigmentation and hyperpigmentation. Poikiloderma was defined by hypopigmentation and hyperpigmentation, telangiectasia, and atrophy. Secondary outcomes included evaluation of those same characteristics in posttreatment nonactive lesions. All photographs were independently assessed by 3 authors (M.L.E., C.J.W., J.M.M.), and discrepancies were resolved by further review of the photograph in question and discussion.
Statistical Analysis—Summary statistics were applied to describe demographic and clinical characteristics. The χ2 test was used for categorical variables. Results achieving P<.05 were considered statistically significant.

Results
We reviewed photographs of 111 patients across all skin types (8, FST I; 12, FST II; 16, FST III; 17, FST IV; 44, FST V; 14, FST VI). The cohort was 47% female, and the mean age was 49.7 years (range, 15–86 years). The majority of the cohort had early-stage MF (stage IA or IB). There were more cases of SS in the SoC cohort than the non-SoC cohort (Table). Only 5 photographs had discrepancies and required discussion among the reviewers to achieve consensus.
![Frequency of morphologic features found in skin of color (SoC [Fitzpatrick skin types IV–VI]) vs non-SoC (Fitzpatrick skin types I–III) patients with mycosis fungoides/Sézary syndrome](https://cdn.mdedge.com/files/s3fs-public/Espinosa_1.JPG "Frequency of morphologic features found in skin of color (SoC [Fitzpatrick skin types IV–VI]) vs non-SoC (Fitzpatrick skin types I–III) patients with mycosis fungoides/Sézary syndrome")
Regarding morphologic characteristics in active lesions (Figure 1), scale was present in almost all patients (99% in SoC, 94% in non-SoC). Erythema was present in nearly all non-SoC patients (94%) but only in 69% of SoC patients (P=.003). Poikiloderma also was found to be present at higher frequencies in non-SoC patients compared with SoC patients (19% and 4%, respectively [P=.008]). However, hyperpigmentation (80% vs 39%), lichenification (43% vs 17%), and silver hue (25% vs 3%) were more common in SoC patients than non-SoC patients (P<.05). There were no significant differences in the remaining features, including hypopigmentation (39% vs 25%), dyschromia (24% vs 19%), violaceous color (44% vs 25%), atrophy (11% vs 22%), alopecia (23% vs 31%), and ulceration (16% vs 8%) between SoC and non-SoC patients (P>.05). Photographs of MF in patients with SoC can be seen in Figure 2.
![Representative photographs of mycosis fungoides (MF) in skin of color (Fitzpatrick skin types [FSTs] IV–VI)](https://cdn.mdedge.com/files/s3fs-public/CT109003003_e_Fig2_ABCDE.JPG "Representative photographs of mycosis fungoides (MF) in skin of color (Fitzpatrick skin types [FSTs] IV–VI)")
Posttreatment (nonactive) photographs were available for 26 patients (6 non-SoC, 20 SoC). We found that across all FST groups, hyperpigmentation was more common than hypopigmentation in areas of previously active disease. Statistical analysis was not completed given that few non-SoC photographs were available for comparison.
Comment
This qualitative review demonstrates the heterogeneity of MF/SS in SoC patients and that these conditions do not present in this population with the classic erythematous patches and plaques found in non-SoC patients. We found that hyperpigmentation, lichenification, and silver hue were present at higher rates in patients with FSTs IV to VI compared to those with FSTs I to III, which had higher rates of erythema and poikiloderma. Familiarity with these morphologic features along with increased exposure to clinical photographs of MF/SS in SoC patients will aid in the visual recognition required for this diagnosis, since erythema is harder to identify in darker skin types. Recognizing the unique findings of MF in patients with SoC as well as in patients with lighter skin types will enable earlier diagnosis and treatment of MF/SS across all skin types. If MF is diagnosed and treated early, life expectancy is similar to that of patients without MF.13 However, the 5-year survival rate for advanced-stage MF/SS is 52% across all skin types, and studies have found that Black patients with advanced-stage disease have worse outcomes despite accounting for demographic factors and tumor stage.14,15 Given the worse outcomes in SoC patients with advanced-stage MF/SS, earlier diagnosis could help address this disparity.8,13,14 Similar morphologic features could be used in diagnosing other inflammatory conditions; studies have shown that the lack of recognition of erythema in Black children has led to delayed diagnosis of atopic dermatitis and subsequent inadequate treatment.16,17
The morphologic presentation of MF/SS in SoC patients also can influence an optimal treatment plan for this population. Hypopigmented MF responds better to phototherapy than hyperpigmented MF, as phototherapy has been shown to have decreased efficacy with increasing FST.18 Therefore, for patients with FSTs IV to VI, topical agents such as nitrogen mustard or bexarotene may be more suitable treatment options, as the efficacy of these treatments is independent of skin color.8 However, nitrogen mustard commonly leads to postinflammatory hyperpigmentation, and topical bexarotene may lead to erythema or irritation; therefore, providers must counsel patients on these possible side effects. For refractory disease, adjunct systemic treatments such as oral bexarotene, subcutaneous interferon, methotrexate, or radiation therapy may be considered.8
In addition to aiding in the prompt diagnosis and treatment of MF/SS in SoC patients, our findings may be used to better assess the extent of disease and distinguish between active MF/SS lesions vs xerosis cutis or residual dyschromia from previously treated lesions. It is important to note that these morphologic features must be taken into account with a complete history and work-up. The differential diagnosis of MF/SS includes conditions such as atopic dermatitis, psoriasis, tinea corporis, and drug reactions, which may have similar morphology in SoC.19
Limitations of our study include the single-center design and the use of photographs instead of in-person examination; however, our cutaneous lymphoma clinic serves a diverse patient population, and our 3 reviewers rated the photographs independently. Discussion amongst the reviewers to address discrepancies was only required for 5 photographs, indicating the high inter-reviewer reliability. Additionally, the original purpose of FST was to assess for the propensity of the skin to burn when undergoing phototherapy, not to serve as a marker for skin color. We recommend trainees and clinicians be mindful about the purpose of FST and to use inclusive language (eg, using the terms skin irritation, skin tenderness, or skin becoming darker from the sun instead of tanning) when determining FST in darker-skinned individuals.20 Future directions include examining if certain treatments are associated with prolonged dyschromia.
Conclusion
In our single-institution retrospective study, we found differences in the morphologic presentation of MF/SS in SoC patients vs non-SoC patients. While erythema is a common feature in non-SoC patients, clinical features of hyperpigmentation, lichenification, and silver hue should be carefully evaluated in the diagnosis of MF/SS in SoC patients. Knowledge of the heterogenous presentation of MF/SS in patients with SoC allows for expedited diagnosis and treatment, leading to better clinical outcomes. Valuable resources, including Taylor and Kelly’s Dermatology for Skin of Color, the Skin of Color Society, and VisualDx educate providers on how dermatologic conditions present in darker skin types. However, there is still work to be done to enhance diversity in educational resources in order to provide equitable care to patients of all skin types.
- Korgavkar K, Xiong M, Weinstock M. Changing incidence trends of cutaneous T-cell lymphoma. JAMA Dermatol. 2013;149:1295-1299. doi:10.1001/jamadermatol.2013.5526
- Jawed SI, Myskowski PL, Horwitz S, et al. Primary cutaneous T-cell lymphoma (mycosis fungoides and Sézary syndrome): part I. diagnosis: clinical and histopathologic features and new molecular and biologic markers. J Am Acad Dermatol. 2014;70:205.E1-E16; quiz 221-222. doi:10.1016/j.jaad.2013.07.049
- Tull RZ, Kerby E, Subash JJ, et al. Ethnic skin centers in the United States: where are we in 2020?. J Am Acad Dermatol. 2020;83:1757-1759. doi:10.1016/j.jaad.2020.03.054
- Adelekun A, Onyekaba G, Lipoff JB. Skin color in dermatology textbooks: an updated evaluation and analysis. J Am Acad Dermatol. 2021;84:194-196. doi:10.1016/j.jaad.2020.04.084
- Ebede T, Papier A. Disparities in dermatology educational resources. J Am Acad Dermatol. 2006;55:687-690. doi:10.1016/j.jaad.2005.10.068
- Jones VA, Clark KA, Shobajo MT, et al. Skin of color representation in medical education: an analysis of popular preparatory materials used for United States medical licensing examinations. J Am Acad Dermatol. 2021;85:773-775. doi:10.1016/j.jaad.2020.07.112
- Montgomery SN, Elbuluk N. A quantitative analysis of research publications focused on the top chief complaints in skin of color patients. J Am Acad Dermatol. 2021;85:241-242. doi:10.1016/j.jaad.2020.08.031
- Hinds GA, Heald P. Cutaneous T-cell lymphoma in skin of color. J Am Acad Dermatol. 2009;60:359-375; quiz 376-378. doi:10.1016/j.jaad.2008.10.031
- Ardigó M, Borroni G, Muscardin L, et al. Hypopigmented mycosis fungoides in Caucasian patients: a clinicopathologic study of 7 cases. J Am Acad Dermatol. 2003;49:264-270. doi:10.1067/s0190-9622(03)00907-1
- Colby SL, Ortman JM. Projections of the size and composition of the U.S. population: 2014 to 2060. United States Census Bureau website. Updated October 8, 2021. Accessed February 28, 2022. https://www.census.gov/library/publications/2015/demo/p25-1143.html
- Taylor SC, Kyei A. Defining skin of color. In: Kelly AP, Taylor SC, Lim HW, et al, eds. Taylor and Kelly’s Dermatology for Skin of Color. 2nd ed. McGraw-Hill Education; 2016.
- Huang AH, Kwatra SG, Khanna R, et al. Racial disparities in the clinical presentation and prognosis of patients with mycosis fungoides. J Natl Med Assoc. 2019;111:633-639. doi:10.1016/j.jnma.2019.08.006
- Kim YH, Jensen RA, Watanabe GL, et al. Clinical stage IA (limited patch and plaque) mycosis fungoides. a long-term outcome analysis. Arch Dermatol. 1996;132:1309-1313.
- Scarisbrick JJ, Prince HM, Vermeer MH, et al. Cutaneous lymphoma international consortium study of outcome in advanced stages of mycosis fungoides and Sézary syndrome: effect of specific prognostic markers on survival and development of a prognostic model. J Clin Oncol. 2015;33:3766-3773. doi:10.1200/JCO.2015.61.7142
- Nath SK, Yu JB, Wilson LD. Poorer prognosis of African-American patients with mycosis fungoides: an analysis of the SEER dataset, 1988 to 2008. Clin Lymphoma Myeloma Leuk. 2014;14:419-423. doi:10.1016/j.clml.2013.12.018
- Ben-Gashir MA, Hay RJ. Reliance on erythema scores may mask severe atopic dermatitis in black children compared with their white counterparts. Br J Dermatol. 2002;147:920-925. doi:10.1046/j.1365-2133.2002.04965.x
- Poladian K, De Souza B, McMichael AJ. Atopic dermatitis in adolescents with skin of color. Cutis. 2019;104:164-168.
- Yones SS, Palmer RA, Garibaldinos TT, et al. Randomized double-blind trial of the treatment of chronic plaque psoriasis: efficacy of psoralen-UV-A therapy vs narrowband UV-B therapy. Arch Dermatol. 2006;142:836-842. doi:10.1001/archderm.142.7.836
- Currimbhoy S, Pandya AG. Cutaneous T-cell lymphoma. In: Kelly AP, Taylor SC, Lim HW, et al, eds. Taylor and Kelly’s Dermatology for Skin of Color. 2nd ed. McGraw-Hill Education; 2016.
- Ware OR, Dawson JE, Shinohara MM, et al. Racial limitations of Fitzpatrick skin type. Cutis. 2020;105:77-80.
Mycosis fungoides (MF) and Sézary syndrome (SS) are non-Hodgkin T-cell lymphomas that make up the majority of cutaneous T-cell lymphomas. These conditions commonly affect Black patients, with an incidence rate of 12.6 cases of cutaneous T-cell lymphomas per million individuals vs 9.8 per million individuals in non–skin of color (SoC) patients.1 However, educational resources tend to focus on the clinical manifestations of MF/SS in lighter skin types, describing MF as erythematous patches, plaques, or tumors presenting in non–sun-exposed areas of the skin and SS as generalized erythroderma.2 Skin of color, comprised of Fitzpatrick skin types (FSTs) IV to VI,3 is poorly represented across dermatology textbooks,4,5 medical student resources,6 and peer-reviewed publications,7 raising awareness for the need to address this disparity.
Skin of color patients with MF/SS display variable morphologies, including features such as hyperpigmentation and hypopigmentation,8 the latter being exceedingly rare in non-SoC patients.9 Familiarity with these differences among providers is essential to allow for equitable diagnosis and treatment across all skin types, especially in light of data predicting that by 2044 more than 50% of the US population will be people of color.10 Patients with SoC are of many ethnic and racial backgrounds, including Black, Hispanic, American Indian, Pacific Islander, and Asian.11
Along with morphologic differences, there also are several racial disparities in the prognosis and survival of patients with MF/SS. Black patients diagnosed with MF present with greater body surface area affected, and Black women with MF have reduced survival rates compared to their White counterparts.12 Given these racial disparities in survival and representation in educational resources, we aimed to quantify the frequency of various morphologic characteristics of MF/SS in patients with SoC vs non-SoC patients to facilitate better recognition of early MF/SS in SoC patients by medical providers.
Methods
We performed a retrospective chart review following approval from the institutional review board at Northwestern University (Chicago, Illinois). We identified all patients with FSTs IV to VI and biopsy-proven MF/SS who had been clinically photographed in our clinic from January 1998 to December 2019. Only photographs that were high quality enough to review morphologic features were included in our review. Fitzpatrick skin type was determined based on electronic medical record documentation. If photographs were available from multiple visits for the same patient, only those showing posttreatment nonactive lesions were included. Additionally, 36 patients with FSTs I to III (non-SoC) and biopsy-proven MF/SS were included in our review as a comparison with the SoC cohort. The primary outcomes for this study included the presence of scale, erythema, hyperpigmentation, hypopigmentation, violaceous color, lichenification, silver hue, dyschromia, alopecia, poikiloderma, atrophy, and ulceration in active lesions. Dyschromia was defined by the presence of both hypopigmentation and hyperpigmentation. Poikiloderma was defined by hypopigmentation and hyperpigmentation, telangiectasia, and atrophy. Secondary outcomes included evaluation of those same characteristics in posttreatment nonactive lesions. All photographs were independently assessed by 3 authors (M.L.E., C.J.W., J.M.M.), and discrepancies were resolved by further review of the photograph in question and discussion.
Statistical Analysis—Summary statistics were applied to describe demographic and clinical characteristics. The χ2 test was used for categorical variables. Results achieving P<.05 were considered statistically significant.
Results
We reviewed photographs of 111 patients across all skin types (8, FST I; 12, FST II; 16, FST III; 17, FST IV; 44, FST V; 14, FST VI). The cohort was 47% female, and the mean age was 49.7 years (range, 15–86 years). The majority of the cohort had early-stage MF (stage IA or IB). There were more cases of SS in the SoC cohort than the non-SoC cohort (Table). Only 5 photographs had discrepancies and required discussion among the reviewers to achieve consensus.
Regarding morphologic characteristics in active lesions (Figure 1), scale was present in almost all patients (99% in SoC, 94% in non-SoC). Erythema was present in nearly all non-SoC patients (94%) but only in 69% of SoC patients (P=.003). Poikiloderma also was found to be present at higher frequencies in non-SoC patients compared with SoC patients (19% and 4%, respectively [P=.008]). However, hyperpigmentation (80% vs 39%), lichenification (43% vs 17%), and silver hue (25% vs 3%) were more common in SoC patients than non-SoC patients (P<.05). There were no significant differences in the remaining features, including hypopigmentation (39% vs 25%), dyschromia (24% vs 19%), violaceous color (44% vs 25%), atrophy (11% vs 22%), alopecia (23% vs 31%), and ulceration (16% vs 8%) between SoC and non-SoC patients (P>.05). Photographs of MF in patients with SoC can be seen in Figure 2.
Posttreatment (nonactive) photographs were available for 26 patients (6 non-SoC, 20 SoC). We found that across all FST groups, hyperpigmentation was more common than hypopigmentation in areas of previously active disease. Statistical analysis was not completed given that few non-SoC photographs were available for comparison.
Comment
This qualitative review demonstrates the heterogeneity of MF/SS in SoC patients and that these conditions do not present in this population with the classic erythematous patches and plaques found in non-SoC patients. We found that hyperpigmentation, lichenification, and silver hue were present at higher rates in patients with FSTs IV to VI compared to those with FSTs I to III, which had higher rates of erythema and poikiloderma. Familiarity with these morphologic features along with increased exposure to clinical photographs of MF/SS in SoC patients will aid in the visual recognition required for this diagnosis, since erythema is harder to identify in darker skin types. Recognizing the unique findings of MF in patients with SoC as well as in patients with lighter skin types will enable earlier diagnosis and treatment of MF/SS across all skin types. If MF is diagnosed and treated early, life expectancy is similar to that of patients without MF.13 However, the 5-year survival rate for advanced-stage MF/SS is 52% across all skin types, and studies have found that Black patients with advanced-stage disease have worse outcomes despite accounting for demographic factors and tumor stage.14,15 Given the worse outcomes in SoC patients with advanced-stage MF/SS, earlier diagnosis could help address this disparity.8,13,14 Similar morphologic features could be used in diagnosing other inflammatory conditions; studies have shown that the lack of recognition of erythema in Black children has led to delayed diagnosis of atopic dermatitis and subsequent inadequate treatment.16,17
The morphologic presentation of MF/SS in SoC patients also can influence an optimal treatment plan for this population. Hypopigmented MF responds better to phototherapy than hyperpigmented MF, as phototherapy has been shown to have decreased efficacy with increasing FST.18 Therefore, for patients with FSTs IV to VI, topical agents such as nitrogen mustard or bexarotene may be more suitable treatment options, as the efficacy of these treatments is independent of skin color.8 However, nitrogen mustard commonly leads to postinflammatory hyperpigmentation, and topical bexarotene may lead to erythema or irritation; therefore, providers must counsel patients on these possible side effects. For refractory disease, adjunct systemic treatments such as oral bexarotene, subcutaneous interferon, methotrexate, or radiation therapy may be considered.8
In addition to aiding in the prompt diagnosis and treatment of MF/SS in SoC patients, our findings may be used to better assess the extent of disease and distinguish between active MF/SS lesions vs xerosis cutis or residual dyschromia from previously treated lesions. It is important to note that these morphologic features must be taken into account with a complete history and work-up. The differential diagnosis of MF/SS includes conditions such as atopic dermatitis, psoriasis, tinea corporis, and drug reactions, which may have similar morphology in SoC.19
Limitations of our study include the single-center design and the use of photographs instead of in-person examination; however, our cutaneous lymphoma clinic serves a diverse patient population, and our 3 reviewers rated the photographs independently. Discussion amongst the reviewers to address discrepancies was only required for 5 photographs, indicating the high inter-reviewer reliability. Additionally, the original purpose of FST was to assess for the propensity of the skin to burn when undergoing phototherapy, not to serve as a marker for skin color. We recommend trainees and clinicians be mindful about the purpose of FST and to use inclusive language (eg, using the terms skin irritation, skin tenderness, or skin becoming darker from the sun instead of tanning) when determining FST in darker-skinned individuals.20 Future directions include examining if certain treatments are associated with prolonged dyschromia.
Conclusion
In our single-institution retrospective study, we found differences in the morphologic presentation of MF/SS in SoC patients vs non-SoC patients. While erythema is a common feature in non-SoC patients, clinical features of hyperpigmentation, lichenification, and silver hue should be carefully evaluated in the diagnosis of MF/SS in SoC patients. Knowledge of the heterogenous presentation of MF/SS in patients with SoC allows for expedited diagnosis and treatment, leading to better clinical outcomes. Valuable resources, including Taylor and Kelly’s Dermatology for Skin of Color, the Skin of Color Society, and VisualDx educate providers on how dermatologic conditions present in darker skin types. However, there is still work to be done to enhance diversity in educational resources in order to provide equitable care to patients of all skin types.
- Korgavkar K, Xiong M, Weinstock M. Changing incidence trends of cutaneous T-cell lymphoma. JAMA Dermatol. 2013;149:1295-1299. doi:10.1001/jamadermatol.2013.5526
- Jawed SI, Myskowski PL, Horwitz S, et al. Primary cutaneous T-cell lymphoma (mycosis fungoides and Sézary syndrome): part I. diagnosis: clinical and histopathologic features and new molecular and biologic markers. J Am Acad Dermatol. 2014;70:205.E1-E16; quiz 221-222. doi:10.1016/j.jaad.2013.07.049
- Tull RZ, Kerby E, Subash JJ, et al. Ethnic skin centers in the United States: where are we in 2020?. J Am Acad Dermatol. 2020;83:1757-1759. doi:10.1016/j.jaad.2020.03.054
- Adelekun A, Onyekaba G, Lipoff JB. Skin color in dermatology textbooks: an updated evaluation and analysis. J Am Acad Dermatol. 2021;84:194-196. doi:10.1016/j.jaad.2020.04.084
- Ebede T, Papier A. Disparities in dermatology educational resources. J Am Acad Dermatol. 2006;55:687-690. doi:10.1016/j.jaad.2005.10.068
- Jones VA, Clark KA, Shobajo MT, et al. Skin of color representation in medical education: an analysis of popular preparatory materials used for United States medical licensing examinations. J Am Acad Dermatol. 2021;85:773-775. doi:10.1016/j.jaad.2020.07.112
- Montgomery SN, Elbuluk N. A quantitative analysis of research publications focused on the top chief complaints in skin of color patients. J Am Acad Dermatol. 2021;85:241-242. doi:10.1016/j.jaad.2020.08.031
- Hinds GA, Heald P. Cutaneous T-cell lymphoma in skin of color. J Am Acad Dermatol. 2009;60:359-375; quiz 376-378. doi:10.1016/j.jaad.2008.10.031
- Ardigó M, Borroni G, Muscardin L, et al. Hypopigmented mycosis fungoides in Caucasian patients: a clinicopathologic study of 7 cases. J Am Acad Dermatol. 2003;49:264-270. doi:10.1067/s0190-9622(03)00907-1
- Colby SL, Ortman JM. Projections of the size and composition of the U.S. population: 2014 to 2060. United States Census Bureau website. Updated October 8, 2021. Accessed February 28, 2022. https://www.census.gov/library/publications/2015/demo/p25-1143.html
- Taylor SC, Kyei A. Defining skin of color. In: Kelly AP, Taylor SC, Lim HW, et al, eds. Taylor and Kelly’s Dermatology for Skin of Color. 2nd ed. McGraw-Hill Education; 2016.
- Huang AH, Kwatra SG, Khanna R, et al. Racial disparities in the clinical presentation and prognosis of patients with mycosis fungoides. J Natl Med Assoc. 2019;111:633-639. doi:10.1016/j.jnma.2019.08.006
- Kim YH, Jensen RA, Watanabe GL, et al. Clinical stage IA (limited patch and plaque) mycosis fungoides. a long-term outcome analysis. Arch Dermatol. 1996;132:1309-1313.
- Scarisbrick JJ, Prince HM, Vermeer MH, et al. Cutaneous lymphoma international consortium study of outcome in advanced stages of mycosis fungoides and Sézary syndrome: effect of specific prognostic markers on survival and development of a prognostic model. J Clin Oncol. 2015;33:3766-3773. doi:10.1200/JCO.2015.61.7142
- Nath SK, Yu JB, Wilson LD. Poorer prognosis of African-American patients with mycosis fungoides: an analysis of the SEER dataset, 1988 to 2008. Clin Lymphoma Myeloma Leuk. 2014;14:419-423. doi:10.1016/j.clml.2013.12.018
- Ben-Gashir MA, Hay RJ. Reliance on erythema scores may mask severe atopic dermatitis in black children compared with their white counterparts. Br J Dermatol. 2002;147:920-925. doi:10.1046/j.1365-2133.2002.04965.x
- Poladian K, De Souza B, McMichael AJ. Atopic dermatitis in adolescents with skin of color. Cutis. 2019;104:164-168.
- Yones SS, Palmer RA, Garibaldinos TT, et al. Randomized double-blind trial of the treatment of chronic plaque psoriasis: efficacy of psoralen-UV-A therapy vs narrowband UV-B therapy. Arch Dermatol. 2006;142:836-842. doi:10.1001/archderm.142.7.836
- Currimbhoy S, Pandya AG. Cutaneous T-cell lymphoma. In: Kelly AP, Taylor SC, Lim HW, et al, eds. Taylor and Kelly’s Dermatology for Skin of Color. 2nd ed. McGraw-Hill Education; 2016.
- Ware OR, Dawson JE, Shinohara MM, et al. Racial limitations of Fitzpatrick skin type. Cutis. 2020;105:77-80.
Practice Points
- Dermatologists should be familiar with the variable morphology of mycosis fungoides (MF)/Sézary syndrome (SS) exhibited by patients of all skin types to ensure prompt diagnosis and treatment.
- Patients with skin of color (SoC)(Fitzpatrick skin types IV–VI) with MF/SS are more likely than non-SoC patients (Fitzpatrick skin types I–III) to present with hyperpigmentation, a silver hue, and lichenification, whereas non-SoC patients commonly present with erythema and poikiloderma.
 who presented with hypopigmented scaly patches on the abdomen")
An Academic Hospitalist–Run Outpatient Paracentesis Clinic
Cirrhosis is the most common cause of ascites in the United States. In patients with compensated cirrhosis, the 10-year probability of developing ascites is 47%. Developing ascites portends a poor prognosis. Fifteen percent of patients who receive this diagnosis die within 1 year, and 44% within 5 years.1 First-line treatment of cirrhotic ascites consists of dietary sodium restriction and diuretic therapy. Refractory ascites is defined as ascites that cannot be easily mobilized despite adhering to a dietary sodium intake of ≤ 2 g daily and daily doses of spironolactone 400 mg and furosemide 160 mg.
Patients who cannot tolerate diuretics because of complications are defined as having diuretic intractable ascites. Diuretic-induced complications include hepatic encephalopathy, renal impairment, hyponatremia, and hypo- or hyperkalemia. Because these patients are either unresponsive to or intolerant of diuretics, second-line treatments, such as regular large-volume paracentesis (LVP) or the insertion of a transjugular intrahepatic portosystemic shunt (TIPS) are needed to manage their ascites. These patients also should be considered for liver transplantation unless there is a contraindication.2
Serial LVP has been shown to be safe and effective in controlling refractory ascites.3 TIPS will decrease the need for repeated LVP in patients with refractory LVP. However, given the uncertainty as to the effect of TIPS creation on survival and the increased risk of encephalopathy, the American Association for the Study of Liver Diseases (AASLD) recommends that TIPS should be used only in those patients who cannot tolerate repeated LVP.4 Repeated LVP also has been shown to be safe and effective in controlling malignant ascites.5,6
LVP can be done in different health care settings. These include the emergency department (ED), interventional radiology suite, inpatient bed, or an outpatient paracentesis clinic. There have been various descriptions of outpatient paracentesis clinics. Reports from the United Kingdom have revealed that paracenteses in these outpatient clinics can be performed safely by nurse practitioners or a liver specialist nurse, that these clinics are highly rated by the patients, and are cost effective.7-10 Gashau and colleagues describe a clinic in Great Britain run by gastroenterology (GI) fellows using an endoscopy suite.11 A nurse practitioner outpatient paracentesis clinic in the US has been described as well.12 Grabau and colleagues present a clinic run by GI endoscopy assistants (licensed practical nurses) using a dedicated paracentesis room in the endoscopy suite.13 Cheng and colleagues describe an outpatient paracentesis clinic in a radiology department run by a single advanced practitioner with assistance from an ultrasound technologist.14 Wang and colleagues present outpatient paracenteses in an outpatient transitional care program by a physician or an advanced practitioner supervised by a physician.15 Sehgal and colleagues describe (in abstract) the creation of a hospitalist-run paracentesis clinic.16
Traditionally, at Veterans Affairs Pittsburgh Healthcare System (VAPHS) in Pennsylvania, if a patient needed LVP, they were admitted to a medicine bed. LVP is not done in the ED, and interventional radiology cannot accommodate the number of patients requiring LVP because of their caseload. The procedure was done by an attending hospitalist or medical residents under the supervision of an attending hospitalist. To improve patient flow and decrease the number of patients using inpatients beds, we created an outpatient paracentesis clinic in 2014. Here, we present the logistics of the clinic, patient demographics, the amount of ascites removed, and the time required to remove the ascites. As part of ongoing quality assurance, we keep track of any complications and report these as well.
Methods
The setting of the outpatient paracentesis clinic is a room in the VAPHS endoscopy suite. The clinic operates 1 half-day per week with up to 3 patients receiving a paracentesis. We use the existing logistics in the endoscopy suite. There are 1 or 2 registered nurses (RNs) who assist the physician performing the paracentesis. The proceduralist is an academic hospitalist who at the time is not on service with residents. The patients are referred to the clinic by the ED, hepatology clinic, palliative care, primary care physicians, or at hospital discharge. In the clinic consult, patients are required to have at least an estimated 3 L of ascites and systolic blood pressure (SBP) ≥ 90. The patients can eat and take medications the morning of the procedure except diuretics. Patients are checked in to the endoscopy suite and a peripheral IV is placed. Blood tests, such as a complete blood count and coagulation studies, are not checked routinely since the AASLD guidelines state that routine prophylactic use of fresh frozen plasma or platelets before paracentesis is not recommended because bleeding is uncommon.3 The proceduralist can order blood work at their discretion.
After the procedure, patients are brought to the recovery area of the endoscopy suite and discharged. The patients are discharged usually within 15 to 30 minutes from arriving in the recovery area after it is assured that the SBP is within 10% of their baseline. Patient follow-up in the outpatient paracentesis clinic is determined by the proceduralist. Most patients need regularly scheduled paracenteses depending on how quickly they reaccumulate ascites. If a patient does not need a regularly scheduled paracentesis, the proceduralist ensures that the appropriate outpatient clinic visit has been scheduled or requested.
Procedure
Informed consent is obtained, and a time-out is performed before each paracentesis. The patient is attached to a cardiac monitor and pulse oximetry as per the endoscopy suite protocol. The proceduralist does a point-of-care ultrasound to find the optimal site and marks the site of puncture. The skin around the marked site is prepared with 3 chlorhexidine gluconate 2%/isopropyl alcohol 70% applicators. A fenestrated drape is used to form a sterile field. The Avanos Paracentesis Kit is routinely used for LVP at VAPHS. Local anesthesia with 1% lidocaine is used with a 25-gauge × 1-inch needle. Deeper anesthesia is obtained with 1% lidocaine, using a 22-gauge × 1.5-inch needle, injecting and aspirating while advancing the needle until ascites is aspirated.
A 15-gauge 3.3-inch Caldwell cannula with an inner needle is inserted into the peritoneal cavity and ascites is aspirated into a syringe. The inner needle is then removed, and the Caldwell cannula is left in the peritoneal cavity and tubing with a roller clamp is attached to the cannula. The tubing is then attached to a 1-L vacuum suction bottle by the RN. We use the CareFusion PleurX drainage bottle. The proceduralist maintains sterility and assures the cannula remains in place. The RN changes the drainage bottles after being filled with 1 L of ascites.
We drain as much ascites as possible until drainage stops on its own. The cannula is then removed, and pressure is held with a gauze pad. An adhesive bandage is then placed over the site. Consistent with AASLD guideline, 25 g of IV albumin 25% is infused for every 3 L of albumin removed provided > 5 L of ascites is removed.3 The albumin is infused during the procedure and not after to limit the time of the procedure. A sample of ascites is sent for cell count with differential and culture.
Results
Between March 2014 and May 2020, 506 paracenteses were performed on 82 patients. The mean age was 66.4 years, and 80 of 82 patients were male. The etiology of the ascites is presented in the Table. Twelve percent of the patients had concomitant hepatocellular carcinoma. Data on the amount of ascites removed were available for all patients, but data on the amount of time it took to do the LVP were available for 392 of 506 paracenteses. The mean volume removed was 7.9 L (range, 0.2-22.9 L), and the mean time of the procedure was 33.3 minutes. The time of the procedure was the time difference between entering and leaving the procedure room. This does not include IV placement or the recovery area time.
There were 5 episodes of postprocedure hypotension that required IV fluid or admission. In all these events, the patients had received the appropriate amount of IV albumin. Three patients required admission, and 1 patient required IV fluid postparacentesis on 2 occasions and then was discharged home. One abdominal wall hematoma occurred. Two patients with umbilical hernias developed incarceration after the paracentesis; both required surgical repair. There were 3 episodes of leakage at the paracentesis site; a skin adhesive was used in 2 cases, and sutures were applied in the other. There were no deaths.
Possible Infections
Ascitic fluid infection is a risk for patients needing paracentesis. Spontaneous bacterial peritonitis (SBP) is a bacterial infection of ascites in the absence of a focal contiguous source. The polymorphonuclear leukocyte (PMN) count in the ascites is ≥ 250 cells/mm3 in the presence of a single organism on culture. Culture-negative neutrocytic ascites (CNNA) is an ascitic fluid PMN count ≥ 250 cells/mm3 in the absence of culture growth obtained before the administration of antibiotics. Monomicrobial nonneutrocytic bacterascites (MNB) is an ascitic fluid PMN count < 250 cells/mm3 with growth of a single organism on culture.17 There was one occasion where a patient developed symptomatic CNNA 3 days after having a therapeutic paracentesis in the clinic at which time his ascites had a normal neutrophil count and a negative culture. He presented with abdominal pain and fever 3 days later, and a diagnostic paracentesis was done in the ED. He was treated as though he had SBP and did well.
Ascites cell count and culture are routinely sent in the clinic, and 1 case of asymptomatic SBP and 3 cases of asymptomatic ascitic fluid infection variants were diagnosed. The patient with SBP grew vancomycin-resistant Enterococcus faecium in his ascites. Two cases were CNNA. These patients were admitted to the hospital and treated with IV antibiotics. One case of MNB occurred that grew Escherichia coli. The patient refused to return to the hospital for IV antibiotics and was treated with a 5-day course of oral ciprofloxacin.
Discussion
We describe an academic hospitalist–run outpatient LVP clinic where large volumes of ascites are removed efficiently and safely. The only other description of a hospitalist-run paracentesis clinic was in abstract form.16 Without the clinic, the patients would have been admitted to the hospital to get an LVP. Based on VAPHS data from fiscal year 2021, the average cost per day of a nontelemetry medicine admission was $3394. Over 74 months, 506 admissions were prevented, which averages to 82 admissions prevented per year, an approximate annual cost savings of $278,308 in the last fiscal year alone.
Possible Complications
The complications we report are congruent with those reported in the literature. Runyon reported that the rate of an abdominal wall hematoma requiring blood transfusion was 0.9%, and the rate of an abdominal wall hematoma not requiring blood transfusion was also 0.9%.18 We had 1 patient who developed an abdominal wall hematoma (0.2% of paracenteses). This patient required 4 units of packed red blood cells. The incidence of ascitic fluid leakage after paracentesis has been reported to be between 0.4% and 2.4%.12 We had 3 episodes of leakage (0.6% of paracenteses). The Z-track technique has been purported to decrease postparacentesis leakage.2 This involves creating a pathway that is nonlinear when anesthetizing the soft tissues and inserting the paracentesis needle. The Z-track technique was not used in any of the paracenteses in our clinic.
Postparacentesis hypotension has been reported to be 0.4% to 1.8%.12,14 We report 5 episodes of hypotension (0.1% of paracenteses) of which 3 patients were admitted to the hospital. Interestingly, 4 of the 5 patients were on β-blockers. Serste and colleagues reported in a crossover trial that paracentesis-induced circulatory dysfunction (PICD) decreased from 80 to 10% when propranolol was discontinued.19 PICD is characterized by reduction of effective arterial blood volume with subsequent activation of vasoconstrictor and antinatriuretic factors that can cause rapid ascites recurrence rate, development of dilutional hyponatremia, hepatorenal syndrome, and increased mortality. IV albumin is given during LVP to prevent PICD. Discontinuing unnecessary antihypertensive medications, especially β-blockers, may mitigate postparacentesis hypotension. In a study of 515 paracenteses, De Gottardi and colleagues reported a 0.2% rate of iatrogenic percutaneous infection of ascites.20 We had 1 patient return 3 days after LVP with fever, abdominal pain, and neutrocytic ascites. His blood and ascites cultures were negative. The etiology of his infected ascites could have been either a spontaneously developed CNNA infection or an iatrogenic percutaneous infection of ascites.
Two cases of incarceration and strangulation of umbilical hernias postparacentesis that required emergent surgical intervention were unanticipated complications. Incarceration of an existing umbilical hernia postparacentesis is an uncommon but serious complication of LVP described in the past in numerous case reports but whose incidence is otherwise unknown.21-26 The fluid and pressure shifts before and after LVP are likely responsible for the hernia incarceration. When ascites is present, the umbilical hernia ring is kept patent by the pressure of the ascitic fluid, and the decrease in tension after removal of ascites may lead to decreased size of the hernia ring and trapping of contents in the hernia sac.25-27 In most reported cases, symptoms and recognition of the incarcerated hernia have occurred within 2 days of the index paracentesis procedure. Most cases were in patients who required serial paracenteses for management of ascites and had relatively regular LVPs.
In both cases, the patients had regular visits for paracentesis, and incarceration occurred 0.5 hours postprocedure, in 1 case and 6 hours in the other. Umbilical hernias are common in patients with cirrhosis, with the prevalence approaching 20%.28 The management of umbilical hernias in patients with ascites is complex and optimal guideline-based management involves elective repair when ascites is adequately controlled to prevent recurrence, with consideration of TIPS at the time of repair.3 However, patients enrolled in outpatient paracentesis clinics are unlikely to have adequate ascites control to be considered optimized for an elective repair. In addition, given the number of serial procedures that they require, it is not surprising that they may be at risk for complications that are otherwise thought to be rare. Although incarceration and strangulation of umbilical hernia is thought to be a rare complication of LVP, patients should be informed of this potential complication so that they are aware to seek medical attention should they develop signs or symptoms.
Guidelines
There are no guidelines on how much ascites can be removed and how quickly the ascites can be removed during LVP. The goal of a therapeutic paracentesis is to remove as much fluid as possible, and there are no limits on the amount that can be removed safely.1 Concerning paracentesis flow rates, Elsabaawy and colleagues showed that ascites flow rate does not correlate with PICD. They looked at 3 groups with ascites flow rates of 80 mL/min, 180 mL/min and 270 mL/min.29 We had data on the time in the procedure room in 77% of our procedures. Given our average amount of ascites removed (7.9 L) and average time in the procedure room (33.3 minutes), the average flow rate from our clinic was at least 237 mL/min (although the flow rate was likely higher because the average time from needle inserted to needle removed was < 33.3 minutes). Both the mean duration of LVP and the mean volume of ascites removed in an outpatient paracentesis clinic were reported in only 1 other study. In a study of 1100 patients, Grabau and colleagues reported the mean duration, defined as the time between when the patient entered and exited the procedure room (the same time period we reported) as 97 minutes and the mean volume of ascites removed as 8.7 L.13
The AASLD guidelines state that patients undergoing serial outpatient LVP should be tested only for cell count and differential without sending a bacterial culture. The reason given is that false positives may exceed true positives from ascites bacterial culture results in asymptomatic patients.3 Mohan and Venkataraman reported a 0.4% rate of SBP, 1.4% rate of CNNA, and 0.7% rate of MNB in asymptomatic patients undergoing LVP in an outpatient clinic.30 We had a 0.2% rate of SBP, 0.4% rate of CNNA, and 0.2% rate of MNB. Given the low rates of SBP in outpatient paracenteses clinics, we will adopt the AASLD suggestions to only send an ascites cell count and not a culture in asymptomatic patients. Noteworthy, our patient with asymptomatic SBP grew vancomycin-resistant Enterococcus faecium, which was resistant to standard SBP antibiotic therapy. However, if ascites culture was not sent, he would have been treated with antibiotics for CNNA, and if he developed symptoms, he would have had a repeat paracentesis with cell count and culture sent.
Training
In 2015, faculty at VAPHS and the University of Pittsburgh School of Medicine designed a Mastering Paracentesis for Medical Residents course based on current guidelines on the management of ascites and published procedural guides. The course is mandatory for all postgraduate year-1 internal medicine residents and begins with 2 hours of didactic and simulation-based training with an ultrasound-compatible paracentesis mannequin. In the 3 weeks following simulation-based training, residents rotate through our outpatient paracentesis clinic and perform between 1 and 3 abdominal paracentesis procedures, receiving as-needed coaching and postprocedure feedback from faculty. Since the course’s inception, more than 150 internal medicine residents have been trained in paracentesis through our clinic.
Conclusions
We present a description of a successful outpatient paracentesis clinic at our hospital run by academic hospitalists. The clinic was created to decrease the number of admissions for LVP. We were fortunate to be able to use the GI endoscopy suite and their resources as the clinic setting. To create outpatient LVP clinics at other institutions, administrative support is essential. In conclusion, we have shown that an outpatient paracentesis clinic run by academic hospitalists can safely and quickly remove large volumes of ascites.
1. Ge PS, Runyon BA. Treatment of patients with cirrhosis. N Engl J Med. 2016;375(8):767-777. doi:10.1056/NEJMra1504367
2. Wong F. Management of ascites in cirrhosis. J Gastroenterol Hepatol. 2012;27(1):11-20. doi:10.1111/j.1440-1746.2011.06925.x
3. Runyon BA; AASLD. Introduction to the revised American Association for the Study of Liver Diseases Practice Guideline management of adult patients with ascites due to cirrhosis 2012. Hepatology. 2013;57(4):1651-1653. doi:10.1002/hep.26359
4. Boyer TD, Haskal ZJ; American Association for the Study of Liver Diseases. The role of transjugular intrahepatic portosystemic shunt (TIPS) in the management of portal hypertension: update 2009. Hepatology. 2010;51(1):306. doi:10.1002/hep.23383
5. Harding V, Fenu E, Medani H, et al. Safety, cost-effectiveness and feasibility of daycase paracentesis in the management of malignant ascites with a focus on ovarian cancer. Br J Cancer. 2012;107(6):925-930. doi:10.1038/bjc.2012.343
6. Korpi S, Salminen VV, Piili RP, Paunu N, Luukkaala T, Lehto JT. Therapeutic procedures for malignant ascites in a palliative care outpatient clinic. J Palliat Med. 2018;21(6):836-841. doi:10.1089/jpm.2017.0616
7. Vaughan J. Developing a nurse-led paracentesis service in an ambulatory care unit. Nurs Stand. 2013;28(4):44-50. doi:10.7748/ns2013.09.28.4.44.e7751
8. Menon S, Thompson L-S, Tan M, et al. Development and cost-benefit analysis of a nurse-led paracentesis and infusion service. Gastrointestinal Nursing. 2016;14(9):32-38. doi:10.12968/gasn.2016.14.9.32
9. Hill S, Smalley JR, Laasch H-U. Developing a nurse-led, day-case, abdominal paracentesis service. Cancer Nursing Practice. 2013;12(5):14-20. doi:10.7748/cnp2013.06.12.5.14.e942
10. Tahir F, Hollywood C, Durrant D. PWE-134 Overview of efficacy and cost effectiveness of nurse led day case abdominal paracentesis service at Gloucestershire Hospital NHS Foundation Trust. Gut. 2014;63(suppl 1):A183.2-A183. doi:10.1136/gutjnl-2014-307263.394
11. Gashau W, Samra G, Gasser J, Rolland M, Sambaiah P, Shorrock C. PTH-075 “ascites clinic”: an outpatient service model for patients requiring large volume paracentesis. Gut. 2014;63(suppl 1):A242.2-A242. doi:10.1136/gutjnl-2014-307263.521
12. Gilani N, Patel N, Gerkin RD, Ramirez FC, Tharalson EE, Patel K. The safety and feasibility of large volume paracentesis performed by an experienced nurse practitioner. Ann Hepatol. 2009;8(4):359-363.
13. Grabau CM, Crago SF, Hoff LK, et al. Performance standards for therapeutic abdominal paracentesis. Hepatology. 2004;40(2):484-488. doi:10.1002/hep.20317
14. Cheng YW, Sandrasegaran K, Cheng K, et al. A dedicated paracentesis clinic decreases healthcare utilization for serial paracenteses in decompensated cirrhosis. Abdom Radiol (NY). 2018;43(8):2190-2197. doi:10.1007/s00261-017-1406-y
15. Wang J, Khan S, Wyer P, et al. The role of ultrasound-guided therapeutic paracentesis in an outpatient transitional care program: a case series. Am J Hosp Palliat Care. 2018;35(9):1256-1260. doi:10.1177/1049909118755378
16. Sehgal R, Dickerson J, Holcomb M. Creation of a hospitalist-run paracentesis clinic [abstract]. J Hosp Med. 2015;10(suppl 2).
17. Sheer TA, Runyon BA. Spontaneous bacterial peritonitis. Dig Dis. 2005;23(1):39-46. doi:10.1159/000084724
18. Runyon BA. Paracentesis of ascitic fluid. A safe procedure. Arch Intern Med. 1986;146(11):2259-2261.
19. Sersté T, Francoz C, Durand F, et al. Beta-blockers cause paracentesis-induced circulatory dysfunction in patients with cirrhosis and refractory ascites: a cross-over study. J Hepatol. 2011;55(4):794-799. doi:10.1016/j.jhep.2011.01.034
20. De Gottardi A, Thévenot T, Spahr L, et al. Risk of complications after abdominal paracentesis in cirrhotic patients: a prospective study. Clin Gastroenterol Hepatol. 2009;7(8):906-909. doi:10.1016/j.cgh.2009.05.004
21. Khodarahmi I, Shahid MU, Contractor S. Incarceration of umbilical hernia: a rare complication of large volume paracentesis. J Radiol Case Rep. 2015;9(9):20-25. doi:10.3941/jrcr.v9i9.2614
22. Chu KM, McCaughan GW. Iatrogenic incarceration of umbilical hernia in cirrhotic patients with ascites. Am J Gastroenterol. 1995;90(11):2058-2059.
23. Triantos CK, Kehagias I, Nikolopoulou V, Burroughs AK. Incarcerated umbilical hernia after large volume paracentesis for refractory ascites. J Gastrointestin Liver Dis. 2010;19(3):245.
24. Touze I, Asselah T, Boruchowicz A, Paris JC. Abdominal pain in a cirrhotic patient with ascites. Postgrad Med J. 1997;73(865):751-752. doi:10.1136/pgmj.73.865.751
25. Baron HC. Umbilical hernia secondary to cirrhosis of the liver. Complications of surgical correction. N Engl J Med. 1960;263:824-828. doi:10.1056/NEJM196010272631702
26. Tan HK, Chang PE. Acute abdomen secondary to incarcerated umbilical hernia after treatment of massive cirrhotic ascites. Case Reports Hepatol. 2013;2013:948172. doi:10.1155/2013/948172
27. Lemmer JH, Strodel WE, Eckhauser FE. Umbilical hernia incarceration: a complication of medical therapy of ascites. Am J Gastroenterol. 1983;78(5):295-296.
28. Belghiti J, Durand F. Abdominal wall hernias in the setting of cirrhosis. Semin Liver Dis. 1997;17(3):219-226. doi:10.1055/s-2007-1007199
29. Elsabaawy MM, Abdelhamid SR, Alsebaey A, et al. The impact of paracentesis flow rate in patients with liver cirrhosis on the development of paracentesis induced circulatory dysfunction. Clin Mol Hepatol. 2015;21(4):365-371. doi:10.3350/cmh.2015.21.4.365
30. Mohan P, Venkataraman J. Prevalence and risk factors for unsuspected spontaneous ascitic fluid infection in cirrhotics undergoing therapeutic paracentesis in an outpatient clinic. Indian J Gastroenterol. 2011;30(5):221-224. doi:10.1007/s12664-011-0131-7
Cirrhosis is the most common cause of ascites in the United States. In patients with compensated cirrhosis, the 10-year probability of developing ascites is 47%. Developing ascites portends a poor prognosis. Fifteen percent of patients who receive this diagnosis die within 1 year, and 44% within 5 years.1 First-line treatment of cirrhotic ascites consists of dietary sodium restriction and diuretic therapy. Refractory ascites is defined as ascites that cannot be easily mobilized despite adhering to a dietary sodium intake of ≤ 2 g daily and daily doses of spironolactone 400 mg and furosemide 160 mg.
Patients who cannot tolerate diuretics because of complications are defined as having diuretic intractable ascites. Diuretic-induced complications include hepatic encephalopathy, renal impairment, hyponatremia, and hypo- or hyperkalemia. Because these patients are either unresponsive to or intolerant of diuretics, second-line treatments, such as regular large-volume paracentesis (LVP) or the insertion of a transjugular intrahepatic portosystemic shunt (TIPS) are needed to manage their ascites. These patients also should be considered for liver transplantation unless there is a contraindication.2
Serial LVP has been shown to be safe and effective in controlling refractory ascites.3 TIPS will decrease the need for repeated LVP in patients with refractory LVP. However, given the uncertainty as to the effect of TIPS creation on survival and the increased risk of encephalopathy, the American Association for the Study of Liver Diseases (AASLD) recommends that TIPS should be used only in those patients who cannot tolerate repeated LVP.4 Repeated LVP also has been shown to be safe and effective in controlling malignant ascites.5,6
LVP can be done in different health care settings. These include the emergency department (ED), interventional radiology suite, inpatient bed, or an outpatient paracentesis clinic. There have been various descriptions of outpatient paracentesis clinics. Reports from the United Kingdom have revealed that paracenteses in these outpatient clinics can be performed safely by nurse practitioners or a liver specialist nurse, that these clinics are highly rated by the patients, and are cost effective.7-10 Gashau and colleagues describe a clinic in Great Britain run by gastroenterology (GI) fellows using an endoscopy suite.11 A nurse practitioner outpatient paracentesis clinic in the US has been described as well.12 Grabau and colleagues present a clinic run by GI endoscopy assistants (licensed practical nurses) using a dedicated paracentesis room in the endoscopy suite.13 Cheng and colleagues describe an outpatient paracentesis clinic in a radiology department run by a single advanced practitioner with assistance from an ultrasound technologist.14 Wang and colleagues present outpatient paracenteses in an outpatient transitional care program by a physician or an advanced practitioner supervised by a physician.15 Sehgal and colleagues describe (in abstract) the creation of a hospitalist-run paracentesis clinic.16
Traditionally, at Veterans Affairs Pittsburgh Healthcare System (VAPHS) in Pennsylvania, if a patient needed LVP, they were admitted to a medicine bed. LVP is not done in the ED, and interventional radiology cannot accommodate the number of patients requiring LVP because of their caseload. The procedure was done by an attending hospitalist or medical residents under the supervision of an attending hospitalist. To improve patient flow and decrease the number of patients using inpatients beds, we created an outpatient paracentesis clinic in 2014. Here, we present the logistics of the clinic, patient demographics, the amount of ascites removed, and the time required to remove the ascites. As part of ongoing quality assurance, we keep track of any complications and report these as well.
Methods
The setting of the outpatient paracentesis clinic is a room in the VAPHS endoscopy suite. The clinic operates 1 half-day per week with up to 3 patients receiving a paracentesis. We use the existing logistics in the endoscopy suite. There are 1 or 2 registered nurses (RNs) who assist the physician performing the paracentesis. The proceduralist is an academic hospitalist who at the time is not on service with residents. The patients are referred to the clinic by the ED, hepatology clinic, palliative care, primary care physicians, or at hospital discharge. In the clinic consult, patients are required to have at least an estimated 3 L of ascites and systolic blood pressure (SBP) ≥ 90. The patients can eat and take medications the morning of the procedure except diuretics. Patients are checked in to the endoscopy suite and a peripheral IV is placed. Blood tests, such as a complete blood count and coagulation studies, are not checked routinely since the AASLD guidelines state that routine prophylactic use of fresh frozen plasma or platelets before paracentesis is not recommended because bleeding is uncommon.3 The proceduralist can order blood work at their discretion.
After the procedure, patients are brought to the recovery area of the endoscopy suite and discharged. The patients are discharged usually within 15 to 30 minutes from arriving in the recovery area after it is assured that the SBP is within 10% of their baseline. Patient follow-up in the outpatient paracentesis clinic is determined by the proceduralist. Most patients need regularly scheduled paracenteses depending on how quickly they reaccumulate ascites. If a patient does not need a regularly scheduled paracentesis, the proceduralist ensures that the appropriate outpatient clinic visit has been scheduled or requested.
Procedure
Informed consent is obtained, and a time-out is performed before each paracentesis. The patient is attached to a cardiac monitor and pulse oximetry as per the endoscopy suite protocol. The proceduralist does a point-of-care ultrasound to find the optimal site and marks the site of puncture. The skin around the marked site is prepared with 3 chlorhexidine gluconate 2%/isopropyl alcohol 70% applicators. A fenestrated drape is used to form a sterile field. The Avanos Paracentesis Kit is routinely used for LVP at VAPHS. Local anesthesia with 1% lidocaine is used with a 25-gauge × 1-inch needle. Deeper anesthesia is obtained with 1% lidocaine, using a 22-gauge × 1.5-inch needle, injecting and aspirating while advancing the needle until ascites is aspirated.
A 15-gauge 3.3-inch Caldwell cannula with an inner needle is inserted into the peritoneal cavity and ascites is aspirated into a syringe. The inner needle is then removed, and the Caldwell cannula is left in the peritoneal cavity and tubing with a roller clamp is attached to the cannula. The tubing is then attached to a 1-L vacuum suction bottle by the RN. We use the CareFusion PleurX drainage bottle. The proceduralist maintains sterility and assures the cannula remains in place. The RN changes the drainage bottles after being filled with 1 L of ascites.
We drain as much ascites as possible until drainage stops on its own. The cannula is then removed, and pressure is held with a gauze pad. An adhesive bandage is then placed over the site. Consistent with AASLD guideline, 25 g of IV albumin 25% is infused for every 3 L of albumin removed provided > 5 L of ascites is removed.3 The albumin is infused during the procedure and not after to limit the time of the procedure. A sample of ascites is sent for cell count with differential and culture.
Results
Between March 2014 and May 2020, 506 paracenteses were performed on 82 patients. The mean age was 66.4 years, and 80 of 82 patients were male. The etiology of the ascites is presented in the Table. Twelve percent of the patients had concomitant hepatocellular carcinoma. Data on the amount of ascites removed were available for all patients, but data on the amount of time it took to do the LVP were available for 392 of 506 paracenteses. The mean volume removed was 7.9 L (range, 0.2-22.9 L), and the mean time of the procedure was 33.3 minutes. The time of the procedure was the time difference between entering and leaving the procedure room. This does not include IV placement or the recovery area time.
There were 5 episodes of postprocedure hypotension that required IV fluid or admission. In all these events, the patients had received the appropriate amount of IV albumin. Three patients required admission, and 1 patient required IV fluid postparacentesis on 2 occasions and then was discharged home. One abdominal wall hematoma occurred. Two patients with umbilical hernias developed incarceration after the paracentesis; both required surgical repair. There were 3 episodes of leakage at the paracentesis site; a skin adhesive was used in 2 cases, and sutures were applied in the other. There were no deaths.
Possible Infections
Ascitic fluid infection is a risk for patients needing paracentesis. Spontaneous bacterial peritonitis (SBP) is a bacterial infection of ascites in the absence of a focal contiguous source. The polymorphonuclear leukocyte (PMN) count in the ascites is ≥ 250 cells/mm3 in the presence of a single organism on culture. Culture-negative neutrocytic ascites (CNNA) is an ascitic fluid PMN count ≥ 250 cells/mm3 in the absence of culture growth obtained before the administration of antibiotics. Monomicrobial nonneutrocytic bacterascites (MNB) is an ascitic fluid PMN count < 250 cells/mm3 with growth of a single organism on culture.17 There was one occasion where a patient developed symptomatic CNNA 3 days after having a therapeutic paracentesis in the clinic at which time his ascites had a normal neutrophil count and a negative culture. He presented with abdominal pain and fever 3 days later, and a diagnostic paracentesis was done in the ED. He was treated as though he had SBP and did well.
Ascites cell count and culture are routinely sent in the clinic, and 1 case of asymptomatic SBP and 3 cases of asymptomatic ascitic fluid infection variants were diagnosed. The patient with SBP grew vancomycin-resistant Enterococcus faecium in his ascites. Two cases were CNNA. These patients were admitted to the hospital and treated with IV antibiotics. One case of MNB occurred that grew Escherichia coli. The patient refused to return to the hospital for IV antibiotics and was treated with a 5-day course of oral ciprofloxacin.
Discussion
We describe an academic hospitalist–run outpatient LVP clinic where large volumes of ascites are removed efficiently and safely. The only other description of a hospitalist-run paracentesis clinic was in abstract form.16 Without the clinic, the patients would have been admitted to the hospital to get an LVP. Based on VAPHS data from fiscal year 2021, the average cost per day of a nontelemetry medicine admission was $3394. Over 74 months, 506 admissions were prevented, which averages to 82 admissions prevented per year, an approximate annual cost savings of $278,308 in the last fiscal year alone.
Possible Complications
The complications we report are congruent with those reported in the literature. Runyon reported that the rate of an abdominal wall hematoma requiring blood transfusion was 0.9%, and the rate of an abdominal wall hematoma not requiring blood transfusion was also 0.9%.18 We had 1 patient who developed an abdominal wall hematoma (0.2% of paracenteses). This patient required 4 units of packed red blood cells. The incidence of ascitic fluid leakage after paracentesis has been reported to be between 0.4% and 2.4%.12 We had 3 episodes of leakage (0.6% of paracenteses). The Z-track technique has been purported to decrease postparacentesis leakage.2 This involves creating a pathway that is nonlinear when anesthetizing the soft tissues and inserting the paracentesis needle. The Z-track technique was not used in any of the paracenteses in our clinic.
Postparacentesis hypotension has been reported to be 0.4% to 1.8%.12,14 We report 5 episodes of hypotension (0.1% of paracenteses) of which 3 patients were admitted to the hospital. Interestingly, 4 of the 5 patients were on β-blockers. Serste and colleagues reported in a crossover trial that paracentesis-induced circulatory dysfunction (PICD) decreased from 80 to 10% when propranolol was discontinued.19 PICD is characterized by reduction of effective arterial blood volume with subsequent activation of vasoconstrictor and antinatriuretic factors that can cause rapid ascites recurrence rate, development of dilutional hyponatremia, hepatorenal syndrome, and increased mortality. IV albumin is given during LVP to prevent PICD. Discontinuing unnecessary antihypertensive medications, especially β-blockers, may mitigate postparacentesis hypotension. In a study of 515 paracenteses, De Gottardi and colleagues reported a 0.2% rate of iatrogenic percutaneous infection of ascites.20 We had 1 patient return 3 days after LVP with fever, abdominal pain, and neutrocytic ascites. His blood and ascites cultures were negative. The etiology of his infected ascites could have been either a spontaneously developed CNNA infection or an iatrogenic percutaneous infection of ascites.
Two cases of incarceration and strangulation of umbilical hernias postparacentesis that required emergent surgical intervention were unanticipated complications. Incarceration of an existing umbilical hernia postparacentesis is an uncommon but serious complication of LVP described in the past in numerous case reports but whose incidence is otherwise unknown.21-26 The fluid and pressure shifts before and after LVP are likely responsible for the hernia incarceration. When ascites is present, the umbilical hernia ring is kept patent by the pressure of the ascitic fluid, and the decrease in tension after removal of ascites may lead to decreased size of the hernia ring and trapping of contents in the hernia sac.25-27 In most reported cases, symptoms and recognition of the incarcerated hernia have occurred within 2 days of the index paracentesis procedure. Most cases were in patients who required serial paracenteses for management of ascites and had relatively regular LVPs.
In both cases, the patients had regular visits for paracentesis, and incarceration occurred 0.5 hours postprocedure, in 1 case and 6 hours in the other. Umbilical hernias are common in patients with cirrhosis, with the prevalence approaching 20%.28 The management of umbilical hernias in patients with ascites is complex and optimal guideline-based management involves elective repair when ascites is adequately controlled to prevent recurrence, with consideration of TIPS at the time of repair.3 However, patients enrolled in outpatient paracentesis clinics are unlikely to have adequate ascites control to be considered optimized for an elective repair. In addition, given the number of serial procedures that they require, it is not surprising that they may be at risk for complications that are otherwise thought to be rare. Although incarceration and strangulation of umbilical hernia is thought to be a rare complication of LVP, patients should be informed of this potential complication so that they are aware to seek medical attention should they develop signs or symptoms.
Guidelines
There are no guidelines on how much ascites can be removed and how quickly the ascites can be removed during LVP. The goal of a therapeutic paracentesis is to remove as much fluid as possible, and there are no limits on the amount that can be removed safely.1 Concerning paracentesis flow rates, Elsabaawy and colleagues showed that ascites flow rate does not correlate with PICD. They looked at 3 groups with ascites flow rates of 80 mL/min, 180 mL/min and 270 mL/min.29 We had data on the time in the procedure room in 77% of our procedures. Given our average amount of ascites removed (7.9 L) and average time in the procedure room (33.3 minutes), the average flow rate from our clinic was at least 237 mL/min (although the flow rate was likely higher because the average time from needle inserted to needle removed was < 33.3 minutes). Both the mean duration of LVP and the mean volume of ascites removed in an outpatient paracentesis clinic were reported in only 1 other study. In a study of 1100 patients, Grabau and colleagues reported the mean duration, defined as the time between when the patient entered and exited the procedure room (the same time period we reported) as 97 minutes and the mean volume of ascites removed as 8.7 L.13
The AASLD guidelines state that patients undergoing serial outpatient LVP should be tested only for cell count and differential without sending a bacterial culture. The reason given is that false positives may exceed true positives from ascites bacterial culture results in asymptomatic patients.3 Mohan and Venkataraman reported a 0.4% rate of SBP, 1.4% rate of CNNA, and 0.7% rate of MNB in asymptomatic patients undergoing LVP in an outpatient clinic.30 We had a 0.2% rate of SBP, 0.4% rate of CNNA, and 0.2% rate of MNB. Given the low rates of SBP in outpatient paracenteses clinics, we will adopt the AASLD suggestions to only send an ascites cell count and not a culture in asymptomatic patients. Noteworthy, our patient with asymptomatic SBP grew vancomycin-resistant Enterococcus faecium, which was resistant to standard SBP antibiotic therapy. However, if ascites culture was not sent, he would have been treated with antibiotics for CNNA, and if he developed symptoms, he would have had a repeat paracentesis with cell count and culture sent.
Training
In 2015, faculty at VAPHS and the University of Pittsburgh School of Medicine designed a Mastering Paracentesis for Medical Residents course based on current guidelines on the management of ascites and published procedural guides. The course is mandatory for all postgraduate year-1 internal medicine residents and begins with 2 hours of didactic and simulation-based training with an ultrasound-compatible paracentesis mannequin. In the 3 weeks following simulation-based training, residents rotate through our outpatient paracentesis clinic and perform between 1 and 3 abdominal paracentesis procedures, receiving as-needed coaching and postprocedure feedback from faculty. Since the course’s inception, more than 150 internal medicine residents have been trained in paracentesis through our clinic.
Conclusions
We present a description of a successful outpatient paracentesis clinic at our hospital run by academic hospitalists. The clinic was created to decrease the number of admissions for LVP. We were fortunate to be able to use the GI endoscopy suite and their resources as the clinic setting. To create outpatient LVP clinics at other institutions, administrative support is essential. In conclusion, we have shown that an outpatient paracentesis clinic run by academic hospitalists can safely and quickly remove large volumes of ascites.
1. Ge PS, Runyon BA. Treatment of patients with cirrhosis. N Engl J Med. 2016;375(8):767-777. doi:10.1056/NEJMra1504367
2. Wong F. Management of ascites in cirrhosis. J Gastroenterol Hepatol. 2012;27(1):11-20. doi:10.1111/j.1440-1746.2011.06925.x
3. Runyon BA; AASLD. Introduction to the revised American Association for the Study of Liver Diseases Practice Guideline management of adult patients with ascites due to cirrhosis 2012. Hepatology. 2013;57(4):1651-1653. doi:10.1002/hep.26359
4. Boyer TD, Haskal ZJ; American Association for the Study of Liver Diseases. The role of transjugular intrahepatic portosystemic shunt (TIPS) in the management of portal hypertension: update 2009. Hepatology. 2010;51(1):306. doi:10.1002/hep.23383
5. Harding V, Fenu E, Medani H, et al. Safety, cost-effectiveness and feasibility of daycase paracentesis in the management of malignant ascites with a focus on ovarian cancer. Br J Cancer. 2012;107(6):925-930. doi:10.1038/bjc.2012.343
6. Korpi S, Salminen VV, Piili RP, Paunu N, Luukkaala T, Lehto JT. Therapeutic procedures for malignant ascites in a palliative care outpatient clinic. J Palliat Med. 2018;21(6):836-841. doi:10.1089/jpm.2017.0616
7. Vaughan J. Developing a nurse-led paracentesis service in an ambulatory care unit. Nurs Stand. 2013;28(4):44-50. doi:10.7748/ns2013.09.28.4.44.e7751
8. Menon S, Thompson L-S, Tan M, et al. Development and cost-benefit analysis of a nurse-led paracentesis and infusion service. Gastrointestinal Nursing. 2016;14(9):32-38. doi:10.12968/gasn.2016.14.9.32
9. Hill S, Smalley JR, Laasch H-U. Developing a nurse-led, day-case, abdominal paracentesis service. Cancer Nursing Practice. 2013;12(5):14-20. doi:10.7748/cnp2013.06.12.5.14.e942
10. Tahir F, Hollywood C, Durrant D. PWE-134 Overview of efficacy and cost effectiveness of nurse led day case abdominal paracentesis service at Gloucestershire Hospital NHS Foundation Trust. Gut. 2014;63(suppl 1):A183.2-A183. doi:10.1136/gutjnl-2014-307263.394
11. Gashau W, Samra G, Gasser J, Rolland M, Sambaiah P, Shorrock C. PTH-075 “ascites clinic”: an outpatient service model for patients requiring large volume paracentesis. Gut. 2014;63(suppl 1):A242.2-A242. doi:10.1136/gutjnl-2014-307263.521
12. Gilani N, Patel N, Gerkin RD, Ramirez FC, Tharalson EE, Patel K. The safety and feasibility of large volume paracentesis performed by an experienced nurse practitioner. Ann Hepatol. 2009;8(4):359-363.
13. Grabau CM, Crago SF, Hoff LK, et al. Performance standards for therapeutic abdominal paracentesis. Hepatology. 2004;40(2):484-488. doi:10.1002/hep.20317
14. Cheng YW, Sandrasegaran K, Cheng K, et al. A dedicated paracentesis clinic decreases healthcare utilization for serial paracenteses in decompensated cirrhosis. Abdom Radiol (NY). 2018;43(8):2190-2197. doi:10.1007/s00261-017-1406-y
15. Wang J, Khan S, Wyer P, et al. The role of ultrasound-guided therapeutic paracentesis in an outpatient transitional care program: a case series. Am J Hosp Palliat Care. 2018;35(9):1256-1260. doi:10.1177/1049909118755378
16. Sehgal R, Dickerson J, Holcomb M. Creation of a hospitalist-run paracentesis clinic [abstract]. J Hosp Med. 2015;10(suppl 2).
17. Sheer TA, Runyon BA. Spontaneous bacterial peritonitis. Dig Dis. 2005;23(1):39-46. doi:10.1159/000084724
18. Runyon BA. Paracentesis of ascitic fluid. A safe procedure. Arch Intern Med. 1986;146(11):2259-2261.
19. Sersté T, Francoz C, Durand F, et al. Beta-blockers cause paracentesis-induced circulatory dysfunction in patients with cirrhosis and refractory ascites: a cross-over study. J Hepatol. 2011;55(4):794-799. doi:10.1016/j.jhep.2011.01.034
20. De Gottardi A, Thévenot T, Spahr L, et al. Risk of complications after abdominal paracentesis in cirrhotic patients: a prospective study. Clin Gastroenterol Hepatol. 2009;7(8):906-909. doi:10.1016/j.cgh.2009.05.004
21. Khodarahmi I, Shahid MU, Contractor S. Incarceration of umbilical hernia: a rare complication of large volume paracentesis. J Radiol Case Rep. 2015;9(9):20-25. doi:10.3941/jrcr.v9i9.2614
22. Chu KM, McCaughan GW. Iatrogenic incarceration of umbilical hernia in cirrhotic patients with ascites. Am J Gastroenterol. 1995;90(11):2058-2059.
23. Triantos CK, Kehagias I, Nikolopoulou V, Burroughs AK. Incarcerated umbilical hernia after large volume paracentesis for refractory ascites. J Gastrointestin Liver Dis. 2010;19(3):245.
24. Touze I, Asselah T, Boruchowicz A, Paris JC. Abdominal pain in a cirrhotic patient with ascites. Postgrad Med J. 1997;73(865):751-752. doi:10.1136/pgmj.73.865.751
25. Baron HC. Umbilical hernia secondary to cirrhosis of the liver. Complications of surgical correction. N Engl J Med. 1960;263:824-828. doi:10.1056/NEJM196010272631702
26. Tan HK, Chang PE. Acute abdomen secondary to incarcerated umbilical hernia after treatment of massive cirrhotic ascites. Case Reports Hepatol. 2013;2013:948172. doi:10.1155/2013/948172
27. Lemmer JH, Strodel WE, Eckhauser FE. Umbilical hernia incarceration: a complication of medical therapy of ascites. Am J Gastroenterol. 1983;78(5):295-296.
28. Belghiti J, Durand F. Abdominal wall hernias in the setting of cirrhosis. Semin Liver Dis. 1997;17(3):219-226. doi:10.1055/s-2007-1007199
29. Elsabaawy MM, Abdelhamid SR, Alsebaey A, et al. The impact of paracentesis flow rate in patients with liver cirrhosis on the development of paracentesis induced circulatory dysfunction. Clin Mol Hepatol. 2015;21(4):365-371. doi:10.3350/cmh.2015.21.4.365
30. Mohan P, Venkataraman J. Prevalence and risk factors for unsuspected spontaneous ascitic fluid infection in cirrhotics undergoing therapeutic paracentesis in an outpatient clinic. Indian J Gastroenterol. 2011;30(5):221-224. doi:10.1007/s12664-011-0131-7