User login
When a patient with chronic alcohol use abruptly stops drinking
CASE A difficult withdrawal
Three days after he stops drinking alcohol, Mr. G, age 49, presents to a detoxification center with his wife, who drove him there because she was concerned about his condition. She says her husband had been drinking alcohol every night for as long as she can remember. Despite numerous admissions to rehabilitation centers, Mr. G usually would resume drinking soon after he was discharged. Three days ago, Mr. G’s wife had told him she “could not take it anymore,” so he got rid of all his alcohol and stopped drinking. Mr. G’s wife felt he was doing fine the first day, but his condition increasingly worsened the second and third days. The triage nurse who attempts to interview Mr. G finds him tremulous, vomiting, and sweating. She notices that he seems preoccupied with pulling at his shirt, appearing to pick at things that are not there.
HISTORY Untreated depression, other comorbidities
Mr. G’s wife says he has never been psychiatrically hospitalized or exhibited suicidal behavior. Mr. G previously received care from a psychiatrist, who diagnosed him with major depressive disorder (MDD) and prescribed an antidepressant, though his wife cannot recall which specific medication. She shares it has been “a long time” since Mr. G has taken the antidepressant and the last time he received treatment for his MDD was 5 years ago. Mr. G’s wife says her husband had once abstained from alcohol use for >6 months following one of his stints at a rehabilitation center. She is not able to share many other details about Mr. G’s previous stays at rehabilitation centers, but says he always had “a rough time.”
She says Mr. G had been drinking an average of 10 drinks each night, usually within 4 hours. He has no history of nicotine or illicit substance use and has held a corporate job for the last 18 years. Several years ago, a physician had diagnosed Mr. G with hypertension and high cholesterol, but he did not follow up for treatment. Mr. G’s wife also recalls a physician told her husband he had a fatty liver. His family history includes heart disease and cancer.
[polldaddy:12041618]
The author’s observations
The treatment team observed several elements of alcohol withdrawal and classified Mr. G as a priority patient. If the team had completed the Clinical Institute Withdrawal Assessment for Alcohol–Revised scale (CIWA-Ar) (Table 11), Mr. G would score ≥10. While the protocol for initiating treatment for patients experiencing alcohol withdrawal varies by institution, patients with moderate to severe scores on the CIWA-Ar when experiencing withdrawal typically are managed with pharmacotherapy to address their symptoms.1 Given the timeline of his last drink as reported by his wife, Mr. G is on the brink of experiencing a cascade of symptoms concerning for delirium tremens (DTs).2 Table 22 provides a timeline and symptoms related to alcohol withdrawal. To prevent further exacerbation of symptoms, which could lead to DTs, Mr. G’s treatment team will likely initiate a benzodiazepine, using either scheduled or symptom-driven dosing.3

Two neurotransmitters that play a role in DTs are glutamate (excitatory) and GABA (inhibitory). In a normal state, the competing actions of these neurotransmitters balance each other. Acute alcohol intake causes a shift in the excitatory and inhibitory levels, with more inhibition taking place, thus causing disequilibrium. If chronic alcohol use continues, the amount of GABA inhibition reduction is related to downregulation of receptors.2,4 Excitation increases by way of upregulation of the N-methyl-

If alcohol is suddenly removed following chronic use, there is unchecked glutamate excitation related to a blunted GABA state. This added increase in the excitation of glutamate leads to withdrawal symptoms.2,4 Table 32,4,5 depicts the neurotransmitter equilibrium of GABA and glutamate relative to alcohol use.

EVALUATION Bleeding gums and bruising
The treatment team admits Mr. G to the triage bay and contacts the addiction psychiatrist. The physician orders laboratory tests to assess nutritional deficits and electrolyte abnormalities. Mr. G is also placed on routine assessments with symptom-triggered therapy. An assessment reveals bleeding gums and bruises, which are believed to be a result of thrombocytopenia (low blood platelet count).
[polldaddy:12041627]
Continue to: The author's observations
The author’s observations
Though regular clinical assessment of PEth varies, it is considered to have high sensitivity and specificity to detect alcohol use.6 When ethanol is present, the phospholipase D enzyme acts upon phosphatidylcholine, forming a direct biomarker, PEth, on the surface of the red blood cell.6,7 PEth’s half-life ranges from 4.5 to 12 days,6 and it can be detected in blood for 3 to 4 weeks after alcohol ingestion.6,7 A PEth value <20 ng/mL indicates light or no alcohol consumption; 20 to 199 ng/mL indicates significant consumption; and >200 ng/mL indicates heavy consumption.7 Since Mr. G has a history of chronic alcohol use, his PEth level is expected to be >200 ng/mL.
AST/ALT and MCV are indirect biomarkers, meaning the tests are not alcohol-specific and the role of alcohol is instead observed by the damage to the body with excessive use over time.7 The expected AST:ALT ratio is 2:1. This is related to 3 mechanisms. The first is a decrease in ALT usually relative to B6 deficiency in individuals with alcohol use disorder (AUD). Another mechanism is related to alcohol’s propensity to affect mitochondria, which is a source for AST. Additionally, AST is also found in higher proportions in the kidneys, heart, and muscles.8
An MCV <100 fL would be within the normal range (80 to 100 fL) for red blood cells. While the reasons for an enlarged red blood cell (or macrocyte) are extensive, alcohol can be a factor once other causes are excluded. Additional laboratory tests and a peripheral blood smear test can help in this investigation. Alcohol disrupts the complete maturation of red blood cells.9,10 If the cause of the macrocyte is alcohol-related and alcohol use is terminated, those enlarged cells can resolve in an average of 3 months.9
Vitamin B1 levels >200 nmol/L would be within normal range (74 to 222 nmol/L). Mr. G’s chronic alcohol use would likely cause him to be vitamin B1–deficient. The deficiency is usually related to diet, malabsorption, and the cells’ impaired ability to utilize vitamin B1. A consequence of vitamin B1 deficiency is Wernicke-Korsakoff syndrome.11
Due to his chronic alcohol use, Mr. G’s magnesium stores most likely would be below normal range (1.7 to 2.2 mg/dL). Acting as a diuretic, alcohol depletes magnesium and other electrolytes. The intracellular shift that occurs to balance the deficit causes the body to use its normal stores of magnesium, which leads to further magnesium depletion. Other common causes include nutritional deficiency and decreased gastrointestinal absorption.12 The bleeding the physician suspected was a result of drinking likely occurred through direct and indirect mechanisms that affect platelets.9,13 Platelets can show improvement 1 week after drinking cessation. Some evidence suggests the risk of seizure or DTs increases significantly with a platelet count <119,000 µL per unit of blood.13
Continue to: TREATMENT Pharmacotherapy for alcohol use disorder
TREATMENT Pharmacotherapy for alcohol use disorder
As Mr. G’s condition starts to stabilize, he discusses treatment options for AUD with his physician. At the end of the discussion, Mr. G expresses an interest in starting a medication. The doctor reviews his laboratory results and available treatment options.
[polldaddy:12041630]
The author’s observations
Of the 3 FDA-approved medications for treating AUD (disulfiram, acamprosate, and naltrexone), naltrexone has been shown to decrease heavy drinking days5,14 and comes in oral and injectable forms. Reducing drinking is achieved by reducing the rewarding effects of alcohol5,14 and alcohol cravings.5 Disulfiram often has poor adherence, and like acamprosate it may be more helpful for maintenance of abstinence. Neither topiramate nor gabapentin are FDA-approved for AUD but may be used for their affects on GABA.5 Gabapentin may also help patients experiencing alcohol withdrawal syndrome.5,15 Mr. G did not have any concomitant medications or comorbid medical conditions, but these factors as well as any renal or hepatic dysfunction must be considered before initiating any medications.
OUTCOME Improved well-being
Mr. G’s treatment team initiates oral naltrexone 50 mg/d, which he tolerates well without complications. He stops drinking entirely and expresses an interest in transitioning to an injectable form of naltrexone in the future. In addition to taking medication, Mr. G wants to participate in psychotherapy. Mr. G thanks his team for the care he received in the hospital, telling them, “You all saved my life.” As he discusses his past issues with alcohol, Mr. G asks his physician how he could get involved to make changes to reduce excessive alcohol consumption in his community (Box5,15-21).
Box
Alcohol use disorder is undertreated5,15-17 and excessive alcohol use accounts for 1 in 5 deaths in individuals within Mr. G’s age range.18 An April 2011 report from the Community Preventive Services Task Force19 did not recommend privatization of retail alcohol sales as an intervention to reduce excessive alcohol consumption, because it would instead lead to an increase in alcohol consumption per capita, a known gateway to excessive alcohol consumption.20
The Task Force was established in 1996 by the US Department of Health and Human Services. Its objective is to identify scientifically proven interventions to save lives, increase lifespans, and improve quality of life. Recommendations are based on systematic reviews to inform lawmakers, health departments, and other organizations and agencies.21 The Task Force’s recommendations were divided into interventions that have strong evidence, sufficient evidence, or insufficient evidence. If Mr. G wanted to have the greatest impact in his efforts to reduce excessive alcohol consumption in his community, the strongest evidence supporting change focuses on electronic screening and brief intervention, maintaining limits on days of alcohol sale, increasing taxes on alcohol, and establishing dram shop liability (laws that hold retail establishments that sell alcohol liable for the injuries or harms caused by their intoxicated or underage customers).19
Bottom Line
Patients experiencing alcohol withdrawal can present with several layers of complexity. Failure to achieve acute stabilization may be life-threatening. After providing critical care, promptly start alcohol use disorder treatment for patients who expresses a desire to change.
Related Resources
- American Society of Addiction Medicine. The ASAM Clinical Practice Guideline on Alcohol Withdrawal Management. https://www.asam.org/quality-care/clinical-guidelines/alcohol-withdrawal-management-guideline
- American Psychiatric Association. The American Psychiatric Association Practice Guideline for the Pharmacological Treatment of Patients With Alcohol Use Disorder. American Psychiatric Association Publishing; 2018.
Drug Brand Names
Acamprosate • Campral
Disulfiram • Antabuse
Gabapentin • Neurontin
Naltrexone (injection) • Vivitrol
Naltrexone (oral) • ReVia
Topiramate • Topamax
1. Sullivan JT, Sykora K, Schneiderman J, et al. Assessment of alcohol withdrawal: the revised clinical institute withdrawal assessment for alcohol scale (CIWA-Ar). Br J Addict. 1989;84(11):1353-1357.
2. Trevisan LA, Boutros N, Petrakis IL, et al. Complications of alcohol withdrawal: pathophysiological insights. Alcohol Health Res World. 1998;22(1):61-66.
3. Holleck JL, Merchant N, Gunderson CG. Symptom-triggered therapy for alcohol withdrawal syndrome: a systematic review and meta-analysis of randomized controlled trials. J Gen Intern Med. 2019;34(6):1018-1024.
4. Clapp P, Bhave SV, Hoffman PL. How adaptation of the brain to alcohol leads to dependence: a pharmacological perspective. Alcohol Res Health. 2008;31(4):310-339.
5. Burnette EM, Nieto SJ, Grodin EN, et al. Novel agents for the pharmacological treatment of alcohol use disorder. Drugs. 2022;82(3):251-274.
6. Selim R, Zhou Y, Rupp LB, et al. Availability of PEth testing is associated with reduced eligibility for liver transplant among patients with alcohol-related liver disease. Clin Transplant. 2022;36(5):e14595.
7. Ulwelling W, Smith K. The PEth blood test in the security environment: what it is; why it is important; and interpretative guidelines. J Forensic Sci. 2018;63(6):1634-1640.
8. Botros M, Sikaris KA. The de ritis ratio: the test of time. Clin Biochem Rev. 2013;34(3):117-130.
9. Ballard HS. The hematological complications of alcoholism. Alcohol Health Res World. 1997;21(1):42-52.
10. Kaferle J, Strzoda CE. Evaluation of macrocytosis. Am Fam Physician. 2009;79(3):203-208.
11. Martin PR, Singleton CK, Hiller-Sturmhöfel S. The role of thiamine deficiency in alcoholic brain disease. Alcohol Res Health. 2003;27(2):134-142.
12. Palmer BF, Clegg DJ. Electrolyte disturbances in patients with chronic alcohol-use disorder. N Engl J Med. 2017;377(14):1368-1377.
13. Silczuk A, Habrat B. Alcohol-induced thrombocytopenia: current review. Alcohol. 2020;86:9-16. doi:10.1016/j.alcohol.2020.02.166
14. Pettinati HM, Rabinowitz AR. New pharmacotherapies for treating the neurobiology of alcohol and drug addiction. Psychiatry (Edgmont). 2006;3(5):14-16.
15. Anton RF, Latham P, Voronin K, et al. Efficacy of gabapentin for the treatment of alcohol use disorder in patients with alcohol withdrawal symptoms: a randomized clinical trial. JAMA Intern Med. 2020;180(5):728-736.
16. Chockalingam L, Burnham EL, Jolley SE. Medication prescribing for alcohol use disorders during alcohol-related encounters in a Colorado regional healthcare system. Alcoholism Clin Exp Res. 2022;46(6):1094-1102.
17. Mintz CM, Hartz SM, Fisher SL, et al. A cascade of care for alcohol use disorder: using 2015-2019 National Survey on Drug Use and Health data to identify gaps in past 12-month care. Alcohol Clin Exp Res. 2021;45(6):1276-1286.
18. Esser MB, Leung G, Sherk A, et al. Estimated deaths attributable to excessive alcohol use among US adults aged 20 to 64 years, 2015 to 2019. JAMA Netw Open. 2022;5(11):e2239485. doi:10.1001/jamanet workopen.2022.39485
19. The Community Guide. CPSTF Findings for Excessive Alcohol Consumption. Updated June 27, 2022. Accessed December 1, 2022. https://www.thecommunityguide.org/pages/task-force-findings-excessive-alcohol-consumption.html
20. The Community Guide. Alcohol Excessive Consumption: Privatization of Retail Alcohol Sales. Updated June 27, 2022. Accessed December 1, 2022. https://www.thecommunityguide.org/findings/alcohol-excessive-consumption-privatization-retail-alcohol-sales.html
21. The Community Guide. What is the CPSTF? Updated June 27, 2022. Accessed December 1, 2022. https://www.thecommunityguide.org/pages/what-is-the-cpstf.html
CASE A difficult withdrawal
Three days after he stops drinking alcohol, Mr. G, age 49, presents to a detoxification center with his wife, who drove him there because she was concerned about his condition. She says her husband had been drinking alcohol every night for as long as she can remember. Despite numerous admissions to rehabilitation centers, Mr. G usually would resume drinking soon after he was discharged. Three days ago, Mr. G’s wife had told him she “could not take it anymore,” so he got rid of all his alcohol and stopped drinking. Mr. G’s wife felt he was doing fine the first day, but his condition increasingly worsened the second and third days. The triage nurse who attempts to interview Mr. G finds him tremulous, vomiting, and sweating. She notices that he seems preoccupied with pulling at his shirt, appearing to pick at things that are not there.
HISTORY Untreated depression, other comorbidities
Mr. G’s wife says he has never been psychiatrically hospitalized or exhibited suicidal behavior. Mr. G previously received care from a psychiatrist, who diagnosed him with major depressive disorder (MDD) and prescribed an antidepressant, though his wife cannot recall which specific medication. She shares it has been “a long time” since Mr. G has taken the antidepressant and the last time he received treatment for his MDD was 5 years ago. Mr. G’s wife says her husband had once abstained from alcohol use for >6 months following one of his stints at a rehabilitation center. She is not able to share many other details about Mr. G’s previous stays at rehabilitation centers, but says he always had “a rough time.”
She says Mr. G had been drinking an average of 10 drinks each night, usually within 4 hours. He has no history of nicotine or illicit substance use and has held a corporate job for the last 18 years. Several years ago, a physician had diagnosed Mr. G with hypertension and high cholesterol, but he did not follow up for treatment. Mr. G’s wife also recalls a physician told her husband he had a fatty liver. His family history includes heart disease and cancer.
[polldaddy:12041618]
The author’s observations
The treatment team observed several elements of alcohol withdrawal and classified Mr. G as a priority patient. If the team had completed the Clinical Institute Withdrawal Assessment for Alcohol–Revised scale (CIWA-Ar) (Table 11), Mr. G would score ≥10. While the protocol for initiating treatment for patients experiencing alcohol withdrawal varies by institution, patients with moderate to severe scores on the CIWA-Ar when experiencing withdrawal typically are managed with pharmacotherapy to address their symptoms.1 Given the timeline of his last drink as reported by his wife, Mr. G is on the brink of experiencing a cascade of symptoms concerning for delirium tremens (DTs).2 Table 22 provides a timeline and symptoms related to alcohol withdrawal. To prevent further exacerbation of symptoms, which could lead to DTs, Mr. G’s treatment team will likely initiate a benzodiazepine, using either scheduled or symptom-driven dosing.3
Two neurotransmitters that play a role in DTs are glutamate (excitatory) and GABA (inhibitory). In a normal state, the competing actions of these neurotransmitters balance each other. Acute alcohol intake causes a shift in the excitatory and inhibitory levels, with more inhibition taking place, thus causing disequilibrium. If chronic alcohol use continues, the amount of GABA inhibition reduction is related to downregulation of receptors.2,4 Excitation increases by way of upregulation of the N-methyl-
If alcohol is suddenly removed following chronic use, there is unchecked glutamate excitation related to a blunted GABA state. This added increase in the excitation of glutamate leads to withdrawal symptoms.2,4 Table 32,4,5 depicts the neurotransmitter equilibrium of GABA and glutamate relative to alcohol use.
EVALUATION Bleeding gums and bruising
The treatment team admits Mr. G to the triage bay and contacts the addiction psychiatrist. The physician orders laboratory tests to assess nutritional deficits and electrolyte abnormalities. Mr. G is also placed on routine assessments with symptom-triggered therapy. An assessment reveals bleeding gums and bruises, which are believed to be a result of thrombocytopenia (low blood platelet count).
[polldaddy:12041627]
Continue to: The author's observations
The author’s observations
Though regular clinical assessment of PEth varies, it is considered to have high sensitivity and specificity to detect alcohol use.6 When ethanol is present, the phospholipase D enzyme acts upon phosphatidylcholine, forming a direct biomarker, PEth, on the surface of the red blood cell.6,7 PEth’s half-life ranges from 4.5 to 12 days,6 and it can be detected in blood for 3 to 4 weeks after alcohol ingestion.6,7 A PEth value <20 ng/mL indicates light or no alcohol consumption; 20 to 199 ng/mL indicates significant consumption; and >200 ng/mL indicates heavy consumption.7 Since Mr. G has a history of chronic alcohol use, his PEth level is expected to be >200 ng/mL.
AST/ALT and MCV are indirect biomarkers, meaning the tests are not alcohol-specific and the role of alcohol is instead observed by the damage to the body with excessive use over time.7 The expected AST:ALT ratio is 2:1. This is related to 3 mechanisms. The first is a decrease in ALT usually relative to B6 deficiency in individuals with alcohol use disorder (AUD). Another mechanism is related to alcohol’s propensity to affect mitochondria, which is a source for AST. Additionally, AST is also found in higher proportions in the kidneys, heart, and muscles.8
An MCV <100 fL would be within the normal range (80 to 100 fL) for red blood cells. While the reasons for an enlarged red blood cell (or macrocyte) are extensive, alcohol can be a factor once other causes are excluded. Additional laboratory tests and a peripheral blood smear test can help in this investigation. Alcohol disrupts the complete maturation of red blood cells.9,10 If the cause of the macrocyte is alcohol-related and alcohol use is terminated, those enlarged cells can resolve in an average of 3 months.9
Vitamin B1 levels >200 nmol/L would be within normal range (74 to 222 nmol/L). Mr. G’s chronic alcohol use would likely cause him to be vitamin B1–deficient. The deficiency is usually related to diet, malabsorption, and the cells’ impaired ability to utilize vitamin B1. A consequence of vitamin B1 deficiency is Wernicke-Korsakoff syndrome.11
Due to his chronic alcohol use, Mr. G’s magnesium stores most likely would be below normal range (1.7 to 2.2 mg/dL). Acting as a diuretic, alcohol depletes magnesium and other electrolytes. The intracellular shift that occurs to balance the deficit causes the body to use its normal stores of magnesium, which leads to further magnesium depletion. Other common causes include nutritional deficiency and decreased gastrointestinal absorption.12 The bleeding the physician suspected was a result of drinking likely occurred through direct and indirect mechanisms that affect platelets.9,13 Platelets can show improvement 1 week after drinking cessation. Some evidence suggests the risk of seizure or DTs increases significantly with a platelet count <119,000 µL per unit of blood.13
Continue to: TREATMENT Pharmacotherapy for alcohol use disorder
TREATMENT Pharmacotherapy for alcohol use disorder
As Mr. G’s condition starts to stabilize, he discusses treatment options for AUD with his physician. At the end of the discussion, Mr. G expresses an interest in starting a medication. The doctor reviews his laboratory results and available treatment options.
[polldaddy:12041630]
The author’s observations
Of the 3 FDA-approved medications for treating AUD (disulfiram, acamprosate, and naltrexone), naltrexone has been shown to decrease heavy drinking days5,14 and comes in oral and injectable forms. Reducing drinking is achieved by reducing the rewarding effects of alcohol5,14 and alcohol cravings.5 Disulfiram often has poor adherence, and like acamprosate it may be more helpful for maintenance of abstinence. Neither topiramate nor gabapentin are FDA-approved for AUD but may be used for their affects on GABA.5 Gabapentin may also help patients experiencing alcohol withdrawal syndrome.5,15 Mr. G did not have any concomitant medications or comorbid medical conditions, but these factors as well as any renal or hepatic dysfunction must be considered before initiating any medications.
OUTCOME Improved well-being
Mr. G’s treatment team initiates oral naltrexone 50 mg/d, which he tolerates well without complications. He stops drinking entirely and expresses an interest in transitioning to an injectable form of naltrexone in the future. In addition to taking medication, Mr. G wants to participate in psychotherapy. Mr. G thanks his team for the care he received in the hospital, telling them, “You all saved my life.” As he discusses his past issues with alcohol, Mr. G asks his physician how he could get involved to make changes to reduce excessive alcohol consumption in his community (Box5,15-21).
Box
Alcohol use disorder is undertreated5,15-17 and excessive alcohol use accounts for 1 in 5 deaths in individuals within Mr. G’s age range.18 An April 2011 report from the Community Preventive Services Task Force19 did not recommend privatization of retail alcohol sales as an intervention to reduce excessive alcohol consumption, because it would instead lead to an increase in alcohol consumption per capita, a known gateway to excessive alcohol consumption.20
The Task Force was established in 1996 by the US Department of Health and Human Services. Its objective is to identify scientifically proven interventions to save lives, increase lifespans, and improve quality of life. Recommendations are based on systematic reviews to inform lawmakers, health departments, and other organizations and agencies.21 The Task Force’s recommendations were divided into interventions that have strong evidence, sufficient evidence, or insufficient evidence. If Mr. G wanted to have the greatest impact in his efforts to reduce excessive alcohol consumption in his community, the strongest evidence supporting change focuses on electronic screening and brief intervention, maintaining limits on days of alcohol sale, increasing taxes on alcohol, and establishing dram shop liability (laws that hold retail establishments that sell alcohol liable for the injuries or harms caused by their intoxicated or underage customers).19
Bottom Line
Patients experiencing alcohol withdrawal can present with several layers of complexity. Failure to achieve acute stabilization may be life-threatening. After providing critical care, promptly start alcohol use disorder treatment for patients who expresses a desire to change.
Related Resources
- American Society of Addiction Medicine. The ASAM Clinical Practice Guideline on Alcohol Withdrawal Management. https://www.asam.org/quality-care/clinical-guidelines/alcohol-withdrawal-management-guideline
- American Psychiatric Association. The American Psychiatric Association Practice Guideline for the Pharmacological Treatment of Patients With Alcohol Use Disorder. American Psychiatric Association Publishing; 2018.
Drug Brand Names
Acamprosate • Campral
Disulfiram • Antabuse
Gabapentin • Neurontin
Naltrexone (injection) • Vivitrol
Naltrexone (oral) • ReVia
Topiramate • Topamax
1. Sullivan JT, Sykora K, Schneiderman J, et al. Assessment of alcohol withdrawal: the revised clinical institute withdrawal assessment for alcohol scale (CIWA-Ar). Br J Addict. 1989;84(11):1353-1357.
2. Trevisan LA, Boutros N, Petrakis IL, et al. Complications of alcohol withdrawal: pathophysiological insights. Alcohol Health Res World. 1998;22(1):61-66.
3. Holleck JL, Merchant N, Gunderson CG. Symptom-triggered therapy for alcohol withdrawal syndrome: a systematic review and meta-analysis of randomized controlled trials. J Gen Intern Med. 2019;34(6):1018-1024.
4. Clapp P, Bhave SV, Hoffman PL. How adaptation of the brain to alcohol leads to dependence: a pharmacological perspective. Alcohol Res Health. 2008;31(4):310-339.
5. Burnette EM, Nieto SJ, Grodin EN, et al. Novel agents for the pharmacological treatment of alcohol use disorder. Drugs. 2022;82(3):251-274.
6. Selim R, Zhou Y, Rupp LB, et al. Availability of PEth testing is associated with reduced eligibility for liver transplant among patients with alcohol-related liver disease. Clin Transplant. 2022;36(5):e14595.
7. Ulwelling W, Smith K. The PEth blood test in the security environment: what it is; why it is important; and interpretative guidelines. J Forensic Sci. 2018;63(6):1634-1640.
8. Botros M, Sikaris KA. The de ritis ratio: the test of time. Clin Biochem Rev. 2013;34(3):117-130.
9. Ballard HS. The hematological complications of alcoholism. Alcohol Health Res World. 1997;21(1):42-52.
10. Kaferle J, Strzoda CE. Evaluation of macrocytosis. Am Fam Physician. 2009;79(3):203-208.
11. Martin PR, Singleton CK, Hiller-Sturmhöfel S. The role of thiamine deficiency in alcoholic brain disease. Alcohol Res Health. 2003;27(2):134-142.
12. Palmer BF, Clegg DJ. Electrolyte disturbances in patients with chronic alcohol-use disorder. N Engl J Med. 2017;377(14):1368-1377.
13. Silczuk A, Habrat B. Alcohol-induced thrombocytopenia: current review. Alcohol. 2020;86:9-16. doi:10.1016/j.alcohol.2020.02.166
14. Pettinati HM, Rabinowitz AR. New pharmacotherapies for treating the neurobiology of alcohol and drug addiction. Psychiatry (Edgmont). 2006;3(5):14-16.
15. Anton RF, Latham P, Voronin K, et al. Efficacy of gabapentin for the treatment of alcohol use disorder in patients with alcohol withdrawal symptoms: a randomized clinical trial. JAMA Intern Med. 2020;180(5):728-736.
16. Chockalingam L, Burnham EL, Jolley SE. Medication prescribing for alcohol use disorders during alcohol-related encounters in a Colorado regional healthcare system. Alcoholism Clin Exp Res. 2022;46(6):1094-1102.
17. Mintz CM, Hartz SM, Fisher SL, et al. A cascade of care for alcohol use disorder: using 2015-2019 National Survey on Drug Use and Health data to identify gaps in past 12-month care. Alcohol Clin Exp Res. 2021;45(6):1276-1286.
18. Esser MB, Leung G, Sherk A, et al. Estimated deaths attributable to excessive alcohol use among US adults aged 20 to 64 years, 2015 to 2019. JAMA Netw Open. 2022;5(11):e2239485. doi:10.1001/jamanet workopen.2022.39485
19. The Community Guide. CPSTF Findings for Excessive Alcohol Consumption. Updated June 27, 2022. Accessed December 1, 2022. https://www.thecommunityguide.org/pages/task-force-findings-excessive-alcohol-consumption.html
20. The Community Guide. Alcohol Excessive Consumption: Privatization of Retail Alcohol Sales. Updated June 27, 2022. Accessed December 1, 2022. https://www.thecommunityguide.org/findings/alcohol-excessive-consumption-privatization-retail-alcohol-sales.html
21. The Community Guide. What is the CPSTF? Updated June 27, 2022. Accessed December 1, 2022. https://www.thecommunityguide.org/pages/what-is-the-cpstf.html

Premedical Student Interest in and Exposure to Dermatology at Howard University
Diversity of health care professionals improves medical outcomes and quality of life in patients. 1 There is a lack of diversity in dermatology, with only 4.2% of dermatologists identifying as Hispanic and 3% identifying as African American, 2 possibly due to a lack of early exposure to dermatology among high school and undergraduate students, a low number of underrepresented students in medical school, a lack of formal mentorship programs geared to underrepresented students, and implicit biases. 1-4 Furthermore, the field is competitive, with many more applicants than available positions. In 2022, there were 851 applicants competing for 492 residency positions in dermatology. 5 Thus, it is important to educate young students about dermatology and understand root causes as to why the number of u nderrepresented in medicine (UiM) dermatologists remains stagnant.
According to Pritchett et al,4 it is crucial for dermatologists to interact with high school and college students to foster an early interest in dermatology. Many racial minority students do not progress from high school to college and then from college to medical school, which leaves a substantially reduced number of eligible UiM applicants who can progress into dermatology.6 Increasing the amount of UiM students going to medical school requires early mediation. Collaborating with pre-existing premedical school organizations through presentations and workshops is another way to promote an early interest in dermatology.4 Special consideration should be given to students who are UiM.
Among the general medical school curriculum, requirements for exposure to dermatology are not high. In one study, the median number of clinical and preclinical hours required was 10. Furthermore, 20% of 33 medical schools did not require preclinical dermatology hours (hours done before medical school rotations begin and in an academic setting), 36% required no clinical hours (rotational hours), 8% required no dermatology hours whatsoever, and only 10% required clinical dermatology rotation.3 Based on these findings, it is clear that dermatology is not well incorporated into medical school curricula. Furthermore, curricula have historically neglected to display adequate representation of skin of color.7 As a result, medical students generally have limited exposure to dermatology3 and are exposed even less to presentations of dermatologic issues in historically marginalized populations.7
Given the paucity of research on UiM students’ perceptions of dermatology prior to medical school, our cross-sectional survey study sought to evaluate the level of interest in dermatology of UiM premedical undergraduates. This survey specifically evaluated exposure to dermatology, preconceived notions about the field, and mentorship opportunities. By understanding these factors, dermatologists and dermatology residency programs can use this information to create mentorship opportunities and better adjust existing programs to meet students’ needs.
Methods
A 19-question multiple-choice survey was administered electronically (SurveyMonkey) in May 2020 to premedical students at Howard University (Washington, DC). One screening question was used: “What is your major?” Those who considered themselves a science major and/or with premedical interest were allowed to complete the survey. All students surveyed were members of the Health Professions Society at Howard University. Students who were interested in pursuing medical school were invited to respond. Approval for this study was obtained from the Howard University institutional review board (FWA00000891).
The survey was divided into 3 sections: Demographics, Exposure to Medicine and Dermatology, and Perceptions of Dermatology. The Demographics section addressed gender, age, and race/ethnicity. The Exposure to Medicine and Dermatology section addressed interest in attending medical school, shadowing experience, exposure to dermatology, and mentoring. The Perceptions of Dermatology section addressed preconceived notions about the field (eg, “dermatology is interesting and exciting”).
Statistical Analysis—The data represented are percentages based on the number of respondents who answered each question. Answers in response to “Please enter any comments” were organized into themes, and the number of respondents who discussed each theme was quantified into a table.
Results
A total of 271 survey invitations were sent to premedical students at Howard University. Students were informed of the study protocol and asked to consent before proceeding to have their responses anonymously collected. Based on the screening question, 152 participants qualified for the survey, and 152 participants completed it (response rate, 56%; completion rate, 100%). Participants were asked to complete the survey only once.
Demographics—Eighty-four percent of respondents identified as science majors, and the remaining 16% identified as nonscience premedical. Ninety-four percent of participants identified as Black or African American; 3% as Asian or Asian American; and the remaining 3% as Other. Most respondents were female (82%), 16% were male, and 2% were either nonbinary or preferred not to answer. Ninety-nine percent were aged 18 to 24 years, and 1% were aged 25 to 34 years (Table 1).

Exposure to Medicine and Dermatology—Ninety-three percent of participants planned on attending medical school, and most students developed an interest in medicine from an early age. Ninety-six percent cited that they became interested in medicine prior to beginning their undergraduate education, and 4% developed an interest as freshmen or sophomores. When asked what led to their interest in medicine, family influence had the single greatest impact on students’ decision to pursue medicine (33%). Classes/school were the second most influential factor (24%), followed by volunteering (15%), shadowing (13%), other (7%), and peer influence (3%)(Figure 1).
.")
Many (56%) premedical students surveyed had shadowing experience to varying degrees. Approximately 18% had fewer than 8 hours of shadowing experience, 24% had 8 to 40 hours, and 14% had more than 40 hours. However, many (43%) premedical students had no shadowing experience (Figure 2). Similarly, 30% of premedical students responded to having a physician as a mentor.

Regarding exposure to dermatology, 42% of premedical students had none. However, 58% of students had exposure to dermatology by being a patient themselves, 40% through seeing a dermatologist with a family member, 21% through seeing a dermatologist on television or social media, 5% through shadowing or volunteering, 3% through mentorship, and 1% through dermatology research (Figure 3).

Of students who said they were interested in dermatology (32%), 16% developed their interest before undergraduate education, while 9% developed interest in their freshman or sophomore year and 7% in their junior or senior year of undergraduate education. Three percent of respondents indicated that they had a dermatology mentorship.
Perceptions of Dermatology—To further evaluate the level of interest that UiM premedical students have in the field of dermatology, students were asked how much they agree or disagree on whether the field of dermatology is interesting. Sixty-three percent of the students agreed that the field of dermatology is interesting, 34% remained uncertain, and 3% disagreed. Additionally, students were asked whether they would consider dermatology as a career; 54% of respondents would consider dermatology as a career, 30% remained uncertain, and 16% would not consider dermatology as a career choice.
Nearly all (95%) students agreed that dermatologists do valuable work that goes beyond the scope of cosmetic procedures such as neuromodulators, fillers, chemical peels, and lasers. Some students also noted they had personal experiences interacting with a dermatologist. For example, one student described visiting the dermatologist many times to get a treatment regimen for their eczema.
Overall themes from the survey are depicted in Table 2. Major themes found in the comments included the desire for more dermatology-related opportunities, mentorship, exposure, connections, and a discussion of disparities faced by Black patients and students within dermatology. Students also expressed an interest in dermatology and the desire to learn more about the specialty.

Comment
Interest in Dermatology—In this cross-sectional survey study of 152 UiM undergraduate students, it was found that many students were interested in dermatology as a career, and more than 70% would be interested in attending events that increased exposure to the field of dermatology. Of the students who had any exposure to dermatology, less than 5% had shadowed an actual dermatologist. The survey showed that there is great potential interest in exposing UiM undergraduate students to the field of dermatology. We found that UiM students are interested in learning more about dermatology, with 80% indicating that they would be willing to participate in dermatology-focused events if they were available. Overall, students mentioned a lack of opportunities, mentorship, exposure, and connections in dermatology despite their interest in the field.
Racial Disparities in Dermatology—Additionally, students discussed disparities they encountered with dermatology due to a lack of patient-provider race concordance and the perceived difference in care when encountering a race-concordant dermatologist. One student noted that they went to multiple White dermatologists for their eczema, and “it wasn’t until I was evaluated by a Black dermatologist (diagnosed with eczema as well) [that I was] prescribed . . . the perfect medication.” Another student noted how a Black dermatologist sparked their interest in getting to know more about the field and remarked that they “think it is an important field that lacks representation for Black people.” This research stresses the need for more dermatology mentorship among UiM undergraduates.
Family Influence on Career Selection—The majority of UiM students in our study became interested in medicine because of family, which is consistent with other studies. In a cross-sectional survey of 300 Pakistani students (150 medical and 150 nonmedical), 87% of students stated that their family had an influence on their career selection.8 In another study of 15 junior doctors in Sierra Leone, the most common reasons for pursuing medicine were the desire to help and familial and peer influence.9 This again showcases how family can have a positive impact on career selection for medical professionals and highlights the need for early intervention.
Shadowing—One way in which student exposure to dermatology can be effectively increased is by shadowing. In a study evaluating a 30-week shadowing program at the Pediatric Continuity Clinic in Los Angeles, California, a greater proportion of premedical students believed they had a good understanding of the job of a resident physician after the program’s completion compared to before starting the program (an increase from 78% to 100%).10 The proportion of students reporting a good understanding of the patient-physician relationship after completing the program also increased from 33% to 78%. Furthermore, 72% of the residents stated that having the undergraduates in the clinic was a positive experience.10 Thus, increasing shadowing opportunities is one extremely effective way to increase student knowledge and awareness of and exposure to dermatology.
Dermatology Mentors—Although 32% of students were interested in dermatology, 3% of students had mentorship in dermatology. In prior studies, it has been shown that mentorship is of great importance in student success and interest in pursuing a specialty. A report from the Association of American Medical Colleges 2019 Medical School Graduation Questionnaire found that the third most influential factor (52.1%) in specialty selection was role model influence.11 In fact, having a role model is consistently one of the top 3 influences on student specialty choice and interest in the last 5 years of survey research. Some studies also have shown mentorship as a positive influence in specialty interest at the undergraduate and graduate levels. A study on an undergraduate student interest group noted that surgeon mentorship and exposure were positive factors to students’ interests in surgery.12 In fact, the Association of American Medical Colleges noted that some surgical specialties, such as orthopedic surgery, had 45% of respondents who were interested in the specialty before medical school pursue their initial preference in medical school.13 Another survey corroborated these findings; more orthopedic-bound students compared with other specialties indicated they were more likely to pursue their field because of experiences prior to medical school.14
One of the reasons students might not have been exposed to as many opportunities for mentorship in dermatology is because the specialty is one of the smaller fields in medicine and tends to be concentrated in more well-resourced metropolitan areas.15 Dermatologists make up only 1.3% of the physician workforce.16 Because there might not be as much exposure to the field, students might also explore their interests in dermatology through other fields, such as through shadowing and observing primary care physicians who often treat patients with dermatologic issues. Skin diseases are a common reason for primary care visits, and one study suggested dermatologic diseases can make up approximately 8.4% of visits in primary care.17
Moreover, only 1% of medical schools require an elective in dermatology.18 With exposure being a crucial component to pursuing the specialty, it also is important to pursue formal mentorship within the specialty itself. One study noted that formal mentorship in dermatology was important for most (67%) respondents when considering the specialty; however, 39% of respondents mentioned receiving mentorship in the past. In fact, dermatology was one of the top 3 specialties for which respondents agreed that formal mentorship was important.19
Mentorship also has been shown to provide students with a variety of opportunities to develop personally and professionally. Some of these opportunities include increased confidence in their personal and professional success, increased desire to pursue a career in a field of interest, networking opportunities, career coaching, and support and research guidance.20 A research study among medical students at Albert Einstein College of Medicine in New York, New York, found that US Medical Licensing Examination Step 1 scores, clinical grades, and the chance of not matching were important factors preventing them from applying to dermatology.21
Factors in Dermatology Residency Selection—A survey was conducted wherein 95 of 114 dermatology program directors expressed that among the top 5 criteria for dermatology resident selection were Step 1 scores and clinical grades, supporting the notion that academic factors were given a great emphasis during residency selection.22 Furthermore, among underrepresented minority medical students, a lack of diversity, the belief that minority students are seen negatively by residencies, socioeconomic factors, and not having mentors were major reasons for being dissuaded from applying to dermatology.21 These results showcase the heightened importance of mentors for underrepresented minority medical students in particular.
In graduate medical education, resources such as wikis, social networking sites, and blogs provide media through which trainees can communicate, exchange ideas, and enhance their medical knowledge.23,24 A survey of 9606 osteopathic medical students showed that 35% of 992 respondents had used social media to learn more about residencies, and 10% believed that social media had influenced their choice of residency.25 Given the impact social media has on recruitment, it also can be employed in a similar manner by dermatologists and dermatology residency programs to attract younger students to the field.
Access to More Opportunities to Learn About Dermatology—Besides shadowing and mentorship, other avenues of exposure to dermatology are possible and should be considered. In our study, 80% of students agreed that they would attend an event that increases exposure to dermatology if held by the premedical group, which suggests that students are eager to learn more about the field and want access to more opportunities, which could include learning procedures such as suturing or how to use a dermatoscope, attending guest speaker events, or participating in Learn2Derm volunteer events.
Learn2Derm was a skin cancer prevention fair first organized by medical students at George Washington University in Washington, DC. Students and residents sought to deliver sunscreens to underserved areas in Washington, DC, as well as teach residents about the importance of skin health. Participating in such events could be an excellent opportunity for all students to gain exposure to important topics in dermatology.26
General Opinions of Dermatology—General opinions about dermatology and medicine were collected from the students through the optional “Additional Comments” section. Major themes found in the comments included the desire for more opportunities, mentorship, exposure, connections, and a discussion of disparities faced by Black patients/students within dermatology. Students also expressed an interest in dermatology and the desire to learn more about the specialty. From these themes, it can be gleaned that students are open to and eager for more opportunities to gain exposure and connections, and increasing the number of minority dermatologists is of importance.
Limitations—An important limitation of this study was the potential for selection bias, as the sample was chosen from a population at one university, which is not representative of the general population. Further, we only sampled students who were premedical and likely from a UiM racial group due to the demographics of the student population at the university, but given that the goal of the survey was to understand exposure to dermatology in underrepresented groups, we believe it was the appropriate population to target. Additionally, results were not compared with other more represented racial groups to see if these findings were unique to UiM undergraduate students.
Conclusion
Among premedical students, dermatology is an area of great interest with minimal opportunities available for exposure and learning because it is a smaller specialty with fewer experiences available for shadowing and mentorship. Although most UiM premedical students who were surveyed were exposed to the field through either the media or being a dermatology patient, fewer were exposed to the field through clinical experiences (such as shadowing) or mentorship. Most respondents found dermatology to be interesting and have considered pursuing it as a career. In particular, race-concordant mentoring in dermatologic care was valued by many students in garnering their interest in the field.
Most UiM students wanted more exposure to dermatology-related opportunities as well as mentorship and connections. Increasing shadowing, research, pipeline programs, and general events geared to dermatology are some modalities that could help improve exposure to dermatology for UiM students, especially for those interested in pursuing the field. This increased exposure can help positively influence more UiM students to pursue dermatology and help close the diversity gap in the field. Additionally, many were interested in attending potential dermatology informational events.
Given the fact that dermatology is a small field and mentorship may be hard to access, increasing informational events may be a more reasonable approach to inspiring and supporting interest. These events could include learning how to use certain tools and techniques, guest speaker events, or participating in educational volunteer efforts such as Learn2Derm.26
Future research should focus on identifying beneficial factors of UiM premedical students who retain an interest in dermatology throughout their careers and actually apply to dermatology programs and become dermatologists. Those who do not apply to the specialty can be identified to understand potential dissuading factors and obstacles. Ultimately, more research and development of exposure opportunities, including mentorship programs and informational events, can be used to close the gap and improve diversity and health outcomes in dermatology.
- Pandya AG, Alexis AF, Berger TG, et al. Increasing racial and ethnic diversity in dermatology: a call to action. J Am Acad Dermatol. 2016;74:584-587.
- Bae G, Qiu M, Reese E, et al. Changes in sex and ethnic diversity in dermatology residents over multiple decades. JAMA Dermatol. 2016;152:92-94.
- McCleskey PE, Gilson RT, DeVillez RL. Medical student core curriculum in dermatology survey. J Am Acad Dermatol. 2009;61:30-35.e4.
- Pritchett EN, Pandya AG, Ferguson NN, et al. Diversity in dermatology: roadmap for improvement. J Am Acad Dermatol. 2018;79:337-341.
- National Resident Matching Program. Results and Data: 2022 Main Residency Match. National Resident Matching Program; 2022. Accessed March 19, 2023. https://www.nrmp.org/wp-content/uploads/2022/11/2022-Main-Match-Results-and-Data-Final-Revised.pdf
- 6. Akhiyat S, Cardwell L, Sokumbi O. Why dermatology is the second least diverse specialty in medicine: how did we get here? Clin Dermatol. 2020;38:310-315.
- Perlman KL, Williams NM, Egbeto IA, et al. Skin of color lacks representation in medical student resources: a cross-sectional study. Int J Womens Dermatol. 2021;7:195-196.
- Saad SM, Fatima SS, Faruqi AA. Students’ views regarding selecting medicine as a profession. J Pak Med Assoc. 2011;61:832-836.
- Woodward A, Thomas S, Jalloh M, et al. Reasons to pursue a career in medicine: a qualitative study in Sierra Leone. Global Health Res Policy. 2017;2:34.
- Thang C, Barnette NM, Patel KS, et al. Association of shadowing program for undergraduate premedical students with improvements in understanding medical education and training. Cureus. 2019;11:E6396.
- Murphy B. The 11 factors that influence med student specialty choice. American Medical Association. December 1, 2020. Accessed March 14, 2023. https://www.ama-assn.org/residents-students/specialty-profiles/11-factors-influence-med-student-specialty-choice
- Vakayil V, Chandrashekar M, Hedberg J, et al. An undergraduate surgery interest group: introducing premedical students to the practice of surgery. Adv Med Educ Pract. 2020;13:339-349.
- 2021 Report on Residents Executive Summary. Association of American Medical Colleges; 2021. Accessed March 14, 2023. https://www.aamc.org/data-reports/students-residents/data/report-residents/2021/executive-summary
- Johnson AL, Sharma J, Chinchilli VM, et al. Why do medical students choose orthopaedics as a career? J Bone Joint Surg Am. 2012;94:e78.
- Feng H, Berk-Krauss J, Feng PW, et al. Comparison of dermatologist density between urban and rural counties in the United States. JAMA Dermatol. 2018;154:1265-1271.
- Active Physicians With a U.S. Doctor of Medicine (U.S. MD) Degree by Specialty, 2019. Association of American Medical Colleges; 2019. Accessed March 14, 2023. https://www.aamc.org/data-reports/workforce/interactive-data/active-physicians-us-doctor-medicine-us-md-degree-specialty-2019
- Rübsam ML, Esch M, Baum E, et al. Diagnosing skin disease in primary care: a qualitative study of GPs’ approaches. Fam Pract. 2015;32:591-595.
- Cahn BA, Harper HE, Halverstam CP, et al. Current status of dermatologic education in US medical schools. JAMA Dermatol. 2020;156:468-470.
- Mylona E, Brubaker L, Williams VN, et al. Does formal mentoring for faculty members matter? a survey of clinical faculty members. Med Educ. 2016;50:670-681.
- Ratnapalan S. Mentoring in medicine. Can Fam Physician. 2010;56:198.
- Soliman YS, Rzepecki AK, Guzman AK, et al. Understanding perceived barriers of minority medical students pursuing a career in dermatology. JAMA Dermatol. 2019;155:252-254.
- Gorouhi F, Alikhan A, Rezaei A, et al. Dermatology residency selection criteria with an emphasis on program characteristics: a national program director survey. Dermatol Res Pract. 2014;2014:692760.
- Choo EK, Ranney ML, Chan TM, et al. Twitter as a tool for communication and knowledge exchange in academic medicine: a guide for skeptics and novices. Med Teach. 2015;37:411-416.
- McGowan BS, Wasko M, Vartabedian BS, et al. Understanding the factors that influence the adoption and meaningful use of social media by physicians to share medical information. J Med Internet Res. 2012;14:e117.
- Schweitzer J, Hannan A, Coren J. The role of social networking web sites in influencing residency decisions. J Am Osteopath Assoc. 2012;112:673-679.
- Medical students lead event addressing disparity in skin cancer morbidity and mortality. Dermatology News. August 19, 2021. Accessed March 14, 2023. https://www.mdedge.com/dermatology/article/244488/diversity-medicine/medical-students-lead-event-addressing-disparity-skin
Diversity of health care professionals improves medical outcomes and quality of life in patients. 1 There is a lack of diversity in dermatology, with only 4.2% of dermatologists identifying as Hispanic and 3% identifying as African American, 2 possibly due to a lack of early exposure to dermatology among high school and undergraduate students, a low number of underrepresented students in medical school, a lack of formal mentorship programs geared to underrepresented students, and implicit biases. 1-4 Furthermore, the field is competitive, with many more applicants than available positions. In 2022, there were 851 applicants competing for 492 residency positions in dermatology. 5 Thus, it is important to educate young students about dermatology and understand root causes as to why the number of u nderrepresented in medicine (UiM) dermatologists remains stagnant.
According to Pritchett et al,4 it is crucial for dermatologists to interact with high school and college students to foster an early interest in dermatology. Many racial minority students do not progress from high school to college and then from college to medical school, which leaves a substantially reduced number of eligible UiM applicants who can progress into dermatology.6 Increasing the amount of UiM students going to medical school requires early mediation. Collaborating with pre-existing premedical school organizations through presentations and workshops is another way to promote an early interest in dermatology.4 Special consideration should be given to students who are UiM.
Among the general medical school curriculum, requirements for exposure to dermatology are not high. In one study, the median number of clinical and preclinical hours required was 10. Furthermore, 20% of 33 medical schools did not require preclinical dermatology hours (hours done before medical school rotations begin and in an academic setting), 36% required no clinical hours (rotational hours), 8% required no dermatology hours whatsoever, and only 10% required clinical dermatology rotation.3 Based on these findings, it is clear that dermatology is not well incorporated into medical school curricula. Furthermore, curricula have historically neglected to display adequate representation of skin of color.7 As a result, medical students generally have limited exposure to dermatology3 and are exposed even less to presentations of dermatologic issues in historically marginalized populations.7
Given the paucity of research on UiM students’ perceptions of dermatology prior to medical school, our cross-sectional survey study sought to evaluate the level of interest in dermatology of UiM premedical undergraduates. This survey specifically evaluated exposure to dermatology, preconceived notions about the field, and mentorship opportunities. By understanding these factors, dermatologists and dermatology residency programs can use this information to create mentorship opportunities and better adjust existing programs to meet students’ needs.
Methods
A 19-question multiple-choice survey was administered electronically (SurveyMonkey) in May 2020 to premedical students at Howard University (Washington, DC). One screening question was used: “What is your major?” Those who considered themselves a science major and/or with premedical interest were allowed to complete the survey. All students surveyed were members of the Health Professions Society at Howard University. Students who were interested in pursuing medical school were invited to respond. Approval for this study was obtained from the Howard University institutional review board (FWA00000891).
The survey was divided into 3 sections: Demographics, Exposure to Medicine and Dermatology, and Perceptions of Dermatology. The Demographics section addressed gender, age, and race/ethnicity. The Exposure to Medicine and Dermatology section addressed interest in attending medical school, shadowing experience, exposure to dermatology, and mentoring. The Perceptions of Dermatology section addressed preconceived notions about the field (eg, “dermatology is interesting and exciting”).
Statistical Analysis—The data represented are percentages based on the number of respondents who answered each question. Answers in response to “Please enter any comments” were organized into themes, and the number of respondents who discussed each theme was quantified into a table.
Results
A total of 271 survey invitations were sent to premedical students at Howard University. Students were informed of the study protocol and asked to consent before proceeding to have their responses anonymously collected. Based on the screening question, 152 participants qualified for the survey, and 152 participants completed it (response rate, 56%; completion rate, 100%). Participants were asked to complete the survey only once.
Demographics—Eighty-four percent of respondents identified as science majors, and the remaining 16% identified as nonscience premedical. Ninety-four percent of participants identified as Black or African American; 3% as Asian or Asian American; and the remaining 3% as Other. Most respondents were female (82%), 16% were male, and 2% were either nonbinary or preferred not to answer. Ninety-nine percent were aged 18 to 24 years, and 1% were aged 25 to 34 years (Table 1).
Exposure to Medicine and Dermatology—Ninety-three percent of participants planned on attending medical school, and most students developed an interest in medicine from an early age. Ninety-six percent cited that they became interested in medicine prior to beginning their undergraduate education, and 4% developed an interest as freshmen or sophomores. When asked what led to their interest in medicine, family influence had the single greatest impact on students’ decision to pursue medicine (33%). Classes/school were the second most influential factor (24%), followed by volunteering (15%), shadowing (13%), other (7%), and peer influence (3%)(Figure 1).
Many (56%) premedical students surveyed had shadowing experience to varying degrees. Approximately 18% had fewer than 8 hours of shadowing experience, 24% had 8 to 40 hours, and 14% had more than 40 hours. However, many (43%) premedical students had no shadowing experience (Figure 2). Similarly, 30% of premedical students responded to having a physician as a mentor.
Regarding exposure to dermatology, 42% of premedical students had none. However, 58% of students had exposure to dermatology by being a patient themselves, 40% through seeing a dermatologist with a family member, 21% through seeing a dermatologist on television or social media, 5% through shadowing or volunteering, 3% through mentorship, and 1% through dermatology research (Figure 3).
Of students who said they were interested in dermatology (32%), 16% developed their interest before undergraduate education, while 9% developed interest in their freshman or sophomore year and 7% in their junior or senior year of undergraduate education. Three percent of respondents indicated that they had a dermatology mentorship.
Perceptions of Dermatology—To further evaluate the level of interest that UiM premedical students have in the field of dermatology, students were asked how much they agree or disagree on whether the field of dermatology is interesting. Sixty-three percent of the students agreed that the field of dermatology is interesting, 34% remained uncertain, and 3% disagreed. Additionally, students were asked whether they would consider dermatology as a career; 54% of respondents would consider dermatology as a career, 30% remained uncertain, and 16% would not consider dermatology as a career choice.
Nearly all (95%) students agreed that dermatologists do valuable work that goes beyond the scope of cosmetic procedures such as neuromodulators, fillers, chemical peels, and lasers. Some students also noted they had personal experiences interacting with a dermatologist. For example, one student described visiting the dermatologist many times to get a treatment regimen for their eczema.
Overall themes from the survey are depicted in Table 2. Major themes found in the comments included the desire for more dermatology-related opportunities, mentorship, exposure, connections, and a discussion of disparities faced by Black patients and students within dermatology. Students also expressed an interest in dermatology and the desire to learn more about the specialty.
Comment
Interest in Dermatology—In this cross-sectional survey study of 152 UiM undergraduate students, it was found that many students were interested in dermatology as a career, and more than 70% would be interested in attending events that increased exposure to the field of dermatology. Of the students who had any exposure to dermatology, less than 5% had shadowed an actual dermatologist. The survey showed that there is great potential interest in exposing UiM undergraduate students to the field of dermatology. We found that UiM students are interested in learning more about dermatology, with 80% indicating that they would be willing to participate in dermatology-focused events if they were available. Overall, students mentioned a lack of opportunities, mentorship, exposure, and connections in dermatology despite their interest in the field.
Racial Disparities in Dermatology—Additionally, students discussed disparities they encountered with dermatology due to a lack of patient-provider race concordance and the perceived difference in care when encountering a race-concordant dermatologist. One student noted that they went to multiple White dermatologists for their eczema, and “it wasn’t until I was evaluated by a Black dermatologist (diagnosed with eczema as well) [that I was] prescribed . . . the perfect medication.” Another student noted how a Black dermatologist sparked their interest in getting to know more about the field and remarked that they “think it is an important field that lacks representation for Black people.” This research stresses the need for more dermatology mentorship among UiM undergraduates.
Family Influence on Career Selection—The majority of UiM students in our study became interested in medicine because of family, which is consistent with other studies. In a cross-sectional survey of 300 Pakistani students (150 medical and 150 nonmedical), 87% of students stated that their family had an influence on their career selection.8 In another study of 15 junior doctors in Sierra Leone, the most common reasons for pursuing medicine were the desire to help and familial and peer influence.9 This again showcases how family can have a positive impact on career selection for medical professionals and highlights the need for early intervention.
Shadowing—One way in which student exposure to dermatology can be effectively increased is by shadowing. In a study evaluating a 30-week shadowing program at the Pediatric Continuity Clinic in Los Angeles, California, a greater proportion of premedical students believed they had a good understanding of the job of a resident physician after the program’s completion compared to before starting the program (an increase from 78% to 100%).10 The proportion of students reporting a good understanding of the patient-physician relationship after completing the program also increased from 33% to 78%. Furthermore, 72% of the residents stated that having the undergraduates in the clinic was a positive experience.10 Thus, increasing shadowing opportunities is one extremely effective way to increase student knowledge and awareness of and exposure to dermatology.
Dermatology Mentors—Although 32% of students were interested in dermatology, 3% of students had mentorship in dermatology. In prior studies, it has been shown that mentorship is of great importance in student success and interest in pursuing a specialty. A report from the Association of American Medical Colleges 2019 Medical School Graduation Questionnaire found that the third most influential factor (52.1%) in specialty selection was role model influence.11 In fact, having a role model is consistently one of the top 3 influences on student specialty choice and interest in the last 5 years of survey research. Some studies also have shown mentorship as a positive influence in specialty interest at the undergraduate and graduate levels. A study on an undergraduate student interest group noted that surgeon mentorship and exposure were positive factors to students’ interests in surgery.12 In fact, the Association of American Medical Colleges noted that some surgical specialties, such as orthopedic surgery, had 45% of respondents who were interested in the specialty before medical school pursue their initial preference in medical school.13 Another survey corroborated these findings; more orthopedic-bound students compared with other specialties indicated they were more likely to pursue their field because of experiences prior to medical school.14
One of the reasons students might not have been exposed to as many opportunities for mentorship in dermatology is because the specialty is one of the smaller fields in medicine and tends to be concentrated in more well-resourced metropolitan areas.15 Dermatologists make up only 1.3% of the physician workforce.16 Because there might not be as much exposure to the field, students might also explore their interests in dermatology through other fields, such as through shadowing and observing primary care physicians who often treat patients with dermatologic issues. Skin diseases are a common reason for primary care visits, and one study suggested dermatologic diseases can make up approximately 8.4% of visits in primary care.17
Moreover, only 1% of medical schools require an elective in dermatology.18 With exposure being a crucial component to pursuing the specialty, it also is important to pursue formal mentorship within the specialty itself. One study noted that formal mentorship in dermatology was important for most (67%) respondents when considering the specialty; however, 39% of respondents mentioned receiving mentorship in the past. In fact, dermatology was one of the top 3 specialties for which respondents agreed that formal mentorship was important.19
Mentorship also has been shown to provide students with a variety of opportunities to develop personally and professionally. Some of these opportunities include increased confidence in their personal and professional success, increased desire to pursue a career in a field of interest, networking opportunities, career coaching, and support and research guidance.20 A research study among medical students at Albert Einstein College of Medicine in New York, New York, found that US Medical Licensing Examination Step 1 scores, clinical grades, and the chance of not matching were important factors preventing them from applying to dermatology.21
Factors in Dermatology Residency Selection—A survey was conducted wherein 95 of 114 dermatology program directors expressed that among the top 5 criteria for dermatology resident selection were Step 1 scores and clinical grades, supporting the notion that academic factors were given a great emphasis during residency selection.22 Furthermore, among underrepresented minority medical students, a lack of diversity, the belief that minority students are seen negatively by residencies, socioeconomic factors, and not having mentors were major reasons for being dissuaded from applying to dermatology.21 These results showcase the heightened importance of mentors for underrepresented minority medical students in particular.
In graduate medical education, resources such as wikis, social networking sites, and blogs provide media through which trainees can communicate, exchange ideas, and enhance their medical knowledge.23,24 A survey of 9606 osteopathic medical students showed that 35% of 992 respondents had used social media to learn more about residencies, and 10% believed that social media had influenced their choice of residency.25 Given the impact social media has on recruitment, it also can be employed in a similar manner by dermatologists and dermatology residency programs to attract younger students to the field.
Access to More Opportunities to Learn About Dermatology—Besides shadowing and mentorship, other avenues of exposure to dermatology are possible and should be considered. In our study, 80% of students agreed that they would attend an event that increases exposure to dermatology if held by the premedical group, which suggests that students are eager to learn more about the field and want access to more opportunities, which could include learning procedures such as suturing or how to use a dermatoscope, attending guest speaker events, or participating in Learn2Derm volunteer events.
Learn2Derm was a skin cancer prevention fair first organized by medical students at George Washington University in Washington, DC. Students and residents sought to deliver sunscreens to underserved areas in Washington, DC, as well as teach residents about the importance of skin health. Participating in such events could be an excellent opportunity for all students to gain exposure to important topics in dermatology.26
General Opinions of Dermatology—General opinions about dermatology and medicine were collected from the students through the optional “Additional Comments” section. Major themes found in the comments included the desire for more opportunities, mentorship, exposure, connections, and a discussion of disparities faced by Black patients/students within dermatology. Students also expressed an interest in dermatology and the desire to learn more about the specialty. From these themes, it can be gleaned that students are open to and eager for more opportunities to gain exposure and connections, and increasing the number of minority dermatologists is of importance.
Limitations—An important limitation of this study was the potential for selection bias, as the sample was chosen from a population at one university, which is not representative of the general population. Further, we only sampled students who were premedical and likely from a UiM racial group due to the demographics of the student population at the university, but given that the goal of the survey was to understand exposure to dermatology in underrepresented groups, we believe it was the appropriate population to target. Additionally, results were not compared with other more represented racial groups to see if these findings were unique to UiM undergraduate students.
Conclusion
Among premedical students, dermatology is an area of great interest with minimal opportunities available for exposure and learning because it is a smaller specialty with fewer experiences available for shadowing and mentorship. Although most UiM premedical students who were surveyed were exposed to the field through either the media or being a dermatology patient, fewer were exposed to the field through clinical experiences (such as shadowing) or mentorship. Most respondents found dermatology to be interesting and have considered pursuing it as a career. In particular, race-concordant mentoring in dermatologic care was valued by many students in garnering their interest in the field.
Most UiM students wanted more exposure to dermatology-related opportunities as well as mentorship and connections. Increasing shadowing, research, pipeline programs, and general events geared to dermatology are some modalities that could help improve exposure to dermatology for UiM students, especially for those interested in pursuing the field. This increased exposure can help positively influence more UiM students to pursue dermatology and help close the diversity gap in the field. Additionally, many were interested in attending potential dermatology informational events.
Given the fact that dermatology is a small field and mentorship may be hard to access, increasing informational events may be a more reasonable approach to inspiring and supporting interest. These events could include learning how to use certain tools and techniques, guest speaker events, or participating in educational volunteer efforts such as Learn2Derm.26
Future research should focus on identifying beneficial factors of UiM premedical students who retain an interest in dermatology throughout their careers and actually apply to dermatology programs and become dermatologists. Those who do not apply to the specialty can be identified to understand potential dissuading factors and obstacles. Ultimately, more research and development of exposure opportunities, including mentorship programs and informational events, can be used to close the gap and improve diversity and health outcomes in dermatology.
- Pandya AG, Alexis AF, Berger TG, et al. Increasing racial and ethnic diversity in dermatology: a call to action. J Am Acad Dermatol. 2016;74:584-587.
- Bae G, Qiu M, Reese E, et al. Changes in sex and ethnic diversity in dermatology residents over multiple decades. JAMA Dermatol. 2016;152:92-94.
- McCleskey PE, Gilson RT, DeVillez RL. Medical student core curriculum in dermatology survey. J Am Acad Dermatol. 2009;61:30-35.e4.
- Pritchett EN, Pandya AG, Ferguson NN, et al. Diversity in dermatology: roadmap for improvement. J Am Acad Dermatol. 2018;79:337-341.
- National Resident Matching Program. Results and Data: 2022 Main Residency Match. National Resident Matching Program; 2022. Accessed March 19, 2023. https://www.nrmp.org/wp-content/uploads/2022/11/2022-Main-Match-Results-and-Data-Final-Revised.pdf
- 6. Akhiyat S, Cardwell L, Sokumbi O. Why dermatology is the second least diverse specialty in medicine: how did we get here? Clin Dermatol. 2020;38:310-315.
- Perlman KL, Williams NM, Egbeto IA, et al. Skin of color lacks representation in medical student resources: a cross-sectional study. Int J Womens Dermatol. 2021;7:195-196.
- Saad SM, Fatima SS, Faruqi AA. Students’ views regarding selecting medicine as a profession. J Pak Med Assoc. 2011;61:832-836.
- Woodward A, Thomas S, Jalloh M, et al. Reasons to pursue a career in medicine: a qualitative study in Sierra Leone. Global Health Res Policy. 2017;2:34.
- Thang C, Barnette NM, Patel KS, et al. Association of shadowing program for undergraduate premedical students with improvements in understanding medical education and training. Cureus. 2019;11:E6396.
- Murphy B. The 11 factors that influence med student specialty choice. American Medical Association. December 1, 2020. Accessed March 14, 2023. https://www.ama-assn.org/residents-students/specialty-profiles/11-factors-influence-med-student-specialty-choice
- Vakayil V, Chandrashekar M, Hedberg J, et al. An undergraduate surgery interest group: introducing premedical students to the practice of surgery. Adv Med Educ Pract. 2020;13:339-349.
- 2021 Report on Residents Executive Summary. Association of American Medical Colleges; 2021. Accessed March 14, 2023. https://www.aamc.org/data-reports/students-residents/data/report-residents/2021/executive-summary
- Johnson AL, Sharma J, Chinchilli VM, et al. Why do medical students choose orthopaedics as a career? J Bone Joint Surg Am. 2012;94:e78.
- Feng H, Berk-Krauss J, Feng PW, et al. Comparison of dermatologist density between urban and rural counties in the United States. JAMA Dermatol. 2018;154:1265-1271.
- Active Physicians With a U.S. Doctor of Medicine (U.S. MD) Degree by Specialty, 2019. Association of American Medical Colleges; 2019. Accessed March 14, 2023. https://www.aamc.org/data-reports/workforce/interactive-data/active-physicians-us-doctor-medicine-us-md-degree-specialty-2019
- Rübsam ML, Esch M, Baum E, et al. Diagnosing skin disease in primary care: a qualitative study of GPs’ approaches. Fam Pract. 2015;32:591-595.
- Cahn BA, Harper HE, Halverstam CP, et al. Current status of dermatologic education in US medical schools. JAMA Dermatol. 2020;156:468-470.
- Mylona E, Brubaker L, Williams VN, et al. Does formal mentoring for faculty members matter? a survey of clinical faculty members. Med Educ. 2016;50:670-681.
- Ratnapalan S. Mentoring in medicine. Can Fam Physician. 2010;56:198.
- Soliman YS, Rzepecki AK, Guzman AK, et al. Understanding perceived barriers of minority medical students pursuing a career in dermatology. JAMA Dermatol. 2019;155:252-254.
- Gorouhi F, Alikhan A, Rezaei A, et al. Dermatology residency selection criteria with an emphasis on program characteristics: a national program director survey. Dermatol Res Pract. 2014;2014:692760.
- Choo EK, Ranney ML, Chan TM, et al. Twitter as a tool for communication and knowledge exchange in academic medicine: a guide for skeptics and novices. Med Teach. 2015;37:411-416.
- McGowan BS, Wasko M, Vartabedian BS, et al. Understanding the factors that influence the adoption and meaningful use of social media by physicians to share medical information. J Med Internet Res. 2012;14:e117.
- Schweitzer J, Hannan A, Coren J. The role of social networking web sites in influencing residency decisions. J Am Osteopath Assoc. 2012;112:673-679.
- Medical students lead event addressing disparity in skin cancer morbidity and mortality. Dermatology News. August 19, 2021. Accessed March 14, 2023. https://www.mdedge.com/dermatology/article/244488/diversity-medicine/medical-students-lead-event-addressing-disparity-skin
Practice Points
- Many premedical students desire more exposure to dermatology than they have been receiving, particularly in mentorship and shadowing. Most exposure has been through social media or as patients in a dermatology clinic.
- Diverse mentorship and diversity of dermatology care are important to underrepresented in medicine premedical students and needs to be further incorporated.
Relationships Between Residence Characteristics and Nursing Home Compare Database Quality Measures
From the University of Nebraska, Lincoln (Mr. Puckett and Dr. Ryherd), University of Nebraska Medical Center, Omaha (Dr. Manley), and the University of Nebraska, Omaha (Dr. Ryan).
ABSTRACT
Objective: This study evaluated relationships between physical characteristics of nursing home residences and quality-of-care measures.
Design: This was a cross-sectional ecologic study. The dependent variables were 5 Centers for Medicare & Medicaid Services (CMS) Nursing Home Compare database long-stay quality measures (QMs) during 2019: percentage of residents who displayed depressive symptoms, percentage of residents who were physically restrained, percentage of residents who experienced 1 or more falls resulting in injury, percentage of residents who received antipsychotic medication, and percentage of residents who received anti-anxiety medication. The independent variables were 4 residence characteristics: ownership type, size, occupancy, and region within the United States. We explored how different types of each residence characteristic compare for each QM.
Setting, participants, and measurements: Quality measure values from 15,420 CMS-supported nursing homes across the United States averaged over the 4 quarters of 2019 reporting were used. Welch’s analysis of variance was performed to examine whether the mean QM values for groups within each residential characteristic were statistically different.
Results: Publicly owned and low-occupancy residences had the highest mean QM values, indicating the poorest performance. Nonprofit and high-occupancy residences generally had the lowest (ie, best) mean QM values. There were significant differences in mean QM values among nursing home sizes and regions.
Conclusion: This study suggests that residence characteristics are related to 5 nursing home QMs. Results suggest that physical characteristics may be related to overall quality of life in nursing homes.
Keywords: quality of care, quality measures, residence characteristics, Alzheimer’s disease and related dementias.
More than 55 million people worldwide are living with Alzheimer’s disease and related dementias (ADRD).1 With the aging of the Baby Boomer population, this number is expected to rise to more than 78 million worldwide by 2030.1 Given the growing number of cognitively impaired older adults, there is an increased need for residences designed for the specialized care of this population. Although there are dozens of living options for the elderly, and although most specialized establishments have the resources to meet the immediate needs of their residents, many facilities lack universal design features that support a high quality of life for someone with ADRD or mild cognitive impairment. Previous research has shown relationships between behavioral and psychological symptoms of dementia (BPSD) and environmental characteristics such as acoustics, lighting, and indoor air temperature.2,3 Physical behaviors of BPSD, including aggression and wandering, and psychological symptoms, such as depression, anxiety, and delusions, put residents at risk of injury.4 Additionally, BPSD is correlated with caregiver burden and stress.5-8 Patients with dementia may also experience a lower stress threshold, changes in perception of space, and decreased short-term memory, creating environmental difficulties for those with ADRD9 that lead them to exhibit BPSD due to poor environmental design. Thus, there is a need to learn more about design features that minimize BPSD and promote a high quality of life for those with ADRD.10
Although research has shown relationships between physical environmental characteristics and BPSD, in this work we study relationships between possible BPSD indicators and 4 residence-level characteristics: ownership type, size, occupancy, and region in the United States (determined by location of the Centers for Medicare & Medicaid Services [CMS] regional offices). We analyzed data from the CMS Nursing Home Compare database for the year 2019.11 This database publishes quarterly data and star ratings for quality-of-care measures (QMs), staffing levels, and health inspections for every nursing home supported by CMS. Previous research has investigated the accuracy of QM reporting for resident falls, the impact of residential characteristics on administration of antipsychotic medication, the influence of profit status on resident outcomes and quality of care, and the effect of nursing home size on quality of life.12-16 Additionally, research suggests that residential characteristics such as size and location could be associated with infection control in nursing homes.17
Certain QMs, such as psychotropic drug administration, resident falls, and physical restraint, provide indicators of agitation, disorientation, or aggression, which are often signals of BPSD episodes. We hypothesized that residence types are associated with different QM scores, which could indicate different occurrences of BPSD. We selected 5 QMs for long-stay residents that could potentially be used as indicators of BPSD. Short-stay resident data were not included in this work to control for BPSD that could be a result of sheer unfamiliarity with the environment and confusion from being in a new home.
Methods
Design and Data Collection
This was a cross-sectional ecologic study aimed at exploring relationships between aggregate residential characteristics and QMs. Data were retrieved from the 2019 annual archives found in the CMS provider data catalog on nursing homes, including rehabilitation services.11 The dataset provides general residence information, such as ownership, number of beds, number of residents, and location, as well as residence quality metrics, such as QMs, staffing data, and inspection data. Residence characteristics and 4-quarter averages of QMs were retrieved and used as cross-sectional data. The data used are from 15,420 residences across the United States. Nursing homes located in Guam, the US Pacific Territories, Puerto Rico, and the US Virgin Islands, while supported by CMS and included in the dataset, were excluded from the study due to a severe absence of QM data.
Dependent Variables
We investigated 5 QMs that were averaged across the 4 quarters of 2019. The QMs used as dependent variables were percentage of residents who displayed depressive symptoms (depression), percentage of residents who were physically restrained (restraint), percentage of residents who experienced 1 or more falls resulting in a major injury (falls), percentage of residents who received antipsychotic medication (antipsychotic medication), and percentage of residents who received anti-anxiety or hypnotic medication (anti-anxiety medication).
A total of 2471 QM values were unreported across the 5 QM analyzed: 501 residences did not report depression data; 479 did not report restraint data; 477 did not report falls data; 508 did not report antipsychotic medication data; and 506 did not report anti-anxiety medication data. A residence with a missing QM value was excluded from that respective analysis.
To assess the relationships among the different QMs, a Pearson correlation coefficient r was computed for each unique pair of QMs (Figure). All QMs studied were found to be very weakly or weakly correlated with one another using the Evans classification for very weak and weak correlations (r < 0.20 and 0.20 < r < 0.39, respectively).18

Independent Variables
A total of 15,420 residences were included in the study. Seventy-nine residences did not report occupancy data, however, so those residences were excluded from the occupancy analyses. We categorized the ownership of each nursing home as for-profit, nonprofit, or public. We categorized nursing home size, based on quartiles of the size distribution, as large (> 127 beds), medium (64 to 126 beds), and small (< 64 beds). This method for categorizing the residential characteristics was similar to that used in previous work.19 Similarly, we categorized nursing home occupancy as high (> 92% occupancy), medium (73% to 91% occupancy), and low (< 73% occupancy) based on quartiles of the occupancy distribution. For the regional analysis, we grouped states together based on the CMS regional offices: Atlanta, Georgia; Boston, Massachusetts; Chicago, Illinois; Dallas, Texas; Denver, Colorado; Kansas City, Missouri; New York, New York; Philadelphia, Pennsylvania; San Francisco, California; and Seattle, Washington.20
Analyses
We used Levene’s test to determine whether variances among the residential groups were equal for each QM, using an a priori α = 0.05. For all 20 tests conducted (4 residential characteristics for all 5 QMs), the resulting F-statistics were significant, indicating that the assumption of homogeneity of variance was not met.
We therefore used Welch’s analysis of variance (ANOVA) to evaluate whether the groups within each residential characteristic were the same on their QM means. For example, we tested whether for-profit, nonprofit, and public residences had significantly different mean depression rates. For statistically significant differences, a Games-Howell post-hoc test was conducted to test the difference between all unique pairwise comparisons. An a priori α = 0.05 was used for both Welch’s ANOVA and post-hoc testing. All analyses were conducted in RStudio Version 1.2.5033 (Posit Software, PBC).
Results
Mean Differences
Mean QM scores for the 5 QMs investigated, grouped by residential characteristic for the 2019 year of reporting, are shown in Table 1. It should be noted that the number of residences that reported occupancy data (n = 15,341) does not equal the total number of residences included in the study (N = 15,420) because 79 residences did not report occupancy data. For all QMs reported in Table 1, lower scores are better. Table 2 and Table 3 show results from pairwise comparisons of mean differences for the different residential characteristic and QM groupings. Mean differences and 95% CI are presented along with an indication of statistical significance (when applicable).

Ownership
Nonprofit residences had significantly lower (ie, better) mean scores than for-profit and public residences for 3 QMs: resident depression, antipsychotic medication use, and anti-anxiety medication use. For-profit and public residences did not significantly differ in their mean values for these QMs. For-profit residences had a significantly lower mean score for resident falls than both nonprofit and public residences, but no significant difference existed between scores for nonprofit and public residence falls. There were no statistically significant differences between mean restraint scores among the ownership types.

Size
Large (ie, high-capacity) residences had a significantly higher mean depression score than both medium and small residences, but there was not a significant difference between medium and small residences. Large residences had the significantly lowest mean score for resident falls, and medium residences scored significantly lower than small residences. Medium residences had a significantly higher mean score for anti-anxiety medication use than both small and large residences, but there was no significant difference between small and large residences. There were no statistically significant differences between mean scores for restraint and antipsychotic medication use among the nursing home sizes.

Occupancy
The mean scores for 4 out of the 5 QMs exhibited similar relationships with occupancy rates: resident depression, falls, and antipsychotic and anti-anxiety medication use. Low-occupancy residences consistently scored significantly higher than both medium- and high-occupancy residences, and medium-occupancy residences consistently scored significantly higher than high-occupancy residences. On average, high-occupancy (≥ 92%) residences reported better QM scores than low-occupancy (< 73%) and medium-occupancy (73% to 91%) residences for all the QMs studied except physical restraint, which yielded no significant results. These findings indicate a possible inverse relationship between building occupancy rate and these 4 QMs.
Region
Pairwise comparisons of mean QM scores by region are shown in Table 3. The Chicago region had a significantly higher mean depression score than all other regions, while the San Francisco region’s score was significantly lower than all other regions, except Atlanta and Boston. The Kansas City region had a significantly higher mean score for resident falls than all other regions, with the exception of Denver, and the San Francisco region scored significantly lower than all other regions in falls. The Boston region had a significantly higher mean score for administering antipsychotic medication than all other regions, except for Kansas City and Seattle, and the New York and San Francisco regions both had significantly lower scores than all other regions except for each other. The Atlanta region reported a significantly higher mean score for administering antianxiety medication than all other regions, and the Seattle region’s score for anti-anxiety medication use was significantly lower than all other regions except for San Francisco.
Discussion
This study presented mean percentages for 5 QMs reported in the Nursing Home Compare database for the year 2019: depression, restraint, falls, antipsychotic medication use, and anti-anxiety medication use. We investigated these scores by 4 residential characteristics: ownership type, size, occupancy, and region. In general, publicly owned and low-occupancy residences had the highest scores, and thus the poorest performances, for the 5 chosen QMs during 2019. Nonprofit and high-occupancy residences generally had the lowest (ie, better) scores, and this result agrees with previous findings on long-stay nursing home residents.21 One possible explanation for better performance by high-occupancy buildings could be that increased social interaction is beneficial to nursing home residents as compared with low-occupancy buildings, where less social interaction is probable. It is difficult to draw conclusions regarding nursing home size and region; however, there are significant differences among sizes for 3 out of the 5 QMs and significant differences among regions for all 5 QMs. The analyses suggest that residence-level characteristics are related to QM scores. Although reported QMs are not a direct representation of resident quality of life, this work agrees with previous research that residential characteristics have some impact on the lives of nursing home residents.13-17 Improvements in QM reporting and changes in quality improvement goals since the formation of Nursing Home Compare exist, suggesting that nursing homes’ awareness of their reporting duties may impact quality of care or reporting tendencies.21,22 Future research should consider investigating the impacts of the COVID-19 pandemic on quality-reporting trends and QM scores.
Other physical characteristics of nursing homes, such as noise, lighting levels, and air quality, may also have an impact on QMs and possibly nursing home residents themselves. This type of data exploration could be included in future research. Additionally, future research could include a similar analysis over a longer period, rather than the 1-year period examined here, to investigate which types of residences consistently have high or low scores or how different types of residences have evolved over the years, particularly considering the impact of the COVID-19 pandemic. Information such as staffing levels, building renovations, and inspection data could be accounted for in future studies. Different QMs could also be investigated to better understand the influence of residential characteristics on quality of care.
Conclusion
This study suggests that residence-level characteristics are related to 5 reported nursing home QMs. Overall, nonprofit and high-occupancy residences had the lowest QM scores, indicating the highest performance. Although the results do not necessarily suggest that residence-level characteristics impact individual nursing home residents’ quality of life, they suggest that physical characteristics affect overall quality of life in nursing homes. Future research is needed to determine the specific physical characteristics of these residences that affect QM scores.
Corresponding author: Brian J. Puckett, puckett.brian@huskers.unl.edu.
Disclosures: None reported.
1. Gauthier S, Rosa-Neto P, Morais JA, et al. World Alzheimer report 2021: journey through the diagnosis of dementia. Alzheimer’s Disease International; 2021.
2. Garre-Olmo J, López-Pousa S, Turon-Estrada A, et al. Environmental determinants of quality of life in nursing home residents with severe dementia. J Am Geriatr Soc. 2012;60(7):1230-1236. doi:10.1111/j.1532-5415.2012.04040.x
3. Zeisel J, Silverstein N, Hyde J, et al. Environmental correlates to behavioral health outcomes in Alzheimer’s special care units. Gerontologist. 2003;43(5):697-711. doi:10.1093/geront/43.5.697
4. Brawley E. Environmental design for Alzheimer’s disease: a quality of life issue. Aging Ment Health. 2001;5(1):S79-S83. doi:10.1080/13607860120044846
5. Joosse L. Do sound levels and space contribute to agitation in nursing home residents with dementia? Research Gerontol Nurs. 2012;5(3):174-184. doi:10.3928/19404921-20120605-02
6. Dowling G, Graf C, Hubbard E, et al. Light treatment for neuropsychiatric behaviors in Alzheimer’s disease. Western J Nurs Res. 2007;29(8):961-975. doi:10.1177/0193945907303083
7. Tartarini F, Cooper P, Fleming R, et al. Indoor air temperature and agitation of nursing home residents with dementia. Am J Alzheimers Dis Other Demen. 2017;32(5):272-281. doi:10.1177/1533317517704898
8. Miyamoto Y, Tachimori H, Ito H. Formal caregiver burden in dementia: impact of behavioral and psychological symptoms of dementia and activities of daily living. Geriatr Nurs. 2010;31(4):246-253. doi:10.1016/j.gerinurse.2010.01.002
9. Dementia care and the built environment: position paper 3. Alzheimer’s Australia; 2004.
10. Cloak N, Al Khalili Y. Behavioral and psychological symptoms in dementia. Updated July 21, 2022. In: StatPearls [Internet]. StatPearls Publishing; 2022.
11. Centers for Medicare & Medicaid Services. Nursing homes including rehab services data archive. 2019 annual files. Accessed January 30, 2023. https://data.cms.gov/provider-data/archived-data/nursing-homes
12. Sanghavi P, Pan S, Caudry D. Assessment of nursing home reporting of major injury falls for quality measurement on Nursing Home Compare. Health Serv Res. 2020;55(2):201-210. doi:10.1111/1475-6773.13247
13. Hughes C, Lapane K, Mor V. Influence of facility characteristics on use of antipsychotic medications in nursing homes. Med Care. 2000;38(12):1164-1173. doi:10.1097/00005650-200012000-00003
14. Aaronson W, Zinn J, Rosko M. Do for-profit and not-for-profit nursing homes behave differently? Gerontologist. 1994;34(6):775-786. doi:10.1093/geront/34.6.775
15. O’Neill C, Harrington C, Kitchener M, et al. Quality of care in nursing homes: an analysis of relationships among profit, quality, and ownership. Med Care. 2003;41(12):1318-1330. doi:10.1097/01.MLR.0000100586.33970.58
16. Allen PD, Klein WC, Gruman C. Correlates of complaints made to the Connecticut Long-Term Care Ombudsman program: the role of organizational and structural factors. Res Aging. 2003;25(6):631-654. doi:10.1177/0164027503256691
17. Abrams H, Loomer L, Gandhi A, et al. Characteristics of U.S. nursing homes with COVID-19 cases. J Am Geriatr Soc. 2020;68(8):1653-1656. doi:10.1111/jgs.16661
18. Evans JD. Straightforward Statistics for the Behavioral Sciences. Thomson Brooks/Cole Publishing Co; 1996.
19. Zinn J, Spector W, Hsieh L, et al. Do trends in the reporting of quality measures on the Nursing Home Compare web site differ by nursing home characteristics? Gerontologist. 2005;45(6):720-730.
20. Centers for Medicare & Medicaid Services. CMS Regional Offices. Accessed January 30, 2023. https://www.cms.gov/Medicare/Coding/ICD10/CMS-Regional-Offices
21. Mukamel DB, Weimer DL, Spector WD, et al. Publication of quality report cards and trends in reported quality measures in nursing homes. Health Serv Res. 2008;43(4):1244-1262. doi:10.1093/geront/45.6.720
22. Harris Y, Clauser SB. Achieving improvement through nursing home quality measurement. Health Care Financ Rev. 2002;23(4):5-18.
From the University of Nebraska, Lincoln (Mr. Puckett and Dr. Ryherd), University of Nebraska Medical Center, Omaha (Dr. Manley), and the University of Nebraska, Omaha (Dr. Ryan).
ABSTRACT
Objective: This study evaluated relationships between physical characteristics of nursing home residences and quality-of-care measures.
Design: This was a cross-sectional ecologic study. The dependent variables were 5 Centers for Medicare & Medicaid Services (CMS) Nursing Home Compare database long-stay quality measures (QMs) during 2019: percentage of residents who displayed depressive symptoms, percentage of residents who were physically restrained, percentage of residents who experienced 1 or more falls resulting in injury, percentage of residents who received antipsychotic medication, and percentage of residents who received anti-anxiety medication. The independent variables were 4 residence characteristics: ownership type, size, occupancy, and region within the United States. We explored how different types of each residence characteristic compare for each QM.
Setting, participants, and measurements: Quality measure values from 15,420 CMS-supported nursing homes across the United States averaged over the 4 quarters of 2019 reporting were used. Welch’s analysis of variance was performed to examine whether the mean QM values for groups within each residential characteristic were statistically different.
Results: Publicly owned and low-occupancy residences had the highest mean QM values, indicating the poorest performance. Nonprofit and high-occupancy residences generally had the lowest (ie, best) mean QM values. There were significant differences in mean QM values among nursing home sizes and regions.
Conclusion: This study suggests that residence characteristics are related to 5 nursing home QMs. Results suggest that physical characteristics may be related to overall quality of life in nursing homes.
Keywords: quality of care, quality measures, residence characteristics, Alzheimer’s disease and related dementias.
More than 55 million people worldwide are living with Alzheimer’s disease and related dementias (ADRD).1 With the aging of the Baby Boomer population, this number is expected to rise to more than 78 million worldwide by 2030.1 Given the growing number of cognitively impaired older adults, there is an increased need for residences designed for the specialized care of this population. Although there are dozens of living options for the elderly, and although most specialized establishments have the resources to meet the immediate needs of their residents, many facilities lack universal design features that support a high quality of life for someone with ADRD or mild cognitive impairment. Previous research has shown relationships between behavioral and psychological symptoms of dementia (BPSD) and environmental characteristics such as acoustics, lighting, and indoor air temperature.2,3 Physical behaviors of BPSD, including aggression and wandering, and psychological symptoms, such as depression, anxiety, and delusions, put residents at risk of injury.4 Additionally, BPSD is correlated with caregiver burden and stress.5-8 Patients with dementia may also experience a lower stress threshold, changes in perception of space, and decreased short-term memory, creating environmental difficulties for those with ADRD9 that lead them to exhibit BPSD due to poor environmental design. Thus, there is a need to learn more about design features that minimize BPSD and promote a high quality of life for those with ADRD.10
Although research has shown relationships between physical environmental characteristics and BPSD, in this work we study relationships between possible BPSD indicators and 4 residence-level characteristics: ownership type, size, occupancy, and region in the United States (determined by location of the Centers for Medicare & Medicaid Services [CMS] regional offices). We analyzed data from the CMS Nursing Home Compare database for the year 2019.11 This database publishes quarterly data and star ratings for quality-of-care measures (QMs), staffing levels, and health inspections for every nursing home supported by CMS. Previous research has investigated the accuracy of QM reporting for resident falls, the impact of residential characteristics on administration of antipsychotic medication, the influence of profit status on resident outcomes and quality of care, and the effect of nursing home size on quality of life.12-16 Additionally, research suggests that residential characteristics such as size and location could be associated with infection control in nursing homes.17
Certain QMs, such as psychotropic drug administration, resident falls, and physical restraint, provide indicators of agitation, disorientation, or aggression, which are often signals of BPSD episodes. We hypothesized that residence types are associated with different QM scores, which could indicate different occurrences of BPSD. We selected 5 QMs for long-stay residents that could potentially be used as indicators of BPSD. Short-stay resident data were not included in this work to control for BPSD that could be a result of sheer unfamiliarity with the environment and confusion from being in a new home.
Methods
Design and Data Collection
This was a cross-sectional ecologic study aimed at exploring relationships between aggregate residential characteristics and QMs. Data were retrieved from the 2019 annual archives found in the CMS provider data catalog on nursing homes, including rehabilitation services.11 The dataset provides general residence information, such as ownership, number of beds, number of residents, and location, as well as residence quality metrics, such as QMs, staffing data, and inspection data. Residence characteristics and 4-quarter averages of QMs were retrieved and used as cross-sectional data. The data used are from 15,420 residences across the United States. Nursing homes located in Guam, the US Pacific Territories, Puerto Rico, and the US Virgin Islands, while supported by CMS and included in the dataset, were excluded from the study due to a severe absence of QM data.
Dependent Variables
We investigated 5 QMs that were averaged across the 4 quarters of 2019. The QMs used as dependent variables were percentage of residents who displayed depressive symptoms (depression), percentage of residents who were physically restrained (restraint), percentage of residents who experienced 1 or more falls resulting in a major injury (falls), percentage of residents who received antipsychotic medication (antipsychotic medication), and percentage of residents who received anti-anxiety or hypnotic medication (anti-anxiety medication).
A total of 2471 QM values were unreported across the 5 QM analyzed: 501 residences did not report depression data; 479 did not report restraint data; 477 did not report falls data; 508 did not report antipsychotic medication data; and 506 did not report anti-anxiety medication data. A residence with a missing QM value was excluded from that respective analysis.
To assess the relationships among the different QMs, a Pearson correlation coefficient r was computed for each unique pair of QMs (Figure). All QMs studied were found to be very weakly or weakly correlated with one another using the Evans classification for very weak and weak correlations (r < 0.20 and 0.20 < r < 0.39, respectively).18
Independent Variables
A total of 15,420 residences were included in the study. Seventy-nine residences did not report occupancy data, however, so those residences were excluded from the occupancy analyses. We categorized the ownership of each nursing home as for-profit, nonprofit, or public. We categorized nursing home size, based on quartiles of the size distribution, as large (> 127 beds), medium (64 to 126 beds), and small (< 64 beds). This method for categorizing the residential characteristics was similar to that used in previous work.19 Similarly, we categorized nursing home occupancy as high (> 92% occupancy), medium (73% to 91% occupancy), and low (< 73% occupancy) based on quartiles of the occupancy distribution. For the regional analysis, we grouped states together based on the CMS regional offices: Atlanta, Georgia; Boston, Massachusetts; Chicago, Illinois; Dallas, Texas; Denver, Colorado; Kansas City, Missouri; New York, New York; Philadelphia, Pennsylvania; San Francisco, California; and Seattle, Washington.20
Analyses
We used Levene’s test to determine whether variances among the residential groups were equal for each QM, using an a priori α = 0.05. For all 20 tests conducted (4 residential characteristics for all 5 QMs), the resulting F-statistics were significant, indicating that the assumption of homogeneity of variance was not met.
We therefore used Welch’s analysis of variance (ANOVA) to evaluate whether the groups within each residential characteristic were the same on their QM means. For example, we tested whether for-profit, nonprofit, and public residences had significantly different mean depression rates. For statistically significant differences, a Games-Howell post-hoc test was conducted to test the difference between all unique pairwise comparisons. An a priori α = 0.05 was used for both Welch’s ANOVA and post-hoc testing. All analyses were conducted in RStudio Version 1.2.5033 (Posit Software, PBC).
Results
Mean Differences
Mean QM scores for the 5 QMs investigated, grouped by residential characteristic for the 2019 year of reporting, are shown in Table 1. It should be noted that the number of residences that reported occupancy data (n = 15,341) does not equal the total number of residences included in the study (N = 15,420) because 79 residences did not report occupancy data. For all QMs reported in Table 1, lower scores are better. Table 2 and Table 3 show results from pairwise comparisons of mean differences for the different residential characteristic and QM groupings. Mean differences and 95% CI are presented along with an indication of statistical significance (when applicable).
Ownership
Nonprofit residences had significantly lower (ie, better) mean scores than for-profit and public residences for 3 QMs: resident depression, antipsychotic medication use, and anti-anxiety medication use. For-profit and public residences did not significantly differ in their mean values for these QMs. For-profit residences had a significantly lower mean score for resident falls than both nonprofit and public residences, but no significant difference existed between scores for nonprofit and public residence falls. There were no statistically significant differences between mean restraint scores among the ownership types.
Size
Large (ie, high-capacity) residences had a significantly higher mean depression score than both medium and small residences, but there was not a significant difference between medium and small residences. Large residences had the significantly lowest mean score for resident falls, and medium residences scored significantly lower than small residences. Medium residences had a significantly higher mean score for anti-anxiety medication use than both small and large residences, but there was no significant difference between small and large residences. There were no statistically significant differences between mean scores for restraint and antipsychotic medication use among the nursing home sizes.
Occupancy
The mean scores for 4 out of the 5 QMs exhibited similar relationships with occupancy rates: resident depression, falls, and antipsychotic and anti-anxiety medication use. Low-occupancy residences consistently scored significantly higher than both medium- and high-occupancy residences, and medium-occupancy residences consistently scored significantly higher than high-occupancy residences. On average, high-occupancy (≥ 92%) residences reported better QM scores than low-occupancy (< 73%) and medium-occupancy (73% to 91%) residences for all the QMs studied except physical restraint, which yielded no significant results. These findings indicate a possible inverse relationship between building occupancy rate and these 4 QMs.
Region
Pairwise comparisons of mean QM scores by region are shown in Table 3. The Chicago region had a significantly higher mean depression score than all other regions, while the San Francisco region’s score was significantly lower than all other regions, except Atlanta and Boston. The Kansas City region had a significantly higher mean score for resident falls than all other regions, with the exception of Denver, and the San Francisco region scored significantly lower than all other regions in falls. The Boston region had a significantly higher mean score for administering antipsychotic medication than all other regions, except for Kansas City and Seattle, and the New York and San Francisco regions both had significantly lower scores than all other regions except for each other. The Atlanta region reported a significantly higher mean score for administering antianxiety medication than all other regions, and the Seattle region’s score for anti-anxiety medication use was significantly lower than all other regions except for San Francisco.
Discussion
This study presented mean percentages for 5 QMs reported in the Nursing Home Compare database for the year 2019: depression, restraint, falls, antipsychotic medication use, and anti-anxiety medication use. We investigated these scores by 4 residential characteristics: ownership type, size, occupancy, and region. In general, publicly owned and low-occupancy residences had the highest scores, and thus the poorest performances, for the 5 chosen QMs during 2019. Nonprofit and high-occupancy residences generally had the lowest (ie, better) scores, and this result agrees with previous findings on long-stay nursing home residents.21 One possible explanation for better performance by high-occupancy buildings could be that increased social interaction is beneficial to nursing home residents as compared with low-occupancy buildings, where less social interaction is probable. It is difficult to draw conclusions regarding nursing home size and region; however, there are significant differences among sizes for 3 out of the 5 QMs and significant differences among regions for all 5 QMs. The analyses suggest that residence-level characteristics are related to QM scores. Although reported QMs are not a direct representation of resident quality of life, this work agrees with previous research that residential characteristics have some impact on the lives of nursing home residents.13-17 Improvements in QM reporting and changes in quality improvement goals since the formation of Nursing Home Compare exist, suggesting that nursing homes’ awareness of their reporting duties may impact quality of care or reporting tendencies.21,22 Future research should consider investigating the impacts of the COVID-19 pandemic on quality-reporting trends and QM scores.
Other physical characteristics of nursing homes, such as noise, lighting levels, and air quality, may also have an impact on QMs and possibly nursing home residents themselves. This type of data exploration could be included in future research. Additionally, future research could include a similar analysis over a longer period, rather than the 1-year period examined here, to investigate which types of residences consistently have high or low scores or how different types of residences have evolved over the years, particularly considering the impact of the COVID-19 pandemic. Information such as staffing levels, building renovations, and inspection data could be accounted for in future studies. Different QMs could also be investigated to better understand the influence of residential characteristics on quality of care.
Conclusion
This study suggests that residence-level characteristics are related to 5 reported nursing home QMs. Overall, nonprofit and high-occupancy residences had the lowest QM scores, indicating the highest performance. Although the results do not necessarily suggest that residence-level characteristics impact individual nursing home residents’ quality of life, they suggest that physical characteristics affect overall quality of life in nursing homes. Future research is needed to determine the specific physical characteristics of these residences that affect QM scores.
Corresponding author: Brian J. Puckett, puckett.brian@huskers.unl.edu.
Disclosures: None reported.
1. Gauthier S, Rosa-Neto P, Morais JA, et al. World Alzheimer report 2021: journey through the diagnosis of dementia. Alzheimer’s Disease International; 2021.
2. Garre-Olmo J, López-Pousa S, Turon-Estrada A, et al. Environmental determinants of quality of life in nursing home residents with severe dementia. J Am Geriatr Soc. 2012;60(7):1230-1236. doi:10.1111/j.1532-5415.2012.04040.x
3. Zeisel J, Silverstein N, Hyde J, et al. Environmental correlates to behavioral health outcomes in Alzheimer’s special care units. Gerontologist. 2003;43(5):697-711. doi:10.1093/geront/43.5.697
4. Brawley E. Environmental design for Alzheimer’s disease: a quality of life issue. Aging Ment Health. 2001;5(1):S79-S83. doi:10.1080/13607860120044846
5. Joosse L. Do sound levels and space contribute to agitation in nursing home residents with dementia? Research Gerontol Nurs. 2012;5(3):174-184. doi:10.3928/19404921-20120605-02
6. Dowling G, Graf C, Hubbard E, et al. Light treatment for neuropsychiatric behaviors in Alzheimer’s disease. Western J Nurs Res. 2007;29(8):961-975. doi:10.1177/0193945907303083
7. Tartarini F, Cooper P, Fleming R, et al. Indoor air temperature and agitation of nursing home residents with dementia. Am J Alzheimers Dis Other Demen. 2017;32(5):272-281. doi:10.1177/1533317517704898
8. Miyamoto Y, Tachimori H, Ito H. Formal caregiver burden in dementia: impact of behavioral and psychological symptoms of dementia and activities of daily living. Geriatr Nurs. 2010;31(4):246-253. doi:10.1016/j.gerinurse.2010.01.002
9. Dementia care and the built environment: position paper 3. Alzheimer’s Australia; 2004.
10. Cloak N, Al Khalili Y. Behavioral and psychological symptoms in dementia. Updated July 21, 2022. In: StatPearls [Internet]. StatPearls Publishing; 2022.
11. Centers for Medicare & Medicaid Services. Nursing homes including rehab services data archive. 2019 annual files. Accessed January 30, 2023. https://data.cms.gov/provider-data/archived-data/nursing-homes
12. Sanghavi P, Pan S, Caudry D. Assessment of nursing home reporting of major injury falls for quality measurement on Nursing Home Compare. Health Serv Res. 2020;55(2):201-210. doi:10.1111/1475-6773.13247
13. Hughes C, Lapane K, Mor V. Influence of facility characteristics on use of antipsychotic medications in nursing homes. Med Care. 2000;38(12):1164-1173. doi:10.1097/00005650-200012000-00003
14. Aaronson W, Zinn J, Rosko M. Do for-profit and not-for-profit nursing homes behave differently? Gerontologist. 1994;34(6):775-786. doi:10.1093/geront/34.6.775
15. O’Neill C, Harrington C, Kitchener M, et al. Quality of care in nursing homes: an analysis of relationships among profit, quality, and ownership. Med Care. 2003;41(12):1318-1330. doi:10.1097/01.MLR.0000100586.33970.58
16. Allen PD, Klein WC, Gruman C. Correlates of complaints made to the Connecticut Long-Term Care Ombudsman program: the role of organizational and structural factors. Res Aging. 2003;25(6):631-654. doi:10.1177/0164027503256691
17. Abrams H, Loomer L, Gandhi A, et al. Characteristics of U.S. nursing homes with COVID-19 cases. J Am Geriatr Soc. 2020;68(8):1653-1656. doi:10.1111/jgs.16661
18. Evans JD. Straightforward Statistics for the Behavioral Sciences. Thomson Brooks/Cole Publishing Co; 1996.
19. Zinn J, Spector W, Hsieh L, et al. Do trends in the reporting of quality measures on the Nursing Home Compare web site differ by nursing home characteristics? Gerontologist. 2005;45(6):720-730.
20. Centers for Medicare & Medicaid Services. CMS Regional Offices. Accessed January 30, 2023. https://www.cms.gov/Medicare/Coding/ICD10/CMS-Regional-Offices
21. Mukamel DB, Weimer DL, Spector WD, et al. Publication of quality report cards and trends in reported quality measures in nursing homes. Health Serv Res. 2008;43(4):1244-1262. doi:10.1093/geront/45.6.720
22. Harris Y, Clauser SB. Achieving improvement through nursing home quality measurement. Health Care Financ Rev. 2002;23(4):5-18.
Adherence to Evidence-Based Outpatient Antimicrobial Prescribing Guidelines at a Tribal Health System
Tuba City Regional Health Care Corporation (TCRHCC) is located on the Navajo Reservation in northeastern Arizona and provides medical coverage to a 6000-square-mile area, serving more than 33,000 residents of the Navajo, Hopi, and San Juan Southern Paiute tribes.1,2 In 2021, there were 334,497 outpatient visits. TCRHCC departments involved in prescribing outpatient antibiotics include the emergency, internal medicine, family medicine, pediatrics, dentistry, surgery, podiatry, obstetrics and gynecology, and midwifery.
Antimicrobial resistance is one of the largest public health threats, causing an estimated 2 million infections and 23,000 deaths every year in the United States.3 This can lead to increased health care costs, morbidity, and mortality. A large, modifiable risk factor is the inappropriate prescribing of antibiotics: An estimated half of all outpatient antibiotics prescribed may be inappropriate in some manner, such as antibiotic choice, dosing, or duration. In addition, at least 30% of US antibiotic prescriptions are unnecessary, leading to significant overuse.3 As such, antimicrobial stewardship is a cornerstone of improving antibiotic use, patient care, and safety.
The goals of antimicrobial stewardship are to measure antimicrobial prescribing, improve clinician prescribing, minimize misdiagnosis or delayed diagnoses, and ensure the right drug, dose, and duration are selected when antimicrobial therapy is appropriate.3 The Centers for Disease Control and Prevention recommends 4 core elements of outpatient antimicrobial stewardship: commitment, action for policy and practice, tracking and reporting, and education and expertise.3 This study focuses on the pillars of action for policy and practice and tracking and reporting.
Methods
The study objectives were not designed to achieve statistical power. A retrospective chart review was performed for patients of any age who were seen in an ambulatory care setting at TCRHCC from August 1, 2020, to August 1, 2021, with a visit diagnosis included in the outpatient antimicrobial prescribing guidelines.4,5 A random sample of 10% of charts of each diagnosis code was used for analysis. An Excel spreadsheet with all patient charts, separated by diagnosis code, was created. Each chart was then assigned a number, and the Excel function RAND was used to select a random number from the pool. This was continued until 10% of each category, or at least 1 chart from diagnosis code categories with less than 10 total charts available, were selected.
Inclusion criteria were patients seen in ambulatory clinics or the emergency department, an infectious disease diagnosis addressed in the facility guidelines, diagnosis and treatment occurred between August 1, 2020, and August 1, 2021, and the patient was discharged home after the visit. Exclusion criteria were patients who required inpatient admission, patient visits to the clinic established solely for COVID-19 vaccination or testing as no other care was ever provided at this location, patients who refused treatment, patients who failed empiric therapy and required treatment adjustments, or patients who were initially treated and received an antibiotic prescription at a facility outside the TCRHCC system.
After chart review and analysis were completed, a prescriber survey and educational intervention were performed from March 2, 2022, to March 31, 2022. This consisted of an anonymous survey to gather demographic data and prescribing habits pre-education, a short educational brief on the existence, location, and recommended use of the outpatient antimicrobial prescribing guidelines, and a posteducation survey to assess knowledge of the guidelines and willingness to adhere to them after the educational intervention.
Results
We reviewed 8779 patient records. A random sample of 10% of the records of each diagnosis code was taken and 876 charts were reviewed. Of the charts reviewed, 351 patients met the inclusion criteria and were included in the analysis. A goal of 90% was established as the target for prescriber adherence for the study based on author consensus for a reasonable goal. Of the 351 evaluated charts, 62 (16.1%) were pediatric patients (aged < 19 years) and 289 (83.9%) were adults (aged ≥ 19 years). Fifty-two (84%) of the pediatric charts and 249 (86%) of the adult charts demonstrated prescribers had appropriately followed guidelines for a combined total of 301 of the 351 charts and an overall adherence rate of 86%. This was 4 points below the established goal of 90%, warranting further investigation. An analysis of prescribers and locations revealed no trends or patterns of nonadherence. A prescriber survey and educational intervention were designed and disseminated to all prescribers at the facility with the approval and assistance of the chief of medicine.
Thirty-nine prescribers responded to the survey. In the pre-educational survey, clinical resources were the most common source of guidance with 36 prescribers (92%) indicating they used them to make an appropriate selection of an antimicrobial; 32 (82%) used personal knowledge, 30 (77%) used culture results, and 24 (62%) used facility guidelines. This was consistent with the posteducational questions: 12 (31%) indicated they were not aware of the facility guidelines before the educational intervention. 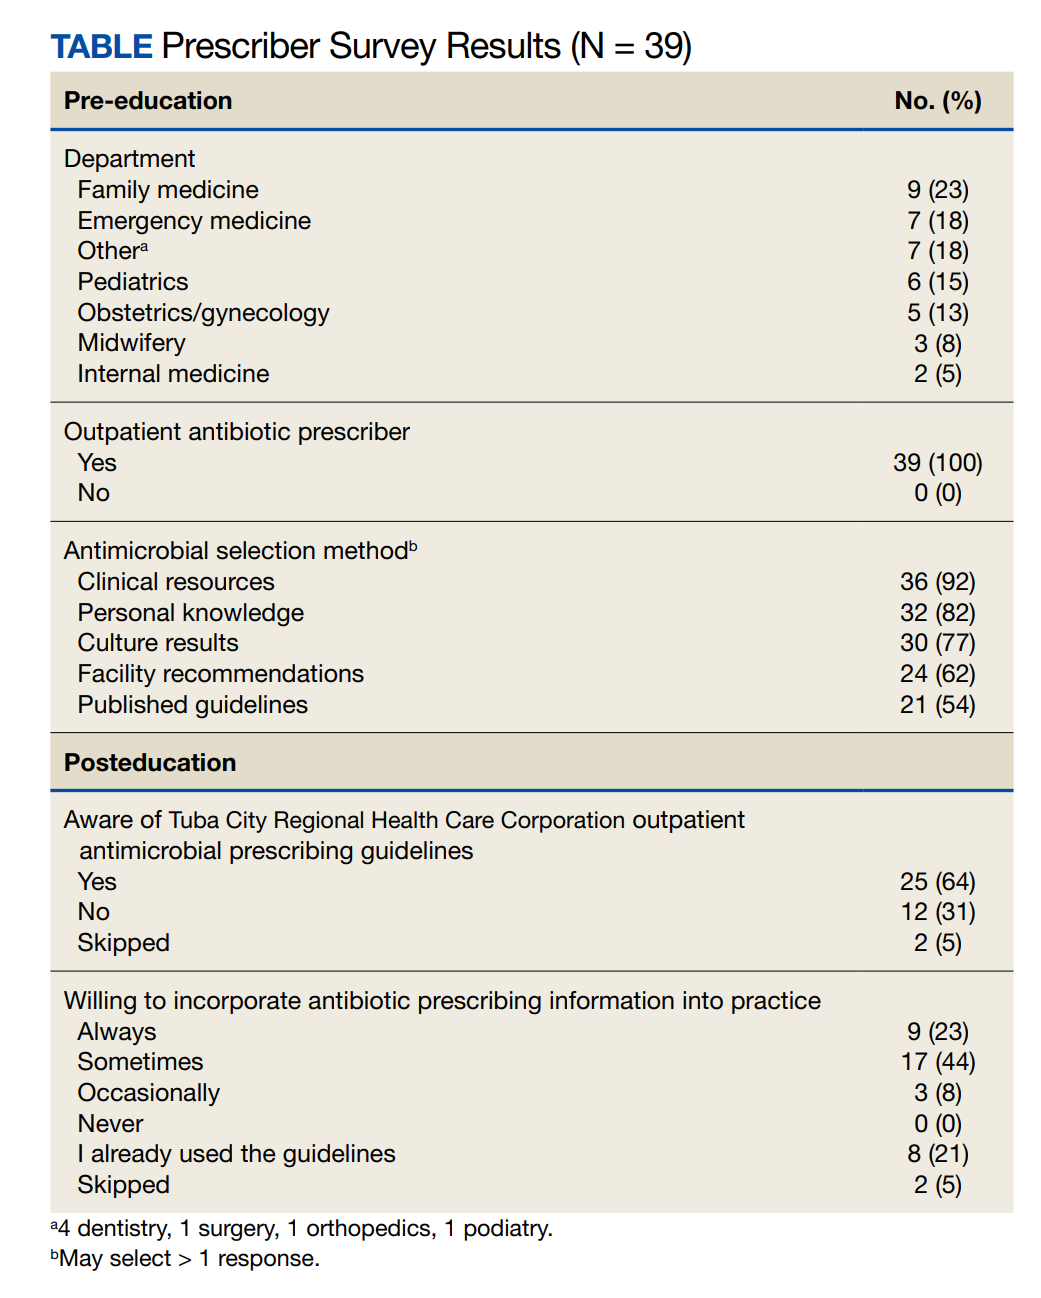
Discussion
This study’s objective was to evaluate prescriber adherence to the facility outpatient prescribing guidelines after they were implemented in 2019 and to plan for interventions if necessary. Overall prescriber adherence was high with 86% of the sampled charts adherent. This was below the goal of 90%, so evaluation of the nonadherent charts was warranted for the determination of any patterns to guide the planned interventions with the facility prescribers. However, no trends were identified, so the intervention was designed as a general survey and educational session for all prescribers. Overall prescriber response was positive, with a total of 34 responding prescribers (87%) indicating a willingness to use the guidelines.
Limitations
This is a retrospective observational study performed through chart review that allowed for frequency analysis but did not allow for statistical analysis, so the significance of results cannot be obtained. Additionally, this study was not able to compare rates of adherence before and after the educational intervention, so the effectiveness of the intervention cannot be assessed.
Conclusions
This retrospective observational study’s data demonstrate that prescribers are adhering at a high rate to recommended empiric antimicrobials for outpatient treatment with an 86% adherence rate. Response to educational intervention indicated a larger proportion of prescribers than previously will use the guidelines. However, the impact this will have on appropriate prescribing rates in the future could not be assessed during this study.
1. Tuba City Regional Health Care Corporation. TCRHCC Annual Report 2021. 2012. Accessed January 25, 2023. Accessed January 30, 2023. https://tchealth.org/pdfdownload/2021_TCRHCC_Annual_Report.pdf
2. Tuba City Regional Health Care Corporation. TCRHCC Annual Report 2013. 2013. Accessed January 25, 2023. Accessed January 30, 2023. https://www.tchealth.org/pdfdownload/2013_Annual_Report.pdf
3. Sanchez GV, Fleming-Dutra KE, Roberts RM, Hicks LA. Core Elements of Outpatient Antibiotic Stewardship. MMWR Recomm Rep. 2016;65(No. RR-6):1–12. doi:10.15585/mmwr.rr6506a1
4. Tuba City Regional Health Care Corporation. Antimicrobial stewardship adult outpatient guidelines. 2019.
5. Tuba City Regional Health Care Corporation. Antimicrobial stewardship pediatric outpatient guidelines. 2019.
Tuba City Regional Health Care Corporation (TCRHCC) is located on the Navajo Reservation in northeastern Arizona and provides medical coverage to a 6000-square-mile area, serving more than 33,000 residents of the Navajo, Hopi, and San Juan Southern Paiute tribes.1,2 In 2021, there were 334,497 outpatient visits. TCRHCC departments involved in prescribing outpatient antibiotics include the emergency, internal medicine, family medicine, pediatrics, dentistry, surgery, podiatry, obstetrics and gynecology, and midwifery.
Antimicrobial resistance is one of the largest public health threats, causing an estimated 2 million infections and 23,000 deaths every year in the United States.3 This can lead to increased health care costs, morbidity, and mortality. A large, modifiable risk factor is the inappropriate prescribing of antibiotics: An estimated half of all outpatient antibiotics prescribed may be inappropriate in some manner, such as antibiotic choice, dosing, or duration. In addition, at least 30% of US antibiotic prescriptions are unnecessary, leading to significant overuse.3 As such, antimicrobial stewardship is a cornerstone of improving antibiotic use, patient care, and safety.
The goals of antimicrobial stewardship are to measure antimicrobial prescribing, improve clinician prescribing, minimize misdiagnosis or delayed diagnoses, and ensure the right drug, dose, and duration are selected when antimicrobial therapy is appropriate.3 The Centers for Disease Control and Prevention recommends 4 core elements of outpatient antimicrobial stewardship: commitment, action for policy and practice, tracking and reporting, and education and expertise.3 This study focuses on the pillars of action for policy and practice and tracking and reporting.
Methods
The study objectives were not designed to achieve statistical power. A retrospective chart review was performed for patients of any age who were seen in an ambulatory care setting at TCRHCC from August 1, 2020, to August 1, 2021, with a visit diagnosis included in the outpatient antimicrobial prescribing guidelines.4,5 A random sample of 10% of charts of each diagnosis code was used for analysis. An Excel spreadsheet with all patient charts, separated by diagnosis code, was created. Each chart was then assigned a number, and the Excel function RAND was used to select a random number from the pool. This was continued until 10% of each category, or at least 1 chart from diagnosis code categories with less than 10 total charts available, were selected.
Inclusion criteria were patients seen in ambulatory clinics or the emergency department, an infectious disease diagnosis addressed in the facility guidelines, diagnosis and treatment occurred between August 1, 2020, and August 1, 2021, and the patient was discharged home after the visit. Exclusion criteria were patients who required inpatient admission, patient visits to the clinic established solely for COVID-19 vaccination or testing as no other care was ever provided at this location, patients who refused treatment, patients who failed empiric therapy and required treatment adjustments, or patients who were initially treated and received an antibiotic prescription at a facility outside the TCRHCC system.
After chart review and analysis were completed, a prescriber survey and educational intervention were performed from March 2, 2022, to March 31, 2022. This consisted of an anonymous survey to gather demographic data and prescribing habits pre-education, a short educational brief on the existence, location, and recommended use of the outpatient antimicrobial prescribing guidelines, and a posteducation survey to assess knowledge of the guidelines and willingness to adhere to them after the educational intervention.
Results
We reviewed 8779 patient records. A random sample of 10% of the records of each diagnosis code was taken and 876 charts were reviewed. Of the charts reviewed, 351 patients met the inclusion criteria and were included in the analysis. A goal of 90% was established as the target for prescriber adherence for the study based on author consensus for a reasonable goal. Of the 351 evaluated charts, 62 (16.1%) were pediatric patients (aged < 19 years) and 289 (83.9%) were adults (aged ≥ 19 years). Fifty-two (84%) of the pediatric charts and 249 (86%) of the adult charts demonstrated prescribers had appropriately followed guidelines for a combined total of 301 of the 351 charts and an overall adherence rate of 86%. This was 4 points below the established goal of 90%, warranting further investigation. An analysis of prescribers and locations revealed no trends or patterns of nonadherence. A prescriber survey and educational intervention were designed and disseminated to all prescribers at the facility with the approval and assistance of the chief of medicine.
Thirty-nine prescribers responded to the survey. In the pre-educational survey, clinical resources were the most common source of guidance with 36 prescribers (92%) indicating they used them to make an appropriate selection of an antimicrobial; 32 (82%) used personal knowledge, 30 (77%) used culture results, and 24 (62%) used facility guidelines. This was consistent with the posteducational questions: 12 (31%) indicated they were not aware of the facility guidelines before the educational intervention.
Discussion
This study’s objective was to evaluate prescriber adherence to the facility outpatient prescribing guidelines after they were implemented in 2019 and to plan for interventions if necessary. Overall prescriber adherence was high with 86% of the sampled charts adherent. This was below the goal of 90%, so evaluation of the nonadherent charts was warranted for the determination of any patterns to guide the planned interventions with the facility prescribers. However, no trends were identified, so the intervention was designed as a general survey and educational session for all prescribers. Overall prescriber response was positive, with a total of 34 responding prescribers (87%) indicating a willingness to use the guidelines.
Limitations
This is a retrospective observational study performed through chart review that allowed for frequency analysis but did not allow for statistical analysis, so the significance of results cannot be obtained. Additionally, this study was not able to compare rates of adherence before and after the educational intervention, so the effectiveness of the intervention cannot be assessed.
Conclusions
This retrospective observational study’s data demonstrate that prescribers are adhering at a high rate to recommended empiric antimicrobials for outpatient treatment with an 86% adherence rate. Response to educational intervention indicated a larger proportion of prescribers than previously will use the guidelines. However, the impact this will have on appropriate prescribing rates in the future could not be assessed during this study.
1. Tuba City Regional Health Care Corporation. TCRHCC Annual Report 2021. 2012. Accessed January 25, 2023. Accessed January 30, 2023. https://tchealth.org/pdfdownload/2021_TCRHCC_Annual_Report.pdf
2. Tuba City Regional Health Care Corporation. TCRHCC Annual Report 2013. 2013. Accessed January 25, 2023. Accessed January 30, 2023. https://www.tchealth.org/pdfdownload/2013_Annual_Report.pdf
3. Sanchez GV, Fleming-Dutra KE, Roberts RM, Hicks LA. Core Elements of Outpatient Antibiotic Stewardship. MMWR Recomm Rep. 2016;65(No. RR-6):1–12. doi:10.15585/mmwr.rr6506a1
4. Tuba City Regional Health Care Corporation. Antimicrobial stewardship adult outpatient guidelines. 2019.
5. Tuba City Regional Health Care Corporation. Antimicrobial stewardship pediatric outpatient guidelines. 2019.
Augmented Reality Demonstration Survey Results From a Veteran Affairs Medical Center
Building the health care system of the future requires the thoughtful development and integration of innovative technologies to positively transform care.1-4 Extended reality (XR) represents a spectrum of emerging technologies that have the potential to enhance health care. This includes virtual reality (VR), where a computer-generated visual experience fills the screen; augmented reality (AR), which allows users to see computer-generated images superimposed into an otherwise normal real-world field of view; and mixed reality (MR), which allows users to interact and manipulate computer-generated AR images.
Clinicians and researchers have begun exploring the potential of XR to address a wide variety of health care challenges. A recent systematic review concluded that many clinical studies in this area have small sample sizes and are in the preclinical, proof-of-concept stage, but demonstrate the potential and impact of the underlying VR, AR, and MR technologies.5 Common emerging health care uses for XR include medical education, training, presurgical planning, surgical guidance, distraction therapy for pain and anxiety, and home health indications, including rehabilitation.5-39 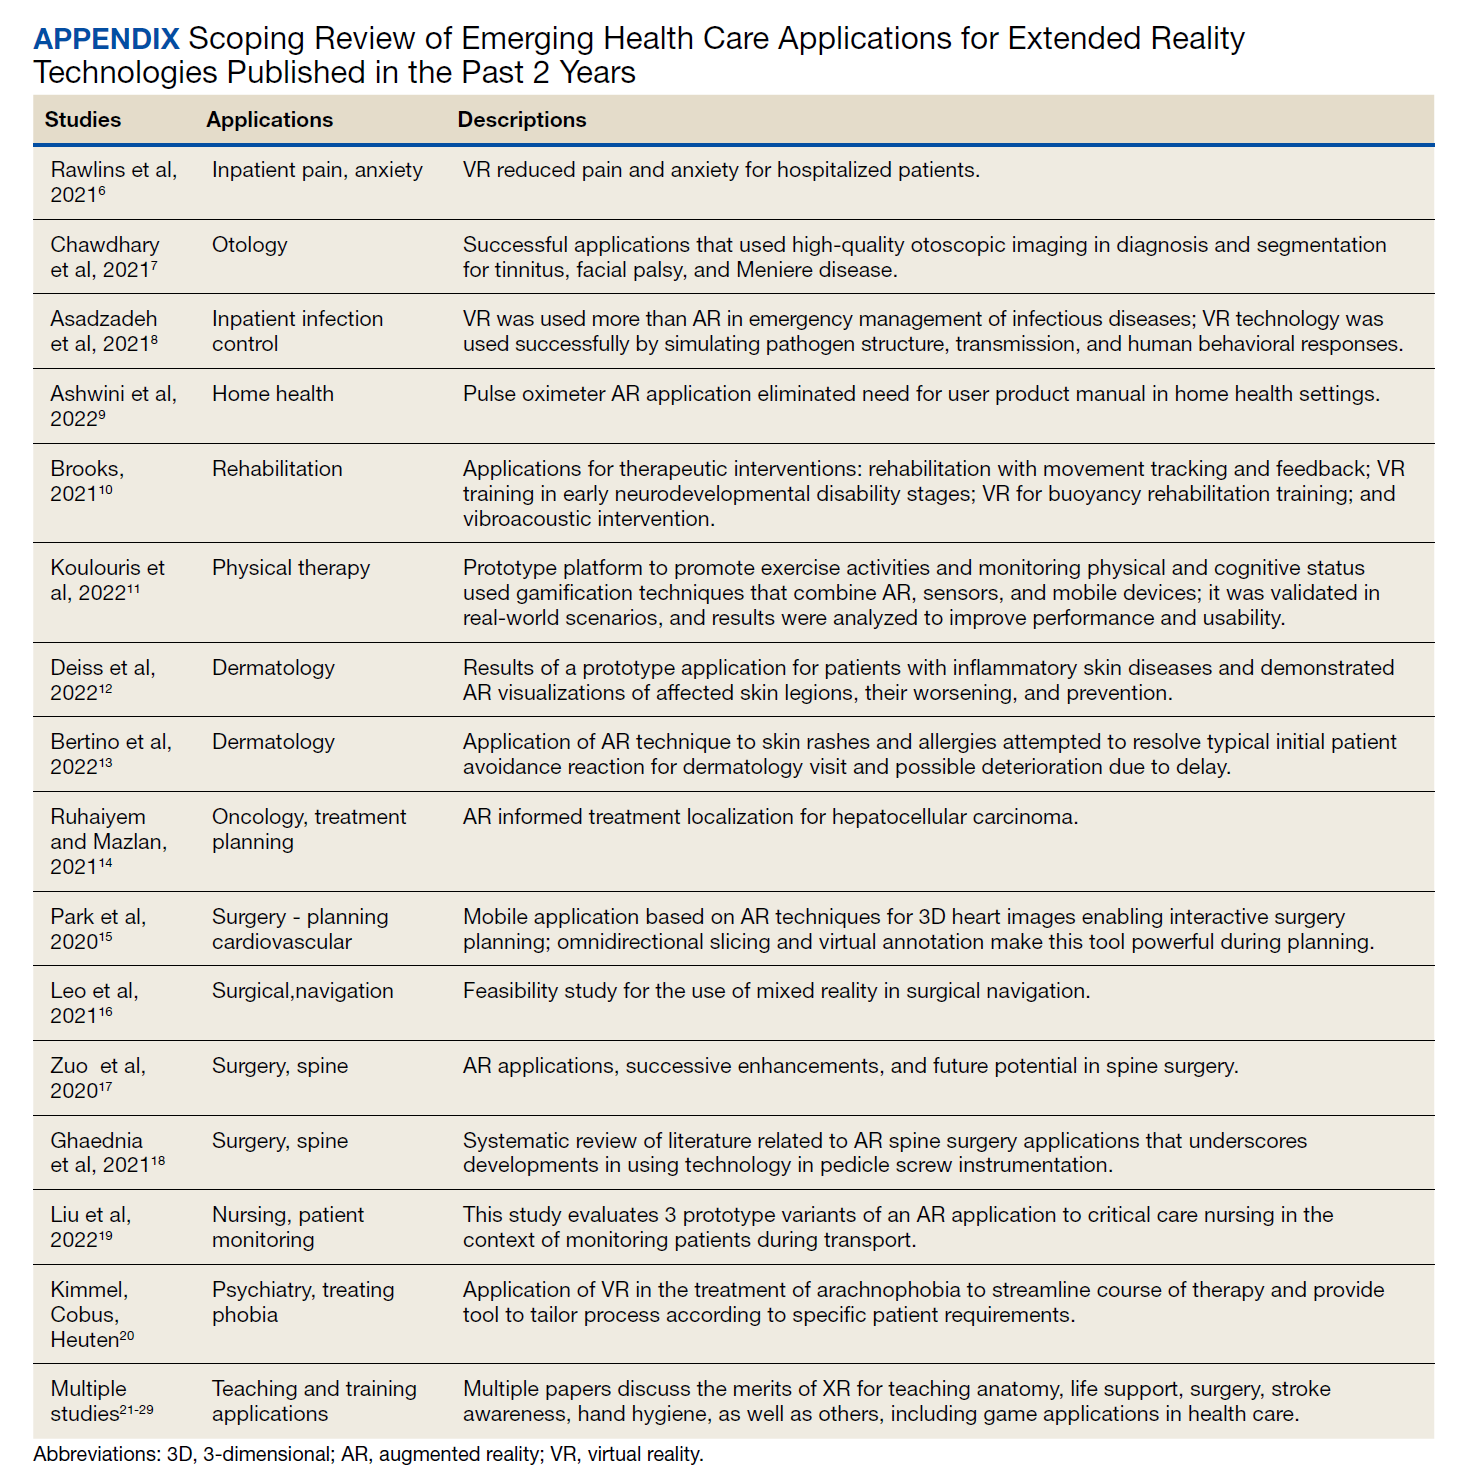
Importantly, some researchers have raised concerns regarding the adaptability of the health care workforce with emerging technologies, and their interest in new methods of delivering care.7,39 Successful deployment of any novel health care technology depends on multiple factors, including alignment with staff needs, receptivity to those solutions, customization to specific preferences, and usability.1,3,40-42 Unfortunately, the implementation of some health care technologies, such as electronic health records that did not account for end-user requirements, resulted in employee fatigue, burnout, and negative staffing turnover.42-44 Conversely, elevated employee morale and operational performance have been directly linked to a climate of inclusion and innovation.45-47 In this assessment, we sought to understand US Department of Veterans Affairs (VA) employees’ perceptions and expert opinions related to the introduction of new AR/MR technology.
Methods
The VA Palo Alto Health Care System (VAPAHCS) consists of 3 inpatient hospitals and 7 outpatient clinics, provides a full range of care services to > 90,000 enrolled veterans with 800 hospital beds, 3 nursing homes, and a 100-bed domiciliary. The facility also runs data-driven care projects in research, innovation, and evidence-based practice group under nursing services.48 This project was performed by the VA National Center for Collaborative Healthcare Innovation at the VAPAHCS campus.
The combined technical system used for this assessment included a wireless communication network, AR/MR hardware, and software. Medivis AnatomyX software displayed an interactive human anatomy atlas segmented into about 6000 individual interactive parts. Medivis SurgicalAR received US Food and Drug Administration clearance for presurgical planning and was used to transform and display deidentified diagnostic images (eg, magnetic resonance images and computed tomography) in 3-dimensional (3D) interactive holograms (Figures 1 and 2). 
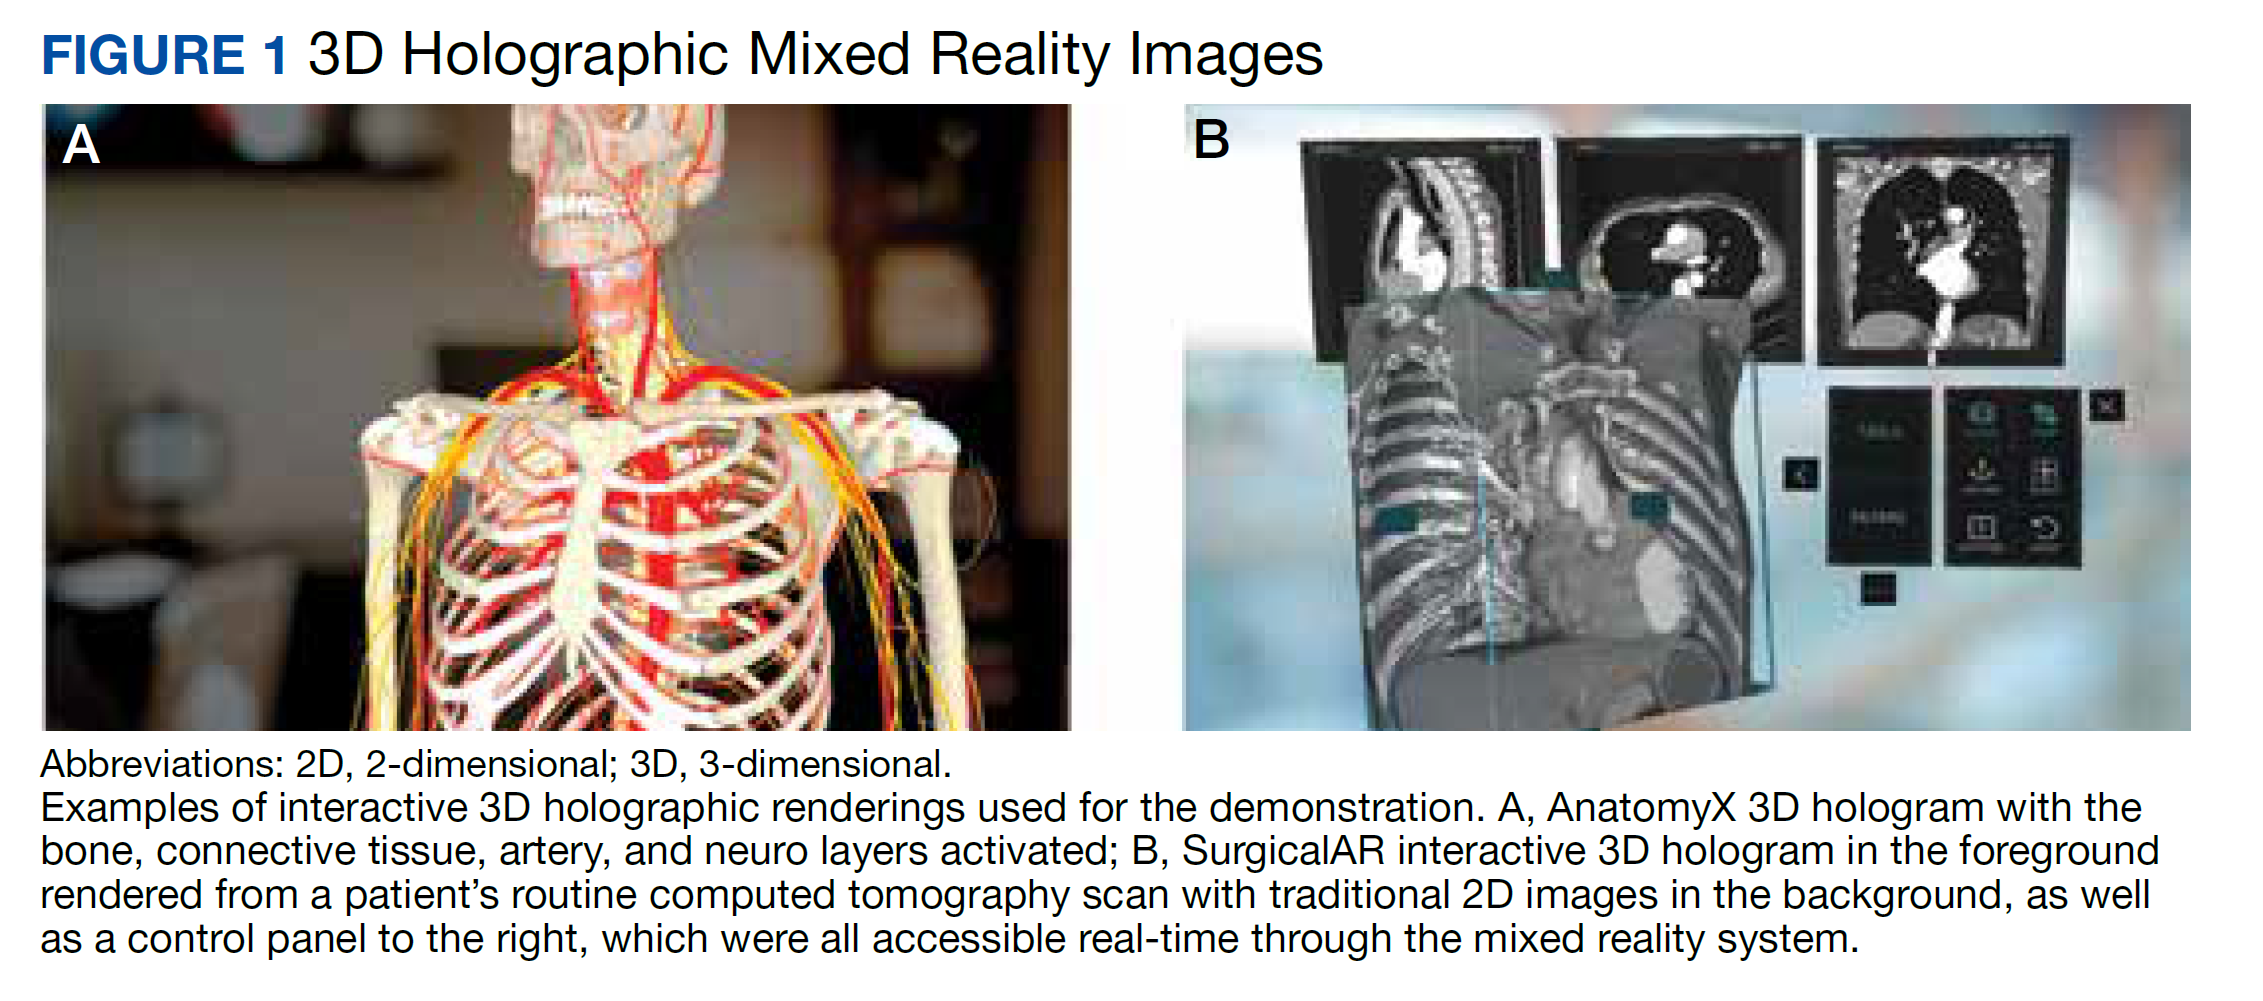
The wireless Microsoft HoloLens 2 AR/MR headset was used for viewing and sensor-enabled collaborative interaction. Multiple participants in the same physical location simultaneously participated and interacted with 3D holograms. The interactive hologram data were enabled for 3D stereoscopic viewing and manipulation.
Setting and Participants
We reviewed published studies that used questionnaires to evaluate institutions’ level of innovation and new technology user acceptance to develop the questionnaire.49-56 Questions and methods were modified, with a focus on understanding the impact on hospital employees. The questionnaire consisted of 2 predemonstration and 3 postdemonstration sections. The first section included background questions. The second (predemonstration) and third (postdemonstration) sections provided matched questions on feelings about the VA. The fourth section included 2 unmatched questions about how the participant felt this technology would impact veterans and whether the VA should implement similar technologies. We used a 5-point Likert scale for sections 2, 3 and 4 (1 = not at all to 5 = extremely). Two unmatched free-text questions asked how the technology could be used in the participant’s hospital service, and another open-ended question asked for any additional comments. To reduce potential reporting bias, 2 VA employees that did not work at VAPAHCS assisted with the survey distribution and collection. VAPAHCS staff were informed by all employee email and facility intranet of the opportunity to participate; the voluntary demonstration and survey took place on February 10 and 11, 2020.
Data Analysis
All matching pre/post questions were analyzed together to determine statistically significant differences using the Wilcoxon signed rank matched pairs test and pooled t test. Survey respondents were also grouped by employment type to evaluate the impact on subgroups. Results were also grouped by VA tenure into 4 categorical 10-year increments (0-10, 11-20, 21-30, 31-40). Additionally, analysis of variance (ANOVA) was performed on employment types and VA tenure to understand whether there was a statistically significant difference in responses by these subgroups. Respondents’ optional free-text answers were manually reviewed by 2 authors (ZPV and DMA), classified, coded by the common themes, and analyzed for comparison.
Results
A total of 166 participants completed the predemonstration survey, which was a requirement for participating in the AR demonstration. Of those, 159 staff members (95.8%) also completed at least part of the postdemonstration paired structured questions, and their results were included in the analysis. 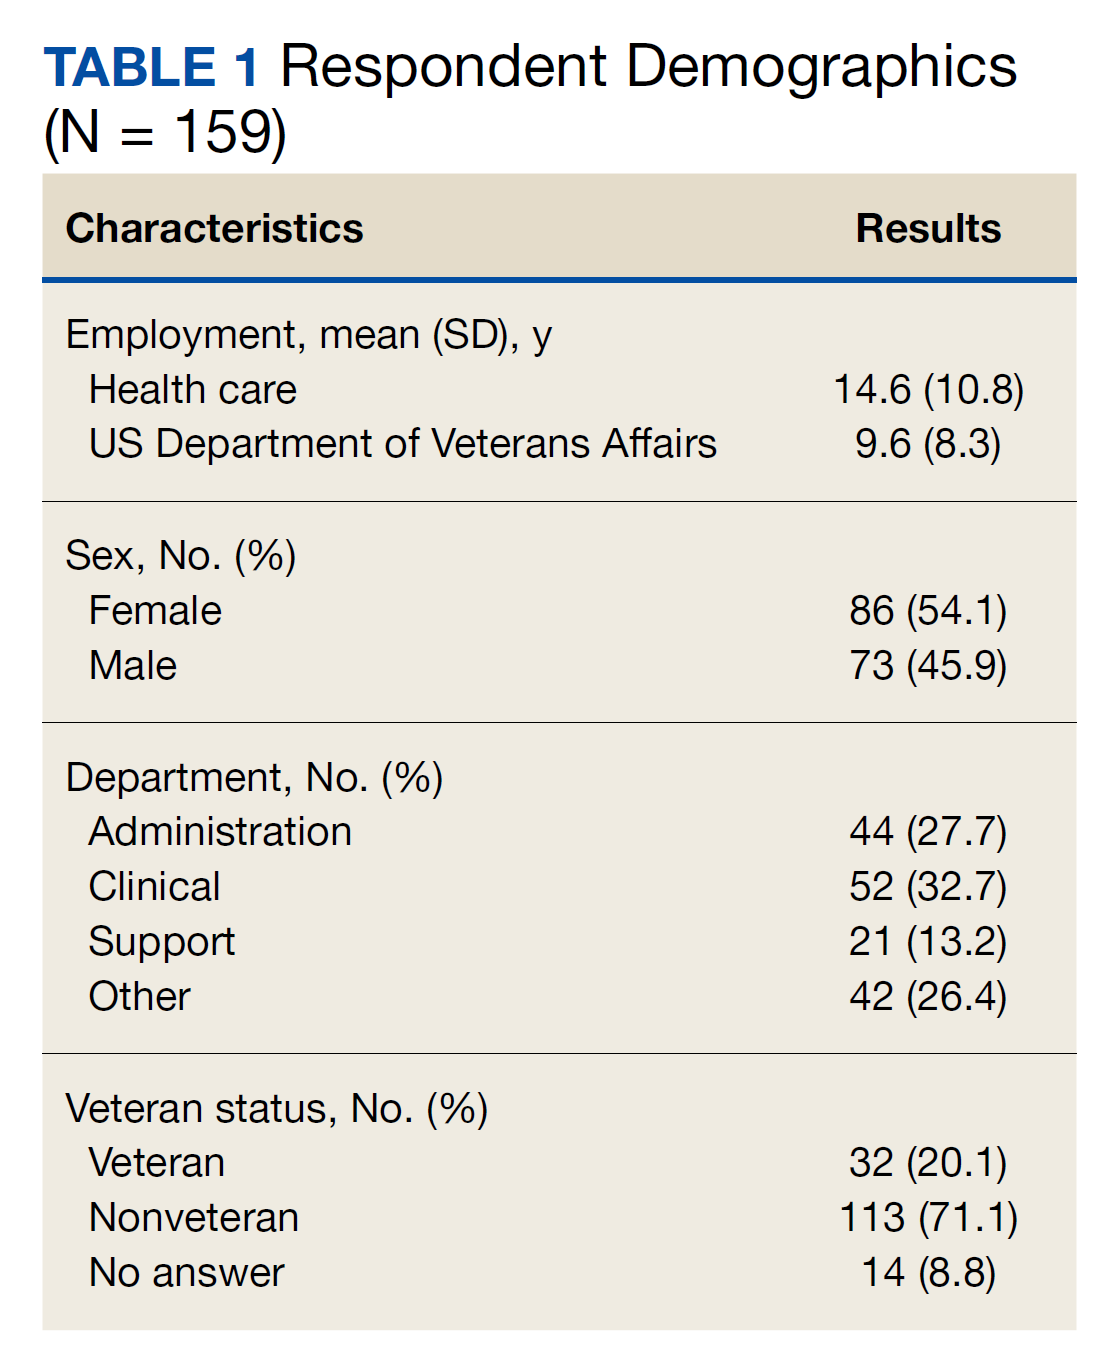
Paired Questions
For questions about how innovative the VA is, 108 of 152 participants (71.1%) provided higher scores after the demonstration, 42 (27.6%) had no change, and 2 (1.3%) provided decreased scores. The mean innovative score increased from 3.4 predemonstration to 4.5 postdemonstration on a Likert scale, which is a 1.1 point increase from predemonstration to postdemonstration (95% CI, 0.9- 1.2) or a 22% increase (95% CI, 18%-24%) (P < .001). Respondents level of excitement about VA also increased with 82 of 157 participants (52.2%) providing higher scores after the demonstration, 71 (45.2%) had no change, and 4 scores (2.5%) decreased. The predemonstration mean excitement score of 3.7 increased to 4.3 postdemonstration, which is a 0.6 point increase from before to after the demonstration (95% CI, 0.5-0.7) or a 12% increase (95% CI, 10%-14%) (P < .001). In the survey, 36 of 149 participants (24.2%) had higher scores for their expectation to continue working at VA postdemonstration, 109 (73.2%) had no change, and 4 scores (2.7%) decreased. The mean employee retention score increased from 4.2 predemonstration to 4.5 postdemonstration, which is a 0.3 point increase between pre/post (95% CI, 0.2-0.4) or a 6% increase (95% CI, 4%-8%) (P < .001)
The pre/post questions were analyzed using 1-way ANOVA by hospital department and VA tenure. The responses by department were not statistically significant. Of the 159 employees assessed, 101 respondents (63.5%) had 0 to 10 years VA tenure, 44 (27.7%) had 11 to 20 years, 10 (6.3%) had 21 to 30 years, and 4 (2.5%) had > 31 to 40 years. Length of VA tenure did not impact respondent excitement. Respondents opinions on innovation in the 0 to 10 year and the 11 to 20 year groups rose from 3.2 and 3.7 predemonstration to 4.3 and 4.6 postdemonstration, respectively (P < .001 for both statistical comparisons) (Table 2). Interestingly, the 0 to 10 group saw a 9% rise from a 4.0 score predemonstration to a 4.4 score postdemonstration (P < .001), indicating that the demonstration had a positive impact on their plans to continue employment at VA (Table 3).
Sex did not play a significant role in how respondents answered questions regarding VA excitement or innovation. However, there was a statistically significant difference in how male and female respondents answered the predemonstration question about their plans to continue VA employment, according to the Wilcoxon rank sum test. Predemonstration, female respondents had a mean score of 4.1, which was 6% lower than the 4.4 score of male colleagues (P = .04). Veteran status did have an impact on how respondents felt about VA innovation, and their plans to continue employment at VA. After the demonstration, veteran staff felt the VA was more innovative compared with nonveterans: 4.7 vs 4.4, respectively, a 6% difference (P = .02) Similarly, for the continued VA employment question, veterans had a mean score of 4.8 vs 4.4 for nonveterans, an 8% difference (P = .03) These results suggest that the demonstration had more of an impact on veteran employees vs nonveteran employees.
Unpaired Questions
There were 2 structured unpaired postdemonstration questions. Respondents agreed that similar technology would impact veteran health care with mean (SD) of 4.6 (0.6) and a median score of 5 on a 5-point Likert scale. Respondents also agreed on the importance of implementing similar innovations with mean (SD) of 4.7 (0.5), and a median score of 5.
The survey asked how this technology could benefit their hospital service department and had 64 responses. Forty-six respondents saw applications for education or patient care/surgery. Other responses shared excitement about the technology and its potential to positively impact patient education. There were 37 responses to the open-ended question: 21 respondents expressed excitement for the technology, and 10 respondents reiterated that the demonstration would be of benefit to patient care/surgery and training.
Discussion
Successful development, design, and deployment of any new health care tool depends on leveraging insights from the employees that will be using and supporting these systems. Correspondingly, understanding the impact that advanced technologies have on health care employees’ satisfaction, morale, and retention is critical to our overall institutional strategy. Our findings show that a one-time experience with AR/MR technology elicited positive employee reactions. Of note, the survey revealed statistically significant improvements in staff’s view of the VA, with the greatest positive impact for questions about innovation, followed by excitement to work at the VA, and likelihood to continue work at the VA. It is very disruptive and costly when health care employees leave, and improving employee satisfaction and morale is important for better patient care and patient satisfaction, which is priority for VAPAHCS leadership.57-62
The paired predemonstration and postdemonstration scores were similarly high, nearing the top threshold available for the Likert scale (4.3 to 4.5). Furthermore, the least incremental improvement for these responses was observed for topics that had the highest initial baseline score. Therefore, the improvements observed for the paired questions may have more to do with the high baseline values.
Of additional interest, the self-reported likelihood of continuing to work at the VA increased the most for female employees, veteran employees, and employees with the least number of years at the VA. These demographic differences have important implications for VA staff recruitment and retention strategies.62 The unpaired questions about the impact on veteran care and whether the VA should continue similar work demonstrated extremely high support with median scores of 5 for both questions. The free-text postdemonstration responses also demonstrate similar positive themes, with a disposition for excitement about both the training and patient care applications for this technology. In addition, respondents felt strongly that this and other similar technologies will positively impact the health care for veterans and that the VA should continue these efforts.
Strengths and Limitations
A strength of this assessment is the ability to evaluate survey responses that were systematically collected and matched from the same individual immediately before and after exposure to the new technology. The free-text responses provided additional important information that both confirmed the results and provided additional valued supplementary guidance for future implementation strategies, which is critical for our translational implementation goals. An additional strength is that the voluntary surveys were managed by non-VAPAHCS colleagues, limiting potential bias. Importantly, the number of respondents allowed a statistically significant assessment of important health care employee metrics. These results have emphasized how being part of an innovative organization, and the introduction of advanced AR/MR technology, improve employees’ satisfaction and morale about where they work as well as their intention to stay at their institution.
A limitation of this assessment was the lack of comparative data for employee acceptance of other technologies at VAPAHCS. This limits our ability to differentiate whether the strong positive results observed in this evaluation were a result of the specific technology assessed, or of new and advanced health care technology in general. Nonetheless, our unpaired questions, which received extremely high scores, also included participant questions about comparing the system with other similar technologies. This assessment was also focused on veteran care, which limits generalizability.
Conclusions
One-time exposure to advanced AR technology for health care significantly increased employee morale as measured by excitement about working at the VA as well as employee intention to continue employment at the VA. These collateral benefits of the technology are particularly important in health care because our employees are our most important asset and improving employee morale equates to better patient care. Positive impacts were most pronounced for women employees, newer VA employees, and employees who are also veterans. These more detailed insights are also positioned to have a direct impact on employee recruitment and retention strategies. Additional valuable insights regarding the most applicable use of the technology in the clinical setting were also obtained.
Acknowledgments
We thank Andrew Spiegelman, Hyewon Kim, Jonathan Sills, and Alexander Erickson for their assistance in developing the survey questions. We also thank Jason Rhodes and Mark Bulson for traveling to our facility to assist with managing the anonymous surveys during the demonstration event.
1. World Economic Forum. Health and healthcare in the fourth industrial revolution: Global Future Council on the future of health and healthcare 2016-2018. April 2019. Accessed January 27, 2023. https://www3.weforum.org/docs/WEF__Shaping_the_Future_of_Health_Council_Report.pdf
2. Iveroth E, Fryk P, Rapp B. Information technology strategy and alignment issues in health care organizations. Health Care Manage Rev. 2013;38(3):188-200. doi:10.1097/HMR.0b013e31826119d7
3. Thakur R, Hsu SH, Fontenot G. Innovation in healthcare: issues and future trends. J Bus Res. 2012;65(4):562-569. doi:10.1016/j.jbusres.2011.02.022
4. Thimbleby H. Technology and the future of healthcare. J Public Health Res. 2013;2(3):e28. Published 2013 Dec 1. doi:10.4081/jphr.2013.e28
5. Viglialoro RM, Condino S, Turini G, Carbone M, Ferrari V, Gesi M. augmented reality, mixed reality, and hybrid approach in healthcare simulation: a systematic review. Applied Sciences. 2021;11(5):2338. doi:10.3390/app11052338
6. Rawlins CR, Veigulis Z, Hebert C, Curtin C, Osborne T. Effect of immersive virtual reality on pain and anxiety at a Veterans Affairs health care facility. Front Virt Real. 2021;(2):136. doi:10.3389/frvir.2021.719681
7. Chawdhary G, Shoman N. Emerging artificial intelligence applications in otological imaging. Curr Opin Otolaryngol Head Neck Surg. 2021;29(5):357-364. doi:10.1097/MOO.0000000000000754
8. Asadzadeh A, Samad-Soltani T, Rezaei-Hachesu P. Applications of virtual and augmented reality in infectious disease epidemics with a focus on the COVID-19 outbreak. Inform Med Unlocked. 2021;24:100579. doi:10.1016/j.imu.2021.100579
9. Ashwini KB, Savitha R, Harish A. Application of augmented reality technology for home healthcare product visualization. ECS Transas. 2022;107(1):10921. doi:10.1149/10701.10921ecst
10. Brooks AL. VR/Technologies for Rehabilitation. In: Brooks AL, Brahman S, Kapralos B, Nakajima A, Tyerman J, Jain LC, eds. Recent Advances in Technologies for Inclusive Well-Being Virtual Patients, Gamification and Simulation. Intelligent Systems Reference Library. Springer; 2021:241-252. doi:10.1007/978-3-030-59608-8_13
11. Koulouris D, Menychtas A, Maglogiannis I. An IoT-enabled platform for the assessment of physical and mental activities utilizing augmented reality exergaming. Sensors (Basel). 2022;22(9):3181. Published 2022 Apr 21. doi:10.3390/s22093181
12. Deiss YR, Korkut S, Inglese T. Increase therapy understanding and medication adherence for patients with inflammatory skin diseases through augmented reality. Digital Human Modeling and Applications in Health, Safety, Ergonomics and Risk Management. Health, Operations Management, and Design: 13th International Conference, DHM 2022, Held as Part of the 24th HCI International Conference, HCII 2022. 2022:21-40. doi:10.1007/978-3-031-06018-2_2
13. Bertino E, Gao W, Steffan B, et al, eds. Lecture Notes in Computer Science (including subseries Lecture Notes in Artificial Intelligence and Lecture Notes in Bioinformatics). Springer; 2022:21-40.
14. Ruhaiyem NIR, Mazlan NA. Image Modeling Through Augmented Reality for Skin Allergies Recognition. Lecture Notes on Data Engineering and Communications Technologies. 2021:72-79. doi: 10.1007/978-3-030-70713-2_8
15. Park BJ, Perkons NR, Profka E, et al. Three-dimensional augmented reality visualization informs locoregional therapy in a translational model of hepatocellular carcinoma. J Vasc Interv Radiol. 2020;31(10):1612-1618.e1. doi:10.1016/j.jvir.2020.01.028
16. Leo J, Zhou Z, Yang H, et al, eds. Interactive cardiovascular surgical planning via augmented reality. 5th Asian CHI Symposium 2021; 2021. doi:10.1145/3429360.3468195
17. Zuo Y, Jiang T, Dou J, et al. A novel evaluation model for a mixed-reality surgical navigation system: where Microsoft Hololens meets the operating room. Surg Innov. 2020;27(2):193-202. doi:10.1177/1553350619893236
18. Ghaednia H, Fourman MS, Lans A, et al. Augmented and virtual reality in spine surgery, current applications and future potentials. Spine J. 2021;21(10):1617-1625. doi:10.1016/j.spinee.2021.03.018
19. Liu Y, Lee MG, Kim JS. Spine surgery assisted by augmented reality: where have we been?. Yonsei Med J. 2022;63(4):305-316. doi:10.3349/ymj.2022.63.4.305
20. Kimmel S, Cobus V, Heuten W, eds. opticARe—augmented reality mobile patient monitoring in intensive care units. Proceedings of the ACM Symposium on Virtual Reality Software and Technology, VRST; 2021. doi:10.1145/3489849.3489852
21. Voštinár P, Horváthová D, Mitter M, Bako M. The look at the various uses of VR. Open Computer Sci. 2021;11(1):241-250. doi:10.1515/comp-2020-0123
22. Zhao J, Xu X, Jiang H, Ding Y. The effectiveness of virtual reality-based technology on anatomy teaching: a meta-analysis of randomized controlled studies. BMC Med Educ. 2020;20(1):127. Published 2020 Apr 25. doi:10.1186/s12909-020-1994-z
23. Ricci S, Calandrino A, Borgonovo G, Chirico M, Casadio M. Viewpoint: virtual and augmented reality in basic and advanced life support training. JMIR Serious Games. 2022;10(1):e28595. Published 2022 Mar 23. doi:10.2196/28595
24. Ricci S, Mobilio GA, Calandrino A, et al. RiNeo MR: A mixed-reality tool for newborn life support training. Annu Int Conf IEEE Eng Med Biol Soc. 2021;2021:5043-5046. doi:10.1109/EMBC46164.2021.9629612
25. Dhar P, Rocks T, Samarasinghe RM, Stephenson G, Smith C. Augmented reality in medical education: students’ experiences and learning outcomes. Med Educ Online. 2021;26(1):1953953. doi:10.1080/10872981.2021.1953953
26. Pears M, Konstantinidis S. The future of immersive technology in global surgery education [published online ahead of print, 2021 Jul 1]. Indian J Surg. 2021;84(suppl 1):1-5. doi:10.1007/s12262-021-02998-6
27. Liang CJ, Start C, Boley H, Kamat VR, Menassa CC, Aebersold M. Enhancing stroke assessment simulation experience in clinical training using augmented reality. Virt Real. 2021;25(3):575-584. doi:10.1007/s10055-020-00475-1
28. Lacey G, Gozdzielewska L, McAloney-Kocaman K, Ruttle J, Cronin S, Price L. Psychomotor learning theory informing the design and evaluation of an interactive augmented reality hand hygiene training app for healthcare workers. Educ Inf Technol. 2022;27(3):3813-3832. doi:10.1007/s10639-021-10752-4
29. Ryan GV, Callaghan S, Rafferty A, Higgins MF, Mangina E, McAuliffe F. Learning outcomes of immersive technologies in health care student education: systematic review of the literature. J Med Internet Res. 2022;24(2):e30082. Published 2022 Feb 1. doi:10.2196/30082
30. Yu FU, Yan HU, Sundstedt V. A Systematic literature review of virtual, augmented, and mixed reality game applications in healthcare. ACM Trans Comput Healthcare. 2022;3(2);1-27. doi:10.1145/3472303
31. Weeks JK, Amiel JM. Enhancing neuroanatomy education with augmented reality. Med Educ. 2019;53(5):516-517. doi:10.1111/medu.13843
32. Williams MA, McVeigh J, Handa AI, Lee R. Augmented reality in surgical training: a systematic review. Postgrad Med J. 2020;96(1139):537-542. doi:10.1136/postgradmedj-2020-137600

33. Triepels CPR, Smeets CFA, Notten KJB, et al. Does three-dimensional anatomy improve student understanding? Clin Anat. 2020;33(1):25-33. doi:10.1002/ca.23405
34. Pietruski P, Majak M, S´wia¸tek-Najwer E, et al. Supporting fibula free flap harvest with augmented reality: A proof-of-concept study. Laryngoscope. 2020;130(5):1173-1179. doi:10.1002/lary.28090
35. Perkins SL, Krajancich B, Yang CJ, Hargreaves BA, Daniel BL, Berry MF. A patient-specific mixed-reality visualization tool for thoracic surgical planning. Ann Thorac Surg. 2020;110(1):290-295. doi:10.1016/j.athoracsur.2020.01.060
36. Müller F, Roner S, Liebmann F, Spirig JM, Fürnstahl P, Farshad M. Augmented reality navigation for spinal pedicle screw instrumentation using intraoperative 3D imaging. Spine J. 2020;20(4):621-628. doi:10.1016/j.spinee.2019.10.012
37. Kaplan AD, Cruit J, Endsley M, Beers SM, Sawyer BD, Hancock PA. The effects of virtual reality, augmented reality, and mixed reality as training enhancement methods: a meta-analysis. Hum Factors. 2021;63(4):706-726. doi:10.1177/0018720820904229
38. Jud L, Fotouhi J, Andronic O, et al. Applicability of augmented reality in orthopedic surgery - a systematic review. BMC Musculoskelet Disord. 2020;21(1):103. Published 2020 Feb 15. doi:10.1186/s12891-020-3110-2
39. Ara J, Karim FB, Alsubaie MSA, et al. Comprehensive analysis of augmented reality technology in modern healthcare system. Int J Adv Comput Sci Appl. 2021;12(6):845-854. doi:10.14569/IJACSA.2021.0120698
40. Webster A, Gardner J. Aligning technology and institutional readiness: the adoption of innovation. Technol Anal Strateg Manag. 2019;31(10):1229-1241. doi:10.1080/09537325.2019.1601694
41. Hastall MR, Dockweiler C, Mühlhaus J. achieving end user acceptance: building blocks for an evidence-based user-centered framework for health technology development and assessment. In: Antona, M, Stephanidis C, eds. Universal Access in Human–Computer Interaction. Human and Technological Environments. UAHCI 2017. Lecture Notes in Computer Science, vol 10279. Springer, Cham; 2017. doi:10.1007/978-3-319-58700-4_2
42. Ratwani RM, Fairbanks RJ, Hettinger AZ, Benda NC. Electronic health record usability: analysis of the user-centered design processes of eleven electronic health record vendors. J Am Med Inform Assoc. 2015;22(6):1179-1182. doi:10.1093/jamia/ocv050
43. Khairat S, Coleman C, Ottmar P, Jayachander DI, Bice T, Carson SS. Association of Electronic Health Record Use With Physician Fatigue and Efficiency. JAMA Netw Open. 2020;3(6):e207385. Published 2020 Jun 1. doi:10.1001/jamanetworkopen.2020.7385
44. Melnick ER, Dyrbye LN, Sinsky CA, et al. The association between perceived electronic health record usability and professional burnout among US physicians. Mayo Clin Proc. 2020;95(3):476-487. doi:10.1016/j.mayocp.2019.09.024
45. Lee YJ. Comparison of job satisfaction between nonprofit and public employees. Nonprofit Volunt Sect Q. 2016;45(2):295-313. doi:10.1177/0899764015584061
46. Brimhall KC. Inclusion is important... but how do I include? Examining the effects of leader engagement on inclusion, innovation, job satisfaction, and perceived quality of care in a diverse nonprofit health care organization. Nonprofit Volunt Sect Q. 2019;48(4):716-737. doi:10.1177/0899764019829834
47. Moreira MR, Gherman M, Sousa PS. Does innovation influence the performance of healthcare organizations?. Innovation (North Syd). 2017;19(3):335-352. doi:10.1080/14479338.2017.1293489
48. US Department of Veterans Affairs. VA Palo Alto Healthcare System. Updated December 29, 2020. Accessed January 27, 2023. https://www.paloalto.va.gov/about/index.asp
49. Siegel SM, Kaemmerer WF. Measuring the perceived support for innovation in organizations. J Appl Psychol. 1978;63(5):553-562. doi:10.1037/0021-9010.63.5.553
50. Anderson NR, West MA. Measuring climate for work group innovation: development and validation of the team climate inventory. J Organ Behav. 1998;19(3):235-258. doi:10.1002/(SICI)1099-1379(199805)19:3<235::AID-JOB837>3.0.CO;2-C
51. Aarons GA. Measuring provider attitudes toward evidence-based practice: consideration of organizational context and individual differences. Child Adolesc Psychiatr Clin N Am. 2005;14(2):255-viii. doi:10.1016/j.chc.2004.04.008
52. Van der Heijden H. User acceptance of hedonic information systems. MIS Q. 2004;28(4):695-704. doi:10.2307/25148660
53. Venkatesh V, Speier C, Morris MG. User acceptance enablers in individual decision making about technology: Toward an integrated model. Decis Sci. 2002;33(2):297-316. doi:10.1111/j.1540-5915.2002.tb01646.x
54. Puri A, Kim B, Nguyen O, Stolee P, Tung J, Lee J. User acceptance of wrist-worn activity trackers among community-dwelling older adults: mixed method study. JMIR Mhealth Uhealth. 2017;5(11):e173. Published 2017 Nov 15. doi:10.2196/mhealth.8211
55. Huang YC, Backman SJ, Backman KF, Moore D. Exploring user acceptance of 3D virtual worlds in travel and tourism marketing. Tourism Management. 2013;36:490-501. doi:10.1016/j.tourman.2012.09.009
56. Rasimah CM, Ahmad A, Zaman HB. Evaluation of user acceptance of mixed reality technology. AJET. 2011;27(8). doi:10.14742/ajet.899
57. Choi J, Boyle DK. RN workgroup job satisfaction and patient falls in acute care hospital units. J Nurs Adm. 2013;43(11):586-591. doi:10.1097/01.NNA.0000434509.66749.7c58. Tzeng HM, Ketefian S. The relationship between nurses’ job satisfaction and inpatient satisfaction: an exploratory study in a Taiwan teaching hospital. J Nurs Care Qual. 2002;16(2):39-49. doi:10.1097/00001786-200201000-00005
59. Williams ES, Skinner AC. Outcomes of physician job satisfaction: a narrative review, implications, and directions for future research. Health Care Manage Rev. 2003;28(2):119-139. doi:10.1097/00004010-200304000-00004
60. Waldman JD, Kelly F, Arora S, Smith HL. The shocking cost of turnover in health care. Health Care Manage Rev. 2004;29(1):2-7. doi:10.1097/00004010-200401000-00002
61. Hayes LJ, O’Brien-Pallas L, Duffield C, et al. Nurse turnover: a literature review - an update. Int J Nurs Stud. 2012;49(7):887-905. doi:10.1016/j.ijnurstu.2011.10.001
62. US Department of Veterans Affairs. FY 2021/FY 2019 Annual performance plan and report. February 2020. Accessed January 27, 2023. https://www.va.gov/oei/docs/VA2019-2021appr.pdf
Building the health care system of the future requires the thoughtful development and integration of innovative technologies to positively transform care.1-4 Extended reality (XR) represents a spectrum of emerging technologies that have the potential to enhance health care. This includes virtual reality (VR), where a computer-generated visual experience fills the screen; augmented reality (AR), which allows users to see computer-generated images superimposed into an otherwise normal real-world field of view; and mixed reality (MR), which allows users to interact and manipulate computer-generated AR images.
Clinicians and researchers have begun exploring the potential of XR to address a wide variety of health care challenges. A recent systematic review concluded that many clinical studies in this area have small sample sizes and are in the preclinical, proof-of-concept stage, but demonstrate the potential and impact of the underlying VR, AR, and MR technologies.5 Common emerging health care uses for XR include medical education, training, presurgical planning, surgical guidance, distraction therapy for pain and anxiety, and home health indications, including rehabilitation.5-39
Importantly, some researchers have raised concerns regarding the adaptability of the health care workforce with emerging technologies, and their interest in new methods of delivering care.7,39 Successful deployment of any novel health care technology depends on multiple factors, including alignment with staff needs, receptivity to those solutions, customization to specific preferences, and usability.1,3,40-42 Unfortunately, the implementation of some health care technologies, such as electronic health records that did not account for end-user requirements, resulted in employee fatigue, burnout, and negative staffing turnover.42-44 Conversely, elevated employee morale and operational performance have been directly linked to a climate of inclusion and innovation.45-47 In this assessment, we sought to understand US Department of Veterans Affairs (VA) employees’ perceptions and expert opinions related to the introduction of new AR/MR technology.
Methods
The VA Palo Alto Health Care System (VAPAHCS) consists of 3 inpatient hospitals and 7 outpatient clinics, provides a full range of care services to > 90,000 enrolled veterans with 800 hospital beds, 3 nursing homes, and a 100-bed domiciliary. The facility also runs data-driven care projects in research, innovation, and evidence-based practice group under nursing services.48 This project was performed by the VA National Center for Collaborative Healthcare Innovation at the VAPAHCS campus.
The combined technical system used for this assessment included a wireless communication network, AR/MR hardware, and software. Medivis AnatomyX software displayed an interactive human anatomy atlas segmented into about 6000 individual interactive parts. Medivis SurgicalAR received US Food and Drug Administration clearance for presurgical planning and was used to transform and display deidentified diagnostic images (eg, magnetic resonance images and computed tomography) in 3-dimensional (3D) interactive holograms (Figures 1 and 2).
The wireless Microsoft HoloLens 2 AR/MR headset was used for viewing and sensor-enabled collaborative interaction. Multiple participants in the same physical location simultaneously participated and interacted with 3D holograms. The interactive hologram data were enabled for 3D stereoscopic viewing and manipulation.
Setting and Participants
We reviewed published studies that used questionnaires to evaluate institutions’ level of innovation and new technology user acceptance to develop the questionnaire.49-56 Questions and methods were modified, with a focus on understanding the impact on hospital employees. The questionnaire consisted of 2 predemonstration and 3 postdemonstration sections. The first section included background questions. The second (predemonstration) and third (postdemonstration) sections provided matched questions on feelings about the VA. The fourth section included 2 unmatched questions about how the participant felt this technology would impact veterans and whether the VA should implement similar technologies. We used a 5-point Likert scale for sections 2, 3 and 4 (1 = not at all to 5 = extremely). Two unmatched free-text questions asked how the technology could be used in the participant’s hospital service, and another open-ended question asked for any additional comments. To reduce potential reporting bias, 2 VA employees that did not work at VAPAHCS assisted with the survey distribution and collection. VAPAHCS staff were informed by all employee email and facility intranet of the opportunity to participate; the voluntary demonstration and survey took place on February 10 and 11, 2020.
Data Analysis
All matching pre/post questions were analyzed together to determine statistically significant differences using the Wilcoxon signed rank matched pairs test and pooled t test. Survey respondents were also grouped by employment type to evaluate the impact on subgroups. Results were also grouped by VA tenure into 4 categorical 10-year increments (0-10, 11-20, 21-30, 31-40). Additionally, analysis of variance (ANOVA) was performed on employment types and VA tenure to understand whether there was a statistically significant difference in responses by these subgroups. Respondents’ optional free-text answers were manually reviewed by 2 authors (ZPV and DMA), classified, coded by the common themes, and analyzed for comparison.
Results
A total of 166 participants completed the predemonstration survey, which was a requirement for participating in the AR demonstration. Of those, 159 staff members (95.8%) also completed at least part of the postdemonstration paired structured questions, and their results were included in the analysis.
Paired Questions
For questions about how innovative the VA is, 108 of 152 participants (71.1%) provided higher scores after the demonstration, 42 (27.6%) had no change, and 2 (1.3%) provided decreased scores. The mean innovative score increased from 3.4 predemonstration to 4.5 postdemonstration on a Likert scale, which is a 1.1 point increase from predemonstration to postdemonstration (95% CI, 0.9- 1.2) or a 22% increase (95% CI, 18%-24%) (P < .001). Respondents level of excitement about VA also increased with 82 of 157 participants (52.2%) providing higher scores after the demonstration, 71 (45.2%) had no change, and 4 scores (2.5%) decreased. The predemonstration mean excitement score of 3.7 increased to 4.3 postdemonstration, which is a 0.6 point increase from before to after the demonstration (95% CI, 0.5-0.7) or a 12% increase (95% CI, 10%-14%) (P < .001). In the survey, 36 of 149 participants (24.2%) had higher scores for their expectation to continue working at VA postdemonstration, 109 (73.2%) had no change, and 4 scores (2.7%) decreased. The mean employee retention score increased from 4.2 predemonstration to 4.5 postdemonstration, which is a 0.3 point increase between pre/post (95% CI, 0.2-0.4) or a 6% increase (95% CI, 4%-8%) (P < .001)
The pre/post questions were analyzed using 1-way ANOVA by hospital department and VA tenure. The responses by department were not statistically significant. Of the 159 employees assessed, 101 respondents (63.5%) had 0 to 10 years VA tenure, 44 (27.7%) had 11 to 20 years, 10 (6.3%) had 21 to 30 years, and 4 (2.5%) had > 31 to 40 years. Length of VA tenure did not impact respondent excitement. Respondents opinions on innovation in the 0 to 10 year and the 11 to 20 year groups rose from 3.2 and 3.7 predemonstration to 4.3 and 4.6 postdemonstration, respectively (P < .001 for both statistical comparisons) (Table 2). Interestingly, the 0 to 10 group saw a 9% rise from a 4.0 score predemonstration to a 4.4 score postdemonstration (P < .001), indicating that the demonstration had a positive impact on their plans to continue employment at VA (Table 3).
Sex did not play a significant role in how respondents answered questions regarding VA excitement or innovation. However, there was a statistically significant difference in how male and female respondents answered the predemonstration question about their plans to continue VA employment, according to the Wilcoxon rank sum test. Predemonstration, female respondents had a mean score of 4.1, which was 6% lower than the 4.4 score of male colleagues (P = .04). Veteran status did have an impact on how respondents felt about VA innovation, and their plans to continue employment at VA. After the demonstration, veteran staff felt the VA was more innovative compared with nonveterans: 4.7 vs 4.4, respectively, a 6% difference (P = .02) Similarly, for the continued VA employment question, veterans had a mean score of 4.8 vs 4.4 for nonveterans, an 8% difference (P = .03) These results suggest that the demonstration had more of an impact on veteran employees vs nonveteran employees.
Unpaired Questions
There were 2 structured unpaired postdemonstration questions. Respondents agreed that similar technology would impact veteran health care with mean (SD) of 4.6 (0.6) and a median score of 5 on a 5-point Likert scale. Respondents also agreed on the importance of implementing similar innovations with mean (SD) of 4.7 (0.5), and a median score of 5.
The survey asked how this technology could benefit their hospital service department and had 64 responses. Forty-six respondents saw applications for education or patient care/surgery. Other responses shared excitement about the technology and its potential to positively impact patient education. There were 37 responses to the open-ended question: 21 respondents expressed excitement for the technology, and 10 respondents reiterated that the demonstration would be of benefit to patient care/surgery and training.
Discussion
Successful development, design, and deployment of any new health care tool depends on leveraging insights from the employees that will be using and supporting these systems. Correspondingly, understanding the impact that advanced technologies have on health care employees’ satisfaction, morale, and retention is critical to our overall institutional strategy. Our findings show that a one-time experience with AR/MR technology elicited positive employee reactions. Of note, the survey revealed statistically significant improvements in staff’s view of the VA, with the greatest positive impact for questions about innovation, followed by excitement to work at the VA, and likelihood to continue work at the VA. It is very disruptive and costly when health care employees leave, and improving employee satisfaction and morale is important for better patient care and patient satisfaction, which is priority for VAPAHCS leadership.57-62
The paired predemonstration and postdemonstration scores were similarly high, nearing the top threshold available for the Likert scale (4.3 to 4.5). Furthermore, the least incremental improvement for these responses was observed for topics that had the highest initial baseline score. Therefore, the improvements observed for the paired questions may have more to do with the high baseline values.
Of additional interest, the self-reported likelihood of continuing to work at the VA increased the most for female employees, veteran employees, and employees with the least number of years at the VA. These demographic differences have important implications for VA staff recruitment and retention strategies.62 The unpaired questions about the impact on veteran care and whether the VA should continue similar work demonstrated extremely high support with median scores of 5 for both questions. The free-text postdemonstration responses also demonstrate similar positive themes, with a disposition for excitement about both the training and patient care applications for this technology. In addition, respondents felt strongly that this and other similar technologies will positively impact the health care for veterans and that the VA should continue these efforts.
Strengths and Limitations
A strength of this assessment is the ability to evaluate survey responses that were systematically collected and matched from the same individual immediately before and after exposure to the new technology. The free-text responses provided additional important information that both confirmed the results and provided additional valued supplementary guidance for future implementation strategies, which is critical for our translational implementation goals. An additional strength is that the voluntary surveys were managed by non-VAPAHCS colleagues, limiting potential bias. Importantly, the number of respondents allowed a statistically significant assessment of important health care employee metrics. These results have emphasized how being part of an innovative organization, and the introduction of advanced AR/MR technology, improve employees’ satisfaction and morale about where they work as well as their intention to stay at their institution.
A limitation of this assessment was the lack of comparative data for employee acceptance of other technologies at VAPAHCS. This limits our ability to differentiate whether the strong positive results observed in this evaluation were a result of the specific technology assessed, or of new and advanced health care technology in general. Nonetheless, our unpaired questions, which received extremely high scores, also included participant questions about comparing the system with other similar technologies. This assessment was also focused on veteran care, which limits generalizability.
Conclusions
One-time exposure to advanced AR technology for health care significantly increased employee morale as measured by excitement about working at the VA as well as employee intention to continue employment at the VA. These collateral benefits of the technology are particularly important in health care because our employees are our most important asset and improving employee morale equates to better patient care. Positive impacts were most pronounced for women employees, newer VA employees, and employees who are also veterans. These more detailed insights are also positioned to have a direct impact on employee recruitment and retention strategies. Additional valuable insights regarding the most applicable use of the technology in the clinical setting were also obtained.
Acknowledgments
We thank Andrew Spiegelman, Hyewon Kim, Jonathan Sills, and Alexander Erickson for their assistance in developing the survey questions. We also thank Jason Rhodes and Mark Bulson for traveling to our facility to assist with managing the anonymous surveys during the demonstration event.
1. World Economic Forum. Health and healthcare in the fourth industrial revolution: Global Future Council on the future of health and healthcare 2016-2018. April 2019. Accessed January 27, 2023. https://www3.weforum.org/docs/WEF__Shaping_the_Future_of_Health_Council_Report.pdf
2. Iveroth E, Fryk P, Rapp B. Information technology strategy and alignment issues in health care organizations. Health Care Manage Rev. 2013;38(3):188-200. doi:10.1097/HMR.0b013e31826119d7
3. Thakur R, Hsu SH, Fontenot G. Innovation in healthcare: issues and future trends. J Bus Res. 2012;65(4):562-569. doi:10.1016/j.jbusres.2011.02.022
4. Thimbleby H. Technology and the future of healthcare. J Public Health Res. 2013;2(3):e28. Published 2013 Dec 1. doi:10.4081/jphr.2013.e28
5. Viglialoro RM, Condino S, Turini G, Carbone M, Ferrari V, Gesi M. augmented reality, mixed reality, and hybrid approach in healthcare simulation: a systematic review. Applied Sciences. 2021;11(5):2338. doi:10.3390/app11052338
6. Rawlins CR, Veigulis Z, Hebert C, Curtin C, Osborne T. Effect of immersive virtual reality on pain and anxiety at a Veterans Affairs health care facility. Front Virt Real. 2021;(2):136. doi:10.3389/frvir.2021.719681
7. Chawdhary G, Shoman N. Emerging artificial intelligence applications in otological imaging. Curr Opin Otolaryngol Head Neck Surg. 2021;29(5):357-364. doi:10.1097/MOO.0000000000000754
8. Asadzadeh A, Samad-Soltani T, Rezaei-Hachesu P. Applications of virtual and augmented reality in infectious disease epidemics with a focus on the COVID-19 outbreak. Inform Med Unlocked. 2021;24:100579. doi:10.1016/j.imu.2021.100579
9. Ashwini KB, Savitha R, Harish A. Application of augmented reality technology for home healthcare product visualization. ECS Transas. 2022;107(1):10921. doi:10.1149/10701.10921ecst
10. Brooks AL. VR/Technologies for Rehabilitation. In: Brooks AL, Brahman S, Kapralos B, Nakajima A, Tyerman J, Jain LC, eds. Recent Advances in Technologies for Inclusive Well-Being Virtual Patients, Gamification and Simulation. Intelligent Systems Reference Library. Springer; 2021:241-252. doi:10.1007/978-3-030-59608-8_13
11. Koulouris D, Menychtas A, Maglogiannis I. An IoT-enabled platform for the assessment of physical and mental activities utilizing augmented reality exergaming. Sensors (Basel). 2022;22(9):3181. Published 2022 Apr 21. doi:10.3390/s22093181
12. Deiss YR, Korkut S, Inglese T. Increase therapy understanding and medication adherence for patients with inflammatory skin diseases through augmented reality. Digital Human Modeling and Applications in Health, Safety, Ergonomics and Risk Management. Health, Operations Management, and Design: 13th International Conference, DHM 2022, Held as Part of the 24th HCI International Conference, HCII 2022. 2022:21-40. doi:10.1007/978-3-031-06018-2_2
13. Bertino E, Gao W, Steffan B, et al, eds. Lecture Notes in Computer Science (including subseries Lecture Notes in Artificial Intelligence and Lecture Notes in Bioinformatics). Springer; 2022:21-40.
14. Ruhaiyem NIR, Mazlan NA. Image Modeling Through Augmented Reality for Skin Allergies Recognition. Lecture Notes on Data Engineering and Communications Technologies. 2021:72-79. doi: 10.1007/978-3-030-70713-2_8
15. Park BJ, Perkons NR, Profka E, et al. Three-dimensional augmented reality visualization informs locoregional therapy in a translational model of hepatocellular carcinoma. J Vasc Interv Radiol. 2020;31(10):1612-1618.e1. doi:10.1016/j.jvir.2020.01.028
16. Leo J, Zhou Z, Yang H, et al, eds. Interactive cardiovascular surgical planning via augmented reality. 5th Asian CHI Symposium 2021; 2021. doi:10.1145/3429360.3468195
17. Zuo Y, Jiang T, Dou J, et al. A novel evaluation model for a mixed-reality surgical navigation system: where Microsoft Hololens meets the operating room. Surg Innov. 2020;27(2):193-202. doi:10.1177/1553350619893236
18. Ghaednia H, Fourman MS, Lans A, et al. Augmented and virtual reality in spine surgery, current applications and future potentials. Spine J. 2021;21(10):1617-1625. doi:10.1016/j.spinee.2021.03.018
19. Liu Y, Lee MG, Kim JS. Spine surgery assisted by augmented reality: where have we been?. Yonsei Med J. 2022;63(4):305-316. doi:10.3349/ymj.2022.63.4.305
20. Kimmel S, Cobus V, Heuten W, eds. opticARe—augmented reality mobile patient monitoring in intensive care units. Proceedings of the ACM Symposium on Virtual Reality Software and Technology, VRST; 2021. doi:10.1145/3489849.3489852
21. Voštinár P, Horváthová D, Mitter M, Bako M. The look at the various uses of VR. Open Computer Sci. 2021;11(1):241-250. doi:10.1515/comp-2020-0123
22. Zhao J, Xu X, Jiang H, Ding Y. The effectiveness of virtual reality-based technology on anatomy teaching: a meta-analysis of randomized controlled studies. BMC Med Educ. 2020;20(1):127. Published 2020 Apr 25. doi:10.1186/s12909-020-1994-z
23. Ricci S, Calandrino A, Borgonovo G, Chirico M, Casadio M. Viewpoint: virtual and augmented reality in basic and advanced life support training. JMIR Serious Games. 2022;10(1):e28595. Published 2022 Mar 23. doi:10.2196/28595
24. Ricci S, Mobilio GA, Calandrino A, et al. RiNeo MR: A mixed-reality tool for newborn life support training. Annu Int Conf IEEE Eng Med Biol Soc. 2021;2021:5043-5046. doi:10.1109/EMBC46164.2021.9629612
25. Dhar P, Rocks T, Samarasinghe RM, Stephenson G, Smith C. Augmented reality in medical education: students’ experiences and learning outcomes. Med Educ Online. 2021;26(1):1953953. doi:10.1080/10872981.2021.1953953
26. Pears M, Konstantinidis S. The future of immersive technology in global surgery education [published online ahead of print, 2021 Jul 1]. Indian J Surg. 2021;84(suppl 1):1-5. doi:10.1007/s12262-021-02998-6
27. Liang CJ, Start C, Boley H, Kamat VR, Menassa CC, Aebersold M. Enhancing stroke assessment simulation experience in clinical training using augmented reality. Virt Real. 2021;25(3):575-584. doi:10.1007/s10055-020-00475-1
28. Lacey G, Gozdzielewska L, McAloney-Kocaman K, Ruttle J, Cronin S, Price L. Psychomotor learning theory informing the design and evaluation of an interactive augmented reality hand hygiene training app for healthcare workers. Educ Inf Technol. 2022;27(3):3813-3832. doi:10.1007/s10639-021-10752-4
29. Ryan GV, Callaghan S, Rafferty A, Higgins MF, Mangina E, McAuliffe F. Learning outcomes of immersive technologies in health care student education: systematic review of the literature. J Med Internet Res. 2022;24(2):e30082. Published 2022 Feb 1. doi:10.2196/30082
30. Yu FU, Yan HU, Sundstedt V. A Systematic literature review of virtual, augmented, and mixed reality game applications in healthcare. ACM Trans Comput Healthcare. 2022;3(2);1-27. doi:10.1145/3472303
31. Weeks JK, Amiel JM. Enhancing neuroanatomy education with augmented reality. Med Educ. 2019;53(5):516-517. doi:10.1111/medu.13843
32. Williams MA, McVeigh J, Handa AI, Lee R. Augmented reality in surgical training: a systematic review. Postgrad Med J. 2020;96(1139):537-542. doi:10.1136/postgradmedj-2020-137600
33. Triepels CPR, Smeets CFA, Notten KJB, et al. Does three-dimensional anatomy improve student understanding? Clin Anat. 2020;33(1):25-33. doi:10.1002/ca.23405
34. Pietruski P, Majak M, S´wia¸tek-Najwer E, et al. Supporting fibula free flap harvest with augmented reality: A proof-of-concept study. Laryngoscope. 2020;130(5):1173-1179. doi:10.1002/lary.28090
35. Perkins SL, Krajancich B, Yang CJ, Hargreaves BA, Daniel BL, Berry MF. A patient-specific mixed-reality visualization tool for thoracic surgical planning. Ann Thorac Surg. 2020;110(1):290-295. doi:10.1016/j.athoracsur.2020.01.060
36. Müller F, Roner S, Liebmann F, Spirig JM, Fürnstahl P, Farshad M. Augmented reality navigation for spinal pedicle screw instrumentation using intraoperative 3D imaging. Spine J. 2020;20(4):621-628. doi:10.1016/j.spinee.2019.10.012
37. Kaplan AD, Cruit J, Endsley M, Beers SM, Sawyer BD, Hancock PA. The effects of virtual reality, augmented reality, and mixed reality as training enhancement methods: a meta-analysis. Hum Factors. 2021;63(4):706-726. doi:10.1177/0018720820904229
38. Jud L, Fotouhi J, Andronic O, et al. Applicability of augmented reality in orthopedic surgery - a systematic review. BMC Musculoskelet Disord. 2020;21(1):103. Published 2020 Feb 15. doi:10.1186/s12891-020-3110-2
39. Ara J, Karim FB, Alsubaie MSA, et al. Comprehensive analysis of augmented reality technology in modern healthcare system. Int J Adv Comput Sci Appl. 2021;12(6):845-854. doi:10.14569/IJACSA.2021.0120698
40. Webster A, Gardner J. Aligning technology and institutional readiness: the adoption of innovation. Technol Anal Strateg Manag. 2019;31(10):1229-1241. doi:10.1080/09537325.2019.1601694
41. Hastall MR, Dockweiler C, Mühlhaus J. achieving end user acceptance: building blocks for an evidence-based user-centered framework for health technology development and assessment. In: Antona, M, Stephanidis C, eds. Universal Access in Human–Computer Interaction. Human and Technological Environments. UAHCI 2017. Lecture Notes in Computer Science, vol 10279. Springer, Cham; 2017. doi:10.1007/978-3-319-58700-4_2
42. Ratwani RM, Fairbanks RJ, Hettinger AZ, Benda NC. Electronic health record usability: analysis of the user-centered design processes of eleven electronic health record vendors. J Am Med Inform Assoc. 2015;22(6):1179-1182. doi:10.1093/jamia/ocv050
43. Khairat S, Coleman C, Ottmar P, Jayachander DI, Bice T, Carson SS. Association of Electronic Health Record Use With Physician Fatigue and Efficiency. JAMA Netw Open. 2020;3(6):e207385. Published 2020 Jun 1. doi:10.1001/jamanetworkopen.2020.7385
44. Melnick ER, Dyrbye LN, Sinsky CA, et al. The association between perceived electronic health record usability and professional burnout among US physicians. Mayo Clin Proc. 2020;95(3):476-487. doi:10.1016/j.mayocp.2019.09.024
45. Lee YJ. Comparison of job satisfaction between nonprofit and public employees. Nonprofit Volunt Sect Q. 2016;45(2):295-313. doi:10.1177/0899764015584061
46. Brimhall KC. Inclusion is important... but how do I include? Examining the effects of leader engagement on inclusion, innovation, job satisfaction, and perceived quality of care in a diverse nonprofit health care organization. Nonprofit Volunt Sect Q. 2019;48(4):716-737. doi:10.1177/0899764019829834
47. Moreira MR, Gherman M, Sousa PS. Does innovation influence the performance of healthcare organizations?. Innovation (North Syd). 2017;19(3):335-352. doi:10.1080/14479338.2017.1293489
48. US Department of Veterans Affairs. VA Palo Alto Healthcare System. Updated December 29, 2020. Accessed January 27, 2023. https://www.paloalto.va.gov/about/index.asp
49. Siegel SM, Kaemmerer WF. Measuring the perceived support for innovation in organizations. J Appl Psychol. 1978;63(5):553-562. doi:10.1037/0021-9010.63.5.553
50. Anderson NR, West MA. Measuring climate for work group innovation: development and validation of the team climate inventory. J Organ Behav. 1998;19(3):235-258. doi:10.1002/(SICI)1099-1379(199805)19:3<235::AID-JOB837>3.0.CO;2-C
51. Aarons GA. Measuring provider attitudes toward evidence-based practice: consideration of organizational context and individual differences. Child Adolesc Psychiatr Clin N Am. 2005;14(2):255-viii. doi:10.1016/j.chc.2004.04.008
52. Van der Heijden H. User acceptance of hedonic information systems. MIS Q. 2004;28(4):695-704. doi:10.2307/25148660
53. Venkatesh V, Speier C, Morris MG. User acceptance enablers in individual decision making about technology: Toward an integrated model. Decis Sci. 2002;33(2):297-316. doi:10.1111/j.1540-5915.2002.tb01646.x
54. Puri A, Kim B, Nguyen O, Stolee P, Tung J, Lee J. User acceptance of wrist-worn activity trackers among community-dwelling older adults: mixed method study. JMIR Mhealth Uhealth. 2017;5(11):e173. Published 2017 Nov 15. doi:10.2196/mhealth.8211
55. Huang YC, Backman SJ, Backman KF, Moore D. Exploring user acceptance of 3D virtual worlds in travel and tourism marketing. Tourism Management. 2013;36:490-501. doi:10.1016/j.tourman.2012.09.009
56. Rasimah CM, Ahmad A, Zaman HB. Evaluation of user acceptance of mixed reality technology. AJET. 2011;27(8). doi:10.14742/ajet.899
57. Choi J, Boyle DK. RN workgroup job satisfaction and patient falls in acute care hospital units. J Nurs Adm. 2013;43(11):586-591. doi:10.1097/01.NNA.0000434509.66749.7c58. Tzeng HM, Ketefian S. The relationship between nurses’ job satisfaction and inpatient satisfaction: an exploratory study in a Taiwan teaching hospital. J Nurs Care Qual. 2002;16(2):39-49. doi:10.1097/00001786-200201000-00005
59. Williams ES, Skinner AC. Outcomes of physician job satisfaction: a narrative review, implications, and directions for future research. Health Care Manage Rev. 2003;28(2):119-139. doi:10.1097/00004010-200304000-00004
60. Waldman JD, Kelly F, Arora S, Smith HL. The shocking cost of turnover in health care. Health Care Manage Rev. 2004;29(1):2-7. doi:10.1097/00004010-200401000-00002
61. Hayes LJ, O’Brien-Pallas L, Duffield C, et al. Nurse turnover: a literature review - an update. Int J Nurs Stud. 2012;49(7):887-905. doi:10.1016/j.ijnurstu.2011.10.001
62. US Department of Veterans Affairs. FY 2021/FY 2019 Annual performance plan and report. February 2020. Accessed January 27, 2023. https://www.va.gov/oei/docs/VA2019-2021appr.pdf
Characterization of Blood-borne Pathogen Exposures During Dermatologic Procedures: The Mayo Clinic Experience
Dermatology providers are at an increased risk for blood-borne pathogen (BBP) exposures during procedures in clinical practice.1-3 Current data regarding the characterization of these exposures are limited. Prior studies are based on surveys that result in low response rates and potential for selection bias. Donnelly et al1 reported a 26% response rate in a national survey-based study evaluating BBP exposures in resident physicians, fellows, and practicing dermatologists, with 85% of respondents reporting at least 1 injury. Similarly, Goulart et al2 reported a 35% response rate in a survey evaluating sharps injuries in residents and medical students, with 85% reporting a sharps injury. In addition, there are conflicting data regarding characteristics of these exposures, including common implicated instruments and procedures.1-3 Prior studies also have not evaluated exposures in all members of dermatologic staff, including resident physicians, practicing dermatologists, and ancillary staff.
To make appropriate quality improvements in dermatologic procedures, a more comprehensive understanding of BBP exposures is needed. We conducted a retrospective review of BBP incidence reports to identify the incidence of BBP events among all dermatologic staff, including resident physicians, practicing dermatologists, and ancillary staff. We further investigated the type of exposure, the type of procedure associated with each exposure, anatomic locations of exposures, and instruments involved in each exposure.
Methods
Data on BBP exposures in the dermatology departments were obtained from the occupational health departments at each of 3 Mayo Clinic sites—Scottsdale, Arizona; Jacksonville, Florida; and Rochester, Minnesota—from March 2010 through January 2021. The institutional review board at Mayo Clinic, Scottsdale, Arizona, granted approval of this study (IRB #20-012625). A retrospective review of each exposure was conducted to identify the incidence of BBP exposures. Occupational BBP exposure was defined as
Statistical Analysis—Variables were summarized using counts and percentages. The 3 most common categories for each variable were then compared among occupational groups using the Fisher exact test. All other categories were grouped for analysis purposes. Medical staff were categorized into 3 occupational groups: practicing dermatologists; resident physicians; and ancillary staff, including nurse/medical assistants, physician assistants, and clinical laboratory technologists. All analyses were 2 sided and considered statistically significant at P<.05. Analyses were performed using SAS 9.4 (SAS Institute Inc).
Results
Type of Exposure—A total of 222 BBP exposures were identified through the trisite retrospective review from March 2010 through January 2021. One hundred ninety-nine (89.6%) of 222 exposures were attributed to needlesticks and medical sharps, while 23 (10.4%) of 222 exposures were attributed to splash incidents (Table).

Anatomic Sites Affected—The anatomic location most frequently involved was the thumb (130/217 events [59.9%]), followed by the hand (39/217 events [18.0%]) and finger (22/217 events [10.1%]). The arm, face, and knee were affected with the lowest frequency, with only 1 event reported at each anatomic site (0.5%)(eTable). Five incidents were excluded from the analysis of anatomic location because of insufficient details of events.


Incident Tasks and Tools—Most BBP exposures occurred during suturing or assisting with suturing (64/210 events [30.5%]), followed by handling of sharps, wires, or instruments (40/210 events [19.0%]) and medication administration (37/210 events [17.6%])(eTable). Twelve incidents were excluded from the analysis of implicated tasks because of insufficient details of events.
The tools involved in exposure events with the greatest prevalence included the suture needle (76/201 events [37.8%]), injection syringe/needle (43/201 events [21.4%]), and shave biopsy razor (24/201 events [11.9%])(eTable). Twenty-one incidents were excluded from the analysis of implicated instruments because of insufficient details of events.
Providers Affected by BBP Exposures—Resident physicians experienced the greatest number of BBP exposures (105/222 events [47.3%]), followed by ancillary providers (84/222 events [37.8%]) and practicing dermatologists (33/222 events [14.9%]). All occupational groups experienced more BBP exposures through needlesticks/medical sharps compared with splash incidents (resident physicians, 88.6%; ancillary staff, 91.7%; practicing dermatologists, 87.9%; P=.725)(Table).
Among resident physicians, practicing dermatologists, and ancillary staff, the most frequent site of injury was the thumb. Suturing/assisting with suturing was the most common task leading to injury, and the suture needle was the most common instrument of injury for both resident physicians and practicing dermatologists. Handling of sharps, wires, or instruments was the most common task leading to injury for ancillary staff, and the injection syringe/needle was the most common instrument of injury in this cohort.
Resident physicians experienced the lowest rate of BBP exposures during administration of medications (12.7%; P=.003). Ancillary staff experienced the highest rate of BBP exposures with an injection needle (35.5%; P=.001). There were no statistically significant differences among occupational groups for the anatomic location of injury (P=.074)(eTable).
Comment
In the year 2000, the annual global incidence of occupational BBP exposures among health care workers worldwide for hepatitis B virus, hepatitis C virus, and HIV was estimated at 2.1 million, 926,000, and 327,000, respectively. Most of these exposures were due to sharps injuries.4 Dermatologists are particularly at risk for BBP exposures given their reliance on frequent procedures in practice. During an 11-year period, 222 BBP exposures were documented in the dermatology departments at 3 Mayo Clinic institutions. Most exposures were due to needlestick/sharps across all occupational groups compared with splash injuries. Prior survey studies confirm that sharps injuries are frequently implicated, with 75% to 94% of residents and practicing dermatologists reporting at least 1 sharps injury.1
Among occupational groups, resident physicians had the highest rate of BBP exposures, followed by nurse/medical assistants and practicing dermatologists, which may be secondary to lack of training or experience. Data from other surgical fields, including general surgery, support that resident physicians have the highest rate of sharps injuries.5 In a survey study (N=452), 51% of residents reported that extra training in safe techniques would be beneficial.2 Safety training may be beneficial in reducing the incidence of BBP exposures in residency programs.
The most common implicated task in resident physicians and practicing dermatologists was suturing or assisting with suturing, and the most common implicated instrument was the suture needle. Prior studies showed conflicting data regarding common implicated tasks and instruments in this cohort.1,2 The task of suturing and the suture needle also were the most implicated means of injury among other surgical specialties.6 Ancillary staff experienced most BBP exposures during handling of sharps, wires, or instruments, as well as the use of an injection needle. The designation of tasks among dermatologic staff likely explains the difference among occupational groups. This new information may provide the opportunity to improve safety measures among all members of the dermatologic team.
Limitations—There are several limitations to this study. This retrospective review was conducted at a single health system at 3 institutions. Hence, similar safety protocols likely were in place across all sites, which may reduce the generalizability of the results. In addition, there is risk of nonreporting bias among staff, as only documented incidence reports were evaluated. Prior studies demonstrated a nonreporting prevalence of 33% to 64% among dermatology staff.1-3 We also did not evaluate whether injuries resulted in BBP exposure or transmission. The rates of postexposure prophylaxis also were not studied. This information was not available for review because of concerns for privacy. Demographic features, such as gender or years of training, also were not evaluated.
Conclusion
This study provides additional insight on the incidence of BBP exposures in dermatology, as well as the implicated tasks, instruments, and anatomic locations of injury. Studies show that implementing formal education regarding the risks of BBP exposure may result in reduction of sharps injuries.7 Formal education in residency programs may be needed in the field of dermatology to reduce BBP exposures. Quality improvement measures should focus on identified risk factors among occupational groups to reduce BBP exposures in the workplace.
- Donnelly AF, Chang Y-HH, Nemeth-Ochoa SA. Sharps injuries and reporting practices of U.S. dermatologists [published online November 14, 2013]. Dermatol Surg. 2013;39:1813-1821.
- Goulart J, Oliveria S, Levitt J. Safety during dermatologic procedures and surgeries: a survey of resident injuries and prevention strategies. J Am Acad Dermatol. 2011;65:648-650.
- Ken K, Golda N. Contaminated sharps injuries: a survey among dermatology residents. J Am Acad Dermatol. 2019;80:1786-1788.
- Pruss-Ustun A, Rapiti E, Hutin Y. Estimation of global burden of disease attributable to contaminated sharps injuries among health-care workers. Am J Ind Med. 2005;48:482-490.
- Choi L, Torres R, Syed S, et al. Sharps and needlestick injuries among medical students, surgical residents, faculty, and operating room staff at a single academic institution. J Surg Educ. 2017;74:131-136.
- Bakaeen F, Awad S, Albo D, et al. Epidemiology of exposure to blood borne pathogens on a surgical service. Am J Surg. 2006;192:E18-E21.
- Li WJ, Zhang M, Shi CL, et al. Study on intervention of bloodborne pathogen exposure in a general hospital [in Chinese]. Zhonghua Lao Dong Wei Sheng Zhi Ye Bing Za Zhi. 2017;35:34-41.
Dermatology providers are at an increased risk for blood-borne pathogen (BBP) exposures during procedures in clinical practice.1-3 Current data regarding the characterization of these exposures are limited. Prior studies are based on surveys that result in low response rates and potential for selection bias. Donnelly et al1 reported a 26% response rate in a national survey-based study evaluating BBP exposures in resident physicians, fellows, and practicing dermatologists, with 85% of respondents reporting at least 1 injury. Similarly, Goulart et al2 reported a 35% response rate in a survey evaluating sharps injuries in residents and medical students, with 85% reporting a sharps injury. In addition, there are conflicting data regarding characteristics of these exposures, including common implicated instruments and procedures.1-3 Prior studies also have not evaluated exposures in all members of dermatologic staff, including resident physicians, practicing dermatologists, and ancillary staff.
To make appropriate quality improvements in dermatologic procedures, a more comprehensive understanding of BBP exposures is needed. We conducted a retrospective review of BBP incidence reports to identify the incidence of BBP events among all dermatologic staff, including resident physicians, practicing dermatologists, and ancillary staff. We further investigated the type of exposure, the type of procedure associated with each exposure, anatomic locations of exposures, and instruments involved in each exposure.
Methods
Data on BBP exposures in the dermatology departments were obtained from the occupational health departments at each of 3 Mayo Clinic sites—Scottsdale, Arizona; Jacksonville, Florida; and Rochester, Minnesota—from March 2010 through January 2021. The institutional review board at Mayo Clinic, Scottsdale, Arizona, granted approval of this study (IRB #20-012625). A retrospective review of each exposure was conducted to identify the incidence of BBP exposures. Occupational BBP exposure was defined as
Statistical Analysis—Variables were summarized using counts and percentages. The 3 most common categories for each variable were then compared among occupational groups using the Fisher exact test. All other categories were grouped for analysis purposes. Medical staff were categorized into 3 occupational groups: practicing dermatologists; resident physicians; and ancillary staff, including nurse/medical assistants, physician assistants, and clinical laboratory technologists. All analyses were 2 sided and considered statistically significant at P<.05. Analyses were performed using SAS 9.4 (SAS Institute Inc).
Results
Type of Exposure—A total of 222 BBP exposures were identified through the trisite retrospective review from March 2010 through January 2021. One hundred ninety-nine (89.6%) of 222 exposures were attributed to needlesticks and medical sharps, while 23 (10.4%) of 222 exposures were attributed to splash incidents (Table).
Anatomic Sites Affected—The anatomic location most frequently involved was the thumb (130/217 events [59.9%]), followed by the hand (39/217 events [18.0%]) and finger (22/217 events [10.1%]). The arm, face, and knee were affected with the lowest frequency, with only 1 event reported at each anatomic site (0.5%)(eTable). Five incidents were excluded from the analysis of anatomic location because of insufficient details of events.
Incident Tasks and Tools—Most BBP exposures occurred during suturing or assisting with suturing (64/210 events [30.5%]), followed by handling of sharps, wires, or instruments (40/210 events [19.0%]) and medication administration (37/210 events [17.6%])(eTable). Twelve incidents were excluded from the analysis of implicated tasks because of insufficient details of events.
The tools involved in exposure events with the greatest prevalence included the suture needle (76/201 events [37.8%]), injection syringe/needle (43/201 events [21.4%]), and shave biopsy razor (24/201 events [11.9%])(eTable). Twenty-one incidents were excluded from the analysis of implicated instruments because of insufficient details of events.
Providers Affected by BBP Exposures—Resident physicians experienced the greatest number of BBP exposures (105/222 events [47.3%]), followed by ancillary providers (84/222 events [37.8%]) and practicing dermatologists (33/222 events [14.9%]). All occupational groups experienced more BBP exposures through needlesticks/medical sharps compared with splash incidents (resident physicians, 88.6%; ancillary staff, 91.7%; practicing dermatologists, 87.9%; P=.725)(Table).
Among resident physicians, practicing dermatologists, and ancillary staff, the most frequent site of injury was the thumb. Suturing/assisting with suturing was the most common task leading to injury, and the suture needle was the most common instrument of injury for both resident physicians and practicing dermatologists. Handling of sharps, wires, or instruments was the most common task leading to injury for ancillary staff, and the injection syringe/needle was the most common instrument of injury in this cohort.
Resident physicians experienced the lowest rate of BBP exposures during administration of medications (12.7%; P=.003). Ancillary staff experienced the highest rate of BBP exposures with an injection needle (35.5%; P=.001). There were no statistically significant differences among occupational groups for the anatomic location of injury (P=.074)(eTable).
Comment
In the year 2000, the annual global incidence of occupational BBP exposures among health care workers worldwide for hepatitis B virus, hepatitis C virus, and HIV was estimated at 2.1 million, 926,000, and 327,000, respectively. Most of these exposures were due to sharps injuries.4 Dermatologists are particularly at risk for BBP exposures given their reliance on frequent procedures in practice. During an 11-year period, 222 BBP exposures were documented in the dermatology departments at 3 Mayo Clinic institutions. Most exposures were due to needlestick/sharps across all occupational groups compared with splash injuries. Prior survey studies confirm that sharps injuries are frequently implicated, with 75% to 94% of residents and practicing dermatologists reporting at least 1 sharps injury.1
Among occupational groups, resident physicians had the highest rate of BBP exposures, followed by nurse/medical assistants and practicing dermatologists, which may be secondary to lack of training or experience. Data from other surgical fields, including general surgery, support that resident physicians have the highest rate of sharps injuries.5 In a survey study (N=452), 51% of residents reported that extra training in safe techniques would be beneficial.2 Safety training may be beneficial in reducing the incidence of BBP exposures in residency programs.
The most common implicated task in resident physicians and practicing dermatologists was suturing or assisting with suturing, and the most common implicated instrument was the suture needle. Prior studies showed conflicting data regarding common implicated tasks and instruments in this cohort.1,2 The task of suturing and the suture needle also were the most implicated means of injury among other surgical specialties.6 Ancillary staff experienced most BBP exposures during handling of sharps, wires, or instruments, as well as the use of an injection needle. The designation of tasks among dermatologic staff likely explains the difference among occupational groups. This new information may provide the opportunity to improve safety measures among all members of the dermatologic team.
Limitations—There are several limitations to this study. This retrospective review was conducted at a single health system at 3 institutions. Hence, similar safety protocols likely were in place across all sites, which may reduce the generalizability of the results. In addition, there is risk of nonreporting bias among staff, as only documented incidence reports were evaluated. Prior studies demonstrated a nonreporting prevalence of 33% to 64% among dermatology staff.1-3 We also did not evaluate whether injuries resulted in BBP exposure or transmission. The rates of postexposure prophylaxis also were not studied. This information was not available for review because of concerns for privacy. Demographic features, such as gender or years of training, also were not evaluated.
Conclusion
This study provides additional insight on the incidence of BBP exposures in dermatology, as well as the implicated tasks, instruments, and anatomic locations of injury. Studies show that implementing formal education regarding the risks of BBP exposure may result in reduction of sharps injuries.7 Formal education in residency programs may be needed in the field of dermatology to reduce BBP exposures. Quality improvement measures should focus on identified risk factors among occupational groups to reduce BBP exposures in the workplace.
- Donnelly AF, Chang Y-HH, Nemeth-Ochoa SA. Sharps injuries and reporting practices of U.S. dermatologists [published online November 14, 2013]. Dermatol Surg. 2013;39:1813-1821.
- Goulart J, Oliveria S, Levitt J. Safety during dermatologic procedures and surgeries: a survey of resident injuries and prevention strategies. J Am Acad Dermatol. 2011;65:648-650.
- Ken K, Golda N. Contaminated sharps injuries: a survey among dermatology residents. J Am Acad Dermatol. 2019;80:1786-1788.
- Pruss-Ustun A, Rapiti E, Hutin Y. Estimation of global burden of disease attributable to contaminated sharps injuries among health-care workers. Am J Ind Med. 2005;48:482-490.
- Choi L, Torres R, Syed S, et al. Sharps and needlestick injuries among medical students, surgical residents, faculty, and operating room staff at a single academic institution. J Surg Educ. 2017;74:131-136.
- Bakaeen F, Awad S, Albo D, et al. Epidemiology of exposure to blood borne pathogens on a surgical service. Am J Surg. 2006;192:E18-E21.
- Li WJ, Zhang M, Shi CL, et al. Study on intervention of bloodborne pathogen exposure in a general hospital [in Chinese]. Zhonghua Lao Dong Wei Sheng Zhi Ye Bing Za Zhi. 2017;35:34-41.
Practice Points
- Most blood-borne pathogen (BBP) exposures in dermatologic staff occur due to medical sharps as opposed to splash incidents.
- The most common implicated task in resident physicians and practicing dermatologists is suturing or assisting with suturing, and the most commonly associated instrument is the suture needle. In contrast, ancillary staff experience most BBP exposures during handling of sharps, wires, or instruments, and the injection syringe/needle is the most common instrument of injury.
- Quality improvement measures are needed in prevention of BBP exposures and should focus on identified risk factors among occupational groups in the workplace.
Bridging the Digital Divide in Teledermatology Usage: A Retrospective Review of Patient Visits
Teledermatology is an effective patient care model for the delivery of high-quality dermatologic care.1 Teledermatology can occur using synchronous, asynchronous, and hybrid models of care. In asynchronous visits (AVs), patients or health professionals submit photographs and information for dermatologists to review and provide treatment recommendations. With synchronous visits (SVs), patients have a visit with a dermatology health professional in real time via live video conferencing software. Hybrid models incorporate asynchronous strategies for patient intake forms and skin photograph submissions as well as synchronous methods for live video consultation in a single visit.1 However, remarkable inequities in internet access limit telemedicine usage among medically marginalized patient populations, including racialized, elderly, and low socioeconomic status groups.2
Synchronous visits, a relatively newer teledermatology format, allow for communication with dermatology professionals from the convenience of a patient’s selected location. The live interaction of SVs allows dermatology professionals to answer questions, provide treatment recommendations, and build therapeutic relationships with patients. Concerns for dermatologist reimbursement, malpractice/liability, and technological challenges stalled large-scale uptake of teledermatology platforms.3 The COVID-19 pandemic led to a drastic increase in teledermatology usage of approximately 587.2%, largely due to public safety measures and Medicaid reimbursement parity between SV and in-office visits (IVs).3,4
With the implementation of SVs as a patient care model, we investigated the demographics of patients who utilized SVs, AVs, or IVs, and we propose strategies to promote equity in dermatologic care access.
Methods
This study was approved by the University of Pittsburgh institutional review board (STUDY20110043). We performed a retrospective electronic medical record review of deidentified data from the University of Pittsburgh Medical Center, a tertiary care center in Allegheny County, Pennsylvania, with an established asynchronous teledermatology program. Hybrid SVs were integrated into the University of Pittsburgh Medical Center patient care visit options in March 2020. Patients were instructed to upload photographs of their skin conditions prior to SV appointments. The study included visits occurring between July and December 2020. Visit types included SVs, AVs, and IVs.
We analyzed the initial dermatology visits of 17,130 patients aged 17.5 years and older. Recorded data included diagnosis, age, sex, race, ethnicity, and insurance type for each visit type. Patients without a reported race (990 patients) or ethnicity (1712 patients) were excluded from analysis of race/ethnicity data. Patient zip codes were compared with the zip codes of Allegheny County municipalities as reported by the Allegheny County Elections Division.
Statistical Analysis—Descriptive statistics were calculated; frequency with percentage was used to report categorical variables, and the mean (SD) was used for normally distributed continuous variables. Univariate analysis was performed using the χ2 test for categorical variables. One-way analysis of variance was used to compare age among visit types. Statistical significance was defined as P<.05. IBM SPSS Statistics for Windows, Version 24 (IBM Corp) was used for all statistical analyses.
Results
In our study population, 81.2% (13,916) of patients were residents of Allegheny County, where 51.6% of residents are female and 81.4% are older than 18 years according to data from 2020.5 The racial and ethnic demographics of Allegheny County were 13.4% African American/Black, 0.2% American Indian/Alaska Native, 4.2% Asian, 2.3% Hispanic/Latino, and 79.6% White. The percentage of residents who identified as Native Hawaiian/Pacific Islander was reported to be greater than 0% but less than 0.5%.5
In our analysis, IVs were the most utilized visit type, accounting for 71.5% (12,240) of visits, followed by 15.0% (2577) for SVs and 13.5% (2313) for AVs. The mean age (SD) of IV patients was 51.0 (18.8) years compared with 39.9 (16.9) years for SV patients and 37.5 (14.3) years for AV patients (eTable). The majority of patients for all visits were female: 62.1% (7599) for IVs, 71.4% (1652) for AVs, and 72.8% (1877) for SVs. The largest racial or ethnic group for all visit types included White patients (83.8% [13,524] of all patients), followed by Black (12.4% [2007]), Hispanic/Latino (1.4% [209]), Asian (3.4% [555]), American Indian/Alaska Native (0.2% [35]), and Native Hawaiian/Other Pacific Islander patients (0.1% [19]).
")
Asian patients, who comprised 4.2% of Allegheny County residents,5 accounted for 2.7% (334) of IVs, 4.9% (113) of AVs, and 4.2% (108) of SVs. Black patients, who were reported as 13.4% of the Allegheny County population,5 were more likely to utilize SVs (19% [490])compared with AVs (7.5% [174]) and IVs (11% [1343]). Hispanic/Latino patients had a disproportionally lower utilization of dermatologic care in all settings, comprising 1.4% (209) of all patients in our study compared with 2.3% of Allegheny County residents.5 White patients, who comprised 79.6% of Allegheny County residents, accounted for 81.1% (9928) of IVs, 67.4% (1737) of SVs, and 80.4% (1859) of AVs. There was no significant difference in the percentage of American Indian/Alaska Native and Native Hawaiian/Other Pacific Islander patients among visit types.
The 3 most common diagnoses for IVs were skin cancer screening, seborrheic keratosis, and melanocytic nevus (Table 1). Skin cancer screening was the most common diagnosis, accounting for 12.2% (8530) of 69,812 IVs. The 3 most common diagnoses for SVs were acne vulgaris, dermatitis, and psoriasis. The 3 most common diagnoses for AVs were acne vulgaris, dermatitis, and perioral dermatitis.

Private insurance was the most common insurance type among all patients (71.4% [12,224])(Table 2). A higher percentage of patients with Medicaid insurance (17.9% [461]) utilized SVs compared with AVs (10.1% [233]) and IVs (11.3% 1385]). Similarly, a higher percentage of patients with no insurance or no insurance listed were seen via SVs (12.5% [322]) compared with AVs (5.1% [117]) and IVs (1.7% [203]). Patients with Medicare insurance used IVs (15.4% [1886]) more than SVs (6.0% [155]) or AVs (2.6% [60]). There was no significant difference among visit type usage for patients with public insurance.
")
Comment
Teledermatology Benefits—In this retrospective review of medical records of patients who obtained dermatologic care after the implementation of SVs at our institution, we found a proportionally higher use of SVs among Black patients, patients with Medicaid, and patients who are underinsured. Benefits of teledermatology include decreases in patient transportation and associated costs, time away from work or home, and need for childcare.6 The SV format provides the additional advantage of direct live interaction and the development of a patient-physician or patient–physician assistant relationship. Although the prerequisite technology, internet, and broadband connectivity preclude use of teledermatology for many vulnerable patients,2 its convenience ultimately may reduce inequities in access.
Disparities in Dermatologic Care—Hispanic ethnicity and male sex are among described patient demographics associated with decreased rates of outpatient dermatologic care.7 We reported disparities in dermatologic care utilization across all visit types among Hispanic patients and males. Patients identifying as Hispanic/Latino composed only 1.4% (n=209) of our study population compared with 2.3% of Allegheny County residents.5 During our study period, most patients seen were female, accounting for 62.1% to 72.8% of visits, compared with 51.6% of Allegheny County residents.5 These disparities in dermatologic care use may have implications for increased skin-associated morbidity and provide impetus for dermatologists to increase engagement with these patient groups.
Characteristics of Patients Using Teledermatology—Patients using SVs and AVs were significantly younger (mean age [SD], 39.9 [16.9] years and 37.5 [14.3] years, respectively) compared with those using IVs (51.0 [18.8] years). This finding reflects known digital knowledge barriers among older patients.8,9 The synchronous communication format of SVs simulates the traditional visit style of IVs, which may be preferable for some patients. Continued patient education and advocacy for broadband access may increase teledermatology use among older patients and patients with limited technology resources.8
Teledermatology visits were used most frequently for acne and dermatitis, while IVs were used for skin cancer screenings and examination of concerning lesions. This usage pattern is consistent with a previously described consensus among dermatologists on the conditions most amenable to teledermatology evaluation.3
Medicaid reimbursement parity for SVs is in effect nationally until the end of the COVID-19 public health emergency declaration in the United States.10 As of February 2023, the public health emergency declaration has been renewed 12 times since January 2020, with the most recent renewal on January 11, 2023.11 As of January 2023, 21 states have enacted legislation providing permanent reimbursement parity for SV services. Six additional states have some payment parity in place, each with its own qualifying criteria, and 23 states have no payment parity.12 Only 25 Medicaid programs currently provide reimbursement for AV services.13
Study Limitations—Our study was limited by lack of data on patients who are multiracial and those who identify as nonbinary and transgender. Because of the low numbers of Hispanic patients associated with each race category and a high number of patients who did not report an ethnicity or race, race and ethnicity data were analyzed separately. For SVs, patients were instructed to upload photographs prior to their visit; however, the percentage of patients who uploaded photographs was not analyzed.
Conclusion
Expansion of teledermatology services, including SVs and AVs, patient outreach and education, advocacy for broadband access, and Medicaid payment parity, may improve dermatologic care access for medically marginalized groups. Teledermatology has the potential to serve as an effective health care option for patients who are racially minoritized, older, and underinsured. To further assess the effectiveness of teledermatology, we plan to analyze the number of SVs and AVs that were referred to IVs. Future studies also will investigate the impact of implementing patient education and patient-reported outcomes of teledermatology visits.
- Lee JJ, English JC. Teledermatology: a review and update. Am J Clin Dermatol. 2018;19:253-260.
- Bakhtiar M, Elbuluk N, Lipoff JB. The digital divide: how COVID-19’s telemedicine expansion could exacerbate disparities. J Am Acad Dermatol. 2020;83:E345-E346.
- Kennedy J, Arey S, Hopkins Z, et al. dermatologist perceptions of teledermatology implementation and future use after COVID-19: demographics, barriers, and insights. JAMA Dermatol. 2021;157:595-597.
- Centers for Disease Control and Prevention. Using telehealth to expand access to essential health services during the COVID-19 pandemic. Updated June 10, 2020. Accessed February 10, 2023. https://www.cdc.gov/coronavirus/2019-ncov/hcp/telehealth.html
- United States Census Bureau. QuickFacts: Allegheny County, Pennsylvania. Accessed August 12, 2021. https://www.census.gov/quickfacts/alleghenycountypennsylvania
- Moore HW. Teledermatology—access to specialized care via a different model. Dermatology Advisor. November 12, 2019. Accessed February 10, 2023. https://www.dermatologyadvisor.com/home/topics/practice-management/teledermatology-access-to-specialized-care-via-a-different-model/
- Tripathi R, Knusel KD, Ezaldein HH, et al. Association of demographic and socioeconomic characteristics with differences in use of outpatient dermatology services in the United States. JAMA Dermatol. 2018;154:1286-1291.
- Nouri S, Khoong EC, Lyles CR, et al. Addressing equity in telemedicine for chronic disease management during the COVID-19 pandemic [published online May 4, 2020]. NEJM Catal Innov Care Deliv. doi:10.1056/CAT.20.0123
- Swenson K, Ghertner R. People in low-income households have less access to internet services—2019 update. Office of the Assistant Secretary for Planning and Evaluation; US Department of Health and Human Services. March 2021. Accessed February 10, 2023. https://aspe.hhs.gov/sites/default/files/private/pdf/263601/internet-access-among-low-income-2019.pdf
- Centers for Medicare and Medicaid Services. COVID-19 frequently asked questions (FAQs) on Medicare fee-for-service (FFS) billing. Updated August 16, 2022. Accessed February 10, 2023. https://www.cms.gov/files/document/03092020-covid-19-faqs-508.pdf
- US Department of Health and Human Services. Renewal of determination that a public health emergency exists. Updated February 9, 2023. Accessed February 20, 2023. https://aspr.hhs.gov/legal/PHE/Pages/COVID19-9Feb2023.aspx?
- Augenstein J, Smith JM. Executive summary: tracking telehealth changes state-by-state in response to COVID-19. Updated January 27, 2023. Accessed February 10, 2023. https://www.manatt.com/insights/newsletters/covid-19-update/executive-summary-tracking-telehealth-changes-stat
- Center for Connected Health Policy. Policy trend maps: store and forward Medicaid reimbursement. Accessed June 23, 2022. https://www.cchpca.org/policy-trends/
Teledermatology is an effective patient care model for the delivery of high-quality dermatologic care.1 Teledermatology can occur using synchronous, asynchronous, and hybrid models of care. In asynchronous visits (AVs), patients or health professionals submit photographs and information for dermatologists to review and provide treatment recommendations. With synchronous visits (SVs), patients have a visit with a dermatology health professional in real time via live video conferencing software. Hybrid models incorporate asynchronous strategies for patient intake forms and skin photograph submissions as well as synchronous methods for live video consultation in a single visit.1 However, remarkable inequities in internet access limit telemedicine usage among medically marginalized patient populations, including racialized, elderly, and low socioeconomic status groups.2
Synchronous visits, a relatively newer teledermatology format, allow for communication with dermatology professionals from the convenience of a patient’s selected location. The live interaction of SVs allows dermatology professionals to answer questions, provide treatment recommendations, and build therapeutic relationships with patients. Concerns for dermatologist reimbursement, malpractice/liability, and technological challenges stalled large-scale uptake of teledermatology platforms.3 The COVID-19 pandemic led to a drastic increase in teledermatology usage of approximately 587.2%, largely due to public safety measures and Medicaid reimbursement parity between SV and in-office visits (IVs).3,4
With the implementation of SVs as a patient care model, we investigated the demographics of patients who utilized SVs, AVs, or IVs, and we propose strategies to promote equity in dermatologic care access.
Methods
This study was approved by the University of Pittsburgh institutional review board (STUDY20110043). We performed a retrospective electronic medical record review of deidentified data from the University of Pittsburgh Medical Center, a tertiary care center in Allegheny County, Pennsylvania, with an established asynchronous teledermatology program. Hybrid SVs were integrated into the University of Pittsburgh Medical Center patient care visit options in March 2020. Patients were instructed to upload photographs of their skin conditions prior to SV appointments. The study included visits occurring between July and December 2020. Visit types included SVs, AVs, and IVs.
We analyzed the initial dermatology visits of 17,130 patients aged 17.5 years and older. Recorded data included diagnosis, age, sex, race, ethnicity, and insurance type for each visit type. Patients without a reported race (990 patients) or ethnicity (1712 patients) were excluded from analysis of race/ethnicity data. Patient zip codes were compared with the zip codes of Allegheny County municipalities as reported by the Allegheny County Elections Division.
Statistical Analysis—Descriptive statistics were calculated; frequency with percentage was used to report categorical variables, and the mean (SD) was used for normally distributed continuous variables. Univariate analysis was performed using the χ2 test for categorical variables. One-way analysis of variance was used to compare age among visit types. Statistical significance was defined as P<.05. IBM SPSS Statistics for Windows, Version 24 (IBM Corp) was used for all statistical analyses.
Results
In our study population, 81.2% (13,916) of patients were residents of Allegheny County, where 51.6% of residents are female and 81.4% are older than 18 years according to data from 2020.5 The racial and ethnic demographics of Allegheny County were 13.4% African American/Black, 0.2% American Indian/Alaska Native, 4.2% Asian, 2.3% Hispanic/Latino, and 79.6% White. The percentage of residents who identified as Native Hawaiian/Pacific Islander was reported to be greater than 0% but less than 0.5%.5
In our analysis, IVs were the most utilized visit type, accounting for 71.5% (12,240) of visits, followed by 15.0% (2577) for SVs and 13.5% (2313) for AVs. The mean age (SD) of IV patients was 51.0 (18.8) years compared with 39.9 (16.9) years for SV patients and 37.5 (14.3) years for AV patients (eTable). The majority of patients for all visits were female: 62.1% (7599) for IVs, 71.4% (1652) for AVs, and 72.8% (1877) for SVs. The largest racial or ethnic group for all visit types included White patients (83.8% [13,524] of all patients), followed by Black (12.4% [2007]), Hispanic/Latino (1.4% [209]), Asian (3.4% [555]), American Indian/Alaska Native (0.2% [35]), and Native Hawaiian/Other Pacific Islander patients (0.1% [19]).
Asian patients, who comprised 4.2% of Allegheny County residents,5 accounted for 2.7% (334) of IVs, 4.9% (113) of AVs, and 4.2% (108) of SVs. Black patients, who were reported as 13.4% of the Allegheny County population,5 were more likely to utilize SVs (19% [490])compared with AVs (7.5% [174]) and IVs (11% [1343]). Hispanic/Latino patients had a disproportionally lower utilization of dermatologic care in all settings, comprising 1.4% (209) of all patients in our study compared with 2.3% of Allegheny County residents.5 White patients, who comprised 79.6% of Allegheny County residents, accounted for 81.1% (9928) of IVs, 67.4% (1737) of SVs, and 80.4% (1859) of AVs. There was no significant difference in the percentage of American Indian/Alaska Native and Native Hawaiian/Other Pacific Islander patients among visit types.
The 3 most common diagnoses for IVs were skin cancer screening, seborrheic keratosis, and melanocytic nevus (Table 1). Skin cancer screening was the most common diagnosis, accounting for 12.2% (8530) of 69,812 IVs. The 3 most common diagnoses for SVs were acne vulgaris, dermatitis, and psoriasis. The 3 most common diagnoses for AVs were acne vulgaris, dermatitis, and perioral dermatitis.
Private insurance was the most common insurance type among all patients (71.4% [12,224])(Table 2). A higher percentage of patients with Medicaid insurance (17.9% [461]) utilized SVs compared with AVs (10.1% [233]) and IVs (11.3% 1385]). Similarly, a higher percentage of patients with no insurance or no insurance listed were seen via SVs (12.5% [322]) compared with AVs (5.1% [117]) and IVs (1.7% [203]). Patients with Medicare insurance used IVs (15.4% [1886]) more than SVs (6.0% [155]) or AVs (2.6% [60]). There was no significant difference among visit type usage for patients with public insurance.
Comment
Teledermatology Benefits—In this retrospective review of medical records of patients who obtained dermatologic care after the implementation of SVs at our institution, we found a proportionally higher use of SVs among Black patients, patients with Medicaid, and patients who are underinsured. Benefits of teledermatology include decreases in patient transportation and associated costs, time away from work or home, and need for childcare.6 The SV format provides the additional advantage of direct live interaction and the development of a patient-physician or patient–physician assistant relationship. Although the prerequisite technology, internet, and broadband connectivity preclude use of teledermatology for many vulnerable patients,2 its convenience ultimately may reduce inequities in access.
Disparities in Dermatologic Care—Hispanic ethnicity and male sex are among described patient demographics associated with decreased rates of outpatient dermatologic care.7 We reported disparities in dermatologic care utilization across all visit types among Hispanic patients and males. Patients identifying as Hispanic/Latino composed only 1.4% (n=209) of our study population compared with 2.3% of Allegheny County residents.5 During our study period, most patients seen were female, accounting for 62.1% to 72.8% of visits, compared with 51.6% of Allegheny County residents.5 These disparities in dermatologic care use may have implications for increased skin-associated morbidity and provide impetus for dermatologists to increase engagement with these patient groups.
Characteristics of Patients Using Teledermatology—Patients using SVs and AVs were significantly younger (mean age [SD], 39.9 [16.9] years and 37.5 [14.3] years, respectively) compared with those using IVs (51.0 [18.8] years). This finding reflects known digital knowledge barriers among older patients.8,9 The synchronous communication format of SVs simulates the traditional visit style of IVs, which may be preferable for some patients. Continued patient education and advocacy for broadband access may increase teledermatology use among older patients and patients with limited technology resources.8
Teledermatology visits were used most frequently for acne and dermatitis, while IVs were used for skin cancer screenings and examination of concerning lesions. This usage pattern is consistent with a previously described consensus among dermatologists on the conditions most amenable to teledermatology evaluation.3
Medicaid reimbursement parity for SVs is in effect nationally until the end of the COVID-19 public health emergency declaration in the United States.10 As of February 2023, the public health emergency declaration has been renewed 12 times since January 2020, with the most recent renewal on January 11, 2023.11 As of January 2023, 21 states have enacted legislation providing permanent reimbursement parity for SV services. Six additional states have some payment parity in place, each with its own qualifying criteria, and 23 states have no payment parity.12 Only 25 Medicaid programs currently provide reimbursement for AV services.13
Study Limitations—Our study was limited by lack of data on patients who are multiracial and those who identify as nonbinary and transgender. Because of the low numbers of Hispanic patients associated with each race category and a high number of patients who did not report an ethnicity or race, race and ethnicity data were analyzed separately. For SVs, patients were instructed to upload photographs prior to their visit; however, the percentage of patients who uploaded photographs was not analyzed.
Conclusion
Expansion of teledermatology services, including SVs and AVs, patient outreach and education, advocacy for broadband access, and Medicaid payment parity, may improve dermatologic care access for medically marginalized groups. Teledermatology has the potential to serve as an effective health care option for patients who are racially minoritized, older, and underinsured. To further assess the effectiveness of teledermatology, we plan to analyze the number of SVs and AVs that were referred to IVs. Future studies also will investigate the impact of implementing patient education and patient-reported outcomes of teledermatology visits.
- Lee JJ, English JC. Teledermatology: a review and update. Am J Clin Dermatol. 2018;19:253-260.
- Bakhtiar M, Elbuluk N, Lipoff JB. The digital divide: how COVID-19’s telemedicine expansion could exacerbate disparities. J Am Acad Dermatol. 2020;83:E345-E346.
- Kennedy J, Arey S, Hopkins Z, et al. dermatologist perceptions of teledermatology implementation and future use after COVID-19: demographics, barriers, and insights. JAMA Dermatol. 2021;157:595-597.
- Centers for Disease Control and Prevention. Using telehealth to expand access to essential health services during the COVID-19 pandemic. Updated June 10, 2020. Accessed February 10, 2023. https://www.cdc.gov/coronavirus/2019-ncov/hcp/telehealth.html
- United States Census Bureau. QuickFacts: Allegheny County, Pennsylvania. Accessed August 12, 2021. https://www.census.gov/quickfacts/alleghenycountypennsylvania
- Moore HW. Teledermatology—access to specialized care via a different model. Dermatology Advisor. November 12, 2019. Accessed February 10, 2023. https://www.dermatologyadvisor.com/home/topics/practice-management/teledermatology-access-to-specialized-care-via-a-different-model/
- Tripathi R, Knusel KD, Ezaldein HH, et al. Association of demographic and socioeconomic characteristics with differences in use of outpatient dermatology services in the United States. JAMA Dermatol. 2018;154:1286-1291.
- Nouri S, Khoong EC, Lyles CR, et al. Addressing equity in telemedicine for chronic disease management during the COVID-19 pandemic [published online May 4, 2020]. NEJM Catal Innov Care Deliv. doi:10.1056/CAT.20.0123
- Swenson K, Ghertner R. People in low-income households have less access to internet services—2019 update. Office of the Assistant Secretary for Planning and Evaluation; US Department of Health and Human Services. March 2021. Accessed February 10, 2023. https://aspe.hhs.gov/sites/default/files/private/pdf/263601/internet-access-among-low-income-2019.pdf
- Centers for Medicare and Medicaid Services. COVID-19 frequently asked questions (FAQs) on Medicare fee-for-service (FFS) billing. Updated August 16, 2022. Accessed February 10, 2023. https://www.cms.gov/files/document/03092020-covid-19-faqs-508.pdf
- US Department of Health and Human Services. Renewal of determination that a public health emergency exists. Updated February 9, 2023. Accessed February 20, 2023. https://aspr.hhs.gov/legal/PHE/Pages/COVID19-9Feb2023.aspx?
- Augenstein J, Smith JM. Executive summary: tracking telehealth changes state-by-state in response to COVID-19. Updated January 27, 2023. Accessed February 10, 2023. https://www.manatt.com/insights/newsletters/covid-19-update/executive-summary-tracking-telehealth-changes-stat
- Center for Connected Health Policy. Policy trend maps: store and forward Medicaid reimbursement. Accessed June 23, 2022. https://www.cchpca.org/policy-trends/
Practice Points
- There is increased use of synchronous video visits (SVs) among Black patients, patients with Medicaid, and patients who are underinsured.
- Synchronous video visits may increase dermatologic care utilization for medically marginalized groups.
- Efforts are needed to increase engagement with dermatologic care for Hispanic and male patients.

Muscle-Related Adverse Events Associated With PCSK9 Inhibitors in a Veteran Population
HMG-CoA reductase inhibitors (statins) have been shown to effectively reduce low-density lipoprotein cholesterol (LDL-C) as well as morbidity and mortality in patients who have either atherosclerotic cardiovascular disease (ASCVD) or risk factors for ASCVD.1-12 However, research shows that up to 20% of patients are unable to tolerate statin therapy due to muscle-related adverse events (AEs).13 This presents a substantial clinical challenge, as current management strategies for patients with statin-associated muscle symptoms, such as intermittent administration of statins and ezetimibe, seldom achieve the > 50% LDL-C reduction recommended by the 2018 American Heart Association/American College of Cardiology Clinical Practice Guidelines.14 Additionally, statin-intolerant patients who have antihyperlipidemic medication lowered or discontinued are at an increased risk of future cardiovascular events.15 Observational data also show that about 70% of adult patients (primarily with genetic lipid disorders such as heterozygous familial hypercholesterolemia) do not achieve an LDL-C level < 100 mg/dL despite treatment with maximum doses of statins with or without ezetimibe.16,17
PCSK9 inhibitors (PCSK9i) have robust efficacy data to support use in patients who do not meet their LDL-C goal despite maximally tolerated lipid therapy.14 However, long-term safety data for PCSK9i are not as robust as its efficacy data. Specifically, safety data relating to muscle-related AEs, which are the most widely recognized AE associated with statins, have only been reported in a few clinical trials with varying incidence rates, levels of significance, and relatively small study populations. Furthermore, the real-world prevalence of muscle-related PCSK9i AEs is unknown. Clinical guidance for management strategies for muscle-related AEs associated with PCSK9i is largely lacking. For this study, muscle-related AEs were defined as any new or unusual muscle soreness, weakness, cramping, aches, and stiffness that persists, is generally bilateral, and typically affects the large muscles. It is important to note, that muscle-related AEs associated with statins, ezetimibe, and PCSK9i can be attributed to the nocebo effect.
According to the prescribing information for alirocumab and evolocumab, myalgia, muscle spasms, and musculoskeletal pain each occurred in < 5% of the study populations.18,19 From these data, muscle-related PCSK9i AEs are thought to be relatively rare, based on the ODYSSEY-OUTCOME and FOURIER trials, which did not enroll statin-intolerant patients.20,21 However, currently available safety data from 3 small, randomized clinical trials specifically in statin-intolerant patients taking a PCSK9i suggest that muscle-related AEs occur at a rate of 12.2% to 32.5% and discontinuation rates varied from 0% to 15.9%.22-25 As the incidence rates of muscle-related AEs in the prescribing information and clinical trials varied widely, this study will provide quantitative data on the percentage of patients that developed muscle-related PCSK9i AEs in a veteran population to help shed light on a topic that is not well studied.
Methods
This was a single-center, retrospective chart review of patients prescribed a PCSK9i between December 1, 2017, and September 1, 2021, and were managed in a pharmacy-led patient aligned care team (PACT) clinic at the Wilkes-Barre US Department of Veterans Affairs (VA) Medical Center (WBVAMC) in Pennsylvania. This study was approved by the Coatesville VA Medical Center Institutional Review Board, which oversees research conducted at WBVAMC. Veterans aged ≥ 18 years were included in the study. Patients were excluded if they had a history of serious hypersensitivity reaction to a PCSK9i or rhabdomyolysis or did not meet the VA criteria for use.26
The primary outcome was the percentage of patients who developed a muscle-related AE while on a PCSK9i in a PACT clinic. Data were further analyzed based on patients who (1) tolerated a full PCSK9i dose; (2) tolerated alternative PCSK9i following initial intolerance; (3) required a PCSK9i dose reduction, or (4) discontinued PCSK9i. A secondary outcome was the percentage of statin- and/or ezetimibe-intolerant patients in these 4 groups. Another secondary outcome was the management strategies taken for patients who were on a reduced (monthly) dose of PCSK9i who did not reach their LDL-C goal. Management strategies that were assessed included restarting weekly statin, restarting weekly ezetimibe, increasing the dose of the same PCSK9i administered monthly, and switching to an alternative PCSK9i.
Data were collected using the VA Computerized Patient Record System (CPRS) and stored in a secure, locked spreadsheet. Baseline patient demographic characteristics collected included age (at PCSK9i start); sex; race; and PCSK9i name, dose, and frequency. We recorded when a patient switched PCSK9i, whether or not it was due to a muscle-related AE, and the name of the original PCSK9i. Also collected were lipid therapy intolerances prior to PCSK9i initiation (ie, intolerance to statin, ezetimibe, or both).
Patients were considered statin intolerant due to a muscle-related AE in accordance with the VA PCSK9i Criteria for Use, which requires trial of at least 3 statins, one of which was trialed at the lowest dosage approved by the US Food and Drug Administration (FDA) and resulted in intolerable skeletal muscle AEs that worsened during treatment and resolved when the statin was stopped. For our study purposes, patients taking alternative day dosing of statins due to muscle-related AEs (ie, 2- or 3-times weekly dosing) were not considered statin intolerant; however, patients taking once-weekly statin dosing were considered statin intolerant. Patients were considered ezetimibe intolerant due to a muscle-related AE if the intolerance was due to skeletal muscle concerns that worsened during treatment and resolved when ezetimibe was stopped. Patients were considered PCSK9i intolerant due to a muscle-related AE if the intolerance was due to skeletal muscle concerns that worsened during treatment and resolved when the PCSK9i was stopped. Patients with non–muscle-related intolerances to statins, ezetimibe, and PCSK9i were not considered statin, ezetimibe, and PCSK9i intolerant.
Alirocumab was initiated at 75 mg subcutaneous (SQ) once every 2 weeks or evolocumab 140 mg SQ once every 2 weeks in our study. The protocol allowed for a dose reduction of alirocumab 75 mg SQ once monthly if a patient experienced AEs, but this dose reduction strategy was not used for any patients on evolocumab in this study. Of note, alirocumab 75 mg SQ once monthly is not an FDA-approved dosing strategy. However, it is similar in concept to the alternative statin dosing (ie, alternate day dosing, once-weekly dosing) and may avoid the need to discontinue PCSK9i therapy altogether.
A review of the CPRS also documented whether a muscle-related AE occurred while the patient was on a PCSK9i (if yes, the specific AE was recorded), the result of PCSK9i therapy (tolerated full dose, required a dose reduction, switched medication, or discontinued), and management strategies taken for patients who did not meet their LDL-C goal while on a reduced (monthly) PCSK9i dose. Prior lipid therapy intolerances, PCSK9i-related AEs, results of PCSK9i therapy, and management strategies for patients who did not meet LDL-C goal while on a reduced PCSK9i dose were obtained by reviewing the PACT pharmacist’s clinic notes and assessment, along with clinic notes and medication history listed within the CPRS.
Statistical Analysis
Descriptive statistics were used for the demographic characteristics of study patients. The primary outcome was calculated as a binary measure (yes/no) of whether the patient developed a muscle-related AE while on a PCSK9i. The secondary outcome of statin, ezetimibe, or statin and ezetimibe intolerances in subgroups also was calculated as a binary measure.
Results
For the study, 156 charts were reviewed and 137 patients were included (Figure). 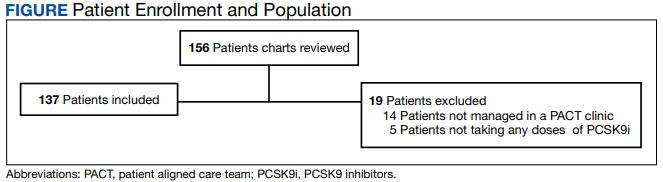
For the secondary results, 4 patients (2.9%) tolerated an alternate PCSK9i (evolocumab 140 mg SQ every 2 weeks) after initial intolerance to PCSK9i, 16 (11.7%) required a dose reduction, and 6 (4.4%) discontinued PCSK9i due to a muscle-related AE.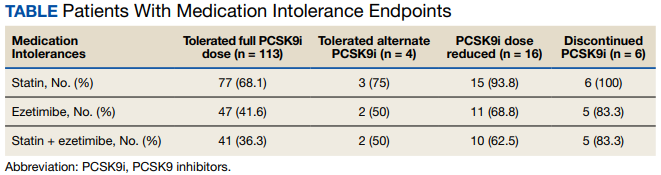
Statin intolerance was most common in all groups, followed by ezetimibe intolerance, and intolerance to statins + ezetimibe. Of the 113 patients who tolerated a full dose of PCSK9i, 77 (68.1%) had intolerance to statin, 47 (41.6%) to ezetimibe, and 41 (36.3%) to both statins and ezetimibe. Of the 6 patients who discontinued PCSK9i, all had intolerance to statins, 5 (83.3%) to ezetimibe, and 5 (83.3%) to statins and ezetimibe.
For patients who were on a reduced (monthly) dose of a PCSK9i who did not reach their LDL-C goal, we found that 16 patients (11.7%) required a PCSK9i dose reduction following muscle-related AEs. Of the patients who had their dose of PCSK9i reduced to monthly dosing, 5 (31%) met their LDL-C goal. For the 11 patients who did not meet their LDL-C goal, different management strategies were taken. Lifestyle modifications were made in 6 patients (54%), the monthly PCSK9i dose was increased to alirocumab 150 mg SQ monthly in 4 patients (36%), and 1 patient (9.1%) was switched to an alternative PCSK9i. There were no identified muscle-related AEs recorded in patients whose dose was increased to alirocumab 150 mg SQ monthly.
Discussion
This retrospective study found 17.5% of patients experienced muscle-related PCSK9i AEs. These occurred at a higher rate than reported in the prescribing information (< 5%) and were similar to the incidence rates reported in the GAUSS-2, GAUSS-3, and ODYSSEY-ALTERNATIVE clinical trials (12.0%-32.5%), which is what we hypothesized.18,19,22-25 It is important to note that the incidence rates of muscle-related AEs reported in the prescribing information for alirocumab and evolocumab were based on trials that did not include statin- and/or ezetimibe-intolerant patients; whereas many patients in our study and patients in the clinical trials were statin and/or ezetimibe intolerant.
Additionally, a new study by Donald and colleagues found an incidence rate of 32% to 36% for muscle-related PCSK9i AEs.27 Collectively, the data from clinical trials and our study indicate that patients with prior intolerances to statin and/or ezetimibe appear to have a higher likelihood of developing a muscle-related PCSK9i intolerance. In our study, 23 of 24 patients who developed a muscle-related PCSK9i AE had a prior history of statin and/or ezetimibe intolerances. This should alert clinicians prescribing PCSK9i in patients with a history of statin and/or ezetimibe intolerance to counsel their patients on the possibility of muscle-related PCSK9i AEs and management strategies. However, it is important to note that there was a substantial number of patients in our study who were statin and/or ezetimibe intolerant due to a prior muscle-related AE who tolerated the full dose of PCSK9i.
To our knowledge, this was the first trial to evaluate muscle-related PCSK9i AEs in a veteran population. Additionally, our study appears to be the first to use 2 PCSK9i dosing strategies that are not FDA approved: Dose reduction for patients who experienced a muscle-related AE on alirocumab 75 mg SQ every 2 weeks and dose escalation for patients who did not meet their LDL-C goal on alirocumab 75 mg SQ monthly following an initial intolerance to 2-week dosing. The dose-reduction strategy allowed patients who experienced a muscle-related AE to alirocumab 75 mg to reduce administration from every 2 weeks to monthly.
This strategy was only performed with alirocumab, the preferred PCSK9i at WBVAMC, but the same dose-reduction strategy can theoretically be used with evolocumab as well. Reduced monthly dosing of alirocumab allowed patients with a prior intolerance to remain on a lower dosage without discontinuation. This is important because as noted by Myers and colleagues, individuals without access to PCSK9i were found to have a significantly higher incidence ratio of cardiovascular events compared with those taking PCSK9i.15 Also of note, > 30% of patients on the reduced monthly dose of alirocumab still met their LDL-C goal. Therefore, using this dose-reduction strategy (instead of patients discontinuing therapy altogether due to a muscle-related intolerance) can lessen the risk of major adverse cardiovascular events (MACE) as well as mitigate muscle-related AEs that occurred while on 2-week PCSK9i dosing regimens. While we acknowledge that this reduced monthly dose of either alirocumab or evolocumab is not FDA approved, it is similar to alternative statin dosing that also is not FDA approved but may minimize the need to discontinue PCSK9i therapy. It would be beneficial if these dosing strategies were investigated by future research.
The dose-escalation strategy for patients who did not meet their LDL-C goal while on the reduced, monthly dose of alirocumab also was unique. Alirocumab was increased from 75 mg SQ once monthly to 150 mg SQ once monthly. Interestingly, we found that through the end of the chart review period, all patients tolerated the increase well, despite having an initial muscle-related AE to alirocumab 75 mg every 2 weeks, which is the same total monthly dosage. This approach is similar to that of once-weekly statin dosing or a drug holiday and may be explained by the long half-life of PCSK9i. Regardless of the mechanism, this finding suggests that an increased monthly dose of PCSK9i is a potential alternative for patients who cannot tolerate the FDA-approved dose. However, the ability for patients to achieve goal LDL-C on the monthly dosage requires future study.
In our study, only 6 patients (4.4%) discontinued PCSK9i therapy. This low discontinuation rate is largely attributable to our unique study design, which allowed for a dose reduction in patients who experienced muscle-related AEs. The earlier ODYSSEY-ALTERNATIVE trial evaluated the safety and efficacy of alirocumab compared with ezetimibe in confirmed statin-intolerant subjects after 24 weeks. This trial did not use a dose-reduction strategy and found 15.9% of patients discontinued alirocumab due to a muscle-related AE.24 This is notably higher than our discontinuation rate of 4.4%. If patients with a muscle-related AE discontinued PCKS9i instead of reducing the dose, they would likely return to their baseline LDL-C, which would increase the risk of MACE.
In general, myalgias due to antihyperlipidemic medications are not completely understood. One possible mechanism for statin-induced myalgias is the depletion of ubiquinone. However, this theory cannot explain muscle-related AEs associated with PCSK9i or ezetimibe, which have not been shown to deplete ubiquinone. We also found that the onset of muscle-related AEs associated with PCSK9i tends to appear later in therapy than what we know about statin therapy. Our study showed that the onset of a muscle-related PCSK9i AEs occurred a mean (SD) 8 (5.3) months after initiation (range, 1-19). Statin muscle-related AEs typically occur within the initial 4 to 8 weeks of treatment, although they can occur at any time.28
Limitations
The results of this study should be considered with the following limitations. First, this was a retrospective chart review performed over a prespecified period. Any muscle-related AEs or LDL-C lowering effects from PCSK9i that occurred outside the review period were not captured. Our study was small and only included 137 patients, though it was similar in size to the GAUSS-2, GAUSS-3, and ODYSSEY-ALTERNATIVE trials.22-24 Additionally, the study was primarily composed of White men and may not be representative of other populations. Some muscle-related PCSK9i AEs may be attributed to the nocebo. Last, our study did not capture patients on a PCSK9i who were not followed in the PACT clinic.
Conclusions
We found that muscle-related PCSK9i AEs occurred at a similar rate as those reported in previous clinical trials and exceeded the incidence rate reported in the prescribing information for alirocumab and evolocumab. It appears that patients who have a prior muscle-related intolerance to a statin and/or ezetimibe had a higher likelihood of developing a muscle-related PCSK9i AE. In our study, only 1 patient developed a muscle-related PCSK9i AE who did not have a prior history of muscle-related intolerance to either a statin or ezetimibe. However, in our study, a substantial percentage of patients with statin and/or ezetimibe intolerances tolerated the full PCSK9i dose well, proving that PCSK9i are still a reasonable alternative for patients with prior intolerances to statins and/or ezetimibe.
Acknowledgments
This material is the result of work supported with resources and the use of facilities at the US Department of Veterans Affairs Medical Center, Wilkes-Barre, Pennsylvania.
1. Randomised trial of cholesterol lowering in 4444 patients with coronary heart disease: the Scandinavian Simvastatin Survival Study (4S). Lancet. 1994;344(8934):1383-1389.
2. Sacks FM, Pfeffer MA, Moye LA, et al. The effect of pravastatin on coronary events after myocardial infarction in patients with average cholesterol levels. Cholesterol and Recurrent Events Trial investigators. N Engl J Med. 1996;335(14):1001-1009. doi:10.1056/NEJM199610033351401
3. Long-Term Intervention with Pravastatin in Ischaemic Disease (LIPID) Study Group. Prevention of cardiovascular events and death with pravastatin in patients with coronary heart disease and a broad range of initial cholesterol levels. N Engl J Med. 1998;339(19):1349-1357. doi:10.1056/NEJM199811053391902.
4. Heart Protection Study Collaborative Group. MRC/BHF Heart Protection Study of cholesterol lowering with simvastatin in 20,536 high-risk individuals: a randomised placebo-controlled trial. Lancet. 2002;360(9326):7-22. doi:10.1016/S0140-6736(02)09327-3
5. Koren MJ, Hunninghake DB; ALLIANCE Investigators. Clinical outcomes in managed-care patients with coronary heart disease treated aggressively in lipid-lowering disease management clinics: the alliance study. J Am Coll Cardiol. 2004;44(9):1772-1779. doi:10.1016/j.jacc.2004.07.053
6. Downs JR, Clearfield M, Weis S, et al. Primary prevention of acute coronary events with lovastatin in men and women with average cholesterol levels: results of AFCAPS/TexCAPS. Air Force/Texas Coronary Atherosclerosis Prevention Study. JAMA. 1998;279(20):1615-1622. doi:10.1001/jama.279.20.1615
7. ALLHAT Officers and Coordinators for the ALLHAT Collaborative Research Group. The Antihypertensive and Lipid-Lowering Treatment to Prevent Heart Attack Trial. Major outcomes in moderately hypercholesterolemic, hypertensive patients randomized to pravastatin vs usual care: The Antihypertensive and Lipid-Lowering Treatment to Prevent Heart Attack Trial (ALLHAT-LLT). JAMA. 2002;288(23):2998-3007. doi:10.1001/jama.288.23.2998
8. Sever PS, Dahlöf B, Poulter NR, et al. Prevention of coronary and stroke events with atorvastatin in hypertensive patients who have average or lower-than-average cholesterol concentrations, in the Anglo-Scandinavian Cardiac Outcomes Trial-Lipid Lowering Arm (ASCOT-LLA): a multicentre randomised controlled trial. Lancet. 2003;361(9364):1149-1158. doi:10.1016/S0140-6736(03)12948-0
9. Ridker PM, Danielson E, Fonseca FA, et al. Rosuvastatin to prevent vascular events in men and women with elevated C-reactive protein. N Engl J Med. 2008;359(21):2195-2207. doi:10.1056/NEJMoa0807646
10. Nakamura H, Arakawa K, Itakura H, et al. Primary prevention of cardiovascular disease with pravastatin in Japan (MEGA Study): a prospective randomised controlled trial. Lancet. 2006;368(9542):1155-1163. doi:10.1016/S0140-6736(06)69472-5
11. Shepherd J, Blauw GJ, Murphy MB, et al. Pravastatin in elderly individuals at risk of vascular disease (PROSPER): a randomised controlled trial. Lancet. 2002;360(9346):1623-1630. doi:10.1016/s0140-6736(02)11600-x
12. Shepherd J, Cobbe SM, Ford I, et al. Prevention of coronary heart disease with pravastatin in men with hypercholesterolemia. West of Scotland Coronary Prevention Study Group. N Engl J Med. 1995;333(20):1301-1307. doi:10.1056/NEJM199511163332001
13. Stroes ES, Thompson PD, Corsini A, et al. Statin-associated muscle symptoms: impact on statin therapy-European Atherosclerosis Society Consensus Panel Statement on Assessment, Aetiology and Management. Eur Heart J. 2015;36(17):1012-1022. doi:10.1093/eurheartj/ehv043
14. Grundy SM, Stone NJ, Bailey AL, et al. AHA/ACC/AACVPR/AAPA/ABC/ACPM/ADA/AGS/APhA/ASPC/NLA/PCNA Guideline on the Management of Blood Cholesterol: A Report of the American College of Cardiology/American Heart Association Task Force on Clinical Practice Guidelines. J Am Coll Cardiol. 2019;73(24) e285-350. doi:10.1016/j.jacc.2018.11003
15. Myers KD, Farboodi N, Mwamburi M, et al. Effect of access to prescribed PCSK9 inhibitors on cardiovascular outcomes. Circ Cardiovasc Qual Outcomes. 2019;12(8):e005404. doi:10.1161/CIRCOUTCOMES.118.005404
16. Wong ND, Chuang J, Zhao Y, Rosenblit PD. Residual dyslipidemia according to low-density lipoprotein cholesterol, non-high-density lipoprotein cholesterol, and apolipoprotein B among statin-treated US adults: National Health and Nutrition Examination Survey 2009-2010. J Clin Lipidol. 2015;9(4):525-532. doi:10.1016/j.jacl.2015.05.003
17. Della Badia LA, Elshourbagy NA, Mousa SA. Targeting PCSK9 as a promising new mechanism for lowering low-density lipoprotein cholesterol. Pharmacol Ther. 2016;164:183-194. doi:10.1016/j.pharmthera.2016.04.011
18. Praluent (alirocumab) injection. Prescribing information. Regeneron Pharmaceuticals; 2021.
19. Repatha (evolocumab) injection. Prescribing information. Amgen; 2021.
20. Schwartz GG, Steg PG, Szarek M, et al. Alirocumab and cardiovascular outcomes after acute coronary syndrome. N Engl J Med. 2018;379(22):2097-2107. doi:10.1056/NEJMoa1801174
21. Sabatine MS, Giugliano RP, Keech AC, et al. Evolocumab and clinical outcomes in patients with cardiovascular disease. N Engl J Med. 2017;376(18):1713-1722. doi:10.1056/NEJMoa1615664
22. Stroes E, Colquhoun D, Sullivan D, et al. Anti-PCSK9 antibody effectively lowers cholesterol in patients with statin intolerance: the GAUSS-2 randomized, placebo-controlled phase 3 clinical trial of evolocumab. J Am Coll Cardiol. 2014;63(23):2541-2548. doi:10.1016/j.jacc.2014.03.019
23. Nissen SE, Stroes E, Dent-Acosta RE, et al. Efficacy and tolerability of evolocumab vs ezetimibe in patients with muscle-related statin intolerance: the GAUSS-3 randomized clinical trial. JAMA. 2016;315(15):1580-1590. doi:10.1001/jama.2016.3608
24. Moriarty PM, Thompson PD, Cannon CP, et al. Efficacy and safety of alirocumab vs ezetimibe in statin-intolerant patients, with a statin rechallenge arm: the ODYSSEY ALTERNATIVE randomized trial. J Clin Lipidol. 2015;9(6):758-769. doi:10.1016/j.jacl.2015.08.006
25. Mesi O, Lin C, Ahmed H, Cho LS. Statin intolerance and new lipid-lowering treatments. Cleve Clin J Med. 2021;88(7):381-387. Published 2021 Jul 1. doi:10.3949/ccjm.88a.20165
26. US Department of Veterans Affairs. Clinical Guidance - Criteria For Use. September 2016. Accessed January 23, 2023. https://www.pbm.va.gov/clinicalguidance/criteriaforuse.asp
27. Donald DR, Reynolds VW, Hall N, DeClercq J, Choi L. Exploring rates of PCSK9 inhibitor persistence and reasons for treatment non-persistence in an integrated specialty pharmacy model. J Clin Lipidol. 2022;16(3):315-324. doi:10.1016/j.jacl.2022.03.004
28. Warden BA, Guyton JR, Kovacs AC, et al. Assessment and management of statin-associated muscle symptoms: A clinical perspective from the National Lipid Association. J Clin Lipidol. Published online September 10, 2022. doi:10.1016/j.jacl.2022.09.001
HMG-CoA reductase inhibitors (statins) have been shown to effectively reduce low-density lipoprotein cholesterol (LDL-C) as well as morbidity and mortality in patients who have either atherosclerotic cardiovascular disease (ASCVD) or risk factors for ASCVD.1-12 However, research shows that up to 20% of patients are unable to tolerate statin therapy due to muscle-related adverse events (AEs).13 This presents a substantial clinical challenge, as current management strategies for patients with statin-associated muscle symptoms, such as intermittent administration of statins and ezetimibe, seldom achieve the > 50% LDL-C reduction recommended by the 2018 American Heart Association/American College of Cardiology Clinical Practice Guidelines.14 Additionally, statin-intolerant patients who have antihyperlipidemic medication lowered or discontinued are at an increased risk of future cardiovascular events.15 Observational data also show that about 70% of adult patients (primarily with genetic lipid disorders such as heterozygous familial hypercholesterolemia) do not achieve an LDL-C level < 100 mg/dL despite treatment with maximum doses of statins with or without ezetimibe.16,17
PCSK9 inhibitors (PCSK9i) have robust efficacy data to support use in patients who do not meet their LDL-C goal despite maximally tolerated lipid therapy.14 However, long-term safety data for PCSK9i are not as robust as its efficacy data. Specifically, safety data relating to muscle-related AEs, which are the most widely recognized AE associated with statins, have only been reported in a few clinical trials with varying incidence rates, levels of significance, and relatively small study populations. Furthermore, the real-world prevalence of muscle-related PCSK9i AEs is unknown. Clinical guidance for management strategies for muscle-related AEs associated with PCSK9i is largely lacking. For this study, muscle-related AEs were defined as any new or unusual muscle soreness, weakness, cramping, aches, and stiffness that persists, is generally bilateral, and typically affects the large muscles. It is important to note, that muscle-related AEs associated with statins, ezetimibe, and PCSK9i can be attributed to the nocebo effect.
According to the prescribing information for alirocumab and evolocumab, myalgia, muscle spasms, and musculoskeletal pain each occurred in < 5% of the study populations.18,19 From these data, muscle-related PCSK9i AEs are thought to be relatively rare, based on the ODYSSEY-OUTCOME and FOURIER trials, which did not enroll statin-intolerant patients.20,21 However, currently available safety data from 3 small, randomized clinical trials specifically in statin-intolerant patients taking a PCSK9i suggest that muscle-related AEs occur at a rate of 12.2% to 32.5% and discontinuation rates varied from 0% to 15.9%.22-25 As the incidence rates of muscle-related AEs in the prescribing information and clinical trials varied widely, this study will provide quantitative data on the percentage of patients that developed muscle-related PCSK9i AEs in a veteran population to help shed light on a topic that is not well studied.
Methods
This was a single-center, retrospective chart review of patients prescribed a PCSK9i between December 1, 2017, and September 1, 2021, and were managed in a pharmacy-led patient aligned care team (PACT) clinic at the Wilkes-Barre US Department of Veterans Affairs (VA) Medical Center (WBVAMC) in Pennsylvania. This study was approved by the Coatesville VA Medical Center Institutional Review Board, which oversees research conducted at WBVAMC. Veterans aged ≥ 18 years were included in the study. Patients were excluded if they had a history of serious hypersensitivity reaction to a PCSK9i or rhabdomyolysis or did not meet the VA criteria for use.26
The primary outcome was the percentage of patients who developed a muscle-related AE while on a PCSK9i in a PACT clinic. Data were further analyzed based on patients who (1) tolerated a full PCSK9i dose; (2) tolerated alternative PCSK9i following initial intolerance; (3) required a PCSK9i dose reduction, or (4) discontinued PCSK9i. A secondary outcome was the percentage of statin- and/or ezetimibe-intolerant patients in these 4 groups. Another secondary outcome was the management strategies taken for patients who were on a reduced (monthly) dose of PCSK9i who did not reach their LDL-C goal. Management strategies that were assessed included restarting weekly statin, restarting weekly ezetimibe, increasing the dose of the same PCSK9i administered monthly, and switching to an alternative PCSK9i.
Data were collected using the VA Computerized Patient Record System (CPRS) and stored in a secure, locked spreadsheet. Baseline patient demographic characteristics collected included age (at PCSK9i start); sex; race; and PCSK9i name, dose, and frequency. We recorded when a patient switched PCSK9i, whether or not it was due to a muscle-related AE, and the name of the original PCSK9i. Also collected were lipid therapy intolerances prior to PCSK9i initiation (ie, intolerance to statin, ezetimibe, or both).
Patients were considered statin intolerant due to a muscle-related AE in accordance with the VA PCSK9i Criteria for Use, which requires trial of at least 3 statins, one of which was trialed at the lowest dosage approved by the US Food and Drug Administration (FDA) and resulted in intolerable skeletal muscle AEs that worsened during treatment and resolved when the statin was stopped. For our study purposes, patients taking alternative day dosing of statins due to muscle-related AEs (ie, 2- or 3-times weekly dosing) were not considered statin intolerant; however, patients taking once-weekly statin dosing were considered statin intolerant. Patients were considered ezetimibe intolerant due to a muscle-related AE if the intolerance was due to skeletal muscle concerns that worsened during treatment and resolved when ezetimibe was stopped. Patients were considered PCSK9i intolerant due to a muscle-related AE if the intolerance was due to skeletal muscle concerns that worsened during treatment and resolved when the PCSK9i was stopped. Patients with non–muscle-related intolerances to statins, ezetimibe, and PCSK9i were not considered statin, ezetimibe, and PCSK9i intolerant.
Alirocumab was initiated at 75 mg subcutaneous (SQ) once every 2 weeks or evolocumab 140 mg SQ once every 2 weeks in our study. The protocol allowed for a dose reduction of alirocumab 75 mg SQ once monthly if a patient experienced AEs, but this dose reduction strategy was not used for any patients on evolocumab in this study. Of note, alirocumab 75 mg SQ once monthly is not an FDA-approved dosing strategy. However, it is similar in concept to the alternative statin dosing (ie, alternate day dosing, once-weekly dosing) and may avoid the need to discontinue PCSK9i therapy altogether.
A review of the CPRS also documented whether a muscle-related AE occurred while the patient was on a PCSK9i (if yes, the specific AE was recorded), the result of PCSK9i therapy (tolerated full dose, required a dose reduction, switched medication, or discontinued), and management strategies taken for patients who did not meet their LDL-C goal while on a reduced (monthly) PCSK9i dose. Prior lipid therapy intolerances, PCSK9i-related AEs, results of PCSK9i therapy, and management strategies for patients who did not meet LDL-C goal while on a reduced PCSK9i dose were obtained by reviewing the PACT pharmacist’s clinic notes and assessment, along with clinic notes and medication history listed within the CPRS.
Statistical Analysis
Descriptive statistics were used for the demographic characteristics of study patients. The primary outcome was calculated as a binary measure (yes/no) of whether the patient developed a muscle-related AE while on a PCSK9i. The secondary outcome of statin, ezetimibe, or statin and ezetimibe intolerances in subgroups also was calculated as a binary measure.
Results
For the study, 156 charts were reviewed and 137 patients were included (Figure).
For the secondary results, 4 patients (2.9%) tolerated an alternate PCSK9i (evolocumab 140 mg SQ every 2 weeks) after initial intolerance to PCSK9i, 16 (11.7%) required a dose reduction, and 6 (4.4%) discontinued PCSK9i due to a muscle-related AE.
Statin intolerance was most common in all groups, followed by ezetimibe intolerance, and intolerance to statins + ezetimibe. Of the 113 patients who tolerated a full dose of PCSK9i, 77 (68.1%) had intolerance to statin, 47 (41.6%) to ezetimibe, and 41 (36.3%) to both statins and ezetimibe. Of the 6 patients who discontinued PCSK9i, all had intolerance to statins, 5 (83.3%) to ezetimibe, and 5 (83.3%) to statins and ezetimibe.
For patients who were on a reduced (monthly) dose of a PCSK9i who did not reach their LDL-C goal, we found that 16 patients (11.7%) required a PCSK9i dose reduction following muscle-related AEs. Of the patients who had their dose of PCSK9i reduced to monthly dosing, 5 (31%) met their LDL-C goal. For the 11 patients who did not meet their LDL-C goal, different management strategies were taken. Lifestyle modifications were made in 6 patients (54%), the monthly PCSK9i dose was increased to alirocumab 150 mg SQ monthly in 4 patients (36%), and 1 patient (9.1%) was switched to an alternative PCSK9i. There were no identified muscle-related AEs recorded in patients whose dose was increased to alirocumab 150 mg SQ monthly.
Discussion
This retrospective study found 17.5% of patients experienced muscle-related PCSK9i AEs. These occurred at a higher rate than reported in the prescribing information (< 5%) and were similar to the incidence rates reported in the GAUSS-2, GAUSS-3, and ODYSSEY-ALTERNATIVE clinical trials (12.0%-32.5%), which is what we hypothesized.18,19,22-25 It is important to note that the incidence rates of muscle-related AEs reported in the prescribing information for alirocumab and evolocumab were based on trials that did not include statin- and/or ezetimibe-intolerant patients; whereas many patients in our study and patients in the clinical trials were statin and/or ezetimibe intolerant.
Additionally, a new study by Donald and colleagues found an incidence rate of 32% to 36% for muscle-related PCSK9i AEs.27 Collectively, the data from clinical trials and our study indicate that patients with prior intolerances to statin and/or ezetimibe appear to have a higher likelihood of developing a muscle-related PCSK9i intolerance. In our study, 23 of 24 patients who developed a muscle-related PCSK9i AE had a prior history of statin and/or ezetimibe intolerances. This should alert clinicians prescribing PCSK9i in patients with a history of statin and/or ezetimibe intolerance to counsel their patients on the possibility of muscle-related PCSK9i AEs and management strategies. However, it is important to note that there was a substantial number of patients in our study who were statin and/or ezetimibe intolerant due to a prior muscle-related AE who tolerated the full dose of PCSK9i.
To our knowledge, this was the first trial to evaluate muscle-related PCSK9i AEs in a veteran population. Additionally, our study appears to be the first to use 2 PCSK9i dosing strategies that are not FDA approved: Dose reduction for patients who experienced a muscle-related AE on alirocumab 75 mg SQ every 2 weeks and dose escalation for patients who did not meet their LDL-C goal on alirocumab 75 mg SQ monthly following an initial intolerance to 2-week dosing. The dose-reduction strategy allowed patients who experienced a muscle-related AE to alirocumab 75 mg to reduce administration from every 2 weeks to monthly.
This strategy was only performed with alirocumab, the preferred PCSK9i at WBVAMC, but the same dose-reduction strategy can theoretically be used with evolocumab as well. Reduced monthly dosing of alirocumab allowed patients with a prior intolerance to remain on a lower dosage without discontinuation. This is important because as noted by Myers and colleagues, individuals without access to PCSK9i were found to have a significantly higher incidence ratio of cardiovascular events compared with those taking PCSK9i.15 Also of note, > 30% of patients on the reduced monthly dose of alirocumab still met their LDL-C goal. Therefore, using this dose-reduction strategy (instead of patients discontinuing therapy altogether due to a muscle-related intolerance) can lessen the risk of major adverse cardiovascular events (MACE) as well as mitigate muscle-related AEs that occurred while on 2-week PCSK9i dosing regimens. While we acknowledge that this reduced monthly dose of either alirocumab or evolocumab is not FDA approved, it is similar to alternative statin dosing that also is not FDA approved but may minimize the need to discontinue PCSK9i therapy. It would be beneficial if these dosing strategies were investigated by future research.
The dose-escalation strategy for patients who did not meet their LDL-C goal while on the reduced, monthly dose of alirocumab also was unique. Alirocumab was increased from 75 mg SQ once monthly to 150 mg SQ once monthly. Interestingly, we found that through the end of the chart review period, all patients tolerated the increase well, despite having an initial muscle-related AE to alirocumab 75 mg every 2 weeks, which is the same total monthly dosage. This approach is similar to that of once-weekly statin dosing or a drug holiday and may be explained by the long half-life of PCSK9i. Regardless of the mechanism, this finding suggests that an increased monthly dose of PCSK9i is a potential alternative for patients who cannot tolerate the FDA-approved dose. However, the ability for patients to achieve goal LDL-C on the monthly dosage requires future study.
In our study, only 6 patients (4.4%) discontinued PCSK9i therapy. This low discontinuation rate is largely attributable to our unique study design, which allowed for a dose reduction in patients who experienced muscle-related AEs. The earlier ODYSSEY-ALTERNATIVE trial evaluated the safety and efficacy of alirocumab compared with ezetimibe in confirmed statin-intolerant subjects after 24 weeks. This trial did not use a dose-reduction strategy and found 15.9% of patients discontinued alirocumab due to a muscle-related AE.24 This is notably higher than our discontinuation rate of 4.4%. If patients with a muscle-related AE discontinued PCKS9i instead of reducing the dose, they would likely return to their baseline LDL-C, which would increase the risk of MACE.
In general, myalgias due to antihyperlipidemic medications are not completely understood. One possible mechanism for statin-induced myalgias is the depletion of ubiquinone. However, this theory cannot explain muscle-related AEs associated with PCSK9i or ezetimibe, which have not been shown to deplete ubiquinone. We also found that the onset of muscle-related AEs associated with PCSK9i tends to appear later in therapy than what we know about statin therapy. Our study showed that the onset of a muscle-related PCSK9i AEs occurred a mean (SD) 8 (5.3) months after initiation (range, 1-19). Statin muscle-related AEs typically occur within the initial 4 to 8 weeks of treatment, although they can occur at any time.28
Limitations
The results of this study should be considered with the following limitations. First, this was a retrospective chart review performed over a prespecified period. Any muscle-related AEs or LDL-C lowering effects from PCSK9i that occurred outside the review period were not captured. Our study was small and only included 137 patients, though it was similar in size to the GAUSS-2, GAUSS-3, and ODYSSEY-ALTERNATIVE trials.22-24 Additionally, the study was primarily composed of White men and may not be representative of other populations. Some muscle-related PCSK9i AEs may be attributed to the nocebo. Last, our study did not capture patients on a PCSK9i who were not followed in the PACT clinic.
Conclusions
We found that muscle-related PCSK9i AEs occurred at a similar rate as those reported in previous clinical trials and exceeded the incidence rate reported in the prescribing information for alirocumab and evolocumab. It appears that patients who have a prior muscle-related intolerance to a statin and/or ezetimibe had a higher likelihood of developing a muscle-related PCSK9i AE. In our study, only 1 patient developed a muscle-related PCSK9i AE who did not have a prior history of muscle-related intolerance to either a statin or ezetimibe. However, in our study, a substantial percentage of patients with statin and/or ezetimibe intolerances tolerated the full PCSK9i dose well, proving that PCSK9i are still a reasonable alternative for patients with prior intolerances to statins and/or ezetimibe.
Acknowledgments
This material is the result of work supported with resources and the use of facilities at the US Department of Veterans Affairs Medical Center, Wilkes-Barre, Pennsylvania.
1. Randomised trial of cholesterol lowering in 4444 patients with coronary heart disease: the Scandinavian Simvastatin Survival Study (4S). Lancet. 1994;344(8934):1383-1389.
2. Sacks FM, Pfeffer MA, Moye LA, et al. The effect of pravastatin on coronary events after myocardial infarction in patients with average cholesterol levels. Cholesterol and Recurrent Events Trial investigators. N Engl J Med. 1996;335(14):1001-1009. doi:10.1056/NEJM199610033351401
3. Long-Term Intervention with Pravastatin in Ischaemic Disease (LIPID) Study Group. Prevention of cardiovascular events and death with pravastatin in patients with coronary heart disease and a broad range of initial cholesterol levels. N Engl J Med. 1998;339(19):1349-1357. doi:10.1056/NEJM199811053391902.
4. Heart Protection Study Collaborative Group. MRC/BHF Heart Protection Study of cholesterol lowering with simvastatin in 20,536 high-risk individuals: a randomised placebo-controlled trial. Lancet. 2002;360(9326):7-22. doi:10.1016/S0140-6736(02)09327-3
5. Koren MJ, Hunninghake DB; ALLIANCE Investigators. Clinical outcomes in managed-care patients with coronary heart disease treated aggressively in lipid-lowering disease management clinics: the alliance study. J Am Coll Cardiol. 2004;44(9):1772-1779. doi:10.1016/j.jacc.2004.07.053
6. Downs JR, Clearfield M, Weis S, et al. Primary prevention of acute coronary events with lovastatin in men and women with average cholesterol levels: results of AFCAPS/TexCAPS. Air Force/Texas Coronary Atherosclerosis Prevention Study. JAMA. 1998;279(20):1615-1622. doi:10.1001/jama.279.20.1615
7. ALLHAT Officers and Coordinators for the ALLHAT Collaborative Research Group. The Antihypertensive and Lipid-Lowering Treatment to Prevent Heart Attack Trial. Major outcomes in moderately hypercholesterolemic, hypertensive patients randomized to pravastatin vs usual care: The Antihypertensive and Lipid-Lowering Treatment to Prevent Heart Attack Trial (ALLHAT-LLT). JAMA. 2002;288(23):2998-3007. doi:10.1001/jama.288.23.2998
8. Sever PS, Dahlöf B, Poulter NR, et al. Prevention of coronary and stroke events with atorvastatin in hypertensive patients who have average or lower-than-average cholesterol concentrations, in the Anglo-Scandinavian Cardiac Outcomes Trial-Lipid Lowering Arm (ASCOT-LLA): a multicentre randomised controlled trial. Lancet. 2003;361(9364):1149-1158. doi:10.1016/S0140-6736(03)12948-0
9. Ridker PM, Danielson E, Fonseca FA, et al. Rosuvastatin to prevent vascular events in men and women with elevated C-reactive protein. N Engl J Med. 2008;359(21):2195-2207. doi:10.1056/NEJMoa0807646
10. Nakamura H, Arakawa K, Itakura H, et al. Primary prevention of cardiovascular disease with pravastatin in Japan (MEGA Study): a prospective randomised controlled trial. Lancet. 2006;368(9542):1155-1163. doi:10.1016/S0140-6736(06)69472-5
11. Shepherd J, Blauw GJ, Murphy MB, et al. Pravastatin in elderly individuals at risk of vascular disease (PROSPER): a randomised controlled trial. Lancet. 2002;360(9346):1623-1630. doi:10.1016/s0140-6736(02)11600-x
12. Shepherd J, Cobbe SM, Ford I, et al. Prevention of coronary heart disease with pravastatin in men with hypercholesterolemia. West of Scotland Coronary Prevention Study Group. N Engl J Med. 1995;333(20):1301-1307. doi:10.1056/NEJM199511163332001
13. Stroes ES, Thompson PD, Corsini A, et al. Statin-associated muscle symptoms: impact on statin therapy-European Atherosclerosis Society Consensus Panel Statement on Assessment, Aetiology and Management. Eur Heart J. 2015;36(17):1012-1022. doi:10.1093/eurheartj/ehv043
14. Grundy SM, Stone NJ, Bailey AL, et al. AHA/ACC/AACVPR/AAPA/ABC/ACPM/ADA/AGS/APhA/ASPC/NLA/PCNA Guideline on the Management of Blood Cholesterol: A Report of the American College of Cardiology/American Heart Association Task Force on Clinical Practice Guidelines. J Am Coll Cardiol. 2019;73(24) e285-350. doi:10.1016/j.jacc.2018.11003
15. Myers KD, Farboodi N, Mwamburi M, et al. Effect of access to prescribed PCSK9 inhibitors on cardiovascular outcomes. Circ Cardiovasc Qual Outcomes. 2019;12(8):e005404. doi:10.1161/CIRCOUTCOMES.118.005404
16. Wong ND, Chuang J, Zhao Y, Rosenblit PD. Residual dyslipidemia according to low-density lipoprotein cholesterol, non-high-density lipoprotein cholesterol, and apolipoprotein B among statin-treated US adults: National Health and Nutrition Examination Survey 2009-2010. J Clin Lipidol. 2015;9(4):525-532. doi:10.1016/j.jacl.2015.05.003
17. Della Badia LA, Elshourbagy NA, Mousa SA. Targeting PCSK9 as a promising new mechanism for lowering low-density lipoprotein cholesterol. Pharmacol Ther. 2016;164:183-194. doi:10.1016/j.pharmthera.2016.04.011
18. Praluent (alirocumab) injection. Prescribing information. Regeneron Pharmaceuticals; 2021.
19. Repatha (evolocumab) injection. Prescribing information. Amgen; 2021.
20. Schwartz GG, Steg PG, Szarek M, et al. Alirocumab and cardiovascular outcomes after acute coronary syndrome. N Engl J Med. 2018;379(22):2097-2107. doi:10.1056/NEJMoa1801174
21. Sabatine MS, Giugliano RP, Keech AC, et al. Evolocumab and clinical outcomes in patients with cardiovascular disease. N Engl J Med. 2017;376(18):1713-1722. doi:10.1056/NEJMoa1615664
22. Stroes E, Colquhoun D, Sullivan D, et al. Anti-PCSK9 antibody effectively lowers cholesterol in patients with statin intolerance: the GAUSS-2 randomized, placebo-controlled phase 3 clinical trial of evolocumab. J Am Coll Cardiol. 2014;63(23):2541-2548. doi:10.1016/j.jacc.2014.03.019
23. Nissen SE, Stroes E, Dent-Acosta RE, et al. Efficacy and tolerability of evolocumab vs ezetimibe in patients with muscle-related statin intolerance: the GAUSS-3 randomized clinical trial. JAMA. 2016;315(15):1580-1590. doi:10.1001/jama.2016.3608
24. Moriarty PM, Thompson PD, Cannon CP, et al. Efficacy and safety of alirocumab vs ezetimibe in statin-intolerant patients, with a statin rechallenge arm: the ODYSSEY ALTERNATIVE randomized trial. J Clin Lipidol. 2015;9(6):758-769. doi:10.1016/j.jacl.2015.08.006
25. Mesi O, Lin C, Ahmed H, Cho LS. Statin intolerance and new lipid-lowering treatments. Cleve Clin J Med. 2021;88(7):381-387. Published 2021 Jul 1. doi:10.3949/ccjm.88a.20165
26. US Department of Veterans Affairs. Clinical Guidance - Criteria For Use. September 2016. Accessed January 23, 2023. https://www.pbm.va.gov/clinicalguidance/criteriaforuse.asp
27. Donald DR, Reynolds VW, Hall N, DeClercq J, Choi L. Exploring rates of PCSK9 inhibitor persistence and reasons for treatment non-persistence in an integrated specialty pharmacy model. J Clin Lipidol. 2022;16(3):315-324. doi:10.1016/j.jacl.2022.03.004
28. Warden BA, Guyton JR, Kovacs AC, et al. Assessment and management of statin-associated muscle symptoms: A clinical perspective from the National Lipid Association. J Clin Lipidol. Published online September 10, 2022. doi:10.1016/j.jacl.2022.09.001
Evaluation of the Appropriateness of Aspirin Therapy in a Veteran Population
Aspirin is an antiplatelet agent that binds irreversibly to COX-1 and COX-2 enzymes, which results in decreased prostaglandin and thromboxane A2 production and inhibition of platelet aggregation. Aspirin often is used for its antipyretic, analgesic, and antiplatelet properties. Its use in cardiovascular disease (CVD) has been studied extensively over the past few decades, and recent data are changing the framework for aspirin use in primary prevention of atherosclerotic cardiovascular disease (ASCVD). Primary prevention refers to efforts to prevent the incidence of cardiovascular events, whereas secondary prevention refers to efforts to prevent a cardiovascular event after one has occurred.1 This differentiation is important as it guides the course of treatment.
Three trials published in 2018 evaluated aspirin use in primary prevention of ASCVD. The ASCEND trial evaluated aspirin use for primary prevention of ASCVD in patients with diabetes mellitus (DM). This study concluded that although aspirin prevented serious vascular events in patients with DM, the benefit observed was largely counteracted by the bleeding hazard.2 The ARRIVE trial evaluated aspirin use for primary prevention in patients with a moderate CVD risk. The study concluded that aspirin use in patients at moderate risk of CVD could not be assessed due to the low incidence rate of CVD; however, the study concluded that aspirin did not reduce the incidence of cardiovascular events for patients at low CVD risk and that aspirin caused more mild gastrointestinal bleeds compared with placebo.3 The ASPREE trial evaluated aspirin use for primary prevention in patients aged > 70 years to determine whether its use prolonged a healthy lifespan. This trial concluded that patients who received daily aspirin were at a higher risk of major hemorrhage and that aspirin did not diminish CVD risk compared with placebo.4
These studies led to a paradigm shift in therapy to reevaluate aspirin use for primary prevention. Current indications for aspirin include secondary prevention of ASCVD (ie, myocardial infarction [MI], coronary artery bypass graft, transient ischemic attack [TIA], and stroke), venous thromboembolism prophylaxis in the setting of orthopedic surgery, or valvular disease with replacement and analgesia. It is important to note that certain clinical circumstances may warrant aspirin use for primary prevention of ASCVD on a patient-specific basis, and this decision should be made using a risk/benefit analysis with the patient.
In April 2022, the US Preventive Services Task Force (USPSTF) recommended against using low-dose aspirin for primary prevention of ASCVD in individuals aged ≥ 60 years. The USPSTF noted that for patients who have a ≥ 10%, 10-year CVD risk, the decision to initiate aspirin should be based on a risk/benefit discussion and may be beneficial in certain patient populations.5A 2019 National Heart, Lung, and Blood Institute survey found that 29 million Americans used aspirin for primary prevention of ASCVD, and 6.6 million of these Americans used aspirin for primary prevention without the recommendation of a health care professional (HCP). Almost half of these individuals were aged > 70 years and, therefore, at an increased risk for bleeding.6 With the recent studies and changes in guidelines highlighting a higher risk rather than benefit with the use of aspirin for primary prevention, the current use of aspirin for primary prevention in the United States needs to be readdressed.
HCPs should assess the appropriateness of aspirin use in their patients to ensure that the risks of aspirin do not outweigh the benefits. Pharmacists can play a vital role in the assessment of aspirin for primary prevention during patient visits and make recommendations to primary care practitioners to deprescribe aspirin when appropriate.
Methods
The objective of this study was to evaluate the appropriateness of aspirin therapy in patient aligned care team (PACT) clinics at the Captain James A. Lovell Federal Health Care Center (FHCC) in North Chicago, Illinois. The PACT clinics are a category of clinics that include all the primary care clinics at FHCC.
The primary outcome of this study was to determine the percentage of patients inappropriately on aspirin therapy. To assess the inappropriate use of aspirin, relevant history of ASCVD was collected. Patients were divided into 3 groups: those with a history of ASCVD, those with no risk factors or history of ASCVD, and those with risk factors and no history of ASCVD. Patients were then categorized for their indication for aspirin use, which included either primary or secondary prevention of ASCVD. Patients were categorized into the primary prevention group if they had no history of ASCVD, whereas patients with a history of ASCVD were placed into the secondary prevention group.
ASCVD was defined as patients with acute coronary syndrome (ACS), history of MI, stable or unstable angina, coronary or other arterial revascularization, stroke, TIA, or peripheral artery disease (PAD), including aortic aneurysm (all with an atherosclerotic origin). Possible ASCVD risk was defined as patients with DM with a major risk factor (family history of premature ASCVD, hypertension, dyslipidemia, smoking, chronic kidney disease [CKD]/albuminuria) or patients diagnosed with coronary artery disease without an event. The percentage of patients followed by a PACT pharmacist, the number of pharmacist follow-up visits during the study period, and the date of the first 81-mg aspirin pharmacy order that was filled at FHCC were also collected.
The secondary outcome of this study focused on patients who were using aspirin for primary prevention and assessed potential reasons that may warrant deprescribing aspirin therapy. One reason for deprescribing is that aspirin may not be indicated for some patients, including those with DM without cardiovascular complications, patients aged > 70 years, and/or patients with CKD (defined as estimated glomerular filtration rate < 60 mL/min). Another reason for deprescribing is contraindication, which included patients with coagulopathy, thrombocytopenia (defined as platelet count < 150,000 mL), a history of gastrointestinal bleeding, peptic ulcer disease or other major bleeds, and/or consistent use of medications that increase bleeding risk (such as nonsteroidal anti-inflammatory agents, steroids, or anticoagulants) for > 14 days.
The safety outcome of this study assessed bleeding events while on aspirin therapy. All patients were categorized depending on if they had a major, minor, or no bleeding event while on aspirin therapy. Hemorrhagic stroke, symptomatic intracranial bleeding, bleeds located in other critical sites or organs (intracranial, intraspinal, intraocular, retroperitoneal, intra‐articular or pericardial), bleeds causing hemodynamic instability requiring vasopressors, bleeds causing a > 2 g/dL hemoglobin drop since initiation of aspirin therapy, severe extracranial bleeding requiring transfusion or hospitalization, fatal bleeding, or bleeds requiring > 2 units of red blood cell transfusion were considered major bleeding events. Minor bleeding events were any events that did not meet the criteria for major bleeding, including bruising, bleeding gums, epistaxis, hemorrhoidal bleeds, and bleeding that did not require intervention or treatment.7
Patients were included if they were aged > 18 years, had an active prescription for 81-mg aspirin tablet on September 30, 2021, and were seen in FHCC PACT clinics or at affiliated community-based outpatient centers. Other doses of aspirin were excluded as the 81-mg dose is the standard dose for primary prevention of ASCVD in the United States. US Department of Defense patients, home-based primary care patients, and community living center patients were excluded in this study. Patients with an aspirin prescription from a non–US Department of Veterans Affairs (VA) facility and patients on aspirin for reasons other than cardiovascular protection (such as pain, fever, etc) also were excluded from this study.
Data were collected from the FHCC electronic health record. A list was generated to include all active prescriptions for aspirin filled at FHCC as of September 30, 2021. Data were reviewed before this date to capture primary and secondary outcomes. No information was gathered from the chart after that date. This project was approved by the Edward Hines, Jr. VA Hospital Institutional Review Board. The primary and secondary outcomes were reported using descriptive statistics.
Results
This study reviewed 140 patient records and 105 patients met inclusion criteria. 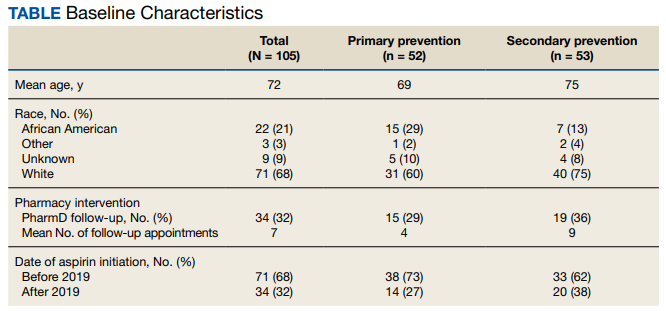
For the primary endpoint, 53 patients (50%) were on aspirin for secondary prevention and 52 (50%) were on aspirin for primary prevention. Of the 105 patients included in the study, 31 (30%) had a possible ASCVD risk and were taking aspirin for primary prevention, while 21 (20%) had no ASCVD and were taking aspirin for primary prevention. Of the 52 patients on aspirin for primary prevention, 31 patients (60%) had a possible risk for ASCVD. Of the 52 patients in the primary prevention group, 15 (29%) were followed by a pharmacist, and the average number of follow-up appointments was 4.
The secondary endpoint focused on patients taking aspirin for primary prevention and the factors that may warrant deprescribing aspirin. Of the 52 patients on aspirin for primary prevention, 25 patients were aged > 70 years, 15 patients were concurrently taking medications that may increase bleeding risk,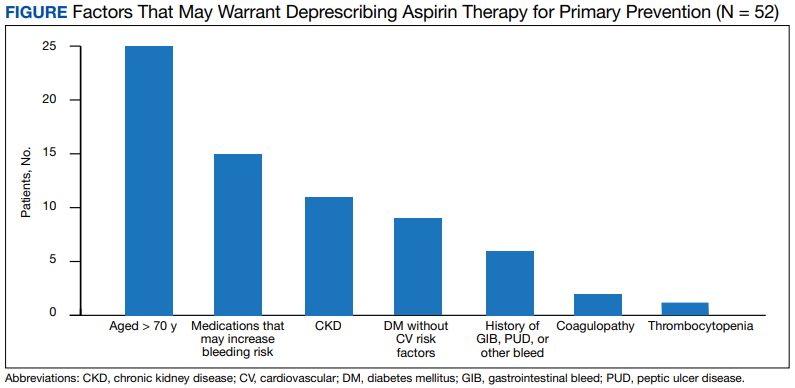
For the entire study group, 6 patients (6%) experienced a major bleeding event while on aspirin, 46 (44%) experienced a minor bleeding event while on aspirin, and 53 (50%) experienced no bleeding events while on aspirin. Of the 6 patients who experienced major bleeding events, 4 were on aspirin for secondary prevention, and 2 were on aspirin for primary prevention with ASCVD risk factors. The major bleeding events included 4 gastrointestinal bleeds, 1 intracranial hemorrhage, and 1 hemorrhagic stroke. Of the 46 who experienced minor bleeding events, 20 patients were on aspirin for primary prevention; 11 of those patients had possible ASCVD risk factors and 9 had no documented ASCVD. The minor bleeding events included hematuria, epistaxis, bleeding scabs, and dental bleeding.
Discussion
The majority of patients in this study were on aspirin appropriately. Indications deemed appropriate for aspirin therapy include secondary prevention and primary prevention with a possible ASCVD risk. About 20% of the total patient population in this study was taking aspirin for primary prevention with no ASCVD risk. For these patients, the risk of bleeding likely outweighs the benefits of aspirin therapy as patients are at low risk for ASCVD; therefore, aspirin therapy is likely inappropriate in this patient population. These patients may be unnecessarily at an increased risk for bleeding and may benefit from deprescribing aspirin. For the safety of patients, HCPs should be continuously assessing the appropriateness of aspirin for primary prevention and deprescribing when necessary.
About one-third of the patients using aspirin for primary prevention were followed by a pharmacist. Pharmacists can play a key role in deprescribing aspirin for primary prevention when aspirin use is deemed inappropriate. About 30% of the total patient population in this study was on aspirin for primary prevention with possible ASCVD risk. This patient population may benefit from aspirin therapy as they are at a higher risk for ASCVD. For these patients, a risk/benefit discussion is necessary to determine the appropriateness of aspirin for primary prevention. This risk/benefit discussion should be a continuous conversation between patients and HCPs as different factors such as age and changes in comorbid conditions and medications may increase bleeding risk.
The secondary endpoint focused on patients taking aspirin for primary prevention and the factors that may warrant deprescribing aspirin. The most common factors seen in this study included patients who were aged > 70 years, patients who were concurrently taking medications that may increase bleeding risk, and patients with CKD. All of these factors increase bleeding risk, making the risks potentially outweigh the benefits of aspirin for primary prevention. These factors should be the primary focus when assessing patients on aspirin for primary prevention to promote deprescribing aspirin if deemed appropriate as they were the most prevalent in this study.
The safety endpoints focused on bleeding events as a whole as well as the bleeding events seen in the primary prevention group. There were 2 major bleeding events and 20 minor bleeding events in the primary prevention group. The number of bleeding events both major and minor further shows the need for a continuous risk/benefit discussion between patients and HCPs on continued aspirin use for primary prevention. The bleeding risk with aspirin is prevalent. HCPs should continue to assess for factors that increase the bleeding risk that may warrant deprescribing aspirin to prevent future bleeding events in this patient population.
Strengths and Limitations
As there have been recent updates to guidelines on the use of aspirin for primary prevention, a strength of this study is that it evaluates a topic that is relevant in health care. Another strength of this study is that it focuses on specific patient factors that HCPs can assess when determining whether aspirin for primary prevention is appropriate in their patients. These specific patient factors can also be used as a guide to help HCPs deprescribe aspirin for primary prevention when appropriate.
One of the limitations of this study is that bleeding events that occurred outside of the FHCC were unable to be assessed unless the HCP specifically commented on the bleeding event in the chart. This could potentially underestimate the bleeding events seen in this study. Another limitation is that the bleeding risk for patients who were not on aspirin was not assessed. There was no comparison group to ascertain whether the bleeding risk was higher in the aspirin group compared with a no aspirin group. However, many of the major clinical trials saw an increased risk of bleeding in the aspirin group compared with placebo.
Conclusions
Aspirin therapy for secondary prevention remains an important part of treatment. Aspirin therapy for primary prevention may be appropriate for patients with a possible ASCVD risk. The therapy may be inappropriate in cases where patients have an increased bleeding risk and low or no ASCVD risk. It is important to continuously assess the need for aspirin therapy for patients in the setting of primary prevention. Common factors seen in this study to warrant deprescribing aspirin for primary prevention include patients aged > 70 years, concurrent use of medications that increase bleeding risk, and patients with CKD. By assessing ASCVD risk as well as bleeding risk and having a risk/benefit discussion between the HCP and patient, aspirin used for primary prevention can be appropriately deprescribed when the risks of bleeding outweigh the benefits.
Acknowledgments
The authors thank the Captain James A. Lovell Federal Health Care Center research committee (Hong-Yen Vi, PharmD, BCPS; Shaiza Khan, PharmD, BCPS; Yinka Alaka, BPharm, PharmD; Jennifer Kwon, PharmD, BCOP) and coinvestigator Aeman Choudhury, PharmD, BCPS, BCACP.
1. Warner TD, Nylander S, Whatling C. Anti-platelet therapy: cyclo-oxygenase inhibition and the use of aspirin with particular regard to dual anti-platelet therapy. Br J Clin Pharmacol. 2011;72(4):619-633. doi:10.1111/j.1365-2125.2011.03943.x
2. ASCEND Study Collaborative Group, Bowman L, Mafham M, et al. Effects of aspirin for primary prevention in persons with diabetes mellitus. N Engl J Med. 2018;379(16):1529-1539. doi:10.1056/NEJMoa1804988
3. Gaziano JM, Brotons C, Coppolecchia R, et al. Use of aspirin to reduce risk of initial vascular events in patients at moderate risk of cardiovascular disease (ARRIVE): a randomised, double-blind, placebo-controlled trial. Lancet. 2018;392(10152):1036-1046. doi:10.1016/S0140-6736(18)31924-X
4. McNeil JJ, Wolfe R, Woods RL, et al. Effect of aspirin on cardiovascular events and bleeding in the healthy elderly. N Engl J Med. 2018;379(16):1509-1518. doi:10.1056/NEJMoa1805819
5. US Preventive Services Task Force, Davidson KW, Barry MJ, et al. Aspirin use to prevent cardiovascular disease: US Preventive Services Task Force Recommendation Statement. JAMA. 2022;327(16):1577-1584. doi:10.1001/jama.2022.4983
6. Murphy E, McEvoy JW. Does stopping aspirin differ fundamentally from not starting aspirin in the primary prevention of cardiovascular disease among older adults? Ann Intern Med. 2022;175(5):757-758. doi:10.7326/M22-0550
7. Schulman S, Kearon C; Subcommittee on Control of Anticoagulation of the Scientific and Standardization Committee of the International Society on Thrombosis and Haemostasis. Definition of major bleeding in clinical investigations of antihemostatic medicinal products in non-surgical patients. J Thromb Haemost. 2005;3(4):692-694. doi:10.1111/j.1538-7836.2005.01204.
Aspirin is an antiplatelet agent that binds irreversibly to COX-1 and COX-2 enzymes, which results in decreased prostaglandin and thromboxane A2 production and inhibition of platelet aggregation. Aspirin often is used for its antipyretic, analgesic, and antiplatelet properties. Its use in cardiovascular disease (CVD) has been studied extensively over the past few decades, and recent data are changing the framework for aspirin use in primary prevention of atherosclerotic cardiovascular disease (ASCVD). Primary prevention refers to efforts to prevent the incidence of cardiovascular events, whereas secondary prevention refers to efforts to prevent a cardiovascular event after one has occurred.1 This differentiation is important as it guides the course of treatment.
Three trials published in 2018 evaluated aspirin use in primary prevention of ASCVD. The ASCEND trial evaluated aspirin use for primary prevention of ASCVD in patients with diabetes mellitus (DM). This study concluded that although aspirin prevented serious vascular events in patients with DM, the benefit observed was largely counteracted by the bleeding hazard.2 The ARRIVE trial evaluated aspirin use for primary prevention in patients with a moderate CVD risk. The study concluded that aspirin use in patients at moderate risk of CVD could not be assessed due to the low incidence rate of CVD; however, the study concluded that aspirin did not reduce the incidence of cardiovascular events for patients at low CVD risk and that aspirin caused more mild gastrointestinal bleeds compared with placebo.3 The ASPREE trial evaluated aspirin use for primary prevention in patients aged > 70 years to determine whether its use prolonged a healthy lifespan. This trial concluded that patients who received daily aspirin were at a higher risk of major hemorrhage and that aspirin did not diminish CVD risk compared with placebo.4
These studies led to a paradigm shift in therapy to reevaluate aspirin use for primary prevention. Current indications for aspirin include secondary prevention of ASCVD (ie, myocardial infarction [MI], coronary artery bypass graft, transient ischemic attack [TIA], and stroke), venous thromboembolism prophylaxis in the setting of orthopedic surgery, or valvular disease with replacement and analgesia. It is important to note that certain clinical circumstances may warrant aspirin use for primary prevention of ASCVD on a patient-specific basis, and this decision should be made using a risk/benefit analysis with the patient.
In April 2022, the US Preventive Services Task Force (USPSTF) recommended against using low-dose aspirin for primary prevention of ASCVD in individuals aged ≥ 60 years. The USPSTF noted that for patients who have a ≥ 10%, 10-year CVD risk, the decision to initiate aspirin should be based on a risk/benefit discussion and may be beneficial in certain patient populations.5A 2019 National Heart, Lung, and Blood Institute survey found that 29 million Americans used aspirin for primary prevention of ASCVD, and 6.6 million of these Americans used aspirin for primary prevention without the recommendation of a health care professional (HCP). Almost half of these individuals were aged > 70 years and, therefore, at an increased risk for bleeding.6 With the recent studies and changes in guidelines highlighting a higher risk rather than benefit with the use of aspirin for primary prevention, the current use of aspirin for primary prevention in the United States needs to be readdressed.
HCPs should assess the appropriateness of aspirin use in their patients to ensure that the risks of aspirin do not outweigh the benefits. Pharmacists can play a vital role in the assessment of aspirin for primary prevention during patient visits and make recommendations to primary care practitioners to deprescribe aspirin when appropriate.
Methods
The objective of this study was to evaluate the appropriateness of aspirin therapy in patient aligned care team (PACT) clinics at the Captain James A. Lovell Federal Health Care Center (FHCC) in North Chicago, Illinois. The PACT clinics are a category of clinics that include all the primary care clinics at FHCC.
The primary outcome of this study was to determine the percentage of patients inappropriately on aspirin therapy. To assess the inappropriate use of aspirin, relevant history of ASCVD was collected. Patients were divided into 3 groups: those with a history of ASCVD, those with no risk factors or history of ASCVD, and those with risk factors and no history of ASCVD. Patients were then categorized for their indication for aspirin use, which included either primary or secondary prevention of ASCVD. Patients were categorized into the primary prevention group if they had no history of ASCVD, whereas patients with a history of ASCVD were placed into the secondary prevention group.
ASCVD was defined as patients with acute coronary syndrome (ACS), history of MI, stable or unstable angina, coronary or other arterial revascularization, stroke, TIA, or peripheral artery disease (PAD), including aortic aneurysm (all with an atherosclerotic origin). Possible ASCVD risk was defined as patients with DM with a major risk factor (family history of premature ASCVD, hypertension, dyslipidemia, smoking, chronic kidney disease [CKD]/albuminuria) or patients diagnosed with coronary artery disease without an event. The percentage of patients followed by a PACT pharmacist, the number of pharmacist follow-up visits during the study period, and the date of the first 81-mg aspirin pharmacy order that was filled at FHCC were also collected.
The secondary outcome of this study focused on patients who were using aspirin for primary prevention and assessed potential reasons that may warrant deprescribing aspirin therapy. One reason for deprescribing is that aspirin may not be indicated for some patients, including those with DM without cardiovascular complications, patients aged > 70 years, and/or patients with CKD (defined as estimated glomerular filtration rate < 60 mL/min). Another reason for deprescribing is contraindication, which included patients with coagulopathy, thrombocytopenia (defined as platelet count < 150,000 mL), a history of gastrointestinal bleeding, peptic ulcer disease or other major bleeds, and/or consistent use of medications that increase bleeding risk (such as nonsteroidal anti-inflammatory agents, steroids, or anticoagulants) for > 14 days.
The safety outcome of this study assessed bleeding events while on aspirin therapy. All patients were categorized depending on if they had a major, minor, or no bleeding event while on aspirin therapy. Hemorrhagic stroke, symptomatic intracranial bleeding, bleeds located in other critical sites or organs (intracranial, intraspinal, intraocular, retroperitoneal, intra‐articular or pericardial), bleeds causing hemodynamic instability requiring vasopressors, bleeds causing a > 2 g/dL hemoglobin drop since initiation of aspirin therapy, severe extracranial bleeding requiring transfusion or hospitalization, fatal bleeding, or bleeds requiring > 2 units of red blood cell transfusion were considered major bleeding events. Minor bleeding events were any events that did not meet the criteria for major bleeding, including bruising, bleeding gums, epistaxis, hemorrhoidal bleeds, and bleeding that did not require intervention or treatment.7
Patients were included if they were aged > 18 years, had an active prescription for 81-mg aspirin tablet on September 30, 2021, and were seen in FHCC PACT clinics or at affiliated community-based outpatient centers. Other doses of aspirin were excluded as the 81-mg dose is the standard dose for primary prevention of ASCVD in the United States. US Department of Defense patients, home-based primary care patients, and community living center patients were excluded in this study. Patients with an aspirin prescription from a non–US Department of Veterans Affairs (VA) facility and patients on aspirin for reasons other than cardiovascular protection (such as pain, fever, etc) also were excluded from this study.
Data were collected from the FHCC electronic health record. A list was generated to include all active prescriptions for aspirin filled at FHCC as of September 30, 2021. Data were reviewed before this date to capture primary and secondary outcomes. No information was gathered from the chart after that date. This project was approved by the Edward Hines, Jr. VA Hospital Institutional Review Board. The primary and secondary outcomes were reported using descriptive statistics.
Results
This study reviewed 140 patient records and 105 patients met inclusion criteria.
For the primary endpoint, 53 patients (50%) were on aspirin for secondary prevention and 52 (50%) were on aspirin for primary prevention. Of the 105 patients included in the study, 31 (30%) had a possible ASCVD risk and were taking aspirin for primary prevention, while 21 (20%) had no ASCVD and were taking aspirin for primary prevention. Of the 52 patients on aspirin for primary prevention, 31 patients (60%) had a possible risk for ASCVD. Of the 52 patients in the primary prevention group, 15 (29%) were followed by a pharmacist, and the average number of follow-up appointments was 4.
The secondary endpoint focused on patients taking aspirin for primary prevention and the factors that may warrant deprescribing aspirin. Of the 52 patients on aspirin for primary prevention, 25 patients were aged > 70 years, 15 patients were concurrently taking medications that may increase bleeding risk,
For the entire study group, 6 patients (6%) experienced a major bleeding event while on aspirin, 46 (44%) experienced a minor bleeding event while on aspirin, and 53 (50%) experienced no bleeding events while on aspirin. Of the 6 patients who experienced major bleeding events, 4 were on aspirin for secondary prevention, and 2 were on aspirin for primary prevention with ASCVD risk factors. The major bleeding events included 4 gastrointestinal bleeds, 1 intracranial hemorrhage, and 1 hemorrhagic stroke. Of the 46 who experienced minor bleeding events, 20 patients were on aspirin for primary prevention; 11 of those patients had possible ASCVD risk factors and 9 had no documented ASCVD. The minor bleeding events included hematuria, epistaxis, bleeding scabs, and dental bleeding.
Discussion
The majority of patients in this study were on aspirin appropriately. Indications deemed appropriate for aspirin therapy include secondary prevention and primary prevention with a possible ASCVD risk. About 20% of the total patient population in this study was taking aspirin for primary prevention with no ASCVD risk. For these patients, the risk of bleeding likely outweighs the benefits of aspirin therapy as patients are at low risk for ASCVD; therefore, aspirin therapy is likely inappropriate in this patient population. These patients may be unnecessarily at an increased risk for bleeding and may benefit from deprescribing aspirin. For the safety of patients, HCPs should be continuously assessing the appropriateness of aspirin for primary prevention and deprescribing when necessary.
About one-third of the patients using aspirin for primary prevention were followed by a pharmacist. Pharmacists can play a key role in deprescribing aspirin for primary prevention when aspirin use is deemed inappropriate. About 30% of the total patient population in this study was on aspirin for primary prevention with possible ASCVD risk. This patient population may benefit from aspirin therapy as they are at a higher risk for ASCVD. For these patients, a risk/benefit discussion is necessary to determine the appropriateness of aspirin for primary prevention. This risk/benefit discussion should be a continuous conversation between patients and HCPs as different factors such as age and changes in comorbid conditions and medications may increase bleeding risk.
The secondary endpoint focused on patients taking aspirin for primary prevention and the factors that may warrant deprescribing aspirin. The most common factors seen in this study included patients who were aged > 70 years, patients who were concurrently taking medications that may increase bleeding risk, and patients with CKD. All of these factors increase bleeding risk, making the risks potentially outweigh the benefits of aspirin for primary prevention. These factors should be the primary focus when assessing patients on aspirin for primary prevention to promote deprescribing aspirin if deemed appropriate as they were the most prevalent in this study.
The safety endpoints focused on bleeding events as a whole as well as the bleeding events seen in the primary prevention group. There were 2 major bleeding events and 20 minor bleeding events in the primary prevention group. The number of bleeding events both major and minor further shows the need for a continuous risk/benefit discussion between patients and HCPs on continued aspirin use for primary prevention. The bleeding risk with aspirin is prevalent. HCPs should continue to assess for factors that increase the bleeding risk that may warrant deprescribing aspirin to prevent future bleeding events in this patient population.
Strengths and Limitations
As there have been recent updates to guidelines on the use of aspirin for primary prevention, a strength of this study is that it evaluates a topic that is relevant in health care. Another strength of this study is that it focuses on specific patient factors that HCPs can assess when determining whether aspirin for primary prevention is appropriate in their patients. These specific patient factors can also be used as a guide to help HCPs deprescribe aspirin for primary prevention when appropriate.
One of the limitations of this study is that bleeding events that occurred outside of the FHCC were unable to be assessed unless the HCP specifically commented on the bleeding event in the chart. This could potentially underestimate the bleeding events seen in this study. Another limitation is that the bleeding risk for patients who were not on aspirin was not assessed. There was no comparison group to ascertain whether the bleeding risk was higher in the aspirin group compared with a no aspirin group. However, many of the major clinical trials saw an increased risk of bleeding in the aspirin group compared with placebo.
Conclusions
Aspirin therapy for secondary prevention remains an important part of treatment. Aspirin therapy for primary prevention may be appropriate for patients with a possible ASCVD risk. The therapy may be inappropriate in cases where patients have an increased bleeding risk and low or no ASCVD risk. It is important to continuously assess the need for aspirin therapy for patients in the setting of primary prevention. Common factors seen in this study to warrant deprescribing aspirin for primary prevention include patients aged > 70 years, concurrent use of medications that increase bleeding risk, and patients with CKD. By assessing ASCVD risk as well as bleeding risk and having a risk/benefit discussion between the HCP and patient, aspirin used for primary prevention can be appropriately deprescribed when the risks of bleeding outweigh the benefits.
Acknowledgments
The authors thank the Captain James A. Lovell Federal Health Care Center research committee (Hong-Yen Vi, PharmD, BCPS; Shaiza Khan, PharmD, BCPS; Yinka Alaka, BPharm, PharmD; Jennifer Kwon, PharmD, BCOP) and coinvestigator Aeman Choudhury, PharmD, BCPS, BCACP.
1. Warner TD, Nylander S, Whatling C. Anti-platelet therapy: cyclo-oxygenase inhibition and the use of aspirin with particular regard to dual anti-platelet therapy. Br J Clin Pharmacol. 2011;72(4):619-633. doi:10.1111/j.1365-2125.2011.03943.x
2. ASCEND Study Collaborative Group, Bowman L, Mafham M, et al. Effects of aspirin for primary prevention in persons with diabetes mellitus. N Engl J Med. 2018;379(16):1529-1539. doi:10.1056/NEJMoa1804988
3. Gaziano JM, Brotons C, Coppolecchia R, et al. Use of aspirin to reduce risk of initial vascular events in patients at moderate risk of cardiovascular disease (ARRIVE): a randomised, double-blind, placebo-controlled trial. Lancet. 2018;392(10152):1036-1046. doi:10.1016/S0140-6736(18)31924-X
4. McNeil JJ, Wolfe R, Woods RL, et al. Effect of aspirin on cardiovascular events and bleeding in the healthy elderly. N Engl J Med. 2018;379(16):1509-1518. doi:10.1056/NEJMoa1805819
5. US Preventive Services Task Force, Davidson KW, Barry MJ, et al. Aspirin use to prevent cardiovascular disease: US Preventive Services Task Force Recommendation Statement. JAMA. 2022;327(16):1577-1584. doi:10.1001/jama.2022.4983
6. Murphy E, McEvoy JW. Does stopping aspirin differ fundamentally from not starting aspirin in the primary prevention of cardiovascular disease among older adults? Ann Intern Med. 2022;175(5):757-758. doi:10.7326/M22-0550
7. Schulman S, Kearon C; Subcommittee on Control of Anticoagulation of the Scientific and Standardization Committee of the International Society on Thrombosis and Haemostasis. Definition of major bleeding in clinical investigations of antihemostatic medicinal products in non-surgical patients. J Thromb Haemost. 2005;3(4):692-694. doi:10.1111/j.1538-7836.2005.01204.
Dermatology Articles in Preprint Servers: A Cross-sectional Study
To the Editor:
Preprint servers allow researchers to post manuscripts before publication in peer-reviewed journals. As of January 2022, 41 public preprint servers accepted medicine/science submissions.1 We sought to analyze characteristics of dermatology manuscripts in preprint servers and assess preprint publication policies in top dermatology journals.
Thirty-five biology/health sciences preprint servers1 were searched (March 3 to March 24, 2021) with keywords dermatology, skin, and cutaneous. Preprint server, preprint post date, location, metrics, journal, impact factor (IF), and journal publication date were recorded. Preprint policies of the top 20 dermatology journals—determined by impact factor of the journal (https://www.scimagojr.com/)—were reviewed. Two-tailed t tests and χ2 tests were performed (P<.05).

A total of 1420 articles were posted to 11 preprint servers between June 20, 2007, and February 15, 2021 (Table 1); 377 (27%) were published in peer-reviewed journals, with 350 (93%) of those published within 1 year of preprint post. Preprints were published in 203 journals with a mean IF of 6.2. Growth in preprint posts by year (2007-2020) was exponential (R2=0.78)(Figure). On average, preprints were viewed 424 times (Table 2), with published preprints viewed more often than unpublished preprints (596 vs 362 views)(P<.001). Only 23 of 786 (3%) preprints with comments enabled had feedback. Among the top 20 dermatology journals, 18 (90%) allowed preprints, 1 (5%) evaluated case by case, and 1 (5%) prohibited preprints.

Our study showed exponential growth in dermatology preprints, a low proportion published in peer-reviewed journals with high IFs, and a substantial number of page views for both published and unpublished preprints. Very few preprints had feedback. We found that most of the top 20 dermatology journals accept preprints. An analysis of 61 dermatology articles in medRxiv found only 51% (31/61) of articles were subsequently published.2 The low rate of publication may be due to the quality of preprints that do not meet criteria to be published following peer review.

Preprint servers are fairly novel, with a majority launched within the last 5 years.1 The goal of preprints is to claim conception of an idea, solicit feedback prior to submission for peer review, and expedite research distribution.3 Because preprints are uploaded without peer review, manuscripts may lack quality and accuracy. An analysis of 57 of thelargest preprint servers found that few provided guidelines on authorship, image manipulation, or reporting of study limitations; however, most preprint servers do perform some screening.4 medRxiv requires full scientific research reports and absence of obscenity, plagiarism, and patient identifiers. In its first year, medRxiv rejected 34% of 176 submissios; reasons were not disclosed.5
The low rate of on-site comments suggests that preprint servers may not be effective for obtaining feedback to improve dermatology manuscripts prior to journal submission. Almost all of the top 20 dermatologyjournals accept preprints. Therefore, dermatologists may use these preprint servers to assert project ideas and disseminate research quickly and freely but may not receive constructive criticism.
Our study is subject to several limitations. Although our search was extensive, it is possible manuscripts were missed. Article metrics also were not available on all servers, and we could not account for accepted articles that were not yet indexed.
There has been a surge in posting of dermatology preprints in recent years. Preprints have not been peer reviewed, and data should be corroborated before incorporating new diagnostics or treatments into clinical practice. Utilization of preprint servers by dermatologists is increasing, but because the impact is still unknown, further studies on accuracy and reliability of preprints are warranted.
1. List of preprint servers: policies and practices across platforms. ASAPbio website. Accessed January 25, 2023. https://asapbio.org/preprint-servers
2. Jia JL, Hua VJ, Sarin KY. Journal attitudes and outcomes of preprints in dermatology. Br J Dermatol. 2021;185:230-232.
3. Chiarelli A, Johnson R, Richens E, et al. Accelerating scholarly communication: the transformative role of preprints. Copyright, Fair Use, Scholarly Communication, etc. 127. September 20, 2019. Accessed January 18, 2023. https://digitalcommons.unl.edu/cgi/viewcontent.cgi?article=1128&context=scholcom
4. Malicki M, Jeroncic A, Riet GT, et al. Preprint servers’ policies, submission requirements, and transparency in reporting and research integrity recommendations. JAMA. 2020;324:1901-1903.
5. Krumholz HM, Bloom T, Sever R, et al. Submissions and downloads of preprints in the first year of medRxiv. JAMA. 2020;324:1903-1905.
To the Editor:
Preprint servers allow researchers to post manuscripts before publication in peer-reviewed journals. As of January 2022, 41 public preprint servers accepted medicine/science submissions.1 We sought to analyze characteristics of dermatology manuscripts in preprint servers and assess preprint publication policies in top dermatology journals.
Thirty-five biology/health sciences preprint servers1 were searched (March 3 to March 24, 2021) with keywords dermatology, skin, and cutaneous. Preprint server, preprint post date, location, metrics, journal, impact factor (IF), and journal publication date were recorded. Preprint policies of the top 20 dermatology journals—determined by impact factor of the journal (https://www.scimagojr.com/)—were reviewed. Two-tailed t tests and χ2 tests were performed (P<.05).
A total of 1420 articles were posted to 11 preprint servers between June 20, 2007, and February 15, 2021 (Table 1); 377 (27%) were published in peer-reviewed journals, with 350 (93%) of those published within 1 year of preprint post. Preprints were published in 203 journals with a mean IF of 6.2. Growth in preprint posts by year (2007-2020) was exponential (R2=0.78)(Figure). On average, preprints were viewed 424 times (Table 2), with published preprints viewed more often than unpublished preprints (596 vs 362 views)(P<.001). Only 23 of 786 (3%) preprints with comments enabled had feedback. Among the top 20 dermatology journals, 18 (90%) allowed preprints, 1 (5%) evaluated case by case, and 1 (5%) prohibited preprints.
Our study showed exponential growth in dermatology preprints, a low proportion published in peer-reviewed journals with high IFs, and a substantial number of page views for both published and unpublished preprints. Very few preprints had feedback. We found that most of the top 20 dermatology journals accept preprints. An analysis of 61 dermatology articles in medRxiv found only 51% (31/61) of articles were subsequently published.2 The low rate of publication may be due to the quality of preprints that do not meet criteria to be published following peer review.
Preprint servers are fairly novel, with a majority launched within the last 5 years.1 The goal of preprints is to claim conception of an idea, solicit feedback prior to submission for peer review, and expedite research distribution.3 Because preprints are uploaded without peer review, manuscripts may lack quality and accuracy. An analysis of 57 of thelargest preprint servers found that few provided guidelines on authorship, image manipulation, or reporting of study limitations; however, most preprint servers do perform some screening.4 medRxiv requires full scientific research reports and absence of obscenity, plagiarism, and patient identifiers. In its first year, medRxiv rejected 34% of 176 submissios; reasons were not disclosed.5
The low rate of on-site comments suggests that preprint servers may not be effective for obtaining feedback to improve dermatology manuscripts prior to journal submission. Almost all of the top 20 dermatologyjournals accept preprints. Therefore, dermatologists may use these preprint servers to assert project ideas and disseminate research quickly and freely but may not receive constructive criticism.
Our study is subject to several limitations. Although our search was extensive, it is possible manuscripts were missed. Article metrics also were not available on all servers, and we could not account for accepted articles that were not yet indexed.
There has been a surge in posting of dermatology preprints in recent years. Preprints have not been peer reviewed, and data should be corroborated before incorporating new diagnostics or treatments into clinical practice. Utilization of preprint servers by dermatologists is increasing, but because the impact is still unknown, further studies on accuracy and reliability of preprints are warranted.
1. List of preprint servers: policies and practices across platforms. ASAPbio website. Accessed January 25, 2023. https://asapbio.org/preprint-servers
2. Jia JL, Hua VJ, Sarin KY. Journal attitudes and outcomes of preprints in dermatology. Br J Dermatol. 2021;185:230-232.
3. Chiarelli A, Johnson R, Richens E, et al. Accelerating scholarly communication: the transformative role of preprints. Copyright, Fair Use, Scholarly Communication, etc. 127. September 20, 2019. Accessed January 18, 2023. https://digitalcommons.unl.edu/cgi/viewcontent.cgi?article=1128&context=scholcom
4. Malicki M, Jeroncic A, Riet GT, et al. Preprint servers’ policies, submission requirements, and transparency in reporting and research integrity recommendations. JAMA. 2020;324:1901-1903.
5. Krumholz HM, Bloom T, Sever R, et al. Submissions and downloads of preprints in the first year of medRxiv. JAMA. 2020;324:1903-1905.
PRACTICE POINTS
- Preprint servers allow researchers to post manuscripts before publication in peer-reviewed journals.
- The low rate of on-site comments suggests that preprint servers may not be effective for obtaining feedback to improve dermatology manuscripts prior to journal submission; therefore, dermatologists may use these servers to disseminate research quickly and freely but may not receive constructive criticism.
- Preprints have not been peer reviewed, and data should be corroborated before incorporating new diagnostics or treatments into clinical practice.