User login
Therapeutic Hypothermia in Cardiac Arrest
Mortality data estimates that there are about 400,000 to 460,000 sudden cardiac deaths (SCD) in the United States.1 In resuscitated cardiac arrest patients, morbidity and mortality remains high due to cerebral ischemic anoxia. Currently it is believed that following return of spontaneous circulation (ROSC) from successful resuscitation, secondary inflammatory responses characterized by the generation of chemical mediators and free radicals, as well as increased microvascular permeability, lead to further brain injury.2 Recently, 2 randomized controlled trials (RCT) showed that induced mild hypothermia (32C‐34C) in comatose patients after out‐of‐hospital cardiac arrest leads to improved neurologic outcomes and survival.3, 4 In 2002, the International Liaison Committee on Resuscitation (ILCOR) recommended induced mild hypothermia for the management of comatose patients with ROSC after cardiac arrest.5 Despite the recommendations by ILCOR and the supporting body of evidence proving the benefit of therapeutic hypothermia after cardiac arrest, this treatment remains underused.68
We present a case series of 8 cardiac arrest survivors treated using a hypothermia protocol at a community hospital.
TREATMENT PROTOCOL
Between June 2006 and December 2006, 8 patients presented to Unity Hospital, (a 200‐bed community teaching hospital with a 20‐bed intensive care unit [ICU]) in coma following cardiac arrest with ROSC after resuscitation. All the patients were managed using therapeutic hypothermia.
The hospital protocol, developed using the ILCOR guidelines, was used on all patients. The aim was to achieve a core temperature of 32C to 34C within 6 to 8 hours and maintain this for 24 hours from the start of cooling. The inclusion criteria were as follows: (1) coma within a 6‐hour postcardiac arrest window preceded by either ventricular fibrillation (VF), pulseless ventricular tachycardia, pulseless electrical activity, or asystole; (2) ability to maintain a blood pressure with or without pressors and/or fluid volume resuscitation after cardiopulmonary resuscitation; and (3) comatose at the time of cooling. The exclusion criteria were as follows: (1) coma from drug overdose, head trauma, stroke, or overt status epilepticus; (2) pregnancy; (3) temperature of 30C; (4) recent major surgery within 14 days; (5) systemic infections; (6) patients with known terminal illness; (7) Glasgow coma scale (GCS) of 10 and above; or (8) known bleeding diathesis or ongoing bleeding.
The Advanced Cardiac Life Support (ACLS) protocol was implemented in both in‐hospital and out‐of‐hospital cardiac arrests. The decision to initiate the protocol was made by the intensivist; however, in out‐of‐hospital cardiac arrest, the decision was taken in conjunction with the emergency room physician. A bladder temperature probe was used to monitor core body temperature. Cooling was achieved using iced saline gastric lavage and ice packs to the patient's neck, axillae, and groin while a cooling blanket (Mul‐T‐Blanket; Gaymar Industries, New York) was placed over and beneath the patient. In some cases, a Blanketrol cooling machine (Blanketrol II; CSZ Products, Inc., Cincinnati, OH) was used when available. All patients were maintained at a PaO2 above 90 mm Hg and PaCO2 around 35 mm Hg. Cisatacurium and midazolam were used to control shivering. Regular insulin intravenous drip was used to maintain tight blood glucose control (target blood glucose level of 140 mg/dL) when necessary. Target systolic and mean arterial blood pressures were 90 mm Hg and 80 mm Hg, respectively. Potassium was replaced to 3.4 mmol/L but not within 8 hours of commencing rewarming. Rewarming was started after 24 hours at a rate of not more than 1C in 4 hours. Clinical and laboratory parameters were continuously recorded and all patients were evaluated for complications, including electrolyte imbalance, cardiac arrhythmias, and seizures.
CASES
Table 1 summarizes all the cases. There were 4 men and 4 women. The mean age was 70 14 years (range, 44‐88 years). The main comorbidities were coronary artery disease (n = 6), hypertension (n = 5), diabetes mellitus (n = 5), and chronic or recurrent cardiac arrhythmia (n = 4). Cardiac arrest occurred out‐of‐hospital in 5 of 8 patients and was witnessed in 6 of the 8 cases. Ventricular fibrillation (VF) was the initial presenting rhythm in 5 of the 8 cases. The mean time from ROSC to initiation of cooling was 3 1.6 hours. The mean time from ROSC and attaining target temperature (34C) was 8.1 4.7 hours. The mean duration of cooling (initiation of cooling to onset of rewarming) was 23.8 0.6 hours. The mean duration at which target temperature was maintained (attainment of 32C‐34C to onset of rewarming) was 18.6 4.6 hours. The median time from onset of passive rewarming to attaining temperature of 36C was 7.25 hours. Two patients survived and were discharged to home (Patients B and C). Patient B had mild cognitive deficits on discharge.
| Patients | Age (Years) | Sex | Comorbidities | Location at the Time of Arrest | Witnessed Arrest? | Initial Rhythm | Time of Collapse to ROSC | Presenting GCS | Time from ROSC to Cooling Initiation (Hours) | Time from ROSC to Target Temperature of 34C (Hours) | Duration of Cooling (Cooling Initiation to Rewarming) (Hours) | Duration of Target Temperature Maintenance (Hours) | Onset of Passive Rewarming to Attainment of Temperature of >36C (Hours) | Complications by Day 5 | Outcome at Discharge |
|---|---|---|---|---|---|---|---|---|---|---|---|---|---|---|---|
| |||||||||||||||
| A | 64 | M | DM, CAD, SSS, PTCA, PM, CHF, COPD | OOH | Yes | VF | 8 min | 3 | 1.7 | 1.7 | 16.9 | 24 | 6 | Pneumonia, hypokalemia, seizures | Death |
| B | 43 | F | Mitral valve prolapse | OOH | Yes | VF | 12 min | 5 | 6.3 | 5.3 | 12.0 | 24 | 7 | Hypokalemia | Good recovery |
| C | 64 | M | CAD, CABG | IH | No | VF | 7 min | 5 | 1.4 | 1.5 | 10.0 | 24 | 7.5 | Good recovery | |
| D | 76 | F | DM, HTN, CAD, PM | OOH | Yes | PEA | 36 min | 6 | 1.7 | 1.6 | 4.2 | 24 | 5 | Hypokalemia | Death |
| E | 88 | F | DM, HTN, CAD, AFIB, CHF, COPD | IH | Yes | Asystole | 6 min | 3 | 1.9 | 4.9 | 5.2 | 22.2 | 9.3 | Hypokalemia, elevated creatinine | Death |
| F | 70 | F | DM, HTN, CABG, PTCA, COPD | OOH | Yes | VF | 15 min | 5 | 1.4 | 2.1 | 5.6 | 18.3 | 3 | Seizures | Death |
| G | 71 | M | CAD, CABG, AICD | OOH | No | VF | >20 min | 3 | 4.7 | 4.6 | 6.7 | 22.5 | 12.3 | Hypokalemia, elevated creatinine, VT and VF | Death |
| H | 82 | M | HTN, CAD, AFIB, CHF | IH | Yes | Asystole | 19 min | 3 | 2.8 | 2.5 | 4.3 | 22.5 | 51 | Elevated creatinine | Death |
DISCUSSION
There is substantial clinical and public health concern over increasing incidence of sudden cardiac deaths despite decreasing overall mortality from coronary heart disease.6
Supportive management has been the norm for comatose patients following cardiac arrest until recently, when induced hypothermia was shown to have favorable outcomes in 2 landmark prospective RCTs.3, 4 Supportive management often led to prolonged unconsciousness due to severe anoxic brain injury, which eventually led to high morbidity and mortality rates.9, 10 The Hypothermia after Cardiac Arrest Study Group (HACA) study4 revealed that 6 patients would need to be treated with therapeutic hypothermia to prevent an adverse neurologic outcome, while 7 patients would need to be treated to prevent 1 death. Other authors have reported improved outcomes with induced hypothermia used in patients resuscitated following cardiac arrest.1114
Despite strong and encouraging evidence, therapeutic hypothermia has not been readily accepted into daily clinical critical care practice.68 In an Internet‐based survey of physicians by Abella et al.,6 87% of respondents (comprised of emergency medicine and critical care physicians, and cardiologists) had not used this treatment modality following cardiac arrest. Reasons given by most physicians included insufficient data to support the use of therapeutic hypothermia, technical difficulties including the immense amount of resources required, as well as inadequate training. Merchant et al.,7 using an Internet‐based survey also sought to ascertain the degree of therapeutic hypothermia use from physicians in the United States, the United Kingdom, Australia, and Finland. They found that 74% of respondents in the United States and 64% of respondents outside of the United States were yet to use induced therapeutic hypothermia. Factors predicting the use of therapeutic hypothermia by physicians were found to include practice in an academic hospital with more than 250 beds, critical care specialty training, and location of the hospital outside of the United States. Similarly, the major reasons given for nonutilization of therapeutic hypothermia in this study include lack of supportive data and technical difficulties. In yet another study by Laver et al.,8 73% of respondents (ICUs in the United Kingdom) revealed that therapeutic hypothermia after cardiac arrest had not been used in their service. They also gave the same reasons for nonusage as in the aforementioned studies.
In this case series we have presented our experience with therapeutic hypothermia in comatose patients following cardiac arrest. Evaluation of our cooling process compares favorably with the findings of the HACA study4: In our study, the mean time from ROSC to cooling initiation was 180 66 minutes compared to a median of 105 minutes (interquartile range, 61192 minutes) in the HACA study; mean time between ROSC and attaining target temperature was 8.1 4.7 hours in our study compared to a median of 8 hours in the HACA study; mean duration of cooling in our study was 23.8 0.6 hours compared to a median of 24 hours in the HACA study; target temperature was maintained for a mean duration of 18.6 4.6 hours in our study compared to a median of 24 hours in the HACA study; and last, median time from passive rewarming to attainment of temperature greater than 36C in our study was 7.25 hours compared to 8 hours in the HACA study.
There were few complications observed in this case series. These include hypokalemia, mildly elevated creatinine levels, and seizures. One patient developed pneumonia. Other potential complications of therapeutic hypothermia include cardiac arrhythmias, sepsis, hyperglycemia, coagulopathy, acid‐base disturbances, and electrolyte imbalance.15 The studies by Bernard et al.3 and the HACA;4 however, revealed no clinically significant unfavorable outcomes in the patients randomized to receive hypothermia treatment.
Our experience based on this case series leads us to conclude that therapeutic hypothermia is feasible in the community hospital setting. In our 200‐bed community teaching hospital, a multidisciplinary approach involving intensivists, emergency room physicians, internists, residents, and nursing staff lessens the technical difficulties associated with implementing a seemingly cumbersome yet inexpensive and effective treatment modality. Therapeutic hypothermia should be considered in appropriate patients in coma after resuscitation from cardiac arrest.
- Centers for Disease Control and Prevention.State specific mortality data from sudden cardiac death—United States, 1999.MMWR Morb Mortal Wkly Rep.2002;51(6):123– 126.
- .Bench to bedside: brain edema and cerebral resuscitation: the present and future.Acad Emerg Med.2002;9(9):933–946.
- ,,, et al.Treatment of comatose survivors of out of hospital cardiac arrest with induced hypothermia.N Engl J Med.2002;346(8):557–563.
- Hypothermia after Cardiac Arrest Study Group.Mild therapeutic hypothermia to improve the neurologic outcome after cardiac arrest.N Engl J Med.2002;346(8):549–556.
- Therapeutic hypothermia after cardiac arrest: an advisory statement by the Advanced Life Support Task Force of the International Liaison Committee on Resuscitation.Circulation.2003;108:118–121.
- ,,, et al.Induced hypothermia is underused after resuscitation from cardiac arrest: a current practice survey.Resuscitation.2005;64:181–186.
- ,,, et al.Therapeutic hypothermia utilization among physicians after resuscitation from cardiac arrest.Crit Care Med.2006;34(7):1935–1940.
- ,,, et al.Therapeutic hypothermia after cardiac arrest: a survey of practice in intensive care units in the United Kingdom.Anaesthesia2006;61:873–877.
- .Hypothermia improves outcome from cardiac arrest.Crit Care Resusc.2005;7(4):325–327.
- ,,.Sudden cardiac death: epidemiology, transient risk, and intervention assessment.Ann Intern Med.1993;119(12):1187–1197.
- ,,, et al.Mild hypothermia induced by a helmet device: a clinical feasibility study.Resuscitation.2001;51:275–281.
- ,,, et al.Implementation of a standardized treatment protocol for post resuscitation care after out‐of‐hospital cardiac arrest.Resuscitation.2007;73(1):29–39.
- ,,,.Induced hypothermia following out‐of‐hospital cardiac arrest; initial experience in a community hospital.Clin Cardiol.2006;29(12):525–529.
- ,,,,.From evidence to clinical practice: effective implementation of therapeutic hypothermia to improve patient outcome after cardiac arrest.Crit Care Med.2006;34(7):1865–1873.
- ,.Induced hypothermia in critical care medicine: a review.Crit Care Med.2003;31(7):2041–2051.
Mortality data estimates that there are about 400,000 to 460,000 sudden cardiac deaths (SCD) in the United States.1 In resuscitated cardiac arrest patients, morbidity and mortality remains high due to cerebral ischemic anoxia. Currently it is believed that following return of spontaneous circulation (ROSC) from successful resuscitation, secondary inflammatory responses characterized by the generation of chemical mediators and free radicals, as well as increased microvascular permeability, lead to further brain injury.2 Recently, 2 randomized controlled trials (RCT) showed that induced mild hypothermia (32C‐34C) in comatose patients after out‐of‐hospital cardiac arrest leads to improved neurologic outcomes and survival.3, 4 In 2002, the International Liaison Committee on Resuscitation (ILCOR) recommended induced mild hypothermia for the management of comatose patients with ROSC after cardiac arrest.5 Despite the recommendations by ILCOR and the supporting body of evidence proving the benefit of therapeutic hypothermia after cardiac arrest, this treatment remains underused.68
We present a case series of 8 cardiac arrest survivors treated using a hypothermia protocol at a community hospital.
TREATMENT PROTOCOL
Between June 2006 and December 2006, 8 patients presented to Unity Hospital, (a 200‐bed community teaching hospital with a 20‐bed intensive care unit [ICU]) in coma following cardiac arrest with ROSC after resuscitation. All the patients were managed using therapeutic hypothermia.
The hospital protocol, developed using the ILCOR guidelines, was used on all patients. The aim was to achieve a core temperature of 32C to 34C within 6 to 8 hours and maintain this for 24 hours from the start of cooling. The inclusion criteria were as follows: (1) coma within a 6‐hour postcardiac arrest window preceded by either ventricular fibrillation (VF), pulseless ventricular tachycardia, pulseless electrical activity, or asystole; (2) ability to maintain a blood pressure with or without pressors and/or fluid volume resuscitation after cardiopulmonary resuscitation; and (3) comatose at the time of cooling. The exclusion criteria were as follows: (1) coma from drug overdose, head trauma, stroke, or overt status epilepticus; (2) pregnancy; (3) temperature of 30C; (4) recent major surgery within 14 days; (5) systemic infections; (6) patients with known terminal illness; (7) Glasgow coma scale (GCS) of 10 and above; or (8) known bleeding diathesis or ongoing bleeding.
The Advanced Cardiac Life Support (ACLS) protocol was implemented in both in‐hospital and out‐of‐hospital cardiac arrests. The decision to initiate the protocol was made by the intensivist; however, in out‐of‐hospital cardiac arrest, the decision was taken in conjunction with the emergency room physician. A bladder temperature probe was used to monitor core body temperature. Cooling was achieved using iced saline gastric lavage and ice packs to the patient's neck, axillae, and groin while a cooling blanket (Mul‐T‐Blanket; Gaymar Industries, New York) was placed over and beneath the patient. In some cases, a Blanketrol cooling machine (Blanketrol II; CSZ Products, Inc., Cincinnati, OH) was used when available. All patients were maintained at a PaO2 above 90 mm Hg and PaCO2 around 35 mm Hg. Cisatacurium and midazolam were used to control shivering. Regular insulin intravenous drip was used to maintain tight blood glucose control (target blood glucose level of 140 mg/dL) when necessary. Target systolic and mean arterial blood pressures were 90 mm Hg and 80 mm Hg, respectively. Potassium was replaced to 3.4 mmol/L but not within 8 hours of commencing rewarming. Rewarming was started after 24 hours at a rate of not more than 1C in 4 hours. Clinical and laboratory parameters were continuously recorded and all patients were evaluated for complications, including electrolyte imbalance, cardiac arrhythmias, and seizures.
CASES
Table 1 summarizes all the cases. There were 4 men and 4 women. The mean age was 70 14 years (range, 44‐88 years). The main comorbidities were coronary artery disease (n = 6), hypertension (n = 5), diabetes mellitus (n = 5), and chronic or recurrent cardiac arrhythmia (n = 4). Cardiac arrest occurred out‐of‐hospital in 5 of 8 patients and was witnessed in 6 of the 8 cases. Ventricular fibrillation (VF) was the initial presenting rhythm in 5 of the 8 cases. The mean time from ROSC to initiation of cooling was 3 1.6 hours. The mean time from ROSC and attaining target temperature (34C) was 8.1 4.7 hours. The mean duration of cooling (initiation of cooling to onset of rewarming) was 23.8 0.6 hours. The mean duration at which target temperature was maintained (attainment of 32C‐34C to onset of rewarming) was 18.6 4.6 hours. The median time from onset of passive rewarming to attaining temperature of 36C was 7.25 hours. Two patients survived and were discharged to home (Patients B and C). Patient B had mild cognitive deficits on discharge.
| Patients | Age (Years) | Sex | Comorbidities | Location at the Time of Arrest | Witnessed Arrest? | Initial Rhythm | Time of Collapse to ROSC | Presenting GCS | Time from ROSC to Cooling Initiation (Hours) | Time from ROSC to Target Temperature of 34C (Hours) | Duration of Cooling (Cooling Initiation to Rewarming) (Hours) | Duration of Target Temperature Maintenance (Hours) | Onset of Passive Rewarming to Attainment of Temperature of >36C (Hours) | Complications by Day 5 | Outcome at Discharge |
|---|---|---|---|---|---|---|---|---|---|---|---|---|---|---|---|
| |||||||||||||||
| A | 64 | M | DM, CAD, SSS, PTCA, PM, CHF, COPD | OOH | Yes | VF | 8 min | 3 | 1.7 | 1.7 | 16.9 | 24 | 6 | Pneumonia, hypokalemia, seizures | Death |
| B | 43 | F | Mitral valve prolapse | OOH | Yes | VF | 12 min | 5 | 6.3 | 5.3 | 12.0 | 24 | 7 | Hypokalemia | Good recovery |
| C | 64 | M | CAD, CABG | IH | No | VF | 7 min | 5 | 1.4 | 1.5 | 10.0 | 24 | 7.5 | Good recovery | |
| D | 76 | F | DM, HTN, CAD, PM | OOH | Yes | PEA | 36 min | 6 | 1.7 | 1.6 | 4.2 | 24 | 5 | Hypokalemia | Death |
| E | 88 | F | DM, HTN, CAD, AFIB, CHF, COPD | IH | Yes | Asystole | 6 min | 3 | 1.9 | 4.9 | 5.2 | 22.2 | 9.3 | Hypokalemia, elevated creatinine | Death |
| F | 70 | F | DM, HTN, CABG, PTCA, COPD | OOH | Yes | VF | 15 min | 5 | 1.4 | 2.1 | 5.6 | 18.3 | 3 | Seizures | Death |
| G | 71 | M | CAD, CABG, AICD | OOH | No | VF | >20 min | 3 | 4.7 | 4.6 | 6.7 | 22.5 | 12.3 | Hypokalemia, elevated creatinine, VT and VF | Death |
| H | 82 | M | HTN, CAD, AFIB, CHF | IH | Yes | Asystole | 19 min | 3 | 2.8 | 2.5 | 4.3 | 22.5 | 51 | Elevated creatinine | Death |
DISCUSSION
There is substantial clinical and public health concern over increasing incidence of sudden cardiac deaths despite decreasing overall mortality from coronary heart disease.6
Supportive management has been the norm for comatose patients following cardiac arrest until recently, when induced hypothermia was shown to have favorable outcomes in 2 landmark prospective RCTs.3, 4 Supportive management often led to prolonged unconsciousness due to severe anoxic brain injury, which eventually led to high morbidity and mortality rates.9, 10 The Hypothermia after Cardiac Arrest Study Group (HACA) study4 revealed that 6 patients would need to be treated with therapeutic hypothermia to prevent an adverse neurologic outcome, while 7 patients would need to be treated to prevent 1 death. Other authors have reported improved outcomes with induced hypothermia used in patients resuscitated following cardiac arrest.1114
Despite strong and encouraging evidence, therapeutic hypothermia has not been readily accepted into daily clinical critical care practice.68 In an Internet‐based survey of physicians by Abella et al.,6 87% of respondents (comprised of emergency medicine and critical care physicians, and cardiologists) had not used this treatment modality following cardiac arrest. Reasons given by most physicians included insufficient data to support the use of therapeutic hypothermia, technical difficulties including the immense amount of resources required, as well as inadequate training. Merchant et al.,7 using an Internet‐based survey also sought to ascertain the degree of therapeutic hypothermia use from physicians in the United States, the United Kingdom, Australia, and Finland. They found that 74% of respondents in the United States and 64% of respondents outside of the United States were yet to use induced therapeutic hypothermia. Factors predicting the use of therapeutic hypothermia by physicians were found to include practice in an academic hospital with more than 250 beds, critical care specialty training, and location of the hospital outside of the United States. Similarly, the major reasons given for nonutilization of therapeutic hypothermia in this study include lack of supportive data and technical difficulties. In yet another study by Laver et al.,8 73% of respondents (ICUs in the United Kingdom) revealed that therapeutic hypothermia after cardiac arrest had not been used in their service. They also gave the same reasons for nonusage as in the aforementioned studies.
In this case series we have presented our experience with therapeutic hypothermia in comatose patients following cardiac arrest. Evaluation of our cooling process compares favorably with the findings of the HACA study4: In our study, the mean time from ROSC to cooling initiation was 180 66 minutes compared to a median of 105 minutes (interquartile range, 61192 minutes) in the HACA study; mean time between ROSC and attaining target temperature was 8.1 4.7 hours in our study compared to a median of 8 hours in the HACA study; mean duration of cooling in our study was 23.8 0.6 hours compared to a median of 24 hours in the HACA study; target temperature was maintained for a mean duration of 18.6 4.6 hours in our study compared to a median of 24 hours in the HACA study; and last, median time from passive rewarming to attainment of temperature greater than 36C in our study was 7.25 hours compared to 8 hours in the HACA study.
There were few complications observed in this case series. These include hypokalemia, mildly elevated creatinine levels, and seizures. One patient developed pneumonia. Other potential complications of therapeutic hypothermia include cardiac arrhythmias, sepsis, hyperglycemia, coagulopathy, acid‐base disturbances, and electrolyte imbalance.15 The studies by Bernard et al.3 and the HACA;4 however, revealed no clinically significant unfavorable outcomes in the patients randomized to receive hypothermia treatment.
Our experience based on this case series leads us to conclude that therapeutic hypothermia is feasible in the community hospital setting. In our 200‐bed community teaching hospital, a multidisciplinary approach involving intensivists, emergency room physicians, internists, residents, and nursing staff lessens the technical difficulties associated with implementing a seemingly cumbersome yet inexpensive and effective treatment modality. Therapeutic hypothermia should be considered in appropriate patients in coma after resuscitation from cardiac arrest.
- Centers for Disease Control and Prevention.State specific mortality data from sudden cardiac death—United States, 1999.MMWR Morb Mortal Wkly Rep.2002;51(6):123– 126.
- .Bench to bedside: brain edema and cerebral resuscitation: the present and future.Acad Emerg Med.2002;9(9):933–946.
- ,,, et al.Treatment of comatose survivors of out of hospital cardiac arrest with induced hypothermia.N Engl J Med.2002;346(8):557–563.
- Hypothermia after Cardiac Arrest Study Group.Mild therapeutic hypothermia to improve the neurologic outcome after cardiac arrest.N Engl J Med.2002;346(8):549–556.
- Therapeutic hypothermia after cardiac arrest: an advisory statement by the Advanced Life Support Task Force of the International Liaison Committee on Resuscitation.Circulation.2003;108:118–121.
- ,,, et al.Induced hypothermia is underused after resuscitation from cardiac arrest: a current practice survey.Resuscitation.2005;64:181–186.
- ,,, et al.Therapeutic hypothermia utilization among physicians after resuscitation from cardiac arrest.Crit Care Med.2006;34(7):1935–1940.
- ,,, et al.Therapeutic hypothermia after cardiac arrest: a survey of practice in intensive care units in the United Kingdom.Anaesthesia2006;61:873–877.
- .Hypothermia improves outcome from cardiac arrest.Crit Care Resusc.2005;7(4):325–327.
- ,,.Sudden cardiac death: epidemiology, transient risk, and intervention assessment.Ann Intern Med.1993;119(12):1187–1197.
- ,,, et al.Mild hypothermia induced by a helmet device: a clinical feasibility study.Resuscitation.2001;51:275–281.
- ,,, et al.Implementation of a standardized treatment protocol for post resuscitation care after out‐of‐hospital cardiac arrest.Resuscitation.2007;73(1):29–39.
- ,,,.Induced hypothermia following out‐of‐hospital cardiac arrest; initial experience in a community hospital.Clin Cardiol.2006;29(12):525–529.
- ,,,,.From evidence to clinical practice: effective implementation of therapeutic hypothermia to improve patient outcome after cardiac arrest.Crit Care Med.2006;34(7):1865–1873.
- ,.Induced hypothermia in critical care medicine: a review.Crit Care Med.2003;31(7):2041–2051.
Engaging Patients at Hospital Discharge
I first met G.M. (a pseudonym) a year ago during a hospitalization for a flare of his Crohn's disease. At the age of 26, he had accrued nearly 400 hospital days in more than 10 institutionsranging from academic to community medical centers from the East Coast to the West Coast. He had been admitted and discharged more than 25 times and endured several surgeries, intermittent struggles with chronic pain and depression, and mishaps due to poor discharge planning. He referred to discharge as the most chaotic time of hospitalization, a comment that prompted a memorable discussion.
He began by describing the emotions he felt when first told about being discharged, using words such as fear and helplessness. He repeatedly talked about the lack of planning and anticipation of discharge as well as the frustration of watching a system that required fixing. Speaking with tremendous emotion and insight, he also pointed out the discharge experiences that maintained his trust and faith in the system. The conversation then shifted to his mother, who pointed out that her experiences as the caretaker were quite different than her son's. She was equally passionate and genuine in trying to characterize the hospital discharge process.
The conversation was so moving that I asked G.M. and his mother to jot down their thoughts on discharge as well as participate in a multidisciplinary patient safety conference. The following are excerpts from our conversation, their letters, and the conference.
THE PATIENT'S VIEW
You never go into the hospital wanting to stay there, but you also worry tremendously about adjusting back to home life. In my case, I was often on heavy pain medications with a PCA (patient‐controlled analgesia), so the transition to orals always created a source of stress, particularly when the transition happened right at discharge. I've had a number of experiences when they told me I was going home, stopped the PCA, and then simply sent me on my way. Nothing is worse than being discharged from the hospital, spending the car ride home doubled over in pain, and then not being able to get pain meds from the pharmacy until the next day. On the other hand, I've had discharges that were better anticipated, so I could participate in the process. This made all the difference in the world. I don't think people realize that when you're on a PCA right up to discharge, you're not really in a state to receive counseling, education, or instructions about follow‐up plansI was just trying to get better.
Many times, I knew I was getting close to discharge, but I often didn't see anyone owning the process. Information would be fragmented or inconsistent, and while I may have been ready for discharge, I wasn't prepared for discharge. This was a combination of paperwork being incomplete or being left to arrange my own follow‐up appointments after getting home. When you're sick and depressed, you fall through the cracks of the system. You just don't have the resolve to make things happen.
Ultimately, a well orchestrated discharge prepared me to be independent on some level. I felt comfortable and ready for life outside the hospital. I didn't feel helpless because I was only responsible for getting wellnot for arranging my follow‐up appointments, ensuring the home care nurse was coming by, and confirming that my primary doctor knew what was going on. In these situations, there was always a discharge planner serving as a patient advocate of sorts. I also can't imagine what I would have done if I didn't have my mom with me all the time. She's my mom, my advocate, and my caretaker and I don't know how patients survive without someone like that.
HIS MOTHER'S VIEW
I wasn't the sick and helpless one but rather the one who was expected to make it all happen: keep tabs on the medications, understand the details of the discharge plan, and ultimately manage the execution of care postdischarge. In the majority of cases when we had a bad discharge experience, it was because the goals were confused. It became about the bed that was needed for the person still sitting in the emergency department. They may not have realized it, but we fully understood the tension, and we very much felt it during the spotty discharge communications. Safety for the patient being discharged seemed to fall off the radar.
The goals of the process must be clear. In good discharges, caregivers clearly outline the transition plan, transfer records to the outpatient physicians, and arrange referrals to specialists as needed. Perhaps equally important is addressing the patient's emotional state for discharge. This isn't about convincing us that he's safe to go home, but a simple acknowledgement of the difficult transitionparticularly after a long hospitalizationgoes a far way in providing reassurance and decreasing fear and anxiety. If the issue is always one about beds and cost, I would think someone would figure out that a good discharge prevents readmissions, which would have to be a cost‐effective investment.
DISCUSSION
The voice of the patient (or family member) is incredibly powerful. Rather than having a trainee present a case history to illustrate teaching points, it is sometimes more meaningful and instructive to let patients tell their own stories. We invited G.M. and his mother to discuss their discharge experiences at a multidisciplinary patient safety conference. There, representative members of the discharge team (eg, house staff, attending, bedside nurse, pharmacist, and discharge planner) responded to their comments and discussed their roles in the discharge process. Ultimately, the patient and his mother taught us the most about what we can do to improve a process fraught with complexity and the potential for errors: communicate and work better as a team.
G.M. and his mother listened to each of the experts discuss the tasks they must complete to ensure a smooth discharge. Each provider expressed how committed they were to safe discharges, yet all of them shared how easy it is for one to go awry. They knew their individual roles, but all relied on each other to make the process completehighlighting that communication failures frequently lead to poor discharge experiences for patients. Engaging patients in the process should not transfer ownership of discharge to them (ie, making them responsible to ensure we do our jobs), though our patient and his mother presented several examples of how they owned the process because it was clear no one else did.
Evaluating our hospital discharge systems must include identifying methods to improve communication with outpatient providers, ensuring medications are available to patients on discharge, and providing written instructions (including follow‐up appointments) to patients before they leave the hospital. G.M. and his mother remind us that the best systems still need to engage patients, make them an active part of the discharge process (rather than an outcome of it), and never underestimate what patients suffer through emotionally prior to discharge.
Providers often feel uneasy when having to explain to patients that they no longer require hospitalization and perhaps avoid emotional engagement in those discussions because of the fear that some patients may become upset about a planned discharge. Communicating with patients about discharge plans should be handled with the same compassion, patience, and skill as delivering bad news. Patients entrust their lives to our clinical decision making, and abandoning this trust just as they leave the hospital is an unintended message that our patient and his mother perceived during their poor discharge experiences.
In my practice, I frequently include trainees in bedside discussions with patients and families, both to illustrate how important these conversations are and to model skills I was taught during my training. I now use discussions about discharge as a specific bedside teaching moment as well, hoping to impress on trainees the overriding message shared by G.M. and his mother: do not forget to engage patients in a process that is designed for them rather than to them.
Many physicians remain dedicated to improving hospital systems, but perhaps we should all be including our patients more in quality improvement activities and hospital committee work, as they provide perspectives not easily captured by administrative data and run charts.
Acknowledgements
The author thanks G.M. and his mother for candidly sharing their thoughts and feelings about the discharge process. He also thanks Erin Hartman, MS, for her invaluable editorial assistance in preparing this manuscript. The patient safety conference described was part of the Triad for Optimal Patient Safety (TOPS), a project funded by the Gorden & Betty Moore Foundation.
Prepared for Discharge Scale
Patients are vulnerable to adverse events when they transition from the hospital to outpatient care.13 Approximately 19%‐23% of patients experience adverse events within 4 weeks after acute care hospitalization.3, 4 One cause of postdischarge adverse events is ineffective discharge planning1, 2, 5, 6 Efforts to study and improve the hospital discharge‐planning processes require appropriate and valid measurement instruments. These instruments must assess the discharge process from multiple perspectives. One of the important perspectives is the patient's.7, 8
The PREPARED Patient Questionnaire is a comprehensive quality improvement tool to assess hospital discharge‐planning processes and outcomes from the patient's perspective.9, 10 The PREPARED acronym describes the content of this tool used to investigate the following phenomena: 1) prescriptions, 2) ready to reenter community, 3) education, 4) placement, 5) assurance of safety, 6) realistic expectations, 7) empowerment, and 8) directed to appropriate services.9 The PREPARED questionnaire was developed for, modified for, and validated with patients at least 65 years old. When administered to elderly patients 1 week after hospital discharge, the PREPARED has face, content, and construct validity.9
We considered the PREPARED questionnaire when we designed a clinical trial to assess the value of a discharge intervention. We sought a survey questionnaire to assess the patients' perceptions after the discharge intervention. In 2004, we found noother validated questionnaires except the PREPARED. We also noted some limitations of the PREPARED. The validated population for the PREPARED was patients older than 65 years. In our clinical trial, we planned to enroll adults of all ages. Another limitation was the PREPARED response scoring system that assigned missing data values to patients who took no medicines, needed no services, or needed no equipment.10 We were concerned about the potential for unacceptably large numbers of patients with nonignorable missing data. We decided to address the above limitations with a validation study in our patient population and with a revised response scoring system.
In the present article, we describe item reduction and validation for the Brief PREPARED (B‐PREPARED) scale to measure patients' perceptions of their preparedness for hospital discharge. When we designed B‐PREPARED, we asked the following question: Does a subset of PREPARED items with a revised scoring system have internal consistency, construct validity, and predictive validity in a population of adult patients with broad age range? We also wanted a brief scale with acceptable, defined statistical properties for multiple users. One user class included clinicians who guide and assess discharge‐planning processes. Other users would be researchers like us who measure differences between treatment groups after discharge process interventions.
METHODS
The Peoria Institutional Review Board approved the protocol for human research. The patient sample for scale analysis was a prospective cohort. Follow‐up was 1 month after patient's discharge from a 730‐bed acute‐care teaching hospital in central Illinois. The patients were enrolled in an ongoing cluster randomized clinical trial with blinded outcome assessment. Willing patients or their proxies provided written consent for study participation. Enrollment occurred between December 2004 and July 2006.
Patient Inclusion Criteria
Trained research coordinators identified all consecutive adult inpatients who were discharged to the patient's home by internal medicine hospitalists. Patient inclusion in our cluster randomized trial required a probability of repeat admission (Pra) score of at least 0.40.11, 12 Hence, the patients in the scale analysis cohort had the same high probability for repeat admission. The research coordinators calculated the Pra within 2 days before discharge from the index hospitalization. The Pra score came from a logistic model of age, sex, prior hospitalizations, prior doctor visits, self‐rated health status, informal caregiver, and comorbid coronary heart disease and diabetes mellitus.11, 12
Patient Exclusion Criteria
We excluded patients if the discharge destination was a nursing home, another acute care hospital, or an inpatient rehabilitation unit. Patients were excluded if life expectancy was less than 6 months as estimated by the hospitalist. Because follow‐up occurred via interview, patients without telephones or English‐ or Spanish‐language skills were excluded. Patients with cognitive impairment could participate with consent from a legally authorized representative and with a proxy whospent a minimum of 3 hours daily with the patient and was willing to answer postdischarge interviews.
Baseline Assessment
During the index hospital admission, trained data abstractors recorded baseline patient data: age, sex, race, diabetes mellitus, heart failure, chronic obstructive pulmonary disease, and coronary heart disease. Patients or proxies provided the number of hospital admissions and doctor visits during the year before the index hospital admission. We recorded the availability of an informal caregiver in response to the question Is there a friend, relative, or neighbor who would take care of you for a few days if necessary? Patients rated their health status on the following scale: poor, fair, good, very good, or excellent.
Discharge and Postdischarge Procedures
At the end of the index hospitalization, hospitalists and ward nurses used standardized forms for discharge diagnoses, prescriptions, instructions, and appointments. Discharge‐planning nurses or social workers consulted with hospitalists and ward nurses and then coordinated service providers including home health nurses, physical therapists, home health aides, homemaker service providers, durable medical equipment vendors, home oxygen vendors, home infusion pharmacists, social workers, rehabilitation service providers, legal aide providers, and others. After discharge, trained research personnel conducted 2 telephone interviews with the patient or the patient's proxy. The first interview occurred 1 week after discharge. Interviewers read verbatim items from the PREPARED10 and the Satisfaction with Information about Medicines Scale (SIMS).13 During the second telephone interview 30 10 days after discharge, interviewers recorded if patients had experienced at least 1 emergency department visit during the month after discharge.
The purpose of the PREPARED items was to have a bank of items and responses that could be used to generate the B‐PREPARED scale. The PREPARED questionnaire was originally developed to provide feedback to hospital ward staff about the quality of discharge‐planning activities that occurred during hospitalization.9 Discriminant factor analysis on the original 16 process questions revealed 4 factors that explained 57% of the total variance in patient/caregiver responses. The PREPARED domains included information exchange on community services and equipment, management of medication, the process of preparing to cope after discharge, and having control over one's discharge circumstances.9 The purpose of the SIMS was as a construct to compare with the B‐PREPARED scale. The derivation and validity of the SIMS have been described extensively elsewhere.13 In summary, the SIMS items were derived from recommendations of the Association of the British Pharmaceutical Industry. The intent of the SIMS was to determine if a patient's medication information needs were met and to allow comparison between patients or groups. Respondents selected 1 of 5 options for each of the 17 items. The sum of scores for each of the SIMS items yielded a total score that ranged from 0 to 17. Patients with high total SIMS scores had high satisfaction with the amount of medication information they received. Validation samples included inpatients and outpatients with a variety of diseases and characteristics. SIMS demonstrated adequate internal consistency, test‐retest reliability, and criterion‐related validity.13
Item Selection and Scoring of the B‐PREPARED Instrument
We selected an initial pool of items from the PREPARED instrument.10 The goal was a parsimonious, comprehensive, and valid instrument for use in clinical and research environments. When we retained or deleted items, our decision process was conservative, conceptual, and statistical. We performed item reduction in the following steps defined a priori. First, we agreed on items consistent with domains in the prepared for discharge construct as defined by expert consensus.9 Second, we excluded items that assessed qualities of the discharge process that were imperceptible to the patient on the day of discharge. Third, we excluded items that elicited open‐ended responses unsuitable for quantitative scale development and analysis. Fourth, we assessed reliability as defined by the Cronbach's alpha statistic. We excluded items that substantially decreased Cronbach's alpha.
Measures of Construct Validity
We used 2 measures of construct validity in our assessment of B‐PREPARED. One construct was patient worry. During the interview 1 week after discharge, research personnel asked, Now that you have been out of the hospital for a while, has anything been worrying you about managing at home? Response options for the dichotomous worry item were no or yes. We anticipated worried patients would have lower B‐PREPARED scale values. The other construct, SIMS, evaluated patient preparedness related to medication information exchange. The hypothesis was a positive correlation between SIMS and B‐PREPARED scale values.
Measure of Predictive Validity
We asked if B‐PREPARED predicted and discriminated groups of patients who did or did not visit emergency departments after hospital discharge. Emergency department visits were relevant adverse outcomes because of their association with postdischarge adverse events due to inpatient treatment.4 Emergency department visits reflected new or worsening symptoms after discharge. In our scale analysis, the hypothesis was patients with at least 1 emergency department visit would have lower B‐PREPARED scale values.
Analysis
Analyses were performed with SPSS PC (Version 14.0.2, SPSS Inc, Chicago, IL). We reported descriptive statistics as means, standard deviations, and range for interval variables and percentages for nominal variables. To determine the internal consistency of the scale, we calculated Cronbach's alpha. We assessed the distribution of the B‐PREPARED scale with visual and statistical tests for skewness. While using the SPSS FACTOR program, we performed principal components extractions and then rotated components using the oblique promax technique. Component scores were saved using the regression score procedure. Component loadings above 0.30 were considered important. Statistical inference tests were the Mann‐Whitney U for median differences between 2 groups and the Spearman correlation for associations. We reported medians with 25th and 75th percentiles. Differences between 2 correlations were tested using Fischer z transformations. The accepted level of significance was P < 0.05.
RESULTS
Description of Cohort
We approached 5124 patients during the index hospital admission. After applying exclusion criteria, we obtained consent and enrolled 491 patients. The reasons for exclusion were low Pra score for 34.9% of ineligible patients, discharge to nursing home for 12.8%, declined consent for 10.8%, nonparticipating hospitalist service for 9.1%, discharged during screen for 8.5%, previously enrolled in study for 5.6%, and declined screening for 2.3%. Each of the other exclusion criteria accounted for less than 4% of the ineligible patients. After subtracting 6% of eligible patients (31 of 491) who died, withdrew, or were lost during the first month, there were 460 patients available for analysis. Table 1 describes the patients' characteristics. Most of the patients, 75.2% (346 of 460), were less than 65 years old, and the mean age was 53.9 15.5 years. Many patients had chronic diseases including diabetes mellitus, coronary heart disease, heart failure, and chronic obstructive pulmonary disease. Most patients, 81.5% (375 of 460), rated their health as poor or fair, and 53.5% (246/460) had 1 or more hospital admissions during the year before their index admission. Cohort patients had a high probability of repeat admission: mean Pra 0.49 0.07 (range 0.400.70).
| Characteristic | n (%) |
|---|---|
| Sex (male) | 193 (42.0%) |
| Age (years) | |
| 1930 | 35 (7.6%) |
| 3164 | 311 (67.6%) |
| 6598 | 114 (24.8%) |
| Race | |
| White | 275 (59.8%) |
| Black | 124 (27.0%) |
| Other | 61 (13.3%) |
| Self‐rated health status | |
| Poor | 139 (30.2%) |
| Fair | 236 (51.3%) |
| Good | 70 (15.2%) |
| Very good | 13 (2.8%) |
| Excellent | 2 (0.4%) |
| Diabetes mellitus | 259 (56.3%) |
| Chronic obstructive pulmonary disease | 79 (17.2%) |
| Coronary heart disease | 188 (40.9%) |
| Heart failure (n = 456) | 100 (21.7%) |
| Informal caregiver available (yes) | 459 (99.1%) |
| Hospital admissions during year prior to index admission | |
| 0 | 214 (46.5%) |
| 1 | 131 (28.5%) |
| 2 | 47 (10.2%) |
| 3 or 4 | 35 (7.6%) |
| 515 | 33 (7.2%) |
Item Reduction, Internal Consistency, and Score Distributions
Item reduction resulted in 12 items that fulfilled conceptual criteria. Table 2 shows the items and the distribution of responses. One of the 12 items, delays on the day you left the hospital (item 12, Table 2), was deleted because the item depressed the Cronbach's alpha. The B‐PREPARED with 11 items had acceptable internal consistency for the full cohort (Cronbach's alpha = 0.76).
| Item Text | Descriptor for Score 0 | Descriptor for Score 1 | Descriptor for Score 2 | |
|---|---|---|---|---|
| ||||
| 1 | While you were in the hospital, how much information did you receive about the medications that you were to take at home? | None (40, 8.7%) | Some, but not enough (95, 20.7%) | As much as I needed; or Not taking any medications (325, 70.7%) |
| 2 | While you were in the hospital, how much information did you receive about the side effects of the medications that you were to take at home? | None (198, 43.0%) | Some, but not enough (54, 11.7%) | As much as I needed; or Not taking any medications (208, 45.2%) |
| 3 | While you were in the hospital, were you given written instructions about your medications? If yes, did someone spend time explaining the written instructions? | No written instructions and no time spent (116, 25.2%) | Yes, received written instructions but no time spent (49, 10.7%) | Yes, received written instructions and yes, time spent; or, Not taking any medications (291, 63.3%) |
| 4 | While you were in the hospital, how much information did you receive on how you would manage your usual activities when you went home? | None (55, 12.0%) | Some, but not enough (90, 19.6%) | As much as I needed (315, 68.5%) |
| 5 | While you were in the hospital, how much information did you receive on community services you might use once you went home? | None (89, 19.3%) | Some, but not enough (40, 8.7%) | As much as I needed; or No services needed (331, 72.0%) |
| 6 | While you were in the hospital, how much information did you receive on equipment you might need once you went home? | None (49, 10.7%) | Some, but not enough (22, 4.8%) | As much as I needed; or No equipment needed (389, 84.6%) |
| 7 | Before you were discharged from the hospital, did anyone arrange community services for you to use at home? | No (42, 9.1%) | Yes; or No one needed to arrange because services were already in place or no services needed (418, 90.9%) | |
| 8 | Before you were discharged from the hospital, did anyone arrange equipment for you? | No (16, 3.5%) | Yes; or No one needed to because equipment already in place or no equipment needed (444, 96.5%) | |
| 9 | Before you were discharged from hospital, was there any other information you would have liked while you were in the hospital to prepare you for coping at home? | No (116, 25.2%) | Yes (344, 74.8%) | |
| 10 | After you were told you could leave the hospital, how confident did you feel about managing at home? | Not confident (25, 5.4%) | Unsure (103, 22.4%) | Confident (332, 72.2%) |
| 11 | Looking back to the time you left the hospital, overall, how prepared did you feel for returning home? | Unprepared (39, 8.5%) | Moderately prepared (132, 28.7%) | Very prepared (288, 62.6%) |
| 12 | After you were told you could leave the hospital, were there any delays on the day you left the hospital? | Yes (122, 26.5%) | No (338, 73.5%) | |
For an individual patient, the sum of the scores for each item yielded a B‐PREPARED scale value. In the 460‐patient cohort, B‐PREPARED scale values had a mean of 17.3 4.3 and a negatively skewed distribution. A high scale value reflected high perception of discharge preparedness. Each of the 11 items correlated significantly with the B‐PREPARED scale value (P < 0.001, 2‐tailed).
There were substantial ceiling effects with individual items but not in the B‐PREPARED total score. Five of the 9 items with 3 response options had a ceiling effect above 70%. Three items had a dichotomous response option (items 7, 8, and 9). In 2 of these 3 items, more than 90% of respondents selected the response indicating higher preparedness. The total B‐PREPARED did not have noteworthy floor or ceiling effects. In this sample's total B‐PREPARED scores, 0.2% of respondents had the lowest score of 3, and 20% had the highest score of 22.
Principal Component Analysis
In the component analysis, we evaluated the correlation matrix of the 11 items in the B‐PREPARED scale. A Kaiser‐Meyer‐Olkin statistic of 0.76 indicated sufficient sampling adequacy to extract components from the matrix. Principal components extracted 54.2% of the variance associated with the 11‐item B‐PREPARED scale. After inspection of scree plots, we determined that 3 components were extracted before the eigenvalue fell below 1. The pattern matrix for the promax rotation was inspected, and the factor loading of each item appears in Table 3. The item content identified the first component as self‐care information for medications and activities. The second component was equipment and services. The third component was confidence. All B‐PREPARED items loaded primarily on 1 of the 3 components (Table 3).
| Item text | Component | |||
|---|---|---|---|---|
| Self‐care Information for Medications and Activity | Equipment and Services | Confidence | ||
| 1 | While you were in the hospital, how much information did you receive about the medications that you were to take at home? | 0.749 | 0.032 | 0.019 |
| 2 | While you were in the hospital, how much information did you receive about the side effects of the medications that you were to take at home? | 0.778 | .008 | 0.003 |
| 3 | While you were in the hospital, were you given written instructions about your medications? If yes, did someone spend time explaining the written instructions? | 0.758 | 0.030 | 0.084 |
| 4 | While you were in the hospital, how much information did you receive on how you would manage your usual activities when you went home? | 0.581 | 0.101 | 0.195 |
| 5 | While you were in the hospital, how much information did you receive on community services you might use once you went home? | 0.158 | 0.639 | 0.124 |
| 6 | While you were in the hospital, how much information did you receive on equipment you might need once you went home? | 0.183 | 0.701 | ‐0.152 |
| 7 | Before you were discharged from the hospital, did anyone arrange community services for you to use at home? | 0.081 | 0.654 | 0.199 |
| 8 | Before you were discharged from the hospital, did anyone arrange equipment for you? | 0.138 | 0.655 | 0.095 |
| 9 | Before you were discharged from the hospital, was there any other information you would have liked while you were in the hospital to prepare you for coping at home? | 0.181 | 0.211 | 0.369 |
| 10 | After you were told you could leave the hospital, how confident did you feel about managing at home? | 0.036 | 0.058 | 0.876 |
| 11 | Looking back to the time you left the hospital, overall, how prepared did you feel for returning home? | 0.018 | 0.032 | 0.875 |
Construct Validity
We assessed 2 constructs: worry and satisfaction with medication information (SIMS). In the cohort, 25% of patients (115 of 460) reported worry about managing at home. Worried patients had significantly lower B‐PREPARED scale values (median [25%, 75%] = 14 [10, 16]) than patients who did not worry (median [25%, 75%] = 17 [14, 20], P < .001). We calculated SIMS and then correlated SIMS with B‐PREPARED and components. In the cohort, the mean SIMS was 12.1 4.7 (range 0‐17). Patients with greater satisfaction on the SIMS also had higher B‐PREPARED scale values (rho = 0.45, P < 0.001). There was a significant positive correlation between SIMS and the B‐PREPARED component called self‐care information for medications and activities (rho = 0.46, P < 0.001). The other 2 B‐PREPARED components, equipment/services and confidence, were positively correlated with SIMS at much lower levels (rho = 0.18 and rho = 0.24, respectively, both Fischer z transformations P < .001). The B‐PREPARED scale demonstrated validity with the constructs of worry and satisfaction with medication information.
Predictive Validity
We assessed the capacity of the B‐PREPARED to predict and discriminate groups of patients who did or did not visit emergency departments. Within 1 month of hospital discharge, 16.5% of the cohort (76 of 460 patients) had at least 1 visit to an emergency department. B‐PREPARED scale values were lower for those patients who visited emergency departments (median [25%, 75%] = 14 [12, 18]) than those who did not (median [25%, 75%] = 16 [13, 19], P = 0.011). The B‐PREPARED scale analysis supported the hypothesized relationship with emergency department visits.
Correlations between B‐PREPARED and Baseline Characteristics
We evaluated the correlations between a patient's B‐PREPARED scale value and baseline characteristics, shown in Table 1. There was a weak positive correlation with self‐rated health status (rho 0.17, P < .001). Patients who perceived better health status had higher B‐PREPARED scale values than those with poorer status. The other baseline characteristics in Table 1 were not associated with B‐PREPARED scale values.
DISCUSSION
The B‐PREPARED scale measures patients' perceptions of their preparedness for hospital discharge home. Scale items came from the PREPARED, a survey with validated psychometric properties in elderly patients. We assessed the B‐PREPARED in a cohort of young and elderly adult patients. We examined the B‐PREPARED instrument for internal consistency, construct validity, and predictive validity. In comparison with the domains identified in the full PREPARED instrument,9 the abbreviated B‐PREPARED scale identified similar domains. Some differences were anticipated because we limited items to those the respondents would be able to perceive before leaving the hospital.
The results of our study should be interpreted in the context of strengths and limitations. One of the strengths was the validity of the PREPARED, from which the B‐PREPARED was derived.7 The conceptually rigorous process used to develop the PREPARED questionnaire allowed us to draw from a bank of concise, well‐worded items.9 The B‐PREPARED extends validity to a population of adults of all ages with high risk for readmission. The other strength of the B‐PREPARED was the association with the clinically relevant constructs worry and satisfaction with medication information. The B‐PREPARED also discriminated between patients who did and those who did not return to emergency departments after discharge. Although the patient population for the B‐PREPARED validation was one of the strengths of this study, it is also a limitation. Our cohort lacked diversity with respect to readmission risk. The results of our study may not generalize to patients with low risk for repeated admission. Furthermore, all our patients were discharged home. The exclusion of other discharge destinations helped us to enroll a cohort with homogenous risk for readmission. However, our exclusion criteria did not allow us to validate the B‐PREPARED in patients discharged to nursing homes, inpatient rehabilitation units, or other acute care facilities.
Another limitation related to outpatient visits after discharge. We did not analyze outpatient sites other than emergency departments. For all of our study patients, the discharging hospitalist scheduled at least 1 outpatient visit with the primary care practitioner. For some patients, the hospitalist also scheduled postdischarge visits for diagnostic evaluations like cardiac stress tests, endoscopies, radiographs, or other laboratory tests. When these visits occurred, they represented successful execution of the discharge plan. Sometimes patients arrived for planned or unplanned outpatient visits with exacerbated symptoms or adverse events. These latter visits might represent failures of the discharge plan. Our data collection did not allow us to distinguish outpatient visits as successes or failures of the discharge plan. When we counted only emergency department visits, we may have underestimated the number of patients with adverse events who sought and received successful treatment in outpatient clinics. Future studies should consider ascertainment of planned and unplanned outpatient visits for exacerbated symptoms and adverse events.
After our study began enrollment, other investigators published the Readiness for Hospital Discharge Scale14 and Care Transitions Measure.15 The design and validation of these sampling instruments differed with each other and with the B‐PREPARED. The differences made the 3 scales complementary but not interchangeable. For example, investigators administered the 21‐item Readiness for Hospital Discharge Scale on the day of discharge to adult medical‐surgical patients, postpartum mothers, and parents of hospitalized children. In contrast, we administered the B‐PREPARED 1 week after discharge to adult internal medicine patients or their proxies. The Readiness for Hospital Discharge subscales were personal status, knowledge, coping ability, and expected support. These subscales were similar to the components of the B‐PREPARED. The Readiness for Hospital Discharge Scale demonstrated internal consistency and construct validity but did not predict patients who returned to emergency departments after hospital discharge.14 Future users of the Readiness for Hospital Discharge Scale or the B‐PREPARED should consider their patient populations and the date of administration when selecting 1 scale versus another. If brevity is important to a clinician or researcher, then the 11‐item B‐PREPARED scale may be considered.
The Care Transitions Measure also differed from the B‐PREPARED. The 15‐item Care Transitions Measure evaluated an adult population with a broad age range and with chronic obstructive pulmonary disease, heart failure, stroke, or hip fracture.15 The diseases represented in the population for the Care Transitions Measure were similar to those in the B‐PREPARED cohort, although the distribution of the diseases differed. When validating the Care Transitions Measure, investigators administered questionnaires 6 to 12 weeks after discharge. The Care Transitions Measure had 4 factors: critical understanding, preferences important, management preparation, and care plan. The factors of the Care Transitions Measure were comparable to the components of the B‐PREPARED, and both scales assessed medication self‐management. However, the Care Transitions Measure addressed patient preferences with specific items, whereas the B‐PREPARED used the scoring system to quantify patient preferences. Both the Care Transitions Measure and the B‐PREPARED demonstrated internal consistency and discriminated between patients who did and those who did not return to emergency departments after hospital discharge.15 When selecting a scale, future users should consider the B‐PREPARED only for assessments 1 week post discharge and should consider the Care Transitions Measure for later assessments.
There are applications of the B‐PREPARED scale in hospital quality improvement efforts. Hospitals have multiple motivations to pursue quality improvement projects related to discharge processes: satisfaction of patients, reduction in adverse events, relation with referring physicians, and accreditation by regulators.6, 16 When hospital‐based clinicians survey patients, they may wish to use a brief, reliable, and validated instrument like the B‐PREPARED questionnaire.
CONCLUSIONS
The B‐PREPARED provided a reliable and valid measure of patients' perceptions of their preparedness for hospital discharge home. Clinicians and researchers may find the B‐PREPARED useful to guide, assess, and compare discharge‐planning interventions.
Acknowledgements
The authors thank Dr. Karen Grimmer‐Somers, PhD, for permission to use the PREPARED instrument and for her thoughtful comments on the draft manuscript.
- ,,,.Discharge planning from hospital to home.Cochrane Database Syst Rev.2004;(1):CD000313.
- ,,.Written and verbal information versus verbal information only for patients being discharged from acute hospital settings to home.Cochrane Database Syst Rev.2003;(4):CD003716.
- ,,,,.The incidence and severity of adverse events affecting patients after discharge from the hospital.Ann Intern Med.2003;138:161–167.
- ,,, et al.Adverse events among medical patients after discharge from hospital.CMAJ.2004;170:345–349.
- ,,,,,.Factors associated with unplanned hospital readmission among patients 65 years of age and older in a Medicare managed care plan.Am J Med.1999;107:13–17.
- ,,,,,.Deficits in communication and information transfer between hospital‐based and primary care physicians: implications for patient safety and continuity of care.JAMA.2007;297:831–841.
- ,,,.Review of the literature on survey instruments used to collect data on hospital patients' perceptions of care.Health Serv Res.2005;40:1996–2017.
- ,.A patient‐centered model of care for hospital discharge.Clin Nurs Res.2004;13:117–136.
- ,.The development, validity and application of a new instrument to assess the quality of discharge planning activities from the community perspective.Int J Qual Health Care.2001;13:109–116.
- PREPARED Patient Questionnaire. Available at: http://www.unisa.edu.au/cahe/pubs/Patient%20scoring.pdf. Accessed June 14,2007.
- ,,.Predictive validity of a questionnaire that identifies older persons at risk for hospital admission.J Am Geriatr Soc.1995;43:374–377.
- ,,,.Predictive validity of the Pra instrument among older recipients of managed care.J Am Geriatr Soc.1997;45:614–617.
- ,,.The Satisfaction with Information about Medicines Scales (SIMS): a new measurement tool for audit and research.Qual Health Care.2001;10:135–140.
- ,.Psychometric properties of the Readiness for Hospital Discharge Scale.J Nurs Meas.2006;14:163–180.
- ,,.Assessing the quality of preparation for posthospital care from the patient's perspective: the care transitions measure.Med Care.2005;43:246–255.
- 2007 Hospital/critical access hospital national patient safety goals. Available at: http://www.jointcommission.org/PatientSafety/NationalPatientSafetyGoals. Accessed June 14,2007.
Patients are vulnerable to adverse events when they transition from the hospital to outpatient care.13 Approximately 19%‐23% of patients experience adverse events within 4 weeks after acute care hospitalization.3, 4 One cause of postdischarge adverse events is ineffective discharge planning1, 2, 5, 6 Efforts to study and improve the hospital discharge‐planning processes require appropriate and valid measurement instruments. These instruments must assess the discharge process from multiple perspectives. One of the important perspectives is the patient's.7, 8
The PREPARED Patient Questionnaire is a comprehensive quality improvement tool to assess hospital discharge‐planning processes and outcomes from the patient's perspective.9, 10 The PREPARED acronym describes the content of this tool used to investigate the following phenomena: 1) prescriptions, 2) ready to reenter community, 3) education, 4) placement, 5) assurance of safety, 6) realistic expectations, 7) empowerment, and 8) directed to appropriate services.9 The PREPARED questionnaire was developed for, modified for, and validated with patients at least 65 years old. When administered to elderly patients 1 week after hospital discharge, the PREPARED has face, content, and construct validity.9
We considered the PREPARED questionnaire when we designed a clinical trial to assess the value of a discharge intervention. We sought a survey questionnaire to assess the patients' perceptions after the discharge intervention. In 2004, we found noother validated questionnaires except the PREPARED. We also noted some limitations of the PREPARED. The validated population for the PREPARED was patients older than 65 years. In our clinical trial, we planned to enroll adults of all ages. Another limitation was the PREPARED response scoring system that assigned missing data values to patients who took no medicines, needed no services, or needed no equipment.10 We were concerned about the potential for unacceptably large numbers of patients with nonignorable missing data. We decided to address the above limitations with a validation study in our patient population and with a revised response scoring system.
In the present article, we describe item reduction and validation for the Brief PREPARED (B‐PREPARED) scale to measure patients' perceptions of their preparedness for hospital discharge. When we designed B‐PREPARED, we asked the following question: Does a subset of PREPARED items with a revised scoring system have internal consistency, construct validity, and predictive validity in a population of adult patients with broad age range? We also wanted a brief scale with acceptable, defined statistical properties for multiple users. One user class included clinicians who guide and assess discharge‐planning processes. Other users would be researchers like us who measure differences between treatment groups after discharge process interventions.
METHODS
The Peoria Institutional Review Board approved the protocol for human research. The patient sample for scale analysis was a prospective cohort. Follow‐up was 1 month after patient's discharge from a 730‐bed acute‐care teaching hospital in central Illinois. The patients were enrolled in an ongoing cluster randomized clinical trial with blinded outcome assessment. Willing patients or their proxies provided written consent for study participation. Enrollment occurred between December 2004 and July 2006.
Patient Inclusion Criteria
Trained research coordinators identified all consecutive adult inpatients who were discharged to the patient's home by internal medicine hospitalists. Patient inclusion in our cluster randomized trial required a probability of repeat admission (Pra) score of at least 0.40.11, 12 Hence, the patients in the scale analysis cohort had the same high probability for repeat admission. The research coordinators calculated the Pra within 2 days before discharge from the index hospitalization. The Pra score came from a logistic model of age, sex, prior hospitalizations, prior doctor visits, self‐rated health status, informal caregiver, and comorbid coronary heart disease and diabetes mellitus.11, 12
Patient Exclusion Criteria
We excluded patients if the discharge destination was a nursing home, another acute care hospital, or an inpatient rehabilitation unit. Patients were excluded if life expectancy was less than 6 months as estimated by the hospitalist. Because follow‐up occurred via interview, patients without telephones or English‐ or Spanish‐language skills were excluded. Patients with cognitive impairment could participate with consent from a legally authorized representative and with a proxy whospent a minimum of 3 hours daily with the patient and was willing to answer postdischarge interviews.
Baseline Assessment
During the index hospital admission, trained data abstractors recorded baseline patient data: age, sex, race, diabetes mellitus, heart failure, chronic obstructive pulmonary disease, and coronary heart disease. Patients or proxies provided the number of hospital admissions and doctor visits during the year before the index hospital admission. We recorded the availability of an informal caregiver in response to the question Is there a friend, relative, or neighbor who would take care of you for a few days if necessary? Patients rated their health status on the following scale: poor, fair, good, very good, or excellent.
Discharge and Postdischarge Procedures
At the end of the index hospitalization, hospitalists and ward nurses used standardized forms for discharge diagnoses, prescriptions, instructions, and appointments. Discharge‐planning nurses or social workers consulted with hospitalists and ward nurses and then coordinated service providers including home health nurses, physical therapists, home health aides, homemaker service providers, durable medical equipment vendors, home oxygen vendors, home infusion pharmacists, social workers, rehabilitation service providers, legal aide providers, and others. After discharge, trained research personnel conducted 2 telephone interviews with the patient or the patient's proxy. The first interview occurred 1 week after discharge. Interviewers read verbatim items from the PREPARED10 and the Satisfaction with Information about Medicines Scale (SIMS).13 During the second telephone interview 30 10 days after discharge, interviewers recorded if patients had experienced at least 1 emergency department visit during the month after discharge.
The purpose of the PREPARED items was to have a bank of items and responses that could be used to generate the B‐PREPARED scale. The PREPARED questionnaire was originally developed to provide feedback to hospital ward staff about the quality of discharge‐planning activities that occurred during hospitalization.9 Discriminant factor analysis on the original 16 process questions revealed 4 factors that explained 57% of the total variance in patient/caregiver responses. The PREPARED domains included information exchange on community services and equipment, management of medication, the process of preparing to cope after discharge, and having control over one's discharge circumstances.9 The purpose of the SIMS was as a construct to compare with the B‐PREPARED scale. The derivation and validity of the SIMS have been described extensively elsewhere.13 In summary, the SIMS items were derived from recommendations of the Association of the British Pharmaceutical Industry. The intent of the SIMS was to determine if a patient's medication information needs were met and to allow comparison between patients or groups. Respondents selected 1 of 5 options for each of the 17 items. The sum of scores for each of the SIMS items yielded a total score that ranged from 0 to 17. Patients with high total SIMS scores had high satisfaction with the amount of medication information they received. Validation samples included inpatients and outpatients with a variety of diseases and characteristics. SIMS demonstrated adequate internal consistency, test‐retest reliability, and criterion‐related validity.13
Item Selection and Scoring of the B‐PREPARED Instrument
We selected an initial pool of items from the PREPARED instrument.10 The goal was a parsimonious, comprehensive, and valid instrument for use in clinical and research environments. When we retained or deleted items, our decision process was conservative, conceptual, and statistical. We performed item reduction in the following steps defined a priori. First, we agreed on items consistent with domains in the prepared for discharge construct as defined by expert consensus.9 Second, we excluded items that assessed qualities of the discharge process that were imperceptible to the patient on the day of discharge. Third, we excluded items that elicited open‐ended responses unsuitable for quantitative scale development and analysis. Fourth, we assessed reliability as defined by the Cronbach's alpha statistic. We excluded items that substantially decreased Cronbach's alpha.
Measures of Construct Validity
We used 2 measures of construct validity in our assessment of B‐PREPARED. One construct was patient worry. During the interview 1 week after discharge, research personnel asked, Now that you have been out of the hospital for a while, has anything been worrying you about managing at home? Response options for the dichotomous worry item were no or yes. We anticipated worried patients would have lower B‐PREPARED scale values. The other construct, SIMS, evaluated patient preparedness related to medication information exchange. The hypothesis was a positive correlation between SIMS and B‐PREPARED scale values.
Measure of Predictive Validity
We asked if B‐PREPARED predicted and discriminated groups of patients who did or did not visit emergency departments after hospital discharge. Emergency department visits were relevant adverse outcomes because of their association with postdischarge adverse events due to inpatient treatment.4 Emergency department visits reflected new or worsening symptoms after discharge. In our scale analysis, the hypothesis was patients with at least 1 emergency department visit would have lower B‐PREPARED scale values.
Analysis
Analyses were performed with SPSS PC (Version 14.0.2, SPSS Inc, Chicago, IL). We reported descriptive statistics as means, standard deviations, and range for interval variables and percentages for nominal variables. To determine the internal consistency of the scale, we calculated Cronbach's alpha. We assessed the distribution of the B‐PREPARED scale with visual and statistical tests for skewness. While using the SPSS FACTOR program, we performed principal components extractions and then rotated components using the oblique promax technique. Component scores were saved using the regression score procedure. Component loadings above 0.30 were considered important. Statistical inference tests were the Mann‐Whitney U for median differences between 2 groups and the Spearman correlation for associations. We reported medians with 25th and 75th percentiles. Differences between 2 correlations were tested using Fischer z transformations. The accepted level of significance was P < 0.05.
RESULTS
Description of Cohort
We approached 5124 patients during the index hospital admission. After applying exclusion criteria, we obtained consent and enrolled 491 patients. The reasons for exclusion were low Pra score for 34.9% of ineligible patients, discharge to nursing home for 12.8%, declined consent for 10.8%, nonparticipating hospitalist service for 9.1%, discharged during screen for 8.5%, previously enrolled in study for 5.6%, and declined screening for 2.3%. Each of the other exclusion criteria accounted for less than 4% of the ineligible patients. After subtracting 6% of eligible patients (31 of 491) who died, withdrew, or were lost during the first month, there were 460 patients available for analysis. Table 1 describes the patients' characteristics. Most of the patients, 75.2% (346 of 460), were less than 65 years old, and the mean age was 53.9 15.5 years. Many patients had chronic diseases including diabetes mellitus, coronary heart disease, heart failure, and chronic obstructive pulmonary disease. Most patients, 81.5% (375 of 460), rated their health as poor or fair, and 53.5% (246/460) had 1 or more hospital admissions during the year before their index admission. Cohort patients had a high probability of repeat admission: mean Pra 0.49 0.07 (range 0.400.70).
| Characteristic | n (%) |
|---|---|
| Sex (male) | 193 (42.0%) |
| Age (years) | |
| 1930 | 35 (7.6%) |
| 3164 | 311 (67.6%) |
| 6598 | 114 (24.8%) |
| Race | |
| White | 275 (59.8%) |
| Black | 124 (27.0%) |
| Other | 61 (13.3%) |
| Self‐rated health status | |
| Poor | 139 (30.2%) |
| Fair | 236 (51.3%) |
| Good | 70 (15.2%) |
| Very good | 13 (2.8%) |
| Excellent | 2 (0.4%) |
| Diabetes mellitus | 259 (56.3%) |
| Chronic obstructive pulmonary disease | 79 (17.2%) |
| Coronary heart disease | 188 (40.9%) |
| Heart failure (n = 456) | 100 (21.7%) |
| Informal caregiver available (yes) | 459 (99.1%) |
| Hospital admissions during year prior to index admission | |
| 0 | 214 (46.5%) |
| 1 | 131 (28.5%) |
| 2 | 47 (10.2%) |
| 3 or 4 | 35 (7.6%) |
| 515 | 33 (7.2%) |
Item Reduction, Internal Consistency, and Score Distributions
Item reduction resulted in 12 items that fulfilled conceptual criteria. Table 2 shows the items and the distribution of responses. One of the 12 items, delays on the day you left the hospital (item 12, Table 2), was deleted because the item depressed the Cronbach's alpha. The B‐PREPARED with 11 items had acceptable internal consistency for the full cohort (Cronbach's alpha = 0.76).
| Item Text | Descriptor for Score 0 | Descriptor for Score 1 | Descriptor for Score 2 | |
|---|---|---|---|---|
| ||||
| 1 | While you were in the hospital, how much information did you receive about the medications that you were to take at home? | None (40, 8.7%) | Some, but not enough (95, 20.7%) | As much as I needed; or Not taking any medications (325, 70.7%) |
| 2 | While you were in the hospital, how much information did you receive about the side effects of the medications that you were to take at home? | None (198, 43.0%) | Some, but not enough (54, 11.7%) | As much as I needed; or Not taking any medications (208, 45.2%) |
| 3 | While you were in the hospital, were you given written instructions about your medications? If yes, did someone spend time explaining the written instructions? | No written instructions and no time spent (116, 25.2%) | Yes, received written instructions but no time spent (49, 10.7%) | Yes, received written instructions and yes, time spent; or, Not taking any medications (291, 63.3%) |
| 4 | While you were in the hospital, how much information did you receive on how you would manage your usual activities when you went home? | None (55, 12.0%) | Some, but not enough (90, 19.6%) | As much as I needed (315, 68.5%) |
| 5 | While you were in the hospital, how much information did you receive on community services you might use once you went home? | None (89, 19.3%) | Some, but not enough (40, 8.7%) | As much as I needed; or No services needed (331, 72.0%) |
| 6 | While you were in the hospital, how much information did you receive on equipment you might need once you went home? | None (49, 10.7%) | Some, but not enough (22, 4.8%) | As much as I needed; or No equipment needed (389, 84.6%) |
| 7 | Before you were discharged from the hospital, did anyone arrange community services for you to use at home? | No (42, 9.1%) | Yes; or No one needed to arrange because services were already in place or no services needed (418, 90.9%) | |
| 8 | Before you were discharged from the hospital, did anyone arrange equipment for you? | No (16, 3.5%) | Yes; or No one needed to because equipment already in place or no equipment needed (444, 96.5%) | |
| 9 | Before you were discharged from hospital, was there any other information you would have liked while you were in the hospital to prepare you for coping at home? | No (116, 25.2%) | Yes (344, 74.8%) | |
| 10 | After you were told you could leave the hospital, how confident did you feel about managing at home? | Not confident (25, 5.4%) | Unsure (103, 22.4%) | Confident (332, 72.2%) |
| 11 | Looking back to the time you left the hospital, overall, how prepared did you feel for returning home? | Unprepared (39, 8.5%) | Moderately prepared (132, 28.7%) | Very prepared (288, 62.6%) |
| 12 | After you were told you could leave the hospital, were there any delays on the day you left the hospital? | Yes (122, 26.5%) | No (338, 73.5%) | |
For an individual patient, the sum of the scores for each item yielded a B‐PREPARED scale value. In the 460‐patient cohort, B‐PREPARED scale values had a mean of 17.3 4.3 and a negatively skewed distribution. A high scale value reflected high perception of discharge preparedness. Each of the 11 items correlated significantly with the B‐PREPARED scale value (P < 0.001, 2‐tailed).
There were substantial ceiling effects with individual items but not in the B‐PREPARED total score. Five of the 9 items with 3 response options had a ceiling effect above 70%. Three items had a dichotomous response option (items 7, 8, and 9). In 2 of these 3 items, more than 90% of respondents selected the response indicating higher preparedness. The total B‐PREPARED did not have noteworthy floor or ceiling effects. In this sample's total B‐PREPARED scores, 0.2% of respondents had the lowest score of 3, and 20% had the highest score of 22.
Principal Component Analysis
In the component analysis, we evaluated the correlation matrix of the 11 items in the B‐PREPARED scale. A Kaiser‐Meyer‐Olkin statistic of 0.76 indicated sufficient sampling adequacy to extract components from the matrix. Principal components extracted 54.2% of the variance associated with the 11‐item B‐PREPARED scale. After inspection of scree plots, we determined that 3 components were extracted before the eigenvalue fell below 1. The pattern matrix for the promax rotation was inspected, and the factor loading of each item appears in Table 3. The item content identified the first component as self‐care information for medications and activities. The second component was equipment and services. The third component was confidence. All B‐PREPARED items loaded primarily on 1 of the 3 components (Table 3).
| Item text | Component | |||
|---|---|---|---|---|
| Self‐care Information for Medications and Activity | Equipment and Services | Confidence | ||
| 1 | While you were in the hospital, how much information did you receive about the medications that you were to take at home? | 0.749 | 0.032 | 0.019 |
| 2 | While you were in the hospital, how much information did you receive about the side effects of the medications that you were to take at home? | 0.778 | .008 | 0.003 |
| 3 | While you were in the hospital, were you given written instructions about your medications? If yes, did someone spend time explaining the written instructions? | 0.758 | 0.030 | 0.084 |
| 4 | While you were in the hospital, how much information did you receive on how you would manage your usual activities when you went home? | 0.581 | 0.101 | 0.195 |
| 5 | While you were in the hospital, how much information did you receive on community services you might use once you went home? | 0.158 | 0.639 | 0.124 |
| 6 | While you were in the hospital, how much information did you receive on equipment you might need once you went home? | 0.183 | 0.701 | ‐0.152 |
| 7 | Before you were discharged from the hospital, did anyone arrange community services for you to use at home? | 0.081 | 0.654 | 0.199 |
| 8 | Before you were discharged from the hospital, did anyone arrange equipment for you? | 0.138 | 0.655 | 0.095 |
| 9 | Before you were discharged from the hospital, was there any other information you would have liked while you were in the hospital to prepare you for coping at home? | 0.181 | 0.211 | 0.369 |
| 10 | After you were told you could leave the hospital, how confident did you feel about managing at home? | 0.036 | 0.058 | 0.876 |
| 11 | Looking back to the time you left the hospital, overall, how prepared did you feel for returning home? | 0.018 | 0.032 | 0.875 |
Construct Validity
We assessed 2 constructs: worry and satisfaction with medication information (SIMS). In the cohort, 25% of patients (115 of 460) reported worry about managing at home. Worried patients had significantly lower B‐PREPARED scale values (median [25%, 75%] = 14 [10, 16]) than patients who did not worry (median [25%, 75%] = 17 [14, 20], P < .001). We calculated SIMS and then correlated SIMS with B‐PREPARED and components. In the cohort, the mean SIMS was 12.1 4.7 (range 0‐17). Patients with greater satisfaction on the SIMS also had higher B‐PREPARED scale values (rho = 0.45, P < 0.001). There was a significant positive correlation between SIMS and the B‐PREPARED component called self‐care information for medications and activities (rho = 0.46, P < 0.001). The other 2 B‐PREPARED components, equipment/services and confidence, were positively correlated with SIMS at much lower levels (rho = 0.18 and rho = 0.24, respectively, both Fischer z transformations P < .001). The B‐PREPARED scale demonstrated validity with the constructs of worry and satisfaction with medication information.
Predictive Validity
We assessed the capacity of the B‐PREPARED to predict and discriminate groups of patients who did or did not visit emergency departments. Within 1 month of hospital discharge, 16.5% of the cohort (76 of 460 patients) had at least 1 visit to an emergency department. B‐PREPARED scale values were lower for those patients who visited emergency departments (median [25%, 75%] = 14 [12, 18]) than those who did not (median [25%, 75%] = 16 [13, 19], P = 0.011). The B‐PREPARED scale analysis supported the hypothesized relationship with emergency department visits.
Correlations between B‐PREPARED and Baseline Characteristics
We evaluated the correlations between a patient's B‐PREPARED scale value and baseline characteristics, shown in Table 1. There was a weak positive correlation with self‐rated health status (rho 0.17, P < .001). Patients who perceived better health status had higher B‐PREPARED scale values than those with poorer status. The other baseline characteristics in Table 1 were not associated with B‐PREPARED scale values.
DISCUSSION
The B‐PREPARED scale measures patients' perceptions of their preparedness for hospital discharge home. Scale items came from the PREPARED, a survey with validated psychometric properties in elderly patients. We assessed the B‐PREPARED in a cohort of young and elderly adult patients. We examined the B‐PREPARED instrument for internal consistency, construct validity, and predictive validity. In comparison with the domains identified in the full PREPARED instrument,9 the abbreviated B‐PREPARED scale identified similar domains. Some differences were anticipated because we limited items to those the respondents would be able to perceive before leaving the hospital.
The results of our study should be interpreted in the context of strengths and limitations. One of the strengths was the validity of the PREPARED, from which the B‐PREPARED was derived.7 The conceptually rigorous process used to develop the PREPARED questionnaire allowed us to draw from a bank of concise, well‐worded items.9 The B‐PREPARED extends validity to a population of adults of all ages with high risk for readmission. The other strength of the B‐PREPARED was the association with the clinically relevant constructs worry and satisfaction with medication information. The B‐PREPARED also discriminated between patients who did and those who did not return to emergency departments after discharge. Although the patient population for the B‐PREPARED validation was one of the strengths of this study, it is also a limitation. Our cohort lacked diversity with respect to readmission risk. The results of our study may not generalize to patients with low risk for repeated admission. Furthermore, all our patients were discharged home. The exclusion of other discharge destinations helped us to enroll a cohort with homogenous risk for readmission. However, our exclusion criteria did not allow us to validate the B‐PREPARED in patients discharged to nursing homes, inpatient rehabilitation units, or other acute care facilities.
Another limitation related to outpatient visits after discharge. We did not analyze outpatient sites other than emergency departments. For all of our study patients, the discharging hospitalist scheduled at least 1 outpatient visit with the primary care practitioner. For some patients, the hospitalist also scheduled postdischarge visits for diagnostic evaluations like cardiac stress tests, endoscopies, radiographs, or other laboratory tests. When these visits occurred, they represented successful execution of the discharge plan. Sometimes patients arrived for planned or unplanned outpatient visits with exacerbated symptoms or adverse events. These latter visits might represent failures of the discharge plan. Our data collection did not allow us to distinguish outpatient visits as successes or failures of the discharge plan. When we counted only emergency department visits, we may have underestimated the number of patients with adverse events who sought and received successful treatment in outpatient clinics. Future studies should consider ascertainment of planned and unplanned outpatient visits for exacerbated symptoms and adverse events.
After our study began enrollment, other investigators published the Readiness for Hospital Discharge Scale14 and Care Transitions Measure.15 The design and validation of these sampling instruments differed with each other and with the B‐PREPARED. The differences made the 3 scales complementary but not interchangeable. For example, investigators administered the 21‐item Readiness for Hospital Discharge Scale on the day of discharge to adult medical‐surgical patients, postpartum mothers, and parents of hospitalized children. In contrast, we administered the B‐PREPARED 1 week after discharge to adult internal medicine patients or their proxies. The Readiness for Hospital Discharge subscales were personal status, knowledge, coping ability, and expected support. These subscales were similar to the components of the B‐PREPARED. The Readiness for Hospital Discharge Scale demonstrated internal consistency and construct validity but did not predict patients who returned to emergency departments after hospital discharge.14 Future users of the Readiness for Hospital Discharge Scale or the B‐PREPARED should consider their patient populations and the date of administration when selecting 1 scale versus another. If brevity is important to a clinician or researcher, then the 11‐item B‐PREPARED scale may be considered.
The Care Transitions Measure also differed from the B‐PREPARED. The 15‐item Care Transitions Measure evaluated an adult population with a broad age range and with chronic obstructive pulmonary disease, heart failure, stroke, or hip fracture.15 The diseases represented in the population for the Care Transitions Measure were similar to those in the B‐PREPARED cohort, although the distribution of the diseases differed. When validating the Care Transitions Measure, investigators administered questionnaires 6 to 12 weeks after discharge. The Care Transitions Measure had 4 factors: critical understanding, preferences important, management preparation, and care plan. The factors of the Care Transitions Measure were comparable to the components of the B‐PREPARED, and both scales assessed medication self‐management. However, the Care Transitions Measure addressed patient preferences with specific items, whereas the B‐PREPARED used the scoring system to quantify patient preferences. Both the Care Transitions Measure and the B‐PREPARED demonstrated internal consistency and discriminated between patients who did and those who did not return to emergency departments after hospital discharge.15 When selecting a scale, future users should consider the B‐PREPARED only for assessments 1 week post discharge and should consider the Care Transitions Measure for later assessments.
There are applications of the B‐PREPARED scale in hospital quality improvement efforts. Hospitals have multiple motivations to pursue quality improvement projects related to discharge processes: satisfaction of patients, reduction in adverse events, relation with referring physicians, and accreditation by regulators.6, 16 When hospital‐based clinicians survey patients, they may wish to use a brief, reliable, and validated instrument like the B‐PREPARED questionnaire.
CONCLUSIONS
The B‐PREPARED provided a reliable and valid measure of patients' perceptions of their preparedness for hospital discharge home. Clinicians and researchers may find the B‐PREPARED useful to guide, assess, and compare discharge‐planning interventions.
Acknowledgements
The authors thank Dr. Karen Grimmer‐Somers, PhD, for permission to use the PREPARED instrument and for her thoughtful comments on the draft manuscript.
- ,,,.Discharge planning from hospital to home.Cochrane Database Syst Rev.2004;(1):CD000313.
- ,,.Written and verbal information versus verbal information only for patients being discharged from acute hospital settings to home.Cochrane Database Syst Rev.2003;(4):CD003716.
- ,,,,.The incidence and severity of adverse events affecting patients after discharge from the hospital.Ann Intern Med.2003;138:161–167.
- ,,, et al.Adverse events among medical patients after discharge from hospital.CMAJ.2004;170:345–349.
- ,,,,,.Factors associated with unplanned hospital readmission among patients 65 years of age and older in a Medicare managed care plan.Am J Med.1999;107:13–17.
- ,,,,,.Deficits in communication and information transfer between hospital‐based and primary care physicians: implications for patient safety and continuity of care.JAMA.2007;297:831–841.
- ,,,.Review of the literature on survey instruments used to collect data on hospital patients' perceptions of care.Health Serv Res.2005;40:1996–2017.
- ,.A patient‐centered model of care for hospital discharge.Clin Nurs Res.2004;13:117–136.
- ,.The development, validity and application of a new instrument to assess the quality of discharge planning activities from the community perspective.Int J Qual Health Care.2001;13:109–116.
- PREPARED Patient Questionnaire. Available at: http://www.unisa.edu.au/cahe/pubs/Patient%20scoring.pdf. Accessed June 14,2007.
- ,,.Predictive validity of a questionnaire that identifies older persons at risk for hospital admission.J Am Geriatr Soc.1995;43:374–377.
- ,,,.Predictive validity of the Pra instrument among older recipients of managed care.J Am Geriatr Soc.1997;45:614–617.
- ,,.The Satisfaction with Information about Medicines Scales (SIMS): a new measurement tool for audit and research.Qual Health Care.2001;10:135–140.
- ,.Psychometric properties of the Readiness for Hospital Discharge Scale.J Nurs Meas.2006;14:163–180.
- ,,.Assessing the quality of preparation for posthospital care from the patient's perspective: the care transitions measure.Med Care.2005;43:246–255.
- 2007 Hospital/critical access hospital national patient safety goals. Available at: http://www.jointcommission.org/PatientSafety/NationalPatientSafetyGoals. Accessed June 14,2007.
Copyright © 2008 Society of Hospital Medicine
Soft‐tissue gangrene secondary to mixed cryoglobulinemia
A 61‐year‐old Hispanic male with chronic hepatitis C presented with a 4‐week history of a nonpruritic skin rash involving his lower extremities, hands, arms, and right ear. He also reported purple discoloration of his right foot, along with pain in the extremity that worsened with ambulation. Physical examination revealed diffuse purpura of both arms and legs (Figure 1). The right foot was cold to the touch and purple to black in color (Figure 2). There were multiple skin ulcers of various sizes covering the anterior aspect of his legs bilaterally. Pedal pulses were 2/4. Laboratory evaluation revealed positive cryoglobulins with low C4 and CH50 concentrations of 3 mg/dL (10‐40) and 2 units/mL (60‐144), respectively. Other immunological studies were negative. Lower extremity arterial Doppler studies were normal.

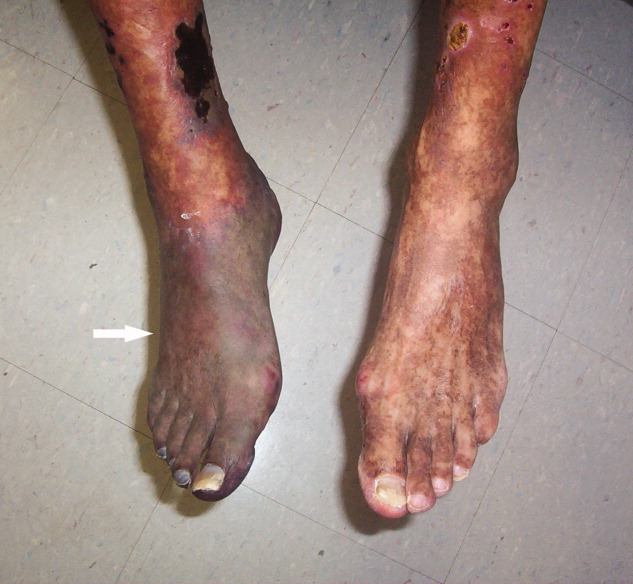
His clinical and laboratory findings were attributed to mixed cryoglobulinemia, and treatment, consisting of daily intravenous methylprednisolone, a single dose of intravenous cyclophosphamide, and plasmapheresis, was initiated. Despite these interventions, 5 days later, he developed severe burning pain in the right extremity with worsening discoloration and a line of demarcation at the level of his proximal midfoot. Eventually, right below the knee, amputation was performed, and histopathological examination showed soft‐tissue gangrene with avascular necrosis of the bone (Figure 3). The patient subsequently had an uneventful course. Plasmapheresis and oral prednisone were continued.
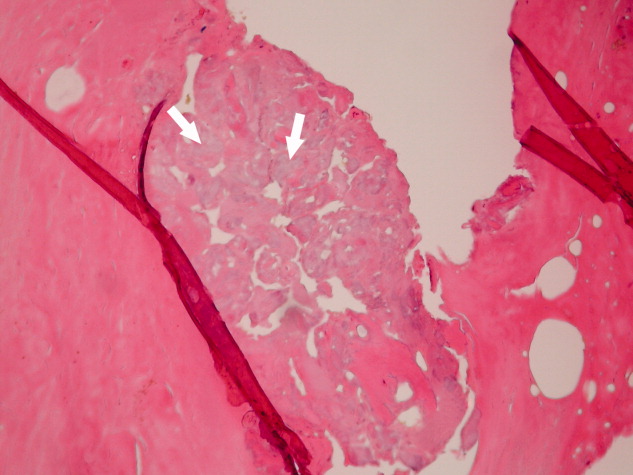
Cryoglobulinemia is a small‐ to medium‐vessel vasculitis due to cryoglobulin‐containing immune complexes. There are 3 types, with the classification based on an immunological analysis of the cryoglobulin composition. Hepatitis C virus infection is closely associated with type II mixed cryoglobulinemia. Cutaneous manifestations are the most common, consisting of palpable purpura, urticaria, postinflammatory hyperpigmentation, acrocyanosis, and skin ulcers. A serum cryoglobulin elevation is diagnostic and is usually accompanied by hypocomplementemia.
Treatment of the underlying disease is essential. However, aggressive therapy with plasmapheresis and immunosuppressive medications is warranted in severe cases involving limb‐ or organ‐threatening vasculitis.
A 61‐year‐old Hispanic male with chronic hepatitis C presented with a 4‐week history of a nonpruritic skin rash involving his lower extremities, hands, arms, and right ear. He also reported purple discoloration of his right foot, along with pain in the extremity that worsened with ambulation. Physical examination revealed diffuse purpura of both arms and legs (Figure 1). The right foot was cold to the touch and purple to black in color (Figure 2). There were multiple skin ulcers of various sizes covering the anterior aspect of his legs bilaterally. Pedal pulses were 2/4. Laboratory evaluation revealed positive cryoglobulins with low C4 and CH50 concentrations of 3 mg/dL (10‐40) and 2 units/mL (60‐144), respectively. Other immunological studies were negative. Lower extremity arterial Doppler studies were normal.
His clinical and laboratory findings were attributed to mixed cryoglobulinemia, and treatment, consisting of daily intravenous methylprednisolone, a single dose of intravenous cyclophosphamide, and plasmapheresis, was initiated. Despite these interventions, 5 days later, he developed severe burning pain in the right extremity with worsening discoloration and a line of demarcation at the level of his proximal midfoot. Eventually, right below the knee, amputation was performed, and histopathological examination showed soft‐tissue gangrene with avascular necrosis of the bone (Figure 3). The patient subsequently had an uneventful course. Plasmapheresis and oral prednisone were continued.
Cryoglobulinemia is a small‐ to medium‐vessel vasculitis due to cryoglobulin‐containing immune complexes. There are 3 types, with the classification based on an immunological analysis of the cryoglobulin composition. Hepatitis C virus infection is closely associated with type II mixed cryoglobulinemia. Cutaneous manifestations are the most common, consisting of palpable purpura, urticaria, postinflammatory hyperpigmentation, acrocyanosis, and skin ulcers. A serum cryoglobulin elevation is diagnostic and is usually accompanied by hypocomplementemia.
Treatment of the underlying disease is essential. However, aggressive therapy with plasmapheresis and immunosuppressive medications is warranted in severe cases involving limb‐ or organ‐threatening vasculitis.
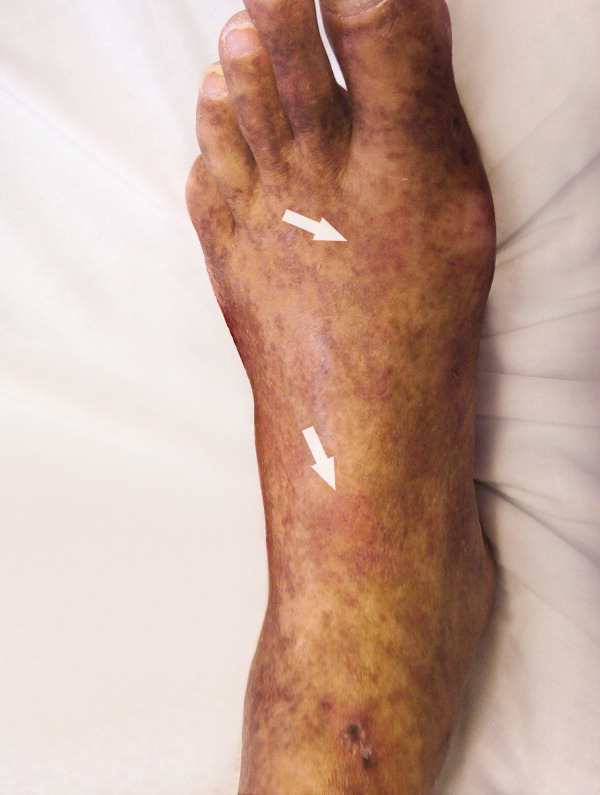
SHM Medication Reconciliation Survey Results
The Joint Commission's (TJC) National Patient Safety Goal (NPSG) #8Accurately and completely reconcile medications across the continuum of carechallenges hospitals to design and implement new medication management processes. With medication errors contributing to patient morbidity and mortality,1 establishing a comprehensive process for reconciling a patient's medications during the hospitalization episode is an important quality improvement and patient safety goal.
However, the current state of inpatient medication management is highly fragmented. Standard documentation is lacking, as is integration of information between care settings.2 There are now reports describing implementation of various medication reconciliation processes for admissions,3 transfers,4 and discharges.5
Hospitalists are well‐positioned to contribute to the implementation of medication reconciliation. Indeed, because TJC does not explicitly specify what type of health care provider (eg, physician, nurse, etc.) should assume responsibility for this process, institutions have designed workflows to suit their own needs, while striving to comply with national standards.
Given the complexity and lack of standardization around this NPSG, a survey was distributed to attendees of a Society of Hospital Medicine (SHM) national meeting to determine the various processes implemented thus far, and to ascertain existing challenges to implementation. We report here on the results.
METHODS
A survey tool (Appendix) was designed to query demographic and institutional factors, involvement in the process, and barriers to implementation of medication reconciliation. Surveys were included in all attendees' registration materials, resulting in the distributions of approximately 800 surveys.
Responses were entered into an Excel spreadsheet. Simple descriptive statistics were used to determine proportions for providers, processes, and barriers to implementation. Where appropriate, variables were dichotomized, allowing for paired t‐test analysis. Statistical significance was defined as a P value less than .05. Subgroup analyses by hospital type, provider type, and process method were performed.
RESULTS
A total of 295 completed surveys were collected. The responses are tabulated in Table 1.
| |
| Primary practice setting | |
| Academic tertiary center | 23% |
| Community teaching hospital | 29% |
| Non‐academic hospital | 43% |
| Patient population | |
| Adults only | 90% |
| Pediatrics only | 5% |
| Adults and pediatrics | 5% |
| State of implementation | |
| Fully implemented | 48% |
| Partially implemented | 35% |
| Planning stages | 11% |
| Unaware of plans to implement | 2% |
| Unaware of med reconciliation | 4% |
| Hospitalist involvement | |
| Active role | 36% |
| Peripheral role | 24% |
| No role | 31% |
| Process format | |
| Paper | 47% |
| Computer | 11% |
| Both paper and computer | 31% |
| Don't know | 2% |
| Measuring compliance | |
| Yes | 42% |
| No | 14% |
| Don't know | 34% |
| Measuring outcomes | |
| Yes | 22% |
| No | 25% |
| Don't know | 41% |
| Impact of medication reconciliation | |
| No impact | 9% |
| Positive impact | 58% |
| Negative impact | 7% |
| Don't know | 14% |
Process
A paper process was used most often (47%), followed by a combined process (31%), and computers alone in just 11% of cases. Measurement of process compliance was reported in less than half (42%), with 34% unaware if their institutions were monitoring compliance. Outcome measurement was recorded as not performed (25%) or unknown (41%) in a majority of cases. Respondents reported a favorable view of the future impact of medication reconciliation, with 58% citing likely positive impacts on patient safety and patient care; fewer were unsure (14%) or anticipated no impact (9%) or negative impact (7%). Survey results regarding responsibility for individual process steps are detailed in Table 2. Notably, respondents often indicated that both physicians and nurses would share responsibility for a given step. Physicians were more often responsible for reconciling home medications, updating discharge medication lists, and communicating to outpatient providers. Nursing performed reconciliation in only 10% of cases. Results across all steps demonstrated very low participation rates by pharmacists, with pharmacist responsibility for reconciliation only 6% of the time.
| Process Step | Physician | Nurse | Physician and Nurse | Pharmacist | Other |
|---|---|---|---|---|---|
| |||||
| Obtaining home med list | 15% | 39% | 41% | 3% | 2% |
| Documenting home med list | 17% | 41% | 37% | 2% | 3% |
| Reconciling medications | 56% | 10% | 21% | 6% | 7% |
| Updating discharge med list | 64% | 6% | 17% | 3% | 10% |
| Providing instructions at discharge | 15% | 46% | 32% | 2% | 5% |
| Communicating changes at follow‐up | 84% | 6% | 4% | 6% | 1% |
Hospital Type
Results of subgroup analyses by hospital type are detailed in Table 3. Community teaching hospitals (CTHs) were significantly more likely (57%) than nonteaching hospitals (NTHs) (49%) or tertiary academic centers (TACs) (35%) to have achieved full implementation. NTHs were significantly less likely to have involved hospitalists in implementation. Use of computer‐based processes at TACs was more common (27%) than in CTHs (9%) or NTHs (7%). TACs were significantly more likely to have a physician obtain the medication list (33%, compared with 15% and 7% for CTHs and NTHs, respectively), whereas NTHs were more likely to use nurses (50%) than were CTHs (31%) or TACs (26%). Similar significant differences were found among hospital types with regard to obtaining the preadmission medication list. Physicians in TACs (25%) were more likely to be responsible for giving discharge medication instructions than in CTHs (10%) or NTHs (14%, not significant compared with TACs).
| Academic Centers [AC] | Community Teaching Hospitals [CT] | Non‐Teaching Hospitals [NT] | P values (2‐tailed) | |||
|---|---|---|---|---|---|---|
| AC vs. CT | AC vs. NT | CT vs. NT | ||||
| ||||||
| State of implementation | ||||||
| Fully implemented | 25/71 (35) | 48/84 (57) | 68/139 (49) | 0.007 | 0.06 | 0.25 |
| Partially implemented | 31/71 (44) | 25/84 (30) | 48/139 (35) | 0.07 | 0.21 | 0.44 |
| Planning stages | 9/71 (13) | 9/84 (11) | 14/139 (10) | 0.70 | 0.51 | 0.81 |
| Unaware of plans to implement | 2/71 (3) | 1/84 (1) | 3/139 (2) | 0.37 | 0.65 | 0.57 |
| Unaware of med reconciliation | 4/71 (5) | 1/84 (1) | 6/139 (4) | 0.14 | 0.74 | 0.19 |
| Hospitalist involvement | ||||||
| Active role | 28/59 (47) | 34/80 (43) | 43/127 (34) | 0.64 | 0.09 | 0.19 |
| Peripheral role | 12/59 (20) | 25/80 (31) | 34/127 (27) | 0.15 | 0.30 | 0.54 |
| No role | 19/59 (32) | 19/80 (24) | 50/127 (39) | 0.30 | 0.36 | 0.03 |
| Process format | ||||||
| Paper | 26/59 (44) | 47/81 (58) | 63/127 (50) | 0.10 | 0.45 | 0.26 |
| Computer | 16/59 (27) | 7/81 (9) | 9/127 (7) | 0.005 | 0.001 | 0.60 |
| Both paper and computer | 17/59 (29) | 25/81 (31) | 51/127 (40) | 0.80 | 0.15 | 0.19 |
| Don't know | 0/59 (0) | 2/81 (2) | 4/127 (3) | 0.28 | 0.18 | 0.66 |
| Process steps (selected questions) | ||||||
| Obtaining home med list | ||||||
| Physician | 19/58 (33) | 12/80 (15) | 9/125 (7) | 0.013 | 0.001 | 0.07 |
| Physician and Nurse | 19/58 (33) | 39/80 (49) | 49/125 (39) | 0.47 | 0.44 | 0.16 |
| Nurse | 15/58 (26) | 25/80 (31) | 62/125 (50) | 0.005 | 0.003 | 0.008 |
| Pharmacist | 5/58 (9) | 1/80 (1) | 2/125 (2) | 0.06 | 0.03 | 0.58 |
| Documenting home med list | ||||||
| Physician | 22/58 (38) | 11/80 (14) | 11/125 (9) | 0.001 | 0.001 | 0.26 |
| Physician and Nurse | 15/58 (26) | 37/80 (46) | 45/125 (36) | 0.02 | 0.18 | 0.16 |
| Nurse | 18/58 (31) | 26/80 (32) | 64/125 (51) | 0.90 | 0.012 | 0.008 |
| Pharmacist | 3/58 (5) | 2/80 (3) | 1/125 (1) | 0.55 | 0.09 | 0.29 |
| Reconciling medications | ||||||
| Physician | 33/58 (57) | 51/80 (64) | 63/125 (50) | 0.41 | 0.42 | 0.051 |
| Physician and Nurse | 8/58 (14) | 14/80 (18) | 32/125 (26) | 0.53 | 0.09 | 0.18 |
| Nurse | 6/58 (10) | 6/80 (8) | 15/125 (12) | 0.68 | 0.71 | 0.36 |
| Pharmacist | 8/58 (14) | 5/80 (6) | 3/125 (2) | 0.11 | 0.007 | 0.13 |
| Updating discharge med list | ||||||
| Physician | 42/58 (72) | 50/80 (63) | 76/125 (61) | 0.27 | 0.15 | 0.77 |
| Physician and Nurse | 7/58 (12) | 16/80 (20) | 23/125 (18) | 0.22 | 0.31 | 0.72 |
| Nurse | 2/58 (3) | 5/80 (6) | 10/125 (8) | 0.41 | 0.20 | 0.59 |
| Pharmacist | 3/58 (5) | 3/80 (4) | 3/125 (2) | 0.78 | 0.27 | 0.40 |
| Providing instructions at discharge | ||||||
| Physician | 14/57 (25) | 8/80 (10) | 17/125 (14) | 0.02 | 0.07 | 0.40 |
| Physician and Nurse | 14/57 (25) | 30/80 (38) | 39/125 (31) | 0.11 | 0.41 | 0.30 |
| Nurse | 25/57 (44) | 37/80 (46) | 60/125 (48) | 0.82 | 0.62 | 0.80 |
| Pharmacist | 4/57 (7) | 1/80 (1) | 0/125 (0) | 0.06 | 0.003 | 0.26 |
Barriers
Results regarding barriers to successful implementation are shown in Table 4. Patient lack of knowledge of medications (87%) and absence of a preadmission medication list from other sources (80%) were common. Both paper and computer medication reconciliation processes were associated with respondents citing cumbersome hospital systems as a barrier; this barrier was cited more often when the implemented process was paper‐only (Table 5). Respondents who stated the medication reconciliation process takes too long did so regardless of whether the implemented process was paper‐based or computer‐based. Despite these barriers, only 16% of respondents stated that medication reconciliation was not worth the effort of implementation. Barriers reported were similar across hospital type (Table 6) with 2 exceptions. Formulary differences were noted to be a barrier more often in CTHs (78%) compared with NTHs (60%) and TACs (64%, not significant compared with CTHs). Language barriers were problematic more often in TACs (48%) than in NTHs (28%) or CTHs (36%, not significant compared with TACs).
| Barrier to Implementation | Yes | No | Unsure |
|---|---|---|---|
| |||
| Patient not knowing meds | 87% | 2% | 0% |
| Process takes too long | 53% | 28% | 8% |
| Med list not available | 80% | 9% | 0% |
| Process not worth effort | 16% | 60% | 12% |
| Cumbersome hospital systems | 52% | 33% | 4% |
| Formulary differences | 59% | 24% | 5% |
| Language barriers | 31% | 53% | 4% |
| No access to outside records | 63% | 23% | 2% |
| Lack of job clarity in process | 38% | 48% | 3% |
| Availability of med list at discharge | 27% | 57% | 3% |
| Barriers (Selected Questions) | Paper Only [P] | Computer Only [C] | Paper and Computer [PC] | P values (2‐tailed) | ||
|---|---|---|---|---|---|---|
| P vs. C | P vs. PC | C vs. PC | ||||
| ||||||
| Process takes too long | ||||||
| Yes | 77/134 (57) | 19/31 (61) | 55/91 (60) | 0.69 | 0.65 | 0.92 |
| No | 43/134 (32) | 11/31 (35) | 28/91 (31) | 0.75 | 0.87 | 0.68 |
| Unsure | 14/134 (10) | 1/31 (3) | 8/91 (9) | 0.21 | 0.80 | 0.27 |
| Process not worth effort | ||||||
| Yes | 24/133 (18) | 3/31 (10) | 17/91 (19) | 0.28 | 0.85 | 0.25 |
| No | 93/133 (70) | 22/31 (71) | 62/91 (68) | 0.91 | 0.75 | 0.76 |
| Unsure | 16/133 (12) | 6/31 (19) | 12/91 (13) | 0.30 | 0.82 | 0.41 |
| Cumbersome hospital systems | ||||||
| Yes | 86/133 (65) | 16/31 (52) | 46/92 (50) | 0.18 | 0.03 | 0.85 |
| No | 42/133 (32) | 13/31 (42) | 42/92 (46) | 0.29 | 0.03 | 0.70 |
| Unsure | 5/133 (4) | 2/31 (6) | 4/92 (4) | 0.62 | 0.82 | 0.64 |
| Barrier to Implementation (Selected Questions) | Academic Centers [AC] | Community Teaching Hospitals [CT] | Non‐Teaching Hospitals [NT] | P values | ||
|---|---|---|---|---|---|---|
| AC vs. CT | AC vs. NT | CT vs. NT | ||||
| ||||||
| Process takes too long | ||||||
| Yes | 37/58 (64) | 49/78 (63) | 70/124 (56) | 0.90 | 0.31 | 0.37 |
| No | 15/58 (26) | 24/78 (31) | 42/124 (34) | 0.53 | 0.28 | 0.66 |
| Unsure | 6/58 (10) | 5/78 (6) | 12/124 (10) | 0.39 | 0.88 | 0.32 |
| Process not worth effort | ||||||
| Yes | 7/58 (12) | 16/78 (21) | 23/123 (19) | 0.17 | 0.24 | 0.73 |
| No | 42/58 (72) | 52/78 (67) | 84/123 (68) | 0.53 | 0.59 | 0.88 |
| Unsure | 9/58 (16) | 10/78 (12) | 16/123 (13) | 0.50 | 0.59 | 0.84 |
| Cumbersome hospital systems | ||||||
| Yes | 36/58 (62) | 46/79 (58) | 69/123 (56) | 0.64 | 0.45 | 0.78 |
| No | 19/58 (33) | 32/79 (41) | 46/123 (37) | 0.34 | 0.60 | 0.57 |
| Unsure | 3/58 (5) | 1/79 (1) | 8/123 (7) | 0.16 | 0.61 | 0.049 |
| Formulary differences | ||||||
| Yes | 37/58 (64) | 61/78 (78) | 74/123 (60) | 0.07 | 0.61 | 0.009 |
| No | 16/58 (28) | 14/78 (18) | 41/123 (33) | 0.17 | 0.50 | 0.02 |
| Unsure | 5/58 (8) | 2/78 (3) | 8/123 (7) | 0.19 | 0.81 | 0.22 |
| Language barriers | ||||||
| Yes | 28/58 (48) | 28/77 (36) | 34/123 (28) | 0.16 | 0.009 | 0.24 |
| No | 28/58 (48) | 46/77 (60) | 82/123 (67) | 0.17 | 0.016 | 0.32 |
| Unsure | 2/58 (3) | 3/77 (4) | 7/123 (5) | 0.76 | 0.54 | 0.74 |
| No access to outside records | ||||||
| Yes | 38/58 (66) | 60/79 (76) | 87/123 (71) | 0.20 | 0.50 | 0.44 |
| No | 18/58 (31) | 18/79 (23) | 33/123 (27) | 0.30 | 0.58 | 0.52 |
| Unsure | 2/58 (3) | 1/79 (1) | 3/123 (2) | 0.39 | 0.68 | 0.58 |
| Lack of job clarity in process | ||||||
| Yes | 26/58 (45) | 31/79 (39) | 49/121 (40) | 0.48 | 0.53 | 0.89 |
| No | 28/58 (48) | 46/79 (58) | 68/121 (56) | 0.25 | 0.32 | 0.78 |
| Unsure | 4/58 (7) | 2/79 (3) | 4/121 (3) | 0.28 | 0.22 | 0.75 |
| Availability of med list at discharge | ||||||
| Yes | 20/58 (34) | 24/79 (30) | 35/120 (29) | 0.62 | 0.50 | 0.88 |
| No | 36/58 (62) | 54/79 (68) | 78/120 (65) | 0.47 | 0.70 | 0.66 |
| Unsure | 0/58 (0) | 1/79 (1) | 7/120 (6) | 0.45 | 0.06 | 0.08 |
DISCUSSION
Managing medication information for inpatients is an extremely complex task. On admission, home medication lists are often inaccurate or absent,6 requiring extra time and effort to discover this information. By discharge, medication regimens have frequently been altered,7 making communication of changes to the next provider essential. One study described myriad provider, patient, and health system issues in maintaining accurate outpatient medication lists.8 These issues are further compounded by the multiple prescribers, necessary hand‐offs, and formulary differences in the inpatient setting.
Over half of the hospitalists in this survey reported hospitalist involvement in design and implementation of medication reconciliation. Given the familiarity with hospital systems and inpatient workflow, hospitalists are well‐positioned to contribute to successful implementation. Nonetheless, many were unaware of efforts to implement this NPSG.
Measurement of both process and outcome measures is important when determining value in quality improvement. Beyond process measures, outcome measures such as adverse drug events, readmission rates, mortality, patient satisfaction, and outpatient provider satisfaction may be appropriate in evaluating medication reconciliation strategies. Even measuring the accuracy of the process with respect to the admission orders written would be a valuable source of information for further improvement. Unfortunately, respondents indicated that evaluation was occurring infrequently. Potentially more problematic is the apparent lack of clarity regarding identification of healthcare provider responsibility for specific process steps. By far the least uniformity is in the acquisition and documentation of the preadmission medication list. There is variability in who is assigned to perform this task, but a substantial number of respondents indicated that their process involved a shared responsibility between physicians and nurses. It is unclear whether this phenomenon reflects the complexity of inpatient medication information management, or is simply an attempt to distribute the work among providers. Sharing the work between physicians and nurses may increase the overall likelihood for compliance and possibly improve the safety and accuracy of the process, especially if the physicians and nurses take the medication history in a redundant fashion and share their findings. Conversely, compliance may decrease if each provider merely expects the other to complete the process. Optimally, an interdisciplinary workflow for medication history taking would be in place, involving both physicians and nurses, with the availability of pharmacist consultation in complex cases. However, our survey data suggest this is infrequent; resident physicians appear to be the ones shouldering substantial responsibility for medication reconciliation in tertiary academic centers. Further research into the accuracy of medication reconciliation processes involving different strategies for medication information collection would be useful.
We documented several barriers to successful implementation of medication reconciliation. Physicians cited a lack of medication knowledge on the part of the patient and unavailable prior medication lists as substantial barriers to success. Many medication reconciliation processes are limited by issues of poor health literacy or inadequate patient knowledge about medications. This lack of medication knowledge is especially problematic for patients new to a healthcare system. It will be important to implement processes that not only reconcile medications accurately, but also make medication information available for future care episodes.
Time required to complete the process was also important. Certain elements of the medication reconciliation process are new work, and integrating the process into existing workflows is crucial. Given the significant time commitment required, the rare involvement of pharmacists at most institutions is striking. It appears that hospital pharmacists do not currently own any of the medication reconciliation process steps at most facilities, despite having formal training in medication history‐taking. In the 2006 ASHP national hospital pharmacy survey, one‐third of pharmacists stated that there were not enough pharmacy resources to meet medication reconciliation demands; only 19% of those surveyed stated pharmacists provided medication education at discharge to more than 25% of their patients.9
This report has several limitations. The survey used was not comprehensive, and only represents a convenience sample of hospitalists attending anational meeting. Nearly 300 physicians responded, representing both teaching and private hospital settings. We consider the response rate of 37% reasonable for a survey of this nature, and the variety of processes described is likely indicative of the overall status of medication reconciliation implementation. The over‐representation of certain institutions in our survey is possible, especially those with large or influential hospital medicine programs. Our survey did not ask respondents to name their home institutions. In addition, this design is open to a convenience sample bias, in that surveying only national meeting attendees (rather than the entire SHM membership) risks overinclusion of those hospitalists involved in leadership roles and quality improvement projects. Despite this, the variety of processes described is likely indicative of the overall status of medication reconciliation implementation in mid‐2006. It is possible that processes have become more uniform nationwide in the interim.
Our survey results reflect the complexity surrounding medication reconciliation. It appears that full implementation has not yet occurred everywhere, significant barriers remain, and outcome measurement is limited. Importantly, physicians, nurses, and pharmacists do not have standardized roles. Responsibility for medication reconciliation has predominantly been added to the existing duties of inpatient physicians and nurses, with limited involvement of pharmacists. Hospitalists are well‐positioned to lead the ongoing implementation of medication reconciliation processes and should take advantage of their systems knowledge to effectively partner with other physicians, nurses, and pharmacists to achieve success in medication reconciliation.
Acknowledgements
The authors thank Ken Epstein, MD, and Renee Meadows, MD, along with the entire SHM Medication Reconciliation Task Force for their helpful review and comments on the article.
Appendix
|
|
- Kohn LT,Corrigan JM,Donaldson MS, eds.To Err Is Human: Building a Safer Health System.Washington, DC:National Academy Press;1999.
- .Medication reconciliation: transfer of medication information across settings – keeping it free from error.Am J Nurs.2005;105(3 Suppl):31–36.
- ,,, et al.Reconciliation of discrepancies in medication histories and admission orders of newly hospitalized patients.Am J Health‐Syst Pharm.2004;61(16):1689–1695.
- ,,, et al.Medication reconciliation: a practical tool to reduce the risk of medication errors.J Crit Care.2003;18(4):201–205.
- ,,,.Evaluation of a new integrated discharge prescription form.Ann Pharmacother.2001;35(7‐8):953–958.
- ,,, et al.Patient safety standardization as a mechanism to improve safety in health care.Jt Comm J Qual Saf.2004;30(1):5–14.
- ,,.What happens to long‐term medication when general practice patients are referred to hospital?Eur J Clin Pharmacol.1996;50(4):253–257.
- ,,, et al.An experiential interdisciplinary quality improvement education initiative.Am J Med Qual.2006;21(5):317–322.
- ,,.ASHP national survey of pharmacy practice in hospital settings: monitoring and patient education‐2006.Am J Health‐Syst Pharm.2007;64(5):507–520.
The Joint Commission's (TJC) National Patient Safety Goal (NPSG) #8Accurately and completely reconcile medications across the continuum of carechallenges hospitals to design and implement new medication management processes. With medication errors contributing to patient morbidity and mortality,1 establishing a comprehensive process for reconciling a patient's medications during the hospitalization episode is an important quality improvement and patient safety goal.
However, the current state of inpatient medication management is highly fragmented. Standard documentation is lacking, as is integration of information between care settings.2 There are now reports describing implementation of various medication reconciliation processes for admissions,3 transfers,4 and discharges.5
Hospitalists are well‐positioned to contribute to the implementation of medication reconciliation. Indeed, because TJC does not explicitly specify what type of health care provider (eg, physician, nurse, etc.) should assume responsibility for this process, institutions have designed workflows to suit their own needs, while striving to comply with national standards.
Given the complexity and lack of standardization around this NPSG, a survey was distributed to attendees of a Society of Hospital Medicine (SHM) national meeting to determine the various processes implemented thus far, and to ascertain existing challenges to implementation. We report here on the results.
METHODS
A survey tool (Appendix) was designed to query demographic and institutional factors, involvement in the process, and barriers to implementation of medication reconciliation. Surveys were included in all attendees' registration materials, resulting in the distributions of approximately 800 surveys.
Responses were entered into an Excel spreadsheet. Simple descriptive statistics were used to determine proportions for providers, processes, and barriers to implementation. Where appropriate, variables were dichotomized, allowing for paired t‐test analysis. Statistical significance was defined as a P value less than .05. Subgroup analyses by hospital type, provider type, and process method were performed.
RESULTS
A total of 295 completed surveys were collected. The responses are tabulated in Table 1.
| |
| Primary practice setting | |
| Academic tertiary center | 23% |
| Community teaching hospital | 29% |
| Non‐academic hospital | 43% |
| Patient population | |
| Adults only | 90% |
| Pediatrics only | 5% |
| Adults and pediatrics | 5% |
| State of implementation | |
| Fully implemented | 48% |
| Partially implemented | 35% |
| Planning stages | 11% |
| Unaware of plans to implement | 2% |
| Unaware of med reconciliation | 4% |
| Hospitalist involvement | |
| Active role | 36% |
| Peripheral role | 24% |
| No role | 31% |
| Process format | |
| Paper | 47% |
| Computer | 11% |
| Both paper and computer | 31% |
| Don't know | 2% |
| Measuring compliance | |
| Yes | 42% |
| No | 14% |
| Don't know | 34% |
| Measuring outcomes | |
| Yes | 22% |
| No | 25% |
| Don't know | 41% |
| Impact of medication reconciliation | |
| No impact | 9% |
| Positive impact | 58% |
| Negative impact | 7% |
| Don't know | 14% |
Process
A paper process was used most often (47%), followed by a combined process (31%), and computers alone in just 11% of cases. Measurement of process compliance was reported in less than half (42%), with 34% unaware if their institutions were monitoring compliance. Outcome measurement was recorded as not performed (25%) or unknown (41%) in a majority of cases. Respondents reported a favorable view of the future impact of medication reconciliation, with 58% citing likely positive impacts on patient safety and patient care; fewer were unsure (14%) or anticipated no impact (9%) or negative impact (7%). Survey results regarding responsibility for individual process steps are detailed in Table 2. Notably, respondents often indicated that both physicians and nurses would share responsibility for a given step. Physicians were more often responsible for reconciling home medications, updating discharge medication lists, and communicating to outpatient providers. Nursing performed reconciliation in only 10% of cases. Results across all steps demonstrated very low participation rates by pharmacists, with pharmacist responsibility for reconciliation only 6% of the time.
| Process Step | Physician | Nurse | Physician and Nurse | Pharmacist | Other |
|---|---|---|---|---|---|
| |||||
| Obtaining home med list | 15% | 39% | 41% | 3% | 2% |
| Documenting home med list | 17% | 41% | 37% | 2% | 3% |
| Reconciling medications | 56% | 10% | 21% | 6% | 7% |
| Updating discharge med list | 64% | 6% | 17% | 3% | 10% |
| Providing instructions at discharge | 15% | 46% | 32% | 2% | 5% |
| Communicating changes at follow‐up | 84% | 6% | 4% | 6% | 1% |
Hospital Type
Results of subgroup analyses by hospital type are detailed in Table 3. Community teaching hospitals (CTHs) were significantly more likely (57%) than nonteaching hospitals (NTHs) (49%) or tertiary academic centers (TACs) (35%) to have achieved full implementation. NTHs were significantly less likely to have involved hospitalists in implementation. Use of computer‐based processes at TACs was more common (27%) than in CTHs (9%) or NTHs (7%). TACs were significantly more likely to have a physician obtain the medication list (33%, compared with 15% and 7% for CTHs and NTHs, respectively), whereas NTHs were more likely to use nurses (50%) than were CTHs (31%) or TACs (26%). Similar significant differences were found among hospital types with regard to obtaining the preadmission medication list. Physicians in TACs (25%) were more likely to be responsible for giving discharge medication instructions than in CTHs (10%) or NTHs (14%, not significant compared with TACs).
| Academic Centers [AC] | Community Teaching Hospitals [CT] | Non‐Teaching Hospitals [NT] | P values (2‐tailed) | |||
|---|---|---|---|---|---|---|
| AC vs. CT | AC vs. NT | CT vs. NT | ||||
| ||||||
| State of implementation | ||||||
| Fully implemented | 25/71 (35) | 48/84 (57) | 68/139 (49) | 0.007 | 0.06 | 0.25 |
| Partially implemented | 31/71 (44) | 25/84 (30) | 48/139 (35) | 0.07 | 0.21 | 0.44 |
| Planning stages | 9/71 (13) | 9/84 (11) | 14/139 (10) | 0.70 | 0.51 | 0.81 |
| Unaware of plans to implement | 2/71 (3) | 1/84 (1) | 3/139 (2) | 0.37 | 0.65 | 0.57 |
| Unaware of med reconciliation | 4/71 (5) | 1/84 (1) | 6/139 (4) | 0.14 | 0.74 | 0.19 |
| Hospitalist involvement | ||||||
| Active role | 28/59 (47) | 34/80 (43) | 43/127 (34) | 0.64 | 0.09 | 0.19 |
| Peripheral role | 12/59 (20) | 25/80 (31) | 34/127 (27) | 0.15 | 0.30 | 0.54 |
| No role | 19/59 (32) | 19/80 (24) | 50/127 (39) | 0.30 | 0.36 | 0.03 |
| Process format | ||||||
| Paper | 26/59 (44) | 47/81 (58) | 63/127 (50) | 0.10 | 0.45 | 0.26 |
| Computer | 16/59 (27) | 7/81 (9) | 9/127 (7) | 0.005 | 0.001 | 0.60 |
| Both paper and computer | 17/59 (29) | 25/81 (31) | 51/127 (40) | 0.80 | 0.15 | 0.19 |
| Don't know | 0/59 (0) | 2/81 (2) | 4/127 (3) | 0.28 | 0.18 | 0.66 |
| Process steps (selected questions) | ||||||
| Obtaining home med list | ||||||
| Physician | 19/58 (33) | 12/80 (15) | 9/125 (7) | 0.013 | 0.001 | 0.07 |
| Physician and Nurse | 19/58 (33) | 39/80 (49) | 49/125 (39) | 0.47 | 0.44 | 0.16 |
| Nurse | 15/58 (26) | 25/80 (31) | 62/125 (50) | 0.005 | 0.003 | 0.008 |
| Pharmacist | 5/58 (9) | 1/80 (1) | 2/125 (2) | 0.06 | 0.03 | 0.58 |
| Documenting home med list | ||||||
| Physician | 22/58 (38) | 11/80 (14) | 11/125 (9) | 0.001 | 0.001 | 0.26 |
| Physician and Nurse | 15/58 (26) | 37/80 (46) | 45/125 (36) | 0.02 | 0.18 | 0.16 |
| Nurse | 18/58 (31) | 26/80 (32) | 64/125 (51) | 0.90 | 0.012 | 0.008 |
| Pharmacist | 3/58 (5) | 2/80 (3) | 1/125 (1) | 0.55 | 0.09 | 0.29 |
| Reconciling medications | ||||||
| Physician | 33/58 (57) | 51/80 (64) | 63/125 (50) | 0.41 | 0.42 | 0.051 |
| Physician and Nurse | 8/58 (14) | 14/80 (18) | 32/125 (26) | 0.53 | 0.09 | 0.18 |
| Nurse | 6/58 (10) | 6/80 (8) | 15/125 (12) | 0.68 | 0.71 | 0.36 |
| Pharmacist | 8/58 (14) | 5/80 (6) | 3/125 (2) | 0.11 | 0.007 | 0.13 |
| Updating discharge med list | ||||||
| Physician | 42/58 (72) | 50/80 (63) | 76/125 (61) | 0.27 | 0.15 | 0.77 |
| Physician and Nurse | 7/58 (12) | 16/80 (20) | 23/125 (18) | 0.22 | 0.31 | 0.72 |
| Nurse | 2/58 (3) | 5/80 (6) | 10/125 (8) | 0.41 | 0.20 | 0.59 |
| Pharmacist | 3/58 (5) | 3/80 (4) | 3/125 (2) | 0.78 | 0.27 | 0.40 |
| Providing instructions at discharge | ||||||
| Physician | 14/57 (25) | 8/80 (10) | 17/125 (14) | 0.02 | 0.07 | 0.40 |
| Physician and Nurse | 14/57 (25) | 30/80 (38) | 39/125 (31) | 0.11 | 0.41 | 0.30 |
| Nurse | 25/57 (44) | 37/80 (46) | 60/125 (48) | 0.82 | 0.62 | 0.80 |
| Pharmacist | 4/57 (7) | 1/80 (1) | 0/125 (0) | 0.06 | 0.003 | 0.26 |
Barriers
Results regarding barriers to successful implementation are shown in Table 4. Patient lack of knowledge of medications (87%) and absence of a preadmission medication list from other sources (80%) were common. Both paper and computer medication reconciliation processes were associated with respondents citing cumbersome hospital systems as a barrier; this barrier was cited more often when the implemented process was paper‐only (Table 5). Respondents who stated the medication reconciliation process takes too long did so regardless of whether the implemented process was paper‐based or computer‐based. Despite these barriers, only 16% of respondents stated that medication reconciliation was not worth the effort of implementation. Barriers reported were similar across hospital type (Table 6) with 2 exceptions. Formulary differences were noted to be a barrier more often in CTHs (78%) compared with NTHs (60%) and TACs (64%, not significant compared with CTHs). Language barriers were problematic more often in TACs (48%) than in NTHs (28%) or CTHs (36%, not significant compared with TACs).
| Barrier to Implementation | Yes | No | Unsure |
|---|---|---|---|
| |||
| Patient not knowing meds | 87% | 2% | 0% |
| Process takes too long | 53% | 28% | 8% |
| Med list not available | 80% | 9% | 0% |
| Process not worth effort | 16% | 60% | 12% |
| Cumbersome hospital systems | 52% | 33% | 4% |
| Formulary differences | 59% | 24% | 5% |
| Language barriers | 31% | 53% | 4% |
| No access to outside records | 63% | 23% | 2% |
| Lack of job clarity in process | 38% | 48% | 3% |
| Availability of med list at discharge | 27% | 57% | 3% |
| Barriers (Selected Questions) | Paper Only [P] | Computer Only [C] | Paper and Computer [PC] | P values (2‐tailed) | ||
|---|---|---|---|---|---|---|
| P vs. C | P vs. PC | C vs. PC | ||||
| ||||||
| Process takes too long | ||||||
| Yes | 77/134 (57) | 19/31 (61) | 55/91 (60) | 0.69 | 0.65 | 0.92 |
| No | 43/134 (32) | 11/31 (35) | 28/91 (31) | 0.75 | 0.87 | 0.68 |
| Unsure | 14/134 (10) | 1/31 (3) | 8/91 (9) | 0.21 | 0.80 | 0.27 |
| Process not worth effort | ||||||
| Yes | 24/133 (18) | 3/31 (10) | 17/91 (19) | 0.28 | 0.85 | 0.25 |
| No | 93/133 (70) | 22/31 (71) | 62/91 (68) | 0.91 | 0.75 | 0.76 |
| Unsure | 16/133 (12) | 6/31 (19) | 12/91 (13) | 0.30 | 0.82 | 0.41 |
| Cumbersome hospital systems | ||||||
| Yes | 86/133 (65) | 16/31 (52) | 46/92 (50) | 0.18 | 0.03 | 0.85 |
| No | 42/133 (32) | 13/31 (42) | 42/92 (46) | 0.29 | 0.03 | 0.70 |
| Unsure | 5/133 (4) | 2/31 (6) | 4/92 (4) | 0.62 | 0.82 | 0.64 |
| Barrier to Implementation (Selected Questions) | Academic Centers [AC] | Community Teaching Hospitals [CT] | Non‐Teaching Hospitals [NT] | P values | ||
|---|---|---|---|---|---|---|
| AC vs. CT | AC vs. NT | CT vs. NT | ||||
| ||||||
| Process takes too long | ||||||
| Yes | 37/58 (64) | 49/78 (63) | 70/124 (56) | 0.90 | 0.31 | 0.37 |
| No | 15/58 (26) | 24/78 (31) | 42/124 (34) | 0.53 | 0.28 | 0.66 |
| Unsure | 6/58 (10) | 5/78 (6) | 12/124 (10) | 0.39 | 0.88 | 0.32 |
| Process not worth effort | ||||||
| Yes | 7/58 (12) | 16/78 (21) | 23/123 (19) | 0.17 | 0.24 | 0.73 |
| No | 42/58 (72) | 52/78 (67) | 84/123 (68) | 0.53 | 0.59 | 0.88 |
| Unsure | 9/58 (16) | 10/78 (12) | 16/123 (13) | 0.50 | 0.59 | 0.84 |
| Cumbersome hospital systems | ||||||
| Yes | 36/58 (62) | 46/79 (58) | 69/123 (56) | 0.64 | 0.45 | 0.78 |
| No | 19/58 (33) | 32/79 (41) | 46/123 (37) | 0.34 | 0.60 | 0.57 |
| Unsure | 3/58 (5) | 1/79 (1) | 8/123 (7) | 0.16 | 0.61 | 0.049 |
| Formulary differences | ||||||
| Yes | 37/58 (64) | 61/78 (78) | 74/123 (60) | 0.07 | 0.61 | 0.009 |
| No | 16/58 (28) | 14/78 (18) | 41/123 (33) | 0.17 | 0.50 | 0.02 |
| Unsure | 5/58 (8) | 2/78 (3) | 8/123 (7) | 0.19 | 0.81 | 0.22 |
| Language barriers | ||||||
| Yes | 28/58 (48) | 28/77 (36) | 34/123 (28) | 0.16 | 0.009 | 0.24 |
| No | 28/58 (48) | 46/77 (60) | 82/123 (67) | 0.17 | 0.016 | 0.32 |
| Unsure | 2/58 (3) | 3/77 (4) | 7/123 (5) | 0.76 | 0.54 | 0.74 |
| No access to outside records | ||||||
| Yes | 38/58 (66) | 60/79 (76) | 87/123 (71) | 0.20 | 0.50 | 0.44 |
| No | 18/58 (31) | 18/79 (23) | 33/123 (27) | 0.30 | 0.58 | 0.52 |
| Unsure | 2/58 (3) | 1/79 (1) | 3/123 (2) | 0.39 | 0.68 | 0.58 |
| Lack of job clarity in process | ||||||
| Yes | 26/58 (45) | 31/79 (39) | 49/121 (40) | 0.48 | 0.53 | 0.89 |
| No | 28/58 (48) | 46/79 (58) | 68/121 (56) | 0.25 | 0.32 | 0.78 |
| Unsure | 4/58 (7) | 2/79 (3) | 4/121 (3) | 0.28 | 0.22 | 0.75 |
| Availability of med list at discharge | ||||||
| Yes | 20/58 (34) | 24/79 (30) | 35/120 (29) | 0.62 | 0.50 | 0.88 |
| No | 36/58 (62) | 54/79 (68) | 78/120 (65) | 0.47 | 0.70 | 0.66 |
| Unsure | 0/58 (0) | 1/79 (1) | 7/120 (6) | 0.45 | 0.06 | 0.08 |
DISCUSSION
Managing medication information for inpatients is an extremely complex task. On admission, home medication lists are often inaccurate or absent,6 requiring extra time and effort to discover this information. By discharge, medication regimens have frequently been altered,7 making communication of changes to the next provider essential. One study described myriad provider, patient, and health system issues in maintaining accurate outpatient medication lists.8 These issues are further compounded by the multiple prescribers, necessary hand‐offs, and formulary differences in the inpatient setting.
Over half of the hospitalists in this survey reported hospitalist involvement in design and implementation of medication reconciliation. Given the familiarity with hospital systems and inpatient workflow, hospitalists are well‐positioned to contribute to successful implementation. Nonetheless, many were unaware of efforts to implement this NPSG.
Measurement of both process and outcome measures is important when determining value in quality improvement. Beyond process measures, outcome measures such as adverse drug events, readmission rates, mortality, patient satisfaction, and outpatient provider satisfaction may be appropriate in evaluating medication reconciliation strategies. Even measuring the accuracy of the process with respect to the admission orders written would be a valuable source of information for further improvement. Unfortunately, respondents indicated that evaluation was occurring infrequently. Potentially more problematic is the apparent lack of clarity regarding identification of healthcare provider responsibility for specific process steps. By far the least uniformity is in the acquisition and documentation of the preadmission medication list. There is variability in who is assigned to perform this task, but a substantial number of respondents indicated that their process involved a shared responsibility between physicians and nurses. It is unclear whether this phenomenon reflects the complexity of inpatient medication information management, or is simply an attempt to distribute the work among providers. Sharing the work between physicians and nurses may increase the overall likelihood for compliance and possibly improve the safety and accuracy of the process, especially if the physicians and nurses take the medication history in a redundant fashion and share their findings. Conversely, compliance may decrease if each provider merely expects the other to complete the process. Optimally, an interdisciplinary workflow for medication history taking would be in place, involving both physicians and nurses, with the availability of pharmacist consultation in complex cases. However, our survey data suggest this is infrequent; resident physicians appear to be the ones shouldering substantial responsibility for medication reconciliation in tertiary academic centers. Further research into the accuracy of medication reconciliation processes involving different strategies for medication information collection would be useful.
We documented several barriers to successful implementation of medication reconciliation. Physicians cited a lack of medication knowledge on the part of the patient and unavailable prior medication lists as substantial barriers to success. Many medication reconciliation processes are limited by issues of poor health literacy or inadequate patient knowledge about medications. This lack of medication knowledge is especially problematic for patients new to a healthcare system. It will be important to implement processes that not only reconcile medications accurately, but also make medication information available for future care episodes.
Time required to complete the process was also important. Certain elements of the medication reconciliation process are new work, and integrating the process into existing workflows is crucial. Given the significant time commitment required, the rare involvement of pharmacists at most institutions is striking. It appears that hospital pharmacists do not currently own any of the medication reconciliation process steps at most facilities, despite having formal training in medication history‐taking. In the 2006 ASHP national hospital pharmacy survey, one‐third of pharmacists stated that there were not enough pharmacy resources to meet medication reconciliation demands; only 19% of those surveyed stated pharmacists provided medication education at discharge to more than 25% of their patients.9
This report has several limitations. The survey used was not comprehensive, and only represents a convenience sample of hospitalists attending anational meeting. Nearly 300 physicians responded, representing both teaching and private hospital settings. We consider the response rate of 37% reasonable for a survey of this nature, and the variety of processes described is likely indicative of the overall status of medication reconciliation implementation. The over‐representation of certain institutions in our survey is possible, especially those with large or influential hospital medicine programs. Our survey did not ask respondents to name their home institutions. In addition, this design is open to a convenience sample bias, in that surveying only national meeting attendees (rather than the entire SHM membership) risks overinclusion of those hospitalists involved in leadership roles and quality improvement projects. Despite this, the variety of processes described is likely indicative of the overall status of medication reconciliation implementation in mid‐2006. It is possible that processes have become more uniform nationwide in the interim.
Our survey results reflect the complexity surrounding medication reconciliation. It appears that full implementation has not yet occurred everywhere, significant barriers remain, and outcome measurement is limited. Importantly, physicians, nurses, and pharmacists do not have standardized roles. Responsibility for medication reconciliation has predominantly been added to the existing duties of inpatient physicians and nurses, with limited involvement of pharmacists. Hospitalists are well‐positioned to lead the ongoing implementation of medication reconciliation processes and should take advantage of their systems knowledge to effectively partner with other physicians, nurses, and pharmacists to achieve success in medication reconciliation.
Acknowledgements
The authors thank Ken Epstein, MD, and Renee Meadows, MD, along with the entire SHM Medication Reconciliation Task Force for their helpful review and comments on the article.
Appendix
|
|
- Kohn LT,Corrigan JM,Donaldson MS, eds.To Err Is Human: Building a Safer Health System.Washington, DC:National Academy Press;1999.
- .Medication reconciliation: transfer of medication information across settings – keeping it free from error.Am J Nurs.2005;105(3 Suppl):31–36.
- ,,, et al.Reconciliation of discrepancies in medication histories and admission orders of newly hospitalized patients.Am J Health‐Syst Pharm.2004;61(16):1689–1695.
- ,,, et al.Medication reconciliation: a practical tool to reduce the risk of medication errors.J Crit Care.2003;18(4):201–205.
- ,,,.Evaluation of a new integrated discharge prescription form.Ann Pharmacother.2001;35(7‐8):953–958.
- ,,, et al.Patient safety standardization as a mechanism to improve safety in health care.Jt Comm J Qual Saf.2004;30(1):5–14.
- ,,.What happens to long‐term medication when general practice patients are referred to hospital?Eur J Clin Pharmacol.1996;50(4):253–257.
- ,,, et al.An experiential interdisciplinary quality improvement education initiative.Am J Med Qual.2006;21(5):317–322.
- ,,.ASHP national survey of pharmacy practice in hospital settings: monitoring and patient education‐2006.Am J Health‐Syst Pharm.2007;64(5):507–520.
Discharge Planning Scale
Preventable adverse events occur when patients transition from hospital to outpatient care.1, 2 The most common cause for postdischarge adverse events is poor communication between inpatient healthcare providers and outpatient primary care physicians.1 Adverse events also occur because of inadequate processes to communicate unresolved problems, monitor drug therapies, or monitor the patient's overall condition.1 Efforts to reduce adverse events logically focus on effective discharge planning and communication.
Systematic reviews have evaluated clinical trials to improve discharge planning and communication.36 Reviewers often reported inconclusive results because of a shortage of high‐quality trials with validated outcome measures.35 Reviewers recommended future studies to develop and validate outcome measures that assessed the discharge process from various perspectives.4 One important perspective was the assessment by the outpatient, primary care physician who was responsible for patient care after discharge.79
One of the authors (K.G.S.) developed the Physician‐PREPARED questionnaire to measure perceptions of outpatient physicians about the quality of hospital discharge. Item content came from studies in Australia that investigated barriers to best practice in discharge planning for older patients.1013 Fifteen items asked community physicians about their awareness of discharge planning processes for their patients. Items also assessed the adequacy of information provided about discharge plans. The Physician‐PREPARED items underwent assessment in Australia. Evaluation revealed well‐worded text, unambiguous response options, face validity, and content validity.
We reconsidered the Physician‐PREPARED questionnaire when we designed a clinical trial to assess the value of a discharge intervention in the United States. Our goal was a comprehensive survey instrument and scale to measure the perceptions of outpatient physicians after the discharge intervention. We found no other appropriate, validated questionnaires except the Physician‐PREPARED. However, we recognized some limitations to the Physician‐PREPARED. The items were developed for Australian physicians who treated elderly patients. We wanted to assess North American physicians who cared for a broad age range of adults. The Physician‐PREPARED did not have a scale with validated, psychometric performance characteristics in our population. We decided to address the above limitations with a scale development and validation study in the United States.
In the present work, we describe item development for the Physician‐PREPARED that occurred in Australia. Then we present item reduction and validation for the Modified Physician‐PREPARED that occurred in the United States. Our primary objective was to validate a scale to measure perceptions of outpatient physicians about qualities of discharge planning and communication. The secondary objectives were to quantify the scale's internal consistency and construct validity. Our goal was a brief scale with acceptable, defined statistical properties for clinicians and researchers.
PATIENTS AND METHODS
Item Development for the Physician‐PREPARED
Australian investigators designed the Physician‐PREPARED survey instrument to measure the quality of discharge planning activities and communication. The investigators developed the survey with the following process that was not published previously. First, a literature review identified survey content germane to outpatient practitioners.10 Investigators conducted interviews, focus groups, and pilot surveys to prioritize items for the survey instrument. The volunteer subjects for item development were general medical practitioners in Adelaide and Sydney, the capital cities of two states in Australia. The draft instrument was circulated to a small group of general medical practitioners for comment on layout, wording, and question intent. After feedback, minor modifications were made to item content and response categories. The result of development in Australia was a survey instrument with 15 items (see Appendix). The items reflected the following key areas of discharge quality: timeliness of communication, patient health status at discharge, adequacy of discharge support services, discharge medication information, and reasons for medication changes. These areas were congruent with the results of other investigators who assessed the quality of discharge planning and communication.14, 15
Validation of the Modified Physician‐PREPARED
The validation study for the Modified Physician‐PREPARED occurred in Illinois. The Peoria Institutional Review Board approved and monitored the human research. The patient sample for validation was a prospective cohort from a cluster randomized clinical trial. Willing patients or their proxies provided written consent for study participation. Patient enrollment occurred between December 2004 and August 2006. The subjects for scale analysis were the outpatient primary care physicians or practitioners designated by patients in the cohort. Outpatient physicians and practitioners gave implied consent when they completed and returned questionnaires. Follow‐up was 10 or more days after the patient's discharge from an acute care, 730‐bed, teaching hospital.
Patient Inclusion Criteria
Trained research coordinators identified all consecutive adult inpatients who were discharged to home by internal medicine hospitalist physicians. Patient inclusion in the cluster‐randomized trial required a probability of repeat admission (Pra) score greater than or equal to 0.40.16, 17 Consequently, the patients in the scale analysis cohort had the same high probability for repeat admission. The Pra score came from patient or proxy responses to questions about age, prior hospitalizations, prior doctor visits, self‐rated health status, and other health‐related questions.16, 17 In previous validation studies with elderly outpatients, a Pra score above 0.5 predicted that patients would have 1 hospital admission per person‐year of survival.16 In other validation studies with inpatients aged 18 to 101 years, the Pra items predicted nonroutine discharge planning needs.18
Exclusion Criteria
The exclusion criteria were designed to enroll a cohort with homogeneous risk for readmission. We excluded patients if their discharge destination was a nursing home, another acute care hospital, or an inpatient rehabilitation unit. Hospice patients were excluded if life expectancy was less than 6 months as estimated by the hospitalist. We also used exclusion criteria to avoid illogical enrollments. If the designated outpatient primary care physician or practitioner also managed the patient during the index hospitalization, then there was no perceived barrier to communication and the patient was excluded. Cognitive impairment was a conditional exclusion criterion. We defined cognitive impairment as a score less than 9 on the 10‐point clock test.19 A patient with cognitive impairment could participate with consent from a legally authorized representative. Before we enrolled a cognitively impaired patient, we required a proxy who spent a minimum of 3 hours daily with the patient and who agreed to answer interview questions.
Baseline Assessment
During the index hospitalization, trained data abstractors recorded baseline patient data to calculate the Pra: age, gender, diabetes mellitus, and ischemic heart disease. Patients or proxies provided the number of hospital admissions and doctor visits during the year before the index hospitalization. We recorded the availability of an informal caregiver in response to the question, Is there a friend, relative or neighbor who would take care of you for a few days, if necessary? Patients rated their health status on the following scale: poor, fair, good, very good, and excellent. In addition, we recorded heart failure and chronic obstructive pulmonary disease because of their possible association with readmission.20, 21 Information about outpatient physicians or practitioners came from the hospital's administrative database and was limited to specialty training.
Discharge Process
At the end of the index hospitalization, hospitalists and ward nurses used standardized forms for discharge diagnoses, prescriptions, instructions, and appointments. Discharge planning nurses or social workers consulted with hospitalists and ward nurses and then coordinated service providers including home health nurses, physical therapists, home health aides, homemaker service providers, durable medical equipment vendors, home oxygen vendors, home infusion pharmacists, social workers, rehabilitation service providers, legal aid providers, and others. Patients designated an outpatient primary care physician or nurse practitioner or physician assistant to receive discharge reports and results of diagnostic tests. Ten days after discharge, research personnel mailed the Physician‐PREPARED questionnaire to the designated outpatient primary care professional.
Item Reduction and Scoring
To develop a scale, we selected items from the Physician‐PREPARED survey instrument (see Appendix). Our goal was a parsimonious, comprehensive, and valid scale for use in clinical and research environments. We applied item reduction techniques according to the following steps that were defined a priori. First, we deleted items with nominal response categories that lacked graded or ordinal characteristics. This exclusion criterion caused us to delete the following items from the questionnaire in the appendix: (1a) Who made you aware of the admission, (2a) Who made you aware of the patient's discharge, and (5a) How did you receive this information? We deleted open‐ended questions, such as: (13) Have you any suggestions how the patient's discharge could have been improved? Next, we excluded items with a large proportion of missing responses because respondents checked Not applicable. Only item 12 from the Physician‐PREPARED fulfilled the latter criterion (see Appendix). Question 12 asked, Has the patient's caretaker voiced any concerns that they have not been coping since the patient was discharged? Among 403 respondents, 52% answered question 12 as Not applicable.
Measures of Construct Validity
We used 3 measures of construct validity in our assessment of the Modified Physician‐PREPARED scale. The first construct item asked the outpatient practitioner, Were you involved at all in planning the patient's discharge? The first construct was relevant because involvement by outpatient physicians improves the quality of hospital discharges.22 The second construct item asked, Are you aware of any community support services that are involved in providing assistance to the patient since discharge? For the third construct, we asked (Appendix item 11), Has the patient voiced any concerns that they have not been coping since discharge? We chose community support services and patient coping because these are clinically relevant and correlated with patients' perceptions of discharge preparedness.23 When we assessed construct validity, our hypotheses were significantly higher Modified Physician‐PREPARED scale values for respondents who answered yes to the construct questions about involvement and awareness and answered no to the question about patient‐voiced concerns.
Analysis
Analyses were performed with SPSS PC (version 14.0.2; SPSS Inc, Chicago, Illinois). We reported descriptive statistics as means, standard deviations (SDs), and range for interval variables; median and range for ordinal variables; and percentages for nominal variables. While developing the scale, the unit of analysis was the physician response to a unique patient. Specific descriptive analyses used the unique respondent as the unit of analysis. To determine the internal consistency of the scale, we calculated Cronbach's alpha with SPSS RELIABILITY. We assessed the distribution of the Modified Physician‐PREPARED scale with visual and statistical tests for skewness. While using the SPSS FACTOR program, we performed principal components extractions and then rotated components using the oblique promax technique. Component scores were saved using the regression score procedure. Component loadings above 0.30 were considered for interpretation.24 Statistical inference tests were the Mann‐Whitney U for median differences for 2 groups, the Kruskal‐Wallis for more than 2 groups, and Spearman correlation for associations. The accepted level of significance was P < 0.05.
RESULTS
Description of Validation Cohort for the Modified Physician‐PREPARED
We sent questionnaires to the primary care physician, nurse practitioner, or physician assistant designated by 549 patients. The survey response rate was 76% (417/549). If a respondent failed to check any response option for 2 or more scale items, then the questionnaire was excluded from analysis. We excluded 3% (14/549) of questionnaires for failure to respond to items. The responses from the remaining 403 questionnaires were analyzed. We did not exclude questionnaires from respondents who followed homebound patients or other patients who failed to come to the clinic for postdischarge visits. Our analysis included 90 questionnaires (22%) from respondents who had no contact with the patient after discharge.
The patient characteristics appear in Table 1. Most of the patients were less than 65 years old (77%, 310/403). Many patients had chronic diseases including diabetes mellitus, ischemic heart disease, heart failure, or chronic obstructive pulmonary disease. Most patients, 81% (327/403), rated their health as poor or fair and 55% (223/403) had 1 or more hospital admissions during the year before their index admission. The questionnaire respondents were primary care physicians who practiced internal medicine (41%, 167/403), medicine‐pediatrics (27%, 108/403), family practice (24%, 97/403), or other specialties (3%, 10/403). Nurse practitioners or physician assistants completed 5% (21/403) of questionnaires.
| Characteristic | Number (%) |
|---|---|
| |
| Gender, female | 235 (58.3%) |
| Race | |
| White | 284 (70.5%) |
| Black | 116 (28.8%) |
| Other | 3 (0.7%) |
| Self‐rated health status | |
| Poor | 125 (31.0%) |
| Fair | 202 (50.1%) |
| Good | 61 (15.1%) |
| Very good | 13 (3.2%) |
| Excellent | 2 (0.5%) |
| Diabetes mellitus | 226 (56.1%) |
| Chronic obstructive pulmonary disease | 76 (18.9%) |
| Ischemic heart disease | 165 (40.9%) |
| Heart failure | 90 (22.3%) |
| Hospital admissions during prior year (includes index admission) | 2.2 (2.0) [0‐15]* |
| Age (years) | 53.6 (15.1) [19‐98]* |
| Pra score | 0.49 (0.07) [0.40‐0.70]* |
We conducted descriptive analyses that treated the respondent as the unit of analysis. There were 172 unique respondents. The number of questionnaires per respondent ranged from 1 to 20 with a median of 1 questionnaire. Respondents varied in the time to return a questionnaire. We measured response time as the difference between the date we received the questionnaire and the date of discharge. The response time ranged from 10 to 90 days with a median of 21 days after discharge.
Modified Physician‐PREPARED: Item Reduction, Internal Consistency, and Score Distributions
The questionnaire items appear in the Appendix. After item reduction, there were 8 items included in the Modified Physician‐PREPARED scale analysis (Table 2). None of the 8 items caused substantive reduction in Cronbach's alpha, so all were retained. The 8‐item scale had acceptable internal consistency (Cronbach's alpha = 0.86). For an individual questionnaire, the sum of the scores for eight items yielded the Modified Physician‐PREPARED scale value. High scale values reflected high perceptions of discharge quality. Each of the 8 items correlated significantly and positively with the scale value (P < 0.001, 2‐tailed).
| Item Text | Descriptor for Score = 1 | Descriptor for Score = 2 | Descriptor for Score = 3 | No Score | |
|---|---|---|---|---|---|
| 1. | When were you made aware that this patient had been admitted to hospital? | Not at all; 55 (13.6%) | After patient was discharged; 65 (16.1%) | Prior to hospitalization; while patient was in hospital; or on the day of discharge; 281 (69.7%) | Missing response; 2 (0.5%) |
| 2. | When were you made aware that the patient was going to be discharged? | Not at all; 115 (28.5%) | Within a week after discharge; or longer than a week after discharge; 61 (15.1%) | While patient was still in hospital; or on day of discharge; or within 1‐2 days after discharge; 225 (55.8%) | Missing response; 2 (0.5%) |
| 3. | How soon after discharge did you receive any information (in any form) relating to this patient's hospital admission and discharge plans? | Longer than a week; or not received; or other 115 (28.5%) | Within a week; 186 (46.2%) | Within 1‐2 days; 101 (25.1%) | Missing response; 1 (0.2%) |
| 4. | Was this sufficient notice to address this patient's postdischarge needs? | Less than sufficient; 98 (24.3%) | Sufficient; 246 (61.0%) | More than sufficient; 46 (11.4%) | Missing response; 13 (3.2%) |
| 5. | Have you received adequate information about this patient's discharge health status? | No; 103 (25.6%) | Yes; 295 (73.2%) | Missing response; 5 (1.2%) | |
| 6. | Have you received adequate written information about the patient's medicines and medication management? | Less than adequate; or no information at all; 103 (25.6%) | Adequate; 262 (65.0%) | More than adequate; 38 (9.4%) | Missing response; 0 (0%) |
| 7. | Did you receive sufficient reasons for changes in medication? (For example, why 1 type of medication is used in preference to another?) | Less than sufficient; or no information at all; 129 (32.0%) | Sufficient; or not applicable (there was no change in medications); 240 (59.6%) | More than sufficient; 29 (7.2%) | Missing response; 5 (1.2%) |
| 8. | In your opinion, how adequate were the discharge plans to assist this patient to assume safe, independent community living? | Less than adequate; or no discharge plans; 82 (20.3%) | Adequate; 276 (68.5%) | More than adequate; 32 (7.9%) | Missing response; 13 (3.2%) |
Table 2 shows the distribution of responses to each item in the Modified Physician‐PREPARED questionnaire. There were substantial ceiling effects for 2 individual items. One of the 7 items with 3 response options had ceiling effects approaching 70% (item 1). One item had 2 response options and 73% responded yes (item 5). The distribution of Modified Physician‐PREPARED scale values for 403 questionnaires had mean 16.6 4.0 SD and skew 0.6 (standard error of skew = 0.1). When scale values of patients 64 years and younger were compared with those of 65 and older, there were no significant differences (P = 0.606). The scale values did not have noteworthy floor or ceiling effects. The distribution of scale values showed 1.2% (5/403) of respondents had the lowest score of 8 and 1.7% (7/403) had the highest score of 24.
Modified Physician‐PREPARED: Principal Component Analysis
The purpose of the principal component analysis was to evaluate the relationships between the items and domains. In the component analysis, we evaluated the correlation matrix of the 8 items in the Modified Physician‐PREPARED scale. The Kaiser‐Meyer‐Olkin statistic of 0.89 indicated sufficient sampling adequacy to extract components from the matrix. Principal components extracted 66% of the variance associated with the 8‐item scale. After inspection of scree plots, we determined that 2 components were extracted before the eigenvalue fell substantially below 1. The pattern matrix for the promax rotation was inspected and the factor loading for each item appears in Table 3. The item content identified 1 component as timeliness of communication. The other component was adequacy of discharge plan/transmission. Within the adequacy component, the item content addressed patient health status, medication information, and reasons for medication changes. All items loaded primarily on 1 of the components; except item 3, which loaded on both components.
| Item Text | Component | ||
|---|---|---|---|
| Adequacy of Discharge Plan/Transmission | Timeliness of Communication | ||
| 7 | Did you receive sufficient reasons for changes in medication? (For example, why one type of medication is used in preference to another?) | 0.900 | 0.132 |
| 6 | Have you received adequate written information about the patient's medicines and medication management? | 0.849 | 0.056 |
| 4 | Was this sufficient notice to address this patient's postdischarge needs? | 0.796 | 0.050 |
| 5 | Have you received adequate information about this patient's discharge health status? | 0.774 | 0.012 |
| 8 | In your opinion, how adequate were the discharge plans to assist this patient to assume safe, independent community living? | 0.744 | 0.132 |
| 3 | How soon after discharge did you receive any information (in any form) relating to this patient's hospital admission and discharge plans? | 0.403 | 0.373 |
| 1 | When were you made aware that this patient had been admitted to hospital? | 0.154 | 0.964 |
| 2 | When were you made aware that the patient was going to be discharged? | 0.123 | 0.779 |
Modified Physician‐PREPARED: Construct Validity
We compared Modified Physician‐PREPARED scale values between dichotomous groups defined by construct variables. When considering the discharge planning and communication for a specific patient, outpatient primary care practitioners reported higher scale values when they were involved in the discharge planning (median [25%, 75%] = 19 [19, 20.5]) than when they were not involved (17 [12.4, 19], P < 0.001). In addition, outpatient practitioners responded with higher scale values when they were aware of community support services (18 [16, 20]) than when they were unaware (17 [12, 19], P = 0.002). There was a nonsignificant trend to higher scale values if patients voiced no concern about coping after discharge (18 [15, 19]) versus concern (17 [12, 19], P = 0.059). For all 3 constructs, the analysis revealed higher Modified Physician‐PREPARED scale values that were in the same direction as hypothesized. We approximated the construct analysis with subscales defined by the principal components (data not shown). The subscale analysis confirmed the direction and significance of the analysis with the full, 8‐item, Modified Physician‐PREPARED scale.
Modified Physician‐PREPARED: Correlations with Baseline Characteristics
We evaluated the correlations between a patient's Modified Physician‐PREPARED scale value and baseline characteristics in Table 1. Patient characteristics were not associated with scale values. We also assessed the median differences between the scale values by practitioner specialty and found no significant differences.
DISCUSSION
The Modified Physician‐PREPARED scale measured the quality of discharge planning and communication from the perspective of the outpatient primary care physician or practitioner. We described the derivation of the scale items. We demonstrated the reliability and validity of the scale among physicians and practitioners who provided postdischarge care to patients at high risk for readmission to the hospital. The item content included timeliness, adequacy, patient health status, medication information, and reasons for medication changes.
According to expert consensus guidelines for hospital discharge care, the communication with the outpatient primary care physician should occur as soon as possible after discharge.25 Recommended data elements in the communication include condition at discharge, diagnoses, medications added, medications discontinued, and medications changed.25 We found the Modified Physician‐PREPARED scale items included content that was consistent with expert consensus guidelines. The items also assessed timeliness and adequacy, 2 domains important to outpatient physicians.14, 26
The Modified Physician‐PREPARED is one of several questionnaires developed to measure qualities of discharge processes from the perspective of outpatient physicians.8, 15, 2733 Previous questionnaires did not report psychometrics except 1 that assessed the quality of discharge summaries and measured test‐retest reliability.33 We are not aware of other physician questionnaires with reliable or valid scales besides the Modified Physician‐PREPARED.
We believe 1 application of the Modified Physician‐PREPARED questionnaire is in quality improvement efforts within hospitals. Most hospitals and inpatient physicians rely on discharge letters or summaries to communicate information about the hospitalization to outpatient practitioners.6 However, systematic problems with generation and transmission of letters and summaries make them sometimes unreliable as sources of consistent, timely, accurate, or important information.6 When patients arrive for their posthospital visits, their outpatient physicians have received no discharge letter for 16% to 53% of patients and no discharge summary for 66% to 88%.6 Among outpatient physicians, 41% attribute preventable adverse events for at least 1 of their patients to inadequate discharge communication.34 One hospital accreditation organization includes discharge communication improvement as a national patient safety goal in the United States.35 Hospitals have multiple motivations to pursue quality improvement projects related to discharge communication: reduction in adverse events, relation with referring physicians, and accreditation by regulators. When surveying physicians, hospital personnel may wish to use a reliable and validated instrument like the Modified Physician‐PREPARED questionnaire.
Another application of the Modified Physician‐PREPARED scale is in research. An example is our randomized, controlled trial to measure the value of a discharge intervention. We published the rationale and design for our intervention.36 In the future, we will analyze the results of our trial and we will need validated scales. One of the trial outcomes is the perspective of the outpatient physician. We expect to compare the scores on the Modified Physician‐PREPARED scale values from community practitioners who treated test patients versus control patients. The statistical properties of the Modified Physician‐PREPARED scale that we validated in the current work will allow us to estimate the precision of between‐group differences and to perform tests of inference.
The results of our study should be interpreted in the context of strengths and limitations. We were able to generalize the validity of the Modified Physician‐PREPARED to North American primary care physicians who treated adult outpatients with a broad age range. We minimized biases with the high survey response rate and low proportion of missing responses. During validation, we asked physicians to evaluate patient transitions from hospital to home. Consequently, the Modified Physician‐PREPARED scale may not apply when doctors follow patients after discharge to nursing homes or other acute care facilities. We excluded patients with low probability of repeat admission: hospice patients and patients with low Pra scores. The purpose of our exclusion criteria was to enrich the sample with patients likely to benefit from interventions to improve discharge processes. We recognize that the Modified Physician‐PREPARED may not generalize to physicians who treat hospice patients or patients with low probability for readmission.
Additional limitations relate to test‐retest reliability and to the clinical meaning of small changes in scale values. In our study, physician respondents returned questionnaires approximately 3 weeks after hospital discharge. We did not ask physicians to complete the questionnaire again after they returned the first questionnaire. Therefore, the test‐retest reliability for the Modified Physician‐PREPARED is unknown. Our protocol was not designed to detect the minimum important difference in the scale values. Consequently, small changes in scale values have uncertain clinical relevance. Future studies are necessary to assess the minimum important difference in the scale values.
CONCLUSION
The Modified Physician‐PREPARED scale was a reliable and valid measure of outpatient physician perceptions of quality and communication after hospital discharge. Clinicians and researchers may find the scale useful to guide, assess, and compare discharge‐planning activities.
APPENDIX
PHYSICIAN‐PREPARED QUESTIONNAIRE
| Item | Question | Response Options |
|---|---|---|
| 1 | When were you made aware that this patient had been admitted to hospital? | Prior to hospitalization |
| While patient was in hospital | ||
| On the day of discharge | ||
| After patient was discharged | ||
| Not at all | ||
| 1a | Who made you aware of the admission? | Hospital ward staff |
| Discharge planner | ||
| Hospital medical staff | ||
| Ambulance | ||
| Patient | ||
| Patient's family/friends | ||
| Other, please specify _________________________ | ||
| 2 | When were you made aware that the patient was going to be discharged? | While patient was still in hospital |
| On day of discharge | ||
| Within 1‐2 days after discharge | ||
| Within a week after discharge | ||
| Longer than a week after discharge | ||
| Not at all | ||
| 2a | Who made you aware of the patient's discharge? | Hospital ward staff |
| Discharge planner | ||
| Hospital medical staff | ||
| Patient | ||
| Patient's family/friends | ||
| Other, please specify _________________________ | ||
| 3 | How soon after discharge did you receive any information (in any form) relating to this patient's hospital admission and discharge plans? | Within 1‐2 days |
| Within a week | ||
| Longer than a week | ||
| Not received | ||
| Other, please specify _________________________ | ||
| 4 | Was this sufficient notice to address this patient's postdischarge needs? | More than sufficient |
| Sufficient | ||
| Less than sufficient | ||
| 5 | Have you received adequate information about this patient's discharge health status? | Yes |
| No | ||
| 5a | How did you receive this information? (Check all that apply) | Telephone call |
| Fax | ||
| Electronic mail system | ||
| Written/typed letter | ||
| 6 | Have you received adequate written information about the patient's medicines and medication management? | More than adequate |
| Adequate | ||
| Less than adequate | ||
| No information at all | ||
| 7 | Did you receive sufficient reasons for changes in medication? (For example, why 1 type of medication is used in preference to another?) | Not applicable (there was no change in medications) |
| More than sufficient | ||
| Sufficient | ||
| Less than sufficient | ||
| No information at all | ||
| 8 | In your opinion, how adequate were the discharge plans to assist this patient to assume safe, independent community living? | More than adequate |
| Adequate | ||
| Less than adequate | ||
| No discharge plans | ||
| 9 | Were you involved at all in planning the patient's discharge? | Yes |
| No | ||
| 10 | Are you aware of any community support services that are involved in providing assistance to the patient since discharge? | Yes |
| No | ||
| 11 | Has the patient voiced any concerns that they have not been coping since discharge? | Yes |
| No | ||
| Not applicable (no contact with patient since discharge) | ||
| 12 | Has the patient's caretaker voiced any concerns that they have not been coping since the patient was discharged? | Not applicable (no caretaker) |
| Yes | ||
| No | ||
| Not applicable (no contact with caretaker since discharge) | ||
| 13 | Have you any suggestions how the patient's discharge could have been improved? | __________________________________________ |
| __________________________________________ | ||
| __________________________________________ |
- ,,,,.The incidence and severity of adverse events affecting patients after discharge from the hospital.Ann Intern Med.2003;138:161–167.
- ,,, et al.Adverse events among medical patients after discharge from hospital.CMAJ.2004;170:345–349.
- ,,.Written and verbal information versus verbal information only for patients being discharged from acute hospital settings to home.Cochrane Database Syst Rev.2003;(4):CD003716.
- ,,,.Discharge planning from hospital to home.Cochrane Database Syst Rev.2004;(1):CD000313.
- ,,,.Care home versus hospital and own home environments for rehabilitation of older people.Cochrane Database Syst Rev.2003;(2):CD003164.
- ,,,,,.Deficits in communication and information transfer between hospital‐based and primary care physicians: implications for patient safety and continuity of care.JAMA.2007;297:831–841.
- ,,,,,.Physician attitudes toward and prevalence of the hospitalist model of care: results of a national survey.Am J Med.2000;109:648–653.
- ,,, et al.Effects of a multidisciplinary, post‐discharge continuance of care intervention on quality of life, discharge satisfaction, and hospital length of stay: a randomized controlled trial.Int J Qual Health Care.2005;17:43–51.
- .Hospitalists and family physicians: understanding opportunities and risks.J Fam Pract.2004;53:473–481.
- ,,,.performance indicators for discharge planning: a focused review of the literature.Aust J Adv Nurs.1999;16:20–28.
- Informing discharge plans. Assessments of elderly patients in Australian public hospitals: a field study. Available at: http://ijahsp.nova.edu/articles/Vol2number3/Grimmer‐Discharge_Plans.htm. Accessed January2008.
- ,,.Experiences of elderly patients regarding independent community living after discharge from hospital: a longitudinal study.Int J Qual Health Care.2004;16:465–472.
- ,,.Life Post‐Discharge: Longitudinal Qualitative and Quantitative Study of 100 Elderly People Post Discharge from Hospital. Technical Report Produced for South Australian Department of Human Services. South Australia: South Australian Department of Human Services;2002.
- ,,,.The quality of communication between hospitals and general practitioners: an assessment.J Qual Clin Pract.1998;18:241–247.
- ,,,,.Do general practitioners and community pharmacists want information on the reasons for drug therapy changes implemented by secondary care?Br J Gen Pract.1997;47:563–566.
- ,,.Predictive validity of a questionnaire that identifies older persons at risk for hospital admission.J Am Geriatr Soc.1995;43:374–377.
- ,,,.Predictive validity of the Pra instrument among older recipients of managed care.J Am Geriatr Soc.1997;45:614–617.
- ,,,,,.Prospective evaluation of a screen for complex discharge planning in hospitalized adults.J Am Geriatr Soc.2003;51:678–682.
- ,.The ten point clock test: a quick screen and grading method for cognitive impairment in medical and surgical patients.Int J Psychiatry Med.1994;24:229–244.
- ,,, et al.comprehensive discharge planning and home follow‐up of hospitalized elders: a randomized clinical trial.JAMA.1999;281:613– 620.
- ,,, et al.Predicting non‐elective hospital readmissions: a multi‐site study. Department of Veterans Affairs Cooperative Study Group on Primary Care and Readmissions.J Clin Epidemiol.2000;53:1113–1118.
- ,,,,.Can GP input into discharge planning result in better outcomes for the frail aged: results from a randomized controlled trial.Fam Pract.1999;16:289–293.
- ,.The development, validity and application of a new instrument to assess the quality of discharge planning activities from the community perspective.Int J Qual Health Care.2001;13:109–116.
- ,.Factor analysis in the development and refinement of clinical assessment instruments.Psychol Assess.1995;7:286–299.
- ,,, et al.Transition of care for hospitalized elderly patients—development of a discharge checklist for hospitalists.J Hosp Med.2006;1:354–360.
- ,,,.Home from hospital: a survey of hospital discharge arrangements in Northamptonshire.J Public Health Med.1992;14:145–150.
- ,,.Electronic clinical communications implementation (ECCI) in Scotland: a mixed‐methods programme evaluation.J Eval Clin Pract.2004;10:11–20.
- ,.General practitioner response to elderly patients discharged from hospital.BMJ.1990;300:159–161.
- ,,,,.Information about patients' deaths: general practitioners' current practice and views on receiving a death register.Br J Gen Pract.1994;44:315–316.
- ,,,.Primary care physician attitudes regarding communication with hospitalists.Am J Med.2001;111:15S–20S.
- ,,,,.The value of inpatient pharmaceutical counselling to elderly patients prior to discharge.Br J Clin Pharmacol.2002;54:657–664.
- ,.Usefulness of letters from hospitals to general practitioners.Br Med J (Clin Res Ed).1984;288:1813–1814.
- ,.What is necessary for high‐quality discharge summaries?Am J Med Qual.1999;14:160–169.
- ,,,,.Outpatient physicians' satisfaction with discharge summaries and perceived need for an electronic discharge summary.J Hosp Med.2006;1:317–320.
- 2007 Hospital/critical access hospital national patient safety goals. Available at: http://www.jointcommission.org/PatientSafety/NationalPatientSafetyGoals. Accessed January2008.
- ,,.Software design to facilitate information transfer at hospital discharge.Inform Prim Care.2006;14:109–119.
Preventable adverse events occur when patients transition from hospital to outpatient care.1, 2 The most common cause for postdischarge adverse events is poor communication between inpatient healthcare providers and outpatient primary care physicians.1 Adverse events also occur because of inadequate processes to communicate unresolved problems, monitor drug therapies, or monitor the patient's overall condition.1 Efforts to reduce adverse events logically focus on effective discharge planning and communication.
Systematic reviews have evaluated clinical trials to improve discharge planning and communication.36 Reviewers often reported inconclusive results because of a shortage of high‐quality trials with validated outcome measures.35 Reviewers recommended future studies to develop and validate outcome measures that assessed the discharge process from various perspectives.4 One important perspective was the assessment by the outpatient, primary care physician who was responsible for patient care after discharge.79
One of the authors (K.G.S.) developed the Physician‐PREPARED questionnaire to measure perceptions of outpatient physicians about the quality of hospital discharge. Item content came from studies in Australia that investigated barriers to best practice in discharge planning for older patients.1013 Fifteen items asked community physicians about their awareness of discharge planning processes for their patients. Items also assessed the adequacy of information provided about discharge plans. The Physician‐PREPARED items underwent assessment in Australia. Evaluation revealed well‐worded text, unambiguous response options, face validity, and content validity.
We reconsidered the Physician‐PREPARED questionnaire when we designed a clinical trial to assess the value of a discharge intervention in the United States. Our goal was a comprehensive survey instrument and scale to measure the perceptions of outpatient physicians after the discharge intervention. We found no other appropriate, validated questionnaires except the Physician‐PREPARED. However, we recognized some limitations to the Physician‐PREPARED. The items were developed for Australian physicians who treated elderly patients. We wanted to assess North American physicians who cared for a broad age range of adults. The Physician‐PREPARED did not have a scale with validated, psychometric performance characteristics in our population. We decided to address the above limitations with a scale development and validation study in the United States.
In the present work, we describe item development for the Physician‐PREPARED that occurred in Australia. Then we present item reduction and validation for the Modified Physician‐PREPARED that occurred in the United States. Our primary objective was to validate a scale to measure perceptions of outpatient physicians about qualities of discharge planning and communication. The secondary objectives were to quantify the scale's internal consistency and construct validity. Our goal was a brief scale with acceptable, defined statistical properties for clinicians and researchers.
PATIENTS AND METHODS
Item Development for the Physician‐PREPARED
Australian investigators designed the Physician‐PREPARED survey instrument to measure the quality of discharge planning activities and communication. The investigators developed the survey with the following process that was not published previously. First, a literature review identified survey content germane to outpatient practitioners.10 Investigators conducted interviews, focus groups, and pilot surveys to prioritize items for the survey instrument. The volunteer subjects for item development were general medical practitioners in Adelaide and Sydney, the capital cities of two states in Australia. The draft instrument was circulated to a small group of general medical practitioners for comment on layout, wording, and question intent. After feedback, minor modifications were made to item content and response categories. The result of development in Australia was a survey instrument with 15 items (see Appendix). The items reflected the following key areas of discharge quality: timeliness of communication, patient health status at discharge, adequacy of discharge support services, discharge medication information, and reasons for medication changes. These areas were congruent with the results of other investigators who assessed the quality of discharge planning and communication.14, 15
Validation of the Modified Physician‐PREPARED
The validation study for the Modified Physician‐PREPARED occurred in Illinois. The Peoria Institutional Review Board approved and monitored the human research. The patient sample for validation was a prospective cohort from a cluster randomized clinical trial. Willing patients or their proxies provided written consent for study participation. Patient enrollment occurred between December 2004 and August 2006. The subjects for scale analysis were the outpatient primary care physicians or practitioners designated by patients in the cohort. Outpatient physicians and practitioners gave implied consent when they completed and returned questionnaires. Follow‐up was 10 or more days after the patient's discharge from an acute care, 730‐bed, teaching hospital.
Patient Inclusion Criteria
Trained research coordinators identified all consecutive adult inpatients who were discharged to home by internal medicine hospitalist physicians. Patient inclusion in the cluster‐randomized trial required a probability of repeat admission (Pra) score greater than or equal to 0.40.16, 17 Consequently, the patients in the scale analysis cohort had the same high probability for repeat admission. The Pra score came from patient or proxy responses to questions about age, prior hospitalizations, prior doctor visits, self‐rated health status, and other health‐related questions.16, 17 In previous validation studies with elderly outpatients, a Pra score above 0.5 predicted that patients would have 1 hospital admission per person‐year of survival.16 In other validation studies with inpatients aged 18 to 101 years, the Pra items predicted nonroutine discharge planning needs.18
Exclusion Criteria
The exclusion criteria were designed to enroll a cohort with homogeneous risk for readmission. We excluded patients if their discharge destination was a nursing home, another acute care hospital, or an inpatient rehabilitation unit. Hospice patients were excluded if life expectancy was less than 6 months as estimated by the hospitalist. We also used exclusion criteria to avoid illogical enrollments. If the designated outpatient primary care physician or practitioner also managed the patient during the index hospitalization, then there was no perceived barrier to communication and the patient was excluded. Cognitive impairment was a conditional exclusion criterion. We defined cognitive impairment as a score less than 9 on the 10‐point clock test.19 A patient with cognitive impairment could participate with consent from a legally authorized representative. Before we enrolled a cognitively impaired patient, we required a proxy who spent a minimum of 3 hours daily with the patient and who agreed to answer interview questions.
Baseline Assessment
During the index hospitalization, trained data abstractors recorded baseline patient data to calculate the Pra: age, gender, diabetes mellitus, and ischemic heart disease. Patients or proxies provided the number of hospital admissions and doctor visits during the year before the index hospitalization. We recorded the availability of an informal caregiver in response to the question, Is there a friend, relative or neighbor who would take care of you for a few days, if necessary? Patients rated their health status on the following scale: poor, fair, good, very good, and excellent. In addition, we recorded heart failure and chronic obstructive pulmonary disease because of their possible association with readmission.20, 21 Information about outpatient physicians or practitioners came from the hospital's administrative database and was limited to specialty training.
Discharge Process
At the end of the index hospitalization, hospitalists and ward nurses used standardized forms for discharge diagnoses, prescriptions, instructions, and appointments. Discharge planning nurses or social workers consulted with hospitalists and ward nurses and then coordinated service providers including home health nurses, physical therapists, home health aides, homemaker service providers, durable medical equipment vendors, home oxygen vendors, home infusion pharmacists, social workers, rehabilitation service providers, legal aid providers, and others. Patients designated an outpatient primary care physician or nurse practitioner or physician assistant to receive discharge reports and results of diagnostic tests. Ten days after discharge, research personnel mailed the Physician‐PREPARED questionnaire to the designated outpatient primary care professional.
Item Reduction and Scoring
To develop a scale, we selected items from the Physician‐PREPARED survey instrument (see Appendix). Our goal was a parsimonious, comprehensive, and valid scale for use in clinical and research environments. We applied item reduction techniques according to the following steps that were defined a priori. First, we deleted items with nominal response categories that lacked graded or ordinal characteristics. This exclusion criterion caused us to delete the following items from the questionnaire in the appendix: (1a) Who made you aware of the admission, (2a) Who made you aware of the patient's discharge, and (5a) How did you receive this information? We deleted open‐ended questions, such as: (13) Have you any suggestions how the patient's discharge could have been improved? Next, we excluded items with a large proportion of missing responses because respondents checked Not applicable. Only item 12 from the Physician‐PREPARED fulfilled the latter criterion (see Appendix). Question 12 asked, Has the patient's caretaker voiced any concerns that they have not been coping since the patient was discharged? Among 403 respondents, 52% answered question 12 as Not applicable.
Measures of Construct Validity
We used 3 measures of construct validity in our assessment of the Modified Physician‐PREPARED scale. The first construct item asked the outpatient practitioner, Were you involved at all in planning the patient's discharge? The first construct was relevant because involvement by outpatient physicians improves the quality of hospital discharges.22 The second construct item asked, Are you aware of any community support services that are involved in providing assistance to the patient since discharge? For the third construct, we asked (Appendix item 11), Has the patient voiced any concerns that they have not been coping since discharge? We chose community support services and patient coping because these are clinically relevant and correlated with patients' perceptions of discharge preparedness.23 When we assessed construct validity, our hypotheses were significantly higher Modified Physician‐PREPARED scale values for respondents who answered yes to the construct questions about involvement and awareness and answered no to the question about patient‐voiced concerns.
Analysis
Analyses were performed with SPSS PC (version 14.0.2; SPSS Inc, Chicago, Illinois). We reported descriptive statistics as means, standard deviations (SDs), and range for interval variables; median and range for ordinal variables; and percentages for nominal variables. While developing the scale, the unit of analysis was the physician response to a unique patient. Specific descriptive analyses used the unique respondent as the unit of analysis. To determine the internal consistency of the scale, we calculated Cronbach's alpha with SPSS RELIABILITY. We assessed the distribution of the Modified Physician‐PREPARED scale with visual and statistical tests for skewness. While using the SPSS FACTOR program, we performed principal components extractions and then rotated components using the oblique promax technique. Component scores were saved using the regression score procedure. Component loadings above 0.30 were considered for interpretation.24 Statistical inference tests were the Mann‐Whitney U for median differences for 2 groups, the Kruskal‐Wallis for more than 2 groups, and Spearman correlation for associations. The accepted level of significance was P < 0.05.
RESULTS
Description of Validation Cohort for the Modified Physician‐PREPARED
We sent questionnaires to the primary care physician, nurse practitioner, or physician assistant designated by 549 patients. The survey response rate was 76% (417/549). If a respondent failed to check any response option for 2 or more scale items, then the questionnaire was excluded from analysis. We excluded 3% (14/549) of questionnaires for failure to respond to items. The responses from the remaining 403 questionnaires were analyzed. We did not exclude questionnaires from respondents who followed homebound patients or other patients who failed to come to the clinic for postdischarge visits. Our analysis included 90 questionnaires (22%) from respondents who had no contact with the patient after discharge.
The patient characteristics appear in Table 1. Most of the patients were less than 65 years old (77%, 310/403). Many patients had chronic diseases including diabetes mellitus, ischemic heart disease, heart failure, or chronic obstructive pulmonary disease. Most patients, 81% (327/403), rated their health as poor or fair and 55% (223/403) had 1 or more hospital admissions during the year before their index admission. The questionnaire respondents were primary care physicians who practiced internal medicine (41%, 167/403), medicine‐pediatrics (27%, 108/403), family practice (24%, 97/403), or other specialties (3%, 10/403). Nurse practitioners or physician assistants completed 5% (21/403) of questionnaires.
| Characteristic | Number (%) |
|---|---|
| |
| Gender, female | 235 (58.3%) |
| Race | |
| White | 284 (70.5%) |
| Black | 116 (28.8%) |
| Other | 3 (0.7%) |
| Self‐rated health status | |
| Poor | 125 (31.0%) |
| Fair | 202 (50.1%) |
| Good | 61 (15.1%) |
| Very good | 13 (3.2%) |
| Excellent | 2 (0.5%) |
| Diabetes mellitus | 226 (56.1%) |
| Chronic obstructive pulmonary disease | 76 (18.9%) |
| Ischemic heart disease | 165 (40.9%) |
| Heart failure | 90 (22.3%) |
| Hospital admissions during prior year (includes index admission) | 2.2 (2.0) [0‐15]* |
| Age (years) | 53.6 (15.1) [19‐98]* |
| Pra score | 0.49 (0.07) [0.40‐0.70]* |
We conducted descriptive analyses that treated the respondent as the unit of analysis. There were 172 unique respondents. The number of questionnaires per respondent ranged from 1 to 20 with a median of 1 questionnaire. Respondents varied in the time to return a questionnaire. We measured response time as the difference between the date we received the questionnaire and the date of discharge. The response time ranged from 10 to 90 days with a median of 21 days after discharge.
Modified Physician‐PREPARED: Item Reduction, Internal Consistency, and Score Distributions
The questionnaire items appear in the Appendix. After item reduction, there were 8 items included in the Modified Physician‐PREPARED scale analysis (Table 2). None of the 8 items caused substantive reduction in Cronbach's alpha, so all were retained. The 8‐item scale had acceptable internal consistency (Cronbach's alpha = 0.86). For an individual questionnaire, the sum of the scores for eight items yielded the Modified Physician‐PREPARED scale value. High scale values reflected high perceptions of discharge quality. Each of the 8 items correlated significantly and positively with the scale value (P < 0.001, 2‐tailed).
| Item Text | Descriptor for Score = 1 | Descriptor for Score = 2 | Descriptor for Score = 3 | No Score | |
|---|---|---|---|---|---|
| 1. | When were you made aware that this patient had been admitted to hospital? | Not at all; 55 (13.6%) | After patient was discharged; 65 (16.1%) | Prior to hospitalization; while patient was in hospital; or on the day of discharge; 281 (69.7%) | Missing response; 2 (0.5%) |
| 2. | When were you made aware that the patient was going to be discharged? | Not at all; 115 (28.5%) | Within a week after discharge; or longer than a week after discharge; 61 (15.1%) | While patient was still in hospital; or on day of discharge; or within 1‐2 days after discharge; 225 (55.8%) | Missing response; 2 (0.5%) |
| 3. | How soon after discharge did you receive any information (in any form) relating to this patient's hospital admission and discharge plans? | Longer than a week; or not received; or other 115 (28.5%) | Within a week; 186 (46.2%) | Within 1‐2 days; 101 (25.1%) | Missing response; 1 (0.2%) |
| 4. | Was this sufficient notice to address this patient's postdischarge needs? | Less than sufficient; 98 (24.3%) | Sufficient; 246 (61.0%) | More than sufficient; 46 (11.4%) | Missing response; 13 (3.2%) |
| 5. | Have you received adequate information about this patient's discharge health status? | No; 103 (25.6%) | Yes; 295 (73.2%) | Missing response; 5 (1.2%) | |
| 6. | Have you received adequate written information about the patient's medicines and medication management? | Less than adequate; or no information at all; 103 (25.6%) | Adequate; 262 (65.0%) | More than adequate; 38 (9.4%) | Missing response; 0 (0%) |
| 7. | Did you receive sufficient reasons for changes in medication? (For example, why 1 type of medication is used in preference to another?) | Less than sufficient; or no information at all; 129 (32.0%) | Sufficient; or not applicable (there was no change in medications); 240 (59.6%) | More than sufficient; 29 (7.2%) | Missing response; 5 (1.2%) |
| 8. | In your opinion, how adequate were the discharge plans to assist this patient to assume safe, independent community living? | Less than adequate; or no discharge plans; 82 (20.3%) | Adequate; 276 (68.5%) | More than adequate; 32 (7.9%) | Missing response; 13 (3.2%) |
Table 2 shows the distribution of responses to each item in the Modified Physician‐PREPARED questionnaire. There were substantial ceiling effects for 2 individual items. One of the 7 items with 3 response options had ceiling effects approaching 70% (item 1). One item had 2 response options and 73% responded yes (item 5). The distribution of Modified Physician‐PREPARED scale values for 403 questionnaires had mean 16.6 4.0 SD and skew 0.6 (standard error of skew = 0.1). When scale values of patients 64 years and younger were compared with those of 65 and older, there were no significant differences (P = 0.606). The scale values did not have noteworthy floor or ceiling effects. The distribution of scale values showed 1.2% (5/403) of respondents had the lowest score of 8 and 1.7% (7/403) had the highest score of 24.
Modified Physician‐PREPARED: Principal Component Analysis
The purpose of the principal component analysis was to evaluate the relationships between the items and domains. In the component analysis, we evaluated the correlation matrix of the 8 items in the Modified Physician‐PREPARED scale. The Kaiser‐Meyer‐Olkin statistic of 0.89 indicated sufficient sampling adequacy to extract components from the matrix. Principal components extracted 66% of the variance associated with the 8‐item scale. After inspection of scree plots, we determined that 2 components were extracted before the eigenvalue fell substantially below 1. The pattern matrix for the promax rotation was inspected and the factor loading for each item appears in Table 3. The item content identified 1 component as timeliness of communication. The other component was adequacy of discharge plan/transmission. Within the adequacy component, the item content addressed patient health status, medication information, and reasons for medication changes. All items loaded primarily on 1 of the components; except item 3, which loaded on both components.
| Item Text | Component | ||
|---|---|---|---|
| Adequacy of Discharge Plan/Transmission | Timeliness of Communication | ||
| 7 | Did you receive sufficient reasons for changes in medication? (For example, why one type of medication is used in preference to another?) | 0.900 | 0.132 |
| 6 | Have you received adequate written information about the patient's medicines and medication management? | 0.849 | 0.056 |
| 4 | Was this sufficient notice to address this patient's postdischarge needs? | 0.796 | 0.050 |
| 5 | Have you received adequate information about this patient's discharge health status? | 0.774 | 0.012 |
| 8 | In your opinion, how adequate were the discharge plans to assist this patient to assume safe, independent community living? | 0.744 | 0.132 |
| 3 | How soon after discharge did you receive any information (in any form) relating to this patient's hospital admission and discharge plans? | 0.403 | 0.373 |
| 1 | When were you made aware that this patient had been admitted to hospital? | 0.154 | 0.964 |
| 2 | When were you made aware that the patient was going to be discharged? | 0.123 | 0.779 |
Modified Physician‐PREPARED: Construct Validity
We compared Modified Physician‐PREPARED scale values between dichotomous groups defined by construct variables. When considering the discharge planning and communication for a specific patient, outpatient primary care practitioners reported higher scale values when they were involved in the discharge planning (median [25%, 75%] = 19 [19, 20.5]) than when they were not involved (17 [12.4, 19], P < 0.001). In addition, outpatient practitioners responded with higher scale values when they were aware of community support services (18 [16, 20]) than when they were unaware (17 [12, 19], P = 0.002). There was a nonsignificant trend to higher scale values if patients voiced no concern about coping after discharge (18 [15, 19]) versus concern (17 [12, 19], P = 0.059). For all 3 constructs, the analysis revealed higher Modified Physician‐PREPARED scale values that were in the same direction as hypothesized. We approximated the construct analysis with subscales defined by the principal components (data not shown). The subscale analysis confirmed the direction and significance of the analysis with the full, 8‐item, Modified Physician‐PREPARED scale.
Modified Physician‐PREPARED: Correlations with Baseline Characteristics
We evaluated the correlations between a patient's Modified Physician‐PREPARED scale value and baseline characteristics in Table 1. Patient characteristics were not associated with scale values. We also assessed the median differences between the scale values by practitioner specialty and found no significant differences.
DISCUSSION
The Modified Physician‐PREPARED scale measured the quality of discharge planning and communication from the perspective of the outpatient primary care physician or practitioner. We described the derivation of the scale items. We demonstrated the reliability and validity of the scale among physicians and practitioners who provided postdischarge care to patients at high risk for readmission to the hospital. The item content included timeliness, adequacy, patient health status, medication information, and reasons for medication changes.
According to expert consensus guidelines for hospital discharge care, the communication with the outpatient primary care physician should occur as soon as possible after discharge.25 Recommended data elements in the communication include condition at discharge, diagnoses, medications added, medications discontinued, and medications changed.25 We found the Modified Physician‐PREPARED scale items included content that was consistent with expert consensus guidelines. The items also assessed timeliness and adequacy, 2 domains important to outpatient physicians.14, 26
The Modified Physician‐PREPARED is one of several questionnaires developed to measure qualities of discharge processes from the perspective of outpatient physicians.8, 15, 2733 Previous questionnaires did not report psychometrics except 1 that assessed the quality of discharge summaries and measured test‐retest reliability.33 We are not aware of other physician questionnaires with reliable or valid scales besides the Modified Physician‐PREPARED.
We believe 1 application of the Modified Physician‐PREPARED questionnaire is in quality improvement efforts within hospitals. Most hospitals and inpatient physicians rely on discharge letters or summaries to communicate information about the hospitalization to outpatient practitioners.6 However, systematic problems with generation and transmission of letters and summaries make them sometimes unreliable as sources of consistent, timely, accurate, or important information.6 When patients arrive for their posthospital visits, their outpatient physicians have received no discharge letter for 16% to 53% of patients and no discharge summary for 66% to 88%.6 Among outpatient physicians, 41% attribute preventable adverse events for at least 1 of their patients to inadequate discharge communication.34 One hospital accreditation organization includes discharge communication improvement as a national patient safety goal in the United States.35 Hospitals have multiple motivations to pursue quality improvement projects related to discharge communication: reduction in adverse events, relation with referring physicians, and accreditation by regulators. When surveying physicians, hospital personnel may wish to use a reliable and validated instrument like the Modified Physician‐PREPARED questionnaire.
Another application of the Modified Physician‐PREPARED scale is in research. An example is our randomized, controlled trial to measure the value of a discharge intervention. We published the rationale and design for our intervention.36 In the future, we will analyze the results of our trial and we will need validated scales. One of the trial outcomes is the perspective of the outpatient physician. We expect to compare the scores on the Modified Physician‐PREPARED scale values from community practitioners who treated test patients versus control patients. The statistical properties of the Modified Physician‐PREPARED scale that we validated in the current work will allow us to estimate the precision of between‐group differences and to perform tests of inference.
The results of our study should be interpreted in the context of strengths and limitations. We were able to generalize the validity of the Modified Physician‐PREPARED to North American primary care physicians who treated adult outpatients with a broad age range. We minimized biases with the high survey response rate and low proportion of missing responses. During validation, we asked physicians to evaluate patient transitions from hospital to home. Consequently, the Modified Physician‐PREPARED scale may not apply when doctors follow patients after discharge to nursing homes or other acute care facilities. We excluded patients with low probability of repeat admission: hospice patients and patients with low Pra scores. The purpose of our exclusion criteria was to enrich the sample with patients likely to benefit from interventions to improve discharge processes. We recognize that the Modified Physician‐PREPARED may not generalize to physicians who treat hospice patients or patients with low probability for readmission.
Additional limitations relate to test‐retest reliability and to the clinical meaning of small changes in scale values. In our study, physician respondents returned questionnaires approximately 3 weeks after hospital discharge. We did not ask physicians to complete the questionnaire again after they returned the first questionnaire. Therefore, the test‐retest reliability for the Modified Physician‐PREPARED is unknown. Our protocol was not designed to detect the minimum important difference in the scale values. Consequently, small changes in scale values have uncertain clinical relevance. Future studies are necessary to assess the minimum important difference in the scale values.
CONCLUSION
The Modified Physician‐PREPARED scale was a reliable and valid measure of outpatient physician perceptions of quality and communication after hospital discharge. Clinicians and researchers may find the scale useful to guide, assess, and compare discharge‐planning activities.
APPENDIX
PHYSICIAN‐PREPARED QUESTIONNAIRE
| Item | Question | Response Options |
|---|---|---|
| 1 | When were you made aware that this patient had been admitted to hospital? | Prior to hospitalization |
| While patient was in hospital | ||
| On the day of discharge | ||
| After patient was discharged | ||
| Not at all | ||
| 1a | Who made you aware of the admission? | Hospital ward staff |
| Discharge planner | ||
| Hospital medical staff | ||
| Ambulance | ||
| Patient | ||
| Patient's family/friends | ||
| Other, please specify _________________________ | ||
| 2 | When were you made aware that the patient was going to be discharged? | While patient was still in hospital |
| On day of discharge | ||
| Within 1‐2 days after discharge | ||
| Within a week after discharge | ||
| Longer than a week after discharge | ||
| Not at all | ||
| 2a | Who made you aware of the patient's discharge? | Hospital ward staff |
| Discharge planner | ||
| Hospital medical staff | ||
| Patient | ||
| Patient's family/friends | ||
| Other, please specify _________________________ | ||
| 3 | How soon after discharge did you receive any information (in any form) relating to this patient's hospital admission and discharge plans? | Within 1‐2 days |
| Within a week | ||
| Longer than a week | ||
| Not received | ||
| Other, please specify _________________________ | ||
| 4 | Was this sufficient notice to address this patient's postdischarge needs? | More than sufficient |
| Sufficient | ||
| Less than sufficient | ||
| 5 | Have you received adequate information about this patient's discharge health status? | Yes |
| No | ||
| 5a | How did you receive this information? (Check all that apply) | Telephone call |
| Fax | ||
| Electronic mail system | ||
| Written/typed letter | ||
| 6 | Have you received adequate written information about the patient's medicines and medication management? | More than adequate |
| Adequate | ||
| Less than adequate | ||
| No information at all | ||
| 7 | Did you receive sufficient reasons for changes in medication? (For example, why 1 type of medication is used in preference to another?) | Not applicable (there was no change in medications) |
| More than sufficient | ||
| Sufficient | ||
| Less than sufficient | ||
| No information at all | ||
| 8 | In your opinion, how adequate were the discharge plans to assist this patient to assume safe, independent community living? | More than adequate |
| Adequate | ||
| Less than adequate | ||
| No discharge plans | ||
| 9 | Were you involved at all in planning the patient's discharge? | Yes |
| No | ||
| 10 | Are you aware of any community support services that are involved in providing assistance to the patient since discharge? | Yes |
| No | ||
| 11 | Has the patient voiced any concerns that they have not been coping since discharge? | Yes |
| No | ||
| Not applicable (no contact with patient since discharge) | ||
| 12 | Has the patient's caretaker voiced any concerns that they have not been coping since the patient was discharged? | Not applicable (no caretaker) |
| Yes | ||
| No | ||
| Not applicable (no contact with caretaker since discharge) | ||
| 13 | Have you any suggestions how the patient's discharge could have been improved? | __________________________________________ |
| __________________________________________ | ||
| __________________________________________ |
- ,,,,.The incidence and severity of adverse events affecting patients after discharge from the hospital.Ann Intern Med.2003;138:161–167.
- ,,, et al.Adverse events among medical patients after discharge from hospital.CMAJ.2004;170:345–349.
- ,,.Written and verbal information versus verbal information only for patients being discharged from acute hospital settings to home.Cochrane Database Syst Rev.2003;(4):CD003716.
- ,,,.Discharge planning from hospital to home.Cochrane Database Syst Rev.2004;(1):CD000313.
- ,,,.Care home versus hospital and own home environments for rehabilitation of older people.Cochrane Database Syst Rev.2003;(2):CD003164.
- ,,,,,.Deficits in communication and information transfer between hospital‐based and primary care physicians: implications for patient safety and continuity of care.JAMA.2007;297:831–841.
- ,,,,,.Physician attitudes toward and prevalence of the hospitalist model of care: results of a national survey.Am J Med.2000;109:648–653.
- ,,, et al.Effects of a multidisciplinary, post‐discharge continuance of care intervention on quality of life, discharge satisfaction, and hospital length of stay: a randomized controlled trial.Int J Qual Health Care.2005;17:43–51.
- .Hospitalists and family physicians: understanding opportunities and risks.J Fam Pract.2004;53:473–481.
- ,,,.performance indicators for discharge planning: a focused review of the literature.Aust J Adv Nurs.1999;16:20–28.
- Informing discharge plans. Assessments of elderly patients in Australian public hospitals: a field study. Available at: http://ijahsp.nova.edu/articles/Vol2number3/Grimmer‐Discharge_Plans.htm. Accessed January2008.
- ,,.Experiences of elderly patients regarding independent community living after discharge from hospital: a longitudinal study.Int J Qual Health Care.2004;16:465–472.
- ,,.Life Post‐Discharge: Longitudinal Qualitative and Quantitative Study of 100 Elderly People Post Discharge from Hospital. Technical Report Produced for South Australian Department of Human Services. South Australia: South Australian Department of Human Services;2002.
- ,,,.The quality of communication between hospitals and general practitioners: an assessment.J Qual Clin Pract.1998;18:241–247.
- ,,,,.Do general practitioners and community pharmacists want information on the reasons for drug therapy changes implemented by secondary care?Br J Gen Pract.1997;47:563–566.
- ,,.Predictive validity of a questionnaire that identifies older persons at risk for hospital admission.J Am Geriatr Soc.1995;43:374–377.
- ,,,.Predictive validity of the Pra instrument among older recipients of managed care.J Am Geriatr Soc.1997;45:614–617.
- ,,,,,.Prospective evaluation of a screen for complex discharge planning in hospitalized adults.J Am Geriatr Soc.2003;51:678–682.
- ,.The ten point clock test: a quick screen and grading method for cognitive impairment in medical and surgical patients.Int J Psychiatry Med.1994;24:229–244.
- ,,, et al.comprehensive discharge planning and home follow‐up of hospitalized elders: a randomized clinical trial.JAMA.1999;281:613– 620.
- ,,, et al.Predicting non‐elective hospital readmissions: a multi‐site study. Department of Veterans Affairs Cooperative Study Group on Primary Care and Readmissions.J Clin Epidemiol.2000;53:1113–1118.
- ,,,,.Can GP input into discharge planning result in better outcomes for the frail aged: results from a randomized controlled trial.Fam Pract.1999;16:289–293.
- ,.The development, validity and application of a new instrument to assess the quality of discharge planning activities from the community perspective.Int J Qual Health Care.2001;13:109–116.
- ,.Factor analysis in the development and refinement of clinical assessment instruments.Psychol Assess.1995;7:286–299.
- ,,, et al.Transition of care for hospitalized elderly patients—development of a discharge checklist for hospitalists.J Hosp Med.2006;1:354–360.
- ,,,.Home from hospital: a survey of hospital discharge arrangements in Northamptonshire.J Public Health Med.1992;14:145–150.
- ,,.Electronic clinical communications implementation (ECCI) in Scotland: a mixed‐methods programme evaluation.J Eval Clin Pract.2004;10:11–20.
- ,.General practitioner response to elderly patients discharged from hospital.BMJ.1990;300:159–161.
- ,,,,.Information about patients' deaths: general practitioners' current practice and views on receiving a death register.Br J Gen Pract.1994;44:315–316.
- ,,,.Primary care physician attitudes regarding communication with hospitalists.Am J Med.2001;111:15S–20S.
- ,,,,.The value of inpatient pharmaceutical counselling to elderly patients prior to discharge.Br J Clin Pharmacol.2002;54:657–664.
- ,.Usefulness of letters from hospitals to general practitioners.Br Med J (Clin Res Ed).1984;288:1813–1814.
- ,.What is necessary for high‐quality discharge summaries?Am J Med Qual.1999;14:160–169.
- ,,,,.Outpatient physicians' satisfaction with discharge summaries and perceived need for an electronic discharge summary.J Hosp Med.2006;1:317–320.
- 2007 Hospital/critical access hospital national patient safety goals. Available at: http://www.jointcommission.org/PatientSafety/NationalPatientSafetyGoals. Accessed January2008.
- ,,.Software design to facilitate information transfer at hospital discharge.Inform Prim Care.2006;14:109–119.
Copyright © 2008 Society of Hospital Medicine
Factors of Care Plan Discussions at Admission
Despite an ideal of dying at home, most Americans die in hospitals.1 Patients and families are clear about what they need from the healthcare system at the end of life: relief of distressing symptoms, the opportunity to communicate with physicians and others about death and dying, and the assurance that they will be attended to and comforted by their physicians as they approach death.2, 3 However, discussions about patient preferences for care occur infrequently,47 even though patients want to discuss care with their doctor,68 and physicians believe these discussions are their responsibility.9
The most prominent work in this area occurred in the Study to Understand Prognoses and Preferences for Outcomes and Risks of Treatments (SUPPORT) study, which focused on patients with advanced disease, often in the intensive care unit.4 Furthermore, few studies have focused on general medical patients, and healthcare has changed in important ways since SUPPORT's publication. First, the Patient Self‐Determination Act (PSDA) requires that all patients be asked about their care wishes at the time of admission and document the presence of an advanced directive.10, 11 Second, there is growing awareness of the need to improve palliative care for all hospitalized patients, with many advocating that hospitalization itself is a reason to ask about patient's preferences for care regardless of a patient's level of chronic or acute illness.12 Finally, emergence of hospitalists,1316 movement toward closed intensive care units,17, 18 and changes in residency training have increased segmentation in care of hospitalized patients.15, 18
To overcome limitations of previous literature and update our knowledge of how care discussions take place in the current healthcare environment, we analyzed data from a large study of patients admitted to general medicine services at 6 academic centers. Using this robust dataset, which included prospectively collected information about preferences for communication with their physician, we performed statistical analyses to understand which patient clinical, sociodemographic, and preference‐related factors, as well as factors related to their site of care, were associated with documentation that a code status discussion took place at the time of hospital admission.
PATIENTS AND METHODS
Sites
The Multicenter Hospitalist Study (MCHS) was a multicenter trial of general medical services that enrolled patients at 6 geographically diverse centers: The University of Chicago (which also served as the coordinating center), University of Iowa Hospitals and Clinics, University of California San Francisco, University of Wisconsin, University of New Mexico, and Brigham and Women's Hospital.19
Each site was selected to participate in the MCHS because patients on their general medicine service were admitted to hospitalist and nonhospitalist physicians in a random fashion (eg, based on predetermined call schedule based on day of the week). As teaching hospitals, house officers provided direct care to patients hospitalized at each center; nonteaching services were not present at the sites during the period of this study.
During the period of this study, each site complied with PSDA requirements for noting that patients had been informed about their right to create an advance directive, but no sites had a guideline or other program in place specifically intended to facilitate physician‐patient communication about care wishes. Two sites had active Hospice or Palliative Care services, and another 2 had Geriatrics Consultation services, but none had standard protocols mandating involvement of these consultants at the time of admission, the time when our key outcomes were documented.
Patients
Patients were eligible for inclusion in the MCHS if they were older than 18 years of age and were admitted at random to a hospitalist or nonhospitalist physician; we excluded patients from MCHS if they were admitted specifically under the care of their primary care physician or subspecialist (eg, admitted for chemotherapy) or were a prison inmate. Patients meeting these eligibility criteria were then approached for purposes of informed consent.
Data Collection
Data for this study were obtained from administrative data, patient interview, and chart abstraction as in previous work.14 Administrative data were drawn from cost‐accounting databases at each participating hospital; administrative data were used to provide cost and length of stay data, as well as information about patient insurance type, age, and sex.
We interviewed patients immediately after informed consent was obtained, with both taking place generally within 24 hours of admission. Interviews collected data about patient preferences for care and functional status,20 and other data not reliably available from administrative sources (such as housing situation).
Patient care plan before admission was taken from notes and orders written in the first 24 hours of hospitalization, as mentioned above. Using criteria we employed in previous work,21 a care discussion (CD) was defined as documentation of a discussion between patients (or family) and at least 1 physician (primary physician, hospitalist, consulting physician, or house officer) during the first 24 hours of hospitalization. CDs needed to specify that the person who wrote the note had actually spoken with the patient or their family for the purposes of determining preferences for care, and that this discussion resulted in a specific care plan. Thus, notations such as do not resuscitate/do not intubate, or spoke with family, questions answered, did not qualify as CDs, but a note stating the patient continues to want full efforts was counted as a CD.
Principal investigators at each site were responsible for training and overseeing interviewing and chart abstraction activities at each site, with central oversight of data quality provided by the central coordinating center. Upon receipt at the data coordinating center, all data were examined for missing, nonsensical, or outlier data with errors referred back to the participating sites for correction.
Statistical Analysis
For bivariable comparisons of patients with and without CDs, we used chi‐squared or Mann‐Whitney U‐tests, as appropriate.
Variables with P < 0.20 in bivariable comparisons were selected for initial inclusion in models. Then, using automated forward and stepwise selection techniques as well as manually entered variables, we fit multivariable generalized estimating equations permitting clustering of effects at the physician level to determine the independent association between the multiple factors tested and presence of a CD. In order to guard against the threat of multiple testing, we retained variables at a significance level of P < 0.01; variables were also retained because of observed confounding with other independent variables, or to maintain face validity of the model. All analyses were performed using SAS 9.0 for Windows (SAS Institute Inc., Cary, NC).
RESULTS
Patient Sociodemographics (Table 1)
A total of 17,097 of 33,638 patients (50.8%) were interviewed and gave consent for chart abstraction. Of these patients, 1776 (10.3%) had a CD documented in the first 24 hours of hospitalization. Patients with documented CDs were older, more often white, had completed more years of education, were more likely to have lived in a nursing home prior to admission, and more likely to have been hospitalized in the last 12 months. The proportion of patients with CDs was highly variable across site of enrollment, from 2.8%‐24.9%.
| Value | No Documented CD (n = 15321, 89.7%) | Documented CD (n = 1776, 10.3%) | P* |
|---|---|---|---|
| |||
| Age (Median, 95%CI)* | 56 (55, 56) | 69 (67, 71) | < 0.0001 |
| Female (n, %) | 8390 (54.8%) | 990 (55.7%) | 0.4312 |
| Race (n, %) | |||
| White | 6640 (43.3%) | 938 (52.8%) | < 0.0001 |
| African American | 4673 (30.5%) | 280 (15.8%) | |
| Asian | 532 (3.5%) | 167 (9.4%) | |
| American Indian | 325 (2.1%) | 26 (1.5%) | |
| Other | 1951 (12.7%) | 241 (13.6%) | |
| Refused/Don't know | 1200 (7.8%) | 124 (7.0%) | |
| Ethnicity (n, %) | |||
| Hispanic or Latino Ethnicity | 1724 (11.3%) | 183 (10.3%) | 0.0039 |
| Insurance type (n, %) | |||
| Charity | 481 (3.4%) | 14 (0.8%) | < 0.0001 |
| Indemnity | 3983 (28.2%) | 327 (19.3%) | |
| Medicaid | 2487 (17.6%) | 195 (11.5%) | |
| Medicare | 6418 (45.5%) | 1114 (65.9%) | |
| Other | 105 (0.7%) | 4 (0.2%) | |
| Self pay | 628 (4.5%) | 36 (2.1%) | |
| Self‐reported education (n, %) | |||
| Junior high school or less | 1297 (8.5%) | 217 (12.2%) | < 0.0001 |
| Some high school | 2146 (14.0%) | 182 (10.2%) | |
| High school graduate | 4435 (28.9%) | 465 (26.2%) | |
| Some college or junior college | 3521 (23.0%) | 347 (19.5%) | |
| College graduate | 1729 (11.3%) | 255 (14.4%) | |
| Post‐graduate | 1191 (7.8%) | 173 (9.7%) | |
| Refused/Don't know | 1002 (6.5%) | 137 (7.7%) | |
| Self reported income (n, %) | |||
| $2,500 or less | 1079 (7.0%) | 108 (6.1%) | 0.0002 |
| $2,501 to $5,000 | 424 (2.8%) | 33 (1.9%) | |
| $5,001 to $10,000 | 1436 (9.4%) | 211 (11.9%) | |
| $10,001 to $15,000 | 1080 (7.0%) | 141 (7.9%) | |
| $15,001 to $25,000 | 1054 (6.9%) | 134 (7.5%) | |
| $25,001 to $35,000 | 837 (5.5%) | 74 (4.2%) | |
| $35,001 to $50,000 | 882 (5.8%) | 94 (5.3%) | |
| $50,001 to $100,000 | 1027 (6.7%) | 125 (7.0%) | |
| $100,001 to $200,000 | 357 (2.3%) | 57 (3.2%) | |
| Over $200,000 | 245 (1.6%) | 34 (1.9%) | |
| Don't know/refused | 6900 (45.0%) | 765 (43.1%) | |
| Housing situation (n, %) | |||
| Own apartment or house | 11887 (77.6%) | 1264 (71.2%) | < 0.0001 |
| A relative or friend's apartment or house | 1804 (11.8%) | 217 (12.2%) | |
| A nursing home, group home, or long‐term care facility | 663 (4.3%) | 204 (11.5%) | |
| A homeless shelter | 258 (1.7%) | 27 (1.5%) | |
| Other | 709 (4.6%) | 64 (3.6%) | |
| Marital status (n, %) | |||
| Married | 4992 (32.6%) | 603 (34.0%) | < 0.0001 |
| Living as if married | 440 (2.9%) | 32 (1.8%) | |
| Divorced | 2027 (13.2%) | 199 (11.2%) | |
| Separated | 569 (3.7%) | 30 (1.7%) | |
| Widowed | 2577 (16.8%) | 487 (27.4%) | |
| Single | 4074 (26.6%) | 364 (20.5%) | |
| Refused | 642 (4.2%) | 61 (3.4%) | |
| Hospitalized in the last 12 months (n, %) | 7602 (49.6%) | 1011 (56.9%) | < 0.0001 |
| Site of enrollment (n, %) | |||
| A | 4602 (30.0%) | 135 (7.6%) | < 0.0001 |
| B | 1595 (10.4%) | 158 (8.9%) | |
| C | 3017 (19.7%) | 998 (56.2%) | |
| D | 2387 (15.6%) | 212 (11.9%) | |
| E | 2057 (13.4%) | 131 (7.4%) | |
| F | 1663 (10.9%) | 142 (8.0%) | |
Patient Self‐Reported Health Status and Comorbid Illness (Table 2)
Patients with CDs more often reported a lot of difficulties with bathing, eating, or dressing; household chores; and moderate activities. Patients with CDs were more likely to report accomplishing less than they would like due to their health. They were more likely to have cancer, depression, a history of stroke, and heart disease, but less likely to have diabetes or human immunodeficiency virus.
| Value | No Documented CD (n = 15321, 89.7%) | Documented CD (n = 1776, 10.3%) | P** |
|---|---|---|---|
| |||
| Thinking back again to one month ago, did any impairment or health problem cause you to need help of other persons with personal care needs, such as eating, bathing, dressing, or getting around the home? (n, %) | |||
| No | 10673 (69.7%) | 973 (54.8%) | < 0.0001 |
| Yes, a little | 1933 (12.6%) | 268 (15.1%) | |
| Yes, a lot | 2127 (13.9%) | 487 (27.4%) | |
| Don't know | 588 (3.8%) | 48 (2.7%) | |
| Thinking back to one month ago, did any impairment or health problem cause you to need help in handling everyday household chores, necessary business, shopping, or getting around for other purposes? (n, %) | |||
| No | 7262 (47.4%) | 566 (31.9%) | < 0.0001 |
| Yes, a little | 2692 (17.6%) | 324 (18.2%) | |
| Yes, a lot | 4126 (26.9%) | 825 (46.5%) | |
| Don't know | 1241 (8.1%) | 61 (3.4%) | |
| As far as you know do you have any of the following health conditions at the present time? (n, %) | |||
| Cancer | |||
| No | 13281 (86.7%) | 1376 (77.5%) | < 0.0001 |
| Yes | 1751 (11.4%) | 351 (19.8%) | |
| Not sure | 289 (1.9%) | 49 (2.8%) | |
| Depression | |||
| No | 10269 (67.0%) | 1099 (61.9%) | < 0.0001 |
| Yes | 4730 (30.9%) | 624 (35.1%) | |
| Not sure | 322 (2.1%) | 53 (3.0%) | |
| Diabetes | |||
| No | 10902 (71.2%) | 1356 (76.4%) | < 0.0001 |
| Yes | 4132 (27.0%) | 394 (22.2%) | |
| Not sure | 287 (1.9%) | 26 (1.5%) | |
| Heart trouble | |||
| No | 10251 (66.9%) | 1080 (60.8%) | < 0.0001 |
| Yes | 4491 (29.3%) | 627 (35.3%) | |
| Not sure | 579 (3.8%) | 69 (3.9%) | |
| HIV or AIDS | |||
| No | 14300 (93.3%) | 1679 (94.5%) | 0.026 |
| Yes | 912 (6.0%) | 80 (4.5%) | |
| Not sure | 109 (0.7%) | 17 (1.0%) | |
| Stroke | |||
| No | 13344 (87.1%) | 1494 (84.1%) | 0.0005 |
| Yes | 1722 (11.2%) | 236 (13.3%) | |
| Not sure | 255 (1.7%) | 46 (2.6%) | |
Patient Preferences, Care Plan Documentation, and Care Coordination at Admission (Table 3)
Patients who had documented CDs were less likely to prefer my doctor give me choices regarding my care, and more often disagreed with the statement I prefer to leave care decisions to my physician. These patients were also more likely to have a durable power of attorney or living will in their chart, or have an alternate decision‐maker noted. The majority of patients without a documented CD (79.9%) had no notation of their care wishes, compared to 29.7% in patients with a documented CD. Patients with a documented CD were more likely to have a regular medical provider and a note in the chart from their primary care physician.
| Value | No Documented CD (n = 15321, 89.7%) | Documented CD (n = 1776, 10.3%) | P* |
|---|---|---|---|
| |||
| I prefer my doctor give me choices regarding my care** (n, %) | |||
| Definitely agree | 11619 (75.8%) | 1247 (70.2%) | < 0.0001 |
| Somewhat agree | 1912 (12.5%) | 252 (14.2%) | |
| Somewhat disagree | 488 (3.2%) | 76 (4.3%) | |
| Definitely disagree | 414 (2.7%) | 87 (4.9%) | |
| Don't know | 888 (5.8%) | 114 (6.4%) | |
| I prefer to leave care decisions to my physician** (n, %) | |||
| Definitely agree | 5660 (36.9%) | 613 (34.5%) | < 0.0001 |
| Somewhat agree | 4539 (29.6%) | 493 (27.8%) | |
| Somewhat disagree | 2265 (14.8%) | 257 (14.5%) | |
| Definitely disagree | 1956 (12.8%) | 304 (17.1%) | |
| Don't know | 901 (5.9%) | 109 (6.1%) | |
| Documentation of care wishes before hospitalization (n, %) | |||
| No documentation | 12238 (79.9%) | 527 (29.7%) | < 0.0001 |
| Full support | 2624 (17.1%) | 742 (41.8%) | |
| Do not resuscitate or intubate (DNR/DNI) | 264 (1.7%) | 370 (20.8%) | |
| Hospice | 53 (0.3%) | 22 (1.2%) | |
| Other limitation (eg, no pressors) | 142 (0.9%) | 115 (6.5%) | |
| Had durable power of attorney in chart (n, %) | 286 (1.9%) | 133 (7.5%) | < 0.0001 |
| Had a living will in chart (n, %) | 266 (1.7%) | 142 (8.0%) | < 0.0001 |
| Alternate decision maker named in chart (n, %) | 2770 (18.1%) | 638 (35.9%) | < 0.0001 |
| Patient noted to be unable to participate in their care at admission (eg, confused, unable to respond) (n, %) | 1227 (8.0%) | 431 (24.3%) | < 0.0001 |
| Inpatient team documented discussion with primary care physician (n, %) | 627 (4.1%) | 136 (7.7%) | < 0.0001 |
| Do not have a regular medical provider** (n, %) | 3836 (25.0%) | 254 (14.3%) | < 0.0001 |
| Note from primary care physician in chart (n, %) | 148 (1.0%) | 39 (2.2%) | < 0.0001 |
Factors Associated with Documented Care Discussions (Table 4)
Using predictor variables presented in Tables 1‐3, we then constructed multivariable models seeking to understand factors independently associated with documentation of code status in the entire cohort, as well as among patients who had no preexisting care wishes.
| Entire Cohort (n = 17097) | Patients with No Documentation of Preadmission Wishes (n = 12765) | |||
|---|---|---|---|---|
| Adjusted Odds Ratio (95% CI) | P Value | Adjusted Odds Ratio (95% CI) | P Value | |
| Preadmission Code Status | ||||
| No documentation | Referent | NA | ||
| Full support | 3.22 (2.28, 4.55) | < 0.0001 | NA | |
| Do not resuscitate or intubate (DNR/DNI) | 11.32 (8.52, 15.04) | < 0.0001 | NA | |
| Hospice | 4.02 (2.33, 6.94) | < 0.0001 | NA | |
| Other limitation (eg, no pressors) | 10.13 (7.35, 13.96) | < 0.0001 | NA | |
| Insurance type | ||||
| Medicare | Referent | Referent | ||
| Charity care | 0.50 (0.30, 0.85) | 0.0099 | 0.56 (0.25, 1.25) | 0.1589 |
| Commercial | 0.81 (0.69, 0.95) | 0.0090 | 0.66 (0.52, 0.85) | 0.0009 |
| Medicaid | 0.69 (0.57, 0.82) | < 0.0001 | 0.49 (0.36, 0.67) | < 0.0001 |
| Other | 0.46 (0.18, 1.13) | 0.0912 | 0.60 (0.17, 2.12) | 0.4302 |
| Self pay | 0.70 (0.52, 0.95) | 0.0203 | 0.49 (0.29, 0.81) | 0.0060 |
| Any limitations in bathing, toileting, dressing or feeding self? | ||||
| No | Referent | Referent | ||
| Yes, a little | 1.25 (1.10, 1.42) | 0.0007 | 1.31 (1.03, 1.67) | 0.0272 |
| Yes, a lot | 1.25 (1.09, 1.43) | 0.0015 | 1.42 (1.11, 1.81) | 0.0055 |
| Unable to respond | 0.81 (0.59, 1.12) | 0.2006 | 0.80 (0.45, 1.41) | 0.4299 |
| Patient has a documented surrogate decision maker | 1.72 (1.47, 2.02) | < 0.0001 | 2.08 (1.62, 2.66) | < 0.0001 |
| Patient noted to be unable to participate in their care at admission (eg, confused, unable to respond) | 1.63 (1.37, 1.94) | < 0.0001 | 2.20 (1.60, 3.02) | < 0.0001 |
| Notation that team had spoken to primary care physician at admission | 1.65 (1.29, 2.11) | < 0.0001 | 1.45 (0.92, 2.28) | 0.1116 |
| History of cancer | ||||
| No | Referent | Referent | ||
| Yes | 1.31 (1.13, 1.51) | 0.0003 | 1.26 (0.96, 1.65) | 0.0960 |
| Not sure | 1.26 (0.87, 1.82) | 0.2162 | 1.80 (1.03, 3.15) | 0.0396 |
| History of diabetes | ||||
| No | Referent | Referent | ||
| Yes | 0.87 (0.75, 1.003) | 0.0543 | 0.79 (0.62, 0.997) | 0.0467 |
| Not sure | 0.61 (0.38, 0.99) | 0.0445 | 0.84 (0.43, 1.65) | 0.6183 |
| Housing situation | ||||
| Own house or apartment | Referent | Referent | ||
| Relative or friend's apartment or house | 1.22 (1.03, 1.45) | 0.0229 | 1.29 (0.97, 1.71) | 0.0783 |
| Nursing home, group home, or long‐term care facility | 1.42 (1.16, 1.74) | 0.0006 | 1.74 (1.27, 2.40) | 0.0007 |
| Homeless shelter | 1.12 (0.72, 1.73) | 0.6204 | 0.87 (0.46, 1.63) | 0.6559 |
| Other/Don't know | 1.02 (0.75, 1.40) | 0.8987 | 1.35 (0.78, 2.36) | 0.2859 |
| Age Group | ||||
| <50 | Referent | Referent | ||
| 5059 | 1.19 (0.99, 1.43) | 0.0647 | 1.18 (0.88, 1.59) | 0.2583 |
| 6069 | 1.18 (0.99, 1.40) | 0.0585 | 1.20 (0.88, 1.66) | 0.2549 |
| 7079 | 1.10 (0.91, 1.33) | 0.3178 | 1.19 (0.85, 1.67) | 0.3033 |
| 8089 | 1.23 (1.03, 1.47) | 0.0207 | 1.34 (0.96, 1.88) | 0.0879 |
| 90+ | 1.45 (1.12, 1.88) | 0.0045 | 1.44 (0.94, 2.20) | 0.0934 |
| Site of Enrollment | ||||
| A | Referent | Referent | ||
| B | 1.74 (1.16, 2.61) | 0.007 | 4.95 (2.90, 8.45) | < 0.0001 |
| C | 5.14 (3.42, 7.74) | < 0.0001 | 26.36 (17.28, 40.23) | < 0.0001 |
| D | 4.19 (2.64, 6.66) | < 0.0001 | 8.06 (4.63, 14.03) | < 0.0001 |
| E | 3.00 (1.82, 4.9) | < 0.0001 | 5.30 (2.71, 10.38) | < 0.0001 |
| F | 4.09 (2.69, 6.23) | < 0.0001 | 2.32 (1.32, 4.08) | 0.0037 |
In the entire cohort, insurance type was independently associated with likelihood of a care discussion, with patients with Medicare having greater adjusted odds ratio for a CD than patients with all other forms of insurance, even after adjusting for age. Patients who had functional limitations with bathing, toileting, and feeding; had a documented surrogate decision maker; were unable to participate in their care; had cancer; or did not live in their own home were more likely to have a documented CD. Subjects with diabetes were less likely to have a CD, although this was of borderline significance. Patients whose team had documented a CD with the patients' primary physician were also more likely to have a discussion noted. However, the magnitude of these predictors was small compared to the independent effects attributable to the site the patient was enrolled or whether the patient had any preexisting documentation. Whereas the adjusted odds ratio associated with clinical or functional measures (such as age, cancer) were generally between 1.5 and 2.5, the range of odds ratios associated with having any documentation of care wishes (compared to no documentation) were all greater than 3, and the odds ratios associated with site of enrollment were 1.7 or higher.
We observed similar findings in analyses limited to patients with no preexisting care documentation. While clinical, sociodemographic, and functional factors remained statistically associated with a CD (albeit with wider confidence intervals due to smaller sample sizes), the effect of the patient's site of enrollment became even more striking (Table 4).
DISCUSSION
In this multicenter study of hospitalized general medical patients, documentation of CDs were highly dependent on where patients received care and whether patients had previous documentation of a care plan. In contrast, although clinical, prognostic, and socioeconomic factors were also associated with whether physicians documented asking patients about their wishes for care, the influence of these factors was modest.
Improving communication between patients and their physicians during an episode of acute illness has been a long‐standing goal, with the Study to Understand Prognoses and Preferences for Outcomes of Treatment (SUPPORT) trial providing the most notable example of an effort to improve patient care through aligning patient wishes, prognosis, and aggressiveness for care. However, even the SUPPORT interventiona robust, well‐implemented, and highly labor‐intensive strategywas not able to achieve this goal. In their summary of SUPPORT study findings, the authors suggested that the likelihood of and effectiveness of communication in seriously ill patients may be powerfully influenced by patient and caregiver culture4; our findings may partially confirm SUPPORT's conclusions.
Preexisting documentation in our study would not have included mandated documentation that someone had given the patient information about advance directives (as mandated by the PSDA), but rather a specification for that advance care plan. This distinction means that preexisting documentation in our study represented a previous decision by the patient (or the patient and their physician) to have made a plan, and an association with hospital discussions may be because the first conversation is the hardest to undertake; subsequent discussions then represent confirmatory or clarifying discussions that may be less difficult to broach (particularly for less experienced trainees). A CD may have also been prompted when documentation was unclear, or when a change in prognosis took place (eg, a new diagnosis of metastatic cancer).22 Alternatively, a preexisting plan may serve as a reminder for clinicians to discuss code status, signify patients who are more willing to broach this subject, and either seem more approachable or bring up the topic themselves.
The influence of site on documentation and CD provides additional evidence that caregiver culture played a role in CDs. Although this variation may have been in part due to culture around documentation practices more generally, it is important to note that none of our participating centers had a policy for documentation of care wishes or patient‐doctor communication, or a policy mandating these discussions in any specific patient group. Furthermore, site‐related differences were seen even in patients with no preexisting documentation, and were seen after adjustment for other documentation or communication practices (eg, documenting a discussion with the patient's primary care provider), making it unlikely that documentation practices are solely responsible for our results. Persistence of variations in care documentation raises interesting questions, particularly when one considers recent data describing variations in end‐of‐life care between similar academic centers (one of which was a participating site in this trial).23 Given that the sites in our study represent diverse institutions yet share a number of characteristics, understanding the specific practices or aspects of medical culture that promote conversations may provide insights in how to improve this promotion elsewhere.
Our results would argue that mandates to document code status on admission may be unlikely to improve communication unless sites also develop an approach to using this newly documented information as a prompt for subsequent discussions. In nursing home settings, documentation of advance directives may reduce resource use, but it is unclear whether similar effects will be seen in hospital settings.24 It is also a challenge to insure that documentation of a care plan in the nursing home is communicated to the providers in the hospital.25 The PSDA was a first step in this direction, but its effects on improving communication are uncertain.26 Our results would confirm that the PSDA or systems to mandate documentation are not solutions in themselves, but are 2 steps in a larger process.
We do not want to discount our findings of less frequent CDs among patients of lower socioeconomic status, where gaps in quality of care, communication, and outcomes are well‐recognized.27 As such, our results delineate yet another area where practice can and should be improved for vulnerable patients. However, factors related to site of care and documentation may provide opportunities to improve care even more profoundly and within a fairly discrete (if complex) acute episode of care. Having said this, our results also demonstrate a potential pitfall of using code status documentation for risk‐adjustment, because such notation may be more dependent on local documentation patterns than clinical appropriateness.
Our study has a number of limitations. As an observational study, our findings are likely prone to biases related to unadjusted confounding due to comorbidity. The influence of comorbidity would seem to have been most important in biasing the effects of preexisting documentation, where documentation would be associated with more unaccounted comorbidity. However, there were no differences in documentation even after accounting for prognosis by adjusting for age, functional status, and a valid comorbidity score.28 As we have pointed out, our key outcome is based on documentation of communication and not actual communication, and as such may be biased in subtle ways not related to site of care or the items tested in our model. While we cannot directly eliminate the possibility of documentation biases in our results using statistical methods, it is important to point out that our chart abstraction protocol used highly specific criteria to detect these discussions, and therefore may under‐detect discussions which may have been documented in less detail. Our study did not examine whether documentation of CDs influenced subsequent care. However, previous studies have shown that advance care planning has only a minor influence on care.29 However, communication about preferences at the time of admission, when the need for specific care decisions may be more evident, may be more likely to influence hospital care. Our results show that previous documentation is associated with discussions early in an admission. Such discussion may affect care, even if the decision made is different than what was previously documented. In addition, patients who were included in our study (those able to provide consent and participate in an interview) may be healthier or more cognitively intact than a general population of hospitalized patients. However, how this would have affected our results is unclear. Being able to speak and consent for oneself are key facilitators to communication, but sicker patients who cannot consent or speak for themselves might also be more likely to have care planning decisions made based on illness severity; documentation in these patients may be more driven by whether such notes were required because of the involvement of home health services (or skilled nursing facilities). Finally, although our study is one of the largest examinations of in‐hospital communication to date and its implications for resident education are worth noting, the sites involved in the MCHS may not be representative of nonteaching hospitals, or community‐based teaching hospitals.
Our results suggest that, although comorbid illness and socioeconomic status play an important role in determining which patients receive CDs at the time of admission, these factors are substantially less powerful than preexisting documentation practices and culture or care practices specific to their site of care. These results suggest that future work should consider organizational characteristics and culture as important targets for interventions to improve care planning in hospitalized patients.
- Committee on Care at the End of Life, Institute of Medicine.Approaching Death: Improving Care at the End of Life.Field MJ,Cassel CK, eds.Washington, DC:National Academy Press;1997.
- ,,,,,.Factors considered important at the end of life by patients, family, physicians, and other care providers.JAMA.2000;284(19):2476–2482.
- ,,,,,.In search of a good death: observations of patients, families, and providers.Ann Intern Med.2000;132(10):825–832.
- The SUPPORT Principal Investigators.A controlled trial to improve care for seriously ill hospitalized patients. The study to understand prognoses and preferences for outcomes and risks of treatments (SUPPORT).JAMA.1995;274(20):1591–1598.
- ,.Choices about cardiopulmonary resuscitation in the hospital. When do physicians talk with patients?N Engl J Med.1984;310(17):1089–1093.
- ,,, et al.Patient preferences for communication with physicians about end‐of‐life decisions. SUPPORT Investigators. Study to Understand Prognoses and Preference for Outcomes and Risks of Treatment.Ann Intern Med.1997;127(1):1–12.
- ,,,.Discussing cardiopulmonary resuscitation: a study of elderly outpatients.J Gen Intern Med.1988;3(4):317–321.
- ,,,,.Educating the elderly: cardiopulmonary resuscitation decisions before and after intervention.J Am Geriatr Soc.1991;39(4):372–377.
- ,,,.Factors influencing physicians in recommending in‐hospital cardiopulmonary resuscitation.Arch Intern Med.1993;153(17):1999–2003.
- Federal Register. 42 USC 1395‐1396. Patient Self‐Determination Act1990.
- ,,.Advance directives on admission. Clinical implications and analysis of the Patient Self‐Determination Act of 1990.JAMA.1991;266(3):402–405.
- ,,.A new doctor in the house: ethical issues in hospitalist systems.JAMA.1999;282(2):171–174.
- ,,,,,.Implementation of a hospitalist service at a community teaching hospital: improving clinical efficiency and patient outcomes.Ann Intern Med.2002;137:859–865.
- ,,, et al.Effects of hospitalist physicians on an academic general medical service: results of a randomized trial.Ann Intern Med.2002;137:866–874.
- ,.The hospitalist movement 5 years later.JAMA.2002;287(4):487–494.
- ,,,,.Reorganizing an academic medical service: impact on cost, quality, patient satisfaction, and education.JAMA.1998;279(19):1560–1565.
- ,,,,,.Physician staffing patterns and clinical outcomes in critically ill patients: a systematic review.JAMA.2002;288(17):2151–2162.
- ,,, et al.Organizational characteristics of intensive care units related to outcomes of abdominal aortic surgery.JAMA.1999;281(14):1310–1317.
- ,,, et al.Effects of inpatient experience on outcomes and costs in a multicenter trial of academic hospitalists.J Gen Intern Med.2005;20(Suppl 1):141–142.
- ,,.SF‐12: How to Score the SF‐12 Physical and Mental Health Summary Scales.2nd ed.Boston, MA:New England Medical Center, The Health Institute;1995.
- ,.End‐of‐life care in a voluntary hospitalist model: effects on communication, processes of care, and patient symptoms.Am J Med.2004;116(10):669–675.
- ,,,.Role of written advance directives in decision making: insights from qualitative and quantitative data.J Gen Intern Med.1998;13(7):439–446.
- ,,,,.Evaluating the efficiency of California providers in caring for patients with chronic illnesses.Health Aff (Millwood).2005 Jul‐Dec;Suppl Web Exclusives:W5–526–43.
- ,,, et al.Systematic implementation of an advance directive program in nursing homes: a randomized controlled trial.JAMA.2000;283(11):1437–1444.
- ,.Meeting palliative care needs in post‐acute care settings: “to help them live until they die”.JAMA.2006;295(6):681–686.
- ,,, et al.Advance directives for seriously ill hospitalized patients: effectiveness with the patient self‐determination act and the SUPPORT intervention. SUPPORT Investigators. Study to Understand Prognoses and Preferences for Outcomes and Risks of Treatment.J Am Geriatr Soc.1997;45(4):500–507.
- Institute of Medicine.Unequal Treatment: Confronting Racial and Ethnic Disparities in Health Care.Smedley BD,Stith AY,Nelson AR, eds.Washington, DC:National Academies Press;2003.
- ,,.Use of a self‐report‐generated Charlson Comorbidity Index for predicting mortality.Med Care.2005;43(6):607–615.
- ,,.Can clinical interventions change care at the end of life?Ann Intern Med.1997;126(5):381–388.
Despite an ideal of dying at home, most Americans die in hospitals.1 Patients and families are clear about what they need from the healthcare system at the end of life: relief of distressing symptoms, the opportunity to communicate with physicians and others about death and dying, and the assurance that they will be attended to and comforted by their physicians as they approach death.2, 3 However, discussions about patient preferences for care occur infrequently,47 even though patients want to discuss care with their doctor,68 and physicians believe these discussions are their responsibility.9
The most prominent work in this area occurred in the Study to Understand Prognoses and Preferences for Outcomes and Risks of Treatments (SUPPORT) study, which focused on patients with advanced disease, often in the intensive care unit.4 Furthermore, few studies have focused on general medical patients, and healthcare has changed in important ways since SUPPORT's publication. First, the Patient Self‐Determination Act (PSDA) requires that all patients be asked about their care wishes at the time of admission and document the presence of an advanced directive.10, 11 Second, there is growing awareness of the need to improve palliative care for all hospitalized patients, with many advocating that hospitalization itself is a reason to ask about patient's preferences for care regardless of a patient's level of chronic or acute illness.12 Finally, emergence of hospitalists,1316 movement toward closed intensive care units,17, 18 and changes in residency training have increased segmentation in care of hospitalized patients.15, 18
To overcome limitations of previous literature and update our knowledge of how care discussions take place in the current healthcare environment, we analyzed data from a large study of patients admitted to general medicine services at 6 academic centers. Using this robust dataset, which included prospectively collected information about preferences for communication with their physician, we performed statistical analyses to understand which patient clinical, sociodemographic, and preference‐related factors, as well as factors related to their site of care, were associated with documentation that a code status discussion took place at the time of hospital admission.
PATIENTS AND METHODS
Sites
The Multicenter Hospitalist Study (MCHS) was a multicenter trial of general medical services that enrolled patients at 6 geographically diverse centers: The University of Chicago (which also served as the coordinating center), University of Iowa Hospitals and Clinics, University of California San Francisco, University of Wisconsin, University of New Mexico, and Brigham and Women's Hospital.19
Each site was selected to participate in the MCHS because patients on their general medicine service were admitted to hospitalist and nonhospitalist physicians in a random fashion (eg, based on predetermined call schedule based on day of the week). As teaching hospitals, house officers provided direct care to patients hospitalized at each center; nonteaching services were not present at the sites during the period of this study.
During the period of this study, each site complied with PSDA requirements for noting that patients had been informed about their right to create an advance directive, but no sites had a guideline or other program in place specifically intended to facilitate physician‐patient communication about care wishes. Two sites had active Hospice or Palliative Care services, and another 2 had Geriatrics Consultation services, but none had standard protocols mandating involvement of these consultants at the time of admission, the time when our key outcomes were documented.
Patients
Patients were eligible for inclusion in the MCHS if they were older than 18 years of age and were admitted at random to a hospitalist or nonhospitalist physician; we excluded patients from MCHS if they were admitted specifically under the care of their primary care physician or subspecialist (eg, admitted for chemotherapy) or were a prison inmate. Patients meeting these eligibility criteria were then approached for purposes of informed consent.
Data Collection
Data for this study were obtained from administrative data, patient interview, and chart abstraction as in previous work.14 Administrative data were drawn from cost‐accounting databases at each participating hospital; administrative data were used to provide cost and length of stay data, as well as information about patient insurance type, age, and sex.
We interviewed patients immediately after informed consent was obtained, with both taking place generally within 24 hours of admission. Interviews collected data about patient preferences for care and functional status,20 and other data not reliably available from administrative sources (such as housing situation).
Patient care plan before admission was taken from notes and orders written in the first 24 hours of hospitalization, as mentioned above. Using criteria we employed in previous work,21 a care discussion (CD) was defined as documentation of a discussion between patients (or family) and at least 1 physician (primary physician, hospitalist, consulting physician, or house officer) during the first 24 hours of hospitalization. CDs needed to specify that the person who wrote the note had actually spoken with the patient or their family for the purposes of determining preferences for care, and that this discussion resulted in a specific care plan. Thus, notations such as do not resuscitate/do not intubate, or spoke with family, questions answered, did not qualify as CDs, but a note stating the patient continues to want full efforts was counted as a CD.
Principal investigators at each site were responsible for training and overseeing interviewing and chart abstraction activities at each site, with central oversight of data quality provided by the central coordinating center. Upon receipt at the data coordinating center, all data were examined for missing, nonsensical, or outlier data with errors referred back to the participating sites for correction.
Statistical Analysis
For bivariable comparisons of patients with and without CDs, we used chi‐squared or Mann‐Whitney U‐tests, as appropriate.
Variables with P < 0.20 in bivariable comparisons were selected for initial inclusion in models. Then, using automated forward and stepwise selection techniques as well as manually entered variables, we fit multivariable generalized estimating equations permitting clustering of effects at the physician level to determine the independent association between the multiple factors tested and presence of a CD. In order to guard against the threat of multiple testing, we retained variables at a significance level of P < 0.01; variables were also retained because of observed confounding with other independent variables, or to maintain face validity of the model. All analyses were performed using SAS 9.0 for Windows (SAS Institute Inc., Cary, NC).
RESULTS
Patient Sociodemographics (Table 1)
A total of 17,097 of 33,638 patients (50.8%) were interviewed and gave consent for chart abstraction. Of these patients, 1776 (10.3%) had a CD documented in the first 24 hours of hospitalization. Patients with documented CDs were older, more often white, had completed more years of education, were more likely to have lived in a nursing home prior to admission, and more likely to have been hospitalized in the last 12 months. The proportion of patients with CDs was highly variable across site of enrollment, from 2.8%‐24.9%.
| Value | No Documented CD (n = 15321, 89.7%) | Documented CD (n = 1776, 10.3%) | P* |
|---|---|---|---|
| |||
| Age (Median, 95%CI)* | 56 (55, 56) | 69 (67, 71) | < 0.0001 |
| Female (n, %) | 8390 (54.8%) | 990 (55.7%) | 0.4312 |
| Race (n, %) | |||
| White | 6640 (43.3%) | 938 (52.8%) | < 0.0001 |
| African American | 4673 (30.5%) | 280 (15.8%) | |
| Asian | 532 (3.5%) | 167 (9.4%) | |
| American Indian | 325 (2.1%) | 26 (1.5%) | |
| Other | 1951 (12.7%) | 241 (13.6%) | |
| Refused/Don't know | 1200 (7.8%) | 124 (7.0%) | |
| Ethnicity (n, %) | |||
| Hispanic or Latino Ethnicity | 1724 (11.3%) | 183 (10.3%) | 0.0039 |
| Insurance type (n, %) | |||
| Charity | 481 (3.4%) | 14 (0.8%) | < 0.0001 |
| Indemnity | 3983 (28.2%) | 327 (19.3%) | |
| Medicaid | 2487 (17.6%) | 195 (11.5%) | |
| Medicare | 6418 (45.5%) | 1114 (65.9%) | |
| Other | 105 (0.7%) | 4 (0.2%) | |
| Self pay | 628 (4.5%) | 36 (2.1%) | |
| Self‐reported education (n, %) | |||
| Junior high school or less | 1297 (8.5%) | 217 (12.2%) | < 0.0001 |
| Some high school | 2146 (14.0%) | 182 (10.2%) | |
| High school graduate | 4435 (28.9%) | 465 (26.2%) | |
| Some college or junior college | 3521 (23.0%) | 347 (19.5%) | |
| College graduate | 1729 (11.3%) | 255 (14.4%) | |
| Post‐graduate | 1191 (7.8%) | 173 (9.7%) | |
| Refused/Don't know | 1002 (6.5%) | 137 (7.7%) | |
| Self reported income (n, %) | |||
| $2,500 or less | 1079 (7.0%) | 108 (6.1%) | 0.0002 |
| $2,501 to $5,000 | 424 (2.8%) | 33 (1.9%) | |
| $5,001 to $10,000 | 1436 (9.4%) | 211 (11.9%) | |
| $10,001 to $15,000 | 1080 (7.0%) | 141 (7.9%) | |
| $15,001 to $25,000 | 1054 (6.9%) | 134 (7.5%) | |
| $25,001 to $35,000 | 837 (5.5%) | 74 (4.2%) | |
| $35,001 to $50,000 | 882 (5.8%) | 94 (5.3%) | |
| $50,001 to $100,000 | 1027 (6.7%) | 125 (7.0%) | |
| $100,001 to $200,000 | 357 (2.3%) | 57 (3.2%) | |
| Over $200,000 | 245 (1.6%) | 34 (1.9%) | |
| Don't know/refused | 6900 (45.0%) | 765 (43.1%) | |
| Housing situation (n, %) | |||
| Own apartment or house | 11887 (77.6%) | 1264 (71.2%) | < 0.0001 |
| A relative or friend's apartment or house | 1804 (11.8%) | 217 (12.2%) | |
| A nursing home, group home, or long‐term care facility | 663 (4.3%) | 204 (11.5%) | |
| A homeless shelter | 258 (1.7%) | 27 (1.5%) | |
| Other | 709 (4.6%) | 64 (3.6%) | |
| Marital status (n, %) | |||
| Married | 4992 (32.6%) | 603 (34.0%) | < 0.0001 |
| Living as if married | 440 (2.9%) | 32 (1.8%) | |
| Divorced | 2027 (13.2%) | 199 (11.2%) | |
| Separated | 569 (3.7%) | 30 (1.7%) | |
| Widowed | 2577 (16.8%) | 487 (27.4%) | |
| Single | 4074 (26.6%) | 364 (20.5%) | |
| Refused | 642 (4.2%) | 61 (3.4%) | |
| Hospitalized in the last 12 months (n, %) | 7602 (49.6%) | 1011 (56.9%) | < 0.0001 |
| Site of enrollment (n, %) | |||
| A | 4602 (30.0%) | 135 (7.6%) | < 0.0001 |
| B | 1595 (10.4%) | 158 (8.9%) | |
| C | 3017 (19.7%) | 998 (56.2%) | |
| D | 2387 (15.6%) | 212 (11.9%) | |
| E | 2057 (13.4%) | 131 (7.4%) | |
| F | 1663 (10.9%) | 142 (8.0%) | |
Patient Self‐Reported Health Status and Comorbid Illness (Table 2)
Patients with CDs more often reported a lot of difficulties with bathing, eating, or dressing; household chores; and moderate activities. Patients with CDs were more likely to report accomplishing less than they would like due to their health. They were more likely to have cancer, depression, a history of stroke, and heart disease, but less likely to have diabetes or human immunodeficiency virus.
| Value | No Documented CD (n = 15321, 89.7%) | Documented CD (n = 1776, 10.3%) | P** |
|---|---|---|---|
| |||
| Thinking back again to one month ago, did any impairment or health problem cause you to need help of other persons with personal care needs, such as eating, bathing, dressing, or getting around the home? (n, %) | |||
| No | 10673 (69.7%) | 973 (54.8%) | < 0.0001 |
| Yes, a little | 1933 (12.6%) | 268 (15.1%) | |
| Yes, a lot | 2127 (13.9%) | 487 (27.4%) | |
| Don't know | 588 (3.8%) | 48 (2.7%) | |
| Thinking back to one month ago, did any impairment or health problem cause you to need help in handling everyday household chores, necessary business, shopping, or getting around for other purposes? (n, %) | |||
| No | 7262 (47.4%) | 566 (31.9%) | < 0.0001 |
| Yes, a little | 2692 (17.6%) | 324 (18.2%) | |
| Yes, a lot | 4126 (26.9%) | 825 (46.5%) | |
| Don't know | 1241 (8.1%) | 61 (3.4%) | |
| As far as you know do you have any of the following health conditions at the present time? (n, %) | |||
| Cancer | |||
| No | 13281 (86.7%) | 1376 (77.5%) | < 0.0001 |
| Yes | 1751 (11.4%) | 351 (19.8%) | |
| Not sure | 289 (1.9%) | 49 (2.8%) | |
| Depression | |||
| No | 10269 (67.0%) | 1099 (61.9%) | < 0.0001 |
| Yes | 4730 (30.9%) | 624 (35.1%) | |
| Not sure | 322 (2.1%) | 53 (3.0%) | |
| Diabetes | |||
| No | 10902 (71.2%) | 1356 (76.4%) | < 0.0001 |
| Yes | 4132 (27.0%) | 394 (22.2%) | |
| Not sure | 287 (1.9%) | 26 (1.5%) | |
| Heart trouble | |||
| No | 10251 (66.9%) | 1080 (60.8%) | < 0.0001 |
| Yes | 4491 (29.3%) | 627 (35.3%) | |
| Not sure | 579 (3.8%) | 69 (3.9%) | |
| HIV or AIDS | |||
| No | 14300 (93.3%) | 1679 (94.5%) | 0.026 |
| Yes | 912 (6.0%) | 80 (4.5%) | |
| Not sure | 109 (0.7%) | 17 (1.0%) | |
| Stroke | |||
| No | 13344 (87.1%) | 1494 (84.1%) | 0.0005 |
| Yes | 1722 (11.2%) | 236 (13.3%) | |
| Not sure | 255 (1.7%) | 46 (2.6%) | |
Patient Preferences, Care Plan Documentation, and Care Coordination at Admission (Table 3)
Patients who had documented CDs were less likely to prefer my doctor give me choices regarding my care, and more often disagreed with the statement I prefer to leave care decisions to my physician. These patients were also more likely to have a durable power of attorney or living will in their chart, or have an alternate decision‐maker noted. The majority of patients without a documented CD (79.9%) had no notation of their care wishes, compared to 29.7% in patients with a documented CD. Patients with a documented CD were more likely to have a regular medical provider and a note in the chart from their primary care physician.
| Value | No Documented CD (n = 15321, 89.7%) | Documented CD (n = 1776, 10.3%) | P* |
|---|---|---|---|
| |||
| I prefer my doctor give me choices regarding my care** (n, %) | |||
| Definitely agree | 11619 (75.8%) | 1247 (70.2%) | < 0.0001 |
| Somewhat agree | 1912 (12.5%) | 252 (14.2%) | |
| Somewhat disagree | 488 (3.2%) | 76 (4.3%) | |
| Definitely disagree | 414 (2.7%) | 87 (4.9%) | |
| Don't know | 888 (5.8%) | 114 (6.4%) | |
| I prefer to leave care decisions to my physician** (n, %) | |||
| Definitely agree | 5660 (36.9%) | 613 (34.5%) | < 0.0001 |
| Somewhat agree | 4539 (29.6%) | 493 (27.8%) | |
| Somewhat disagree | 2265 (14.8%) | 257 (14.5%) | |
| Definitely disagree | 1956 (12.8%) | 304 (17.1%) | |
| Don't know | 901 (5.9%) | 109 (6.1%) | |
| Documentation of care wishes before hospitalization (n, %) | |||
| No documentation | 12238 (79.9%) | 527 (29.7%) | < 0.0001 |
| Full support | 2624 (17.1%) | 742 (41.8%) | |
| Do not resuscitate or intubate (DNR/DNI) | 264 (1.7%) | 370 (20.8%) | |
| Hospice | 53 (0.3%) | 22 (1.2%) | |
| Other limitation (eg, no pressors) | 142 (0.9%) | 115 (6.5%) | |
| Had durable power of attorney in chart (n, %) | 286 (1.9%) | 133 (7.5%) | < 0.0001 |
| Had a living will in chart (n, %) | 266 (1.7%) | 142 (8.0%) | < 0.0001 |
| Alternate decision maker named in chart (n, %) | 2770 (18.1%) | 638 (35.9%) | < 0.0001 |
| Patient noted to be unable to participate in their care at admission (eg, confused, unable to respond) (n, %) | 1227 (8.0%) | 431 (24.3%) | < 0.0001 |
| Inpatient team documented discussion with primary care physician (n, %) | 627 (4.1%) | 136 (7.7%) | < 0.0001 |
| Do not have a regular medical provider** (n, %) | 3836 (25.0%) | 254 (14.3%) | < 0.0001 |
| Note from primary care physician in chart (n, %) | 148 (1.0%) | 39 (2.2%) | < 0.0001 |
Factors Associated with Documented Care Discussions (Table 4)
Using predictor variables presented in Tables 1‐3, we then constructed multivariable models seeking to understand factors independently associated with documentation of code status in the entire cohort, as well as among patients who had no preexisting care wishes.
| Entire Cohort (n = 17097) | Patients with No Documentation of Preadmission Wishes (n = 12765) | |||
|---|---|---|---|---|
| Adjusted Odds Ratio (95% CI) | P Value | Adjusted Odds Ratio (95% CI) | P Value | |
| Preadmission Code Status | ||||
| No documentation | Referent | NA | ||
| Full support | 3.22 (2.28, 4.55) | < 0.0001 | NA | |
| Do not resuscitate or intubate (DNR/DNI) | 11.32 (8.52, 15.04) | < 0.0001 | NA | |
| Hospice | 4.02 (2.33, 6.94) | < 0.0001 | NA | |
| Other limitation (eg, no pressors) | 10.13 (7.35, 13.96) | < 0.0001 | NA | |
| Insurance type | ||||
| Medicare | Referent | Referent | ||
| Charity care | 0.50 (0.30, 0.85) | 0.0099 | 0.56 (0.25, 1.25) | 0.1589 |
| Commercial | 0.81 (0.69, 0.95) | 0.0090 | 0.66 (0.52, 0.85) | 0.0009 |
| Medicaid | 0.69 (0.57, 0.82) | < 0.0001 | 0.49 (0.36, 0.67) | < 0.0001 |
| Other | 0.46 (0.18, 1.13) | 0.0912 | 0.60 (0.17, 2.12) | 0.4302 |
| Self pay | 0.70 (0.52, 0.95) | 0.0203 | 0.49 (0.29, 0.81) | 0.0060 |
| Any limitations in bathing, toileting, dressing or feeding self? | ||||
| No | Referent | Referent | ||
| Yes, a little | 1.25 (1.10, 1.42) | 0.0007 | 1.31 (1.03, 1.67) | 0.0272 |
| Yes, a lot | 1.25 (1.09, 1.43) | 0.0015 | 1.42 (1.11, 1.81) | 0.0055 |
| Unable to respond | 0.81 (0.59, 1.12) | 0.2006 | 0.80 (0.45, 1.41) | 0.4299 |
| Patient has a documented surrogate decision maker | 1.72 (1.47, 2.02) | < 0.0001 | 2.08 (1.62, 2.66) | < 0.0001 |
| Patient noted to be unable to participate in their care at admission (eg, confused, unable to respond) | 1.63 (1.37, 1.94) | < 0.0001 | 2.20 (1.60, 3.02) | < 0.0001 |
| Notation that team had spoken to primary care physician at admission | 1.65 (1.29, 2.11) | < 0.0001 | 1.45 (0.92, 2.28) | 0.1116 |
| History of cancer | ||||
| No | Referent | Referent | ||
| Yes | 1.31 (1.13, 1.51) | 0.0003 | 1.26 (0.96, 1.65) | 0.0960 |
| Not sure | 1.26 (0.87, 1.82) | 0.2162 | 1.80 (1.03, 3.15) | 0.0396 |
| History of diabetes | ||||
| No | Referent | Referent | ||
| Yes | 0.87 (0.75, 1.003) | 0.0543 | 0.79 (0.62, 0.997) | 0.0467 |
| Not sure | 0.61 (0.38, 0.99) | 0.0445 | 0.84 (0.43, 1.65) | 0.6183 |
| Housing situation | ||||
| Own house or apartment | Referent | Referent | ||
| Relative or friend's apartment or house | 1.22 (1.03, 1.45) | 0.0229 | 1.29 (0.97, 1.71) | 0.0783 |
| Nursing home, group home, or long‐term care facility | 1.42 (1.16, 1.74) | 0.0006 | 1.74 (1.27, 2.40) | 0.0007 |
| Homeless shelter | 1.12 (0.72, 1.73) | 0.6204 | 0.87 (0.46, 1.63) | 0.6559 |
| Other/Don't know | 1.02 (0.75, 1.40) | 0.8987 | 1.35 (0.78, 2.36) | 0.2859 |
| Age Group | ||||
| <50 | Referent | Referent | ||
| 5059 | 1.19 (0.99, 1.43) | 0.0647 | 1.18 (0.88, 1.59) | 0.2583 |
| 6069 | 1.18 (0.99, 1.40) | 0.0585 | 1.20 (0.88, 1.66) | 0.2549 |
| 7079 | 1.10 (0.91, 1.33) | 0.3178 | 1.19 (0.85, 1.67) | 0.3033 |
| 8089 | 1.23 (1.03, 1.47) | 0.0207 | 1.34 (0.96, 1.88) | 0.0879 |
| 90+ | 1.45 (1.12, 1.88) | 0.0045 | 1.44 (0.94, 2.20) | 0.0934 |
| Site of Enrollment | ||||
| A | Referent | Referent | ||
| B | 1.74 (1.16, 2.61) | 0.007 | 4.95 (2.90, 8.45) | < 0.0001 |
| C | 5.14 (3.42, 7.74) | < 0.0001 | 26.36 (17.28, 40.23) | < 0.0001 |
| D | 4.19 (2.64, 6.66) | < 0.0001 | 8.06 (4.63, 14.03) | < 0.0001 |
| E | 3.00 (1.82, 4.9) | < 0.0001 | 5.30 (2.71, 10.38) | < 0.0001 |
| F | 4.09 (2.69, 6.23) | < 0.0001 | 2.32 (1.32, 4.08) | 0.0037 |
In the entire cohort, insurance type was independently associated with likelihood of a care discussion, with patients with Medicare having greater adjusted odds ratio for a CD than patients with all other forms of insurance, even after adjusting for age. Patients who had functional limitations with bathing, toileting, and feeding; had a documented surrogate decision maker; were unable to participate in their care; had cancer; or did not live in their own home were more likely to have a documented CD. Subjects with diabetes were less likely to have a CD, although this was of borderline significance. Patients whose team had documented a CD with the patients' primary physician were also more likely to have a discussion noted. However, the magnitude of these predictors was small compared to the independent effects attributable to the site the patient was enrolled or whether the patient had any preexisting documentation. Whereas the adjusted odds ratio associated with clinical or functional measures (such as age, cancer) were generally between 1.5 and 2.5, the range of odds ratios associated with having any documentation of care wishes (compared to no documentation) were all greater than 3, and the odds ratios associated with site of enrollment were 1.7 or higher.
We observed similar findings in analyses limited to patients with no preexisting care documentation. While clinical, sociodemographic, and functional factors remained statistically associated with a CD (albeit with wider confidence intervals due to smaller sample sizes), the effect of the patient's site of enrollment became even more striking (Table 4).
DISCUSSION
In this multicenter study of hospitalized general medical patients, documentation of CDs were highly dependent on where patients received care and whether patients had previous documentation of a care plan. In contrast, although clinical, prognostic, and socioeconomic factors were also associated with whether physicians documented asking patients about their wishes for care, the influence of these factors was modest.
Improving communication between patients and their physicians during an episode of acute illness has been a long‐standing goal, with the Study to Understand Prognoses and Preferences for Outcomes of Treatment (SUPPORT) trial providing the most notable example of an effort to improve patient care through aligning patient wishes, prognosis, and aggressiveness for care. However, even the SUPPORT interventiona robust, well‐implemented, and highly labor‐intensive strategywas not able to achieve this goal. In their summary of SUPPORT study findings, the authors suggested that the likelihood of and effectiveness of communication in seriously ill patients may be powerfully influenced by patient and caregiver culture4; our findings may partially confirm SUPPORT's conclusions.
Preexisting documentation in our study would not have included mandated documentation that someone had given the patient information about advance directives (as mandated by the PSDA), but rather a specification for that advance care plan. This distinction means that preexisting documentation in our study represented a previous decision by the patient (or the patient and their physician) to have made a plan, and an association with hospital discussions may be because the first conversation is the hardest to undertake; subsequent discussions then represent confirmatory or clarifying discussions that may be less difficult to broach (particularly for less experienced trainees). A CD may have also been prompted when documentation was unclear, or when a change in prognosis took place (eg, a new diagnosis of metastatic cancer).22 Alternatively, a preexisting plan may serve as a reminder for clinicians to discuss code status, signify patients who are more willing to broach this subject, and either seem more approachable or bring up the topic themselves.
The influence of site on documentation and CD provides additional evidence that caregiver culture played a role in CDs. Although this variation may have been in part due to culture around documentation practices more generally, it is important to note that none of our participating centers had a policy for documentation of care wishes or patient‐doctor communication, or a policy mandating these discussions in any specific patient group. Furthermore, site‐related differences were seen even in patients with no preexisting documentation, and were seen after adjustment for other documentation or communication practices (eg, documenting a discussion with the patient's primary care provider), making it unlikely that documentation practices are solely responsible for our results. Persistence of variations in care documentation raises interesting questions, particularly when one considers recent data describing variations in end‐of‐life care between similar academic centers (one of which was a participating site in this trial).23 Given that the sites in our study represent diverse institutions yet share a number of characteristics, understanding the specific practices or aspects of medical culture that promote conversations may provide insights in how to improve this promotion elsewhere.
Our results would argue that mandates to document code status on admission may be unlikely to improve communication unless sites also develop an approach to using this newly documented information as a prompt for subsequent discussions. In nursing home settings, documentation of advance directives may reduce resource use, but it is unclear whether similar effects will be seen in hospital settings.24 It is also a challenge to insure that documentation of a care plan in the nursing home is communicated to the providers in the hospital.25 The PSDA was a first step in this direction, but its effects on improving communication are uncertain.26 Our results would confirm that the PSDA or systems to mandate documentation are not solutions in themselves, but are 2 steps in a larger process.
We do not want to discount our findings of less frequent CDs among patients of lower socioeconomic status, where gaps in quality of care, communication, and outcomes are well‐recognized.27 As such, our results delineate yet another area where practice can and should be improved for vulnerable patients. However, factors related to site of care and documentation may provide opportunities to improve care even more profoundly and within a fairly discrete (if complex) acute episode of care. Having said this, our results also demonstrate a potential pitfall of using code status documentation for risk‐adjustment, because such notation may be more dependent on local documentation patterns than clinical appropriateness.
Our study has a number of limitations. As an observational study, our findings are likely prone to biases related to unadjusted confounding due to comorbidity. The influence of comorbidity would seem to have been most important in biasing the effects of preexisting documentation, where documentation would be associated with more unaccounted comorbidity. However, there were no differences in documentation even after accounting for prognosis by adjusting for age, functional status, and a valid comorbidity score.28 As we have pointed out, our key outcome is based on documentation of communication and not actual communication, and as such may be biased in subtle ways not related to site of care or the items tested in our model. While we cannot directly eliminate the possibility of documentation biases in our results using statistical methods, it is important to point out that our chart abstraction protocol used highly specific criteria to detect these discussions, and therefore may under‐detect discussions which may have been documented in less detail. Our study did not examine whether documentation of CDs influenced subsequent care. However, previous studies have shown that advance care planning has only a minor influence on care.29 However, communication about preferences at the time of admission, when the need for specific care decisions may be more evident, may be more likely to influence hospital care. Our results show that previous documentation is associated with discussions early in an admission. Such discussion may affect care, even if the decision made is different than what was previously documented. In addition, patients who were included in our study (those able to provide consent and participate in an interview) may be healthier or more cognitively intact than a general population of hospitalized patients. However, how this would have affected our results is unclear. Being able to speak and consent for oneself are key facilitators to communication, but sicker patients who cannot consent or speak for themselves might also be more likely to have care planning decisions made based on illness severity; documentation in these patients may be more driven by whether such notes were required because of the involvement of home health services (or skilled nursing facilities). Finally, although our study is one of the largest examinations of in‐hospital communication to date and its implications for resident education are worth noting, the sites involved in the MCHS may not be representative of nonteaching hospitals, or community‐based teaching hospitals.
Our results suggest that, although comorbid illness and socioeconomic status play an important role in determining which patients receive CDs at the time of admission, these factors are substantially less powerful than preexisting documentation practices and culture or care practices specific to their site of care. These results suggest that future work should consider organizational characteristics and culture as important targets for interventions to improve care planning in hospitalized patients.
- Committee on Care at the End of Life, Institute of Medicine.Approaching Death: Improving Care at the End of Life.Field MJ,Cassel CK, eds.Washington, DC:National Academy Press;1997.
- ,,,,,.Factors considered important at the end of life by patients, family, physicians, and other care providers.JAMA.2000;284(19):2476–2482.
- ,,,,,.In search of a good death: observations of patients, families, and providers.Ann Intern Med.2000;132(10):825–832.
- The SUPPORT Principal Investigators.A controlled trial to improve care for seriously ill hospitalized patients. The study to understand prognoses and preferences for outcomes and risks of treatments (SUPPORT).JAMA.1995;274(20):1591–1598.
- ,.Choices about cardiopulmonary resuscitation in the hospital. When do physicians talk with patients?N Engl J Med.1984;310(17):1089–1093.
- ,,, et al.Patient preferences for communication with physicians about end‐of‐life decisions. SUPPORT Investigators. Study to Understand Prognoses and Preference for Outcomes and Risks of Treatment.Ann Intern Med.1997;127(1):1–12.
- ,,,.Discussing cardiopulmonary resuscitation: a study of elderly outpatients.J Gen Intern Med.1988;3(4):317–321.
- ,,,,.Educating the elderly: cardiopulmonary resuscitation decisions before and after intervention.J Am Geriatr Soc.1991;39(4):372–377.
- ,,,.Factors influencing physicians in recommending in‐hospital cardiopulmonary resuscitation.Arch Intern Med.1993;153(17):1999–2003.
- Federal Register. 42 USC 1395‐1396. Patient Self‐Determination Act1990.
- ,,.Advance directives on admission. Clinical implications and analysis of the Patient Self‐Determination Act of 1990.JAMA.1991;266(3):402–405.
- ,,.A new doctor in the house: ethical issues in hospitalist systems.JAMA.1999;282(2):171–174.
- ,,,,,.Implementation of a hospitalist service at a community teaching hospital: improving clinical efficiency and patient outcomes.Ann Intern Med.2002;137:859–865.
- ,,, et al.Effects of hospitalist physicians on an academic general medical service: results of a randomized trial.Ann Intern Med.2002;137:866–874.
- ,.The hospitalist movement 5 years later.JAMA.2002;287(4):487–494.
- ,,,,.Reorganizing an academic medical service: impact on cost, quality, patient satisfaction, and education.JAMA.1998;279(19):1560–1565.
- ,,,,,.Physician staffing patterns and clinical outcomes in critically ill patients: a systematic review.JAMA.2002;288(17):2151–2162.
- ,,, et al.Organizational characteristics of intensive care units related to outcomes of abdominal aortic surgery.JAMA.1999;281(14):1310–1317.
- ,,, et al.Effects of inpatient experience on outcomes and costs in a multicenter trial of academic hospitalists.J Gen Intern Med.2005;20(Suppl 1):141–142.
- ,,.SF‐12: How to Score the SF‐12 Physical and Mental Health Summary Scales.2nd ed.Boston, MA:New England Medical Center, The Health Institute;1995.
- ,.End‐of‐life care in a voluntary hospitalist model: effects on communication, processes of care, and patient symptoms.Am J Med.2004;116(10):669–675.
- ,,,.Role of written advance directives in decision making: insights from qualitative and quantitative data.J Gen Intern Med.1998;13(7):439–446.
- ,,,,.Evaluating the efficiency of California providers in caring for patients with chronic illnesses.Health Aff (Millwood).2005 Jul‐Dec;Suppl Web Exclusives:W5–526–43.
- ,,, et al.Systematic implementation of an advance directive program in nursing homes: a randomized controlled trial.JAMA.2000;283(11):1437–1444.
- ,.Meeting palliative care needs in post‐acute care settings: “to help them live until they die”.JAMA.2006;295(6):681–686.
- ,,, et al.Advance directives for seriously ill hospitalized patients: effectiveness with the patient self‐determination act and the SUPPORT intervention. SUPPORT Investigators. Study to Understand Prognoses and Preferences for Outcomes and Risks of Treatment.J Am Geriatr Soc.1997;45(4):500–507.
- Institute of Medicine.Unequal Treatment: Confronting Racial and Ethnic Disparities in Health Care.Smedley BD,Stith AY,Nelson AR, eds.Washington, DC:National Academies Press;2003.
- ,,.Use of a self‐report‐generated Charlson Comorbidity Index for predicting mortality.Med Care.2005;43(6):607–615.
- ,,.Can clinical interventions change care at the end of life?Ann Intern Med.1997;126(5):381–388.
Copyright © 2008 Society of Hospital Medicine
Sleep in Hospitalized Medical Patients: Part 1
Hospitalized patients often have difficulty initiating and maintaining sleep, or complain of early awakening and nonrestorative sleep.1 The etiology of sleep disruption is multifactorial and includes the patient's underlying illness(es), medical treatments, and the hospital environment. Often unrecognized and untreated during hospitalization, sleep disruption may lead to sleep deprivation, or a chronic lack of restorative sleep.
Even in healthy individuals, sleep deprivation can result in numerous physical and psychological consequences. Sleep deprivation is associated with hypertension,2, 3 impaired postural control,4 decreased ventilatory drive,5 increased sympathetic cardiovascular activation,6 blunted hypothalamic‐pituitary‐adrenal axis,7 impaired host defenses, and possibly diabetes mellitus and obesity.810 The lack of restorative sleep increases the risk of developing anxiety and mood disorders and delirium, especially in acutely ill older patients.11 In the presence of acute physical infirmity, inadequate sleep may further compound illness and impair recovery. We provide an overview of normal sleep architecture and discuss factors that lead to sleep disruption in hospitalized medical patients.
NORMAL SLEEP ARCHITECTURE AND REGULATION
Normal sleep architecture refers to a characteristic pattern of sleep, and consists of two major stages: nonrapid eye movement (NREM, pronounced non‐rem) and rapid eye movement (REM). (For a table of pertinent abbreviations and terms, see Table 1) Sleep is quantified by polysomnography (PSG), which includes an electroencephalogram (EEG), electromyogram (EMG), and electrooculogram (EOG). A PSG also includes an electrocardiogram (ECG), and measures of airflow, oxygen saturation, and body position. NREM sleep comprises 75% to 80% of total sleep time (TST), and is characterized by relatively quiescent brain activity and decreased metabolic rate.12 NREM sleep consists of four stages (S1‐S4), with each stage leading to a progressively deeper sleep (Figure 1). REM sleep follows slow wave sleep (SWS), or deep sleep, and increases over the night, comprising 20% to 25% of TST. REM sleep is characterized by an activated EEG pattern, muscle atonia, and episodic bursts of rapid eye movements.
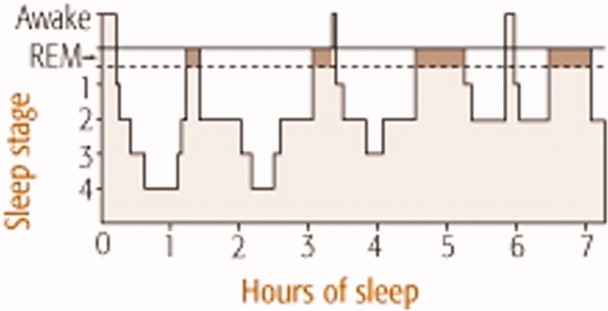
| Acronym | Term |
|---|---|
| BiPAP | Bilevel positive airway pressure |
| CHF | Congestive heart failure |
| CPAP | Continuous positive airway pressure |
| COPD | Chronic obstructive pulmonary disease |
| EEG | Electroencephalogram |
| EOG | Electroculogram |
| EMG | Electromyogram |
| ESRD | End‐stage renal disease |
| NPPV | Noninvasive positive pressure ventilation |
| NREM | Nonrapid eye movement |
| OSA | Obstructive sleep apnea |
| PLMD | Periodic limb movement disorder |
| PSG | Polysomnography |
| RBD | REM sleep behavior disorder |
| REM | Rapid eye movement |
| RLS | Restless leg syndrome |
| S1‐S4 | 4 Stages of sleep in NREM |
| SE | Sleep efficiency; TST divided by total time in bed |
| SWS | Slow wave sleep |
| TBI | Traumatic brain injury |
| TST | Total sleep time |
Normal sleep provides a period of physiologic and mental rest. During sleep, sympathetic tone decreases and parasympathetic tone increases, leading to a reduction in heart rate, arterial blood pressure, and cardiac output.13 Deep sleep is theorized to be necessary for physiologic restoration. REM sleep is associated with dreaming, and is essential for maintaining emotional and cognitive well‐being. Sleep architecture undergoes characteristic changes as people age.14 The duration of SWS peaks in childhood and decreases with age. Consequently, people >60 years old tend to have lower arousal thresholds and to have more frequent awakenings. The results of the Sleep Heart Health Study found that increased age was associated with decreased percentage of REM sleep, worse sleep efficiency (SE, which is TST divided by total time in bed), and lower arousal thresholds.14 With the reduction of SE, older people need to spend more hours in bed to achieve the same amount of restorative sleep as when they were younger. Although sleep tends to become more disrupted as people age, insomnia should not be considered a normal part of aging, and needs to be addressed clinically.15 The results of a National Sleep Foundation telephone survey of subjects between the ages of 55 and 84 years old (n = 1,506) suggested that sleep complaints in older adults are frequently secondary to comorbid medical conditions.16
Multiple anatomic structures, pathways, and neurotransmitter systems are involved in controlling wakefulness and sleep. Neurotransmitters that promote wakefulness include acetylcholine, histamine, noradrenaline (norepinephrine), serotonin, dopamine, and hypocretin (orexin). Sleep‐promoting neurotransmitters include gamma aminobutyric acid (GABA), adenosine, and melatonin. Specific stages of sleep are regulated by the turning on and off of various neurons. REM on cells use GABA, acetylcholine, and glutamine, whereas REM off cells use norepinephrine and serotonin. SWS is promoted by GABA and serotonin.17
Sleep regulation is a balance between a homeostatic sleep need and an intrinsic body clock, or circadian pacemaker. Located in the suprachiasmic nucleus, the circadian pacemaker determines the onset and termination of sleep, and is partially regulated by environmental cues such as light and ambient temperature. Melatonin, a physiologic sleep promoter, is inhibited by ambient light, and its circulation is decreased during daylight hours. The adrenal secretion of cortisol, which is associated with wakefulness, follows a circadian pattern. Regulated by the hypothalamic‐pituitary axis, cortisol levels peak in the early morning hours in preparation for the increased metabolic demands during wakefulness.
SLEEP PROBLEMS IN HOSPITALIZED PATIENTS
Insomnia, which is characterized by difficulty initiating or maintaining sleep, is the most common sleep disorder in the United States. About one‐third of the adult population in the United States experiences insomnia at some point in their lives,18 and it is a persistent problem in approximately 10% of U.S. adults.19 Insomnia can be exacerbated during hospitalization.
Studies investigating sleep in hospitalized patients using PSG have been limited primarily to the setting of the intensive care unit (ICU). Critically ill patients, particularly those requiring mechanical ventilation, are prone to sleep disturbances and an associated delirium.2022 Critically ill patients have fragmented sleep, with decreased SE and SWS, and increased S1 and S2.23 Physician awareness of the impact of sleep disturbance in hospitalized patients is vital. Surveys reveal that approximately one‐half of patients admitted on general medical wards complain of sleep disruption.24, 25 Meissner et al.25 examined the prevalence of sleep complaints and physician recognition of these complaints among general medical patients admitted to a Veterans Affairs tertiary care center. Results showed that 47% (n = 222) of patients had complaints of either insomnia and/or excessive daytime sleepiness.
FACTORS AFFECTING SLEEP DURING HOSPITALIZATION
Many medical and neurologic illnesses, psychiatric disorders, pain, medication therapy and the hospital environment may impair sleep, and hinder recovery from illness.
General Medical Disorders
Primary sleep disorders, such as obstructive sleep apnea (OSA) and numerous other medical illnesses, can directly impair sleep physiology, leading to a cyclical interaction (Figure 2). Other conditions that disrupt sleep include congestive heart failure (CHF), diabetes mellitus, chronic obstructive pulmonary disease (COPD), gastroesophageal reflux, cardiovascular disease, thyroid disorders, renal disease, and severe liver disease.26 Table 2 lists selected medical and neurological conditions, their associated sleep‐related problems, and suggestions on how to ameliorate these problems.
| Disease | Problem | Clinical Implications and Strategies to Improve Sleep |
|---|---|---|
| ||
| Asthma | Nocturnal exacerbation, nocturnal GER | Inhaled corticosteroids and/or long‐acting inhaled beta‐adrenergic agents |
| CHF | Orthopnea, paroxysmal nocturnal dyspnea, sleep‐disordered breathing, increased sympathetic tone, nighttime diuresis, Cheyne‐Stokes respiration | Keep the head of bed elevated 30 degrees. Nocturnal O2 to keep O2 saturation >88%. Daytime diuresis. Optimize cardiac function to treat Cheyne‐Stokes respiration. Consider CPAP for CHF |
| COPD | Persistent nocturnal hypoxemia with complications (e.g., cor pulmonale, polycythemia) | O2 for COPD and persistent hypoxemia (PaO2 55‐60 mm Hg) |
| Sporadic nighttime desaturations | PaO2 55 mm Hg monitor O2 saturation by pulse oximetry. If patient desaturates to 88% at night consistently, start nocturnal O2. For hypercapnia, adjust O2 to maintain O2 saturation at 88% to 90% | |
| Early‐morning airflow obstruction | Consider bedtime tiotropium and inhaled long‐acting beta‐adrenergic agonist agents | |
| Inhibition of respiratory muscles in REM | Avoid sedative‐hypnotics that cause respiratory depression | |
| Decreased functional residual capacity from recumbent position during sleep | Minimize recumbancy by keeping the head of bed up at 30 degrees | |
| End‐stage renal disease | Pruritus, nausea; increased risk of RLS and PLMD | Ambulation may help with RLS. Consider ropinirole and pramipexole. Correct hyperphosphatemia and uremia. Consider antipruritic and antiemetic agents |
| Nocturnal GER | Nocturnal GER decreased sleep, heartburn, coughing, asthma | Avoid eating or drinking 2 hours before bedtime, especially those that delay gastric emptying, increase acid secretion, or decrease lower esophageal sphincter pressure; e.g., high‐fat foods, ethanol, chocolate, peppers, peppermint. Keep head of bed 30 degrees. Minimize medications that could worsen nocturnal GER; e.g., theophylline, calcium channel blockers, prostaglandins, bisphosphonates |
| OSA | Snoring with upper airway obstruction | No ethanol 2 hours before bedtime. Minimize CNS depressants. Avoid supine position. Consider CPAP, oral mandibular advancement device, and/or surgical correction. Long‐term plan should include weight loss |
| Stroke | Focal neurologic deficits (e.g., dysphagia, weakness or paralysis) | Keep head of bed 30 degrees. Regularly suction secretions. Post‐stroke patients have an increased risk of hypersomnia, insomnia, and/or OSA |
Affecting approximately 24% of men and 9% of women in the United States, OSA is the most common primary sleep disorder,27, 28 and causes significant mental and physical morbidity. Risk factors for OSA include obesity, hypothyroidism‐induced muscle weakness, and structural abnormalities in the oropharynx region such as acromegaly, micrognathia, or retrognathia. OSA is characterized by episodes of complete or partial pharyngeal obstruction during sleep that cause snoring, apneic episodes, choking, dyspnea, and restlessness.28 These episodes are associated with intermittent nocturnal sympathetic activation leading to nocturnal awakenings and cortical arousals, all of which lead to daytime symptoms of fatigue, sleepiness, and cognitive impairment (Figure 2). In addition, chronic sympathetic activation causes numerous derangements in the vascular endothelium and platelet activation.29, 30 Sleep‐disordered breathing has been independently associated with cardiovascular diseases such as hypertension, CHF, ischemic heart disease, atrial fibrillation, and cerebrovascular disease.31, 32
OSA is also associated with sleep‐related gastroesophageal reflux, which is characterized by pain and nocturnal cough, and can induce nocturnal asthma attacks and laryngospasm.33 Green et al.29 found that OSA patients treated with continuous positive airway pressure (CPAP) had a 48% improvement in nocturnal reflux symptoms. Although the pathophysiology connecting OSA to the renal system is unknown, OSA has been found in up to 60% of patients with end‐stage renal disease and chronic renal failure.34
Patients with pulmonary disorders can be profoundly affected by the normal physiologic changes during sleep, particularly in REM sleep. During REM sleep, all respiratory muscles except the diaphragm become paralyzed. Thus, episodes of marked oxygen desaturation can occur in patients who rely on their accessory muscles for respiration. COPD patients have decreased TST, SWS, and REM sleep. Shortness of breath, nocturnal cough, and wheezing worsen sleep.35 The resulting fatigue and sleep deprivation negatively impact the work of breathing and impair gas exchange. Airflow obstruction tends to worsen in the early morning hours in patients with COPD and asthma, and may be related to the effect of REM on the accessory muscles for respiration. Although used to target CO2 retention, investigations using bilevel positive airway pressure ventilators (BiPAP) for improving sleep in COPD patients have been limited. Noninvasive positive pressure ventilation (NPPV) appears to acutely improve SE and TST in patients with hypercapnic COPD without significantly improving gas exchange. Other sleep parameters such as sleep architecture and the number of arousals during the night, remain unchanged during NPPV.36
CPAP has several side effects that could worsen sleep, which may explain its poor adherence rate among ambulatory patients.37 Side effects include nasal bridge discomfort, nasal congestion, swallowing air, dry nose, dry or red eyes, noise, ear pain, and rhinitis.38 During hospitalization, efforts should be made to improve patient comfort by resizing ill‐fitting masks, adding heated humidification or nasal steroids to alleviate nasal congestion, or adding a chin strap to reduce air leak and ingestion of air.
Endocrine disorders have also been associated with sleep disruption. Studies suggest that patients with diabetes mellitus have decreased TST and impaired sleep quality due to nocturia and neuropathic pain.39 Inadequate sleep may also affect glucose control. Inadequate quality or quantity of sleep has been shown to be a risk factor for developing Type 2 diabetes mellitus in large prospective studies.40 Sleep duration and quality were significant predictors of increased levels of glycosylated hemoglobin (HbA1c) in patients with Type 2 diabetes mellitus. Thyroid diseases often coexist with diabetes mellitus. Both hypo‐ and hyperthyroidism have been associated with sleep disruption. Hypothyroidism is associated with daytime somnolence and fatigue. Patients with hypothyroidism tend to have reduced SWS. Hyperthyroid patients often complain of insomnia, which has been attributed to a hypermetabolic state.
Approximately 50% of patients with chronic end‐stage renal disease (ESRD) have insomnia and other sleep disorders.41 Patients often complain of restless leg syndrome (RLS), periodic limb movement disorder (PLMD), bone pain, nausea, and pruritus. The etiology of sleep disorders appears to be related to metabolic derangements associated with ESRD or from coexisting diabetes mellitus.
RLS and PLMD are distinct problems that affect sleep differently. RLS is characterized by an unpleasant crampy, creeping or crawling sensation in the lower extremities that is relieved by movement of the legs.42 RLS symptoms typically occur soon after going to bed, and therefore tend to disrupt sleep onset. The requisite bed rest during hospitalization can worsen RLS, further exacerbating sleep problems.43 Since RLS may partially be caused by disrupted iron metabolism, serum ferritin levels should be evaluated.44 Other conditions associated with RLS include pregnancy, rheumatoid arthritis, fibromyalgia, multiple sclerosis, ESRD, and Parkinson's disease. The differential diagnosis for RLS and PLMD includes neuroleptic‐induced akathisia, peripheral neuropathy, and positional or nocturnal leg cramps. PLMD occurs in about 80% of those with RLS, and is characterized by involuntary limb movements that occur every 20 to 40 seconds during NREM sleep. Unaware of these movements, patients often experience frequent arousals throughout the night, and complain of daytime somnolence and fatigue.42
A pilot study of 35 patients with minimal hepatic encephalopathy found that nearly 50% complained of sleep difficulties.45 Hypothesizing that a dysregulation of histaminergic neurotransmission in cirrhosis alters the sleep‐wake cycle, Spahr et al.46 found that 40% of their patients reported subjective improvement in sleep when administered 25 mg of hydroxyzine, compared to none who received placebo.
Neurologic Disorders
Since the brain and its various neurotransmitter systems are critical in regulating sleep and wakefulness, patients with neurologic disorders have an increased risk of developing sleep disorders. Patients with dementia, other neurodegenerative disorders, epilepsy, and traumatic brain injury (TBI) have a higher prevalence of sleep disturbance and sleep disorders.47 Poststroke patients can develop insomnia or hypersomnia, a reduction in sleep latency, increased sleep, or excessive daytime sleepiness, and are at higher risk for OSA during the first several months after a stroke.48 Specific neurologic lesions may lead to uncommon problems such as inversion of the sleep‐wake cycle, parasomnias, and hallucinatory dream‐like states.
Both Parkinson's disease and Alzheimer's disease are associated with multiple sleep disturbances, which tend to worsen with disease progression.14 Common problems include increased sleep fragmentation and wakefulness, with increases of stage 1 sleep and reductions of SWS and REM. Patients with neurodegenerative disorders also have an increased risk of REM sleep behavior disorder, or RBD.49 RBD is characterized by vivid and unusual dreams, and physically vigorous sleep behaviors that may result in ecchymoses, lacerations, and fractures.50 Fifty percent of patients with TBI reported insomnia symptoms.51 Disorders in initiating and maintaining sleep were the most common complaints among hospitalized patients with TBI. Some patients with TBI may develop circadian rhythm disturbances.52
Pain
A majority of patients with chronic pain, 50% to 70%, complain of impaired sleep.53 Sleep disruption is so common in fibromyalgia (75%) that it is considered to be a key diagnostic symptom.54 In a study investigating the affect of pain on sleep in burn patients, pain was associated with increased intermittent awakenings and prolonged periods of wake time during the night.55 The following day, these patients had poorer pain tolerance and greater pain intensity. Pain causes sleep fragmentation by increasing cortical arousals. Recent evidence suggests that sleep deprivation can increase pain sensitivity by inhibiting opioid protein synthesis or reducing opioid receptor affinity.56
Psychiatric Disorders
Sleep problems are so common in psychiatric conditions that the Diagnostic and Statistical Manual of Mental Disorders (DMS‐IV‐TR) includes sleep disturbance as a diagnostic criterion for a manic episode, and for various depressive, anxiety, and substance abuse disorders.57 The presence of sleep disturbance in hospitalized patients may suggest the presence of an underlying psychiatric disorder that would otherwise go unrecognized. In a survey of 200 general medical patients in a Brazilian hospital, Rocha et al.58 found that 112 (56.5%) complained of insomnia, and 100 (50%) met criteria for at least 1 psychiatric disorder. However, only 3 out of the total number of 200 surveyed (1.5%) were identified as having psychiatric diagnoses in the medical record, and sleep history was not noted in the clinical evaluation. An episode of major depressive disorder was the most common psychiatric diagnosis (35%). In this study, hospitalized patients with insomnia had a 3.6 times higher risk of having major depressive disorder than inpatients without insomnia.
Insomnia has a profound effect on mental health by worsening health‐related quality of life. In a study of outpatients at family medicine, internal medicine, endocrinology, cardiology, and psychiatry clinics in 3 U.S. cities (n = 3,445), insomnia worsened health‐related quality of life nearly as much as CHF or major depressive disorder did.59 Another survey of outpatients found that those with chronic insomnia were nearly 40 times more likely to have major depression and 6 times more likely to have an anxiety disorder compared to those without insomnia.60 Longitudinal studies have found that prior insomnia was associated with 2‐ to 5‐fold increase in the odds of mood and anxiety disorders and suicide.61, 62 Examining prodromes and precursors to mental disorders, Eaton et al.63 found that 47% of those with onset of depression at the 1‐year follow‐up had sleep problems at baseline.
An estimated 65% of patients with major depression have difficulty falling asleep, frequent awakenings, or early morning awakenings.64 Three patterns of sleep architecture abnormalities have been observed in patients with major depression: 1) sleep continuity disturbances characterized by prolonged sleep‐onset, increased wake time during sleep, increased early morning wake time, and decreased TST; 2) decreased proportion and length of SWS; and 3) REM sleep abnormalities such as reduced time to REM sleep, prolonged first REM sleep episode, and increased REM sleep percentage.65 Sleep during a manic episode has been less studied than in depression, but the data suggest that abnormal sleep in mania includes disrupted sleep continuity, shortened REM latency, and increased REM density (REM eye movement activity/total REM sleep time).65
Substance use disorders are also associated with sleep problems. In a survey by Brower et al.66 of patients who were undergoing alcohol rehabilitation, 61% (n = 172) had symptoms of insomnia such as increased sleep latency during the 6 months prior to entering treatment. Approximately 45% of these patients reported using alcohol for the purpose of initiating sleep. Alcohol and illicit substance intoxication and withdrawal are known to be associated with disrupted sleep. However, sleep disturbances may persist long after withdrawal symptoms have abated. Drummond et al. found that some patients continued to have alcohol‐associated sleep problems even after 27 months of abstinence.67 Evidence also suggests that untreated insomnia and other sleep problems may increase the risk of developing substance abuse problems due to self‐medicating with alcohol and other substances to help with sleep.68
Drugs that Affect Sleep
Numerous drugs can alter sleep quantity and quality. Sedatives and opioids may initially help with sleep onset, but impair sleep architecture. Medications used to treat medical and psychiatric illnesses also disrupt sleep (Table 3). The most common agents that impair sleep include antiepileptic drugs, selective serotonin reuptake inhibitors, monoamine oxidase inhibitors, tricyclic antidepressants, antihypertensives, antihistamines, and corticosteroids.
| Drug Class | Examples of Drugs | Affect on Sleep Architecture | Potential Mechanism | Clinical Implications |
|---|---|---|---|---|
| ||||
| CNS | ||||
| AEDs | Phenobarbital, carbamazepine, phenytoin | Very sedating. AEDs tend to TST, sleep latency | Inhibit neuronal calcium influx, adenosine, or 5HT activity | Sedation is dose‐dependent, and tends to occur with acute use |
| TCAs | Amoxapine, amitriptyline, imipramine, nortriptyline, desipramine, doxepin, clomipramine | Very sedating. Suppresses REM sleep, TST, stage‐2 sleep | Stimulate antimuscarinic‐receptor and alpha1‐receptor | Suppressed REM sleep motor inhibition restlessness, psychomotor agitation during sleep subjectively sleep quality, daytime sleepiness |
| BzRAs | Alprazolam, lorazepam, chlordiazepoxide, diazepam, oxazepam | Very sedating. TST, sleep latency, SWS duration, REM, stage‐2 sleep | Stimulate GABA type A receptor | Minimize daytime use. Chronic BzRAs SWS long‐term sequelae unknown |
| MAOIs | Phenylzine, tranylcypromine | Very sedating. TST, REM, REM rebound if stop MAOIs | Mechanism unknown | Daytime sleepiness; dosing time does not affect daytime somnolence |
| SSRIs | Sedating: paroxetine, fluvoxamine. Activating: fluoxetine, sertraline, citalopram | TST, are less sedating than TCAs and MAOIs. May REM, TWT, TST, SE | 5HT activity | Some patients get the opposite reaction |
| SNRI | Venlafaxine, duloxetine | Activating in some patients; sedating in 12% to 31%. TST | 5HT and NE activity | If activating, switch to AM dosing. If sedating, switch to PM dosing |
| Mood stabilizer | Lithium | Sedating. TST, SWS, REM, REM latency | daytime sedation. Dose at night | |
| Stimulants | Ephedrine, pseudoephedrine, modafinil | Activating. TST, SWS, sleep latency | DOPA, NE, and 5HT activity | Avoid after 6 PM |
| Anti‐Parkinson | Bromocriptine, levodopa | Sedating. Nightmares, SWS | DOPA | Dose at night, if possible |
| Cardiac | ||||
| Lipophilic beta‐blockers | Propranolol, pindolol, metoprolol, timolol. Hydrophilic agents (atenolol and sotalol) lack these effects | Activating. awakenings, TWT, REM, nightmares | CNS beta‐blockade | Lipophilic beta‐blockers daytime sleep when dosed in AM |
| CNS agents | Norepinephrine, epinephrine | Activating. REM, SWS | Stimulate alpha1‐receptor | Minimize use at night |
| Dopamine | Activating. REM, SWS | Stimulate dopamine2‐receptor and alpha1‐receptor | Minimize use at night | |
| Ca++ channel blockers | Amlodipine, verapamil, nifedipine | Exacerbate underlying medical condition | Lower esophageal sphincter tone nocturnal GER sleep disturbance | |
| Alpha2‐receptor agonist | Clonidine | Stage 1, REM, nightmares | Stimulate alpha2‐receptor | Alpha2‐agonists daytime sleep and sleepiness directly. Dose at night |
| Alpha1‐receptor blockers | Doxazosin, prazosin, terazosin | Inhibit alpha1‐receptor | Alpha1‐receptor blockers daytime sleepiness | |
| Diuretics | HCTZ, furosemide | Sedating. | PM diuresis frequent awakenings | |
| Other | ||||
| Opioids | Codeine, morphine | Sedating. SWS, REM | Stimulate mu‐receptor | Minimize use at night |
| NSAIDs | Ibuprofen, indomethcin, celecoxib | TST, SE | Inhibit prostaglandin synthesis | Minimize use at night |
| Methylxanthine | Theophylline | Activating. stage 1, REM | Causes less restful sleep | |
| Antihistamines | Diphenhydramine, promethazine | Sedating | H1 receptor blockade | Minimize use at night |
| Corticosteroids | Dexamethasone, prednisone | Activating. REM, SWS, nightmares | Melatonin secretion | Can disrupt sleep, anxiety, induce mania or psychosis |
| H2 blockers | Cimetidine, ranitidine, famotidine | Sedating. TST | H2 receptor blockade | Sedating if >60 years old, renal impairment |
| Quinolone | Ciprofloxacin, sparfloxacin, ofloxacin, grepafloxacin, levofloxacin | Activating | Stimulate GABA type A receptor | Consider sleep agent after maximizing sleep hygiene. Linezolid rarely causes sleep disturbances |
Lipophilic beta antagonists such as propranolol and timolol can increase total wake time, decrease REM sleep, and increase the incidence of nightmares and insomnia.69 Anabolic steroids and beta‐agonist bronchodilator therapy can cause severe anxiety, sleeplessness, and even psychosis. Vasopressor agents such as dopamine can cause cortical activation, leading to increased arousal and reduced SWS.
Hospital Environment
Environmental noise and patient care activities often interfere with sleep in the hospital. They account for about 30% of patient awakenings in ICU patients.70 Noise levels in the ICU have average sound peaks of 150 to 200 dB, and evening peaks >80 dB between midnight and 6 AM.71 By comparison, the front row seats at a rock concert have sound levels of 110 dB. The high noise level in hospitals has long been implicated as a sleep disruptor,72 but studies in the past decade have found that patient care activities probably contribute more to awakenings than does environmental noise.73 An analysis of critical care nursing routines found that activities such as taking vital signs and giving baths occurred a mean 42.6 times a night per patient.74 Tamburri et al.74 found that patients experienced 2 to 3 hours without interruption on only 6% of the 147 nights studied. Routine daily baths were provided on 55 of the 147 study nights between 2 AM and 5 AM, which is unlikely to be an opportune time for most patients.
CONCLUSION
Hospitalization often prevents patients from achieving adequate sleep and can affect recovery from illness. Understanding the major factors that impair sleep during hospitalization allows clinicians to systemically evaluate and treat sleep problems. More than just prescribing sedative/hypnotic agents, the treatment for sleep disruption includes addressing multiple medical, behavioral, and environmental factors, which will be discussed in Part 2 of this article.
- NIH State‐of‐the Science Conference Statement on Manifestations and Management of Chronic Insomnia in Adults.NIH Consens Sci Statements.2005;22(2):1–30.
- ,,, et al.Short sleep duration as a risk factor for hypertension: analyses of the first National Health and Nutrition Examination Survey.Hypertension.2006;47(5):833–839.
- ,,, et al.Total sleep deprivation elevates blood pressure through arterial baroreflex resetting: a study with microneurographic technique.Sleep.2003;26(8):986–989.
- ,,,,.Postural control after a night without sleep.Neuropsychologia.2006;44(12):2520–2525.
- .Sleep deprivation decreases ventilatory responses to CO2 but not load compensation.Chest.1983;84(6):695–698.
- ,,, et al.Increased sympathetic and decreased parasympathetic cardiovascular modulation in normal humans with acute sleep deprivation.J Appl Physiol.2005;98(6):2024–2032.
- .Reductions in circulating anabolic hormones induced by sustained sleep deprivation in rats.Am J Physiol Endocrinol Metab.2004;286(6):E1060–E1070.
- ,,,.The metabolic consequences of sleep deprivation.Sleep Med Rev.2007;11(3):163–178.
- ,,,,.Sleep deprivation and activation of morning levels of cellular and genomic markers of inflammation.Arch Int Med.2006;166:1756–1752.
- ,,,.Effects of sleep and sleep deprivation on immunoglobulins and complement in humans.Brain Behav Immun.2007;21:308–310.
- ,,,,.The effects of sleep deprivation on symptoms of psychopathology in healthy adults.Sleep Med.2007;8:215–221.
- ,.Normal human sleep. In:Kryger MH,Roth T,Dement WC, editors.Principles and Practice of Sleep Medicine.3rd ed.Philadelphia:W.B. Saunders;2000:15–16.
- .Update on the Science, Diagnosis and Management of Insomnia.International Congress and Symposium Series 262.London:Royal Society of Medicine Press Ltd;2006.
- ,,,,,.The effects of age, sex, ethnicity, and sleep‐disordered breathing on sleep architecture.Arch Intern Med.2004;164:406–18.
- ,.Sleep disruption in older adults.Am J Nurs.2007;107(5):40–49.
- ,,,.Sleep disturbances and chronic disease in older adults: results of the 2003 National Sleep Foundation Sleep in America Survey.J Psychosom Res.2004;56(5):497–502.
- .Sleep in patients with neurologic and psychiatric disorders.Prim Care.2005;32:535–548.
- ,,.Insomnia and its treatment: prevalence and correlates.Arch Gen Psychiatry.1985;42(3):225–232.
- ,.Epidemiologic study of sleep disturbances and psychiatric disorders: an opportunity for prevention?JAMA.1989;262:1479–1484.
- ,,,,,.Sleep in critically ill patients requiring mechanical ventilation.Chest.2000;117:809–818.
- ,.Sedative and analgesic medications: risk factors for delirium and sleep disturbances in the critically ill.Crit Care Med.2006;22:313–327.
- ,,,,.Quantity and quality of sleep in the surgical intensive care unit: are our patients sleeping?J Trauma.2007;63:1210–1214.
- .Sleep in acute care units.Sleep Breath.2006;10:6–15.
- ,,,,,.An assessment of quality of sleep and the use of drugs with sedating properties in hospitalized adult patients.Health Qual Life Outcomes.2004;2:17.
- ,,,,,.Failure of physician documentation of sleep complaints in hospitalized patients.West J Med.1998;169:146–149.
- .Sleep and medical disorders.Prim Care.2005;35:511–533.
- ,,,,,.The occurrence of sleep‐disordered breathing among middle‐aged adults.N Engl J Med.1993;328:1230–1235.
- ,.Clinical features and evaluation of obstructive sleep apnea‐hypopnea syndrome. In:Kryger MH,Roth T,Dement WC, editors.Principles and Practice of Sleep Medicine.3rd ed.Philadelphia:W.B. Saunders;2000:869–872.
- ,,.Marked improvement in nocturnal gastroesophageal reflux in a large cohort of patients with obstructive sleep apnea.Arch Intern Med.2003;163:41–45.
- ,.Sleep and medical disorders.Med Clin North Am.2004;88:679–703.
- ,,,.Relation of sleep‐disordered breathing to carotid plaque and intima‐media thickness.Atherosclerosis.2008;197(1):125– 131.
- ,,, et al.Sleep‐disordered breathing and cardiovascular disease: cross‐sectional results of the Sleep Heart Health Study.Am J Respir Crit Care Med.2001;163:19–25.
- .Gastroesophageal reflux during sleep.Sleep Med Clin.2007;2:41–50.
- ,.Sleep apnea in renal failure.Adv Perit Dial.1997;13:88–92.
- .Sleep in chronic obstructive pulmonary disease.Sleep Med Clin.2007;2:1–8.
- ,,,.Effects of non‐invasive positive pressure ventilation on gas exchange and sleep in COPD patients.Chest.1997;112:623–628.
- ,,, et al.Night‐to‐night variability in CPAP use over the first three months of treatment.Sleep.1997;20(4):278–283.
- ,.Improving CPAP use by patients with the sleep apnoea/hypopnoea syndrome (SAHS).Sleep Med Rev.2003;7(1):81–99.
- ,,.Factors predicting sleep disruption in type II diabetes.Sleep.2000;23:415–416.
- ,,.Sleep duration as a risk factor for the development of type 2 diabetes.Diabetes Care.2006;29:657–661.
- .Sleep disorders and end‐stage renal disease.Sleep Med Clin.2007;2:59–66.
- ,,,.Sleep and aging: 1. Sleep disorders commonly found in older people.CMAJ.2007;176(9):1299–1304.
- ,,,,,.Impact, diagnosis and treatment of restless legs syndrome (RLS) in a primary care population: The REST (RLS Epidemiology, Symptoms, and Treatment) primary care study.Sleep Med.2004;5(3):237–246.
- ,.Epidemiology and clinical findings of restless leg syndrome.Sleep Med.2004;5(3):293–299.
- ,,,,,.High prevalence of sleep disturbance in cirrhosis.Hepatology.1998;27:339–345.
- ,,,,.Histamine H1 blocker hydroxyzine improves sleep in patients with cirrhosis and minimal hepatic encephalopathy: a randomized controlled pilot trial.Am J Gastroenterol.2007;102:744–753.
- .Sleep in patients with neurologic and psychiatric disorders.Prim Care.2005;32:535–548.
- ,,.Obstructive sleep apnea: implications for cardiac and vascular disease.JAMA.2003;290(14):1906–1914.
- ,,, et al.Pathophysiology of REM sleep behaviour disorder and relevance to neurodegenerative disease.Brain.2007;130(Pt 11):2770–2788.
- ,.REM sleep parasomnias. In:Kryger MH,Roth T,Dement WC, editors.Principles and Practice of Sleep Medicine.3rd ed.Philadelphia:W.B. Saunders;2000:724–725.
- ,,.Insomnia in patients with traumatic brain injury.J Head Trauma Rehabil.2006;21(3):199–212.
- ,,,,.Circadian rhythm sleep disorders following mild traumatic brain injury.Neurology.2007;68(14):1136–1140.
- ,.Comorbidities: psychiatric, medical, medications, and substances.Sleep Med Clin.2006;231–245.
- ,,.Sleep disturbance and fibromyalgia.Sleep Med Clin.2007;2:31–39.
- ,,.Sleep disturbances, pain and analgesia in adults hospitalized for burn injuries.Sleep Med.2004;5:551–559.
- ,,.Sleep deprivation and pain perception.Sleep Med Rev.2006;10:357–369.
- American Psychiatric Association.Diagnostic and Statistical Manual of Mental Disorders.4th ed. Text Revision.Washington, DC:American Psychiatric Association;2000.
- ,,, et al.Is insomnia a marker for psychiatric disorders in general hospitals?Sleep Med.2005;6:549–553.
- ,.The relationship between insomnia and health‐related quality of life in patients with chronic illness.J Fam Pract.2002;51(3):229–235.
- ,.Epidemiologic study of sleep disturbances and psychiatric disorders: an opportunity for prevention?JAMA.1989;262:1479–1484.
- ,,,.Sleep disturbance and psychiatric disorders: a longitudinal epidemiological study of young adults.Biol Psychiatry.1996;39:411–418.
- ,,,.The morbidity of insomnia uncomplicated by psychiatric disorders.Gen Hosp Psychiatry.1997;19:245–250.
- ,,.Prodromes and precursors: epidemiologic data for primary prevention of disorders with slow onset.Am J Psychiatry.1995;152:967–972.
- ,,,,,.Which depressive symptoms are related to which sleep electroencephalographic variables?Biol Psychol.1997;42:904–913.
- ,.Sleep in mood disorders.Psychiatr Clin North Am.2006;29:1009–1032.
- ,,,,.Insomnia, self‐medication, and relapse to alcoholism.Am J Psychiatry.2001;158:399–404.
- ,,,.The sleep of abstinent pure primary alcoholic patients: natural course and relationship to relapse.Alcohol Clin Exp Res.1998;22:1796–1802.
- ,,,,.Screening for substance use patterns among patients referred for a variety of sleep complaints.Am J Drug Alcohol Abuse.2006;32:111–120.
- .Drugs that disturb sleep and wakefulness. In:Kryger MH,Roth T,Dement WC, editors.Principles and Practice of Sleep Medicine.3rd ed.Philadelphia:W.B. Saunders;2000:441–462.
- ,,, et al.Contribution of the intensive care unit environment to sleep disruption in mechanically ventilated patients and healthy subjects.Am J Respir Crit Care Med.2003;167(5):708–715.
- ,,.Adverse environmental conditions in the respiratory and medical ICU settings.Chest.1994;105:1211–1216.
- ,,,,,.Noise levels in Johns Hopkins Hospital.J Acoust Soc Am.2005;118(6):3629–3645.
- ,,.Patient perception of sleep quality and etiology of sleep disruption in the intensive care unit.Am J Respir Crit Care Med.1999;159:1155–1162.
- ,,,.Nocturnal care interactions with patients in critical care units.Am J Crit Care.2004;13(2):102–115.
Hospitalized patients often have difficulty initiating and maintaining sleep, or complain of early awakening and nonrestorative sleep.1 The etiology of sleep disruption is multifactorial and includes the patient's underlying illness(es), medical treatments, and the hospital environment. Often unrecognized and untreated during hospitalization, sleep disruption may lead to sleep deprivation, or a chronic lack of restorative sleep.
Even in healthy individuals, sleep deprivation can result in numerous physical and psychological consequences. Sleep deprivation is associated with hypertension,2, 3 impaired postural control,4 decreased ventilatory drive,5 increased sympathetic cardiovascular activation,6 blunted hypothalamic‐pituitary‐adrenal axis,7 impaired host defenses, and possibly diabetes mellitus and obesity.810 The lack of restorative sleep increases the risk of developing anxiety and mood disorders and delirium, especially in acutely ill older patients.11 In the presence of acute physical infirmity, inadequate sleep may further compound illness and impair recovery. We provide an overview of normal sleep architecture and discuss factors that lead to sleep disruption in hospitalized medical patients.
NORMAL SLEEP ARCHITECTURE AND REGULATION
Normal sleep architecture refers to a characteristic pattern of sleep, and consists of two major stages: nonrapid eye movement (NREM, pronounced non‐rem) and rapid eye movement (REM). (For a table of pertinent abbreviations and terms, see Table 1) Sleep is quantified by polysomnography (PSG), which includes an electroencephalogram (EEG), electromyogram (EMG), and electrooculogram (EOG). A PSG also includes an electrocardiogram (ECG), and measures of airflow, oxygen saturation, and body position. NREM sleep comprises 75% to 80% of total sleep time (TST), and is characterized by relatively quiescent brain activity and decreased metabolic rate.12 NREM sleep consists of four stages (S1‐S4), with each stage leading to a progressively deeper sleep (Figure 1). REM sleep follows slow wave sleep (SWS), or deep sleep, and increases over the night, comprising 20% to 25% of TST. REM sleep is characterized by an activated EEG pattern, muscle atonia, and episodic bursts of rapid eye movements.
| Acronym | Term |
|---|---|
| BiPAP | Bilevel positive airway pressure |
| CHF | Congestive heart failure |
| CPAP | Continuous positive airway pressure |
| COPD | Chronic obstructive pulmonary disease |
| EEG | Electroencephalogram |
| EOG | Electroculogram |
| EMG | Electromyogram |
| ESRD | End‐stage renal disease |
| NPPV | Noninvasive positive pressure ventilation |
| NREM | Nonrapid eye movement |
| OSA | Obstructive sleep apnea |
| PLMD | Periodic limb movement disorder |
| PSG | Polysomnography |
| RBD | REM sleep behavior disorder |
| REM | Rapid eye movement |
| RLS | Restless leg syndrome |
| S1‐S4 | 4 Stages of sleep in NREM |
| SE | Sleep efficiency; TST divided by total time in bed |
| SWS | Slow wave sleep |
| TBI | Traumatic brain injury |
| TST | Total sleep time |
Normal sleep provides a period of physiologic and mental rest. During sleep, sympathetic tone decreases and parasympathetic tone increases, leading to a reduction in heart rate, arterial blood pressure, and cardiac output.13 Deep sleep is theorized to be necessary for physiologic restoration. REM sleep is associated with dreaming, and is essential for maintaining emotional and cognitive well‐being. Sleep architecture undergoes characteristic changes as people age.14 The duration of SWS peaks in childhood and decreases with age. Consequently, people >60 years old tend to have lower arousal thresholds and to have more frequent awakenings. The results of the Sleep Heart Health Study found that increased age was associated with decreased percentage of REM sleep, worse sleep efficiency (SE, which is TST divided by total time in bed), and lower arousal thresholds.14 With the reduction of SE, older people need to spend more hours in bed to achieve the same amount of restorative sleep as when they were younger. Although sleep tends to become more disrupted as people age, insomnia should not be considered a normal part of aging, and needs to be addressed clinically.15 The results of a National Sleep Foundation telephone survey of subjects between the ages of 55 and 84 years old (n = 1,506) suggested that sleep complaints in older adults are frequently secondary to comorbid medical conditions.16
Multiple anatomic structures, pathways, and neurotransmitter systems are involved in controlling wakefulness and sleep. Neurotransmitters that promote wakefulness include acetylcholine, histamine, noradrenaline (norepinephrine), serotonin, dopamine, and hypocretin (orexin). Sleep‐promoting neurotransmitters include gamma aminobutyric acid (GABA), adenosine, and melatonin. Specific stages of sleep are regulated by the turning on and off of various neurons. REM on cells use GABA, acetylcholine, and glutamine, whereas REM off cells use norepinephrine and serotonin. SWS is promoted by GABA and serotonin.17
Sleep regulation is a balance between a homeostatic sleep need and an intrinsic body clock, or circadian pacemaker. Located in the suprachiasmic nucleus, the circadian pacemaker determines the onset and termination of sleep, and is partially regulated by environmental cues such as light and ambient temperature. Melatonin, a physiologic sleep promoter, is inhibited by ambient light, and its circulation is decreased during daylight hours. The adrenal secretion of cortisol, which is associated with wakefulness, follows a circadian pattern. Regulated by the hypothalamic‐pituitary axis, cortisol levels peak in the early morning hours in preparation for the increased metabolic demands during wakefulness.
SLEEP PROBLEMS IN HOSPITALIZED PATIENTS
Insomnia, which is characterized by difficulty initiating or maintaining sleep, is the most common sleep disorder in the United States. About one‐third of the adult population in the United States experiences insomnia at some point in their lives,18 and it is a persistent problem in approximately 10% of U.S. adults.19 Insomnia can be exacerbated during hospitalization.
Studies investigating sleep in hospitalized patients using PSG have been limited primarily to the setting of the intensive care unit (ICU). Critically ill patients, particularly those requiring mechanical ventilation, are prone to sleep disturbances and an associated delirium.2022 Critically ill patients have fragmented sleep, with decreased SE and SWS, and increased S1 and S2.23 Physician awareness of the impact of sleep disturbance in hospitalized patients is vital. Surveys reveal that approximately one‐half of patients admitted on general medical wards complain of sleep disruption.24, 25 Meissner et al.25 examined the prevalence of sleep complaints and physician recognition of these complaints among general medical patients admitted to a Veterans Affairs tertiary care center. Results showed that 47% (n = 222) of patients had complaints of either insomnia and/or excessive daytime sleepiness.
FACTORS AFFECTING SLEEP DURING HOSPITALIZATION
Many medical and neurologic illnesses, psychiatric disorders, pain, medication therapy and the hospital environment may impair sleep, and hinder recovery from illness.
General Medical Disorders
Primary sleep disorders, such as obstructive sleep apnea (OSA) and numerous other medical illnesses, can directly impair sleep physiology, leading to a cyclical interaction (Figure 2). Other conditions that disrupt sleep include congestive heart failure (CHF), diabetes mellitus, chronic obstructive pulmonary disease (COPD), gastroesophageal reflux, cardiovascular disease, thyroid disorders, renal disease, and severe liver disease.26 Table 2 lists selected medical and neurological conditions, their associated sleep‐related problems, and suggestions on how to ameliorate these problems.
| Disease | Problem | Clinical Implications and Strategies to Improve Sleep |
|---|---|---|
| ||
| Asthma | Nocturnal exacerbation, nocturnal GER | Inhaled corticosteroids and/or long‐acting inhaled beta‐adrenergic agents |
| CHF | Orthopnea, paroxysmal nocturnal dyspnea, sleep‐disordered breathing, increased sympathetic tone, nighttime diuresis, Cheyne‐Stokes respiration | Keep the head of bed elevated 30 degrees. Nocturnal O2 to keep O2 saturation >88%. Daytime diuresis. Optimize cardiac function to treat Cheyne‐Stokes respiration. Consider CPAP for CHF |
| COPD | Persistent nocturnal hypoxemia with complications (e.g., cor pulmonale, polycythemia) | O2 for COPD and persistent hypoxemia (PaO2 55‐60 mm Hg) |
| Sporadic nighttime desaturations | PaO2 55 mm Hg monitor O2 saturation by pulse oximetry. If patient desaturates to 88% at night consistently, start nocturnal O2. For hypercapnia, adjust O2 to maintain O2 saturation at 88% to 90% | |
| Early‐morning airflow obstruction | Consider bedtime tiotropium and inhaled long‐acting beta‐adrenergic agonist agents | |
| Inhibition of respiratory muscles in REM | Avoid sedative‐hypnotics that cause respiratory depression | |
| Decreased functional residual capacity from recumbent position during sleep | Minimize recumbancy by keeping the head of bed up at 30 degrees | |
| End‐stage renal disease | Pruritus, nausea; increased risk of RLS and PLMD | Ambulation may help with RLS. Consider ropinirole and pramipexole. Correct hyperphosphatemia and uremia. Consider antipruritic and antiemetic agents |
| Nocturnal GER | Nocturnal GER decreased sleep, heartburn, coughing, asthma | Avoid eating or drinking 2 hours before bedtime, especially those that delay gastric emptying, increase acid secretion, or decrease lower esophageal sphincter pressure; e.g., high‐fat foods, ethanol, chocolate, peppers, peppermint. Keep head of bed 30 degrees. Minimize medications that could worsen nocturnal GER; e.g., theophylline, calcium channel blockers, prostaglandins, bisphosphonates |
| OSA | Snoring with upper airway obstruction | No ethanol 2 hours before bedtime. Minimize CNS depressants. Avoid supine position. Consider CPAP, oral mandibular advancement device, and/or surgical correction. Long‐term plan should include weight loss |
| Stroke | Focal neurologic deficits (e.g., dysphagia, weakness or paralysis) | Keep head of bed 30 degrees. Regularly suction secretions. Post‐stroke patients have an increased risk of hypersomnia, insomnia, and/or OSA |
Affecting approximately 24% of men and 9% of women in the United States, OSA is the most common primary sleep disorder,27, 28 and causes significant mental and physical morbidity. Risk factors for OSA include obesity, hypothyroidism‐induced muscle weakness, and structural abnormalities in the oropharynx region such as acromegaly, micrognathia, or retrognathia. OSA is characterized by episodes of complete or partial pharyngeal obstruction during sleep that cause snoring, apneic episodes, choking, dyspnea, and restlessness.28 These episodes are associated with intermittent nocturnal sympathetic activation leading to nocturnal awakenings and cortical arousals, all of which lead to daytime symptoms of fatigue, sleepiness, and cognitive impairment (Figure 2). In addition, chronic sympathetic activation causes numerous derangements in the vascular endothelium and platelet activation.29, 30 Sleep‐disordered breathing has been independently associated with cardiovascular diseases such as hypertension, CHF, ischemic heart disease, atrial fibrillation, and cerebrovascular disease.31, 32
OSA is also associated with sleep‐related gastroesophageal reflux, which is characterized by pain and nocturnal cough, and can induce nocturnal asthma attacks and laryngospasm.33 Green et al.29 found that OSA patients treated with continuous positive airway pressure (CPAP) had a 48% improvement in nocturnal reflux symptoms. Although the pathophysiology connecting OSA to the renal system is unknown, OSA has been found in up to 60% of patients with end‐stage renal disease and chronic renal failure.34
Patients with pulmonary disorders can be profoundly affected by the normal physiologic changes during sleep, particularly in REM sleep. During REM sleep, all respiratory muscles except the diaphragm become paralyzed. Thus, episodes of marked oxygen desaturation can occur in patients who rely on their accessory muscles for respiration. COPD patients have decreased TST, SWS, and REM sleep. Shortness of breath, nocturnal cough, and wheezing worsen sleep.35 The resulting fatigue and sleep deprivation negatively impact the work of breathing and impair gas exchange. Airflow obstruction tends to worsen in the early morning hours in patients with COPD and asthma, and may be related to the effect of REM on the accessory muscles for respiration. Although used to target CO2 retention, investigations using bilevel positive airway pressure ventilators (BiPAP) for improving sleep in COPD patients have been limited. Noninvasive positive pressure ventilation (NPPV) appears to acutely improve SE and TST in patients with hypercapnic COPD without significantly improving gas exchange. Other sleep parameters such as sleep architecture and the number of arousals during the night, remain unchanged during NPPV.36
CPAP has several side effects that could worsen sleep, which may explain its poor adherence rate among ambulatory patients.37 Side effects include nasal bridge discomfort, nasal congestion, swallowing air, dry nose, dry or red eyes, noise, ear pain, and rhinitis.38 During hospitalization, efforts should be made to improve patient comfort by resizing ill‐fitting masks, adding heated humidification or nasal steroids to alleviate nasal congestion, or adding a chin strap to reduce air leak and ingestion of air.
Endocrine disorders have also been associated with sleep disruption. Studies suggest that patients with diabetes mellitus have decreased TST and impaired sleep quality due to nocturia and neuropathic pain.39 Inadequate sleep may also affect glucose control. Inadequate quality or quantity of sleep has been shown to be a risk factor for developing Type 2 diabetes mellitus in large prospective studies.40 Sleep duration and quality were significant predictors of increased levels of glycosylated hemoglobin (HbA1c) in patients with Type 2 diabetes mellitus. Thyroid diseases often coexist with diabetes mellitus. Both hypo‐ and hyperthyroidism have been associated with sleep disruption. Hypothyroidism is associated with daytime somnolence and fatigue. Patients with hypothyroidism tend to have reduced SWS. Hyperthyroid patients often complain of insomnia, which has been attributed to a hypermetabolic state.
Approximately 50% of patients with chronic end‐stage renal disease (ESRD) have insomnia and other sleep disorders.41 Patients often complain of restless leg syndrome (RLS), periodic limb movement disorder (PLMD), bone pain, nausea, and pruritus. The etiology of sleep disorders appears to be related to metabolic derangements associated with ESRD or from coexisting diabetes mellitus.
RLS and PLMD are distinct problems that affect sleep differently. RLS is characterized by an unpleasant crampy, creeping or crawling sensation in the lower extremities that is relieved by movement of the legs.42 RLS symptoms typically occur soon after going to bed, and therefore tend to disrupt sleep onset. The requisite bed rest during hospitalization can worsen RLS, further exacerbating sleep problems.43 Since RLS may partially be caused by disrupted iron metabolism, serum ferritin levels should be evaluated.44 Other conditions associated with RLS include pregnancy, rheumatoid arthritis, fibromyalgia, multiple sclerosis, ESRD, and Parkinson's disease. The differential diagnosis for RLS and PLMD includes neuroleptic‐induced akathisia, peripheral neuropathy, and positional or nocturnal leg cramps. PLMD occurs in about 80% of those with RLS, and is characterized by involuntary limb movements that occur every 20 to 40 seconds during NREM sleep. Unaware of these movements, patients often experience frequent arousals throughout the night, and complain of daytime somnolence and fatigue.42
A pilot study of 35 patients with minimal hepatic encephalopathy found that nearly 50% complained of sleep difficulties.45 Hypothesizing that a dysregulation of histaminergic neurotransmission in cirrhosis alters the sleep‐wake cycle, Spahr et al.46 found that 40% of their patients reported subjective improvement in sleep when administered 25 mg of hydroxyzine, compared to none who received placebo.
Neurologic Disorders
Since the brain and its various neurotransmitter systems are critical in regulating sleep and wakefulness, patients with neurologic disorders have an increased risk of developing sleep disorders. Patients with dementia, other neurodegenerative disorders, epilepsy, and traumatic brain injury (TBI) have a higher prevalence of sleep disturbance and sleep disorders.47 Poststroke patients can develop insomnia or hypersomnia, a reduction in sleep latency, increased sleep, or excessive daytime sleepiness, and are at higher risk for OSA during the first several months after a stroke.48 Specific neurologic lesions may lead to uncommon problems such as inversion of the sleep‐wake cycle, parasomnias, and hallucinatory dream‐like states.
Both Parkinson's disease and Alzheimer's disease are associated with multiple sleep disturbances, which tend to worsen with disease progression.14 Common problems include increased sleep fragmentation and wakefulness, with increases of stage 1 sleep and reductions of SWS and REM. Patients with neurodegenerative disorders also have an increased risk of REM sleep behavior disorder, or RBD.49 RBD is characterized by vivid and unusual dreams, and physically vigorous sleep behaviors that may result in ecchymoses, lacerations, and fractures.50 Fifty percent of patients with TBI reported insomnia symptoms.51 Disorders in initiating and maintaining sleep were the most common complaints among hospitalized patients with TBI. Some patients with TBI may develop circadian rhythm disturbances.52
Pain
A majority of patients with chronic pain, 50% to 70%, complain of impaired sleep.53 Sleep disruption is so common in fibromyalgia (75%) that it is considered to be a key diagnostic symptom.54 In a study investigating the affect of pain on sleep in burn patients, pain was associated with increased intermittent awakenings and prolonged periods of wake time during the night.55 The following day, these patients had poorer pain tolerance and greater pain intensity. Pain causes sleep fragmentation by increasing cortical arousals. Recent evidence suggests that sleep deprivation can increase pain sensitivity by inhibiting opioid protein synthesis or reducing opioid receptor affinity.56
Psychiatric Disorders
Sleep problems are so common in psychiatric conditions that the Diagnostic and Statistical Manual of Mental Disorders (DMS‐IV‐TR) includes sleep disturbance as a diagnostic criterion for a manic episode, and for various depressive, anxiety, and substance abuse disorders.57 The presence of sleep disturbance in hospitalized patients may suggest the presence of an underlying psychiatric disorder that would otherwise go unrecognized. In a survey of 200 general medical patients in a Brazilian hospital, Rocha et al.58 found that 112 (56.5%) complained of insomnia, and 100 (50%) met criteria for at least 1 psychiatric disorder. However, only 3 out of the total number of 200 surveyed (1.5%) were identified as having psychiatric diagnoses in the medical record, and sleep history was not noted in the clinical evaluation. An episode of major depressive disorder was the most common psychiatric diagnosis (35%). In this study, hospitalized patients with insomnia had a 3.6 times higher risk of having major depressive disorder than inpatients without insomnia.
Insomnia has a profound effect on mental health by worsening health‐related quality of life. In a study of outpatients at family medicine, internal medicine, endocrinology, cardiology, and psychiatry clinics in 3 U.S. cities (n = 3,445), insomnia worsened health‐related quality of life nearly as much as CHF or major depressive disorder did.59 Another survey of outpatients found that those with chronic insomnia were nearly 40 times more likely to have major depression and 6 times more likely to have an anxiety disorder compared to those without insomnia.60 Longitudinal studies have found that prior insomnia was associated with 2‐ to 5‐fold increase in the odds of mood and anxiety disorders and suicide.61, 62 Examining prodromes and precursors to mental disorders, Eaton et al.63 found that 47% of those with onset of depression at the 1‐year follow‐up had sleep problems at baseline.
An estimated 65% of patients with major depression have difficulty falling asleep, frequent awakenings, or early morning awakenings.64 Three patterns of sleep architecture abnormalities have been observed in patients with major depression: 1) sleep continuity disturbances characterized by prolonged sleep‐onset, increased wake time during sleep, increased early morning wake time, and decreased TST; 2) decreased proportion and length of SWS; and 3) REM sleep abnormalities such as reduced time to REM sleep, prolonged first REM sleep episode, and increased REM sleep percentage.65 Sleep during a manic episode has been less studied than in depression, but the data suggest that abnormal sleep in mania includes disrupted sleep continuity, shortened REM latency, and increased REM density (REM eye movement activity/total REM sleep time).65
Substance use disorders are also associated with sleep problems. In a survey by Brower et al.66 of patients who were undergoing alcohol rehabilitation, 61% (n = 172) had symptoms of insomnia such as increased sleep latency during the 6 months prior to entering treatment. Approximately 45% of these patients reported using alcohol for the purpose of initiating sleep. Alcohol and illicit substance intoxication and withdrawal are known to be associated with disrupted sleep. However, sleep disturbances may persist long after withdrawal symptoms have abated. Drummond et al. found that some patients continued to have alcohol‐associated sleep problems even after 27 months of abstinence.67 Evidence also suggests that untreated insomnia and other sleep problems may increase the risk of developing substance abuse problems due to self‐medicating with alcohol and other substances to help with sleep.68
Drugs that Affect Sleep
Numerous drugs can alter sleep quantity and quality. Sedatives and opioids may initially help with sleep onset, but impair sleep architecture. Medications used to treat medical and psychiatric illnesses also disrupt sleep (Table 3). The most common agents that impair sleep include antiepileptic drugs, selective serotonin reuptake inhibitors, monoamine oxidase inhibitors, tricyclic antidepressants, antihypertensives, antihistamines, and corticosteroids.
| Drug Class | Examples of Drugs | Affect on Sleep Architecture | Potential Mechanism | Clinical Implications |
|---|---|---|---|---|
| ||||
| CNS | ||||
| AEDs | Phenobarbital, carbamazepine, phenytoin | Very sedating. AEDs tend to TST, sleep latency | Inhibit neuronal calcium influx, adenosine, or 5HT activity | Sedation is dose‐dependent, and tends to occur with acute use |
| TCAs | Amoxapine, amitriptyline, imipramine, nortriptyline, desipramine, doxepin, clomipramine | Very sedating. Suppresses REM sleep, TST, stage‐2 sleep | Stimulate antimuscarinic‐receptor and alpha1‐receptor | Suppressed REM sleep motor inhibition restlessness, psychomotor agitation during sleep subjectively sleep quality, daytime sleepiness |
| BzRAs | Alprazolam, lorazepam, chlordiazepoxide, diazepam, oxazepam | Very sedating. TST, sleep latency, SWS duration, REM, stage‐2 sleep | Stimulate GABA type A receptor | Minimize daytime use. Chronic BzRAs SWS long‐term sequelae unknown |
| MAOIs | Phenylzine, tranylcypromine | Very sedating. TST, REM, REM rebound if stop MAOIs | Mechanism unknown | Daytime sleepiness; dosing time does not affect daytime somnolence |
| SSRIs | Sedating: paroxetine, fluvoxamine. Activating: fluoxetine, sertraline, citalopram | TST, are less sedating than TCAs and MAOIs. May REM, TWT, TST, SE | 5HT activity | Some patients get the opposite reaction |
| SNRI | Venlafaxine, duloxetine | Activating in some patients; sedating in 12% to 31%. TST | 5HT and NE activity | If activating, switch to AM dosing. If sedating, switch to PM dosing |
| Mood stabilizer | Lithium | Sedating. TST, SWS, REM, REM latency | daytime sedation. Dose at night | |
| Stimulants | Ephedrine, pseudoephedrine, modafinil | Activating. TST, SWS, sleep latency | DOPA, NE, and 5HT activity | Avoid after 6 PM |
| Anti‐Parkinson | Bromocriptine, levodopa | Sedating. Nightmares, SWS | DOPA | Dose at night, if possible |
| Cardiac | ||||
| Lipophilic beta‐blockers | Propranolol, pindolol, metoprolol, timolol. Hydrophilic agents (atenolol and sotalol) lack these effects | Activating. awakenings, TWT, REM, nightmares | CNS beta‐blockade | Lipophilic beta‐blockers daytime sleep when dosed in AM |
| CNS agents | Norepinephrine, epinephrine | Activating. REM, SWS | Stimulate alpha1‐receptor | Minimize use at night |
| Dopamine | Activating. REM, SWS | Stimulate dopamine2‐receptor and alpha1‐receptor | Minimize use at night | |
| Ca++ channel blockers | Amlodipine, verapamil, nifedipine | Exacerbate underlying medical condition | Lower esophageal sphincter tone nocturnal GER sleep disturbance | |
| Alpha2‐receptor agonist | Clonidine | Stage 1, REM, nightmares | Stimulate alpha2‐receptor | Alpha2‐agonists daytime sleep and sleepiness directly. Dose at night |
| Alpha1‐receptor blockers | Doxazosin, prazosin, terazosin | Inhibit alpha1‐receptor | Alpha1‐receptor blockers daytime sleepiness | |
| Diuretics | HCTZ, furosemide | Sedating. | PM diuresis frequent awakenings | |
| Other | ||||
| Opioids | Codeine, morphine | Sedating. SWS, REM | Stimulate mu‐receptor | Minimize use at night |
| NSAIDs | Ibuprofen, indomethcin, celecoxib | TST, SE | Inhibit prostaglandin synthesis | Minimize use at night |
| Methylxanthine | Theophylline | Activating. stage 1, REM | Causes less restful sleep | |
| Antihistamines | Diphenhydramine, promethazine | Sedating | H1 receptor blockade | Minimize use at night |
| Corticosteroids | Dexamethasone, prednisone | Activating. REM, SWS, nightmares | Melatonin secretion | Can disrupt sleep, anxiety, induce mania or psychosis |
| H2 blockers | Cimetidine, ranitidine, famotidine | Sedating. TST | H2 receptor blockade | Sedating if >60 years old, renal impairment |
| Quinolone | Ciprofloxacin, sparfloxacin, ofloxacin, grepafloxacin, levofloxacin | Activating | Stimulate GABA type A receptor | Consider sleep agent after maximizing sleep hygiene. Linezolid rarely causes sleep disturbances |
Lipophilic beta antagonists such as propranolol and timolol can increase total wake time, decrease REM sleep, and increase the incidence of nightmares and insomnia.69 Anabolic steroids and beta‐agonist bronchodilator therapy can cause severe anxiety, sleeplessness, and even psychosis. Vasopressor agents such as dopamine can cause cortical activation, leading to increased arousal and reduced SWS.
Hospital Environment
Environmental noise and patient care activities often interfere with sleep in the hospital. They account for about 30% of patient awakenings in ICU patients.70 Noise levels in the ICU have average sound peaks of 150 to 200 dB, and evening peaks >80 dB between midnight and 6 AM.71 By comparison, the front row seats at a rock concert have sound levels of 110 dB. The high noise level in hospitals has long been implicated as a sleep disruptor,72 but studies in the past decade have found that patient care activities probably contribute more to awakenings than does environmental noise.73 An analysis of critical care nursing routines found that activities such as taking vital signs and giving baths occurred a mean 42.6 times a night per patient.74 Tamburri et al.74 found that patients experienced 2 to 3 hours without interruption on only 6% of the 147 nights studied. Routine daily baths were provided on 55 of the 147 study nights between 2 AM and 5 AM, which is unlikely to be an opportune time for most patients.
CONCLUSION
Hospitalization often prevents patients from achieving adequate sleep and can affect recovery from illness. Understanding the major factors that impair sleep during hospitalization allows clinicians to systemically evaluate and treat sleep problems. More than just prescribing sedative/hypnotic agents, the treatment for sleep disruption includes addressing multiple medical, behavioral, and environmental factors, which will be discussed in Part 2 of this article.
- NIH State‐of‐the Science Conference Statement on Manifestations and Management of Chronic Insomnia in Adults.NIH Consens Sci Statements.2005;22(2):1–30.
- ,,, et al.Short sleep duration as a risk factor for hypertension: analyses of the first National Health and Nutrition Examination Survey.Hypertension.2006;47(5):833–839.
- ,,, et al.Total sleep deprivation elevates blood pressure through arterial baroreflex resetting: a study with microneurographic technique.Sleep.2003;26(8):986–989.
- ,,,,.Postural control after a night without sleep.Neuropsychologia.2006;44(12):2520–2525.
- .Sleep deprivation decreases ventilatory responses to CO2 but not load compensation.Chest.1983;84(6):695–698.
- ,,, et al.Increased sympathetic and decreased parasympathetic cardiovascular modulation in normal humans with acute sleep deprivation.J Appl Physiol.2005;98(6):2024–2032.
- .Reductions in circulating anabolic hormones induced by sustained sleep deprivation in rats.Am J Physiol Endocrinol Metab.2004;286(6):E1060–E1070.
- ,,,.The metabolic consequences of sleep deprivation.Sleep Med Rev.2007;11(3):163–178.
- ,,,,.Sleep deprivation and activation of morning levels of cellular and genomic markers of inflammation.Arch Int Med.2006;166:1756–1752.
- ,,,.Effects of sleep and sleep deprivation on immunoglobulins and complement in humans.Brain Behav Immun.2007;21:308–310.
- ,,,,.The effects of sleep deprivation on symptoms of psychopathology in healthy adults.Sleep Med.2007;8:215–221.
- ,.Normal human sleep. In:Kryger MH,Roth T,Dement WC, editors.Principles and Practice of Sleep Medicine.3rd ed.Philadelphia:W.B. Saunders;2000:15–16.
- .Update on the Science, Diagnosis and Management of Insomnia.International Congress and Symposium Series 262.London:Royal Society of Medicine Press Ltd;2006.
- ,,,,,.The effects of age, sex, ethnicity, and sleep‐disordered breathing on sleep architecture.Arch Intern Med.2004;164:406–18.
- ,.Sleep disruption in older adults.Am J Nurs.2007;107(5):40–49.
- ,,,.Sleep disturbances and chronic disease in older adults: results of the 2003 National Sleep Foundation Sleep in America Survey.J Psychosom Res.2004;56(5):497–502.
- .Sleep in patients with neurologic and psychiatric disorders.Prim Care.2005;32:535–548.
- ,,.Insomnia and its treatment: prevalence and correlates.Arch Gen Psychiatry.1985;42(3):225–232.
- ,.Epidemiologic study of sleep disturbances and psychiatric disorders: an opportunity for prevention?JAMA.1989;262:1479–1484.
- ,,,,,.Sleep in critically ill patients requiring mechanical ventilation.Chest.2000;117:809–818.
- ,.Sedative and analgesic medications: risk factors for delirium and sleep disturbances in the critically ill.Crit Care Med.2006;22:313–327.
- ,,,,.Quantity and quality of sleep in the surgical intensive care unit: are our patients sleeping?J Trauma.2007;63:1210–1214.
- .Sleep in acute care units.Sleep Breath.2006;10:6–15.
- ,,,,,.An assessment of quality of sleep and the use of drugs with sedating properties in hospitalized adult patients.Health Qual Life Outcomes.2004;2:17.
- ,,,,,.Failure of physician documentation of sleep complaints in hospitalized patients.West J Med.1998;169:146–149.
- .Sleep and medical disorders.Prim Care.2005;35:511–533.
- ,,,,,.The occurrence of sleep‐disordered breathing among middle‐aged adults.N Engl J Med.1993;328:1230–1235.
- ,.Clinical features and evaluation of obstructive sleep apnea‐hypopnea syndrome. In:Kryger MH,Roth T,Dement WC, editors.Principles and Practice of Sleep Medicine.3rd ed.Philadelphia:W.B. Saunders;2000:869–872.
- ,,.Marked improvement in nocturnal gastroesophageal reflux in a large cohort of patients with obstructive sleep apnea.Arch Intern Med.2003;163:41–45.
- ,.Sleep and medical disorders.Med Clin North Am.2004;88:679–703.
- ,,,.Relation of sleep‐disordered breathing to carotid plaque and intima‐media thickness.Atherosclerosis.2008;197(1):125– 131.
- ,,, et al.Sleep‐disordered breathing and cardiovascular disease: cross‐sectional results of the Sleep Heart Health Study.Am J Respir Crit Care Med.2001;163:19–25.
- .Gastroesophageal reflux during sleep.Sleep Med Clin.2007;2:41–50.
- ,.Sleep apnea in renal failure.Adv Perit Dial.1997;13:88–92.
- .Sleep in chronic obstructive pulmonary disease.Sleep Med Clin.2007;2:1–8.
- ,,,.Effects of non‐invasive positive pressure ventilation on gas exchange and sleep in COPD patients.Chest.1997;112:623–628.
- ,,, et al.Night‐to‐night variability in CPAP use over the first three months of treatment.Sleep.1997;20(4):278–283.
- ,.Improving CPAP use by patients with the sleep apnoea/hypopnoea syndrome (SAHS).Sleep Med Rev.2003;7(1):81–99.
- ,,.Factors predicting sleep disruption in type II diabetes.Sleep.2000;23:415–416.
- ,,.Sleep duration as a risk factor for the development of type 2 diabetes.Diabetes Care.2006;29:657–661.
- .Sleep disorders and end‐stage renal disease.Sleep Med Clin.2007;2:59–66.
- ,,,.Sleep and aging: 1. Sleep disorders commonly found in older people.CMAJ.2007;176(9):1299–1304.
- ,,,,,.Impact, diagnosis and treatment of restless legs syndrome (RLS) in a primary care population: The REST (RLS Epidemiology, Symptoms, and Treatment) primary care study.Sleep Med.2004;5(3):237–246.
- ,.Epidemiology and clinical findings of restless leg syndrome.Sleep Med.2004;5(3):293–299.
- ,,,,,.High prevalence of sleep disturbance in cirrhosis.Hepatology.1998;27:339–345.
- ,,,,.Histamine H1 blocker hydroxyzine improves sleep in patients with cirrhosis and minimal hepatic encephalopathy: a randomized controlled pilot trial.Am J Gastroenterol.2007;102:744–753.
- .Sleep in patients with neurologic and psychiatric disorders.Prim Care.2005;32:535–548.
- ,,.Obstructive sleep apnea: implications for cardiac and vascular disease.JAMA.2003;290(14):1906–1914.
- ,,, et al.Pathophysiology of REM sleep behaviour disorder and relevance to neurodegenerative disease.Brain.2007;130(Pt 11):2770–2788.
- ,.REM sleep parasomnias. In:Kryger MH,Roth T,Dement WC, editors.Principles and Practice of Sleep Medicine.3rd ed.Philadelphia:W.B. Saunders;2000:724–725.
- ,,.Insomnia in patients with traumatic brain injury.J Head Trauma Rehabil.2006;21(3):199–212.
- ,,,,.Circadian rhythm sleep disorders following mild traumatic brain injury.Neurology.2007;68(14):1136–1140.
- ,.Comorbidities: psychiatric, medical, medications, and substances.Sleep Med Clin.2006;231–245.
- ,,.Sleep disturbance and fibromyalgia.Sleep Med Clin.2007;2:31–39.
- ,,.Sleep disturbances, pain and analgesia in adults hospitalized for burn injuries.Sleep Med.2004;5:551–559.
- ,,.Sleep deprivation and pain perception.Sleep Med Rev.2006;10:357–369.
- American Psychiatric Association.Diagnostic and Statistical Manual of Mental Disorders.4th ed. Text Revision.Washington, DC:American Psychiatric Association;2000.
- ,,, et al.Is insomnia a marker for psychiatric disorders in general hospitals?Sleep Med.2005;6:549–553.
- ,.The relationship between insomnia and health‐related quality of life in patients with chronic illness.J Fam Pract.2002;51(3):229–235.
- ,.Epidemiologic study of sleep disturbances and psychiatric disorders: an opportunity for prevention?JAMA.1989;262:1479–1484.
- ,,,.Sleep disturbance and psychiatric disorders: a longitudinal epidemiological study of young adults.Biol Psychiatry.1996;39:411–418.
- ,,,.The morbidity of insomnia uncomplicated by psychiatric disorders.Gen Hosp Psychiatry.1997;19:245–250.
- ,,.Prodromes and precursors: epidemiologic data for primary prevention of disorders with slow onset.Am J Psychiatry.1995;152:967–972.
- ,,,,,.Which depressive symptoms are related to which sleep electroencephalographic variables?Biol Psychol.1997;42:904–913.
- ,.Sleep in mood disorders.Psychiatr Clin North Am.2006;29:1009–1032.
- ,,,,.Insomnia, self‐medication, and relapse to alcoholism.Am J Psychiatry.2001;158:399–404.
- ,,,.The sleep of abstinent pure primary alcoholic patients: natural course and relationship to relapse.Alcohol Clin Exp Res.1998;22:1796–1802.
- ,,,,.Screening for substance use patterns among patients referred for a variety of sleep complaints.Am J Drug Alcohol Abuse.2006;32:111–120.
- .Drugs that disturb sleep and wakefulness. In:Kryger MH,Roth T,Dement WC, editors.Principles and Practice of Sleep Medicine.3rd ed.Philadelphia:W.B. Saunders;2000:441–462.
- ,,, et al.Contribution of the intensive care unit environment to sleep disruption in mechanically ventilated patients and healthy subjects.Am J Respir Crit Care Med.2003;167(5):708–715.
- ,,.Adverse environmental conditions in the respiratory and medical ICU settings.Chest.1994;105:1211–1216.
- ,,,,,.Noise levels in Johns Hopkins Hospital.J Acoust Soc Am.2005;118(6):3629–3645.
- ,,.Patient perception of sleep quality and etiology of sleep disruption in the intensive care unit.Am J Respir Crit Care Med.1999;159:1155–1162.
- ,,,.Nocturnal care interactions with patients in critical care units.Am J Crit Care.2004;13(2):102–115.

Death is a Crafty Old Friend
I will never forget her first words to me: You mispronounced my name.
I remember stopping short, awkwardly looking down at the emergency room chart in my hands and wondering how I could have mispronounced Mrs. Wells. I'm sorry, how should I say your name? I asked her.
Kitty.
Ah. Miss Kitty? I tried. This is, after all, Virginia, and octogenarians here are renowned for their adherence to social niceties.
She shook her head, her frown showing just how hard she was working to be patient with me. Miss Kitty was a character on Gunsmoke, she told me. Well, actually, she was lecturing me. I have never had red hair, I don't own a saloon, and I sure as heck don't have Marshall Dillon to keep me company. Darn my luck.
She was my seventh admission that afternoon, with at least 2 more to follow, but I found a smile for her and started into my usual routine. So, what brings you to the hospital today, Kitty?
I was hoping to meet a cute young doctor, she told me. And I think I succeeded.
This was clearly not going to go quickly. We'll deal with your poor eyesight later. What about the shortness of breath that the nurse wrote on your chart? I did not even mention the audible wheezing or the pursed‐lip breathing I had heard from outside the curtain.
Oh, that's just a ploy, she lied. To get to the meeting the cute young doctor part.
In glancing at her fingers to look for clubbing, I noticed the golden band and the tiny diamond ring, both of which looked huge on her knobby fingers. Kitty, I gently scolded her, I don't have time to deal with jealous husbands.
She laughed as she absently twirled the rings around her finger. Carl won't mind, she told me. He's been dead 14 years now.
But you still wear his rings, I pointed out.
He brought this ring with him when he came back to me from France after the war, she told me, straightening the tiny diamond on her finger. It was all his private's salary could afford, so he gave me the ring and a magnifying glass, and he told me to never look at the ring without using the magnifying glass.
No, this was clearly not going to go quickly at all. But I was pretty sure I was not going to mind.
Over the next 4 days, Kitty and I got to know each other fairly well. Her chronic obstructive pulmonary disease exacerbation improved to the point that I could send her home, and she begrudgingly accepted my recommendation of oxygen at night.
Over the next 2 years, I admitted her 7 more times; to my frustration, this meant that she was seeing me more regularly than she was seeing her primary care physician. After her third admission, I found myself having to convince her that it was time to start using her oxygen continuously. When she came back for her fourth admission, I noticed the cane at her bedside. Are you having trouble walking now, Kitty? I naively asked her.
Of course not, she shot back quickly. This is just in case I see a man I want to get a closer look at. I just hook him around the ankle and pull him in.
That discharge was to a skilled nursing facility because she had no family and no one else to care for her. After her 3 months of skilled benefits, she transitioned to long‐term care, and the next time her emphysema acted up, she thanked me for the introduction to all those handsome gentlemen. On each day of that admission, she asked when I was going to let her out of the hospital. Each day, she made sure that I knew, meant missed opportunities for her to be able to figure out which of the male residents was meant to be Carl's successor.
Her sixth admission was for pneumonia, and we nearly lost her. I am still convinced that it was nothing more than her self‐described abundance of piss and vinegar that pulled her through.
When the emergency room called me less than a month later for her seventh admission, I knew that Kitty and I were getting awfully close to the end of our relationship. She was tired and weak and smaller even than she had been just a few weeks before.
I admitted her to the intensive care unit for the first time on that admission, and I made the mistake of telling her that it was because with her somnolence and with her wish that she not be intubated, I was flirting with the idea of bilevel positive airway pressure (BiPAP) ventilation. She managed to find enough wind to tell me that I should save all my flirting for her.
Three days of antibiotics, frequent bronchodilators, steroids, and as much BiPAP as she could stand did not net us much improvement. On hospital day 4, the intensive care unit nurse caught me before I knocked on Kitty's sliding glass door.
She wants to go home, Lucy told me.
We're working on it, I reminded her.
Lucy shook her head. No, she said. Home with a capital H. Heaven. Lucy relayed the conversation that Kitty had had with her. The one that my old friend had not had with me.
The one that I should have had with her.
I closed Kitty's door behind me and sat down at her side on the bed, noticing how she was drawing each breath as if she had to pay for it.
Lucy told me about your conversation, I said quietly, once Kitty had finally opened her eyes and found me. No more BiPAP, I understand. She nodded. I waited for her to say something more, but she did not. Why didn't you tell me, Kitty? I asked her gently.
She laughed; her laugh was a short, tired little thing that died in her throat. She reached from under the covers to pat my hand. I suppose, she said, that I didn't want to let you down. You always seem so proud of yourself when I come in here, gasping and coughing, and you get me well enough to go back home. She paused to blow off some CO2 and find a sad smile for me. Time to let me go, she told me. Let me be with Carl again.
We talked for quite a while. Well, actually, I did most of the talking. She did not have the wind for it. I admitted to her just how embarrassed I was that she had had to bring this up to me. I have for quite some time been rather comfortable with the notion that death is not the worst thing that can happen to a patient. It was Dr. Tom Smith, at the Medical College of Virginia, who first introduced what was then a wide‐eyed, idealist medical student to the concept of a good death: snatching a victory for compassion from the jaws of a medical defeat.
Therefore, at Kitty's insistence, there was no more BiPAP. When her breathing became labored, we gave her just enough morphine to take the edge off her air hunger. Rather than round on her in the mornings, I simply sat with her.
I would like to say that I was with Kitty when she died. It would bring the story full circle and give our relationship a clean beginning and a clean end. It would be good fiction.
However, it would also be a lie.
Lucy met me at her door again, just 3 days later, and told me about Kitty's quiet passing, in her sleep, just an hour before I had arrived for rounds.
I sat at Kitty's side one last time, holding her now cold hand. She was smiling.
At least, that is how I intend to remember that moment.
The bed sagged just a bit on the other side as I realized that Death had joined me. For those who have not had the pleasure, the part of Death is played by Gwyneth Paltrow.
We sat in silence for several minutes, Death showing me the patience that she had once told me she had.
I rarely see it.
How is she? I finally asked.
Better. She and Carl are catching up a bit. I nodded. He's giving her hell for losing that magnifying glass.
I could not help the smile. Carl was one lucky man.
She says thank you.
Whether it was true or not, it was nice for Death to say it.
She let me have a long stretch of silence before she felt the need to ruin our tender moment. You have any other business for me?
I growled a warning, and she smiled. That was a joke, Doctor. Lighten up a little, would you?
She turned to go, but I stopped her. Hey, I found a great quote for you. The last time that we had chatted, she had been lamenting the plethora of love lines and the paucity of good death ones:
Because I could not stop for Death,
He kindly stopped for me;
The carriage held but just ourselves
and immortality.
Emily Dickinson, I told her.
Huh, she said, frowning and doing that thing with her eyebrow for which Gwyneth gets paid millions. Wonder why she thought I was a he?
Acknowledgements
I thank the editors of the Journal of Hospital Medicine for considering this submission. This is a fictionalized account of a true patient experience. The patient in question has passed away, but while she was alive, she and I discussed many things, including my writing, and she actually asked that I write about her some day. This is the fulfillment of my promise to her.
One Hundred Years Later
The approach to clinical conundrums by an expert clinician is revealed through presentation of an actual patient's case in an approach typical of morning report. Similar to patient care, sequential pieces of information are provided to the clinician who is unfamiliar with the case. The focus is on the thought processes of both the clinical team caring for the patient and the discussant.
A 36 year‐old male physician was admitted to a Baltimore hospital in April 1907 with weight loss, weakness, arthralgias, and abdominal distension that had progressed over 5 years.
In 1907, major causes of unexplained weight loss included tuberculosis, hyperthyroidism, cancer, and diabetes. Arthralgias and weakness are not specific. The insidious progression over 5 years narrows the infectious possibilities; tuberculosis and syphilis are important considerations. Since surgical removal was the main treatment for malignancy in 1907, a history of prior surgery might point to a previously diagnosed malignancy that is now progressing.
Five years earlier, while visiting Turkey as a medical missionary, he first noted the onset of arthralgias that lasted 6 to 8 hours and occurred 3 to 4 times per week. Over time, these attacks lasted up to 24 hours and became associated with warmth, swelling, and tenderness of both small and large joints. He gradually lost weight and strength. One year prior to arrival in the hospital, he developed a cough productive of yellow sputum. Seven months prior, he returned from Turkey to Atlanta and noticed an increase in his cough, along with fevers of 100 Fahrenheit and night sweats.
The primacy of the arthralgias in this illness lead me to consider primary rheumatic diseases, and multisystem diseases (including infections) with a predominant skeletal component. In 1907, tests for lupus and the rheumatoid factor were not available. Neither skeletal remains nor works of art provide evidence that rheumatoid arthritis existed until the 19th century, whereas ankylosing spondylitis, gout, and rickets were present by then.
As a medical missionary, he might have acquired a disease endemic to the areas he visited, or the travel history may be a red herring. Familial Mediterranean fever, though prevalent in Turkey and a cause of arthralgias accompanied by recurrent attacks of abdominal pain and fever, is not an acquired disease. Behcet's disease, also known as Silk Trader's Route disease, is found in descendents of the countries that comprised the ancient Silk Route from Japan to the Middle East and may cause arthritis along with oral ulcers, genital lesions, pathergy or uveitis. I would inquire about his ancestry and fevers before dismissing these possibilities.
Although 5 years would be unusually long for tuberculosis to go unrecognized, a physician in the first half of the 20th century would place tuberculosis near the top of possible diagnoses. In 1930, a time when the population of the United States was considerably less, there were over 300,000 cases of tuberculosis. Physicians, and in particular pathologists since autopsies were more commonly performed, often died from tuberculosis since streptomycin, the first antituberculous medication, did not arrive until 1944. At the turn of the 20th century, the ability to detect tubercle bacilli was quite good. Thus, I would include tuberculous peritonitis as a cause of the progressive abdominal symptoms in this physician. In approximately one‐third of patients with tuberculous peritonitis there is evidence of pulmonary disease, and I would try to culture tuberculosis in samples of sputum, a test then so common it probably rivaled our frequent complete blood counts in popularity.
Six months prior, examinations of sputum were negative for tubercle bacilli. Four months prior to arrival, the patient moved to New Mexico. His cough improved but he continued to lose weight and had diarrhea consisting of 3 to 4 loose or semiformed bowel movements per day. Three months prior to admission, he noted an increase in abdominal girth along with right lower quadrant fullness. One month prior, he noted painful swelling and warmth in both ankles as well as dyspnea with exertion.
The increased abdominal girth in the context of chronic illness might be due to ascites, adenopathy, visceromegaly, or mass lesions such as a neoplasm or abscess. If ascites is the cause, one would need to consider primary hepatic disorders, as well as extrahepatic diseases that could progress over years. Infection with hepatitis A virus does not cause chronic liver disease. Hepatitis B, in those days, was referred to as serum hepatitis, and a serum marker for the B virusthe Australia antigenwas not identified until 1967. Cardiac causes of ascites include congestive heart failure and constrictive pericarditis, the latter an important consideration because it is potentially curable. Also, constrictive pericarditis can present as an indolent weight‐losing disease because of chronic visceral congestion. Other considerations include nephrotic syndrome, infection, and neoplasm, including mesothelioma.
Abdominal distention might also be seen with a smoldering abscess. In addition to an appendiceal process, the travel and right lower quadrant localization reminds us to consider ameboma. This patient surely was in an area where amebiasis was endemic, and amebomaa chronic inflammatory form of infection with E. histolytica not associated with diarrhea or liver cystsmay mimic cecal carcinoma. Exertional dyspnea suggests at least the possibility of cardiac disease. Despite the negative sputum cultures, tuberculosis remains high on the list as a cause of constrictive pericarditis or peritonitis, either of which may occur in the absence of active pulmonary disease.
Past medical history included measles and whooping cough as a child, mild pleurisy at age 14, mild influenza 7 years previously. The patient had a tonsillectomy as a child and had a portion of his inferior turbinate bone removed in an attempt to relieve a nasal condition.
On physical exam, the patient was thin and the skin over his face and hands was deep brown. His temperature was 101.5 Fahrenheit, the heart rate was 100, and the respiratory rate was 24. Small lymph nodes were palpable in the axillary and epitrochlear areas. His thorax moved asymmetrically, with less movement on the left apex and slight dullness to percussion in that area. The pulmonic component of the second heart sound was mildly accentuated. The abdomen displayed fullness and tympany, most pronounced in the right lower quadrant without hepatosplenomegaly. The left ankle was swollen, and the overlying skin was tense, shiny, and hot. On both lower legs, areas of discoloration and slight induration were observed, felt to be consistent with faded erythema nodosum.
Though pleurisy has numerous causes, its presence raises the specter of tuberculosis again. The nasal condition triggers thoughts of Wegener's granulomatosis or lethal midline granuloma, both unlikely diagnoses here. The pulmonary exam suggests an apical process, such as tuberculosis, and the accentuated pulmonic heart sound implies pulmonary hypertension, which could be due to a number of chronic pulmonary diseases. The epitrochlear nodes are of interest since lymphoma and Hodgkin's disease rarely involve this area; syphilis and human immunodeficiency virus (HIV) are a few of the chronic diseases that may involve this lymph node region. More helpful is the absence of hepatosplenomegaly, since many indolent malignancies and infections would be expected to enlarge these organs by this point.
Monoarticular arthritis is often due to infection, and less likely due to rheumatoid disease. When rheumatoid arthritis flares, the entire skeleton flares, not single joints. Given the indolence and this single joint involvement, tuberculosis again comes to mind.
I would next want to obtain a plain chest radiograph, looking for evidence of tuberculosis. As with any test, one should ask how this will change management. In 1907, antituberculous medications were not available, so therapy was directed at lowering oxygen tension in the primary site of infection; for example, pulmonary disease was addressed via pneumothorax. If the chest radiograph provides little hint of tuberculosis, then consideration must be given to exploratory surgery of the abdomen given the focal abnormality in the right lower quadrant.
A peripheral blood smear revealed a hypochromic microcytic anemia. The total red blood cell count was 4.468 million/mm3 (normal range for men is 4.52‐5.90 million/mm3), white blood cell count was 8180/mm3, including 80% granulocytes and 9% eosinophils. On gross inspection, the stool was clay‐colored, and stool microscopy demonstrated large numbers of neutral fat droplets, but no ova, parasites, or tubercle bacilli. Urinalysis revealed no albumin or casts, and the bones were normal on ankle radiographs. Another sample of sputum revealed no tubercle bacilli, and intradermal placement of tuberculin provoked no reaction.
His negative tuberculin skin reaction is unusual for that era, because of the prevalence of tuberculosis. Most likely, he is anergic because of his severe underlying illness, and the absent reaction is thus not all that helpful a clue. Multiple negative sputum examinations lower the possibility of pulmonary, but not extrapulmonary, tuberculosis. The absence of bony destruction on ankle radiographs lowers my suspicion for tuberculous arthritis.
The excess stool fat implies steatogenic diarrhea from malabsorption, and 2 categories here are pancreatic and luminal diseases. Of these 2, pancreatic etiologies produce more severe malabsorption. We do not hear mention of jaundice, however, and I cannot see how to link the pancreas to the arthritis. A chronic infection which may produce malabsorption and eosinophilia is strongyloidiasis, endemic in the southeastern United States. However, this patient did not manifest the most common finding of chronic strongyloidiasis, namely asthma. Adrenal insufficiency, as might result from disseminated tuberculosis, is associated with increased skin pigmentation, diarrhea, and eosinophilia. However, the diarrhea of adrenal insufficiency is not malabsorptive, and serum electrolytes and cortisol tests were not available then to confirm this diagnosis antemortem.
In an attempt to identify a unifying cause of chronic arthritis, malabsorption, and increased skin pigmentation, I must consider Whipple's disease first and foremost. Physicians then were strapped and observation was often the default mode of the day. Given the abdominal findings, an exploratory laparotomy would be warranted if his condition deteriorated.
Despite forced oral feedings, the patient continued to lose weight, from his normal of 175 pounds to a nadir of 145 pounds. Because of worsening abdominal distention, the patient underwent exploratory abdominal surgery on the twenty‐first hospital day. Intraoperatively, no ascites was seen, but his mesenteric lymph nodes were hard and markedly enlarged. The abdomen was closed without further intervention. Two days after the surgery, the patient abruptly developed dyspnea. His respirations were 40 per minute, heart rate was 120, and he had minimal rales at the lung bases without findings of consolidation. He died 2 hours later, on the twenty‐third hospital day, and an autopsy was performed.
The final event may have been a pulmonary embolism. As for the adenopathy, lymphoma and tuberculosis are possible. Heavy chain disease, an unusual lymphoproliferative disorder found in persons from the old Silk Trader's Route from the Middle East to the Orient, is a remote prospect. However, 5 years is just too indolent for most cancers and would be very unusual for tuberculosis. I think the findings support Whipple's disease, and I wonder if this was the first reported case.
On postmortem examination, the abdominal adenopathy was striking. The small intestine contained enlarged villi with thickened submucosa, and the mesenteric nodes were enlarged with fat deposits and abnormal foamy cells. Within these foamy cells, microscopy revealed numerous rod‐shaped organisms. All studies were negative for tuberculosis, and although the pathologist, Dr. George Hoyt Whipple, suspected an infectious etiology, he offered the name intestinal lipodystrophy to emphasize the striking small intestinal changes he witnessed at autopsy, and which are the hallmarks of the disease that now bears his name. Whipple also shared the 1934 Nobel Prize in Physiology or Medicine with Minot and Murphy for their discovery that a nutritional substance in liver, now known as vitamin B12, was beneficial in treating pernicious anemia.
COMMENTARY
This is the index case of Whipple's disease, summarized from the original 1907 description.1 George Hoyt Whipple, then a pathologist at Johns Hopkins, highlights the value of keen observation and a well‐done case report in describing a new disease entity. One of the roles of case reports is to detail the features of an unknown disease. In this capacity, Whipple's summary is exemplary. His achievement was having the openness of mind to realize he was witnessing something novel, and to take the first step on the road to discovery. Although Whipple suspected he was staring at a unique disease, he could not pinpoint the culprit bacteria and he had trouble squaring the extraintestinal findings with the marked intestinal anomalies. It was left to decades of input from others to confirm the association of arthralgias, eosinophilia, skin hyperpigmentation, and cardiac valve abnormalities with intestinal malabsorption, and to culture the infectious agent.
In his discussion, Whipple recognized he was confronted with a novel clinical entity. Prior to surgery, pulmonary and mesenteric tuberculosis were suspected, based on the fevers, weight loss, cough, fat malabsorption, and lymphadenopathy. However, he felt the left apical exam was more representative of retraction from prior disease than active infection. He was also bothered by the negative skin reaction and sputum tests. At surgery, the pronounced adenopathy suggested sarcoma or Hodgkin's disease but postmortem examination eliminated these possibilities. At autopsy, the abdominal findings were most striking. The small intestine demonstrated enlarged villi with thickened submucosa and markedly enlarged mesenteric lymph glands containing large fat deposits and distinctly abnormal foamy cells. These foamy macrophages contained great numbers of rod‐shaped organisms resembling the tubercle bacillus. However, all tests were negative for tuberculosis, and the lungs contained no active disease. Though he suspected an infectious etiology, Whipple offered the name intestinal lipodystrophy to emphasize the striking small intestinal pathology.
Although Whipple had surmised a novel infectious agent in 1907, it took almost a century to isolate the causative microbe. Granules within foamy macrophages of the small intestine were detected on periodic acid‐Schiff (PAS) staining in 1949.2 Similar PAS‐positive granules were soon discovered in other tissues and fluid, providing a plausible explanation for the systemic features of the disease.3 Electron microscopy confirmed the presence of infectious bacilli in 1961,4 ushering in the era of antimicrobial treatment for this disease. More recently, using polymerase chain reaction (PCR), a unique bacterial 16S ribosomal RNA gene was isolated in patients with Whipple's disease.5, 6 Phylogenetically classified with the actinobacteria, Tropheryma whipplei (fom the Greek trophe, nourishment, and eryma, barrier) was ultimately subcultured in 2000,7 and immunodetection testing became possible. Using this technique, the archived pathology specimens from the 1907 index case demonstrated numerous intracellular bacteria in the lamina propria, closing the loop started by Whipple nearly a century earlier.8
Whipple's index case report described most of the manifestations of the disease we are familiar with today. As in the original description, arthralgias are the most common initial symptom and may precede diagnosis by a mean of 8 years. Other cardinal features include weight loss, abdominal pain and steatorrhea due to small intestinal involvement. Table 1 summarizes the important signs and symptoms of Whipple's disease.9, 10 One notable manifestation missing in Whipple's report is central nervous system involvement. Central nervous system (CNS) disease ranges from cognitive deficits to encephalitis and focal defects, and may occur years after treatment and without concomitant intestinal symptoms.
| Clinical Feature | Comment |
|---|---|
| |
| Cardinal features (present in 60% to 90%) | |
| Arthropathy | Most common initial symptom, preceding diagnosis by a mean of 8 years. Migratory, nonerosive, mainly in the peripheral joints. |
| Weight loss | |
| Diarrhea | Usually steatorrhea, may be associated with pain or occult blood in the stool |
| Other common features (present in 20% to 45%) | |
| Fever | |
| Lymphadenopathy | May present as a palpable mass |
| Increased skin pigmentation | Mechanism unknown (evidence of adrenal insufficiency has not been found in Whipple's) |
| Cardiac disease | Culture‐negative endocarditis |
| Hypotension | |
| Peripheral edema | |
| Uncommon clinical features | |
| Central nervous system involvement | May be global (dementia, personality change, sleep disturbance) or focal (cranial neuropathy, nystagmus) |
| Eye disease | Uveitis, retinitis |
| Hepatosplenomegaly | |
| Polyserositis | |
| Ascites | |
A remaining mystery is why this pathogen results only rarely in clinical disease. Caucasians comprise the majority of infected patients, and men are affected 8 times more often than women. An overrepresentation of HLA‐B27 suggests a genetic predisposition, though its role in pathogenesis is unclear. T. whipplei has been identified by PCR methods in asymptomatic individuals, implying additional abnormalities must be present in susceptible hosts for symptoms to occur following colonization.11 The exact immune defects are speculative, and immunodeficiency states (such as HIV) have not been consistently identified in patients with Whipple's disease.
The cornerstone of diagnosing Whipple's disease is upper endoscopy with duodenal biopsy. Flattening of the villi and markedly increased PAS‐positive staining of lamina propria macrophages are strongly suggestive of the diagnosis. PAS‐positive staining is not unique to T. whipplei, however. In patients with profound immunodeficiency, Mycobacterium avium intracellulare may stain positive with PAS. Since Whipple's disease is only rarely associated with HIV, a negative HIV test would favor a diagnosis of Whipple's disease. Electron microscopy may distinguish T. whipplei from its mimickers by morphology. For extraintestinal disease, PCR testing on samples from infected tissue has been found to be a reliable diagnostic aid.9
Given the rarity of the disease, controlled clinical trials addressing optimal treatment are lacking. Current recommendations include initial therapy for 14 days with an agent that crosses the blood‐brain barrier (eg, ceftriaxone) to reduce the incidence of CNS disease. This is then followed by a year or more of oral antimicrobial therapy with trimethoprim‐sulfamethoxazole or a tetracycline.9 While most patients respond within 2 to 3 weeks, relapse may occur in as many as one‐third of patients.
Historical case reports reinforce the case‐based learning paradigm. As the discussant remarks, observation was all too often the only recourse for physicians a century ago. In recounting the 7‐year progression of disease in 1 individual, Whipple provides a unique window into the natural evolution of the key features of this systemic disease. Viewed through the prism of Whipple's eyes, we can recall the striking lymphoid hyperplasia and unusual organisms in the small intestine, cementing our understanding of the pathogenesis of this disorder. Revisiting past cases allows us to learn of and learn from the past.
Teaching Points
-
Whipple's disease should be considered in patients with unexplained arthralgias accompanied by weight loss, malabsorption, and abdominal pain.
-
For suspected intestinal Whipple's disease, diagnosis is best made by duodenal biopsy demonstrating PAS‐positive staining in lamina propria macrophages.
-
Systemic manifestations of Whipple's disease include culture‐negative endocarditis and CNS disease. PCR testing of involved sites for T. whipplei is recommended to confirm extraintestinal disease.
- .A hitherto undescribed disease characterized anatomically by deposits of fat and fatty acids in the intestinal and mesenteric lymphatic tissues.Bull Johns Hopkins Hosp.1907;18:382–391.
- .The tinctoral demonstration of a glycoprotein in Whipple's disease.Proc Soc Exp Biol Med.1949;72:225–227.
- ,,.Whipple's disease: clinical, biochemical, and histopathologic features and assessment of treatment in 29 patients.Mayo Clin Proc.1988;63:539–551.
- ,.Combined electron and light microscopy in Whipple's disease: demonstration of “bacillary bodies” in the intestine.Bull Johns Hopkins Hosp.1961;109:80–98.
- ,,,.Phylogeny of the Whipple's disease‐associated bacterium.Lancet.1991;338:474–475.
- ,,,.Identification of the uncultured bacillus of Whipple's disease.N Engl J Med.1992;327:293–301.
- ,,, et al.Cultivation of the bacillus of Whipple's disease.N Engl J Med.2000;342:620–625.
- ,,,.Immunodetection of Tropheryma whipplei in intestinal tissue from Dr. Whipple's 1907 patient.N Engl J Med.2003;348:1411– 1412.
- ,.Whipple's disease.Lancet.2003;361:239–246.
- ,,, et al.Diagnostic guidelines in central nervous system Whipple's disease.Ann Neurol.1996;40:561–568.
- ,,, et al.PCR‐positive tests for Tropheryma whippleii in patients without Whipple's disease.Lancet.1999;353:2214.
The approach to clinical conundrums by an expert clinician is revealed through presentation of an actual patient's case in an approach typical of morning report. Similar to patient care, sequential pieces of information are provided to the clinician who is unfamiliar with the case. The focus is on the thought processes of both the clinical team caring for the patient and the discussant.
A 36 year‐old male physician was admitted to a Baltimore hospital in April 1907 with weight loss, weakness, arthralgias, and abdominal distension that had progressed over 5 years.
In 1907, major causes of unexplained weight loss included tuberculosis, hyperthyroidism, cancer, and diabetes. Arthralgias and weakness are not specific. The insidious progression over 5 years narrows the infectious possibilities; tuberculosis and syphilis are important considerations. Since surgical removal was the main treatment for malignancy in 1907, a history of prior surgery might point to a previously diagnosed malignancy that is now progressing.
Five years earlier, while visiting Turkey as a medical missionary, he first noted the onset of arthralgias that lasted 6 to 8 hours and occurred 3 to 4 times per week. Over time, these attacks lasted up to 24 hours and became associated with warmth, swelling, and tenderness of both small and large joints. He gradually lost weight and strength. One year prior to arrival in the hospital, he developed a cough productive of yellow sputum. Seven months prior, he returned from Turkey to Atlanta and noticed an increase in his cough, along with fevers of 100 Fahrenheit and night sweats.
The primacy of the arthralgias in this illness lead me to consider primary rheumatic diseases, and multisystem diseases (including infections) with a predominant skeletal component. In 1907, tests for lupus and the rheumatoid factor were not available. Neither skeletal remains nor works of art provide evidence that rheumatoid arthritis existed until the 19th century, whereas ankylosing spondylitis, gout, and rickets were present by then.
As a medical missionary, he might have acquired a disease endemic to the areas he visited, or the travel history may be a red herring. Familial Mediterranean fever, though prevalent in Turkey and a cause of arthralgias accompanied by recurrent attacks of abdominal pain and fever, is not an acquired disease. Behcet's disease, also known as Silk Trader's Route disease, is found in descendents of the countries that comprised the ancient Silk Route from Japan to the Middle East and may cause arthritis along with oral ulcers, genital lesions, pathergy or uveitis. I would inquire about his ancestry and fevers before dismissing these possibilities.
Although 5 years would be unusually long for tuberculosis to go unrecognized, a physician in the first half of the 20th century would place tuberculosis near the top of possible diagnoses. In 1930, a time when the population of the United States was considerably less, there were over 300,000 cases of tuberculosis. Physicians, and in particular pathologists since autopsies were more commonly performed, often died from tuberculosis since streptomycin, the first antituberculous medication, did not arrive until 1944. At the turn of the 20th century, the ability to detect tubercle bacilli was quite good. Thus, I would include tuberculous peritonitis as a cause of the progressive abdominal symptoms in this physician. In approximately one‐third of patients with tuberculous peritonitis there is evidence of pulmonary disease, and I would try to culture tuberculosis in samples of sputum, a test then so common it probably rivaled our frequent complete blood counts in popularity.
Six months prior, examinations of sputum were negative for tubercle bacilli. Four months prior to arrival, the patient moved to New Mexico. His cough improved but he continued to lose weight and had diarrhea consisting of 3 to 4 loose or semiformed bowel movements per day. Three months prior to admission, he noted an increase in abdominal girth along with right lower quadrant fullness. One month prior, he noted painful swelling and warmth in both ankles as well as dyspnea with exertion.
The increased abdominal girth in the context of chronic illness might be due to ascites, adenopathy, visceromegaly, or mass lesions such as a neoplasm or abscess. If ascites is the cause, one would need to consider primary hepatic disorders, as well as extrahepatic diseases that could progress over years. Infection with hepatitis A virus does not cause chronic liver disease. Hepatitis B, in those days, was referred to as serum hepatitis, and a serum marker for the B virusthe Australia antigenwas not identified until 1967. Cardiac causes of ascites include congestive heart failure and constrictive pericarditis, the latter an important consideration because it is potentially curable. Also, constrictive pericarditis can present as an indolent weight‐losing disease because of chronic visceral congestion. Other considerations include nephrotic syndrome, infection, and neoplasm, including mesothelioma.
Abdominal distention might also be seen with a smoldering abscess. In addition to an appendiceal process, the travel and right lower quadrant localization reminds us to consider ameboma. This patient surely was in an area where amebiasis was endemic, and amebomaa chronic inflammatory form of infection with E. histolytica not associated with diarrhea or liver cystsmay mimic cecal carcinoma. Exertional dyspnea suggests at least the possibility of cardiac disease. Despite the negative sputum cultures, tuberculosis remains high on the list as a cause of constrictive pericarditis or peritonitis, either of which may occur in the absence of active pulmonary disease.
Past medical history included measles and whooping cough as a child, mild pleurisy at age 14, mild influenza 7 years previously. The patient had a tonsillectomy as a child and had a portion of his inferior turbinate bone removed in an attempt to relieve a nasal condition.
On physical exam, the patient was thin and the skin over his face and hands was deep brown. His temperature was 101.5 Fahrenheit, the heart rate was 100, and the respiratory rate was 24. Small lymph nodes were palpable in the axillary and epitrochlear areas. His thorax moved asymmetrically, with less movement on the left apex and slight dullness to percussion in that area. The pulmonic component of the second heart sound was mildly accentuated. The abdomen displayed fullness and tympany, most pronounced in the right lower quadrant without hepatosplenomegaly. The left ankle was swollen, and the overlying skin was tense, shiny, and hot. On both lower legs, areas of discoloration and slight induration were observed, felt to be consistent with faded erythema nodosum.
Though pleurisy has numerous causes, its presence raises the specter of tuberculosis again. The nasal condition triggers thoughts of Wegener's granulomatosis or lethal midline granuloma, both unlikely diagnoses here. The pulmonary exam suggests an apical process, such as tuberculosis, and the accentuated pulmonic heart sound implies pulmonary hypertension, which could be due to a number of chronic pulmonary diseases. The epitrochlear nodes are of interest since lymphoma and Hodgkin's disease rarely involve this area; syphilis and human immunodeficiency virus (HIV) are a few of the chronic diseases that may involve this lymph node region. More helpful is the absence of hepatosplenomegaly, since many indolent malignancies and infections would be expected to enlarge these organs by this point.
Monoarticular arthritis is often due to infection, and less likely due to rheumatoid disease. When rheumatoid arthritis flares, the entire skeleton flares, not single joints. Given the indolence and this single joint involvement, tuberculosis again comes to mind.
I would next want to obtain a plain chest radiograph, looking for evidence of tuberculosis. As with any test, one should ask how this will change management. In 1907, antituberculous medications were not available, so therapy was directed at lowering oxygen tension in the primary site of infection; for example, pulmonary disease was addressed via pneumothorax. If the chest radiograph provides little hint of tuberculosis, then consideration must be given to exploratory surgery of the abdomen given the focal abnormality in the right lower quadrant.
A peripheral blood smear revealed a hypochromic microcytic anemia. The total red blood cell count was 4.468 million/mm3 (normal range for men is 4.52‐5.90 million/mm3), white blood cell count was 8180/mm3, including 80% granulocytes and 9% eosinophils. On gross inspection, the stool was clay‐colored, and stool microscopy demonstrated large numbers of neutral fat droplets, but no ova, parasites, or tubercle bacilli. Urinalysis revealed no albumin or casts, and the bones were normal on ankle radiographs. Another sample of sputum revealed no tubercle bacilli, and intradermal placement of tuberculin provoked no reaction.
His negative tuberculin skin reaction is unusual for that era, because of the prevalence of tuberculosis. Most likely, he is anergic because of his severe underlying illness, and the absent reaction is thus not all that helpful a clue. Multiple negative sputum examinations lower the possibility of pulmonary, but not extrapulmonary, tuberculosis. The absence of bony destruction on ankle radiographs lowers my suspicion for tuberculous arthritis.
The excess stool fat implies steatogenic diarrhea from malabsorption, and 2 categories here are pancreatic and luminal diseases. Of these 2, pancreatic etiologies produce more severe malabsorption. We do not hear mention of jaundice, however, and I cannot see how to link the pancreas to the arthritis. A chronic infection which may produce malabsorption and eosinophilia is strongyloidiasis, endemic in the southeastern United States. However, this patient did not manifest the most common finding of chronic strongyloidiasis, namely asthma. Adrenal insufficiency, as might result from disseminated tuberculosis, is associated with increased skin pigmentation, diarrhea, and eosinophilia. However, the diarrhea of adrenal insufficiency is not malabsorptive, and serum electrolytes and cortisol tests were not available then to confirm this diagnosis antemortem.
In an attempt to identify a unifying cause of chronic arthritis, malabsorption, and increased skin pigmentation, I must consider Whipple's disease first and foremost. Physicians then were strapped and observation was often the default mode of the day. Given the abdominal findings, an exploratory laparotomy would be warranted if his condition deteriorated.
Despite forced oral feedings, the patient continued to lose weight, from his normal of 175 pounds to a nadir of 145 pounds. Because of worsening abdominal distention, the patient underwent exploratory abdominal surgery on the twenty‐first hospital day. Intraoperatively, no ascites was seen, but his mesenteric lymph nodes were hard and markedly enlarged. The abdomen was closed without further intervention. Two days after the surgery, the patient abruptly developed dyspnea. His respirations were 40 per minute, heart rate was 120, and he had minimal rales at the lung bases without findings of consolidation. He died 2 hours later, on the twenty‐third hospital day, and an autopsy was performed.
The final event may have been a pulmonary embolism. As for the adenopathy, lymphoma and tuberculosis are possible. Heavy chain disease, an unusual lymphoproliferative disorder found in persons from the old Silk Trader's Route from the Middle East to the Orient, is a remote prospect. However, 5 years is just too indolent for most cancers and would be very unusual for tuberculosis. I think the findings support Whipple's disease, and I wonder if this was the first reported case.
On postmortem examination, the abdominal adenopathy was striking. The small intestine contained enlarged villi with thickened submucosa, and the mesenteric nodes were enlarged with fat deposits and abnormal foamy cells. Within these foamy cells, microscopy revealed numerous rod‐shaped organisms. All studies were negative for tuberculosis, and although the pathologist, Dr. George Hoyt Whipple, suspected an infectious etiology, he offered the name intestinal lipodystrophy to emphasize the striking small intestinal changes he witnessed at autopsy, and which are the hallmarks of the disease that now bears his name. Whipple also shared the 1934 Nobel Prize in Physiology or Medicine with Minot and Murphy for their discovery that a nutritional substance in liver, now known as vitamin B12, was beneficial in treating pernicious anemia.
COMMENTARY
This is the index case of Whipple's disease, summarized from the original 1907 description.1 George Hoyt Whipple, then a pathologist at Johns Hopkins, highlights the value of keen observation and a well‐done case report in describing a new disease entity. One of the roles of case reports is to detail the features of an unknown disease. In this capacity, Whipple's summary is exemplary. His achievement was having the openness of mind to realize he was witnessing something novel, and to take the first step on the road to discovery. Although Whipple suspected he was staring at a unique disease, he could not pinpoint the culprit bacteria and he had trouble squaring the extraintestinal findings with the marked intestinal anomalies. It was left to decades of input from others to confirm the association of arthralgias, eosinophilia, skin hyperpigmentation, and cardiac valve abnormalities with intestinal malabsorption, and to culture the infectious agent.
In his discussion, Whipple recognized he was confronted with a novel clinical entity. Prior to surgery, pulmonary and mesenteric tuberculosis were suspected, based on the fevers, weight loss, cough, fat malabsorption, and lymphadenopathy. However, he felt the left apical exam was more representative of retraction from prior disease than active infection. He was also bothered by the negative skin reaction and sputum tests. At surgery, the pronounced adenopathy suggested sarcoma or Hodgkin's disease but postmortem examination eliminated these possibilities. At autopsy, the abdominal findings were most striking. The small intestine demonstrated enlarged villi with thickened submucosa and markedly enlarged mesenteric lymph glands containing large fat deposits and distinctly abnormal foamy cells. These foamy macrophages contained great numbers of rod‐shaped organisms resembling the tubercle bacillus. However, all tests were negative for tuberculosis, and the lungs contained no active disease. Though he suspected an infectious etiology, Whipple offered the name intestinal lipodystrophy to emphasize the striking small intestinal pathology.
Although Whipple had surmised a novel infectious agent in 1907, it took almost a century to isolate the causative microbe. Granules within foamy macrophages of the small intestine were detected on periodic acid‐Schiff (PAS) staining in 1949.2 Similar PAS‐positive granules were soon discovered in other tissues and fluid, providing a plausible explanation for the systemic features of the disease.3 Electron microscopy confirmed the presence of infectious bacilli in 1961,4 ushering in the era of antimicrobial treatment for this disease. More recently, using polymerase chain reaction (PCR), a unique bacterial 16S ribosomal RNA gene was isolated in patients with Whipple's disease.5, 6 Phylogenetically classified with the actinobacteria, Tropheryma whipplei (fom the Greek trophe, nourishment, and eryma, barrier) was ultimately subcultured in 2000,7 and immunodetection testing became possible. Using this technique, the archived pathology specimens from the 1907 index case demonstrated numerous intracellular bacteria in the lamina propria, closing the loop started by Whipple nearly a century earlier.8
Whipple's index case report described most of the manifestations of the disease we are familiar with today. As in the original description, arthralgias are the most common initial symptom and may precede diagnosis by a mean of 8 years. Other cardinal features include weight loss, abdominal pain and steatorrhea due to small intestinal involvement. Table 1 summarizes the important signs and symptoms of Whipple's disease.9, 10 One notable manifestation missing in Whipple's report is central nervous system involvement. Central nervous system (CNS) disease ranges from cognitive deficits to encephalitis and focal defects, and may occur years after treatment and without concomitant intestinal symptoms.
| Clinical Feature | Comment |
|---|---|
| |
| Cardinal features (present in 60% to 90%) | |
| Arthropathy | Most common initial symptom, preceding diagnosis by a mean of 8 years. Migratory, nonerosive, mainly in the peripheral joints. |
| Weight loss | |
| Diarrhea | Usually steatorrhea, may be associated with pain or occult blood in the stool |
| Other common features (present in 20% to 45%) | |
| Fever | |
| Lymphadenopathy | May present as a palpable mass |
| Increased skin pigmentation | Mechanism unknown (evidence of adrenal insufficiency has not been found in Whipple's) |
| Cardiac disease | Culture‐negative endocarditis |
| Hypotension | |
| Peripheral edema | |
| Uncommon clinical features | |
| Central nervous system involvement | May be global (dementia, personality change, sleep disturbance) or focal (cranial neuropathy, nystagmus) |
| Eye disease | Uveitis, retinitis |
| Hepatosplenomegaly | |
| Polyserositis | |
| Ascites | |
A remaining mystery is why this pathogen results only rarely in clinical disease. Caucasians comprise the majority of infected patients, and men are affected 8 times more often than women. An overrepresentation of HLA‐B27 suggests a genetic predisposition, though its role in pathogenesis is unclear. T. whipplei has been identified by PCR methods in asymptomatic individuals, implying additional abnormalities must be present in susceptible hosts for symptoms to occur following colonization.11 The exact immune defects are speculative, and immunodeficiency states (such as HIV) have not been consistently identified in patients with Whipple's disease.
The cornerstone of diagnosing Whipple's disease is upper endoscopy with duodenal biopsy. Flattening of the villi and markedly increased PAS‐positive staining of lamina propria macrophages are strongly suggestive of the diagnosis. PAS‐positive staining is not unique to T. whipplei, however. In patients with profound immunodeficiency, Mycobacterium avium intracellulare may stain positive with PAS. Since Whipple's disease is only rarely associated with HIV, a negative HIV test would favor a diagnosis of Whipple's disease. Electron microscopy may distinguish T. whipplei from its mimickers by morphology. For extraintestinal disease, PCR testing on samples from infected tissue has been found to be a reliable diagnostic aid.9
Given the rarity of the disease, controlled clinical trials addressing optimal treatment are lacking. Current recommendations include initial therapy for 14 days with an agent that crosses the blood‐brain barrier (eg, ceftriaxone) to reduce the incidence of CNS disease. This is then followed by a year or more of oral antimicrobial therapy with trimethoprim‐sulfamethoxazole or a tetracycline.9 While most patients respond within 2 to 3 weeks, relapse may occur in as many as one‐third of patients.
Historical case reports reinforce the case‐based learning paradigm. As the discussant remarks, observation was all too often the only recourse for physicians a century ago. In recounting the 7‐year progression of disease in 1 individual, Whipple provides a unique window into the natural evolution of the key features of this systemic disease. Viewed through the prism of Whipple's eyes, we can recall the striking lymphoid hyperplasia and unusual organisms in the small intestine, cementing our understanding of the pathogenesis of this disorder. Revisiting past cases allows us to learn of and learn from the past.
Teaching Points
-
Whipple's disease should be considered in patients with unexplained arthralgias accompanied by weight loss, malabsorption, and abdominal pain.
-
For suspected intestinal Whipple's disease, diagnosis is best made by duodenal biopsy demonstrating PAS‐positive staining in lamina propria macrophages.
-
Systemic manifestations of Whipple's disease include culture‐negative endocarditis and CNS disease. PCR testing of involved sites for T. whipplei is recommended to confirm extraintestinal disease.
- .A hitherto undescribed disease characterized anatomically by deposits of fat and fatty acids in the intestinal and mesenteric lymphatic tissues.Bull Johns Hopkins Hosp.1907;18:382–391.
- .The tinctoral demonstration of a glycoprotein in Whipple's disease.Proc Soc Exp Biol Med.1949;72:225–227.
- ,,.Whipple's disease: clinical, biochemical, and histopathologic features and assessment of treatment in 29 patients.Mayo Clin Proc.1988;63:539–551.
- ,.Combined electron and light microscopy in Whipple's disease: demonstration of “bacillary bodies” in the intestine.Bull Johns Hopkins Hosp.1961;109:80–98.
- ,,,.Phylogeny of the Whipple's disease‐associated bacterium.Lancet.1991;338:474–475.
- ,,,.Identification of the uncultured bacillus of Whipple's disease.N Engl J Med.1992;327:293–301.
- ,,, et al.Cultivation of the bacillus of Whipple's disease.N Engl J Med.2000;342:620–625.
- ,,,.Immunodetection of Tropheryma whipplei in intestinal tissue from Dr. Whipple's 1907 patient.N Engl J Med.2003;348:1411– 1412.
- ,.Whipple's disease.Lancet.2003;361:239–246.
- ,,, et al.Diagnostic guidelines in central nervous system Whipple's disease.Ann Neurol.1996;40:561–568.
- ,,, et al.PCR‐positive tests for Tropheryma whippleii in patients without Whipple's disease.Lancet.1999;353:2214.