User login
Inhaled Insulin: Troubled Drug Rises from the Ashes
Remember all the hype leading up to the approval of the dry-powder formulation of human insulin, produced by means of recombinant DNA technology, a.k.a. inhaled insulin (Exubera)? That was three years ago (January 2006). Remember all the press releases regarding the removal of inhaled insulin from the market? That was October 2007.1,2
Almost immediately after Pfizer “pulled the plug” on inhaled insulin, cases of lung cancer started being reported—albeit it had occurred in Exubera-treated patients that had a history of smoking cigarettes—a contraindication within the drug’s approved label. Some clinicians questioned whether it was due to insulin being a weak growth factor when binding to the type 1 insulin-like growth factor receptor; others wondered if it was related to smoking history.3,4 Three other collaboration efforts for inhaled insulin—NovoNordisk/Aradigm, MannKind, and Alkermes/Eli Lilly AIR insulin— were in the pipeline when Pfizer bowed out of the market. MannKind’s Technosphere insulin and Alkermes/Eli Lilly AIR insulin are still being investigated. Both are in phase 3 clinical trials.5
So, contrary to popular belief, inhaled insulin is not dead, yet. These other companies are looking to improve upon what Pfizer lost out on. The AIR system uses a smaller, breathable inhaler, which would fit into a patient’s hand. The inhaled powder has a smaller particle size and a larger surface area, which provides deeper lung penetration of drug.6
More Drugs Via the Pulmonary Route
Aside from asthma, chronic obstructive pulmonary disease, pulmonary hypertension, and cystic fibrosis, where a hospitalist could expect to use pulmonary delivered drugs, other medicines are being investigated for administration via this route. The pulmonary route may be used for tuberculosis (TB), where lower doses can be given since high doses of systemic therapy lead to significant drug toxicity.7
Inhaled vaccines are being developed, including Bacillus Calmette-Guérin (BCG) TB and respiratory syncytial virus (RSV). Parathyroid hormone for osteoporosis, human factor IX for hemophilia, and interferon α-2b for hepatitis B virus, are potential and current inhaled treatments.
New Delivery Systems: Will They Pan Out?
Knowing the lung absorbs biologic drugs with a wide range of molecular weights, solubility, and charges, is a plus for pulmonary delivery. However, pulmonary drug delivery also presents challenges. These include local toxic effects, such as cell injury, edema, and altered tissue defenses. Drug carriers, preservatives, and propellants, such as sulfites, might harm pulmonary tissue or the body.
Safety is one of the biggest concerns when companies develop new drug delivery systems. These inhaled products and methods of delivering inhaled insulin are quickly moving through clinical trials.
Only time will tell when approvals will take place, but it looks as though there will be some innovative insulin products in the near future. TH
Michele B Kaufman, PharmD, BSc, RPh, is a freelance medical writer based in New York City.
References
1. Alvey L. U.S. Food and Drug Administration. FDA ap-proves first ever inhaled insulin combination product for treatment of diabetes. www.fda.gov/bbs/topics/ news/2006/NEW01304.html. Published Jan. 27, 2006. Accessed Dec. 1, 2008.
2. U.S. Food and Drug Administration. Drug discontinuations. www.fda.gov/cder/drug/shortages/#disc. Published Oct. 19, 2007. Accessed Dec. 1, 2008.
3. von Kriegstein E, von Kriegstein K. Inhaled insulin for diabetes. N Engl J Med. 2007;356:2106-2108.
4. McMahon GT, Arky RA. Inhaled insulin for diabetes. N Engl J Med. 2007;356:497-502.
5. Opar A. Another blow for inhaled protein therapeutics. Nat Rev Drug Discov. 2008;7:189-190.
6. Dubin CH. The state of systemic pulmonary delivery: one year after Exubera’s approval. Nat Rev Drug Discov. 2007;7(4):61-67.
7. Greb E. Inhalable drugs in the launch pad: will they take off? Pharm Tech. 2008;4:48-55.
8. Riley K, Long P. FDA approves treatment for rare neurologic disease. www.fda.gov/bbs/topics/ NEWS/2008/NEW01884.html. Published Sept. 12, 2008. Accessed Dec. 1, 2008.
9. Keppra XR approved in the U.S. hugin.info/133973/ R/1251192/271964.pdf. Published Sept. 15, 2008. Accessed Sept. 15, 2008.
10. U.S. Food and Drug Administration. 2008 safety alerts for human medical products (drugs, biologics, medical devices, special nutritionals, and cosmetics). www.fda.gov/medwatch/safety/2008/rituxan_DHCP_Final%209411700.pdf Published Sept. 2008. Accessed Sept. 15, 2008.
11. U.S. Food and Drug Administration. Pregnacy and lactation labeling. www.fda.gov/cder/regulatory/ pregnancy_labeling/default.htm Published June 11, 2008. Accessed Sept. 15, 2008.
12. Cruzan S. U.S. Food and Drug Administration. FDA proposes new rule to provide updated information on the use of prescription drugs and biological products during pregnancy and breast-feeding. www. fda.gov/bbs/topics/NEWS/2008/NEW018 41.html. Published May 28, 2008. Accessed Sept. 15, 2008.
13. Peggy P. FDA to take A, B, and C out of pregnancy labeling. www.medpagetoday.com/OBGYN/Pregnancy/ tb/9626. Published May 28, 2008. Accessed Sept. 15, 2008.
JUPITER to Earth: A statin helps people with normal LDL-C and high hs-CRP, but what does it mean?
The medical community has struggled with two important questions for the past 10 years: When it comes to the low-density lipoprotein cholesterol (LDL-C) level, how low should one go and at what cost? And are there other markers of risk that can identify a higher-risk subpopulation in relatively healthy people? The JUPITER trial (Justification for the Use of Statins in Prevention: an Intervention Trial Evaluating Rosuvastatin) provided partial answers for these questions by finding that a highly potent statin lowered the risk of cardiovascular events in patients with “normal” LDL-C but elevated levels of high-sensitivity C-reactive protein (hs-CRP).1
In this article, we will critically evaluate the methods, results, and conclusions of the JUPITER trial. Additionally, we will discuss its limitations and areas of uncertainty.
BEFORE JUPITER
The LDL-C-lowering drugs called statins have revolutionized cardiovascular medicine.2 They are beneficial in both the primary prevention setting and in acute coronary syndromes, stable angina, and unstable angina and can halt the progression of coronary artery disease—in some cases even resulting in modest regression of plaque.3–6
Many experts have credited the reduction in LDL-C as being the sole factor responsible for the decrease in major adverse events seen with statin therapy.7 However, statins have other, non-lipid-lowering properties, including anti-inflammatory and antioxidant effects, that may also contribute to their benefits.8–15
One of the anti-inflammatory actions of statins is evidenced by lower levels of the acute-phase reactant CRP.10,11,15,16 Measuring systemic CRP levels with a highly sensitive assay (yielding the so-called high-sensitivity or hs-CRP level) provides significant clinical prognostic value across a spectrum of clinical situations, ranging from risk screening in apparently healthy people to stable and unstable angina.17–22 People with higher hs-CRP levels are, on average, at higher risk of adverse cardiovascular events. However, controversy remains as to whether hs-CRP plays a mechanistic role in plaque formation and acute complications. Indeed, recent genetic studies argue strongly that hs-CRP lies outside the mechanistic path of atherosclerosis.23 Nonetheless, an overwhelming amount of data indicates that hs-CRP serves as a marker of disease.17–21
Nissen et al10 showed that the rate of progression of atherosclerosis is lower when the levels of atherogenic lipoproteins and hs-CRP are both lowered with statin therapy. Simultaneously, Ridker et al11 showed that patients who have lower hs-CRP levels after statin therapy have better clinical outcomes than those with higher hs-CRP levels, regardless of their achieved level of LDL-C.
Collectively, these studies and others have led some to believe that, in people with relatively low LDL-C but persistently elevated hs-CRP, statin therapy may reduce the rate of events.15,24 The JUPITER trial was undertaken to test this hypothesis.
JUPITER STUDY DESIGN
JUPITER was designed to see whether highly potent statin therapy is beneficial in people with elevated hs-CRP who otherwise do not meet the criteria for lipid-lowering therapy. The study was conducted at 1,315 sites in 26 countries. It was sponsored by AstraZeneca, the maker of rosuvastatin (Crestor).
Inclusion and exclusion criteria
All participants had to be free of known cardiovascular disease, have an LDL-C level lower than 130 mg/dL, and have an hs-CRP level of 2.0 mg/L or greater. Patients were excluded if they were previous or current users of lipid-lowering drugs; had severe arthritis, lupus, or inflammatory bowel disease; or were taking immune-modulating drugs such as cyclosporine (Sandimmune, others), tacrolimus (Prograf), azathioprine (Azasan, Imuran), or long-term oral corticosteroids.
Rosuvastatin therapy
Participants were randomly assigned in a 1:1 ratio to receive rosuvastatin 20 mg daily or a matching placebo in a double-blind fashion.
End points
The primary end point was the composite of nonfatal myocardial infarction, nonfatal stroke, hospitalization for unstable angina, an arterial revascularization procedure, or confirmed death from cardiovascular causes. Secondary end points were the individual components of the primary end point.
Statistical analysis
The study was powered to detect a 25% reduction in the primary end point among those treated with rosuvastatin. The trial was designed to run until 520 end point events had occurred. However, on March 29, 2008, after the first prespecified interim analysis, the Data and Safety Monitoring Board stopped the trial due to a significant reduction in the primary end point in the rosuvastatin group. As in most randomized clinical trials, all analyses were done on an intention-to-treat basis. Prespecified subgroup analyses were also performed.
STUDY RESULTS
Patient recruitment and eligibility
Between February 4, 2003, and December 15, 2006, a total of 89,890 people were screened. Of these, 17,802 met the inclusion and exclusion criteria and were included in the study. Of the 72,088 people who were excluded, 25,993 (36.1%) had an hs-CRP level below 2 mg/L and 37,611 (52.2%) had an LDL-C level of 130 mg/dL or higher.
A not-so-healthy population
The aim of the investigators was to include relatively healthy people. The median age was 66 years, about 16% of participants were current smokers, about 11% had a family history of heart disease, and about 41% met the criteria for metabolic syndrome, all conditions that are associated with elevated hs-CRP.25 Of note, the median hs-CRP level was 4.2 mg/L, a level indicating higher global risk according to the American College of Cardiology/American Heart Association consensus statement.26
Reduction in lipid levels and hs-CRP
By 12 months, in the rosuvastatin group, the median LDL-C level had fallen by 50% (from 108 to 55 mg/dL), and the median hs-CRP level had fallen by 37% (from 4.2 to 2.2 mg/L). Additionally, the triglyceride level had fallen by 17%. The high-density lipoprotein cholesterol levels did not change significantly.
Impact on end points
Adverse events
WHAT DOES THIS MEAN?
Is lower LDL-C better?
The JUPITER trial is the latest of several statin trials that have shown significant reductions in major adverse cardiovascular events when LDL-C was lowered below what has been recommended by the current guidelines.27,28
In 2002, the Heart Protection Study29 showed a significant reduction in major adverse cardiovascular events in patients at high risk of coronary artery disease if they received simvastatin (Zocor), even if they had LDL-C levels lower than 100 mg/dL at baseline. Similarly, the Pravastatin or Atorvastatin Evaluation and Infection-Thrombolysis in Myocardial Infarction 22 (PROVE-IT TIMI 22) trial30 showed a 16% relative risk reduction in a composite end point in patients presenting with acute coronary syndrome if they received intensive statin therapy.
These two studies led to an update by the National Cholesterol Education Program (Adult Treatment Panel III), suggesting an optimal LDL-C goal of less than 70 mg/dL in those with coronary artery disease or its risk equivalent (ie, diabetes mellitus, peripheral vascular disease). Furthermore, in support of the “lower is better” theory, a number of studies that used intravascular ultrasonography have shown regression of coronary plaque with aggressive LDL-C lowering. Notably, in a Study to Evaluate the Effect of Rosuvastatin on Intravascular Ultrasound-Derived Coronary Atheroma Burden (the ASTEROID trial),5 rosuvastatin 40 mg daily caused significant plaque regression while lowering LDL-C to 61 mg/dL over a 24-month period.
A number of high-dose statin trials have shown that lowering LDL-C to less than 70 mg/dL significantly reduces major adverse cardiovascular events.31–39 The JUPITER trial was unique in that it extended these findings to people without known coronary disease (ie, primary prevention) or elevated cholesterol but with elevated levels of a marker of inflammation—hs-CRP. In view of the JUPITER results and of studies using intravascular ultrasonography in the primary prevention setting, it seems clear that lowering LDL-C to levels less than 70 mg/dL also reduces both atherosclerotic plaque progression and the rate of first major adverse cardiovascular events in primary prevention in patients at higher global risk.
Did the study prove that reducing hs-CRP lowers risk?
Measuring hs-CRP levels has been extensively studied in apparently healthy populations, stable angina, unstable angina, and other cardiovascular settings.18,21,40–43 It has been shown to have significant prognostic implications in a number of primary and secondary trials.44 Additionally, those with elevated LDL-C and hs-CRP levels benefit the most from statin therapy.16,45,46 Animal studies have also provided some evidence that CRP may play a role in atherogenesis.47,48 However, recent clinical and genetic studies have raised doubt about the direct causal relationship between CRP and coronary artery disease,23,49,50 and epidemiologic studies have questioned its usefulness as a marker of risk.51,52
The JUPITER study adds little to clear up the controversy about whether hs-CRP is a mechanistic participant in atherosclerotic disease. However, it also shows that this issue is somewhat irrelevant, in that selection of patients for high-potency statin therapy solely on the basis of high hs-CRP without other indications for lipid-lowering therapy clearly reduces risk and improves survival.
JUPITER did not examine whether people with higher hs-CRP levels benefited more from statin therapy than those with lower levels. The hypothesis-generating data for JUPITER came from an analysis of changes in hs-CRP and LDL-C in the Air Force/Texas Coronary Atherosclerosis Prevention Study (AFCAPS/TexCAPS).16 Thus, JUPITER did not include people with both low LDL-C and low hs-CRP because, in the AFCAPS/TexCAPS analysis, those with low LDL-C and low hs-CRP had extremely low event rates and no clinical efficacy of statin therapy, despite good LDL-C reduction. In marked contrast, those with low LDL-C but elevated hs-CRP had high event rates and large relative risk reductions— hence the need for JUPITER to prospectively test this hypothesis. Nevertheless, the initial results of JUPITER as presented do not yet make it clear that there is a dose-response relationship between higher levels of hs-CRP and a greater reduction in events, even in a cohort with elevated hs-CRP at baseline. This analysis will no doubt be forthcoming in another manuscript from Ridker and colleagues. Specifically, it will be of interest to examine whether those with the highest hs-CRP levels benefited the most from rosuvastatin on both an absolute and relative scale, and whether those with the greatest hs-CRP reduction also benefited more. With the present data available from JUPITER, a reasonable interpretation is that an elevated hs-CRP simply widens the inclusion criterion for those for whom high-potency statin therapy improves clinical outcomes.53
Better markers are needed
Even with a nonspecific marker such as hs-CRP, patients at higher global risk and with LDL-C below the recommended levels could be identified and treated aggressively. This benefit, however, required that approximately 100 people be treated with rosuvastatin for 2 years to prevent one event. Additionally, only 20% of all patients screened were eligible for the trial. Therefore, one could argue that its generalizability is limited.
Markers of risk that are more specific and sensitive are needed to identify people at higher global risk who would otherwise be considered to be at low risk with the current risk assessment tools. A number of such inflammatory and oxidative markers are under development.54–60
Absolute vs relative risk reduction and the public health burden
The 44% reduction in the number of primary end point events in the rosuvastatin group was considerable in relative terms. However, in absolute terms, 95 people had to be treated for up to 2 years in order to prevent one event.53 In making recommendations, the United States Department of Health and Human Services has to consider the clinical benefit of a test or a drug in light of its cost. With health care costs increasing, many agencies are refusing to pay for therapies on the basis of cost or small absolute benefit.
While we do not have the answer as to whether treating 95 people for 2 years to see one benefit is cost-effective, one thing is clear: the field of medicine is in desperate need of a better way to identify individuals who may benefit from a test or therapy.61 Additionally, we think it is important to note that the “numbers-needed-to-treat” (95 at 2 years and 25 at 5 years) derived from JUPITER are actually smaller than the values observed in the AFCAPS/TexCAPS and the West of Scotland Coronary Prevention Study.62,63 This suggests that statin therapy is at least as cost-effective in those with elevated hs-CRP as in those with elevated LDL-C. Even our most robust therapies are effective in only a minority of patients treated.61
Should ‘healthy’ people be tested for hs-CRP?
In 2003, we wrote in this journal21 that measuring hs-CRP may add to the current risk-prediction models by identifying people at increased risk who would otherwise not be considered as such by current risk models. The US Centers for Disease Control and Prevention and the American Heart Association have also stated that measuring hs-CRP in those at intermediate risk may be reasonable.26
The JUPITER investigators intended to study a relatively healthy population, but, as we mentioned, a close look at the cohort’s baseline characteristics indicates a substantial proportion met the criteria for metabolic syndrome. Therefore, one could challenge whether we really need hs-CRP in such a population to identify who will benefit from statin therapy.
We agree with the recommendation from the Centers for Disease Control and Prevention and the American Heart Association that measuring hs-CRP in people at intermediate risk is a reasonable option.26 We also believe that hs-CRP should be tested as a secondary risk factor, in combination with blood pressure, lipids, diabetes, smoking, serum creatinine, and fasting blood glucose. Factors such as obesity, sedentary lifestyle, family history of heart disease, and emotional and physical stress should also be considered.
Safety of high-dose statin therapy
High-dose statin therapy has been well tolerated in clinical trials, but rates of discontinuation have been higher (7%–10%) than with moderate-dose therapy (4%–5%).64 Fortunately, the rates of serious adverse events have in general been low. For example, with simvastatin 80 mg, the rates of myopathy and rhabdomyolysis were quite low.31
Rates of elevations in serum alanine aminotransferase (ALT) and aspartate aminotransferase (AST) with high-dose statin therapy have been reported to be below 1.3%. Studies have shown that reducing LDL-C to below 100 mg/dL is associated with a higher incidence of ALT and AST elevations. However, these elevations have usually been benign and often return to normal when the drug is reduced in dose or withdrawn.
In previous studies of rosuvastatin,65 the incidence of myopathy and liver function abnormalities was less than 0.1%. Rates of proteinuria were similarly low, and in many patients renal function actually improved on rosuvastatin.66,67 Furthermore, rosuvastatin may have different pharmacokinetic properties than atorvastatin (Lipitor) and simvastatin, which may result in a lower incidence of musculoskeletal toxicity.68,69
In general, the incidence of cancer has been similar in those treated with high-dose statins and those treated with placebo. The Treating to New Targets trial70 suggested that the incidence of cancer was higher with atorvastatin 80 mg daily than with 20 mg daily. However, a meta-analysis of 14 trials of moderate-dose statin therapy did not show any evidence of increased cancer rates with these agents.70 Indeed, in JUPITER, there was a reduction in cancer-related mortality rates, which could have been due to chance.
The JUPITER trial also showed an increase in the physician-reported incidence of diabetes mellitus with rosuvastatin. This is an important finding, and it may be a class effect because modest increases have similarly been reported with other statins in other major trials, eg, with pravastatin (Pravachol) in PROSPER, simvastatin in the Heart Protection Study, and atorvastatin in PROVE-IT. However, even in those with diabetes or impaired fasting glucose, the reduction in the rate of major adverse events is significant. For example, in JUPITER, almost all of the cases of “incident diabetes” were in those with impaired fasting glucose at baseline, and this group had nearly a 50% reduction in rates of myocardial infarction, stroke, and cardiovascular death. Therefore, on balance, the modest risk of earlier diagnosis of diabetes with statin therapy seems substantially offset by the marked reduction in rates of major adverse cardiovascular events in people with diabetes and impaired fasting glucose on statin therapy.
TAKE-HOME POINTS
The JUPITER trial, like previous high-dose statin trials, calls into question whether current LDL-C guidelines are appropriate for people at higher global risk with otherwise “normal” LDL-C levels.27,28 This trial heralds a new era in preventive therapy because it extends beyond LDL-C as an indication for statin therapy within the primary prevention setting. Statins have revolutionized the therapy of cardiovascular disease, and they continue to show benefit even in the “healthy.”
Clearly, hs-CRP serves as a nonlipid marker to identify those who may benefit from statin therapy. Nonetheless, more specific and sensitive markers (or panels) of cardiovascular risk are necessary. In the future, we will need markers that not only identify people at higher global risk, but that also tell us who would benefit from certain medical or surgical therapies. Elevated hs-CRP in a patient who otherwise would not be a candidate for statin therapy should trigger a reassessment of the risks vs benefits of statin therapy—JUPITER teaches us that statin therapy will benefit these patients.
Aggressive lifestyle modification that encompasses a balanced diet, routine exercise, and smoking cessation should be applied in both primary and secondary prevention. Additionally, risk factors such as elevated blood pressure and hyperlipidemia should be aggressively treated with appropriate medications.
- Ridker PM, Danielson E, Fonseca FA, et al. Rosuvastatin to prevent vascular events in men and women with elevated C-reactive protein. N Engl J Med 2008; 359:2195–2207.
- Topol EJ. Intensive statin therapy—a sea change in cardiovascular prevention. N Engl J Med 2004; 350:1562–1564.
- Cannon CP, Murphy SA, Braunwald E. Intensive lipid lowering with atorvastatin in coronary disease. N Engl J Med 2005; 353:93–96.
- Cohen DJ, Carrozza JP, Baim DS. Aggressive lipid-lowering therapy compared with angioplasty in stable coronary artery disease. N Engl J Med 1999; 341:1853–1854.
- Nissen SE, Nicholls SJ, Sipahi I, et al. Effect of very high-intensity statin therapy on regression of coronary atherosclerosis: the ASTEROID trial. JAMA 2006; 295:1556–1565.
- Nissen SE, Tuzcu EM, Schoenhagen P, et al. Effect of intensive compared with moderate lipid-lowering therapy on progression of coronary atherosclerosis: a randomized controlled trial. JAMA 2004; 291:1071–1080.
- Robinson JG, Smith B, Maheshwari N, Schrott H. Pleiotropic effects of statins: benefit beyond cholesterol reduction? A meta-regression analysis. J Am Coll Cardiol 2005; 46:1855–1862.
- Aikawa M, Rabkin E, Sugiyama S, et al. An HMG-CoA reductase inhibitor, cerivastatin, suppresses growth of macrophages expressing matrix metalloproteinases and tissue factor in vivo and in vitro. Circulation 2001; 103:276–283.
- Liao JK. Effects of statins on 3-hydroxy-3-methylglutaryl coenzyme a reductase inhibition beyond low-density lipoprotein cholesterol. Am J Cardiol 2005; 96:24F–33F.
- Nissen SE, Tuzcu EM, Schoenhagen P, et al. Statin therapy, LDL cholesterol, C-reactive protein, and coronary artery disease. N Engl J Med 2005; 352:29–38.
- Ridker PM, Cannon CP, Morrow D, et al. C-reactive protein levels and outcomes after statin therapy. N Engl J Med 2005; 352:20–28.
- Shishehbor MH, Aviles RJ, Brennan ML, et al. Association of nitrotyrosine levels with cardiovascular disease and modulation by statin therapy. JAMA 2003; 289:1675–1680.
- Shishehbor MH, Brennan ML, Aviles RJ, et al. Statins promote potent systemic antioxidant effects through specific inflammatory pathways. Circulation 2003; 108:426–431.
- Takemoto M, Liao JK. Pleiotropic effects of 3-hydroxy-3-methylglutaryl coenzyme a reductase inhibitors. Arterioscler Thromb Vasc Biol 2001; 21:1712–1719.
- Shishehbor MH, Patel T, Bhatt DL. Using statins to treat inflammation in acute coronary syndromes: Are we there yet? Cleve Clin J Med 2006; 73:760–766.
- Ridker PM, Rifai N, Clearfield M, et al. Measurement of C-reactive protein for the targeting of statin therapy in the primary prevention of acute coronary events. N Engl J Med 2001; 344:1959–1965.
- Ridker PM, Buring JE, Shih J, Matias M, Hennekens CH. Prospective study of C-reactive protein and the risk of future cardiovascular events among apparently healthy women. Circulation 1998; 98:731–733.
- Ridker PM, Hennekens CH, Buring JE, Rifai N. C-reactive protein and other markers of inflammation in the prediction of cardiovascular disease in women. N Engl J Med 2000; 342:836–843.
- Ridker PM, Stampfer MJ, Rifai N. Novel risk factors for systemic atherosclerosis: a comparison of C-reactive protein, fibrinogen, homocysteine, lipoprotein(a), and standard cholesterol screening as predictors of peripheral arterial disease. JAMA 2001; 285:2481–2485.
- Rifai N, Ridker PM. High-sensitivity C-reactive protein: a novel and promising marker of coronary heart disease. Clin Chem 2001; 47:403–411.
- Shishehbor MH, Bhatt DL, Topol EJ. Using C-reactive protein to assess cardiovascular disease risk. Cleve Clin J Med 2003; 70:634–640.
- Ridker PM, Cushman M, Stampfer MJ, Tracy RP, Hennekens CH. Inflammation, aspirin, and the risk of cardiovascular disease in apparently healthy men. N Engl J Med 1997; 336:973–979.
- Zacho J, Tybjaerg-Hansen A, Jensen JS, Grande P, Sillesen H, Nordestgaard BG. Genetically elevated C-reactive protein and ischemic vascular disease. N Engl J Med 2008; 359:1897–1908.
- Ridker PM. Are statins anti-inflammatory? Issues in the design and conduct of the pravastatin inflammation C-reactive protein evaluation. Curr Cardiol Rep 2000; 2:269–273.
- Ridker PM, Buring JE, Cook NR, Rifai N. C-reactive protein, the metabolic syndrome, and risk of incident cardiovascular events: an 8-year follow-up of 14 719 initially healthy American women. Circulation 2003; 107:391–397.
- Pearson TA, Mensah GA, Alexander RW, et al. Markers of inflammation and cardiovascular disease: application to clinical and public health practice: a statement for healthcare professionals from the Centers for Disease Control and Prevention and the American Heart Association. Circulation 2003; 107:499–511.
- Executive Summary of the Third Report of the National Cholesterol Education Program (NCEP) Expert Panel on Detection, Evaluation, And Treatment of High Blood Cholesterol In Adults (Adult Treatment Panel III). JAMA 2001; 285:2486–2497.
- Grundy SM, Cleeman JI, Merz CN, et al. Implications of recent clinical trials for the National Cholesterol Education Program Adult Treatment Panel III guidelines. Circulation 2004; 110:227–239.
- Collins R, Peto R, Armitage J. The MRC/BHF Heart Protection Study: preliminary results. Int J Clin Pract 2002; 56:53–56.
- Cannon CP, Braunwald E, McCabe CH, et al. Intensive versus moderate lipid lowering with statins after acute coronary syndromes. N Engl J Med 2004; 350:1495–1504.
- de Lemos JA, Blazing MA, Wiviott SD, et al. Early intensive vs a delayed conservative simvastatin strategy in patients with acute coronary syndromes: phase Z of the A to Z trial. JAMA 2004; 292:1307–1316.
- LaRosa JC, Grundy SM, Waters DD, et al. Intensive lipid lowering with atorvastatin in patients with stable coronary disease. N Engl J Med 2005; 352:1425–1435.
- Liem AH, van Boven AJ, Veeger NJ, et al. Effect of fluvastatin on ischaemia following acute myocardial infarction: a randomized trial. Eur Heart J 2002; 23:1931–1937.
- Pedersen TR, Faergeman O, Kastelein JJ, et al. High-dose atorvastatin vs usual-dose simvastatin for secondary prevention after myocardial infarction: the IDEAL study: a randomized controlled trial. JAMA 2005; 294:2437–2445.
- Pitt B, Waters D, Brown WV, et al. Aggressive lipid-lowering therapy compared with angioplasty in stable coronary artery disease. Atorvastatin versus Revascularization Treatment Investigators. N Engl J Med 1999; 341:70–76.
- Ray KK, Cannon CP, McCabe CH, et al. Early and late benefits of highdose atorvastatin in patients with acute coronary syndromes: results from the PROVE IT-TIMI 22 trial. J Am Coll Cardiol 2005; 46:1405–1410.
- Schwartz GG, Olsson AG, Ezekowitz MD, et al. Effects of atorvastatin on early recurrent ischemic events in acute coronary syndromes: the MIRACL study: a randomized controlled trial. JAMA 2001; 285:1711–1718.
- Serruys PW, de Feyter P, Macaya C, et al. Fluvastatin for prevention of cardiac events following successful first percutaneous coronary intervention: a randomized controlled trial. JAMA 2002; 287:3215–3222.
- Patel TN, Shishehbor MH, Bhatt DL. A review of high-dose statin therapy: targeting cholesterol and inflammation in atherosclerosis. Eur Heart J 2007; 28:664–672.
- Ridker PM. Novel risk factors and markers for coronary disease. Adv Intern Med 2000; 45:391–418.
- Ridker PM. High-sensitivity C-reactive protein: potential adjunct for global risk assessment in the primary prevention of cardiovascular disease. Circulation 2001; 103:1813–1818.
- Ridker PM, Glynn RJ, Hennekens CH. C-reactive protein adds to the predictive value of total and HDL cholesterol in determining risk of first myocardial infarction. Circulation 1998; 97:2007–2011.
- Cushman M, Arnold AM, Psaty BM, et al. C-reactive protein and the 10-year incidence of coronary heart disease in older men and women: the cardiovascular health study. Circulation 2005; 112:25–31.
- Ridker PM. C-reactive protein and the prediction of cardiovascular events among those at intermediate risk: moving an inflammatory hypothesis toward consensus. J Am Coll Cardiol 2007; 49:2129–2138.
- Albert MA, Danielson E, Rifai N, Ridker PM. Effect of statin therapy on C-reactive protein levels: the pravastatin inflammation/CRP evaluation (PRINCE): a randomized trial and cohort study. JAMA 2001; 286:64–70.
- Ridker PM, Rifai N, Pfeffer MA, Sacks F, Braunwald E. Long-term effects of pravastatin on plasma concentration of C-reactive protein. The Cholesterol and Recurrent Events (CARE) Investigators. Circulation 1999; 100:230–235.
- Bisoendial RJ, Kastelein JJ, Levels JH, et al. Activation of inflammation and coagulation after infusion of C-reactive protein in humans. Circ Res 2005; 96:714–716.
- Schwedler SB, Amann K, Wernicke K, et al. Native C-reactive protein increases whereas modified C-reactive protein reduces atherosclerosis in apolipoprotein E-knockout mice. Circulation 2005; 112:1016–1023.
- Pfister R, Hellmich M. Multiple biomarkers and cardiovascular risk. N Engl J Med 2008; 359:760.
- Schunkert H, Samani NJ. Elevated C-reactive protein in atherosclerosis— chicken or egg? N Engl J Med 2008; 359:1953–1955.
- Danesh J, Wheeler JG, Hirschfield GM, et al. C-reactive protein and other circulating markers of inflammation in the prediction of coronary heart disease. N Engl J Med 2004; 350:1387–1397.
- Kushner I, Sehgal AR. Is high-sensitivity C-reactive protein an effective screening test for cardiovascular risk? Arch Intern Med 2002; 162:867–869.
- Hlatky MA. Expanding the orbit of primary prevention—moving beyond JUPITER. N Engl J Med 2008; 359:2280–2282.
- Shishehbor MH, Hazen SL. Inflammatory and oxidative markers in atherosclerosis: relationship to outcome. Curr Atheroscler Rep 2004; 6:243–250.
- Nicholls SJ, Hazen SL. Myeloperoxidase and cardiovascular disease. Arterioscler Thromb Vasc Biol 2005; 25:1102–1111.
- Bhattacharyya T, Nicholls SJ, Topol EJ, et al. Relationship of paraoxonase 1 (PON1) gene polymorphisms and functional activity with systemic oxidative stress and cardiovascular risk. JAMA 2008; 299:1265–1276.
- Choi SH, Chae A, Miller E, et al. Relationship between biomarkers of oxidized low-density lipoprotein, statin therapy, quantitative coronary angiography, and atheroma: volume observations from the REVERSAL (Reversal of Atherosclerosis with Aggressive Lipid Lowering) study. J Am Coll Cardiol 2008; 52:24–32.
- Hakonarson H, Thorvaldsson S, Helgadottir A, et al. Effects of a 5-lipoxygenase-activating protein inhibitor on biomarkers associated with risk of myocardial infarction: a randomized trial. JAMA 2005; 293:2245–2256.
- Ky B, Burke A, Tsimikas S, et al. The influence of pravastatin and atorvastatin on markers of oxidative stress in hypercholesterolemic humans. J Am Coll Cardiol 2008; 51:1653–1662.
- Levy AP, Levy JE, Kalet-Litman S, et al. Haptoglobin genotype is a determinant of iron, lipid peroxidation, and macrophage accumulation in the atherosclerotic plaque. Arterioscler Thromb Vasc Biol 2007; 27:134–140.
- Mukherjee D, Topol EJ. Pharmacogenomics in cardiovascular diseases. Curr Probl Cardiol 2003; 28:317–347
- West of Scotland Coronary Prevention Study: identification of highrisk groups and comparison with other cardiovascular intervention trials. Lancet 1996; 348:1339–1342.
- Downs JR, Clearfield M, Weis S, et al. Primary prevention of acute coronary events with lovastatin in men and women with average cholesterol levels: results of AFCAPS/TexCAPS. Air Force/Texas Coronary Atherosclerosis Prevention Study. JAMA 1998; 279:1615–1622.
- Davidson MH, Robinson JG. Safety of aggressive lipid management. J Am Coll Cardiol 2007; 49:1753–1762.
- Davidson MH. Rosuvastatin safety: lessons from the FDA review and post-approval surveillance. Expert Opin Drug Saf 2004; 3:547–557.
- Kasiske BL, Wanner C, O’Neill WC. An assessment of statin safety by nephrologists. Am J Cardiol 2006; 97:82C–85C.
- McTaggart F, Buckett L, Davidson R, et al. Preclinical and clinical pharmacology of rosuvastatin, a new 3-hydroxy-3-methylglutaryl coenzyme A reductase inhibitor. Am J Cardiol 2001; 87:28B–32B.
- Jacobson TA. Statin safety: lessons from new drug applications for marketed statins. Am J Cardiol 2006; 97:44C–51C.
- Jacobson TA. Comparative pharmacokinetic interaction profiles of pravastatin, simvastatin, and atorvastatin when coadministered with cytochrome P450 inhibitors. Am J Cardiol 2004; 94:1140–1146.
- Baigent C, Keech A, Kearney PM, et al. Efficacy and safety of cholesterol-lowering treatment: prospective meta-analysis of data from 90,056 participants in 14 randomised trials of statins. Lancet 2005; 366:1267–1278.
The medical community has struggled with two important questions for the past 10 years: When it comes to the low-density lipoprotein cholesterol (LDL-C) level, how low should one go and at what cost? And are there other markers of risk that can identify a higher-risk subpopulation in relatively healthy people? The JUPITER trial (Justification for the Use of Statins in Prevention: an Intervention Trial Evaluating Rosuvastatin) provided partial answers for these questions by finding that a highly potent statin lowered the risk of cardiovascular events in patients with “normal” LDL-C but elevated levels of high-sensitivity C-reactive protein (hs-CRP).1
In this article, we will critically evaluate the methods, results, and conclusions of the JUPITER trial. Additionally, we will discuss its limitations and areas of uncertainty.
BEFORE JUPITER
The LDL-C-lowering drugs called statins have revolutionized cardiovascular medicine.2 They are beneficial in both the primary prevention setting and in acute coronary syndromes, stable angina, and unstable angina and can halt the progression of coronary artery disease—in some cases even resulting in modest regression of plaque.3–6
Many experts have credited the reduction in LDL-C as being the sole factor responsible for the decrease in major adverse events seen with statin therapy.7 However, statins have other, non-lipid-lowering properties, including anti-inflammatory and antioxidant effects, that may also contribute to their benefits.8–15
One of the anti-inflammatory actions of statins is evidenced by lower levels of the acute-phase reactant CRP.10,11,15,16 Measuring systemic CRP levels with a highly sensitive assay (yielding the so-called high-sensitivity or hs-CRP level) provides significant clinical prognostic value across a spectrum of clinical situations, ranging from risk screening in apparently healthy people to stable and unstable angina.17–22 People with higher hs-CRP levels are, on average, at higher risk of adverse cardiovascular events. However, controversy remains as to whether hs-CRP plays a mechanistic role in plaque formation and acute complications. Indeed, recent genetic studies argue strongly that hs-CRP lies outside the mechanistic path of atherosclerosis.23 Nonetheless, an overwhelming amount of data indicates that hs-CRP serves as a marker of disease.17–21
Nissen et al10 showed that the rate of progression of atherosclerosis is lower when the levels of atherogenic lipoproteins and hs-CRP are both lowered with statin therapy. Simultaneously, Ridker et al11 showed that patients who have lower hs-CRP levels after statin therapy have better clinical outcomes than those with higher hs-CRP levels, regardless of their achieved level of LDL-C.
Collectively, these studies and others have led some to believe that, in people with relatively low LDL-C but persistently elevated hs-CRP, statin therapy may reduce the rate of events.15,24 The JUPITER trial was undertaken to test this hypothesis.
JUPITER STUDY DESIGN
JUPITER was designed to see whether highly potent statin therapy is beneficial in people with elevated hs-CRP who otherwise do not meet the criteria for lipid-lowering therapy. The study was conducted at 1,315 sites in 26 countries. It was sponsored by AstraZeneca, the maker of rosuvastatin (Crestor).
Inclusion and exclusion criteria
All participants had to be free of known cardiovascular disease, have an LDL-C level lower than 130 mg/dL, and have an hs-CRP level of 2.0 mg/L or greater. Patients were excluded if they were previous or current users of lipid-lowering drugs; had severe arthritis, lupus, or inflammatory bowel disease; or were taking immune-modulating drugs such as cyclosporine (Sandimmune, others), tacrolimus (Prograf), azathioprine (Azasan, Imuran), or long-term oral corticosteroids.
Rosuvastatin therapy
Participants were randomly assigned in a 1:1 ratio to receive rosuvastatin 20 mg daily or a matching placebo in a double-blind fashion.
End points
The primary end point was the composite of nonfatal myocardial infarction, nonfatal stroke, hospitalization for unstable angina, an arterial revascularization procedure, or confirmed death from cardiovascular causes. Secondary end points were the individual components of the primary end point.
Statistical analysis
The study was powered to detect a 25% reduction in the primary end point among those treated with rosuvastatin. The trial was designed to run until 520 end point events had occurred. However, on March 29, 2008, after the first prespecified interim analysis, the Data and Safety Monitoring Board stopped the trial due to a significant reduction in the primary end point in the rosuvastatin group. As in most randomized clinical trials, all analyses were done on an intention-to-treat basis. Prespecified subgroup analyses were also performed.
STUDY RESULTS
Patient recruitment and eligibility
Between February 4, 2003, and December 15, 2006, a total of 89,890 people were screened. Of these, 17,802 met the inclusion and exclusion criteria and were included in the study. Of the 72,088 people who were excluded, 25,993 (36.1%) had an hs-CRP level below 2 mg/L and 37,611 (52.2%) had an LDL-C level of 130 mg/dL or higher.
A not-so-healthy population
The aim of the investigators was to include relatively healthy people. The median age was 66 years, about 16% of participants were current smokers, about 11% had a family history of heart disease, and about 41% met the criteria for metabolic syndrome, all conditions that are associated with elevated hs-CRP.25 Of note, the median hs-CRP level was 4.2 mg/L, a level indicating higher global risk according to the American College of Cardiology/American Heart Association consensus statement.26
Reduction in lipid levels and hs-CRP
By 12 months, in the rosuvastatin group, the median LDL-C level had fallen by 50% (from 108 to 55 mg/dL), and the median hs-CRP level had fallen by 37% (from 4.2 to 2.2 mg/L). Additionally, the triglyceride level had fallen by 17%. The high-density lipoprotein cholesterol levels did not change significantly.
Impact on end points
Adverse events
WHAT DOES THIS MEAN?
Is lower LDL-C better?
The JUPITER trial is the latest of several statin trials that have shown significant reductions in major adverse cardiovascular events when LDL-C was lowered below what has been recommended by the current guidelines.27,28
In 2002, the Heart Protection Study29 showed a significant reduction in major adverse cardiovascular events in patients at high risk of coronary artery disease if they received simvastatin (Zocor), even if they had LDL-C levels lower than 100 mg/dL at baseline. Similarly, the Pravastatin or Atorvastatin Evaluation and Infection-Thrombolysis in Myocardial Infarction 22 (PROVE-IT TIMI 22) trial30 showed a 16% relative risk reduction in a composite end point in patients presenting with acute coronary syndrome if they received intensive statin therapy.
These two studies led to an update by the National Cholesterol Education Program (Adult Treatment Panel III), suggesting an optimal LDL-C goal of less than 70 mg/dL in those with coronary artery disease or its risk equivalent (ie, diabetes mellitus, peripheral vascular disease). Furthermore, in support of the “lower is better” theory, a number of studies that used intravascular ultrasonography have shown regression of coronary plaque with aggressive LDL-C lowering. Notably, in a Study to Evaluate the Effect of Rosuvastatin on Intravascular Ultrasound-Derived Coronary Atheroma Burden (the ASTEROID trial),5 rosuvastatin 40 mg daily caused significant plaque regression while lowering LDL-C to 61 mg/dL over a 24-month period.
A number of high-dose statin trials have shown that lowering LDL-C to less than 70 mg/dL significantly reduces major adverse cardiovascular events.31–39 The JUPITER trial was unique in that it extended these findings to people without known coronary disease (ie, primary prevention) or elevated cholesterol but with elevated levels of a marker of inflammation—hs-CRP. In view of the JUPITER results and of studies using intravascular ultrasonography in the primary prevention setting, it seems clear that lowering LDL-C to levels less than 70 mg/dL also reduces both atherosclerotic plaque progression and the rate of first major adverse cardiovascular events in primary prevention in patients at higher global risk.
Did the study prove that reducing hs-CRP lowers risk?
Measuring hs-CRP levels has been extensively studied in apparently healthy populations, stable angina, unstable angina, and other cardiovascular settings.18,21,40–43 It has been shown to have significant prognostic implications in a number of primary and secondary trials.44 Additionally, those with elevated LDL-C and hs-CRP levels benefit the most from statin therapy.16,45,46 Animal studies have also provided some evidence that CRP may play a role in atherogenesis.47,48 However, recent clinical and genetic studies have raised doubt about the direct causal relationship between CRP and coronary artery disease,23,49,50 and epidemiologic studies have questioned its usefulness as a marker of risk.51,52
The JUPITER study adds little to clear up the controversy about whether hs-CRP is a mechanistic participant in atherosclerotic disease. However, it also shows that this issue is somewhat irrelevant, in that selection of patients for high-potency statin therapy solely on the basis of high hs-CRP without other indications for lipid-lowering therapy clearly reduces risk and improves survival.
JUPITER did not examine whether people with higher hs-CRP levels benefited more from statin therapy than those with lower levels. The hypothesis-generating data for JUPITER came from an analysis of changes in hs-CRP and LDL-C in the Air Force/Texas Coronary Atherosclerosis Prevention Study (AFCAPS/TexCAPS).16 Thus, JUPITER did not include people with both low LDL-C and low hs-CRP because, in the AFCAPS/TexCAPS analysis, those with low LDL-C and low hs-CRP had extremely low event rates and no clinical efficacy of statin therapy, despite good LDL-C reduction. In marked contrast, those with low LDL-C but elevated hs-CRP had high event rates and large relative risk reductions— hence the need for JUPITER to prospectively test this hypothesis. Nevertheless, the initial results of JUPITER as presented do not yet make it clear that there is a dose-response relationship between higher levels of hs-CRP and a greater reduction in events, even in a cohort with elevated hs-CRP at baseline. This analysis will no doubt be forthcoming in another manuscript from Ridker and colleagues. Specifically, it will be of interest to examine whether those with the highest hs-CRP levels benefited the most from rosuvastatin on both an absolute and relative scale, and whether those with the greatest hs-CRP reduction also benefited more. With the present data available from JUPITER, a reasonable interpretation is that an elevated hs-CRP simply widens the inclusion criterion for those for whom high-potency statin therapy improves clinical outcomes.53
Better markers are needed
Even with a nonspecific marker such as hs-CRP, patients at higher global risk and with LDL-C below the recommended levels could be identified and treated aggressively. This benefit, however, required that approximately 100 people be treated with rosuvastatin for 2 years to prevent one event. Additionally, only 20% of all patients screened were eligible for the trial. Therefore, one could argue that its generalizability is limited.
Markers of risk that are more specific and sensitive are needed to identify people at higher global risk who would otherwise be considered to be at low risk with the current risk assessment tools. A number of such inflammatory and oxidative markers are under development.54–60
Absolute vs relative risk reduction and the public health burden
The 44% reduction in the number of primary end point events in the rosuvastatin group was considerable in relative terms. However, in absolute terms, 95 people had to be treated for up to 2 years in order to prevent one event.53 In making recommendations, the United States Department of Health and Human Services has to consider the clinical benefit of a test or a drug in light of its cost. With health care costs increasing, many agencies are refusing to pay for therapies on the basis of cost or small absolute benefit.
While we do not have the answer as to whether treating 95 people for 2 years to see one benefit is cost-effective, one thing is clear: the field of medicine is in desperate need of a better way to identify individuals who may benefit from a test or therapy.61 Additionally, we think it is important to note that the “numbers-needed-to-treat” (95 at 2 years and 25 at 5 years) derived from JUPITER are actually smaller than the values observed in the AFCAPS/TexCAPS and the West of Scotland Coronary Prevention Study.62,63 This suggests that statin therapy is at least as cost-effective in those with elevated hs-CRP as in those with elevated LDL-C. Even our most robust therapies are effective in only a minority of patients treated.61
Should ‘healthy’ people be tested for hs-CRP?
In 2003, we wrote in this journal21 that measuring hs-CRP may add to the current risk-prediction models by identifying people at increased risk who would otherwise not be considered as such by current risk models. The US Centers for Disease Control and Prevention and the American Heart Association have also stated that measuring hs-CRP in those at intermediate risk may be reasonable.26
The JUPITER investigators intended to study a relatively healthy population, but, as we mentioned, a close look at the cohort’s baseline characteristics indicates a substantial proportion met the criteria for metabolic syndrome. Therefore, one could challenge whether we really need hs-CRP in such a population to identify who will benefit from statin therapy.
We agree with the recommendation from the Centers for Disease Control and Prevention and the American Heart Association that measuring hs-CRP in people at intermediate risk is a reasonable option.26 We also believe that hs-CRP should be tested as a secondary risk factor, in combination with blood pressure, lipids, diabetes, smoking, serum creatinine, and fasting blood glucose. Factors such as obesity, sedentary lifestyle, family history of heart disease, and emotional and physical stress should also be considered.
Safety of high-dose statin therapy
High-dose statin therapy has been well tolerated in clinical trials, but rates of discontinuation have been higher (7%–10%) than with moderate-dose therapy (4%–5%).64 Fortunately, the rates of serious adverse events have in general been low. For example, with simvastatin 80 mg, the rates of myopathy and rhabdomyolysis were quite low.31
Rates of elevations in serum alanine aminotransferase (ALT) and aspartate aminotransferase (AST) with high-dose statin therapy have been reported to be below 1.3%. Studies have shown that reducing LDL-C to below 100 mg/dL is associated with a higher incidence of ALT and AST elevations. However, these elevations have usually been benign and often return to normal when the drug is reduced in dose or withdrawn.
In previous studies of rosuvastatin,65 the incidence of myopathy and liver function abnormalities was less than 0.1%. Rates of proteinuria were similarly low, and in many patients renal function actually improved on rosuvastatin.66,67 Furthermore, rosuvastatin may have different pharmacokinetic properties than atorvastatin (Lipitor) and simvastatin, which may result in a lower incidence of musculoskeletal toxicity.68,69
In general, the incidence of cancer has been similar in those treated with high-dose statins and those treated with placebo. The Treating to New Targets trial70 suggested that the incidence of cancer was higher with atorvastatin 80 mg daily than with 20 mg daily. However, a meta-analysis of 14 trials of moderate-dose statin therapy did not show any evidence of increased cancer rates with these agents.70 Indeed, in JUPITER, there was a reduction in cancer-related mortality rates, which could have been due to chance.
The JUPITER trial also showed an increase in the physician-reported incidence of diabetes mellitus with rosuvastatin. This is an important finding, and it may be a class effect because modest increases have similarly been reported with other statins in other major trials, eg, with pravastatin (Pravachol) in PROSPER, simvastatin in the Heart Protection Study, and atorvastatin in PROVE-IT. However, even in those with diabetes or impaired fasting glucose, the reduction in the rate of major adverse events is significant. For example, in JUPITER, almost all of the cases of “incident diabetes” were in those with impaired fasting glucose at baseline, and this group had nearly a 50% reduction in rates of myocardial infarction, stroke, and cardiovascular death. Therefore, on balance, the modest risk of earlier diagnosis of diabetes with statin therapy seems substantially offset by the marked reduction in rates of major adverse cardiovascular events in people with diabetes and impaired fasting glucose on statin therapy.
TAKE-HOME POINTS
The JUPITER trial, like previous high-dose statin trials, calls into question whether current LDL-C guidelines are appropriate for people at higher global risk with otherwise “normal” LDL-C levels.27,28 This trial heralds a new era in preventive therapy because it extends beyond LDL-C as an indication for statin therapy within the primary prevention setting. Statins have revolutionized the therapy of cardiovascular disease, and they continue to show benefit even in the “healthy.”
Clearly, hs-CRP serves as a nonlipid marker to identify those who may benefit from statin therapy. Nonetheless, more specific and sensitive markers (or panels) of cardiovascular risk are necessary. In the future, we will need markers that not only identify people at higher global risk, but that also tell us who would benefit from certain medical or surgical therapies. Elevated hs-CRP in a patient who otherwise would not be a candidate for statin therapy should trigger a reassessment of the risks vs benefits of statin therapy—JUPITER teaches us that statin therapy will benefit these patients.
Aggressive lifestyle modification that encompasses a balanced diet, routine exercise, and smoking cessation should be applied in both primary and secondary prevention. Additionally, risk factors such as elevated blood pressure and hyperlipidemia should be aggressively treated with appropriate medications.
- Ridker PM, Danielson E, Fonseca FA, et al. Rosuvastatin to prevent vascular events in men and women with elevated C-reactive protein. N Engl J Med 2008; 359:2195–2207.
- Topol EJ. Intensive statin therapy—a sea change in cardiovascular prevention. N Engl J Med 2004; 350:1562–1564.
- Cannon CP, Murphy SA, Braunwald E. Intensive lipid lowering with atorvastatin in coronary disease. N Engl J Med 2005; 353:93–96.
- Cohen DJ, Carrozza JP, Baim DS. Aggressive lipid-lowering therapy compared with angioplasty in stable coronary artery disease. N Engl J Med 1999; 341:1853–1854.
- Nissen SE, Nicholls SJ, Sipahi I, et al. Effect of very high-intensity statin therapy on regression of coronary atherosclerosis: the ASTEROID trial. JAMA 2006; 295:1556–1565.
- Nissen SE, Tuzcu EM, Schoenhagen P, et al. Effect of intensive compared with moderate lipid-lowering therapy on progression of coronary atherosclerosis: a randomized controlled trial. JAMA 2004; 291:1071–1080.
- Robinson JG, Smith B, Maheshwari N, Schrott H. Pleiotropic effects of statins: benefit beyond cholesterol reduction? A meta-regression analysis. J Am Coll Cardiol 2005; 46:1855–1862.
- Aikawa M, Rabkin E, Sugiyama S, et al. An HMG-CoA reductase inhibitor, cerivastatin, suppresses growth of macrophages expressing matrix metalloproteinases and tissue factor in vivo and in vitro. Circulation 2001; 103:276–283.
- Liao JK. Effects of statins on 3-hydroxy-3-methylglutaryl coenzyme a reductase inhibition beyond low-density lipoprotein cholesterol. Am J Cardiol 2005; 96:24F–33F.
- Nissen SE, Tuzcu EM, Schoenhagen P, et al. Statin therapy, LDL cholesterol, C-reactive protein, and coronary artery disease. N Engl J Med 2005; 352:29–38.
- Ridker PM, Cannon CP, Morrow D, et al. C-reactive protein levels and outcomes after statin therapy. N Engl J Med 2005; 352:20–28.
- Shishehbor MH, Aviles RJ, Brennan ML, et al. Association of nitrotyrosine levels with cardiovascular disease and modulation by statin therapy. JAMA 2003; 289:1675–1680.
- Shishehbor MH, Brennan ML, Aviles RJ, et al. Statins promote potent systemic antioxidant effects through specific inflammatory pathways. Circulation 2003; 108:426–431.
- Takemoto M, Liao JK. Pleiotropic effects of 3-hydroxy-3-methylglutaryl coenzyme a reductase inhibitors. Arterioscler Thromb Vasc Biol 2001; 21:1712–1719.
- Shishehbor MH, Patel T, Bhatt DL. Using statins to treat inflammation in acute coronary syndromes: Are we there yet? Cleve Clin J Med 2006; 73:760–766.
- Ridker PM, Rifai N, Clearfield M, et al. Measurement of C-reactive protein for the targeting of statin therapy in the primary prevention of acute coronary events. N Engl J Med 2001; 344:1959–1965.
- Ridker PM, Buring JE, Shih J, Matias M, Hennekens CH. Prospective study of C-reactive protein and the risk of future cardiovascular events among apparently healthy women. Circulation 1998; 98:731–733.
- Ridker PM, Hennekens CH, Buring JE, Rifai N. C-reactive protein and other markers of inflammation in the prediction of cardiovascular disease in women. N Engl J Med 2000; 342:836–843.
- Ridker PM, Stampfer MJ, Rifai N. Novel risk factors for systemic atherosclerosis: a comparison of C-reactive protein, fibrinogen, homocysteine, lipoprotein(a), and standard cholesterol screening as predictors of peripheral arterial disease. JAMA 2001; 285:2481–2485.
- Rifai N, Ridker PM. High-sensitivity C-reactive protein: a novel and promising marker of coronary heart disease. Clin Chem 2001; 47:403–411.
- Shishehbor MH, Bhatt DL, Topol EJ. Using C-reactive protein to assess cardiovascular disease risk. Cleve Clin J Med 2003; 70:634–640.
- Ridker PM, Cushman M, Stampfer MJ, Tracy RP, Hennekens CH. Inflammation, aspirin, and the risk of cardiovascular disease in apparently healthy men. N Engl J Med 1997; 336:973–979.
- Zacho J, Tybjaerg-Hansen A, Jensen JS, Grande P, Sillesen H, Nordestgaard BG. Genetically elevated C-reactive protein and ischemic vascular disease. N Engl J Med 2008; 359:1897–1908.
- Ridker PM. Are statins anti-inflammatory? Issues in the design and conduct of the pravastatin inflammation C-reactive protein evaluation. Curr Cardiol Rep 2000; 2:269–273.
- Ridker PM, Buring JE, Cook NR, Rifai N. C-reactive protein, the metabolic syndrome, and risk of incident cardiovascular events: an 8-year follow-up of 14 719 initially healthy American women. Circulation 2003; 107:391–397.
- Pearson TA, Mensah GA, Alexander RW, et al. Markers of inflammation and cardiovascular disease: application to clinical and public health practice: a statement for healthcare professionals from the Centers for Disease Control and Prevention and the American Heart Association. Circulation 2003; 107:499–511.
- Executive Summary of the Third Report of the National Cholesterol Education Program (NCEP) Expert Panel on Detection, Evaluation, And Treatment of High Blood Cholesterol In Adults (Adult Treatment Panel III). JAMA 2001; 285:2486–2497.
- Grundy SM, Cleeman JI, Merz CN, et al. Implications of recent clinical trials for the National Cholesterol Education Program Adult Treatment Panel III guidelines. Circulation 2004; 110:227–239.
- Collins R, Peto R, Armitage J. The MRC/BHF Heart Protection Study: preliminary results. Int J Clin Pract 2002; 56:53–56.
- Cannon CP, Braunwald E, McCabe CH, et al. Intensive versus moderate lipid lowering with statins after acute coronary syndromes. N Engl J Med 2004; 350:1495–1504.
- de Lemos JA, Blazing MA, Wiviott SD, et al. Early intensive vs a delayed conservative simvastatin strategy in patients with acute coronary syndromes: phase Z of the A to Z trial. JAMA 2004; 292:1307–1316.
- LaRosa JC, Grundy SM, Waters DD, et al. Intensive lipid lowering with atorvastatin in patients with stable coronary disease. N Engl J Med 2005; 352:1425–1435.
- Liem AH, van Boven AJ, Veeger NJ, et al. Effect of fluvastatin on ischaemia following acute myocardial infarction: a randomized trial. Eur Heart J 2002; 23:1931–1937.
- Pedersen TR, Faergeman O, Kastelein JJ, et al. High-dose atorvastatin vs usual-dose simvastatin for secondary prevention after myocardial infarction: the IDEAL study: a randomized controlled trial. JAMA 2005; 294:2437–2445.
- Pitt B, Waters D, Brown WV, et al. Aggressive lipid-lowering therapy compared with angioplasty in stable coronary artery disease. Atorvastatin versus Revascularization Treatment Investigators. N Engl J Med 1999; 341:70–76.
- Ray KK, Cannon CP, McCabe CH, et al. Early and late benefits of highdose atorvastatin in patients with acute coronary syndromes: results from the PROVE IT-TIMI 22 trial. J Am Coll Cardiol 2005; 46:1405–1410.
- Schwartz GG, Olsson AG, Ezekowitz MD, et al. Effects of atorvastatin on early recurrent ischemic events in acute coronary syndromes: the MIRACL study: a randomized controlled trial. JAMA 2001; 285:1711–1718.
- Serruys PW, de Feyter P, Macaya C, et al. Fluvastatin for prevention of cardiac events following successful first percutaneous coronary intervention: a randomized controlled trial. JAMA 2002; 287:3215–3222.
- Patel TN, Shishehbor MH, Bhatt DL. A review of high-dose statin therapy: targeting cholesterol and inflammation in atherosclerosis. Eur Heart J 2007; 28:664–672.
- Ridker PM. Novel risk factors and markers for coronary disease. Adv Intern Med 2000; 45:391–418.
- Ridker PM. High-sensitivity C-reactive protein: potential adjunct for global risk assessment in the primary prevention of cardiovascular disease. Circulation 2001; 103:1813–1818.
- Ridker PM, Glynn RJ, Hennekens CH. C-reactive protein adds to the predictive value of total and HDL cholesterol in determining risk of first myocardial infarction. Circulation 1998; 97:2007–2011.
- Cushman M, Arnold AM, Psaty BM, et al. C-reactive protein and the 10-year incidence of coronary heart disease in older men and women: the cardiovascular health study. Circulation 2005; 112:25–31.
- Ridker PM. C-reactive protein and the prediction of cardiovascular events among those at intermediate risk: moving an inflammatory hypothesis toward consensus. J Am Coll Cardiol 2007; 49:2129–2138.
- Albert MA, Danielson E, Rifai N, Ridker PM. Effect of statin therapy on C-reactive protein levels: the pravastatin inflammation/CRP evaluation (PRINCE): a randomized trial and cohort study. JAMA 2001; 286:64–70.
- Ridker PM, Rifai N, Pfeffer MA, Sacks F, Braunwald E. Long-term effects of pravastatin on plasma concentration of C-reactive protein. The Cholesterol and Recurrent Events (CARE) Investigators. Circulation 1999; 100:230–235.
- Bisoendial RJ, Kastelein JJ, Levels JH, et al. Activation of inflammation and coagulation after infusion of C-reactive protein in humans. Circ Res 2005; 96:714–716.
- Schwedler SB, Amann K, Wernicke K, et al. Native C-reactive protein increases whereas modified C-reactive protein reduces atherosclerosis in apolipoprotein E-knockout mice. Circulation 2005; 112:1016–1023.
- Pfister R, Hellmich M. Multiple biomarkers and cardiovascular risk. N Engl J Med 2008; 359:760.
- Schunkert H, Samani NJ. Elevated C-reactive protein in atherosclerosis— chicken or egg? N Engl J Med 2008; 359:1953–1955.
- Danesh J, Wheeler JG, Hirschfield GM, et al. C-reactive protein and other circulating markers of inflammation in the prediction of coronary heart disease. N Engl J Med 2004; 350:1387–1397.
- Kushner I, Sehgal AR. Is high-sensitivity C-reactive protein an effective screening test for cardiovascular risk? Arch Intern Med 2002; 162:867–869.
- Hlatky MA. Expanding the orbit of primary prevention—moving beyond JUPITER. N Engl J Med 2008; 359:2280–2282.
- Shishehbor MH, Hazen SL. Inflammatory and oxidative markers in atherosclerosis: relationship to outcome. Curr Atheroscler Rep 2004; 6:243–250.
- Nicholls SJ, Hazen SL. Myeloperoxidase and cardiovascular disease. Arterioscler Thromb Vasc Biol 2005; 25:1102–1111.
- Bhattacharyya T, Nicholls SJ, Topol EJ, et al. Relationship of paraoxonase 1 (PON1) gene polymorphisms and functional activity with systemic oxidative stress and cardiovascular risk. JAMA 2008; 299:1265–1276.
- Choi SH, Chae A, Miller E, et al. Relationship between biomarkers of oxidized low-density lipoprotein, statin therapy, quantitative coronary angiography, and atheroma: volume observations from the REVERSAL (Reversal of Atherosclerosis with Aggressive Lipid Lowering) study. J Am Coll Cardiol 2008; 52:24–32.
- Hakonarson H, Thorvaldsson S, Helgadottir A, et al. Effects of a 5-lipoxygenase-activating protein inhibitor on biomarkers associated with risk of myocardial infarction: a randomized trial. JAMA 2005; 293:2245–2256.
- Ky B, Burke A, Tsimikas S, et al. The influence of pravastatin and atorvastatin on markers of oxidative stress in hypercholesterolemic humans. J Am Coll Cardiol 2008; 51:1653–1662.
- Levy AP, Levy JE, Kalet-Litman S, et al. Haptoglobin genotype is a determinant of iron, lipid peroxidation, and macrophage accumulation in the atherosclerotic plaque. Arterioscler Thromb Vasc Biol 2007; 27:134–140.
- Mukherjee D, Topol EJ. Pharmacogenomics in cardiovascular diseases. Curr Probl Cardiol 2003; 28:317–347
- West of Scotland Coronary Prevention Study: identification of highrisk groups and comparison with other cardiovascular intervention trials. Lancet 1996; 348:1339–1342.
- Downs JR, Clearfield M, Weis S, et al. Primary prevention of acute coronary events with lovastatin in men and women with average cholesterol levels: results of AFCAPS/TexCAPS. Air Force/Texas Coronary Atherosclerosis Prevention Study. JAMA 1998; 279:1615–1622.
- Davidson MH, Robinson JG. Safety of aggressive lipid management. J Am Coll Cardiol 2007; 49:1753–1762.
- Davidson MH. Rosuvastatin safety: lessons from the FDA review and post-approval surveillance. Expert Opin Drug Saf 2004; 3:547–557.
- Kasiske BL, Wanner C, O’Neill WC. An assessment of statin safety by nephrologists. Am J Cardiol 2006; 97:82C–85C.
- McTaggart F, Buckett L, Davidson R, et al. Preclinical and clinical pharmacology of rosuvastatin, a new 3-hydroxy-3-methylglutaryl coenzyme A reductase inhibitor. Am J Cardiol 2001; 87:28B–32B.
- Jacobson TA. Statin safety: lessons from new drug applications for marketed statins. Am J Cardiol 2006; 97:44C–51C.
- Jacobson TA. Comparative pharmacokinetic interaction profiles of pravastatin, simvastatin, and atorvastatin when coadministered with cytochrome P450 inhibitors. Am J Cardiol 2004; 94:1140–1146.
- Baigent C, Keech A, Kearney PM, et al. Efficacy and safety of cholesterol-lowering treatment: prospective meta-analysis of data from 90,056 participants in 14 randomised trials of statins. Lancet 2005; 366:1267–1278.
KEY POINTS
- LDL-C is the current gold standard diagnostic marker of risk, and elevated values should be aggressively treated in both primary and secondary prevention.
- The optional LDL-C goal of 70 mg/dL for patients at high risk may need to be extended to others at higher global risk, such as those with elevated hs-CRP.
- Although elevated hs-CRP may identify some people with low LDL-C who are nevertheless at higher global risk, more sensitive and specific markers of risk are needed.
Boosting Blood Cells for Transplant Patients
Erratum (2008;82:317-318)
What's Eating You? Native and Imported Fire Ants
October 2008 Instant Poll Results
BIOIDENTICAL HT: WHERE DO YOU STAND?
A 54-year-old woman, recently menopausal, complains of hot flushes that make her miserable. After an evaluation, including an endocrine work-up, you recommend hormone therapy (HT). She promptly asks about bioidentical hormones, which she has read about on the Internet and heard about from friends. In your practice, the next step would be to:
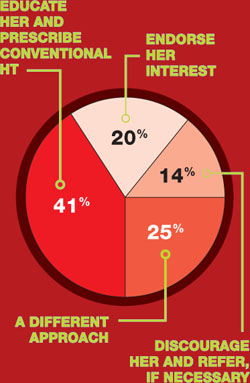
COMMENTS
“I would educate her on the facts about bioidenticals but, if she insists, I would let her have them.”
“I employ a combination of the three options.”
“As a specialty, we need to be clear on terminology: There are pharmaceutical bioidentical hormones.”
“I explain to patients that estradiol—the medication in Estrace, Vivelle, etc.—is bioidentical.”
BIOIDENTICAL HT: WHERE DO YOU STAND?
A 54-year-old woman, recently menopausal, complains of hot flushes that make her miserable. After an evaluation, including an endocrine work-up, you recommend hormone therapy (HT). She promptly asks about bioidentical hormones, which she has read about on the Internet and heard about from friends. In your practice, the next step would be to:
COMMENTS
“I would educate her on the facts about bioidenticals but, if she insists, I would let her have them.”
“I employ a combination of the three options.”
“As a specialty, we need to be clear on terminology: There are pharmaceutical bioidentical hormones.”
“I explain to patients that estradiol—the medication in Estrace, Vivelle, etc.—is bioidentical.”
ROUNDTABLE: PART 1 OF 2: Using mesh to repair prolapse calls for more than a kit—it takes skill
MICKEY M. KARRAM, MD, moderator, is Director of Urogynecology at Good Samaritan Hospital and Voluntary Professor of ObGyn at the University of Cincinnati School of Medicine in Cincinnati, Ohio.
SHLOMO RAZ, MD, is Professor of Urology and Chief of Pelvic Medicine and Reconstructive Urology at UCLA School of Medicine in Los Angeles.
VINCENT LUCENTE, MD, MBA, is Founder and Director of the Institute for Female Pelvic Medicine and Reconstructive Surgery in Allentown, Pa, and Clinical Professor of ObGyn at Temple University School of Medicine in Philadelphia.
MARK D. WALTERS, MD, is Professor and Vice Chair of Gynecology, Section of Urogynecology and Reconstructive Pelvic Surgery, Department of Obstetrics and Gynecology, at the Cleveland Clinic in Cleveland, Ohio.
Mesh kits for repairing prolapse are proliferating like crazy, just as they did for midurethral sling procedures. But mesh augmentation of prolapse surgeries requires more than a prepackaged assortment of tools and materials. In this article, moderator Mickey M. Karram, MD, and a panel of nationally recognized urogynecologists and urologists describe the literature on mesh augmentation and discuss indications, contraindications, techniques, applicable cases, and the considerable training required.
In Part 2, which will appear in the February issue of OBG Management, the panel tackles the thorny topic of complications, including erosion, extrusion, foreshortening of the vagina, dyspareunia, and pain. Their discussion focuses on ways to avoid these problems, and methods for correcting them.
Do we have enough data?
DR. KARRAM: To start, let’s quickly review the peer-reviewed literature on the use of mesh augmentation during surgery for pelvic organ prolapse.
DR. WALTERS: Until recently, most data concerned open abdominal sacrocolpopexy (ASC) using polypropylene or Merseline mesh. There is significant clinical experience with this operation, and multiple cohort studies show long-term cure rates of 78% to 100% for apical prolapse.1
At least two randomized controlled trials have compared open ASC with sutured vaginal colpopexy procedures, and ASC is certainly equal to—perhaps better than—all transvaginal sutured repairs.2,3
With ASC, most recurrences affect the distal half of the vagina and involve one or more of the following:
- anterior or posterior vaginal wall prolapse (or both)
- stress urinary incontinence (SUI)
- distal rectocele.1,3
Mesh erosion occurs in 3.4% of cases and is usually easily managed.1 Other complications, including bowel injury, tend to be related to access, regardless of whether the operation is performed via laparotomy or laparoscopy.
Robotic sacrocolpopexy has become popular in recent years, and we will probably see data on this approach as we gain experience.
When it comes to vaginal mesh kits, the peer-reviewed literature is just beginning to expand, with many studies being presented at international meetings. For anterior and, possibly, apical vaginal prolapse, the cure rate after use of a mesh kit appears to be as high as, or higher than, the rate for sutured repairs.4 This high rate of anatomic cure is balanced somewhat by additional cost and complications involving mesh and the kits.
For posterior vaginal wall prolapse and rectocele, I firmly believe, based on our research and that of others, that sutured repairs are superior to graft-augmented surgery.5
DR. KARRAM: What are the indications and contraindications for mesh augmentation of prolapse repair ( FIGURES 1 and 2 )?
DR. LUCENTE: I believe mesh is indicated in any patient in need of surgical repair of pelvic organ prolapse who is seeking optimal durability and is willing to accept the known risks of the surgery.
The issue becomes more complex when it comes to contraindications. Absolute contraindications are fairly obvious; they include medically unstable patients and those who may have an inactive infectious process within the pelvis or even undiagnosed abnormal uterine bleeding.
At our center, because the potential for dyspareunia and pelvic discomfort is our biggest concern, we have developed a profile of the patient who is more likely to develop these complaints. The profile includes any patient who has a chronic pain disorder of any type, but especially chronic pelvic pain disorders such as endometriosis and vulvodynia. Other risk factors appear to be a history of pelvic surgery involving any permanent material, suture or mesh, and young age.
So if we have a patient in her late 30s who has undergone reconstructive surgery using permanent sutures and who has an element of chronic pelvic pain, we would counsel her strongly to consider surgical options other than the use of synthetic mesh.
DR. WALTERS: The main indications for mesh-augmented prolapse repair are recurrent posthysterectomy vaginal vault prolapse, for which I usually perform ASC, and recurrent cystocele or anteriorapical prolapse, for which I use one of the anterior mesh kits.
I still think sutured repairs—by that, I mean uterosacral ligament or sacrospinous colpopexy with sutured rectocele repair—work best for recurrent posterior wall and posteriorapical prolapse. I don’t use mesh augmentation for rectocele.
The main contraindication to mesh augmentation, as I see it, is a history of mesh complications. If I am repairing a mesh complication such as erosion or pain, I do not place another mesh.
Medical issues that might increase mesh complications, such as diabetes, steroid use, or severe vaginal atrophy, would, at the very least, make me consider carefully whether mesh augmentation is appropriate. The literature is not clear on this, so mesh could still be used if the surgeon thinks it is necessary.
DR. KARRAM: I haven’t found a definitive indication for mesh augmentation. We have used biologic meshes empirically, but I am not convinced that they really add long-term durability, regardless of whether they are used in the anterior or posterior vaginal segment.
Our published durability rate for traditional suture-type repairs is in the range of 85% at 5 years out.6 Even if I assumed that mesh would give me 100% 5-year durability, this rate would have to be at the expense of some erosion, pain, and other complications unique to mesh. I do not think that the potential improvement in durability is worth these potential complications.
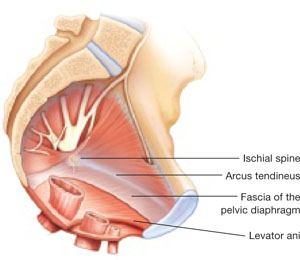
FIGURE 1 When the pelvic support system is intact, prolapse is rare
In the normal pelvis, organs are supported by a complex web of muscles, fascia, and connective tissue. 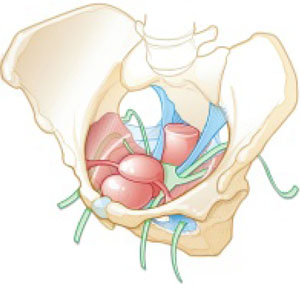
FIGURE 2 Mesh augmentation seeks to enhance the durability of repair
One type of mesh in final position. Mesh-augmented repair restores the vaginal apex and lends support to the walls of the vagina.
DR. KARRAM: If you are doing a lot of mesh repairs, you are obviously content with the results and feel that the few complications you are seeing are outweighed by the advantages mesh confers. How do you avoid extrusion and avert creation of a painful vagina?
DR. RAZ: Most of our cases are recurrent prolapse after failed vaginal or abdominal repair. I am indeed using a significant amount of soft polypropylene mesh for reconstructive procedures. As with the use of any other synthetic material, low-grade infection can develop after a few weeks or months. I use copious irrigation with antibiotic solution during reconstruction.
To avoid extrusion, I perform deep, rather than superficial, dissection of the vaginal wall to allow for better coverage of the mesh. For posterior mesh reconstruction, I cover the mesh with pararectal fascia to prevent erosion.
For mesh-augmented procedures, I cut the mesh myself in the operating room ( FIGURE 3 ). For a sling, I use a 10 cm × 1 cm soft polypropylene mesh. For a grade 3 or 4 cystocele, I use a trapezoid of soft polypropylene mesh with several points of fixation:
- at the sacrouterine ligament
- lateral to the obturator fascia
- distal to the bladder neck.
I always repair the vault at the same time.
For vault prolapse, I use a segment of soft polypropylene mesh in the shape of an apron with two arms (1 cm × 4 cm) and a central segment (4 cm × 7 cm). I support the vault using number 1-0 delayed absorbable suture and mesh. From outside the vaginal wall, in the posterolateral deep vaginal wall (inside the peritoneum), I incorporate the origin of the sacrouterine ligament and one arm of the mesh in the groove between the colon and levator ani, 15 cm from the introitus. I bring the suture 1 cm from the original entrance. A separate set of sutures brings the perirectal fascia together with the sacrouterine ligaments and perivesical fascia to close the peritoneal cavity. I tie the vault-suspension sutures, providing support to the cuff in a high posterior position (12 to 15 cm from the introitus).
In selected cases of significant recurrent rectocele, I use a rectangle of soft polypropylene mesh anchored to the origin of the sacrouterine ligament and distal to the perineal membrane. The mesh is covered by the pararectal fascia.
We have not seen vaginal, urethral, or bladder erosion in 1,800 cases of our distal urethral Prolene sling procedure using 10 cm × 1 cm soft mesh. In patients who have significant cystocele, vault prolapse, and recurrent rectocele, our vaginal erosion rate is 3%. We have never encountered rectal, bladder, or bowel perforation using our technique.
DR. LUCENTE: We often use mesh and are more than simply content with our results—we are extremely pleased, and so are our patients. Having said that, our techniques have definitely evolved over the past few years, as we’ve focused on how to decrease exposure and, more recently, optimize sexual function and vaginal comfort.
First, to avoid exposure, the most critical step is precise hydrodissection and distention of the true vesicovaginal space. This step can only be achieved through careful tactile guidance of the needle tip into the space, where it should remain while hydrodissection is performed. Always remember, sharp dissection “follows” hydrodissection. If you place the needle bevel within the vaginal wall, you will “split” the vaginal wall—as during standard colporrhaphy—which will lead to a high exposure rate.
Second, to avoid dyspareunia, it’s essential to pay close attention to POP-Q measurements, especially vaginal length, to ensure that the reconstruction restores the same length without foreshortening. This approach entails leaving the cervix in most patients who have a shorter vagina, and making sure that the mesh is secured above the ischial spine in younger, sexually active patients who have demonstrated a higher risk of postoperative deep, penetrating dyspareunia, compared with older, less sexually active patients.
Also paramount is to ensure that you have manually displaced the vagina inwardly as much as possible before deploying or setting the mesh. If you simply try to suture secure the mesh with the vagina incised open, without the ability to deploy the mesh with a closed, displaced vagina (to mimic deep penetration), it is difficult, if not impossible, to properly set the mesh for optimal comfort.
In the early days of midurethral pubovaginal slings using polypropylene, the adage was “looser is better than tighter.” This is even truer for transvaginal mesh.
DR. KARRAM: Dr. Walters, please describe your current surgical procedure of choice without mesh and explain why you haven’t adopted mesh for routine repairs.
DR. WALTERS: About 20% of my prolapse surgeries—usually for posthysterectomy or recurrent vaginal vault prolapse—involve ASC with placement of polypropylene mesh. I perform most of these cases through a Pfannenstiel incision, but I’ve also done them laparoscopically. Several of my partners perform ASC laparoscopically and robotically.
For the other 80% of my patients who have prolapse, I perform repairs transvaginally, usually using high bilateral uterosacralligament vaginal-vault suspension. We have learned to suture higher and slightly more medial on the uterosacral ligaments to attain greater vaginal depth and minimize ureteral obstruction. We use two or three sutures on each uterosacral ligament, usually a combination of permanent and delayed absorbable sutures.
I am also performing more sacrospinous ligament suspensions because this operation is being studied by the Pelvic Floor Disorders Network. Properly performed, it is an excellent surgery for apical prolapse. But, as with most of our surgeries for prolapse, recurrent anterior wall prolapse remains a problem.
Like you, Dr. Karram, we’ve studied our group’s anatomic and functional outcomes very carefully for more than 10 years and are mostly satisfied with our cure and complication rates. Although our anatomic outcomes with these surgeries are not always perfect, our reoperation rate for prolapse is only about 5%, with a high level of satisfaction in 88% to 92% of patients.
DR. RAZ: Unaugmented reconstruction fails in more than 30% of cases. Some patients who have significant prolapse and attenuated tissue think that this tissue will become healthier or stronger after reconstructive surgery, but that isn’t the case. In these situations, excision and plication make no clinical sense.
The problem is that we have yet to identify the ideal surrogate for poor-quality tissue. Most of us use polypropylene mesh in different variations. We need a better material that will be nonimmunogenic, well tolerated, and easily incorporated without erosion. Xenograft-like derivatives of dermis, or allografts such as cadaveric fascia, have failed over the long term because the body reabsorbs the graft without forming any new connective tissue.
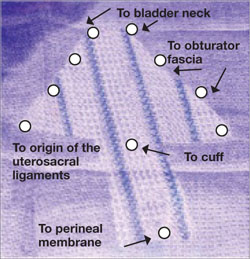
FIGURE 3 Mesh can be cut in the OR to custom-fit a patient
Hand-cut mesh and points of placement.
PHOTO: SHLOMO RAZ, MD
Is a kit a valuable aid?
DR. KARRAM: If a surgeon wants to augment a repair, what are the advantages of a packaged mesh kit, compared with simply cutting the mesh and performing surgery without a kit?
DR. WALTERS: The advantages of a packaged mesh kit are the convenience involved and the ability to consistently perform the same operation with the same product. That facilitates learning, teaching, and research. It also helps us understand the published literature a little better because “custom” prolapse repairs are operator-dependent and difficult to apply generally to a population of surgeons.
These advantages are most clearly apparent with midurethral sling mesh kits, which have almost revolutionized surgery for stress incontinence. I don’t believe mesh kits for prolapse are there yet, but they certainly have potential.
DR. RAZ: I’m opposed to the use of kits. They are industry-driven. One company has made $1 billion selling them. Imagine a patient who undergoes placement of a sling kit ($1,000), cystocele kit ($1,500), and posterior mesh kit ($1,500). How can our healthcare system sustain this burden, especially when there is no real evidence that a kit improves the operation, and given the incredible complication rate that we see?
Moreover, the kits contain a single-use needle and passer and a precut segment of polypropylene mesh. But every patient is different and requires a unique size or shape of mesh. I don’t believe that a surgeon who knows pelvic anatomy needs a kit to perform mesh-augmented reconstruction. We can buy the same segment of mesh for $200 to $400, cut it as needed, and perform the same operation advertised by industry.
For surgeons who prefer a kit, the tools that are included should be made reusable.
DR. LUCENTE: In my opinion, the primary advantage of a commercially available transvaginal mesh delivery system—notice, I avoided the word “kit,” because I think there are plenty of negative connotations associated with it—is the ability to deliver the mesh in a “tension”-free manner.
One alternative that many people pursue is cutting the mesh to size and using sutures to hold it in place while tissue ingrowth occurs. However, the hernia literature suggests that suturing mesh in place increases the risk of postoperative discomfort at the site of implantation. The true cause of the discomfort remains unclear, but it is thought to arise from nerve tethering or traction at the pre-committed points of attachment before the host tissue and mesh interface have adjusted or settled with tissue ingrowth.
All neuropathic complications of mesh implantation have been shown in the current hernia literature to be increased with the use of sutures.7 Also, as previously mentioned, it is extremely difficult to set or adjust the mesh with the vaginal incision remaining “open,” which is a downside to suture techniques.
What training is necessary to use a kit?
DR. KARRAM: Mesh kits are aggressively promoted by industry, with close to half a dozen different kits to be available soon. What is the minimum amount of training one should have before utilizing these kits?
DR. WALTERS: The surgeon should at least know how to perform traditional sutured prolapse repairs and SUI surgery and be able to perform cystoscopy. Ideally, the surgeon should undergo training on a cadaver with a skilled and experienced user of the mesh kit. The surgeon also should carefully review the risks and benefits of mesh kits with the patient and inform the patient that he or she is in the early learning curve of a particular surgery. The informed patient should have a right to refuse mesh-augmented prolapse surgery after the consent process.
DR. LUCENTE: I’m glad you asked this question. I strongly believe that surgical expertise and proficiency within gynecology need to be more effectively addressed by us all. We have a situation in our field in which techniques and technology are widening the gap between what is possible and what the surgeon is comfortable doing safely.
It’s incumbent on all of us, especially those who are in a leadership position as a chairperson or chief of a division, to work with our physician staff and faculty to optimize surgical skill and patient outcomes, including safety, with new technologies.
As for the minimal amount of training needed, that’s extremely variable. It depends on the current skill set of the physician and his or her ability to pick up the mechanics of the surgery as it is taught through a cadaver lab or preceptorship. It’s regrettable that some physicians lack the objectivity and insight to judge their own skill set. This, again, is the time for a chairperson or chief of a division to step up to the plate and ensure proper credentialing and demonstration of proficiency.
It is unrealistic to expect industry to decide who should or should not utilize this truly breakthrough technology. That is our responsibility as physicians.
DR. KARRAM: At a minimum, I think any surgeon utilizing a kit should have a firm understanding of pelvic floor anatomy and experience performing traditional repairs:
- intraperitoneal procedures such as Mc-Call culdoplasty and uterosacral suspension
- sacrospinous suspension
- retropubic procedures and anti-incontinence operations such as pubovaginal slings.
This three-dimensional understanding of the pelvic floor is mandatory if one is to assume that blind passage of trocars through potentially dangerous spaces is the wave of the future.
DR. RAZ: You need to be a pelvic surgeon, know your anatomy, and know how to manage complications if you are going to use one of these kits. You should stick to the surgery that works best in your hands. Industry cannot teach you to be a good pelvic surgeon; it takes lifelong experience.
DR. KARRAM: If you have a patient who is sexually inactive with pelvic organ prolapse, would you prefer a mesh repair or an obliterative procedure? And why?
DR. WALTERS: If the patient is sexually inactive—especially if she is older and definitely will not be in the future—it makes absolutely no sense to perform a mesh-augmented repair. A traditional, somewhat tight, sutured repair works fine in this setting and carries very low risk.
In fact, our group and others have found that, in carefully selected patients, partial colpectomy and colpocleisis procedures (without grafts) have among the highest cure and satisfaction rates of all surgeries we perform for prolapse; they also have relatively low risk.8 Recurrent prolapse after an obliterative procedure is rare; most of the dissatisfaction relates to postoperative voiding difficulties or persistent or de novo urinary incontinence.
DR. KARRAM: I also prefer an obliterative procedure. I see no reason to bring in the cost and potential for complications that mesh repair entails. An obliterative procedure should produce an anatomic success rate close to 100%, with minimal complications. It also can be performed quickly with minimal anesthesia and convalescence.
DR. LUCENTE: My response is based on a clinical study that my associate, Dr. Miles Murphy, has performed, comparing a transvaginal mesh procedure with a LaForte operation for severe pelvic organ prolapse.9 Both patient groups were well satisfied with the result, and success rates were comparable. However, the group that underwent the transvaginal mesh procedure had a shorter operative time.
As a result of these studies, we tend to prefer transvaginal mesh repair. Even though the woman may be sexually inactive, the procedure preserves vaginal function, and we all know that life has a way of being unpredictable. Her situation may change so that she once again desires sexual function.
However, for a very elderly woman—one in her late 80s or 90s—who has severe or extreme prolapse with a very large procidentia and vaginal length measuring, say, 13 cm beyond the introitus, I do prefer an obliterative procedure.
DR. RAZ: I agree. I would not offer a sexually inactive patient an obliterative procedure. You never know what the future will hold.
Mesh repair can be performed safely, provided the surgeon has good knowledge of anatomic landmarks and knows how to manage any potential complications that may arise.
1. Nygaard IE, McCreery R, Brubaker L, et al. Pelvic Floor Disorders Network. Abdominal sacrocolpopexy: a comprehensive review. Obstet Gynecol. 2004;104:805-823.
2. Benson JT, Lucente V, McClellan E. Vaginal versus abdominal reconstructive surgery for the treatment of pelvic support defects: a prospective randomized study with long-term outcome evaluation. Am J Obstet Gynecol. 1996;175:1418-1421;discussion 1421-1422.
3. Maher CF, Qatawneh AM, Dwyer PL, Carey MP, Cornish A, Schluter PJ. Abdominal sacral colpopexy or vaginal sacrospinous colpopexy for vaginal vault prolapse: a prospective randomized study. Am J Obstet Gynecol. 2004;190:20-26.
4. Murphy M. Society of Gynecologic Surgeons Systematic Review Group. Clinical practice guidelines on vaginal graft use from the Society of Gynecologic Surgeons. Obstet Gynecol. 2008;112:1123-1130.
5. Paraiso MF, Barber MD, Muir TW, Walters MD. Rectocele repair: a randomized trial of three surgical procedures including graft augmentation. Am J Obstet Gynecol. 2006;195:1762-1771.
6. Silva WA, Pauls RN, Segal JL, Rooney CM, Kleeman SD, Karram MM. Uterosacral ligament vault suspension: five-year outcomes. Obstet Gynecol 2006;108:255-263.
7. EU Hernia Trialists Collaboration. Repair of groin hernia with synthetic mesh: meta-analysis of randomized controlled trials. Ann Surg. 2002;235:322-332.
8. Barber MD, Amundsen C, Paraiso MFR, Weidner A, Romero A, Walters MD. Quality of life after surgery for genital prolapse in elderly women: obliterative and reconstructive surgery. Int Urogynecol J. 2007;18:799-806.
9. Murphy M, van Raalte H, Mercurio E, Haff R, Wiseman B, Lucente VR. Incontinence-related quality of life and sexual function following the tension-free vaginal tape vs the “inside-out” tension-free vaginal tape obturator. Int Urogynecol J. 2008;19:481-487.
MICKEY M. KARRAM, MD, moderator, is Director of Urogynecology at Good Samaritan Hospital and Voluntary Professor of ObGyn at the University of Cincinnati School of Medicine in Cincinnati, Ohio.
SHLOMO RAZ, MD, is Professor of Urology and Chief of Pelvic Medicine and Reconstructive Urology at UCLA School of Medicine in Los Angeles.
VINCENT LUCENTE, MD, MBA, is Founder and Director of the Institute for Female Pelvic Medicine and Reconstructive Surgery in Allentown, Pa, and Clinical Professor of ObGyn at Temple University School of Medicine in Philadelphia.
MARK D. WALTERS, MD, is Professor and Vice Chair of Gynecology, Section of Urogynecology and Reconstructive Pelvic Surgery, Department of Obstetrics and Gynecology, at the Cleveland Clinic in Cleveland, Ohio.
Mesh kits for repairing prolapse are proliferating like crazy, just as they did for midurethral sling procedures. But mesh augmentation of prolapse surgeries requires more than a prepackaged assortment of tools and materials. In this article, moderator Mickey M. Karram, MD, and a panel of nationally recognized urogynecologists and urologists describe the literature on mesh augmentation and discuss indications, contraindications, techniques, applicable cases, and the considerable training required.
In Part 2, which will appear in the February issue of OBG Management, the panel tackles the thorny topic of complications, including erosion, extrusion, foreshortening of the vagina, dyspareunia, and pain. Their discussion focuses on ways to avoid these problems, and methods for correcting them.
Do we have enough data?
DR. KARRAM: To start, let’s quickly review the peer-reviewed literature on the use of mesh augmentation during surgery for pelvic organ prolapse.
DR. WALTERS: Until recently, most data concerned open abdominal sacrocolpopexy (ASC) using polypropylene or Merseline mesh. There is significant clinical experience with this operation, and multiple cohort studies show long-term cure rates of 78% to 100% for apical prolapse.1
At least two randomized controlled trials have compared open ASC with sutured vaginal colpopexy procedures, and ASC is certainly equal to—perhaps better than—all transvaginal sutured repairs.2,3
With ASC, most recurrences affect the distal half of the vagina and involve one or more of the following:
- anterior or posterior vaginal wall prolapse (or both)
- stress urinary incontinence (SUI)
- distal rectocele.1,3
Mesh erosion occurs in 3.4% of cases and is usually easily managed.1 Other complications, including bowel injury, tend to be related to access, regardless of whether the operation is performed via laparotomy or laparoscopy.
Robotic sacrocolpopexy has become popular in recent years, and we will probably see data on this approach as we gain experience.
When it comes to vaginal mesh kits, the peer-reviewed literature is just beginning to expand, with many studies being presented at international meetings. For anterior and, possibly, apical vaginal prolapse, the cure rate after use of a mesh kit appears to be as high as, or higher than, the rate for sutured repairs.4 This high rate of anatomic cure is balanced somewhat by additional cost and complications involving mesh and the kits.
For posterior vaginal wall prolapse and rectocele, I firmly believe, based on our research and that of others, that sutured repairs are superior to graft-augmented surgery.5
DR. KARRAM: What are the indications and contraindications for mesh augmentation of prolapse repair ( FIGURES 1 and 2 )?
DR. LUCENTE: I believe mesh is indicated in any patient in need of surgical repair of pelvic organ prolapse who is seeking optimal durability and is willing to accept the known risks of the surgery.
The issue becomes more complex when it comes to contraindications. Absolute contraindications are fairly obvious; they include medically unstable patients and those who may have an inactive infectious process within the pelvis or even undiagnosed abnormal uterine bleeding.
At our center, because the potential for dyspareunia and pelvic discomfort is our biggest concern, we have developed a profile of the patient who is more likely to develop these complaints. The profile includes any patient who has a chronic pain disorder of any type, but especially chronic pelvic pain disorders such as endometriosis and vulvodynia. Other risk factors appear to be a history of pelvic surgery involving any permanent material, suture or mesh, and young age.
So if we have a patient in her late 30s who has undergone reconstructive surgery using permanent sutures and who has an element of chronic pelvic pain, we would counsel her strongly to consider surgical options other than the use of synthetic mesh.
DR. WALTERS: The main indications for mesh-augmented prolapse repair are recurrent posthysterectomy vaginal vault prolapse, for which I usually perform ASC, and recurrent cystocele or anteriorapical prolapse, for which I use one of the anterior mesh kits.
I still think sutured repairs—by that, I mean uterosacral ligament or sacrospinous colpopexy with sutured rectocele repair—work best for recurrent posterior wall and posteriorapical prolapse. I don’t use mesh augmentation for rectocele.
The main contraindication to mesh augmentation, as I see it, is a history of mesh complications. If I am repairing a mesh complication such as erosion or pain, I do not place another mesh.
Medical issues that might increase mesh complications, such as diabetes, steroid use, or severe vaginal atrophy, would, at the very least, make me consider carefully whether mesh augmentation is appropriate. The literature is not clear on this, so mesh could still be used if the surgeon thinks it is necessary.
DR. KARRAM: I haven’t found a definitive indication for mesh augmentation. We have used biologic meshes empirically, but I am not convinced that they really add long-term durability, regardless of whether they are used in the anterior or posterior vaginal segment.
Our published durability rate for traditional suture-type repairs is in the range of 85% at 5 years out.6 Even if I assumed that mesh would give me 100% 5-year durability, this rate would have to be at the expense of some erosion, pain, and other complications unique to mesh. I do not think that the potential improvement in durability is worth these potential complications.
FIGURE 1 When the pelvic support system is intact, prolapse is rare
In the normal pelvis, organs are supported by a complex web of muscles, fascia, and connective tissue.
FIGURE 2 Mesh augmentation seeks to enhance the durability of repair
One type of mesh in final position. Mesh-augmented repair restores the vaginal apex and lends support to the walls of the vagina.
DR. KARRAM: If you are doing a lot of mesh repairs, you are obviously content with the results and feel that the few complications you are seeing are outweighed by the advantages mesh confers. How do you avoid extrusion and avert creation of a painful vagina?
DR. RAZ: Most of our cases are recurrent prolapse after failed vaginal or abdominal repair. I am indeed using a significant amount of soft polypropylene mesh for reconstructive procedures. As with the use of any other synthetic material, low-grade infection can develop after a few weeks or months. I use copious irrigation with antibiotic solution during reconstruction.
To avoid extrusion, I perform deep, rather than superficial, dissection of the vaginal wall to allow for better coverage of the mesh. For posterior mesh reconstruction, I cover the mesh with pararectal fascia to prevent erosion.
For mesh-augmented procedures, I cut the mesh myself in the operating room ( FIGURE 3 ). For a sling, I use a 10 cm × 1 cm soft polypropylene mesh. For a grade 3 or 4 cystocele, I use a trapezoid of soft polypropylene mesh with several points of fixation:
- at the sacrouterine ligament
- lateral to the obturator fascia
- distal to the bladder neck.
I always repair the vault at the same time.
For vault prolapse, I use a segment of soft polypropylene mesh in the shape of an apron with two arms (1 cm × 4 cm) and a central segment (4 cm × 7 cm). I support the vault using number 1-0 delayed absorbable suture and mesh. From outside the vaginal wall, in the posterolateral deep vaginal wall (inside the peritoneum), I incorporate the origin of the sacrouterine ligament and one arm of the mesh in the groove between the colon and levator ani, 15 cm from the introitus. I bring the suture 1 cm from the original entrance. A separate set of sutures brings the perirectal fascia together with the sacrouterine ligaments and perivesical fascia to close the peritoneal cavity. I tie the vault-suspension sutures, providing support to the cuff in a high posterior position (12 to 15 cm from the introitus).
In selected cases of significant recurrent rectocele, I use a rectangle of soft polypropylene mesh anchored to the origin of the sacrouterine ligament and distal to the perineal membrane. The mesh is covered by the pararectal fascia.
We have not seen vaginal, urethral, or bladder erosion in 1,800 cases of our distal urethral Prolene sling procedure using 10 cm × 1 cm soft mesh. In patients who have significant cystocele, vault prolapse, and recurrent rectocele, our vaginal erosion rate is 3%. We have never encountered rectal, bladder, or bowel perforation using our technique.
DR. LUCENTE: We often use mesh and are more than simply content with our results—we are extremely pleased, and so are our patients. Having said that, our techniques have definitely evolved over the past few years, as we’ve focused on how to decrease exposure and, more recently, optimize sexual function and vaginal comfort.
First, to avoid exposure, the most critical step is precise hydrodissection and distention of the true vesicovaginal space. This step can only be achieved through careful tactile guidance of the needle tip into the space, where it should remain while hydrodissection is performed. Always remember, sharp dissection “follows” hydrodissection. If you place the needle bevel within the vaginal wall, you will “split” the vaginal wall—as during standard colporrhaphy—which will lead to a high exposure rate.
Second, to avoid dyspareunia, it’s essential to pay close attention to POP-Q measurements, especially vaginal length, to ensure that the reconstruction restores the same length without foreshortening. This approach entails leaving the cervix in most patients who have a shorter vagina, and making sure that the mesh is secured above the ischial spine in younger, sexually active patients who have demonstrated a higher risk of postoperative deep, penetrating dyspareunia, compared with older, less sexually active patients.
Also paramount is to ensure that you have manually displaced the vagina inwardly as much as possible before deploying or setting the mesh. If you simply try to suture secure the mesh with the vagina incised open, without the ability to deploy the mesh with a closed, displaced vagina (to mimic deep penetration), it is difficult, if not impossible, to properly set the mesh for optimal comfort.
In the early days of midurethral pubovaginal slings using polypropylene, the adage was “looser is better than tighter.” This is even truer for transvaginal mesh.
DR. KARRAM: Dr. Walters, please describe your current surgical procedure of choice without mesh and explain why you haven’t adopted mesh for routine repairs.
DR. WALTERS: About 20% of my prolapse surgeries—usually for posthysterectomy or recurrent vaginal vault prolapse—involve ASC with placement of polypropylene mesh. I perform most of these cases through a Pfannenstiel incision, but I’ve also done them laparoscopically. Several of my partners perform ASC laparoscopically and robotically.
For the other 80% of my patients who have prolapse, I perform repairs transvaginally, usually using high bilateral uterosacralligament vaginal-vault suspension. We have learned to suture higher and slightly more medial on the uterosacral ligaments to attain greater vaginal depth and minimize ureteral obstruction. We use two or three sutures on each uterosacral ligament, usually a combination of permanent and delayed absorbable sutures.
I am also performing more sacrospinous ligament suspensions because this operation is being studied by the Pelvic Floor Disorders Network. Properly performed, it is an excellent surgery for apical prolapse. But, as with most of our surgeries for prolapse, recurrent anterior wall prolapse remains a problem.
Like you, Dr. Karram, we’ve studied our group’s anatomic and functional outcomes very carefully for more than 10 years and are mostly satisfied with our cure and complication rates. Although our anatomic outcomes with these surgeries are not always perfect, our reoperation rate for prolapse is only about 5%, with a high level of satisfaction in 88% to 92% of patients.
DR. RAZ: Unaugmented reconstruction fails in more than 30% of cases. Some patients who have significant prolapse and attenuated tissue think that this tissue will become healthier or stronger after reconstructive surgery, but that isn’t the case. In these situations, excision and plication make no clinical sense.
The problem is that we have yet to identify the ideal surrogate for poor-quality tissue. Most of us use polypropylene mesh in different variations. We need a better material that will be nonimmunogenic, well tolerated, and easily incorporated without erosion. Xenograft-like derivatives of dermis, or allografts such as cadaveric fascia, have failed over the long term because the body reabsorbs the graft without forming any new connective tissue.
FIGURE 3 Mesh can be cut in the OR to custom-fit a patient
Hand-cut mesh and points of placement.
PHOTO: SHLOMO RAZ, MD
Is a kit a valuable aid?
DR. KARRAM: If a surgeon wants to augment a repair, what are the advantages of a packaged mesh kit, compared with simply cutting the mesh and performing surgery without a kit?
DR. WALTERS: The advantages of a packaged mesh kit are the convenience involved and the ability to consistently perform the same operation with the same product. That facilitates learning, teaching, and research. It also helps us understand the published literature a little better because “custom” prolapse repairs are operator-dependent and difficult to apply generally to a population of surgeons.
These advantages are most clearly apparent with midurethral sling mesh kits, which have almost revolutionized surgery for stress incontinence. I don’t believe mesh kits for prolapse are there yet, but they certainly have potential.
DR. RAZ: I’m opposed to the use of kits. They are industry-driven. One company has made $1 billion selling them. Imagine a patient who undergoes placement of a sling kit ($1,000), cystocele kit ($1,500), and posterior mesh kit ($1,500). How can our healthcare system sustain this burden, especially when there is no real evidence that a kit improves the operation, and given the incredible complication rate that we see?
Moreover, the kits contain a single-use needle and passer and a precut segment of polypropylene mesh. But every patient is different and requires a unique size or shape of mesh. I don’t believe that a surgeon who knows pelvic anatomy needs a kit to perform mesh-augmented reconstruction. We can buy the same segment of mesh for $200 to $400, cut it as needed, and perform the same operation advertised by industry.
For surgeons who prefer a kit, the tools that are included should be made reusable.
DR. LUCENTE: In my opinion, the primary advantage of a commercially available transvaginal mesh delivery system—notice, I avoided the word “kit,” because I think there are plenty of negative connotations associated with it—is the ability to deliver the mesh in a “tension”-free manner.
One alternative that many people pursue is cutting the mesh to size and using sutures to hold it in place while tissue ingrowth occurs. However, the hernia literature suggests that suturing mesh in place increases the risk of postoperative discomfort at the site of implantation. The true cause of the discomfort remains unclear, but it is thought to arise from nerve tethering or traction at the pre-committed points of attachment before the host tissue and mesh interface have adjusted or settled with tissue ingrowth.
All neuropathic complications of mesh implantation have been shown in the current hernia literature to be increased with the use of sutures.7 Also, as previously mentioned, it is extremely difficult to set or adjust the mesh with the vaginal incision remaining “open,” which is a downside to suture techniques.
What training is necessary to use a kit?
DR. KARRAM: Mesh kits are aggressively promoted by industry, with close to half a dozen different kits to be available soon. What is the minimum amount of training one should have before utilizing these kits?
DR. WALTERS: The surgeon should at least know how to perform traditional sutured prolapse repairs and SUI surgery and be able to perform cystoscopy. Ideally, the surgeon should undergo training on a cadaver with a skilled and experienced user of the mesh kit. The surgeon also should carefully review the risks and benefits of mesh kits with the patient and inform the patient that he or she is in the early learning curve of a particular surgery. The informed patient should have a right to refuse mesh-augmented prolapse surgery after the consent process.
DR. LUCENTE: I’m glad you asked this question. I strongly believe that surgical expertise and proficiency within gynecology need to be more effectively addressed by us all. We have a situation in our field in which techniques and technology are widening the gap between what is possible and what the surgeon is comfortable doing safely.
It’s incumbent on all of us, especially those who are in a leadership position as a chairperson or chief of a division, to work with our physician staff and faculty to optimize surgical skill and patient outcomes, including safety, with new technologies.
As for the minimal amount of training needed, that’s extremely variable. It depends on the current skill set of the physician and his or her ability to pick up the mechanics of the surgery as it is taught through a cadaver lab or preceptorship. It’s regrettable that some physicians lack the objectivity and insight to judge their own skill set. This, again, is the time for a chairperson or chief of a division to step up to the plate and ensure proper credentialing and demonstration of proficiency.
It is unrealistic to expect industry to decide who should or should not utilize this truly breakthrough technology. That is our responsibility as physicians.
DR. KARRAM: At a minimum, I think any surgeon utilizing a kit should have a firm understanding of pelvic floor anatomy and experience performing traditional repairs:
- intraperitoneal procedures such as Mc-Call culdoplasty and uterosacral suspension
- sacrospinous suspension
- retropubic procedures and anti-incontinence operations such as pubovaginal slings.
This three-dimensional understanding of the pelvic floor is mandatory if one is to assume that blind passage of trocars through potentially dangerous spaces is the wave of the future.
DR. RAZ: You need to be a pelvic surgeon, know your anatomy, and know how to manage complications if you are going to use one of these kits. You should stick to the surgery that works best in your hands. Industry cannot teach you to be a good pelvic surgeon; it takes lifelong experience.
DR. KARRAM: If you have a patient who is sexually inactive with pelvic organ prolapse, would you prefer a mesh repair or an obliterative procedure? And why?
DR. WALTERS: If the patient is sexually inactive—especially if she is older and definitely will not be in the future—it makes absolutely no sense to perform a mesh-augmented repair. A traditional, somewhat tight, sutured repair works fine in this setting and carries very low risk.
In fact, our group and others have found that, in carefully selected patients, partial colpectomy and colpocleisis procedures (without grafts) have among the highest cure and satisfaction rates of all surgeries we perform for prolapse; they also have relatively low risk.8 Recurrent prolapse after an obliterative procedure is rare; most of the dissatisfaction relates to postoperative voiding difficulties or persistent or de novo urinary incontinence.
DR. KARRAM: I also prefer an obliterative procedure. I see no reason to bring in the cost and potential for complications that mesh repair entails. An obliterative procedure should produce an anatomic success rate close to 100%, with minimal complications. It also can be performed quickly with minimal anesthesia and convalescence.
DR. LUCENTE: My response is based on a clinical study that my associate, Dr. Miles Murphy, has performed, comparing a transvaginal mesh procedure with a LaForte operation for severe pelvic organ prolapse.9 Both patient groups were well satisfied with the result, and success rates were comparable. However, the group that underwent the transvaginal mesh procedure had a shorter operative time.
As a result of these studies, we tend to prefer transvaginal mesh repair. Even though the woman may be sexually inactive, the procedure preserves vaginal function, and we all know that life has a way of being unpredictable. Her situation may change so that she once again desires sexual function.
However, for a very elderly woman—one in her late 80s or 90s—who has severe or extreme prolapse with a very large procidentia and vaginal length measuring, say, 13 cm beyond the introitus, I do prefer an obliterative procedure.
DR. RAZ: I agree. I would not offer a sexually inactive patient an obliterative procedure. You never know what the future will hold.
Mesh repair can be performed safely, provided the surgeon has good knowledge of anatomic landmarks and knows how to manage any potential complications that may arise.
1. Nygaard IE, McCreery R, Brubaker L, et al. Pelvic Floor Disorders Network. Abdominal sacrocolpopexy: a comprehensive review. Obstet Gynecol. 2004;104:805-823.
2. Benson JT, Lucente V, McClellan E. Vaginal versus abdominal reconstructive surgery for the treatment of pelvic support defects: a prospective randomized study with long-term outcome evaluation. Am J Obstet Gynecol. 1996;175:1418-1421;discussion 1421-1422.
3. Maher CF, Qatawneh AM, Dwyer PL, Carey MP, Cornish A, Schluter PJ. Abdominal sacral colpopexy or vaginal sacrospinous colpopexy for vaginal vault prolapse: a prospective randomized study. Am J Obstet Gynecol. 2004;190:20-26.
4. Murphy M. Society of Gynecologic Surgeons Systematic Review Group. Clinical practice guidelines on vaginal graft use from the Society of Gynecologic Surgeons. Obstet Gynecol. 2008;112:1123-1130.
5. Paraiso MF, Barber MD, Muir TW, Walters MD. Rectocele repair: a randomized trial of three surgical procedures including graft augmentation. Am J Obstet Gynecol. 2006;195:1762-1771.
6. Silva WA, Pauls RN, Segal JL, Rooney CM, Kleeman SD, Karram MM. Uterosacral ligament vault suspension: five-year outcomes. Obstet Gynecol 2006;108:255-263.
7. EU Hernia Trialists Collaboration. Repair of groin hernia with synthetic mesh: meta-analysis of randomized controlled trials. Ann Surg. 2002;235:322-332.
8. Barber MD, Amundsen C, Paraiso MFR, Weidner A, Romero A, Walters MD. Quality of life after surgery for genital prolapse in elderly women: obliterative and reconstructive surgery. Int Urogynecol J. 2007;18:799-806.
9. Murphy M, van Raalte H, Mercurio E, Haff R, Wiseman B, Lucente VR. Incontinence-related quality of life and sexual function following the tension-free vaginal tape vs the “inside-out” tension-free vaginal tape obturator. Int Urogynecol J. 2008;19:481-487.
A new year, a new CPT: Will these changes rattle your practice?
Take note, ObGyns: A number of changes in Current Procedural Terminology (CPT) 2009—those changes took effect January 1—are going to modify the way you bill and will have an impact on your reimbursement. Most of these changes are minor, although renumbering of infusion codes will require changes to the encounter form. And I have good and bad news for urogynecologists who perform vaginal paravaginal repairs and sling procedures for stress urinary incontinence. Read on for details!
Mesh for vaginal paravaginal defect repair—
code error corrected
Code 57267 is an add-on code that describes the insertion of mesh, or other prosthesis, through a vaginal approach when native tissues have been determined to be weak and inadequate for repair—especially in patients who have undergone a previous attempt at repair. As an add-on code, it can be billed only in addition to other, specific procedures.
Before January 1, code 57267 could only be reported with an anterior or posterior colporrhaphy, or both, or with a rectocele repair without colporrhaphy.
When performing a vaginal approach paravaginal defect repair, however, the same weakened tissues also require use of the mesh, yet code 57825 (paravaginal defect repair [including repair of cystocele, if performed]) was not included as one of the allowed codes. This error is rectified in 2009.
You must still be aware that reporting the 57267 add-on code requires that you establish medical necessity for its use. Documentation of weakened, attenuated, or incompetent pubocervical tissue in the case of a paravaginal repair (International Classification of Diseases Clinical Modification [ICD-9-CM] code 618.81) or rectovaginal tissue for rectocele/enterocele repair (618.82) continues to be important when reporting the add-on mesh code.
A reminder about anesthesia
Until January 1, codes 57400 (dilation of vagina), 57410 (pelvic examination), and 57415 (removal of impacted vaginal foreign body) read “under anesthesia.” In a move to standardize terminology, these codes will be revised to add the wording “other than local.” The revision clarifies that 1) all surgical codes include administration of a local anesthetic and 2) codes designated with “under anesthesia” refer to regional blocks and general anesthesia.
of 2 urogynecology procedures for UI!
Although not a CPT change, it’s worth noting that physicians who perform 1) sling operations for correcting stress urinary incontinence or 2) subsequent revisions because of problems with fascia or synthetic mesh need to be aware that the physician work relative value for these procedures has been decreased in 2009 by the Centers for Medicare and Medicaid Services (CMS). Why the drop? According to CMS, results of surveys by the American Urogynecologic Society and the American Urological Association indicate that the procedures are not as difficult to perform as once considered.
The two affected codes are:
| 57288 | Sling operation for stress incontinence (e.g., fascia or synthetic) |
| 57287 | Removal or revision of sling for stress urinary incontinence (e.g., fascia or synthetic) |
The change will result in a decline in payment for these procedures by Medicare and some non-Medicare payers, and will be felt harder with sling procedures than with revisions. Why? The work relative value units (RVUs) decreased for 57287, but that decrease was offset by an increase in practice expense relative value—which resulted in total RVUs increasing for this code in 2009, from 18.31 to 18.53.
Code 57288, on the other hand, has been tagged with a decrease in both the physician work and practice expense RVUs. Total RVUs for this code, therefore, have dropped from 21.59 to 19.62. In Medicare dollars, that equates to about $118 less for the same procedure when one applies the 2009 Medicare conversion factor of $36.07.
New human papillomavirus vaccine, new code
A new code, 90650, has been added to report the newer bivalent human papillomavirus (HPV) vaccine, which contains an adjuvant formulation and is intended to protect against infection by high-risk HPV types 16 and 18. The existing HPV vaccine code, 90649, targets those high-risk types of HPV and two low-risk types (6 and 11).
Coverage recommendations for the new vaccine match those of the existing, quadrivalent vaccine, but not all payers are covering the HPV vaccine based on those recommendations. The new vaccine offers a less costly alternative for patients whose health-care insurance does not cover the vaccine or who are uninsured.
Wholesale reorganization of injection and infusion codes
Codes 90760–90779 (covering therapeutic, prophylactic, and diagnostic injections and infusions) are deleted in 2009 and renumbered, with the same descriptors, to 96360–96379. This was done to organize all infusions and injections together. The biggest change for you and every other ObGyn? You must revise the practice’s encounter form to reflect the requirement that intramuscular and subcutaneous injections are now coded 96372 instead of 90772.
Modifier -21 and prolonged E/M services
Now deleted is Modifier -21 (prolonged evaluation and management [E/M] service). This modifier represented acknowledgment that a continuous face-to-face E/M service could exceed the maximum time allowed by the highest level of E/M service for the type being billed.
In other words, before January 1, 2009, if a patient’s condition was such that you documented an established or new patient visit (99215 or 99205) but in fact spent more time with her than the 45 or 60 minutes that typically accompanies these codes, you added modifier -21 in the hope of receiving higher reimbursement. Now the modifier is deleted because there is already a mechanism in place to report such prolonged service.
Add-on codes 99354–99357 are used to report face-to-face outpatient and inpatient prolonged E/M services. Guidelines for these codes mandate cumulative time rather than continuous time, and using the add-on codes is contingent on the additional time spent being 30 or more minutes above the typical time allotted for the basic E/M service that you are billing.
Here’s a case that exemplifies how coding works in these circumstances:
CASE
You evaluate a patient for severe uterine bleeding, and report a level-4 visit (99214), which has a typical time of 25 minutes. At the same visit, you determine that endometrial biopsy is required, and you perform it during the visit. But the patient faints during the procedure—and you spend an additional 35 minutes (cumulative time) with her before you send her home.
Because the typical time of 25 minutes was exceeded by at least 30 minutes, you should report 99354 (prolonged physician service in the office or other outpatient setting requiring direct [face-to-face] patient contact beyond the usual service; first hour [list separately in addition to code for office or other outpatient Evaluation and Management service]) in addition to 99214.
Guidelines for correct use of these codes are also being revised to emphasize that only outpatient prolonged services codes are intended to be used to report total duration of face-to-face time; on the other hand, inpatient codes are intended to report the total duration of the time spent (whether continuous or noncontinuous) by the physician on the unit actively involved in caring for the patient.
Man treated for asthma dies of undiagnosed heart disease...Failure to confirm Echo result leads to cardiac arrest...more...
Man treated for asthma dies of undiagnosed heart disease
A MONTH AFTER HE BEGAN RECEIVING ASTHMA TREATMENT from his physician, a 50-year-old man suffered a heart attack and died. An autopsy revealed idiopathic dilated cardiomyopathy.
PLAINTIFF’S CLAIM: The doctor negligently failed to examine the patient for heart disease; the patient was in congestive heart failure during treatment.
DOCTOR’S DEFENSE: The physician claimed that he twice recommended that the patient see a cardiologist. The plaintiff countered that the doctor didn’t make a referral, despite chart notes to that effect.
VERDICT: California defense verdict.
COMMENT: Clear documentation of the history, physical, and differential diagnostic thinking helps fend off unwarranted lawsuits.
Failure to confirm Echo result leads to cardiac arrest
SUDDEN ONSET OF CHEST PAIN radiating to the back, which had started during rest, brought a 49-year-old woman to the hospital. The patient also complained of pain radiating to her left jaw and ear, which became worse when she inhaled or moved. She had no shortness of breath, palpitations, diaphoresis, or history of trauma. She did have a history of gastroesophageal reflux disease (GERD), but said that the pain didn’t resemble the pain of GERD. While in the triage area, she vomited.
Two electrocardiograms (EKGs) done in the emergency room showed sinus bradycardia and nonspecific T-wave abnormalities. A chest radiograph was reported as normal, but with a note of borderline heart enlargement and a tortuous aorta. A gastrointestinal (GI) cocktail of Nitropaste and Toradol didn’t relieve the pain, nor did Ativan. No workup for aortic dissection was done.
After consultation with a doctor covering for the patient’s primary care physician, the patient was hospitalized with orders for laboratory studies, a chest radiograph, and an EKG the next morning. The EKG again showed abnormalities, including a nonspecific T-wave abnormality, as did the chest radiograph (moderate cardiomegaly, tortuous aorta, mild prominence of the pulmonary vasculature without evidence of congestive failure, and small left pleural effusion or slight blunting of the left lateral costophrenic angle). But the radiograph wasn’t compared to the one taken the night before. A GI consult—by which time the patient’s hematocrit had dropped from 32 to 26—attributed the pain to GERD and recommended outpatient esophagogastroduodenoscopy.
The results of a routine echocardiogram—faxed to the patient’s floor the same day—were worrisome: a dilated aortic root and ascending aorta accompanied by at least moderately severe aortic insufficiency and normal ventricular function.
The patient’s primary care physician saw the patient and discharged her that evening. Fewer than 2 hours later, the patient suffered a cardiac arrest at home and couldn’t be resuscitated after transport to the hospital. An autopsy found the cause of death to be cardiac tamponade resulting from dissection of an aortic aneurysm.
PLAINTIFF’S CLAIM: The patient shouldn’t have been discharged without clarification of the echocardiogram results.
DOCTOR’S DEFENSE: The primary care physician’s understanding was that the cardiologist had ruled out heart-related problems, including aortic dissection, and that the patient had been diagnosed with a stomach illness, which would be followed on an outpatient basis. Even if a diagnosis of aortic dissection had been made, the outcome would have been the same.
VERDICT: $560,000 Massachusetts settlement.
COMMENT: Inadequate follow-up of testing—in this case, an inpatient echocardiogram—can have catastrophic results. Before discharge, each inpatient test should be reviewed and adjudicated, and a clear plan for follow-up delineated.
Cancer missed in patient with rectal bleeding
A 44-YEAR-OLD MAN went to his family physician, an internist, with complaints that included rectal bleeding. The physician performed a flexible sigmoidoscopy, which found hemorrhoids that weren’t inflamed or bleeding. A hemoccult test at a physical exam before the sigmoidoscopy was positive for bleeding.
A year later, the patient returned to the doctor complaining of blood in his underwear almost every other day. The doctor noted a “slightly inflamed hemorrhoid” on anoscopy, but no bleeding from the hemorrhoid; he didn’t test for occult bleeding.
Early the next year, the patient saw the physician for a complaint of blood in the stool and changes in bowel habits. A hemoccult test was positive, and the doctor diagnosed irritable bowel syndrome. The patient returned 6 months later with the same complaints and, he said, requested referral to a gastroenterologist. The doctor again attributed the complaints to irritable bowel syndrome.
Early the following year, the patient went to another internist because his insurance changed. This internist immediately diagnosed stage-3 rectal cancer. The patient underwent radiation, chemotherapy, and 2 surgeries, one to remove part of his rectum and a second to reverse an ileostomy done during the first operation. The patient was left impotent, with permanent, variable bowel dysfunction.
PLAINTIFF’S CLAIM: The diagnosis of hemorrhoids wasn’t reasonable; the patient should have been referred to a gastroenterologist or for colorectal cancer surgery. Early detection and diagnosis would have resulted in removal of a polyp or early cancer, which could have been done during a colonoscopy or by transanal excision.
DOCTOR’S DEFENSE: The patient’s doctor denied that the patient had requested a referral to a gastroenterologist and maintained that he believed the flexible sigmoidoscopy had ruled out a serious cause of bleeding.
VERDICT: $1 million Virginia verdict.
COMMENT: When a patient has persistent rectal bleeding without a clear cause, no matter what the patient’s age, further evaluation or referral is prudent.
ACE inhibitors and ARBs: One or the other—not both—for high-risk patients
Avoid prescribing an angiotensin-converting enzyme (ACE) inhibitor and an angiotensin receptor blocker (ARB) for patients at high risk of vascular events or renal dysfunction. The combination does not reduce poor outcomes, and leads to more adverse drug-related events than an ACE inhibitor or ARB alone.1
Strength of recommendation
B: 1 large, high-quality randomized controlled trial (RCT).
The ONTARGET investigators. Telmisartan, ramipril, or both in patients at high risk for vascular events. N Engl J Med. 2008;358:1547-1559.
ILLUSTRATIVE CASE
A 56-year-old patient with well-controlled type 2 diabetes and hypertension comes to see you for routine follow up. His blood pressure is controlled with lisinopril 40 mg/d. But his albumin-to-creatinine ratio is 75 mg/g, and your records reveal that his albuminuria is getting progressively worse.
You’re aware of the potential benefits of a dual angiotensin blockade, and are considering adding an angiotensin receptor blocker (ARB) to your patient’s medication regimen. You wonder whether the combination of an angiotensin-converting enzyme (ACE) inhibitor and an ARB will slow the decline of renal function. You also wonder whether the combination will reduce your patient’s cardiovascular risk.
ACE inhibitors are known to reduce cardiovascular morbidity and mortality, as well as proteinuria in patients with vascular disease or diabetes, whether or not they have heart failure.2 But few studies have compared the effects of ACE inhibitors and ARBs in high-risk patients without heart failure. Nor has there been a definitive study of the effects of an ACE inhibitor–ARB combination on proteinuria and cardiovascular risk.
Are 2 drugs better than 1?
In a recent meta-analysis, researchers reported that combination therapy had a beneficial effect on proteinuria.3 But that observation was based on a small number of patients (N=309 from 10 studies), short follow up, and a lack of data on key clinical end points such as decline of the glomerular filtration rate (GFR) and the onset of dialysis.
Other evidence comes from a study of 199 patients with diabetes and microalbuminuria, in which the ACE inhibitor-ARB combination reduced proteinuria more than either agent alone.4 And in a study of 336 patients with nondiabetic nephropathy, the 2-drug combination slowed the decline in renal function more than monotherapy.5
Small studies raise hopes. These preliminary findings, along with the theoretical benefits of dual angiotensin blockade, suggested that the benefits of taking both agents together could be significant. A large, well-done randomized controlled trial (RCT) was needed to determine the following: (1) whether an ARB is as effective as an ACE inhibitor in reducing morbidity and mortality in high-risk patients who don’t have heart failure, and (2) whether the ACE inhibitor–ARB combination is better than monotherapy for patients at high risk.
The ONTARGET study:
- established that telmisartan, an ARB, is not inferior to ramipril, an ACE inhibitor, in reducing cardiovascular and renal events in high-risk patients without heart failure.
- found that either drug alone is more effective than combination therapy for this patient population.
- cast fresh doubt on the assumption that proteinuria is an accurate surrogate marker for progressive renal dysfunction.
STUDY SUMMARY: Vascular outcomes same for ACE inhibitors, ARBs
The ONgoing Telmisartan Alone and in combination with Ramipril Global Endpoint Trial (ONTARGET), a multi-year study of thousands of patients, addressed both of those questions. The researchers compared the effects of both telmisartan (Micardis, an ARB) alone and a telmisartan + ramipril (Altace, an ACE inhibitor) combination with the effects of the ACE inhibitor alone in patients ≥55 years of age with established atherosclerotic vascular disease or diabetes with end-organ damage.1 Exclusion criteria included major renal artery stenosis, uncorrected volume or sodium depletion, a serum creatinine concentration of ≥3 mg/dL, and uncontrolled hypertension (>160 mm Hg systolic or >100 mm Hg diastolic).
After a 3-week run-in period to eliminate those who were unable to tolerate either medication or were nonadherent, a total of 25,620 patients remained. They were randomly assigned to take ramipril 10 mg/d, telmisartan 80 mg/d, or both the ACE inhibitor and the ARB. The researchers followed the patients for a median of 56 months.
The primary composite outcome was death from cardiovascular causes, myocardial infarction, stroke, or hospitalization for heart failure;1 the main renal outcome was a composite of first dialysis, doubling of serum creatinine, or death.6
The percentage of patients with the primary outcome was the same in all 3 groups (~16.5%). This finding was somewhat surprising because the blood pressure of patients in the combination therapy group was 2 to 3 mm Hg lower overall (both systolic and diastolic) than the blood pressure of patients on monotherapy—a difference that in other studies has been associated with an estimated 4% to 5% reduction in risk.1,2 Patients in the combination group had more hypotensive symptoms compared with those in the ramipril group (4.8% vs 1.7%, number needed to harm [NNH]=32, P<.001).
Renal dysfunction was highest in dual therapy group
Patients in the combination therapy group had higher rates of renal dysfunction than either the ramipril group (13.5% vs 10.2%, NNH=30, P<.001) or the telmisartan group (10.6%), despite a decrease in proteinuria among those on dual therapy. Patients taking the 2-drug combination also had higher rates of hyperkalemia.
While telmisartan proved to be equal to ramipril in reducing vascular events in high-risk patients, patients taking the ACE inhibitor experienced more cough (NNH=32, P<.001) and angioedema (NNH=500, P=.01). In both monotherapy groups, the rates of adverse drug reactions were probably lower than what we typically see in clinical practice because after the run-in period, only patients who were better able to tolerate both medications remained.
WHAT’S NEW: Combination causes renal impairment
This study established that telmisartan, an ARB, is not inferior to ramipril, an ACE inhibitor, in reducing cardiovascular and renal events in patients without heart failure. In addition, as the largest RCT to explore the effects of a dual blockade of the renin-angiotensin system with an ACE inhibitor and an ARB, it casts fresh doubt on the assumption that proteinuria is an accurate surrogate marker for progressive renal dysfunction. The reduction in proteinuria seen in patients in the combination therapy group came at a cost of increased renal impairment.
CAVEATS: Findings do not apply to heart failure patients
More than 11% of potential subjects were excluded from this study during the run-in period. This suggests that physicians in practice are likely to find a significant number of patients who are unable to tolerate (or fail to adhere to) monotherapy with ACE inhibitors or ARBs.
At baseline, only a small subgroup—13%—had overt diabetic nephropathy, the hallmark for a substantial continuous decline of GFR. However, 38% of the study group had diabetes, and almost 30% of these diabetes patients had microalbuminuria. Subgroup analysis found results consistent with the overall group, and the large sample size reduces the likelihood that these findings were due to low power. The overall rate of dialysis and doubling of serum creatinine was low, but still statistically significant, due to the large size of this study.
In determining treatment for high-risk patients with vascular disease or diabetes, it is important to keep the study population in mind. Studies of patients with poorly controlled congestive heart failure (CHF) have shown potential benefits from an ACE inhibitor–ARB combination.7 The ONTARGET trial specifically excluded individuals with CHF, and its findings—and recommendations to avoid combination therapy—should not be applied to heart failure patients.
CHALLENGES TO IMPLEMENTATION: Best microalbuminuria Tx remains elusive
Although albuminuria has been considered an early sign of the onset of diabetic nephropathy, the ONTARGET study demonstrated that combination therapy may cause further reduction in albuminuria but still adversely affect renal function. Thus, this study raises important questions about the best treatment for patients with diabetes who have microalbuminuria and are already on either an ACE inhibitor or an ARB. We wonder, too, whether we should continue to test for microalbuminuria in patients who are taking one of these agents, given the lack of guidance regarding further treatment.
Acknowledgements
The PURLs Surveillance System is supported in part by Grant Number UL1RR024999 from the National Center for Research Resources, a Clinical Translational Science Award to the University of Chicago. The content is solely the responsibility of the authors and does not necessarily represent the official views of the National Center for Research Resources or the National Institutes of Health.
PURLs methodology
This study was selected and evaluated using FPIN’s Priority Updates from the Research Literature (PURL) Surveillance System methodology. The criteria and findings leading to the selection of this study as a PURL can be accessed at www.jfponline.com/purls.
Click here to view PURL METHODOLOGY
1. The ONTARGET Investigators. Telmisartan, ramipril, or both in patients at high risk for vascular events. N Engl J Med. 2008;358:1547-1559.
2. Yusuf S, Sleight P, Pogue J, et al. Effects of an angiotensin-converting-enzyme inhibitor, ramipril, on cardiovascular events in high-risk patients. The Heart Outcomes Prevention Evaluation Study Investigators. N Engl J Med. 2000;342:145-153.
3. Jennings DL, Kalus JS, Coleman CI, et al. Combination therapy with an ACE inhibitor and an angiotensin receptor blocker for diabetic nephropathy: a meta-analysis. Diabet Med. 2007;24:486-493.
4. Mogensen CE, Neldam S, Tikkanen I, et al. Randomised controlled trial of dual blockade of renin-angiotensin system in patients with hypertension, microalbuminuria, and non-insulin dependent diabetes: the candesartan and lisinopril microalbuminuria (CALM) study. BMJ. 2000;321:1440-1444.
5. Nakao N, Yoshimura A, Morita H, et al. Combination treatment of angiotensin-II receptor blocker and angiotensin-converting-enzyme inhibitor in non-diabetic renal disease (COOPERATE): a randomised controlled trial. Lancet. 2003;361:117-124.
6. Mann JF, Schmieder RE, McQueen M, et al. Renal outcomes with telmisartan, ramipril, or both, in people at high vascular risk (the ONTARGET study): a multicentre, randomised, double-blind, controlled trial. Lancet. 2008;372:547-553.
7. Cohn JN, Tognoni G. A randomized trial of the angiotensin-receptor blocker valsartan in chronic heart failure. N Engl J Med. 2001;345:1667-1675.
Avoid prescribing an angiotensin-converting enzyme (ACE) inhibitor and an angiotensin receptor blocker (ARB) for patients at high risk of vascular events or renal dysfunction. The combination does not reduce poor outcomes, and leads to more adverse drug-related events than an ACE inhibitor or ARB alone.1
Strength of recommendation
B: 1 large, high-quality randomized controlled trial (RCT).
The ONTARGET investigators. Telmisartan, ramipril, or both in patients at high risk for vascular events. N Engl J Med. 2008;358:1547-1559.
ILLUSTRATIVE CASE
A 56-year-old patient with well-controlled type 2 diabetes and hypertension comes to see you for routine follow up. His blood pressure is controlled with lisinopril 40 mg/d. But his albumin-to-creatinine ratio is 75 mg/g, and your records reveal that his albuminuria is getting progressively worse.
You’re aware of the potential benefits of a dual angiotensin blockade, and are considering adding an angiotensin receptor blocker (ARB) to your patient’s medication regimen. You wonder whether the combination of an angiotensin-converting enzyme (ACE) inhibitor and an ARB will slow the decline of renal function. You also wonder whether the combination will reduce your patient’s cardiovascular risk.
ACE inhibitors are known to reduce cardiovascular morbidity and mortality, as well as proteinuria in patients with vascular disease or diabetes, whether or not they have heart failure.2 But few studies have compared the effects of ACE inhibitors and ARBs in high-risk patients without heart failure. Nor has there been a definitive study of the effects of an ACE inhibitor–ARB combination on proteinuria and cardiovascular risk.
Are 2 drugs better than 1?
In a recent meta-analysis, researchers reported that combination therapy had a beneficial effect on proteinuria.3 But that observation was based on a small number of patients (N=309 from 10 studies), short follow up, and a lack of data on key clinical end points such as decline of the glomerular filtration rate (GFR) and the onset of dialysis.
Other evidence comes from a study of 199 patients with diabetes and microalbuminuria, in which the ACE inhibitor-ARB combination reduced proteinuria more than either agent alone.4 And in a study of 336 patients with nondiabetic nephropathy, the 2-drug combination slowed the decline in renal function more than monotherapy.5
Small studies raise hopes. These preliminary findings, along with the theoretical benefits of dual angiotensin blockade, suggested that the benefits of taking both agents together could be significant. A large, well-done randomized controlled trial (RCT) was needed to determine the following: (1) whether an ARB is as effective as an ACE inhibitor in reducing morbidity and mortality in high-risk patients who don’t have heart failure, and (2) whether the ACE inhibitor–ARB combination is better than monotherapy for patients at high risk.
The ONTARGET study:
- established that telmisartan, an ARB, is not inferior to ramipril, an ACE inhibitor, in reducing cardiovascular and renal events in high-risk patients without heart failure.
- found that either drug alone is more effective than combination therapy for this patient population.
- cast fresh doubt on the assumption that proteinuria is an accurate surrogate marker for progressive renal dysfunction.
STUDY SUMMARY: Vascular outcomes same for ACE inhibitors, ARBs
The ONgoing Telmisartan Alone and in combination with Ramipril Global Endpoint Trial (ONTARGET), a multi-year study of thousands of patients, addressed both of those questions. The researchers compared the effects of both telmisartan (Micardis, an ARB) alone and a telmisartan + ramipril (Altace, an ACE inhibitor) combination with the effects of the ACE inhibitor alone in patients ≥55 years of age with established atherosclerotic vascular disease or diabetes with end-organ damage.1 Exclusion criteria included major renal artery stenosis, uncorrected volume or sodium depletion, a serum creatinine concentration of ≥3 mg/dL, and uncontrolled hypertension (>160 mm Hg systolic or >100 mm Hg diastolic).
After a 3-week run-in period to eliminate those who were unable to tolerate either medication or were nonadherent, a total of 25,620 patients remained. They were randomly assigned to take ramipril 10 mg/d, telmisartan 80 mg/d, or both the ACE inhibitor and the ARB. The researchers followed the patients for a median of 56 months.
The primary composite outcome was death from cardiovascular causes, myocardial infarction, stroke, or hospitalization for heart failure;1 the main renal outcome was a composite of first dialysis, doubling of serum creatinine, or death.6
The percentage of patients with the primary outcome was the same in all 3 groups (~16.5%). This finding was somewhat surprising because the blood pressure of patients in the combination therapy group was 2 to 3 mm Hg lower overall (both systolic and diastolic) than the blood pressure of patients on monotherapy—a difference that in other studies has been associated with an estimated 4% to 5% reduction in risk.1,2 Patients in the combination group had more hypotensive symptoms compared with those in the ramipril group (4.8% vs 1.7%, number needed to harm [NNH]=32, P<.001).
Renal dysfunction was highest in dual therapy group
Patients in the combination therapy group had higher rates of renal dysfunction than either the ramipril group (13.5% vs 10.2%, NNH=30, P<.001) or the telmisartan group (10.6%), despite a decrease in proteinuria among those on dual therapy. Patients taking the 2-drug combination also had higher rates of hyperkalemia.
While telmisartan proved to be equal to ramipril in reducing vascular events in high-risk patients, patients taking the ACE inhibitor experienced more cough (NNH=32, P<.001) and angioedema (NNH=500, P=.01). In both monotherapy groups, the rates of adverse drug reactions were probably lower than what we typically see in clinical practice because after the run-in period, only patients who were better able to tolerate both medications remained.
WHAT’S NEW: Combination causes renal impairment
This study established that telmisartan, an ARB, is not inferior to ramipril, an ACE inhibitor, in reducing cardiovascular and renal events in patients without heart failure. In addition, as the largest RCT to explore the effects of a dual blockade of the renin-angiotensin system with an ACE inhibitor and an ARB, it casts fresh doubt on the assumption that proteinuria is an accurate surrogate marker for progressive renal dysfunction. The reduction in proteinuria seen in patients in the combination therapy group came at a cost of increased renal impairment.
CAVEATS: Findings do not apply to heart failure patients
More than 11% of potential subjects were excluded from this study during the run-in period. This suggests that physicians in practice are likely to find a significant number of patients who are unable to tolerate (or fail to adhere to) monotherapy with ACE inhibitors or ARBs.
At baseline, only a small subgroup—13%—had overt diabetic nephropathy, the hallmark for a substantial continuous decline of GFR. However, 38% of the study group had diabetes, and almost 30% of these diabetes patients had microalbuminuria. Subgroup analysis found results consistent with the overall group, and the large sample size reduces the likelihood that these findings were due to low power. The overall rate of dialysis and doubling of serum creatinine was low, but still statistically significant, due to the large size of this study.
In determining treatment for high-risk patients with vascular disease or diabetes, it is important to keep the study population in mind. Studies of patients with poorly controlled congestive heart failure (CHF) have shown potential benefits from an ACE inhibitor–ARB combination.7 The ONTARGET trial specifically excluded individuals with CHF, and its findings—and recommendations to avoid combination therapy—should not be applied to heart failure patients.
CHALLENGES TO IMPLEMENTATION: Best microalbuminuria Tx remains elusive
Although albuminuria has been considered an early sign of the onset of diabetic nephropathy, the ONTARGET study demonstrated that combination therapy may cause further reduction in albuminuria but still adversely affect renal function. Thus, this study raises important questions about the best treatment for patients with diabetes who have microalbuminuria and are already on either an ACE inhibitor or an ARB. We wonder, too, whether we should continue to test for microalbuminuria in patients who are taking one of these agents, given the lack of guidance regarding further treatment.
Acknowledgements
The PURLs Surveillance System is supported in part by Grant Number UL1RR024999 from the National Center for Research Resources, a Clinical Translational Science Award to the University of Chicago. The content is solely the responsibility of the authors and does not necessarily represent the official views of the National Center for Research Resources or the National Institutes of Health.
PURLs methodology
This study was selected and evaluated using FPIN’s Priority Updates from the Research Literature (PURL) Surveillance System methodology. The criteria and findings leading to the selection of this study as a PURL can be accessed at www.jfponline.com/purls.
Click here to view PURL METHODOLOGY
1. The ONTARGET Investigators. Telmisartan, ramipril, or both in patients at high risk for vascular events. N Engl J Med. 2008;358:1547-1559.
2. Yusuf S, Sleight P, Pogue J, et al. Effects of an angiotensin-converting-enzyme inhibitor, ramipril, on cardiovascular events in high-risk patients. The Heart Outcomes Prevention Evaluation Study Investigators. N Engl J Med. 2000;342:145-153.
3. Jennings DL, Kalus JS, Coleman CI, et al. Combination therapy with an ACE inhibitor and an angiotensin receptor blocker for diabetic nephropathy: a meta-analysis. Diabet Med. 2007;24:486-493.
4. Mogensen CE, Neldam S, Tikkanen I, et al. Randomised controlled trial of dual blockade of renin-angiotensin system in patients with hypertension, microalbuminuria, and non-insulin dependent diabetes: the candesartan and lisinopril microalbuminuria (CALM) study. BMJ. 2000;321:1440-1444.
5. Nakao N, Yoshimura A, Morita H, et al. Combination treatment of angiotensin-II receptor blocker and angiotensin-converting-enzyme inhibitor in non-diabetic renal disease (COOPERATE): a randomised controlled trial. Lancet. 2003;361:117-124.
6. Mann JF, Schmieder RE, McQueen M, et al. Renal outcomes with telmisartan, ramipril, or both, in people at high vascular risk (the ONTARGET study): a multicentre, randomised, double-blind, controlled trial. Lancet. 2008;372:547-553.
7. Cohn JN, Tognoni G. A randomized trial of the angiotensin-receptor blocker valsartan in chronic heart failure. N Engl J Med. 2001;345:1667-1675.
Copyright © 2009 The Family Physicians Inquiries Network.
All rights reserved.