User login
Ki-67 bests cytology, growth pattern as prognostic factor for MCL
Evaluating routinely available histopathological prognostic features from more than 500 MCL patients in prospective trials, researchers found that the Ki-67 index is a better prognostic factor than are cytology and growth pattern in mantle-cell lymphoma (MCL). In addition, the combination of the Ki-67 index with the Mantle Cell Lymphoma International Prognostic Index [MIPI] defined four prognostic groups with better discrimination than did MIPI or the two-category biologic MIPI (MIPI-b) alone.
Higher Ki-67 index was associated with poorer overall survival (OS) (hazard ratio [HR], 1.24 per 10% increase; P less than .001) and progression-free survival (PFS) (HR, 1.17; P less than .001). Consistent with an earlier, population-based study, results showed prognostic value for a 30% cutoff of the Ki-67 index. Quantitative levels below 30% provided no additional prognostic information.
“The Ki-67 index remains the only routinely available independent prognostic factor in addition to MIPI. In contrast to cytology and growth pattern, the Ki-67 evaluation has been standardized for routine application,” wrote Dr. Eva Hoster of University Hospital Munich, and colleagues. “The modified combination of Ki-67 index and MIPI integrates the most important clinical and biologic markers currently available in clinical routine and was shown to allow a simple and powerful risk stratification superior to MIPI and MIPI-b in our evaluation,” they added (J Clin Oncol. 2016 Feb. 29. doi: 10.1200/jco.63.8387).
Blastoid cytology was associated with inferior 5-year OS compared with nonblastoid cytology (35% vs. 68%; HR, 2.35; P less than .001) and PFS (29% vs. 44%; HR, 1.58; P = .007), but the effect was largely accounted for by a generally higher Ki-67 index in blastoid MCL. Diffuse growth pattern was associated slightly worse 5-year OS (61% vs. 72%; HR, 1.38; P = .048) and PFS (38% vs. 49%; HR, 1.25; P = .087), but the effect was largely explained by MIPI score.
Combining dichotomized Ki-67 (above or below 30%) with MIPI risk groups defined four prognostic groups by the sum of weights (total 0 to 3): Ki-67 of 30% or more (weight 1), intermediate-risk MIPI (weight 1), and high-risk MIPI (weight 2). The 5-year OS rates for the four groups ranged from 17% to 85%, with OS hazard ratios greater than 2 between adjacent risk groups.
The study analyzed pooled data from two randomized trials initiated in 2004 by the European Mantle Cell Lymphoma Network, MCL Younger and MCL Elderly. In total, 508 patients of median age 62 years were included. The proportion of low-risk, intermediate-risk, and high-risk MIPI were 41%, 35%, and 24%, respectively.
Research was supported in part by Roche. Dr. Hoster reported receiving funding from Roche Pharma AG and Celgene. Several of her coauthors reported ties to industry.
FROM JOURNAL OF CLINICAL ONCOLOGY
Key clinical point: The Ki-67 index was superior to cytology and growth pattern as a prognostic factor in mantle-cell lymphoma (MCL).
Major finding: Higher Ki-67 index was associated with poorer overall survival (hazard ratio [HR], 1.24 per 10% increase; P less than .001) and progression-free survival (HR, 1.17; P less than .001).
Data source: Pooled data from two randomized trials initiated in 2004 by the European Mantle Cell Lymphoma Network, MCL Younger and MCL Elderly, included 508 patients.
Disclosures: Research was supported in part by Roche. Dr. Hoster reported receiving funding from Roche Pharma AG and Celgene. Several of her coauthors reported ties to industry.
Intellectual disability impedes decision-making in organ transplantation
CASE REPORT Evaluation for renal transplant
Mr. B, age 21, who has a diagnosis of autism spectrum disorder and an IQ comparable to that of a 4-year-old, is referred for evaluation of his candidacy for renal transplant.
A few months earlier, Mr. B pulled out his temporary dialysis catheter. Now, he receives hemodialysis through an arteriovenous fistula in the arm, but requires constant supervision during dialysis.
At evaluation, Mr. B is accompanied by his parents and his older sister, who have been providing day-to-day care for him. They appear fully committed to his well-being.
Mr. B does not have a living donor.
Needed: Assessment of adaptive functioning
DSM-5 defines intellectual disability as a disorder with onset during the developmental period. It includes deficits of intellectual and adaptive functioning in conceptual, social, and practical domains.
Regrettably, many authors focus exclusively on intellectual functioning and IQ, classifying patients as having intellectual disability based on intelligence tests alone.1,2 Adaptive capabilities are insufficiently taken into consideration; there is an urgent need to supplement IQ testing with neuropsychological testing of a patient’s cognitive and adaptive functioning.
Landmark case
In 1995, Sandra Jensen, age 34, with trisomy 21 (Down syndrome) was denied a heart and lung transplant at 2 prominent academic institutions. The denial created a national debate; Jensen’s advocates persuaded one of the hospitals to reconsider.3,4
In 1996, Jensen received the transplant, but she died 18 months later from complications of immunosuppressive therapy. Her surgery was a landmark event; previously, no patient with trisomy 21 or intellectual disability had undergone organ transplantation.
Although attitudes and practices have changed in the past 2 decades, intellectual disability is still considered a relative contraindication to certain organ transplants.5
Why is intellectual disability still a contraindication?
Allocation of transplant organs is based primarily on the ethical principle of utilitarianism: ie, a morally good action is one that helps the greatest number of people. “Benefit” might take the form of the number of lives saved or the number of years added to a patient’s life.
There is little consensus on the definition of quality of life, with its debatable ideological standpoint that stands, at times, in contrast to distributive justice. Studies have shown that the long-term outcome for patients with intellectual disability who received a kidney transplant is comparable to the outcome after renal transplant for patients who are not intellectually disabled. In other studies, patients with intellectual disability and their caregivers report improvement in quality of life after transplant.
The goal of successful transplantation is improvement in quality of life and an increase in longevity. Compliance with all aspects of post-transplant treatment is essential—which is why intellectual disability remains a relative contraindication to heart transplantation in the guidelines of the International Society for Heart and Lung Transplantation. The society’s position is based on a theoretical rationale: ie, “concerns about compliance.”
Only 7 cases of successful long-term outcome after cardiac transplantation have been reported in patients with intellectual disability, and these were marked by the presence of the social and cognitive support necessary for post-transplant compliance with treatment.5 One of these 7 patients had a lengthy hospitalization 4 years after transplantation because of poor adherence to his medication regimen, following the functional decline of his primary caregiver.
Two-pronged evaluation is needed. Most patients undergoing organ transplantation receive a psychosocial assessment that varies from institution to institution. Intellectual disability can add complexity to the task of assessing candidacy for transplantation, however. In these patients, the availability and adequacy of caregivers is as important a part of decision-making as assessment of the patients themselves—yet studies of the assessment of caregivers are limited. The patient’s caregivers should be present during evaluation so that their knowledge, ability, and willingness to take on post-transplant responsibilities can be assessed. More research is needed on long-term outcomes of successful transplantation in patients with intellectual disability.
CASE CONTINUED Placement on hold
The transplant committee decides to postpone placing Mr. B on the transplant waiting list. Consensus is to revisit the question of placing him on the list at a later date.
What led to this decision?
The committee had several concerns about approving Mr. B for a transplant:
- His history of pulling out the catheter meant that he would require closer postoperative monitoring, because he would likely have drains and a urinary catheter inserted.
- Maintaining adequate oral hydration with a new kidney could be a challenge because Mr. B would not be able to comprehend how dehydration can destroy a new kidney.
- His parents believed that, after transplant, Mr. B would not be dependent on them; they failed to understand that he requires lifelong supervision to ensure compliance with immunosuppressive medications and return for follow-up.
The committee’s decision was aided by the rationale that dialysis is readily available and is a sustainable alternative to transplantation.
Mr. B’s case raises an ethical question
We speculate what the team’s decision about transplantation would have been if Mr. B (1) had a living donor or (2) was being considered for a heart, lung, or liver transplant—for which there is no analogous procedure to dialysis to sustain the patient.
1. Arciniegas DB, Filley CM. Implications of impaired cognition for organ transplant candidacy. Curr Opin Organ Transplant. 1999;4(2):168-172.
2. Dobbels F. Intellectual disability in pediatric transplantation: pitfalls and opportunities. Pediatr Transplant. 2014;18(7):658-660.
3. Martens MA, Jones L, Reiss S. Organ transplantation, organ donation and mental retardation. Pediatr Transplant. 2006;10(6):658-664.
4. Panocchia N, Bossola M, Vivanti G. Transplantation and mental retardation: what is the meaning of a discrimination? Am J Transplant. 2010;10(4):727-730.
5. Samelson-Jones E, Mancini D, Shapiro PA. Cardiac transplantation in adult patients with mental retardation: do outcomes support consensus guidelines? Psychosomatics. 2012;53(2):133-138.
CASE REPORT Evaluation for renal transplant
Mr. B, age 21, who has a diagnosis of autism spectrum disorder and an IQ comparable to that of a 4-year-old, is referred for evaluation of his candidacy for renal transplant.
A few months earlier, Mr. B pulled out his temporary dialysis catheter. Now, he receives hemodialysis through an arteriovenous fistula in the arm, but requires constant supervision during dialysis.
At evaluation, Mr. B is accompanied by his parents and his older sister, who have been providing day-to-day care for him. They appear fully committed to his well-being.
Mr. B does not have a living donor.
Needed: Assessment of adaptive functioning
DSM-5 defines intellectual disability as a disorder with onset during the developmental period. It includes deficits of intellectual and adaptive functioning in conceptual, social, and practical domains.
Regrettably, many authors focus exclusively on intellectual functioning and IQ, classifying patients as having intellectual disability based on intelligence tests alone.1,2 Adaptive capabilities are insufficiently taken into consideration; there is an urgent need to supplement IQ testing with neuropsychological testing of a patient’s cognitive and adaptive functioning.
Landmark case
In 1995, Sandra Jensen, age 34, with trisomy 21 (Down syndrome) was denied a heart and lung transplant at 2 prominent academic institutions. The denial created a national debate; Jensen’s advocates persuaded one of the hospitals to reconsider.3,4
In 1996, Jensen received the transplant, but she died 18 months later from complications of immunosuppressive therapy. Her surgery was a landmark event; previously, no patient with trisomy 21 or intellectual disability had undergone organ transplantation.
Although attitudes and practices have changed in the past 2 decades, intellectual disability is still considered a relative contraindication to certain organ transplants.5
Why is intellectual disability still a contraindication?
Allocation of transplant organs is based primarily on the ethical principle of utilitarianism: ie, a morally good action is one that helps the greatest number of people. “Benefit” might take the form of the number of lives saved or the number of years added to a patient’s life.
There is little consensus on the definition of quality of life, with its debatable ideological standpoint that stands, at times, in contrast to distributive justice. Studies have shown that the long-term outcome for patients with intellectual disability who received a kidney transplant is comparable to the outcome after renal transplant for patients who are not intellectually disabled. In other studies, patients with intellectual disability and their caregivers report improvement in quality of life after transplant.
The goal of successful transplantation is improvement in quality of life and an increase in longevity. Compliance with all aspects of post-transplant treatment is essential—which is why intellectual disability remains a relative contraindication to heart transplantation in the guidelines of the International Society for Heart and Lung Transplantation. The society’s position is based on a theoretical rationale: ie, “concerns about compliance.”
Only 7 cases of successful long-term outcome after cardiac transplantation have been reported in patients with intellectual disability, and these were marked by the presence of the social and cognitive support necessary for post-transplant compliance with treatment.5 One of these 7 patients had a lengthy hospitalization 4 years after transplantation because of poor adherence to his medication regimen, following the functional decline of his primary caregiver.
Two-pronged evaluation is needed. Most patients undergoing organ transplantation receive a psychosocial assessment that varies from institution to institution. Intellectual disability can add complexity to the task of assessing candidacy for transplantation, however. In these patients, the availability and adequacy of caregivers is as important a part of decision-making as assessment of the patients themselves—yet studies of the assessment of caregivers are limited. The patient’s caregivers should be present during evaluation so that their knowledge, ability, and willingness to take on post-transplant responsibilities can be assessed. More research is needed on long-term outcomes of successful transplantation in patients with intellectual disability.
CASE CONTINUED Placement on hold
The transplant committee decides to postpone placing Mr. B on the transplant waiting list. Consensus is to revisit the question of placing him on the list at a later date.
What led to this decision?
The committee had several concerns about approving Mr. B for a transplant:
- His history of pulling out the catheter meant that he would require closer postoperative monitoring, because he would likely have drains and a urinary catheter inserted.
- Maintaining adequate oral hydration with a new kidney could be a challenge because Mr. B would not be able to comprehend how dehydration can destroy a new kidney.
- His parents believed that, after transplant, Mr. B would not be dependent on them; they failed to understand that he requires lifelong supervision to ensure compliance with immunosuppressive medications and return for follow-up.
The committee’s decision was aided by the rationale that dialysis is readily available and is a sustainable alternative to transplantation.
Mr. B’s case raises an ethical question
We speculate what the team’s decision about transplantation would have been if Mr. B (1) had a living donor or (2) was being considered for a heart, lung, or liver transplant—for which there is no analogous procedure to dialysis to sustain the patient.
1. Arciniegas DB, Filley CM. Implications of impaired cognition for organ transplant candidacy. Curr Opin Organ Transplant. 1999;4(2):168-172.
2. Dobbels F. Intellectual disability in pediatric transplantation: pitfalls and opportunities. Pediatr Transplant. 2014;18(7):658-660.
3. Martens MA, Jones L, Reiss S. Organ transplantation, organ donation and mental retardation. Pediatr Transplant. 2006;10(6):658-664.
4. Panocchia N, Bossola M, Vivanti G. Transplantation and mental retardation: what is the meaning of a discrimination? Am J Transplant. 2010;10(4):727-730.
5. Samelson-Jones E, Mancini D, Shapiro PA. Cardiac transplantation in adult patients with mental retardation: do outcomes support consensus guidelines? Psychosomatics. 2012;53(2):133-138.

Proposal Requires Three Lesions for Diagnosis of MS
A European expert group has proposed several revisions to the 2010 McDonald criteria for the use of MRI in diagnosing multiple sclerosis (MS). In the January 25 online issue of Lancet Neurology, the MAGNIMS collaborative research network asserted that new data on the application of MRI, as well as improvements in MRI technology, demanded changes to the MS diagnostic criteria.
The first proposed recommendation is that three or more focal lesions, rather than a single lesion, should be present for a physician to diagnose the involvement of the periventricular region and to show disease dissemination in space. “A single lesion was deemed not sufficiently specific to determine whether involvement of the periventricular region is due to a demyelinating inflammatory event, and the use of one periventricular lesion for assessing dissemination in space has never been formally validated,” said Massimo Filippi, MD, Professor of Neurology at Vita-Salute San Raffaele University in Milan, and his coauthors. The authors also pointed out that incidental periventricular lesions are observed in as much as 30% of patients with migraine, and in individuals with other neurologic disorders.
In addition, the group recommended that optic nerve lesions be added to the criteria for dissemination in space. “Clinical documentation of optic nerve atrophy or pallor, neurophysiological confirmation of optic nerve dysfunction (slowed conduction), or imaging features of clinically silent optic nerve inflammation (MRI lesions or retinal nerve fiber layer thinning) support dissemination in space and, in patients without concurrent visual symptoms, dissemination in time.”
According to the new recommendations, disease dissemination in space can be shown by the involvement of at least two areas from a list of the following five possibilities: three or more periventricular lesions, one or more infratentorial lesions, one or more spinal cord lesions, one or more optic nerve lesions, or one or more cortical or juxtacortical lesions.
The group did not propose any significant changes to the criteria for dissemination in time. They did note, however, that the presence of nonenhancing black holes should not be considered as a potential alternative criterion to show dissemination in time in adult patients.
The committee also supported the existing recommendations that children age 11 or older with nonacute disseminated encephalomyelitis-like presentation should be diagnosed with the same criteria for dissemination in time and space as are applied to adults. “Several studies have confirmed that the 2010 McDonald criteria perform better than or similarly to previously proposed pediatric MS criteria for diagnosis of children with nonacute disseminated encephalomyelitis presentations and pediatric patients older than 11 years, and the consensus group therefore recommend caution when using these criteria in children younger than 11 years,” they said.
Other recommendations include that there be no distinction required between symptomatic and asymptomatic MRI lesions for diagnosing dissemination in time or space; that the whole spinal cord be imaged to define dissemination in space, particularly in patients who do not fulfill the brain MRI criteria; and that the same criteria for dissemination in space be used for primary progressive MS and relapse-onset MS, with CSF results considered for clinically uncertain cases of primary progressive MS.
—Bianca Nogrady
Suggested Reading
Filippi M, Rocca MA, Ciccarelli O, et al. MRI criteria for the diagnosis of multiple sclerosis: MAGNIMS consensus guidelines. Lancet Neurol. 2016 Jan 25 [Epub ahead of print].
A European expert group has proposed several revisions to the 2010 McDonald criteria for the use of MRI in diagnosing multiple sclerosis (MS). In the January 25 online issue of Lancet Neurology, the MAGNIMS collaborative research network asserted that new data on the application of MRI, as well as improvements in MRI technology, demanded changes to the MS diagnostic criteria.
The first proposed recommendation is that three or more focal lesions, rather than a single lesion, should be present for a physician to diagnose the involvement of the periventricular region and to show disease dissemination in space. “A single lesion was deemed not sufficiently specific to determine whether involvement of the periventricular region is due to a demyelinating inflammatory event, and the use of one periventricular lesion for assessing dissemination in space has never been formally validated,” said Massimo Filippi, MD, Professor of Neurology at Vita-Salute San Raffaele University in Milan, and his coauthors. The authors also pointed out that incidental periventricular lesions are observed in as much as 30% of patients with migraine, and in individuals with other neurologic disorders.
In addition, the group recommended that optic nerve lesions be added to the criteria for dissemination in space. “Clinical documentation of optic nerve atrophy or pallor, neurophysiological confirmation of optic nerve dysfunction (slowed conduction), or imaging features of clinically silent optic nerve inflammation (MRI lesions or retinal nerve fiber layer thinning) support dissemination in space and, in patients without concurrent visual symptoms, dissemination in time.”
According to the new recommendations, disease dissemination in space can be shown by the involvement of at least two areas from a list of the following five possibilities: three or more periventricular lesions, one or more infratentorial lesions, one or more spinal cord lesions, one or more optic nerve lesions, or one or more cortical or juxtacortical lesions.
The group did not propose any significant changes to the criteria for dissemination in time. They did note, however, that the presence of nonenhancing black holes should not be considered as a potential alternative criterion to show dissemination in time in adult patients.
The committee also supported the existing recommendations that children age 11 or older with nonacute disseminated encephalomyelitis-like presentation should be diagnosed with the same criteria for dissemination in time and space as are applied to adults. “Several studies have confirmed that the 2010 McDonald criteria perform better than or similarly to previously proposed pediatric MS criteria for diagnosis of children with nonacute disseminated encephalomyelitis presentations and pediatric patients older than 11 years, and the consensus group therefore recommend caution when using these criteria in children younger than 11 years,” they said.
Other recommendations include that there be no distinction required between symptomatic and asymptomatic MRI lesions for diagnosing dissemination in time or space; that the whole spinal cord be imaged to define dissemination in space, particularly in patients who do not fulfill the brain MRI criteria; and that the same criteria for dissemination in space be used for primary progressive MS and relapse-onset MS, with CSF results considered for clinically uncertain cases of primary progressive MS.
—Bianca Nogrady
Suggested Reading
Filippi M, Rocca MA, Ciccarelli O, et al. MRI criteria for the diagnosis of multiple sclerosis: MAGNIMS consensus guidelines. Lancet Neurol. 2016 Jan 25 [Epub ahead of print].
Suggested Reading
Filippi M, Rocca MA, Ciccarelli O, et al. MRI criteria for the diagnosis of multiple sclerosis: MAGNIMS consensus guidelines. Lancet Neurol. 2016 Jan 25 [Epub ahead of print].
Phenytoin May Offer Neuroprotection to Patients With Optic Neuritis
Patients with acute demyelinating optic neuritis who received phenytoin lost 30% less of their retinal nerve fiber layer (RNFL) than did placebo-treated patients in a randomized phase II study published online ahead of print January 25 in Lancet Neurology. “The results of this clinical trial support the concept of neuroprotection using phenytoin to inhibit voltage-gated sodium channels in patients with acute optic neuritis,” said Rhian Raftopoulos, MD, of the National Hospital for Neurology and Neurosurgery in London, and coauthors.
In the study of 86 people with acute optic neuritis, investigators randomized 29 participants to receive 4 mg/kg/day of oral phenytoin, 13 participants to receive 6 mg/kg/day of oral phenytoin, and 44 participants to receive placebo for three months. All participants were randomized within 14 days of vision loss. One-third of the patients had previously been diagnosed with multiple sclerosis or was diagnosed at presentation, and 74% had at least one brain lesion on MRI.
Treatment with phenytoin was associated with a decline of mean RNFL thickness in the affected eye from 130.62 μm at baseline to 81.46 μm at six months, compared with a decline from 125.20 μm to 74.29 μm in the placebo group, representing a statistically significant adjusted mean difference of 7.15 μm.
The researchers also noted a significant 34% reduction in macular volume loss in the treatment arm, compared with placebo, representing an adjusted mean difference of 0.20 mm3. However, the treatment had no significant effect on low-contrast visual acuity and visual evoked potentials.
The most common adverse event in the treatment arm was maculopapular rash, which was judged as severe in one patient treated with phenytoin.
“The absence of regular, early outcome assessments around one to two months after initiation of treatment makes it hard to interpret the results because they would have helped to rule out a primarily anti-inflammatory effect of the treatment by tracking RNFL swelling and possible optic nerve inflammation, especially given that there was higher baseline RNFL thickness and worse low-contrast visual acuity in the patients who received phenytoin,” said Shiv Saidha, MBBCh, Assistant Professor of Neurology, and Peter A. Calabresi, MD, Director of the Division of Neuroimmunology, both at Johns Hopkins University in Baltimore, in an accompanying editorial. “If the true RNFL thickness at baseline in the affected eye of patients in the phenytoin group was higher than those in the placebo group, it could have accounted for the findings, even though the investigators made a prespecified adjustment for it.
“Although the results of this study are a major advancement and undeniably encouraging, future studies need to include more frequent optical coherence tomography (OCT) sampling, as well as more detailed OCT-segmentation-derived retinal measures such as ganglion cell plus inner plexiform layer thickness, which do not swell during acute optic neuritis, mitigating the need for statistical corrections involving the unaffected eye,” they concluded.
—Bianca Nogrady
Suggested Reading
Raftopoulos R, Hickman SJ, Toosy A, et al. Phenytoin for neuroprotection in patients with acute optic neuritis: a randomised, placebo-controlled, phase 2 trial. Lancet Neurol. 2016 Jan 25 [Epub ahead of print].
Saidha S, Calabresi PA. Phenytoin in acute optic neuritis: neuroprotective or not? Lancet Neurol. 2016 Jan 25 [Epub ahead of print].
Patients with acute demyelinating optic neuritis who received phenytoin lost 30% less of their retinal nerve fiber layer (RNFL) than did placebo-treated patients in a randomized phase II study published online ahead of print January 25 in Lancet Neurology. “The results of this clinical trial support the concept of neuroprotection using phenytoin to inhibit voltage-gated sodium channels in patients with acute optic neuritis,” said Rhian Raftopoulos, MD, of the National Hospital for Neurology and Neurosurgery in London, and coauthors.
In the study of 86 people with acute optic neuritis, investigators randomized 29 participants to receive 4 mg/kg/day of oral phenytoin, 13 participants to receive 6 mg/kg/day of oral phenytoin, and 44 participants to receive placebo for three months. All participants were randomized within 14 days of vision loss. One-third of the patients had previously been diagnosed with multiple sclerosis or was diagnosed at presentation, and 74% had at least one brain lesion on MRI.
Treatment with phenytoin was associated with a decline of mean RNFL thickness in the affected eye from 130.62 μm at baseline to 81.46 μm at six months, compared with a decline from 125.20 μm to 74.29 μm in the placebo group, representing a statistically significant adjusted mean difference of 7.15 μm.
The researchers also noted a significant 34% reduction in macular volume loss in the treatment arm, compared with placebo, representing an adjusted mean difference of 0.20 mm3. However, the treatment had no significant effect on low-contrast visual acuity and visual evoked potentials.
The most common adverse event in the treatment arm was maculopapular rash, which was judged as severe in one patient treated with phenytoin.
“The absence of regular, early outcome assessments around one to two months after initiation of treatment makes it hard to interpret the results because they would have helped to rule out a primarily anti-inflammatory effect of the treatment by tracking RNFL swelling and possible optic nerve inflammation, especially given that there was higher baseline RNFL thickness and worse low-contrast visual acuity in the patients who received phenytoin,” said Shiv Saidha, MBBCh, Assistant Professor of Neurology, and Peter A. Calabresi, MD, Director of the Division of Neuroimmunology, both at Johns Hopkins University in Baltimore, in an accompanying editorial. “If the true RNFL thickness at baseline in the affected eye of patients in the phenytoin group was higher than those in the placebo group, it could have accounted for the findings, even though the investigators made a prespecified adjustment for it.
“Although the results of this study are a major advancement and undeniably encouraging, future studies need to include more frequent optical coherence tomography (OCT) sampling, as well as more detailed OCT-segmentation-derived retinal measures such as ganglion cell plus inner plexiform layer thickness, which do not swell during acute optic neuritis, mitigating the need for statistical corrections involving the unaffected eye,” they concluded.
—Bianca Nogrady
Suggested Reading
Raftopoulos R, Hickman SJ, Toosy A, et al. Phenytoin for neuroprotection in patients with acute optic neuritis: a randomised, placebo-controlled, phase 2 trial. Lancet Neurol. 2016 Jan 25 [Epub ahead of print].
Saidha S, Calabresi PA. Phenytoin in acute optic neuritis: neuroprotective or not? Lancet Neurol. 2016 Jan 25 [Epub ahead of print].
The hunger game
How do you feel about hunger? Do you trust in its power? Having written one book on picky eating based solely on my mother’s wisdom, supplemented with a scanty amount of Internet-based research, I have spent and continue to spend a good bit of time thinking about hunger.
I have concluded that it is a very powerful force and that when a child gets hungry enough, he will eat, even foods that he has previously rejected. It is that assumption that is at the core of my advice to parents of picky eaters. I suspect that many of you share that same philosophy and recommend a strategy that is heavy on patience. Of course the problem lies in getting parents to adopt that attitude and accept the fact that if they just present a healthy diet and step back, hunger will eventually win, and the child will eat.

However, the devil is in the details. Have the parents set rules that will prevent the child from overdrinking? Have they really stopped talking about what the child, and everyone else in the family, is or isn’t eating? Are the parents setting good examples with their own eating habits and comments about food?
Because 99% of my patient population have been healthy, I have always felt comfortable relying on the power of hunger to win the battle over picky eating. If properly managed, none of my patients was going to die or suffer permanent consequences from picky eating. However, I have always wondered whether hunger could be leveraged to safely manage selective eating in children with serious health problems. I have a suspicion that it would succeed, but luckily I have never been presented with a case to test my hunch.
I recently read a very personal account written by the mother of a child with severe congenital cardiac disease that supports my gut feeling that when carefully monitored, starvation can be an effective strategy in managing selective eating (“When Your Baby Won’t Eat,” by Virginia Sole-Smith, The New York Times Magazine, Feb. 4, 2016). Three surgeries in the first few months of life necessitated that the child be fed by gavage. Attempts at breastfeeding failed, as it often does in situations like this. Struggles with gavage tube placement at home became such an emotionally traumatic ordeal that eventually a gastrostomy tube was placed when the child was 6 months old.
The family was led to believe that an important window in the child’s oral development had closed as a result of interventions necessitated by the child’s cardiac malformations. Although she was neurologically and physically capable of eating, getting her to do so was going to require long-term behavior modification, and there was no guarantee that this approach would completely undo what bad luck and prior management strategies had created. She might never relate to food as a normal child does.
After several attempts at behavior management using one-to-one reinforcement, this mother began to do some research. She discovered that of the nearly 30 feeding programs in children’s hospitals and private clinics, almost all use variations of a similar behavior modification strategy that had not worked for her daughter. As she observed: “This behavioral model presumes that children who don’t eat need external motivation.”
Eventually, the family found help in one of the few feeding programs in the United States that has adopted a dramatically different “child-centered” approach in which “therapists believe that all children have some internal motivation to eat, as well as an innate ability to effectively self-regulate their intake.” The solution to this child’s problem didn’t occur overnight. It began by exposing the child to a variety of foods in situations free of attempts to get her to eat – no coercion or rewards, regardless of how subtle they might have seemed. Once the child was experimenting with food, her tube feedings were gradually decreased in volume and caloric content. And, voila! Hunger won and the child began meeting her total nutritional needs by eating, in some cases with gusto.
Of course I was easy to convince because the results confirmed my hunch. But, do you believe that hunger can and should be used as the centerpiece in the management of selective eating, even in cases well beyond the parameters of garden variety picky eating? Are you willing to play the hunger game along with me?
Dr. Wilkoff practiced primary care pediatrics in Brunswick, Maine, for nearly 40 years. He has authored several books on behavioral pediatrics including “How to Say No to Your Toddler.”
How do you feel about hunger? Do you trust in its power? Having written one book on picky eating based solely on my mother’s wisdom, supplemented with a scanty amount of Internet-based research, I have spent and continue to spend a good bit of time thinking about hunger.
I have concluded that it is a very powerful force and that when a child gets hungry enough, he will eat, even foods that he has previously rejected. It is that assumption that is at the core of my advice to parents of picky eaters. I suspect that many of you share that same philosophy and recommend a strategy that is heavy on patience. Of course the problem lies in getting parents to adopt that attitude and accept the fact that if they just present a healthy diet and step back, hunger will eventually win, and the child will eat.
However, the devil is in the details. Have the parents set rules that will prevent the child from overdrinking? Have they really stopped talking about what the child, and everyone else in the family, is or isn’t eating? Are the parents setting good examples with their own eating habits and comments about food?
Because 99% of my patient population have been healthy, I have always felt comfortable relying on the power of hunger to win the battle over picky eating. If properly managed, none of my patients was going to die or suffer permanent consequences from picky eating. However, I have always wondered whether hunger could be leveraged to safely manage selective eating in children with serious health problems. I have a suspicion that it would succeed, but luckily I have never been presented with a case to test my hunch.
I recently read a very personal account written by the mother of a child with severe congenital cardiac disease that supports my gut feeling that when carefully monitored, starvation can be an effective strategy in managing selective eating (“When Your Baby Won’t Eat,” by Virginia Sole-Smith, The New York Times Magazine, Feb. 4, 2016). Three surgeries in the first few months of life necessitated that the child be fed by gavage. Attempts at breastfeeding failed, as it often does in situations like this. Struggles with gavage tube placement at home became such an emotionally traumatic ordeal that eventually a gastrostomy tube was placed when the child was 6 months old.
The family was led to believe that an important window in the child’s oral development had closed as a result of interventions necessitated by the child’s cardiac malformations. Although she was neurologically and physically capable of eating, getting her to do so was going to require long-term behavior modification, and there was no guarantee that this approach would completely undo what bad luck and prior management strategies had created. She might never relate to food as a normal child does.
After several attempts at behavior management using one-to-one reinforcement, this mother began to do some research. She discovered that of the nearly 30 feeding programs in children’s hospitals and private clinics, almost all use variations of a similar behavior modification strategy that had not worked for her daughter. As she observed: “This behavioral model presumes that children who don’t eat need external motivation.”
Eventually, the family found help in one of the few feeding programs in the United States that has adopted a dramatically different “child-centered” approach in which “therapists believe that all children have some internal motivation to eat, as well as an innate ability to effectively self-regulate their intake.” The solution to this child’s problem didn’t occur overnight. It began by exposing the child to a variety of foods in situations free of attempts to get her to eat – no coercion or rewards, regardless of how subtle they might have seemed. Once the child was experimenting with food, her tube feedings were gradually decreased in volume and caloric content. And, voila! Hunger won and the child began meeting her total nutritional needs by eating, in some cases with gusto.
Of course I was easy to convince because the results confirmed my hunch. But, do you believe that hunger can and should be used as the centerpiece in the management of selective eating, even in cases well beyond the parameters of garden variety picky eating? Are you willing to play the hunger game along with me?
Dr. Wilkoff practiced primary care pediatrics in Brunswick, Maine, for nearly 40 years. He has authored several books on behavioral pediatrics including “How to Say No to Your Toddler.”

ISC: Thrombectomy shown highly cost-effective for stroke
LOS ANGELES – Endovascular thrombectomy is not only clinically the best option for many patients with acute, ischemic strokes involving a proximal occlusion in a large cerebral artery; it’s also highly cost effective, based on follow-up analyses of two of the five randomized trials published in 2015 that collectively established thrombectomy as standard of care for these patients.
Thrombectomy plus administration of intravenous tissue plasminogen activator (TPA), compared with TPA only, “is highly cost effective and economically dominant with lower long-term cost and better outcomes,” Theresa I. Shireman, Ph.D., said at the International Stroke Conference.

And in an independent analysis of data from a totally different trial, endovascular thrombectomy on average reduced patients’ acute length of hospitalization, improved their survival and quality of life, and was cost saving when compared with treatment with intravenous TPA only, which had previously been the standard of care, Dr. Bruce C.V. Campbell reported at the meeting.
The analysis presented by Dr. Shireman used data collected in the SWIFT-PRIME trial, which randomized 196 patients at centers in the United States and Europe to treatment with either intravenous TPA plus endovascular thrombectomy or TPA alone. Average total costs during the index hospitalization ran to roughly $46,000 in the combined-treatment arm and about $29,000 in the TPA-only arm, a difference largely driven by a roughly $15,000 average incremental cost for the thrombectomy procedure, said Dr. Shireman, professor of health services research at Brown University in Providence, R.I.
However, the cost-effectiveness of thrombectomy began to kick in soon after. During the 90 days following index hospitalization, patients who underwent thrombectomy had substantial average reductions in their need for inpatient rehabilitation, time spent in skilled nursing facilities, and in outpatient rehabilitation. Overall, total medical costs during the first 90 days post discharge ran on average close to $5,000 less per patient following thrombectomy. In addition, based on their health status after 90 days, patients treated with thrombectomy were projected to have a greater than 1.7-year average life expectancy than those randomized to TPA only, with a projected net gain of 1.74 quality-adjusted life years (QALY) per patient and with a projected average decrease of roughly $23,000 in total lifetime medical costs.

Based on this average increase in QALYs and decreased long-term cost, adding thrombectomy to TPA for routine treatment of the types of patients enrolled in SWIFT-PRIME was economically dominant, Dr. Shireman said at the meeting sponsored by the American Heart Association. She also projected that despite the higher upfront cost for adding thrombectomy to treatment, the eventual savings in long-term care meant that thrombectomy began producing a net saving once patients survived for more than 22 months following their index hospitalization.
Dr. Campbell reported very similar findings in his analysis of data collected from the EXTEND-IA trial, which randomized 70 patients at 10 centers in Australia and New Zealand. During the first 90 days of treatment, including the index hospitalization, treatment with thrombectomy plus TPA saved an average of roughly $4,000 U.S.per patient, compared with TPA only, even though the average incremental cost for adding thrombectomy was nearly $11,000 U.S. The overall increased total 90-day costs with TPA only was largely driven by a substantially longer time spent hospitalized among the TPA-only patients, compared with those treated with thrombectomy plus TPA, said Dr. Campbell, a neurologist and head of hyperacute stroke at Royal Melbourne Hospital.
In addition, adding thrombectomy resulted in a projected average 4-year increase in life expectancy, and an average gain of about 3 QALYs per patient. Thrombectomy “is an incredibly powerful procedure, not just in terms of clinical response but also in terms of economics,” he concluded. Even when judged by the worst-case scenario of the analysis, “there is a 100% probability that the cost-effectiveness per QALY is less than $10,000 U.S., which is incredible value,” Dr. Campbell said.
SWIFT-PRIME was sponsored by Covidien/Medtronic. EXTEND-IA received partial funding through an unrestricted grant from Covidien/Medtronic. Dr. Shireman and Dr. Campbell had no personal disclosures.
On Twitter @mitchelzoler
LOS ANGELES – Endovascular thrombectomy is not only clinically the best option for many patients with acute, ischemic strokes involving a proximal occlusion in a large cerebral artery; it’s also highly cost effective, based on follow-up analyses of two of the five randomized trials published in 2015 that collectively established thrombectomy as standard of care for these patients.
Thrombectomy plus administration of intravenous tissue plasminogen activator (TPA), compared with TPA only, “is highly cost effective and economically dominant with lower long-term cost and better outcomes,” Theresa I. Shireman, Ph.D., said at the International Stroke Conference.
And in an independent analysis of data from a totally different trial, endovascular thrombectomy on average reduced patients’ acute length of hospitalization, improved their survival and quality of life, and was cost saving when compared with treatment with intravenous TPA only, which had previously been the standard of care, Dr. Bruce C.V. Campbell reported at the meeting.
The analysis presented by Dr. Shireman used data collected in the SWIFT-PRIME trial, which randomized 196 patients at centers in the United States and Europe to treatment with either intravenous TPA plus endovascular thrombectomy or TPA alone. Average total costs during the index hospitalization ran to roughly $46,000 in the combined-treatment arm and about $29,000 in the TPA-only arm, a difference largely driven by a roughly $15,000 average incremental cost for the thrombectomy procedure, said Dr. Shireman, professor of health services research at Brown University in Providence, R.I.
However, the cost-effectiveness of thrombectomy began to kick in soon after. During the 90 days following index hospitalization, patients who underwent thrombectomy had substantial average reductions in their need for inpatient rehabilitation, time spent in skilled nursing facilities, and in outpatient rehabilitation. Overall, total medical costs during the first 90 days post discharge ran on average close to $5,000 less per patient following thrombectomy. In addition, based on their health status after 90 days, patients treated with thrombectomy were projected to have a greater than 1.7-year average life expectancy than those randomized to TPA only, with a projected net gain of 1.74 quality-adjusted life years (QALY) per patient and with a projected average decrease of roughly $23,000 in total lifetime medical costs.
Based on this average increase in QALYs and decreased long-term cost, adding thrombectomy to TPA for routine treatment of the types of patients enrolled in SWIFT-PRIME was economically dominant, Dr. Shireman said at the meeting sponsored by the American Heart Association. She also projected that despite the higher upfront cost for adding thrombectomy to treatment, the eventual savings in long-term care meant that thrombectomy began producing a net saving once patients survived for more than 22 months following their index hospitalization.
Dr. Campbell reported very similar findings in his analysis of data collected from the EXTEND-IA trial, which randomized 70 patients at 10 centers in Australia and New Zealand. During the first 90 days of treatment, including the index hospitalization, treatment with thrombectomy plus TPA saved an average of roughly $4,000 U.S.per patient, compared with TPA only, even though the average incremental cost for adding thrombectomy was nearly $11,000 U.S. The overall increased total 90-day costs with TPA only was largely driven by a substantially longer time spent hospitalized among the TPA-only patients, compared with those treated with thrombectomy plus TPA, said Dr. Campbell, a neurologist and head of hyperacute stroke at Royal Melbourne Hospital.
In addition, adding thrombectomy resulted in a projected average 4-year increase in life expectancy, and an average gain of about 3 QALYs per patient. Thrombectomy “is an incredibly powerful procedure, not just in terms of clinical response but also in terms of economics,” he concluded. Even when judged by the worst-case scenario of the analysis, “there is a 100% probability that the cost-effectiveness per QALY is less than $10,000 U.S., which is incredible value,” Dr. Campbell said.
SWIFT-PRIME was sponsored by Covidien/Medtronic. EXTEND-IA received partial funding through an unrestricted grant from Covidien/Medtronic. Dr. Shireman and Dr. Campbell had no personal disclosures.
On Twitter @mitchelzoler
AT THE INTERNATIONAL STROKE CONFERENCE
Key clinical point: Adding endovascular thrombectomy to TPA treatment for selected patients with acute, ischemic stroke proved highly cost effective on the basis of data collected in two independent randomized trials.
Major finding: In SWIFT-PRIME, thrombectomy saved a projected average of $23,000 in lifetime health care costs and added 1.74 QALYs.
Data source: SWIFT-PRIME, an international, multicenter, randomized trial that enrolled 196 patients.
Disclosures: SWIFT-PRIME was sponsored by Covidien/Medtronic. EXTEND-IA received partial funding through an unrestricted grant from Covidien/Medtronic. Dr. Shireman and Dr. Campbell had no personal disclosures.

The Great Masquerader
1. Several weeks ago, this 56-year-old man noticed numerous asymptomatic round macules and papules on his palms and soles, many with scaly peripheral margins. Similar lesions are noted on the penile corona and glans. There is a faint but definite morbiliform, blanchable pink rash covering most of the patient’s trunk, taking on a “shawl” distribution across the shoulders. The patient is exclusively homosexual and recently engaged in high-risk sexual activity.

| 
|
Diagnosis: It would be hard to imagine a more classic example of secondary syphilis than was seen in this case, occurring in a patient so obviously at risk. But it’s only “obvious” if you’re ready and aware of how syphilis manifests. It also helps if you understand how common it is and who’s likely to get it.
TAKE-HOME LEARNING POINTS
• Palmar and plantar rashes are unusual and should prompt the examiner to expand the history and physical.
• Secondary syphilis, though uncommon, is far from rare, especially among gay men engaging in high-risk sexual behavior.
• It’s common for the patient to deny the appearance of the chancre of primary syphilis, and such a lesion would be long gone by the time those of secondary syphilis manifest.
• Conditions involving the skin should be seen by a dermatology provider, regardless of location. This includes diseases of the skin, hair, nails, oral mucosa, genitals, feet, or palms. One potential exception is the eye itself, though most diseases “of the eye” are, in reality, diseases of the periocular skin—and belong with a dermatology provider.
For more information on this case, see “When There’s More to the Story ….” Clin Rev. 2013;12;2013(12):W2.
For the next photograph, proceed to the next page >>
2. First appearing a month ago, this rash was first confined to the patient’s abdomen and subsequently spread. The blanchable, erythematous papules and nodules are fairly dense, uniformly covering most of his skin but sparing face and soles. Two 7-mm scaly brown nodules are seen on his right palm. There are no palpable nodes in the usual locations. More than 10 years ago, the patient was diagnosed with HIV, which is well controlled with medication. Homosexually active, he denies having any new contacts.

Diagnosis: This case presents a fairly typical clinical picture of secondary syphilis—a diagnosis that requires confirmation with syphilis serology: rapid plasma reagin (RPR) or Venereal Disease Research Laboratory (VDRL) testing. The latter measures antibodies to the lipids formed by the host against lipids formed on the treponemal cell surface.
In this case, the diagnosis had to be confirmed by more specific treponemal tests, usually conducted by the local health department, to which positive results must be reported. If further testing confirms the diagnosis (as expected), the patient will be treated by the health department. Investigators will question him, attempting to determine the source of the infection and thereby quell an outbreak.
For more information on this case, see “Unusual Cause for Asymptomatic Rash.” Clin Rev. 2013;23(9):W6.
For the next photograph, proceed to the next page >>
3. A 43-year-old man presented with a rapidly enlarging ulcerated nodule on the right ankle with a necrotic and crusted center. He also had multiple red-brown papules on the trunk and extremities. Some of these lesions had central erosions, while others had surface scale. He was known to be HIV positive but had no lymphadenopathy.
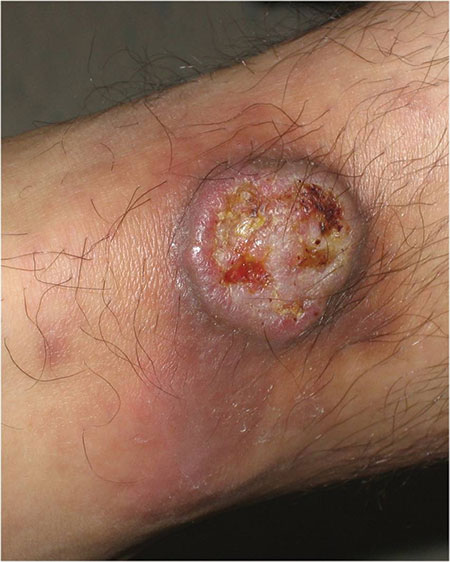
Diagnosis: Lues maligna is used to describe a rare noduloulcerative form of secondary syphilis.1 It was first described in 18592 and has been associated with other disorders such as diabetes mellitus3 and chronic alcoholism.4 Patients usually are gravely ill and develop polymorphic ulcerating lesions. Facial and scalp involvement are common, but patients typically do not have palmoplantar involvement in conventional presentations of secondary syphilis.
…The patient’s rapid plasma reagin titer at the time of the fourth biopsy was 1:256, and appropriate treatment with penicillin resulted in complete clearance of the lesions in 3 to 4 weeks.
For more information on this case, see “Rapidly Enlarging Noduloulcerative Lesions.” Cutis. 2014;94(3):E20-E22.
Photograph and case description courtesy of Cutis. 2014;94(3):E20-E22.
Related article
Man, 54, With Delusions and Seizures
2011;21(4):20, 22, 24
1. Several weeks ago, this 56-year-old man noticed numerous asymptomatic round macules and papules on his palms and soles, many with scaly peripheral margins. Similar lesions are noted on the penile corona and glans. There is a faint but definite morbiliform, blanchable pink rash covering most of the patient’s trunk, taking on a “shawl” distribution across the shoulders. The patient is exclusively homosexual and recently engaged in high-risk sexual activity.
|
|
|
Diagnosis: It would be hard to imagine a more classic example of secondary syphilis than was seen in this case, occurring in a patient so obviously at risk. But it’s only “obvious” if you’re ready and aware of how syphilis manifests. It also helps if you understand how common it is and who’s likely to get it.
TAKE-HOME LEARNING POINTS
• Palmar and plantar rashes are unusual and should prompt the examiner to expand the history and physical.
• Secondary syphilis, though uncommon, is far from rare, especially among gay men engaging in high-risk sexual behavior.
• It’s common for the patient to deny the appearance of the chancre of primary syphilis, and such a lesion would be long gone by the time those of secondary syphilis manifest.
• Conditions involving the skin should be seen by a dermatology provider, regardless of location. This includes diseases of the skin, hair, nails, oral mucosa, genitals, feet, or palms. One potential exception is the eye itself, though most diseases “of the eye” are, in reality, diseases of the periocular skin—and belong with a dermatology provider.
For more information on this case, see “When There’s More to the Story ….” Clin Rev. 2013;12;2013(12):W2.
For the next photograph, proceed to the next page >>
2. First appearing a month ago, this rash was first confined to the patient’s abdomen and subsequently spread. The blanchable, erythematous papules and nodules are fairly dense, uniformly covering most of his skin but sparing face and soles. Two 7-mm scaly brown nodules are seen on his right palm. There are no palpable nodes in the usual locations. More than 10 years ago, the patient was diagnosed with HIV, which is well controlled with medication. Homosexually active, he denies having any new contacts.
Diagnosis: This case presents a fairly typical clinical picture of secondary syphilis—a diagnosis that requires confirmation with syphilis serology: rapid plasma reagin (RPR) or Venereal Disease Research Laboratory (VDRL) testing. The latter measures antibodies to the lipids formed by the host against lipids formed on the treponemal cell surface.
In this case, the diagnosis had to be confirmed by more specific treponemal tests, usually conducted by the local health department, to which positive results must be reported. If further testing confirms the diagnosis (as expected), the patient will be treated by the health department. Investigators will question him, attempting to determine the source of the infection and thereby quell an outbreak.
For more information on this case, see “Unusual Cause for Asymptomatic Rash.” Clin Rev. 2013;23(9):W6.
For the next photograph, proceed to the next page >>
3. A 43-year-old man presented with a rapidly enlarging ulcerated nodule on the right ankle with a necrotic and crusted center. He also had multiple red-brown papules on the trunk and extremities. Some of these lesions had central erosions, while others had surface scale. He was known to be HIV positive but had no lymphadenopathy.
Diagnosis: Lues maligna is used to describe a rare noduloulcerative form of secondary syphilis.1 It was first described in 18592 and has been associated with other disorders such as diabetes mellitus3 and chronic alcoholism.4 Patients usually are gravely ill and develop polymorphic ulcerating lesions. Facial and scalp involvement are common, but patients typically do not have palmoplantar involvement in conventional presentations of secondary syphilis.
…The patient’s rapid plasma reagin titer at the time of the fourth biopsy was 1:256, and appropriate treatment with penicillin resulted in complete clearance of the lesions in 3 to 4 weeks.
For more information on this case, see “Rapidly Enlarging Noduloulcerative Lesions.” Cutis. 2014;94(3):E20-E22.
Photograph and case description courtesy of Cutis. 2014;94(3):E20-E22.
Related article
Man, 54, With Delusions and Seizures
2011;21(4):20, 22, 24
Opicapone May Reduce Off Time for Patients With Parkinson’s Disease
Administering 50 mg of opicapone as an adjunct to levodopa treatment decreases the amount of off time by approximately 61 minutes, compared with placebo, for patients with Parkinson’s disease and end-of-dose motor fluctuations, according to research published in the February issue of Lancet Neurology. Data indicate that the drug is safe, well tolerated, and noninferior to entacapone for this indication.
Opicapone is “the only once-daily catechol-O-methyltransferase (COMT) inhibitor to provide a mean reduction in time in the off state that is clinically relevant,” said Joaquim J. Ferreira, MD, Professor of Neurology and Clinical Pharmacology at the University of Lisbon, and colleagues. Administering the drug once daily could simplify a patient’s drug regimen by permitting the physician to decrease the total daily levodopa dose, increase the dosing interval, and reduce the number of intakes, thereby maximizing the benefit of therapy, he added.
Comparing Opicapone, Entacapone, and Placebo
The half-life of oral levodopa is between 60 and 90 minutes and is linked with end-of-dose motor fluctuations. COMT inhibitors increase the plasma elimination half-life of levodopa and decrease peak–trough variations. Entacapone, a COMT inhibitor, provides moderate reductions in daily off time, but needs to be administered with each dose of levodopa. Neurologists thus have sought a more effective COMT inhibitor that can be used easily in clinical practice.
Dr. Ferreira and colleagues assessed the safety and efficacy of opicapone as an adjunct to levodopa, compared with placebo and entacapone, in patients with Parkinson’s disease and motor fluctuations. Eligible participants had had a clinical diagnosis of Parkinson’s disease for at least three years, a Hoehn and Yahr stage of 1 to 3 during the on state, and at least one year of clinical improvement with levodopa treatment. People who had used entacapone previously, had significant dyskinesia disability, or had severe or unpredictable off periods were excluded from the study.
Equal groups of patients were computer randomized to once-daily opicapone (5 mg, 25 mg, or 50 mg), placebo, or 200 mg of entacapone with every levodopa intake. The participants and investigators were blinded to treatment allocation throughout the study. Opicapone capsules and entacapone tablets were overencapsulated to maintain blinding.
Doses of study drugs were given concomitantly with each levodopa intake. Patients in the opicapone groups received placebo for the daytime doses and active treatment for the bedtime dose. Patients in the entacapone group took the active treatment during the day and placebo as the bedtime dose. Investigators assessed participants at screening, baseline, and at five subsequent time points.
The study’s primary end point was the change from baseline to the end of study treatment in absolute off time, as assessed by daily patient diaries. Secondary end points included the change from baseline to the end of study treatment in the proportion of patients who had at least a one-hour reduction in absolute off time and the change from baseline to the end of study treatment in the proportion of patients who had at least a one-hour increase in absolute total on time.
For statistical analysis, population sets were defined as the full analysis set, which included all randomly assigned patients who took at least one dose of study drug and had at least one assessment of time in the off state after baseline; the per-protocol set, which included all patients in the full analysis set who did not have any major protocol deviations; and the safety set, which included all patients who received at least one dose of study drug.
Opicapone Was Noninferior to Entacapone
The researchers enrolled 600 patients, of whom 121 received placebo, 122 received 200 mg of entacapone, 122 received 5 mg of opicapone, 119 received 25 mg of opicapone, and 116 received 50 mg of opicapone. The full analysis included 590 patients, and the per-protocol analysis included 537 patients. In all, 542 patients completed the study. Patient demographics, baseline Parkinson’s disease characteristics, and treatment history did not differ between the treatment groups in the safety analysis.
In the full analysis, the adjusted mean change from baseline in absolute off time was –116.8 minutes in the opicapone 50 mg group, compared with –96.3 minutes in the entacapone group, –91.3 minutes in the opicapone 5 mg group, –85.9 minutes in the opicapone 25 mg group, and –56.0 minutes in the placebo group. The per-protocol analysis yielded similar results.
The investigators only tested the 50-mg dose of opicapone for noninferiority of absolute off time. This treatment was superior to placebo and noninferior to entacapone. The researchers found no significant differences between placebo and opicapone 5 mg or opicapone 25 mg. Entacapone was superior to placebo.
Compared with placebo, the proportion of patients with a reduction in off time of at least one hour was significantly higher in patient who received 25 mg or 50 mg of opicapone, and the proportion of patients with an increase in on time of at least one hour was significantly higher in patients who received 50 mg of opicapone. No significant differences were noted in off and on state rates for entacapone versus placebo. Results for the other secondary end points supported those of the primary analysis.
Adverse Events Were Uncommon
The percentage of patients who discontinued because of treatment-emergent adverse events was low and similar across the treatment groups. The most common treatment-emergent adverse events leading to discontinuation were diarrhea, visual hallucinations, and dyskinesia. Dyskinesia was the most frequently reported treatment-emergent adverse event possibly related to the study drug, and the highest incidence occurred in the opicapone groups. Approximately 80% of treatment-emergent dyskinesias occurred in patients in all groups who already had dyskinesia at baseline. The incidence of serious treatment-emergent adverse events was low (ie, 7% or less) in all groups, and 35% of these events were judged to be unrelated to the study drug.
“The beneficial effects of opicapone 50 mg at reducing the time in the off state were accompanied by a corresponding increase in time in the on state without troublesome dyskinesia, whereas the duration of time in the on state with troublesome dyskinesia did not change,” said Dr. Ferreira. The study results “suggest an overall positive risk-to-benefit ratio for the use of opicapone in patients with Parkinson’s disease with end-of-dose motor fluctuations,” he added. Results of the authors’ open-label extension study will be published in the future.
—Erik Greb
Suggested Reading
Ferreira JJ, Lees A, Rocha JF, et al. Opicapone as an adjunct to levodopa in patients with Parkinson’s disease and end-of-dose motor fluctuations: a randomised, double-blind, controlled trial. Lancet Neurol. 2016;15(2):154-165.
Administering 50 mg of opicapone as an adjunct to levodopa treatment decreases the amount of off time by approximately 61 minutes, compared with placebo, for patients with Parkinson’s disease and end-of-dose motor fluctuations, according to research published in the February issue of Lancet Neurology. Data indicate that the drug is safe, well tolerated, and noninferior to entacapone for this indication.
Opicapone is “the only once-daily catechol-O-methyltransferase (COMT) inhibitor to provide a mean reduction in time in the off state that is clinically relevant,” said Joaquim J. Ferreira, MD, Professor of Neurology and Clinical Pharmacology at the University of Lisbon, and colleagues. Administering the drug once daily could simplify a patient’s drug regimen by permitting the physician to decrease the total daily levodopa dose, increase the dosing interval, and reduce the number of intakes, thereby maximizing the benefit of therapy, he added.
Comparing Opicapone, Entacapone, and Placebo
The half-life of oral levodopa is between 60 and 90 minutes and is linked with end-of-dose motor fluctuations. COMT inhibitors increase the plasma elimination half-life of levodopa and decrease peak–trough variations. Entacapone, a COMT inhibitor, provides moderate reductions in daily off time, but needs to be administered with each dose of levodopa. Neurologists thus have sought a more effective COMT inhibitor that can be used easily in clinical practice.
Dr. Ferreira and colleagues assessed the safety and efficacy of opicapone as an adjunct to levodopa, compared with placebo and entacapone, in patients with Parkinson’s disease and motor fluctuations. Eligible participants had had a clinical diagnosis of Parkinson’s disease for at least three years, a Hoehn and Yahr stage of 1 to 3 during the on state, and at least one year of clinical improvement with levodopa treatment. People who had used entacapone previously, had significant dyskinesia disability, or had severe or unpredictable off periods were excluded from the study.
Equal groups of patients were computer randomized to once-daily opicapone (5 mg, 25 mg, or 50 mg), placebo, or 200 mg of entacapone with every levodopa intake. The participants and investigators were blinded to treatment allocation throughout the study. Opicapone capsules and entacapone tablets were overencapsulated to maintain blinding.
Doses of study drugs were given concomitantly with each levodopa intake. Patients in the opicapone groups received placebo for the daytime doses and active treatment for the bedtime dose. Patients in the entacapone group took the active treatment during the day and placebo as the bedtime dose. Investigators assessed participants at screening, baseline, and at five subsequent time points.
The study’s primary end point was the change from baseline to the end of study treatment in absolute off time, as assessed by daily patient diaries. Secondary end points included the change from baseline to the end of study treatment in the proportion of patients who had at least a one-hour reduction in absolute off time and the change from baseline to the end of study treatment in the proportion of patients who had at least a one-hour increase in absolute total on time.
For statistical analysis, population sets were defined as the full analysis set, which included all randomly assigned patients who took at least one dose of study drug and had at least one assessment of time in the off state after baseline; the per-protocol set, which included all patients in the full analysis set who did not have any major protocol deviations; and the safety set, which included all patients who received at least one dose of study drug.
Opicapone Was Noninferior to Entacapone
The researchers enrolled 600 patients, of whom 121 received placebo, 122 received 200 mg of entacapone, 122 received 5 mg of opicapone, 119 received 25 mg of opicapone, and 116 received 50 mg of opicapone. The full analysis included 590 patients, and the per-protocol analysis included 537 patients. In all, 542 patients completed the study. Patient demographics, baseline Parkinson’s disease characteristics, and treatment history did not differ between the treatment groups in the safety analysis.
In the full analysis, the adjusted mean change from baseline in absolute off time was –116.8 minutes in the opicapone 50 mg group, compared with –96.3 minutes in the entacapone group, –91.3 minutes in the opicapone 5 mg group, –85.9 minutes in the opicapone 25 mg group, and –56.0 minutes in the placebo group. The per-protocol analysis yielded similar results.
The investigators only tested the 50-mg dose of opicapone for noninferiority of absolute off time. This treatment was superior to placebo and noninferior to entacapone. The researchers found no significant differences between placebo and opicapone 5 mg or opicapone 25 mg. Entacapone was superior to placebo.
Compared with placebo, the proportion of patients with a reduction in off time of at least one hour was significantly higher in patient who received 25 mg or 50 mg of opicapone, and the proportion of patients with an increase in on time of at least one hour was significantly higher in patients who received 50 mg of opicapone. No significant differences were noted in off and on state rates for entacapone versus placebo. Results for the other secondary end points supported those of the primary analysis.
Adverse Events Were Uncommon
The percentage of patients who discontinued because of treatment-emergent adverse events was low and similar across the treatment groups. The most common treatment-emergent adverse events leading to discontinuation were diarrhea, visual hallucinations, and dyskinesia. Dyskinesia was the most frequently reported treatment-emergent adverse event possibly related to the study drug, and the highest incidence occurred in the opicapone groups. Approximately 80% of treatment-emergent dyskinesias occurred in patients in all groups who already had dyskinesia at baseline. The incidence of serious treatment-emergent adverse events was low (ie, 7% or less) in all groups, and 35% of these events were judged to be unrelated to the study drug.
“The beneficial effects of opicapone 50 mg at reducing the time in the off state were accompanied by a corresponding increase in time in the on state without troublesome dyskinesia, whereas the duration of time in the on state with troublesome dyskinesia did not change,” said Dr. Ferreira. The study results “suggest an overall positive risk-to-benefit ratio for the use of opicapone in patients with Parkinson’s disease with end-of-dose motor fluctuations,” he added. Results of the authors’ open-label extension study will be published in the future.
—Erik Greb
Suggested Reading
Ferreira JJ, Lees A, Rocha JF, et al. Opicapone as an adjunct to levodopa in patients with Parkinson’s disease and end-of-dose motor fluctuations: a randomised, double-blind, controlled trial. Lancet Neurol. 2016;15(2):154-165.
Suggested Reading
Ferreira JJ, Lees A, Rocha JF, et al. Opicapone as an adjunct to levodopa in patients with Parkinson’s disease and end-of-dose motor fluctuations: a randomised, double-blind, controlled trial. Lancet Neurol. 2016;15(2):154-165.
BRAIN Initiative Could Advance the Field of Neuromodulation
LAS VEGAS—Through various programs, the BRAIN Initiative seeks to fund research in 2016 that could advance the field of neuromodulation, according to a lecture given at the 19th Annual Meeting of the North American Neuromodulation Society. These investigations could affect the treatment of epilepsy, headache, Parkinson’s disease, or other neurologic disorders.
The BRAIN Initiative has two main objectives, said Stephanie Fertig, MBA, Director of Small Business Programs at the National Institute of Neurological Disorders and Stroke. The first is to foster the development of new technologies for mapping connections in the brain and discovering patterns of neural activity. The second goal is to use these new technologies, as well as existing technologies, to further neurologists’ understanding of how the neural circuit affects the function of the healthy or diseased brain. The initiative, which President Obama introduced in 2013, is a collaboration between federal agencies, including the National Science Foundation and NIH, private foundations, universities, and industry. Information on the BRAIN Initiative can be found online at www.braininitiative.nih.gov.
Researchers Invited to Apply for Funding
Several of the BRAIN Initiative’s programs are intended to promote the identification, development, and optimization of new technologies and approaches for large-scale recording and modulation in the nervous system. The goal is to foster research that will add to scientific understanding of the dynamic signaling in the nervous system, said Ms. Fertig. One program seeks applications to study new and untested ideas for recording and modulating technology, including ideas in the initial stages of conceptualization. Other programs aim to further proof-of-concept testing for such technology, as well as to enable the optimization of the technology with feedback from the user community.
Another of the initiative’s programs is intended to fund nonclinical and clinical studies that will help advance invasive recording or stimulating devices that could, in turn, treat CNS disorders and improve understanding of the human brain. Researchers will receive support for the implementation of clinical prototype devices, nonclinical safety and efficacy testing, design verification and validation activities, and pursuit of regulatory approval for a small clinical study. The program will consider clinical studies of acute or short-term procedures that entail nonsignificant risk (as determined by an Institutional Review Board), as well as those that entail a significant risk and require an Investigational Device Exemption (IDE) from the FDA. The BRAIN Initiative provides two options for researchers interested in funding for invasive devices, said Ms. Fertig. “One is if you need to do some nonclinical work before you get your IDE and then move into the clinic. That’s the phase translational to clinical research track. Then there’s the direct-to-clinical research program,” which is appropriate for investigators who do not need to perform nonclinical work and are ready for a clinical study.
Public–Private Partnership Program
The BRAIN Initiative also created a Public–Private Partnership Program to facilitate collaboration between clinical investigators and manufacturers of invasive recording or stimulating devices. This program is intended to promote clinical research and foster partnerships between clinical researchers and the developers of “next-generation implantable stimulating–recording devices,” said Ms. Fertig. Data about the safety and utility of such devices can be costly to obtain, but the Public–Private Partnership Program will enable researchers to use existing manufacturers’ safety data. To date, six device manufacturers (ie, Medtronic, Boston Scientific, Blackrock, NeuroPace, NeuroNexus, and Second Sight) have signed a memorandum of understanding with NIH to provide support and information on materials (eg, devices and software). The information will guide investigators who want to pursue specific agreements with manufacturers for the submission of research proposals to NIH. Furthermore, NIH has created templates of collaborative research agreements and confidential disclosure agreements to quicken the legal and administrative process for establishing partnerships between manufacturers and academic research institutions.
Funding Supports Device-Related Research
The BRAIN Initiative already has funded various studies that could lead to new invasive treatments for various neurologic disorders. Leigh R. Hochberg, MD, PhD, Director of the Neurotechnology Trials Unit at Massachusetts General Hospital in Boston, and associates received NIH support for the development of the BrainGate device. Dr. Hochberg created BrainGate, a brain implant system, to allow patients with quadriplegia to control external devices such as prosthetic arms by thought alone. Dr. Hochberg’s BRAIN project is to develop BrainGate into a fully implanted medical treatment system without external components. The goal is to enable patients to use the device independently on an ongoing basis.
In addition, Gregory A. Worrell, MD, PhD, Professor of Neurology at Mayo Clinic in Rochester, Minnesota, and colleagues received funding to study wireless devices that measure brain activity, predict seizure onset, and deliver therapeutic stimulation to mitigate seizures. Dr. Worrell’s group initially plans to conduct a preclinical study to test one such device in dogs with epilepsy. If the device is successful, the group will perform a pilot clinical trial in patients with epilepsy.
Finally, Nicholas D. Schiff, MD, Jerold B. Katz Professor of Neurology and Neuroscience at Weill Cornell Medical College in New York, and colleagues received support for their efforts to develop device therapy for cognitive impairment associated with traumatic brain injury. They are focusing on a device that delivers deep brain stimulation to the thalamus, which they hypothesize may restore the disrupted circuit function that underlies the cognitive disability.
—Erik Greb
Suggested Reading
Brinkmann BH, Patterson EE, Vite C, et al. Forecasting seizures using intracranial EEG measures and SVM in naturally occurring canine epilepsy. PLoS One. 2015;10(8):e0133900.
Gummadavelli A, Motelow JE, Smith N, et al. Thalamic stimulation to improve level of consciousness after seizures: evaluation of electrophysiology and behavior. Epilepsia. 2015;56(1):114-124.
Hochberg LR, Bacher D, Jarosiewicz B, et al. Reach and grasp by people with tetraplegia using a neurally controlled robotic arm. Nature. 2012;485(7398):372-375.
LAS VEGAS—Through various programs, the BRAIN Initiative seeks to fund research in 2016 that could advance the field of neuromodulation, according to a lecture given at the 19th Annual Meeting of the North American Neuromodulation Society. These investigations could affect the treatment of epilepsy, headache, Parkinson’s disease, or other neurologic disorders.
The BRAIN Initiative has two main objectives, said Stephanie Fertig, MBA, Director of Small Business Programs at the National Institute of Neurological Disorders and Stroke. The first is to foster the development of new technologies for mapping connections in the brain and discovering patterns of neural activity. The second goal is to use these new technologies, as well as existing technologies, to further neurologists’ understanding of how the neural circuit affects the function of the healthy or diseased brain. The initiative, which President Obama introduced in 2013, is a collaboration between federal agencies, including the National Science Foundation and NIH, private foundations, universities, and industry. Information on the BRAIN Initiative can be found online at www.braininitiative.nih.gov.
Researchers Invited to Apply for Funding
Several of the BRAIN Initiative’s programs are intended to promote the identification, development, and optimization of new technologies and approaches for large-scale recording and modulation in the nervous system. The goal is to foster research that will add to scientific understanding of the dynamic signaling in the nervous system, said Ms. Fertig. One program seeks applications to study new and untested ideas for recording and modulating technology, including ideas in the initial stages of conceptualization. Other programs aim to further proof-of-concept testing for such technology, as well as to enable the optimization of the technology with feedback from the user community.
Another of the initiative’s programs is intended to fund nonclinical and clinical studies that will help advance invasive recording or stimulating devices that could, in turn, treat CNS disorders and improve understanding of the human brain. Researchers will receive support for the implementation of clinical prototype devices, nonclinical safety and efficacy testing, design verification and validation activities, and pursuit of regulatory approval for a small clinical study. The program will consider clinical studies of acute or short-term procedures that entail nonsignificant risk (as determined by an Institutional Review Board), as well as those that entail a significant risk and require an Investigational Device Exemption (IDE) from the FDA. The BRAIN Initiative provides two options for researchers interested in funding for invasive devices, said Ms. Fertig. “One is if you need to do some nonclinical work before you get your IDE and then move into the clinic. That’s the phase translational to clinical research track. Then there’s the direct-to-clinical research program,” which is appropriate for investigators who do not need to perform nonclinical work and are ready for a clinical study.
Public–Private Partnership Program
The BRAIN Initiative also created a Public–Private Partnership Program to facilitate collaboration between clinical investigators and manufacturers of invasive recording or stimulating devices. This program is intended to promote clinical research and foster partnerships between clinical researchers and the developers of “next-generation implantable stimulating–recording devices,” said Ms. Fertig. Data about the safety and utility of such devices can be costly to obtain, but the Public–Private Partnership Program will enable researchers to use existing manufacturers’ safety data. To date, six device manufacturers (ie, Medtronic, Boston Scientific, Blackrock, NeuroPace, NeuroNexus, and Second Sight) have signed a memorandum of understanding with NIH to provide support and information on materials (eg, devices and software). The information will guide investigators who want to pursue specific agreements with manufacturers for the submission of research proposals to NIH. Furthermore, NIH has created templates of collaborative research agreements and confidential disclosure agreements to quicken the legal and administrative process for establishing partnerships between manufacturers and academic research institutions.
Funding Supports Device-Related Research
The BRAIN Initiative already has funded various studies that could lead to new invasive treatments for various neurologic disorders. Leigh R. Hochberg, MD, PhD, Director of the Neurotechnology Trials Unit at Massachusetts General Hospital in Boston, and associates received NIH support for the development of the BrainGate device. Dr. Hochberg created BrainGate, a brain implant system, to allow patients with quadriplegia to control external devices such as prosthetic arms by thought alone. Dr. Hochberg’s BRAIN project is to develop BrainGate into a fully implanted medical treatment system without external components. The goal is to enable patients to use the device independently on an ongoing basis.
In addition, Gregory A. Worrell, MD, PhD, Professor of Neurology at Mayo Clinic in Rochester, Minnesota, and colleagues received funding to study wireless devices that measure brain activity, predict seizure onset, and deliver therapeutic stimulation to mitigate seizures. Dr. Worrell’s group initially plans to conduct a preclinical study to test one such device in dogs with epilepsy. If the device is successful, the group will perform a pilot clinical trial in patients with epilepsy.
Finally, Nicholas D. Schiff, MD, Jerold B. Katz Professor of Neurology and Neuroscience at Weill Cornell Medical College in New York, and colleagues received support for their efforts to develop device therapy for cognitive impairment associated with traumatic brain injury. They are focusing on a device that delivers deep brain stimulation to the thalamus, which they hypothesize may restore the disrupted circuit function that underlies the cognitive disability.
—Erik Greb
Suggested Reading
Brinkmann BH, Patterson EE, Vite C, et al. Forecasting seizures using intracranial EEG measures and SVM in naturally occurring canine epilepsy. PLoS One. 2015;10(8):e0133900.
Gummadavelli A, Motelow JE, Smith N, et al. Thalamic stimulation to improve level of consciousness after seizures: evaluation of electrophysiology and behavior. Epilepsia. 2015;56(1):114-124.
Hochberg LR, Bacher D, Jarosiewicz B, et al. Reach and grasp by people with tetraplegia using a neurally controlled robotic arm. Nature. 2012;485(7398):372-375.
VIDEO: A better way to treat large intraventricular hemorrhages
LOS ANGELES – For intraventricular hemorrhages of at least 20 mL, alteplase (Activase – Genentech) delivered directly into the clot by external ventricular drain almost doubles the odds of achieving a modified Rankin Score of 0-3 by 6 months.
More clot is removed – and patients with large intraventricular hemorrhages (IVHs) do better – with more vigorous alteplase dosing and when more than one drain is used.
The findings come from the Clot Lysis Evaluation of Accelerated Resolution (CLEAR III) trial, which randomized 249 IVH patients to 1 mg alteplase every 8 hours for up to 12 doses, and 251 to saline on the same schedule, delivered by external ventricular drain. The intervention didn’t make much difference with small hemorrhages.
In a video interview at the International Stroke Conference, investigator Dr. Issam Awad, a professor of surgery and neurology and director of neurovascular surgery at the University of Chicago, explained how to do the technique correctly for larger clots, and the expected benefits.
The video associated with this article is no longer available on this site. Please view all of our videos on the MDedge YouTube channel
AT THE INTERNATIONAL STROKE CONFERENCE