User login
Characteristics, Frequency, and Disposition of Patients With a HeartMate II Left Ventricular Assist Device Presenting to the ED
Introduction
Approximately 6.5 million adults in the United States have heart failure, accounting for nearly 1 million ED visits annually.1 Advanced heart failure is particularly difficult to treat, and is associated with significant morbidity and mortality. While medical therapy is the initial treatment for patients with advanced heart failure, it has limited effectiveness; therefore, at the present time, heart transplant is the most effective treatment for heart failure refractory to medical management.
According to the 2013 Registry of the International Society for Heart and Lung Transplantation, 4,096 cardiac transplants were performed worldwide in 2011, approximately 2,000 of which were done in the United States.2
The average age of a heart transplant recipient in the United States is 55 years.2 In 2017, there were nearly 4,000 patients on the United Network for Organ Sharing, the organization that manages the national transplant waiting list in the United States and matches donors to recipients.3 Unfortunately, the number of patients requiring a heart transplant far exceeds the number of registered donors, and a large number of patients must wait years for transplantation. In addition to those awaiting a heart transplant, there are many patients with advanced heart failure who are not suitable candidates for transplant (usually due to age).
Left Ventricular Assist Devices
As of December 31, 2016, a total of 22,866 US Food and Drug Administration (FDA)-approved devices were listed in the Interagency Registry for Mechanically Assisted Circulatory Support, 17,016 of which were continuous-flow (CF) left ventricular assist devices (LVADs), including the HeartMate II (HMII) (Abbott Laboratories) and the HeartWare Ventricular Assist Device (HVAD) (Medtronic).4 Left ventricular assist devices, which have been in use for over 30 years, have evolved into smaller, quieter, and more durable devices. The current generation of LVADs has a CF design (as opposed to the older pulsatile-flow [PF] design). More importantly, CF LVADs are associated with higher survival rates and increased quality of life than the earlier PF models.5 For these reasons, CF LVADs are being used much more frequently today. As previously noted, LVADs serve as a temporizing measure for patients awaiting a heart transplant (ie, bridge-to-transplant therapy [BTT]) or as the primary treatment for patients who are not suitable candidates for transplant (ie, destination therapy [DT]).
The percentage of patients receiving an LVAD as a DT has increased from around 15% between 2006 to 2007 to nearly 46% in 2014.6Recently, several reports following LVAD patients demonstrated a reverse remodeling of the heart and recovery of native cardiac function that was sufficient enough in some patients as to permit LVAD removal (ie, bridge to recovery).7 In the United States, the number of patients undergoing LVAD removal due to recovery remains fewer than 3%.6With the increase in the number of patients receiving LVADs, there is an increased likelihood of LVAD patients presenting to an ED due to device-related complications. Recognized complications associated with LVADs include thrombosis, infection, bleeding, and issues with volume status.5,7 However, the frequency of LVAD-associated complications and the final disposition of these patients is less well known.
HeartMate II Patient ED Presentation Study
Purpose
The purpose of our study was to identify the reasons for LVAD patient presentation to the ED, the frequency of these presentations, and the final disposition of these patients. Our institution, Sentara Norfolk General Hospital (SNGH), is a level I trauma and a tertiary care referral center, and it is the only hospital in a large area of Virginia to perform LVAD implantation.
Our study involved only patients implanted with the HMII LVAD.
Methods
Patients and Study Design
This was a retrospective study of patients with an HMII LVAD who presented to the SNGH ED between April 1, 2009 and September 9, 2012. All patients implanted with an HMII LVAD during the study period were assigned a study number linking the patient to their medical record number and social security number. Study numbers were assigned at the time of LVAD implantation by one of the investigators. This document was kept in a secure and locked location in the department of emergency medicine and was not accessible to anyone other than study investigators.
The electronic medical records were retrospectively reviewed to identify any HMII LVAD patient presenting to the SNGH ED during the study period. Information abstracted from the ED medical records included patient age, sex, initial complaint, final diagnosis, and disposition. Only the patient’s assigned study number was used on the data collection form, and no personal identifying information was present.
This study was granted approval for human subject research by the Eastern Virginia Medical School Institutional Review Board. Eligible patients included all patients with an HMII LVAD implanted during the study period. Study patients who presented to the SNGH ED between April 1, 2009 and September 9, 2012 were identified by a retrospective chart review. These patients were instructed to specifically seek care at the SNGH ED in the event of an emergency. There were no exclusion criteria.
Data were collected and reported in real numbers and percentages. No formal statistical analysis was used in evaluating the results.
Results
Between April 1, 2009 and September 9, 2012, there were a total of 98 patients with an HMII LVAD that had been implanted during the study period at SNGH. The average patient age was 53.6 years, with a range from age 20 years to 78 years. Sixty-seven (68%) of the patients enrolled in the study required at least one ED visit. The HMII LVAD patients who presented to the ED ranged in age from 20 years to 78 years, with an average age of 53.1 years. The average number of ED visits by these 67 patients was 3.7, with a range of 1 to 12. Approximately 56% of the ED visits were directly LVAD-related. In all, 67 patients were responsible for a total of 248 ED visits.
The two most common reasons for presentation to the ED involved bleeding and volume overload. A total of 37 ED visits (14.9%), were related to bleeding, which included gastrointestinal (GI) bleeding (18/37 or 49%), epistaxis, hematuria, gingival bleeding, and postoperative bleeding following tooth extraction.
Volume overload accounted for 37 ED visits (14.9%), and the most common presenting symptom in these patients was shortness of breath. Other reasons patients presented to the ED were weakness/lightheadedness/dizziness/syncope (24/9.6%), device malfunction (20/8.1%), infection (7/2.8%), and transient ischemic attack/cerebrovascular accident (6/2.4%). For infection-related ED visits, two presentations (2.9%) involved a driveline infection. Common causes for ED visits related to device malfunction included battery failure and device-alarm activation. Overall, 142 of the 248 total ED visits (57.3%) resulted in hospital admission. One patient in the study presented in cardiac arrest and could not be resuscitated.
The remaining 108 LVAD patient ED visits (44%), did not appear to be related to the presence of the LVAD, but rather represented common reasons for presentation to an ED. These other non-LVAD-related reasons for presentation to the ED were due to motor vehicle incidents (3); assault (2); dental pain (3); mechanical fall (5); and upper respiratory tract infection (4), and represented small groupings of patient reasons for an ED visit.
Examples of singular reasons for presentation to the ED included one patient who presented with suicidal ideation, and another patient who presented for evaluation of symptoms suspicious for a sexually transmitted infection.
Discussion
As the number of patients with advanced heart failure continues to increase, the number of those with an LVAD also increases. Between 2006 and June 2013, nearly 9,000 adult patients in the United States received a durable LVAD.6 In the early years of LVAD implantation, patients were restricted to remain in proximity of geographical areas surrounding academic health care centers. An increased comfort level by both physicians and patients now allows LVAD patients to reside in more distant communities. This increase in LVAD implantation, coupled with the widening patient distribution, make it important for every emergency physician (EP) to have a working knowledge of the device and its associated complications. To date, the characteristics and frequency of LVAD patient presentations to the ED have not been well characterized.
Left ventricular assist devices are considered in patients who have significant symptoms associated with poor LV function or who cannot maintain normal hemodynamics and vital organ function. Continuous-flow LVADs account for almost all devices currently implanted. During our data-collection period, there were two FDA-approved implantable LVADs—the HMII, approved for BTT in 2008 and for DT in 2010; and the HVAD approved for BTT in 2012. In August 2017, HeartMate III (Abbott Laboratories) was approved by the FDA. All patients enrolled in our study were recipients of the HMII device, as this was the only type of LVAD implant performed at our hospital. Current survival with the HMII LVAD is 80% at 1 year and 69% at 2 years, and there has not been shown to be a significant difference when stratified by era of implant.6
Device Designs and Structures
The pump of the HMII is inserted into the abdominal cavity, whereas the HVAD is implanted in the chest cavity, with the inflow cannula in the apex of the LV and the outflow cannula connecting to the proximal aorta. Blood is continuously pumped through the system.8,9 The pump is connected to a driveline that exits the body and connects to a controller. Continuous-flow devices have either an axial or centrifugal blood pump. Axial devices have an impeller that is connected to ball-and-cup bearings that accelerate blood along its axis. Newer axial flow pumps incorporate magnetic levitation of the rotor and do not require the use of bearings. Centrifugal devices accelerate blood circumferentially with a rotor that is suspended within in the blood pool by electromagnetic or hydrodynamic forces.10 The controller is powered by two external batteries or connected to a power base unit where the pump can be interrogated. The controller is usually housed in a garment worn by the patient, one that also includes the batteries. The controller can also be powered by a base unit that can be plugged into an electrical outlet.11
There are, and continue to be, advances in both LVAD design and function. Since the time period of our study, changes have been made in the outflow bend relief (the tube at the junction of the outflow cannula and the pump housing designed to prevent kinking of the outflow cannula) and the LVAD controller. Older controllers have been replaced with newer models, but many of the LVAD pumps in this article remain in service.
Anticoagulation Therapy
Patients who have a CF LVAD require anticoagulation therapy with warfarin to a target international normalized ratio (INR) of 2 to 3, in addition to aspirin therapy of 325 mg daily.8,9Newer oral anticoagulant drugs are not routinely given to patients who have a CF LVAD.
Cardiopulmonary Evaluation
With CF LVADs, blood is pumped continuously, and a constant, machine-like murmur can be heard on auscultation rather than the typical heart sounds. Patients who have an LVAD may not have palpable arterial pulses. Doppler evaluation of the brachial artery and a manual blood pressure (BP) cuff are used to listen for the start of Korotkoff sounds as the cuff is released. The pressure at which the first sound is heard is used to estimate the patient’s mean arterial pressure (MAP) at the time when there is no pulse; and the systolic BP (SBP) is heard at the time when there is pulse. Patients with a CF LVAD with nonpulsatile flow should have a MAP between 70 mm Hg and 90 mm Hg (HMII), or 70 mm Hg and 80 mm Hg (HVAD). Patients who have a CF LVAD with a palpable pulse should have an SBP less than 120 mm Hg (HMII) or 105 mm Hg (HVAD). Readings outside of these ranges require an adjustment in the patient’s antihypertensive therapy, since high BP increases the risk of stroke and can impair the cardiac support provided by the LVAD.8Low BP may be the result of inadequate pump speed, dehydration, inflow cannula obstruction, or pump thrombus.
Bleeding
In our study, bleeding and volume overload were the two most common reasons LVAD patients presented to the ED. Interestingly, in a systematic review of clinical outcomes following CF LVAD implantation, bleeding was the most commonly recorded adverse event.12In fact, the majority of patients in all of the studies reviewed experienced at least one bleeding event. In one study of 139 HMII LVAD patients, the risk of bleeding was greatest within the first two weeks, and early bleeding was associated with increased mortality.13The most common source of bleeding complications in patients with a CF LVAD are GI, similar to our study.14
In a review and meta-analysis by Draper et al,15of GI bleeding in 1,697 patients with CF LVADs, the pooled prevalence was 23%.Subgroup analysis demonstrated an increased risk of bleeding in older patients and in those who had an elevated serum creatinine level.15 Upper GI bleeding occurred in 48% of patients, lower GI bleeding in 22%, small-bowel bleeding in 15%, and bleeding at an unknown site in 19%. The most common cause of the bleeding was from arteriovenous malformations (AVMs).15 In their review, Draper et al15 found a 9.3% prevalence of recurrent GI bleeding and a pooled event rate for an all-cause mortality rate of 23%.
They also noted that the increased risk of GI bleeding in CF LVAD patients is multifactorial. For example, there was decreased activity of type 2 von Willebrand factor multimers in patients with CF LVADs, leading to an acquired von Willebrand syndrome.15
Another finding seen in this review was that CF devices lead to a low pulse-pressure system, which is thought to cause some degree of intestinal hypoperfusion, potentially leading to vascular dilation and AVM formation.15 Based on findings, a neurovascular etiology involving increased sympathetic tone resulting in smooth muscle relaxation and AVM formation has been proposed. Lastly, the anticoagulation required with the CF LVADs to prevent pump thrombosis also increases the risk of GI bleeding, especially when combined with aspirin or other antiplatelet agents which are routinely prescribed.15
Volume Overload
Interestingly, in our study, volume overload as a cause for ED presentation was the same as for bleeding complications. In the systematic review of clinical outcomes in CF LVAD patients, volume overload or ongoing heart failure occurred in 18% of patients 1 year after device implantation.12
The clinical presentation of patients experiencing volume overload is typically dyspnea and fatigue; on physical examination they will frequently demonstrate evidence of fluid retention, such as dependent edema and pulmonary congestion.16Causes of volume overload in the LVAD patient includes medication noncompliance, inadequate pump speed, device malfunction, right ventricular failure, impaired renal function, and cardiac tamponade.16 These patients will frequently have MAPs greater than 90 mm Hg, and may require treatment with diuretics, calcium channel blockers, beta-blockers, or angiotensin-converting enzyme inhibitors.8
Weakness, Lightheadedness, Dizziness, Syncope
In our study, some combination of weakness, lightheadedness, dizziness, and syncope accounted for the third most common cause of ED presentation (9.6%). In the majority of cases, this was due to dehydration. Usually, these patients will have a MAP less than 60 mm Hg. Unfortunately, patients with pump thrombosis, sepsis, or cannula malposition can also present with a low MAP. It is important to differentiate the cause, as the management is quite different, depending on the etiology. Bedside ultrasound can play an important role in evaluating the volume status and cannula position.8 In addition, emergent consult with the patients ventricular assist device (VAD) treatment team is critical.8 Pump thrombus is a medical emergency and is usually associated with hematuria without red blood cells in the urine, acute kidney injury, and marked elevations in lactate dehydrogenase and serum free hemoglobin.8 If not treated promptly, renal failure and death may result. If dehydration is the cause, gentle rehydration with intravenous normal saline and electrolyte replacement may be all that is required.
Device Malfunction
Device malfunction was the next most common reason for ED presentation in our study, at 8.1%. This category included a number of different events, including battery failure, driveline fracture, and pump thrombosis. According to McIlvennan et al,12 causes of device malfunction include thrombus formation with hemolysis, mechanical failure of the impeller, and driveline lead fractures with electrical failure.Again, the VAD team should be consulted immediately, and the EP should plug the LVAD into a hospital power base, if available, to conserve battery life. If power is interrupted, the pump will stop working. The EP should examine all of the connections from the percutaneous lead to the controller and from the controller to the batteries to ensure they are intact. The exit site for the percutaneous lead should be examined for evidence of trauma or signs of infection. The patient should also be asked about recent trauma to the driveline.
Neurological Events
Interestingly, in other reviews, neurological events, including ischemic stroke, hemorrhagic stroke, and transient ischemic attack occur with higher frequency than was the case in the study, and are relatively common complications that can result in severe morbidity and mortality.12In the Interagency Registry for Mechanically Assisted Circulatory Support report, there was a 3% risk of stroke at 1 month, 5% at 3 months, 7% at 6 months, 11% at 12 months, 17% at 24 months, and 19% at 36 months post-implant.6,12Similarly, the HMII DT Trial demonstrated rates of ischemic and hemorrhagic stroke as high as 8% and 11% respectively, within the first 2 years following LVAD placement.5,6In our study, neurological events accounted for only six (2.4%) of ED visits. It is unclear why our numbers were less than those reported by others.
Cardiac Events and Management
During the study period, one LVAD patient presented to the ED in cardiac arrest. Patients who have an LVAD and are in cardiac arrest have unique considerations that deserve discussion. If the LVAD pump has stopped functioning, connections between the system controller and the pump and power source must be checked, as loose connections need to be refitted and the pump restarted. It is important to note that when an LVAD ceases operation, blood becomes stagnant in the pump and conduits. Delays of even several minutes pose a significant risk for pump thrombosis, stroke, and thromboembolism when the device is restarted. If the pump does not restart and the patient is connected to batteries, the batteries should be replaced with a new, fully charged pair, or the device should be connected to a base unit.17
Due to the location of the outflow graft on the aorta and the inflow conduit in the LV apex, external chest compressions pose a risk of dislodging the device and causing fatal hemorrhage. Clinical judgment should be used when deciding to perform external chest compressions. A recent American Heart Association scientific statement concluded that withholding chest compression in a patient with an LVAD who is truly in circulatory failure that is not attributable to a device failure would cause more harm to the patient than the potential to dislodge the device.18
Direct cardiac massage, performed by a skilled surgeon may be effective in patients that have had recent device implantation, especially if prior to mediastinal healing.16 If external defibrillation/cardioversion is required, the percutaneous lead should not be disconnected from the system controller and the pump should not be stopped prior to the delivery of a shock.17
Study Limitations
This was a retrospective study and has the limitations common to all such studies. It is possible that some of the patients in our study sought care at a hospital ED outside of our system, and therefore were not included in our study. This, however, is exceedingly unlikely as the cardiologists and care team continually emphasized and instructed all patients in our study only to present to the study hospital ED for any complaint. Similarly, the various emergency medical services agencies for our region were also instructed to bring all LVAD patients to the study hospital.
Another limitation of our study is the relatively small total number of patients (98) and that our findings may not apply to other patient populations. This limitation, however, would be true for any hospital system that limits the type of LVAD implant procedure to one manufacturer (HMII in this instance).
Conclusion
Emergency physicians must be prepared to evaluate the LVAD patient presenting to the ED. A little over 55% of the time, the visit will be directly related to the LVAD; in the remainder of cases, patient presentation will be due to a non-LVAD-related cause. At initial presentation, however, the EP should assume that the ED visit is related to the LVAD, until a thorough history and physical examination can exclude otherwise.
Because of the high incidence of GI bleeding in LVAD patients, a rectal examination for blood in the stool should be performed for any complaint that may be related, such as generalized weakness, syncope, or shortness of breath. In the majority of cases, a complete blood count; complete metabolic profile, including lactic acid dehydrogenase; and coagulation studies, including prothrombin time and INRs, are indicated. Most patients with an LVAD will require a member of the VAD team (typically the perfusionist or biomedical engineer) to interrogate the controller if there is any concern about its function, including alarm sounding or lights flashing.
1. Benjamin EJ, Blaha MJ, Chiuve SE, et al; American Heart Association Statistics Committee and Stroke Statistics Subcommittee. Heart disease and stroke statistics-2017 update: a report from the American Heart Association. Circulation. 2017;135(10):e146-e603. doi:10.1161/CIR.0000000000000485. Erratum in: Circulation. 2017;135(1):e646. doi:10.1161/CIR.0000000000000491.
2. Lund LH, Edwards LB, Kucheryavaya AY, et al. The Registry of the International Society for Heart and Lung Transplantation: thirtieth official adult heart transplant report—2013; focus theme: age. J Heart Lung Transplant. 2013;32(10):951-964. doi:10.1016/j.healun.2013.08.006.
3. UNOS (United Network for Organ Sharing) Web site. https://unos.org/data/transplant-trends/waiting-list-candidates-by-organ-type/. Accessed February 8, 2018.
4. Kirklin JK, Pagani FD, Kormos RL, et al. Eighth annual INTERMACS report: Special focus on framing the impact of adverse events. J Heart Lung Transplant. 2017;36(10):1080-1086. doi:10.1016/j.healun.2017.07.005.
5. Slaughter MS, Rogers JG, Milano CA, et al. Advanced heart failure treated with continuous flow left ventricular assist device. N Engl J Med. 2009;361(23):2241-2251. doi:10.1056/NEJMoa0909938.
6. Kirklin JK, Naftel DC, Pagani FD, et al. Seventh INTERMACS annual report: 15,000 patients and counting. J Heart Lung Transplant. 2015;34(12):1495-1504. doi:10.1016/j.healun.2015.10.003.
7. Ambardekar AV, Buttrick PM. Reverse remodeling with left ventricular assist devices: a review of clinical, cellular and molecular effects. Circ Heart Fail. 2011;4(2):224-233. doi:10.1161/CIRCHEARTFAILURE.110.959684.
8. Slaughter MS, Pagani FD, Rogers JG, et al. Clinical management of continuous-flow left ventricular assist devices in advanced heart failure. J Heart Lung Transplant. 2010;29 (suppl 4):1-39. doi:10.1016/j.healun.2010.01.011.
9. Lo BM, Devine AS. Patients with left ventricular assist devices. Critical Decisions in Emergency Medicine. 2014;28(7):2-9.
10. Feldman D, Pamboukian SV, Teuteberg JJ, et al. The 2013 International Society for Heart and Lung Transplantation guidelines for mechanical circulatory support: executive summary. J Heart Lung Transplant. 2013;32(2):157-187. doi:10.1016/j.healun.2012.09.013.
11. Miller LW, Pagani FD, Russell SD, et al. Use of a continuous-flow device in patients awaiting heart transplantation. N Engl J Med. 2007;357(9):885-896. doi:10.1056/NEJMoa067758.
12. McIlvennan CK, Magid KH, Ambardekar AV, et al. Clinical outcomes following continuous-flow left ventricular assist device: a systematic review. Circ Heart Fail. 2014;7(6):1003-1013. doi:10.1161/
13. Mulloy DP, Bhamidipati CM, Stone ML, et al. Cryoablation during left ventricular assist device implantation reduces postoperative ventricular tachyarrhythmias. J Thorac Cardiovasc Surg. 2013;145(5):1207-1213. doi:10.1016/j.jtcvs.2012.03.061.
14. Stern DR, Kazam J, Edwards P, et al. Increased incidence of gastrointestinal bleeding following implantation of the Heartmate II LVAD. J Card Surg. 2010;25(3):352-356. doi:10.1111/j.1540-8191.2010.01025.x.
15. Draper KV, Huang RJ, Gerson LB. GI bleeding in patients with continuous-flow left ventricular assist devices: a systematic review and meta-analysis. Gastrointest Endosc. 2014;80(3):435-446. doi:10.1016/j.gie.2014.03.040.
16. Aissaoui N, Morshuis M, Diebold B, et al. Heart failure while on ventricular assist device support: a true clinical entity? Arch Cardiovasc Dis. 2013:106(1):44-51. doi:10.1016/j.acvd.2012.09.006.
17. Thoratec HeartMate II Left Ventricular Assist System (LVAS) Information and Emergency Assistance Guide. Thoratec Corporation Web site. http://www.thoratec.com/_assets/download-tracker/HM_II_Info_Emergency_Assist_Guide_US_103873B_ENGLISH.pdf. Accessed July 5, 2017.
18. Peberdy MA, Gluck JA, Ornato JP, et al; American Heart Association Emergency Cardiovascular Care Committee; Council on Cardiopulmonary, Critical Care, Perioperative, and Resuscitation; Council on Cardiovascular Diseases in the Young; Council on Cardiovascular Surgery and Anesthesia; Council on Cardiovascular and Stroke Nursing; and Council on Clinical Cardiology. Cardiopulmonary resuscitation in adults and children with mechanical circulatory support a scientific statement from the American Heart Association. Circulation. 2017;135(24):e1115-e1134. doi:10.1161/CIR.0000000000000504.
Introduction
Approximately 6.5 million adults in the United States have heart failure, accounting for nearly 1 million ED visits annually.1 Advanced heart failure is particularly difficult to treat, and is associated with significant morbidity and mortality. While medical therapy is the initial treatment for patients with advanced heart failure, it has limited effectiveness; therefore, at the present time, heart transplant is the most effective treatment for heart failure refractory to medical management.
According to the 2013 Registry of the International Society for Heart and Lung Transplantation, 4,096 cardiac transplants were performed worldwide in 2011, approximately 2,000 of which were done in the United States.2
The average age of a heart transplant recipient in the United States is 55 years.2 In 2017, there were nearly 4,000 patients on the United Network for Organ Sharing, the organization that manages the national transplant waiting list in the United States and matches donors to recipients.3 Unfortunately, the number of patients requiring a heart transplant far exceeds the number of registered donors, and a large number of patients must wait years for transplantation. In addition to those awaiting a heart transplant, there are many patients with advanced heart failure who are not suitable candidates for transplant (usually due to age).
Left Ventricular Assist Devices
As of December 31, 2016, a total of 22,866 US Food and Drug Administration (FDA)-approved devices were listed in the Interagency Registry for Mechanically Assisted Circulatory Support, 17,016 of which were continuous-flow (CF) left ventricular assist devices (LVADs), including the HeartMate II (HMII) (Abbott Laboratories) and the HeartWare Ventricular Assist Device (HVAD) (Medtronic).4 Left ventricular assist devices, which have been in use for over 30 years, have evolved into smaller, quieter, and more durable devices. The current generation of LVADs has a CF design (as opposed to the older pulsatile-flow [PF] design). More importantly, CF LVADs are associated with higher survival rates and increased quality of life than the earlier PF models.5 For these reasons, CF LVADs are being used much more frequently today. As previously noted, LVADs serve as a temporizing measure for patients awaiting a heart transplant (ie, bridge-to-transplant therapy [BTT]) or as the primary treatment for patients who are not suitable candidates for transplant (ie, destination therapy [DT]).
The percentage of patients receiving an LVAD as a DT has increased from around 15% between 2006 to 2007 to nearly 46% in 2014.6Recently, several reports following LVAD patients demonstrated a reverse remodeling of the heart and recovery of native cardiac function that was sufficient enough in some patients as to permit LVAD removal (ie, bridge to recovery).7 In the United States, the number of patients undergoing LVAD removal due to recovery remains fewer than 3%.6With the increase in the number of patients receiving LVADs, there is an increased likelihood of LVAD patients presenting to an ED due to device-related complications. Recognized complications associated with LVADs include thrombosis, infection, bleeding, and issues with volume status.5,7 However, the frequency of LVAD-associated complications and the final disposition of these patients is less well known.
HeartMate II Patient ED Presentation Study
Purpose
The purpose of our study was to identify the reasons for LVAD patient presentation to the ED, the frequency of these presentations, and the final disposition of these patients. Our institution, Sentara Norfolk General Hospital (SNGH), is a level I trauma and a tertiary care referral center, and it is the only hospital in a large area of Virginia to perform LVAD implantation.
Our study involved only patients implanted with the HMII LVAD.
Methods
Patients and Study Design
This was a retrospective study of patients with an HMII LVAD who presented to the SNGH ED between April 1, 2009 and September 9, 2012. All patients implanted with an HMII LVAD during the study period were assigned a study number linking the patient to their medical record number and social security number. Study numbers were assigned at the time of LVAD implantation by one of the investigators. This document was kept in a secure and locked location in the department of emergency medicine and was not accessible to anyone other than study investigators.
The electronic medical records were retrospectively reviewed to identify any HMII LVAD patient presenting to the SNGH ED during the study period. Information abstracted from the ED medical records included patient age, sex, initial complaint, final diagnosis, and disposition. Only the patient’s assigned study number was used on the data collection form, and no personal identifying information was present.
This study was granted approval for human subject research by the Eastern Virginia Medical School Institutional Review Board. Eligible patients included all patients with an HMII LVAD implanted during the study period. Study patients who presented to the SNGH ED between April 1, 2009 and September 9, 2012 were identified by a retrospective chart review. These patients were instructed to specifically seek care at the SNGH ED in the event of an emergency. There were no exclusion criteria.
Data were collected and reported in real numbers and percentages. No formal statistical analysis was used in evaluating the results.
Results
Between April 1, 2009 and September 9, 2012, there were a total of 98 patients with an HMII LVAD that had been implanted during the study period at SNGH. The average patient age was 53.6 years, with a range from age 20 years to 78 years. Sixty-seven (68%) of the patients enrolled in the study required at least one ED visit. The HMII LVAD patients who presented to the ED ranged in age from 20 years to 78 years, with an average age of 53.1 years. The average number of ED visits by these 67 patients was 3.7, with a range of 1 to 12. Approximately 56% of the ED visits were directly LVAD-related. In all, 67 patients were responsible for a total of 248 ED visits.
The two most common reasons for presentation to the ED involved bleeding and volume overload. A total of 37 ED visits (14.9%), were related to bleeding, which included gastrointestinal (GI) bleeding (18/37 or 49%), epistaxis, hematuria, gingival bleeding, and postoperative bleeding following tooth extraction.
Volume overload accounted for 37 ED visits (14.9%), and the most common presenting symptom in these patients was shortness of breath. Other reasons patients presented to the ED were weakness/lightheadedness/dizziness/syncope (24/9.6%), device malfunction (20/8.1%), infection (7/2.8%), and transient ischemic attack/cerebrovascular accident (6/2.4%). For infection-related ED visits, two presentations (2.9%) involved a driveline infection. Common causes for ED visits related to device malfunction included battery failure and device-alarm activation. Overall, 142 of the 248 total ED visits (57.3%) resulted in hospital admission. One patient in the study presented in cardiac arrest and could not be resuscitated.
The remaining 108 LVAD patient ED visits (44%), did not appear to be related to the presence of the LVAD, but rather represented common reasons for presentation to an ED. These other non-LVAD-related reasons for presentation to the ED were due to motor vehicle incidents (3); assault (2); dental pain (3); mechanical fall (5); and upper respiratory tract infection (4), and represented small groupings of patient reasons for an ED visit.
Examples of singular reasons for presentation to the ED included one patient who presented with suicidal ideation, and another patient who presented for evaluation of symptoms suspicious for a sexually transmitted infection.
Discussion
As the number of patients with advanced heart failure continues to increase, the number of those with an LVAD also increases. Between 2006 and June 2013, nearly 9,000 adult patients in the United States received a durable LVAD.6 In the early years of LVAD implantation, patients were restricted to remain in proximity of geographical areas surrounding academic health care centers. An increased comfort level by both physicians and patients now allows LVAD patients to reside in more distant communities. This increase in LVAD implantation, coupled with the widening patient distribution, make it important for every emergency physician (EP) to have a working knowledge of the device and its associated complications. To date, the characteristics and frequency of LVAD patient presentations to the ED have not been well characterized.
Left ventricular assist devices are considered in patients who have significant symptoms associated with poor LV function or who cannot maintain normal hemodynamics and vital organ function. Continuous-flow LVADs account for almost all devices currently implanted. During our data-collection period, there were two FDA-approved implantable LVADs—the HMII, approved for BTT in 2008 and for DT in 2010; and the HVAD approved for BTT in 2012. In August 2017, HeartMate III (Abbott Laboratories) was approved by the FDA. All patients enrolled in our study were recipients of the HMII device, as this was the only type of LVAD implant performed at our hospital. Current survival with the HMII LVAD is 80% at 1 year and 69% at 2 years, and there has not been shown to be a significant difference when stratified by era of implant.6
Device Designs and Structures
The pump of the HMII is inserted into the abdominal cavity, whereas the HVAD is implanted in the chest cavity, with the inflow cannula in the apex of the LV and the outflow cannula connecting to the proximal aorta. Blood is continuously pumped through the system.8,9 The pump is connected to a driveline that exits the body and connects to a controller. Continuous-flow devices have either an axial or centrifugal blood pump. Axial devices have an impeller that is connected to ball-and-cup bearings that accelerate blood along its axis. Newer axial flow pumps incorporate magnetic levitation of the rotor and do not require the use of bearings. Centrifugal devices accelerate blood circumferentially with a rotor that is suspended within in the blood pool by electromagnetic or hydrodynamic forces.10 The controller is powered by two external batteries or connected to a power base unit where the pump can be interrogated. The controller is usually housed in a garment worn by the patient, one that also includes the batteries. The controller can also be powered by a base unit that can be plugged into an electrical outlet.11
There are, and continue to be, advances in both LVAD design and function. Since the time period of our study, changes have been made in the outflow bend relief (the tube at the junction of the outflow cannula and the pump housing designed to prevent kinking of the outflow cannula) and the LVAD controller. Older controllers have been replaced with newer models, but many of the LVAD pumps in this article remain in service.
Anticoagulation Therapy
Patients who have a CF LVAD require anticoagulation therapy with warfarin to a target international normalized ratio (INR) of 2 to 3, in addition to aspirin therapy of 325 mg daily.8,9Newer oral anticoagulant drugs are not routinely given to patients who have a CF LVAD.
Cardiopulmonary Evaluation
With CF LVADs, blood is pumped continuously, and a constant, machine-like murmur can be heard on auscultation rather than the typical heart sounds. Patients who have an LVAD may not have palpable arterial pulses. Doppler evaluation of the brachial artery and a manual blood pressure (BP) cuff are used to listen for the start of Korotkoff sounds as the cuff is released. The pressure at which the first sound is heard is used to estimate the patient’s mean arterial pressure (MAP) at the time when there is no pulse; and the systolic BP (SBP) is heard at the time when there is pulse. Patients with a CF LVAD with nonpulsatile flow should have a MAP between 70 mm Hg and 90 mm Hg (HMII), or 70 mm Hg and 80 mm Hg (HVAD). Patients who have a CF LVAD with a palpable pulse should have an SBP less than 120 mm Hg (HMII) or 105 mm Hg (HVAD). Readings outside of these ranges require an adjustment in the patient’s antihypertensive therapy, since high BP increases the risk of stroke and can impair the cardiac support provided by the LVAD.8Low BP may be the result of inadequate pump speed, dehydration, inflow cannula obstruction, or pump thrombus.
Bleeding
In our study, bleeding and volume overload were the two most common reasons LVAD patients presented to the ED. Interestingly, in a systematic review of clinical outcomes following CF LVAD implantation, bleeding was the most commonly recorded adverse event.12In fact, the majority of patients in all of the studies reviewed experienced at least one bleeding event. In one study of 139 HMII LVAD patients, the risk of bleeding was greatest within the first two weeks, and early bleeding was associated with increased mortality.13The most common source of bleeding complications in patients with a CF LVAD are GI, similar to our study.14
In a review and meta-analysis by Draper et al,15of GI bleeding in 1,697 patients with CF LVADs, the pooled prevalence was 23%.Subgroup analysis demonstrated an increased risk of bleeding in older patients and in those who had an elevated serum creatinine level.15 Upper GI bleeding occurred in 48% of patients, lower GI bleeding in 22%, small-bowel bleeding in 15%, and bleeding at an unknown site in 19%. The most common cause of the bleeding was from arteriovenous malformations (AVMs).15 In their review, Draper et al15 found a 9.3% prevalence of recurrent GI bleeding and a pooled event rate for an all-cause mortality rate of 23%.
They also noted that the increased risk of GI bleeding in CF LVAD patients is multifactorial. For example, there was decreased activity of type 2 von Willebrand factor multimers in patients with CF LVADs, leading to an acquired von Willebrand syndrome.15
Another finding seen in this review was that CF devices lead to a low pulse-pressure system, which is thought to cause some degree of intestinal hypoperfusion, potentially leading to vascular dilation and AVM formation.15 Based on findings, a neurovascular etiology involving increased sympathetic tone resulting in smooth muscle relaxation and AVM formation has been proposed. Lastly, the anticoagulation required with the CF LVADs to prevent pump thrombosis also increases the risk of GI bleeding, especially when combined with aspirin or other antiplatelet agents which are routinely prescribed.15
Volume Overload
Interestingly, in our study, volume overload as a cause for ED presentation was the same as for bleeding complications. In the systematic review of clinical outcomes in CF LVAD patients, volume overload or ongoing heart failure occurred in 18% of patients 1 year after device implantation.12
The clinical presentation of patients experiencing volume overload is typically dyspnea and fatigue; on physical examination they will frequently demonstrate evidence of fluid retention, such as dependent edema and pulmonary congestion.16Causes of volume overload in the LVAD patient includes medication noncompliance, inadequate pump speed, device malfunction, right ventricular failure, impaired renal function, and cardiac tamponade.16 These patients will frequently have MAPs greater than 90 mm Hg, and may require treatment with diuretics, calcium channel blockers, beta-blockers, or angiotensin-converting enzyme inhibitors.8
Weakness, Lightheadedness, Dizziness, Syncope
In our study, some combination of weakness, lightheadedness, dizziness, and syncope accounted for the third most common cause of ED presentation (9.6%). In the majority of cases, this was due to dehydration. Usually, these patients will have a MAP less than 60 mm Hg. Unfortunately, patients with pump thrombosis, sepsis, or cannula malposition can also present with a low MAP. It is important to differentiate the cause, as the management is quite different, depending on the etiology. Bedside ultrasound can play an important role in evaluating the volume status and cannula position.8 In addition, emergent consult with the patients ventricular assist device (VAD) treatment team is critical.8 Pump thrombus is a medical emergency and is usually associated with hematuria without red blood cells in the urine, acute kidney injury, and marked elevations in lactate dehydrogenase and serum free hemoglobin.8 If not treated promptly, renal failure and death may result. If dehydration is the cause, gentle rehydration with intravenous normal saline and electrolyte replacement may be all that is required.
Device Malfunction
Device malfunction was the next most common reason for ED presentation in our study, at 8.1%. This category included a number of different events, including battery failure, driveline fracture, and pump thrombosis. According to McIlvennan et al,12 causes of device malfunction include thrombus formation with hemolysis, mechanical failure of the impeller, and driveline lead fractures with electrical failure.Again, the VAD team should be consulted immediately, and the EP should plug the LVAD into a hospital power base, if available, to conserve battery life. If power is interrupted, the pump will stop working. The EP should examine all of the connections from the percutaneous lead to the controller and from the controller to the batteries to ensure they are intact. The exit site for the percutaneous lead should be examined for evidence of trauma or signs of infection. The patient should also be asked about recent trauma to the driveline.
Neurological Events
Interestingly, in other reviews, neurological events, including ischemic stroke, hemorrhagic stroke, and transient ischemic attack occur with higher frequency than was the case in the study, and are relatively common complications that can result in severe morbidity and mortality.12In the Interagency Registry for Mechanically Assisted Circulatory Support report, there was a 3% risk of stroke at 1 month, 5% at 3 months, 7% at 6 months, 11% at 12 months, 17% at 24 months, and 19% at 36 months post-implant.6,12Similarly, the HMII DT Trial demonstrated rates of ischemic and hemorrhagic stroke as high as 8% and 11% respectively, within the first 2 years following LVAD placement.5,6In our study, neurological events accounted for only six (2.4%) of ED visits. It is unclear why our numbers were less than those reported by others.
Cardiac Events and Management
During the study period, one LVAD patient presented to the ED in cardiac arrest. Patients who have an LVAD and are in cardiac arrest have unique considerations that deserve discussion. If the LVAD pump has stopped functioning, connections between the system controller and the pump and power source must be checked, as loose connections need to be refitted and the pump restarted. It is important to note that when an LVAD ceases operation, blood becomes stagnant in the pump and conduits. Delays of even several minutes pose a significant risk for pump thrombosis, stroke, and thromboembolism when the device is restarted. If the pump does not restart and the patient is connected to batteries, the batteries should be replaced with a new, fully charged pair, or the device should be connected to a base unit.17
Due to the location of the outflow graft on the aorta and the inflow conduit in the LV apex, external chest compressions pose a risk of dislodging the device and causing fatal hemorrhage. Clinical judgment should be used when deciding to perform external chest compressions. A recent American Heart Association scientific statement concluded that withholding chest compression in a patient with an LVAD who is truly in circulatory failure that is not attributable to a device failure would cause more harm to the patient than the potential to dislodge the device.18
Direct cardiac massage, performed by a skilled surgeon may be effective in patients that have had recent device implantation, especially if prior to mediastinal healing.16 If external defibrillation/cardioversion is required, the percutaneous lead should not be disconnected from the system controller and the pump should not be stopped prior to the delivery of a shock.17
Study Limitations
This was a retrospective study and has the limitations common to all such studies. It is possible that some of the patients in our study sought care at a hospital ED outside of our system, and therefore were not included in our study. This, however, is exceedingly unlikely as the cardiologists and care team continually emphasized and instructed all patients in our study only to present to the study hospital ED for any complaint. Similarly, the various emergency medical services agencies for our region were also instructed to bring all LVAD patients to the study hospital.
Another limitation of our study is the relatively small total number of patients (98) and that our findings may not apply to other patient populations. This limitation, however, would be true for any hospital system that limits the type of LVAD implant procedure to one manufacturer (HMII in this instance).
Conclusion
Emergency physicians must be prepared to evaluate the LVAD patient presenting to the ED. A little over 55% of the time, the visit will be directly related to the LVAD; in the remainder of cases, patient presentation will be due to a non-LVAD-related cause. At initial presentation, however, the EP should assume that the ED visit is related to the LVAD, until a thorough history and physical examination can exclude otherwise.
Because of the high incidence of GI bleeding in LVAD patients, a rectal examination for blood in the stool should be performed for any complaint that may be related, such as generalized weakness, syncope, or shortness of breath. In the majority of cases, a complete blood count; complete metabolic profile, including lactic acid dehydrogenase; and coagulation studies, including prothrombin time and INRs, are indicated. Most patients with an LVAD will require a member of the VAD team (typically the perfusionist or biomedical engineer) to interrogate the controller if there is any concern about its function, including alarm sounding or lights flashing.
Introduction
Approximately 6.5 million adults in the United States have heart failure, accounting for nearly 1 million ED visits annually.1 Advanced heart failure is particularly difficult to treat, and is associated with significant morbidity and mortality. While medical therapy is the initial treatment for patients with advanced heart failure, it has limited effectiveness; therefore, at the present time, heart transplant is the most effective treatment for heart failure refractory to medical management.
According to the 2013 Registry of the International Society for Heart and Lung Transplantation, 4,096 cardiac transplants were performed worldwide in 2011, approximately 2,000 of which were done in the United States.2
The average age of a heart transplant recipient in the United States is 55 years.2 In 2017, there were nearly 4,000 patients on the United Network for Organ Sharing, the organization that manages the national transplant waiting list in the United States and matches donors to recipients.3 Unfortunately, the number of patients requiring a heart transplant far exceeds the number of registered donors, and a large number of patients must wait years for transplantation. In addition to those awaiting a heart transplant, there are many patients with advanced heart failure who are not suitable candidates for transplant (usually due to age).
Left Ventricular Assist Devices
As of December 31, 2016, a total of 22,866 US Food and Drug Administration (FDA)-approved devices were listed in the Interagency Registry for Mechanically Assisted Circulatory Support, 17,016 of which were continuous-flow (CF) left ventricular assist devices (LVADs), including the HeartMate II (HMII) (Abbott Laboratories) and the HeartWare Ventricular Assist Device (HVAD) (Medtronic).4 Left ventricular assist devices, which have been in use for over 30 years, have evolved into smaller, quieter, and more durable devices. The current generation of LVADs has a CF design (as opposed to the older pulsatile-flow [PF] design). More importantly, CF LVADs are associated with higher survival rates and increased quality of life than the earlier PF models.5 For these reasons, CF LVADs are being used much more frequently today. As previously noted, LVADs serve as a temporizing measure for patients awaiting a heart transplant (ie, bridge-to-transplant therapy [BTT]) or as the primary treatment for patients who are not suitable candidates for transplant (ie, destination therapy [DT]).
The percentage of patients receiving an LVAD as a DT has increased from around 15% between 2006 to 2007 to nearly 46% in 2014.6Recently, several reports following LVAD patients demonstrated a reverse remodeling of the heart and recovery of native cardiac function that was sufficient enough in some patients as to permit LVAD removal (ie, bridge to recovery).7 In the United States, the number of patients undergoing LVAD removal due to recovery remains fewer than 3%.6With the increase in the number of patients receiving LVADs, there is an increased likelihood of LVAD patients presenting to an ED due to device-related complications. Recognized complications associated with LVADs include thrombosis, infection, bleeding, and issues with volume status.5,7 However, the frequency of LVAD-associated complications and the final disposition of these patients is less well known.
HeartMate II Patient ED Presentation Study
Purpose
The purpose of our study was to identify the reasons for LVAD patient presentation to the ED, the frequency of these presentations, and the final disposition of these patients. Our institution, Sentara Norfolk General Hospital (SNGH), is a level I trauma and a tertiary care referral center, and it is the only hospital in a large area of Virginia to perform LVAD implantation.
Our study involved only patients implanted with the HMII LVAD.
Methods
Patients and Study Design
This was a retrospective study of patients with an HMII LVAD who presented to the SNGH ED between April 1, 2009 and September 9, 2012. All patients implanted with an HMII LVAD during the study period were assigned a study number linking the patient to their medical record number and social security number. Study numbers were assigned at the time of LVAD implantation by one of the investigators. This document was kept in a secure and locked location in the department of emergency medicine and was not accessible to anyone other than study investigators.
The electronic medical records were retrospectively reviewed to identify any HMII LVAD patient presenting to the SNGH ED during the study period. Information abstracted from the ED medical records included patient age, sex, initial complaint, final diagnosis, and disposition. Only the patient’s assigned study number was used on the data collection form, and no personal identifying information was present.
This study was granted approval for human subject research by the Eastern Virginia Medical School Institutional Review Board. Eligible patients included all patients with an HMII LVAD implanted during the study period. Study patients who presented to the SNGH ED between April 1, 2009 and September 9, 2012 were identified by a retrospective chart review. These patients were instructed to specifically seek care at the SNGH ED in the event of an emergency. There were no exclusion criteria.
Data were collected and reported in real numbers and percentages. No formal statistical analysis was used in evaluating the results.
Results
Between April 1, 2009 and September 9, 2012, there were a total of 98 patients with an HMII LVAD that had been implanted during the study period at SNGH. The average patient age was 53.6 years, with a range from age 20 years to 78 years. Sixty-seven (68%) of the patients enrolled in the study required at least one ED visit. The HMII LVAD patients who presented to the ED ranged in age from 20 years to 78 years, with an average age of 53.1 years. The average number of ED visits by these 67 patients was 3.7, with a range of 1 to 12. Approximately 56% of the ED visits were directly LVAD-related. In all, 67 patients were responsible for a total of 248 ED visits.
The two most common reasons for presentation to the ED involved bleeding and volume overload. A total of 37 ED visits (14.9%), were related to bleeding, which included gastrointestinal (GI) bleeding (18/37 or 49%), epistaxis, hematuria, gingival bleeding, and postoperative bleeding following tooth extraction.
Volume overload accounted for 37 ED visits (14.9%), and the most common presenting symptom in these patients was shortness of breath. Other reasons patients presented to the ED were weakness/lightheadedness/dizziness/syncope (24/9.6%), device malfunction (20/8.1%), infection (7/2.8%), and transient ischemic attack/cerebrovascular accident (6/2.4%). For infection-related ED visits, two presentations (2.9%) involved a driveline infection. Common causes for ED visits related to device malfunction included battery failure and device-alarm activation. Overall, 142 of the 248 total ED visits (57.3%) resulted in hospital admission. One patient in the study presented in cardiac arrest and could not be resuscitated.
The remaining 108 LVAD patient ED visits (44%), did not appear to be related to the presence of the LVAD, but rather represented common reasons for presentation to an ED. These other non-LVAD-related reasons for presentation to the ED were due to motor vehicle incidents (3); assault (2); dental pain (3); mechanical fall (5); and upper respiratory tract infection (4), and represented small groupings of patient reasons for an ED visit.
Examples of singular reasons for presentation to the ED included one patient who presented with suicidal ideation, and another patient who presented for evaluation of symptoms suspicious for a sexually transmitted infection.
Discussion
As the number of patients with advanced heart failure continues to increase, the number of those with an LVAD also increases. Between 2006 and June 2013, nearly 9,000 adult patients in the United States received a durable LVAD.6 In the early years of LVAD implantation, patients were restricted to remain in proximity of geographical areas surrounding academic health care centers. An increased comfort level by both physicians and patients now allows LVAD patients to reside in more distant communities. This increase in LVAD implantation, coupled with the widening patient distribution, make it important for every emergency physician (EP) to have a working knowledge of the device and its associated complications. To date, the characteristics and frequency of LVAD patient presentations to the ED have not been well characterized.
Left ventricular assist devices are considered in patients who have significant symptoms associated with poor LV function or who cannot maintain normal hemodynamics and vital organ function. Continuous-flow LVADs account for almost all devices currently implanted. During our data-collection period, there were two FDA-approved implantable LVADs—the HMII, approved for BTT in 2008 and for DT in 2010; and the HVAD approved for BTT in 2012. In August 2017, HeartMate III (Abbott Laboratories) was approved by the FDA. All patients enrolled in our study were recipients of the HMII device, as this was the only type of LVAD implant performed at our hospital. Current survival with the HMII LVAD is 80% at 1 year and 69% at 2 years, and there has not been shown to be a significant difference when stratified by era of implant.6
Device Designs and Structures
The pump of the HMII is inserted into the abdominal cavity, whereas the HVAD is implanted in the chest cavity, with the inflow cannula in the apex of the LV and the outflow cannula connecting to the proximal aorta. Blood is continuously pumped through the system.8,9 The pump is connected to a driveline that exits the body and connects to a controller. Continuous-flow devices have either an axial or centrifugal blood pump. Axial devices have an impeller that is connected to ball-and-cup bearings that accelerate blood along its axis. Newer axial flow pumps incorporate magnetic levitation of the rotor and do not require the use of bearings. Centrifugal devices accelerate blood circumferentially with a rotor that is suspended within in the blood pool by electromagnetic or hydrodynamic forces.10 The controller is powered by two external batteries or connected to a power base unit where the pump can be interrogated. The controller is usually housed in a garment worn by the patient, one that also includes the batteries. The controller can also be powered by a base unit that can be plugged into an electrical outlet.11
There are, and continue to be, advances in both LVAD design and function. Since the time period of our study, changes have been made in the outflow bend relief (the tube at the junction of the outflow cannula and the pump housing designed to prevent kinking of the outflow cannula) and the LVAD controller. Older controllers have been replaced with newer models, but many of the LVAD pumps in this article remain in service.
Anticoagulation Therapy
Patients who have a CF LVAD require anticoagulation therapy with warfarin to a target international normalized ratio (INR) of 2 to 3, in addition to aspirin therapy of 325 mg daily.8,9Newer oral anticoagulant drugs are not routinely given to patients who have a CF LVAD.
Cardiopulmonary Evaluation
With CF LVADs, blood is pumped continuously, and a constant, machine-like murmur can be heard on auscultation rather than the typical heart sounds. Patients who have an LVAD may not have palpable arterial pulses. Doppler evaluation of the brachial artery and a manual blood pressure (BP) cuff are used to listen for the start of Korotkoff sounds as the cuff is released. The pressure at which the first sound is heard is used to estimate the patient’s mean arterial pressure (MAP) at the time when there is no pulse; and the systolic BP (SBP) is heard at the time when there is pulse. Patients with a CF LVAD with nonpulsatile flow should have a MAP between 70 mm Hg and 90 mm Hg (HMII), or 70 mm Hg and 80 mm Hg (HVAD). Patients who have a CF LVAD with a palpable pulse should have an SBP less than 120 mm Hg (HMII) or 105 mm Hg (HVAD). Readings outside of these ranges require an adjustment in the patient’s antihypertensive therapy, since high BP increases the risk of stroke and can impair the cardiac support provided by the LVAD.8Low BP may be the result of inadequate pump speed, dehydration, inflow cannula obstruction, or pump thrombus.
Bleeding
In our study, bleeding and volume overload were the two most common reasons LVAD patients presented to the ED. Interestingly, in a systematic review of clinical outcomes following CF LVAD implantation, bleeding was the most commonly recorded adverse event.12In fact, the majority of patients in all of the studies reviewed experienced at least one bleeding event. In one study of 139 HMII LVAD patients, the risk of bleeding was greatest within the first two weeks, and early bleeding was associated with increased mortality.13The most common source of bleeding complications in patients with a CF LVAD are GI, similar to our study.14
In a review and meta-analysis by Draper et al,15of GI bleeding in 1,697 patients with CF LVADs, the pooled prevalence was 23%.Subgroup analysis demonstrated an increased risk of bleeding in older patients and in those who had an elevated serum creatinine level.15 Upper GI bleeding occurred in 48% of patients, lower GI bleeding in 22%, small-bowel bleeding in 15%, and bleeding at an unknown site in 19%. The most common cause of the bleeding was from arteriovenous malformations (AVMs).15 In their review, Draper et al15 found a 9.3% prevalence of recurrent GI bleeding and a pooled event rate for an all-cause mortality rate of 23%.
They also noted that the increased risk of GI bleeding in CF LVAD patients is multifactorial. For example, there was decreased activity of type 2 von Willebrand factor multimers in patients with CF LVADs, leading to an acquired von Willebrand syndrome.15
Another finding seen in this review was that CF devices lead to a low pulse-pressure system, which is thought to cause some degree of intestinal hypoperfusion, potentially leading to vascular dilation and AVM formation.15 Based on findings, a neurovascular etiology involving increased sympathetic tone resulting in smooth muscle relaxation and AVM formation has been proposed. Lastly, the anticoagulation required with the CF LVADs to prevent pump thrombosis also increases the risk of GI bleeding, especially when combined with aspirin or other antiplatelet agents which are routinely prescribed.15
Volume Overload
Interestingly, in our study, volume overload as a cause for ED presentation was the same as for bleeding complications. In the systematic review of clinical outcomes in CF LVAD patients, volume overload or ongoing heart failure occurred in 18% of patients 1 year after device implantation.12
The clinical presentation of patients experiencing volume overload is typically dyspnea and fatigue; on physical examination they will frequently demonstrate evidence of fluid retention, such as dependent edema and pulmonary congestion.16Causes of volume overload in the LVAD patient includes medication noncompliance, inadequate pump speed, device malfunction, right ventricular failure, impaired renal function, and cardiac tamponade.16 These patients will frequently have MAPs greater than 90 mm Hg, and may require treatment with diuretics, calcium channel blockers, beta-blockers, or angiotensin-converting enzyme inhibitors.8
Weakness, Lightheadedness, Dizziness, Syncope
In our study, some combination of weakness, lightheadedness, dizziness, and syncope accounted for the third most common cause of ED presentation (9.6%). In the majority of cases, this was due to dehydration. Usually, these patients will have a MAP less than 60 mm Hg. Unfortunately, patients with pump thrombosis, sepsis, or cannula malposition can also present with a low MAP. It is important to differentiate the cause, as the management is quite different, depending on the etiology. Bedside ultrasound can play an important role in evaluating the volume status and cannula position.8 In addition, emergent consult with the patients ventricular assist device (VAD) treatment team is critical.8 Pump thrombus is a medical emergency and is usually associated with hematuria without red blood cells in the urine, acute kidney injury, and marked elevations in lactate dehydrogenase and serum free hemoglobin.8 If not treated promptly, renal failure and death may result. If dehydration is the cause, gentle rehydration with intravenous normal saline and electrolyte replacement may be all that is required.
Device Malfunction
Device malfunction was the next most common reason for ED presentation in our study, at 8.1%. This category included a number of different events, including battery failure, driveline fracture, and pump thrombosis. According to McIlvennan et al,12 causes of device malfunction include thrombus formation with hemolysis, mechanical failure of the impeller, and driveline lead fractures with electrical failure.Again, the VAD team should be consulted immediately, and the EP should plug the LVAD into a hospital power base, if available, to conserve battery life. If power is interrupted, the pump will stop working. The EP should examine all of the connections from the percutaneous lead to the controller and from the controller to the batteries to ensure they are intact. The exit site for the percutaneous lead should be examined for evidence of trauma or signs of infection. The patient should also be asked about recent trauma to the driveline.
Neurological Events
Interestingly, in other reviews, neurological events, including ischemic stroke, hemorrhagic stroke, and transient ischemic attack occur with higher frequency than was the case in the study, and are relatively common complications that can result in severe morbidity and mortality.12In the Interagency Registry for Mechanically Assisted Circulatory Support report, there was a 3% risk of stroke at 1 month, 5% at 3 months, 7% at 6 months, 11% at 12 months, 17% at 24 months, and 19% at 36 months post-implant.6,12Similarly, the HMII DT Trial demonstrated rates of ischemic and hemorrhagic stroke as high as 8% and 11% respectively, within the first 2 years following LVAD placement.5,6In our study, neurological events accounted for only six (2.4%) of ED visits. It is unclear why our numbers were less than those reported by others.
Cardiac Events and Management
During the study period, one LVAD patient presented to the ED in cardiac arrest. Patients who have an LVAD and are in cardiac arrest have unique considerations that deserve discussion. If the LVAD pump has stopped functioning, connections between the system controller and the pump and power source must be checked, as loose connections need to be refitted and the pump restarted. It is important to note that when an LVAD ceases operation, blood becomes stagnant in the pump and conduits. Delays of even several minutes pose a significant risk for pump thrombosis, stroke, and thromboembolism when the device is restarted. If the pump does not restart and the patient is connected to batteries, the batteries should be replaced with a new, fully charged pair, or the device should be connected to a base unit.17
Due to the location of the outflow graft on the aorta and the inflow conduit in the LV apex, external chest compressions pose a risk of dislodging the device and causing fatal hemorrhage. Clinical judgment should be used when deciding to perform external chest compressions. A recent American Heart Association scientific statement concluded that withholding chest compression in a patient with an LVAD who is truly in circulatory failure that is not attributable to a device failure would cause more harm to the patient than the potential to dislodge the device.18
Direct cardiac massage, performed by a skilled surgeon may be effective in patients that have had recent device implantation, especially if prior to mediastinal healing.16 If external defibrillation/cardioversion is required, the percutaneous lead should not be disconnected from the system controller and the pump should not be stopped prior to the delivery of a shock.17
Study Limitations
This was a retrospective study and has the limitations common to all such studies. It is possible that some of the patients in our study sought care at a hospital ED outside of our system, and therefore were not included in our study. This, however, is exceedingly unlikely as the cardiologists and care team continually emphasized and instructed all patients in our study only to present to the study hospital ED for any complaint. Similarly, the various emergency medical services agencies for our region were also instructed to bring all LVAD patients to the study hospital.
Another limitation of our study is the relatively small total number of patients (98) and that our findings may not apply to other patient populations. This limitation, however, would be true for any hospital system that limits the type of LVAD implant procedure to one manufacturer (HMII in this instance).
Conclusion
Emergency physicians must be prepared to evaluate the LVAD patient presenting to the ED. A little over 55% of the time, the visit will be directly related to the LVAD; in the remainder of cases, patient presentation will be due to a non-LVAD-related cause. At initial presentation, however, the EP should assume that the ED visit is related to the LVAD, until a thorough history and physical examination can exclude otherwise.
Because of the high incidence of GI bleeding in LVAD patients, a rectal examination for blood in the stool should be performed for any complaint that may be related, such as generalized weakness, syncope, or shortness of breath. In the majority of cases, a complete blood count; complete metabolic profile, including lactic acid dehydrogenase; and coagulation studies, including prothrombin time and INRs, are indicated. Most patients with an LVAD will require a member of the VAD team (typically the perfusionist or biomedical engineer) to interrogate the controller if there is any concern about its function, including alarm sounding or lights flashing.
1. Benjamin EJ, Blaha MJ, Chiuve SE, et al; American Heart Association Statistics Committee and Stroke Statistics Subcommittee. Heart disease and stroke statistics-2017 update: a report from the American Heart Association. Circulation. 2017;135(10):e146-e603. doi:10.1161/CIR.0000000000000485. Erratum in: Circulation. 2017;135(1):e646. doi:10.1161/CIR.0000000000000491.
2. Lund LH, Edwards LB, Kucheryavaya AY, et al. The Registry of the International Society for Heart and Lung Transplantation: thirtieth official adult heart transplant report—2013; focus theme: age. J Heart Lung Transplant. 2013;32(10):951-964. doi:10.1016/j.healun.2013.08.006.
3. UNOS (United Network for Organ Sharing) Web site. https://unos.org/data/transplant-trends/waiting-list-candidates-by-organ-type/. Accessed February 8, 2018.
4. Kirklin JK, Pagani FD, Kormos RL, et al. Eighth annual INTERMACS report: Special focus on framing the impact of adverse events. J Heart Lung Transplant. 2017;36(10):1080-1086. doi:10.1016/j.healun.2017.07.005.
5. Slaughter MS, Rogers JG, Milano CA, et al. Advanced heart failure treated with continuous flow left ventricular assist device. N Engl J Med. 2009;361(23):2241-2251. doi:10.1056/NEJMoa0909938.
6. Kirklin JK, Naftel DC, Pagani FD, et al. Seventh INTERMACS annual report: 15,000 patients and counting. J Heart Lung Transplant. 2015;34(12):1495-1504. doi:10.1016/j.healun.2015.10.003.
7. Ambardekar AV, Buttrick PM. Reverse remodeling with left ventricular assist devices: a review of clinical, cellular and molecular effects. Circ Heart Fail. 2011;4(2):224-233. doi:10.1161/CIRCHEARTFAILURE.110.959684.
8. Slaughter MS, Pagani FD, Rogers JG, et al. Clinical management of continuous-flow left ventricular assist devices in advanced heart failure. J Heart Lung Transplant. 2010;29 (suppl 4):1-39. doi:10.1016/j.healun.2010.01.011.
9. Lo BM, Devine AS. Patients with left ventricular assist devices. Critical Decisions in Emergency Medicine. 2014;28(7):2-9.
10. Feldman D, Pamboukian SV, Teuteberg JJ, et al. The 2013 International Society for Heart and Lung Transplantation guidelines for mechanical circulatory support: executive summary. J Heart Lung Transplant. 2013;32(2):157-187. doi:10.1016/j.healun.2012.09.013.
11. Miller LW, Pagani FD, Russell SD, et al. Use of a continuous-flow device in patients awaiting heart transplantation. N Engl J Med. 2007;357(9):885-896. doi:10.1056/NEJMoa067758.
12. McIlvennan CK, Magid KH, Ambardekar AV, et al. Clinical outcomes following continuous-flow left ventricular assist device: a systematic review. Circ Heart Fail. 2014;7(6):1003-1013. doi:10.1161/
13. Mulloy DP, Bhamidipati CM, Stone ML, et al. Cryoablation during left ventricular assist device implantation reduces postoperative ventricular tachyarrhythmias. J Thorac Cardiovasc Surg. 2013;145(5):1207-1213. doi:10.1016/j.jtcvs.2012.03.061.
14. Stern DR, Kazam J, Edwards P, et al. Increased incidence of gastrointestinal bleeding following implantation of the Heartmate II LVAD. J Card Surg. 2010;25(3):352-356. doi:10.1111/j.1540-8191.2010.01025.x.
15. Draper KV, Huang RJ, Gerson LB. GI bleeding in patients with continuous-flow left ventricular assist devices: a systematic review and meta-analysis. Gastrointest Endosc. 2014;80(3):435-446. doi:10.1016/j.gie.2014.03.040.
16. Aissaoui N, Morshuis M, Diebold B, et al. Heart failure while on ventricular assist device support: a true clinical entity? Arch Cardiovasc Dis. 2013:106(1):44-51. doi:10.1016/j.acvd.2012.09.006.
17. Thoratec HeartMate II Left Ventricular Assist System (LVAS) Information and Emergency Assistance Guide. Thoratec Corporation Web site. http://www.thoratec.com/_assets/download-tracker/HM_II_Info_Emergency_Assist_Guide_US_103873B_ENGLISH.pdf. Accessed July 5, 2017.
18. Peberdy MA, Gluck JA, Ornato JP, et al; American Heart Association Emergency Cardiovascular Care Committee; Council on Cardiopulmonary, Critical Care, Perioperative, and Resuscitation; Council on Cardiovascular Diseases in the Young; Council on Cardiovascular Surgery and Anesthesia; Council on Cardiovascular and Stroke Nursing; and Council on Clinical Cardiology. Cardiopulmonary resuscitation in adults and children with mechanical circulatory support a scientific statement from the American Heart Association. Circulation. 2017;135(24):e1115-e1134. doi:10.1161/CIR.0000000000000504.
1. Benjamin EJ, Blaha MJ, Chiuve SE, et al; American Heart Association Statistics Committee and Stroke Statistics Subcommittee. Heart disease and stroke statistics-2017 update: a report from the American Heart Association. Circulation. 2017;135(10):e146-e603. doi:10.1161/CIR.0000000000000485. Erratum in: Circulation. 2017;135(1):e646. doi:10.1161/CIR.0000000000000491.
2. Lund LH, Edwards LB, Kucheryavaya AY, et al. The Registry of the International Society for Heart and Lung Transplantation: thirtieth official adult heart transplant report—2013; focus theme: age. J Heart Lung Transplant. 2013;32(10):951-964. doi:10.1016/j.healun.2013.08.006.
3. UNOS (United Network for Organ Sharing) Web site. https://unos.org/data/transplant-trends/waiting-list-candidates-by-organ-type/. Accessed February 8, 2018.
4. Kirklin JK, Pagani FD, Kormos RL, et al. Eighth annual INTERMACS report: Special focus on framing the impact of adverse events. J Heart Lung Transplant. 2017;36(10):1080-1086. doi:10.1016/j.healun.2017.07.005.
5. Slaughter MS, Rogers JG, Milano CA, et al. Advanced heart failure treated with continuous flow left ventricular assist device. N Engl J Med. 2009;361(23):2241-2251. doi:10.1056/NEJMoa0909938.
6. Kirklin JK, Naftel DC, Pagani FD, et al. Seventh INTERMACS annual report: 15,000 patients and counting. J Heart Lung Transplant. 2015;34(12):1495-1504. doi:10.1016/j.healun.2015.10.003.
7. Ambardekar AV, Buttrick PM. Reverse remodeling with left ventricular assist devices: a review of clinical, cellular and molecular effects. Circ Heart Fail. 2011;4(2):224-233. doi:10.1161/CIRCHEARTFAILURE.110.959684.
8. Slaughter MS, Pagani FD, Rogers JG, et al. Clinical management of continuous-flow left ventricular assist devices in advanced heart failure. J Heart Lung Transplant. 2010;29 (suppl 4):1-39. doi:10.1016/j.healun.2010.01.011.
9. Lo BM, Devine AS. Patients with left ventricular assist devices. Critical Decisions in Emergency Medicine. 2014;28(7):2-9.
10. Feldman D, Pamboukian SV, Teuteberg JJ, et al. The 2013 International Society for Heart and Lung Transplantation guidelines for mechanical circulatory support: executive summary. J Heart Lung Transplant. 2013;32(2):157-187. doi:10.1016/j.healun.2012.09.013.
11. Miller LW, Pagani FD, Russell SD, et al. Use of a continuous-flow device in patients awaiting heart transplantation. N Engl J Med. 2007;357(9):885-896. doi:10.1056/NEJMoa067758.
12. McIlvennan CK, Magid KH, Ambardekar AV, et al. Clinical outcomes following continuous-flow left ventricular assist device: a systematic review. Circ Heart Fail. 2014;7(6):1003-1013. doi:10.1161/
13. Mulloy DP, Bhamidipati CM, Stone ML, et al. Cryoablation during left ventricular assist device implantation reduces postoperative ventricular tachyarrhythmias. J Thorac Cardiovasc Surg. 2013;145(5):1207-1213. doi:10.1016/j.jtcvs.2012.03.061.
14. Stern DR, Kazam J, Edwards P, et al. Increased incidence of gastrointestinal bleeding following implantation of the Heartmate II LVAD. J Card Surg. 2010;25(3):352-356. doi:10.1111/j.1540-8191.2010.01025.x.
15. Draper KV, Huang RJ, Gerson LB. GI bleeding in patients with continuous-flow left ventricular assist devices: a systematic review and meta-analysis. Gastrointest Endosc. 2014;80(3):435-446. doi:10.1016/j.gie.2014.03.040.
16. Aissaoui N, Morshuis M, Diebold B, et al. Heart failure while on ventricular assist device support: a true clinical entity? Arch Cardiovasc Dis. 2013:106(1):44-51. doi:10.1016/j.acvd.2012.09.006.
17. Thoratec HeartMate II Left Ventricular Assist System (LVAS) Information and Emergency Assistance Guide. Thoratec Corporation Web site. http://www.thoratec.com/_assets/download-tracker/HM_II_Info_Emergency_Assist_Guide_US_103873B_ENGLISH.pdf. Accessed July 5, 2017.
18. Peberdy MA, Gluck JA, Ornato JP, et al; American Heart Association Emergency Cardiovascular Care Committee; Council on Cardiopulmonary, Critical Care, Perioperative, and Resuscitation; Council on Cardiovascular Diseases in the Young; Council on Cardiovascular Surgery and Anesthesia; Council on Cardiovascular and Stroke Nursing; and Council on Clinical Cardiology. Cardiopulmonary resuscitation in adults and children with mechanical circulatory support a scientific statement from the American Heart Association. Circulation. 2017;135(24):e1115-e1134. doi:10.1161/CIR.0000000000000504.
Disruptive Physician Behavior: The Importance of Recognition and Intervention and Its Impact on Patient Safety
Dramatic stories of disruptive physician behavior (DPB) appear occasionally in the news, such as the physician who shot and killed a colleague within hospital confines or the gynecologist who secretly took photographs using a camera disguised as a pen during pelvic examinations. More common in hospitals, however, are incidents of inappropriate behavior that may generate complaints from patients or other providers and at times snowball into administrative or legal challenges.
“Professionalism” is one of the six competencies listed by the Accreditation Council for Graduate Medical Education (ACGME)1 and the American Board of Medical Specialties. Unfortunately, incidents of disruptive behavior can result in violation of the tenets of professionalism in the healthcare environment. These behaviors fall along a continuum ranging from outwardly aggressive and uncivil to overly passive and insidious. Although these behaviors can occur across all healthcare disciplines and settings and are not just limited to physicians, the behaviors of physicians often have a much greater impact on the healthcare system as a whole because of their positions of relative “power” within the system.2 Hence, this problem requires greater awareness and education. In this context, the aim of this article is to discuss disruptive behaviors in physicians
The AMA defines DPB as “personal conduct, verbal or physical that has the potential to negatively affect patient care or the ability to work with other members of the healthcare team.”3 The definition of DPB by the Joint Commission includes “all behaviors that undermine a culture of safety.”4 Both the Joint Commission and the AMA recognize the significance and patient safety implications of such behavior. Policy statements by both these organizations underscore the importance of confronting and remedying these potentially dangerous interpersonal behaviors.
Data regarding the prevalence of DPB have been inconsistent. One study estimated that 3%–5% of physicians demonstrate this behavior,5 whereas another study reported a DPB prevalence of 97% among physicians and nurses in the workplace.6 According to a 2004 survey of physician executives, more than 95% of them reported regular encounters of DPB.7
The etiology of such disruptive behaviors is multifactorial and complex. Explanations associated with ‘nature versus nurture’ have ranged from physician psychopathology to unhealthy modeling during training. Both extrinsic and intrinsic factors may also contribute to DPB. External stressors and negative experiences–professional and/or personal–can provoke disruptive behaviors. Overwork, fatigue, strife, and a dysfunctional environment that can arise in both work and home environments can contribute to the development of mental health problems. Stress, burnout, and depression have increasingly become prevalent among physicians and can play a significant role in causing impaired patterns of professional conduct.8, 9 These mental health problems can cause physicians to acquire maladaptive coping strategies such as substance abuse and drug or alcohol dependence. However, it is important to note that physician impairment and substance abuse are not the most frequent causes of DPB. In fact, fewer than 10% of physician behavior issues have been related to substance abuse.2, 5
Psychiatric disorders such as major depression and bipolar and anxiety disorders may also contribute to DPB.10 Most of these disorders (except for schizophrenia) are likely as common among physicians as among the general public.9 An essential clarification is that although DPB can be a manifestation of personality disorders or psychiatric disorders, it does not always stem from underlying psychopathology. Clarifying these distinctions is important for managing the problem and calls for expert professional evaluation in some cases.10
A person’s behavior is shaped by character, values, perceptions, and attitudes. Individuals who engage in DPB typically lack insight and justify their behaviors as a means to achieve a goal. Disrespectful behavior is rooted, in part, in characteristics such as insecurity, immaturity, and aggressiveness; however, it can also be learned, tolerated, and reinforced in the hierarchical hospital culture.11
Other intrinsic factors that may contribute to DPB include lack of emotional intelligence, poor social skills, cultural and ethnic issues, and generation and gender bias.12 Identifying the root causes of DPB can be challenging due to the complexity of the interaction between the healthcare environment and the key players within it; nevertheless, awareness of the contributing factors and early recognition are important. Those who take on the mantle of leadership within hospitals should be educated in this regard.
Repercussions of Disruptive Physician Behavior
An institution’s organizational culture often has an impact on how DPB is addressed. Tolerance of such behavior can have far-reaching consequences. The central tenets of a “culture of safety and respect”–teamwork across disciplines and a blame-free environment in which every member of the healthcare team feels equally empowered to report errors and openly discuss safety issues–would be negatively impacted.
DPB can diminish the quality of care provided, increase the risk of medical errors, and adversely affect patient safety and satisfaction.11-13 Such behavior can cause erosion of relationships and communication between individuals and contribute to a hostile work environment. For instance, nurses or trainees may be afraid to question a physician because of the fear of getting yelled at or being humiliated. Consequently, improperly written orders may be overlooked or a potentially “wrong-site” surgical procedure may not be questioned for fear of provoking a hostile response.
DPB can increase litigation risk and financial costs to institutions. Provider retention may be adversely affected; valued staff may leave hospitals and need to be replaced, and productivity may suffer. When physicians in training observe how their superiors model disruptive behaviors with impunity, a concerning problem that arises is that DPB becomes normalized in the workplace culture, especially if such behaviors are tolerated and result in a perceived gain.
Proposed Interventions

Confrontation of DPB can be challenging without appropriate infrastructure. Healthcare facilities should have a fair system in place for reliable reporting and monitoring of DPB, including a complaints’ verification process, appeals process, and an option for fair hearing.
It is best to initially address the issue in a direct, timely, yet informal manner through counseling or a verbal warning. In several situations, such informal counseling opportunities create a mindful awareness of the problem and the problematic behavior ceases without the need for further action.
When informal intervention is either not appropriate (eg, if the alleged event involved an assault or other illegal behavior) or has already been offered in the past, more formal intervention is required. Institutional progressive disciplinary polices should be in place and adhered to. For example, repeat offenders may be issued written warnings or even temporary suspension of privileges.
Institutional resources such as human resources departments, office of general counsel, office of medical affairs, and the hospital’s medical board may be consulted. Some medical centers have “employee assistance programs” staffed with clinicians skilled in dealing with DPB. Individuals diagnosed with substance abuse or a mental health disorder may require consultation with mental health professionals.14
Special “Professionalism Committees” can be instituted and tasked with investigating complaints and making recommendations for the involvement of resources outside the institution, such as a state medical society.15
Conclusion
Although the vast majority of physicians are well-behaved, it is important to acknowledge that disruptive behaviors can occur in the healthcare environment. Such behaviors have a major impact on workplace culture and patient safety and must be recognized early. Hospital executives and leaders must ensure that appropriate interventions are undertaken—before the quality of patient care is affected and before lives are endangered.
Acknowledgment
The authors would like to thank Ansu John for providing editorial assistance with the manuscript.
Disclosures
The authors have nothing to disclose (Conflict of Interest Form submitted as separate PDF document). Dr. Heitt consults with local hospitals, medical practices, and licensing boards regarding physicians and other healthcare practitioners who have been accused of engaging in disruptive behavior. In these situations he may be paid by the board, medical society, hospital, practice or the professional (patient).
1. Accreditation Council for Graduate Medical Education. Common program requirements: general competencies. https://www.acgme.org/Portals/0/PDFs/Common_Program_Requirements_07012011[2].pdf. Accessed July 25, 2017.
2. Porto G, Lauve R. Disruptive clinician behavior: a persistent threat to patient safety. Patient safety and quality healthcare. Lionheart Publishing, Inc. 2006;3:16-24 https://www.psqh.com/julaug06/disruptive.html. Accessed October 1, 2017.
3. American Medical Association. Opinion E- 9.045–Physicians with disruptive behavior. Chicago, IL American Medical Association 2008.
4. Joint Commission: Behaviors that undermine a culture of safety. Sentinel event alert, July 9, 2008:40. http://www.jointcommission.org/sentinel_event_alert_issue_40_behaviors_that_undermine_a_culture_of_safety/. Accessed October 1, 2017.
5. Leape LL, Fromson JA. Problem doctors: is there a system-level solution? Ann Int Med. 2006;144:107-115. PubMed
6. Rosenstein AH, O’Daniel M. A survey of the impact of disruptive behaviors and communication defects on patient safety. Jt Comm J Qual Patient Saf. 2008;34(8):464-471. PubMed
7. Weber DO. Poll Results: Doctors’ disruptive behavior disturbs physician leaders. The Physician Executive. 2004;30(5):6. PubMed
8. Center C, Davis M, Detre T, et al. Confronting depression and suicide in physicians: a consensus statement. JAMA. 2003;289(23):3161-3166. PubMed
9. Brown S, Goske M, Johnson C. Beyond substance abuse: stress, burnout and depression as causes of physician impairment and disruptive behavior. J Am Coll Radiol. 2009 6;(7):479-485. PubMed
10. Reynolds NT. Disruptive physician behavior: use and misuse of the label. J Med Regulation. 2012;98(1):8-19.
11. Leape LL, Shore MF, Dienstag JL, et al. Perspective: a culture of respect, part 1: the nature and causes of disrespectful behavior by physicians. Acad Med. 2012;87(7):845-852. PubMed
12. Rosenstein AH, O’Daniel M. Impact and implications of disruptive behavior in the perioperative arena. J Am Coll Surg. 2006;203(1):96-105. PubMed
13. Patient Safety Primer: Disruptive and unprofessional behavior. Available at AHRQ Patient Safety Network: https://psnet.ahrq.gov/primers/primer/15/disruptive-and-unprofessional-behavior(Accessed October 1, 2017.
14. Williams BW, Williams MV. The disruptive physician: conceptual organization. JMed Licensure Discipline. 2008;94(3):12-19.
15. Speck R, Foster J, Mulhem V, et al. Development of a professionalism committee approach to address unprofessional medical staff behavior at an academic medical center. Jt Comm J Qual Patient Saf. 2004;40(4):161-167. PubMed
Dramatic stories of disruptive physician behavior (DPB) appear occasionally in the news, such as the physician who shot and killed a colleague within hospital confines or the gynecologist who secretly took photographs using a camera disguised as a pen during pelvic examinations. More common in hospitals, however, are incidents of inappropriate behavior that may generate complaints from patients or other providers and at times snowball into administrative or legal challenges.
“Professionalism” is one of the six competencies listed by the Accreditation Council for Graduate Medical Education (ACGME)1 and the American Board of Medical Specialties. Unfortunately, incidents of disruptive behavior can result in violation of the tenets of professionalism in the healthcare environment. These behaviors fall along a continuum ranging from outwardly aggressive and uncivil to overly passive and insidious. Although these behaviors can occur across all healthcare disciplines and settings and are not just limited to physicians, the behaviors of physicians often have a much greater impact on the healthcare system as a whole because of their positions of relative “power” within the system.2 Hence, this problem requires greater awareness and education. In this context, the aim of this article is to discuss disruptive behaviors in physicians
The AMA defines DPB as “personal conduct, verbal or physical that has the potential to negatively affect patient care or the ability to work with other members of the healthcare team.”3 The definition of DPB by the Joint Commission includes “all behaviors that undermine a culture of safety.”4 Both the Joint Commission and the AMA recognize the significance and patient safety implications of such behavior. Policy statements by both these organizations underscore the importance of confronting and remedying these potentially dangerous interpersonal behaviors.
Data regarding the prevalence of DPB have been inconsistent. One study estimated that 3%–5% of physicians demonstrate this behavior,5 whereas another study reported a DPB prevalence of 97% among physicians and nurses in the workplace.6 According to a 2004 survey of physician executives, more than 95% of them reported regular encounters of DPB.7
The etiology of such disruptive behaviors is multifactorial and complex. Explanations associated with ‘nature versus nurture’ have ranged from physician psychopathology to unhealthy modeling during training. Both extrinsic and intrinsic factors may also contribute to DPB. External stressors and negative experiences–professional and/or personal–can provoke disruptive behaviors. Overwork, fatigue, strife, and a dysfunctional environment that can arise in both work and home environments can contribute to the development of mental health problems. Stress, burnout, and depression have increasingly become prevalent among physicians and can play a significant role in causing impaired patterns of professional conduct.8, 9 These mental health problems can cause physicians to acquire maladaptive coping strategies such as substance abuse and drug or alcohol dependence. However, it is important to note that physician impairment and substance abuse are not the most frequent causes of DPB. In fact, fewer than 10% of physician behavior issues have been related to substance abuse.2, 5
Psychiatric disorders such as major depression and bipolar and anxiety disorders may also contribute to DPB.10 Most of these disorders (except for schizophrenia) are likely as common among physicians as among the general public.9 An essential clarification is that although DPB can be a manifestation of personality disorders or psychiatric disorders, it does not always stem from underlying psychopathology. Clarifying these distinctions is important for managing the problem and calls for expert professional evaluation in some cases.10
A person’s behavior is shaped by character, values, perceptions, and attitudes. Individuals who engage in DPB typically lack insight and justify their behaviors as a means to achieve a goal. Disrespectful behavior is rooted, in part, in characteristics such as insecurity, immaturity, and aggressiveness; however, it can also be learned, tolerated, and reinforced in the hierarchical hospital culture.11
Other intrinsic factors that may contribute to DPB include lack of emotional intelligence, poor social skills, cultural and ethnic issues, and generation and gender bias.12 Identifying the root causes of DPB can be challenging due to the complexity of the interaction between the healthcare environment and the key players within it; nevertheless, awareness of the contributing factors and early recognition are important. Those who take on the mantle of leadership within hospitals should be educated in this regard.
Repercussions of Disruptive Physician Behavior
An institution’s organizational culture often has an impact on how DPB is addressed. Tolerance of such behavior can have far-reaching consequences. The central tenets of a “culture of safety and respect”–teamwork across disciplines and a blame-free environment in which every member of the healthcare team feels equally empowered to report errors and openly discuss safety issues–would be negatively impacted.
DPB can diminish the quality of care provided, increase the risk of medical errors, and adversely affect patient safety and satisfaction.11-13 Such behavior can cause erosion of relationships and communication between individuals and contribute to a hostile work environment. For instance, nurses or trainees may be afraid to question a physician because of the fear of getting yelled at or being humiliated. Consequently, improperly written orders may be overlooked or a potentially “wrong-site” surgical procedure may not be questioned for fear of provoking a hostile response.
DPB can increase litigation risk and financial costs to institutions. Provider retention may be adversely affected; valued staff may leave hospitals and need to be replaced, and productivity may suffer. When physicians in training observe how their superiors model disruptive behaviors with impunity, a concerning problem that arises is that DPB becomes normalized in the workplace culture, especially if such behaviors are tolerated and result in a perceived gain.
Proposed Interventions
Confrontation of DPB can be challenging without appropriate infrastructure. Healthcare facilities should have a fair system in place for reliable reporting and monitoring of DPB, including a complaints’ verification process, appeals process, and an option for fair hearing.
It is best to initially address the issue in a direct, timely, yet informal manner through counseling or a verbal warning. In several situations, such informal counseling opportunities create a mindful awareness of the problem and the problematic behavior ceases without the need for further action.
When informal intervention is either not appropriate (eg, if the alleged event involved an assault or other illegal behavior) or has already been offered in the past, more formal intervention is required. Institutional progressive disciplinary polices should be in place and adhered to. For example, repeat offenders may be issued written warnings or even temporary suspension of privileges.
Institutional resources such as human resources departments, office of general counsel, office of medical affairs, and the hospital’s medical board may be consulted. Some medical centers have “employee assistance programs” staffed with clinicians skilled in dealing with DPB. Individuals diagnosed with substance abuse or a mental health disorder may require consultation with mental health professionals.14
Special “Professionalism Committees” can be instituted and tasked with investigating complaints and making recommendations for the involvement of resources outside the institution, such as a state medical society.15
Conclusion
Although the vast majority of physicians are well-behaved, it is important to acknowledge that disruptive behaviors can occur in the healthcare environment. Such behaviors have a major impact on workplace culture and patient safety and must be recognized early. Hospital executives and leaders must ensure that appropriate interventions are undertaken—before the quality of patient care is affected and before lives are endangered.
Acknowledgment
The authors would like to thank Ansu John for providing editorial assistance with the manuscript.
Disclosures
The authors have nothing to disclose (Conflict of Interest Form submitted as separate PDF document). Dr. Heitt consults with local hospitals, medical practices, and licensing boards regarding physicians and other healthcare practitioners who have been accused of engaging in disruptive behavior. In these situations he may be paid by the board, medical society, hospital, practice or the professional (patient).
Dramatic stories of disruptive physician behavior (DPB) appear occasionally in the news, such as the physician who shot and killed a colleague within hospital confines or the gynecologist who secretly took photographs using a camera disguised as a pen during pelvic examinations. More common in hospitals, however, are incidents of inappropriate behavior that may generate complaints from patients or other providers and at times snowball into administrative or legal challenges.
“Professionalism” is one of the six competencies listed by the Accreditation Council for Graduate Medical Education (ACGME)1 and the American Board of Medical Specialties. Unfortunately, incidents of disruptive behavior can result in violation of the tenets of professionalism in the healthcare environment. These behaviors fall along a continuum ranging from outwardly aggressive and uncivil to overly passive and insidious. Although these behaviors can occur across all healthcare disciplines and settings and are not just limited to physicians, the behaviors of physicians often have a much greater impact on the healthcare system as a whole because of their positions of relative “power” within the system.2 Hence, this problem requires greater awareness and education. In this context, the aim of this article is to discuss disruptive behaviors in physicians
The AMA defines DPB as “personal conduct, verbal or physical that has the potential to negatively affect patient care or the ability to work with other members of the healthcare team.”3 The definition of DPB by the Joint Commission includes “all behaviors that undermine a culture of safety.”4 Both the Joint Commission and the AMA recognize the significance and patient safety implications of such behavior. Policy statements by both these organizations underscore the importance of confronting and remedying these potentially dangerous interpersonal behaviors.
Data regarding the prevalence of DPB have been inconsistent. One study estimated that 3%–5% of physicians demonstrate this behavior,5 whereas another study reported a DPB prevalence of 97% among physicians and nurses in the workplace.6 According to a 2004 survey of physician executives, more than 95% of them reported regular encounters of DPB.7
The etiology of such disruptive behaviors is multifactorial and complex. Explanations associated with ‘nature versus nurture’ have ranged from physician psychopathology to unhealthy modeling during training. Both extrinsic and intrinsic factors may also contribute to DPB. External stressors and negative experiences–professional and/or personal–can provoke disruptive behaviors. Overwork, fatigue, strife, and a dysfunctional environment that can arise in both work and home environments can contribute to the development of mental health problems. Stress, burnout, and depression have increasingly become prevalent among physicians and can play a significant role in causing impaired patterns of professional conduct.8, 9 These mental health problems can cause physicians to acquire maladaptive coping strategies such as substance abuse and drug or alcohol dependence. However, it is important to note that physician impairment and substance abuse are not the most frequent causes of DPB. In fact, fewer than 10% of physician behavior issues have been related to substance abuse.2, 5
Psychiatric disorders such as major depression and bipolar and anxiety disorders may also contribute to DPB.10 Most of these disorders (except for schizophrenia) are likely as common among physicians as among the general public.9 An essential clarification is that although DPB can be a manifestation of personality disorders or psychiatric disorders, it does not always stem from underlying psychopathology. Clarifying these distinctions is important for managing the problem and calls for expert professional evaluation in some cases.10
A person’s behavior is shaped by character, values, perceptions, and attitudes. Individuals who engage in DPB typically lack insight and justify their behaviors as a means to achieve a goal. Disrespectful behavior is rooted, in part, in characteristics such as insecurity, immaturity, and aggressiveness; however, it can also be learned, tolerated, and reinforced in the hierarchical hospital culture.11
Other intrinsic factors that may contribute to DPB include lack of emotional intelligence, poor social skills, cultural and ethnic issues, and generation and gender bias.12 Identifying the root causes of DPB can be challenging due to the complexity of the interaction between the healthcare environment and the key players within it; nevertheless, awareness of the contributing factors and early recognition are important. Those who take on the mantle of leadership within hospitals should be educated in this regard.
Repercussions of Disruptive Physician Behavior
An institution’s organizational culture often has an impact on how DPB is addressed. Tolerance of such behavior can have far-reaching consequences. The central tenets of a “culture of safety and respect”–teamwork across disciplines and a blame-free environment in which every member of the healthcare team feels equally empowered to report errors and openly discuss safety issues–would be negatively impacted.
DPB can diminish the quality of care provided, increase the risk of medical errors, and adversely affect patient safety and satisfaction.11-13 Such behavior can cause erosion of relationships and communication between individuals and contribute to a hostile work environment. For instance, nurses or trainees may be afraid to question a physician because of the fear of getting yelled at or being humiliated. Consequently, improperly written orders may be overlooked or a potentially “wrong-site” surgical procedure may not be questioned for fear of provoking a hostile response.
DPB can increase litigation risk and financial costs to institutions. Provider retention may be adversely affected; valued staff may leave hospitals and need to be replaced, and productivity may suffer. When physicians in training observe how their superiors model disruptive behaviors with impunity, a concerning problem that arises is that DPB becomes normalized in the workplace culture, especially if such behaviors are tolerated and result in a perceived gain.
Proposed Interventions
Confrontation of DPB can be challenging without appropriate infrastructure. Healthcare facilities should have a fair system in place for reliable reporting and monitoring of DPB, including a complaints’ verification process, appeals process, and an option for fair hearing.
It is best to initially address the issue in a direct, timely, yet informal manner through counseling or a verbal warning. In several situations, such informal counseling opportunities create a mindful awareness of the problem and the problematic behavior ceases without the need for further action.
When informal intervention is either not appropriate (eg, if the alleged event involved an assault or other illegal behavior) or has already been offered in the past, more formal intervention is required. Institutional progressive disciplinary polices should be in place and adhered to. For example, repeat offenders may be issued written warnings or even temporary suspension of privileges.
Institutional resources such as human resources departments, office of general counsel, office of medical affairs, and the hospital’s medical board may be consulted. Some medical centers have “employee assistance programs” staffed with clinicians skilled in dealing with DPB. Individuals diagnosed with substance abuse or a mental health disorder may require consultation with mental health professionals.14
Special “Professionalism Committees” can be instituted and tasked with investigating complaints and making recommendations for the involvement of resources outside the institution, such as a state medical society.15
Conclusion
Although the vast majority of physicians are well-behaved, it is important to acknowledge that disruptive behaviors can occur in the healthcare environment. Such behaviors have a major impact on workplace culture and patient safety and must be recognized early. Hospital executives and leaders must ensure that appropriate interventions are undertaken—before the quality of patient care is affected and before lives are endangered.
Acknowledgment
The authors would like to thank Ansu John for providing editorial assistance with the manuscript.
Disclosures
The authors have nothing to disclose (Conflict of Interest Form submitted as separate PDF document). Dr. Heitt consults with local hospitals, medical practices, and licensing boards regarding physicians and other healthcare practitioners who have been accused of engaging in disruptive behavior. In these situations he may be paid by the board, medical society, hospital, practice or the professional (patient).
1. Accreditation Council for Graduate Medical Education. Common program requirements: general competencies. https://www.acgme.org/Portals/0/PDFs/Common_Program_Requirements_07012011[2].pdf. Accessed July 25, 2017.
2. Porto G, Lauve R. Disruptive clinician behavior: a persistent threat to patient safety. Patient safety and quality healthcare. Lionheart Publishing, Inc. 2006;3:16-24 https://www.psqh.com/julaug06/disruptive.html. Accessed October 1, 2017.
3. American Medical Association. Opinion E- 9.045–Physicians with disruptive behavior. Chicago, IL American Medical Association 2008.
4. Joint Commission: Behaviors that undermine a culture of safety. Sentinel event alert, July 9, 2008:40. http://www.jointcommission.org/sentinel_event_alert_issue_40_behaviors_that_undermine_a_culture_of_safety/. Accessed October 1, 2017.
5. Leape LL, Fromson JA. Problem doctors: is there a system-level solution? Ann Int Med. 2006;144:107-115. PubMed
6. Rosenstein AH, O’Daniel M. A survey of the impact of disruptive behaviors and communication defects on patient safety. Jt Comm J Qual Patient Saf. 2008;34(8):464-471. PubMed
7. Weber DO. Poll Results: Doctors’ disruptive behavior disturbs physician leaders. The Physician Executive. 2004;30(5):6. PubMed
8. Center C, Davis M, Detre T, et al. Confronting depression and suicide in physicians: a consensus statement. JAMA. 2003;289(23):3161-3166. PubMed
9. Brown S, Goske M, Johnson C. Beyond substance abuse: stress, burnout and depression as causes of physician impairment and disruptive behavior. J Am Coll Radiol. 2009 6;(7):479-485. PubMed
10. Reynolds NT. Disruptive physician behavior: use and misuse of the label. J Med Regulation. 2012;98(1):8-19.
11. Leape LL, Shore MF, Dienstag JL, et al. Perspective: a culture of respect, part 1: the nature and causes of disrespectful behavior by physicians. Acad Med. 2012;87(7):845-852. PubMed
12. Rosenstein AH, O’Daniel M. Impact and implications of disruptive behavior in the perioperative arena. J Am Coll Surg. 2006;203(1):96-105. PubMed
13. Patient Safety Primer: Disruptive and unprofessional behavior. Available at AHRQ Patient Safety Network: https://psnet.ahrq.gov/primers/primer/15/disruptive-and-unprofessional-behavior(Accessed October 1, 2017.
14. Williams BW, Williams MV. The disruptive physician: conceptual organization. JMed Licensure Discipline. 2008;94(3):12-19.
15. Speck R, Foster J, Mulhem V, et al. Development of a professionalism committee approach to address unprofessional medical staff behavior at an academic medical center. Jt Comm J Qual Patient Saf. 2004;40(4):161-167. PubMed
1. Accreditation Council for Graduate Medical Education. Common program requirements: general competencies. https://www.acgme.org/Portals/0/PDFs/Common_Program_Requirements_07012011[2].pdf. Accessed July 25, 2017.
2. Porto G, Lauve R. Disruptive clinician behavior: a persistent threat to patient safety. Patient safety and quality healthcare. Lionheart Publishing, Inc. 2006;3:16-24 https://www.psqh.com/julaug06/disruptive.html. Accessed October 1, 2017.
3. American Medical Association. Opinion E- 9.045–Physicians with disruptive behavior. Chicago, IL American Medical Association 2008.
4. Joint Commission: Behaviors that undermine a culture of safety. Sentinel event alert, July 9, 2008:40. http://www.jointcommission.org/sentinel_event_alert_issue_40_behaviors_that_undermine_a_culture_of_safety/. Accessed October 1, 2017.
5. Leape LL, Fromson JA. Problem doctors: is there a system-level solution? Ann Int Med. 2006;144:107-115. PubMed
6. Rosenstein AH, O’Daniel M. A survey of the impact of disruptive behaviors and communication defects on patient safety. Jt Comm J Qual Patient Saf. 2008;34(8):464-471. PubMed
7. Weber DO. Poll Results: Doctors’ disruptive behavior disturbs physician leaders. The Physician Executive. 2004;30(5):6. PubMed
8. Center C, Davis M, Detre T, et al. Confronting depression and suicide in physicians: a consensus statement. JAMA. 2003;289(23):3161-3166. PubMed
9. Brown S, Goske M, Johnson C. Beyond substance abuse: stress, burnout and depression as causes of physician impairment and disruptive behavior. J Am Coll Radiol. 2009 6;(7):479-485. PubMed
10. Reynolds NT. Disruptive physician behavior: use and misuse of the label. J Med Regulation. 2012;98(1):8-19.
11. Leape LL, Shore MF, Dienstag JL, et al. Perspective: a culture of respect, part 1: the nature and causes of disrespectful behavior by physicians. Acad Med. 2012;87(7):845-852. PubMed
12. Rosenstein AH, O’Daniel M. Impact and implications of disruptive behavior in the perioperative arena. J Am Coll Surg. 2006;203(1):96-105. PubMed
13. Patient Safety Primer: Disruptive and unprofessional behavior. Available at AHRQ Patient Safety Network: https://psnet.ahrq.gov/primers/primer/15/disruptive-and-unprofessional-behavior(Accessed October 1, 2017.
14. Williams BW, Williams MV. The disruptive physician: conceptual organization. JMed Licensure Discipline. 2008;94(3):12-19.
15. Speck R, Foster J, Mulhem V, et al. Development of a professionalism committee approach to address unprofessional medical staff behavior at an academic medical center. Jt Comm J Qual Patient Saf. 2004;40(4):161-167. PubMed
© 2018 Society of Hospital Medicine
Denah Joseph: “In the Hospital”
We recently spoke with Denah Joseph, a clinical chaplain who works with the Palliative Care team to provide spiritual services to patients with serious illness. In addition, Denah leads efforts to address burnout among healthcare providers.
Denah, tell us about yourself.
My first career was actually in clinical psychology, but I’ve been a Palliative Care chaplain for 15 years. I also teach skill-building for providers around burnout and resilience.
What brought you to Palliative Care?
I’ve lost three sisters and a partner to breast cancer, and my dad died when I was quite young, so I’ve had a lot of exposure to loss. The other big thread in my life has been my spiritual practice. My father was an Orthodox Jew, but exceptionally ecumenical for his time. His first wife was Irish Catholic, and my father used to go to church, sit, kneel, and say the rosary, and light candles for his Catholic friends. Three hundred nuns from the local diocese all came to my dad’s funeral. It was really remarkable.
I’ve been a practicing Buddhist since I was 19. When I went back to school to become a chaplain I wanted to bring more of my spiritual interest into counseling work, so chaplaincy seemed like a really interesting way to do that.
Tell us more about what a chaplain actually does.
As a field, healthcare chaplaincy is relatively new. The old model was if a person was religious, somebody would arrange for a rabbi or an imam or a priest to come into the hospital and take care of the pastoral needs of that patient. In the last 10 to 15 years, the consensus guidelines for quality patient care now include addressing the spiritual dimension of patients’ lives. Instead of relying on volunteers from the community with no quality assurance, it’s required that any hospital over 200 beds have spiritual care available. In order to be a board-certified chaplain, you need to be endorsed by a faith community, and have an advanced degree in either Pastoral Counseling or Theology.
Everybody has spiritual needs even if they don’t use that word “spiritual.” We define it in terms of meaning, relationships, impact on one’s life, hope, fears, reconciliation issues, legacy issues, etc. Approximately 80% of patients want their physicians to understand a little bit about their spiritual/existential/emotional world, and only 20% of doctors ask—so there’s a really big gap. This can be a 5-minute conversation about who are you, what’s important to you, what’s the biggest struggle with your illness that is not medically oriented.
Can you share a patient encounter where you learned something?
Recently I cared for a patient whose wish was to survive to see his only son graduate from college. His wife and son both were like, “You’ve got to hang in there, Dad. You’ve got to hang in there.” He had very advanced pancreatic cancer, and the chances of him making it to graduation were exceedingly small, but nobody was dealing with this.
During the hospitalization, I went to the patient and his wife and I said, “We’re all hoping that you’re going to make it until the graduation but in the event you don’t, would you like to write a letter to your son?” In the Jewish tradition, it is called an ethical will. It’s the idea of legacy work. Just like you would make a will for your material possessions, an ethical will expresses what you value, what you hope for and dream for your beloved. He wanted to do it. His wife said, “Absolutely not, that’s like believing you’re not going to make it.” He was a very gentle guy. He would generally completely defer to his wife, but this time he said, “No, I want to do this.”
So I met with the patient and asked questions like, “What are the things you would hope to be remembered for? What are you most proud of that you want your son to know? What would you want your son to know if he became a father?”
I had him just talk, while I took notes. Later on, I wrote it up on official stationery and gave it to the patient.
What was his reaction when you gave the letter to him?
He started to cry. He said it was perfect. I usually read it to them so they can make edits if they want to. It sort of brings the grief forward when you imagine talking to a beloved that you’re leaving behind.
A few days later the patient died in the hospital surrounded by family members.
His wife, who had advocated so strongly against the letter, hugged me. She said, “That letter is the most important thing that happened here in the hospital.” I was shocked she said that, I had no idea he even shared it with her.
If people have the opportunity to share what’s important to them, particularly generationally, it could address a very deep need to be remembered.
Reflecting on it, I actually see myself as a healer and all my work is in healing, whether it’s working with physicians or working with patients or working with students or working with people in my private practice. It’s a theme that runs through everything. It’s not a word we hear often enough in medicine.
Why not?
The culture of medicine has lost its roots, in that sense. I hear a lot of people say, “There’s nothing we can do medically, so we’re just supporting them through this.” Supporting people through the experience is often seen as less valuable, but I think, particularly for serious, terminal illness, supporting people is not optional.
Switching gears a bit, tell us about the skill-building and resilience work you’ve done.
I think if you don’t proactively care for the rest of your life then your work life takes over. Although it’s pronounced in medicine, it’s in all fields. The pace and stress of our contemporary culture can be contrary to well-being in general.
When I first came to UCSF, I saw a culture of silence around stress, anxiety, and burnout. I started reading about burnout and the numbers of people who qualified to be burnt out at any given time, which may be at least 50% and trending upward. It just seemed to me that in any other profession if half the workforce was impaired, somebody would be doing something. I’ve really become passionate about this in the last couple of years.
So I developed a burnout prevention and resilience skills training class for providers. We work on mindfulness, social connection and support, positive psychology emotions like gratitude, appreciation, self-compassion, and humor, and delve into the sources of meaning in our work.
Based on your work, what would you say are the key stressors in medicine, generally?
Well there’s research on the electronic medical record and the increasing focus on metrics and “value-driven medicine,” which can lead to reduced connection with patients. I hope that what I’m doing makes some difference, but fundamentally, I believe there needs to be a real commitment on the part of the health system, to understand and make the changes that need to happen.
What is the fundamental problem? How do you define that?
Well I don’t think anybody knows. I think that’s what we’re saying. How can it be that so many people aren’t happy in such privileged work? It’s not clinical. It’s the system. It’s yet another flow sheet that you have to fill out; the actual amount of time spent with patients is low. No wonder we get burned out. We’re just doing orders all the time and answering phone calls.
It’s the loss of interconnectedness.
Yes, it’s the loss of connection. That goes back to even why chaplains may not be recognized as adding value. You can’t put a metric on connection. You can’t say, “I made 5 connections.”
Anything else you would like to share?
I don’t know how you feel about it, but I feel so grateful to have the opportunity to be in people’s lives in the intimate way we get to be and I, especially, get to be in a way sometimes even more than doctors. You get to be there, and you may even want to talk about the things that we were mentioning, but they’re asking you about their creatinine and their platelets and their urinary incontinence, so that’s what you’re having to talk about. I don’t have to do that, so I feel like I get the best seat in the house that way.
I think the seriously ill have so much to share and often are wise, particularly the young ones, from having dealt with illness. I’m really interested in that idea of wisdom and how you develop wisdom. Traditionally wisdom is associated with being an elder and having lived a long time and having a lot of experience. I think our work gives us that opportunity. We don’t have to necessarily live through everything to develop that kind of wisdom, but just to be with people who are living through these things.
So here I am, almost 70. I’m working harder than I’ve ever worked in my life. My partner is retired. She’s like, “Come on, let’s play.” She rides bikes, takes the dog out, cooks, reads. But I just can’t stop. I think it’s because I feel like, what else would I want to be doing with my time? I think that’s an amazing thing to be given that gift that I learn from my patients all the time and learn about what’s important. Obviously people are different, but it all boils down to relationships in the end.
That’s the promise of medicine, and I think that’s the great sadness of what’s going on with the epidemic of burnout. People lose connection to that.
There is some element to being present in these hard and difficult times that can bring perspective to life; and to know the sadness, in some ways
…is to know the joy.
Thank you, Denah, for sharing your thoughts with us.
We recently spoke with Denah Joseph, a clinical chaplain who works with the Palliative Care team to provide spiritual services to patients with serious illness. In addition, Denah leads efforts to address burnout among healthcare providers.
Denah, tell us about yourself.
My first career was actually in clinical psychology, but I’ve been a Palliative Care chaplain for 15 years. I also teach skill-building for providers around burnout and resilience.
What brought you to Palliative Care?
I’ve lost three sisters and a partner to breast cancer, and my dad died when I was quite young, so I’ve had a lot of exposure to loss. The other big thread in my life has been my spiritual practice. My father was an Orthodox Jew, but exceptionally ecumenical for his time. His first wife was Irish Catholic, and my father used to go to church, sit, kneel, and say the rosary, and light candles for his Catholic friends. Three hundred nuns from the local diocese all came to my dad’s funeral. It was really remarkable.
I’ve been a practicing Buddhist since I was 19. When I went back to school to become a chaplain I wanted to bring more of my spiritual interest into counseling work, so chaplaincy seemed like a really interesting way to do that.
Tell us more about what a chaplain actually does.
As a field, healthcare chaplaincy is relatively new. The old model was if a person was religious, somebody would arrange for a rabbi or an imam or a priest to come into the hospital and take care of the pastoral needs of that patient. In the last 10 to 15 years, the consensus guidelines for quality patient care now include addressing the spiritual dimension of patients’ lives. Instead of relying on volunteers from the community with no quality assurance, it’s required that any hospital over 200 beds have spiritual care available. In order to be a board-certified chaplain, you need to be endorsed by a faith community, and have an advanced degree in either Pastoral Counseling or Theology.
Everybody has spiritual needs even if they don’t use that word “spiritual.” We define it in terms of meaning, relationships, impact on one’s life, hope, fears, reconciliation issues, legacy issues, etc. Approximately 80% of patients want their physicians to understand a little bit about their spiritual/existential/emotional world, and only 20% of doctors ask—so there’s a really big gap. This can be a 5-minute conversation about who are you, what’s important to you, what’s the biggest struggle with your illness that is not medically oriented.
Can you share a patient encounter where you learned something?
Recently I cared for a patient whose wish was to survive to see his only son graduate from college. His wife and son both were like, “You’ve got to hang in there, Dad. You’ve got to hang in there.” He had very advanced pancreatic cancer, and the chances of him making it to graduation were exceedingly small, but nobody was dealing with this.
During the hospitalization, I went to the patient and his wife and I said, “We’re all hoping that you’re going to make it until the graduation but in the event you don’t, would you like to write a letter to your son?” In the Jewish tradition, it is called an ethical will. It’s the idea of legacy work. Just like you would make a will for your material possessions, an ethical will expresses what you value, what you hope for and dream for your beloved. He wanted to do it. His wife said, “Absolutely not, that’s like believing you’re not going to make it.” He was a very gentle guy. He would generally completely defer to his wife, but this time he said, “No, I want to do this.”
So I met with the patient and asked questions like, “What are the things you would hope to be remembered for? What are you most proud of that you want your son to know? What would you want your son to know if he became a father?”
I had him just talk, while I took notes. Later on, I wrote it up on official stationery and gave it to the patient.
What was his reaction when you gave the letter to him?
He started to cry. He said it was perfect. I usually read it to them so they can make edits if they want to. It sort of brings the grief forward when you imagine talking to a beloved that you’re leaving behind.
A few days later the patient died in the hospital surrounded by family members.
His wife, who had advocated so strongly against the letter, hugged me. She said, “That letter is the most important thing that happened here in the hospital.” I was shocked she said that, I had no idea he even shared it with her.
If people have the opportunity to share what’s important to them, particularly generationally, it could address a very deep need to be remembered.
Reflecting on it, I actually see myself as a healer and all my work is in healing, whether it’s working with physicians or working with patients or working with students or working with people in my private practice. It’s a theme that runs through everything. It’s not a word we hear often enough in medicine.
Why not?
The culture of medicine has lost its roots, in that sense. I hear a lot of people say, “There’s nothing we can do medically, so we’re just supporting them through this.” Supporting people through the experience is often seen as less valuable, but I think, particularly for serious, terminal illness, supporting people is not optional.
Switching gears a bit, tell us about the skill-building and resilience work you’ve done.
I think if you don’t proactively care for the rest of your life then your work life takes over. Although it’s pronounced in medicine, it’s in all fields. The pace and stress of our contemporary culture can be contrary to well-being in general.
When I first came to UCSF, I saw a culture of silence around stress, anxiety, and burnout. I started reading about burnout and the numbers of people who qualified to be burnt out at any given time, which may be at least 50% and trending upward. It just seemed to me that in any other profession if half the workforce was impaired, somebody would be doing something. I’ve really become passionate about this in the last couple of years.
So I developed a burnout prevention and resilience skills training class for providers. We work on mindfulness, social connection and support, positive psychology emotions like gratitude, appreciation, self-compassion, and humor, and delve into the sources of meaning in our work.
Based on your work, what would you say are the key stressors in medicine, generally?
Well there’s research on the electronic medical record and the increasing focus on metrics and “value-driven medicine,” which can lead to reduced connection with patients. I hope that what I’m doing makes some difference, but fundamentally, I believe there needs to be a real commitment on the part of the health system, to understand and make the changes that need to happen.
What is the fundamental problem? How do you define that?
Well I don’t think anybody knows. I think that’s what we’re saying. How can it be that so many people aren’t happy in such privileged work? It’s not clinical. It’s the system. It’s yet another flow sheet that you have to fill out; the actual amount of time spent with patients is low. No wonder we get burned out. We’re just doing orders all the time and answering phone calls.
It’s the loss of interconnectedness.
Yes, it’s the loss of connection. That goes back to even why chaplains may not be recognized as adding value. You can’t put a metric on connection. You can’t say, “I made 5 connections.”
Anything else you would like to share?
I don’t know how you feel about it, but I feel so grateful to have the opportunity to be in people’s lives in the intimate way we get to be and I, especially, get to be in a way sometimes even more than doctors. You get to be there, and you may even want to talk about the things that we were mentioning, but they’re asking you about their creatinine and their platelets and their urinary incontinence, so that’s what you’re having to talk about. I don’t have to do that, so I feel like I get the best seat in the house that way.
I think the seriously ill have so much to share and often are wise, particularly the young ones, from having dealt with illness. I’m really interested in that idea of wisdom and how you develop wisdom. Traditionally wisdom is associated with being an elder and having lived a long time and having a lot of experience. I think our work gives us that opportunity. We don’t have to necessarily live through everything to develop that kind of wisdom, but just to be with people who are living through these things.
So here I am, almost 70. I’m working harder than I’ve ever worked in my life. My partner is retired. She’s like, “Come on, let’s play.” She rides bikes, takes the dog out, cooks, reads. But I just can’t stop. I think it’s because I feel like, what else would I want to be doing with my time? I think that’s an amazing thing to be given that gift that I learn from my patients all the time and learn about what’s important. Obviously people are different, but it all boils down to relationships in the end.
That’s the promise of medicine, and I think that’s the great sadness of what’s going on with the epidemic of burnout. People lose connection to that.
There is some element to being present in these hard and difficult times that can bring perspective to life; and to know the sadness, in some ways
…is to know the joy.
Thank you, Denah, for sharing your thoughts with us.
We recently spoke with Denah Joseph, a clinical chaplain who works with the Palliative Care team to provide spiritual services to patients with serious illness. In addition, Denah leads efforts to address burnout among healthcare providers.
Denah, tell us about yourself.
My first career was actually in clinical psychology, but I’ve been a Palliative Care chaplain for 15 years. I also teach skill-building for providers around burnout and resilience.
What brought you to Palliative Care?
I’ve lost three sisters and a partner to breast cancer, and my dad died when I was quite young, so I’ve had a lot of exposure to loss. The other big thread in my life has been my spiritual practice. My father was an Orthodox Jew, but exceptionally ecumenical for his time. His first wife was Irish Catholic, and my father used to go to church, sit, kneel, and say the rosary, and light candles for his Catholic friends. Three hundred nuns from the local diocese all came to my dad’s funeral. It was really remarkable.
I’ve been a practicing Buddhist since I was 19. When I went back to school to become a chaplain I wanted to bring more of my spiritual interest into counseling work, so chaplaincy seemed like a really interesting way to do that.
Tell us more about what a chaplain actually does.
As a field, healthcare chaplaincy is relatively new. The old model was if a person was religious, somebody would arrange for a rabbi or an imam or a priest to come into the hospital and take care of the pastoral needs of that patient. In the last 10 to 15 years, the consensus guidelines for quality patient care now include addressing the spiritual dimension of patients’ lives. Instead of relying on volunteers from the community with no quality assurance, it’s required that any hospital over 200 beds have spiritual care available. In order to be a board-certified chaplain, you need to be endorsed by a faith community, and have an advanced degree in either Pastoral Counseling or Theology.
Everybody has spiritual needs even if they don’t use that word “spiritual.” We define it in terms of meaning, relationships, impact on one’s life, hope, fears, reconciliation issues, legacy issues, etc. Approximately 80% of patients want their physicians to understand a little bit about their spiritual/existential/emotional world, and only 20% of doctors ask—so there’s a really big gap. This can be a 5-minute conversation about who are you, what’s important to you, what’s the biggest struggle with your illness that is not medically oriented.
Can you share a patient encounter where you learned something?
Recently I cared for a patient whose wish was to survive to see his only son graduate from college. His wife and son both were like, “You’ve got to hang in there, Dad. You’ve got to hang in there.” He had very advanced pancreatic cancer, and the chances of him making it to graduation were exceedingly small, but nobody was dealing with this.
During the hospitalization, I went to the patient and his wife and I said, “We’re all hoping that you’re going to make it until the graduation but in the event you don’t, would you like to write a letter to your son?” In the Jewish tradition, it is called an ethical will. It’s the idea of legacy work. Just like you would make a will for your material possessions, an ethical will expresses what you value, what you hope for and dream for your beloved. He wanted to do it. His wife said, “Absolutely not, that’s like believing you’re not going to make it.” He was a very gentle guy. He would generally completely defer to his wife, but this time he said, “No, I want to do this.”
So I met with the patient and asked questions like, “What are the things you would hope to be remembered for? What are you most proud of that you want your son to know? What would you want your son to know if he became a father?”
I had him just talk, while I took notes. Later on, I wrote it up on official stationery and gave it to the patient.
What was his reaction when you gave the letter to him?
He started to cry. He said it was perfect. I usually read it to them so they can make edits if they want to. It sort of brings the grief forward when you imagine talking to a beloved that you’re leaving behind.
A few days later the patient died in the hospital surrounded by family members.
His wife, who had advocated so strongly against the letter, hugged me. She said, “That letter is the most important thing that happened here in the hospital.” I was shocked she said that, I had no idea he even shared it with her.
If people have the opportunity to share what’s important to them, particularly generationally, it could address a very deep need to be remembered.
Reflecting on it, I actually see myself as a healer and all my work is in healing, whether it’s working with physicians or working with patients or working with students or working with people in my private practice. It’s a theme that runs through everything. It’s not a word we hear often enough in medicine.
Why not?
The culture of medicine has lost its roots, in that sense. I hear a lot of people say, “There’s nothing we can do medically, so we’re just supporting them through this.” Supporting people through the experience is often seen as less valuable, but I think, particularly for serious, terminal illness, supporting people is not optional.
Switching gears a bit, tell us about the skill-building and resilience work you’ve done.
I think if you don’t proactively care for the rest of your life then your work life takes over. Although it’s pronounced in medicine, it’s in all fields. The pace and stress of our contemporary culture can be contrary to well-being in general.
When I first came to UCSF, I saw a culture of silence around stress, anxiety, and burnout. I started reading about burnout and the numbers of people who qualified to be burnt out at any given time, which may be at least 50% and trending upward. It just seemed to me that in any other profession if half the workforce was impaired, somebody would be doing something. I’ve really become passionate about this in the last couple of years.
So I developed a burnout prevention and resilience skills training class for providers. We work on mindfulness, social connection and support, positive psychology emotions like gratitude, appreciation, self-compassion, and humor, and delve into the sources of meaning in our work.
Based on your work, what would you say are the key stressors in medicine, generally?
Well there’s research on the electronic medical record and the increasing focus on metrics and “value-driven medicine,” which can lead to reduced connection with patients. I hope that what I’m doing makes some difference, but fundamentally, I believe there needs to be a real commitment on the part of the health system, to understand and make the changes that need to happen.
What is the fundamental problem? How do you define that?
Well I don’t think anybody knows. I think that’s what we’re saying. How can it be that so many people aren’t happy in such privileged work? It’s not clinical. It’s the system. It’s yet another flow sheet that you have to fill out; the actual amount of time spent with patients is low. No wonder we get burned out. We’re just doing orders all the time and answering phone calls.
It’s the loss of interconnectedness.
Yes, it’s the loss of connection. That goes back to even why chaplains may not be recognized as adding value. You can’t put a metric on connection. You can’t say, “I made 5 connections.”
Anything else you would like to share?
I don’t know how you feel about it, but I feel so grateful to have the opportunity to be in people’s lives in the intimate way we get to be and I, especially, get to be in a way sometimes even more than doctors. You get to be there, and you may even want to talk about the things that we were mentioning, but they’re asking you about their creatinine and their platelets and their urinary incontinence, so that’s what you’re having to talk about. I don’t have to do that, so I feel like I get the best seat in the house that way.
I think the seriously ill have so much to share and often are wise, particularly the young ones, from having dealt with illness. I’m really interested in that idea of wisdom and how you develop wisdom. Traditionally wisdom is associated with being an elder and having lived a long time and having a lot of experience. I think our work gives us that opportunity. We don’t have to necessarily live through everything to develop that kind of wisdom, but just to be with people who are living through these things.
So here I am, almost 70. I’m working harder than I’ve ever worked in my life. My partner is retired. She’s like, “Come on, let’s play.” She rides bikes, takes the dog out, cooks, reads. But I just can’t stop. I think it’s because I feel like, what else would I want to be doing with my time? I think that’s an amazing thing to be given that gift that I learn from my patients all the time and learn about what’s important. Obviously people are different, but it all boils down to relationships in the end.
That’s the promise of medicine, and I think that’s the great sadness of what’s going on with the epidemic of burnout. People lose connection to that.
There is some element to being present in these hard and difficult times that can bring perspective to life; and to know the sadness, in some ways
…is to know the joy.
Thank you, Denah, for sharing your thoughts with us.
© 2018 Society of Hospital Medicine
In the Hospital: Series Introduction
The only real voyage of discovery consists not in seeking new landscapes but in having new eyes.
—Marcel Proust
Hospitals can be complex, challenging, and dehumanizing for both patients and practitioners. In a national survey, up to half of hospitalists were affected by burnout and scored highly on emotional exhaustion and depersonalization scales.1
Yet hospitals are also ripe with meaningful stories. In addition to patients’ narratives, the stories of multidisciplinary team members who make quality patient care possible reveal that we are bound together in more ways than we realize. Now, we have the opportunity to tell these stories.
This issue of Journal of Hospital Medicine introduces a new series: In the Hospital. Through selected interviews we explore the day-to-day lives of members of our hospital team. Highlighting the “team”
We invite readers to appreciate the common threads that bind these pieces together. These stories will introduce us to individuals who have discrete and often disparate job descriptions, but all of them care about patients and want the best for them. Some are frustrated with the health care system and the constraints it places on our efficiency. Many of them worry about how to balance the demands of work with the need to be available for their families and friends. Many are trying their best to maintain their humanism, build resilience, and sustain themselves in ways that meet their personal goals for excellence, empathy, and fulfillment.
This series begins with the story of a palliative-care clinical chaplain whose life experience and perspective brings to light issues of resilience, meaning, and purpose. Future stories in this series will include a variety of providers across a spectrum of practice environments. We look forward to engaging you in this journey and welcome feedback and contributions.
Disclosures
The authors have nothing to disclose.
1. Roberts DL, Shanafelt TD, Dyrbye LN, West CP. A national comparison of burnout and work-life balance among internal medicine hospitalists and out- patient general internists. J Hosp Med. 2014;9(3),176-181. PubMed
The only real voyage of discovery consists not in seeking new landscapes but in having new eyes.
—Marcel Proust
Hospitals can be complex, challenging, and dehumanizing for both patients and practitioners. In a national survey, up to half of hospitalists were affected by burnout and scored highly on emotional exhaustion and depersonalization scales.1
Yet hospitals are also ripe with meaningful stories. In addition to patients’ narratives, the stories of multidisciplinary team members who make quality patient care possible reveal that we are bound together in more ways than we realize. Now, we have the opportunity to tell these stories.
This issue of Journal of Hospital Medicine introduces a new series: In the Hospital. Through selected interviews we explore the day-to-day lives of members of our hospital team. Highlighting the “team”
We invite readers to appreciate the common threads that bind these pieces together. These stories will introduce us to individuals who have discrete and often disparate job descriptions, but all of them care about patients and want the best for them. Some are frustrated with the health care system and the constraints it places on our efficiency. Many of them worry about how to balance the demands of work with the need to be available for their families and friends. Many are trying their best to maintain their humanism, build resilience, and sustain themselves in ways that meet their personal goals for excellence, empathy, and fulfillment.
This series begins with the story of a palliative-care clinical chaplain whose life experience and perspective brings to light issues of resilience, meaning, and purpose. Future stories in this series will include a variety of providers across a spectrum of practice environments. We look forward to engaging you in this journey and welcome feedback and contributions.
Disclosures
The authors have nothing to disclose.
The only real voyage of discovery consists not in seeking new landscapes but in having new eyes.
—Marcel Proust
Hospitals can be complex, challenging, and dehumanizing for both patients and practitioners. In a national survey, up to half of hospitalists were affected by burnout and scored highly on emotional exhaustion and depersonalization scales.1
Yet hospitals are also ripe with meaningful stories. In addition to patients’ narratives, the stories of multidisciplinary team members who make quality patient care possible reveal that we are bound together in more ways than we realize. Now, we have the opportunity to tell these stories.
This issue of Journal of Hospital Medicine introduces a new series: In the Hospital. Through selected interviews we explore the day-to-day lives of members of our hospital team. Highlighting the “team”
We invite readers to appreciate the common threads that bind these pieces together. These stories will introduce us to individuals who have discrete and often disparate job descriptions, but all of them care about patients and want the best for them. Some are frustrated with the health care system and the constraints it places on our efficiency. Many of them worry about how to balance the demands of work with the need to be available for their families and friends. Many are trying their best to maintain their humanism, build resilience, and sustain themselves in ways that meet their personal goals for excellence, empathy, and fulfillment.
This series begins with the story of a palliative-care clinical chaplain whose life experience and perspective brings to light issues of resilience, meaning, and purpose. Future stories in this series will include a variety of providers across a spectrum of practice environments. We look forward to engaging you in this journey and welcome feedback and contributions.
Disclosures
The authors have nothing to disclose.
1. Roberts DL, Shanafelt TD, Dyrbye LN, West CP. A national comparison of burnout and work-life balance among internal medicine hospitalists and out- patient general internists. J Hosp Med. 2014;9(3),176-181. PubMed
1. Roberts DL, Shanafelt TD, Dyrbye LN, West CP. A national comparison of burnout and work-life balance among internal medicine hospitalists and out- patient general internists. J Hosp Med. 2014;9(3),176-181. PubMed
© 2018 Society of Hospital Medicine
Rivaroxaban Plus Aspirin Nearly Halves Ischemic Stroke Risk
LOS ANGELES—Combined treatment with a low dosage of the anticoagulant rivaroxaban plus aspirin cut the incidence of ischemic strokes nearly in half, compared with aspirin alone, in a multicenter, randomized trial of more than 27,000 patients with stable atherosclerotic vascular disease.
This dramatic reduction in ischemic strokes, as well as a 42% reduction in all-cause strokes, by adding low-dose rivaroxaban (Xarelto) occurred without a significant increase in hemorrhagic strokes, but with a small increase in total major bleeding events such as gastrointestinal bleeds, said Mike Sharma, MD, at the International Stroke Conference 2018.
“There was a consistent effect across all strata of stroke risk,” Dr. Sharma said. Among patients with a prior stroke, rivaroxaban plus aspirin provided the greatest benefit, with no increase in intracranial hemorrhages, Dr. Sharma said.
“We think these results will fundamentally change how we approach stroke prevention,” said Dr. Sharma, a stroke neurologist in the Population Health Research Institute of McMaster University in Hamilton, Ontario.
An Analysis of Data From COMPASS
Dr. Sharma reported results from a secondary analysis of data collected in the COMPASS (Rivaroxaban for the Prevention of Major Cardiovascular Events in Coronary or Peripheral Artery Disease) trial, which enrolled 27,395 patients with stable coronary or peripheral artery disease at 602 centers in 33 countries.
The primary outcome of the trial, reported in 2017, was the combined rate of cardiovascular death, myocardial infarction, or stroke during an average of 23 months of follow-up. Patients received rivaroxaban plus aspirin (ie, 2.5 mg of rivaroxaban twice daily plus 100 mg of aspirin once daily), aspirin alone (ie, 100 mg of aspirin daily), or rivaroxaban alone (ie, 5.0 mg of rivaroxaban twice daily). A primary outcome event occurred in 4.1% of patients treated with rivaroxaban plus aspirin, 4.9% of patients who received rivaroxaban alone, and 5.4% of patients who received aspirin alone—a statistically significant 24% relative risk reduction in the combined treatment group, compared with aspirin only. The rivaroxaban only–treated patients did not significantly differ from the control patients who received only aspirin. The rate of major bleeds in patients treated with rivaroxaban plus aspirin was 1.2% greater, compared with aspirin only, but the rate of nonfatal symptomatic intracranial hemorrhages was identical in the two treatment groups.
The present study focused on various measures of stroke. The rate of all strokes was 42% lower among the patients treated with rivaroxaban plus aspirin, compared with the aspirin-alone patients, and the rate of ischemic strokes was 49% lower with the dual therapy, compared with aspirin only. Both differences were statistically significant. In contrast, the rivaroxaban-alone regimen did not significantly reduce all-cause strokes. It did significantly reduce ischemic strokes, compared with aspirin only, but it also significantly increased hemorrhagic strokes, compared with aspirin only, an adverse effect not caused by the combination of low-dose rivaroxaban plus aspirin.
Benefit in High-Risk Patients
Rivaroxaban plus aspirin surpassed aspirin alone for preventing mild and severe strokes and for preventing strokes in patients with a history of a prior stroke and in those without a prior stroke. The stroke reduction produced by rivaroxaban plus aspirin was greatest in the highest risk patients—those with a prior stroke. On the combined regimen, these patients had an average stroke incidence of 0.7% per year, compared with an annual 3.4% rate among the patients on aspirin only. This 2.7% absolute reduction by using rivaroxaban plus aspirin translated into a number needed to treat of 37 patients with a history of stroke to prevent one new stroke per year.
The 2017 report of the main COMPASS results included a net clinical benefit analysis that factored together the primary end point events and major bleeding events. The net rate of all these events was 4.7% with rivaroxaban plus aspirin and 5.9% with aspirin only, a statistically significant 20% relative risk reduction for all adverse outcomes with dual therapy. Researchers are assessing the cost-effectiveness of adding rivaroxaban, Dr. Sharma said.
Rivaroxaban received FDA marketing approval in 2011 for preventing deep vein thrombosis and preventing stroke in patients with atrial fibrillation at dosages higher than those used in COMPASS. The approved rivaroxaban dosage is 10 mg/day for preventing deep vein thrombosis, and 20 mg/day for preventing stroke in patients with atrial fibrillation. The 2.5-mg formulation of rivaroxaban that was given twice daily had the best safety and efficacy in COMPASS, but it is not available now on the US market, although it is available in Europe. Johnson & Johnson, which markets rivaroxaban globally with Bayer, submitted an application to the FDA in December 2017 for marketing approval of the 2.5-mg formulation in twice-daily dosing for use as in the COMPASS trial.
COMPASS was sponsored by Bayer, and Dr. Sharma has been a consultant or adviser to Bayer.
—Mitchel L. Zoler
Suggested Reading
Eikelboom JW, Connolly SJ, Bosch J, et al. Rivaroxaban with or without aspirin in stable cardiovascular disease. N Engl J Med. 2017;377(14):1319-1330.
LOS ANGELES—Combined treatment with a low dosage of the anticoagulant rivaroxaban plus aspirin cut the incidence of ischemic strokes nearly in half, compared with aspirin alone, in a multicenter, randomized trial of more than 27,000 patients with stable atherosclerotic vascular disease.
This dramatic reduction in ischemic strokes, as well as a 42% reduction in all-cause strokes, by adding low-dose rivaroxaban (Xarelto) occurred without a significant increase in hemorrhagic strokes, but with a small increase in total major bleeding events such as gastrointestinal bleeds, said Mike Sharma, MD, at the International Stroke Conference 2018.
“There was a consistent effect across all strata of stroke risk,” Dr. Sharma said. Among patients with a prior stroke, rivaroxaban plus aspirin provided the greatest benefit, with no increase in intracranial hemorrhages, Dr. Sharma said.
“We think these results will fundamentally change how we approach stroke prevention,” said Dr. Sharma, a stroke neurologist in the Population Health Research Institute of McMaster University in Hamilton, Ontario.
An Analysis of Data From COMPASS
Dr. Sharma reported results from a secondary analysis of data collected in the COMPASS (Rivaroxaban for the Prevention of Major Cardiovascular Events in Coronary or Peripheral Artery Disease) trial, which enrolled 27,395 patients with stable coronary or peripheral artery disease at 602 centers in 33 countries.
The primary outcome of the trial, reported in 2017, was the combined rate of cardiovascular death, myocardial infarction, or stroke during an average of 23 months of follow-up. Patients received rivaroxaban plus aspirin (ie, 2.5 mg of rivaroxaban twice daily plus 100 mg of aspirin once daily), aspirin alone (ie, 100 mg of aspirin daily), or rivaroxaban alone (ie, 5.0 mg of rivaroxaban twice daily). A primary outcome event occurred in 4.1% of patients treated with rivaroxaban plus aspirin, 4.9% of patients who received rivaroxaban alone, and 5.4% of patients who received aspirin alone—a statistically significant 24% relative risk reduction in the combined treatment group, compared with aspirin only. The rivaroxaban only–treated patients did not significantly differ from the control patients who received only aspirin. The rate of major bleeds in patients treated with rivaroxaban plus aspirin was 1.2% greater, compared with aspirin only, but the rate of nonfatal symptomatic intracranial hemorrhages was identical in the two treatment groups.
The present study focused on various measures of stroke. The rate of all strokes was 42% lower among the patients treated with rivaroxaban plus aspirin, compared with the aspirin-alone patients, and the rate of ischemic strokes was 49% lower with the dual therapy, compared with aspirin only. Both differences were statistically significant. In contrast, the rivaroxaban-alone regimen did not significantly reduce all-cause strokes. It did significantly reduce ischemic strokes, compared with aspirin only, but it also significantly increased hemorrhagic strokes, compared with aspirin only, an adverse effect not caused by the combination of low-dose rivaroxaban plus aspirin.
Benefit in High-Risk Patients
Rivaroxaban plus aspirin surpassed aspirin alone for preventing mild and severe strokes and for preventing strokes in patients with a history of a prior stroke and in those without a prior stroke. The stroke reduction produced by rivaroxaban plus aspirin was greatest in the highest risk patients—those with a prior stroke. On the combined regimen, these patients had an average stroke incidence of 0.7% per year, compared with an annual 3.4% rate among the patients on aspirin only. This 2.7% absolute reduction by using rivaroxaban plus aspirin translated into a number needed to treat of 37 patients with a history of stroke to prevent one new stroke per year.
The 2017 report of the main COMPASS results included a net clinical benefit analysis that factored together the primary end point events and major bleeding events. The net rate of all these events was 4.7% with rivaroxaban plus aspirin and 5.9% with aspirin only, a statistically significant 20% relative risk reduction for all adverse outcomes with dual therapy. Researchers are assessing the cost-effectiveness of adding rivaroxaban, Dr. Sharma said.
Rivaroxaban received FDA marketing approval in 2011 for preventing deep vein thrombosis and preventing stroke in patients with atrial fibrillation at dosages higher than those used in COMPASS. The approved rivaroxaban dosage is 10 mg/day for preventing deep vein thrombosis, and 20 mg/day for preventing stroke in patients with atrial fibrillation. The 2.5-mg formulation of rivaroxaban that was given twice daily had the best safety and efficacy in COMPASS, but it is not available now on the US market, although it is available in Europe. Johnson & Johnson, which markets rivaroxaban globally with Bayer, submitted an application to the FDA in December 2017 for marketing approval of the 2.5-mg formulation in twice-daily dosing for use as in the COMPASS trial.
COMPASS was sponsored by Bayer, and Dr. Sharma has been a consultant or adviser to Bayer.
—Mitchel L. Zoler
Suggested Reading
Eikelboom JW, Connolly SJ, Bosch J, et al. Rivaroxaban with or without aspirin in stable cardiovascular disease. N Engl J Med. 2017;377(14):1319-1330.
LOS ANGELES—Combined treatment with a low dosage of the anticoagulant rivaroxaban plus aspirin cut the incidence of ischemic strokes nearly in half, compared with aspirin alone, in a multicenter, randomized trial of more than 27,000 patients with stable atherosclerotic vascular disease.
This dramatic reduction in ischemic strokes, as well as a 42% reduction in all-cause strokes, by adding low-dose rivaroxaban (Xarelto) occurred without a significant increase in hemorrhagic strokes, but with a small increase in total major bleeding events such as gastrointestinal bleeds, said Mike Sharma, MD, at the International Stroke Conference 2018.
“There was a consistent effect across all strata of stroke risk,” Dr. Sharma said. Among patients with a prior stroke, rivaroxaban plus aspirin provided the greatest benefit, with no increase in intracranial hemorrhages, Dr. Sharma said.
“We think these results will fundamentally change how we approach stroke prevention,” said Dr. Sharma, a stroke neurologist in the Population Health Research Institute of McMaster University in Hamilton, Ontario.
An Analysis of Data From COMPASS
Dr. Sharma reported results from a secondary analysis of data collected in the COMPASS (Rivaroxaban for the Prevention of Major Cardiovascular Events in Coronary or Peripheral Artery Disease) trial, which enrolled 27,395 patients with stable coronary or peripheral artery disease at 602 centers in 33 countries.
The primary outcome of the trial, reported in 2017, was the combined rate of cardiovascular death, myocardial infarction, or stroke during an average of 23 months of follow-up. Patients received rivaroxaban plus aspirin (ie, 2.5 mg of rivaroxaban twice daily plus 100 mg of aspirin once daily), aspirin alone (ie, 100 mg of aspirin daily), or rivaroxaban alone (ie, 5.0 mg of rivaroxaban twice daily). A primary outcome event occurred in 4.1% of patients treated with rivaroxaban plus aspirin, 4.9% of patients who received rivaroxaban alone, and 5.4% of patients who received aspirin alone—a statistically significant 24% relative risk reduction in the combined treatment group, compared with aspirin only. The rivaroxaban only–treated patients did not significantly differ from the control patients who received only aspirin. The rate of major bleeds in patients treated with rivaroxaban plus aspirin was 1.2% greater, compared with aspirin only, but the rate of nonfatal symptomatic intracranial hemorrhages was identical in the two treatment groups.
The present study focused on various measures of stroke. The rate of all strokes was 42% lower among the patients treated with rivaroxaban plus aspirin, compared with the aspirin-alone patients, and the rate of ischemic strokes was 49% lower with the dual therapy, compared with aspirin only. Both differences were statistically significant. In contrast, the rivaroxaban-alone regimen did not significantly reduce all-cause strokes. It did significantly reduce ischemic strokes, compared with aspirin only, but it also significantly increased hemorrhagic strokes, compared with aspirin only, an adverse effect not caused by the combination of low-dose rivaroxaban plus aspirin.
Benefit in High-Risk Patients
Rivaroxaban plus aspirin surpassed aspirin alone for preventing mild and severe strokes and for preventing strokes in patients with a history of a prior stroke and in those without a prior stroke. The stroke reduction produced by rivaroxaban plus aspirin was greatest in the highest risk patients—those with a prior stroke. On the combined regimen, these patients had an average stroke incidence of 0.7% per year, compared with an annual 3.4% rate among the patients on aspirin only. This 2.7% absolute reduction by using rivaroxaban plus aspirin translated into a number needed to treat of 37 patients with a history of stroke to prevent one new stroke per year.
The 2017 report of the main COMPASS results included a net clinical benefit analysis that factored together the primary end point events and major bleeding events. The net rate of all these events was 4.7% with rivaroxaban plus aspirin and 5.9% with aspirin only, a statistically significant 20% relative risk reduction for all adverse outcomes with dual therapy. Researchers are assessing the cost-effectiveness of adding rivaroxaban, Dr. Sharma said.
Rivaroxaban received FDA marketing approval in 2011 for preventing deep vein thrombosis and preventing stroke in patients with atrial fibrillation at dosages higher than those used in COMPASS. The approved rivaroxaban dosage is 10 mg/day for preventing deep vein thrombosis, and 20 mg/day for preventing stroke in patients with atrial fibrillation. The 2.5-mg formulation of rivaroxaban that was given twice daily had the best safety and efficacy in COMPASS, but it is not available now on the US market, although it is available in Europe. Johnson & Johnson, which markets rivaroxaban globally with Bayer, submitted an application to the FDA in December 2017 for marketing approval of the 2.5-mg formulation in twice-daily dosing for use as in the COMPASS trial.
COMPASS was sponsored by Bayer, and Dr. Sharma has been a consultant or adviser to Bayer.
—Mitchel L. Zoler
Suggested Reading
Eikelboom JW, Connolly SJ, Bosch J, et al. Rivaroxaban with or without aspirin in stable cardiovascular disease. N Engl J Med. 2017;377(14):1319-1330.
Relationship between Hospital 30-Day Mortality Rates for Heart Failure and Patterns of Early Inpatient Comfort Care
In an effort to improve the quality of care delivered to heart failure (HF) patients, the Centers for Medicare & Medicaid Services (CMS) publish hospitals’ 30-day risk-standardized mortality rates (RSMRs) for HF.1 These mortality rates are also used by CMS to determine the financial penalties and bonuses that hospitals receive as part of the national Hospital Value-based Purchasing program.2 Whether or not these efforts effectively direct patients towards high-quality providers or motivate hospitals to provide better care, few would disagree with the overarching goal of decreasing the number of patients who die from HF.
However, for some patients with chronic disease at the end of life, goals of care may change. The quality of days lived may become more important than the quantity of days lived. As a consequence, high-quality care for some patients at the end of life is associated with withdrawing life-sustaining or life-extending therapies. Over time, this therapeutic perspective has become more common, with use of hospice care doubling from 23% to 47% between 2000 and 2012 among Medicare beneficiaries who died.3 For a national cohort of older patients admitted with HF—not just those patients who died in that same year—hospitals’ rates of referral to hospice are considerably lower, averaging 2.9% in 2010 in a national study.4 Nevertheless, it is possible that hospitals that more faithfully follow their dying patients’ wishes and withdraw life-prolonging interventions and provide comfort-focused care at the end of life might be unfairly penalized if such efforts resulted in higher mortality rates than other hospitals.
Therefore, we used Medicare data linked to a national HF registry with information about end-of-life care, to address 3 questions: (1) How much do hospitals vary in their rates of early comfort care and how has this changed over time; (2) What hospital and patient factors are associated with higher early comfort care rates; and (3) Is there a correlation between 30-day risk-adjusted mortality rates for HF with hospital rates of early comfort care?
METHODS
Data Sources
We used data from the American Heart Association’s Get With The Guidelines-Heart Failure (GWTG-HF) registry. GWTG-HF is a voluntary, inpatient, quality improvement registry5-7 that uses web-based tools and standard questionnaires to collect data on patients with HF admitted to participating hospitals nationwide. The data include information from admission (eg, sociodemographic characteristics, symptoms, medical history, and initial laboratory and test results), the inpatient stay (eg, therapies), and discharge (eg, discharge destination, whether and when comfort care was initiated). We linked the GWTG-HF registry data to Medicare claims data in order to obtain information about Medicare eligibility and patient comorbidities. Additionally, we used data from the American Hospital Association (2008) for hospital characteristics. Quintiles Real-World & Late Phase Research (Cambridge, MA) serves as the data coordinating center for GWTG-HF and the Duke Clinical Research Institute (Durham, NC) serves as the statistical analytic center. GWTG-HF participating sites have a waiver of informed consent because the data are de-identified and primarily used for quality improvement. All analyses performed on this data have been approved by the Duke Medical Center Institutional Review Board.
Study Population
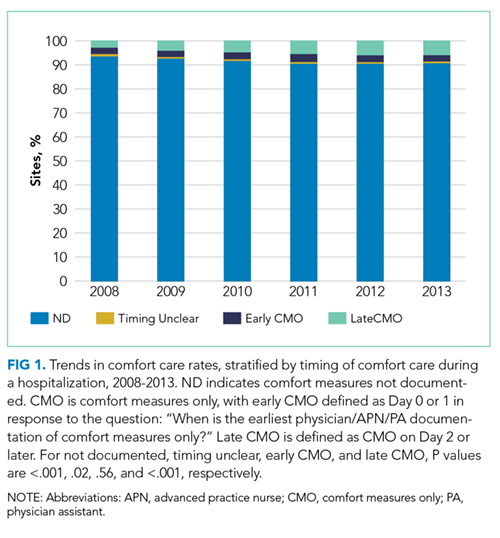
Study Outcomes
Our outcome of interest was the correlation between a hospital’s rate of initiating early CMO for admitted HF patients and a hospital’s 30-day RSMR for HF. The GWTG-HF questionnaire8 asks “When is the earliest physician/advanced practice nurse/physician assistant documentation of comfort measures only?” and permits 4 responses: day 0 or 1, day 2 or after, timing unclear, or not documented/unable to determine. We defined early CMO as CMO on day 0 or 1, and late/no CMO as any other response. We chose to examine early comfort care because many hospitalized patients transition to comfort care before they die if the death is in any way predictable. Thus, if comfort care is measured at any time during the hospitalization, hospitals that have high mortality rates are likely to have high comfort care rates. Therefore, we chose to use the more precise measure of early comfort care. We created hospital-level, risk-standardized early comfort care rates using the same risk-adjustment model used for RSMRs but with the outcome of early comfort care instead of mortality.9,10
RSMRs were calculated using a validated GWTG-HF 30-day risk-standardized mortality model9 with additional variables identified from other GWTG-HF analyses.10 The 30 days are measured as the 30 days after the index admission date.
Statistical Analyses
We described trends in early comfort care rates over time, from February 17, 2008, to February 17, 2014, using the Cochran-Armitage test for trend. We then grouped hospitals into quintiles based on their unadjusted early comfort care rates. We described patient and hospital characteristics for each quintile, using χ2 tests to test for differences across quintiles for categorical variables and Wilcoxon rank sum tests to assess for differences across quintiles for continuous variables. We then examined the Spearman’s rank correlation between hospitals’ RSMR and risk-adjusted comfort care rates. Finally, we compared hospital-level RSMRs before and after adjusting for early comfort care.
We performed risk-adjustment for these last 2 analyses as follows. For each patient, covariates were obtained from the GWTG-HF registry. Clinical data captured for the index admission were utilized in the risk-adjustment model (for both RSMRs and risk-adjusted comfort care rates). Included covariates were as follows: age (per 10 years); race (black vs non-black); systolic blood pressure at admission ≤170 (per 10 mm Hg); respiratory rate (per 5 respirations/min); heart rate ≤105 (per 10 beats/min); weight ≤100 (per 5 kg); weight >100 (per 5 kg); blood urea nitrogen (per 10 mg/dl); brain natriuretic peptide ≤2000 (per 500 pg/ml); hemoglobin 10-14 (per 1 g/dl); troponin abnormal (vs normal); creatinine ≤1 (per 1 mg/dl); sodium 130-140 (per 5 mEq/l); and chronic obstructive pulmonary disease or asthma.
Hierarchical logistic regression modeling was used to calculate the hospital-specific RSMR. A predicted/expected ratio similar to an observed/expected (O/E) ratio was calculated using the following modifications: (1) instead of the observed (crude) number of deaths, the numerator is the number of deaths predicted by the hierarchical model among a hospital’s patients given the patients’ risk factors and the hospital-specific effect; (2) the denominator is the expected number of deaths among the hospital’s patients given the patients’ risk factors and the average of all hospital-specific effects overall; and (3) the ratio of the numerator and denominator are then multiplied by the observed overall mortality rate (same as O/E). This calculation is the method used by CMS to derive RSMRs.11 Multiple imputation was used to handle missing data in the models; 25 imputed datasets using the fully conditional specification method were created. Patients with missing prior comorbidities were assumed to not have those conditions. Hospital characteristics were not imputed; therefore, for analyses that required construction of risk-adjusted comfort care rates or RSMRs, we excluded 18,867 patients cared for at 82 hospitals missing hospital characteristics. We ran 2 sets of models for risk-adjusted comfort care rates and RSMRs: the first adjusted only for patient characteristics, and the second adjusted for both patient and hospital characteristics. Results from the 2 models were similar, so we present only results from the latter. Variance inflation factors were all <2, indicating the collinearity between covariates was not an issue.
All statistical analyses were performed by using SAS version 9.4 (SAS Institute, Cary, NC). We tested for statistical significance by using 2-tailed tests and considered P values <.05 to be statistically significant.
RESULTS
Of the 272 hospitals included in our final study cohort, the observed median overall rate of early comfort care in this study was 1.9% (25th to 75th percentile: 0.9% to 4.0%); hospitals varied widely in unadjusted early comfort care rates (0.00% to 0.46% in the lowest quintile, and 4.60% to 39.91% in the highest quintile; Table 1).
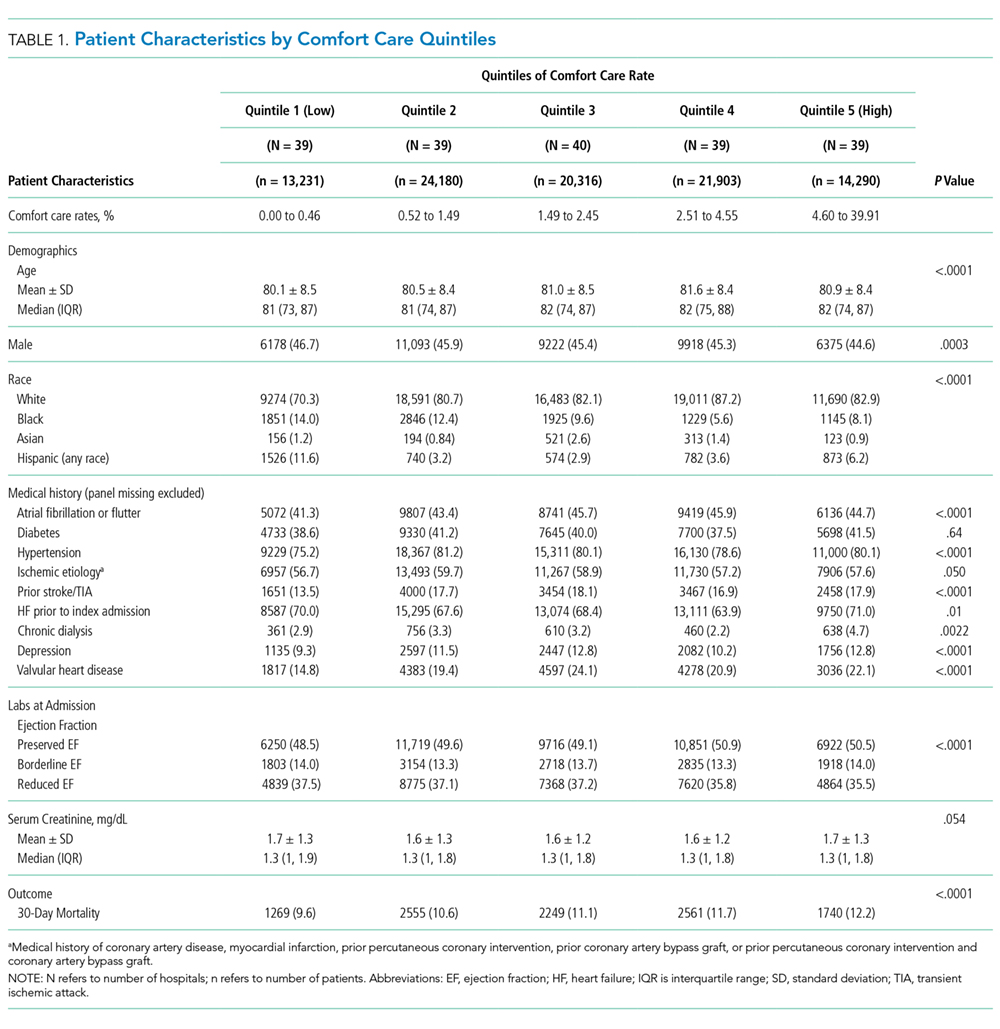
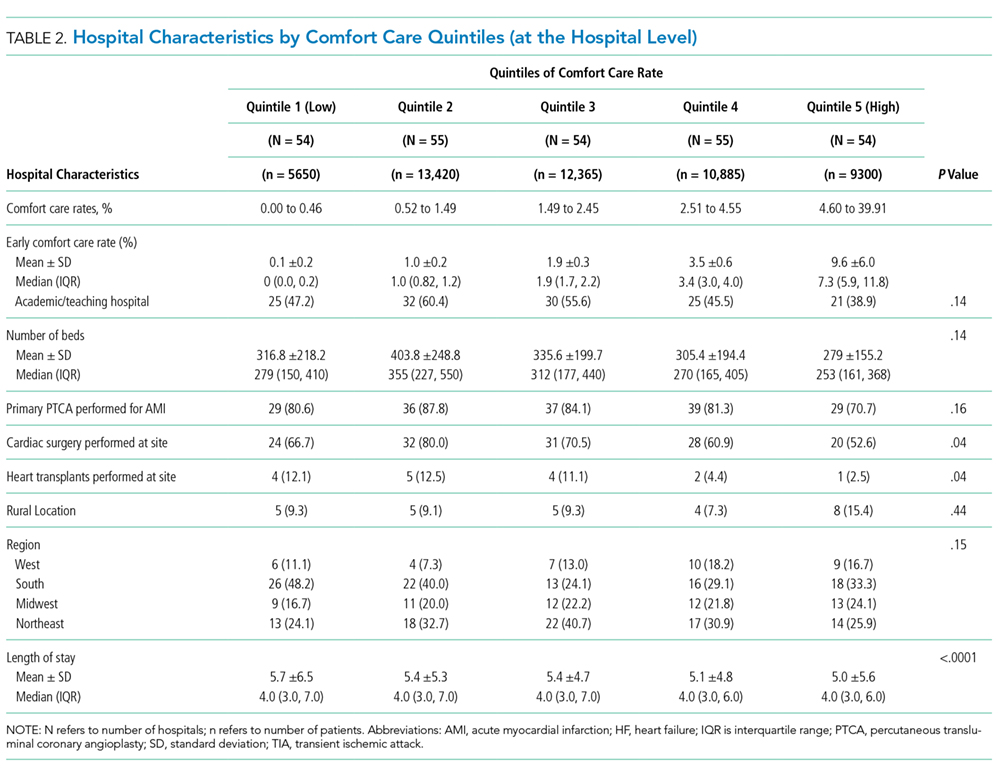
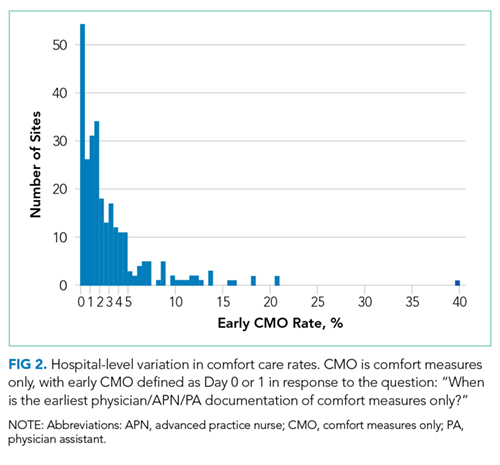
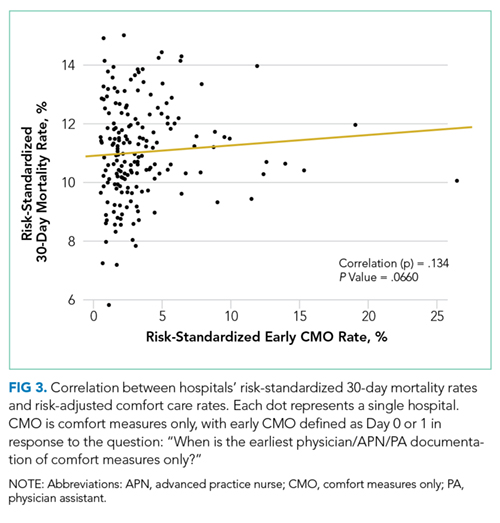
DISCUSSION
Among a national sample of US hospitals, we found wide variation in how frequently health care providers deliver comfort care within the first 2 days of admission for HF. A minority of hospitals reported no early comfort care on any patients throughout the 6-year study period, but hospitals in the highest quintile initiated early comfort care rates for at least 1 in 20 HF patients. Hospitals that were more likely to initiate early comfort care had a higher proportion of female and white patients and were less likely to have the capacity to deliver aggressive surgical interventions such as heart transplants. Hospital-level 30-day RSMRs were not correlated with rates of early comfort care.
While the appropriate rate of early comfort care for patients hospitalized with HF is unknown, given that the average hospital RSMR is approximately 12% for fee-for-service Medicare patients hospitalized with HF,12 it is surprising that some hospitals initiated early comfort care on none or very few of their HF patients. It is quite possible that many of these hospitals initiated comfort care for some of their patients after 48 hours of hospitalization. We were unable to estimate the average period of time patients received comfort care prior to dying, the degree to which this varies across hospitals or why it might vary, and whether the length of time between comfort care initiation and death is related to satisfaction with end-of-life care. Future research on these topics would help inform providers seeking to deliver better end-of-life care. In this study, we also were unable to estimate how often early comfort care was not initiated because patients had a good prognosis. However, prior studies have suggested low rates of comfort care or hospice referral even among patients at very high estimated mortality risk.4 It is also possible that providers and families had concerns about the ability to accurately prognosticate, although several models have been shown to perform acceptably for patients hospitalized with HF.13
We found that comfort care rates did not increase over time, even though use of hospice care doubled among Medicare beneficiaries between 2000 and 2012. By way of context, cancer—the second leading cause of death in the US—was responsible for 38% of hospice admissions in 2013, whereas heart disease (including but not limited to HF)—the leading cause of death— was responsible for 13% of hospice admissions.14 The 2013 American College of Cardiology Foundation and the American Heart Association guidelines for HF recommend consideration of hospice or palliative care for inpatient and transitional care.15 In future work, it would be important to better understand the drivers behind decisions around comfort care for patients hospitalized with HF.
With regards to the policy implications of our study, we found that on average, adjusting 30-day mortality rates for early comfort care was not associated with a change in hospital mortality rankings. For those hospitals with high comfort care rates, adjusting for comfort care did lower mortality rates, but the change was so small as to be clinically insignificant. CMS’ RSMR for HF excludes patients enrolled in hospice during the 12 months prior to index admission, including the first day of the index admission, acknowledging that death may not be an untoward outcome for such patients.16 Fee-for-service Medicare beneficiaries excluded for hospice enrollment comprised 1.29% of HF admissions from July 2012 to June 201516 and are likely a subset of early comfort care patients in our sample, both because of the inclusiveness of chart review (vs claims-based identification) and because we defined early comfort care as comfort care initiated on day 0 or 1 of hospitalization. Nevertheless, with our data we cannot assess to what degree our findings were due solely to hospice patients excluded from CMS’ current estimates.
Prior research has described the underuse of palliative care among patients with HF17 and the association of palliative care with better patient and family experiences at the end of life.18-20 We add to this literature by describing the epidemiology—prevalence, changes over time, and associated factors—of early comfort care for HF in a national sample of hospitals. This serves as a baseline for future work on end-of-life care among patients hospitalized for HF. Our findings also contribute to ongoing discussion about how best to risk-adjust mortality metrics used to assess hospital quality in pay-for-performance programs. Recent research on stroke and pneumonia based on California data suggests that not accounting for do-not-resuscitate (DNR) status biases hospital mortality rates.21,22 Earlier research examined the impact of adjusting hospital mortality rates for DNR for a broader range of conditions.23,24 We expand this line of inquiry by examining the hospital-level association of early comfort care with mortality rates for HF, utilizing a national, contemporary cohort of inpatient stays. In addition, while studies have found that DNR rates within the first 24 hours of admission are relatively high (median 15.8% for pneumonia; 13.3% for stroke),21,22 comfort care is distinct from DNR.
Our findings should be interpreted in the context of several potential limitations. First, we did not have any information about patient or family wishes regarding end-of-life care, or the exact timing of early comfort care (eg, day 0 or day 1). The initiation of comfort care usually follows conversations about end-of-life care involving a patient, his or her family, and the medical team. Thus, we do not know if low early comfort care rates represent the lack of such a conversation (and thus poor-quality care) or the desire by most patients not to initiate early comfort care (and thus high-quality care). This would be an important area for future research. Second, we included only patients admitted to hospitals that participate in GWTG-HF, a voluntary quality improvement initiative. This may limit the generalizability of our findings, but it is unclear how our sample might bias our findings. Hospitals engaged in quality improvement may be more likely to initiate early comfort care aligned with patients’ wishes; on the other hand, hospitals with advanced surgical capabilities are over-represented in our sample and these hospitals are less likely to initiate early comfort care. Third, we examined associations and cannot make conclusions about causality. Residual measured and unmeasured confounding may influence these findings.
In summary, we found that early comfort care rates for fee-for-service Medicare beneficiaries admitted for HF varies widely among hospitals, but median rates of early comfort care have not changed over time. On average, there was no correlation between hospital-level, 30-day, RSMRs and rates of early comfort care. This suggests that current efforts to lower mortality rates have not had unintended consequences for hospitals that institute early comfort care more commonly than their peers.
Acknowledgments
Dr. Chen and Ms. Cox take responsibility for the integrity of the data and the accuracy of the data analysis. Drs. Chen, Levine, and Hayward are responsible for the study concept and design. Drs. Chen and Fonarow acquired the data. Dr. Chen drafted the manuscript. Drs. Chen, Levin, Hayward, Cox, Fonarow, DeVore, Hernandez, Heidenreich, and Yancy revised the manuscript for important intellectual content. Drs. Chen, Hayward, Cox, and Schulte performed the statistical analysis. Drs. Chen and Fonarow obtained funding for the study. Drs. Hayward and Fonarow supervised the study. The authors thank Bailey Green, MPH, for the research assistance she provided. She was compensated for her work.
Disclosure
Dr. Fonarow reports research support from the National Institutes of Health, and consulting for Amgen, Janssen, Novartis, Medtronic, and St Jude Medical. Dr. DeVore reports research support from the American Heart Association, Amgen, and Novartis, and consulting for Amgen. The other authors have no relevant conflicts of interest. Dr. Chen was supported by a Career Development Grant Award (K08HS020671) from the Agency for Healthcare Research and Quality when the manuscript was being prepared. She currently receives support from the Department of Health and Human Services Office of the Assistant Secretary for Planning and Evaluation for her work there. She also receives support from the Blue Cross Blue Shield of Michigan Foundation’s Investigator Initiated Research Program, the Agency for Healthcare Research and Quality (R01 HS024698), and the National Institute on Aging (P01 AG019783). These funding sources had no role in the preparation, review, or approval of the manuscript. The GWTG-HF program is provided by the American Heart Association. GWTG-HF has been funded in the past through support from Amgen, Medtronic, GlaxoSmithKline, Ortho-McNeil, and the American Heart Association Pharmaceutical Roundtable. These sponsors had no role in the study design, data analysis or manuscript preparation and revision.
1. Centers for Medicare & Medicaid Services. Hospital Compare. https://www.medicare.gov/hospitalcompare/. Accessed on November 27, 2016.
2. Centers for Medicare & Medicaid Services. Hospital Value-based Purchasing. https://www.medicare.gov/hospitalcompare/data/hospital-vbp.html. Accessed August 30, 2017.
3. Medicare Payment Advisory Comission. Report to the Congress: Medicare payment policy. 2014. http://www.medpac.gov/docs/default-source/reports/mar14_entirereport.pdf. Accessed August 31, 2017.
4. Whellan DJ, Cox M, Hernandez AF, et al. Utilization of hospice and predicted mortality risk among older patients hospitalized with heart failure: findings from GWTG-HF. J Card Fail. 2012;18(6):471-477. PubMed
5. Hong Y, LaBresh KA. Overview of the American Heart Association “Get with the Guidelines” programs: coronary heart disease, stroke, and heart failure. Crit Pathw Cardiol. 2006;5(4):179-186. PubMed
6. LaBresh KA, Gliklich R, Liljestrand J, Peto R, Ellrodt AG. Using “get with the guidelines” to improve cardiovascular secondary prevention. Jt Comm J Qual Saf. 2003;29(10):539-550. PubMed
7. Hernandez AF, Fonarow GC, Liang L, et al. Sex and racial differences in the use of implantable cardioverter-defibrillators among patients hospitalized with heart failure. JAMA. 2007;298(13):1525-1532. PubMed
8. Get With The Guidelines-Heart Failure. HF Patient Management Tool, October 2016.
9. Eapen ZJ, Liang L, Fonarow GC, et al. Validated, electronic health record deployable prediction models for assessing patient risk of 30-day rehospitalization and mortality in older heart failure patients. JACC Heart Fail. 2013;1(3):245-251. PubMed
10. Peterson PN, Rumsfeld JS, Liang L, et al. A validated risk score for in-hospital mortality in patients with heart failure from the American Heart Association get with the guidelines program. Circ Cardiovasc Qual Outcomes. 2010;3(1):25-32. PubMed
11. Frequently Asked Questions (FAQs): Implementation and Maintenance of CMS Mortality Measures for AMI & HF. 2007. https://www.cms.gov/Medicare/Quality-Initiatives-Patient-Assessment-Instruments/HospitalQualityInits/downloads/HospitalMortalityAboutAMI_HF.pdf. Accessed August 30, 2017.
12. Suter LG, Li SX, Grady JN, et al. National patterns of risk-standardized mortality and readmission after hospitalization for acute myocardial infarction, heart failure, and pneumonia: update on publicly reported outcomes measures based on the 2013 release. J Gen Intern Med. 2014;29(10):1333-1340. PubMed
13. Lagu T, Pekow PS, Shieh MS, et al. Validation and comparison of seven mortality prediction models for hospitalized patients with acute decompensated heart failure. Circ Heart Fail. Aug 2016;9(8):e002912. PubMed
14. National Hospice and Palliative Care Organization. NHPCO’s facts and figures: hospice care in america. 2015. https://www.nhpco.org/sites/default/files/public/Statistics_Research/2015_Facts_Figures.pdf. Accessed August 30, 2017.
15. Yancy CW, Jessup M, Bozkurt B, et al. 2013 ACCF/AHA guideline for the management of heart failure: executive summary: a report of the American College of Cardiology Foundation/American Heart Association Task Force on practice guidelines. Circulation. 2013;128(16):1810-1852. PubMed
16. Centers for Medicare & Medicaid Services. 2016 Condition-Specific Measures Updates and Specifications Report Hospital-Level 30-Day Risk-Standardized Mortality Measures. https://www.qualitynet.org/dcs/ContentServer?c=Page&pagename=QnetPublic%2FPage%2FQnetTier3&cid=1228774398696. Accessed August 30, 2017.
17. Bakitas M, Macmartin M, Trzepkowski K, et al. Palliative care consultations for heart failure patients: how many, when, and why? J Card Fail. 2013;19(3):193-201. PubMed
18. Wachterman MW, Pilver C, Smith D, Ersek M, Lipsitz SR, Keating NL. Quality of End-of-Life Care Provided to Patients With Different Serious Illnesses. JAMA Intern Med. 2016;176(8):1095-1102. PubMed
19. Wright AA, Zhang B, Ray A, et al. Associations between end-of-life discussions, patient mental health, medical care near death, and caregiver bereavement adjustment. JAMA. 2008;300(14):1665-1673. PubMed
20. Rogers JG, Patel CB, Mentz RJ, et al. Palliative care in heart failure: results of a randomized, controlled clinical trial. J Card Fail. 2016;22(11):940. PubMed
21. Kelly AG, Zahuranec DB, Holloway RG, Morgenstern LB, Burke JF. Variation in do-not-resuscitate orders for patients with ischemic stroke: implications for national hospital comparisons. Stroke. 2014;45(3):822-827. PubMed
22. Walkey AJ, Weinberg J, Wiener RS, Cooke CR, Lindenauer PK. Association of Do-Not-Resuscitate Orders and Hospital Mortality Rate Among Patients With Pneumonia. JAMA Intern Med. 2016;176(1):97-104. PubMed
23. Bardach N, Zhao S, Pantilat S, Johnston SC. Adjustment for do-not-resuscitate orders reverses the apparent in-hospital mortality advantage for minorities. Am J Med. 2005;118(4):400-408. PubMed
24. Tabak YP, Johannes RS, Silber JH, Kurtz SG. Should Do-Not-Resuscitate status be included as a mortality risk adjustor? The impact of DNR variations on performance reporting. Med Care. 2005;43(7):658-666. PubMed
In an effort to improve the quality of care delivered to heart failure (HF) patients, the Centers for Medicare & Medicaid Services (CMS) publish hospitals’ 30-day risk-standardized mortality rates (RSMRs) for HF.1 These mortality rates are also used by CMS to determine the financial penalties and bonuses that hospitals receive as part of the national Hospital Value-based Purchasing program.2 Whether or not these efforts effectively direct patients towards high-quality providers or motivate hospitals to provide better care, few would disagree with the overarching goal of decreasing the number of patients who die from HF.
However, for some patients with chronic disease at the end of life, goals of care may change. The quality of days lived may become more important than the quantity of days lived. As a consequence, high-quality care for some patients at the end of life is associated with withdrawing life-sustaining or life-extending therapies. Over time, this therapeutic perspective has become more common, with use of hospice care doubling from 23% to 47% between 2000 and 2012 among Medicare beneficiaries who died.3 For a national cohort of older patients admitted with HF—not just those patients who died in that same year—hospitals’ rates of referral to hospice are considerably lower, averaging 2.9% in 2010 in a national study.4 Nevertheless, it is possible that hospitals that more faithfully follow their dying patients’ wishes and withdraw life-prolonging interventions and provide comfort-focused care at the end of life might be unfairly penalized if such efforts resulted in higher mortality rates than other hospitals.
Therefore, we used Medicare data linked to a national HF registry with information about end-of-life care, to address 3 questions: (1) How much do hospitals vary in their rates of early comfort care and how has this changed over time; (2) What hospital and patient factors are associated with higher early comfort care rates; and (3) Is there a correlation between 30-day risk-adjusted mortality rates for HF with hospital rates of early comfort care?
METHODS
Data Sources
We used data from the American Heart Association’s Get With The Guidelines-Heart Failure (GWTG-HF) registry. GWTG-HF is a voluntary, inpatient, quality improvement registry5-7 that uses web-based tools and standard questionnaires to collect data on patients with HF admitted to participating hospitals nationwide. The data include information from admission (eg, sociodemographic characteristics, symptoms, medical history, and initial laboratory and test results), the inpatient stay (eg, therapies), and discharge (eg, discharge destination, whether and when comfort care was initiated). We linked the GWTG-HF registry data to Medicare claims data in order to obtain information about Medicare eligibility and patient comorbidities. Additionally, we used data from the American Hospital Association (2008) for hospital characteristics. Quintiles Real-World & Late Phase Research (Cambridge, MA) serves as the data coordinating center for GWTG-HF and the Duke Clinical Research Institute (Durham, NC) serves as the statistical analytic center. GWTG-HF participating sites have a waiver of informed consent because the data are de-identified and primarily used for quality improvement. All analyses performed on this data have been approved by the Duke Medical Center Institutional Review Board.
Study Population
Study Outcomes
Our outcome of interest was the correlation between a hospital’s rate of initiating early CMO for admitted HF patients and a hospital’s 30-day RSMR for HF. The GWTG-HF questionnaire8 asks “When is the earliest physician/advanced practice nurse/physician assistant documentation of comfort measures only?” and permits 4 responses: day 0 or 1, day 2 or after, timing unclear, or not documented/unable to determine. We defined early CMO as CMO on day 0 or 1, and late/no CMO as any other response. We chose to examine early comfort care because many hospitalized patients transition to comfort care before they die if the death is in any way predictable. Thus, if comfort care is measured at any time during the hospitalization, hospitals that have high mortality rates are likely to have high comfort care rates. Therefore, we chose to use the more precise measure of early comfort care. We created hospital-level, risk-standardized early comfort care rates using the same risk-adjustment model used for RSMRs but with the outcome of early comfort care instead of mortality.9,10
RSMRs were calculated using a validated GWTG-HF 30-day risk-standardized mortality model9 with additional variables identified from other GWTG-HF analyses.10 The 30 days are measured as the 30 days after the index admission date.
Statistical Analyses
We described trends in early comfort care rates over time, from February 17, 2008, to February 17, 2014, using the Cochran-Armitage test for trend. We then grouped hospitals into quintiles based on their unadjusted early comfort care rates. We described patient and hospital characteristics for each quintile, using χ2 tests to test for differences across quintiles for categorical variables and Wilcoxon rank sum tests to assess for differences across quintiles for continuous variables. We then examined the Spearman’s rank correlation between hospitals’ RSMR and risk-adjusted comfort care rates. Finally, we compared hospital-level RSMRs before and after adjusting for early comfort care.
We performed risk-adjustment for these last 2 analyses as follows. For each patient, covariates were obtained from the GWTG-HF registry. Clinical data captured for the index admission were utilized in the risk-adjustment model (for both RSMRs and risk-adjusted comfort care rates). Included covariates were as follows: age (per 10 years); race (black vs non-black); systolic blood pressure at admission ≤170 (per 10 mm Hg); respiratory rate (per 5 respirations/min); heart rate ≤105 (per 10 beats/min); weight ≤100 (per 5 kg); weight >100 (per 5 kg); blood urea nitrogen (per 10 mg/dl); brain natriuretic peptide ≤2000 (per 500 pg/ml); hemoglobin 10-14 (per 1 g/dl); troponin abnormal (vs normal); creatinine ≤1 (per 1 mg/dl); sodium 130-140 (per 5 mEq/l); and chronic obstructive pulmonary disease or asthma.
Hierarchical logistic regression modeling was used to calculate the hospital-specific RSMR. A predicted/expected ratio similar to an observed/expected (O/E) ratio was calculated using the following modifications: (1) instead of the observed (crude) number of deaths, the numerator is the number of deaths predicted by the hierarchical model among a hospital’s patients given the patients’ risk factors and the hospital-specific effect; (2) the denominator is the expected number of deaths among the hospital’s patients given the patients’ risk factors and the average of all hospital-specific effects overall; and (3) the ratio of the numerator and denominator are then multiplied by the observed overall mortality rate (same as O/E). This calculation is the method used by CMS to derive RSMRs.11 Multiple imputation was used to handle missing data in the models; 25 imputed datasets using the fully conditional specification method were created. Patients with missing prior comorbidities were assumed to not have those conditions. Hospital characteristics were not imputed; therefore, for analyses that required construction of risk-adjusted comfort care rates or RSMRs, we excluded 18,867 patients cared for at 82 hospitals missing hospital characteristics. We ran 2 sets of models for risk-adjusted comfort care rates and RSMRs: the first adjusted only for patient characteristics, and the second adjusted for both patient and hospital characteristics. Results from the 2 models were similar, so we present only results from the latter. Variance inflation factors were all <2, indicating the collinearity between covariates was not an issue.
All statistical analyses were performed by using SAS version 9.4 (SAS Institute, Cary, NC). We tested for statistical significance by using 2-tailed tests and considered P values <.05 to be statistically significant.
RESULTS
Of the 272 hospitals included in our final study cohort, the observed median overall rate of early comfort care in this study was 1.9% (25th to 75th percentile: 0.9% to 4.0%); hospitals varied widely in unadjusted early comfort care rates (0.00% to 0.46% in the lowest quintile, and 4.60% to 39.91% in the highest quintile; Table 1).
DISCUSSION
Among a national sample of US hospitals, we found wide variation in how frequently health care providers deliver comfort care within the first 2 days of admission for HF. A minority of hospitals reported no early comfort care on any patients throughout the 6-year study period, but hospitals in the highest quintile initiated early comfort care rates for at least 1 in 20 HF patients. Hospitals that were more likely to initiate early comfort care had a higher proportion of female and white patients and were less likely to have the capacity to deliver aggressive surgical interventions such as heart transplants. Hospital-level 30-day RSMRs were not correlated with rates of early comfort care.
While the appropriate rate of early comfort care for patients hospitalized with HF is unknown, given that the average hospital RSMR is approximately 12% for fee-for-service Medicare patients hospitalized with HF,12 it is surprising that some hospitals initiated early comfort care on none or very few of their HF patients. It is quite possible that many of these hospitals initiated comfort care for some of their patients after 48 hours of hospitalization. We were unable to estimate the average period of time patients received comfort care prior to dying, the degree to which this varies across hospitals or why it might vary, and whether the length of time between comfort care initiation and death is related to satisfaction with end-of-life care. Future research on these topics would help inform providers seeking to deliver better end-of-life care. In this study, we also were unable to estimate how often early comfort care was not initiated because patients had a good prognosis. However, prior studies have suggested low rates of comfort care or hospice referral even among patients at very high estimated mortality risk.4 It is also possible that providers and families had concerns about the ability to accurately prognosticate, although several models have been shown to perform acceptably for patients hospitalized with HF.13
We found that comfort care rates did not increase over time, even though use of hospice care doubled among Medicare beneficiaries between 2000 and 2012. By way of context, cancer—the second leading cause of death in the US—was responsible for 38% of hospice admissions in 2013, whereas heart disease (including but not limited to HF)—the leading cause of death— was responsible for 13% of hospice admissions.14 The 2013 American College of Cardiology Foundation and the American Heart Association guidelines for HF recommend consideration of hospice or palliative care for inpatient and transitional care.15 In future work, it would be important to better understand the drivers behind decisions around comfort care for patients hospitalized with HF.
With regards to the policy implications of our study, we found that on average, adjusting 30-day mortality rates for early comfort care was not associated with a change in hospital mortality rankings. For those hospitals with high comfort care rates, adjusting for comfort care did lower mortality rates, but the change was so small as to be clinically insignificant. CMS’ RSMR for HF excludes patients enrolled in hospice during the 12 months prior to index admission, including the first day of the index admission, acknowledging that death may not be an untoward outcome for such patients.16 Fee-for-service Medicare beneficiaries excluded for hospice enrollment comprised 1.29% of HF admissions from July 2012 to June 201516 and are likely a subset of early comfort care patients in our sample, both because of the inclusiveness of chart review (vs claims-based identification) and because we defined early comfort care as comfort care initiated on day 0 or 1 of hospitalization. Nevertheless, with our data we cannot assess to what degree our findings were due solely to hospice patients excluded from CMS’ current estimates.
Prior research has described the underuse of palliative care among patients with HF17 and the association of palliative care with better patient and family experiences at the end of life.18-20 We add to this literature by describing the epidemiology—prevalence, changes over time, and associated factors—of early comfort care for HF in a national sample of hospitals. This serves as a baseline for future work on end-of-life care among patients hospitalized for HF. Our findings also contribute to ongoing discussion about how best to risk-adjust mortality metrics used to assess hospital quality in pay-for-performance programs. Recent research on stroke and pneumonia based on California data suggests that not accounting for do-not-resuscitate (DNR) status biases hospital mortality rates.21,22 Earlier research examined the impact of adjusting hospital mortality rates for DNR for a broader range of conditions.23,24 We expand this line of inquiry by examining the hospital-level association of early comfort care with mortality rates for HF, utilizing a national, contemporary cohort of inpatient stays. In addition, while studies have found that DNR rates within the first 24 hours of admission are relatively high (median 15.8% for pneumonia; 13.3% for stroke),21,22 comfort care is distinct from DNR.
Our findings should be interpreted in the context of several potential limitations. First, we did not have any information about patient or family wishes regarding end-of-life care, or the exact timing of early comfort care (eg, day 0 or day 1). The initiation of comfort care usually follows conversations about end-of-life care involving a patient, his or her family, and the medical team. Thus, we do not know if low early comfort care rates represent the lack of such a conversation (and thus poor-quality care) or the desire by most patients not to initiate early comfort care (and thus high-quality care). This would be an important area for future research. Second, we included only patients admitted to hospitals that participate in GWTG-HF, a voluntary quality improvement initiative. This may limit the generalizability of our findings, but it is unclear how our sample might bias our findings. Hospitals engaged in quality improvement may be more likely to initiate early comfort care aligned with patients’ wishes; on the other hand, hospitals with advanced surgical capabilities are over-represented in our sample and these hospitals are less likely to initiate early comfort care. Third, we examined associations and cannot make conclusions about causality. Residual measured and unmeasured confounding may influence these findings.
In summary, we found that early comfort care rates for fee-for-service Medicare beneficiaries admitted for HF varies widely among hospitals, but median rates of early comfort care have not changed over time. On average, there was no correlation between hospital-level, 30-day, RSMRs and rates of early comfort care. This suggests that current efforts to lower mortality rates have not had unintended consequences for hospitals that institute early comfort care more commonly than their peers.
Acknowledgments
Dr. Chen and Ms. Cox take responsibility for the integrity of the data and the accuracy of the data analysis. Drs. Chen, Levine, and Hayward are responsible for the study concept and design. Drs. Chen and Fonarow acquired the data. Dr. Chen drafted the manuscript. Drs. Chen, Levin, Hayward, Cox, Fonarow, DeVore, Hernandez, Heidenreich, and Yancy revised the manuscript for important intellectual content. Drs. Chen, Hayward, Cox, and Schulte performed the statistical analysis. Drs. Chen and Fonarow obtained funding for the study. Drs. Hayward and Fonarow supervised the study. The authors thank Bailey Green, MPH, for the research assistance she provided. She was compensated for her work.
Disclosure
Dr. Fonarow reports research support from the National Institutes of Health, and consulting for Amgen, Janssen, Novartis, Medtronic, and St Jude Medical. Dr. DeVore reports research support from the American Heart Association, Amgen, and Novartis, and consulting for Amgen. The other authors have no relevant conflicts of interest. Dr. Chen was supported by a Career Development Grant Award (K08HS020671) from the Agency for Healthcare Research and Quality when the manuscript was being prepared. She currently receives support from the Department of Health and Human Services Office of the Assistant Secretary for Planning and Evaluation for her work there. She also receives support from the Blue Cross Blue Shield of Michigan Foundation’s Investigator Initiated Research Program, the Agency for Healthcare Research and Quality (R01 HS024698), and the National Institute on Aging (P01 AG019783). These funding sources had no role in the preparation, review, or approval of the manuscript. The GWTG-HF program is provided by the American Heart Association. GWTG-HF has been funded in the past through support from Amgen, Medtronic, GlaxoSmithKline, Ortho-McNeil, and the American Heart Association Pharmaceutical Roundtable. These sponsors had no role in the study design, data analysis or manuscript preparation and revision.
In an effort to improve the quality of care delivered to heart failure (HF) patients, the Centers for Medicare & Medicaid Services (CMS) publish hospitals’ 30-day risk-standardized mortality rates (RSMRs) for HF.1 These mortality rates are also used by CMS to determine the financial penalties and bonuses that hospitals receive as part of the national Hospital Value-based Purchasing program.2 Whether or not these efforts effectively direct patients towards high-quality providers or motivate hospitals to provide better care, few would disagree with the overarching goal of decreasing the number of patients who die from HF.
However, for some patients with chronic disease at the end of life, goals of care may change. The quality of days lived may become more important than the quantity of days lived. As a consequence, high-quality care for some patients at the end of life is associated with withdrawing life-sustaining or life-extending therapies. Over time, this therapeutic perspective has become more common, with use of hospice care doubling from 23% to 47% between 2000 and 2012 among Medicare beneficiaries who died.3 For a national cohort of older patients admitted with HF—not just those patients who died in that same year—hospitals’ rates of referral to hospice are considerably lower, averaging 2.9% in 2010 in a national study.4 Nevertheless, it is possible that hospitals that more faithfully follow their dying patients’ wishes and withdraw life-prolonging interventions and provide comfort-focused care at the end of life might be unfairly penalized if such efforts resulted in higher mortality rates than other hospitals.
Therefore, we used Medicare data linked to a national HF registry with information about end-of-life care, to address 3 questions: (1) How much do hospitals vary in their rates of early comfort care and how has this changed over time; (2) What hospital and patient factors are associated with higher early comfort care rates; and (3) Is there a correlation between 30-day risk-adjusted mortality rates for HF with hospital rates of early comfort care?
METHODS
Data Sources
We used data from the American Heart Association’s Get With The Guidelines-Heart Failure (GWTG-HF) registry. GWTG-HF is a voluntary, inpatient, quality improvement registry5-7 that uses web-based tools and standard questionnaires to collect data on patients with HF admitted to participating hospitals nationwide. The data include information from admission (eg, sociodemographic characteristics, symptoms, medical history, and initial laboratory and test results), the inpatient stay (eg, therapies), and discharge (eg, discharge destination, whether and when comfort care was initiated). We linked the GWTG-HF registry data to Medicare claims data in order to obtain information about Medicare eligibility and patient comorbidities. Additionally, we used data from the American Hospital Association (2008) for hospital characteristics. Quintiles Real-World & Late Phase Research (Cambridge, MA) serves as the data coordinating center for GWTG-HF and the Duke Clinical Research Institute (Durham, NC) serves as the statistical analytic center. GWTG-HF participating sites have a waiver of informed consent because the data are de-identified and primarily used for quality improvement. All analyses performed on this data have been approved by the Duke Medical Center Institutional Review Board.
Study Population
Study Outcomes
Our outcome of interest was the correlation between a hospital’s rate of initiating early CMO for admitted HF patients and a hospital’s 30-day RSMR for HF. The GWTG-HF questionnaire8 asks “When is the earliest physician/advanced practice nurse/physician assistant documentation of comfort measures only?” and permits 4 responses: day 0 or 1, day 2 or after, timing unclear, or not documented/unable to determine. We defined early CMO as CMO on day 0 or 1, and late/no CMO as any other response. We chose to examine early comfort care because many hospitalized patients transition to comfort care before they die if the death is in any way predictable. Thus, if comfort care is measured at any time during the hospitalization, hospitals that have high mortality rates are likely to have high comfort care rates. Therefore, we chose to use the more precise measure of early comfort care. We created hospital-level, risk-standardized early comfort care rates using the same risk-adjustment model used for RSMRs but with the outcome of early comfort care instead of mortality.9,10
RSMRs were calculated using a validated GWTG-HF 30-day risk-standardized mortality model9 with additional variables identified from other GWTG-HF analyses.10 The 30 days are measured as the 30 days after the index admission date.
Statistical Analyses
We described trends in early comfort care rates over time, from February 17, 2008, to February 17, 2014, using the Cochran-Armitage test for trend. We then grouped hospitals into quintiles based on their unadjusted early comfort care rates. We described patient and hospital characteristics for each quintile, using χ2 tests to test for differences across quintiles for categorical variables and Wilcoxon rank sum tests to assess for differences across quintiles for continuous variables. We then examined the Spearman’s rank correlation between hospitals’ RSMR and risk-adjusted comfort care rates. Finally, we compared hospital-level RSMRs before and after adjusting for early comfort care.
We performed risk-adjustment for these last 2 analyses as follows. For each patient, covariates were obtained from the GWTG-HF registry. Clinical data captured for the index admission were utilized in the risk-adjustment model (for both RSMRs and risk-adjusted comfort care rates). Included covariates were as follows: age (per 10 years); race (black vs non-black); systolic blood pressure at admission ≤170 (per 10 mm Hg); respiratory rate (per 5 respirations/min); heart rate ≤105 (per 10 beats/min); weight ≤100 (per 5 kg); weight >100 (per 5 kg); blood urea nitrogen (per 10 mg/dl); brain natriuretic peptide ≤2000 (per 500 pg/ml); hemoglobin 10-14 (per 1 g/dl); troponin abnormal (vs normal); creatinine ≤1 (per 1 mg/dl); sodium 130-140 (per 5 mEq/l); and chronic obstructive pulmonary disease or asthma.
Hierarchical logistic regression modeling was used to calculate the hospital-specific RSMR. A predicted/expected ratio similar to an observed/expected (O/E) ratio was calculated using the following modifications: (1) instead of the observed (crude) number of deaths, the numerator is the number of deaths predicted by the hierarchical model among a hospital’s patients given the patients’ risk factors and the hospital-specific effect; (2) the denominator is the expected number of deaths among the hospital’s patients given the patients’ risk factors and the average of all hospital-specific effects overall; and (3) the ratio of the numerator and denominator are then multiplied by the observed overall mortality rate (same as O/E). This calculation is the method used by CMS to derive RSMRs.11 Multiple imputation was used to handle missing data in the models; 25 imputed datasets using the fully conditional specification method were created. Patients with missing prior comorbidities were assumed to not have those conditions. Hospital characteristics were not imputed; therefore, for analyses that required construction of risk-adjusted comfort care rates or RSMRs, we excluded 18,867 patients cared for at 82 hospitals missing hospital characteristics. We ran 2 sets of models for risk-adjusted comfort care rates and RSMRs: the first adjusted only for patient characteristics, and the second adjusted for both patient and hospital characteristics. Results from the 2 models were similar, so we present only results from the latter. Variance inflation factors were all <2, indicating the collinearity between covariates was not an issue.
All statistical analyses were performed by using SAS version 9.4 (SAS Institute, Cary, NC). We tested for statistical significance by using 2-tailed tests and considered P values <.05 to be statistically significant.
RESULTS
Of the 272 hospitals included in our final study cohort, the observed median overall rate of early comfort care in this study was 1.9% (25th to 75th percentile: 0.9% to 4.0%); hospitals varied widely in unadjusted early comfort care rates (0.00% to 0.46% in the lowest quintile, and 4.60% to 39.91% in the highest quintile; Table 1).
DISCUSSION
Among a national sample of US hospitals, we found wide variation in how frequently health care providers deliver comfort care within the first 2 days of admission for HF. A minority of hospitals reported no early comfort care on any patients throughout the 6-year study period, but hospitals in the highest quintile initiated early comfort care rates for at least 1 in 20 HF patients. Hospitals that were more likely to initiate early comfort care had a higher proportion of female and white patients and were less likely to have the capacity to deliver aggressive surgical interventions such as heart transplants. Hospital-level 30-day RSMRs were not correlated with rates of early comfort care.
While the appropriate rate of early comfort care for patients hospitalized with HF is unknown, given that the average hospital RSMR is approximately 12% for fee-for-service Medicare patients hospitalized with HF,12 it is surprising that some hospitals initiated early comfort care on none or very few of their HF patients. It is quite possible that many of these hospitals initiated comfort care for some of their patients after 48 hours of hospitalization. We were unable to estimate the average period of time patients received comfort care prior to dying, the degree to which this varies across hospitals or why it might vary, and whether the length of time between comfort care initiation and death is related to satisfaction with end-of-life care. Future research on these topics would help inform providers seeking to deliver better end-of-life care. In this study, we also were unable to estimate how often early comfort care was not initiated because patients had a good prognosis. However, prior studies have suggested low rates of comfort care or hospice referral even among patients at very high estimated mortality risk.4 It is also possible that providers and families had concerns about the ability to accurately prognosticate, although several models have been shown to perform acceptably for patients hospitalized with HF.13
We found that comfort care rates did not increase over time, even though use of hospice care doubled among Medicare beneficiaries between 2000 and 2012. By way of context, cancer—the second leading cause of death in the US—was responsible for 38% of hospice admissions in 2013, whereas heart disease (including but not limited to HF)—the leading cause of death— was responsible for 13% of hospice admissions.14 The 2013 American College of Cardiology Foundation and the American Heart Association guidelines for HF recommend consideration of hospice or palliative care for inpatient and transitional care.15 In future work, it would be important to better understand the drivers behind decisions around comfort care for patients hospitalized with HF.
With regards to the policy implications of our study, we found that on average, adjusting 30-day mortality rates for early comfort care was not associated with a change in hospital mortality rankings. For those hospitals with high comfort care rates, adjusting for comfort care did lower mortality rates, but the change was so small as to be clinically insignificant. CMS’ RSMR for HF excludes patients enrolled in hospice during the 12 months prior to index admission, including the first day of the index admission, acknowledging that death may not be an untoward outcome for such patients.16 Fee-for-service Medicare beneficiaries excluded for hospice enrollment comprised 1.29% of HF admissions from July 2012 to June 201516 and are likely a subset of early comfort care patients in our sample, both because of the inclusiveness of chart review (vs claims-based identification) and because we defined early comfort care as comfort care initiated on day 0 or 1 of hospitalization. Nevertheless, with our data we cannot assess to what degree our findings were due solely to hospice patients excluded from CMS’ current estimates.
Prior research has described the underuse of palliative care among patients with HF17 and the association of palliative care with better patient and family experiences at the end of life.18-20 We add to this literature by describing the epidemiology—prevalence, changes over time, and associated factors—of early comfort care for HF in a national sample of hospitals. This serves as a baseline for future work on end-of-life care among patients hospitalized for HF. Our findings also contribute to ongoing discussion about how best to risk-adjust mortality metrics used to assess hospital quality in pay-for-performance programs. Recent research on stroke and pneumonia based on California data suggests that not accounting for do-not-resuscitate (DNR) status biases hospital mortality rates.21,22 Earlier research examined the impact of adjusting hospital mortality rates for DNR for a broader range of conditions.23,24 We expand this line of inquiry by examining the hospital-level association of early comfort care with mortality rates for HF, utilizing a national, contemporary cohort of inpatient stays. In addition, while studies have found that DNR rates within the first 24 hours of admission are relatively high (median 15.8% for pneumonia; 13.3% for stroke),21,22 comfort care is distinct from DNR.
Our findings should be interpreted in the context of several potential limitations. First, we did not have any information about patient or family wishes regarding end-of-life care, or the exact timing of early comfort care (eg, day 0 or day 1). The initiation of comfort care usually follows conversations about end-of-life care involving a patient, his or her family, and the medical team. Thus, we do not know if low early comfort care rates represent the lack of such a conversation (and thus poor-quality care) or the desire by most patients not to initiate early comfort care (and thus high-quality care). This would be an important area for future research. Second, we included only patients admitted to hospitals that participate in GWTG-HF, a voluntary quality improvement initiative. This may limit the generalizability of our findings, but it is unclear how our sample might bias our findings. Hospitals engaged in quality improvement may be more likely to initiate early comfort care aligned with patients’ wishes; on the other hand, hospitals with advanced surgical capabilities are over-represented in our sample and these hospitals are less likely to initiate early comfort care. Third, we examined associations and cannot make conclusions about causality. Residual measured and unmeasured confounding may influence these findings.
In summary, we found that early comfort care rates for fee-for-service Medicare beneficiaries admitted for HF varies widely among hospitals, but median rates of early comfort care have not changed over time. On average, there was no correlation between hospital-level, 30-day, RSMRs and rates of early comfort care. This suggests that current efforts to lower mortality rates have not had unintended consequences for hospitals that institute early comfort care more commonly than their peers.
Acknowledgments
Dr. Chen and Ms. Cox take responsibility for the integrity of the data and the accuracy of the data analysis. Drs. Chen, Levine, and Hayward are responsible for the study concept and design. Drs. Chen and Fonarow acquired the data. Dr. Chen drafted the manuscript. Drs. Chen, Levin, Hayward, Cox, Fonarow, DeVore, Hernandez, Heidenreich, and Yancy revised the manuscript for important intellectual content. Drs. Chen, Hayward, Cox, and Schulte performed the statistical analysis. Drs. Chen and Fonarow obtained funding for the study. Drs. Hayward and Fonarow supervised the study. The authors thank Bailey Green, MPH, for the research assistance she provided. She was compensated for her work.
Disclosure
Dr. Fonarow reports research support from the National Institutes of Health, and consulting for Amgen, Janssen, Novartis, Medtronic, and St Jude Medical. Dr. DeVore reports research support from the American Heart Association, Amgen, and Novartis, and consulting for Amgen. The other authors have no relevant conflicts of interest. Dr. Chen was supported by a Career Development Grant Award (K08HS020671) from the Agency for Healthcare Research and Quality when the manuscript was being prepared. She currently receives support from the Department of Health and Human Services Office of the Assistant Secretary for Planning and Evaluation for her work there. She also receives support from the Blue Cross Blue Shield of Michigan Foundation’s Investigator Initiated Research Program, the Agency for Healthcare Research and Quality (R01 HS024698), and the National Institute on Aging (P01 AG019783). These funding sources had no role in the preparation, review, or approval of the manuscript. The GWTG-HF program is provided by the American Heart Association. GWTG-HF has been funded in the past through support from Amgen, Medtronic, GlaxoSmithKline, Ortho-McNeil, and the American Heart Association Pharmaceutical Roundtable. These sponsors had no role in the study design, data analysis or manuscript preparation and revision.
1. Centers for Medicare & Medicaid Services. Hospital Compare. https://www.medicare.gov/hospitalcompare/. Accessed on November 27, 2016.
2. Centers for Medicare & Medicaid Services. Hospital Value-based Purchasing. https://www.medicare.gov/hospitalcompare/data/hospital-vbp.html. Accessed August 30, 2017.
3. Medicare Payment Advisory Comission. Report to the Congress: Medicare payment policy. 2014. http://www.medpac.gov/docs/default-source/reports/mar14_entirereport.pdf. Accessed August 31, 2017.
4. Whellan DJ, Cox M, Hernandez AF, et al. Utilization of hospice and predicted mortality risk among older patients hospitalized with heart failure: findings from GWTG-HF. J Card Fail. 2012;18(6):471-477. PubMed
5. Hong Y, LaBresh KA. Overview of the American Heart Association “Get with the Guidelines” programs: coronary heart disease, stroke, and heart failure. Crit Pathw Cardiol. 2006;5(4):179-186. PubMed
6. LaBresh KA, Gliklich R, Liljestrand J, Peto R, Ellrodt AG. Using “get with the guidelines” to improve cardiovascular secondary prevention. Jt Comm J Qual Saf. 2003;29(10):539-550. PubMed
7. Hernandez AF, Fonarow GC, Liang L, et al. Sex and racial differences in the use of implantable cardioverter-defibrillators among patients hospitalized with heart failure. JAMA. 2007;298(13):1525-1532. PubMed
8. Get With The Guidelines-Heart Failure. HF Patient Management Tool, October 2016.
9. Eapen ZJ, Liang L, Fonarow GC, et al. Validated, electronic health record deployable prediction models for assessing patient risk of 30-day rehospitalization and mortality in older heart failure patients. JACC Heart Fail. 2013;1(3):245-251. PubMed
10. Peterson PN, Rumsfeld JS, Liang L, et al. A validated risk score for in-hospital mortality in patients with heart failure from the American Heart Association get with the guidelines program. Circ Cardiovasc Qual Outcomes. 2010;3(1):25-32. PubMed
11. Frequently Asked Questions (FAQs): Implementation and Maintenance of CMS Mortality Measures for AMI & HF. 2007. https://www.cms.gov/Medicare/Quality-Initiatives-Patient-Assessment-Instruments/HospitalQualityInits/downloads/HospitalMortalityAboutAMI_HF.pdf. Accessed August 30, 2017.
12. Suter LG, Li SX, Grady JN, et al. National patterns of risk-standardized mortality and readmission after hospitalization for acute myocardial infarction, heart failure, and pneumonia: update on publicly reported outcomes measures based on the 2013 release. J Gen Intern Med. 2014;29(10):1333-1340. PubMed
13. Lagu T, Pekow PS, Shieh MS, et al. Validation and comparison of seven mortality prediction models for hospitalized patients with acute decompensated heart failure. Circ Heart Fail. Aug 2016;9(8):e002912. PubMed
14. National Hospice and Palliative Care Organization. NHPCO’s facts and figures: hospice care in america. 2015. https://www.nhpco.org/sites/default/files/public/Statistics_Research/2015_Facts_Figures.pdf. Accessed August 30, 2017.
15. Yancy CW, Jessup M, Bozkurt B, et al. 2013 ACCF/AHA guideline for the management of heart failure: executive summary: a report of the American College of Cardiology Foundation/American Heart Association Task Force on practice guidelines. Circulation. 2013;128(16):1810-1852. PubMed
16. Centers for Medicare & Medicaid Services. 2016 Condition-Specific Measures Updates and Specifications Report Hospital-Level 30-Day Risk-Standardized Mortality Measures. https://www.qualitynet.org/dcs/ContentServer?c=Page&pagename=QnetPublic%2FPage%2FQnetTier3&cid=1228774398696. Accessed August 30, 2017.
17. Bakitas M, Macmartin M, Trzepkowski K, et al. Palliative care consultations for heart failure patients: how many, when, and why? J Card Fail. 2013;19(3):193-201. PubMed
18. Wachterman MW, Pilver C, Smith D, Ersek M, Lipsitz SR, Keating NL. Quality of End-of-Life Care Provided to Patients With Different Serious Illnesses. JAMA Intern Med. 2016;176(8):1095-1102. PubMed
19. Wright AA, Zhang B, Ray A, et al. Associations between end-of-life discussions, patient mental health, medical care near death, and caregiver bereavement adjustment. JAMA. 2008;300(14):1665-1673. PubMed
20. Rogers JG, Patel CB, Mentz RJ, et al. Palliative care in heart failure: results of a randomized, controlled clinical trial. J Card Fail. 2016;22(11):940. PubMed
21. Kelly AG, Zahuranec DB, Holloway RG, Morgenstern LB, Burke JF. Variation in do-not-resuscitate orders for patients with ischemic stroke: implications for national hospital comparisons. Stroke. 2014;45(3):822-827. PubMed
22. Walkey AJ, Weinberg J, Wiener RS, Cooke CR, Lindenauer PK. Association of Do-Not-Resuscitate Orders and Hospital Mortality Rate Among Patients With Pneumonia. JAMA Intern Med. 2016;176(1):97-104. PubMed
23. Bardach N, Zhao S, Pantilat S, Johnston SC. Adjustment for do-not-resuscitate orders reverses the apparent in-hospital mortality advantage for minorities. Am J Med. 2005;118(4):400-408. PubMed
24. Tabak YP, Johannes RS, Silber JH, Kurtz SG. Should Do-Not-Resuscitate status be included as a mortality risk adjustor? The impact of DNR variations on performance reporting. Med Care. 2005;43(7):658-666. PubMed
1. Centers for Medicare & Medicaid Services. Hospital Compare. https://www.medicare.gov/hospitalcompare/. Accessed on November 27, 2016.
2. Centers for Medicare & Medicaid Services. Hospital Value-based Purchasing. https://www.medicare.gov/hospitalcompare/data/hospital-vbp.html. Accessed August 30, 2017.
3. Medicare Payment Advisory Comission. Report to the Congress: Medicare payment policy. 2014. http://www.medpac.gov/docs/default-source/reports/mar14_entirereport.pdf. Accessed August 31, 2017.
4. Whellan DJ, Cox M, Hernandez AF, et al. Utilization of hospice and predicted mortality risk among older patients hospitalized with heart failure: findings from GWTG-HF. J Card Fail. 2012;18(6):471-477. PubMed
5. Hong Y, LaBresh KA. Overview of the American Heart Association “Get with the Guidelines” programs: coronary heart disease, stroke, and heart failure. Crit Pathw Cardiol. 2006;5(4):179-186. PubMed
6. LaBresh KA, Gliklich R, Liljestrand J, Peto R, Ellrodt AG. Using “get with the guidelines” to improve cardiovascular secondary prevention. Jt Comm J Qual Saf. 2003;29(10):539-550. PubMed
7. Hernandez AF, Fonarow GC, Liang L, et al. Sex and racial differences in the use of implantable cardioverter-defibrillators among patients hospitalized with heart failure. JAMA. 2007;298(13):1525-1532. PubMed
8. Get With The Guidelines-Heart Failure. HF Patient Management Tool, October 2016.
9. Eapen ZJ, Liang L, Fonarow GC, et al. Validated, electronic health record deployable prediction models for assessing patient risk of 30-day rehospitalization and mortality in older heart failure patients. JACC Heart Fail. 2013;1(3):245-251. PubMed
10. Peterson PN, Rumsfeld JS, Liang L, et al. A validated risk score for in-hospital mortality in patients with heart failure from the American Heart Association get with the guidelines program. Circ Cardiovasc Qual Outcomes. 2010;3(1):25-32. PubMed
11. Frequently Asked Questions (FAQs): Implementation and Maintenance of CMS Mortality Measures for AMI & HF. 2007. https://www.cms.gov/Medicare/Quality-Initiatives-Patient-Assessment-Instruments/HospitalQualityInits/downloads/HospitalMortalityAboutAMI_HF.pdf. Accessed August 30, 2017.
12. Suter LG, Li SX, Grady JN, et al. National patterns of risk-standardized mortality and readmission after hospitalization for acute myocardial infarction, heart failure, and pneumonia: update on publicly reported outcomes measures based on the 2013 release. J Gen Intern Med. 2014;29(10):1333-1340. PubMed
13. Lagu T, Pekow PS, Shieh MS, et al. Validation and comparison of seven mortality prediction models for hospitalized patients with acute decompensated heart failure. Circ Heart Fail. Aug 2016;9(8):e002912. PubMed
14. National Hospice and Palliative Care Organization. NHPCO’s facts and figures: hospice care in america. 2015. https://www.nhpco.org/sites/default/files/public/Statistics_Research/2015_Facts_Figures.pdf. Accessed August 30, 2017.
15. Yancy CW, Jessup M, Bozkurt B, et al. 2013 ACCF/AHA guideline for the management of heart failure: executive summary: a report of the American College of Cardiology Foundation/American Heart Association Task Force on practice guidelines. Circulation. 2013;128(16):1810-1852. PubMed
16. Centers for Medicare & Medicaid Services. 2016 Condition-Specific Measures Updates and Specifications Report Hospital-Level 30-Day Risk-Standardized Mortality Measures. https://www.qualitynet.org/dcs/ContentServer?c=Page&pagename=QnetPublic%2FPage%2FQnetTier3&cid=1228774398696. Accessed August 30, 2017.
17. Bakitas M, Macmartin M, Trzepkowski K, et al. Palliative care consultations for heart failure patients: how many, when, and why? J Card Fail. 2013;19(3):193-201. PubMed
18. Wachterman MW, Pilver C, Smith D, Ersek M, Lipsitz SR, Keating NL. Quality of End-of-Life Care Provided to Patients With Different Serious Illnesses. JAMA Intern Med. 2016;176(8):1095-1102. PubMed
19. Wright AA, Zhang B, Ray A, et al. Associations between end-of-life discussions, patient mental health, medical care near death, and caregiver bereavement adjustment. JAMA. 2008;300(14):1665-1673. PubMed
20. Rogers JG, Patel CB, Mentz RJ, et al. Palliative care in heart failure: results of a randomized, controlled clinical trial. J Card Fail. 2016;22(11):940. PubMed
21. Kelly AG, Zahuranec DB, Holloway RG, Morgenstern LB, Burke JF. Variation in do-not-resuscitate orders for patients with ischemic stroke: implications for national hospital comparisons. Stroke. 2014;45(3):822-827. PubMed
22. Walkey AJ, Weinberg J, Wiener RS, Cooke CR, Lindenauer PK. Association of Do-Not-Resuscitate Orders and Hospital Mortality Rate Among Patients With Pneumonia. JAMA Intern Med. 2016;176(1):97-104. PubMed
23. Bardach N, Zhao S, Pantilat S, Johnston SC. Adjustment for do-not-resuscitate orders reverses the apparent in-hospital mortality advantage for minorities. Am J Med. 2005;118(4):400-408. PubMed
24. Tabak YP, Johannes RS, Silber JH, Kurtz SG. Should Do-Not-Resuscitate status be included as a mortality risk adjustor? The impact of DNR variations on performance reporting. Med Care. 2005;43(7):658-666. PubMed
© 2018 Society of Hospital Medicine
Increasing sepsis survivorship creates new challenges
SAN ANTONIO – , results of a retrospective, single-center analysis suggest.
The number of sepsis survivors at risk for hospital readmission rose substantially in recent years, according to the analysis of 17,256 adult medical and surgical admissions to University of Pennsylvania Health System hospitals between July 1, 2010, and June 30, 2015. The journal Critical Care Medicine published these results online as Mark E. Mikkelsen, MD, was presenting them at the Critical Care Congress sponsored by the Society for Critical Care Medicine.

Over the time period that Dr. Mikkelsen and his colleagues analyzed, the proportion of sepsis hospitalizations more than doubled from 3.9% to 9.4%, while in-hospital mortality rates for sepsis hospitalizations fell from 24.1% to 14.8%. As a result, the proportion of discharged patients at risk for readmission increased from 2.7% to 7.8%, noted Dr. Mikkelsen, associate professor of medicine at the Hospital of the University Of Pennsylvania, Philadelphia.
Thirty-day hospital readmission rates modestly declined from 26.4% to 23.1% over that time period, driven by reduced readmissions among survivors of nonsevere and nonpneumonia sepsis, Dr. Mikkelsen said. This decline in overall sepsis patient readmissions was offset by an increase in emergency department treat-and-release visits. Such visits rose from 2.8% in 2010 to a peak of 5.4% in 2014, Dr. Mikkelsen explained. Generally, readmission rates for severe sepsis patients have not changed over time, he added.
“I anticipate that each and every hospital represented in this room will experience a similar phenomenon,” he said. “Therefore, high quality postdischarge care is in fact urgently needed,” he added. “It is warranted that there is an international spotlight on sepsis beginning in the hospital but now continuing thereafter into the phase of life after sepsis.”
These findings reflect “great sepsis survivorship” and suggest new challenges to address, said Timothy G. Buchman, MD, PhD, editor-in-chief of the Critical Care Medicine and past president of the Society for Critical Care Medicine.
“It’s really extraordinary to see that the efforts that have been made by the Surviving Sepsis campaign have paid off,” Dr. Buchman said in an interview. “Now we need to look much more carefully at both the readmission issues, as well as the consequences of long-term sepsis survivorship, not just on patients, but also on their families.”
Dr. Mikkelsen and a study coauthor received support for article research from the National Institutes of Health.
SOURCE: Meyer N et al. Crit Care Med. 2018 Mar. doi: 10.1097/CCM. 0000000000002872.
SAN ANTONIO – , results of a retrospective, single-center analysis suggest.
The number of sepsis survivors at risk for hospital readmission rose substantially in recent years, according to the analysis of 17,256 adult medical and surgical admissions to University of Pennsylvania Health System hospitals between July 1, 2010, and June 30, 2015. The journal Critical Care Medicine published these results online as Mark E. Mikkelsen, MD, was presenting them at the Critical Care Congress sponsored by the Society for Critical Care Medicine.
Over the time period that Dr. Mikkelsen and his colleagues analyzed, the proportion of sepsis hospitalizations more than doubled from 3.9% to 9.4%, while in-hospital mortality rates for sepsis hospitalizations fell from 24.1% to 14.8%. As a result, the proportion of discharged patients at risk for readmission increased from 2.7% to 7.8%, noted Dr. Mikkelsen, associate professor of medicine at the Hospital of the University Of Pennsylvania, Philadelphia.
Thirty-day hospital readmission rates modestly declined from 26.4% to 23.1% over that time period, driven by reduced readmissions among survivors of nonsevere and nonpneumonia sepsis, Dr. Mikkelsen said. This decline in overall sepsis patient readmissions was offset by an increase in emergency department treat-and-release visits. Such visits rose from 2.8% in 2010 to a peak of 5.4% in 2014, Dr. Mikkelsen explained. Generally, readmission rates for severe sepsis patients have not changed over time, he added.
“I anticipate that each and every hospital represented in this room will experience a similar phenomenon,” he said. “Therefore, high quality postdischarge care is in fact urgently needed,” he added. “It is warranted that there is an international spotlight on sepsis beginning in the hospital but now continuing thereafter into the phase of life after sepsis.”
These findings reflect “great sepsis survivorship” and suggest new challenges to address, said Timothy G. Buchman, MD, PhD, editor-in-chief of the Critical Care Medicine and past president of the Society for Critical Care Medicine.
“It’s really extraordinary to see that the efforts that have been made by the Surviving Sepsis campaign have paid off,” Dr. Buchman said in an interview. “Now we need to look much more carefully at both the readmission issues, as well as the consequences of long-term sepsis survivorship, not just on patients, but also on their families.”
Dr. Mikkelsen and a study coauthor received support for article research from the National Institutes of Health.
SOURCE: Meyer N et al. Crit Care Med. 2018 Mar. doi: 10.1097/CCM. 0000000000002872.
SAN ANTONIO – , results of a retrospective, single-center analysis suggest.
The number of sepsis survivors at risk for hospital readmission rose substantially in recent years, according to the analysis of 17,256 adult medical and surgical admissions to University of Pennsylvania Health System hospitals between July 1, 2010, and June 30, 2015. The journal Critical Care Medicine published these results online as Mark E. Mikkelsen, MD, was presenting them at the Critical Care Congress sponsored by the Society for Critical Care Medicine.
Over the time period that Dr. Mikkelsen and his colleagues analyzed, the proportion of sepsis hospitalizations more than doubled from 3.9% to 9.4%, while in-hospital mortality rates for sepsis hospitalizations fell from 24.1% to 14.8%. As a result, the proportion of discharged patients at risk for readmission increased from 2.7% to 7.8%, noted Dr. Mikkelsen, associate professor of medicine at the Hospital of the University Of Pennsylvania, Philadelphia.
Thirty-day hospital readmission rates modestly declined from 26.4% to 23.1% over that time period, driven by reduced readmissions among survivors of nonsevere and nonpneumonia sepsis, Dr. Mikkelsen said. This decline in overall sepsis patient readmissions was offset by an increase in emergency department treat-and-release visits. Such visits rose from 2.8% in 2010 to a peak of 5.4% in 2014, Dr. Mikkelsen explained. Generally, readmission rates for severe sepsis patients have not changed over time, he added.
“I anticipate that each and every hospital represented in this room will experience a similar phenomenon,” he said. “Therefore, high quality postdischarge care is in fact urgently needed,” he added. “It is warranted that there is an international spotlight on sepsis beginning in the hospital but now continuing thereafter into the phase of life after sepsis.”
These findings reflect “great sepsis survivorship” and suggest new challenges to address, said Timothy G. Buchman, MD, PhD, editor-in-chief of the Critical Care Medicine and past president of the Society for Critical Care Medicine.
“It’s really extraordinary to see that the efforts that have been made by the Surviving Sepsis campaign have paid off,” Dr. Buchman said in an interview. “Now we need to look much more carefully at both the readmission issues, as well as the consequences of long-term sepsis survivorship, not just on patients, but also on their families.”
Dr. Mikkelsen and a study coauthor received support for article research from the National Institutes of Health.
SOURCE: Meyer N et al. Crit Care Med. 2018 Mar. doi: 10.1097/CCM. 0000000000002872.
AT CCC47
Key clinical point: An analysis of one center’s sepsis cases revealed increases in sepsis survivors at risk for hospital readmission and returns of these patients to the hospital via the emergency department.
Major finding: The proportion of medical and surgical discharges at risk for hospital readmission after sepsis grew from 2.7% to 7.8%. The modest decline in 30-day readmission rates was offset by an increase in emergency department treat-and-release visits.
Data source: A retrospective, observational cohort study of more than 17,000 adult medical and surgical admissions in an academic health care system from 2010 to 2015.
Disclosures: The National Institutes of Health supported the work.
Source: Meyer N et al. Crit Care Med. 2018 Mar. doi: 10.1097/CCM.0000000000002872.

Levetiracetam May Be Superior to Phenobarbital for Infantile Epilepsy
Levetiracetam may be a superior initial treatment for infants with nonsyndromic epilepsy, according to a multicenter, prospective, observational study published online ahead of print February 12 in JAMA Pediatrics.
“Our findings suggest that levetiracetam has superior effectiveness, compared with phenobarbital, as initial monotherapy for nonsyndromic epilepsy in infants,” said Zachary Grinspan, MD, Director of the Pediatric Epilepsy Program at Cornell University, New York, and colleagues. “We estimate that for every 100 infants with epilepsy treated with levetiracetam instead of phenobarbital, 44 infants would be free from monotherapy failure instead of 16.”
To evaluate the effectiveness of levetiracetam vs phenobarbital, the researchers conducted the Early Life Epilepsy Study, which included 155 children with nonsyndromic epilepsy. Patient information was obtained from medical records and collected from March 1, 2012, through April 30, 2015. All participants were observed during their first three years of life.
In all, 117 children were treated with levetiracetam, and 38 with phenobarbital. Children treated with levetiracetam were, on average, two months older at seizure onset than were those in the phenobarbital group (5.2 months vs 3.0 months). Infants treated with levetiracetam also tended to begin treatment further from the time of their first seizure and exhibited less developmental delay at the time of epilepsy diagnosis.
Freedom from monotherapy failure was more common in the levetiracetam group than the phenobarbital group (40.2% vs 15.8%).
Outcome information was missing for more infants treated with levetiracetam than those treated with phenobarbital, which could have influenced the analyses, said Dr. Grinspan. The genetic interactions that influence nonsyndromic epilepsy make the latter difficult to study.
Although this study provides information that could benefit patients with infantile epilepsy, more work must be done on the topic, said the investigators. “A prospective clinical trial is needed. Levetiracetam and phenobarbital are both commonly used for infantile-onset epilepsy, indicating community equipoise regarding their relative effectiveness,” they said. “However, the effect size in our analysis was surprisingly large (number needed to treat, 3.5), suggesting that a change in practice could meaningfully improve outcomes.”
—Ian Lacy
Suggested Reading
Grinspan ZM, Shellhaas RA, Coryell J, et al. Comparative effectiveness of levetiracetam vs phenobarbital for infantile epilepsy. JAMA Pediatr. 2018 Feb 12 [Epub ahead of print].
Levetiracetam may be a superior initial treatment for infants with nonsyndromic epilepsy, according to a multicenter, prospective, observational study published online ahead of print February 12 in JAMA Pediatrics.
“Our findings suggest that levetiracetam has superior effectiveness, compared with phenobarbital, as initial monotherapy for nonsyndromic epilepsy in infants,” said Zachary Grinspan, MD, Director of the Pediatric Epilepsy Program at Cornell University, New York, and colleagues. “We estimate that for every 100 infants with epilepsy treated with levetiracetam instead of phenobarbital, 44 infants would be free from monotherapy failure instead of 16.”
To evaluate the effectiveness of levetiracetam vs phenobarbital, the researchers conducted the Early Life Epilepsy Study, which included 155 children with nonsyndromic epilepsy. Patient information was obtained from medical records and collected from March 1, 2012, through April 30, 2015. All participants were observed during their first three years of life.
In all, 117 children were treated with levetiracetam, and 38 with phenobarbital. Children treated with levetiracetam were, on average, two months older at seizure onset than were those in the phenobarbital group (5.2 months vs 3.0 months). Infants treated with levetiracetam also tended to begin treatment further from the time of their first seizure and exhibited less developmental delay at the time of epilepsy diagnosis.
Freedom from monotherapy failure was more common in the levetiracetam group than the phenobarbital group (40.2% vs 15.8%).
Outcome information was missing for more infants treated with levetiracetam than those treated with phenobarbital, which could have influenced the analyses, said Dr. Grinspan. The genetic interactions that influence nonsyndromic epilepsy make the latter difficult to study.
Although this study provides information that could benefit patients with infantile epilepsy, more work must be done on the topic, said the investigators. “A prospective clinical trial is needed. Levetiracetam and phenobarbital are both commonly used for infantile-onset epilepsy, indicating community equipoise regarding their relative effectiveness,” they said. “However, the effect size in our analysis was surprisingly large (number needed to treat, 3.5), suggesting that a change in practice could meaningfully improve outcomes.”
—Ian Lacy
Suggested Reading
Grinspan ZM, Shellhaas RA, Coryell J, et al. Comparative effectiveness of levetiracetam vs phenobarbital for infantile epilepsy. JAMA Pediatr. 2018 Feb 12 [Epub ahead of print].
Levetiracetam may be a superior initial treatment for infants with nonsyndromic epilepsy, according to a multicenter, prospective, observational study published online ahead of print February 12 in JAMA Pediatrics.
“Our findings suggest that levetiracetam has superior effectiveness, compared with phenobarbital, as initial monotherapy for nonsyndromic epilepsy in infants,” said Zachary Grinspan, MD, Director of the Pediatric Epilepsy Program at Cornell University, New York, and colleagues. “We estimate that for every 100 infants with epilepsy treated with levetiracetam instead of phenobarbital, 44 infants would be free from monotherapy failure instead of 16.”
To evaluate the effectiveness of levetiracetam vs phenobarbital, the researchers conducted the Early Life Epilepsy Study, which included 155 children with nonsyndromic epilepsy. Patient information was obtained from medical records and collected from March 1, 2012, through April 30, 2015. All participants were observed during their first three years of life.
In all, 117 children were treated with levetiracetam, and 38 with phenobarbital. Children treated with levetiracetam were, on average, two months older at seizure onset than were those in the phenobarbital group (5.2 months vs 3.0 months). Infants treated with levetiracetam also tended to begin treatment further from the time of their first seizure and exhibited less developmental delay at the time of epilepsy diagnosis.
Freedom from monotherapy failure was more common in the levetiracetam group than the phenobarbital group (40.2% vs 15.8%).
Outcome information was missing for more infants treated with levetiracetam than those treated with phenobarbital, which could have influenced the analyses, said Dr. Grinspan. The genetic interactions that influence nonsyndromic epilepsy make the latter difficult to study.
Although this study provides information that could benefit patients with infantile epilepsy, more work must be done on the topic, said the investigators. “A prospective clinical trial is needed. Levetiracetam and phenobarbital are both commonly used for infantile-onset epilepsy, indicating community equipoise regarding their relative effectiveness,” they said. “However, the effect size in our analysis was surprisingly large (number needed to treat, 3.5), suggesting that a change in practice could meaningfully improve outcomes.”
—Ian Lacy
Suggested Reading
Grinspan ZM, Shellhaas RA, Coryell J, et al. Comparative effectiveness of levetiracetam vs phenobarbital for infantile epilepsy. JAMA Pediatr. 2018 Feb 12 [Epub ahead of print].

No Consensus Treatment for Neurosarcoidosis
NAPLES, FL—Although patients with symptomatic neurosarcoidosis account for approximately 5% to 15% of people with systemic sarcoidosis, making it a rare manifestation of an uncommon disorder, neurosarcoidosis is associated with substantial morbidity and with mortality rates ranging from about 1% to 7%. Steroids can be an effective treatment, but high doses over a long period of time are often required, relapse rates are relatively high, and a significant percentage of cases are refractory to first-line therapy. Additional therapies, including steroid-sparing immunosuppressive agents, show promise. Current evidence is based largely on small series of patients, however, and these treatments remain off-label, according to a presentation given at the 45th Annual Meeting of the Southern Clinical Neurological Society.

In the absence of accepted standards, treatment mainly is informed by small series and anecdotal experiences, said Christopher Eckstein, MD, Assistant Professor of Neurology at the Duke University School of Medicine in Durham, North Carolina. “Nobody really knows exactly what to do,” he said.
A Higher Cutoff for Recurrence
To compensate for this uncertainty, as well as for the lack of robust data, Dr. Eckstein offered clinical treatment strategies based on his own experience and other anecdotal sources. Steroids play a large role in treatment. For acute treatment, corticosteroids are the main first-line therapies and typically are administered in high doses for a long time. “It is not uncommon for me to start patients with clear neurosarcoidosis on 80 mg to 100 mg of prednisone a day, keep them there for four weeks, and then taper down by 10 mg every two weeks until I get to 40 mg,” he said. “Then I take it down by 5 mg every two weeks till I get to about 10 mg. The reason I slow it down is because, once I get [the dosage] to about 40 mg or below it, that is where I tend to see, anecdotally at least, my sarcoid patients relapse.”
For patients with cardiac sarcoidosis who present to Duke, clinicians usually reduce the dosage to 25 mg before patients start to have recurrent symptoms, said Dr. Eckstein. Recurrent symptoms usually do not arise until the dosage goes below approximately 10 mg for patients with pulmonary sarcoidosis. Patients with neurosarcoidosis often require higher doses, however, said Dr. Eckstein. “Frequently, when I hit that 35-mg mark, I do another MRI, and we will see patients who either have recurrence of their symptoms or their enhancement has returned. It is not unusual for patients to be on steroids sometimes up to a year.”
Cases of refractory or recurrent neurosarcoidosis generally are treated with broad-spectrum immunosuppression. Several steroid-sparing agents and mechanisms are available, and their use in neurosarcoidosis is based on case series involving small numbers of patients. The original case series for methotrexate included eight patients, that for mycophenolate included three patients, that for azathioprine included less than 12, that for cyclosporine had 13, and that for TNF-alpha inhibitors such as infliximab and adalimumab included 17.
Dr. Eckstein will often start patients on one of these agents when he is weaning them from a steroid. “I usually do repeat MRIs when I get them around 35–40 mg, when I get them below 20 mg, and then when I get them off prednisone,” he said. “If we see recurrence, or their symptoms start to recur, and we see that they are refractory to steroids alone, we will often add these in.”
These agents are increasingly being added to first-line therapy for neurosarcoidosis, along with prednisone, said Dr. Eckstein. “But I find that enough [patients] are steroid-responsive and do not need things like infliximab that I do not necessarily start them right away.”
Choosing Among Oral Agents
Among the oral therapies, he uses methotrexate most. “I previously used a lot of mycophenolate; however, a recent retrospective comparison found that methotrexate’s recurrence level was much lower than [that for] mycophenolate,” said Dr. Eckstein.
Hydroxychloroquine, which works well in treating mucocutaneous forms of sarcoidosis, does not seem especially effective for neurosarcoidosis, said Dr. Eckstein. He tends not to use cyclosporine often, considering that better tolerated therapies are available. For certain patients, cyclophosphamide is the only therapy that will control neurosarcoidosis, said Dr. Eckstein. These patients tend to be exceptionally refractory. “But generally with cyclophosphamide—with high enough doses for long enough—you can usually suppress it,” he said.
Adalimumab has been assessed mostly as a treatment for myelopathies. Studies suggest it to be effective and easy to tolerate.
Steroid-Sparing Agents Can Be Effective
The steroid-sparing agent that Dr. Eckstein currently uses the most is infliximab, which is administered IV. The patients tend to tolerate it well and have good outcomes. Dr. Eckstein usually starts treatment at the lowest dose he thinks will be efficacious. “Most neurologists have not used a lot of infliximab, but they send people to rheumatology for it,” he said. “I start at 5 mg/kg, I do an induction at day one, day 14, and then four weeks later, followed by maintenance dosing every eight weeks.”
For most of his patients, this regimen is sufficient, although some patients require doses of 8 mg/kg, and others need an infusion at that level every four to six weeks. These regimens are often effective. While such patients are usually on concurrent prednisone, a recent trend is to use concurrent methotrexate to prevent reactions to infliximab. A few patients who receive infliximab plus methotrexate tend to tolerate the combination fairly well, said Dr. Eckstein.
Researchers have studied one nonpharmacologic treatment for neurosarcoidosis: radiotherapy. Dr. Eckstein cited recent case reports that examined low-dose, whole-brain radiation in refractory cases. “This is not something I have any hands-on experience with,” he said. “Most of my patients have responded to one of the other steroid-sparing agents [listed] when they’re refractory. But this is something that may be looked at more in the next several years. If there are people who have a very focal kind of encephalitic nodules, they can [undergo] fractional or focal radiotherapy.”
—Fred Balzac
Suggested Reading
Fritz D, van de Beek D, Brouwer MC. Clinical features, treatment and outcome in neurosarcoidosis: systematic review and meta-analysis. BMC Neurol. 2016;16(1):220-227.
Gelfand JM, Bradshaw MJ, Stern BJ, et al. Infliximab for the treatment of CNS sarcoidosis: a multi-institutional series. Neurology. 2017;89(20):2092-2100.
Ibitoye RT, Wilkins A, Scolding NJ. Neurosarcoidosis: a clinical approach to diagnosis and management. J Neurol. 2017;264(5):1023-1028.
Saidha S, Sotirchos ES, Eckstein C. Etiology of sarcoidosis: does infection play a role? Yale J Biol Med. 2012;85(1):133-141.
Tana C, Wegener S, Borys E, et al. Challenges in the diagnosis and treatment of neurosarcoidosis. Ann Med. 2015;47(7):576-591.
Ungprasert P, Matteson EL. Neurosarcoidosis. Rheum Dis Clin North Am. 2017;43(4):593-606.
Ungprasert P, Crowson CS, Matteson EL. Characteristics and long-term outcome of neurosarcoidosis: a population-based study from 1976-2013. Neuroepidemiology. 2017;48(3-4):87-94.
NAPLES, FL—Although patients with symptomatic neurosarcoidosis account for approximately 5% to 15% of people with systemic sarcoidosis, making it a rare manifestation of an uncommon disorder, neurosarcoidosis is associated with substantial morbidity and with mortality rates ranging from about 1% to 7%. Steroids can be an effective treatment, but high doses over a long period of time are often required, relapse rates are relatively high, and a significant percentage of cases are refractory to first-line therapy. Additional therapies, including steroid-sparing immunosuppressive agents, show promise. Current evidence is based largely on small series of patients, however, and these treatments remain off-label, according to a presentation given at the 45th Annual Meeting of the Southern Clinical Neurological Society.
In the absence of accepted standards, treatment mainly is informed by small series and anecdotal experiences, said Christopher Eckstein, MD, Assistant Professor of Neurology at the Duke University School of Medicine in Durham, North Carolina. “Nobody really knows exactly what to do,” he said.
A Higher Cutoff for Recurrence
To compensate for this uncertainty, as well as for the lack of robust data, Dr. Eckstein offered clinical treatment strategies based on his own experience and other anecdotal sources. Steroids play a large role in treatment. For acute treatment, corticosteroids are the main first-line therapies and typically are administered in high doses for a long time. “It is not uncommon for me to start patients with clear neurosarcoidosis on 80 mg to 100 mg of prednisone a day, keep them there for four weeks, and then taper down by 10 mg every two weeks until I get to 40 mg,” he said. “Then I take it down by 5 mg every two weeks till I get to about 10 mg. The reason I slow it down is because, once I get [the dosage] to about 40 mg or below it, that is where I tend to see, anecdotally at least, my sarcoid patients relapse.”
For patients with cardiac sarcoidosis who present to Duke, clinicians usually reduce the dosage to 25 mg before patients start to have recurrent symptoms, said Dr. Eckstein. Recurrent symptoms usually do not arise until the dosage goes below approximately 10 mg for patients with pulmonary sarcoidosis. Patients with neurosarcoidosis often require higher doses, however, said Dr. Eckstein. “Frequently, when I hit that 35-mg mark, I do another MRI, and we will see patients who either have recurrence of their symptoms or their enhancement has returned. It is not unusual for patients to be on steroids sometimes up to a year.”
Cases of refractory or recurrent neurosarcoidosis generally are treated with broad-spectrum immunosuppression. Several steroid-sparing agents and mechanisms are available, and their use in neurosarcoidosis is based on case series involving small numbers of patients. The original case series for methotrexate included eight patients, that for mycophenolate included three patients, that for azathioprine included less than 12, that for cyclosporine had 13, and that for TNF-alpha inhibitors such as infliximab and adalimumab included 17.
Dr. Eckstein will often start patients on one of these agents when he is weaning them from a steroid. “I usually do repeat MRIs when I get them around 35–40 mg, when I get them below 20 mg, and then when I get them off prednisone,” he said. “If we see recurrence, or their symptoms start to recur, and we see that they are refractory to steroids alone, we will often add these in.”
These agents are increasingly being added to first-line therapy for neurosarcoidosis, along with prednisone, said Dr. Eckstein. “But I find that enough [patients] are steroid-responsive and do not need things like infliximab that I do not necessarily start them right away.”
Choosing Among Oral Agents
Among the oral therapies, he uses methotrexate most. “I previously used a lot of mycophenolate; however, a recent retrospective comparison found that methotrexate’s recurrence level was much lower than [that for] mycophenolate,” said Dr. Eckstein.
Hydroxychloroquine, which works well in treating mucocutaneous forms of sarcoidosis, does not seem especially effective for neurosarcoidosis, said Dr. Eckstein. He tends not to use cyclosporine often, considering that better tolerated therapies are available. For certain patients, cyclophosphamide is the only therapy that will control neurosarcoidosis, said Dr. Eckstein. These patients tend to be exceptionally refractory. “But generally with cyclophosphamide—with high enough doses for long enough—you can usually suppress it,” he said.
Adalimumab has been assessed mostly as a treatment for myelopathies. Studies suggest it to be effective and easy to tolerate.
Steroid-Sparing Agents Can Be Effective
The steroid-sparing agent that Dr. Eckstein currently uses the most is infliximab, which is administered IV. The patients tend to tolerate it well and have good outcomes. Dr. Eckstein usually starts treatment at the lowest dose he thinks will be efficacious. “Most neurologists have not used a lot of infliximab, but they send people to rheumatology for it,” he said. “I start at 5 mg/kg, I do an induction at day one, day 14, and then four weeks later, followed by maintenance dosing every eight weeks.”
For most of his patients, this regimen is sufficient, although some patients require doses of 8 mg/kg, and others need an infusion at that level every four to six weeks. These regimens are often effective. While such patients are usually on concurrent prednisone, a recent trend is to use concurrent methotrexate to prevent reactions to infliximab. A few patients who receive infliximab plus methotrexate tend to tolerate the combination fairly well, said Dr. Eckstein.
Researchers have studied one nonpharmacologic treatment for neurosarcoidosis: radiotherapy. Dr. Eckstein cited recent case reports that examined low-dose, whole-brain radiation in refractory cases. “This is not something I have any hands-on experience with,” he said. “Most of my patients have responded to one of the other steroid-sparing agents [listed] when they’re refractory. But this is something that may be looked at more in the next several years. If there are people who have a very focal kind of encephalitic nodules, they can [undergo] fractional or focal radiotherapy.”
—Fred Balzac
Suggested Reading
Fritz D, van de Beek D, Brouwer MC. Clinical features, treatment and outcome in neurosarcoidosis: systematic review and meta-analysis. BMC Neurol. 2016;16(1):220-227.
Gelfand JM, Bradshaw MJ, Stern BJ, et al. Infliximab for the treatment of CNS sarcoidosis: a multi-institutional series. Neurology. 2017;89(20):2092-2100.
Ibitoye RT, Wilkins A, Scolding NJ. Neurosarcoidosis: a clinical approach to diagnosis and management. J Neurol. 2017;264(5):1023-1028.
Saidha S, Sotirchos ES, Eckstein C. Etiology of sarcoidosis: does infection play a role? Yale J Biol Med. 2012;85(1):133-141.
Tana C, Wegener S, Borys E, et al. Challenges in the diagnosis and treatment of neurosarcoidosis. Ann Med. 2015;47(7):576-591.
Ungprasert P, Matteson EL. Neurosarcoidosis. Rheum Dis Clin North Am. 2017;43(4):593-606.
Ungprasert P, Crowson CS, Matteson EL. Characteristics and long-term outcome of neurosarcoidosis: a population-based study from 1976-2013. Neuroepidemiology. 2017;48(3-4):87-94.
NAPLES, FL—Although patients with symptomatic neurosarcoidosis account for approximately 5% to 15% of people with systemic sarcoidosis, making it a rare manifestation of an uncommon disorder, neurosarcoidosis is associated with substantial morbidity and with mortality rates ranging from about 1% to 7%. Steroids can be an effective treatment, but high doses over a long period of time are often required, relapse rates are relatively high, and a significant percentage of cases are refractory to first-line therapy. Additional therapies, including steroid-sparing immunosuppressive agents, show promise. Current evidence is based largely on small series of patients, however, and these treatments remain off-label, according to a presentation given at the 45th Annual Meeting of the Southern Clinical Neurological Society.
In the absence of accepted standards, treatment mainly is informed by small series and anecdotal experiences, said Christopher Eckstein, MD, Assistant Professor of Neurology at the Duke University School of Medicine in Durham, North Carolina. “Nobody really knows exactly what to do,” he said.
A Higher Cutoff for Recurrence
To compensate for this uncertainty, as well as for the lack of robust data, Dr. Eckstein offered clinical treatment strategies based on his own experience and other anecdotal sources. Steroids play a large role in treatment. For acute treatment, corticosteroids are the main first-line therapies and typically are administered in high doses for a long time. “It is not uncommon for me to start patients with clear neurosarcoidosis on 80 mg to 100 mg of prednisone a day, keep them there for four weeks, and then taper down by 10 mg every two weeks until I get to 40 mg,” he said. “Then I take it down by 5 mg every two weeks till I get to about 10 mg. The reason I slow it down is because, once I get [the dosage] to about 40 mg or below it, that is where I tend to see, anecdotally at least, my sarcoid patients relapse.”
For patients with cardiac sarcoidosis who present to Duke, clinicians usually reduce the dosage to 25 mg before patients start to have recurrent symptoms, said Dr. Eckstein. Recurrent symptoms usually do not arise until the dosage goes below approximately 10 mg for patients with pulmonary sarcoidosis. Patients with neurosarcoidosis often require higher doses, however, said Dr. Eckstein. “Frequently, when I hit that 35-mg mark, I do another MRI, and we will see patients who either have recurrence of their symptoms or their enhancement has returned. It is not unusual for patients to be on steroids sometimes up to a year.”
Cases of refractory or recurrent neurosarcoidosis generally are treated with broad-spectrum immunosuppression. Several steroid-sparing agents and mechanisms are available, and their use in neurosarcoidosis is based on case series involving small numbers of patients. The original case series for methotrexate included eight patients, that for mycophenolate included three patients, that for azathioprine included less than 12, that for cyclosporine had 13, and that for TNF-alpha inhibitors such as infliximab and adalimumab included 17.
Dr. Eckstein will often start patients on one of these agents when he is weaning them from a steroid. “I usually do repeat MRIs when I get them around 35–40 mg, when I get them below 20 mg, and then when I get them off prednisone,” he said. “If we see recurrence, or their symptoms start to recur, and we see that they are refractory to steroids alone, we will often add these in.”
These agents are increasingly being added to first-line therapy for neurosarcoidosis, along with prednisone, said Dr. Eckstein. “But I find that enough [patients] are steroid-responsive and do not need things like infliximab that I do not necessarily start them right away.”
Choosing Among Oral Agents
Among the oral therapies, he uses methotrexate most. “I previously used a lot of mycophenolate; however, a recent retrospective comparison found that methotrexate’s recurrence level was much lower than [that for] mycophenolate,” said Dr. Eckstein.
Hydroxychloroquine, which works well in treating mucocutaneous forms of sarcoidosis, does not seem especially effective for neurosarcoidosis, said Dr. Eckstein. He tends not to use cyclosporine often, considering that better tolerated therapies are available. For certain patients, cyclophosphamide is the only therapy that will control neurosarcoidosis, said Dr. Eckstein. These patients tend to be exceptionally refractory. “But generally with cyclophosphamide—with high enough doses for long enough—you can usually suppress it,” he said.
Adalimumab has been assessed mostly as a treatment for myelopathies. Studies suggest it to be effective and easy to tolerate.
Steroid-Sparing Agents Can Be Effective
The steroid-sparing agent that Dr. Eckstein currently uses the most is infliximab, which is administered IV. The patients tend to tolerate it well and have good outcomes. Dr. Eckstein usually starts treatment at the lowest dose he thinks will be efficacious. “Most neurologists have not used a lot of infliximab, but they send people to rheumatology for it,” he said. “I start at 5 mg/kg, I do an induction at day one, day 14, and then four weeks later, followed by maintenance dosing every eight weeks.”
For most of his patients, this regimen is sufficient, although some patients require doses of 8 mg/kg, and others need an infusion at that level every four to six weeks. These regimens are often effective. While such patients are usually on concurrent prednisone, a recent trend is to use concurrent methotrexate to prevent reactions to infliximab. A few patients who receive infliximab plus methotrexate tend to tolerate the combination fairly well, said Dr. Eckstein.
Researchers have studied one nonpharmacologic treatment for neurosarcoidosis: radiotherapy. Dr. Eckstein cited recent case reports that examined low-dose, whole-brain radiation in refractory cases. “This is not something I have any hands-on experience with,” he said. “Most of my patients have responded to one of the other steroid-sparing agents [listed] when they’re refractory. But this is something that may be looked at more in the next several years. If there are people who have a very focal kind of encephalitic nodules, they can [undergo] fractional or focal radiotherapy.”
—Fred Balzac
Suggested Reading
Fritz D, van de Beek D, Brouwer MC. Clinical features, treatment and outcome in neurosarcoidosis: systematic review and meta-analysis. BMC Neurol. 2016;16(1):220-227.
Gelfand JM, Bradshaw MJ, Stern BJ, et al. Infliximab for the treatment of CNS sarcoidosis: a multi-institutional series. Neurology. 2017;89(20):2092-2100.
Ibitoye RT, Wilkins A, Scolding NJ. Neurosarcoidosis: a clinical approach to diagnosis and management. J Neurol. 2017;264(5):1023-1028.
Saidha S, Sotirchos ES, Eckstein C. Etiology of sarcoidosis: does infection play a role? Yale J Biol Med. 2012;85(1):133-141.
Tana C, Wegener S, Borys E, et al. Challenges in the diagnosis and treatment of neurosarcoidosis. Ann Med. 2015;47(7):576-591.
Ungprasert P, Matteson EL. Neurosarcoidosis. Rheum Dis Clin North Am. 2017;43(4):593-606.
Ungprasert P, Crowson CS, Matteson EL. Characteristics and long-term outcome of neurosarcoidosis: a population-based study from 1976-2013. Neuroepidemiology. 2017;48(3-4):87-94.

Conference News Roundup—American Association for the Advancement of Science
Stretchable Electronics Could Aid Stroke Recovery Treatment
A device designed to be worn on the throat could aid stroke rehabilitation, researchers said.
John A. Rogers, PhD, Louis Simpson and Kimberly Querrey Professor of Materials Science and Engineering, Biomedical Engineering, and Neurological Surgery at Northwestern University in Evanston, Illinois, developed the device in partnership with Shirley Ryan AbilityLab, a research hospital in Chicago. The sensor is the latest in Dr. Rogers’s portfolio of stretchable electronics that are appropriate for use in advanced medical care and portable enough to be worn outside the hospital and during exercise.
Dr. Rogers’s sensors stick directly to the skin, moving with the body and providing measurements, including heart function, muscle activity, and quality of sleep.
“Stretchable electronics allow us to see what is going on inside patients’ bodies at a level traditional wearables simply cannot achieve,” said Dr. Rogers. “The key is to make them as integrated as possible with the human body.”
The new bandage-like throat sensor measures patients’ swallowing ability and patterns of speech. The sensors aid in the diagnosis and treatment of aphasia.
The tools that speech-language pathologists have traditionally used to monitor patients’ speech function, such as microphones, cannot distinguish between patients’ voices and ambient noise.
“Our sensors solve that problem by measuring vibrations of the vocal cords,” Dr. Rogers said. “But they only work when worn directly on the throat, which is a sensitive area of the skin. We developed novel materials for this sensor that bend and stretch with the body, minimizing discomfort to patients.”
Shirley Ryan AbilityLab uses the throat sensor in conjunction with electronic biosensors, also developed in Dr. Rogers’s laboratory, on the legs, arms, and chest to monitor stroke patients’ recovery progress. The intermodal system of sensors streams data wirelessly to clinicians’ phones and computers, providing a quantitative picture of patients’ advanced physical and physiologic responses in real time.“One of the biggest problems we face with stroke patients is that their gains tend to drop off when they leave the hospital,” said Arun Jayaraman, PhD, research scientist at the Shirley Ryan AbilityLab. “With the home monitoring enabled by these sensors, we can intervene at the right time, which could lead to better, faster recoveries for patients.”
Because the sensors are wireless, they eliminate barriers posed by traditional health monitoring devices in clinical settings. Patients can wear them after they leave the hospital, allowing doctors to understand how their patients are functioning in the real world.
“Talking with friends and family at home is a completely different dimension from what we do in therapy,” said Leora Cherney, PhD, research scientist at the Shirley Ryan AbilityLab. “Having a detailed understanding of patients’ communication habits outside of the clinic helps us develop better strategies with our patients to improve their speaking skills and speed up their recovery process.”
Data from the sensors will be presented in a dashboard that is easy for clinicians and patients to understand. It will send alerts when patients are underperforming on a certain metric and allow them to set and track progress toward their goals.
Inhibiting an Enzyme May Aid Memory Creation
Aging or impaired brains can once again form lasting memories if an enzyme that impedes the function of a key gene too strongly is inhibited, according to neurobiologists at the University of California, Irvine.
“What we have discovered is that if we free up that DNA again, now the aging brain can form long-term memories normally,” said senior author Marcelo Wood, PhD, Francisco J. Ayala Chair in Neurobiology and Behavior at the university. “To form a long-term memory, you have to turn specific genes on. In most young brains, that happens easily, but as we get older and our brains get older, we have trouble with that.”
That is because the six feet of DNA spooled into every cell in our bodies has a harder time releasing itself as needed, he explained. Like many body parts, “it is no longer as flexible as it used to be,” said Dr. Wood. The stiffness in this case is due to a molecular brake pad called histone deacetylase 3 (HDAC3), that has become “overeager” in the aged brain and is compacting the material too hard, blocking the release of a gene called Period1, said Dr. Wood. Removing HDAC3 restores flexibility and allows internal cell machinery to access Period1 to begin forming new memories.
Researchers had previously theorized that the loss of transcription and encoding functions in older brains resulted from deteriorating core circadian clocks. But Dr. Wood and his team found that the ability to create lasting memories was linked to a different process—the enzyme blocking the release of Period1—in the hippocampus.
“New drugs targeting HDAC3 could provide an exciting avenue to allow older people to improve memory formation,” said Dr. Wood.
Unaffected Hemisphere Assumes Language Function After Perinatal Stroke
Babies sometimes have stroke around the time of birth. Birth is hard on the brain, as is the change in blood circulation from the mother to the neonate. At least one in 4,000 babies have stroke shortly before, during, or after birth.
But a stroke in a baby, even a big one, does not have the same lasting impact as a stroke in an adult. A study led by investigators at Georgetown University Medical Center in Washington, DC, found that a decade or two after a perinatal stroke damaged the left language side of the brain, affected teenagers and young adults used the right sides of their brains for language.The findings demonstrate how plastic brain function is in infants, said Elissa L. Newport, PhD, Professor of Neurology at Georgetown University School of Medicine, and Director of the Center for Brain Plasticity and Recovery at Georgetown University and MedStar National Rehabilitation Network.Her study found that the 12 individuals studied, aged 12 to 25, who had a left-brain perinatal stroke all used the right side of their brains for language. “Their language is good—normal,” she said.
The only signs of prior damage to their brains are that some participants limp, and many have learned to make their left hands dominant because their right hands had impaired function after stroke. They also have executive function impairments—slightly slower neural processing, for example—that are common in individuals with brain injuries. But basic cognitive functions, like language comprehension and production, are excellent, said Dr. Newport.
Furthermore, imaging studies revealed that language in these participants is based entirely in the right hemisphere, in the region opposite to the normal language areas in the left hemisphere. This result had been recorded in previous research, but earlier findings were inconsistent, perhaps because of the heterogeneity of the types of brain injuries included in those studies, said Dr. Newport. Her research, which was carefully controlled in terms of the types and areas of injury included, suggests that while “these young brains were plastic, meaning they could relocate language to a healthy area, it does not mean that new areas can be located willy-nilly on the right side.
“We believe there are important constraints on where functions can be relocated,” she continued. “There are specific regions that take over when part of the brain is injured, depending on the particular function. Each function, like language or spatial skills, has a particular region that can take over if its primary brain area is injured. This is an important discovery that may have implications in the rehabilitation of adult stroke survivors.”
This finding is consistent with the behavior of young brains, said Dr. Newport. “Imaging shows that children up to about age 4 can process language in both sides of their brains, and then the functions split up: the left side processes sentences, and the right processes emotion in language.”
Dr. Newport and her colleagues are extending their study of brain function after a perinatal stroke to a larger group of participants. They are examining stroke in the left and right hemispheres and also whether brain functions other than language are relocated and where. Her group is also collaborating on studies that may reveal the molecular basis of plasticity in young brains. This information might help promote plasticity in adults with stroke or brain injury.
Why Do We Sleep?
Evidence supports the synaptic homeostasis hypothesis about the function of sleep, said researchers. The debate about sleep’s function has continued for a generation and arose following observations that people and animals sicken and die if they are deprived of sleep.
Chiara Cirelli, MD, PhD, and Giulio Tononi, MD, PhD, psychiatrists at the Center for Sleep and Consciousness in Madison, Wisconsin, proposed the synaptic homeostasis hypothesis in 2003. This hypothesis holds that sleep is the price we pay for brains that are plastic and able to keep learning new things. They subsequently undertook a four-year research effort that could show direct evidence for their theory. The result was published in February 2017 in Science and offered direct visual proof of the hypothesis.
Striking electron-microscope pictures from inside the brains of mice suggest what happens in our own brains every day. Our synapses grow strong and large during the stimulation of daytime, then shrink by nearly 20% while we sleep, thus creating room for more growth and learning the next day.
A large team of researchers sectioned the brains of mice and used a scanning electron microscope to photograph, reconstruct, and analyze two areas of cerebral cortex. They were able to reconstruct 6,920 synapses and measure their size.
The team remained blinded about whether they were analyzing the brain cells of a well-rested mouse or one that had been awake. When they finally correlated the measurements with the amount of sleep the mice had had during the six to eight hours before the image was taken, they found that a few hours of sleep led on average to an 18% decrease in the size of the synapses. These changes occurred in both areas of the cerebral cortex and were proportional to the size of the synapses.
Dr. Cirelli’s laboratory is now looking at new brain areas, and at the brains of young mice, to understand the role that sleep plays in brain development.
Statistics and Neuroscience Can Improve Anesthesiology
Anesthesia is believed to act on the brain, but the standard protocol among anesthesiologists for monitoring and dosing patients during surgery is to rely on indirect signs of arousal, like movement and changes in heart rate and blood pressure. Research in brain science and statistical modeling has allowed Emery N. Brown, MD, PhD, an anesthetist at Massachusetts General Hospital in Boston, to safely give patients less anesthesia, which can be beneficial.
Dr. Brown has developed a theoretical (ie, neuroscientific) and analytical (ie, statistical) understanding of EEG brain wave measurements of patients under general anesthesia. Anesthesia’s effects in the brain produce specific patterns of brain waves, and monitoring them via EEG data can improve care.
“We should use neuroscience and neuroscience paradigms to try to understand what is happening in the brain under general anesthesia,” said Dr. Brown. “It is a neurophysiologic process that affects the brain and CNS, so how can it be that what is being developed in the neuroscience field is not being brought to bear on the question of the brain under anesthesia?”
In numerous papers over more than a decade, Dr. Brown has examined how various anesthesia drugs such as propofol, dexmedetomidine, and sevoflurane interact with various neuronal receptors, affecting circuits in different regions of the brain. Those neurophysiologic effects ultimately give rise to a state of unconsciousness—essentially a reversible coma—characterized by powerful, low-frequency brain waves that overwhelm the normal rhythms that synchronize brain functions such as sensory perception, higher cognition, or motor control.
Understanding anesthesia to this degree allows for practical insights. In a study published in October 2016 in Proceedings of the National Academy of Sciences, for example, Dr. Brown and colleagues showed how stimulating dopamine-producing neurons in the ventral tegmental area of the brain could wake mice up from general anesthesia. The study suggests a way that human patients could be awakened as well, which could lessen side effects, recover normal brain function more rapidly, and help patients move more quickly out of the operating room and into recovery.
In parallel with illuminating the neuroscience of general anesthesia, Dr. Brown has developed statistical methods to analyze EEG measurements in a way that anesthesiologists can apply to patients. Dr. Brown has shown that EEG readings of level of unconsciousness vary in characteristic ways based on the drug, its dose, and the patient’s age.
“The deciphering of how these drugs are acting in the brain turns out to be an important signal-processing question,” said Dr. Brown. “The drugs work by producing oscillations, these oscillations are readily visible in the EEG and change systematically with drug dose, class, and age.”
During every surgery, Dr. Brown uses real-time EEG readings to keep a patient adequately dosed without giving too much anesthetic. While treating an 81-year-old patient with cancer, Dr. Brown was able to administer about one-third of the dose considered necessary. This dose reduction can be especially important for older patients. “We already know you do not have to give older people as much, but it turns out it can be even less,” said Dr. Brown.
Older patients are especially susceptible to problematic side effects when they wake up, including delirium or postoperative cognitive dysfunction. Neuroscientifically informed ways to prevent giving too much anesthesia can help prevent such problems, said Dr. Brown.
As more anesthesiologists acquire knowledge and EEG equipment, the field can move to a model where doctors have a direct view of the patient’s brain when monitoring and maintaining their consciousness during surgery, said Dr. Brown.
Stretchable Electronics Could Aid Stroke Recovery Treatment
A device designed to be worn on the throat could aid stroke rehabilitation, researchers said.
John A. Rogers, PhD, Louis Simpson and Kimberly Querrey Professor of Materials Science and Engineering, Biomedical Engineering, and Neurological Surgery at Northwestern University in Evanston, Illinois, developed the device in partnership with Shirley Ryan AbilityLab, a research hospital in Chicago. The sensor is the latest in Dr. Rogers’s portfolio of stretchable electronics that are appropriate for use in advanced medical care and portable enough to be worn outside the hospital and during exercise.
Dr. Rogers’s sensors stick directly to the skin, moving with the body and providing measurements, including heart function, muscle activity, and quality of sleep.
“Stretchable electronics allow us to see what is going on inside patients’ bodies at a level traditional wearables simply cannot achieve,” said Dr. Rogers. “The key is to make them as integrated as possible with the human body.”
The new bandage-like throat sensor measures patients’ swallowing ability and patterns of speech. The sensors aid in the diagnosis and treatment of aphasia.
The tools that speech-language pathologists have traditionally used to monitor patients’ speech function, such as microphones, cannot distinguish between patients’ voices and ambient noise.
“Our sensors solve that problem by measuring vibrations of the vocal cords,” Dr. Rogers said. “But they only work when worn directly on the throat, which is a sensitive area of the skin. We developed novel materials for this sensor that bend and stretch with the body, minimizing discomfort to patients.”
Shirley Ryan AbilityLab uses the throat sensor in conjunction with electronic biosensors, also developed in Dr. Rogers’s laboratory, on the legs, arms, and chest to monitor stroke patients’ recovery progress. The intermodal system of sensors streams data wirelessly to clinicians’ phones and computers, providing a quantitative picture of patients’ advanced physical and physiologic responses in real time.“One of the biggest problems we face with stroke patients is that their gains tend to drop off when they leave the hospital,” said Arun Jayaraman, PhD, research scientist at the Shirley Ryan AbilityLab. “With the home monitoring enabled by these sensors, we can intervene at the right time, which could lead to better, faster recoveries for patients.”
Because the sensors are wireless, they eliminate barriers posed by traditional health monitoring devices in clinical settings. Patients can wear them after they leave the hospital, allowing doctors to understand how their patients are functioning in the real world.
“Talking with friends and family at home is a completely different dimension from what we do in therapy,” said Leora Cherney, PhD, research scientist at the Shirley Ryan AbilityLab. “Having a detailed understanding of patients’ communication habits outside of the clinic helps us develop better strategies with our patients to improve their speaking skills and speed up their recovery process.”
Data from the sensors will be presented in a dashboard that is easy for clinicians and patients to understand. It will send alerts when patients are underperforming on a certain metric and allow them to set and track progress toward their goals.
Inhibiting an Enzyme May Aid Memory Creation
Aging or impaired brains can once again form lasting memories if an enzyme that impedes the function of a key gene too strongly is inhibited, according to neurobiologists at the University of California, Irvine.
“What we have discovered is that if we free up that DNA again, now the aging brain can form long-term memories normally,” said senior author Marcelo Wood, PhD, Francisco J. Ayala Chair in Neurobiology and Behavior at the university. “To form a long-term memory, you have to turn specific genes on. In most young brains, that happens easily, but as we get older and our brains get older, we have trouble with that.”
That is because the six feet of DNA spooled into every cell in our bodies has a harder time releasing itself as needed, he explained. Like many body parts, “it is no longer as flexible as it used to be,” said Dr. Wood. The stiffness in this case is due to a molecular brake pad called histone deacetylase 3 (HDAC3), that has become “overeager” in the aged brain and is compacting the material too hard, blocking the release of a gene called Period1, said Dr. Wood. Removing HDAC3 restores flexibility and allows internal cell machinery to access Period1 to begin forming new memories.
Researchers had previously theorized that the loss of transcription and encoding functions in older brains resulted from deteriorating core circadian clocks. But Dr. Wood and his team found that the ability to create lasting memories was linked to a different process—the enzyme blocking the release of Period1—in the hippocampus.
“New drugs targeting HDAC3 could provide an exciting avenue to allow older people to improve memory formation,” said Dr. Wood.
Unaffected Hemisphere Assumes Language Function After Perinatal Stroke
Babies sometimes have stroke around the time of birth. Birth is hard on the brain, as is the change in blood circulation from the mother to the neonate. At least one in 4,000 babies have stroke shortly before, during, or after birth.
But a stroke in a baby, even a big one, does not have the same lasting impact as a stroke in an adult. A study led by investigators at Georgetown University Medical Center in Washington, DC, found that a decade or two after a perinatal stroke damaged the left language side of the brain, affected teenagers and young adults used the right sides of their brains for language.The findings demonstrate how plastic brain function is in infants, said Elissa L. Newport, PhD, Professor of Neurology at Georgetown University School of Medicine, and Director of the Center for Brain Plasticity and Recovery at Georgetown University and MedStar National Rehabilitation Network.Her study found that the 12 individuals studied, aged 12 to 25, who had a left-brain perinatal stroke all used the right side of their brains for language. “Their language is good—normal,” she said.
The only signs of prior damage to their brains are that some participants limp, and many have learned to make their left hands dominant because their right hands had impaired function after stroke. They also have executive function impairments—slightly slower neural processing, for example—that are common in individuals with brain injuries. But basic cognitive functions, like language comprehension and production, are excellent, said Dr. Newport.
Furthermore, imaging studies revealed that language in these participants is based entirely in the right hemisphere, in the region opposite to the normal language areas in the left hemisphere. This result had been recorded in previous research, but earlier findings were inconsistent, perhaps because of the heterogeneity of the types of brain injuries included in those studies, said Dr. Newport. Her research, which was carefully controlled in terms of the types and areas of injury included, suggests that while “these young brains were plastic, meaning they could relocate language to a healthy area, it does not mean that new areas can be located willy-nilly on the right side.
“We believe there are important constraints on where functions can be relocated,” she continued. “There are specific regions that take over when part of the brain is injured, depending on the particular function. Each function, like language or spatial skills, has a particular region that can take over if its primary brain area is injured. This is an important discovery that may have implications in the rehabilitation of adult stroke survivors.”
This finding is consistent with the behavior of young brains, said Dr. Newport. “Imaging shows that children up to about age 4 can process language in both sides of their brains, and then the functions split up: the left side processes sentences, and the right processes emotion in language.”
Dr. Newport and her colleagues are extending their study of brain function after a perinatal stroke to a larger group of participants. They are examining stroke in the left and right hemispheres and also whether brain functions other than language are relocated and where. Her group is also collaborating on studies that may reveal the molecular basis of plasticity in young brains. This information might help promote plasticity in adults with stroke or brain injury.
Why Do We Sleep?
Evidence supports the synaptic homeostasis hypothesis about the function of sleep, said researchers. The debate about sleep’s function has continued for a generation and arose following observations that people and animals sicken and die if they are deprived of sleep.
Chiara Cirelli, MD, PhD, and Giulio Tononi, MD, PhD, psychiatrists at the Center for Sleep and Consciousness in Madison, Wisconsin, proposed the synaptic homeostasis hypothesis in 2003. This hypothesis holds that sleep is the price we pay for brains that are plastic and able to keep learning new things. They subsequently undertook a four-year research effort that could show direct evidence for their theory. The result was published in February 2017 in Science and offered direct visual proof of the hypothesis.
Striking electron-microscope pictures from inside the brains of mice suggest what happens in our own brains every day. Our synapses grow strong and large during the stimulation of daytime, then shrink by nearly 20% while we sleep, thus creating room for more growth and learning the next day.
A large team of researchers sectioned the brains of mice and used a scanning electron microscope to photograph, reconstruct, and analyze two areas of cerebral cortex. They were able to reconstruct 6,920 synapses and measure their size.
The team remained blinded about whether they were analyzing the brain cells of a well-rested mouse or one that had been awake. When they finally correlated the measurements with the amount of sleep the mice had had during the six to eight hours before the image was taken, they found that a few hours of sleep led on average to an 18% decrease in the size of the synapses. These changes occurred in both areas of the cerebral cortex and were proportional to the size of the synapses.
Dr. Cirelli’s laboratory is now looking at new brain areas, and at the brains of young mice, to understand the role that sleep plays in brain development.
Statistics and Neuroscience Can Improve Anesthesiology
Anesthesia is believed to act on the brain, but the standard protocol among anesthesiologists for monitoring and dosing patients during surgery is to rely on indirect signs of arousal, like movement and changes in heart rate and blood pressure. Research in brain science and statistical modeling has allowed Emery N. Brown, MD, PhD, an anesthetist at Massachusetts General Hospital in Boston, to safely give patients less anesthesia, which can be beneficial.
Dr. Brown has developed a theoretical (ie, neuroscientific) and analytical (ie, statistical) understanding of EEG brain wave measurements of patients under general anesthesia. Anesthesia’s effects in the brain produce specific patterns of brain waves, and monitoring them via EEG data can improve care.
“We should use neuroscience and neuroscience paradigms to try to understand what is happening in the brain under general anesthesia,” said Dr. Brown. “It is a neurophysiologic process that affects the brain and CNS, so how can it be that what is being developed in the neuroscience field is not being brought to bear on the question of the brain under anesthesia?”
In numerous papers over more than a decade, Dr. Brown has examined how various anesthesia drugs such as propofol, dexmedetomidine, and sevoflurane interact with various neuronal receptors, affecting circuits in different regions of the brain. Those neurophysiologic effects ultimately give rise to a state of unconsciousness—essentially a reversible coma—characterized by powerful, low-frequency brain waves that overwhelm the normal rhythms that synchronize brain functions such as sensory perception, higher cognition, or motor control.
Understanding anesthesia to this degree allows for practical insights. In a study published in October 2016 in Proceedings of the National Academy of Sciences, for example, Dr. Brown and colleagues showed how stimulating dopamine-producing neurons in the ventral tegmental area of the brain could wake mice up from general anesthesia. The study suggests a way that human patients could be awakened as well, which could lessen side effects, recover normal brain function more rapidly, and help patients move more quickly out of the operating room and into recovery.
In parallel with illuminating the neuroscience of general anesthesia, Dr. Brown has developed statistical methods to analyze EEG measurements in a way that anesthesiologists can apply to patients. Dr. Brown has shown that EEG readings of level of unconsciousness vary in characteristic ways based on the drug, its dose, and the patient’s age.
“The deciphering of how these drugs are acting in the brain turns out to be an important signal-processing question,” said Dr. Brown. “The drugs work by producing oscillations, these oscillations are readily visible in the EEG and change systematically with drug dose, class, and age.”
During every surgery, Dr. Brown uses real-time EEG readings to keep a patient adequately dosed without giving too much anesthetic. While treating an 81-year-old patient with cancer, Dr. Brown was able to administer about one-third of the dose considered necessary. This dose reduction can be especially important for older patients. “We already know you do not have to give older people as much, but it turns out it can be even less,” said Dr. Brown.
Older patients are especially susceptible to problematic side effects when they wake up, including delirium or postoperative cognitive dysfunction. Neuroscientifically informed ways to prevent giving too much anesthesia can help prevent such problems, said Dr. Brown.
As more anesthesiologists acquire knowledge and EEG equipment, the field can move to a model where doctors have a direct view of the patient’s brain when monitoring and maintaining their consciousness during surgery, said Dr. Brown.
Stretchable Electronics Could Aid Stroke Recovery Treatment
A device designed to be worn on the throat could aid stroke rehabilitation, researchers said.
John A. Rogers, PhD, Louis Simpson and Kimberly Querrey Professor of Materials Science and Engineering, Biomedical Engineering, and Neurological Surgery at Northwestern University in Evanston, Illinois, developed the device in partnership with Shirley Ryan AbilityLab, a research hospital in Chicago. The sensor is the latest in Dr. Rogers’s portfolio of stretchable electronics that are appropriate for use in advanced medical care and portable enough to be worn outside the hospital and during exercise.
Dr. Rogers’s sensors stick directly to the skin, moving with the body and providing measurements, including heart function, muscle activity, and quality of sleep.
“Stretchable electronics allow us to see what is going on inside patients’ bodies at a level traditional wearables simply cannot achieve,” said Dr. Rogers. “The key is to make them as integrated as possible with the human body.”
The new bandage-like throat sensor measures patients’ swallowing ability and patterns of speech. The sensors aid in the diagnosis and treatment of aphasia.
The tools that speech-language pathologists have traditionally used to monitor patients’ speech function, such as microphones, cannot distinguish between patients’ voices and ambient noise.
“Our sensors solve that problem by measuring vibrations of the vocal cords,” Dr. Rogers said. “But they only work when worn directly on the throat, which is a sensitive area of the skin. We developed novel materials for this sensor that bend and stretch with the body, minimizing discomfort to patients.”
Shirley Ryan AbilityLab uses the throat sensor in conjunction with electronic biosensors, also developed in Dr. Rogers’s laboratory, on the legs, arms, and chest to monitor stroke patients’ recovery progress. The intermodal system of sensors streams data wirelessly to clinicians’ phones and computers, providing a quantitative picture of patients’ advanced physical and physiologic responses in real time.“One of the biggest problems we face with stroke patients is that their gains tend to drop off when they leave the hospital,” said Arun Jayaraman, PhD, research scientist at the Shirley Ryan AbilityLab. “With the home monitoring enabled by these sensors, we can intervene at the right time, which could lead to better, faster recoveries for patients.”
Because the sensors are wireless, they eliminate barriers posed by traditional health monitoring devices in clinical settings. Patients can wear them after they leave the hospital, allowing doctors to understand how their patients are functioning in the real world.
“Talking with friends and family at home is a completely different dimension from what we do in therapy,” said Leora Cherney, PhD, research scientist at the Shirley Ryan AbilityLab. “Having a detailed understanding of patients’ communication habits outside of the clinic helps us develop better strategies with our patients to improve their speaking skills and speed up their recovery process.”
Data from the sensors will be presented in a dashboard that is easy for clinicians and patients to understand. It will send alerts when patients are underperforming on a certain metric and allow them to set and track progress toward their goals.
Inhibiting an Enzyme May Aid Memory Creation
Aging or impaired brains can once again form lasting memories if an enzyme that impedes the function of a key gene too strongly is inhibited, according to neurobiologists at the University of California, Irvine.
“What we have discovered is that if we free up that DNA again, now the aging brain can form long-term memories normally,” said senior author Marcelo Wood, PhD, Francisco J. Ayala Chair in Neurobiology and Behavior at the university. “To form a long-term memory, you have to turn specific genes on. In most young brains, that happens easily, but as we get older and our brains get older, we have trouble with that.”
That is because the six feet of DNA spooled into every cell in our bodies has a harder time releasing itself as needed, he explained. Like many body parts, “it is no longer as flexible as it used to be,” said Dr. Wood. The stiffness in this case is due to a molecular brake pad called histone deacetylase 3 (HDAC3), that has become “overeager” in the aged brain and is compacting the material too hard, blocking the release of a gene called Period1, said Dr. Wood. Removing HDAC3 restores flexibility and allows internal cell machinery to access Period1 to begin forming new memories.
Researchers had previously theorized that the loss of transcription and encoding functions in older brains resulted from deteriorating core circadian clocks. But Dr. Wood and his team found that the ability to create lasting memories was linked to a different process—the enzyme blocking the release of Period1—in the hippocampus.
“New drugs targeting HDAC3 could provide an exciting avenue to allow older people to improve memory formation,” said Dr. Wood.
Unaffected Hemisphere Assumes Language Function After Perinatal Stroke
Babies sometimes have stroke around the time of birth. Birth is hard on the brain, as is the change in blood circulation from the mother to the neonate. At least one in 4,000 babies have stroke shortly before, during, or after birth.
But a stroke in a baby, even a big one, does not have the same lasting impact as a stroke in an adult. A study led by investigators at Georgetown University Medical Center in Washington, DC, found that a decade or two after a perinatal stroke damaged the left language side of the brain, affected teenagers and young adults used the right sides of their brains for language.The findings demonstrate how plastic brain function is in infants, said Elissa L. Newport, PhD, Professor of Neurology at Georgetown University School of Medicine, and Director of the Center for Brain Plasticity and Recovery at Georgetown University and MedStar National Rehabilitation Network.Her study found that the 12 individuals studied, aged 12 to 25, who had a left-brain perinatal stroke all used the right side of their brains for language. “Their language is good—normal,” she said.
The only signs of prior damage to their brains are that some participants limp, and many have learned to make their left hands dominant because their right hands had impaired function after stroke. They also have executive function impairments—slightly slower neural processing, for example—that are common in individuals with brain injuries. But basic cognitive functions, like language comprehension and production, are excellent, said Dr. Newport.
Furthermore, imaging studies revealed that language in these participants is based entirely in the right hemisphere, in the region opposite to the normal language areas in the left hemisphere. This result had been recorded in previous research, but earlier findings were inconsistent, perhaps because of the heterogeneity of the types of brain injuries included in those studies, said Dr. Newport. Her research, which was carefully controlled in terms of the types and areas of injury included, suggests that while “these young brains were plastic, meaning they could relocate language to a healthy area, it does not mean that new areas can be located willy-nilly on the right side.
“We believe there are important constraints on where functions can be relocated,” she continued. “There are specific regions that take over when part of the brain is injured, depending on the particular function. Each function, like language or spatial skills, has a particular region that can take over if its primary brain area is injured. This is an important discovery that may have implications in the rehabilitation of adult stroke survivors.”
This finding is consistent with the behavior of young brains, said Dr. Newport. “Imaging shows that children up to about age 4 can process language in both sides of their brains, and then the functions split up: the left side processes sentences, and the right processes emotion in language.”
Dr. Newport and her colleagues are extending their study of brain function after a perinatal stroke to a larger group of participants. They are examining stroke in the left and right hemispheres and also whether brain functions other than language are relocated and where. Her group is also collaborating on studies that may reveal the molecular basis of plasticity in young brains. This information might help promote plasticity in adults with stroke or brain injury.
Why Do We Sleep?
Evidence supports the synaptic homeostasis hypothesis about the function of sleep, said researchers. The debate about sleep’s function has continued for a generation and arose following observations that people and animals sicken and die if they are deprived of sleep.
Chiara Cirelli, MD, PhD, and Giulio Tononi, MD, PhD, psychiatrists at the Center for Sleep and Consciousness in Madison, Wisconsin, proposed the synaptic homeostasis hypothesis in 2003. This hypothesis holds that sleep is the price we pay for brains that are plastic and able to keep learning new things. They subsequently undertook a four-year research effort that could show direct evidence for their theory. The result was published in February 2017 in Science and offered direct visual proof of the hypothesis.
Striking electron-microscope pictures from inside the brains of mice suggest what happens in our own brains every day. Our synapses grow strong and large during the stimulation of daytime, then shrink by nearly 20% while we sleep, thus creating room for more growth and learning the next day.
A large team of researchers sectioned the brains of mice and used a scanning electron microscope to photograph, reconstruct, and analyze two areas of cerebral cortex. They were able to reconstruct 6,920 synapses and measure their size.
The team remained blinded about whether they were analyzing the brain cells of a well-rested mouse or one that had been awake. When they finally correlated the measurements with the amount of sleep the mice had had during the six to eight hours before the image was taken, they found that a few hours of sleep led on average to an 18% decrease in the size of the synapses. These changes occurred in both areas of the cerebral cortex and were proportional to the size of the synapses.
Dr. Cirelli’s laboratory is now looking at new brain areas, and at the brains of young mice, to understand the role that sleep plays in brain development.
Statistics and Neuroscience Can Improve Anesthesiology
Anesthesia is believed to act on the brain, but the standard protocol among anesthesiologists for monitoring and dosing patients during surgery is to rely on indirect signs of arousal, like movement and changes in heart rate and blood pressure. Research in brain science and statistical modeling has allowed Emery N. Brown, MD, PhD, an anesthetist at Massachusetts General Hospital in Boston, to safely give patients less anesthesia, which can be beneficial.
Dr. Brown has developed a theoretical (ie, neuroscientific) and analytical (ie, statistical) understanding of EEG brain wave measurements of patients under general anesthesia. Anesthesia’s effects in the brain produce specific patterns of brain waves, and monitoring them via EEG data can improve care.
“We should use neuroscience and neuroscience paradigms to try to understand what is happening in the brain under general anesthesia,” said Dr. Brown. “It is a neurophysiologic process that affects the brain and CNS, so how can it be that what is being developed in the neuroscience field is not being brought to bear on the question of the brain under anesthesia?”
In numerous papers over more than a decade, Dr. Brown has examined how various anesthesia drugs such as propofol, dexmedetomidine, and sevoflurane interact with various neuronal receptors, affecting circuits in different regions of the brain. Those neurophysiologic effects ultimately give rise to a state of unconsciousness—essentially a reversible coma—characterized by powerful, low-frequency brain waves that overwhelm the normal rhythms that synchronize brain functions such as sensory perception, higher cognition, or motor control.
Understanding anesthesia to this degree allows for practical insights. In a study published in October 2016 in Proceedings of the National Academy of Sciences, for example, Dr. Brown and colleagues showed how stimulating dopamine-producing neurons in the ventral tegmental area of the brain could wake mice up from general anesthesia. The study suggests a way that human patients could be awakened as well, which could lessen side effects, recover normal brain function more rapidly, and help patients move more quickly out of the operating room and into recovery.
In parallel with illuminating the neuroscience of general anesthesia, Dr. Brown has developed statistical methods to analyze EEG measurements in a way that anesthesiologists can apply to patients. Dr. Brown has shown that EEG readings of level of unconsciousness vary in characteristic ways based on the drug, its dose, and the patient’s age.
“The deciphering of how these drugs are acting in the brain turns out to be an important signal-processing question,” said Dr. Brown. “The drugs work by producing oscillations, these oscillations are readily visible in the EEG and change systematically with drug dose, class, and age.”
During every surgery, Dr. Brown uses real-time EEG readings to keep a patient adequately dosed without giving too much anesthetic. While treating an 81-year-old patient with cancer, Dr. Brown was able to administer about one-third of the dose considered necessary. This dose reduction can be especially important for older patients. “We already know you do not have to give older people as much, but it turns out it can be even less,” said Dr. Brown.
Older patients are especially susceptible to problematic side effects when they wake up, including delirium or postoperative cognitive dysfunction. Neuroscientifically informed ways to prevent giving too much anesthesia can help prevent such problems, said Dr. Brown.
As more anesthesiologists acquire knowledge and EEG equipment, the field can move to a model where doctors have a direct view of the patient’s brain when monitoring and maintaining their consciousness during surgery, said Dr. Brown.