User login
Replacing warfarin with a NOAC in patients on chronic anticoagulation therapy
Hospitalists must consider clinical factors and patient preferences
Case
A 70-year old woman with hypertension, diabetes, nonischemic stroke, moderate renal insufficiency (creatinine clearance [CrCl] 45 mL/min), heart failure, and nonvalvular atrial fibrillation (AF) on warfarin is admitted because of a very supratherapeutic INR. She reports labile INR values despite strict adherence to her medication regimen. Her cancer screening tests had previously been unremarkable. She inquires about the risks and benefits of switching to a novel oral anticoagulant (NOAC) as advertised on television. Should you consider it while she is still in the hospital?
Brief overview of the issue
Lifelong anticoagulation therapy is common among patients with AF or recurrent venous thromboembolism (VTE). Until the advent of NOACs, a great majority of patients were prescribed warfarin, the oral vitamin K antagonist that requires regular blood tests for monitoring of the INR. In contrast to warfarin, NOACs are direct-acting agents (hence also known as “direct oral anticoagulants” or DOACs) that are selective for one specific coagulation factor, either thrombin (e.g., dabigatran) or factor Xa (e.g., rivaroxaban, apixaban, and edoxaban, all with an “X” in their names).

NOACS have been studied and approved by the Food and Drug Administration for nonvalvular AF, i.e., patients without rheumatic mitral stenosis, mechanical or bioprosthetic heart valve, or prior mitral valve repair. Compared to warfarin, NOACS have fewer drug or food interactions, have more predictable pharmacokinetics, and may be associated with reduced risk of major bleeding depending on the agent. The latter is a particularly attractive feature of NOAC therapy, especially when its use is considered among older patients at risk of intracranial hemorrhage (ICH), such as those with previous strokes, ICH, or reduced renal function. Unfortunately, data on the efficacy and safety of the use of NOACs in certain patient populations (e.g., those with severe renal insufficiency, active malignancy, the elderly, patients with suboptimal medication adherence) are generally lacking.
Overview of the data
There are no randomized controlled trials (RCTs) addressing the clinical benefits of switching from warfarin to NOAC therapy. However, based on a number of RCTs comparing warfarin to individual NOACs and their related meta-analyses, the following conclusions may be made about their attributes:
1. Noninferiority to warfarin in reducing the risk of ischemic stroke in AF.
2. Association with a lower rate of major bleeds (statistically significant or trend) and a lower rate of ICH and hemorrhagic strokes compared to warfarin.
3. Association with a higher rate of gastrointestinal bleeding compared to warfarin (except for apixaban, low-dose dabigatran, and edoxaban1).
4. Association with a decreased rate of all stroke and thromboembolism events compared to warfarin.
5. Association with a slightly decreased all-cause mortality in AF compared to warfarin in many studies,2-8 but not all.1,9
6. Noninferiority to warfarin in all-cause mortality in patients with VTE and for its secondary prevention.1,4
NOACS should be used with caution or avoided altogether in patients with severe liver disease or renal insufficiency (see Table 1). 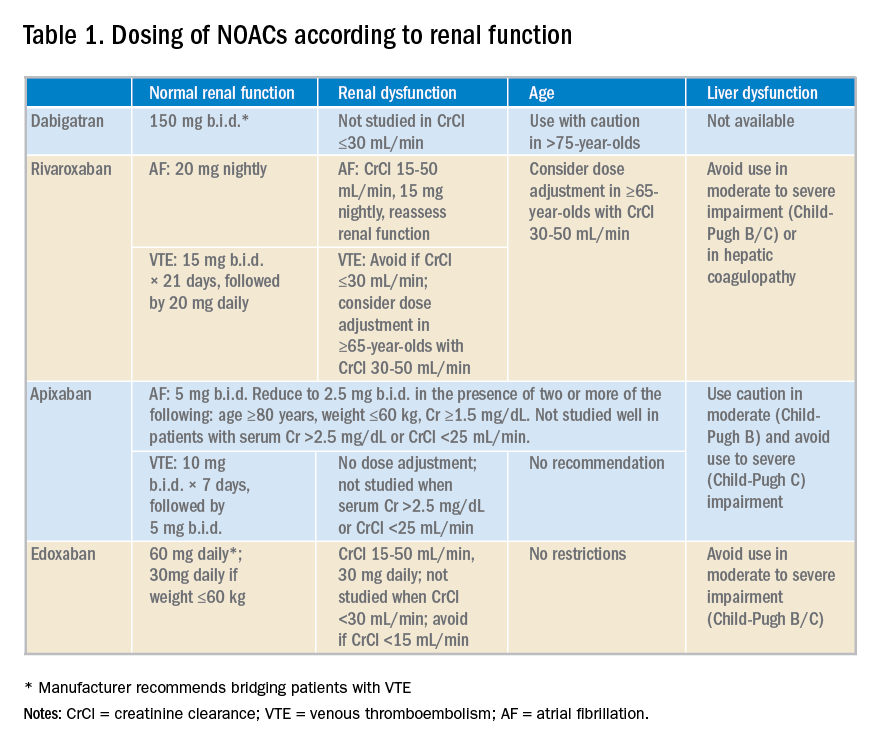
Potential advantages and disadvantages of NOAC therapy are listed in Table 2.
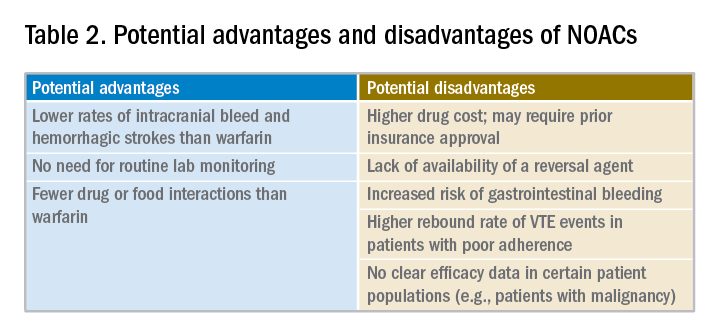
It should be emphasized that in patients with cancer or hypercoagulable state, no clear efficacy or safety data are currently available for the use of NOACs.

The 2016 CHEST guideline on antithrombotic therapy for VTE recommends NOACs over warfarin.10 The 2012 European Society of Cardiology AF guidelines also recommend NOACs over warfarin.11 However, the 2014 American College of Cardiology/American Heart Association/Heart Rhythm Society guidelines on AF state that it is not necessary to change to a NOAC when patients are “stable, easily controlled, and satisfied with warfarin therapy.”12
Data from a relatively small, short-term study examining the safety of switching patients from warfarin to a NOAC suggest that although bleeding events are relatively common (12%) following such a switch, major bleeding and cardiac or cerebrovascular events are rare.10
Application of the data to our original case
Given a high calculated CHADS2VASC score of 8 in our patient, she has a clear indication for anticoagulation for AF. Her history of labile INRs, ischemic stroke, and moderate renal insufficiency place her at high risk for ICH.
A NOAC may reduce this risk but possibly at the expense of an increased risk for a gastrointestinal bleed. More importantly, however, she may be a good candidate for a switch to a NOAC because of her labile INRs despite good medication adherence. Her warfarin can be held while hospitalized and a NOAC may be initiated when the INR falls below 2.

Prior to discharge, potential cost of the drug to the patient should be explored and discussed. It is also important to involve the primary care physician in the decision-making process. Ultimately, selection of an appropriate NOAC should be based on a careful review of its risks and benefits, clinical factors, patient preference, and shared decision making.
Bottom line
Hospitalists are in a great position to discuss a switch to a NOAC in selected patients with history of good medication adherence and labile INRs or ICH risk factors.
Dr. Geisler, Dr. Liao, and Dr. Manian are hospitalists at Massachusetts General Hospital in Boston.
References
1. Sharma M et al. Efficacy and harms of direct oral anticoagulants in the elderly for stroke prevention in atrial fibrillation and secondary prevention of venous thromboembolism: Systematic review and meta-analysis. Circulation. 2015;132(3):194-204.
2. Ruff CT et al. Comparison of the efficacy and safety of new oral anticoagulants with warfarin in patients with atrial fibrillation: A meta-analysis of randomised trials. Lancet. 2014;383(9921):955-62.
3. Dentali F et al. Efficacy and safety of the novel oral anticoagulants in atrial fibrillation: A systematic review and meta-analysis of the literature. Circulation. 2012;126(20):2381-91.
4. Adam SS et al. Comparative effectiveness of warfarin and new oral anticoagulants for the management of atrial fibrillation and venous thromboembolism: A systematic review. Ann Intern Med. 2012;157(11):796-807.
5. Bruins Slot KM and Berge E. Factor Xa inhibitors versus vitamin K antagonists for preventing cerebral or systemic embolism in patients with atrial fibrillation. Cochrane Database Syst Rev. 2013(8):CD008980.
6. Gomez-Outes A et al. Dabigatran, rivaroxaban, or apixaban versus warfarin in patients with nonvalvular atrial fibrillation: A systematic review and meta-analysis of subgroups. Thrombosis. 2013;2013:640723.
7. Miller CS et al. Meta-analysis of efficacy and safety of new oral anticoagulants (dabigatran, rivaroxaban, apixaban) versus warfarin in patients with atrial fibrillation. Am J Cardiol. 2012;110(3):453-60.
8. Baker WL and Phung OJ. Systematic review and adjusted indirect comparison meta-analysis of oral anticoagulants in atrial fibrillation. Circ Cardiovasc Qual Outcomes. 2012;5(5):711-19.
9. Ntaios G et al. Nonvitamin-K-antagonist oral anticoagulants in patients with atrial fibrillation and previous stroke or transient ischemic attack: A systematic review and meta-analysis of randomized controlled trials. Stroke. 2012;43(12):3298-304.
10. Kearon C et al. Antithrombotic therapy for VTE disease: CHEST guideline and expert panel report. Chest. 2016;149(2):315-52.
11. Camm AJ et al. 2012 focused update of the ESC guidelines for the management of atrial fibrillation: an update of the 2010 ESC guidelines for the management of atrial fibrillation – developed with the special contribution of the European Heart Rhythm Association. Europace. 2012;14(10):1385-413.
12. January CT et al. 2014 AHA/ACC/HRS guideline for the management of patients with atrial fibrillation: A report of the American College of Cardiology/American Heart Association task force on practice guidelines and the Heart Rhythm Society. Circulation. 2014;130(23):e199-267.
Quiz
When considering a switch from warfarin to a NOAC, all the following factors should be considered a potential advantage, except:
A. No need for routing lab monitoring.
B. Lower risk of gastrointestinal bleeding.
C. Fewer drug interactions.
D. Lower rates of intracranial bleed and hemorrhagic stroke.
The correct answer is B. NOACs have been associated with lower risk of intracranial bleed and hemorrhagic stroke but not gastrointestinal bleed. Routine lab monitoring is not necessary during their use and they are associated with fewer drug interactions compared to warfarin.
Key Points
- NOACs represent a clear advancement in our anticoagulation armamentarium.
- Potential advantages of their use include lower rates of intracranial bleed and hemorrhagic strokes, fewer drug or food interactions, and lack of need for routing lab monitoring.
- Potential disadvantages of their use include increased rates of gastrointestinal bleed with some agents, general lack of availability of reversal agents, higher drug cost, unsuitability in patients with poor medication compliance, and lack of efficacy data in certain patient populations.
- Decision to switch from warfarin to a NOAC should thoroughly consider its pros and cons, clinical factors, and patient preferences.
Hospitalists must consider clinical factors and patient preferences
Hospitalists must consider clinical factors and patient preferences
Case
A 70-year old woman with hypertension, diabetes, nonischemic stroke, moderate renal insufficiency (creatinine clearance [CrCl] 45 mL/min), heart failure, and nonvalvular atrial fibrillation (AF) on warfarin is admitted because of a very supratherapeutic INR. She reports labile INR values despite strict adherence to her medication regimen. Her cancer screening tests had previously been unremarkable. She inquires about the risks and benefits of switching to a novel oral anticoagulant (NOAC) as advertised on television. Should you consider it while she is still in the hospital?
Brief overview of the issue
Lifelong anticoagulation therapy is common among patients with AF or recurrent venous thromboembolism (VTE). Until the advent of NOACs, a great majority of patients were prescribed warfarin, the oral vitamin K antagonist that requires regular blood tests for monitoring of the INR. In contrast to warfarin, NOACs are direct-acting agents (hence also known as “direct oral anticoagulants” or DOACs) that are selective for one specific coagulation factor, either thrombin (e.g., dabigatran) or factor Xa (e.g., rivaroxaban, apixaban, and edoxaban, all with an “X” in their names).
NOACS have been studied and approved by the Food and Drug Administration for nonvalvular AF, i.e., patients without rheumatic mitral stenosis, mechanical or bioprosthetic heart valve, or prior mitral valve repair. Compared to warfarin, NOACS have fewer drug or food interactions, have more predictable pharmacokinetics, and may be associated with reduced risk of major bleeding depending on the agent. The latter is a particularly attractive feature of NOAC therapy, especially when its use is considered among older patients at risk of intracranial hemorrhage (ICH), such as those with previous strokes, ICH, or reduced renal function. Unfortunately, data on the efficacy and safety of the use of NOACs in certain patient populations (e.g., those with severe renal insufficiency, active malignancy, the elderly, patients with suboptimal medication adherence) are generally lacking.
Overview of the data
There are no randomized controlled trials (RCTs) addressing the clinical benefits of switching from warfarin to NOAC therapy. However, based on a number of RCTs comparing warfarin to individual NOACs and their related meta-analyses, the following conclusions may be made about their attributes:
1. Noninferiority to warfarin in reducing the risk of ischemic stroke in AF.
2. Association with a lower rate of major bleeds (statistically significant or trend) and a lower rate of ICH and hemorrhagic strokes compared to warfarin.
3. Association with a higher rate of gastrointestinal bleeding compared to warfarin (except for apixaban, low-dose dabigatran, and edoxaban1).
4. Association with a decreased rate of all stroke and thromboembolism events compared to warfarin.
5. Association with a slightly decreased all-cause mortality in AF compared to warfarin in many studies,2-8 but not all.1,9
6. Noninferiority to warfarin in all-cause mortality in patients with VTE and for its secondary prevention.1,4
NOACS should be used with caution or avoided altogether in patients with severe liver disease or renal insufficiency (see Table 1).
Potential advantages and disadvantages of NOAC therapy are listed in Table 2.
It should be emphasized that in patients with cancer or hypercoagulable state, no clear efficacy or safety data are currently available for the use of NOACs.
The 2016 CHEST guideline on antithrombotic therapy for VTE recommends NOACs over warfarin.10 The 2012 European Society of Cardiology AF guidelines also recommend NOACs over warfarin.11 However, the 2014 American College of Cardiology/American Heart Association/Heart Rhythm Society guidelines on AF state that it is not necessary to change to a NOAC when patients are “stable, easily controlled, and satisfied with warfarin therapy.”12
Data from a relatively small, short-term study examining the safety of switching patients from warfarin to a NOAC suggest that although bleeding events are relatively common (12%) following such a switch, major bleeding and cardiac or cerebrovascular events are rare.10
Application of the data to our original case
Given a high calculated CHADS2VASC score of 8 in our patient, she has a clear indication for anticoagulation for AF. Her history of labile INRs, ischemic stroke, and moderate renal insufficiency place her at high risk for ICH.
A NOAC may reduce this risk but possibly at the expense of an increased risk for a gastrointestinal bleed. More importantly, however, she may be a good candidate for a switch to a NOAC because of her labile INRs despite good medication adherence. Her warfarin can be held while hospitalized and a NOAC may be initiated when the INR falls below 2.
Prior to discharge, potential cost of the drug to the patient should be explored and discussed. It is also important to involve the primary care physician in the decision-making process. Ultimately, selection of an appropriate NOAC should be based on a careful review of its risks and benefits, clinical factors, patient preference, and shared decision making.
Bottom line
Hospitalists are in a great position to discuss a switch to a NOAC in selected patients with history of good medication adherence and labile INRs or ICH risk factors.
Dr. Geisler, Dr. Liao, and Dr. Manian are hospitalists at Massachusetts General Hospital in Boston.
References
1. Sharma M et al. Efficacy and harms of direct oral anticoagulants in the elderly for stroke prevention in atrial fibrillation and secondary prevention of venous thromboembolism: Systematic review and meta-analysis. Circulation. 2015;132(3):194-204.
2. Ruff CT et al. Comparison of the efficacy and safety of new oral anticoagulants with warfarin in patients with atrial fibrillation: A meta-analysis of randomised trials. Lancet. 2014;383(9921):955-62.
3. Dentali F et al. Efficacy and safety of the novel oral anticoagulants in atrial fibrillation: A systematic review and meta-analysis of the literature. Circulation. 2012;126(20):2381-91.
4. Adam SS et al. Comparative effectiveness of warfarin and new oral anticoagulants for the management of atrial fibrillation and venous thromboembolism: A systematic review. Ann Intern Med. 2012;157(11):796-807.
5. Bruins Slot KM and Berge E. Factor Xa inhibitors versus vitamin K antagonists for preventing cerebral or systemic embolism in patients with atrial fibrillation. Cochrane Database Syst Rev. 2013(8):CD008980.
6. Gomez-Outes A et al. Dabigatran, rivaroxaban, or apixaban versus warfarin in patients with nonvalvular atrial fibrillation: A systematic review and meta-analysis of subgroups. Thrombosis. 2013;2013:640723.
7. Miller CS et al. Meta-analysis of efficacy and safety of new oral anticoagulants (dabigatran, rivaroxaban, apixaban) versus warfarin in patients with atrial fibrillation. Am J Cardiol. 2012;110(3):453-60.
8. Baker WL and Phung OJ. Systematic review and adjusted indirect comparison meta-analysis of oral anticoagulants in atrial fibrillation. Circ Cardiovasc Qual Outcomes. 2012;5(5):711-19.
9. Ntaios G et al. Nonvitamin-K-antagonist oral anticoagulants in patients with atrial fibrillation and previous stroke or transient ischemic attack: A systematic review and meta-analysis of randomized controlled trials. Stroke. 2012;43(12):3298-304.
10. Kearon C et al. Antithrombotic therapy for VTE disease: CHEST guideline and expert panel report. Chest. 2016;149(2):315-52.
11. Camm AJ et al. 2012 focused update of the ESC guidelines for the management of atrial fibrillation: an update of the 2010 ESC guidelines for the management of atrial fibrillation – developed with the special contribution of the European Heart Rhythm Association. Europace. 2012;14(10):1385-413.
12. January CT et al. 2014 AHA/ACC/HRS guideline for the management of patients with atrial fibrillation: A report of the American College of Cardiology/American Heart Association task force on practice guidelines and the Heart Rhythm Society. Circulation. 2014;130(23):e199-267.
Quiz
When considering a switch from warfarin to a NOAC, all the following factors should be considered a potential advantage, except:
A. No need for routing lab monitoring.
B. Lower risk of gastrointestinal bleeding.
C. Fewer drug interactions.
D. Lower rates of intracranial bleed and hemorrhagic stroke.
The correct answer is B. NOACs have been associated with lower risk of intracranial bleed and hemorrhagic stroke but not gastrointestinal bleed. Routine lab monitoring is not necessary during their use and they are associated with fewer drug interactions compared to warfarin.
Key Points
- NOACs represent a clear advancement in our anticoagulation armamentarium.
- Potential advantages of their use include lower rates of intracranial bleed and hemorrhagic strokes, fewer drug or food interactions, and lack of need for routing lab monitoring.
- Potential disadvantages of their use include increased rates of gastrointestinal bleed with some agents, general lack of availability of reversal agents, higher drug cost, unsuitability in patients with poor medication compliance, and lack of efficacy data in certain patient populations.
- Decision to switch from warfarin to a NOAC should thoroughly consider its pros and cons, clinical factors, and patient preferences.
Case
A 70-year old woman with hypertension, diabetes, nonischemic stroke, moderate renal insufficiency (creatinine clearance [CrCl] 45 mL/min), heart failure, and nonvalvular atrial fibrillation (AF) on warfarin is admitted because of a very supratherapeutic INR. She reports labile INR values despite strict adherence to her medication regimen. Her cancer screening tests had previously been unremarkable. She inquires about the risks and benefits of switching to a novel oral anticoagulant (NOAC) as advertised on television. Should you consider it while she is still in the hospital?
Brief overview of the issue
Lifelong anticoagulation therapy is common among patients with AF or recurrent venous thromboembolism (VTE). Until the advent of NOACs, a great majority of patients were prescribed warfarin, the oral vitamin K antagonist that requires regular blood tests for monitoring of the INR. In contrast to warfarin, NOACs are direct-acting agents (hence also known as “direct oral anticoagulants” or DOACs) that are selective for one specific coagulation factor, either thrombin (e.g., dabigatran) or factor Xa (e.g., rivaroxaban, apixaban, and edoxaban, all with an “X” in their names).
NOACS have been studied and approved by the Food and Drug Administration for nonvalvular AF, i.e., patients without rheumatic mitral stenosis, mechanical or bioprosthetic heart valve, or prior mitral valve repair. Compared to warfarin, NOACS have fewer drug or food interactions, have more predictable pharmacokinetics, and may be associated with reduced risk of major bleeding depending on the agent. The latter is a particularly attractive feature of NOAC therapy, especially when its use is considered among older patients at risk of intracranial hemorrhage (ICH), such as those with previous strokes, ICH, or reduced renal function. Unfortunately, data on the efficacy and safety of the use of NOACs in certain patient populations (e.g., those with severe renal insufficiency, active malignancy, the elderly, patients with suboptimal medication adherence) are generally lacking.
Overview of the data
There are no randomized controlled trials (RCTs) addressing the clinical benefits of switching from warfarin to NOAC therapy. However, based on a number of RCTs comparing warfarin to individual NOACs and their related meta-analyses, the following conclusions may be made about their attributes:
1. Noninferiority to warfarin in reducing the risk of ischemic stroke in AF.
2. Association with a lower rate of major bleeds (statistically significant or trend) and a lower rate of ICH and hemorrhagic strokes compared to warfarin.
3. Association with a higher rate of gastrointestinal bleeding compared to warfarin (except for apixaban, low-dose dabigatran, and edoxaban1).
4. Association with a decreased rate of all stroke and thromboembolism events compared to warfarin.
5. Association with a slightly decreased all-cause mortality in AF compared to warfarin in many studies,2-8 but not all.1,9
6. Noninferiority to warfarin in all-cause mortality in patients with VTE and for its secondary prevention.1,4
NOACS should be used with caution or avoided altogether in patients with severe liver disease or renal insufficiency (see Table 1).
Potential advantages and disadvantages of NOAC therapy are listed in Table 2.
It should be emphasized that in patients with cancer or hypercoagulable state, no clear efficacy or safety data are currently available for the use of NOACs.
The 2016 CHEST guideline on antithrombotic therapy for VTE recommends NOACs over warfarin.10 The 2012 European Society of Cardiology AF guidelines also recommend NOACs over warfarin.11 However, the 2014 American College of Cardiology/American Heart Association/Heart Rhythm Society guidelines on AF state that it is not necessary to change to a NOAC when patients are “stable, easily controlled, and satisfied with warfarin therapy.”12
Data from a relatively small, short-term study examining the safety of switching patients from warfarin to a NOAC suggest that although bleeding events are relatively common (12%) following such a switch, major bleeding and cardiac or cerebrovascular events are rare.10
Application of the data to our original case
Given a high calculated CHADS2VASC score of 8 in our patient, she has a clear indication for anticoagulation for AF. Her history of labile INRs, ischemic stroke, and moderate renal insufficiency place her at high risk for ICH.
A NOAC may reduce this risk but possibly at the expense of an increased risk for a gastrointestinal bleed. More importantly, however, she may be a good candidate for a switch to a NOAC because of her labile INRs despite good medication adherence. Her warfarin can be held while hospitalized and a NOAC may be initiated when the INR falls below 2.
Prior to discharge, potential cost of the drug to the patient should be explored and discussed. It is also important to involve the primary care physician in the decision-making process. Ultimately, selection of an appropriate NOAC should be based on a careful review of its risks and benefits, clinical factors, patient preference, and shared decision making.
Bottom line
Hospitalists are in a great position to discuss a switch to a NOAC in selected patients with history of good medication adherence and labile INRs or ICH risk factors.
Dr. Geisler, Dr. Liao, and Dr. Manian are hospitalists at Massachusetts General Hospital in Boston.
References
1. Sharma M et al. Efficacy and harms of direct oral anticoagulants in the elderly for stroke prevention in atrial fibrillation and secondary prevention of venous thromboembolism: Systematic review and meta-analysis. Circulation. 2015;132(3):194-204.
2. Ruff CT et al. Comparison of the efficacy and safety of new oral anticoagulants with warfarin in patients with atrial fibrillation: A meta-analysis of randomised trials. Lancet. 2014;383(9921):955-62.
3. Dentali F et al. Efficacy and safety of the novel oral anticoagulants in atrial fibrillation: A systematic review and meta-analysis of the literature. Circulation. 2012;126(20):2381-91.
4. Adam SS et al. Comparative effectiveness of warfarin and new oral anticoagulants for the management of atrial fibrillation and venous thromboembolism: A systematic review. Ann Intern Med. 2012;157(11):796-807.
5. Bruins Slot KM and Berge E. Factor Xa inhibitors versus vitamin K antagonists for preventing cerebral or systemic embolism in patients with atrial fibrillation. Cochrane Database Syst Rev. 2013(8):CD008980.
6. Gomez-Outes A et al. Dabigatran, rivaroxaban, or apixaban versus warfarin in patients with nonvalvular atrial fibrillation: A systematic review and meta-analysis of subgroups. Thrombosis. 2013;2013:640723.
7. Miller CS et al. Meta-analysis of efficacy and safety of new oral anticoagulants (dabigatran, rivaroxaban, apixaban) versus warfarin in patients with atrial fibrillation. Am J Cardiol. 2012;110(3):453-60.
8. Baker WL and Phung OJ. Systematic review and adjusted indirect comparison meta-analysis of oral anticoagulants in atrial fibrillation. Circ Cardiovasc Qual Outcomes. 2012;5(5):711-19.
9. Ntaios G et al. Nonvitamin-K-antagonist oral anticoagulants in patients with atrial fibrillation and previous stroke or transient ischemic attack: A systematic review and meta-analysis of randomized controlled trials. Stroke. 2012;43(12):3298-304.
10. Kearon C et al. Antithrombotic therapy for VTE disease: CHEST guideline and expert panel report. Chest. 2016;149(2):315-52.
11. Camm AJ et al. 2012 focused update of the ESC guidelines for the management of atrial fibrillation: an update of the 2010 ESC guidelines for the management of atrial fibrillation – developed with the special contribution of the European Heart Rhythm Association. Europace. 2012;14(10):1385-413.
12. January CT et al. 2014 AHA/ACC/HRS guideline for the management of patients with atrial fibrillation: A report of the American College of Cardiology/American Heart Association task force on practice guidelines and the Heart Rhythm Society. Circulation. 2014;130(23):e199-267.
Quiz
When considering a switch from warfarin to a NOAC, all the following factors should be considered a potential advantage, except:
A. No need for routing lab monitoring.
B. Lower risk of gastrointestinal bleeding.
C. Fewer drug interactions.
D. Lower rates of intracranial bleed and hemorrhagic stroke.
The correct answer is B. NOACs have been associated with lower risk of intracranial bleed and hemorrhagic stroke but not gastrointestinal bleed. Routine lab monitoring is not necessary during their use and they are associated with fewer drug interactions compared to warfarin.
Key Points
- NOACs represent a clear advancement in our anticoagulation armamentarium.
- Potential advantages of their use include lower rates of intracranial bleed and hemorrhagic strokes, fewer drug or food interactions, and lack of need for routing lab monitoring.
- Potential disadvantages of their use include increased rates of gastrointestinal bleed with some agents, general lack of availability of reversal agents, higher drug cost, unsuitability in patients with poor medication compliance, and lack of efficacy data in certain patient populations.
- Decision to switch from warfarin to a NOAC should thoroughly consider its pros and cons, clinical factors, and patient preferences.
Childhood change of residence raises psychoses risk in young adults
Children and adolescents who moved longer distances or more frequently before 16 years of age were significantly more likely to develop psychosis in early adulthood than were those with less residential mobility, according to data from about 1.4 million children and adolescents in Sweden.
Data from previous studies have supported a link between childhood residential mobility and subsequent nonaffective psychoses, but no research has addressed the effects in later adolescence and young adulthood until now, wrote Ceri Price of Cardiff (Wales) University and colleagues.
In a study published in JAMA Psychiatry, the researchers reviewed data from a population-based cohort of individuals who were born in Sweden between Jan. 1, 1982, and Dec. 31, 1995, and lived in Sweden at age 16 years. The participants were followed from their 16th birthdays until a diagnosis of a nonaffective psychotic disorder, death, censorship because of emigration, or Dec. 31, 2011 – whichever came first.
Overall, the most sensitive range for an association between moving and psychosis was ages 16-19 years; the adjusted hazard ratio for a nonaffective psychotic disorder was 1.99 for participants who moved each year between ages 16 and 19 years, compared with those who never moved. In addition, moving greater distances before 16 years of age was independently associated with an increased risk of nonaffective psychosis (HR, 1.11) and the data suggested a nonlinear threshold effect when the distance moved exceeded 30 km.
A total of 4,537 individuals had a nonaffective psychotic disorder at a median 21 years of age, and a dose-response relationship emerged between more frequent moves and increased risk of nonaffective psychosis after controlling for confounding variables.
By contrast, a single move in young adulthood was not associated with increased psychosis risk, but moving at least four times during young adulthood was associated with an increased risk (adjusted HR, 1.82).
The study findings were strengthened by the longitudinal design and large population, but they were limited by several factors, including an absence of data on other adverse childhood experiences, such as family discord; peer relationships, such as friendships and bullying; and information on school changes and the disruption of peer relationships, the researchers wrote.
However, the results support the theory that psychosis risk can be affected by the disruption of social networks, peer support, and identity formation that occurs when children and adolescents move, and these results have potential implications for child health services and social policy, they noted.
“It is important that health, social, and educational practitioners ensure that children and adolescents who are newly resident to their neighborhoods receive adequate support to minimize the risks of adverse outcomes during adulthood, and every effort should be made to ensure the effective transfer of care for highly mobile children who are already in contact with health and social services,” they said.
The researchers had no financial conflicts to disclose. The study was supported in part by the Wellcome Trust and the Royal Society.
SOURCE: Price C et al. JAMA Psychiatry. 2018 Aug 22. doi: 10.1001/jamapsychiatry.2018.2233.
Children and adolescents who moved longer distances or more frequently before 16 years of age were significantly more likely to develop psychosis in early adulthood than were those with less residential mobility, according to data from about 1.4 million children and adolescents in Sweden.
Data from previous studies have supported a link between childhood residential mobility and subsequent nonaffective psychoses, but no research has addressed the effects in later adolescence and young adulthood until now, wrote Ceri Price of Cardiff (Wales) University and colleagues.
In a study published in JAMA Psychiatry, the researchers reviewed data from a population-based cohort of individuals who were born in Sweden between Jan. 1, 1982, and Dec. 31, 1995, and lived in Sweden at age 16 years. The participants were followed from their 16th birthdays until a diagnosis of a nonaffective psychotic disorder, death, censorship because of emigration, or Dec. 31, 2011 – whichever came first.
Overall, the most sensitive range for an association between moving and psychosis was ages 16-19 years; the adjusted hazard ratio for a nonaffective psychotic disorder was 1.99 for participants who moved each year between ages 16 and 19 years, compared with those who never moved. In addition, moving greater distances before 16 years of age was independently associated with an increased risk of nonaffective psychosis (HR, 1.11) and the data suggested a nonlinear threshold effect when the distance moved exceeded 30 km.
A total of 4,537 individuals had a nonaffective psychotic disorder at a median 21 years of age, and a dose-response relationship emerged between more frequent moves and increased risk of nonaffective psychosis after controlling for confounding variables.
By contrast, a single move in young adulthood was not associated with increased psychosis risk, but moving at least four times during young adulthood was associated with an increased risk (adjusted HR, 1.82).
The study findings were strengthened by the longitudinal design and large population, but they were limited by several factors, including an absence of data on other adverse childhood experiences, such as family discord; peer relationships, such as friendships and bullying; and information on school changes and the disruption of peer relationships, the researchers wrote.
However, the results support the theory that psychosis risk can be affected by the disruption of social networks, peer support, and identity formation that occurs when children and adolescents move, and these results have potential implications for child health services and social policy, they noted.
“It is important that health, social, and educational practitioners ensure that children and adolescents who are newly resident to their neighborhoods receive adequate support to minimize the risks of adverse outcomes during adulthood, and every effort should be made to ensure the effective transfer of care for highly mobile children who are already in contact with health and social services,” they said.
The researchers had no financial conflicts to disclose. The study was supported in part by the Wellcome Trust and the Royal Society.
SOURCE: Price C et al. JAMA Psychiatry. 2018 Aug 22. doi: 10.1001/jamapsychiatry.2018.2233.
Children and adolescents who moved longer distances or more frequently before 16 years of age were significantly more likely to develop psychosis in early adulthood than were those with less residential mobility, according to data from about 1.4 million children and adolescents in Sweden.
Data from previous studies have supported a link between childhood residential mobility and subsequent nonaffective psychoses, but no research has addressed the effects in later adolescence and young adulthood until now, wrote Ceri Price of Cardiff (Wales) University and colleagues.
In a study published in JAMA Psychiatry, the researchers reviewed data from a population-based cohort of individuals who were born in Sweden between Jan. 1, 1982, and Dec. 31, 1995, and lived in Sweden at age 16 years. The participants were followed from their 16th birthdays until a diagnosis of a nonaffective psychotic disorder, death, censorship because of emigration, or Dec. 31, 2011 – whichever came first.
Overall, the most sensitive range for an association between moving and psychosis was ages 16-19 years; the adjusted hazard ratio for a nonaffective psychotic disorder was 1.99 for participants who moved each year between ages 16 and 19 years, compared with those who never moved. In addition, moving greater distances before 16 years of age was independently associated with an increased risk of nonaffective psychosis (HR, 1.11) and the data suggested a nonlinear threshold effect when the distance moved exceeded 30 km.
A total of 4,537 individuals had a nonaffective psychotic disorder at a median 21 years of age, and a dose-response relationship emerged between more frequent moves and increased risk of nonaffective psychosis after controlling for confounding variables.
By contrast, a single move in young adulthood was not associated with increased psychosis risk, but moving at least four times during young adulthood was associated with an increased risk (adjusted HR, 1.82).
The study findings were strengthened by the longitudinal design and large population, but they were limited by several factors, including an absence of data on other adverse childhood experiences, such as family discord; peer relationships, such as friendships and bullying; and information on school changes and the disruption of peer relationships, the researchers wrote.
However, the results support the theory that psychosis risk can be affected by the disruption of social networks, peer support, and identity formation that occurs when children and adolescents move, and these results have potential implications for child health services and social policy, they noted.
“It is important that health, social, and educational practitioners ensure that children and adolescents who are newly resident to their neighborhoods receive adequate support to minimize the risks of adverse outcomes during adulthood, and every effort should be made to ensure the effective transfer of care for highly mobile children who are already in contact with health and social services,” they said.
The researchers had no financial conflicts to disclose. The study was supported in part by the Wellcome Trust and the Royal Society.
SOURCE: Price C et al. JAMA Psychiatry. 2018 Aug 22. doi: 10.1001/jamapsychiatry.2018.2233.
FROM JAMA PSYCHIATRY
Key clinical point: Clinicians and teachers should ensure that children and adolescents who are new to communities receive support “to minimize the risks of adverse outcomes during adulthood.”
Major finding: Those who moved residentially each year between 16 and 19 years of age were significantly more likely to develop nonaffective psychoses, compared with those who never moved (hazard ratio, 1.99).
Study details: The data come from a prospective cohort study of 1,440,383 youth living in Sweden.
Disclosures: The researchers had no financial conflicts to disclose. The study was supported in part by the Wellcome Trust and the Royal Society.
Source: Price C et al. JAMA Psychiatry. 2018 Aug 22. doi: 10.1001/jamapsychiatry.2018.2233.
Mailing out fecal tests may improve CRC screening rates
Mailing fecal immunochemical tests (FITs) to overdue patients improved the rate of colorectal cancer screening in community health centers, results of a recent randomized trial show.
Outreach by mail led to a 3.4–percentage point increase in completion of FIT, compared with clinics who did not participate in the intervention, according to results of the randomized Strategies and Opportunities to STOP Colon Cancer in Priority Populations (STOP CRC) trial.
Although that difference was statistically significant, investigators said the improvement was less than expected based on previous experience, including a pilot study showing that the strategy of mailing fecal tests boosted completion rates by 38%.
Based on that discrepancy, additional strategies may be needed to support implementation of FIT mailing programs in low-resource health centers, reported Gloria D. Coronado, PhD, Kaiser Permanente Center for Health Research, Portland, Ore., and coinvestigators.
“This work demonstrates that mailed FIT outreach programs can have clinical impact when integrated into clinical work flows, but emphasizes the need to identify additional strategies to support program implementation in low-resource health centers,” Dr. Coronado and coauthors said in JAMA Internal Medicine.
The STOP CRC study included 26 federally qualified health center clinics serving low-income populations in Oregon and California. Investigators identified a total of 41,193 adults overdue for colorectal cancer screening between Feb. 4, 2014 and Feb. 3, 2015.
The core of the intervention was a set of electronic health record–embedded tools that identified adults due for screening and allowed staff to generate letters and mailing labels for a series of three mailings. The first mailing was an introductory letter, the second was a FIT kit packet that included wordless instructions, and the third was a reminder letter.
For clinics that participated in the intervention, the rate of FIT completion was 13.9%, versus 10.4%, a difference that was statistically significant (95% confidence interval, 0.1%-6.8%; P = .047), according to investigators. Likewise, the proportion of participants completing any CRC screening was significantly higher in the intervention clinics (18.3% versus 14.5%; 3.8 percentage points difference; 95% CI, 0.6%-7.0%; P = .024).
Somewhat larger effects were seen in an analysis that accounted for delays in implementation of the program. In that analysis, FIT completion rates were 17.6% for the intervention clinics and 12.8% for the usual care clinics (95% CI, 0.9-8.6%; P = .020), with similar increases seen in the proportion of patients receiving any CRC screening.
These increases in screening occurred despite “relatively low” implementation of the program, Dr. Coronado and colleagues said.
In the pilot study, a concerted effort was made to ensure all eligible adults got the intervention; in this study, 6,925 out of 21,134 intervention participants (33%) got an introductory letter, and of those, 91% received the FIT and 59% got the reminder letter.
Implementation varied widely by health center, ranging from 6.5% to 68.2%, investigators said in their report.
One reason for low implementation may be that the program competed with other priorities in the clinics. In interviews, health center leaders said challenges in the clinic included time burden, limited organizational capacity, and challenges with the EHR and associated reporting tools.
“For most participating health centers, STOP CRC represented the first time EHR tools were used to deliver cancer screening services outside the clinic,” Dr. Coronado said. “Implementation might have increased with experience.”
The research reported by Dr. Coronado and coinvestigators was supported by the National Institutes of Health. Dr. Coronado reported serving as a coinvestigator on a study of an experimental blood test for colorectal cancer funded by EpiGenomics and as principal investigator on a study of an experimental FIT funded by Quidel Corporation. No other disclosures were reported.
SOURCE: Coronado GD et al. JAMA Intern Med. 2018 Aug 6. doi: 10.1001/jamainternmed.2018.3629.
Mailing fecal immunochemical tests (FITs) to overdue patients improved the rate of colorectal cancer screening in community health centers, results of a recent randomized trial show.
Outreach by mail led to a 3.4–percentage point increase in completion of FIT, compared with clinics who did not participate in the intervention, according to results of the randomized Strategies and Opportunities to STOP Colon Cancer in Priority Populations (STOP CRC) trial.
Although that difference was statistically significant, investigators said the improvement was less than expected based on previous experience, including a pilot study showing that the strategy of mailing fecal tests boosted completion rates by 38%.
Based on that discrepancy, additional strategies may be needed to support implementation of FIT mailing programs in low-resource health centers, reported Gloria D. Coronado, PhD, Kaiser Permanente Center for Health Research, Portland, Ore., and coinvestigators.
“This work demonstrates that mailed FIT outreach programs can have clinical impact when integrated into clinical work flows, but emphasizes the need to identify additional strategies to support program implementation in low-resource health centers,” Dr. Coronado and coauthors said in JAMA Internal Medicine.
The STOP CRC study included 26 federally qualified health center clinics serving low-income populations in Oregon and California. Investigators identified a total of 41,193 adults overdue for colorectal cancer screening between Feb. 4, 2014 and Feb. 3, 2015.
The core of the intervention was a set of electronic health record–embedded tools that identified adults due for screening and allowed staff to generate letters and mailing labels for a series of three mailings. The first mailing was an introductory letter, the second was a FIT kit packet that included wordless instructions, and the third was a reminder letter.
For clinics that participated in the intervention, the rate of FIT completion was 13.9%, versus 10.4%, a difference that was statistically significant (95% confidence interval, 0.1%-6.8%; P = .047), according to investigators. Likewise, the proportion of participants completing any CRC screening was significantly higher in the intervention clinics (18.3% versus 14.5%; 3.8 percentage points difference; 95% CI, 0.6%-7.0%; P = .024).
Somewhat larger effects were seen in an analysis that accounted for delays in implementation of the program. In that analysis, FIT completion rates were 17.6% for the intervention clinics and 12.8% for the usual care clinics (95% CI, 0.9-8.6%; P = .020), with similar increases seen in the proportion of patients receiving any CRC screening.
These increases in screening occurred despite “relatively low” implementation of the program, Dr. Coronado and colleagues said.
In the pilot study, a concerted effort was made to ensure all eligible adults got the intervention; in this study, 6,925 out of 21,134 intervention participants (33%) got an introductory letter, and of those, 91% received the FIT and 59% got the reminder letter.
Implementation varied widely by health center, ranging from 6.5% to 68.2%, investigators said in their report.
One reason for low implementation may be that the program competed with other priorities in the clinics. In interviews, health center leaders said challenges in the clinic included time burden, limited organizational capacity, and challenges with the EHR and associated reporting tools.
“For most participating health centers, STOP CRC represented the first time EHR tools were used to deliver cancer screening services outside the clinic,” Dr. Coronado said. “Implementation might have increased with experience.”
The research reported by Dr. Coronado and coinvestigators was supported by the National Institutes of Health. Dr. Coronado reported serving as a coinvestigator on a study of an experimental blood test for colorectal cancer funded by EpiGenomics and as principal investigator on a study of an experimental FIT funded by Quidel Corporation. No other disclosures were reported.
SOURCE: Coronado GD et al. JAMA Intern Med. 2018 Aug 6. doi: 10.1001/jamainternmed.2018.3629.
Mailing fecal immunochemical tests (FITs) to overdue patients improved the rate of colorectal cancer screening in community health centers, results of a recent randomized trial show.
Outreach by mail led to a 3.4–percentage point increase in completion of FIT, compared with clinics who did not participate in the intervention, according to results of the randomized Strategies and Opportunities to STOP Colon Cancer in Priority Populations (STOP CRC) trial.
Although that difference was statistically significant, investigators said the improvement was less than expected based on previous experience, including a pilot study showing that the strategy of mailing fecal tests boosted completion rates by 38%.
Based on that discrepancy, additional strategies may be needed to support implementation of FIT mailing programs in low-resource health centers, reported Gloria D. Coronado, PhD, Kaiser Permanente Center for Health Research, Portland, Ore., and coinvestigators.
“This work demonstrates that mailed FIT outreach programs can have clinical impact when integrated into clinical work flows, but emphasizes the need to identify additional strategies to support program implementation in low-resource health centers,” Dr. Coronado and coauthors said in JAMA Internal Medicine.
The STOP CRC study included 26 federally qualified health center clinics serving low-income populations in Oregon and California. Investigators identified a total of 41,193 adults overdue for colorectal cancer screening between Feb. 4, 2014 and Feb. 3, 2015.
The core of the intervention was a set of electronic health record–embedded tools that identified adults due for screening and allowed staff to generate letters and mailing labels for a series of three mailings. The first mailing was an introductory letter, the second was a FIT kit packet that included wordless instructions, and the third was a reminder letter.
For clinics that participated in the intervention, the rate of FIT completion was 13.9%, versus 10.4%, a difference that was statistically significant (95% confidence interval, 0.1%-6.8%; P = .047), according to investigators. Likewise, the proportion of participants completing any CRC screening was significantly higher in the intervention clinics (18.3% versus 14.5%; 3.8 percentage points difference; 95% CI, 0.6%-7.0%; P = .024).
Somewhat larger effects were seen in an analysis that accounted for delays in implementation of the program. In that analysis, FIT completion rates were 17.6% for the intervention clinics and 12.8% for the usual care clinics (95% CI, 0.9-8.6%; P = .020), with similar increases seen in the proportion of patients receiving any CRC screening.
These increases in screening occurred despite “relatively low” implementation of the program, Dr. Coronado and colleagues said.
In the pilot study, a concerted effort was made to ensure all eligible adults got the intervention; in this study, 6,925 out of 21,134 intervention participants (33%) got an introductory letter, and of those, 91% received the FIT and 59% got the reminder letter.
Implementation varied widely by health center, ranging from 6.5% to 68.2%, investigators said in their report.
One reason for low implementation may be that the program competed with other priorities in the clinics. In interviews, health center leaders said challenges in the clinic included time burden, limited organizational capacity, and challenges with the EHR and associated reporting tools.
“For most participating health centers, STOP CRC represented the first time EHR tools were used to deliver cancer screening services outside the clinic,” Dr. Coronado said. “Implementation might have increased with experience.”
The research reported by Dr. Coronado and coinvestigators was supported by the National Institutes of Health. Dr. Coronado reported serving as a coinvestigator on a study of an experimental blood test for colorectal cancer funded by EpiGenomics and as principal investigator on a study of an experimental FIT funded by Quidel Corporation. No other disclosures were reported.
SOURCE: Coronado GD et al. JAMA Intern Med. 2018 Aug 6. doi: 10.1001/jamainternmed.2018.3629.
FROM JAMA INTERNAL MEDICINE
Key clinical point: Mailing fecal immunochemical tests (FITs) to overdue patients improved the rate of colorectal cancer screening, though not to the extent that had been seen in a pilot study.
Major finding: Outreach by mail led to a 3.4–percentage point increase in FIT completion for participating clinics versus clinics that implemented usual care.
Study details: STOP CRC, a cluster-randomized pragmatic clinical trial including 26 federally qualified health center clinics and a total of 41,193 adults overdue for colorectal cancer screening.
Disclosures: The research was supported by the National Institutes of Health. One investigator reported disclosures related to EpiGenomics and Quidel Corporation.
Source: Coronado GD et al. JAMA Intern Med. 2018 Aug 6. doi: 10.1001/jamainternmed.2018.3629.
High autonomic dysfunction distinguishes persistent posttraumatic headache
SAN FRANCISCO – Symptoms of autonomic dysfunction are significantly greater in patients with persistent posttraumatic headache than in migraine, raising the welcome possibility that this characteristic might serve to reliably differentiate the two disorders, Levi Howard, MD, said at the annual meeting of the American Headache Society.
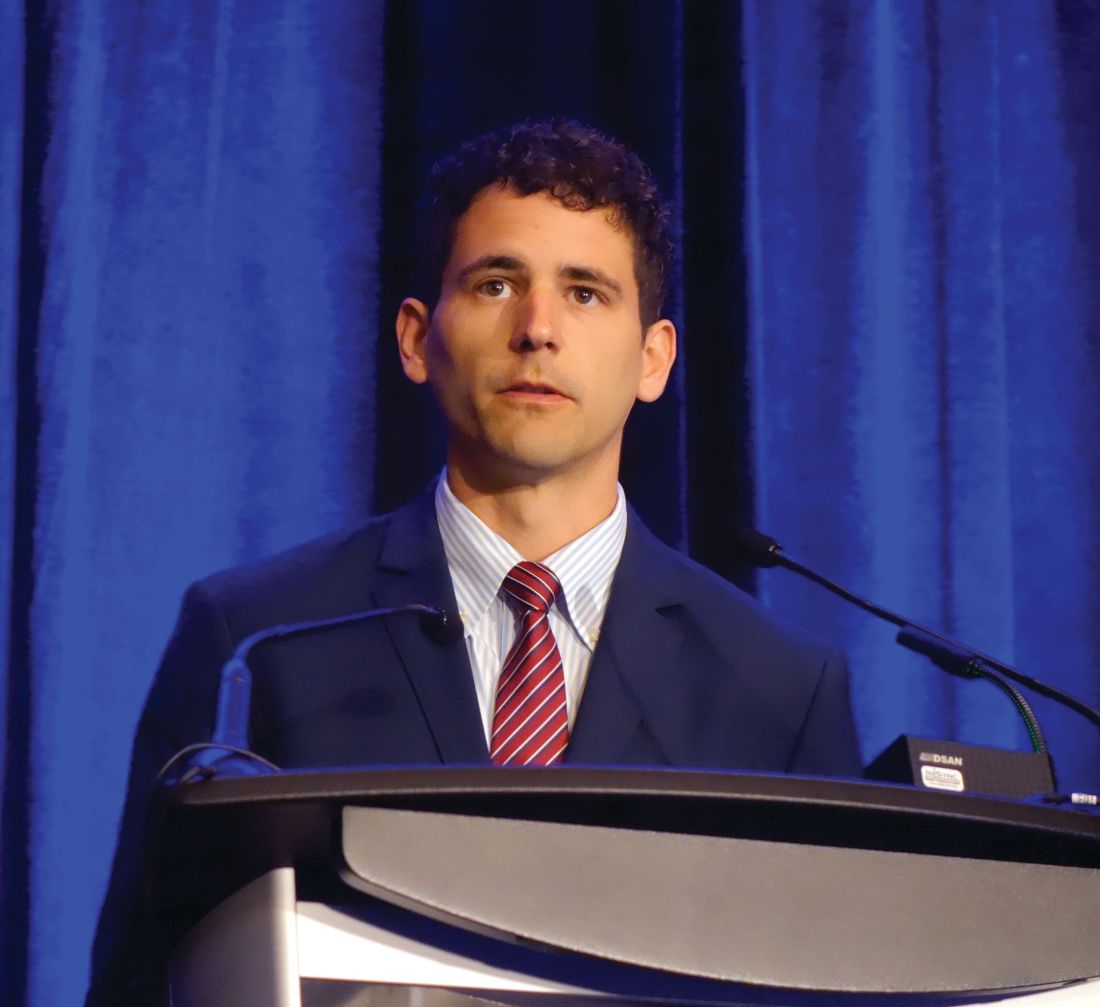
“Interestingly enough, in looking at other studies evaluating dysautonomia, the [autonomic dysfunction scores] in our persistent posttraumatic headache group were on a par with scores previously reported for patients with diseases such as small-fiber polyneuropathy and postural orthostatic tachycardia syndrome,” observed Dr. Howard, an active duty military physician assigned to obtain neurology training at the Mayo Clinic Arizona in Phoenix.
“This brings up two questions: Do autonomic symptoms contribute to accurate classification of persistent posttraumatic headache versus migraine? And if we treat this autonomic dysfunction, does the headache also improve? In our clinical observation, this appears to be the case,” he continued.
Right now, posttraumatic headache (PTH) is defined on the basis of its temporal relationship to head injury. At this time, PTH has no defining clinical characteristics, although most often it has a phenotype that meets diagnostic criteria for migraine.
However, Dr. Howard and his coinvestigators have observed anecdotally in clinical practice that persistent PTH – defined as PTH lasting longer than 3 months – is often accompanied by orthostatic intolerance. This observation, coupled with reports in multiple prior studies that dysautonomia is common in patients with mild traumatic brain injury (TBI) and postconcussion syndrome, prompted Dr. Howard and his coworkers to conduct a cross-sectional cohort study. It included 56 patients with persistent PTH due to mild TBI, 30 patients with migraine, and 36 healthy controls. Most of the persistent PTH group were military veterans with mild TBI due to blast injuries.
All subjects were assessed for autonomic dysfunction using the well-validated COMPASS-31 questionnaire. This instrument assesses six domains of autonomic function: orthostatic intolerance, bladder, gastrointestinal, vasomotor, secretomotor, and pupillomotor.
Scores in each of the six domains were numerically higher in the persistent PTH group, with the differences achieving statistical significance in the orthostatic intolerance and bladder domains.
Of note, the migraine group had a greater headache burden, with a mean 23-year headache history, compared with 10.56 years in the persistent PTH group. The migraine patients also averaged 21.1 headache days per month, versus 16.2 in the persistent PTH group. Yet the investigators found no strong association between autonomic dysfunction and headache burden as reflected in headache duration or headache days per month.
The study was funded by the Department of Defense. Dr. Howard reported having no financial conflicts of interest.
SOURCE: Howard L et al. AHS 2018, Abstract FHM03.
SAN FRANCISCO – Symptoms of autonomic dysfunction are significantly greater in patients with persistent posttraumatic headache than in migraine, raising the welcome possibility that this characteristic might serve to reliably differentiate the two disorders, Levi Howard, MD, said at the annual meeting of the American Headache Society.
“Interestingly enough, in looking at other studies evaluating dysautonomia, the [autonomic dysfunction scores] in our persistent posttraumatic headache group were on a par with scores previously reported for patients with diseases such as small-fiber polyneuropathy and postural orthostatic tachycardia syndrome,” observed Dr. Howard, an active duty military physician assigned to obtain neurology training at the Mayo Clinic Arizona in Phoenix.
“This brings up two questions: Do autonomic symptoms contribute to accurate classification of persistent posttraumatic headache versus migraine? And if we treat this autonomic dysfunction, does the headache also improve? In our clinical observation, this appears to be the case,” he continued.
Right now, posttraumatic headache (PTH) is defined on the basis of its temporal relationship to head injury. At this time, PTH has no defining clinical characteristics, although most often it has a phenotype that meets diagnostic criteria for migraine.
However, Dr. Howard and his coinvestigators have observed anecdotally in clinical practice that persistent PTH – defined as PTH lasting longer than 3 months – is often accompanied by orthostatic intolerance. This observation, coupled with reports in multiple prior studies that dysautonomia is common in patients with mild traumatic brain injury (TBI) and postconcussion syndrome, prompted Dr. Howard and his coworkers to conduct a cross-sectional cohort study. It included 56 patients with persistent PTH due to mild TBI, 30 patients with migraine, and 36 healthy controls. Most of the persistent PTH group were military veterans with mild TBI due to blast injuries.
All subjects were assessed for autonomic dysfunction using the well-validated COMPASS-31 questionnaire. This instrument assesses six domains of autonomic function: orthostatic intolerance, bladder, gastrointestinal, vasomotor, secretomotor, and pupillomotor.
Scores in each of the six domains were numerically higher in the persistent PTH group, with the differences achieving statistical significance in the orthostatic intolerance and bladder domains.
Of note, the migraine group had a greater headache burden, with a mean 23-year headache history, compared with 10.56 years in the persistent PTH group. The migraine patients also averaged 21.1 headache days per month, versus 16.2 in the persistent PTH group. Yet the investigators found no strong association between autonomic dysfunction and headache burden as reflected in headache duration or headache days per month.
The study was funded by the Department of Defense. Dr. Howard reported having no financial conflicts of interest.
SOURCE: Howard L et al. AHS 2018, Abstract FHM03.
SAN FRANCISCO – Symptoms of autonomic dysfunction are significantly greater in patients with persistent posttraumatic headache than in migraine, raising the welcome possibility that this characteristic might serve to reliably differentiate the two disorders, Levi Howard, MD, said at the annual meeting of the American Headache Society.
“Interestingly enough, in looking at other studies evaluating dysautonomia, the [autonomic dysfunction scores] in our persistent posttraumatic headache group were on a par with scores previously reported for patients with diseases such as small-fiber polyneuropathy and postural orthostatic tachycardia syndrome,” observed Dr. Howard, an active duty military physician assigned to obtain neurology training at the Mayo Clinic Arizona in Phoenix.
“This brings up two questions: Do autonomic symptoms contribute to accurate classification of persistent posttraumatic headache versus migraine? And if we treat this autonomic dysfunction, does the headache also improve? In our clinical observation, this appears to be the case,” he continued.
Right now, posttraumatic headache (PTH) is defined on the basis of its temporal relationship to head injury. At this time, PTH has no defining clinical characteristics, although most often it has a phenotype that meets diagnostic criteria for migraine.
However, Dr. Howard and his coinvestigators have observed anecdotally in clinical practice that persistent PTH – defined as PTH lasting longer than 3 months – is often accompanied by orthostatic intolerance. This observation, coupled with reports in multiple prior studies that dysautonomia is common in patients with mild traumatic brain injury (TBI) and postconcussion syndrome, prompted Dr. Howard and his coworkers to conduct a cross-sectional cohort study. It included 56 patients with persistent PTH due to mild TBI, 30 patients with migraine, and 36 healthy controls. Most of the persistent PTH group were military veterans with mild TBI due to blast injuries.
All subjects were assessed for autonomic dysfunction using the well-validated COMPASS-31 questionnaire. This instrument assesses six domains of autonomic function: orthostatic intolerance, bladder, gastrointestinal, vasomotor, secretomotor, and pupillomotor.
Scores in each of the six domains were numerically higher in the persistent PTH group, with the differences achieving statistical significance in the orthostatic intolerance and bladder domains.
Of note, the migraine group had a greater headache burden, with a mean 23-year headache history, compared with 10.56 years in the persistent PTH group. The migraine patients also averaged 21.1 headache days per month, versus 16.2 in the persistent PTH group. Yet the investigators found no strong association between autonomic dysfunction and headache burden as reflected in headache duration or headache days per month.
The study was funded by the Department of Defense. Dr. Howard reported having no financial conflicts of interest.
SOURCE: Howard L et al. AHS 2018, Abstract FHM03.
REPORTING FROM THE AHS ANNUAL MEETING
Key clinical point: New evidence that patients with persistent posttraumatic headache have high levels of autonomic dysfunction could open the door to novel treatments.
Major finding: Scores on the COMPASS-31 questionnaire, a measure of autonomic dysfunction, averaged 37.22 in patients with persistent posttraumatic headache, indicative of significantly greater impairment than the 27.15 in migraine patients and 11.67 in healthy controls.
Study details: This cross-sectional cohort study included 56 patients with persistent posttraumatic headache, 30 with migraine, and 36 healthy controls.
Disclosures: The study was sponsored by the Department of Defense and presented by an active duty military physician.
Source: Howard L et al. AHS 2018, Abstract FHM03
Earnings gap seen among Maryland physicians
Male physicians in Maryland reported higher earnings than did female physicians, even when they all worked 41 or more hours a week, according to a 2018 survey of physicians in the state.
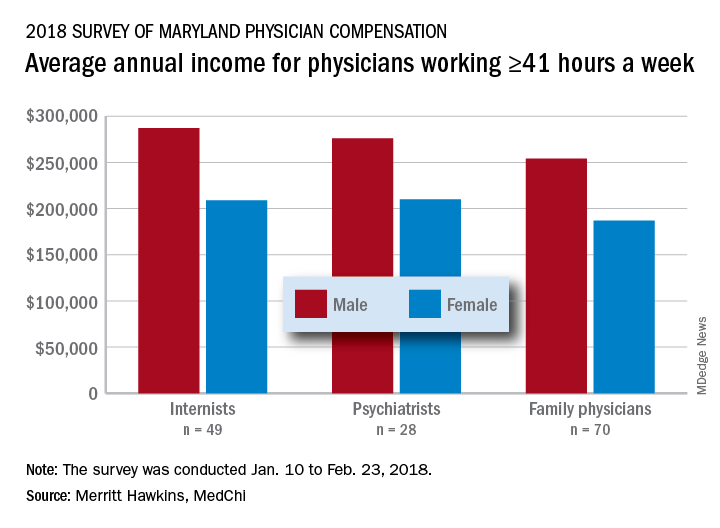
The average pretax income for all 508 respondents was $299,000 in 2016: Male physicians (66.6% of the sample) had an average of $335,000 and women averaged 33% lower at $224,000, MedChi (the Maryland State Medical Society) and Merritt Hawkins reported on July 31. Men did report working a longer week: Their average of 50.5 hours was 11% more than the 45.4-hour average for women.
“The biggest disparities we see in compensation are between male and female physicians in Maryland,” Gene Ransom, MedChi’s chief executive officer, said in a written statement. “Though such disparities have been noted in other research, it is still surprising to see the extent to which they persist.”
Of the respondents who worked an average of 41 or more hours per week – an analysis conducted only for the three largest specialties in the survey – female internists earned 27% less than their male counterparts, female psychiatrists earned 24% less, and female family physicians earned 26% less, the survey results showed.
Earnings were structured somewhat differently for Maryland’s male and female physicians. Women were more likely to be compensated in the form of a straight salary than men (35.0% vs. 30.3%), and men were more likely to paid based on production (22.7% vs. 16.9%) or in the form of an income guarantee (0.9% vs. 0.0%). Proportions receiving a salary with a production bonus were 42.7% for men and 42.5% for women, according to the survey.
The survey was commissioned by MedChi and conducted by Merritt Hawkins from Jan. 10 to Feb. 23, 2018. The margin of error was plus or minus 4.4%.
Male physicians in Maryland reported higher earnings than did female physicians, even when they all worked 41 or more hours a week, according to a 2018 survey of physicians in the state.
The average pretax income for all 508 respondents was $299,000 in 2016: Male physicians (66.6% of the sample) had an average of $335,000 and women averaged 33% lower at $224,000, MedChi (the Maryland State Medical Society) and Merritt Hawkins reported on July 31. Men did report working a longer week: Their average of 50.5 hours was 11% more than the 45.4-hour average for women.
“The biggest disparities we see in compensation are between male and female physicians in Maryland,” Gene Ransom, MedChi’s chief executive officer, said in a written statement. “Though such disparities have been noted in other research, it is still surprising to see the extent to which they persist.”
Of the respondents who worked an average of 41 or more hours per week – an analysis conducted only for the three largest specialties in the survey – female internists earned 27% less than their male counterparts, female psychiatrists earned 24% less, and female family physicians earned 26% less, the survey results showed.
Earnings were structured somewhat differently for Maryland’s male and female physicians. Women were more likely to be compensated in the form of a straight salary than men (35.0% vs. 30.3%), and men were more likely to paid based on production (22.7% vs. 16.9%) or in the form of an income guarantee (0.9% vs. 0.0%). Proportions receiving a salary with a production bonus were 42.7% for men and 42.5% for women, according to the survey.
The survey was commissioned by MedChi and conducted by Merritt Hawkins from Jan. 10 to Feb. 23, 2018. The margin of error was plus or minus 4.4%.
Male physicians in Maryland reported higher earnings than did female physicians, even when they all worked 41 or more hours a week, according to a 2018 survey of physicians in the state.
The average pretax income for all 508 respondents was $299,000 in 2016: Male physicians (66.6% of the sample) had an average of $335,000 and women averaged 33% lower at $224,000, MedChi (the Maryland State Medical Society) and Merritt Hawkins reported on July 31. Men did report working a longer week: Their average of 50.5 hours was 11% more than the 45.4-hour average for women.
“The biggest disparities we see in compensation are between male and female physicians in Maryland,” Gene Ransom, MedChi’s chief executive officer, said in a written statement. “Though such disparities have been noted in other research, it is still surprising to see the extent to which they persist.”
Of the respondents who worked an average of 41 or more hours per week – an analysis conducted only for the three largest specialties in the survey – female internists earned 27% less than their male counterparts, female psychiatrists earned 24% less, and female family physicians earned 26% less, the survey results showed.
Earnings were structured somewhat differently for Maryland’s male and female physicians. Women were more likely to be compensated in the form of a straight salary than men (35.0% vs. 30.3%), and men were more likely to paid based on production (22.7% vs. 16.9%) or in the form of an income guarantee (0.9% vs. 0.0%). Proportions receiving a salary with a production bonus were 42.7% for men and 42.5% for women, according to the survey.
The survey was commissioned by MedChi and conducted by Merritt Hawkins from Jan. 10 to Feb. 23, 2018. The margin of error was plus or minus 4.4%.
New MS subtype shows absence of cerebral white matter demyelination
A new subtype of multiple sclerosis called myelocortical multiple sclerosis is characterized by demyelination only in the spinal cord and cerebral cortex and not in the cerebral white matter.
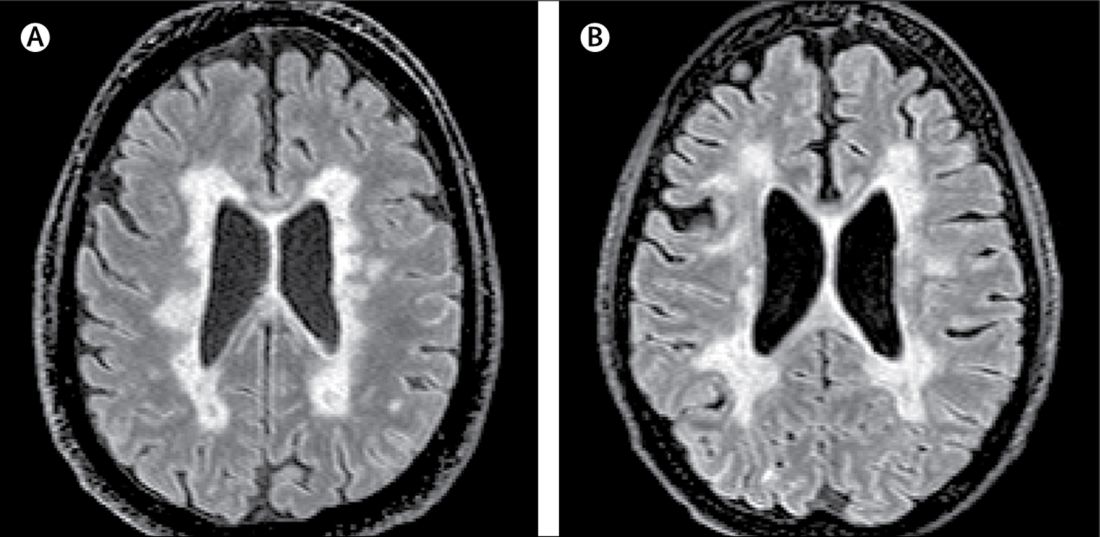
A paper published online Aug. 21 in Lancet Neurology presents the results of a study of the brains and spinal cords of 100 patients who died of multiple sclerosis.
Bruce D. Trapp, PhD, of the Lerner Research Institute at the Cleveland Clinic in Ohio, and his coauthors wrote that while the demyelination of cerebral white matter is a pathologic hallmark of multiple sclerosis, previous research has found only around half of cerebral T2-weighted hyperintense white matter lesions are demyelinated, and these lesions account for less than a third of variance in the rate of brain atrophy.
“In the absence of specific MRI metrics for demyelination, the relationship between cerebral white-matter demyelination and neurodegeneration remains speculative,” they wrote.
In this study, researchers scanned the brains with MRI before autopsy, then took centimeter-thick hemispheric slices to study the white-matter lesions. They identified 12 individuals as having what they describe as ‘myelocortical multiple sclerosis,’ characterized by the absence of areas of cerebral white-matter discoloration indicative of demyelinated lesions.
The authors then compared these individuals to 12 individuals with typical multiple sclerosis matched by age, sex, MRI protocol, multiple sclerosis disease subtype, disease duration, and Expanded Disability Status Scale.
They found that while individuals with myelocortical multiple sclerosis did not have demyelinated lesions in the cerebral white matter, they had similar areas of demyelinated lesions in the cerebral cortex to individuals with typical multiple sclerosis (median 4.45% vs. 9.74% respectively, P = .5512).
However, the individuals with myelocortical multiple sclerosis had a significantly smaller area of spinal cord demyelination (median 3.81% vs. 13.81%, P = .0083).
Individuals with myelocortical multiple sclerosis also had significantly lower mean cortical neuronal densities, compared with healthy control brains in layer III, layer V, and layer VI. But individuals with typical multiple sclerosis only had a lower cortical neuronal density in layer V when compared with controls.
Researchers also saw that in typical multiple sclerosis, neuronal density decreased as the area of brain white-matter demyelination increased. However, this negative linear correlation was not seen in myelocortical multiple sclerosis.
On MRI, researchers were still able to see abnormalities in the cerebral white matter in individuals with myelocortical multiple sclerosis, in T2-weighted, T1-weighted and magnetization transfer ratios (MTR) images.
They also found similar total T2-weighted and T1-weighted lesion volumes in individuals with myelocortical and with typical multiple sclerosis, although individuals with typical multiple sclerosis had significantly greater MTR lesion volumes.
“We propose that myelocortical multiple sclerosis is characterized by spinal cord demyelination, subpial cortical demyelination, and an absence of cerebral white-matter demyelination,” the authors wrote. “Our findings indicate that abnormal cerebral white-matter T2-T1-MTR regions of interest are not always demyelinated, and this pathological evidence suggests that cerebral white-matter demyelination and cortical neuronal degeneration can be independent events in myelocortical multiple sclerosis.”
The authors noted that their study may have been affected by selection bias, as all the patients in the study had died from complications of advanced multiple sclerosis. They suggested that it was therefore not appropriate to conclude that the prevalence of myelocortical multiple sclerosis seen in their sample would be similar across the multiple sclerosis population, nor were the findings likely to apply to people with earlier stage disease.
The study was funded by the U.S. National Institutes of Health and National Multiple Sclerosis Society. One author was an employee of Renovo Neural, and three authors were employees of Biogen. One author declared a pending patent related to automated lesion segmentation from MRI images, and four authors declared funding, fees, and non-financial support from pharmaceutical companies.
SOURCE: Trapp B et al. Lancet Neurol. 2018 Aug 21. doi: 10.1016/ S1474-4422(18)30245-X.
A new subtype of multiple sclerosis called myelocortical multiple sclerosis is characterized by demyelination only in the spinal cord and cerebral cortex and not in the cerebral white matter.
A paper published online Aug. 21 in Lancet Neurology presents the results of a study of the brains and spinal cords of 100 patients who died of multiple sclerosis.
Bruce D. Trapp, PhD, of the Lerner Research Institute at the Cleveland Clinic in Ohio, and his coauthors wrote that while the demyelination of cerebral white matter is a pathologic hallmark of multiple sclerosis, previous research has found only around half of cerebral T2-weighted hyperintense white matter lesions are demyelinated, and these lesions account for less than a third of variance in the rate of brain atrophy.
“In the absence of specific MRI metrics for demyelination, the relationship between cerebral white-matter demyelination and neurodegeneration remains speculative,” they wrote.
In this study, researchers scanned the brains with MRI before autopsy, then took centimeter-thick hemispheric slices to study the white-matter lesions. They identified 12 individuals as having what they describe as ‘myelocortical multiple sclerosis,’ characterized by the absence of areas of cerebral white-matter discoloration indicative of demyelinated lesions.
The authors then compared these individuals to 12 individuals with typical multiple sclerosis matched by age, sex, MRI protocol, multiple sclerosis disease subtype, disease duration, and Expanded Disability Status Scale.
They found that while individuals with myelocortical multiple sclerosis did not have demyelinated lesions in the cerebral white matter, they had similar areas of demyelinated lesions in the cerebral cortex to individuals with typical multiple sclerosis (median 4.45% vs. 9.74% respectively, P = .5512).
However, the individuals with myelocortical multiple sclerosis had a significantly smaller area of spinal cord demyelination (median 3.81% vs. 13.81%, P = .0083).
Individuals with myelocortical multiple sclerosis also had significantly lower mean cortical neuronal densities, compared with healthy control brains in layer III, layer V, and layer VI. But individuals with typical multiple sclerosis only had a lower cortical neuronal density in layer V when compared with controls.
Researchers also saw that in typical multiple sclerosis, neuronal density decreased as the area of brain white-matter demyelination increased. However, this negative linear correlation was not seen in myelocortical multiple sclerosis.
On MRI, researchers were still able to see abnormalities in the cerebral white matter in individuals with myelocortical multiple sclerosis, in T2-weighted, T1-weighted and magnetization transfer ratios (MTR) images.
They also found similar total T2-weighted and T1-weighted lesion volumes in individuals with myelocortical and with typical multiple sclerosis, although individuals with typical multiple sclerosis had significantly greater MTR lesion volumes.
“We propose that myelocortical multiple sclerosis is characterized by spinal cord demyelination, subpial cortical demyelination, and an absence of cerebral white-matter demyelination,” the authors wrote. “Our findings indicate that abnormal cerebral white-matter T2-T1-MTR regions of interest are not always demyelinated, and this pathological evidence suggests that cerebral white-matter demyelination and cortical neuronal degeneration can be independent events in myelocortical multiple sclerosis.”
The authors noted that their study may have been affected by selection bias, as all the patients in the study had died from complications of advanced multiple sclerosis. They suggested that it was therefore not appropriate to conclude that the prevalence of myelocortical multiple sclerosis seen in their sample would be similar across the multiple sclerosis population, nor were the findings likely to apply to people with earlier stage disease.
The study was funded by the U.S. National Institutes of Health and National Multiple Sclerosis Society. One author was an employee of Renovo Neural, and three authors were employees of Biogen. One author declared a pending patent related to automated lesion segmentation from MRI images, and four authors declared funding, fees, and non-financial support from pharmaceutical companies.
SOURCE: Trapp B et al. Lancet Neurol. 2018 Aug 21. doi: 10.1016/ S1474-4422(18)30245-X.
A new subtype of multiple sclerosis called myelocortical multiple sclerosis is characterized by demyelination only in the spinal cord and cerebral cortex and not in the cerebral white matter.
A paper published online Aug. 21 in Lancet Neurology presents the results of a study of the brains and spinal cords of 100 patients who died of multiple sclerosis.
Bruce D. Trapp, PhD, of the Lerner Research Institute at the Cleveland Clinic in Ohio, and his coauthors wrote that while the demyelination of cerebral white matter is a pathologic hallmark of multiple sclerosis, previous research has found only around half of cerebral T2-weighted hyperintense white matter lesions are demyelinated, and these lesions account for less than a third of variance in the rate of brain atrophy.
“In the absence of specific MRI metrics for demyelination, the relationship between cerebral white-matter demyelination and neurodegeneration remains speculative,” they wrote.
In this study, researchers scanned the brains with MRI before autopsy, then took centimeter-thick hemispheric slices to study the white-matter lesions. They identified 12 individuals as having what they describe as ‘myelocortical multiple sclerosis,’ characterized by the absence of areas of cerebral white-matter discoloration indicative of demyelinated lesions.
The authors then compared these individuals to 12 individuals with typical multiple sclerosis matched by age, sex, MRI protocol, multiple sclerosis disease subtype, disease duration, and Expanded Disability Status Scale.
They found that while individuals with myelocortical multiple sclerosis did not have demyelinated lesions in the cerebral white matter, they had similar areas of demyelinated lesions in the cerebral cortex to individuals with typical multiple sclerosis (median 4.45% vs. 9.74% respectively, P = .5512).
However, the individuals with myelocortical multiple sclerosis had a significantly smaller area of spinal cord demyelination (median 3.81% vs. 13.81%, P = .0083).
Individuals with myelocortical multiple sclerosis also had significantly lower mean cortical neuronal densities, compared with healthy control brains in layer III, layer V, and layer VI. But individuals with typical multiple sclerosis only had a lower cortical neuronal density in layer V when compared with controls.
Researchers also saw that in typical multiple sclerosis, neuronal density decreased as the area of brain white-matter demyelination increased. However, this negative linear correlation was not seen in myelocortical multiple sclerosis.
On MRI, researchers were still able to see abnormalities in the cerebral white matter in individuals with myelocortical multiple sclerosis, in T2-weighted, T1-weighted and magnetization transfer ratios (MTR) images.
They also found similar total T2-weighted and T1-weighted lesion volumes in individuals with myelocortical and with typical multiple sclerosis, although individuals with typical multiple sclerosis had significantly greater MTR lesion volumes.
“We propose that myelocortical multiple sclerosis is characterized by spinal cord demyelination, subpial cortical demyelination, and an absence of cerebral white-matter demyelination,” the authors wrote. “Our findings indicate that abnormal cerebral white-matter T2-T1-MTR regions of interest are not always demyelinated, and this pathological evidence suggests that cerebral white-matter demyelination and cortical neuronal degeneration can be independent events in myelocortical multiple sclerosis.”
The authors noted that their study may have been affected by selection bias, as all the patients in the study had died from complications of advanced multiple sclerosis. They suggested that it was therefore not appropriate to conclude that the prevalence of myelocortical multiple sclerosis seen in their sample would be similar across the multiple sclerosis population, nor were the findings likely to apply to people with earlier stage disease.
The study was funded by the U.S. National Institutes of Health and National Multiple Sclerosis Society. One author was an employee of Renovo Neural, and three authors were employees of Biogen. One author declared a pending patent related to automated lesion segmentation from MRI images, and four authors declared funding, fees, and non-financial support from pharmaceutical companies.
SOURCE: Trapp B et al. Lancet Neurol. 2018 Aug 21. doi: 10.1016/ S1474-4422(18)30245-X.
FROM LANCET NEUROLOGY
Key clinical point: Researchers have identified a new subtype of multiple sclerosis.
Major finding: Individuals with myelocortical multiple sclerosis show demyelination in the spinal cord and cortex only.
Study details: Post-mortem study of brains and spinal cords of 100 individuals with multiple sclerosis.
Disclosures: The study was funded by the U.S. National Institutes of Health and National Multiple Sclerosis Society. One author was an employee of Renovo Neural, three authors were employees of Biogen. One author declared a pending patent related to automated lesion segmentation from MRI images, and four authors declared funding, fees and non-financial support from pharmaceutical companies.
Source: Trapp B et al. Lancet Neurol. 2018 Aug 21. doi: 10.1016/ S1474-4422(18)30245-X.
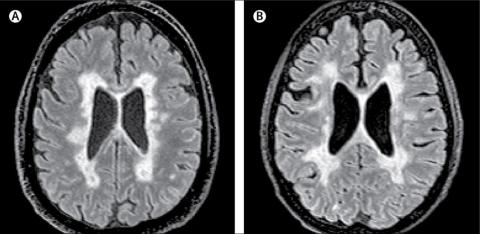
Model finds spontaneous HCV clearance higher than previous estimates
Up to 40% of hepatitis C virus (HCV)–infected individuals clear their infection spontaneously, based on the results of a new mathematical model of HCV transmission and clearance, according to a report published online in the International Journal of Infectious Diseases.
Houssein H. Ayoub, PhD, of Cornell University, New York, and his colleagues conducted a study on HCV clearance. Previous estimates using empirical data indicated that the HCV clearance rate was about 25% after and acute infection duration of 16.5 weeks, according to Dr. Ayoub and his colleagues.
They developed a model to describe HCV transmission and a virus clearance rate (fclearance), defined as the proportion of HCV-infected persons who spontaneously clear their infection after the acute stage. The rest of the infected population (1–fclearance) become chronically infected and positive for both HCV antibodies and HCV RNA.This was estimated by fitting the model to probability-based and nationally representative, population-based data from Egypt (2008 and 2015), and the U.S. National Health and Nutrition Examination Surveys (NHANES A and NHANES B) data. Their model showed that fclearance was related to the HCV viremic rate approximately as fclearance = 1.16 x (1–HCV viremic rate). The HCV viremic rate was defined as the proportion of individuals who were positive for HCV antibodies and HCV RNA out of all who were positive for HCV antibodies positive, regardless of RNA status, as measured in a cross-sectional survey.
Antibody prevalence in Egypt was estimated at 14.7% in 2008 and 10.0% in 2015, while the viremic rate was assessed as 67.1% and 70.2%, respectively. For the United States, the pooled antibody prevalence from the NHANES A data between 1999 and 2012 was an estimated 1.4% and the pooled viremic rate was estimated at around 74%. The NHANES B data used as the denominator for HCV viremic rate both individuals confirmed as HCV Ab positive and those with an undetermined HCV antibody status. (NHANES laboratory procedures can provide this added information because of their subsequent testing of undetermined HCV antibody results for HCV RNA positivity.) This change to the formula yielded a viremic rate of 64.6%.
They found that fclearance was an estimated at 39.9% and 33.5% for Egypt in 2008 and 2015, respectively, and 29.6% and 49.9% for NHANES A and NHANES B, respectively.
“Empirical measures from longitudinal cohort studies may have underestimated the ability of the host immune system to clear HCV infection. This finding may have also implications for our understanding of the biological determinants of HCV spontaneous clearance. It may hint that a strategy for HCV vaccine development could be a vaccine that does not necessarily prevent infection, but modulates immune response towards conditions that increase the capacity of the host immune system to clear HCV infection spontaneously,” the researchers concluded.
The study was funded by the Qatar National Research Fund and Cornell University. The authors reported no conflicts of interest.
SOURCE: Ayoub HH et al. Int J Infect Dis. 2018 Jul 18. doi: 10.1016/j.ijid.2018.07.013.
Up to 40% of hepatitis C virus (HCV)–infected individuals clear their infection spontaneously, based on the results of a new mathematical model of HCV transmission and clearance, according to a report published online in the International Journal of Infectious Diseases.
Houssein H. Ayoub, PhD, of Cornell University, New York, and his colleagues conducted a study on HCV clearance. Previous estimates using empirical data indicated that the HCV clearance rate was about 25% after and acute infection duration of 16.5 weeks, according to Dr. Ayoub and his colleagues.
They developed a model to describe HCV transmission and a virus clearance rate (fclearance), defined as the proportion of HCV-infected persons who spontaneously clear their infection after the acute stage. The rest of the infected population (1–fclearance) become chronically infected and positive for both HCV antibodies and HCV RNA.This was estimated by fitting the model to probability-based and nationally representative, population-based data from Egypt (2008 and 2015), and the U.S. National Health and Nutrition Examination Surveys (NHANES A and NHANES B) data. Their model showed that fclearance was related to the HCV viremic rate approximately as fclearance = 1.16 x (1–HCV viremic rate). The HCV viremic rate was defined as the proportion of individuals who were positive for HCV antibodies and HCV RNA out of all who were positive for HCV antibodies positive, regardless of RNA status, as measured in a cross-sectional survey.
Antibody prevalence in Egypt was estimated at 14.7% in 2008 and 10.0% in 2015, while the viremic rate was assessed as 67.1% and 70.2%, respectively. For the United States, the pooled antibody prevalence from the NHANES A data between 1999 and 2012 was an estimated 1.4% and the pooled viremic rate was estimated at around 74%. The NHANES B data used as the denominator for HCV viremic rate both individuals confirmed as HCV Ab positive and those with an undetermined HCV antibody status. (NHANES laboratory procedures can provide this added information because of their subsequent testing of undetermined HCV antibody results for HCV RNA positivity.) This change to the formula yielded a viremic rate of 64.6%.
They found that fclearance was an estimated at 39.9% and 33.5% for Egypt in 2008 and 2015, respectively, and 29.6% and 49.9% for NHANES A and NHANES B, respectively.
“Empirical measures from longitudinal cohort studies may have underestimated the ability of the host immune system to clear HCV infection. This finding may have also implications for our understanding of the biological determinants of HCV spontaneous clearance. It may hint that a strategy for HCV vaccine development could be a vaccine that does not necessarily prevent infection, but modulates immune response towards conditions that increase the capacity of the host immune system to clear HCV infection spontaneously,” the researchers concluded.
The study was funded by the Qatar National Research Fund and Cornell University. The authors reported no conflicts of interest.
SOURCE: Ayoub HH et al. Int J Infect Dis. 2018 Jul 18. doi: 10.1016/j.ijid.2018.07.013.
Up to 40% of hepatitis C virus (HCV)–infected individuals clear their infection spontaneously, based on the results of a new mathematical model of HCV transmission and clearance, according to a report published online in the International Journal of Infectious Diseases.
Houssein H. Ayoub, PhD, of Cornell University, New York, and his colleagues conducted a study on HCV clearance. Previous estimates using empirical data indicated that the HCV clearance rate was about 25% after and acute infection duration of 16.5 weeks, according to Dr. Ayoub and his colleagues.
They developed a model to describe HCV transmission and a virus clearance rate (fclearance), defined as the proportion of HCV-infected persons who spontaneously clear their infection after the acute stage. The rest of the infected population (1–fclearance) become chronically infected and positive for both HCV antibodies and HCV RNA.This was estimated by fitting the model to probability-based and nationally representative, population-based data from Egypt (2008 and 2015), and the U.S. National Health and Nutrition Examination Surveys (NHANES A and NHANES B) data. Their model showed that fclearance was related to the HCV viremic rate approximately as fclearance = 1.16 x (1–HCV viremic rate). The HCV viremic rate was defined as the proportion of individuals who were positive for HCV antibodies and HCV RNA out of all who were positive for HCV antibodies positive, regardless of RNA status, as measured in a cross-sectional survey.
Antibody prevalence in Egypt was estimated at 14.7% in 2008 and 10.0% in 2015, while the viremic rate was assessed as 67.1% and 70.2%, respectively. For the United States, the pooled antibody prevalence from the NHANES A data between 1999 and 2012 was an estimated 1.4% and the pooled viremic rate was estimated at around 74%. The NHANES B data used as the denominator for HCV viremic rate both individuals confirmed as HCV Ab positive and those with an undetermined HCV antibody status. (NHANES laboratory procedures can provide this added information because of their subsequent testing of undetermined HCV antibody results for HCV RNA positivity.) This change to the formula yielded a viremic rate of 64.6%.
They found that fclearance was an estimated at 39.9% and 33.5% for Egypt in 2008 and 2015, respectively, and 29.6% and 49.9% for NHANES A and NHANES B, respectively.
“Empirical measures from longitudinal cohort studies may have underestimated the ability of the host immune system to clear HCV infection. This finding may have also implications for our understanding of the biological determinants of HCV spontaneous clearance. It may hint that a strategy for HCV vaccine development could be a vaccine that does not necessarily prevent infection, but modulates immune response towards conditions that increase the capacity of the host immune system to clear HCV infection spontaneously,” the researchers concluded.
The study was funded by the Qatar National Research Fund and Cornell University. The authors reported no conflicts of interest.
SOURCE: Ayoub HH et al. Int J Infect Dis. 2018 Jul 18. doi: 10.1016/j.ijid.2018.07.013.
FROM THE INTERNATIONAL JOURNAL OF INFECTIOUS DISEASES
Key clinical point: The hepatitis C virus clearance rate was 39.9% and 33.5% for Egypt in 2008 and 2015, respectively, and 29.6% and 49.9% for two U.S. populations.
Major finding: A new model of HCV-infected persons indicates that up to 40% clear their infection spontaneously, higher than earlier estimates.
Study details: A mathematical model was developed to describe HCV transmission and clearance based on nationally representative population data for Egypt and the United States.
Disclosures: The study was funded by the Qatar National Research Fund and Cornell University. The authors reported no conflicts of interest.
Source: Ayoub HH et al. Int J Infect Dis. 2018 Jul 18. doi: 10.1016/j.ijid.2018.07.013.
Prescription opioid epidemic hits migraine patients hard
SAN FRANCISCO –

“Given the opioid epidemic in the U.S. and the high prevalence of opioid use in migraine patients shown in our study, especially in those with chronic migraine, our results suggest that improved management of treatment is needed to optimize care,” said Justin S. Yu, PharmD.
“We’re seeing a lot of opioid use in these migraine patients. It may not all be due to migraine – some had comorbid nonheadache pain conditions – but this still represents an opportunity to look at these patients more closely, maybe treat them better, because there are opportunities to improve their care, their outcomes, and their quality of life,” added Dr. Yu of Allergan in Irvine, Calif.
He presented an in-depth retrospective observational study of opioid use in 129 chronic migraine patients as defined by more than 15 headache days per month (at least 8 of which fulfilled the diagnostic criteria for migraine) and 63 others with less frequent episodic migraine. In the previous 12 months, according to claims data, 54% of the chronic migraine patients and 37% of the episodic migraine patient filled one or more prescriptions for an opioid.
More impressively, fully one-third of the chronic migraine group and 16% of episodic migraineurs filled three or more opioid prescriptions within that 12-month interval. In fact, the mean number of filled opioid prescriptions over the year was 4.0 among all chronic migraine patients and 2.8 in the overall episodic migraine cohort.
“Opioids have been used for acute treatment of chronic migraine and episodic migraine but are not recommended for regular use due to the risk of medication overuse, tolerance, dependence, and opioid hyperalgesia,” Dr. Yu noted.

Separately, Richard B. Lipton, MD, presented an analysis of 3,930 migraine patients currently using acute oral prescription headache medications who were among the larger group of 15,133 migraineurs who participated in the massive MAST (Migraine in America Symptoms and Treatment) study, an Internet-based epidemiologic survey of a nationally representative sample of patients with the disorder.
Topping the list of the most frequently used oral prescription acute headache medications were the oral triptans, used by 46% of subjects, followed by prescription NSAIDs, taken by 36%, and oral prescription opioids, used by 33.1%. And that eyebrow-raising rate of prescription opioid use is apparently par for the course.
“In lots of survey data now we’re seeing that among people with migraine who take acute prescription drugs, this one-third number is not unusual, although at least from my perspective it’s certainly a problem. Also, of people using oral acute prescription agents, a full 66% were also using OTC headache medications,” said Dr. Lipton, professor and vice chair of the department of neurology at Albert Einstein College of Medicine and director of the Montefiore Headache Center in New York.
In addition, oral prescription barbiturates were used for acute treatment of migraine by 11.2% of the MAST participants.
Acute medication overuse, as defined by use of oral prescription opioids and/or barbiturates on an average of more than 10 days per month, was identified in 8.1% of the total group. For them, the appropriate course of action is withdrawal of the overused medication, addition of a preventive agent – such drugs weren’t being used by the great majority of patients on acute prescription medications for migraine – and replacement of the opioid or barbiturate with a less problematic class of acute therapy, Dr. Lipton advised.
The MAST analysis identified a bevy of major unmet needs in people with migraine who are using acute prescription medications to treat their headaches. Fifty-three percent of participants said their severe headache attacks come on very rapidly, 50% indicated their attacks reach peak intensity in less than 2 hours no matter what they do, 39% said their head pain returns less than 24 hours after initial pain relief, and 41% complained of severe headache upon awakening. Nausea interfering with daily activities was frequently cited. Seventy-six percent of the sample had at least one of these major unmet needs.
Dr. Lipton stressed that although some of his colleagues have reacted defensively to these data highlighting numerous major unmet treatment needs in migraine patients, the MAST findings certainly aren’t an indictment that headache specialists are doing a poor job.
“I am not saying that. Of course, the vast majority of these people aren’t treated by headache specialists, they’re treated by primary care physicians. What I am saying is there are lots of opportunities to use new and emerging tools to improve the lives of our patients,” the neurologist said.
Dr. Yu noted that in his study, 14.7% of patients with chronic migraine and 15.9% with episodic migraine had been diagnosed with an anxiety disorder within the previous 12 months. Also, 24% with chronic and 11.1% with episodic migraine had been diagnosed with depression. A diagnosis of a comorbid nonheadache pain disorder was present in 13% of the chronic migraineurs and 8% of those with episodic migraine.
The MAST study was sponsored by Promius Pharma, a subsidiary of Dr. Reddy’s Laboratories. Dr. Lipton reported receiving research funding from and/or honoraria from that company and more than a dozen others.
Dr. Yu is employed by Allergan, which sponsored his study.
SOURCE: AHS annual meeting, Yu JS et al., Abstract PF11, and Lipton RB et al., Abstract OR02.
SAN FRANCISCO –
“Given the opioid epidemic in the U.S. and the high prevalence of opioid use in migraine patients shown in our study, especially in those with chronic migraine, our results suggest that improved management of treatment is needed to optimize care,” said Justin S. Yu, PharmD.
“We’re seeing a lot of opioid use in these migraine patients. It may not all be due to migraine – some had comorbid nonheadache pain conditions – but this still represents an opportunity to look at these patients more closely, maybe treat them better, because there are opportunities to improve their care, their outcomes, and their quality of life,” added Dr. Yu of Allergan in Irvine, Calif.
He presented an in-depth retrospective observational study of opioid use in 129 chronic migraine patients as defined by more than 15 headache days per month (at least 8 of which fulfilled the diagnostic criteria for migraine) and 63 others with less frequent episodic migraine. In the previous 12 months, according to claims data, 54% of the chronic migraine patients and 37% of the episodic migraine patient filled one or more prescriptions for an opioid.
More impressively, fully one-third of the chronic migraine group and 16% of episodic migraineurs filled three or more opioid prescriptions within that 12-month interval. In fact, the mean number of filled opioid prescriptions over the year was 4.0 among all chronic migraine patients and 2.8 in the overall episodic migraine cohort.
“Opioids have been used for acute treatment of chronic migraine and episodic migraine but are not recommended for regular use due to the risk of medication overuse, tolerance, dependence, and opioid hyperalgesia,” Dr. Yu noted.
Separately, Richard B. Lipton, MD, presented an analysis of 3,930 migraine patients currently using acute oral prescription headache medications who were among the larger group of 15,133 migraineurs who participated in the massive MAST (Migraine in America Symptoms and Treatment) study, an Internet-based epidemiologic survey of a nationally representative sample of patients with the disorder.
Topping the list of the most frequently used oral prescription acute headache medications were the oral triptans, used by 46% of subjects, followed by prescription NSAIDs, taken by 36%, and oral prescription opioids, used by 33.1%. And that eyebrow-raising rate of prescription opioid use is apparently par for the course.
“In lots of survey data now we’re seeing that among people with migraine who take acute prescription drugs, this one-third number is not unusual, although at least from my perspective it’s certainly a problem. Also, of people using oral acute prescription agents, a full 66% were also using OTC headache medications,” said Dr. Lipton, professor and vice chair of the department of neurology at Albert Einstein College of Medicine and director of the Montefiore Headache Center in New York.
In addition, oral prescription barbiturates were used for acute treatment of migraine by 11.2% of the MAST participants.
Acute medication overuse, as defined by use of oral prescription opioids and/or barbiturates on an average of more than 10 days per month, was identified in 8.1% of the total group. For them, the appropriate course of action is withdrawal of the overused medication, addition of a preventive agent – such drugs weren’t being used by the great majority of patients on acute prescription medications for migraine – and replacement of the opioid or barbiturate with a less problematic class of acute therapy, Dr. Lipton advised.
The MAST analysis identified a bevy of major unmet needs in people with migraine who are using acute prescription medications to treat their headaches. Fifty-three percent of participants said their severe headache attacks come on very rapidly, 50% indicated their attacks reach peak intensity in less than 2 hours no matter what they do, 39% said their head pain returns less than 24 hours after initial pain relief, and 41% complained of severe headache upon awakening. Nausea interfering with daily activities was frequently cited. Seventy-six percent of the sample had at least one of these major unmet needs.
Dr. Lipton stressed that although some of his colleagues have reacted defensively to these data highlighting numerous major unmet treatment needs in migraine patients, the MAST findings certainly aren’t an indictment that headache specialists are doing a poor job.
“I am not saying that. Of course, the vast majority of these people aren’t treated by headache specialists, they’re treated by primary care physicians. What I am saying is there are lots of opportunities to use new and emerging tools to improve the lives of our patients,” the neurologist said.
Dr. Yu noted that in his study, 14.7% of patients with chronic migraine and 15.9% with episodic migraine had been diagnosed with an anxiety disorder within the previous 12 months. Also, 24% with chronic and 11.1% with episodic migraine had been diagnosed with depression. A diagnosis of a comorbid nonheadache pain disorder was present in 13% of the chronic migraineurs and 8% of those with episodic migraine.
The MAST study was sponsored by Promius Pharma, a subsidiary of Dr. Reddy’s Laboratories. Dr. Lipton reported receiving research funding from and/or honoraria from that company and more than a dozen others.
Dr. Yu is employed by Allergan, which sponsored his study.
SOURCE: AHS annual meeting, Yu JS et al., Abstract PF11, and Lipton RB et al., Abstract OR02.
SAN FRANCISCO –
“Given the opioid epidemic in the U.S. and the high prevalence of opioid use in migraine patients shown in our study, especially in those with chronic migraine, our results suggest that improved management of treatment is needed to optimize care,” said Justin S. Yu, PharmD.
“We’re seeing a lot of opioid use in these migraine patients. It may not all be due to migraine – some had comorbid nonheadache pain conditions – but this still represents an opportunity to look at these patients more closely, maybe treat them better, because there are opportunities to improve their care, their outcomes, and their quality of life,” added Dr. Yu of Allergan in Irvine, Calif.
He presented an in-depth retrospective observational study of opioid use in 129 chronic migraine patients as defined by more than 15 headache days per month (at least 8 of which fulfilled the diagnostic criteria for migraine) and 63 others with less frequent episodic migraine. In the previous 12 months, according to claims data, 54% of the chronic migraine patients and 37% of the episodic migraine patient filled one or more prescriptions for an opioid.
More impressively, fully one-third of the chronic migraine group and 16% of episodic migraineurs filled three or more opioid prescriptions within that 12-month interval. In fact, the mean number of filled opioid prescriptions over the year was 4.0 among all chronic migraine patients and 2.8 in the overall episodic migraine cohort.
“Opioids have been used for acute treatment of chronic migraine and episodic migraine but are not recommended for regular use due to the risk of medication overuse, tolerance, dependence, and opioid hyperalgesia,” Dr. Yu noted.
Separately, Richard B. Lipton, MD, presented an analysis of 3,930 migraine patients currently using acute oral prescription headache medications who were among the larger group of 15,133 migraineurs who participated in the massive MAST (Migraine in America Symptoms and Treatment) study, an Internet-based epidemiologic survey of a nationally representative sample of patients with the disorder.
Topping the list of the most frequently used oral prescription acute headache medications were the oral triptans, used by 46% of subjects, followed by prescription NSAIDs, taken by 36%, and oral prescription opioids, used by 33.1%. And that eyebrow-raising rate of prescription opioid use is apparently par for the course.
“In lots of survey data now we’re seeing that among people with migraine who take acute prescription drugs, this one-third number is not unusual, although at least from my perspective it’s certainly a problem. Also, of people using oral acute prescription agents, a full 66% were also using OTC headache medications,” said Dr. Lipton, professor and vice chair of the department of neurology at Albert Einstein College of Medicine and director of the Montefiore Headache Center in New York.
In addition, oral prescription barbiturates were used for acute treatment of migraine by 11.2% of the MAST participants.
Acute medication overuse, as defined by use of oral prescription opioids and/or barbiturates on an average of more than 10 days per month, was identified in 8.1% of the total group. For them, the appropriate course of action is withdrawal of the overused medication, addition of a preventive agent – such drugs weren’t being used by the great majority of patients on acute prescription medications for migraine – and replacement of the opioid or barbiturate with a less problematic class of acute therapy, Dr. Lipton advised.
The MAST analysis identified a bevy of major unmet needs in people with migraine who are using acute prescription medications to treat their headaches. Fifty-three percent of participants said their severe headache attacks come on very rapidly, 50% indicated their attacks reach peak intensity in less than 2 hours no matter what they do, 39% said their head pain returns less than 24 hours after initial pain relief, and 41% complained of severe headache upon awakening. Nausea interfering with daily activities was frequently cited. Seventy-six percent of the sample had at least one of these major unmet needs.
Dr. Lipton stressed that although some of his colleagues have reacted defensively to these data highlighting numerous major unmet treatment needs in migraine patients, the MAST findings certainly aren’t an indictment that headache specialists are doing a poor job.
“I am not saying that. Of course, the vast majority of these people aren’t treated by headache specialists, they’re treated by primary care physicians. What I am saying is there are lots of opportunities to use new and emerging tools to improve the lives of our patients,” the neurologist said.
Dr. Yu noted that in his study, 14.7% of patients with chronic migraine and 15.9% with episodic migraine had been diagnosed with an anxiety disorder within the previous 12 months. Also, 24% with chronic and 11.1% with episodic migraine had been diagnosed with depression. A diagnosis of a comorbid nonheadache pain disorder was present in 13% of the chronic migraineurs and 8% of those with episodic migraine.
The MAST study was sponsored by Promius Pharma, a subsidiary of Dr. Reddy’s Laboratories. Dr. Lipton reported receiving research funding from and/or honoraria from that company and more than a dozen others.
Dr. Yu is employed by Allergan, which sponsored his study.
SOURCE: AHS annual meeting, Yu JS et al., Abstract PF11, and Lipton RB et al., Abstract OR02.
REPORTING FROM THE AHS ANNUAL MEETING

Witnessed overdose, HCV infection associated with greater opioid overdose risk
With drug overdoses being the leading cause of accidental death in the United States, knowing the predictors of opioid overdose may help target treatment and prevention efforts to deal with this growing problem, according to Samantha Schiavon, MA, a graduate student in medical and clinical psychology, and her colleagues at the University of Alabama at Birmingham.

They performed a study that found a variety of factors associated with increased risk of opioid overdose, including witnessing an overdose (a friend or others), chronic hepatitis C virus (HCV) infection, and a higher frequency of distinct buprenorphine treatment episodes.
Data were acquired during Nov. 2015-July 2017 from an ongoing study to determine the impact of the distribution of naloxone kits to individuals at high risk for opioid overdose. All 247 participants included were considered at high risk of opioid overdose because they were recruited from sites providing opioid addiction treatment, including a residential drug treatment facility (43%), inpatient treatment following ED admittance (25%), and criminal justice supervision (32%). Of the participants, 57% were male, with a mean age of around 34 years; most were white (89%).
Participants were assessed using a self-reporting 30-item questionnaire regarding chronic medical conditions, STIs, past and current opioid misuse, nonfatal opioid overdose experiences, and frequency of every distinct opioid treatment episode including buprenorphine, methadone maintenance clinics, residential drug rehabilitation programs, and intensive outpatient treatment. All variables were answered on a 5-point scale ranging from 0 (never) to 4 (more than three times), according to the researchers.
Participants who witnessed a friend’s overdose (odds ratio, 4.21; 95% confidence interval, 1.99-8.89) showed the highest risk of personal overdose, while having witnessed others overdose at a higher frequency carried a lower increased risk (OR, 1.42; 95% CI, 1.11-1.82).
HCV infection was associated with a more than twofold increase in overdose risk (OR, 2.44; 95% CI, 1.20-4.97), likely because of the strong association between HCV and heroin injection drug use, according to the researchers. They added that this association may be an indicator of higher-risk injection behavior, including needle sharing. They also suggested that, given the current epidemiology of HCV infection, identifying HCV infections may benefit younger populations who may be at risk of an overdose from riskier injection practices or where injection drug risk is not yet known.
The researchers reported that a higher frequency of distinct buprenorphine treatment episodes also led to increased risk (OR, 1.55; 95% CI, 1.17-2.07), whereas a greater frequency of distinct methadone treatment episodes was related to decreased odds of experiencing a nonfatal overdose (OR, 0.67; 95% CI, 0.49-0.91) according to their report published in Addictive Behavior (2018;86:51-5).
In addition, those who experienced a past opioid overdose were more likely to have obtained methadone illicitly (65%; P less than or equal to .001) or have a friend who died from an overdose (90%; P = .001) compared with those who have not experienced an overdose, according to the researchers.
“The current study strongly contributes to our understanding of risk factors of experiencing an opioid overdose. The knowledge gained from this study may enable targeted treatment interventions to reduce preventable deaths from opioid overdose,” according to the researchers. In particular, they pointed out the increased risk of overdose with the use of illicitly obtained methadone and suggested that expanded access to medication-assisted treatments be made available to all patients. “Opioid antagonist medications such as naltrexone may be particularly helpful in preventing opioid overdose for patients leaving controlled environments such as hospital, drug treatment, and correctional facilities,” they concluded.
The researchers reported that they had no conflicts of interest.
SOURCE: Schiavon S et al. Addict Behav. 2018;86:51-5.
With drug overdoses being the leading cause of accidental death in the United States, knowing the predictors of opioid overdose may help target treatment and prevention efforts to deal with this growing problem, according to Samantha Schiavon, MA, a graduate student in medical and clinical psychology, and her colleagues at the University of Alabama at Birmingham.
They performed a study that found a variety of factors associated with increased risk of opioid overdose, including witnessing an overdose (a friend or others), chronic hepatitis C virus (HCV) infection, and a higher frequency of distinct buprenorphine treatment episodes.
Data were acquired during Nov. 2015-July 2017 from an ongoing study to determine the impact of the distribution of naloxone kits to individuals at high risk for opioid overdose. All 247 participants included were considered at high risk of opioid overdose because they were recruited from sites providing opioid addiction treatment, including a residential drug treatment facility (43%), inpatient treatment following ED admittance (25%), and criminal justice supervision (32%). Of the participants, 57% were male, with a mean age of around 34 years; most were white (89%).
Participants were assessed using a self-reporting 30-item questionnaire regarding chronic medical conditions, STIs, past and current opioid misuse, nonfatal opioid overdose experiences, and frequency of every distinct opioid treatment episode including buprenorphine, methadone maintenance clinics, residential drug rehabilitation programs, and intensive outpatient treatment. All variables were answered on a 5-point scale ranging from 0 (never) to 4 (more than three times), according to the researchers.
Participants who witnessed a friend’s overdose (odds ratio, 4.21; 95% confidence interval, 1.99-8.89) showed the highest risk of personal overdose, while having witnessed others overdose at a higher frequency carried a lower increased risk (OR, 1.42; 95% CI, 1.11-1.82).
HCV infection was associated with a more than twofold increase in overdose risk (OR, 2.44; 95% CI, 1.20-4.97), likely because of the strong association between HCV and heroin injection drug use, according to the researchers. They added that this association may be an indicator of higher-risk injection behavior, including needle sharing. They also suggested that, given the current epidemiology of HCV infection, identifying HCV infections may benefit younger populations who may be at risk of an overdose from riskier injection practices or where injection drug risk is not yet known.
The researchers reported that a higher frequency of distinct buprenorphine treatment episodes also led to increased risk (OR, 1.55; 95% CI, 1.17-2.07), whereas a greater frequency of distinct methadone treatment episodes was related to decreased odds of experiencing a nonfatal overdose (OR, 0.67; 95% CI, 0.49-0.91) according to their report published in Addictive Behavior (2018;86:51-5).
In addition, those who experienced a past opioid overdose were more likely to have obtained methadone illicitly (65%; P less than or equal to .001) or have a friend who died from an overdose (90%; P = .001) compared with those who have not experienced an overdose, according to the researchers.
“The current study strongly contributes to our understanding of risk factors of experiencing an opioid overdose. The knowledge gained from this study may enable targeted treatment interventions to reduce preventable deaths from opioid overdose,” according to the researchers. In particular, they pointed out the increased risk of overdose with the use of illicitly obtained methadone and suggested that expanded access to medication-assisted treatments be made available to all patients. “Opioid antagonist medications such as naltrexone may be particularly helpful in preventing opioid overdose for patients leaving controlled environments such as hospital, drug treatment, and correctional facilities,” they concluded.
The researchers reported that they had no conflicts of interest.
SOURCE: Schiavon S et al. Addict Behav. 2018;86:51-5.
With drug overdoses being the leading cause of accidental death in the United States, knowing the predictors of opioid overdose may help target treatment and prevention efforts to deal with this growing problem, according to Samantha Schiavon, MA, a graduate student in medical and clinical psychology, and her colleagues at the University of Alabama at Birmingham.
They performed a study that found a variety of factors associated with increased risk of opioid overdose, including witnessing an overdose (a friend or others), chronic hepatitis C virus (HCV) infection, and a higher frequency of distinct buprenorphine treatment episodes.
Data were acquired during Nov. 2015-July 2017 from an ongoing study to determine the impact of the distribution of naloxone kits to individuals at high risk for opioid overdose. All 247 participants included were considered at high risk of opioid overdose because they were recruited from sites providing opioid addiction treatment, including a residential drug treatment facility (43%), inpatient treatment following ED admittance (25%), and criminal justice supervision (32%). Of the participants, 57% were male, with a mean age of around 34 years; most were white (89%).
Participants were assessed using a self-reporting 30-item questionnaire regarding chronic medical conditions, STIs, past and current opioid misuse, nonfatal opioid overdose experiences, and frequency of every distinct opioid treatment episode including buprenorphine, methadone maintenance clinics, residential drug rehabilitation programs, and intensive outpatient treatment. All variables were answered on a 5-point scale ranging from 0 (never) to 4 (more than three times), according to the researchers.
Participants who witnessed a friend’s overdose (odds ratio, 4.21; 95% confidence interval, 1.99-8.89) showed the highest risk of personal overdose, while having witnessed others overdose at a higher frequency carried a lower increased risk (OR, 1.42; 95% CI, 1.11-1.82).
HCV infection was associated with a more than twofold increase in overdose risk (OR, 2.44; 95% CI, 1.20-4.97), likely because of the strong association between HCV and heroin injection drug use, according to the researchers. They added that this association may be an indicator of higher-risk injection behavior, including needle sharing. They also suggested that, given the current epidemiology of HCV infection, identifying HCV infections may benefit younger populations who may be at risk of an overdose from riskier injection practices or where injection drug risk is not yet known.
The researchers reported that a higher frequency of distinct buprenorphine treatment episodes also led to increased risk (OR, 1.55; 95% CI, 1.17-2.07), whereas a greater frequency of distinct methadone treatment episodes was related to decreased odds of experiencing a nonfatal overdose (OR, 0.67; 95% CI, 0.49-0.91) according to their report published in Addictive Behavior (2018;86:51-5).
In addition, those who experienced a past opioid overdose were more likely to have obtained methadone illicitly (65%; P less than or equal to .001) or have a friend who died from an overdose (90%; P = .001) compared with those who have not experienced an overdose, according to the researchers.
“The current study strongly contributes to our understanding of risk factors of experiencing an opioid overdose. The knowledge gained from this study may enable targeted treatment interventions to reduce preventable deaths from opioid overdose,” according to the researchers. In particular, they pointed out the increased risk of overdose with the use of illicitly obtained methadone and suggested that expanded access to medication-assisted treatments be made available to all patients. “Opioid antagonist medications such as naltrexone may be particularly helpful in preventing opioid overdose for patients leaving controlled environments such as hospital, drug treatment, and correctional facilities,” they concluded.
The researchers reported that they had no conflicts of interest.
SOURCE: Schiavon S et al. Addict Behav. 2018;86:51-5.
FROM ADDICTIVE BEHAVIORS
Key clinical point: The greatest increased risk of opioid overdose was associated with witnessing a friend’s overdose and chronic hepatitis C virus infection.
Major finding: Witnessing a friend’s overdose was associated with the highest risk of personal overdose (OR, 4.21).
Study details: 247 participants who were considered at high risk of opioid overdose and were recruited from sites providing opioid addiction treatment.
Disclosures: The authors reported that they had no conflicts of interest.
Source: Schiavon S et al. Addict Behav. 2018;86:51-5.

Cognitive Behavioral Therapy for Veterans With Tinnitus
Chronic tinnitus is defined as nonsensical, persistent sound in the head or ears with no external sound source that persists for more than 6 months.1 It is most commonly associated with sound trauma, aging, head injury, and damage to the ear structures.2 Tinnitus affects up to 30% of military veterans, a prevalence rate that is twice that of the nonveteran population.3 It also is the most common service-connected disability for veterans.4 In 2016, more than 1.6 million veterans had service-connected tinnitus.
Clinical management of tinnitus is the purview of audiologists, although their role in providing this service is not well defined.5 Following an audiologic evaluation for hearing loss, devices such as hearing aids, ear-level sound generators, or sounds played through speakers may be prescribed. However, effectiveness of these devices has been shown only when coupled with counseling.6 Counseling provided by audiologists often includes education about tinnitus etiology, maintaining hearing health, and use of sound to manage tinnitus. Length, content of care, and follow-up services vary among audiologists.
Given the importance of counseling and the added complexities of mental health and behavioral health comorbidities (eg, depression, anxiety, sleep disorders), various psychological therapies delivered by mental health specialists for tinnitus management have been explored.7-11 In fact, only psychological therapies have been documented to be efficacious for mitigating the negative effects of tinnitus on sleep, concentration, communication, and emotions.12 Among these approaches, cognitive behavioral therapy (CBT) has the strongest empirical support, particularly in terms of improving quality of life (QOL) and reducing depressive symptoms.11,12 Cognitive behavioral therapy for tinnitus is derived from social cognitive theory (SCT) and modeled after CBT for depression, anxiety, pain, and insomnia.11,13-15
Cognitive behavioral therapy helps patients with tinnitus reconceptualize the auditory problem as manageable and encourages acquisition, practice, and use of a range of specific tinnitus coping strategies to enhance perceptions of self-control and self-efficacy. Cognitive behavioral therapy involves a number of distinct therapeutic components, and there is no consensus about the efficacious components of CBT for tinnitus. For example, use of sound and purposeful exposure to tinnitus varies among providers.16 Additional questions about CBT pertain to its clinical implementation (eg, group vs individual sessions, frequency and length of sessions, in-person sessions vs delivery via telephone or Internet).
Programs offered at the Department of Veterans Affairs (VA) facilities take veteran-specific factors into account to promote optimal engagement and outcomes. Factors that differentiate veterans from civilians include (1) increased probability of low health literacy and low socioeconomic status among seniors17; (2) increased likelihood of acoustic and/or psychological trauma3,18; (3) overrepresentation of males; and (4) increased probability of mental health diagnoses.19,20 At the same time, veterans are highly diverse with respect to age, academic achievement, cultural background, medical and mental health comorbidities, and economic resources.17 In spite of this diversity, most veterans are unified by their sense of camaraderie, loyalty to country, and adherence to discipline and order.21 Peer support and other variables such as compassionate understanding of their military experiences may be especially important to consider when designing behavioral interventions for veterans.
The present phenomenologic study was motivated by the need to develop and test a veteran-specific CBT for tinnitus protocol (VET CBT-T). To examine veterans’ experiences with VET CBT-T, we designed a small pilot randomized controlled trial (RCT) of VET CBT-T comparing it to structured audiologist counseling (AC). A mixed quantitative and qualitative approach was employed, including assessing veterans’ acceptance of care, identifying aspects that can be modified to improve outcomes, and obtaining feasibility data to guide refinements to VET CBT-T to inform a larger RCT.
Methods
The study used a single-blind, randomized, parallel treatment (VET CBT-T vs AC) concurrent design complemented by collection of qualitative data. This study was approved by the institutional review board at the VA Connecticut Healthcare System (VACHS) and was registered at ClinicalTrials.gov (NCT00724152). 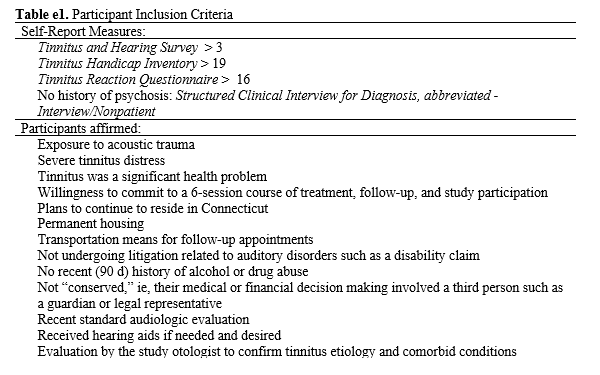
Measures
Four standardized measures were administered to potential participants. Callers were screened for eligibility by the research coordinator using Section A of the Tinnitus and Hearing Survey (THS), which had been developed to screen candidates for tinnitus studies by phone.22 The THS contains 3 sections to identify problems related to tinnitus (Section A), hearing (Section B), and sound tolerance (Section C). Section A contains 4 items, each with a possible score of 0 to 4, which identifies tinnitus problems. Callers who were veterans and who met the necessary cutoff of 4 out of 16 possible points on Section A were invited to meet in-person with the research coordinator to obtain written informed consent and conduct a thorough assessment of eligibility.23
Three additional assessment measures were then administered sequentially to determine eligibility. The first 2 of these measures were readministered to eligible candidates who agreed to participate in the study and were used to examine outcomes:
(1) Tinnitus Handicap Inventory (THI): The 25-item THI provides an index score (0-100), with higher scores reflecting poorer QOL and more perceived functional limitations due to tinnitus.24 Candidates with scores of ≤ 19 were excluded.
(2) Tinnitus Reaction Questionnaire (TRQ): The TRQ measures perceived impact of tinnitus on QOL with emphasis on emotional consequences of tinnitus.25 Higher scores indicate more severe impact. Scores of ≥ 17 points purportedly indicate significant tinnitus disturbance. Candidates scoring < 17 were excluded.
(3) Structured Clinical Interview for Diagnosis, Abbreviated-Interview/Nonpatient (SCIDa-I/NP): The SCIDa-I/NP is a measure used to assess symptoms of psychopathology.26 Candidates with a lifetime history of psychosis were excluded.
Interventions
Each of the interventions was offered using 6 group sessions, with 2 or more participants, on an approximate weekly schedule.
VET CBT-T. Two primary texts served as resources for developing the VET CBT-T protocol: (1) the Psychological Management of Chronic Tinnitus: A Cognitive-Behavioral Approach14; and (2) a manual for providing CBT for the treatment of chronic pain.27,28 Draft materials were developed by the clinical psychologist, including a clinician’s manual for providing VET CBT-T. Handouts were provided to each veteran. Components were compared to another unpublished CBT for tinnitus workbook.10
Key components targeted psychological difficulties including sleep disturbance, reduced functioning, low mood, nervousness, reduced pleasure from activities, and negative changes in relationships. The protocol emphasized basic information about tinnitus; relationships among tinnitus, acoustic trauma, and mental health symptoms; veterans’ sense of camaraderie and loyalty; and goal setting, making use of discipline and order veterans may desire.
To build rapport, the psychologist used reflective listening, encouraged interactive dialogue, and promoted participant understanding. Since tinnitus is thought to be exacerbated by stress, participants learned ways to manage stress and practiced relaxation exercises. Participants learned to create individualized, intersession goals that were realistic, specific, and measurable to promote self-efficacy. They also learned to list and increase pleasant activities to distract from tinnitus, improve QOL, and enable behavioral activation. Motivational interviewing addressed readiness, ambivalence, and resistance to achieving these specific goals. Participants also learned to identify and modify unhelpful thoughts about tinnitus (ie, cognitive restructuring). 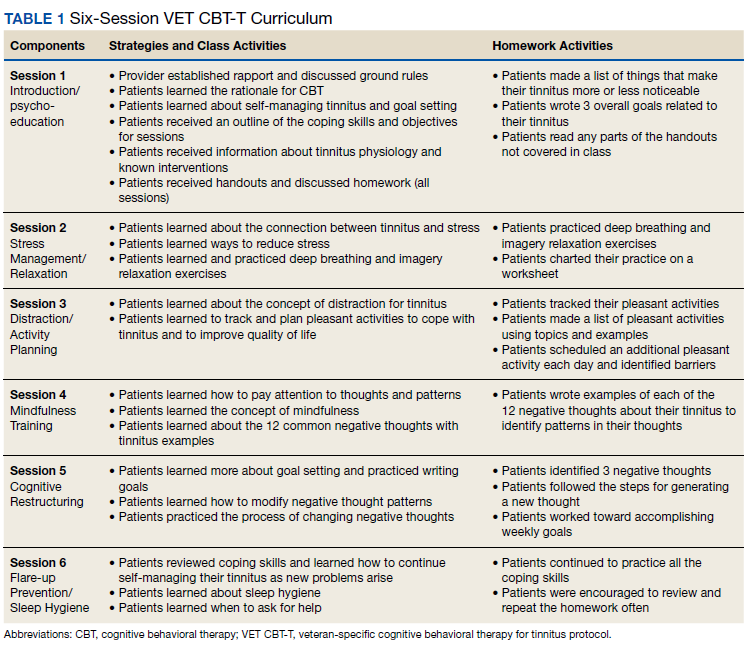
Audiologist Counseling (AC). To control for patient contact in VET CBT-T, the study audiologist created a 6-session counseling protocol. The AC emphasized education about tinnitus and available tinnitus interventions. Participants were encouraged to ask questions, share their tinnitus experiences, and cope with tinnitus by avoiding silence. 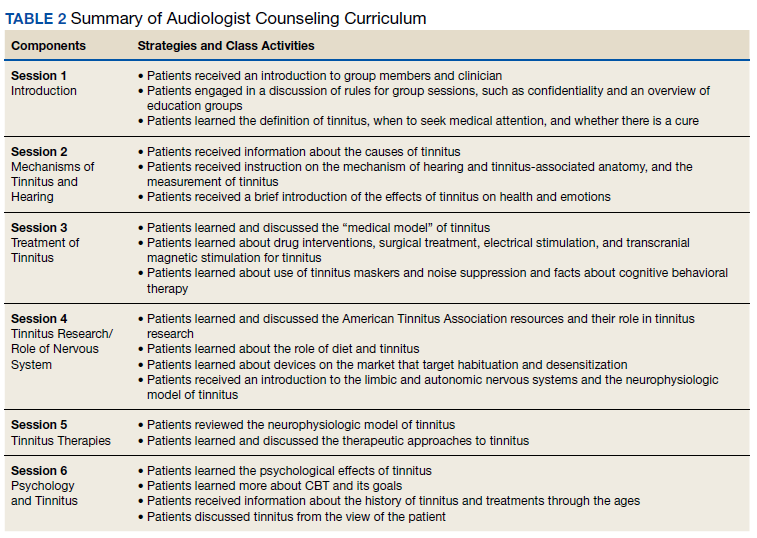
Quantitative Analysis
To assess baseline between-group differences, pretreatment (t1;immediately prior to attending the first group session) administrations of the THI and TRQ were compared using t tests. Demographics between groups were compared using the chi-square test.
The THI and TRQ were readministered following completion of the last group session (t2) and about 8 weeks after the last group session (t3). Because of the small sample size, required assumptions for analyzing parametric tests of linear effects were not met. Thus, only descriptive results and mean differences in scores on the THI and TRQ between these 3 assessment periods are presented. SPSS PASW Statistics 18.0 (Hong Kong, China) was used for analyses.
Qualitative Analysis
VET CBT-T. After each VET CBT-T session, veterans’ acceptance of the protocol was assessed using 4 questions: (1) Was the information presented to you today easy to understand? Yes/No. If no, why not? (2) Were the examples (if there were any) useful? Yes/No. If no, why not? (3) Was the way the information was presented by the group leader helpful? Yes/No. If no, why not? and (4) Please tell us what you thought about today’s group. Participants were encouraged to be honest and provide detailed feedback. To facilitate unbiased responding, the group leader left the room while a research assistant collected the comments.
Participants’ experiences and acceptance of the interventions were explored using a stepwise content analysis approach.29,30First, the feedback data were prepared for analysis by entering verbatim responses into a spreadsheet. Next, these responses were reviewed by the clinical psychologist who identified themes. Examination of data involved qualitative analyses in which the phenomenon of interest was veterans’ acceptance of the interventions. This process presumed that most veterans would respond favorably to the intervention and, thus, acknowledged that the clinical psychologist designed and delivered the intervention.
Any contrary or negative comments were flagged. However, neutral and positive comments also were analyzed and tallied. Notations within each comment were used to calculate the number of occurrences of themes. Similar themes with few responses were collapsed into a single theme when appropriate. Final themes and tallies were shared with an auditor familiar with tinnitus, psychology, and qualitative methods who made comments and checked tallies within each theme. The themes were revised based on this audit and retallied. The clinical psychologist then summarized the themes in text, which was reviewed by the auditor for accuracy in capturing the important emergent themes.
Next, themes were used to examine typed verbatim transcripts from the second and fifth sessions of the intervention. Thematic content derived from the above feedback was extracted from the transcripts by the clinical psychologist. Then the study audiologist read the transcripts to confirm or reject these comments as relevant to the themes. Additional comments were nominated by the study audiologist and reviewed by the clinical psychologist who finalized feedback thought to best represent the themes.
Results
One hundred ninety-six persons inquired about the study (Figure 1). 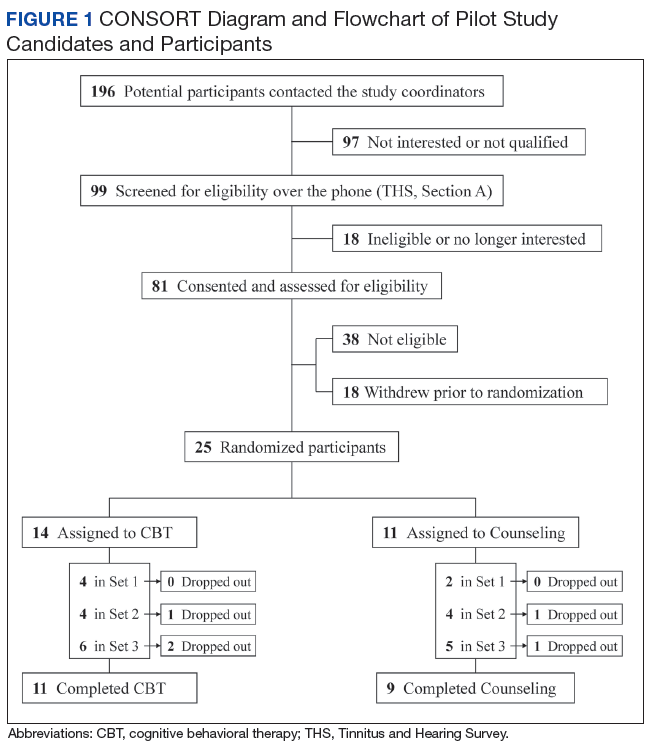
After being deemed eligible by the otologist as having tinnitus associated with sound trauma, the remaining 25 eligible and interested candidates were randomized into the 2 treatment arms. To reduce attrition, formation of groups took into account participants’ preferred appointment days and times. When 3 or more participants were allocated to a treatment arm, group sessions were scheduled. Five (20%) participants were lost to attrition, including 1 randomized to VET CBT-T and 2 to AC who dropped out prior to receiving any intervention, and 2 randomized to VET CBT-T who dropped out after attending 1 session. Reasons stated for dropping out included concerns they would not learn new information, inability to tolerate sound in a group, unexpected moves out of the area, lack of time, loss of interest, and family emergencies. 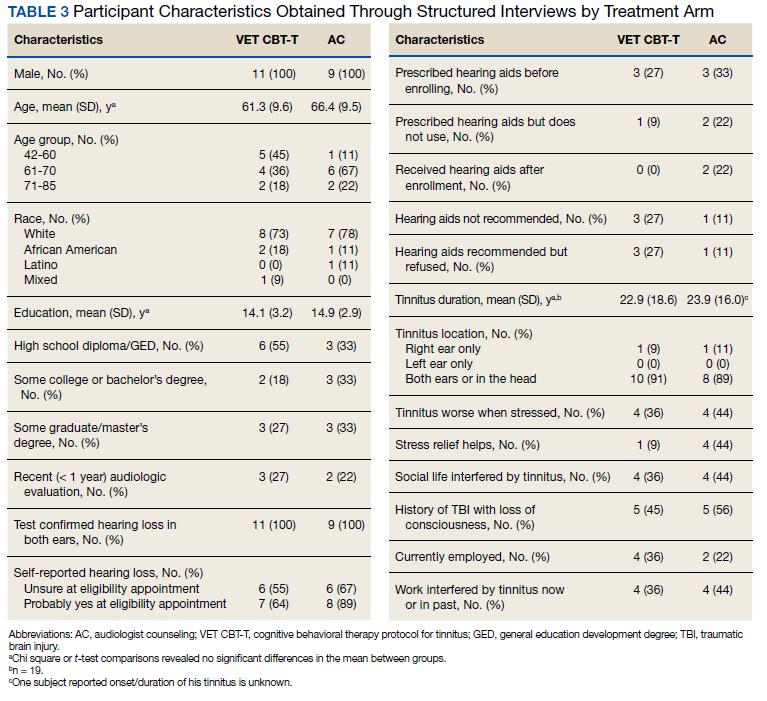
Quantitative Analysis
Participants in the 2 treatment arms did not differ significantly on the pretreatment (t1) THI (t = 1.39, df = 18, P = .18) or TRQ (t = 0.99, df = 18, P = .33) scores. Differences in THI scores were computed from pre- to posttreatment (VET CBT-Tt1−t2 = 6.2; ACt1−t2 = 10.0) and from pretreatment to 8-week follow-up (VET CBT-Tt1−t3 = 4.4; ACt1−t3 = 9.1). Similarly, differences in mean TRQ index scores were computed from pre- to posttreatment (VET CBT-Tt1−t2 = 5.3; ACt1−t2 = 7.6) and from pretreatment to 8 weeks follow-up (VET CBT-Tt1−t3 = 1.5; ACt1−t3 = 5.6). These mean differences reveal consistent reductions in mean index scores (improved tinnitus-related QOL) between time points for each treatment arm, but do not indicate statistically or clinically significant reductions of distress.
Qualitative Analysis
The 89 comments that participants provided after the 18 VET CBT-T sessions (3 series of 6 sessions each) were mostly positive (67 responses, 75%) (eTable 2). 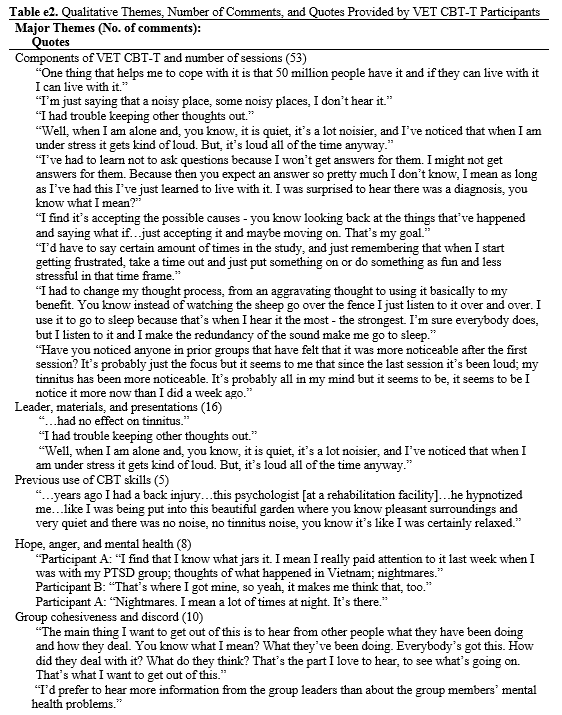
Components of VET CBT-T and Number of Sessions (n = 53)
Psychoeducation and Sound Enrichment. Participants generally appreciated the psychoeducation component of VET CBT-T, including basic information about the prevalence of tinnitus, mechanics of the ear and hearing, and how an enriched sound environment may assist with coping (5 comments).
Stress Reduction. Two of the 14 participants who commented on the stress reduction session (via relaxation exercises) noted that it was helpful in their lives overall but “had no effect on tinnitus.”
Goal Setting. Nine participants noted that they valued the goal-setting strategies and long-term relapse planning, one writing that he was “…glad to be encouraged to document and set specific, documented goals each week.”
Cognitive Restructuring and Acceptance. Participants reported that the cognitive restructuring session was important for “accepting” their tinnitus (9 comments). Overall cognitive restructuring appeared to be well received by participants as a concept when learning ways to cope with tinnitus.
Distraction. Of the 8 comments that regarded the increasing-pleasant-activities session, 1 participant reported that the pleasant activities worksheet had a female bias and that activities on one of the worksheets “were not helpful and overlapped too much.” A participant suggested that group leaders allow participants to brainstorm pleasant activities using an open-ended format instead of using categories of pleasant activities. Participants generally found the increasing-pleasant-activities component very beneficial for managing tinnitus.
Self-Hypnosis and Exposure Therapy. Two components not presented during VET CBT-T were identified by participants as potentially desirable. One participant suggested providing information on self-hypnosis and another stated that he focuses on his tinnitus to cope, much like exposure therapy for tinnitus.
Number of Sessions. One participant wrote after the last (sixth) session that he was “glad it’s over” possibly suggesting the intervention was too long. Another participant stated at the fifth session, “I basically want to get out of here—out of this, out of these meetings.” Conversely a participant stated, “I was kind of hoping there was one more after next week.” Another participant explained the intervention itself can be in conflict with its own stated goals of attending less to tinnitus.
Leader, Materials, and Presentations (n = 16).
Overall, the participants had positive experiences (15 comments) with their study therapist. They noted that the group leader was “flexible” and “did a great job of facilitating discussion.” One participant commented on the need for better visual presentations of the information and the need for the group leader to “use her own words” rather than reading the content.
Previous Use of CBT Skills (n = 5).
Five participants noted that information presented was “not new” and that they had acquired the coping skills spontaneously years earlier. Two expressed relief that some of the ways they had been dealing with their tinnitus prior to the intervention were actually recommended. One discussed that reviewing skills that he had already implemented was helpful.
Hope, Anger, and Mental Health (n = 8).
Three participants indicated the intervention gave them “hope” that they will learn ways to cope with tinnitus. One noted that the discussion regarding depression as a commonly co-occurring condition with tinnitus should include a better description of depressive symptoms. Two expressed relief to receive help for their frustration and anger resulting from tinnitus, and 1 participant discussed the added frustration of hearing loss with tinnitus. Excessive alcohol use to cope with tinnitus and the comorbidity of tinnitus and PTSD also were discussed.
Group Cohesiveness (n = 8)/Discord (n = 2).
Many group members commented that they enjoyed listening to information about tinnitus and sharing their experiences. There was friendly interaction and discussion among most of the participants. They commented that it was informative to see that others were coming forward for help and were interested to hear others’ experiences. The group format was mostly welcomed and appreciated. However, group discord occurred when topics other than tinnitus were shared, such as recovery from substance abuse. Two feedback comments indicated that this discussion was unwelcomed.
Discussion
This pilot study provides evidence that at least some of the veterans who were eligible and participated accrued benefit from either AC or VET CBT-T. There also is evidence that a structured and intensive counseling approach by an audiologist that does not include sound therapy is beneficial. Participants generally found that the interventions were acceptable for understanding basic information about tinnitus, and those in the VET CBT-T treatment arm reported improvements in problem solving and coping.
The planned qualitative analyses enabled in-depth examination of intervention feedback from participants and revealed important themes for modifying the VET CBT-T intervention, which occurred following completion of this pilot study. Further, these themes echo the success in creating a unique, veteran-centric, CBT intervention for tinnitus management.
Primarily, participants indicated that education about tinnitus prevalence, etiology, and sound enrichment assisted in coping with tinnitus. This theme also reflects the protocol’s emphasis on health literacy. The wide availability of misinformation on tinnitus, along with the potential for monetary scams, underlies the need for well-designed and research-informed tinnitus education programs. Helping veterans distinguish facts and myths is a potentially important element of tinnitus management. Experiences coping with trauma were salient as participants diverged in their opinions regarding the appropriateness of discussing these issues during a tinnitus management group.
Specific themes emerged regarding the relevance of posttraumatic stress disorder (PTSD) symptoms and substance use to cope with tinnitus. Comfort levels when hearing and discussing these symptoms varied among participants. Due to the high comorbidities of mental health disorders and tinnitus, this theme is important to consider when designing tinnitus management programs. Other qualitative themes served to validate peer support and that the veteran-centric protocol was acceptable, including positive regard for goal setting, indicating that adherence to discipline and order had been addressed.
Identified VET CBT-T Modifications
There were multiple indicators that the rationale for sessions needed to be clarified. Participants highlighted the need to hear clear expectations about what the coping skills would address and multiple reminders regarding the goals of relaxation exercises for tinnitus. Some expressed concern about their lack of concentration during the relaxation exercises. A concern that was discussed with participants only during the informed consent process was the possibility that the intervention could increase focus on tinnitus and, thus, temporarily increase tinnitus distress while receiving the intervention.
Need for Interdisciplinary Care
Perhaps the fact that both interventions were beneficial is not surprising since AC as delivered in this study was designed to be an active intervention that incorporated education and support, including some components similar to those included in VET CBT-T. It appears that AC designed to match the CBT intervention in terms of number of sessions among other enhancements suggests that this intervention may be efficacious. The AC intervention offered support and education about tinnitus; however, sound therapy was not provided despite some empirical support for its use.31 Future research should examine whether sound therapy adds benefit to an intensive and structured AC approach.
It has been proposed that a combination of CBT delivered by a mental health provider and AC should be implemented as an optimal tinnitus management protocol.31,32 Results of this and a number of other recent studies 16,32,33 encourage an integrated, interdisciplinary approach.
Findings of the present study were applied toward development of a hierarchical and interdisciplinary tinnitus management protocol, Progressive Tinnitus Management (PTM).22,34 Components of VET CBT-T were selected for the intervention provided with PTM, modified as per the feedback from participants in this study. This approach was combined with components of the AC intervention, further complemented by sound therapy. The new combined protocol was tested in a pilot telephone study of PTM for veterans and military members with positive results.32 Two VA-supported RCTs of PTM have since been completed.35,36 Results indicate that relative to wait list control, PTM is effective in mitigating negative effects of tinnitus.
Last, after this pilot study, the protocol was modified to address participants’ concerns that their primary care and other providers were unaware that interventions for tinnitus exist. Providers offering tinnitus care are now encouraged to share its availability with veterans and other clinicians. This study provides compelling evidence that veterans respond to messages of hope from providers that they do not needlessly have to suffer alone. Rather than telling veterans to “just live with it,” primary care providers should be able to offer ideas and services for learning how to live with tinnitus.
Future Directions
Future revisions of VET CBT-T could incorporate “acceptance” as a concept for coping with tinnitus, components such as self-hypnosis and exposure therapy, and strategies for coping with hearing loss and communication difficulties. Reexamination of the number and length of sessions also is encouraged, as well as integration of evidence-based interventions for comorbid conditions such as PTSD, substance use disorders, and insomnia. Perhaps increasing the use of peer support services would help reach veterans concerned by the stigma of receiving mental health care. Some veterans were dissatisfied with hearing about others’ mental health concerns. It may be beneficial to offer tinnitus interventions to cohorts of veterans identified with specific comorbid mental health or substance use disorders. However, peer support may be more important than protecting veterans from hearing about others’ mental health concerns as social cognitive theory suggests.
Limitations
This feasibility study’s strict inclusion criteria resulted in a small but well-defined sample that may not be representative of the larger population of veterans who could potentially benefit from these interventions. The extensive evaluation requirements and eligibility requirements likely enhanced the internal validity of the trial but may have compromised the external validity and generalizability of the study findings.
While a few women were assessed during the eligibility process, unfortunately, only men were deemed eligible. It is therefore unknown how women veterans would receive this protocol. Currently there is a bias in selecting male participants for tinnitus research. It is hoped that in the future a sample of women veterans could also provide feedback on this tinnitus management protocol developed by the VHA.
The fact that a large proportion of those who made initial contact about the study decided not to follow up is not inconsistent with studies of similar psychological interventions.37 Challenges related to engaging otherwise appropriate candidates in psychological interventions for a range of chronic health concerns have been well described and may apply to tinnitus management.
Conclusion
The qualitative feedback from participants was generally positive for both protocols. Emergent themes confirmed the need for a veteran-specific intervention while highlighting individual veterans’ needs. Transcripts from sessions provided additional descriptive information that identified changes to the protocols that would improve veterans’ receipt of care. Due to the abundance of veterans with tinnitus and the needs of veterans in terms of health care delivery and receipt, an interdisciplinary CBT-plus-AC protocol was created that is specific to and accepted by veterans with tinnitus.
Refinements to the VET CBT-T protocol were identified that led to development of PTM that was the subject of another small study, which then led to the authors’ 2 larger RCTs. Attempts were made to include greater attention to the mental health concerns of veterans both in terms of education and in offering sensitive delivery of the protocol. Session content was used to create an organized, visual presentation that follows an organized workbook.22,35 Refinements to the protocol are ongoing.
Acknowledgments
This material was based on work supported by US Department of Veterans Affairs, Rehabilitation Research and Development (RR&D): (1) R.D. Kerns’ Pilot Merit Grant #C6324P and (2) C.J. (Kendall) Schmidt’s Career Development Award-1 #D6848M. The authors would like to acknowledge the assistance from Rebecca Czlapinski, MA; Kathryn LaChappelle, MPH; and Emily Thielman, MS, for the conduct of the study, data collection and management, and preparation of this manuscript.
1. Henry JA. “Measurement” of tinnitus. Otol Neurotol. 2016;37(8):e276-e285.
2. Hoffman HJ, Reed GW. Epidemiology of tinnitus. In Snow JB, ed. Tinnitus: Theory and Management. Hamilton, Canada: BC Becker; 2004:16-41.
3. Folmer RL, Theodoroff SM, Martin WH, Shi Y. Experimental, controversial, and futuristic treatments for chronic tinnitus. J Am Acad Audiol. 2014;25(1):106-125.
4. US Department of Veterans Affairs. Veterans Benefits Administration annual benefits report fiscal year 2016. https://www.benefits.va.gov/REPORTS/abr/ABR-All_Sec tions_FY16_06292017.pdf . Accessed June 19, 2018.
5. Henry JA, Zaugg TL, Myers PJ, Schechter MA. The role of audiologic evaluation in progressive audiologic tinnitus management. Trends Amplif. 2008;12(3):170-187.
6. Hoare DJ, Searchfield GD, El Refaie A, Henry JA. Sound therapy for tinnitus management: practicable options. J Am Acad Audiol. 2014;25(1):62-75.
7. Andersson G, Porsaeus D, Wiklund M, Kaldo V, Larsen HC. Treatment of tinnitus in the elderly: a controlled trial of cognitive behavior therapy. Int J Audiol. 2005;44(11):671-675.
8. Henry JL, Wilson PH. Coping with tinnitus: two studies of psychological and audiological characteristics of patients with high and low tinnitus-related distress. Int Tinnitus J. 1995;1(2):85-92.
9. Henry JL, Wilson PH. The psychological management of tinnitus: comparison of a combined cognitive educational program, education alone and a waiting-list control. Int Tinnitus J. 1996;2:9-20.
10. Robinson SK, Viirre ES, Bailey KA, et al. A randomized controlled trial of cognitive-behavior therapy for tinnitus. Int Tinnitus J. 2008;14(2):119-126.
11. Martinez-Devesa P, Perera R, Theodoulou M, Waddell A. Cognitive behavioural therapy for tinnitus. Cochrane Database Syst Rev. 2010(9):CD005233.
12. Tunkel DE, Bauer CA, Sun GH, et al. Clinical practice guideline: tinnitus. Otolaryngol Head Neck Surg. 2014;151(Suppl)(2):S1-S40.
13. Beck JS. Cognitive Behavior Therapy: Basics and Beyond. 2nd ed. New York, NY: Guilford Press; 2011.
14. Henry JL, Wilson PH. The Psychological Management of Chronic Tinnitus : A Cognitive-Behavioral Approach. Boston, MA: Allyn and Bacon; 2001.
15. Bandura A. Health promotion by social cognitive means. Health Educ Behav. 2004;31(2):143-164.
16. Cima RF, Andersson G, Schmidt CJ, Henry JA. Cognitive-behavioral treatments for tinnitus: a review of the literature. J Am Acad Audiol. 2014;25(1):29-61.
17. Rodriguez V, Andrade AD, García-Retamero R, et al. Health literacy, numeracy, and graphical literacy among veterans in primary care and their effect on shared decision making and trust in physicians. J Health Commun. 2013;18(suppl 1):273-289.
18. Seal KH, Metzler TJ, Gima KS, Bertenthal D, Maguen S, Marmar CR. Trends and risk factors for mental health diagnoses among Iraq and Afghanistan veterans using Department of Veterans Affairs health care, 2002-2008. Am J Public Health. 2009;99(9):1651-1658.
19. Thomas JL, Wilk JE, Riviere LA, et al. Prevalence of mental health problems and functional impairment among active component and National Guard soldiers 3 and 12 months following combat in Iraq. Arch Gen Psychiatry. 2010;67(6):614-623.
20. Zivin K, McCarthy JF, McCammon RJ, et al. Health-related quality of life and utilities among patients with depression in the Department of Veterans Affairs. Psychiatr Serv. 2008;59(11):1331-1334.
21. Costa DL, Kahn ME. Health, wartime stress, and unit cohesion: evidence from Union Army veterans. Demography. 2010;47(1):45-66.
22. Henry JA, Zaugg TL, Myers PJ, Kendall (Schmidt) CJ. Progressive Tinnitus Management: Clinical Handbook for Audiologists. San Diego, CA: Plural Publishing; 2010.
23. Henry JA, Schechter MA, Loovis CL, et al. Clinical management of tinnitus using a “progressive intervention” approach. J Rehabil Res Dev. 2005;42(4 suppl 2):95-116.
24. Newman CW, Jacobson GP, Spitzer JB. Development of the Tinnitus Handicap Inventory. Arch Otolaryngol Head Neck Surg. 1996;122(2):143-148.
25. Wilson PH, Henry JL, Bowen M, Haralambous G. Tinnitus Reaction Questionnaire: psychometric properties of a measure of distress associated with tinnitus. J Speech Hear Res. 1991;34(1):197-201.
26. First MB, Spitzer RL, Gibbon M, Williams JBW. Structured Clinical Interview for DSM-IV Axis I Disorders (SCID-I) Clinical Version, Administration Booklet. Washington, DC: American Psychiatric Press; 2012.
27. Kerns RD, Thorn BE, Dixon KE. Psychological treatments for persistent pain: an introduction. J Clin Psychol. 2006;62(11):1327-1331.
28. Otis JD. Managing Chronic Pain: A Cognitive-Behavioral Therapy Approach. New York, NY: Oxford; 2007.
29. Sandelowski M. Whatever happened to qualitative description? Res Nurs Health. 2000;23(4):334-340.
30. Mertens DM. Research and Evaluation in Education and Psychology: Integrating Diversity With Quantitative, Qualitative, and Mixed Methods. 3rd ed. Los Angeles, CA: Sage; 2009 .
31. Hobson J, Chisholm E, El Refaie A. Sound therapy (masking) in the management of tinnitus in adults. Cochrane Database Syst Rev. 2010;(12):CD006371.
32. Henry JA, Zaugg TL, Myers PJ, et al. Pilot study to develop telehealth tinnitus management for persons with and without traumatic brain injury. J Rehabil Res Dev. 2012;49(7):1025-1042.
33. Weise C, Heinecke K, Rief W. Biofeedback-based behavioral treatment for chronic tinnitus: results of a randomized controlled trial. J Consult Clin Psychol. 2008;76(6):1046-1057.
34. Henry JA, Zaugg TL, Myers PJ, Kendall (Schmidt) CJ. How to Manage Your Tinnitus: A Step-by-Step Workbook, 3rd ed. San Diego, CA: Plural Publishing; 2010.
35. Henry JA, Thielman EJ, Zaugg TL, et al. Randomized controlled trial in clinical settings to evaluate effectiveness of coping skills education used with Progressive Tinnitus Management. J Speech Lang Hear Res. 2017;60(5):1378-1397.
36. Henry, JA, Thielman, E, Zaugg, et al. Telephone-based progressive tinnitus management for persons with and without traumatic brain injury: a randomized controlled trial. Ear Hear. 2018. [Epub ahead of print.]
37. Chang MW, Nitzke S, Brown R, et al. Recruitment challenges and enrollment observations from a community based intervention (Mothers In Motion) for low-income overweight and obese women. Contemp Clin Trials Commun. 2017;5:26-33.
Chronic tinnitus is defined as nonsensical, persistent sound in the head or ears with no external sound source that persists for more than 6 months.1 It is most commonly associated with sound trauma, aging, head injury, and damage to the ear structures.2 Tinnitus affects up to 30% of military veterans, a prevalence rate that is twice that of the nonveteran population.3 It also is the most common service-connected disability for veterans.4 In 2016, more than 1.6 million veterans had service-connected tinnitus.
Clinical management of tinnitus is the purview of audiologists, although their role in providing this service is not well defined.5 Following an audiologic evaluation for hearing loss, devices such as hearing aids, ear-level sound generators, or sounds played through speakers may be prescribed. However, effectiveness of these devices has been shown only when coupled with counseling.6 Counseling provided by audiologists often includes education about tinnitus etiology, maintaining hearing health, and use of sound to manage tinnitus. Length, content of care, and follow-up services vary among audiologists.
Given the importance of counseling and the added complexities of mental health and behavioral health comorbidities (eg, depression, anxiety, sleep disorders), various psychological therapies delivered by mental health specialists for tinnitus management have been explored.7-11 In fact, only psychological therapies have been documented to be efficacious for mitigating the negative effects of tinnitus on sleep, concentration, communication, and emotions.12 Among these approaches, cognitive behavioral therapy (CBT) has the strongest empirical support, particularly in terms of improving quality of life (QOL) and reducing depressive symptoms.11,12 Cognitive behavioral therapy for tinnitus is derived from social cognitive theory (SCT) and modeled after CBT for depression, anxiety, pain, and insomnia.11,13-15
Cognitive behavioral therapy helps patients with tinnitus reconceptualize the auditory problem as manageable and encourages acquisition, practice, and use of a range of specific tinnitus coping strategies to enhance perceptions of self-control and self-efficacy. Cognitive behavioral therapy involves a number of distinct therapeutic components, and there is no consensus about the efficacious components of CBT for tinnitus. For example, use of sound and purposeful exposure to tinnitus varies among providers.16 Additional questions about CBT pertain to its clinical implementation (eg, group vs individual sessions, frequency and length of sessions, in-person sessions vs delivery via telephone or Internet).
Programs offered at the Department of Veterans Affairs (VA) facilities take veteran-specific factors into account to promote optimal engagement and outcomes. Factors that differentiate veterans from civilians include (1) increased probability of low health literacy and low socioeconomic status among seniors17; (2) increased likelihood of acoustic and/or psychological trauma3,18; (3) overrepresentation of males; and (4) increased probability of mental health diagnoses.19,20 At the same time, veterans are highly diverse with respect to age, academic achievement, cultural background, medical and mental health comorbidities, and economic resources.17 In spite of this diversity, most veterans are unified by their sense of camaraderie, loyalty to country, and adherence to discipline and order.21 Peer support and other variables such as compassionate understanding of their military experiences may be especially important to consider when designing behavioral interventions for veterans.
The present phenomenologic study was motivated by the need to develop and test a veteran-specific CBT for tinnitus protocol (VET CBT-T). To examine veterans’ experiences with VET CBT-T, we designed a small pilot randomized controlled trial (RCT) of VET CBT-T comparing it to structured audiologist counseling (AC). A mixed quantitative and qualitative approach was employed, including assessing veterans’ acceptance of care, identifying aspects that can be modified to improve outcomes, and obtaining feasibility data to guide refinements to VET CBT-T to inform a larger RCT.
Methods
The study used a single-blind, randomized, parallel treatment (VET CBT-T vs AC) concurrent design complemented by collection of qualitative data. This study was approved by the institutional review board at the VA Connecticut Healthcare System (VACHS) and was registered at ClinicalTrials.gov (NCT00724152).
Measures
Four standardized measures were administered to potential participants. Callers were screened for eligibility by the research coordinator using Section A of the Tinnitus and Hearing Survey (THS), which had been developed to screen candidates for tinnitus studies by phone.22 The THS contains 3 sections to identify problems related to tinnitus (Section A), hearing (Section B), and sound tolerance (Section C). Section A contains 4 items, each with a possible score of 0 to 4, which identifies tinnitus problems. Callers who were veterans and who met the necessary cutoff of 4 out of 16 possible points on Section A were invited to meet in-person with the research coordinator to obtain written informed consent and conduct a thorough assessment of eligibility.23
Three additional assessment measures were then administered sequentially to determine eligibility. The first 2 of these measures were readministered to eligible candidates who agreed to participate in the study and were used to examine outcomes:
(1) Tinnitus Handicap Inventory (THI): The 25-item THI provides an index score (0-100), with higher scores reflecting poorer QOL and more perceived functional limitations due to tinnitus.24 Candidates with scores of ≤ 19 were excluded.
(2) Tinnitus Reaction Questionnaire (TRQ): The TRQ measures perceived impact of tinnitus on QOL with emphasis on emotional consequences of tinnitus.25 Higher scores indicate more severe impact. Scores of ≥ 17 points purportedly indicate significant tinnitus disturbance. Candidates scoring < 17 were excluded.
(3) Structured Clinical Interview for Diagnosis, Abbreviated-Interview/Nonpatient (SCIDa-I/NP): The SCIDa-I/NP is a measure used to assess symptoms of psychopathology.26 Candidates with a lifetime history of psychosis were excluded.
Interventions
Each of the interventions was offered using 6 group sessions, with 2 or more participants, on an approximate weekly schedule.
VET CBT-T. Two primary texts served as resources for developing the VET CBT-T protocol: (1) the Psychological Management of Chronic Tinnitus: A Cognitive-Behavioral Approach14; and (2) a manual for providing CBT for the treatment of chronic pain.27,28 Draft materials were developed by the clinical psychologist, including a clinician’s manual for providing VET CBT-T. Handouts were provided to each veteran. Components were compared to another unpublished CBT for tinnitus workbook.10
Key components targeted psychological difficulties including sleep disturbance, reduced functioning, low mood, nervousness, reduced pleasure from activities, and negative changes in relationships. The protocol emphasized basic information about tinnitus; relationships among tinnitus, acoustic trauma, and mental health symptoms; veterans’ sense of camaraderie and loyalty; and goal setting, making use of discipline and order veterans may desire.
To build rapport, the psychologist used reflective listening, encouraged interactive dialogue, and promoted participant understanding. Since tinnitus is thought to be exacerbated by stress, participants learned ways to manage stress and practiced relaxation exercises. Participants learned to create individualized, intersession goals that were realistic, specific, and measurable to promote self-efficacy. They also learned to list and increase pleasant activities to distract from tinnitus, improve QOL, and enable behavioral activation. Motivational interviewing addressed readiness, ambivalence, and resistance to achieving these specific goals. Participants also learned to identify and modify unhelpful thoughts about tinnitus (ie, cognitive restructuring).
Audiologist Counseling (AC). To control for patient contact in VET CBT-T, the study audiologist created a 6-session counseling protocol. The AC emphasized education about tinnitus and available tinnitus interventions. Participants were encouraged to ask questions, share their tinnitus experiences, and cope with tinnitus by avoiding silence.
Quantitative Analysis
To assess baseline between-group differences, pretreatment (t1;immediately prior to attending the first group session) administrations of the THI and TRQ were compared using t tests. Demographics between groups were compared using the chi-square test.
The THI and TRQ were readministered following completion of the last group session (t2) and about 8 weeks after the last group session (t3). Because of the small sample size, required assumptions for analyzing parametric tests of linear effects were not met. Thus, only descriptive results and mean differences in scores on the THI and TRQ between these 3 assessment periods are presented. SPSS PASW Statistics 18.0 (Hong Kong, China) was used for analyses.
Qualitative Analysis
VET CBT-T. After each VET CBT-T session, veterans’ acceptance of the protocol was assessed using 4 questions: (1) Was the information presented to you today easy to understand? Yes/No. If no, why not? (2) Were the examples (if there were any) useful? Yes/No. If no, why not? (3) Was the way the information was presented by the group leader helpful? Yes/No. If no, why not? and (4) Please tell us what you thought about today’s group. Participants were encouraged to be honest and provide detailed feedback. To facilitate unbiased responding, the group leader left the room while a research assistant collected the comments.
Participants’ experiences and acceptance of the interventions were explored using a stepwise content analysis approach.29,30First, the feedback data were prepared for analysis by entering verbatim responses into a spreadsheet. Next, these responses were reviewed by the clinical psychologist who identified themes. Examination of data involved qualitative analyses in which the phenomenon of interest was veterans’ acceptance of the interventions. This process presumed that most veterans would respond favorably to the intervention and, thus, acknowledged that the clinical psychologist designed and delivered the intervention.
Any contrary or negative comments were flagged. However, neutral and positive comments also were analyzed and tallied. Notations within each comment were used to calculate the number of occurrences of themes. Similar themes with few responses were collapsed into a single theme when appropriate. Final themes and tallies were shared with an auditor familiar with tinnitus, psychology, and qualitative methods who made comments and checked tallies within each theme. The themes were revised based on this audit and retallied. The clinical psychologist then summarized the themes in text, which was reviewed by the auditor for accuracy in capturing the important emergent themes.
Next, themes were used to examine typed verbatim transcripts from the second and fifth sessions of the intervention. Thematic content derived from the above feedback was extracted from the transcripts by the clinical psychologist. Then the study audiologist read the transcripts to confirm or reject these comments as relevant to the themes. Additional comments were nominated by the study audiologist and reviewed by the clinical psychologist who finalized feedback thought to best represent the themes.
Results
One hundred ninety-six persons inquired about the study (Figure 1).
After being deemed eligible by the otologist as having tinnitus associated with sound trauma, the remaining 25 eligible and interested candidates were randomized into the 2 treatment arms. To reduce attrition, formation of groups took into account participants’ preferred appointment days and times. When 3 or more participants were allocated to a treatment arm, group sessions were scheduled. Five (20%) participants were lost to attrition, including 1 randomized to VET CBT-T and 2 to AC who dropped out prior to receiving any intervention, and 2 randomized to VET CBT-T who dropped out after attending 1 session. Reasons stated for dropping out included concerns they would not learn new information, inability to tolerate sound in a group, unexpected moves out of the area, lack of time, loss of interest, and family emergencies.
Quantitative Analysis
Participants in the 2 treatment arms did not differ significantly on the pretreatment (t1) THI (t = 1.39, df = 18, P = .18) or TRQ (t = 0.99, df = 18, P = .33) scores. Differences in THI scores were computed from pre- to posttreatment (VET CBT-Tt1−t2 = 6.2; ACt1−t2 = 10.0) and from pretreatment to 8-week follow-up (VET CBT-Tt1−t3 = 4.4; ACt1−t3 = 9.1). Similarly, differences in mean TRQ index scores were computed from pre- to posttreatment (VET CBT-Tt1−t2 = 5.3; ACt1−t2 = 7.6) and from pretreatment to 8 weeks follow-up (VET CBT-Tt1−t3 = 1.5; ACt1−t3 = 5.6). These mean differences reveal consistent reductions in mean index scores (improved tinnitus-related QOL) between time points for each treatment arm, but do not indicate statistically or clinically significant reductions of distress.
Qualitative Analysis
The 89 comments that participants provided after the 18 VET CBT-T sessions (3 series of 6 sessions each) were mostly positive (67 responses, 75%) (eTable 2).
Components of VET CBT-T and Number of Sessions (n = 53)
Psychoeducation and Sound Enrichment. Participants generally appreciated the psychoeducation component of VET CBT-T, including basic information about the prevalence of tinnitus, mechanics of the ear and hearing, and how an enriched sound environment may assist with coping (5 comments).
Stress Reduction. Two of the 14 participants who commented on the stress reduction session (via relaxation exercises) noted that it was helpful in their lives overall but “had no effect on tinnitus.”
Goal Setting. Nine participants noted that they valued the goal-setting strategies and long-term relapse planning, one writing that he was “…glad to be encouraged to document and set specific, documented goals each week.”
Cognitive Restructuring and Acceptance. Participants reported that the cognitive restructuring session was important for “accepting” their tinnitus (9 comments). Overall cognitive restructuring appeared to be well received by participants as a concept when learning ways to cope with tinnitus.
Distraction. Of the 8 comments that regarded the increasing-pleasant-activities session, 1 participant reported that the pleasant activities worksheet had a female bias and that activities on one of the worksheets “were not helpful and overlapped too much.” A participant suggested that group leaders allow participants to brainstorm pleasant activities using an open-ended format instead of using categories of pleasant activities. Participants generally found the increasing-pleasant-activities component very beneficial for managing tinnitus.
Self-Hypnosis and Exposure Therapy. Two components not presented during VET CBT-T were identified by participants as potentially desirable. One participant suggested providing information on self-hypnosis and another stated that he focuses on his tinnitus to cope, much like exposure therapy for tinnitus.
Number of Sessions. One participant wrote after the last (sixth) session that he was “glad it’s over” possibly suggesting the intervention was too long. Another participant stated at the fifth session, “I basically want to get out of here—out of this, out of these meetings.” Conversely a participant stated, “I was kind of hoping there was one more after next week.” Another participant explained the intervention itself can be in conflict with its own stated goals of attending less to tinnitus.
Leader, Materials, and Presentations (n = 16).
Overall, the participants had positive experiences (15 comments) with their study therapist. They noted that the group leader was “flexible” and “did a great job of facilitating discussion.” One participant commented on the need for better visual presentations of the information and the need for the group leader to “use her own words” rather than reading the content.
Previous Use of CBT Skills (n = 5).
Five participants noted that information presented was “not new” and that they had acquired the coping skills spontaneously years earlier. Two expressed relief that some of the ways they had been dealing with their tinnitus prior to the intervention were actually recommended. One discussed that reviewing skills that he had already implemented was helpful.
Hope, Anger, and Mental Health (n = 8).
Three participants indicated the intervention gave them “hope” that they will learn ways to cope with tinnitus. One noted that the discussion regarding depression as a commonly co-occurring condition with tinnitus should include a better description of depressive symptoms. Two expressed relief to receive help for their frustration and anger resulting from tinnitus, and 1 participant discussed the added frustration of hearing loss with tinnitus. Excessive alcohol use to cope with tinnitus and the comorbidity of tinnitus and PTSD also were discussed.
Group Cohesiveness (n = 8)/Discord (n = 2).
Many group members commented that they enjoyed listening to information about tinnitus and sharing their experiences. There was friendly interaction and discussion among most of the participants. They commented that it was informative to see that others were coming forward for help and were interested to hear others’ experiences. The group format was mostly welcomed and appreciated. However, group discord occurred when topics other than tinnitus were shared, such as recovery from substance abuse. Two feedback comments indicated that this discussion was unwelcomed.
Discussion
This pilot study provides evidence that at least some of the veterans who were eligible and participated accrued benefit from either AC or VET CBT-T. There also is evidence that a structured and intensive counseling approach by an audiologist that does not include sound therapy is beneficial. Participants generally found that the interventions were acceptable for understanding basic information about tinnitus, and those in the VET CBT-T treatment arm reported improvements in problem solving and coping.
The planned qualitative analyses enabled in-depth examination of intervention feedback from participants and revealed important themes for modifying the VET CBT-T intervention, which occurred following completion of this pilot study. Further, these themes echo the success in creating a unique, veteran-centric, CBT intervention for tinnitus management.
Primarily, participants indicated that education about tinnitus prevalence, etiology, and sound enrichment assisted in coping with tinnitus. This theme also reflects the protocol’s emphasis on health literacy. The wide availability of misinformation on tinnitus, along with the potential for monetary scams, underlies the need for well-designed and research-informed tinnitus education programs. Helping veterans distinguish facts and myths is a potentially important element of tinnitus management. Experiences coping with trauma were salient as participants diverged in their opinions regarding the appropriateness of discussing these issues during a tinnitus management group.
Specific themes emerged regarding the relevance of posttraumatic stress disorder (PTSD) symptoms and substance use to cope with tinnitus. Comfort levels when hearing and discussing these symptoms varied among participants. Due to the high comorbidities of mental health disorders and tinnitus, this theme is important to consider when designing tinnitus management programs. Other qualitative themes served to validate peer support and that the veteran-centric protocol was acceptable, including positive regard for goal setting, indicating that adherence to discipline and order had been addressed.
Identified VET CBT-T Modifications
There were multiple indicators that the rationale for sessions needed to be clarified. Participants highlighted the need to hear clear expectations about what the coping skills would address and multiple reminders regarding the goals of relaxation exercises for tinnitus. Some expressed concern about their lack of concentration during the relaxation exercises. A concern that was discussed with participants only during the informed consent process was the possibility that the intervention could increase focus on tinnitus and, thus, temporarily increase tinnitus distress while receiving the intervention.
Need for Interdisciplinary Care
Perhaps the fact that both interventions were beneficial is not surprising since AC as delivered in this study was designed to be an active intervention that incorporated education and support, including some components similar to those included in VET CBT-T. It appears that AC designed to match the CBT intervention in terms of number of sessions among other enhancements suggests that this intervention may be efficacious. The AC intervention offered support and education about tinnitus; however, sound therapy was not provided despite some empirical support for its use.31 Future research should examine whether sound therapy adds benefit to an intensive and structured AC approach.
It has been proposed that a combination of CBT delivered by a mental health provider and AC should be implemented as an optimal tinnitus management protocol.31,32 Results of this and a number of other recent studies 16,32,33 encourage an integrated, interdisciplinary approach.
Findings of the present study were applied toward development of a hierarchical and interdisciplinary tinnitus management protocol, Progressive Tinnitus Management (PTM).22,34 Components of VET CBT-T were selected for the intervention provided with PTM, modified as per the feedback from participants in this study. This approach was combined with components of the AC intervention, further complemented by sound therapy. The new combined protocol was tested in a pilot telephone study of PTM for veterans and military members with positive results.32 Two VA-supported RCTs of PTM have since been completed.35,36 Results indicate that relative to wait list control, PTM is effective in mitigating negative effects of tinnitus.
Last, after this pilot study, the protocol was modified to address participants’ concerns that their primary care and other providers were unaware that interventions for tinnitus exist. Providers offering tinnitus care are now encouraged to share its availability with veterans and other clinicians. This study provides compelling evidence that veterans respond to messages of hope from providers that they do not needlessly have to suffer alone. Rather than telling veterans to “just live with it,” primary care providers should be able to offer ideas and services for learning how to live with tinnitus.
Future Directions
Future revisions of VET CBT-T could incorporate “acceptance” as a concept for coping with tinnitus, components such as self-hypnosis and exposure therapy, and strategies for coping with hearing loss and communication difficulties. Reexamination of the number and length of sessions also is encouraged, as well as integration of evidence-based interventions for comorbid conditions such as PTSD, substance use disorders, and insomnia. Perhaps increasing the use of peer support services would help reach veterans concerned by the stigma of receiving mental health care. Some veterans were dissatisfied with hearing about others’ mental health concerns. It may be beneficial to offer tinnitus interventions to cohorts of veterans identified with specific comorbid mental health or substance use disorders. However, peer support may be more important than protecting veterans from hearing about others’ mental health concerns as social cognitive theory suggests.
Limitations
This feasibility study’s strict inclusion criteria resulted in a small but well-defined sample that may not be representative of the larger population of veterans who could potentially benefit from these interventions. The extensive evaluation requirements and eligibility requirements likely enhanced the internal validity of the trial but may have compromised the external validity and generalizability of the study findings.
While a few women were assessed during the eligibility process, unfortunately, only men were deemed eligible. It is therefore unknown how women veterans would receive this protocol. Currently there is a bias in selecting male participants for tinnitus research. It is hoped that in the future a sample of women veterans could also provide feedback on this tinnitus management protocol developed by the VHA.
The fact that a large proportion of those who made initial contact about the study decided not to follow up is not inconsistent with studies of similar psychological interventions.37 Challenges related to engaging otherwise appropriate candidates in psychological interventions for a range of chronic health concerns have been well described and may apply to tinnitus management.
Conclusion
The qualitative feedback from participants was generally positive for both protocols. Emergent themes confirmed the need for a veteran-specific intervention while highlighting individual veterans’ needs. Transcripts from sessions provided additional descriptive information that identified changes to the protocols that would improve veterans’ receipt of care. Due to the abundance of veterans with tinnitus and the needs of veterans in terms of health care delivery and receipt, an interdisciplinary CBT-plus-AC protocol was created that is specific to and accepted by veterans with tinnitus.
Refinements to the VET CBT-T protocol were identified that led to development of PTM that was the subject of another small study, which then led to the authors’ 2 larger RCTs. Attempts were made to include greater attention to the mental health concerns of veterans both in terms of education and in offering sensitive delivery of the protocol. Session content was used to create an organized, visual presentation that follows an organized workbook.22,35 Refinements to the protocol are ongoing.
Acknowledgments
This material was based on work supported by US Department of Veterans Affairs, Rehabilitation Research and Development (RR&D): (1) R.D. Kerns’ Pilot Merit Grant #C6324P and (2) C.J. (Kendall) Schmidt’s Career Development Award-1 #D6848M. The authors would like to acknowledge the assistance from Rebecca Czlapinski, MA; Kathryn LaChappelle, MPH; and Emily Thielman, MS, for the conduct of the study, data collection and management, and preparation of this manuscript.
Chronic tinnitus is defined as nonsensical, persistent sound in the head or ears with no external sound source that persists for more than 6 months.1 It is most commonly associated with sound trauma, aging, head injury, and damage to the ear structures.2 Tinnitus affects up to 30% of military veterans, a prevalence rate that is twice that of the nonveteran population.3 It also is the most common service-connected disability for veterans.4 In 2016, more than 1.6 million veterans had service-connected tinnitus.
Clinical management of tinnitus is the purview of audiologists, although their role in providing this service is not well defined.5 Following an audiologic evaluation for hearing loss, devices such as hearing aids, ear-level sound generators, or sounds played through speakers may be prescribed. However, effectiveness of these devices has been shown only when coupled with counseling.6 Counseling provided by audiologists often includes education about tinnitus etiology, maintaining hearing health, and use of sound to manage tinnitus. Length, content of care, and follow-up services vary among audiologists.
Given the importance of counseling and the added complexities of mental health and behavioral health comorbidities (eg, depression, anxiety, sleep disorders), various psychological therapies delivered by mental health specialists for tinnitus management have been explored.7-11 In fact, only psychological therapies have been documented to be efficacious for mitigating the negative effects of tinnitus on sleep, concentration, communication, and emotions.12 Among these approaches, cognitive behavioral therapy (CBT) has the strongest empirical support, particularly in terms of improving quality of life (QOL) and reducing depressive symptoms.11,12 Cognitive behavioral therapy for tinnitus is derived from social cognitive theory (SCT) and modeled after CBT for depression, anxiety, pain, and insomnia.11,13-15
Cognitive behavioral therapy helps patients with tinnitus reconceptualize the auditory problem as manageable and encourages acquisition, practice, and use of a range of specific tinnitus coping strategies to enhance perceptions of self-control and self-efficacy. Cognitive behavioral therapy involves a number of distinct therapeutic components, and there is no consensus about the efficacious components of CBT for tinnitus. For example, use of sound and purposeful exposure to tinnitus varies among providers.16 Additional questions about CBT pertain to its clinical implementation (eg, group vs individual sessions, frequency and length of sessions, in-person sessions vs delivery via telephone or Internet).
Programs offered at the Department of Veterans Affairs (VA) facilities take veteran-specific factors into account to promote optimal engagement and outcomes. Factors that differentiate veterans from civilians include (1) increased probability of low health literacy and low socioeconomic status among seniors17; (2) increased likelihood of acoustic and/or psychological trauma3,18; (3) overrepresentation of males; and (4) increased probability of mental health diagnoses.19,20 At the same time, veterans are highly diverse with respect to age, academic achievement, cultural background, medical and mental health comorbidities, and economic resources.17 In spite of this diversity, most veterans are unified by their sense of camaraderie, loyalty to country, and adherence to discipline and order.21 Peer support and other variables such as compassionate understanding of their military experiences may be especially important to consider when designing behavioral interventions for veterans.
The present phenomenologic study was motivated by the need to develop and test a veteran-specific CBT for tinnitus protocol (VET CBT-T). To examine veterans’ experiences with VET CBT-T, we designed a small pilot randomized controlled trial (RCT) of VET CBT-T comparing it to structured audiologist counseling (AC). A mixed quantitative and qualitative approach was employed, including assessing veterans’ acceptance of care, identifying aspects that can be modified to improve outcomes, and obtaining feasibility data to guide refinements to VET CBT-T to inform a larger RCT.
Methods
The study used a single-blind, randomized, parallel treatment (VET CBT-T vs AC) concurrent design complemented by collection of qualitative data. This study was approved by the institutional review board at the VA Connecticut Healthcare System (VACHS) and was registered at ClinicalTrials.gov (NCT00724152).
Measures
Four standardized measures were administered to potential participants. Callers were screened for eligibility by the research coordinator using Section A of the Tinnitus and Hearing Survey (THS), which had been developed to screen candidates for tinnitus studies by phone.22 The THS contains 3 sections to identify problems related to tinnitus (Section A), hearing (Section B), and sound tolerance (Section C). Section A contains 4 items, each with a possible score of 0 to 4, which identifies tinnitus problems. Callers who were veterans and who met the necessary cutoff of 4 out of 16 possible points on Section A were invited to meet in-person with the research coordinator to obtain written informed consent and conduct a thorough assessment of eligibility.23
Three additional assessment measures were then administered sequentially to determine eligibility. The first 2 of these measures were readministered to eligible candidates who agreed to participate in the study and were used to examine outcomes:
(1) Tinnitus Handicap Inventory (THI): The 25-item THI provides an index score (0-100), with higher scores reflecting poorer QOL and more perceived functional limitations due to tinnitus.24 Candidates with scores of ≤ 19 were excluded.
(2) Tinnitus Reaction Questionnaire (TRQ): The TRQ measures perceived impact of tinnitus on QOL with emphasis on emotional consequences of tinnitus.25 Higher scores indicate more severe impact. Scores of ≥ 17 points purportedly indicate significant tinnitus disturbance. Candidates scoring < 17 were excluded.
(3) Structured Clinical Interview for Diagnosis, Abbreviated-Interview/Nonpatient (SCIDa-I/NP): The SCIDa-I/NP is a measure used to assess symptoms of psychopathology.26 Candidates with a lifetime history of psychosis were excluded.
Interventions
Each of the interventions was offered using 6 group sessions, with 2 or more participants, on an approximate weekly schedule.
VET CBT-T. Two primary texts served as resources for developing the VET CBT-T protocol: (1) the Psychological Management of Chronic Tinnitus: A Cognitive-Behavioral Approach14; and (2) a manual for providing CBT for the treatment of chronic pain.27,28 Draft materials were developed by the clinical psychologist, including a clinician’s manual for providing VET CBT-T. Handouts were provided to each veteran. Components were compared to another unpublished CBT for tinnitus workbook.10
Key components targeted psychological difficulties including sleep disturbance, reduced functioning, low mood, nervousness, reduced pleasure from activities, and negative changes in relationships. The protocol emphasized basic information about tinnitus; relationships among tinnitus, acoustic trauma, and mental health symptoms; veterans’ sense of camaraderie and loyalty; and goal setting, making use of discipline and order veterans may desire.
To build rapport, the psychologist used reflective listening, encouraged interactive dialogue, and promoted participant understanding. Since tinnitus is thought to be exacerbated by stress, participants learned ways to manage stress and practiced relaxation exercises. Participants learned to create individualized, intersession goals that were realistic, specific, and measurable to promote self-efficacy. They also learned to list and increase pleasant activities to distract from tinnitus, improve QOL, and enable behavioral activation. Motivational interviewing addressed readiness, ambivalence, and resistance to achieving these specific goals. Participants also learned to identify and modify unhelpful thoughts about tinnitus (ie, cognitive restructuring).
Audiologist Counseling (AC). To control for patient contact in VET CBT-T, the study audiologist created a 6-session counseling protocol. The AC emphasized education about tinnitus and available tinnitus interventions. Participants were encouraged to ask questions, share their tinnitus experiences, and cope with tinnitus by avoiding silence.
Quantitative Analysis
To assess baseline between-group differences, pretreatment (t1;immediately prior to attending the first group session) administrations of the THI and TRQ were compared using t tests. Demographics between groups were compared using the chi-square test.
The THI and TRQ were readministered following completion of the last group session (t2) and about 8 weeks after the last group session (t3). Because of the small sample size, required assumptions for analyzing parametric tests of linear effects were not met. Thus, only descriptive results and mean differences in scores on the THI and TRQ between these 3 assessment periods are presented. SPSS PASW Statistics 18.0 (Hong Kong, China) was used for analyses.
Qualitative Analysis
VET CBT-T. After each VET CBT-T session, veterans’ acceptance of the protocol was assessed using 4 questions: (1) Was the information presented to you today easy to understand? Yes/No. If no, why not? (2) Were the examples (if there were any) useful? Yes/No. If no, why not? (3) Was the way the information was presented by the group leader helpful? Yes/No. If no, why not? and (4) Please tell us what you thought about today’s group. Participants were encouraged to be honest and provide detailed feedback. To facilitate unbiased responding, the group leader left the room while a research assistant collected the comments.
Participants’ experiences and acceptance of the interventions were explored using a stepwise content analysis approach.29,30First, the feedback data were prepared for analysis by entering verbatim responses into a spreadsheet. Next, these responses were reviewed by the clinical psychologist who identified themes. Examination of data involved qualitative analyses in which the phenomenon of interest was veterans’ acceptance of the interventions. This process presumed that most veterans would respond favorably to the intervention and, thus, acknowledged that the clinical psychologist designed and delivered the intervention.
Any contrary or negative comments were flagged. However, neutral and positive comments also were analyzed and tallied. Notations within each comment were used to calculate the number of occurrences of themes. Similar themes with few responses were collapsed into a single theme when appropriate. Final themes and tallies were shared with an auditor familiar with tinnitus, psychology, and qualitative methods who made comments and checked tallies within each theme. The themes were revised based on this audit and retallied. The clinical psychologist then summarized the themes in text, which was reviewed by the auditor for accuracy in capturing the important emergent themes.
Next, themes were used to examine typed verbatim transcripts from the second and fifth sessions of the intervention. Thematic content derived from the above feedback was extracted from the transcripts by the clinical psychologist. Then the study audiologist read the transcripts to confirm or reject these comments as relevant to the themes. Additional comments were nominated by the study audiologist and reviewed by the clinical psychologist who finalized feedback thought to best represent the themes.
Results
One hundred ninety-six persons inquired about the study (Figure 1).
After being deemed eligible by the otologist as having tinnitus associated with sound trauma, the remaining 25 eligible and interested candidates were randomized into the 2 treatment arms. To reduce attrition, formation of groups took into account participants’ preferred appointment days and times. When 3 or more participants were allocated to a treatment arm, group sessions were scheduled. Five (20%) participants were lost to attrition, including 1 randomized to VET CBT-T and 2 to AC who dropped out prior to receiving any intervention, and 2 randomized to VET CBT-T who dropped out after attending 1 session. Reasons stated for dropping out included concerns they would not learn new information, inability to tolerate sound in a group, unexpected moves out of the area, lack of time, loss of interest, and family emergencies.
Quantitative Analysis
Participants in the 2 treatment arms did not differ significantly on the pretreatment (t1) THI (t = 1.39, df = 18, P = .18) or TRQ (t = 0.99, df = 18, P = .33) scores. Differences in THI scores were computed from pre- to posttreatment (VET CBT-Tt1−t2 = 6.2; ACt1−t2 = 10.0) and from pretreatment to 8-week follow-up (VET CBT-Tt1−t3 = 4.4; ACt1−t3 = 9.1). Similarly, differences in mean TRQ index scores were computed from pre- to posttreatment (VET CBT-Tt1−t2 = 5.3; ACt1−t2 = 7.6) and from pretreatment to 8 weeks follow-up (VET CBT-Tt1−t3 = 1.5; ACt1−t3 = 5.6). These mean differences reveal consistent reductions in mean index scores (improved tinnitus-related QOL) between time points for each treatment arm, but do not indicate statistically or clinically significant reductions of distress.
Qualitative Analysis
The 89 comments that participants provided after the 18 VET CBT-T sessions (3 series of 6 sessions each) were mostly positive (67 responses, 75%) (eTable 2).
Components of VET CBT-T and Number of Sessions (n = 53)
Psychoeducation and Sound Enrichment. Participants generally appreciated the psychoeducation component of VET CBT-T, including basic information about the prevalence of tinnitus, mechanics of the ear and hearing, and how an enriched sound environment may assist with coping (5 comments).
Stress Reduction. Two of the 14 participants who commented on the stress reduction session (via relaxation exercises) noted that it was helpful in their lives overall but “had no effect on tinnitus.”
Goal Setting. Nine participants noted that they valued the goal-setting strategies and long-term relapse planning, one writing that he was “…glad to be encouraged to document and set specific, documented goals each week.”
Cognitive Restructuring and Acceptance. Participants reported that the cognitive restructuring session was important for “accepting” their tinnitus (9 comments). Overall cognitive restructuring appeared to be well received by participants as a concept when learning ways to cope with tinnitus.
Distraction. Of the 8 comments that regarded the increasing-pleasant-activities session, 1 participant reported that the pleasant activities worksheet had a female bias and that activities on one of the worksheets “were not helpful and overlapped too much.” A participant suggested that group leaders allow participants to brainstorm pleasant activities using an open-ended format instead of using categories of pleasant activities. Participants generally found the increasing-pleasant-activities component very beneficial for managing tinnitus.
Self-Hypnosis and Exposure Therapy. Two components not presented during VET CBT-T were identified by participants as potentially desirable. One participant suggested providing information on self-hypnosis and another stated that he focuses on his tinnitus to cope, much like exposure therapy for tinnitus.
Number of Sessions. One participant wrote after the last (sixth) session that he was “glad it’s over” possibly suggesting the intervention was too long. Another participant stated at the fifth session, “I basically want to get out of here—out of this, out of these meetings.” Conversely a participant stated, “I was kind of hoping there was one more after next week.” Another participant explained the intervention itself can be in conflict with its own stated goals of attending less to tinnitus.
Leader, Materials, and Presentations (n = 16).
Overall, the participants had positive experiences (15 comments) with their study therapist. They noted that the group leader was “flexible” and “did a great job of facilitating discussion.” One participant commented on the need for better visual presentations of the information and the need for the group leader to “use her own words” rather than reading the content.
Previous Use of CBT Skills (n = 5).
Five participants noted that information presented was “not new” and that they had acquired the coping skills spontaneously years earlier. Two expressed relief that some of the ways they had been dealing with their tinnitus prior to the intervention were actually recommended. One discussed that reviewing skills that he had already implemented was helpful.
Hope, Anger, and Mental Health (n = 8).
Three participants indicated the intervention gave them “hope” that they will learn ways to cope with tinnitus. One noted that the discussion regarding depression as a commonly co-occurring condition with tinnitus should include a better description of depressive symptoms. Two expressed relief to receive help for their frustration and anger resulting from tinnitus, and 1 participant discussed the added frustration of hearing loss with tinnitus. Excessive alcohol use to cope with tinnitus and the comorbidity of tinnitus and PTSD also were discussed.
Group Cohesiveness (n = 8)/Discord (n = 2).
Many group members commented that they enjoyed listening to information about tinnitus and sharing their experiences. There was friendly interaction and discussion among most of the participants. They commented that it was informative to see that others were coming forward for help and were interested to hear others’ experiences. The group format was mostly welcomed and appreciated. However, group discord occurred when topics other than tinnitus were shared, such as recovery from substance abuse. Two feedback comments indicated that this discussion was unwelcomed.
Discussion
This pilot study provides evidence that at least some of the veterans who were eligible and participated accrued benefit from either AC or VET CBT-T. There also is evidence that a structured and intensive counseling approach by an audiologist that does not include sound therapy is beneficial. Participants generally found that the interventions were acceptable for understanding basic information about tinnitus, and those in the VET CBT-T treatment arm reported improvements in problem solving and coping.
The planned qualitative analyses enabled in-depth examination of intervention feedback from participants and revealed important themes for modifying the VET CBT-T intervention, which occurred following completion of this pilot study. Further, these themes echo the success in creating a unique, veteran-centric, CBT intervention for tinnitus management.
Primarily, participants indicated that education about tinnitus prevalence, etiology, and sound enrichment assisted in coping with tinnitus. This theme also reflects the protocol’s emphasis on health literacy. The wide availability of misinformation on tinnitus, along with the potential for monetary scams, underlies the need for well-designed and research-informed tinnitus education programs. Helping veterans distinguish facts and myths is a potentially important element of tinnitus management. Experiences coping with trauma were salient as participants diverged in their opinions regarding the appropriateness of discussing these issues during a tinnitus management group.
Specific themes emerged regarding the relevance of posttraumatic stress disorder (PTSD) symptoms and substance use to cope with tinnitus. Comfort levels when hearing and discussing these symptoms varied among participants. Due to the high comorbidities of mental health disorders and tinnitus, this theme is important to consider when designing tinnitus management programs. Other qualitative themes served to validate peer support and that the veteran-centric protocol was acceptable, including positive regard for goal setting, indicating that adherence to discipline and order had been addressed.
Identified VET CBT-T Modifications
There were multiple indicators that the rationale for sessions needed to be clarified. Participants highlighted the need to hear clear expectations about what the coping skills would address and multiple reminders regarding the goals of relaxation exercises for tinnitus. Some expressed concern about their lack of concentration during the relaxation exercises. A concern that was discussed with participants only during the informed consent process was the possibility that the intervention could increase focus on tinnitus and, thus, temporarily increase tinnitus distress while receiving the intervention.
Need for Interdisciplinary Care
Perhaps the fact that both interventions were beneficial is not surprising since AC as delivered in this study was designed to be an active intervention that incorporated education and support, including some components similar to those included in VET CBT-T. It appears that AC designed to match the CBT intervention in terms of number of sessions among other enhancements suggests that this intervention may be efficacious. The AC intervention offered support and education about tinnitus; however, sound therapy was not provided despite some empirical support for its use.31 Future research should examine whether sound therapy adds benefit to an intensive and structured AC approach.
It has been proposed that a combination of CBT delivered by a mental health provider and AC should be implemented as an optimal tinnitus management protocol.31,32 Results of this and a number of other recent studies 16,32,33 encourage an integrated, interdisciplinary approach.
Findings of the present study were applied toward development of a hierarchical and interdisciplinary tinnitus management protocol, Progressive Tinnitus Management (PTM).22,34 Components of VET CBT-T were selected for the intervention provided with PTM, modified as per the feedback from participants in this study. This approach was combined with components of the AC intervention, further complemented by sound therapy. The new combined protocol was tested in a pilot telephone study of PTM for veterans and military members with positive results.32 Two VA-supported RCTs of PTM have since been completed.35,36 Results indicate that relative to wait list control, PTM is effective in mitigating negative effects of tinnitus.
Last, after this pilot study, the protocol was modified to address participants’ concerns that their primary care and other providers were unaware that interventions for tinnitus exist. Providers offering tinnitus care are now encouraged to share its availability with veterans and other clinicians. This study provides compelling evidence that veterans respond to messages of hope from providers that they do not needlessly have to suffer alone. Rather than telling veterans to “just live with it,” primary care providers should be able to offer ideas and services for learning how to live with tinnitus.
Future Directions
Future revisions of VET CBT-T could incorporate “acceptance” as a concept for coping with tinnitus, components such as self-hypnosis and exposure therapy, and strategies for coping with hearing loss and communication difficulties. Reexamination of the number and length of sessions also is encouraged, as well as integration of evidence-based interventions for comorbid conditions such as PTSD, substance use disorders, and insomnia. Perhaps increasing the use of peer support services would help reach veterans concerned by the stigma of receiving mental health care. Some veterans were dissatisfied with hearing about others’ mental health concerns. It may be beneficial to offer tinnitus interventions to cohorts of veterans identified with specific comorbid mental health or substance use disorders. However, peer support may be more important than protecting veterans from hearing about others’ mental health concerns as social cognitive theory suggests.
Limitations
This feasibility study’s strict inclusion criteria resulted in a small but well-defined sample that may not be representative of the larger population of veterans who could potentially benefit from these interventions. The extensive evaluation requirements and eligibility requirements likely enhanced the internal validity of the trial but may have compromised the external validity and generalizability of the study findings.
While a few women were assessed during the eligibility process, unfortunately, only men were deemed eligible. It is therefore unknown how women veterans would receive this protocol. Currently there is a bias in selecting male participants for tinnitus research. It is hoped that in the future a sample of women veterans could also provide feedback on this tinnitus management protocol developed by the VHA.
The fact that a large proportion of those who made initial contact about the study decided not to follow up is not inconsistent with studies of similar psychological interventions.37 Challenges related to engaging otherwise appropriate candidates in psychological interventions for a range of chronic health concerns have been well described and may apply to tinnitus management.
Conclusion
The qualitative feedback from participants was generally positive for both protocols. Emergent themes confirmed the need for a veteran-specific intervention while highlighting individual veterans’ needs. Transcripts from sessions provided additional descriptive information that identified changes to the protocols that would improve veterans’ receipt of care. Due to the abundance of veterans with tinnitus and the needs of veterans in terms of health care delivery and receipt, an interdisciplinary CBT-plus-AC protocol was created that is specific to and accepted by veterans with tinnitus.
Refinements to the VET CBT-T protocol were identified that led to development of PTM that was the subject of another small study, which then led to the authors’ 2 larger RCTs. Attempts were made to include greater attention to the mental health concerns of veterans both in terms of education and in offering sensitive delivery of the protocol. Session content was used to create an organized, visual presentation that follows an organized workbook.22,35 Refinements to the protocol are ongoing.
Acknowledgments
This material was based on work supported by US Department of Veterans Affairs, Rehabilitation Research and Development (RR&D): (1) R.D. Kerns’ Pilot Merit Grant #C6324P and (2) C.J. (Kendall) Schmidt’s Career Development Award-1 #D6848M. The authors would like to acknowledge the assistance from Rebecca Czlapinski, MA; Kathryn LaChappelle, MPH; and Emily Thielman, MS, for the conduct of the study, data collection and management, and preparation of this manuscript.
1. Henry JA. “Measurement” of tinnitus. Otol Neurotol. 2016;37(8):e276-e285.
2. Hoffman HJ, Reed GW. Epidemiology of tinnitus. In Snow JB, ed. Tinnitus: Theory and Management. Hamilton, Canada: BC Becker; 2004:16-41.
3. Folmer RL, Theodoroff SM, Martin WH, Shi Y. Experimental, controversial, and futuristic treatments for chronic tinnitus. J Am Acad Audiol. 2014;25(1):106-125.
4. US Department of Veterans Affairs. Veterans Benefits Administration annual benefits report fiscal year 2016. https://www.benefits.va.gov/REPORTS/abr/ABR-All_Sec tions_FY16_06292017.pdf . Accessed June 19, 2018.
5. Henry JA, Zaugg TL, Myers PJ, Schechter MA. The role of audiologic evaluation in progressive audiologic tinnitus management. Trends Amplif. 2008;12(3):170-187.
6. Hoare DJ, Searchfield GD, El Refaie A, Henry JA. Sound therapy for tinnitus management: practicable options. J Am Acad Audiol. 2014;25(1):62-75.
7. Andersson G, Porsaeus D, Wiklund M, Kaldo V, Larsen HC. Treatment of tinnitus in the elderly: a controlled trial of cognitive behavior therapy. Int J Audiol. 2005;44(11):671-675.
8. Henry JL, Wilson PH. Coping with tinnitus: two studies of psychological and audiological characteristics of patients with high and low tinnitus-related distress. Int Tinnitus J. 1995;1(2):85-92.
9. Henry JL, Wilson PH. The psychological management of tinnitus: comparison of a combined cognitive educational program, education alone and a waiting-list control. Int Tinnitus J. 1996;2:9-20.
10. Robinson SK, Viirre ES, Bailey KA, et al. A randomized controlled trial of cognitive-behavior therapy for tinnitus. Int Tinnitus J. 2008;14(2):119-126.
11. Martinez-Devesa P, Perera R, Theodoulou M, Waddell A. Cognitive behavioural therapy for tinnitus. Cochrane Database Syst Rev. 2010(9):CD005233.
12. Tunkel DE, Bauer CA, Sun GH, et al. Clinical practice guideline: tinnitus. Otolaryngol Head Neck Surg. 2014;151(Suppl)(2):S1-S40.
13. Beck JS. Cognitive Behavior Therapy: Basics and Beyond. 2nd ed. New York, NY: Guilford Press; 2011.
14. Henry JL, Wilson PH. The Psychological Management of Chronic Tinnitus : A Cognitive-Behavioral Approach. Boston, MA: Allyn and Bacon; 2001.
15. Bandura A. Health promotion by social cognitive means. Health Educ Behav. 2004;31(2):143-164.
16. Cima RF, Andersson G, Schmidt CJ, Henry JA. Cognitive-behavioral treatments for tinnitus: a review of the literature. J Am Acad Audiol. 2014;25(1):29-61.
17. Rodriguez V, Andrade AD, García-Retamero R, et al. Health literacy, numeracy, and graphical literacy among veterans in primary care and their effect on shared decision making and trust in physicians. J Health Commun. 2013;18(suppl 1):273-289.
18. Seal KH, Metzler TJ, Gima KS, Bertenthal D, Maguen S, Marmar CR. Trends and risk factors for mental health diagnoses among Iraq and Afghanistan veterans using Department of Veterans Affairs health care, 2002-2008. Am J Public Health. 2009;99(9):1651-1658.
19. Thomas JL, Wilk JE, Riviere LA, et al. Prevalence of mental health problems and functional impairment among active component and National Guard soldiers 3 and 12 months following combat in Iraq. Arch Gen Psychiatry. 2010;67(6):614-623.
20. Zivin K, McCarthy JF, McCammon RJ, et al. Health-related quality of life and utilities among patients with depression in the Department of Veterans Affairs. Psychiatr Serv. 2008;59(11):1331-1334.
21. Costa DL, Kahn ME. Health, wartime stress, and unit cohesion: evidence from Union Army veterans. Demography. 2010;47(1):45-66.
22. Henry JA, Zaugg TL, Myers PJ, Kendall (Schmidt) CJ. Progressive Tinnitus Management: Clinical Handbook for Audiologists. San Diego, CA: Plural Publishing; 2010.
23. Henry JA, Schechter MA, Loovis CL, et al. Clinical management of tinnitus using a “progressive intervention” approach. J Rehabil Res Dev. 2005;42(4 suppl 2):95-116.
24. Newman CW, Jacobson GP, Spitzer JB. Development of the Tinnitus Handicap Inventory. Arch Otolaryngol Head Neck Surg. 1996;122(2):143-148.
25. Wilson PH, Henry JL, Bowen M, Haralambous G. Tinnitus Reaction Questionnaire: psychometric properties of a measure of distress associated with tinnitus. J Speech Hear Res. 1991;34(1):197-201.
26. First MB, Spitzer RL, Gibbon M, Williams JBW. Structured Clinical Interview for DSM-IV Axis I Disorders (SCID-I) Clinical Version, Administration Booklet. Washington, DC: American Psychiatric Press; 2012.
27. Kerns RD, Thorn BE, Dixon KE. Psychological treatments for persistent pain: an introduction. J Clin Psychol. 2006;62(11):1327-1331.
28. Otis JD. Managing Chronic Pain: A Cognitive-Behavioral Therapy Approach. New York, NY: Oxford; 2007.
29. Sandelowski M. Whatever happened to qualitative description? Res Nurs Health. 2000;23(4):334-340.
30. Mertens DM. Research and Evaluation in Education and Psychology: Integrating Diversity With Quantitative, Qualitative, and Mixed Methods. 3rd ed. Los Angeles, CA: Sage; 2009 .
31. Hobson J, Chisholm E, El Refaie A. Sound therapy (masking) in the management of tinnitus in adults. Cochrane Database Syst Rev. 2010;(12):CD006371.
32. Henry JA, Zaugg TL, Myers PJ, et al. Pilot study to develop telehealth tinnitus management for persons with and without traumatic brain injury. J Rehabil Res Dev. 2012;49(7):1025-1042.
33. Weise C, Heinecke K, Rief W. Biofeedback-based behavioral treatment for chronic tinnitus: results of a randomized controlled trial. J Consult Clin Psychol. 2008;76(6):1046-1057.
34. Henry JA, Zaugg TL, Myers PJ, Kendall (Schmidt) CJ. How to Manage Your Tinnitus: A Step-by-Step Workbook, 3rd ed. San Diego, CA: Plural Publishing; 2010.
35. Henry JA, Thielman EJ, Zaugg TL, et al. Randomized controlled trial in clinical settings to evaluate effectiveness of coping skills education used with Progressive Tinnitus Management. J Speech Lang Hear Res. 2017;60(5):1378-1397.
36. Henry, JA, Thielman, E, Zaugg, et al. Telephone-based progressive tinnitus management for persons with and without traumatic brain injury: a randomized controlled trial. Ear Hear. 2018. [Epub ahead of print.]
37. Chang MW, Nitzke S, Brown R, et al. Recruitment challenges and enrollment observations from a community based intervention (Mothers In Motion) for low-income overweight and obese women. Contemp Clin Trials Commun. 2017;5:26-33.
1. Henry JA. “Measurement” of tinnitus. Otol Neurotol. 2016;37(8):e276-e285.
2. Hoffman HJ, Reed GW. Epidemiology of tinnitus. In Snow JB, ed. Tinnitus: Theory and Management. Hamilton, Canada: BC Becker; 2004:16-41.
3. Folmer RL, Theodoroff SM, Martin WH, Shi Y. Experimental, controversial, and futuristic treatments for chronic tinnitus. J Am Acad Audiol. 2014;25(1):106-125.
4. US Department of Veterans Affairs. Veterans Benefits Administration annual benefits report fiscal year 2016. https://www.benefits.va.gov/REPORTS/abr/ABR-All_Sec tions_FY16_06292017.pdf . Accessed June 19, 2018.
5. Henry JA, Zaugg TL, Myers PJ, Schechter MA. The role of audiologic evaluation in progressive audiologic tinnitus management. Trends Amplif. 2008;12(3):170-187.
6. Hoare DJ, Searchfield GD, El Refaie A, Henry JA. Sound therapy for tinnitus management: practicable options. J Am Acad Audiol. 2014;25(1):62-75.
7. Andersson G, Porsaeus D, Wiklund M, Kaldo V, Larsen HC. Treatment of tinnitus in the elderly: a controlled trial of cognitive behavior therapy. Int J Audiol. 2005;44(11):671-675.
8. Henry JL, Wilson PH. Coping with tinnitus: two studies of psychological and audiological characteristics of patients with high and low tinnitus-related distress. Int Tinnitus J. 1995;1(2):85-92.
9. Henry JL, Wilson PH. The psychological management of tinnitus: comparison of a combined cognitive educational program, education alone and a waiting-list control. Int Tinnitus J. 1996;2:9-20.
10. Robinson SK, Viirre ES, Bailey KA, et al. A randomized controlled trial of cognitive-behavior therapy for tinnitus. Int Tinnitus J. 2008;14(2):119-126.
11. Martinez-Devesa P, Perera R, Theodoulou M, Waddell A. Cognitive behavioural therapy for tinnitus. Cochrane Database Syst Rev. 2010(9):CD005233.
12. Tunkel DE, Bauer CA, Sun GH, et al. Clinical practice guideline: tinnitus. Otolaryngol Head Neck Surg. 2014;151(Suppl)(2):S1-S40.
13. Beck JS. Cognitive Behavior Therapy: Basics and Beyond. 2nd ed. New York, NY: Guilford Press; 2011.
14. Henry JL, Wilson PH. The Psychological Management of Chronic Tinnitus : A Cognitive-Behavioral Approach. Boston, MA: Allyn and Bacon; 2001.
15. Bandura A. Health promotion by social cognitive means. Health Educ Behav. 2004;31(2):143-164.
16. Cima RF, Andersson G, Schmidt CJ, Henry JA. Cognitive-behavioral treatments for tinnitus: a review of the literature. J Am Acad Audiol. 2014;25(1):29-61.
17. Rodriguez V, Andrade AD, García-Retamero R, et al. Health literacy, numeracy, and graphical literacy among veterans in primary care and their effect on shared decision making and trust in physicians. J Health Commun. 2013;18(suppl 1):273-289.
18. Seal KH, Metzler TJ, Gima KS, Bertenthal D, Maguen S, Marmar CR. Trends and risk factors for mental health diagnoses among Iraq and Afghanistan veterans using Department of Veterans Affairs health care, 2002-2008. Am J Public Health. 2009;99(9):1651-1658.
19. Thomas JL, Wilk JE, Riviere LA, et al. Prevalence of mental health problems and functional impairment among active component and National Guard soldiers 3 and 12 months following combat in Iraq. Arch Gen Psychiatry. 2010;67(6):614-623.
20. Zivin K, McCarthy JF, McCammon RJ, et al. Health-related quality of life and utilities among patients with depression in the Department of Veterans Affairs. Psychiatr Serv. 2008;59(11):1331-1334.
21. Costa DL, Kahn ME. Health, wartime stress, and unit cohesion: evidence from Union Army veterans. Demography. 2010;47(1):45-66.
22. Henry JA, Zaugg TL, Myers PJ, Kendall (Schmidt) CJ. Progressive Tinnitus Management: Clinical Handbook for Audiologists. San Diego, CA: Plural Publishing; 2010.
23. Henry JA, Schechter MA, Loovis CL, et al. Clinical management of tinnitus using a “progressive intervention” approach. J Rehabil Res Dev. 2005;42(4 suppl 2):95-116.
24. Newman CW, Jacobson GP, Spitzer JB. Development of the Tinnitus Handicap Inventory. Arch Otolaryngol Head Neck Surg. 1996;122(2):143-148.
25. Wilson PH, Henry JL, Bowen M, Haralambous G. Tinnitus Reaction Questionnaire: psychometric properties of a measure of distress associated with tinnitus. J Speech Hear Res. 1991;34(1):197-201.
26. First MB, Spitzer RL, Gibbon M, Williams JBW. Structured Clinical Interview for DSM-IV Axis I Disorders (SCID-I) Clinical Version, Administration Booklet. Washington, DC: American Psychiatric Press; 2012.
27. Kerns RD, Thorn BE, Dixon KE. Psychological treatments for persistent pain: an introduction. J Clin Psychol. 2006;62(11):1327-1331.
28. Otis JD. Managing Chronic Pain: A Cognitive-Behavioral Therapy Approach. New York, NY: Oxford; 2007.
29. Sandelowski M. Whatever happened to qualitative description? Res Nurs Health. 2000;23(4):334-340.
30. Mertens DM. Research and Evaluation in Education and Psychology: Integrating Diversity With Quantitative, Qualitative, and Mixed Methods. 3rd ed. Los Angeles, CA: Sage; 2009 .
31. Hobson J, Chisholm E, El Refaie A. Sound therapy (masking) in the management of tinnitus in adults. Cochrane Database Syst Rev. 2010;(12):CD006371.
32. Henry JA, Zaugg TL, Myers PJ, et al. Pilot study to develop telehealth tinnitus management for persons with and without traumatic brain injury. J Rehabil Res Dev. 2012;49(7):1025-1042.
33. Weise C, Heinecke K, Rief W. Biofeedback-based behavioral treatment for chronic tinnitus: results of a randomized controlled trial. J Consult Clin Psychol. 2008;76(6):1046-1057.
34. Henry JA, Zaugg TL, Myers PJ, Kendall (Schmidt) CJ. How to Manage Your Tinnitus: A Step-by-Step Workbook, 3rd ed. San Diego, CA: Plural Publishing; 2010.
35. Henry JA, Thielman EJ, Zaugg TL, et al. Randomized controlled trial in clinical settings to evaluate effectiveness of coping skills education used with Progressive Tinnitus Management. J Speech Lang Hear Res. 2017;60(5):1378-1397.
36. Henry, JA, Thielman, E, Zaugg, et al. Telephone-based progressive tinnitus management for persons with and without traumatic brain injury: a randomized controlled trial. Ear Hear. 2018. [Epub ahead of print.]
37. Chang MW, Nitzke S, Brown R, et al. Recruitment challenges and enrollment observations from a community based intervention (Mothers In Motion) for low-income overweight and obese women. Contemp Clin Trials Commun. 2017;5:26-33.