User login
A Pharmacist-Led Transitional Care Program to Reduce Hospital Readmissions in Older Adults
Medication reconciliation and patient education during admission and after discharge helped older patients remain independent at home.
There will be 53 million older adults in the US by 2020.1 Increasing age often brings medical comorbidities and prescriptions for multiple medications. An increasing number of prescribed medications combined with age-related changes in the ability to metabolize drugs makes older adults highly vulnerable to adverse drug events (ADEs).2 In addition, older adults often have difficulty self-managing their medications and adhering to prescribed regimens.3 As a result, ADEs can lead to poor health outcomes, including hospitalizations, in older adults.
Medication errors and ADEs are particularly common during transitions from hospital to home and can lead to unnecessary readmissions,a major cause of wasteful health care spending in the US.4,5 More than $25 billion are estimated to be spent annually on hospital readmissions, with Medicare picking up the bill for $17 billion of the total.6,7 Researchers have found that the majority of ADEs following hospital discharge are either entirely preventable or at least ameliorable (ie, the negative impact or harm resulting from the ADE could have been reduced).8
To address these issues, we undertook a clinical demonstration project that implemented a new transitional care program to improve the quality of care for older veterans transitioning from the Audie L. Murphy Veterans Memorial Hospital of the South Texas Veterans Health Care System (STVHCS) in San Antonio to home. The Geriatrics Medication Education at Discharge project (GMED) falls under the auspices of the San Antonio Geriatrics Research Education and Clinical Center (GRECC). Clinical demonstration projects are mandated for US Department of Veterans Affairs (VA) GRECCs to create and promote innovative models of care for older veterans. Dissemination of successful clinical demonstration projects to other VA sites is strongly encouraged. The GMED program was modeled after the Boston GRECC Pharmacological Intervention in Late Life (PILL) program.9 The PILL program, which focuses on serving older veterans with cognitive impairment, demonstrated that a postdischarge pharmacist telephone visit for medication reconciliation leads to a reduction in readmission within 60 days of discharge.9 The goals of the GMED program were to reduce polypharmacy, inappropriate prescribing and 30-day readmissions.
Methods
The project was conducted when a full-time clinical pharmacy specialist (CPS) was available (May-September 2013 and April 2014-March 2015). This project was approved as nonresearch/quality improvement by the University of Texas Health Science Center Institutional Review Board, which serves the STVHCS. Consent was not required.
Eligibility
Patients were identified via a daily hospital database query of all adults aged ≥ 65 years admitted to the hospital through Inpatient Medicine, Neurology, or Cardiology services within the prior 24 hours. Patients meeting any of the following criteria based on review of the Computerized Patient Record System (CPRS) by the team geriatrician and CPS were considered eligible: (1) aged ≥ 70 years prescribed ≥ 12 outpatient medications; (2) aged ≥ 65 years with a medical history of dementia; (3) aged ≥ 65 years prescribed outpatient medications meeting Beers criteria10; (4) age ≥ 65 years with ≥ 2 hospital admissions (including the current, index admission) within the past calendar year; or (5) aged ≥ 65 years with ≥ 3 emergency department visits within the past calendar year. For the first polypharmacy criterion, patients aged ≥ 70 years were selected instead of aged ≥ 65 years so as not to exceed the capacity of 1 CPS. Twelve or more medications were used as a cutoff for polypharmacy based on prior quality improvement information gathered from our VA geriatrics clinic examining the average number of medications taken by older veterans in the outpatient setting.
Related: Reducing COPD Readmission Rates: Using a COPD Care Service During Care Transitions
Patients were excluded if they were expected to be discharged to any facility where the patient and/or the caregiver were not primarily responsible for medication administration after discharge. Patients who met eligibility criteria but were not seen by the transitional program pharmacist (due to staff capacity) were included in this analysis as a convenience comparison group of patients who received usual care. Patients were not randomized. All communication occurred in English, but this project did not exclude patients with limited English proficiency.
A program support assistant conducted the daily query of the hospital database. The pharmacist conducted the chart review to determine eligibility and delivered the intervention. Eligible patients were selected at random for the intervention with the intention of providing the intervention to as many veterans as possible.
The GMED Intervention
The GMED program included 2 phases, which were both conducted by a CPS with oversight from a senior CPS with geriatric pharmacology expertise and an internist/geriatrician. 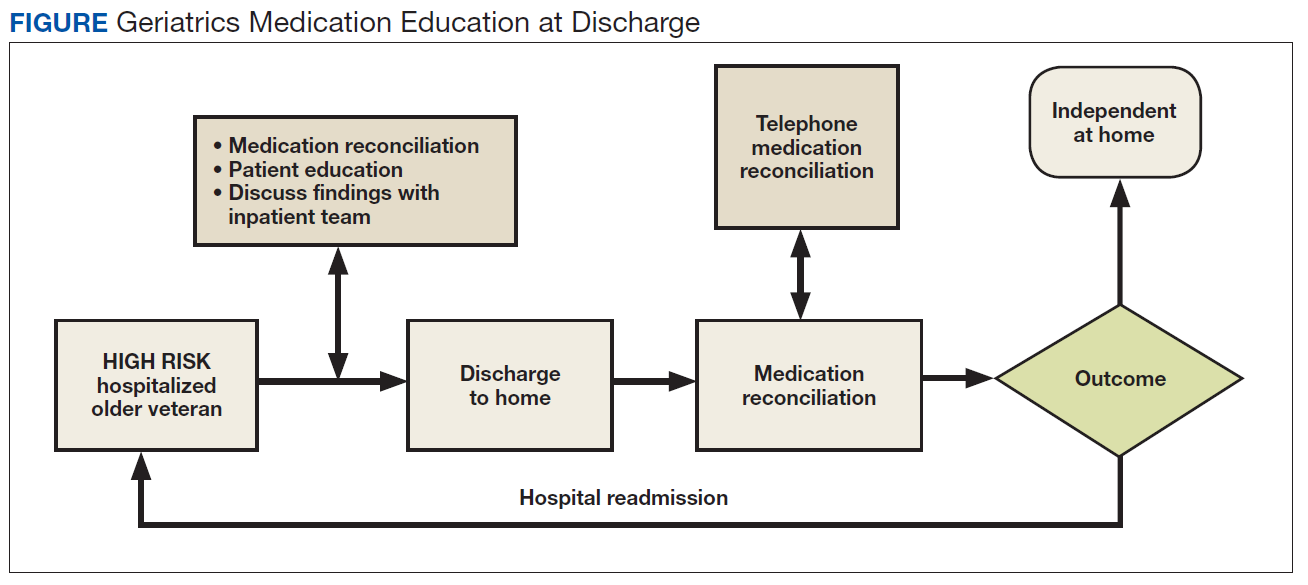
The first phase of the transitional care program included an individual, face-to-face meeting between the CPS and the patient during the hospitalization. If a veteran was not present in the room at the time of an attempted visit, the pharmacist made 2 additional attempts (3 total) to include the patient in the transitional care program during the hospitalization. 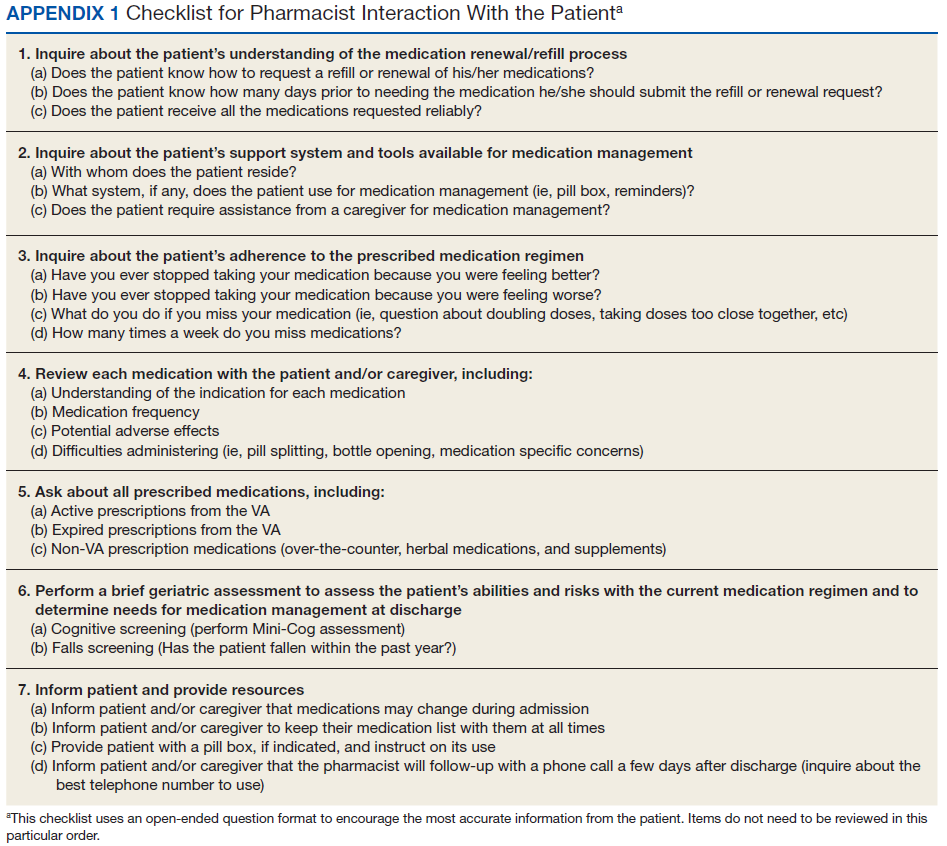
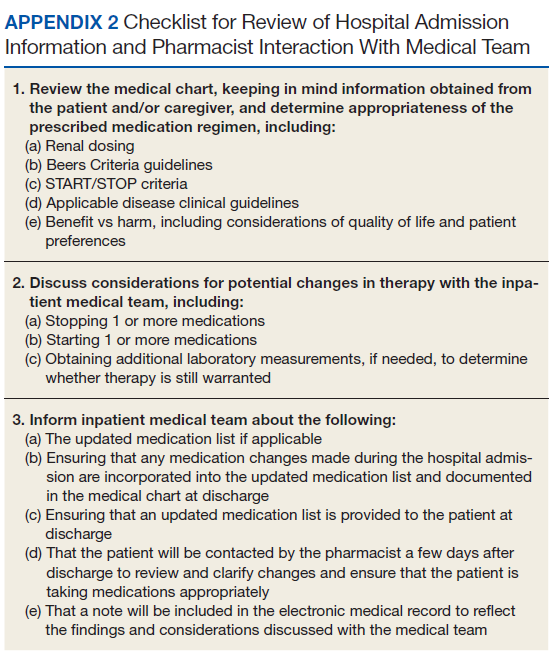
The second component of the transitional care program included a telephone visit within 2 to 3 days of discharge, conducted by the same CPS who performed the face-to-face visit. The purpose of the telephone visit was to perform medication reconciliation, identify and rectify medication errors, provide further patient education, and assist in facilitating appropriate follow-up by the patient’s primary care provider (PCP), if required. At a minimum, veterans were asked a series of questions pertaining to their concerns about medication regimens, receipt of newly prescribed medications at discharge, additional education regarding medications after the CPS encounter during hospitalization, and whether the veteran required assistance with the medication regimen in the home setting. Follow-up questions were asked as needed to clarify and identify potential medication problems. All information from this telephone encounter was communicated to the PCP through CPRS documentation and by telephone as needed.
Related: Initiative to Minimize Pharmaceutical Risk in Older Veterans (IMPROVE) Polypharmacy Clinic
Data Collection
A standardized questionnaire was used prospectively for patients in the transitional care program group to assess patient education, primary residence, presence of a caregiver, fall history, medication adherence, and cognitive status (using Mini-Cog).13 Additional information (patient age, number of outpatient medications prior to and following the admission, presence of Beers criteria outpatient medications prior to and following the admission, new outpatient prescriptions, and changes to existing prescriptions as a result of the hospitalization) was gathered prospectively from patient interviews or from chart review.
For patients included in the comparison group, a retrospective administrative chart review was conducted to collect information such as age, sex, ethnic group, admission within 1 year prior to index admission, frailty, and Charlson Comorbidity Index (CCI) score, a method of categorizing comorbidities of patients based on the diagnosis codes found in administrative data.14 Each comorbidity category has an associated weight (from 1 to 6), based on the adjusted risk of mortality or resource use, and the sum of all the weights results in a single comorbidity score for a patient (0 indicates no comorbidities; higher scores predict greater risk of mortality or increased resource use).
We used the index developed from 17 disease categories. The range for CCI was 0 to 25. Frailty was defined as the presence of any of the following frailty-related diagnoses: anemia; fall, head injury, other injury; coagulopathy; electrolyte disturbance; or gait disorder. These diagnoses are either primary frailty characteristics within the frailty phenotype or have been shown in prior studies to be associated with the frailty phenotype.15-18 While more widely accepted frailty definitions exist,these other definitions require direct examination of the patient and could not be used in this project because we did not directly interact with the comparison group.16,19 The frailty definition used has been previously identified as a predictor of health care utilization and 30-day readmission in a veteran population.20 Whether or not the CPS detected a postdischarge medication error was recorded. All CPS recommendations were documented.
An index admission was defined as a hospital admission that occurred during the project period. Thirty-day readmission was defined as a hospital admission that occurred within 30 days of the discharge date of an index admission. Each index admission was considered individually for readmission (yes vs no) even if it occurred in the same patient over the project period. A 30-day readmission was not considered an index admission. An admission that occurred after a 30-day readmission was considered a subsequent index admission. Patients who died in the hospital were not included in this analysis, as they would not have participated in the entire intervention.
Statistical Analysis
We compared characteristics between patients who received GMED and patients who never received GMED (comparison group). Generalized estimating equations (GEE) were used to determine whether the rate of 30-day readmission (yes vs no) in the transitional care program group differed from that of the comparison group. In our GEE analysis, we assumed a binomial distribution and the logit link to model the log-odds of readmission as a linear function of transitional care program status (yes vs no) and other covariates, including age, frailty, hospital admission within 1 year prior to the index admission, and CCI score as covariates. Thirty-day readmission status associated with each index admission was coded as 1 for a readmission within 30 days of the discharge date of the index admission, or 0 for no readmission within 30 days.
Transitional care program status was determined whether or not the individual received the transitional care program for each index admission. This analysis allowed us to model repeated measures of index admissions as a function of the project period and whether the patient was seen by the GMED CPS during the index admission. The patient identifier was used as a cluster variable in the GEE analysis. Inverse propensity scores of receiving GMED at the index admission were adjusted as weights in the GEE analysis to minimize confounding and, hence, to strengthen the causal interpretation of the effect of the transitional care program. If there was ≥ 1 index admission, the GMED status (yes vs no) at the initial index admission was used as the dependent variable to calculate propensity scores. The propensity scores of transitional care program status were derived from the logistic regression analysis that modeled the log-odds of receiving the transitional care program at the index admission as a linear function of age, CCI, frailty, and prior hospitalization during the 1-year period prior to the index admission.
Related: Development and Implementation of a Geriatric Walking Clinic
Results
The GMED CPS saw 435 patients during the project period; 47 (10.8%) died prior to 30 days and were excluded, leaving 388 patients who received the transitional care program included in this evaluation. 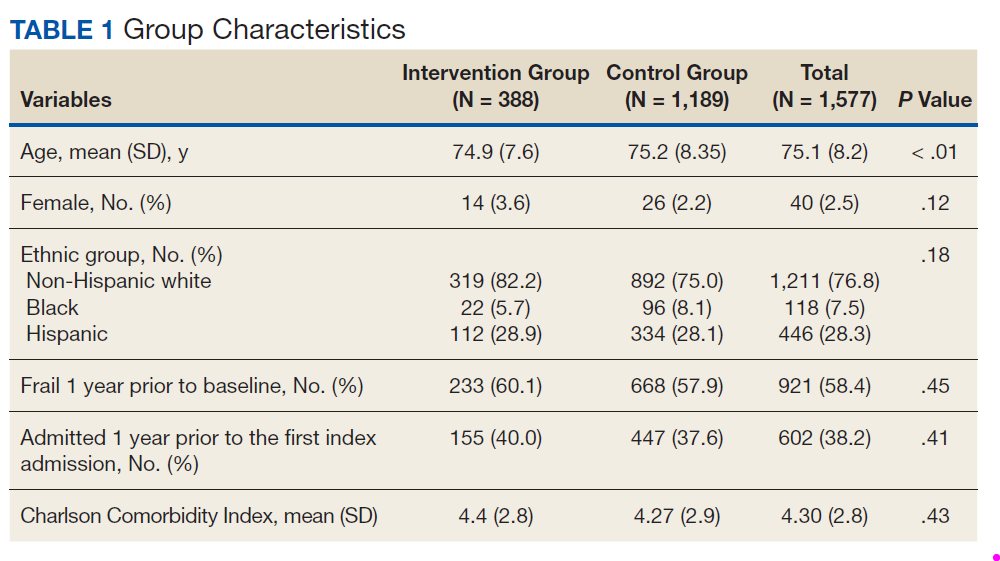
Data from the CPS-patient interviews and chart reviews were available for 378 of the 388 patients (Table 2). Patients were primarily male, non-Hispanic white, with a high school education. More than half (65%) the patients were admitted for a new diagnosis or clinical condition. 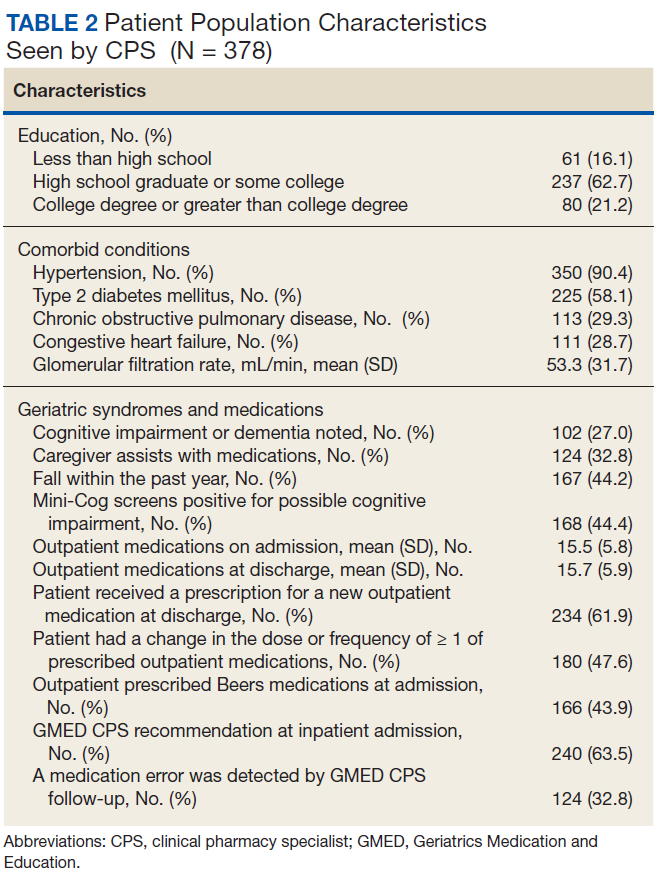
The 30-day readmission rate was 15.6% for the transitional care program group and 21.9% for the comparison group. Three hundred seventy-one patients received the transitional care program only once, 16 patients received the transitional care program twice (ie, they had 2 index admissions during the study period and received the intervention both times), and 1 patient received the transitional care program 3 times.
In an unadjusted GEE model, the odds ratio (OR) for readmission in the transitional care program group was 0.74 (95% CI, 0.54-1.0, P = .06) compared with the usual care group (Table 3). 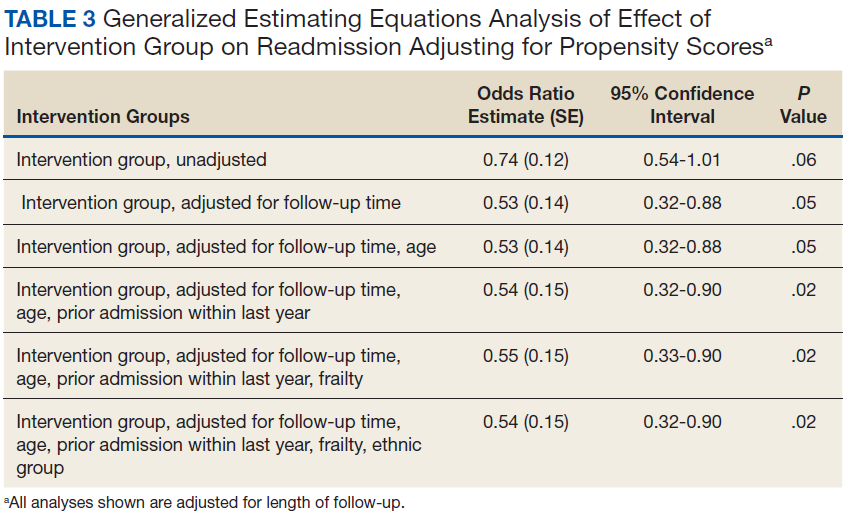
Thirty-five percent of patients had ≥ 1 CPS-recommended change in their treatment at the time of the inpatient admission (Table 4). 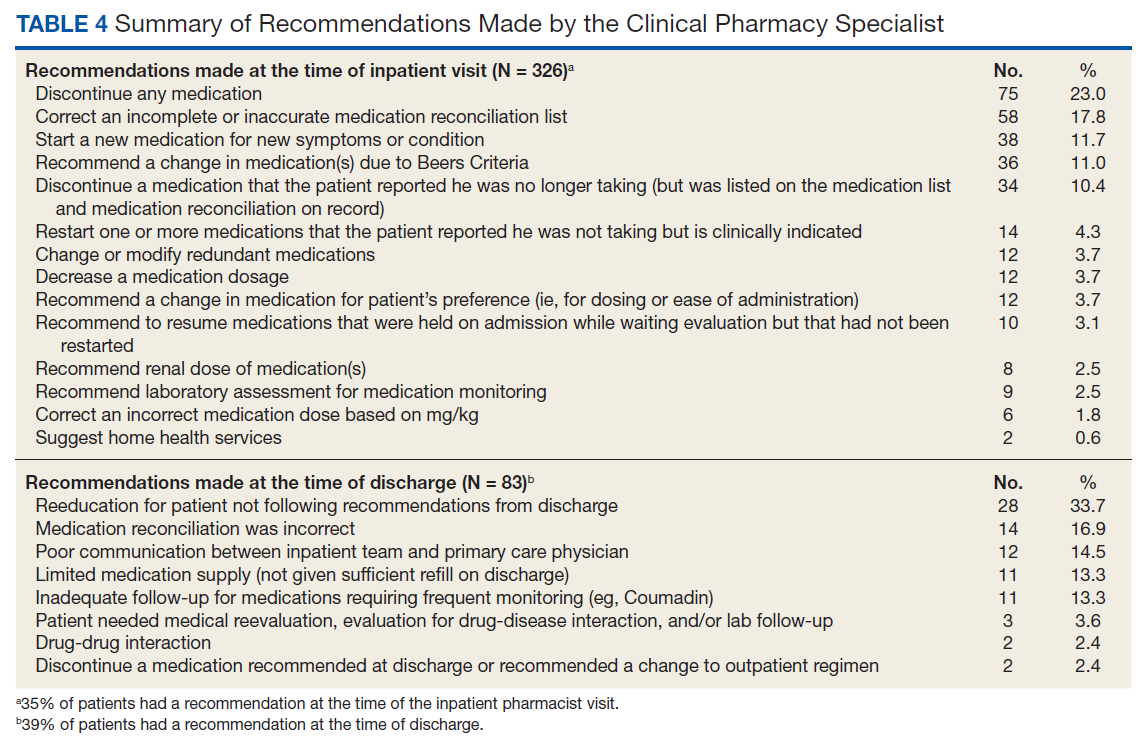
Discussion
We developed a transitional care program for hospitalized older veterans to improve the transition from hospital to home. After adjusting for clinical factors, GMED was associated with 26% lower odds of readmission within 30 days of discharge compared with that of the control group. The GMED CPS made changes to the medical regimen both during the inpatient admission as well as after discharge to correct medication errors and educate patients.
In addition, GMED led to a reduction in the number of prescribed medications, which impacts inappropriate polypharmacy—a significant problem in older adults, which contributes to ADEs.21 Our intervention was patient centered, as all decisions and education regarding medication management were tailored to each patient, taking into account medical and psychosocial factors.
Studies of similar programs have shown that a pharmacist-based program can improve outcomes in patients transitioning from hospital to home. A meta-analysis of 19 studies that evaluated the effectiveness of pharmacy-led medication reconciliation interventions at the time of a care transition showed that compared with usual care a pharmacist intervention led to reduced medication discrepancies.22 In this meta-analysis, medication discrepancies of higher clinical impact were more easily identified through pharmacy-led interventions than with usual care, suggesting improved safety. Although not all studies have shown a clear reduction in readmission rates or other health care utilization, the addition of clinical pharmacist services in the care of inpatients has generally resulted in improved care with no evidence of harm.23
Based on these findings and collaboration with another GRECC, we designed our program to focus on older adults with polypharmacy, cognitive impairment, high-risk medication usage, and/or a history of high health care use.9 Our findings add to the growing body of evidence that a CPS-led transitional care program results in reduced polypharmacy and reduced unnecessary hospital readmissions. Further, our findings have demonstrated the effectiveness of this type of program in a practical, clinical setting with veteran patients.
At the time of project inception, we believed that the majority of our interventions would occur postdischarge. We were somewhat surprised that a major component of GMED was suggested interventions by our pharmacist at the time of admission. We believe that because the CPS made suggestions during admission, we prevented postdischarge ADEs. A frequent intervention corrected the medication reconciliation on file at admission. This finding also was seen in another study by Gleason and colleagues, which examined medication errors at admission for 651 adult medicine inpatients.24 This study found that more than one-third of patients had medication reconciliation errors. Further, older age (≥ 65 years) was associated with increased odds of medication errors in this study.
Of note, a survey of hospital-based pharmacists indicated medication reconciliation is the most important role of the pharmacist in improving care transitions.25 The pharmacists stated that detection of errors at the time of admission is very important. The pharmacists further reported that additional education and counseling for patients with poor understanding of their medications was also important. Our findings support these findings and the use of a pharmacist as part of the medical team to improve medication reconciliation and education.
Limitations
A limitation of GMED is that we monitored only admissions to our hospital; therefore, we did not account for any hospitalizations that may have occurred outside the STVHCS. Another limitation is that this was not a randomized controlled trial, and we used a convenience sample of patients who met our criteria for eligibility but were not seen due to time constraints. This introduces potential bias such that patients admitted and discharged on nights or weekends when the CPS was not available were not included in the transitional care program group, and these patients may fundamentally differ from those admitted and discharged Monday through Friday.
However, Khanna and colleagues found that night or weekend admission was not associated with 30-day readmission or other worse outcomes (such as length of stay, 30-day emergency department visit, or intensive care unit transfer) in 857 general medicine admissions at a tertiary care hospital.26 Every effort was made to include as many eligible patients as possible in the transitional program group, and we were able to demonstrate that the patients in the 2 groups were similar. Frailty and prior hospital admission were more prevalent, although not significantly so, in the transitional program group, suggesting that any selection bias would have actually attenuated—not enhanced—the observed effect of the transitional program. Although the transitional program group patients were slightly younger by 0.3 years, they were similar in frailty status and CCI score.
Conclusion
The GMED program was associated with reduced 30-day hospital readmission, discontinuation of unnecessary medications, and corrected medication errors and discrepancies. We propose that a CPS-based transitional care program can improve the quality of care for older patients being discharged to home.
Acknowledgments
Supported by funding from the Veterans Health Administration T21 Non-Institutional Long-Term Care Initiative and VA Office of Rural Health and the San Antonio Geriatrics Research, Education, and Clinical Center. The sponsor did not have any role in the design, methods, data collection, or analysis, and preparation.
Author Contributions
R. Rottman-Sagebiel developed the transitional program concept and design and executed the program implementation, interpretation of data, and preparation of the manuscript. S. Pastewait, N. Cupples, A. Conde, M. Moris, and E. Gonzalez assisted with program design and implementation. S. Cope assisted with interpretation of data and preparation of the manuscript. H. Braden assisted with interpretation of data. D. MacCarthy assisted with data management and statistical analysis. C. Wang and S. Espinoza developed the program concept and design, performed statistical analysis and interpretation of data, and helped prepare the manuscript.
Advances in Geriatrics
Advances in Geriatrics features articles focused on quality improvement/quality assurance initiatives, pilot studies, best practices, research, patient education, and patient-centered care written by health care providers associated with Veteran Health Administration Geriatric Research Education and Clinical Centers. Interested authors can submit articles at editorialmanager.com/fedprac or send a brief 2 to 3 sentence abstract to fedprac@mdedge.com for feedback and publication recommendations.
1. Vincent GK, Velkoff VA. The Next Four Decades: The Older Population in the United States: 2010 to 2050. US Department of Commerce, Economics and Statistics Administration, US Census Bureau; 2010.
2. Merle L, Laroche ML, Dantoine T, Charmes JP. Predicting and preventing adverse drug reactions in the very old. Drugs Aging. 2005;22(5):375-392.
3. Shi S, Mörike K, Klotz U. The clinical implications of ageing for rational drug therapy. Eur J Clin Pharmacol. 2008;64(2):183-199.
4. Coleman EA, Min Sj, Chomiak A, Kramer AM. Posthospital care transitions: patterns, complications, and risk identification. Health Serv Res. 2004;39(5):1449-1465.
5. Berwick DM, Hackbarth AD. Eliminating waste in US health care. JAMA. 2012;307(14):1513-1516.
6. Price Waterhouse Coopers Health Research Institute. The Price of Excess: Identifying Waste in Healthcare Spending. Price Waterhouse Coopers Health Research Institute; 2008.
7. Jencks SF, Williams MV, Coleman EA. Rehospitalizations among patients in the Medicare fee-for-service program. N Engl J Med. 2009;360(14):1418-1428.
8. Forster AJ, Murff HJ, Peterson JF, Gandhi TK, Bates DW. The incidence and severity of adverse events affecting patients after discharge from the hospital. Ann Intern Med. 2003;138(3):161-167.
9. Paquin AM, Salow M, Rudolph JL. Pharmacist calls to older adults with cognitive difficulties after discharge in a Tertiary Veterans Administration Medical Center: a quality improvement program. J Am Geriatr Soc. 2015;63(3):571-577.
10. The American Geriatrics Society 2015 Beers Criteria Update Expert Panel. American Geriatrics Society 2015 updated Beers Criteria for potentially inappropriate medication use in older adults. J Am Geriatr Soc. 2015;63(11):2227-2246.
11. Greenwald JL, Halasyamani L, Greene J, et al. Making inpatient medication reconciliation patient centered, clinically relevant and implementable: a consensus statement on key principles and necessary first steps. J Hosp Med. 2010;5(8):477-485.
12. Gallagher P, Ryan C, Byrne S, Kennedy J, O’Mahony D. STOPP (Screening Tool of Older Person’s Prescriptions) and START (Screening Tool to Alert doctors to Right Treatment). Consensus validation. Int J Clin Pharmacol Ther. 2008;46(2):72-83.
13. Borson S, Scanlan J, Brush M, Vitaliano P, Dokmak A. The mini‐cog: a cognitive ‘vital signs’ measure for dementia screening in multi‐lingual elderly. Int J Geriatr Psychiatry. 2000;15(11):1021-1027.
14. Deyo RA, Cherkin DC, Ciol MA. Adapting a clinical comorbidity index for use with ICD-9-CM administrative databases. J Clin Epidemiol. 1992;45(6):613-619.
15. Chaves PH, Semba RD, Leng SX, et al. Impact of anemia and cardiovascular disease on frailty status of community-dwelling older women: the Women’s Health and Aging Studies I and II. J Gerontol A Biol Sci Med Sci. 2005;60(6):729-735.
16. Fried LP, Tangen CM, Walston J, et al; Cardiovascular Health Study Collaborative Research Group. Frailty in older adults: evidence for a phenotype. J Gerontol A Biol Sci Med Sci. 2001;56(3):M146-M156.
17. Walston J, McBurnie MA, Newman A, et al; Cardiovascular Health Study. Frailty and activation of the inflammation and coagulation systems with and without clinical comorbidities: results from the Cardiovascular Health Study. Arch Int Med. 2002;162(20):2333-2341.
18. Stookey JD, Purser JL, Pieper CF, Cohen HJ. Plasma hypertonicity: another marker of frailty? J Am Geriatr Soc. 2004;52(8):1313-1320.
19. Rockwood K, Mitnitski A. Frailty in relation to the accumulation of deficits. J Gerontol A Biol Sci Med Sci. 2007;62(7):722-727.
20. Pugh JA, Wang CP, Espinoza SE, et al. Influence of frailty‐related diagnoses, high‐risk prescribing in elderly adults, and primary care use on readmissions in fewer than 30 days for veterans aged 65 and older. J Am Geriatr Soc. 2014;62(2):291-298.
21. Scott IA, Hilmer SN, Reeve E, et al. Reducing inappropriate polypharmacy: the process of deprescribing. JAMA Intern Med. 2015;175(5):827-834.
22. Mekonnen AB, McLachlan AJ, Brien JA. Pharmacy‐led medication reconciliation programmes at hospital transitions: a systematic review and meta‐analysis. J Clin Pharm Ther. 2016;41(2):128-144.
23. Kaboli PJ, Hoth AB, McClimon BJ, Schnipper JL. Clinical pharmacists and inpatient medical care: a systematic review. Arch Int Med. 2006;166(9):955-964.
24. Gleason KM, McDaniel MR, Feinglass J, et al. Results of the Medications at Transitions and Clinical Handoffs (MATCH) study: an analysis of medication reconciliation errors and risk factors at hospital admission. J Gen Intern Med. 2010;25(5):441-447.
25. Haynes KT, Oberne A, Cawthon C, Kripalani S. Pharmacists’ recommendations to improve care transitions. Ann Pharmacother. 2012;46(9):1152-1159.
26. Khanna R, Wachsberg K, Marouni A, Feinglass J, Williams MV, Wayne DB. The association between night or weekend admission and hospitalization‐relevant patient outcomes. J Hosp Med. 2011;6(1):10-14.
Medication reconciliation and patient education during admission and after discharge helped older patients remain independent at home.
Medication reconciliation and patient education during admission and after discharge helped older patients remain independent at home.
There will be 53 million older adults in the US by 2020.1 Increasing age often brings medical comorbidities and prescriptions for multiple medications. An increasing number of prescribed medications combined with age-related changes in the ability to metabolize drugs makes older adults highly vulnerable to adverse drug events (ADEs).2 In addition, older adults often have difficulty self-managing their medications and adhering to prescribed regimens.3 As a result, ADEs can lead to poor health outcomes, including hospitalizations, in older adults.
Medication errors and ADEs are particularly common during transitions from hospital to home and can lead to unnecessary readmissions,a major cause of wasteful health care spending in the US.4,5 More than $25 billion are estimated to be spent annually on hospital readmissions, with Medicare picking up the bill for $17 billion of the total.6,7 Researchers have found that the majority of ADEs following hospital discharge are either entirely preventable or at least ameliorable (ie, the negative impact or harm resulting from the ADE could have been reduced).8
To address these issues, we undertook a clinical demonstration project that implemented a new transitional care program to improve the quality of care for older veterans transitioning from the Audie L. Murphy Veterans Memorial Hospital of the South Texas Veterans Health Care System (STVHCS) in San Antonio to home. The Geriatrics Medication Education at Discharge project (GMED) falls under the auspices of the San Antonio Geriatrics Research Education and Clinical Center (GRECC). Clinical demonstration projects are mandated for US Department of Veterans Affairs (VA) GRECCs to create and promote innovative models of care for older veterans. Dissemination of successful clinical demonstration projects to other VA sites is strongly encouraged. The GMED program was modeled after the Boston GRECC Pharmacological Intervention in Late Life (PILL) program.9 The PILL program, which focuses on serving older veterans with cognitive impairment, demonstrated that a postdischarge pharmacist telephone visit for medication reconciliation leads to a reduction in readmission within 60 days of discharge.9 The goals of the GMED program were to reduce polypharmacy, inappropriate prescribing and 30-day readmissions.
Methods
The project was conducted when a full-time clinical pharmacy specialist (CPS) was available (May-September 2013 and April 2014-March 2015). This project was approved as nonresearch/quality improvement by the University of Texas Health Science Center Institutional Review Board, which serves the STVHCS. Consent was not required.
Eligibility
Patients were identified via a daily hospital database query of all adults aged ≥ 65 years admitted to the hospital through Inpatient Medicine, Neurology, or Cardiology services within the prior 24 hours. Patients meeting any of the following criteria based on review of the Computerized Patient Record System (CPRS) by the team geriatrician and CPS were considered eligible: (1) aged ≥ 70 years prescribed ≥ 12 outpatient medications; (2) aged ≥ 65 years with a medical history of dementia; (3) aged ≥ 65 years prescribed outpatient medications meeting Beers criteria10; (4) age ≥ 65 years with ≥ 2 hospital admissions (including the current, index admission) within the past calendar year; or (5) aged ≥ 65 years with ≥ 3 emergency department visits within the past calendar year. For the first polypharmacy criterion, patients aged ≥ 70 years were selected instead of aged ≥ 65 years so as not to exceed the capacity of 1 CPS. Twelve or more medications were used as a cutoff for polypharmacy based on prior quality improvement information gathered from our VA geriatrics clinic examining the average number of medications taken by older veterans in the outpatient setting.
Related: Reducing COPD Readmission Rates: Using a COPD Care Service During Care Transitions
Patients were excluded if they were expected to be discharged to any facility where the patient and/or the caregiver were not primarily responsible for medication administration after discharge. Patients who met eligibility criteria but were not seen by the transitional program pharmacist (due to staff capacity) were included in this analysis as a convenience comparison group of patients who received usual care. Patients were not randomized. All communication occurred in English, but this project did not exclude patients with limited English proficiency.
A program support assistant conducted the daily query of the hospital database. The pharmacist conducted the chart review to determine eligibility and delivered the intervention. Eligible patients were selected at random for the intervention with the intention of providing the intervention to as many veterans as possible.
The GMED Intervention
The GMED program included 2 phases, which were both conducted by a CPS with oversight from a senior CPS with geriatric pharmacology expertise and an internist/geriatrician.
The first phase of the transitional care program included an individual, face-to-face meeting between the CPS and the patient during the hospitalization. If a veteran was not present in the room at the time of an attempted visit, the pharmacist made 2 additional attempts (3 total) to include the patient in the transitional care program during the hospitalization.
The second component of the transitional care program included a telephone visit within 2 to 3 days of discharge, conducted by the same CPS who performed the face-to-face visit. The purpose of the telephone visit was to perform medication reconciliation, identify and rectify medication errors, provide further patient education, and assist in facilitating appropriate follow-up by the patient’s primary care provider (PCP), if required. At a minimum, veterans were asked a series of questions pertaining to their concerns about medication regimens, receipt of newly prescribed medications at discharge, additional education regarding medications after the CPS encounter during hospitalization, and whether the veteran required assistance with the medication regimen in the home setting. Follow-up questions were asked as needed to clarify and identify potential medication problems. All information from this telephone encounter was communicated to the PCP through CPRS documentation and by telephone as needed.
Related: Initiative to Minimize Pharmaceutical Risk in Older Veterans (IMPROVE) Polypharmacy Clinic
Data Collection
A standardized questionnaire was used prospectively for patients in the transitional care program group to assess patient education, primary residence, presence of a caregiver, fall history, medication adherence, and cognitive status (using Mini-Cog).13 Additional information (patient age, number of outpatient medications prior to and following the admission, presence of Beers criteria outpatient medications prior to and following the admission, new outpatient prescriptions, and changes to existing prescriptions as a result of the hospitalization) was gathered prospectively from patient interviews or from chart review.
For patients included in the comparison group, a retrospective administrative chart review was conducted to collect information such as age, sex, ethnic group, admission within 1 year prior to index admission, frailty, and Charlson Comorbidity Index (CCI) score, a method of categorizing comorbidities of patients based on the diagnosis codes found in administrative data.14 Each comorbidity category has an associated weight (from 1 to 6), based on the adjusted risk of mortality or resource use, and the sum of all the weights results in a single comorbidity score for a patient (0 indicates no comorbidities; higher scores predict greater risk of mortality or increased resource use).
We used the index developed from 17 disease categories. The range for CCI was 0 to 25. Frailty was defined as the presence of any of the following frailty-related diagnoses: anemia; fall, head injury, other injury; coagulopathy; electrolyte disturbance; or gait disorder. These diagnoses are either primary frailty characteristics within the frailty phenotype or have been shown in prior studies to be associated with the frailty phenotype.15-18 While more widely accepted frailty definitions exist,these other definitions require direct examination of the patient and could not be used in this project because we did not directly interact with the comparison group.16,19 The frailty definition used has been previously identified as a predictor of health care utilization and 30-day readmission in a veteran population.20 Whether or not the CPS detected a postdischarge medication error was recorded. All CPS recommendations were documented.
An index admission was defined as a hospital admission that occurred during the project period. Thirty-day readmission was defined as a hospital admission that occurred within 30 days of the discharge date of an index admission. Each index admission was considered individually for readmission (yes vs no) even if it occurred in the same patient over the project period. A 30-day readmission was not considered an index admission. An admission that occurred after a 30-day readmission was considered a subsequent index admission. Patients who died in the hospital were not included in this analysis, as they would not have participated in the entire intervention.
Statistical Analysis
We compared characteristics between patients who received GMED and patients who never received GMED (comparison group). Generalized estimating equations (GEE) were used to determine whether the rate of 30-day readmission (yes vs no) in the transitional care program group differed from that of the comparison group. In our GEE analysis, we assumed a binomial distribution and the logit link to model the log-odds of readmission as a linear function of transitional care program status (yes vs no) and other covariates, including age, frailty, hospital admission within 1 year prior to the index admission, and CCI score as covariates. Thirty-day readmission status associated with each index admission was coded as 1 for a readmission within 30 days of the discharge date of the index admission, or 0 for no readmission within 30 days.
Transitional care program status was determined whether or not the individual received the transitional care program for each index admission. This analysis allowed us to model repeated measures of index admissions as a function of the project period and whether the patient was seen by the GMED CPS during the index admission. The patient identifier was used as a cluster variable in the GEE analysis. Inverse propensity scores of receiving GMED at the index admission were adjusted as weights in the GEE analysis to minimize confounding and, hence, to strengthen the causal interpretation of the effect of the transitional care program. If there was ≥ 1 index admission, the GMED status (yes vs no) at the initial index admission was used as the dependent variable to calculate propensity scores. The propensity scores of transitional care program status were derived from the logistic regression analysis that modeled the log-odds of receiving the transitional care program at the index admission as a linear function of age, CCI, frailty, and prior hospitalization during the 1-year period prior to the index admission.
Related: Development and Implementation of a Geriatric Walking Clinic
Results
The GMED CPS saw 435 patients during the project period; 47 (10.8%) died prior to 30 days and were excluded, leaving 388 patients who received the transitional care program included in this evaluation.
Data from the CPS-patient interviews and chart reviews were available for 378 of the 388 patients (Table 2). Patients were primarily male, non-Hispanic white, with a high school education. More than half (65%) the patients were admitted for a new diagnosis or clinical condition.
The 30-day readmission rate was 15.6% for the transitional care program group and 21.9% for the comparison group. Three hundred seventy-one patients received the transitional care program only once, 16 patients received the transitional care program twice (ie, they had 2 index admissions during the study period and received the intervention both times), and 1 patient received the transitional care program 3 times.
In an unadjusted GEE model, the odds ratio (OR) for readmission in the transitional care program group was 0.74 (95% CI, 0.54-1.0, P = .06) compared with the usual care group (Table 3).
Thirty-five percent of patients had ≥ 1 CPS-recommended change in their treatment at the time of the inpatient admission (Table 4).
Discussion
We developed a transitional care program for hospitalized older veterans to improve the transition from hospital to home. After adjusting for clinical factors, GMED was associated with 26% lower odds of readmission within 30 days of discharge compared with that of the control group. The GMED CPS made changes to the medical regimen both during the inpatient admission as well as after discharge to correct medication errors and educate patients.
In addition, GMED led to a reduction in the number of prescribed medications, which impacts inappropriate polypharmacy—a significant problem in older adults, which contributes to ADEs.21 Our intervention was patient centered, as all decisions and education regarding medication management were tailored to each patient, taking into account medical and psychosocial factors.
Studies of similar programs have shown that a pharmacist-based program can improve outcomes in patients transitioning from hospital to home. A meta-analysis of 19 studies that evaluated the effectiveness of pharmacy-led medication reconciliation interventions at the time of a care transition showed that compared with usual care a pharmacist intervention led to reduced medication discrepancies.22 In this meta-analysis, medication discrepancies of higher clinical impact were more easily identified through pharmacy-led interventions than with usual care, suggesting improved safety. Although not all studies have shown a clear reduction in readmission rates or other health care utilization, the addition of clinical pharmacist services in the care of inpatients has generally resulted in improved care with no evidence of harm.23
Based on these findings and collaboration with another GRECC, we designed our program to focus on older adults with polypharmacy, cognitive impairment, high-risk medication usage, and/or a history of high health care use.9 Our findings add to the growing body of evidence that a CPS-led transitional care program results in reduced polypharmacy and reduced unnecessary hospital readmissions. Further, our findings have demonstrated the effectiveness of this type of program in a practical, clinical setting with veteran patients.
At the time of project inception, we believed that the majority of our interventions would occur postdischarge. We were somewhat surprised that a major component of GMED was suggested interventions by our pharmacist at the time of admission. We believe that because the CPS made suggestions during admission, we prevented postdischarge ADEs. A frequent intervention corrected the medication reconciliation on file at admission. This finding also was seen in another study by Gleason and colleagues, which examined medication errors at admission for 651 adult medicine inpatients.24 This study found that more than one-third of patients had medication reconciliation errors. Further, older age (≥ 65 years) was associated with increased odds of medication errors in this study.
Of note, a survey of hospital-based pharmacists indicated medication reconciliation is the most important role of the pharmacist in improving care transitions.25 The pharmacists stated that detection of errors at the time of admission is very important. The pharmacists further reported that additional education and counseling for patients with poor understanding of their medications was also important. Our findings support these findings and the use of a pharmacist as part of the medical team to improve medication reconciliation and education.
Limitations
A limitation of GMED is that we monitored only admissions to our hospital; therefore, we did not account for any hospitalizations that may have occurred outside the STVHCS. Another limitation is that this was not a randomized controlled trial, and we used a convenience sample of patients who met our criteria for eligibility but were not seen due to time constraints. This introduces potential bias such that patients admitted and discharged on nights or weekends when the CPS was not available were not included in the transitional care program group, and these patients may fundamentally differ from those admitted and discharged Monday through Friday.
However, Khanna and colleagues found that night or weekend admission was not associated with 30-day readmission or other worse outcomes (such as length of stay, 30-day emergency department visit, or intensive care unit transfer) in 857 general medicine admissions at a tertiary care hospital.26 Every effort was made to include as many eligible patients as possible in the transitional program group, and we were able to demonstrate that the patients in the 2 groups were similar. Frailty and prior hospital admission were more prevalent, although not significantly so, in the transitional program group, suggesting that any selection bias would have actually attenuated—not enhanced—the observed effect of the transitional program. Although the transitional program group patients were slightly younger by 0.3 years, they were similar in frailty status and CCI score.
Conclusion
The GMED program was associated with reduced 30-day hospital readmission, discontinuation of unnecessary medications, and corrected medication errors and discrepancies. We propose that a CPS-based transitional care program can improve the quality of care for older patients being discharged to home.
Acknowledgments
Supported by funding from the Veterans Health Administration T21 Non-Institutional Long-Term Care Initiative and VA Office of Rural Health and the San Antonio Geriatrics Research, Education, and Clinical Center. The sponsor did not have any role in the design, methods, data collection, or analysis, and preparation.
Author Contributions
R. Rottman-Sagebiel developed the transitional program concept and design and executed the program implementation, interpretation of data, and preparation of the manuscript. S. Pastewait, N. Cupples, A. Conde, M. Moris, and E. Gonzalez assisted with program design and implementation. S. Cope assisted with interpretation of data and preparation of the manuscript. H. Braden assisted with interpretation of data. D. MacCarthy assisted with data management and statistical analysis. C. Wang and S. Espinoza developed the program concept and design, performed statistical analysis and interpretation of data, and helped prepare the manuscript.
Advances in Geriatrics
Advances in Geriatrics features articles focused on quality improvement/quality assurance initiatives, pilot studies, best practices, research, patient education, and patient-centered care written by health care providers associated with Veteran Health Administration Geriatric Research Education and Clinical Centers. Interested authors can submit articles at editorialmanager.com/fedprac or send a brief 2 to 3 sentence abstract to fedprac@mdedge.com for feedback and publication recommendations.
There will be 53 million older adults in the US by 2020.1 Increasing age often brings medical comorbidities and prescriptions for multiple medications. An increasing number of prescribed medications combined with age-related changes in the ability to metabolize drugs makes older adults highly vulnerable to adverse drug events (ADEs).2 In addition, older adults often have difficulty self-managing their medications and adhering to prescribed regimens.3 As a result, ADEs can lead to poor health outcomes, including hospitalizations, in older adults.
Medication errors and ADEs are particularly common during transitions from hospital to home and can lead to unnecessary readmissions,a major cause of wasteful health care spending in the US.4,5 More than $25 billion are estimated to be spent annually on hospital readmissions, with Medicare picking up the bill for $17 billion of the total.6,7 Researchers have found that the majority of ADEs following hospital discharge are either entirely preventable or at least ameliorable (ie, the negative impact or harm resulting from the ADE could have been reduced).8
To address these issues, we undertook a clinical demonstration project that implemented a new transitional care program to improve the quality of care for older veterans transitioning from the Audie L. Murphy Veterans Memorial Hospital of the South Texas Veterans Health Care System (STVHCS) in San Antonio to home. The Geriatrics Medication Education at Discharge project (GMED) falls under the auspices of the San Antonio Geriatrics Research Education and Clinical Center (GRECC). Clinical demonstration projects are mandated for US Department of Veterans Affairs (VA) GRECCs to create and promote innovative models of care for older veterans. Dissemination of successful clinical demonstration projects to other VA sites is strongly encouraged. The GMED program was modeled after the Boston GRECC Pharmacological Intervention in Late Life (PILL) program.9 The PILL program, which focuses on serving older veterans with cognitive impairment, demonstrated that a postdischarge pharmacist telephone visit for medication reconciliation leads to a reduction in readmission within 60 days of discharge.9 The goals of the GMED program were to reduce polypharmacy, inappropriate prescribing and 30-day readmissions.
Methods
The project was conducted when a full-time clinical pharmacy specialist (CPS) was available (May-September 2013 and April 2014-March 2015). This project was approved as nonresearch/quality improvement by the University of Texas Health Science Center Institutional Review Board, which serves the STVHCS. Consent was not required.
Eligibility
Patients were identified via a daily hospital database query of all adults aged ≥ 65 years admitted to the hospital through Inpatient Medicine, Neurology, or Cardiology services within the prior 24 hours. Patients meeting any of the following criteria based on review of the Computerized Patient Record System (CPRS) by the team geriatrician and CPS were considered eligible: (1) aged ≥ 70 years prescribed ≥ 12 outpatient medications; (2) aged ≥ 65 years with a medical history of dementia; (3) aged ≥ 65 years prescribed outpatient medications meeting Beers criteria10; (4) age ≥ 65 years with ≥ 2 hospital admissions (including the current, index admission) within the past calendar year; or (5) aged ≥ 65 years with ≥ 3 emergency department visits within the past calendar year. For the first polypharmacy criterion, patients aged ≥ 70 years were selected instead of aged ≥ 65 years so as not to exceed the capacity of 1 CPS. Twelve or more medications were used as a cutoff for polypharmacy based on prior quality improvement information gathered from our VA geriatrics clinic examining the average number of medications taken by older veterans in the outpatient setting.
Related: Reducing COPD Readmission Rates: Using a COPD Care Service During Care Transitions
Patients were excluded if they were expected to be discharged to any facility where the patient and/or the caregiver were not primarily responsible for medication administration after discharge. Patients who met eligibility criteria but were not seen by the transitional program pharmacist (due to staff capacity) were included in this analysis as a convenience comparison group of patients who received usual care. Patients were not randomized. All communication occurred in English, but this project did not exclude patients with limited English proficiency.
A program support assistant conducted the daily query of the hospital database. The pharmacist conducted the chart review to determine eligibility and delivered the intervention. Eligible patients were selected at random for the intervention with the intention of providing the intervention to as many veterans as possible.
The GMED Intervention
The GMED program included 2 phases, which were both conducted by a CPS with oversight from a senior CPS with geriatric pharmacology expertise and an internist/geriatrician.
The first phase of the transitional care program included an individual, face-to-face meeting between the CPS and the patient during the hospitalization. If a veteran was not present in the room at the time of an attempted visit, the pharmacist made 2 additional attempts (3 total) to include the patient in the transitional care program during the hospitalization.
The second component of the transitional care program included a telephone visit within 2 to 3 days of discharge, conducted by the same CPS who performed the face-to-face visit. The purpose of the telephone visit was to perform medication reconciliation, identify and rectify medication errors, provide further patient education, and assist in facilitating appropriate follow-up by the patient’s primary care provider (PCP), if required. At a minimum, veterans were asked a series of questions pertaining to their concerns about medication regimens, receipt of newly prescribed medications at discharge, additional education regarding medications after the CPS encounter during hospitalization, and whether the veteran required assistance with the medication regimen in the home setting. Follow-up questions were asked as needed to clarify and identify potential medication problems. All information from this telephone encounter was communicated to the PCP through CPRS documentation and by telephone as needed.
Related: Initiative to Minimize Pharmaceutical Risk in Older Veterans (IMPROVE) Polypharmacy Clinic
Data Collection
A standardized questionnaire was used prospectively for patients in the transitional care program group to assess patient education, primary residence, presence of a caregiver, fall history, medication adherence, and cognitive status (using Mini-Cog).13 Additional information (patient age, number of outpatient medications prior to and following the admission, presence of Beers criteria outpatient medications prior to and following the admission, new outpatient prescriptions, and changes to existing prescriptions as a result of the hospitalization) was gathered prospectively from patient interviews or from chart review.
For patients included in the comparison group, a retrospective administrative chart review was conducted to collect information such as age, sex, ethnic group, admission within 1 year prior to index admission, frailty, and Charlson Comorbidity Index (CCI) score, a method of categorizing comorbidities of patients based on the diagnosis codes found in administrative data.14 Each comorbidity category has an associated weight (from 1 to 6), based on the adjusted risk of mortality or resource use, and the sum of all the weights results in a single comorbidity score for a patient (0 indicates no comorbidities; higher scores predict greater risk of mortality or increased resource use).
We used the index developed from 17 disease categories. The range for CCI was 0 to 25. Frailty was defined as the presence of any of the following frailty-related diagnoses: anemia; fall, head injury, other injury; coagulopathy; electrolyte disturbance; or gait disorder. These diagnoses are either primary frailty characteristics within the frailty phenotype or have been shown in prior studies to be associated with the frailty phenotype.15-18 While more widely accepted frailty definitions exist,these other definitions require direct examination of the patient and could not be used in this project because we did not directly interact with the comparison group.16,19 The frailty definition used has been previously identified as a predictor of health care utilization and 30-day readmission in a veteran population.20 Whether or not the CPS detected a postdischarge medication error was recorded. All CPS recommendations were documented.
An index admission was defined as a hospital admission that occurred during the project period. Thirty-day readmission was defined as a hospital admission that occurred within 30 days of the discharge date of an index admission. Each index admission was considered individually for readmission (yes vs no) even if it occurred in the same patient over the project period. A 30-day readmission was not considered an index admission. An admission that occurred after a 30-day readmission was considered a subsequent index admission. Patients who died in the hospital were not included in this analysis, as they would not have participated in the entire intervention.
Statistical Analysis
We compared characteristics between patients who received GMED and patients who never received GMED (comparison group). Generalized estimating equations (GEE) were used to determine whether the rate of 30-day readmission (yes vs no) in the transitional care program group differed from that of the comparison group. In our GEE analysis, we assumed a binomial distribution and the logit link to model the log-odds of readmission as a linear function of transitional care program status (yes vs no) and other covariates, including age, frailty, hospital admission within 1 year prior to the index admission, and CCI score as covariates. Thirty-day readmission status associated with each index admission was coded as 1 for a readmission within 30 days of the discharge date of the index admission, or 0 for no readmission within 30 days.
Transitional care program status was determined whether or not the individual received the transitional care program for each index admission. This analysis allowed us to model repeated measures of index admissions as a function of the project period and whether the patient was seen by the GMED CPS during the index admission. The patient identifier was used as a cluster variable in the GEE analysis. Inverse propensity scores of receiving GMED at the index admission were adjusted as weights in the GEE analysis to minimize confounding and, hence, to strengthen the causal interpretation of the effect of the transitional care program. If there was ≥ 1 index admission, the GMED status (yes vs no) at the initial index admission was used as the dependent variable to calculate propensity scores. The propensity scores of transitional care program status were derived from the logistic regression analysis that modeled the log-odds of receiving the transitional care program at the index admission as a linear function of age, CCI, frailty, and prior hospitalization during the 1-year period prior to the index admission.
Related: Development and Implementation of a Geriatric Walking Clinic
Results
The GMED CPS saw 435 patients during the project period; 47 (10.8%) died prior to 30 days and were excluded, leaving 388 patients who received the transitional care program included in this evaluation.
Data from the CPS-patient interviews and chart reviews were available for 378 of the 388 patients (Table 2). Patients were primarily male, non-Hispanic white, with a high school education. More than half (65%) the patients were admitted for a new diagnosis or clinical condition.
The 30-day readmission rate was 15.6% for the transitional care program group and 21.9% for the comparison group. Three hundred seventy-one patients received the transitional care program only once, 16 patients received the transitional care program twice (ie, they had 2 index admissions during the study period and received the intervention both times), and 1 patient received the transitional care program 3 times.
In an unadjusted GEE model, the odds ratio (OR) for readmission in the transitional care program group was 0.74 (95% CI, 0.54-1.0, P = .06) compared with the usual care group (Table 3).
Thirty-five percent of patients had ≥ 1 CPS-recommended change in their treatment at the time of the inpatient admission (Table 4).
Discussion
We developed a transitional care program for hospitalized older veterans to improve the transition from hospital to home. After adjusting for clinical factors, GMED was associated with 26% lower odds of readmission within 30 days of discharge compared with that of the control group. The GMED CPS made changes to the medical regimen both during the inpatient admission as well as after discharge to correct medication errors and educate patients.
In addition, GMED led to a reduction in the number of prescribed medications, which impacts inappropriate polypharmacy—a significant problem in older adults, which contributes to ADEs.21 Our intervention was patient centered, as all decisions and education regarding medication management were tailored to each patient, taking into account medical and psychosocial factors.
Studies of similar programs have shown that a pharmacist-based program can improve outcomes in patients transitioning from hospital to home. A meta-analysis of 19 studies that evaluated the effectiveness of pharmacy-led medication reconciliation interventions at the time of a care transition showed that compared with usual care a pharmacist intervention led to reduced medication discrepancies.22 In this meta-analysis, medication discrepancies of higher clinical impact were more easily identified through pharmacy-led interventions than with usual care, suggesting improved safety. Although not all studies have shown a clear reduction in readmission rates or other health care utilization, the addition of clinical pharmacist services in the care of inpatients has generally resulted in improved care with no evidence of harm.23
Based on these findings and collaboration with another GRECC, we designed our program to focus on older adults with polypharmacy, cognitive impairment, high-risk medication usage, and/or a history of high health care use.9 Our findings add to the growing body of evidence that a CPS-led transitional care program results in reduced polypharmacy and reduced unnecessary hospital readmissions. Further, our findings have demonstrated the effectiveness of this type of program in a practical, clinical setting with veteran patients.
At the time of project inception, we believed that the majority of our interventions would occur postdischarge. We were somewhat surprised that a major component of GMED was suggested interventions by our pharmacist at the time of admission. We believe that because the CPS made suggestions during admission, we prevented postdischarge ADEs. A frequent intervention corrected the medication reconciliation on file at admission. This finding also was seen in another study by Gleason and colleagues, which examined medication errors at admission for 651 adult medicine inpatients.24 This study found that more than one-third of patients had medication reconciliation errors. Further, older age (≥ 65 years) was associated with increased odds of medication errors in this study.
Of note, a survey of hospital-based pharmacists indicated medication reconciliation is the most important role of the pharmacist in improving care transitions.25 The pharmacists stated that detection of errors at the time of admission is very important. The pharmacists further reported that additional education and counseling for patients with poor understanding of their medications was also important. Our findings support these findings and the use of a pharmacist as part of the medical team to improve medication reconciliation and education.
Limitations
A limitation of GMED is that we monitored only admissions to our hospital; therefore, we did not account for any hospitalizations that may have occurred outside the STVHCS. Another limitation is that this was not a randomized controlled trial, and we used a convenience sample of patients who met our criteria for eligibility but were not seen due to time constraints. This introduces potential bias such that patients admitted and discharged on nights or weekends when the CPS was not available were not included in the transitional care program group, and these patients may fundamentally differ from those admitted and discharged Monday through Friday.
However, Khanna and colleagues found that night or weekend admission was not associated with 30-day readmission or other worse outcomes (such as length of stay, 30-day emergency department visit, or intensive care unit transfer) in 857 general medicine admissions at a tertiary care hospital.26 Every effort was made to include as many eligible patients as possible in the transitional program group, and we were able to demonstrate that the patients in the 2 groups were similar. Frailty and prior hospital admission were more prevalent, although not significantly so, in the transitional program group, suggesting that any selection bias would have actually attenuated—not enhanced—the observed effect of the transitional program. Although the transitional program group patients were slightly younger by 0.3 years, they were similar in frailty status and CCI score.
Conclusion
The GMED program was associated with reduced 30-day hospital readmission, discontinuation of unnecessary medications, and corrected medication errors and discrepancies. We propose that a CPS-based transitional care program can improve the quality of care for older patients being discharged to home.
Acknowledgments
Supported by funding from the Veterans Health Administration T21 Non-Institutional Long-Term Care Initiative and VA Office of Rural Health and the San Antonio Geriatrics Research, Education, and Clinical Center. The sponsor did not have any role in the design, methods, data collection, or analysis, and preparation.
Author Contributions
R. Rottman-Sagebiel developed the transitional program concept and design and executed the program implementation, interpretation of data, and preparation of the manuscript. S. Pastewait, N. Cupples, A. Conde, M. Moris, and E. Gonzalez assisted with program design and implementation. S. Cope assisted with interpretation of data and preparation of the manuscript. H. Braden assisted with interpretation of data. D. MacCarthy assisted with data management and statistical analysis. C. Wang and S. Espinoza developed the program concept and design, performed statistical analysis and interpretation of data, and helped prepare the manuscript.
Advances in Geriatrics
Advances in Geriatrics features articles focused on quality improvement/quality assurance initiatives, pilot studies, best practices, research, patient education, and patient-centered care written by health care providers associated with Veteran Health Administration Geriatric Research Education and Clinical Centers. Interested authors can submit articles at editorialmanager.com/fedprac or send a brief 2 to 3 sentence abstract to fedprac@mdedge.com for feedback and publication recommendations.
1. Vincent GK, Velkoff VA. The Next Four Decades: The Older Population in the United States: 2010 to 2050. US Department of Commerce, Economics and Statistics Administration, US Census Bureau; 2010.
2. Merle L, Laroche ML, Dantoine T, Charmes JP. Predicting and preventing adverse drug reactions in the very old. Drugs Aging. 2005;22(5):375-392.
3. Shi S, Mörike K, Klotz U. The clinical implications of ageing for rational drug therapy. Eur J Clin Pharmacol. 2008;64(2):183-199.
4. Coleman EA, Min Sj, Chomiak A, Kramer AM. Posthospital care transitions: patterns, complications, and risk identification. Health Serv Res. 2004;39(5):1449-1465.
5. Berwick DM, Hackbarth AD. Eliminating waste in US health care. JAMA. 2012;307(14):1513-1516.
6. Price Waterhouse Coopers Health Research Institute. The Price of Excess: Identifying Waste in Healthcare Spending. Price Waterhouse Coopers Health Research Institute; 2008.
7. Jencks SF, Williams MV, Coleman EA. Rehospitalizations among patients in the Medicare fee-for-service program. N Engl J Med. 2009;360(14):1418-1428.
8. Forster AJ, Murff HJ, Peterson JF, Gandhi TK, Bates DW. The incidence and severity of adverse events affecting patients after discharge from the hospital. Ann Intern Med. 2003;138(3):161-167.
9. Paquin AM, Salow M, Rudolph JL. Pharmacist calls to older adults with cognitive difficulties after discharge in a Tertiary Veterans Administration Medical Center: a quality improvement program. J Am Geriatr Soc. 2015;63(3):571-577.
10. The American Geriatrics Society 2015 Beers Criteria Update Expert Panel. American Geriatrics Society 2015 updated Beers Criteria for potentially inappropriate medication use in older adults. J Am Geriatr Soc. 2015;63(11):2227-2246.
11. Greenwald JL, Halasyamani L, Greene J, et al. Making inpatient medication reconciliation patient centered, clinically relevant and implementable: a consensus statement on key principles and necessary first steps. J Hosp Med. 2010;5(8):477-485.
12. Gallagher P, Ryan C, Byrne S, Kennedy J, O’Mahony D. STOPP (Screening Tool of Older Person’s Prescriptions) and START (Screening Tool to Alert doctors to Right Treatment). Consensus validation. Int J Clin Pharmacol Ther. 2008;46(2):72-83.
13. Borson S, Scanlan J, Brush M, Vitaliano P, Dokmak A. The mini‐cog: a cognitive ‘vital signs’ measure for dementia screening in multi‐lingual elderly. Int J Geriatr Psychiatry. 2000;15(11):1021-1027.
14. Deyo RA, Cherkin DC, Ciol MA. Adapting a clinical comorbidity index for use with ICD-9-CM administrative databases. J Clin Epidemiol. 1992;45(6):613-619.
15. Chaves PH, Semba RD, Leng SX, et al. Impact of anemia and cardiovascular disease on frailty status of community-dwelling older women: the Women’s Health and Aging Studies I and II. J Gerontol A Biol Sci Med Sci. 2005;60(6):729-735.
16. Fried LP, Tangen CM, Walston J, et al; Cardiovascular Health Study Collaborative Research Group. Frailty in older adults: evidence for a phenotype. J Gerontol A Biol Sci Med Sci. 2001;56(3):M146-M156.
17. Walston J, McBurnie MA, Newman A, et al; Cardiovascular Health Study. Frailty and activation of the inflammation and coagulation systems with and without clinical comorbidities: results from the Cardiovascular Health Study. Arch Int Med. 2002;162(20):2333-2341.
18. Stookey JD, Purser JL, Pieper CF, Cohen HJ. Plasma hypertonicity: another marker of frailty? J Am Geriatr Soc. 2004;52(8):1313-1320.
19. Rockwood K, Mitnitski A. Frailty in relation to the accumulation of deficits. J Gerontol A Biol Sci Med Sci. 2007;62(7):722-727.
20. Pugh JA, Wang CP, Espinoza SE, et al. Influence of frailty‐related diagnoses, high‐risk prescribing in elderly adults, and primary care use on readmissions in fewer than 30 days for veterans aged 65 and older. J Am Geriatr Soc. 2014;62(2):291-298.
21. Scott IA, Hilmer SN, Reeve E, et al. Reducing inappropriate polypharmacy: the process of deprescribing. JAMA Intern Med. 2015;175(5):827-834.
22. Mekonnen AB, McLachlan AJ, Brien JA. Pharmacy‐led medication reconciliation programmes at hospital transitions: a systematic review and meta‐analysis. J Clin Pharm Ther. 2016;41(2):128-144.
23. Kaboli PJ, Hoth AB, McClimon BJ, Schnipper JL. Clinical pharmacists and inpatient medical care: a systematic review. Arch Int Med. 2006;166(9):955-964.
24. Gleason KM, McDaniel MR, Feinglass J, et al. Results of the Medications at Transitions and Clinical Handoffs (MATCH) study: an analysis of medication reconciliation errors and risk factors at hospital admission. J Gen Intern Med. 2010;25(5):441-447.
25. Haynes KT, Oberne A, Cawthon C, Kripalani S. Pharmacists’ recommendations to improve care transitions. Ann Pharmacother. 2012;46(9):1152-1159.
26. Khanna R, Wachsberg K, Marouni A, Feinglass J, Williams MV, Wayne DB. The association between night or weekend admission and hospitalization‐relevant patient outcomes. J Hosp Med. 2011;6(1):10-14.
1. Vincent GK, Velkoff VA. The Next Four Decades: The Older Population in the United States: 2010 to 2050. US Department of Commerce, Economics and Statistics Administration, US Census Bureau; 2010.
2. Merle L, Laroche ML, Dantoine T, Charmes JP. Predicting and preventing adverse drug reactions in the very old. Drugs Aging. 2005;22(5):375-392.
3. Shi S, Mörike K, Klotz U. The clinical implications of ageing for rational drug therapy. Eur J Clin Pharmacol. 2008;64(2):183-199.
4. Coleman EA, Min Sj, Chomiak A, Kramer AM. Posthospital care transitions: patterns, complications, and risk identification. Health Serv Res. 2004;39(5):1449-1465.
5. Berwick DM, Hackbarth AD. Eliminating waste in US health care. JAMA. 2012;307(14):1513-1516.
6. Price Waterhouse Coopers Health Research Institute. The Price of Excess: Identifying Waste in Healthcare Spending. Price Waterhouse Coopers Health Research Institute; 2008.
7. Jencks SF, Williams MV, Coleman EA. Rehospitalizations among patients in the Medicare fee-for-service program. N Engl J Med. 2009;360(14):1418-1428.
8. Forster AJ, Murff HJ, Peterson JF, Gandhi TK, Bates DW. The incidence and severity of adverse events affecting patients after discharge from the hospital. Ann Intern Med. 2003;138(3):161-167.
9. Paquin AM, Salow M, Rudolph JL. Pharmacist calls to older adults with cognitive difficulties after discharge in a Tertiary Veterans Administration Medical Center: a quality improvement program. J Am Geriatr Soc. 2015;63(3):571-577.
10. The American Geriatrics Society 2015 Beers Criteria Update Expert Panel. American Geriatrics Society 2015 updated Beers Criteria for potentially inappropriate medication use in older adults. J Am Geriatr Soc. 2015;63(11):2227-2246.
11. Greenwald JL, Halasyamani L, Greene J, et al. Making inpatient medication reconciliation patient centered, clinically relevant and implementable: a consensus statement on key principles and necessary first steps. J Hosp Med. 2010;5(8):477-485.
12. Gallagher P, Ryan C, Byrne S, Kennedy J, O’Mahony D. STOPP (Screening Tool of Older Person’s Prescriptions) and START (Screening Tool to Alert doctors to Right Treatment). Consensus validation. Int J Clin Pharmacol Ther. 2008;46(2):72-83.
13. Borson S, Scanlan J, Brush M, Vitaliano P, Dokmak A. The mini‐cog: a cognitive ‘vital signs’ measure for dementia screening in multi‐lingual elderly. Int J Geriatr Psychiatry. 2000;15(11):1021-1027.
14. Deyo RA, Cherkin DC, Ciol MA. Adapting a clinical comorbidity index for use with ICD-9-CM administrative databases. J Clin Epidemiol. 1992;45(6):613-619.
15. Chaves PH, Semba RD, Leng SX, et al. Impact of anemia and cardiovascular disease on frailty status of community-dwelling older women: the Women’s Health and Aging Studies I and II. J Gerontol A Biol Sci Med Sci. 2005;60(6):729-735.
16. Fried LP, Tangen CM, Walston J, et al; Cardiovascular Health Study Collaborative Research Group. Frailty in older adults: evidence for a phenotype. J Gerontol A Biol Sci Med Sci. 2001;56(3):M146-M156.
17. Walston J, McBurnie MA, Newman A, et al; Cardiovascular Health Study. Frailty and activation of the inflammation and coagulation systems with and without clinical comorbidities: results from the Cardiovascular Health Study. Arch Int Med. 2002;162(20):2333-2341.
18. Stookey JD, Purser JL, Pieper CF, Cohen HJ. Plasma hypertonicity: another marker of frailty? J Am Geriatr Soc. 2004;52(8):1313-1320.
19. Rockwood K, Mitnitski A. Frailty in relation to the accumulation of deficits. J Gerontol A Biol Sci Med Sci. 2007;62(7):722-727.
20. Pugh JA, Wang CP, Espinoza SE, et al. Influence of frailty‐related diagnoses, high‐risk prescribing in elderly adults, and primary care use on readmissions in fewer than 30 days for veterans aged 65 and older. J Am Geriatr Soc. 2014;62(2):291-298.
21. Scott IA, Hilmer SN, Reeve E, et al. Reducing inappropriate polypharmacy: the process of deprescribing. JAMA Intern Med. 2015;175(5):827-834.
22. Mekonnen AB, McLachlan AJ, Brien JA. Pharmacy‐led medication reconciliation programmes at hospital transitions: a systematic review and meta‐analysis. J Clin Pharm Ther. 2016;41(2):128-144.
23. Kaboli PJ, Hoth AB, McClimon BJ, Schnipper JL. Clinical pharmacists and inpatient medical care: a systematic review. Arch Int Med. 2006;166(9):955-964.
24. Gleason KM, McDaniel MR, Feinglass J, et al. Results of the Medications at Transitions and Clinical Handoffs (MATCH) study: an analysis of medication reconciliation errors and risk factors at hospital admission. J Gen Intern Med. 2010;25(5):441-447.
25. Haynes KT, Oberne A, Cawthon C, Kripalani S. Pharmacists’ recommendations to improve care transitions. Ann Pharmacother. 2012;46(9):1152-1159.
26. Khanna R, Wachsberg K, Marouni A, Feinglass J, Williams MV, Wayne DB. The association between night or weekend admission and hospitalization‐relevant patient outcomes. J Hosp Med. 2011;6(1):10-14.
PACT ICU Model: Interprofessional Case Conferences for High-Risk/High-Need Patients
Physician, nurse practitioner trainees, medical center faculty, and clinic staff develop proactive, team-based, interprofessional care plans to address unmet chronic care needs for high-risk patients.
This article is part of a series that illustrates strategies intended to redesign primary care education at the Veterans Health Administration (VHA), using interprofessional workplace learning. All have been implemented in the VA Centers of Excellence in Primary Care Education (CoEPCE). These models embody visionary transformation of clinical and educational environments that have potential for replication and dissemination throughout VA and other primary care clinical educational environments. For an introduction to the series see Klink K. Transforming primary care clinical learning environments to optimize education, outcomes, and satisfaction. Fed Pract. 2018;35(9):8-10.
Background
In 2011, 5 US Department of Veterans Affairs (VA) medical centers (VAMCs) were selected by the Office of Academic Affiliations (OAA) to establish CoEPCE. Part of the VA New Models of Care initiative, the 5 Centers of Excellence (CoE) in Boise, Idaho; Cleveland, Ohio; San Francisco, California; Seattle, Washington; and West Haven, Connecticut, are utilizing VA primary care settings to develop and test innovative approaches to prepare physician residents and students, advanced practice nurse residents and undergraduate nursing students, and other professions of health trainees (eg, pharmacy, social work, psychology, physician assistants [PAs]) for primary care practice in the 21st century.
The Boise CoE developed and implemented a practice-based learning model. Nurse practitioner (NP) students and residents, physician residents, pharmacy residents, psychology interns, and psychology postdoctoral fellows participate in a comprehensive curriculum and practice together for 1 to 3 years. The goal is to produce providers who are able to lead and practice health care in patient-centered primary care and rural care environments. All core curricula are interprofessionally coauthored and cotaught.1
Methods
In 2015, OAA evaluators reviewed background documents and conducted open-ended interviews with 10 CoE staff, participating trainees, VA faculty, VA facility leadership, and affiliate faculty. In response to questions focused on their experiences, informants described lessons learned, challenges encountered, and benefits for participants, veterans, and the VA. Using a qualitative and quantitative approach, this case study draws on those interviews, surveys of PACT ICU (patient aligned care team interprofessional care update) participants, and analysis of presented patients to examine PACT ICU outcomes.
Interprofessional Education and Care
A key CoEPCE aim is to create more clinical opportunities for CoE trainees from a variety of professions to work as a team in ways that anticipate and address the care needs of veterans. This emphasis on workplace learning is needed since most current health care professional education programs lack settings where trainees from different professions can learn and work together with their clinic partners to provide care for patients. With the emphasis on patient-centered medical homes (PCMH) and team-based care in the Affordable Care Act, there is an imperative to develop new training models that address this gap in the preparation of future health professionals. Along with this imperative, clinicians are increasingly required to optimize the health of complex patients who consequently require a multidisciplinary approach to care, particularly high-risk, high-needs patients inappropriately using services, such as frequent emergency department (ED) use.
Addressing Complex Needs
In 2010, the Boise VA Medical Center (VAMC) phased in patient aligned care teams (PACTs), the VA-mandated version of PCMH that consist of a physician or NP primary care provider (PCP), a registered nurse (RN) care manager, a licensed vocational nurse (LVN), and a medical support assistant (MSA). 
The PACT ICU also serves as a venue in which trainees and supervisors from different professions use a patient-centered framework to collaborate on these specific patient cases. The PACT ICU is easily applied to a range of health conditions, such as diabetes mellitus (DM), mental and behavioral health, lack of social support, and delivery system issues, such as ED use. The goals of PACT ICU are to improve the quality and satisfaction of patient care for high-risk patients; encourage appropriate use of health care resources by prioritizing continuity with the PACT team; and enhance interprofessional PACT team function, decreasing PCP and staff stress.
Planning and Implementation
In January 2013, Boise VAMC and the Caldwell, Idaho community-based outpatient clinic (CBOC) implemented PACT ICU. Other nonteaching clinics followed later in the year. Planning and executing PACT ICU took about 10 hours of CoE staff time and required no change in Boise VAMC policy. Program leadership approval was necessary for participation of CoE residents and postdocs. Service-line leadership support was required to protect clinic staff time (nurse care manager, social workers, chaplaincy, and ethics service). At the Caldwell CBOC, the section chief approved the program, and it took about 1 month to initiate a similar version of PACT ICU.
Curriculum
PACT ICU is a workplace clinical activity with roots in the case conference model, specifically the EFECT model (Elicit the narrative of illness, Facilitate a group meeting, Evidence-based gap analysis, Care plan, and Track changes).3 PACT ICU emphasizes a patient-centered approach to developing care plans. Staff review the 5 highest risk patients who are identified by the VA Care Assessment Need (CAN) registry. The CAN is an analytic tool that is available throughout VA and estimates patients’ risk of mortality or hospitalization in the following 90 days. Physician and NP residents choose 1 of the 5 patients to discuss in PACT ICU, while the remaining 4 serve as case-control comparisons to examine long-term patient outcomes. All trainees, faculty, and staff are provided patient data that can be discussed on a secure website.
The PACT ICU combines didactic teaching with workplace learning. For example, the patient’s medical issues may lead to a formal presentation about a topic, such as secondary stroke medication prophylaxis. The workplace learning occurs as the trainees observe and participate in the decision making toward a treatment plan. Interprofessional interactions are role-modeled by clinical faculty and staff during these discussions, and the result impact the patients care. PACT ICU embodies the core domains that shape the CoEPCE curriculum: Interprofessional collaboration (IPC), performance improvement (PI), sustained relationships (SR), and shared decision making (SDM) (Table 1). 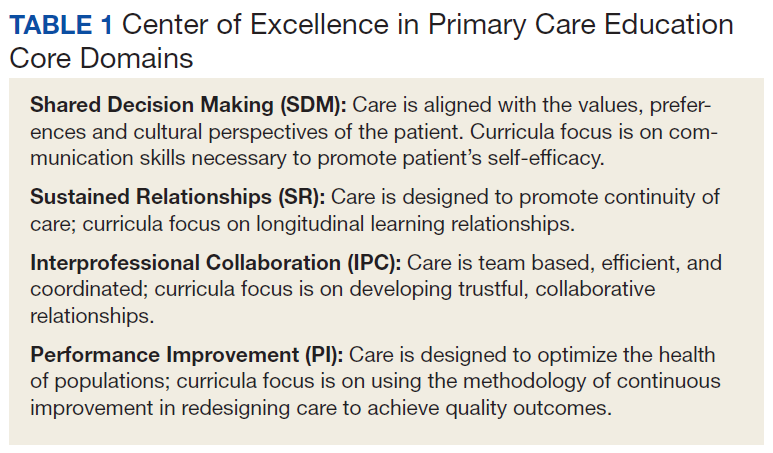
There have been some changes to the PACT ICU model over time. Initially, conferences took place on a weekly basis, to build momentum among the team and to normalize processes. After about 2 years, this decreased to every other week to reduce the time burden. Additionally, the CoE has strengthened the “tracking changes” component of the EFECT model—trainees now present a 5-minute update on the last patient they presented at the prior PACT ICU case conference. Most recently, psychology postdoctoral candidates have instituted preconference calls with patients to further improve the teams understanding of the patients’ perspective and narrative.
Related: Improving Team-Based Care Coordination Delivery and Documentation in the Health Record
Resources
The CoE faculty participate in an education program concerning facilitation of interprofessional meetings. All faculty are expected to role model collaborative behavior and mentor trainees on the cases they present.
The PACT ICU requires a room large enough to accommodate at least 12 people. One staff member is required to review patient cases prior to the case conferences (usually about 1 hour of preparation per case conference). Another staff person creates and shares a spreadsheet stored with VA-approved information security with data fields to include the site, PACT ICU date, patient identifier, the CAN score, and a checkbox for whether the patient was selected or part of a control group. Logistic support is required for reserving the room and sending information to presenters. A clinic-based RN with training in interprofessional care case management uses an online schedule to facilitate selection and review of patients. The RN care managers can use a secure management tool to track patient care and outreach.
The RN care manager also needs to be available to attend the PACT ICU case conferences. The Boise CoE built a website to share and standardize resources, such as a presenter schedule, PACT ICU worksheet, and provider questionnaire. (Contact Boise CoE staff for access.) For the initial evaluation of impact, PACT ICU utilized staff data support in the form of a data manager and biostatistician to identify, collect, and analyze data. While optional, this was helpful in refining the approach and demonstrating the impact of the project. Other resource-related requirements for exporting PACT ICU include:
- Staff members, usually RN care managers who coordinate meetings with participants and identify appropriate patients using a registry, such as CAN;
- Meeting facilitators who enforce use of the EFECT model and interprofessional participation to ensure that the interprofessional care plan is carried out by the presenting provider; and
- Interprofessional trainees and faculty who participate in PACT ICU and complete surveys after the first conference.
Monitoring and Assessment
The CoE staff have analyzed the evaluation of PACT ICU with participant self-evaluation, consultation referral patterns, and utilization data, combination of ED and episodic care visits along with hospitalizations).4 Pharmacy faculty are exploring the use polypharmacy registries, and psychology will use registries of poor psychosocial function.
Partnerships
Beyond support and engagement from VA CoEPCE and affiliate faculty, PACT ICU has greatly benefited from partnerships with VA facility department and CBOC leadership. The CoEPCE codirector and faculty are in facility committees, such as the PACT Strategic Planning Committee.
Academic affiliates are integral partners who assist with NP student and resident recruitment as well as participate in the planning and refinement of CoEPCE components. PACT ICU supports their mandate to encourage interprofessional teamwork. Faculty members from Gonzaga University (NP affiliate) were involved in the initial discussion on PACT ICU and consider it a “learning laboratory” to work through challenging problems. Gonzaga CoEPCE NP trainees are asked to talk about their PACT ICU experience—its strengths, weaknesses, and challenges—to other Gonzaga students who don’t have exposure to the team experience.
Challenges and Solutions
The demand for direct patient care puts pressure on indirect patient care approaches like PACT ICU, which is a time-intensive process with high impact on only a small number of patients. The argument for deploying strategies such as PACT ICU is that managing chronic conditions and encouraging appropriate use of services will improve outcomes for the highest risk patients and save important system resources in the long-run. However, in the short-term, a strong case must be made for the diversion of resources from usual clinic flow, particularly securing recurring blocks of provider time and clinic staff members. In addition, issues about team communication and understanding of appropriate team-based care can overflow to complex patients not presented in the PACT ICU conference.
Providing a facilitated interprofessional venue to discuss how to appropriately coordinate care improves the participation and perceived value of different team members. This approach has led to improved engagement of the team for patients discussed in the PACT ICU, as well as in general care within the participating clinic. With recent changes, the VA does see a workload benefit, and participants get encounter credit through “Non face-to-face prolonged service” codes (CPT 99358/99359), and other possibilities exist related to clinical team conference codes (CPT 99367-8) and complex chronic care management codes (CPT 99487-89). More information on documentation, scheduling and encountering/billing can be found at boisevacoe.org under Products. Other challenges include logistic challenges of finding appropriate patients and distributing sensitive patient information among the team. Additionally, PACT ICU has to wrestle with staffing shortages and episodic participation by some professions that are chronically understaffed. We have addressed many of these problems by receiving buy-in from both leadership and participants. Leadership have allowed time for participation in clinic staff schedules, and each participant has committed to recruiting a substitute in case of a schedule conflict.
Factors for Success
The commitment from the Boise VAMC facility, primary care clinic leadership and affiliated training programs to support staff and trainee participation also has been critical. Additionally, VA facility leadership commitment to ongoing improvements to PACT implementation was a key facilitating factor. Colocation of trainees and clinic staff on the academic PACT team facilitates communication between PACT ICU case conferences, while also supporting team dynamics and sustained relationships with patients. Many of these patients can and will typically seek care using the interdisciplinary trainees, and trainees were motivated to proactively coordinate warm handoffs and other models of transfer of care. PACT ICU has been successfully replicated and sustained at 4 of the 5 CoEPCE sites. The Caldwell CBOC PACT ICU has been up and running for 2 years, and 2 other nonacademic clinics have piloted PACT ICU managed care conferences thus far. Experience regarding the implementation at other academic sites has been published.5
Accomplishments and Benefits
There is evidence that PACT ICU is achieving its goals of improving trainee learning and patient outcomes. Trainees are using team skills to provide patient-centered care; trainees are strengthening their overall clinical skills by learning how to improve their responses to high-risk patients. There is also evidence of an increase in interprofessional warm handoffs within the clinic, in which “a clinician directly introduces a patient to another clinician at the time of the patient’s visit, and often a brief encounter between the patient and the health care professional occurs.”4,6
Unlike a traditional didactic with classroom case conferences on interprofessional collaboration, PACT ICU is an opportunity for health care professionals to both learn and work together providing care in a clinic. Moreover, colocation of diverse trainee and faculty professions during the case conferences better prepares trainees to work with other professions and supports all participants to work and communicate as a team.
CoE staff have assessed educational outcomes before and after attendance in PACT ICU. On average, trainees (n = 30) said they found the PACT ICU case conferences to be “very helpful” in developing treatment plans. 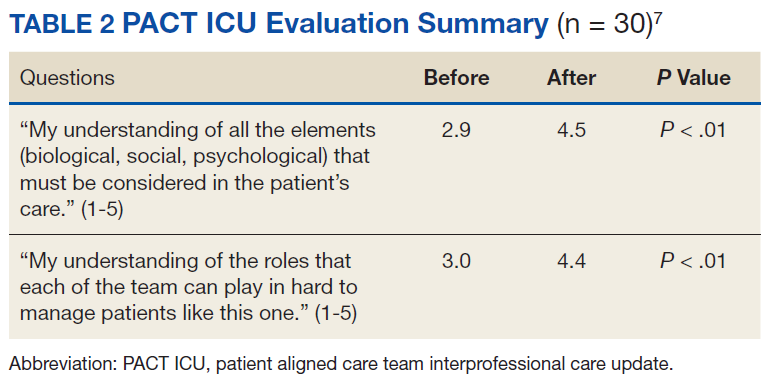
Interprofessional Collaboration
Team building and colocating trainees, faculty, and clinic staff from different professions are a primary focus of PACT ICU. The case conferences are designed to break down silos and foster a team approach to care. Trainees learn how the team works and the ways other professionals can help them take care of the patient. For example, trainees learn early about the contributions and expertise that the pharmacist and psychologist offer in terms of their scope of practice and referral opportunities. Additionally, the RN care manager increases the integration with the PACT clinical team by sharing pertinent information on individual patients. Based on recent trainee survey findings, the CoE has observed a positive change in the team dynamic and trainee ability to interface between professions. PACT ICU participants were more likely to make referrals to other members within the PACT team, such as a warm handoff during a clinic appointment, while they were less likely to seek a consult outside the team.7
Clinical Performance
The PACT ICU is an opportunity for a trainee to increase clinical expertise. It provides exposure to a variety of patientsand their care needs and serves as an opportunity to present a high-risk, challenging patient to colleagues of various professions. As of June 2018, 96 physician resident and NP residents have presented complex patient cases.
In addition, a structured forum for discussing patients and their care options strengthens team clinical performance, which supports people to work to the full scope of their practice. Trainees learn and apply team skills, such as communication and the warm handoff.
An interprofessional care plan that is delineated during the meeting supports the trainee and is carried out with help from consultants as needed. These consultants often facilitate plans for a covisit or warm handoff at the next clinic visit, a call from the RN care manager, a virtual clinic appointment, or other nontraditional visits. The clinic staff can get information from PCPs about patient’s plan of care, and PCPs get a more complete picture of a patient’s situation (eg, history, communications, and life-style factors). In addition, surveys of PACT ICU participants suggest the curriculum’s effectiveness at encouraging use of PACT principles within the clinic team and improving appropriate referrals to other members of the PACT team, such as pharmacy and behavioral health.
Patients presented at PACT ICU can be particularly challenging, so there may be a psychological benefit to working with a team to develop a new care plan. The PCPs who feel they are overwhelmed and have exhausted every option step back, get input, and look at the patient in a new light.
Related: Interprofessional Education in Patient Aligned Care Team Primary Care-Mental Health Integration
CoEPCE Function
The PACT ICU is flexible and has been adapted to different ambulatory care settings. Currently, PACT ICU case conferences take place at Boise VAMC, the Caldwell CBOCs, and more recently at a smaller CBOC in Burns, Oregon. The PACT ICU structure is slightly different in the clinic settings since the VA primary care clinic has different resources to draw upon, such as hospital and specialty services. The Caldwell CBOC was unable to protect time for PCPs, so it holds a monthly PACT ICU case conference. In addition to continuing expansion in other nonacademic PACT clinics and collaboration with other CoEPCE sites, work is underway to disseminate generalizable principles for interprofessional education, as well as exporting the model for implementation in non-VA settings.
Primary Care Services
The PACT ICU has the potential to create efficiencies in busy clinic settings. It strengthens communication between PCPs and is an opportunity to touch base on the patient, delegate care, and keep track of high-risk patients who might otherwise receive attention only when having an acute problem. Nurses gain a deeper understanding of the patients presented at PACT ICU.
PACT ICU leverages and builds on existing PACT resources in an achievable and sustainable manner benefiting primary care. CoE trainees, who are part of the Silver Team, tap in to the information that team nurses gain from checking in with these high-risk patients biweekly. Moreover, the integration with the Silver Team improves continuity, which helps enhance a patient’s level of trust. The relationship strengthened between primary care and behavioral health at the Caldwell CBOC, providing improved patient access and increased professional sharing.
Patient Outcomes
The PACT ICU provides a forum for input beyond that of the PCP. This feature results in a more robust treatment plan than might be developed by individual PCPs who might not have time to consider options that are outside their scope of practice. Formulating an enriched care plan, informed by multiple professions, has the potential to improve utilization and provide better care.
The Boise VAMC PACT ICU has presented 219 patients as of June 2018. While clinical outcomes data are difficult to collect, the CoE has data on utilization differences on all patients presented at the PACT ICU case conferences. This includes 4 control patients from the same PCP, with similarly high risk based on CAN scores at the time of selection. A single control patient is selected based on gender, closest age, and CAN score; this serves as a comparator for subsequent utilization analysis.
Data from the first 2 years of this study demonstrate that compared with the high-risk control group, there was an increase in contacts with PACT team members, including behavioral health, clinical pharmacists, and nurse care management, persisting up to 6 months following the PACT ICU presentation.4 However, PACT ICU participation did not increase the number of visits with the PCP, indicating better engagement with the entire team. Participation was associated with significantly decreased hospitalizations and a trend toward decreased ED visits. These findings persisted when compared with controls in the PCP’s panel with similar CAN scores, making “regression to the mean” often seen in these studies much less likely.
Analysis of patients early in the project suggests the possibility of improved glycemic control in patients with DM and improved blood pressure control in hypertensive patients presented at the PACT ICU compared with that of non-PACT ICU patients.8 Another potential benefit includes better team-based coordination. Because the patient now has a team focusing on care, this new dynamic results in improving outreach, identifying patients who could receive care by a telephone, and better preparing team members to establish rapport when the patient calls or comes in for a visit.
The Future
In stage 2 of the CoEPCE program, a multi-site trial of PACT ICU was completed to better understand which elements are critical to success, with the goal of facilitating broader exportability.5 The trial focused on 3 intertwined elements: structure, delivery, and evaluation. Using local implementation and the multisite trial, the most effective practices have been documented as part of an implementation kit, available at boisevacoe.org. The goal of the implementation kit is to facilitate step-by-step implementation of PACT ICU to other settings beyond the multisite study. Since the open-ended structure of PACT ICU enables accommodating different professions and specialties beyond the model’s Boise VAMC participants, it could be easily adapted to potentially support a variety of implementations elsewhere (Appendix).
Another opportunity for expansion is increased patient involvement. Currently, PACT ICU patients have the opportunity to review and ask questions about their multidisciplinary care plans before starting. 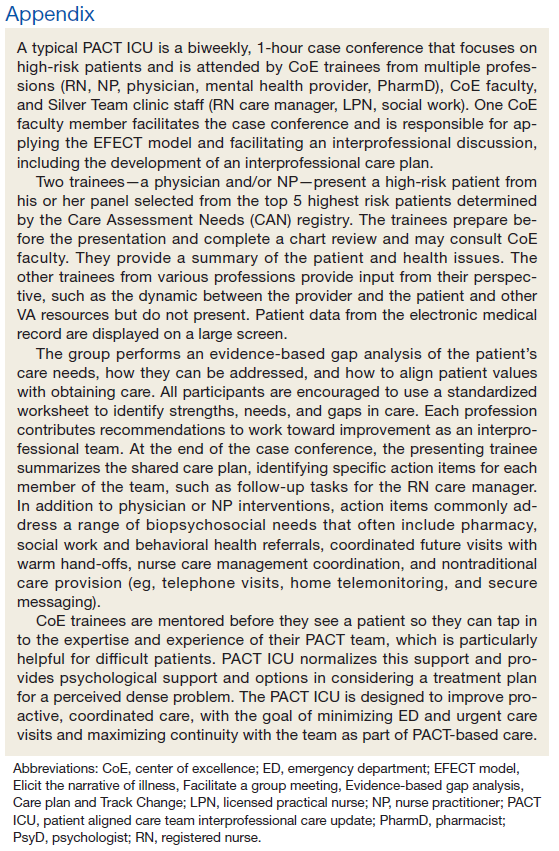
1. Rugen KW, Watts S, Janson S, et al. Veteran Affairs centers of excellence in primary care education: transforming nurse practitioner education. Nurs Outlook. 2014;62(2):78-88.
2. Billett S. Learning through practice: beyond informal and towards a framework for learning through practice. UNESCO-UNEVOC. https://unevoc.unesco.org/fileadmin/up/2013_epub_revisiting_global_trends_in_tvet_chapter4.pdf. Published 2013. Accessed August 30, 2018.
3. Bitton A, Pereira AG, Smith CS, Babbott SF, Bowen JL. The EFECT framework for interprofessional education in the patient centered medical home. Healthc (Amst). 2013;1(3-4):63-68.
4. Weppner WG, Davis K, Tivis R, et al. Impact of a complex chronic care patient case conference on quality and utilization. Transl Behav Med. 2018;8(3):366-374.
5. King IC, Strewler A, Wipf JE. Translating innovation: exploring dissemination of a unique case conference. J Interprof Educ Pract. 2017;6(1):55-60.
6. Cohen DJ, Balasubramanian BA, Davis M, et al. Understanding care integration from the ground up: five organizing constructs that shape integrated practices. J Am Board Fam Med. 2015;28(suppl 1):S7-S20.
7. Weppner WG, Davis K, Sordahl J, et al. Interprofessional care conferences for high risk primary care patients. Acad Med. 2016;91(6):798-802.
8. Buu J, Fisher A, Weppner W, Mason B. Impact of patient aligned care team interprofessional care updates (ICU) on metabolic parameters. Fed Pract. 2016;33(2):44-48.
Physician, nurse practitioner trainees, medical center faculty, and clinic staff develop proactive, team-based, interprofessional care plans to address unmet chronic care needs for high-risk patients.
Physician, nurse practitioner trainees, medical center faculty, and clinic staff develop proactive, team-based, interprofessional care plans to address unmet chronic care needs for high-risk patients.
This article is part of a series that illustrates strategies intended to redesign primary care education at the Veterans Health Administration (VHA), using interprofessional workplace learning. All have been implemented in the VA Centers of Excellence in Primary Care Education (CoEPCE). These models embody visionary transformation of clinical and educational environments that have potential for replication and dissemination throughout VA and other primary care clinical educational environments. For an introduction to the series see Klink K. Transforming primary care clinical learning environments to optimize education, outcomes, and satisfaction. Fed Pract. 2018;35(9):8-10.
Background
In 2011, 5 US Department of Veterans Affairs (VA) medical centers (VAMCs) were selected by the Office of Academic Affiliations (OAA) to establish CoEPCE. Part of the VA New Models of Care initiative, the 5 Centers of Excellence (CoE) in Boise, Idaho; Cleveland, Ohio; San Francisco, California; Seattle, Washington; and West Haven, Connecticut, are utilizing VA primary care settings to develop and test innovative approaches to prepare physician residents and students, advanced practice nurse residents and undergraduate nursing students, and other professions of health trainees (eg, pharmacy, social work, psychology, physician assistants [PAs]) for primary care practice in the 21st century.
The Boise CoE developed and implemented a practice-based learning model. Nurse practitioner (NP) students and residents, physician residents, pharmacy residents, psychology interns, and psychology postdoctoral fellows participate in a comprehensive curriculum and practice together for 1 to 3 years. The goal is to produce providers who are able to lead and practice health care in patient-centered primary care and rural care environments. All core curricula are interprofessionally coauthored and cotaught.1
Methods
In 2015, OAA evaluators reviewed background documents and conducted open-ended interviews with 10 CoE staff, participating trainees, VA faculty, VA facility leadership, and affiliate faculty. In response to questions focused on their experiences, informants described lessons learned, challenges encountered, and benefits for participants, veterans, and the VA. Using a qualitative and quantitative approach, this case study draws on those interviews, surveys of PACT ICU (patient aligned care team interprofessional care update) participants, and analysis of presented patients to examine PACT ICU outcomes.
Interprofessional Education and Care
A key CoEPCE aim is to create more clinical opportunities for CoE trainees from a variety of professions to work as a team in ways that anticipate and address the care needs of veterans. This emphasis on workplace learning is needed since most current health care professional education programs lack settings where trainees from different professions can learn and work together with their clinic partners to provide care for patients. With the emphasis on patient-centered medical homes (PCMH) and team-based care in the Affordable Care Act, there is an imperative to develop new training models that address this gap in the preparation of future health professionals. Along with this imperative, clinicians are increasingly required to optimize the health of complex patients who consequently require a multidisciplinary approach to care, particularly high-risk, high-needs patients inappropriately using services, such as frequent emergency department (ED) use.
Addressing Complex Needs
In 2010, the Boise VA Medical Center (VAMC) phased in patient aligned care teams (PACTs), the VA-mandated version of PCMH that consist of a physician or NP primary care provider (PCP), a registered nurse (RN) care manager, a licensed vocational nurse (LVN), and a medical support assistant (MSA).
The PACT ICU also serves as a venue in which trainees and supervisors from different professions use a patient-centered framework to collaborate on these specific patient cases. The PACT ICU is easily applied to a range of health conditions, such as diabetes mellitus (DM), mental and behavioral health, lack of social support, and delivery system issues, such as ED use. The goals of PACT ICU are to improve the quality and satisfaction of patient care for high-risk patients; encourage appropriate use of health care resources by prioritizing continuity with the PACT team; and enhance interprofessional PACT team function, decreasing PCP and staff stress.
Planning and Implementation
In January 2013, Boise VAMC and the Caldwell, Idaho community-based outpatient clinic (CBOC) implemented PACT ICU. Other nonteaching clinics followed later in the year. Planning and executing PACT ICU took about 10 hours of CoE staff time and required no change in Boise VAMC policy. Program leadership approval was necessary for participation of CoE residents and postdocs. Service-line leadership support was required to protect clinic staff time (nurse care manager, social workers, chaplaincy, and ethics service). At the Caldwell CBOC, the section chief approved the program, and it took about 1 month to initiate a similar version of PACT ICU.
Curriculum
PACT ICU is a workplace clinical activity with roots in the case conference model, specifically the EFECT model (Elicit the narrative of illness, Facilitate a group meeting, Evidence-based gap analysis, Care plan, and Track changes).3 PACT ICU emphasizes a patient-centered approach to developing care plans. Staff review the 5 highest risk patients who are identified by the VA Care Assessment Need (CAN) registry. The CAN is an analytic tool that is available throughout VA and estimates patients’ risk of mortality or hospitalization in the following 90 days. Physician and NP residents choose 1 of the 5 patients to discuss in PACT ICU, while the remaining 4 serve as case-control comparisons to examine long-term patient outcomes. All trainees, faculty, and staff are provided patient data that can be discussed on a secure website.
The PACT ICU combines didactic teaching with workplace learning. For example, the patient’s medical issues may lead to a formal presentation about a topic, such as secondary stroke medication prophylaxis. The workplace learning occurs as the trainees observe and participate in the decision making toward a treatment plan. Interprofessional interactions are role-modeled by clinical faculty and staff during these discussions, and the result impact the patients care. PACT ICU embodies the core domains that shape the CoEPCE curriculum: Interprofessional collaboration (IPC), performance improvement (PI), sustained relationships (SR), and shared decision making (SDM) (Table 1).
There have been some changes to the PACT ICU model over time. Initially, conferences took place on a weekly basis, to build momentum among the team and to normalize processes. After about 2 years, this decreased to every other week to reduce the time burden. Additionally, the CoE has strengthened the “tracking changes” component of the EFECT model—trainees now present a 5-minute update on the last patient they presented at the prior PACT ICU case conference. Most recently, psychology postdoctoral candidates have instituted preconference calls with patients to further improve the teams understanding of the patients’ perspective and narrative.
Related: Improving Team-Based Care Coordination Delivery and Documentation in the Health Record
Resources
The CoE faculty participate in an education program concerning facilitation of interprofessional meetings. All faculty are expected to role model collaborative behavior and mentor trainees on the cases they present.
The PACT ICU requires a room large enough to accommodate at least 12 people. One staff member is required to review patient cases prior to the case conferences (usually about 1 hour of preparation per case conference). Another staff person creates and shares a spreadsheet stored with VA-approved information security with data fields to include the site, PACT ICU date, patient identifier, the CAN score, and a checkbox for whether the patient was selected or part of a control group. Logistic support is required for reserving the room and sending information to presenters. A clinic-based RN with training in interprofessional care case management uses an online schedule to facilitate selection and review of patients. The RN care managers can use a secure management tool to track patient care and outreach.
The RN care manager also needs to be available to attend the PACT ICU case conferences. The Boise CoE built a website to share and standardize resources, such as a presenter schedule, PACT ICU worksheet, and provider questionnaire. (Contact Boise CoE staff for access.) For the initial evaluation of impact, PACT ICU utilized staff data support in the form of a data manager and biostatistician to identify, collect, and analyze data. While optional, this was helpful in refining the approach and demonstrating the impact of the project. Other resource-related requirements for exporting PACT ICU include:
- Staff members, usually RN care managers who coordinate meetings with participants and identify appropriate patients using a registry, such as CAN;
- Meeting facilitators who enforce use of the EFECT model and interprofessional participation to ensure that the interprofessional care plan is carried out by the presenting provider; and
- Interprofessional trainees and faculty who participate in PACT ICU and complete surveys after the first conference.
Monitoring and Assessment
The CoE staff have analyzed the evaluation of PACT ICU with participant self-evaluation, consultation referral patterns, and utilization data, combination of ED and episodic care visits along with hospitalizations).4 Pharmacy faculty are exploring the use polypharmacy registries, and psychology will use registries of poor psychosocial function.
Partnerships
Beyond support and engagement from VA CoEPCE and affiliate faculty, PACT ICU has greatly benefited from partnerships with VA facility department and CBOC leadership. The CoEPCE codirector and faculty are in facility committees, such as the PACT Strategic Planning Committee.
Academic affiliates are integral partners who assist with NP student and resident recruitment as well as participate in the planning and refinement of CoEPCE components. PACT ICU supports their mandate to encourage interprofessional teamwork. Faculty members from Gonzaga University (NP affiliate) were involved in the initial discussion on PACT ICU and consider it a “learning laboratory” to work through challenging problems. Gonzaga CoEPCE NP trainees are asked to talk about their PACT ICU experience—its strengths, weaknesses, and challenges—to other Gonzaga students who don’t have exposure to the team experience.
Challenges and Solutions
The demand for direct patient care puts pressure on indirect patient care approaches like PACT ICU, which is a time-intensive process with high impact on only a small number of patients. The argument for deploying strategies such as PACT ICU is that managing chronic conditions and encouraging appropriate use of services will improve outcomes for the highest risk patients and save important system resources in the long-run. However, in the short-term, a strong case must be made for the diversion of resources from usual clinic flow, particularly securing recurring blocks of provider time and clinic staff members. In addition, issues about team communication and understanding of appropriate team-based care can overflow to complex patients not presented in the PACT ICU conference.
Providing a facilitated interprofessional venue to discuss how to appropriately coordinate care improves the participation and perceived value of different team members. This approach has led to improved engagement of the team for patients discussed in the PACT ICU, as well as in general care within the participating clinic. With recent changes, the VA does see a workload benefit, and participants get encounter credit through “Non face-to-face prolonged service” codes (CPT 99358/99359), and other possibilities exist related to clinical team conference codes (CPT 99367-8) and complex chronic care management codes (CPT 99487-89). More information on documentation, scheduling and encountering/billing can be found at boisevacoe.org under Products. Other challenges include logistic challenges of finding appropriate patients and distributing sensitive patient information among the team. Additionally, PACT ICU has to wrestle with staffing shortages and episodic participation by some professions that are chronically understaffed. We have addressed many of these problems by receiving buy-in from both leadership and participants. Leadership have allowed time for participation in clinic staff schedules, and each participant has committed to recruiting a substitute in case of a schedule conflict.
Factors for Success
The commitment from the Boise VAMC facility, primary care clinic leadership and affiliated training programs to support staff and trainee participation also has been critical. Additionally, VA facility leadership commitment to ongoing improvements to PACT implementation was a key facilitating factor. Colocation of trainees and clinic staff on the academic PACT team facilitates communication between PACT ICU case conferences, while also supporting team dynamics and sustained relationships with patients. Many of these patients can and will typically seek care using the interdisciplinary trainees, and trainees were motivated to proactively coordinate warm handoffs and other models of transfer of care. PACT ICU has been successfully replicated and sustained at 4 of the 5 CoEPCE sites. The Caldwell CBOC PACT ICU has been up and running for 2 years, and 2 other nonacademic clinics have piloted PACT ICU managed care conferences thus far. Experience regarding the implementation at other academic sites has been published.5
Accomplishments and Benefits
There is evidence that PACT ICU is achieving its goals of improving trainee learning and patient outcomes. Trainees are using team skills to provide patient-centered care; trainees are strengthening their overall clinical skills by learning how to improve their responses to high-risk patients. There is also evidence of an increase in interprofessional warm handoffs within the clinic, in which “a clinician directly introduces a patient to another clinician at the time of the patient’s visit, and often a brief encounter between the patient and the health care professional occurs.”4,6
Unlike a traditional didactic with classroom case conferences on interprofessional collaboration, PACT ICU is an opportunity for health care professionals to both learn and work together providing care in a clinic. Moreover, colocation of diverse trainee and faculty professions during the case conferences better prepares trainees to work with other professions and supports all participants to work and communicate as a team.
CoE staff have assessed educational outcomes before and after attendance in PACT ICU. On average, trainees (n = 30) said they found the PACT ICU case conferences to be “very helpful” in developing treatment plans.
Interprofessional Collaboration
Team building and colocating trainees, faculty, and clinic staff from different professions are a primary focus of PACT ICU. The case conferences are designed to break down silos and foster a team approach to care. Trainees learn how the team works and the ways other professionals can help them take care of the patient. For example, trainees learn early about the contributions and expertise that the pharmacist and psychologist offer in terms of their scope of practice and referral opportunities. Additionally, the RN care manager increases the integration with the PACT clinical team by sharing pertinent information on individual patients. Based on recent trainee survey findings, the CoE has observed a positive change in the team dynamic and trainee ability to interface between professions. PACT ICU participants were more likely to make referrals to other members within the PACT team, such as a warm handoff during a clinic appointment, while they were less likely to seek a consult outside the team.7
Clinical Performance
The PACT ICU is an opportunity for a trainee to increase clinical expertise. It provides exposure to a variety of patientsand their care needs and serves as an opportunity to present a high-risk, challenging patient to colleagues of various professions. As of June 2018, 96 physician resident and NP residents have presented complex patient cases.
In addition, a structured forum for discussing patients and their care options strengthens team clinical performance, which supports people to work to the full scope of their practice. Trainees learn and apply team skills, such as communication and the warm handoff.
An interprofessional care plan that is delineated during the meeting supports the trainee and is carried out with help from consultants as needed. These consultants often facilitate plans for a covisit or warm handoff at the next clinic visit, a call from the RN care manager, a virtual clinic appointment, or other nontraditional visits. The clinic staff can get information from PCPs about patient’s plan of care, and PCPs get a more complete picture of a patient’s situation (eg, history, communications, and life-style factors). In addition, surveys of PACT ICU participants suggest the curriculum’s effectiveness at encouraging use of PACT principles within the clinic team and improving appropriate referrals to other members of the PACT team, such as pharmacy and behavioral health.
Patients presented at PACT ICU can be particularly challenging, so there may be a psychological benefit to working with a team to develop a new care plan. The PCPs who feel they are overwhelmed and have exhausted every option step back, get input, and look at the patient in a new light.
Related: Interprofessional Education in Patient Aligned Care Team Primary Care-Mental Health Integration
CoEPCE Function
The PACT ICU is flexible and has been adapted to different ambulatory care settings. Currently, PACT ICU case conferences take place at Boise VAMC, the Caldwell CBOCs, and more recently at a smaller CBOC in Burns, Oregon. The PACT ICU structure is slightly different in the clinic settings since the VA primary care clinic has different resources to draw upon, such as hospital and specialty services. The Caldwell CBOC was unable to protect time for PCPs, so it holds a monthly PACT ICU case conference. In addition to continuing expansion in other nonacademic PACT clinics and collaboration with other CoEPCE sites, work is underway to disseminate generalizable principles for interprofessional education, as well as exporting the model for implementation in non-VA settings.
Primary Care Services
The PACT ICU has the potential to create efficiencies in busy clinic settings. It strengthens communication between PCPs and is an opportunity to touch base on the patient, delegate care, and keep track of high-risk patients who might otherwise receive attention only when having an acute problem. Nurses gain a deeper understanding of the patients presented at PACT ICU.
PACT ICU leverages and builds on existing PACT resources in an achievable and sustainable manner benefiting primary care. CoE trainees, who are part of the Silver Team, tap in to the information that team nurses gain from checking in with these high-risk patients biweekly. Moreover, the integration with the Silver Team improves continuity, which helps enhance a patient’s level of trust. The relationship strengthened between primary care and behavioral health at the Caldwell CBOC, providing improved patient access and increased professional sharing.
Patient Outcomes
The PACT ICU provides a forum for input beyond that of the PCP. This feature results in a more robust treatment plan than might be developed by individual PCPs who might not have time to consider options that are outside their scope of practice. Formulating an enriched care plan, informed by multiple professions, has the potential to improve utilization and provide better care.
The Boise VAMC PACT ICU has presented 219 patients as of June 2018. While clinical outcomes data are difficult to collect, the CoE has data on utilization differences on all patients presented at the PACT ICU case conferences. This includes 4 control patients from the same PCP, with similarly high risk based on CAN scores at the time of selection. A single control patient is selected based on gender, closest age, and CAN score; this serves as a comparator for subsequent utilization analysis.
Data from the first 2 years of this study demonstrate that compared with the high-risk control group, there was an increase in contacts with PACT team members, including behavioral health, clinical pharmacists, and nurse care management, persisting up to 6 months following the PACT ICU presentation.4 However, PACT ICU participation did not increase the number of visits with the PCP, indicating better engagement with the entire team. Participation was associated with significantly decreased hospitalizations and a trend toward decreased ED visits. These findings persisted when compared with controls in the PCP’s panel with similar CAN scores, making “regression to the mean” often seen in these studies much less likely.
Analysis of patients early in the project suggests the possibility of improved glycemic control in patients with DM and improved blood pressure control in hypertensive patients presented at the PACT ICU compared with that of non-PACT ICU patients.8 Another potential benefit includes better team-based coordination. Because the patient now has a team focusing on care, this new dynamic results in improving outreach, identifying patients who could receive care by a telephone, and better preparing team members to establish rapport when the patient calls or comes in for a visit.
The Future
In stage 2 of the CoEPCE program, a multi-site trial of PACT ICU was completed to better understand which elements are critical to success, with the goal of facilitating broader exportability.5 The trial focused on 3 intertwined elements: structure, delivery, and evaluation. Using local implementation and the multisite trial, the most effective practices have been documented as part of an implementation kit, available at boisevacoe.org. The goal of the implementation kit is to facilitate step-by-step implementation of PACT ICU to other settings beyond the multisite study. Since the open-ended structure of PACT ICU enables accommodating different professions and specialties beyond the model’s Boise VAMC participants, it could be easily adapted to potentially support a variety of implementations elsewhere (Appendix).
Another opportunity for expansion is increased patient involvement. Currently, PACT ICU patients have the opportunity to review and ask questions about their multidisciplinary care plans before starting.
This article is part of a series that illustrates strategies intended to redesign primary care education at the Veterans Health Administration (VHA), using interprofessional workplace learning. All have been implemented in the VA Centers of Excellence in Primary Care Education (CoEPCE). These models embody visionary transformation of clinical and educational environments that have potential for replication and dissemination throughout VA and other primary care clinical educational environments. For an introduction to the series see Klink K. Transforming primary care clinical learning environments to optimize education, outcomes, and satisfaction. Fed Pract. 2018;35(9):8-10.
Background
In 2011, 5 US Department of Veterans Affairs (VA) medical centers (VAMCs) were selected by the Office of Academic Affiliations (OAA) to establish CoEPCE. Part of the VA New Models of Care initiative, the 5 Centers of Excellence (CoE) in Boise, Idaho; Cleveland, Ohio; San Francisco, California; Seattle, Washington; and West Haven, Connecticut, are utilizing VA primary care settings to develop and test innovative approaches to prepare physician residents and students, advanced practice nurse residents and undergraduate nursing students, and other professions of health trainees (eg, pharmacy, social work, psychology, physician assistants [PAs]) for primary care practice in the 21st century.
The Boise CoE developed and implemented a practice-based learning model. Nurse practitioner (NP) students and residents, physician residents, pharmacy residents, psychology interns, and psychology postdoctoral fellows participate in a comprehensive curriculum and practice together for 1 to 3 years. The goal is to produce providers who are able to lead and practice health care in patient-centered primary care and rural care environments. All core curricula are interprofessionally coauthored and cotaught.1
Methods
In 2015, OAA evaluators reviewed background documents and conducted open-ended interviews with 10 CoE staff, participating trainees, VA faculty, VA facility leadership, and affiliate faculty. In response to questions focused on their experiences, informants described lessons learned, challenges encountered, and benefits for participants, veterans, and the VA. Using a qualitative and quantitative approach, this case study draws on those interviews, surveys of PACT ICU (patient aligned care team interprofessional care update) participants, and analysis of presented patients to examine PACT ICU outcomes.
Interprofessional Education and Care
A key CoEPCE aim is to create more clinical opportunities for CoE trainees from a variety of professions to work as a team in ways that anticipate and address the care needs of veterans. This emphasis on workplace learning is needed since most current health care professional education programs lack settings where trainees from different professions can learn and work together with their clinic partners to provide care for patients. With the emphasis on patient-centered medical homes (PCMH) and team-based care in the Affordable Care Act, there is an imperative to develop new training models that address this gap in the preparation of future health professionals. Along with this imperative, clinicians are increasingly required to optimize the health of complex patients who consequently require a multidisciplinary approach to care, particularly high-risk, high-needs patients inappropriately using services, such as frequent emergency department (ED) use.
Addressing Complex Needs
In 2010, the Boise VA Medical Center (VAMC) phased in patient aligned care teams (PACTs), the VA-mandated version of PCMH that consist of a physician or NP primary care provider (PCP), a registered nurse (RN) care manager, a licensed vocational nurse (LVN), and a medical support assistant (MSA).
The PACT ICU also serves as a venue in which trainees and supervisors from different professions use a patient-centered framework to collaborate on these specific patient cases. The PACT ICU is easily applied to a range of health conditions, such as diabetes mellitus (DM), mental and behavioral health, lack of social support, and delivery system issues, such as ED use. The goals of PACT ICU are to improve the quality and satisfaction of patient care for high-risk patients; encourage appropriate use of health care resources by prioritizing continuity with the PACT team; and enhance interprofessional PACT team function, decreasing PCP and staff stress.
Planning and Implementation
In January 2013, Boise VAMC and the Caldwell, Idaho community-based outpatient clinic (CBOC) implemented PACT ICU. Other nonteaching clinics followed later in the year. Planning and executing PACT ICU took about 10 hours of CoE staff time and required no change in Boise VAMC policy. Program leadership approval was necessary for participation of CoE residents and postdocs. Service-line leadership support was required to protect clinic staff time (nurse care manager, social workers, chaplaincy, and ethics service). At the Caldwell CBOC, the section chief approved the program, and it took about 1 month to initiate a similar version of PACT ICU.
Curriculum
PACT ICU is a workplace clinical activity with roots in the case conference model, specifically the EFECT model (Elicit the narrative of illness, Facilitate a group meeting, Evidence-based gap analysis, Care plan, and Track changes).3 PACT ICU emphasizes a patient-centered approach to developing care plans. Staff review the 5 highest risk patients who are identified by the VA Care Assessment Need (CAN) registry. The CAN is an analytic tool that is available throughout VA and estimates patients’ risk of mortality or hospitalization in the following 90 days. Physician and NP residents choose 1 of the 5 patients to discuss in PACT ICU, while the remaining 4 serve as case-control comparisons to examine long-term patient outcomes. All trainees, faculty, and staff are provided patient data that can be discussed on a secure website.
The PACT ICU combines didactic teaching with workplace learning. For example, the patient’s medical issues may lead to a formal presentation about a topic, such as secondary stroke medication prophylaxis. The workplace learning occurs as the trainees observe and participate in the decision making toward a treatment plan. Interprofessional interactions are role-modeled by clinical faculty and staff during these discussions, and the result impact the patients care. PACT ICU embodies the core domains that shape the CoEPCE curriculum: Interprofessional collaboration (IPC), performance improvement (PI), sustained relationships (SR), and shared decision making (SDM) (Table 1).
There have been some changes to the PACT ICU model over time. Initially, conferences took place on a weekly basis, to build momentum among the team and to normalize processes. After about 2 years, this decreased to every other week to reduce the time burden. Additionally, the CoE has strengthened the “tracking changes” component of the EFECT model—trainees now present a 5-minute update on the last patient they presented at the prior PACT ICU case conference. Most recently, psychology postdoctoral candidates have instituted preconference calls with patients to further improve the teams understanding of the patients’ perspective and narrative.
Related: Improving Team-Based Care Coordination Delivery and Documentation in the Health Record
Resources
The CoE faculty participate in an education program concerning facilitation of interprofessional meetings. All faculty are expected to role model collaborative behavior and mentor trainees on the cases they present.
The PACT ICU requires a room large enough to accommodate at least 12 people. One staff member is required to review patient cases prior to the case conferences (usually about 1 hour of preparation per case conference). Another staff person creates and shares a spreadsheet stored with VA-approved information security with data fields to include the site, PACT ICU date, patient identifier, the CAN score, and a checkbox for whether the patient was selected or part of a control group. Logistic support is required for reserving the room and sending information to presenters. A clinic-based RN with training in interprofessional care case management uses an online schedule to facilitate selection and review of patients. The RN care managers can use a secure management tool to track patient care and outreach.
The RN care manager also needs to be available to attend the PACT ICU case conferences. The Boise CoE built a website to share and standardize resources, such as a presenter schedule, PACT ICU worksheet, and provider questionnaire. (Contact Boise CoE staff for access.) For the initial evaluation of impact, PACT ICU utilized staff data support in the form of a data manager and biostatistician to identify, collect, and analyze data. While optional, this was helpful in refining the approach and demonstrating the impact of the project. Other resource-related requirements for exporting PACT ICU include:
- Staff members, usually RN care managers who coordinate meetings with participants and identify appropriate patients using a registry, such as CAN;
- Meeting facilitators who enforce use of the EFECT model and interprofessional participation to ensure that the interprofessional care plan is carried out by the presenting provider; and
- Interprofessional trainees and faculty who participate in PACT ICU and complete surveys after the first conference.
Monitoring and Assessment
The CoE staff have analyzed the evaluation of PACT ICU with participant self-evaluation, consultation referral patterns, and utilization data, combination of ED and episodic care visits along with hospitalizations).4 Pharmacy faculty are exploring the use polypharmacy registries, and psychology will use registries of poor psychosocial function.
Partnerships
Beyond support and engagement from VA CoEPCE and affiliate faculty, PACT ICU has greatly benefited from partnerships with VA facility department and CBOC leadership. The CoEPCE codirector and faculty are in facility committees, such as the PACT Strategic Planning Committee.
Academic affiliates are integral partners who assist with NP student and resident recruitment as well as participate in the planning and refinement of CoEPCE components. PACT ICU supports their mandate to encourage interprofessional teamwork. Faculty members from Gonzaga University (NP affiliate) were involved in the initial discussion on PACT ICU and consider it a “learning laboratory” to work through challenging problems. Gonzaga CoEPCE NP trainees are asked to talk about their PACT ICU experience—its strengths, weaknesses, and challenges—to other Gonzaga students who don’t have exposure to the team experience.
Challenges and Solutions
The demand for direct patient care puts pressure on indirect patient care approaches like PACT ICU, which is a time-intensive process with high impact on only a small number of patients. The argument for deploying strategies such as PACT ICU is that managing chronic conditions and encouraging appropriate use of services will improve outcomes for the highest risk patients and save important system resources in the long-run. However, in the short-term, a strong case must be made for the diversion of resources from usual clinic flow, particularly securing recurring blocks of provider time and clinic staff members. In addition, issues about team communication and understanding of appropriate team-based care can overflow to complex patients not presented in the PACT ICU conference.
Providing a facilitated interprofessional venue to discuss how to appropriately coordinate care improves the participation and perceived value of different team members. This approach has led to improved engagement of the team for patients discussed in the PACT ICU, as well as in general care within the participating clinic. With recent changes, the VA does see a workload benefit, and participants get encounter credit through “Non face-to-face prolonged service” codes (CPT 99358/99359), and other possibilities exist related to clinical team conference codes (CPT 99367-8) and complex chronic care management codes (CPT 99487-89). More information on documentation, scheduling and encountering/billing can be found at boisevacoe.org under Products. Other challenges include logistic challenges of finding appropriate patients and distributing sensitive patient information among the team. Additionally, PACT ICU has to wrestle with staffing shortages and episodic participation by some professions that are chronically understaffed. We have addressed many of these problems by receiving buy-in from both leadership and participants. Leadership have allowed time for participation in clinic staff schedules, and each participant has committed to recruiting a substitute in case of a schedule conflict.
Factors for Success
The commitment from the Boise VAMC facility, primary care clinic leadership and affiliated training programs to support staff and trainee participation also has been critical. Additionally, VA facility leadership commitment to ongoing improvements to PACT implementation was a key facilitating factor. Colocation of trainees and clinic staff on the academic PACT team facilitates communication between PACT ICU case conferences, while also supporting team dynamics and sustained relationships with patients. Many of these patients can and will typically seek care using the interdisciplinary trainees, and trainees were motivated to proactively coordinate warm handoffs and other models of transfer of care. PACT ICU has been successfully replicated and sustained at 4 of the 5 CoEPCE sites. The Caldwell CBOC PACT ICU has been up and running for 2 years, and 2 other nonacademic clinics have piloted PACT ICU managed care conferences thus far. Experience regarding the implementation at other academic sites has been published.5
Accomplishments and Benefits
There is evidence that PACT ICU is achieving its goals of improving trainee learning and patient outcomes. Trainees are using team skills to provide patient-centered care; trainees are strengthening their overall clinical skills by learning how to improve their responses to high-risk patients. There is also evidence of an increase in interprofessional warm handoffs within the clinic, in which “a clinician directly introduces a patient to another clinician at the time of the patient’s visit, and often a brief encounter between the patient and the health care professional occurs.”4,6
Unlike a traditional didactic with classroom case conferences on interprofessional collaboration, PACT ICU is an opportunity for health care professionals to both learn and work together providing care in a clinic. Moreover, colocation of diverse trainee and faculty professions during the case conferences better prepares trainees to work with other professions and supports all participants to work and communicate as a team.
CoE staff have assessed educational outcomes before and after attendance in PACT ICU. On average, trainees (n = 30) said they found the PACT ICU case conferences to be “very helpful” in developing treatment plans.
Interprofessional Collaboration
Team building and colocating trainees, faculty, and clinic staff from different professions are a primary focus of PACT ICU. The case conferences are designed to break down silos and foster a team approach to care. Trainees learn how the team works and the ways other professionals can help them take care of the patient. For example, trainees learn early about the contributions and expertise that the pharmacist and psychologist offer in terms of their scope of practice and referral opportunities. Additionally, the RN care manager increases the integration with the PACT clinical team by sharing pertinent information on individual patients. Based on recent trainee survey findings, the CoE has observed a positive change in the team dynamic and trainee ability to interface between professions. PACT ICU participants were more likely to make referrals to other members within the PACT team, such as a warm handoff during a clinic appointment, while they were less likely to seek a consult outside the team.7
Clinical Performance
The PACT ICU is an opportunity for a trainee to increase clinical expertise. It provides exposure to a variety of patientsand their care needs and serves as an opportunity to present a high-risk, challenging patient to colleagues of various professions. As of June 2018, 96 physician resident and NP residents have presented complex patient cases.
In addition, a structured forum for discussing patients and their care options strengthens team clinical performance, which supports people to work to the full scope of their practice. Trainees learn and apply team skills, such as communication and the warm handoff.
An interprofessional care plan that is delineated during the meeting supports the trainee and is carried out with help from consultants as needed. These consultants often facilitate plans for a covisit or warm handoff at the next clinic visit, a call from the RN care manager, a virtual clinic appointment, or other nontraditional visits. The clinic staff can get information from PCPs about patient’s plan of care, and PCPs get a more complete picture of a patient’s situation (eg, history, communications, and life-style factors). In addition, surveys of PACT ICU participants suggest the curriculum’s effectiveness at encouraging use of PACT principles within the clinic team and improving appropriate referrals to other members of the PACT team, such as pharmacy and behavioral health.
Patients presented at PACT ICU can be particularly challenging, so there may be a psychological benefit to working with a team to develop a new care plan. The PCPs who feel they are overwhelmed and have exhausted every option step back, get input, and look at the patient in a new light.
Related: Interprofessional Education in Patient Aligned Care Team Primary Care-Mental Health Integration
CoEPCE Function
The PACT ICU is flexible and has been adapted to different ambulatory care settings. Currently, PACT ICU case conferences take place at Boise VAMC, the Caldwell CBOCs, and more recently at a smaller CBOC in Burns, Oregon. The PACT ICU structure is slightly different in the clinic settings since the VA primary care clinic has different resources to draw upon, such as hospital and specialty services. The Caldwell CBOC was unable to protect time for PCPs, so it holds a monthly PACT ICU case conference. In addition to continuing expansion in other nonacademic PACT clinics and collaboration with other CoEPCE sites, work is underway to disseminate generalizable principles for interprofessional education, as well as exporting the model for implementation in non-VA settings.
Primary Care Services
The PACT ICU has the potential to create efficiencies in busy clinic settings. It strengthens communication between PCPs and is an opportunity to touch base on the patient, delegate care, and keep track of high-risk patients who might otherwise receive attention only when having an acute problem. Nurses gain a deeper understanding of the patients presented at PACT ICU.
PACT ICU leverages and builds on existing PACT resources in an achievable and sustainable manner benefiting primary care. CoE trainees, who are part of the Silver Team, tap in to the information that team nurses gain from checking in with these high-risk patients biweekly. Moreover, the integration with the Silver Team improves continuity, which helps enhance a patient’s level of trust. The relationship strengthened between primary care and behavioral health at the Caldwell CBOC, providing improved patient access and increased professional sharing.
Patient Outcomes
The PACT ICU provides a forum for input beyond that of the PCP. This feature results in a more robust treatment plan than might be developed by individual PCPs who might not have time to consider options that are outside their scope of practice. Formulating an enriched care plan, informed by multiple professions, has the potential to improve utilization and provide better care.
The Boise VAMC PACT ICU has presented 219 patients as of June 2018. While clinical outcomes data are difficult to collect, the CoE has data on utilization differences on all patients presented at the PACT ICU case conferences. This includes 4 control patients from the same PCP, with similarly high risk based on CAN scores at the time of selection. A single control patient is selected based on gender, closest age, and CAN score; this serves as a comparator for subsequent utilization analysis.
Data from the first 2 years of this study demonstrate that compared with the high-risk control group, there was an increase in contacts with PACT team members, including behavioral health, clinical pharmacists, and nurse care management, persisting up to 6 months following the PACT ICU presentation.4 However, PACT ICU participation did not increase the number of visits with the PCP, indicating better engagement with the entire team. Participation was associated with significantly decreased hospitalizations and a trend toward decreased ED visits. These findings persisted when compared with controls in the PCP’s panel with similar CAN scores, making “regression to the mean” often seen in these studies much less likely.
Analysis of patients early in the project suggests the possibility of improved glycemic control in patients with DM and improved blood pressure control in hypertensive patients presented at the PACT ICU compared with that of non-PACT ICU patients.8 Another potential benefit includes better team-based coordination. Because the patient now has a team focusing on care, this new dynamic results in improving outreach, identifying patients who could receive care by a telephone, and better preparing team members to establish rapport when the patient calls or comes in for a visit.
The Future
In stage 2 of the CoEPCE program, a multi-site trial of PACT ICU was completed to better understand which elements are critical to success, with the goal of facilitating broader exportability.5 The trial focused on 3 intertwined elements: structure, delivery, and evaluation. Using local implementation and the multisite trial, the most effective practices have been documented as part of an implementation kit, available at boisevacoe.org. The goal of the implementation kit is to facilitate step-by-step implementation of PACT ICU to other settings beyond the multisite study. Since the open-ended structure of PACT ICU enables accommodating different professions and specialties beyond the model’s Boise VAMC participants, it could be easily adapted to potentially support a variety of implementations elsewhere (Appendix).
Another opportunity for expansion is increased patient involvement. Currently, PACT ICU patients have the opportunity to review and ask questions about their multidisciplinary care plans before starting.
1. Rugen KW, Watts S, Janson S, et al. Veteran Affairs centers of excellence in primary care education: transforming nurse practitioner education. Nurs Outlook. 2014;62(2):78-88.
2. Billett S. Learning through practice: beyond informal and towards a framework for learning through practice. UNESCO-UNEVOC. https://unevoc.unesco.org/fileadmin/up/2013_epub_revisiting_global_trends_in_tvet_chapter4.pdf. Published 2013. Accessed August 30, 2018.
3. Bitton A, Pereira AG, Smith CS, Babbott SF, Bowen JL. The EFECT framework for interprofessional education in the patient centered medical home. Healthc (Amst). 2013;1(3-4):63-68.
4. Weppner WG, Davis K, Tivis R, et al. Impact of a complex chronic care patient case conference on quality and utilization. Transl Behav Med. 2018;8(3):366-374.
5. King IC, Strewler A, Wipf JE. Translating innovation: exploring dissemination of a unique case conference. J Interprof Educ Pract. 2017;6(1):55-60.
6. Cohen DJ, Balasubramanian BA, Davis M, et al. Understanding care integration from the ground up: five organizing constructs that shape integrated practices. J Am Board Fam Med. 2015;28(suppl 1):S7-S20.
7. Weppner WG, Davis K, Sordahl J, et al. Interprofessional care conferences for high risk primary care patients. Acad Med. 2016;91(6):798-802.
8. Buu J, Fisher A, Weppner W, Mason B. Impact of patient aligned care team interprofessional care updates (ICU) on metabolic parameters. Fed Pract. 2016;33(2):44-48.
1. Rugen KW, Watts S, Janson S, et al. Veteran Affairs centers of excellence in primary care education: transforming nurse practitioner education. Nurs Outlook. 2014;62(2):78-88.
2. Billett S. Learning through practice: beyond informal and towards a framework for learning through practice. UNESCO-UNEVOC. https://unevoc.unesco.org/fileadmin/up/2013_epub_revisiting_global_trends_in_tvet_chapter4.pdf. Published 2013. Accessed August 30, 2018.
3. Bitton A, Pereira AG, Smith CS, Babbott SF, Bowen JL. The EFECT framework for interprofessional education in the patient centered medical home. Healthc (Amst). 2013;1(3-4):63-68.
4. Weppner WG, Davis K, Tivis R, et al. Impact of a complex chronic care patient case conference on quality and utilization. Transl Behav Med. 2018;8(3):366-374.
5. King IC, Strewler A, Wipf JE. Translating innovation: exploring dissemination of a unique case conference. J Interprof Educ Pract. 2017;6(1):55-60.
6. Cohen DJ, Balasubramanian BA, Davis M, et al. Understanding care integration from the ground up: five organizing constructs that shape integrated practices. J Am Board Fam Med. 2015;28(suppl 1):S7-S20.
7. Weppner WG, Davis K, Sordahl J, et al. Interprofessional care conferences for high risk primary care patients. Acad Med. 2016;91(6):798-802.
8. Buu J, Fisher A, Weppner W, Mason B. Impact of patient aligned care team interprofessional care updates (ICU) on metabolic parameters. Fed Pract. 2016;33(2):44-48.
Role of Point-of-Care Ultrasonography in the Evaluation and Management of Kidney Disease
Imaging at the nephrology point of care provides an important and continuously expanding tool to improve diagnostic accuracy in concert with history and physical examination.
The evaluation of acute kidney injury (AKI) often starts with the classic prerenal, renal, and postrenal causalities, delineating a practical workable approach in its differential diagnosis. Accordingly, the history, physical examination, urinalysis, and kidney-bladder sonography are standard resources in the initial approach to renal disease assessment. Ultrasonography has a well-established role as an important adjuvant for postrenal diagnosis of renal failure. Nevertheless, most of the causes of AKI are prerenal and renal.
Some etiologies of kidney injury are sequelae of systemic diseases in which sonography can be diagnostically analogous to the history and physical examination. Furthermore, ultrasonography may be informative in various clinical scenarios, for example, patients with chronic kidney disease (CKD) and end-stage renal disease (ESRD). In this narrative review, the contribution of point-of-care (POC) sonography to the evaluation and management of AKI, CKD, and associated diseases are explored beyond the traditional sonogram uses for kidney biopsy, central catheter placement, and/or screening of hydronephrosis.
Two important elements made possible the incorporation of POC sonography into nephrology practice.1,2 First, the development of handheld reliable and portable ultrasound devices and, second, the derived capacity of POC sonography to obtain objective signs of physiologic and/or pathophysiologic phenomena. The latter clinical application is realized through the incorporation of POC protocols into the modified focused assessment with sonography for trauma (FAST) examination in conjunction with limited echocardiography and lung sonography (Figure 1). 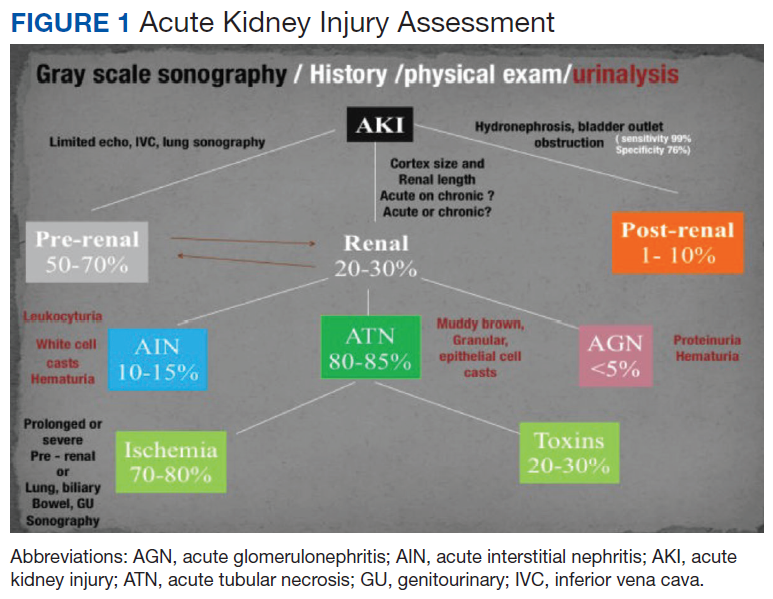
These protocols have allowed the evaluation of extracellular volume, which is important to measure for the diagnosis and management of renal diseases. For example, the evaluation of lung water by POC ultrasonography for patients with ESRD is emerging as a promising tool. In a study of patients with ESRD undergoing hemodialysis, POC ultrasonography detected moderate-to-severe lung congestion in 45% of patients, most of whom (71%) were asymptomatic. Two years of follow-up of patients was associated with 3 to 4 times greater risk of heart attack and death, respectively, compared with individuals without congestion on sonography.4-6 Thus, ultrasound assessment of lung water in patients with ESRD may prove to be an essential tool to assure an adequate ultrafiltration and improve patient outcomes.
Related: Nephrogenic Systemic Fibrosis in a Patient With Multiple Inflammatory Disorders
Acute Kidney Injury
Prerenal
The physical examination provides evaluation of effective arterial circulatory flow (EACF) and is clinically useful in the evaluation of prerenal azotemia. The utility is more obvious in the extremes of EACF. However, in the case of blood volume losses of > 10% or the physiologic equivalent, heart rate, blood pressure, skin turgor, urinary output, and capillary refill may be within normal limits. Obvious changes in these parameters during the physical examination are considered relatively late manifestations.7-10 Therefore, prerenal failure is frequently diagnosed retrospectively after correction of the EACF through use of crystalloids, blood products, vasopressors, inotropic agents, discontinuation of antihypertensive agents, or treatment of its prerenal causes. Certain sonographic maneuvers, performed at the bedside during acute renal injury, may be useful in many patients to evaluate a multitude of prerenal causes of AKI.
Sonographic inferior vena cava (IVC) luminal diameter and inspiratory collapsibility together serve as a surrogate marker of preload venous return and right side heart function. Such imaging results have been shown to be more accurate than jugular venous distension on physical examination but only modestly helpful as a surrogate for central venous pressure (CVP), with more accuracy in the lower values of the CVP.11 However, this procedure can be repeated often after volume resuscitation to achieve a 1.5- to 2.5-cm diameter dimension of the IVC and < 25% inspiratory collapsibility as a goal.
An IVC with a diameter > 2.5 cm in the context of a suspected prerenal AKI is more likely the consequence of heart failure (HF) rather than hypovolemia. The caveat to this finding is that pulmonary hypertension may induce false-positive results.12,13 Hepatic vein dilation is another sign of HF and/or pulmonary hypertension. Furthermore, sonographic images of the left ventricle either from the parasternal long axis or subxiphoid approach can identify supranormal left ventricular ejection fraction (LVEF) or hyperdynamic heart as an important clue of the absolute or relative decrease of EACF.14 Conversely, a decrease in EACF in patients with low LVEF can be assessed qualitatively at the bedside in patients with systolic HF. Supporting evidence of prerenal azotemia as the result of HF can be suggested by the presence of pleural effusions and bilateral comet/rockets tails or B lines in lung sonography.15
The easily recognizable hypoechoic ascitic fluid in the presence of small, hyperechoic gross changes in the echocardiographic texture of liver may indicate a hepatorenal component as the cause of prerenal failure. A small increase of > 20% in the diameter of the portal vein with deep inspiration indicates portal hypertension, with a sensitivity of 80% and a specificity of 100%.15,16 Other clinical scenarios leading to AKI in association with systemic hypotension may be identified quickly with the aid of POC sonography. These scenarios include cardiac tamponade, tension pneumothorax, right ventricular dysfunction (as a surrogate of pulmonary embolism), or an acute coronary event.16,17 Alternatively, identifying the presence of severe left ventricular hypertrophy through POC ultrasonography in a patient with AKI and normal or low normal blood pressures may alert clinicians to the diagnosis of normotensive renal failure in individuals with previously unrecognized severe hypertension. In this clinical context, keeping mean arterial pressures higher than usual with vasopressors may improve renal function while decreasing dialysis utilization.18-21
Likewise, in clinical scenarios of shock with AKI, POC ultrasonography has proven to be an indispensable tool. For example, rapid exploration of the biliary tree demonstrating anterior gallbladder wall thickening, a stone or sludge, common bile duct dilation, or perigallbladder inflammation suggests acute cholecystitis and/or cholangitis as the cause. The presence of dyspnea in association with hypotension and unilateral signs of a higher proportion of comet tails and/or a lung consolidation suggests pneumonia. Rapid differentiation between acute respiratory distress syndrome (ARDS) and pulmonary edema from HF is possible with ultrasonography. When pleural line abnormalities are seen, ARDS is a common cause.
POC ultrasonography will be key in management of ARDS, as ultrasound results will help avoid the use of excessive diuretics, which can result in renal hypoperfusion and AKI.22 In trauma patients, the ultrasound examination will identify free fluid (bleeding) as the source of the prerenal failure, along with its cause (aortic dissection, hepatic hemorrhage, splenic hemorrhage, ectopic pregnancy, etc).23 Sonographic free air observed in the abdomen can provide the clue of a perforated viscus.24 The sonographic image of an inflamed pancreas can suggest pancreatitis as the cause of the systemic hypotension. Ultimately, intravascular losses in the hypoechoic edematous bowel wall in obstruction, ileus, pseudomembranous, or infectious or autoimmune enterocolitis can lead to significant decreases in the EACF and cause prerenal injury.
Related: Prevalence of Suspicious Ultrasound Features in Hot Thyroid Nodules
Intrinsic Renal Disease
In intrinsic AKI, acute tubular necrosis (ATN), glomerulonephritis, and interstitial nephritis are the typical causes. Although no signs are specific to each of the potential causes, a poor corticomedullary differentiation, kidney size < 9 cm, and cortex size < 1 cm help to distinguish CKD from AKI, especially if no previous serum creatinine values are available. The early diagnosis of ATN continues to be clinically relevant in the management of acute renal failure. Despite not being a practical tool for POC sonography currently, the use of bedside Doppler repetitive renal vasculature measures of resistive index predict occurrence and severity of ATN in the critical care setting and are an independent risk factor for poor survival in arterial hypertension and HF.25-30
Other POC sonographic evaluations of intrinsic AKI have been helpful in the following clinical scenarios. The presence of an ultrasonographic sign of sinusitis in the context of nephritic sediment and a rapid decline of renal function suggest antineutrophil cytoplasmic antibody (ANCA)-related vasculitis. Likewise, in younger adults, nephritic sediment and bilateral sonographic lung interstitial fluid in the absence of infection and a normal POC echocardiogram without significant edema elsewhere suggest glomerulonephritis in the category of pulmonary lung syndrome caused by antiglomerular basement membrane antibodies.
In the elderly, a similar systemic presentation suggests an ANCA vasculitis. Pleural effusion, synovitis, proteinuria, and/or hematuria will suggest lupus nephritis. Another important cause of acute renal failure in the critical care setting is intra-abdominal compartment syndrome. Here, bladder pressure measurement protocols are the standard of care. A human model evaluated the predictive value of intra-abdominal compartment syndrome pressures using the IVC square surface. In this study, a normal surface area of the IVC of > 1 cm2/m2 excluded the presence of intra-abdominal hypertension 87.5% of the time. However, the sensitivity of detection of the intra-abdominal hypertension was only 67.5% when the surface area of the IVC was < 1 cm2/m2.31
CKD and Associated Diseases
The diagnostic validity of ultrasonography is well established in adult-onset polycystic kidney disease. Bedside visualization of a parathyroid adenoma may be an important clue for a patient with CKD, echogenic kidneys, or nephrolithiasis with or without hypercalcemia to diagnose primary hyperparathyroidism. The sonographic diagnosis of abnormal parathyroid gland compared with parathyroid surgical exploration had a sensitivity, specificity, and positive predictive value of 74%, 96%, and 90%, respectively.32 In the clinical presentation of severe hypertension with headaches, ultrasonography at bedside can provide valuable diagnostic and risk assessment information of endocranial hypertension from measuring the optic nerve sheath. Sensitivity and specificity of papilledema was 90% and 79%, respectively, when 3.3 mm was the cutoff of the nerve sheath with a 30-degrees sign.33 The carotid artery intima media thickness measured on sonography correlates with the future development of atherogenesis, left ventricular hypertrophy, cognition deficits, CKD, and cardiovascular disease in asymptomatic patients. An intima media thickness of > 1.1 mm has been associated with a higher cardiovascular mortality.
Early initiation of antihypertensive medications and/or statins has been suggested to lower risk in these asymptomatic patients.34 The size and contour (smooth or irregular) of kidneys may provide clues to reflux nephropathy, dysplastic kidneys, radiation nephritis, or chronic pyelonephritis. The presence of nephrotic syndrome and abnormal free light chains ratio with a bedside echocardiogram showing the typical refractile myocardial walls with a peculiar speckled pattern is strongly suggestive of amyloidosis.35 Conditions associated with chronic hypercalcemia, medullary sponge kidney, milk alkali syndrome, sarcoidosis, and distal renal tubular acidosis are causes of nephrocalcinosis. Some degree of CKD is a constant feature in nephrocalcinosis. The initial imaging of choice in nephrocalcinosis and specially the medullary type is ultrasonography preferable to X-ray and perhaps to computed tomography.36
End-Stage Renal Disease
In a patient undergoing peritoneal dialysis with exit-site infection, the presence of > 1 mm radiolucent rim around the subcutaneous catheter after antibiotics has a bad prognosis and prompts catheter removal. This sonographic sign has a positive and negative predictive value for a tunneled infection of 84.6% and 94.1%, respectively.37,38 A risk factor for peritonitis in peritoneal dialysis is air in the peritoneum, which can be seen in one-third of patients. These individuals have 2.4 times more risk of peritonitis compared with patients without pneumoperitoneum. The sensitivity and specificity of sonographic detection of pneumoperitoneum is 94% and 100%, respectively, using the scissor technique.39 Proper training in performing home peritoneal dialysis decreases the incidence of pneumoperitoneum. Although not formally assessed, patient education and change in procedure techniques may decrease the incidence of pneumoperitoneum and peritonitis. The use of prelaparoscopic ultrasonography before insertion of the peritoneal dialysis catheter has detected intra-abdominal adhesions (visceral slide sign) with a sensitivity of 90% to 92%.40
History and physical examination are frequently helpful in the diagnosis of malfunctioning arteriovenous fistulas (AVF) for inflow or outflow disturbances, with sensitivity ranging from 70% to 100% and specificity ranging from 71% to 93% compared with angiography. Frequently, POC limited ultrasound can be helpful for a problematic AVF, either for cannulation or diagnosis. The congruence of duplex sonography with arteriogram is 85% to 96%. Various etiologies of a dysfunctional AVF (pseudo- or true aneurysm, poor development, stenosis, thrombi, or accessory veins) can be observed in the dialysis unit through limited sonography.41-44
After placement of a hemodialysis catheter using real-time ultrasonography, pneumohemothorax can be diagnosed reliably and rapidly. Catheter misplacement outside of the right atrium was detected by thoracic echocardiogram with a sensitivity of 96%, a specificity of 83%, and a positive predictive value of 98%.45,46 Ultimately, ultrasonography may replace chest X-ray in most cases after central vein dialysis catheter placement in the acute care setting.
Postrenal Failure
The sensitivity of ultrasonography to detect dilation to hydronephrosis of the pelvicaliceal system is well established. Sonography is the diagnostic examination of choice in pregnancy and the initial screening test for the nonpregnant patient. Computed tomography is the preferred imaging study in nephroureterolithiasis; however, due to ionizing radiation and cost, ultrasonography is gaining popularity for initial and/or follow-up evaluations. The ureteral jet is a relatively unexplored color and Doppler sonographic methodology that can provide insight into pelvicalyceal peristalsis, potentially yielding evidence of functional obstruction.47-51 Postvoid bladder residual volumes and bladder wall hypertrophy may provide important clues as to the cause(s) of the obstructive uropathy.
Telenephrology
In our institution, sonography is used in the evaluation of IVC, lungs, and kidneys via telemedicine. The probe is handled by trained nurses at the distant site. 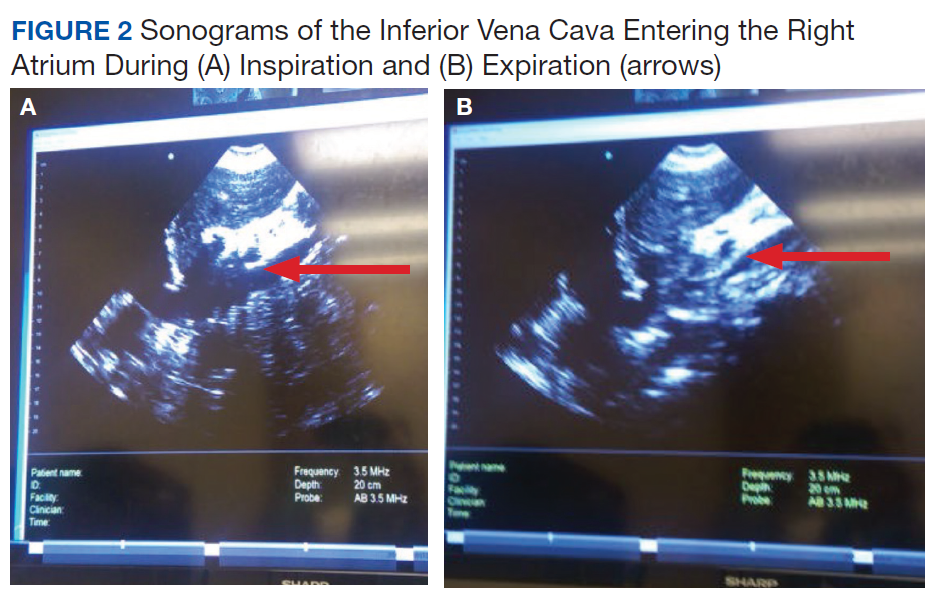
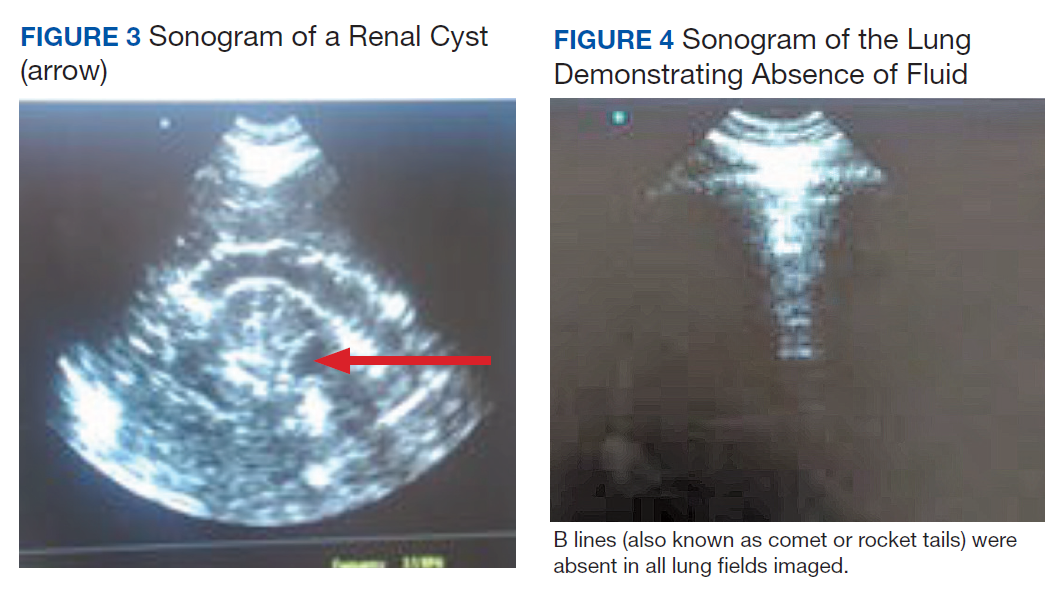
Cardiac Arrest in ESRD
Patients with ESRD may have sudden cardiac arrest as a result of several etiologies. During the advance cardiac life support algorithm, there is a brief period of evaluation of the electrical rhythm in which echocardiography can be helpful with the diagnosis immediately after the 2 initial minutes of cardiopulmonary resuscitation. An enlarged right ventricular cavity (> 2/3 of the left ventricle) is a sonographic sign of a pulmonary embolism.
Bedside sonography has the potential to alter the current guidelines of advance cardiac life support management. For example, if the bedside echo shows a significant pericardial effusion, a pericardiocentesis could be performed faster as it would be diagnosed faster. In addition, at times the heart may appear to be beating rapidly but there is a small amount of fluid (blood) within the cardiac chambers. This may be from an extreme case of dehydration for which rapid administration of IV fluids may help manage. Therefore, a quick bedside point of care echocardiography may reveal a cardiac anomaly that may be able to be restored in a efficient manner. 
Related: General Applications of Ultrasound in Rheumatology Practice
Conclusion
Ultrasonography at the POC provides an important and continuously expanding tool to improve nephrological diagnostic accuracy in concert with history and physical examination. Extracellular fluid evaluation is paramount in all kidney disease conditions. Recent clinical studies in lung ultrasonography suggest that the learning curve for the medical provider is quicker than with other organs. Because POC sonography in association with limited bedside echocardiography may reveal discriminatory signs of pneumonia and differentiate between cardiogenic vs noncardiogenic pulmonary edema, such imaging may be important cost-effective strategies in the management of dyspnea and in the categorization/etiology of AKI. Therefore, incorporation of POC sonography into clinical practice will require that medical schools, residency programs, and nephrology fellowship programs design teaching strategies within their respective curricula. Research studies with outcomes regarding diagnosis, morbidity, and mortality are necessary in these areas.
1. Remer EM, Papanicolaou N, Casalino DD, et al. ACR Appropriateness Criteria® on renal failure. Am J Med. 2014;127(11):1041-1048.e1.
2. Tublin M, Thurston W, Wilson SR. The kidney and urinary tract. In: Rumack C, Wilson S, Charboneau JW, Levine D, eds. Diagnostic Ultrasound. 4th ed. Philadelphia, PA: Elsevier Mosby; 2011:317-391.
3. Bahner D, Blaivas M, Cohen HL, et al; American Institute of Ultrasound in Medicine. AIUM practice guideline for the performance of the focused assessment with sonography for trauma (FAST) examination. J Ultrasound Med. 2008;27(2):313-318.
4. Mallamaci F, Benedetto FA, Tripepi R, et al. Detection of pulmonary congestion by chest ultrasound in dialysis patients. JACC Cardiovasc Imaging. 2010;3(6):586-594.
5. Enia G, Torino C, Panuccio V, et al; Lung Comets Cohort Working Group. Asymptomatic pulmonary congestion and physical functioning in hemodialysis patients. Clin J Am Soc Nephrol. 2013;8(8):1343-1348.
6. Zoccali C, Torino C, Tripepi R, et al; Lung US in CKD Working Group. Pulmonary congestion predicts cardiac events and mortality in ESRD. J Am Soc Nephrol. 2013;24(4):639-646.
7. Fortes MB, Owen JA, Raymond-Barker P, et al. Is this elderly patient dehydrated? Diagnostic accuracy of hydration assessment using physical signs, urine, and saliva markers. J Am Med Dir Assoc. 2015;16(3):221-228.
8. Jauregui J, Nelson D, Choo E, et al. The BUDDY (Bedside Ultrasound to Detect Dehydration in Youth) study. Crit Ultrasound J. 2014;6(1):15.
9. McGee S, Abernethy WB 3rd, Simel DL. The rational clinical examination. Is this patient hypovolemic? JAMA. 1999;281(11):1022-1029.
10. Chung HM, Kluge R, Schrier RW, Anderson RJ. Clinical assessment of extracellular fluid volume in hyponatremia. Am J Med. 1987;83(5):905-908.
11. Guarracino F, Ferro B, Forfori F, Bertini P, Magliacano L, Pinsky MR. Jugular vein distensibility predicts fluid responsiveness in septic patients. Crit Care. 2014;18(6):647.
12. Stawicki SP, Adkins EJ, Eiferman DS, et al. Prospective evaluation of intravascular volume status in critically ill patients: does inferior vena cava collapsibility correlate with central venous pressure? J Trauma Acute Care Surg. 2014;76(4):956-963.
13. Thanakitcharu P, Charoenwut M, Siriwiwatanakul N. Inferior vena cava diameter and collapsibility index: a practical non-invasive evaluation of intravascular fluid volume in critically-ill patients. J Med Assoc Thai. 2013;96(suppl 3):S14-S22.
14. Gustafsson M, Alehagen U, Johansson P. Pocket-sized ultrasound examination of fluid imbalance in patients with heart failure: a pilot and feasibility study of heart failure nurses without prior experience of ultrasonography. Eur J Cardiovasc Nurs. 2015;14(4):294-302.
15. Peguero A, Lamarche J, Courville C, Taha M, Antar-Shultz M. Ultrasonography to evaluate pulmonary edema resolution with blood pressure control in a hemodialysis patient. Abstract 263 presented at: 2016 Spring Clinical National Kidney Foundation Meeting; April 27-May 1, 2016; Boston, MA.
16. Bolondi L, Mazziotti A, Arienti V, et al. Ultrasonographic study of portal venous system in portal hypertension and after portosystemic shunt operations. Surgery. 1984;95(3):261-269.
17. Al-Nakshabandi NA. The role of ultrasonography in portal hypertension. Saudi J Gastroenterol. 2006;12(3):111-117.
18. Abuelo JG. Normotensive ischemic acute renal failure. N Engl J Med. 2007;357(8):797-805.
19. Messerli FH. Clinical determinants and consequences of left ventricular hypertrophy. Am J Med. 1983;75(3A):51-56.
20. Chen SC, Su HM, Hung CC, et al. Echocardiographic parameters are independently associated with rate of renal function decline and progression to dialysis in patients with chronic kidney disease. Clin J Am Soc Nephrol. 2011;6(12):2750-2758.
21. Helfand M, Buckley DI, Freeman M, et al. Emerging risk factors for coronary heart disease: a summary of systematic reviews conducted for the U.S. Preventive Services Task Force. Ann Intern Med. 2009;151(7):496-507.
22. Copetti R, Soldati G, Copetti P. Chest sonography: a useful tool to differentiate acute cardiogenic pulmonary edema from acute respiratory distress syndrome. Cardiovasc Ultrasound. 2008;6:16.
23. ProCESS Investigators, Yealy DM, Kellum JA, et al. A randomized trial of protocol-based care for early septic shock. N Engl J Med. 2014;370(18):1683-1693.
24. Hefny AF, Abu-Zidan FM. Sonographic diagnosis of intraperitoneal free air. J Emerg Trauma Shock. 2011;4(4):511-513.
25. Meola M, Petrucci I. Ultrasound and color Doppler in nephrology. Acute kidney injury [in Italian]. G Ital Nefrol. 2012;29(5):599-615.
26. Corradi F, Brusasco C, Vezzani A, et al. Hemorrhagic shock in polytrauma patients: early detection with renal Doppler resistive index measurements. Radiology. 2011;260(1):112-118.
27. Viazzi F, Leoncini G, Derchi LE, Pontremoli R. Ultrasound Doppler renal resistive index: a useful tool for the management of the hypertensive patient. J Hypertens. 2014;32(1):149-153.
28. Marty P, Szatjnic S, Ferre F, et al. Doppler renal resistive index for early detection of acute kidney injury after major orthopaedic surgery : a prospective observational study. Eur J Anaesthesiol. 2015;32(1):37-43.
29. Kastelan S, Ljubicic N, Kastelan Z, Ostojic R, Uravic M. The role of duplex-doppler ultrasonography in the diagnosis of renal dysfunction and hepatorenal syndrome in patients with liver cirrhosis. Hepatogastroenterology. 2004;51(59):1408-1412.
30. Capotondo L, Nicolai GA, Garosi G. The role of color Doppler in acute kidney injury. Arch Ital Urol Androl. 2010;82(4):275-279.
31. Cavaliere F, Cina A, Biasucci D, et al. Sonographic assessment of abdominal vein dimensional and hemodynamic changes induced in human volunteers by a model of abdominal hypertension. Crit Care Med. 2011;39(2):344-348.
32. Tublin ME, Pryma DA, Yim JH, et al. Localization of parathyroid adenomas by sonography and technetium tc 99m sestamibi single-photon emission computed tomography before minimally invasive parathyroidectomy: are both studies really needed? J Ultrasound Med. 2009;28(2):183-190.
33. Carter SB, Pistilli M, Livingston KG, et al. The role of orbital ultrasonography in distinguishing papilledema from pseudopapilledema. Eye (Lond). 2014;28(12):1425-1430.
34. Greenland P, Alpert JS, Beller GA, et al; American College of Cardiology Foundation; American Heart Association. 2010 ACCF/AHA guideline for assessment of cardiovascular risk in asymptomatic adults: a report of the American College of Cardiology Foundation/American Heart Association Task Force on Practice Guidelines. J Am Coll Cardiol. 2010;56(25):e50-e103.
35. Huang Y, Zhan J, Wei X, et al. Clinical characteristics of 42 patients with cardiac amyloidosis. [Article in Chinese] Zhonghua Nei Ke Za Zhi. 2014;53(7):546-549.
36. Boyce AM, Shawker TH, Hill SC, et al. Ultrasound is superior to computed tomography for assessment of medullary nephrocalcinosis in hypoparathyroidism. J Clin Endocrinol Metab. 2013;98(3):989-994.
37. Kwan TH, Tong MK, Siu YP, Leung KT, Luk SH, Cheung YK. Ultrasonography in the management of exit site infections in peritoneal dialysis patients. Nephrology (Carlton). 2004;9(6):348-352.
38. Karahan OI, Taskapan H, Yikilmaz A, Oymak O, Utas C. Ultrasound evaluation of peritoneal catheter tunnel in catheter related infections in CAPD. Int Urol Nephrol. 2005;37(2):363-366.
39. Karahan OI, Kurt A, Yikilmaz A, Kahriman G. New method for the detection of intraperitoneal free air by sonography: scissors maneuver. J Clin Ultrasound. 2004;32(8):381-385.
40. Okamoto T, Ikenoue T, Matsui K, et al. Free air on CT and the risk of peritonitis in peritoneal dialysis patients: a retrospective study. Ren Fail. 2014;36(10):1492-1496.
41. Arshad FH, Sutijono D, Moore CL. Emergency ultrasound diagnosis of a pseudoaneurysm associated with an arteriovenous fistula. Acad Emerg Med. 2010;17(6):e43-e45.
42. Teodorescu V, Gustavson S, Schanzer H. Duplex ultrasound evaluation of hemodialysis access: a detailed protocol. Int J Nephrol. 2012;2012:508956.
43. Coentrão L, Turmel-Rodrigues L. Monitoring dialysis arteriovenous fistulae: it’s in our hands. J Vasc Access. 2013;14(3):209-215.
44. Chandra AP, Dimascio D, Gruenewald S, Nankivell B, Allen RD, Swinnen J. Colour duplex ultrasound accurately identifies focal stenoses in dysfunctional autogenous arteriovenous fistulae. Nephrology (Carlton). 2010;15(3):300-306.
45. Bedel J, Vallée F, Mari A, et al. Guidewire localization by transthoracic echocardiography during central venous catheter insertion: a periprocedural method to evaluate catheter placement. Intensive Care Med. 2013;39(11):1932-1937.
46. Vezzani A, Brusasco C, Palermo S, Launo C, Mergoni M, Corradi F. Ultrasound localization of central vein catheter and detection of postprocedural pneumothorax: an alternative to chest radiography. Crit Care Med. 2010;38(2):533-538.
47. Celik S, Altay C, Bozkurt O, et al. Association between ureteral jet dynamics and nonobstructive kidney stones: a prospective-controlled study. Urology. 2014;84(5):1016-1020.
48. Tullus K. Does the ureteric jet Doppler waveform have a role in detecting vesicoureteric reflux? Pediatr Nephrol. 2013;28(9):1719-1721.
49. Jandaghi AB, Falahatkar S, Alizadeh A, et al. Assessment of ureterovesical jet dynamics in obstructed ureter by urinary stone with color Doppler and duplex Doppler examinations. Urolithiasis. 2013;41(2):159-163.
50. Pepe P, Motta L, Pennisi M, Aragona F. Functional evaluation of the urinary tract by color-Doppler ultrasonography (CDU) in 100 patients with renal colic. Eur J Radiol. 2005;53(1):131-135.
51. Leung VY, Metreweli C. Ureteric jet in renal transplantation patient. Ultrasound Med Biol. 2002;28(7):885-888.
Imaging at the nephrology point of care provides an important and continuously expanding tool to improve diagnostic accuracy in concert with history and physical examination.
Imaging at the nephrology point of care provides an important and continuously expanding tool to improve diagnostic accuracy in concert with history and physical examination.
The evaluation of acute kidney injury (AKI) often starts with the classic prerenal, renal, and postrenal causalities, delineating a practical workable approach in its differential diagnosis. Accordingly, the history, physical examination, urinalysis, and kidney-bladder sonography are standard resources in the initial approach to renal disease assessment. Ultrasonography has a well-established role as an important adjuvant for postrenal diagnosis of renal failure. Nevertheless, most of the causes of AKI are prerenal and renal.
Some etiologies of kidney injury are sequelae of systemic diseases in which sonography can be diagnostically analogous to the history and physical examination. Furthermore, ultrasonography may be informative in various clinical scenarios, for example, patients with chronic kidney disease (CKD) and end-stage renal disease (ESRD). In this narrative review, the contribution of point-of-care (POC) sonography to the evaluation and management of AKI, CKD, and associated diseases are explored beyond the traditional sonogram uses for kidney biopsy, central catheter placement, and/or screening of hydronephrosis.
Two important elements made possible the incorporation of POC sonography into nephrology practice.1,2 First, the development of handheld reliable and portable ultrasound devices and, second, the derived capacity of POC sonography to obtain objective signs of physiologic and/or pathophysiologic phenomena. The latter clinical application is realized through the incorporation of POC protocols into the modified focused assessment with sonography for trauma (FAST) examination in conjunction with limited echocardiography and lung sonography (Figure 1).
These protocols have allowed the evaluation of extracellular volume, which is important to measure for the diagnosis and management of renal diseases. For example, the evaluation of lung water by POC ultrasonography for patients with ESRD is emerging as a promising tool. In a study of patients with ESRD undergoing hemodialysis, POC ultrasonography detected moderate-to-severe lung congestion in 45% of patients, most of whom (71%) were asymptomatic. Two years of follow-up of patients was associated with 3 to 4 times greater risk of heart attack and death, respectively, compared with individuals without congestion on sonography.4-6 Thus, ultrasound assessment of lung water in patients with ESRD may prove to be an essential tool to assure an adequate ultrafiltration and improve patient outcomes.
Related: Nephrogenic Systemic Fibrosis in a Patient With Multiple Inflammatory Disorders
Acute Kidney Injury
Prerenal
The physical examination provides evaluation of effective arterial circulatory flow (EACF) and is clinically useful in the evaluation of prerenal azotemia. The utility is more obvious in the extremes of EACF. However, in the case of blood volume losses of > 10% or the physiologic equivalent, heart rate, blood pressure, skin turgor, urinary output, and capillary refill may be within normal limits. Obvious changes in these parameters during the physical examination are considered relatively late manifestations.7-10 Therefore, prerenal failure is frequently diagnosed retrospectively after correction of the EACF through use of crystalloids, blood products, vasopressors, inotropic agents, discontinuation of antihypertensive agents, or treatment of its prerenal causes. Certain sonographic maneuvers, performed at the bedside during acute renal injury, may be useful in many patients to evaluate a multitude of prerenal causes of AKI.
Sonographic inferior vena cava (IVC) luminal diameter and inspiratory collapsibility together serve as a surrogate marker of preload venous return and right side heart function. Such imaging results have been shown to be more accurate than jugular venous distension on physical examination but only modestly helpful as a surrogate for central venous pressure (CVP), with more accuracy in the lower values of the CVP.11 However, this procedure can be repeated often after volume resuscitation to achieve a 1.5- to 2.5-cm diameter dimension of the IVC and < 25% inspiratory collapsibility as a goal.
An IVC with a diameter > 2.5 cm in the context of a suspected prerenal AKI is more likely the consequence of heart failure (HF) rather than hypovolemia. The caveat to this finding is that pulmonary hypertension may induce false-positive results.12,13 Hepatic vein dilation is another sign of HF and/or pulmonary hypertension. Furthermore, sonographic images of the left ventricle either from the parasternal long axis or subxiphoid approach can identify supranormal left ventricular ejection fraction (LVEF) or hyperdynamic heart as an important clue of the absolute or relative decrease of EACF.14 Conversely, a decrease in EACF in patients with low LVEF can be assessed qualitatively at the bedside in patients with systolic HF. Supporting evidence of prerenal azotemia as the result of HF can be suggested by the presence of pleural effusions and bilateral comet/rockets tails or B lines in lung sonography.15
The easily recognizable hypoechoic ascitic fluid in the presence of small, hyperechoic gross changes in the echocardiographic texture of liver may indicate a hepatorenal component as the cause of prerenal failure. A small increase of > 20% in the diameter of the portal vein with deep inspiration indicates portal hypertension, with a sensitivity of 80% and a specificity of 100%.15,16 Other clinical scenarios leading to AKI in association with systemic hypotension may be identified quickly with the aid of POC sonography. These scenarios include cardiac tamponade, tension pneumothorax, right ventricular dysfunction (as a surrogate of pulmonary embolism), or an acute coronary event.16,17 Alternatively, identifying the presence of severe left ventricular hypertrophy through POC ultrasonography in a patient with AKI and normal or low normal blood pressures may alert clinicians to the diagnosis of normotensive renal failure in individuals with previously unrecognized severe hypertension. In this clinical context, keeping mean arterial pressures higher than usual with vasopressors may improve renal function while decreasing dialysis utilization.18-21
Likewise, in clinical scenarios of shock with AKI, POC ultrasonography has proven to be an indispensable tool. For example, rapid exploration of the biliary tree demonstrating anterior gallbladder wall thickening, a stone or sludge, common bile duct dilation, or perigallbladder inflammation suggests acute cholecystitis and/or cholangitis as the cause. The presence of dyspnea in association with hypotension and unilateral signs of a higher proportion of comet tails and/or a lung consolidation suggests pneumonia. Rapid differentiation between acute respiratory distress syndrome (ARDS) and pulmonary edema from HF is possible with ultrasonography. When pleural line abnormalities are seen, ARDS is a common cause.
POC ultrasonography will be key in management of ARDS, as ultrasound results will help avoid the use of excessive diuretics, which can result in renal hypoperfusion and AKI.22 In trauma patients, the ultrasound examination will identify free fluid (bleeding) as the source of the prerenal failure, along with its cause (aortic dissection, hepatic hemorrhage, splenic hemorrhage, ectopic pregnancy, etc).23 Sonographic free air observed in the abdomen can provide the clue of a perforated viscus.24 The sonographic image of an inflamed pancreas can suggest pancreatitis as the cause of the systemic hypotension. Ultimately, intravascular losses in the hypoechoic edematous bowel wall in obstruction, ileus, pseudomembranous, or infectious or autoimmune enterocolitis can lead to significant decreases in the EACF and cause prerenal injury.
Related: Prevalence of Suspicious Ultrasound Features in Hot Thyroid Nodules
Intrinsic Renal Disease
In intrinsic AKI, acute tubular necrosis (ATN), glomerulonephritis, and interstitial nephritis are the typical causes. Although no signs are specific to each of the potential causes, a poor corticomedullary differentiation, kidney size < 9 cm, and cortex size < 1 cm help to distinguish CKD from AKI, especially if no previous serum creatinine values are available. The early diagnosis of ATN continues to be clinically relevant in the management of acute renal failure. Despite not being a practical tool for POC sonography currently, the use of bedside Doppler repetitive renal vasculature measures of resistive index predict occurrence and severity of ATN in the critical care setting and are an independent risk factor for poor survival in arterial hypertension and HF.25-30
Other POC sonographic evaluations of intrinsic AKI have been helpful in the following clinical scenarios. The presence of an ultrasonographic sign of sinusitis in the context of nephritic sediment and a rapid decline of renal function suggest antineutrophil cytoplasmic antibody (ANCA)-related vasculitis. Likewise, in younger adults, nephritic sediment and bilateral sonographic lung interstitial fluid in the absence of infection and a normal POC echocardiogram without significant edema elsewhere suggest glomerulonephritis in the category of pulmonary lung syndrome caused by antiglomerular basement membrane antibodies.
In the elderly, a similar systemic presentation suggests an ANCA vasculitis. Pleural effusion, synovitis, proteinuria, and/or hematuria will suggest lupus nephritis. Another important cause of acute renal failure in the critical care setting is intra-abdominal compartment syndrome. Here, bladder pressure measurement protocols are the standard of care. A human model evaluated the predictive value of intra-abdominal compartment syndrome pressures using the IVC square surface. In this study, a normal surface area of the IVC of > 1 cm2/m2 excluded the presence of intra-abdominal hypertension 87.5% of the time. However, the sensitivity of detection of the intra-abdominal hypertension was only 67.5% when the surface area of the IVC was < 1 cm2/m2.31
CKD and Associated Diseases
The diagnostic validity of ultrasonography is well established in adult-onset polycystic kidney disease. Bedside visualization of a parathyroid adenoma may be an important clue for a patient with CKD, echogenic kidneys, or nephrolithiasis with or without hypercalcemia to diagnose primary hyperparathyroidism. The sonographic diagnosis of abnormal parathyroid gland compared with parathyroid surgical exploration had a sensitivity, specificity, and positive predictive value of 74%, 96%, and 90%, respectively.32 In the clinical presentation of severe hypertension with headaches, ultrasonography at bedside can provide valuable diagnostic and risk assessment information of endocranial hypertension from measuring the optic nerve sheath. Sensitivity and specificity of papilledema was 90% and 79%, respectively, when 3.3 mm was the cutoff of the nerve sheath with a 30-degrees sign.33 The carotid artery intima media thickness measured on sonography correlates with the future development of atherogenesis, left ventricular hypertrophy, cognition deficits, CKD, and cardiovascular disease in asymptomatic patients. An intima media thickness of > 1.1 mm has been associated with a higher cardiovascular mortality.
Early initiation of antihypertensive medications and/or statins has been suggested to lower risk in these asymptomatic patients.34 The size and contour (smooth or irregular) of kidneys may provide clues to reflux nephropathy, dysplastic kidneys, radiation nephritis, or chronic pyelonephritis. The presence of nephrotic syndrome and abnormal free light chains ratio with a bedside echocardiogram showing the typical refractile myocardial walls with a peculiar speckled pattern is strongly suggestive of amyloidosis.35 Conditions associated with chronic hypercalcemia, medullary sponge kidney, milk alkali syndrome, sarcoidosis, and distal renal tubular acidosis are causes of nephrocalcinosis. Some degree of CKD is a constant feature in nephrocalcinosis. The initial imaging of choice in nephrocalcinosis and specially the medullary type is ultrasonography preferable to X-ray and perhaps to computed tomography.36
End-Stage Renal Disease
In a patient undergoing peritoneal dialysis with exit-site infection, the presence of > 1 mm radiolucent rim around the subcutaneous catheter after antibiotics has a bad prognosis and prompts catheter removal. This sonographic sign has a positive and negative predictive value for a tunneled infection of 84.6% and 94.1%, respectively.37,38 A risk factor for peritonitis in peritoneal dialysis is air in the peritoneum, which can be seen in one-third of patients. These individuals have 2.4 times more risk of peritonitis compared with patients without pneumoperitoneum. The sensitivity and specificity of sonographic detection of pneumoperitoneum is 94% and 100%, respectively, using the scissor technique.39 Proper training in performing home peritoneal dialysis decreases the incidence of pneumoperitoneum. Although not formally assessed, patient education and change in procedure techniques may decrease the incidence of pneumoperitoneum and peritonitis. The use of prelaparoscopic ultrasonography before insertion of the peritoneal dialysis catheter has detected intra-abdominal adhesions (visceral slide sign) with a sensitivity of 90% to 92%.40
History and physical examination are frequently helpful in the diagnosis of malfunctioning arteriovenous fistulas (AVF) for inflow or outflow disturbances, with sensitivity ranging from 70% to 100% and specificity ranging from 71% to 93% compared with angiography. Frequently, POC limited ultrasound can be helpful for a problematic AVF, either for cannulation or diagnosis. The congruence of duplex sonography with arteriogram is 85% to 96%. Various etiologies of a dysfunctional AVF (pseudo- or true aneurysm, poor development, stenosis, thrombi, or accessory veins) can be observed in the dialysis unit through limited sonography.41-44
After placement of a hemodialysis catheter using real-time ultrasonography, pneumohemothorax can be diagnosed reliably and rapidly. Catheter misplacement outside of the right atrium was detected by thoracic echocardiogram with a sensitivity of 96%, a specificity of 83%, and a positive predictive value of 98%.45,46 Ultimately, ultrasonography may replace chest X-ray in most cases after central vein dialysis catheter placement in the acute care setting.
Postrenal Failure
The sensitivity of ultrasonography to detect dilation to hydronephrosis of the pelvicaliceal system is well established. Sonography is the diagnostic examination of choice in pregnancy and the initial screening test for the nonpregnant patient. Computed tomography is the preferred imaging study in nephroureterolithiasis; however, due to ionizing radiation and cost, ultrasonography is gaining popularity for initial and/or follow-up evaluations. The ureteral jet is a relatively unexplored color and Doppler sonographic methodology that can provide insight into pelvicalyceal peristalsis, potentially yielding evidence of functional obstruction.47-51 Postvoid bladder residual volumes and bladder wall hypertrophy may provide important clues as to the cause(s) of the obstructive uropathy.
Telenephrology
In our institution, sonography is used in the evaluation of IVC, lungs, and kidneys via telemedicine. The probe is handled by trained nurses at the distant site.
Cardiac Arrest in ESRD
Patients with ESRD may have sudden cardiac arrest as a result of several etiologies. During the advance cardiac life support algorithm, there is a brief period of evaluation of the electrical rhythm in which echocardiography can be helpful with the diagnosis immediately after the 2 initial minutes of cardiopulmonary resuscitation. An enlarged right ventricular cavity (> 2/3 of the left ventricle) is a sonographic sign of a pulmonary embolism.
Bedside sonography has the potential to alter the current guidelines of advance cardiac life support management. For example, if the bedside echo shows a significant pericardial effusion, a pericardiocentesis could be performed faster as it would be diagnosed faster. In addition, at times the heart may appear to be beating rapidly but there is a small amount of fluid (blood) within the cardiac chambers. This may be from an extreme case of dehydration for which rapid administration of IV fluids may help manage. Therefore, a quick bedside point of care echocardiography may reveal a cardiac anomaly that may be able to be restored in a efficient manner.
Related: General Applications of Ultrasound in Rheumatology Practice
Conclusion
Ultrasonography at the POC provides an important and continuously expanding tool to improve nephrological diagnostic accuracy in concert with history and physical examination. Extracellular fluid evaluation is paramount in all kidney disease conditions. Recent clinical studies in lung ultrasonography suggest that the learning curve for the medical provider is quicker than with other organs. Because POC sonography in association with limited bedside echocardiography may reveal discriminatory signs of pneumonia and differentiate between cardiogenic vs noncardiogenic pulmonary edema, such imaging may be important cost-effective strategies in the management of dyspnea and in the categorization/etiology of AKI. Therefore, incorporation of POC sonography into clinical practice will require that medical schools, residency programs, and nephrology fellowship programs design teaching strategies within their respective curricula. Research studies with outcomes regarding diagnosis, morbidity, and mortality are necessary in these areas.
The evaluation of acute kidney injury (AKI) often starts with the classic prerenal, renal, and postrenal causalities, delineating a practical workable approach in its differential diagnosis. Accordingly, the history, physical examination, urinalysis, and kidney-bladder sonography are standard resources in the initial approach to renal disease assessment. Ultrasonography has a well-established role as an important adjuvant for postrenal diagnosis of renal failure. Nevertheless, most of the causes of AKI are prerenal and renal.
Some etiologies of kidney injury are sequelae of systemic diseases in which sonography can be diagnostically analogous to the history and physical examination. Furthermore, ultrasonography may be informative in various clinical scenarios, for example, patients with chronic kidney disease (CKD) and end-stage renal disease (ESRD). In this narrative review, the contribution of point-of-care (POC) sonography to the evaluation and management of AKI, CKD, and associated diseases are explored beyond the traditional sonogram uses for kidney biopsy, central catheter placement, and/or screening of hydronephrosis.
Two important elements made possible the incorporation of POC sonography into nephrology practice.1,2 First, the development of handheld reliable and portable ultrasound devices and, second, the derived capacity of POC sonography to obtain objective signs of physiologic and/or pathophysiologic phenomena. The latter clinical application is realized through the incorporation of POC protocols into the modified focused assessment with sonography for trauma (FAST) examination in conjunction with limited echocardiography and lung sonography (Figure 1).
These protocols have allowed the evaluation of extracellular volume, which is important to measure for the diagnosis and management of renal diseases. For example, the evaluation of lung water by POC ultrasonography for patients with ESRD is emerging as a promising tool. In a study of patients with ESRD undergoing hemodialysis, POC ultrasonography detected moderate-to-severe lung congestion in 45% of patients, most of whom (71%) were asymptomatic. Two years of follow-up of patients was associated with 3 to 4 times greater risk of heart attack and death, respectively, compared with individuals without congestion on sonography.4-6 Thus, ultrasound assessment of lung water in patients with ESRD may prove to be an essential tool to assure an adequate ultrafiltration and improve patient outcomes.
Related: Nephrogenic Systemic Fibrosis in a Patient With Multiple Inflammatory Disorders
Acute Kidney Injury
Prerenal
The physical examination provides evaluation of effective arterial circulatory flow (EACF) and is clinically useful in the evaluation of prerenal azotemia. The utility is more obvious in the extremes of EACF. However, in the case of blood volume losses of > 10% or the physiologic equivalent, heart rate, blood pressure, skin turgor, urinary output, and capillary refill may be within normal limits. Obvious changes in these parameters during the physical examination are considered relatively late manifestations.7-10 Therefore, prerenal failure is frequently diagnosed retrospectively after correction of the EACF through use of crystalloids, blood products, vasopressors, inotropic agents, discontinuation of antihypertensive agents, or treatment of its prerenal causes. Certain sonographic maneuvers, performed at the bedside during acute renal injury, may be useful in many patients to evaluate a multitude of prerenal causes of AKI.
Sonographic inferior vena cava (IVC) luminal diameter and inspiratory collapsibility together serve as a surrogate marker of preload venous return and right side heart function. Such imaging results have been shown to be more accurate than jugular venous distension on physical examination but only modestly helpful as a surrogate for central venous pressure (CVP), with more accuracy in the lower values of the CVP.11 However, this procedure can be repeated often after volume resuscitation to achieve a 1.5- to 2.5-cm diameter dimension of the IVC and < 25% inspiratory collapsibility as a goal.
An IVC with a diameter > 2.5 cm in the context of a suspected prerenal AKI is more likely the consequence of heart failure (HF) rather than hypovolemia. The caveat to this finding is that pulmonary hypertension may induce false-positive results.12,13 Hepatic vein dilation is another sign of HF and/or pulmonary hypertension. Furthermore, sonographic images of the left ventricle either from the parasternal long axis or subxiphoid approach can identify supranormal left ventricular ejection fraction (LVEF) or hyperdynamic heart as an important clue of the absolute or relative decrease of EACF.14 Conversely, a decrease in EACF in patients with low LVEF can be assessed qualitatively at the bedside in patients with systolic HF. Supporting evidence of prerenal azotemia as the result of HF can be suggested by the presence of pleural effusions and bilateral comet/rockets tails or B lines in lung sonography.15
The easily recognizable hypoechoic ascitic fluid in the presence of small, hyperechoic gross changes in the echocardiographic texture of liver may indicate a hepatorenal component as the cause of prerenal failure. A small increase of > 20% in the diameter of the portal vein with deep inspiration indicates portal hypertension, with a sensitivity of 80% and a specificity of 100%.15,16 Other clinical scenarios leading to AKI in association with systemic hypotension may be identified quickly with the aid of POC sonography. These scenarios include cardiac tamponade, tension pneumothorax, right ventricular dysfunction (as a surrogate of pulmonary embolism), or an acute coronary event.16,17 Alternatively, identifying the presence of severe left ventricular hypertrophy through POC ultrasonography in a patient with AKI and normal or low normal blood pressures may alert clinicians to the diagnosis of normotensive renal failure in individuals with previously unrecognized severe hypertension. In this clinical context, keeping mean arterial pressures higher than usual with vasopressors may improve renal function while decreasing dialysis utilization.18-21
Likewise, in clinical scenarios of shock with AKI, POC ultrasonography has proven to be an indispensable tool. For example, rapid exploration of the biliary tree demonstrating anterior gallbladder wall thickening, a stone or sludge, common bile duct dilation, or perigallbladder inflammation suggests acute cholecystitis and/or cholangitis as the cause. The presence of dyspnea in association with hypotension and unilateral signs of a higher proportion of comet tails and/or a lung consolidation suggests pneumonia. Rapid differentiation between acute respiratory distress syndrome (ARDS) and pulmonary edema from HF is possible with ultrasonography. When pleural line abnormalities are seen, ARDS is a common cause.
POC ultrasonography will be key in management of ARDS, as ultrasound results will help avoid the use of excessive diuretics, which can result in renal hypoperfusion and AKI.22 In trauma patients, the ultrasound examination will identify free fluid (bleeding) as the source of the prerenal failure, along with its cause (aortic dissection, hepatic hemorrhage, splenic hemorrhage, ectopic pregnancy, etc).23 Sonographic free air observed in the abdomen can provide the clue of a perforated viscus.24 The sonographic image of an inflamed pancreas can suggest pancreatitis as the cause of the systemic hypotension. Ultimately, intravascular losses in the hypoechoic edematous bowel wall in obstruction, ileus, pseudomembranous, or infectious or autoimmune enterocolitis can lead to significant decreases in the EACF and cause prerenal injury.
Related: Prevalence of Suspicious Ultrasound Features in Hot Thyroid Nodules
Intrinsic Renal Disease
In intrinsic AKI, acute tubular necrosis (ATN), glomerulonephritis, and interstitial nephritis are the typical causes. Although no signs are specific to each of the potential causes, a poor corticomedullary differentiation, kidney size < 9 cm, and cortex size < 1 cm help to distinguish CKD from AKI, especially if no previous serum creatinine values are available. The early diagnosis of ATN continues to be clinically relevant in the management of acute renal failure. Despite not being a practical tool for POC sonography currently, the use of bedside Doppler repetitive renal vasculature measures of resistive index predict occurrence and severity of ATN in the critical care setting and are an independent risk factor for poor survival in arterial hypertension and HF.25-30
Other POC sonographic evaluations of intrinsic AKI have been helpful in the following clinical scenarios. The presence of an ultrasonographic sign of sinusitis in the context of nephritic sediment and a rapid decline of renal function suggest antineutrophil cytoplasmic antibody (ANCA)-related vasculitis. Likewise, in younger adults, nephritic sediment and bilateral sonographic lung interstitial fluid in the absence of infection and a normal POC echocardiogram without significant edema elsewhere suggest glomerulonephritis in the category of pulmonary lung syndrome caused by antiglomerular basement membrane antibodies.
In the elderly, a similar systemic presentation suggests an ANCA vasculitis. Pleural effusion, synovitis, proteinuria, and/or hematuria will suggest lupus nephritis. Another important cause of acute renal failure in the critical care setting is intra-abdominal compartment syndrome. Here, bladder pressure measurement protocols are the standard of care. A human model evaluated the predictive value of intra-abdominal compartment syndrome pressures using the IVC square surface. In this study, a normal surface area of the IVC of > 1 cm2/m2 excluded the presence of intra-abdominal hypertension 87.5% of the time. However, the sensitivity of detection of the intra-abdominal hypertension was only 67.5% when the surface area of the IVC was < 1 cm2/m2.31
CKD and Associated Diseases
The diagnostic validity of ultrasonography is well established in adult-onset polycystic kidney disease. Bedside visualization of a parathyroid adenoma may be an important clue for a patient with CKD, echogenic kidneys, or nephrolithiasis with or without hypercalcemia to diagnose primary hyperparathyroidism. The sonographic diagnosis of abnormal parathyroid gland compared with parathyroid surgical exploration had a sensitivity, specificity, and positive predictive value of 74%, 96%, and 90%, respectively.32 In the clinical presentation of severe hypertension with headaches, ultrasonography at bedside can provide valuable diagnostic and risk assessment information of endocranial hypertension from measuring the optic nerve sheath. Sensitivity and specificity of papilledema was 90% and 79%, respectively, when 3.3 mm was the cutoff of the nerve sheath with a 30-degrees sign.33 The carotid artery intima media thickness measured on sonography correlates with the future development of atherogenesis, left ventricular hypertrophy, cognition deficits, CKD, and cardiovascular disease in asymptomatic patients. An intima media thickness of > 1.1 mm has been associated with a higher cardiovascular mortality.
Early initiation of antihypertensive medications and/or statins has been suggested to lower risk in these asymptomatic patients.34 The size and contour (smooth or irregular) of kidneys may provide clues to reflux nephropathy, dysplastic kidneys, radiation nephritis, or chronic pyelonephritis. The presence of nephrotic syndrome and abnormal free light chains ratio with a bedside echocardiogram showing the typical refractile myocardial walls with a peculiar speckled pattern is strongly suggestive of amyloidosis.35 Conditions associated with chronic hypercalcemia, medullary sponge kidney, milk alkali syndrome, sarcoidosis, and distal renal tubular acidosis are causes of nephrocalcinosis. Some degree of CKD is a constant feature in nephrocalcinosis. The initial imaging of choice in nephrocalcinosis and specially the medullary type is ultrasonography preferable to X-ray and perhaps to computed tomography.36
End-Stage Renal Disease
In a patient undergoing peritoneal dialysis with exit-site infection, the presence of > 1 mm radiolucent rim around the subcutaneous catheter after antibiotics has a bad prognosis and prompts catheter removal. This sonographic sign has a positive and negative predictive value for a tunneled infection of 84.6% and 94.1%, respectively.37,38 A risk factor for peritonitis in peritoneal dialysis is air in the peritoneum, which can be seen in one-third of patients. These individuals have 2.4 times more risk of peritonitis compared with patients without pneumoperitoneum. The sensitivity and specificity of sonographic detection of pneumoperitoneum is 94% and 100%, respectively, using the scissor technique.39 Proper training in performing home peritoneal dialysis decreases the incidence of pneumoperitoneum. Although not formally assessed, patient education and change in procedure techniques may decrease the incidence of pneumoperitoneum and peritonitis. The use of prelaparoscopic ultrasonography before insertion of the peritoneal dialysis catheter has detected intra-abdominal adhesions (visceral slide sign) with a sensitivity of 90% to 92%.40
History and physical examination are frequently helpful in the diagnosis of malfunctioning arteriovenous fistulas (AVF) for inflow or outflow disturbances, with sensitivity ranging from 70% to 100% and specificity ranging from 71% to 93% compared with angiography. Frequently, POC limited ultrasound can be helpful for a problematic AVF, either for cannulation or diagnosis. The congruence of duplex sonography with arteriogram is 85% to 96%. Various etiologies of a dysfunctional AVF (pseudo- or true aneurysm, poor development, stenosis, thrombi, or accessory veins) can be observed in the dialysis unit through limited sonography.41-44
After placement of a hemodialysis catheter using real-time ultrasonography, pneumohemothorax can be diagnosed reliably and rapidly. Catheter misplacement outside of the right atrium was detected by thoracic echocardiogram with a sensitivity of 96%, a specificity of 83%, and a positive predictive value of 98%.45,46 Ultimately, ultrasonography may replace chest X-ray in most cases after central vein dialysis catheter placement in the acute care setting.
Postrenal Failure
The sensitivity of ultrasonography to detect dilation to hydronephrosis of the pelvicaliceal system is well established. Sonography is the diagnostic examination of choice in pregnancy and the initial screening test for the nonpregnant patient. Computed tomography is the preferred imaging study in nephroureterolithiasis; however, due to ionizing radiation and cost, ultrasonography is gaining popularity for initial and/or follow-up evaluations. The ureteral jet is a relatively unexplored color and Doppler sonographic methodology that can provide insight into pelvicalyceal peristalsis, potentially yielding evidence of functional obstruction.47-51 Postvoid bladder residual volumes and bladder wall hypertrophy may provide important clues as to the cause(s) of the obstructive uropathy.
Telenephrology
In our institution, sonography is used in the evaluation of IVC, lungs, and kidneys via telemedicine. The probe is handled by trained nurses at the distant site.
Cardiac Arrest in ESRD
Patients with ESRD may have sudden cardiac arrest as a result of several etiologies. During the advance cardiac life support algorithm, there is a brief period of evaluation of the electrical rhythm in which echocardiography can be helpful with the diagnosis immediately after the 2 initial minutes of cardiopulmonary resuscitation. An enlarged right ventricular cavity (> 2/3 of the left ventricle) is a sonographic sign of a pulmonary embolism.
Bedside sonography has the potential to alter the current guidelines of advance cardiac life support management. For example, if the bedside echo shows a significant pericardial effusion, a pericardiocentesis could be performed faster as it would be diagnosed faster. In addition, at times the heart may appear to be beating rapidly but there is a small amount of fluid (blood) within the cardiac chambers. This may be from an extreme case of dehydration for which rapid administration of IV fluids may help manage. Therefore, a quick bedside point of care echocardiography may reveal a cardiac anomaly that may be able to be restored in a efficient manner.
Related: General Applications of Ultrasound in Rheumatology Practice
Conclusion
Ultrasonography at the POC provides an important and continuously expanding tool to improve nephrological diagnostic accuracy in concert with history and physical examination. Extracellular fluid evaluation is paramount in all kidney disease conditions. Recent clinical studies in lung ultrasonography suggest that the learning curve for the medical provider is quicker than with other organs. Because POC sonography in association with limited bedside echocardiography may reveal discriminatory signs of pneumonia and differentiate between cardiogenic vs noncardiogenic pulmonary edema, such imaging may be important cost-effective strategies in the management of dyspnea and in the categorization/etiology of AKI. Therefore, incorporation of POC sonography into clinical practice will require that medical schools, residency programs, and nephrology fellowship programs design teaching strategies within their respective curricula. Research studies with outcomes regarding diagnosis, morbidity, and mortality are necessary in these areas.
1. Remer EM, Papanicolaou N, Casalino DD, et al. ACR Appropriateness Criteria® on renal failure. Am J Med. 2014;127(11):1041-1048.e1.
2. Tublin M, Thurston W, Wilson SR. The kidney and urinary tract. In: Rumack C, Wilson S, Charboneau JW, Levine D, eds. Diagnostic Ultrasound. 4th ed. Philadelphia, PA: Elsevier Mosby; 2011:317-391.
3. Bahner D, Blaivas M, Cohen HL, et al; American Institute of Ultrasound in Medicine. AIUM practice guideline for the performance of the focused assessment with sonography for trauma (FAST) examination. J Ultrasound Med. 2008;27(2):313-318.
4. Mallamaci F, Benedetto FA, Tripepi R, et al. Detection of pulmonary congestion by chest ultrasound in dialysis patients. JACC Cardiovasc Imaging. 2010;3(6):586-594.
5. Enia G, Torino C, Panuccio V, et al; Lung Comets Cohort Working Group. Asymptomatic pulmonary congestion and physical functioning in hemodialysis patients. Clin J Am Soc Nephrol. 2013;8(8):1343-1348.
6. Zoccali C, Torino C, Tripepi R, et al; Lung US in CKD Working Group. Pulmonary congestion predicts cardiac events and mortality in ESRD. J Am Soc Nephrol. 2013;24(4):639-646.
7. Fortes MB, Owen JA, Raymond-Barker P, et al. Is this elderly patient dehydrated? Diagnostic accuracy of hydration assessment using physical signs, urine, and saliva markers. J Am Med Dir Assoc. 2015;16(3):221-228.
8. Jauregui J, Nelson D, Choo E, et al. The BUDDY (Bedside Ultrasound to Detect Dehydration in Youth) study. Crit Ultrasound J. 2014;6(1):15.
9. McGee S, Abernethy WB 3rd, Simel DL. The rational clinical examination. Is this patient hypovolemic? JAMA. 1999;281(11):1022-1029.
10. Chung HM, Kluge R, Schrier RW, Anderson RJ. Clinical assessment of extracellular fluid volume in hyponatremia. Am J Med. 1987;83(5):905-908.
11. Guarracino F, Ferro B, Forfori F, Bertini P, Magliacano L, Pinsky MR. Jugular vein distensibility predicts fluid responsiveness in septic patients. Crit Care. 2014;18(6):647.
12. Stawicki SP, Adkins EJ, Eiferman DS, et al. Prospective evaluation of intravascular volume status in critically ill patients: does inferior vena cava collapsibility correlate with central venous pressure? J Trauma Acute Care Surg. 2014;76(4):956-963.
13. Thanakitcharu P, Charoenwut M, Siriwiwatanakul N. Inferior vena cava diameter and collapsibility index: a practical non-invasive evaluation of intravascular fluid volume in critically-ill patients. J Med Assoc Thai. 2013;96(suppl 3):S14-S22.
14. Gustafsson M, Alehagen U, Johansson P. Pocket-sized ultrasound examination of fluid imbalance in patients with heart failure: a pilot and feasibility study of heart failure nurses without prior experience of ultrasonography. Eur J Cardiovasc Nurs. 2015;14(4):294-302.
15. Peguero A, Lamarche J, Courville C, Taha M, Antar-Shultz M. Ultrasonography to evaluate pulmonary edema resolution with blood pressure control in a hemodialysis patient. Abstract 263 presented at: 2016 Spring Clinical National Kidney Foundation Meeting; April 27-May 1, 2016; Boston, MA.
16. Bolondi L, Mazziotti A, Arienti V, et al. Ultrasonographic study of portal venous system in portal hypertension and after portosystemic shunt operations. Surgery. 1984;95(3):261-269.
17. Al-Nakshabandi NA. The role of ultrasonography in portal hypertension. Saudi J Gastroenterol. 2006;12(3):111-117.
18. Abuelo JG. Normotensive ischemic acute renal failure. N Engl J Med. 2007;357(8):797-805.
19. Messerli FH. Clinical determinants and consequences of left ventricular hypertrophy. Am J Med. 1983;75(3A):51-56.
20. Chen SC, Su HM, Hung CC, et al. Echocardiographic parameters are independently associated with rate of renal function decline and progression to dialysis in patients with chronic kidney disease. Clin J Am Soc Nephrol. 2011;6(12):2750-2758.
21. Helfand M, Buckley DI, Freeman M, et al. Emerging risk factors for coronary heart disease: a summary of systematic reviews conducted for the U.S. Preventive Services Task Force. Ann Intern Med. 2009;151(7):496-507.
22. Copetti R, Soldati G, Copetti P. Chest sonography: a useful tool to differentiate acute cardiogenic pulmonary edema from acute respiratory distress syndrome. Cardiovasc Ultrasound. 2008;6:16.
23. ProCESS Investigators, Yealy DM, Kellum JA, et al. A randomized trial of protocol-based care for early septic shock. N Engl J Med. 2014;370(18):1683-1693.
24. Hefny AF, Abu-Zidan FM. Sonographic diagnosis of intraperitoneal free air. J Emerg Trauma Shock. 2011;4(4):511-513.
25. Meola M, Petrucci I. Ultrasound and color Doppler in nephrology. Acute kidney injury [in Italian]. G Ital Nefrol. 2012;29(5):599-615.
26. Corradi F, Brusasco C, Vezzani A, et al. Hemorrhagic shock in polytrauma patients: early detection with renal Doppler resistive index measurements. Radiology. 2011;260(1):112-118.
27. Viazzi F, Leoncini G, Derchi LE, Pontremoli R. Ultrasound Doppler renal resistive index: a useful tool for the management of the hypertensive patient. J Hypertens. 2014;32(1):149-153.
28. Marty P, Szatjnic S, Ferre F, et al. Doppler renal resistive index for early detection of acute kidney injury after major orthopaedic surgery : a prospective observational study. Eur J Anaesthesiol. 2015;32(1):37-43.
29. Kastelan S, Ljubicic N, Kastelan Z, Ostojic R, Uravic M. The role of duplex-doppler ultrasonography in the diagnosis of renal dysfunction and hepatorenal syndrome in patients with liver cirrhosis. Hepatogastroenterology. 2004;51(59):1408-1412.
30. Capotondo L, Nicolai GA, Garosi G. The role of color Doppler in acute kidney injury. Arch Ital Urol Androl. 2010;82(4):275-279.
31. Cavaliere F, Cina A, Biasucci D, et al. Sonographic assessment of abdominal vein dimensional and hemodynamic changes induced in human volunteers by a model of abdominal hypertension. Crit Care Med. 2011;39(2):344-348.
32. Tublin ME, Pryma DA, Yim JH, et al. Localization of parathyroid adenomas by sonography and technetium tc 99m sestamibi single-photon emission computed tomography before minimally invasive parathyroidectomy: are both studies really needed? J Ultrasound Med. 2009;28(2):183-190.
33. Carter SB, Pistilli M, Livingston KG, et al. The role of orbital ultrasonography in distinguishing papilledema from pseudopapilledema. Eye (Lond). 2014;28(12):1425-1430.
34. Greenland P, Alpert JS, Beller GA, et al; American College of Cardiology Foundation; American Heart Association. 2010 ACCF/AHA guideline for assessment of cardiovascular risk in asymptomatic adults: a report of the American College of Cardiology Foundation/American Heart Association Task Force on Practice Guidelines. J Am Coll Cardiol. 2010;56(25):e50-e103.
35. Huang Y, Zhan J, Wei X, et al. Clinical characteristics of 42 patients with cardiac amyloidosis. [Article in Chinese] Zhonghua Nei Ke Za Zhi. 2014;53(7):546-549.
36. Boyce AM, Shawker TH, Hill SC, et al. Ultrasound is superior to computed tomography for assessment of medullary nephrocalcinosis in hypoparathyroidism. J Clin Endocrinol Metab. 2013;98(3):989-994.
37. Kwan TH, Tong MK, Siu YP, Leung KT, Luk SH, Cheung YK. Ultrasonography in the management of exit site infections in peritoneal dialysis patients. Nephrology (Carlton). 2004;9(6):348-352.
38. Karahan OI, Taskapan H, Yikilmaz A, Oymak O, Utas C. Ultrasound evaluation of peritoneal catheter tunnel in catheter related infections in CAPD. Int Urol Nephrol. 2005;37(2):363-366.
39. Karahan OI, Kurt A, Yikilmaz A, Kahriman G. New method for the detection of intraperitoneal free air by sonography: scissors maneuver. J Clin Ultrasound. 2004;32(8):381-385.
40. Okamoto T, Ikenoue T, Matsui K, et al. Free air on CT and the risk of peritonitis in peritoneal dialysis patients: a retrospective study. Ren Fail. 2014;36(10):1492-1496.
41. Arshad FH, Sutijono D, Moore CL. Emergency ultrasound diagnosis of a pseudoaneurysm associated with an arteriovenous fistula. Acad Emerg Med. 2010;17(6):e43-e45.
42. Teodorescu V, Gustavson S, Schanzer H. Duplex ultrasound evaluation of hemodialysis access: a detailed protocol. Int J Nephrol. 2012;2012:508956.
43. Coentrão L, Turmel-Rodrigues L. Monitoring dialysis arteriovenous fistulae: it’s in our hands. J Vasc Access. 2013;14(3):209-215.
44. Chandra AP, Dimascio D, Gruenewald S, Nankivell B, Allen RD, Swinnen J. Colour duplex ultrasound accurately identifies focal stenoses in dysfunctional autogenous arteriovenous fistulae. Nephrology (Carlton). 2010;15(3):300-306.
45. Bedel J, Vallée F, Mari A, et al. Guidewire localization by transthoracic echocardiography during central venous catheter insertion: a periprocedural method to evaluate catheter placement. Intensive Care Med. 2013;39(11):1932-1937.
46. Vezzani A, Brusasco C, Palermo S, Launo C, Mergoni M, Corradi F. Ultrasound localization of central vein catheter and detection of postprocedural pneumothorax: an alternative to chest radiography. Crit Care Med. 2010;38(2):533-538.
47. Celik S, Altay C, Bozkurt O, et al. Association between ureteral jet dynamics and nonobstructive kidney stones: a prospective-controlled study. Urology. 2014;84(5):1016-1020.
48. Tullus K. Does the ureteric jet Doppler waveform have a role in detecting vesicoureteric reflux? Pediatr Nephrol. 2013;28(9):1719-1721.
49. Jandaghi AB, Falahatkar S, Alizadeh A, et al. Assessment of ureterovesical jet dynamics in obstructed ureter by urinary stone with color Doppler and duplex Doppler examinations. Urolithiasis. 2013;41(2):159-163.
50. Pepe P, Motta L, Pennisi M, Aragona F. Functional evaluation of the urinary tract by color-Doppler ultrasonography (CDU) in 100 patients with renal colic. Eur J Radiol. 2005;53(1):131-135.
51. Leung VY, Metreweli C. Ureteric jet in renal transplantation patient. Ultrasound Med Biol. 2002;28(7):885-888.
1. Remer EM, Papanicolaou N, Casalino DD, et al. ACR Appropriateness Criteria® on renal failure. Am J Med. 2014;127(11):1041-1048.e1.
2. Tublin M, Thurston W, Wilson SR. The kidney and urinary tract. In: Rumack C, Wilson S, Charboneau JW, Levine D, eds. Diagnostic Ultrasound. 4th ed. Philadelphia, PA: Elsevier Mosby; 2011:317-391.
3. Bahner D, Blaivas M, Cohen HL, et al; American Institute of Ultrasound in Medicine. AIUM practice guideline for the performance of the focused assessment with sonography for trauma (FAST) examination. J Ultrasound Med. 2008;27(2):313-318.
4. Mallamaci F, Benedetto FA, Tripepi R, et al. Detection of pulmonary congestion by chest ultrasound in dialysis patients. JACC Cardiovasc Imaging. 2010;3(6):586-594.
5. Enia G, Torino C, Panuccio V, et al; Lung Comets Cohort Working Group. Asymptomatic pulmonary congestion and physical functioning in hemodialysis patients. Clin J Am Soc Nephrol. 2013;8(8):1343-1348.
6. Zoccali C, Torino C, Tripepi R, et al; Lung US in CKD Working Group. Pulmonary congestion predicts cardiac events and mortality in ESRD. J Am Soc Nephrol. 2013;24(4):639-646.
7. Fortes MB, Owen JA, Raymond-Barker P, et al. Is this elderly patient dehydrated? Diagnostic accuracy of hydration assessment using physical signs, urine, and saliva markers. J Am Med Dir Assoc. 2015;16(3):221-228.
8. Jauregui J, Nelson D, Choo E, et al. The BUDDY (Bedside Ultrasound to Detect Dehydration in Youth) study. Crit Ultrasound J. 2014;6(1):15.
9. McGee S, Abernethy WB 3rd, Simel DL. The rational clinical examination. Is this patient hypovolemic? JAMA. 1999;281(11):1022-1029.
10. Chung HM, Kluge R, Schrier RW, Anderson RJ. Clinical assessment of extracellular fluid volume in hyponatremia. Am J Med. 1987;83(5):905-908.
11. Guarracino F, Ferro B, Forfori F, Bertini P, Magliacano L, Pinsky MR. Jugular vein distensibility predicts fluid responsiveness in septic patients. Crit Care. 2014;18(6):647.
12. Stawicki SP, Adkins EJ, Eiferman DS, et al. Prospective evaluation of intravascular volume status in critically ill patients: does inferior vena cava collapsibility correlate with central venous pressure? J Trauma Acute Care Surg. 2014;76(4):956-963.
13. Thanakitcharu P, Charoenwut M, Siriwiwatanakul N. Inferior vena cava diameter and collapsibility index: a practical non-invasive evaluation of intravascular fluid volume in critically-ill patients. J Med Assoc Thai. 2013;96(suppl 3):S14-S22.
14. Gustafsson M, Alehagen U, Johansson P. Pocket-sized ultrasound examination of fluid imbalance in patients with heart failure: a pilot and feasibility study of heart failure nurses without prior experience of ultrasonography. Eur J Cardiovasc Nurs. 2015;14(4):294-302.
15. Peguero A, Lamarche J, Courville C, Taha M, Antar-Shultz M. Ultrasonography to evaluate pulmonary edema resolution with blood pressure control in a hemodialysis patient. Abstract 263 presented at: 2016 Spring Clinical National Kidney Foundation Meeting; April 27-May 1, 2016; Boston, MA.
16. Bolondi L, Mazziotti A, Arienti V, et al. Ultrasonographic study of portal venous system in portal hypertension and after portosystemic shunt operations. Surgery. 1984;95(3):261-269.
17. Al-Nakshabandi NA. The role of ultrasonography in portal hypertension. Saudi J Gastroenterol. 2006;12(3):111-117.
18. Abuelo JG. Normotensive ischemic acute renal failure. N Engl J Med. 2007;357(8):797-805.
19. Messerli FH. Clinical determinants and consequences of left ventricular hypertrophy. Am J Med. 1983;75(3A):51-56.
20. Chen SC, Su HM, Hung CC, et al. Echocardiographic parameters are independently associated with rate of renal function decline and progression to dialysis in patients with chronic kidney disease. Clin J Am Soc Nephrol. 2011;6(12):2750-2758.
21. Helfand M, Buckley DI, Freeman M, et al. Emerging risk factors for coronary heart disease: a summary of systematic reviews conducted for the U.S. Preventive Services Task Force. Ann Intern Med. 2009;151(7):496-507.
22. Copetti R, Soldati G, Copetti P. Chest sonography: a useful tool to differentiate acute cardiogenic pulmonary edema from acute respiratory distress syndrome. Cardiovasc Ultrasound. 2008;6:16.
23. ProCESS Investigators, Yealy DM, Kellum JA, et al. A randomized trial of protocol-based care for early septic shock. N Engl J Med. 2014;370(18):1683-1693.
24. Hefny AF, Abu-Zidan FM. Sonographic diagnosis of intraperitoneal free air. J Emerg Trauma Shock. 2011;4(4):511-513.
25. Meola M, Petrucci I. Ultrasound and color Doppler in nephrology. Acute kidney injury [in Italian]. G Ital Nefrol. 2012;29(5):599-615.
26. Corradi F, Brusasco C, Vezzani A, et al. Hemorrhagic shock in polytrauma patients: early detection with renal Doppler resistive index measurements. Radiology. 2011;260(1):112-118.
27. Viazzi F, Leoncini G, Derchi LE, Pontremoli R. Ultrasound Doppler renal resistive index: a useful tool for the management of the hypertensive patient. J Hypertens. 2014;32(1):149-153.
28. Marty P, Szatjnic S, Ferre F, et al. Doppler renal resistive index for early detection of acute kidney injury after major orthopaedic surgery : a prospective observational study. Eur J Anaesthesiol. 2015;32(1):37-43.
29. Kastelan S, Ljubicic N, Kastelan Z, Ostojic R, Uravic M. The role of duplex-doppler ultrasonography in the diagnosis of renal dysfunction and hepatorenal syndrome in patients with liver cirrhosis. Hepatogastroenterology. 2004;51(59):1408-1412.
30. Capotondo L, Nicolai GA, Garosi G. The role of color Doppler in acute kidney injury. Arch Ital Urol Androl. 2010;82(4):275-279.
31. Cavaliere F, Cina A, Biasucci D, et al. Sonographic assessment of abdominal vein dimensional and hemodynamic changes induced in human volunteers by a model of abdominal hypertension. Crit Care Med. 2011;39(2):344-348.
32. Tublin ME, Pryma DA, Yim JH, et al. Localization of parathyroid adenomas by sonography and technetium tc 99m sestamibi single-photon emission computed tomography before minimally invasive parathyroidectomy: are both studies really needed? J Ultrasound Med. 2009;28(2):183-190.
33. Carter SB, Pistilli M, Livingston KG, et al. The role of orbital ultrasonography in distinguishing papilledema from pseudopapilledema. Eye (Lond). 2014;28(12):1425-1430.
34. Greenland P, Alpert JS, Beller GA, et al; American College of Cardiology Foundation; American Heart Association. 2010 ACCF/AHA guideline for assessment of cardiovascular risk in asymptomatic adults: a report of the American College of Cardiology Foundation/American Heart Association Task Force on Practice Guidelines. J Am Coll Cardiol. 2010;56(25):e50-e103.
35. Huang Y, Zhan J, Wei X, et al. Clinical characteristics of 42 patients with cardiac amyloidosis. [Article in Chinese] Zhonghua Nei Ke Za Zhi. 2014;53(7):546-549.
36. Boyce AM, Shawker TH, Hill SC, et al. Ultrasound is superior to computed tomography for assessment of medullary nephrocalcinosis in hypoparathyroidism. J Clin Endocrinol Metab. 2013;98(3):989-994.
37. Kwan TH, Tong MK, Siu YP, Leung KT, Luk SH, Cheung YK. Ultrasonography in the management of exit site infections in peritoneal dialysis patients. Nephrology (Carlton). 2004;9(6):348-352.
38. Karahan OI, Taskapan H, Yikilmaz A, Oymak O, Utas C. Ultrasound evaluation of peritoneal catheter tunnel in catheter related infections in CAPD. Int Urol Nephrol. 2005;37(2):363-366.
39. Karahan OI, Kurt A, Yikilmaz A, Kahriman G. New method for the detection of intraperitoneal free air by sonography: scissors maneuver. J Clin Ultrasound. 2004;32(8):381-385.
40. Okamoto T, Ikenoue T, Matsui K, et al. Free air on CT and the risk of peritonitis in peritoneal dialysis patients: a retrospective study. Ren Fail. 2014;36(10):1492-1496.
41. Arshad FH, Sutijono D, Moore CL. Emergency ultrasound diagnosis of a pseudoaneurysm associated with an arteriovenous fistula. Acad Emerg Med. 2010;17(6):e43-e45.
42. Teodorescu V, Gustavson S, Schanzer H. Duplex ultrasound evaluation of hemodialysis access: a detailed protocol. Int J Nephrol. 2012;2012:508956.
43. Coentrão L, Turmel-Rodrigues L. Monitoring dialysis arteriovenous fistulae: it’s in our hands. J Vasc Access. 2013;14(3):209-215.
44. Chandra AP, Dimascio D, Gruenewald S, Nankivell B, Allen RD, Swinnen J. Colour duplex ultrasound accurately identifies focal stenoses in dysfunctional autogenous arteriovenous fistulae. Nephrology (Carlton). 2010;15(3):300-306.
45. Bedel J, Vallée F, Mari A, et al. Guidewire localization by transthoracic echocardiography during central venous catheter insertion: a periprocedural method to evaluate catheter placement. Intensive Care Med. 2013;39(11):1932-1937.
46. Vezzani A, Brusasco C, Palermo S, Launo C, Mergoni M, Corradi F. Ultrasound localization of central vein catheter and detection of postprocedural pneumothorax: an alternative to chest radiography. Crit Care Med. 2010;38(2):533-538.
47. Celik S, Altay C, Bozkurt O, et al. Association between ureteral jet dynamics and nonobstructive kidney stones: a prospective-controlled study. Urology. 2014;84(5):1016-1020.
48. Tullus K. Does the ureteric jet Doppler waveform have a role in detecting vesicoureteric reflux? Pediatr Nephrol. 2013;28(9):1719-1721.
49. Jandaghi AB, Falahatkar S, Alizadeh A, et al. Assessment of ureterovesical jet dynamics in obstructed ureter by urinary stone with color Doppler and duplex Doppler examinations. Urolithiasis. 2013;41(2):159-163.
50. Pepe P, Motta L, Pennisi M, Aragona F. Functional evaluation of the urinary tract by color-Doppler ultrasonography (CDU) in 100 patients with renal colic. Eur J Radiol. 2005;53(1):131-135.
51. Leung VY, Metreweli C. Ureteric jet in renal transplantation patient. Ultrasound Med Biol. 2002;28(7):885-888.
Improving VTE Risk Prediction for Patients With Multiple Myeloma
Although patients with multiple myeloma (MM) have an increased risk of developing venous thromboembolism (VTE), no validated model exists that predicts VTE in MM. To help health care providers better assess the risks and the appropriateness of thromboprophylaxis, a team of researchers have developed the IMPEDE VTE risk assessment tool.
According to Kristen M. Sanfilippo, MD, of Washington University School of Medicine and the St. Louis Veterans Affairs Medical Center in Missouri, who presented the paper at the American Society of Hematology meeting last week in San Diego, this is the first effort to build a tool that is both internally and externally validated. The goal was to develop a model that outperformed current National Comprehensive Cancer Network (NCCN) guidelines for VTE that are based on expert opinion and were not specific to patients with multiple myeloma.
“We evaluated the performance of the current NCCN and International Myeloma Working Group guidelines with the VA data and our model outperformed these guidelines. Our recommendations is that our IMPEDE VTE should be considered to replace them,” said Sanfilippo. "I think we can improve our predictability of thrombosis in myeloma by adding novel predictors to the model, but that would have to be assessed in a prospective manner.”
Using the VA Central Cancer Registry, the researchers identified 4,448 patients diagnosed with MM between 1999 and 2014 and retrospectively followed the patients for 180 days after start of MM chemotherapy. Using beta coefficients, the researchers developed a risk score by dividing by a common divisor and rounding to the nearest integer. The risk score for each patient was the sum of all scores for each predictor variable.
The factors associated with VTE were combined to develop the IMPEDE VTE score. The factors were: Immunomodulatory drugs, 3 points; BMI > 25, 1 point; Pathologic fracture pelvis/femur 2 points; Erythropoiesis-stimulating agents, 1 point, Dexamethasone (High-dose 4 points; low-dose 2 points)/Doxorubicin 2 points; Asian Ethnicity, -3 points; history of VTE, 3 points; Tunneled line/ central venous catheter, 2 points). In addition, use of therapeutic anticoagulation (-5 points) with warfarin or low molecular weight heparin (LWMH) and use of prophylactic LMWH or aspirin (-2 points) were associated with a decreased risk of VTE. The risk score then identifies patients’ VTE risk as low (≤ 3), intermediate (4-6), or high (≥ 7).
According to Sanfilippo, the model showed satisfactory discrimination in both the derivation cohort (Harrell’s c-statistic = 0.66) and in the bootstrap validation, c-statistic = 0.66 (95% CI: 0.63 – 0.70). Within the first 6-months of starting chemotherapy, the rate of VTE was 3.5% compared to > 10% for high-risk patients.
The researchers hoped that the risk prediction model for VTE in MM would allow for use of thromboprophylaxis in MM patients at high-risk of VTE while sparing those at low risk.
Although patients with multiple myeloma (MM) have an increased risk of developing venous thromboembolism (VTE), no validated model exists that predicts VTE in MM. To help health care providers better assess the risks and the appropriateness of thromboprophylaxis, a team of researchers have developed the IMPEDE VTE risk assessment tool.
According to Kristen M. Sanfilippo, MD, of Washington University School of Medicine and the St. Louis Veterans Affairs Medical Center in Missouri, who presented the paper at the American Society of Hematology meeting last week in San Diego, this is the first effort to build a tool that is both internally and externally validated. The goal was to develop a model that outperformed current National Comprehensive Cancer Network (NCCN) guidelines for VTE that are based on expert opinion and were not specific to patients with multiple myeloma.
“We evaluated the performance of the current NCCN and International Myeloma Working Group guidelines with the VA data and our model outperformed these guidelines. Our recommendations is that our IMPEDE VTE should be considered to replace them,” said Sanfilippo. "I think we can improve our predictability of thrombosis in myeloma by adding novel predictors to the model, but that would have to be assessed in a prospective manner.”
Using the VA Central Cancer Registry, the researchers identified 4,448 patients diagnosed with MM between 1999 and 2014 and retrospectively followed the patients for 180 days after start of MM chemotherapy. Using beta coefficients, the researchers developed a risk score by dividing by a common divisor and rounding to the nearest integer. The risk score for each patient was the sum of all scores for each predictor variable.
The factors associated with VTE were combined to develop the IMPEDE VTE score. The factors were: Immunomodulatory drugs, 3 points; BMI > 25, 1 point; Pathologic fracture pelvis/femur 2 points; Erythropoiesis-stimulating agents, 1 point, Dexamethasone (High-dose 4 points; low-dose 2 points)/Doxorubicin 2 points; Asian Ethnicity, -3 points; history of VTE, 3 points; Tunneled line/ central venous catheter, 2 points). In addition, use of therapeutic anticoagulation (-5 points) with warfarin or low molecular weight heparin (LWMH) and use of prophylactic LMWH or aspirin (-2 points) were associated with a decreased risk of VTE. The risk score then identifies patients’ VTE risk as low (≤ 3), intermediate (4-6), or high (≥ 7).
According to Sanfilippo, the model showed satisfactory discrimination in both the derivation cohort (Harrell’s c-statistic = 0.66) and in the bootstrap validation, c-statistic = 0.66 (95% CI: 0.63 – 0.70). Within the first 6-months of starting chemotherapy, the rate of VTE was 3.5% compared to > 10% for high-risk patients.
The researchers hoped that the risk prediction model for VTE in MM would allow for use of thromboprophylaxis in MM patients at high-risk of VTE while sparing those at low risk.
Although patients with multiple myeloma (MM) have an increased risk of developing venous thromboembolism (VTE), no validated model exists that predicts VTE in MM. To help health care providers better assess the risks and the appropriateness of thromboprophylaxis, a team of researchers have developed the IMPEDE VTE risk assessment tool.
According to Kristen M. Sanfilippo, MD, of Washington University School of Medicine and the St. Louis Veterans Affairs Medical Center in Missouri, who presented the paper at the American Society of Hematology meeting last week in San Diego, this is the first effort to build a tool that is both internally and externally validated. The goal was to develop a model that outperformed current National Comprehensive Cancer Network (NCCN) guidelines for VTE that are based on expert opinion and were not specific to patients with multiple myeloma.
“We evaluated the performance of the current NCCN and International Myeloma Working Group guidelines with the VA data and our model outperformed these guidelines. Our recommendations is that our IMPEDE VTE should be considered to replace them,” said Sanfilippo. "I think we can improve our predictability of thrombosis in myeloma by adding novel predictors to the model, but that would have to be assessed in a prospective manner.”
Using the VA Central Cancer Registry, the researchers identified 4,448 patients diagnosed with MM between 1999 and 2014 and retrospectively followed the patients for 180 days after start of MM chemotherapy. Using beta coefficients, the researchers developed a risk score by dividing by a common divisor and rounding to the nearest integer. The risk score for each patient was the sum of all scores for each predictor variable.
The factors associated with VTE were combined to develop the IMPEDE VTE score. The factors were: Immunomodulatory drugs, 3 points; BMI > 25, 1 point; Pathologic fracture pelvis/femur 2 points; Erythropoiesis-stimulating agents, 1 point, Dexamethasone (High-dose 4 points; low-dose 2 points)/Doxorubicin 2 points; Asian Ethnicity, -3 points; history of VTE, 3 points; Tunneled line/ central venous catheter, 2 points). In addition, use of therapeutic anticoagulation (-5 points) with warfarin or low molecular weight heparin (LWMH) and use of prophylactic LMWH or aspirin (-2 points) were associated with a decreased risk of VTE. The risk score then identifies patients’ VTE risk as low (≤ 3), intermediate (4-6), or high (≥ 7).
According to Sanfilippo, the model showed satisfactory discrimination in both the derivation cohort (Harrell’s c-statistic = 0.66) and in the bootstrap validation, c-statistic = 0.66 (95% CI: 0.63 – 0.70). Within the first 6-months of starting chemotherapy, the rate of VTE was 3.5% compared to > 10% for high-risk patients.
The researchers hoped that the risk prediction model for VTE in MM would allow for use of thromboprophylaxis in MM patients at high-risk of VTE while sparing those at low risk.
Action on HealthCare.gov picked up during week 5
Activity during week 5 of open enrollment on HealthCare.gov was up by more than 50% over the previous week, but the total number of plans selected for the 2019 coverage year remains lower than it was last year, according to the Centers for Medicare & Medicaid Services.
The 773,000 plans selected during week 5 (Nov. 25 – Dec. 1) of the 2019 open enrollment season were an increase of 54% over week 4, CMS data show for the 39 states that use the HealthCare.gov platform, with the cumulative total now at 3.2 million. By comparison, week-5 selections in last year’s open enrollment totaled 823,000, and the cumulative figure was 3.6 million.
The deadline for applying for 2019 coverage on HealthCare.gov is Dec. 15.
Activity during week 5 of open enrollment on HealthCare.gov was up by more than 50% over the previous week, but the total number of plans selected for the 2019 coverage year remains lower than it was last year, according to the Centers for Medicare & Medicaid Services.
The 773,000 plans selected during week 5 (Nov. 25 – Dec. 1) of the 2019 open enrollment season were an increase of 54% over week 4, CMS data show for the 39 states that use the HealthCare.gov platform, with the cumulative total now at 3.2 million. By comparison, week-5 selections in last year’s open enrollment totaled 823,000, and the cumulative figure was 3.6 million.
The deadline for applying for 2019 coverage on HealthCare.gov is Dec. 15.
Activity during week 5 of open enrollment on HealthCare.gov was up by more than 50% over the previous week, but the total number of plans selected for the 2019 coverage year remains lower than it was last year, according to the Centers for Medicare & Medicaid Services.
The 773,000 plans selected during week 5 (Nov. 25 – Dec. 1) of the 2019 open enrollment season were an increase of 54% over week 4, CMS data show for the 39 states that use the HealthCare.gov platform, with the cumulative total now at 3.2 million. By comparison, week-5 selections in last year’s open enrollment totaled 823,000, and the cumulative figure was 3.6 million.
The deadline for applying for 2019 coverage on HealthCare.gov is Dec. 15.
Withdrawing heart failure meds, the best DOAC for octogenarians, and more.
This week, apixaban edges out other DOACs for octogenarians, methotrexate fails to cut cardiovascular events in a large trial, withdrawing heart failure medications after recovery leads to relapse, and showing patients their own atherosclerosis may reduce their cardiovascular event risk.
Subscribe to Cardiocast wherever you get your podcasts.
Amazon Alexa
Apple Podcasts
This week, apixaban edges out other DOACs for octogenarians, methotrexate fails to cut cardiovascular events in a large trial, withdrawing heart failure medications after recovery leads to relapse, and showing patients their own atherosclerosis may reduce their cardiovascular event risk.
Subscribe to Cardiocast wherever you get your podcasts.
Amazon Alexa
Apple Podcasts
This week, apixaban edges out other DOACs for octogenarians, methotrexate fails to cut cardiovascular events in a large trial, withdrawing heart failure medications after recovery leads to relapse, and showing patients their own atherosclerosis may reduce their cardiovascular event risk.
Subscribe to Cardiocast wherever you get your podcasts.
Amazon Alexa
Apple Podcasts

Rivaroxaban may reduce VTE risk in cancer patients
SAN DIEGO – Prophylaxis with rivaroxaban significantly reduced the rate of venous thromboembolism and associated death in high-risk ambulatory cancer patients receiving systemic therapy, results of a randomized trial show.
The reduction in venous thromboembolism (VTE) or VTE-related death was not statistically significant in the primary analysis, in part because a large proportion of patients stopped taking the direct oral anticoagulant, according to investigator Alok A. Khorana, MD, of the Cleveland Clinic.
However, the reduction in events was significant in a prespecified secondary analysis limited to the on-treatment period, Dr. Khorana reported at the annual meeting of the American Society of Hematology, adding that rates of major and nonmajor bleeding were low.
Results are “eagerly awaited” from a different prophylaxis trial – the AVERT study – looking at another direct oral anticoagulant in high-risk cancer patients, Dr. Khorana said in a late-breaking abstracts session.
“If the findings of that trial are consistent with ours, then we certainly hope that these findings should inform future recommendations regarding thromboprophylaxis for high-risk ambulatory cancer patients, and then the landscape of anticoagulation in the cancer population should start to shift from management of events to primary prevention,” he said.
In the study by Dr. Khorana and his colleagues, known as CASSINI, 841 patients with various solid tumors and lymphomas were randomized to either rivaroxaban 10 mg or placebo once daily. The patients, enrolled at 143 study centers in 11 countries, all had a Khorana risk score of 2 or greater.
In the primary analysis period of 180 days, the composite endpoint of VTE or VTE-related death occurred in 5.95% of the rivaroxaban-treated group and 8.79% of the placebo group (hazard ratio, 0.66; 95% confidence interval, 0.40-1.09; P = .101). However, a total of 177 patients (43.7%) stopped rivaroxaban earlier than 180 days, and likewise, 203 patients (50.2%) stopped placebo early.
In a prespecified secondary analysis looking just at the period of time when patients were actually taking rivaroxaban or placebo, rivaroxaban did significantly reduce risk of VTE or VTE-related death, Dr. Khorana said. The composite endpoint occurred in 2.62% of the rivaroxaban patients and 6.41% of placebo patients in that on-treatment analysis (HR, 0.40; 95% CI, 0.20-0.80; P = .007).
Rates of major bleeding and clinically relevant nonmajor bleeding were not significantly different between groups, according to results of a safety analysis. Major bleeding occurred in eight rivaroxaban patients and four placebo patients, or 1.98% and 0.99%, respectively (P = .265).
CASSINI was sponsored by Bayer and Janssen. Dr. Khorana reported disclosures related to Janssen, Bayer, PAREXEL, Sanofi, Pfizer, TriSalus Life Sciences, Halozyme, Seattle Genetics, AngioDynamics, and others.
SAN DIEGO – Prophylaxis with rivaroxaban significantly reduced the rate of venous thromboembolism and associated death in high-risk ambulatory cancer patients receiving systemic therapy, results of a randomized trial show.
The reduction in venous thromboembolism (VTE) or VTE-related death was not statistically significant in the primary analysis, in part because a large proportion of patients stopped taking the direct oral anticoagulant, according to investigator Alok A. Khorana, MD, of the Cleveland Clinic.
However, the reduction in events was significant in a prespecified secondary analysis limited to the on-treatment period, Dr. Khorana reported at the annual meeting of the American Society of Hematology, adding that rates of major and nonmajor bleeding were low.
Results are “eagerly awaited” from a different prophylaxis trial – the AVERT study – looking at another direct oral anticoagulant in high-risk cancer patients, Dr. Khorana said in a late-breaking abstracts session.
“If the findings of that trial are consistent with ours, then we certainly hope that these findings should inform future recommendations regarding thromboprophylaxis for high-risk ambulatory cancer patients, and then the landscape of anticoagulation in the cancer population should start to shift from management of events to primary prevention,” he said.
In the study by Dr. Khorana and his colleagues, known as CASSINI, 841 patients with various solid tumors and lymphomas were randomized to either rivaroxaban 10 mg or placebo once daily. The patients, enrolled at 143 study centers in 11 countries, all had a Khorana risk score of 2 or greater.
In the primary analysis period of 180 days, the composite endpoint of VTE or VTE-related death occurred in 5.95% of the rivaroxaban-treated group and 8.79% of the placebo group (hazard ratio, 0.66; 95% confidence interval, 0.40-1.09; P = .101). However, a total of 177 patients (43.7%) stopped rivaroxaban earlier than 180 days, and likewise, 203 patients (50.2%) stopped placebo early.
In a prespecified secondary analysis looking just at the period of time when patients were actually taking rivaroxaban or placebo, rivaroxaban did significantly reduce risk of VTE or VTE-related death, Dr. Khorana said. The composite endpoint occurred in 2.62% of the rivaroxaban patients and 6.41% of placebo patients in that on-treatment analysis (HR, 0.40; 95% CI, 0.20-0.80; P = .007).
Rates of major bleeding and clinically relevant nonmajor bleeding were not significantly different between groups, according to results of a safety analysis. Major bleeding occurred in eight rivaroxaban patients and four placebo patients, or 1.98% and 0.99%, respectively (P = .265).
CASSINI was sponsored by Bayer and Janssen. Dr. Khorana reported disclosures related to Janssen, Bayer, PAREXEL, Sanofi, Pfizer, TriSalus Life Sciences, Halozyme, Seattle Genetics, AngioDynamics, and others.
SAN DIEGO – Prophylaxis with rivaroxaban significantly reduced the rate of venous thromboembolism and associated death in high-risk ambulatory cancer patients receiving systemic therapy, results of a randomized trial show.
The reduction in venous thromboembolism (VTE) or VTE-related death was not statistically significant in the primary analysis, in part because a large proportion of patients stopped taking the direct oral anticoagulant, according to investigator Alok A. Khorana, MD, of the Cleveland Clinic.
However, the reduction in events was significant in a prespecified secondary analysis limited to the on-treatment period, Dr. Khorana reported at the annual meeting of the American Society of Hematology, adding that rates of major and nonmajor bleeding were low.
Results are “eagerly awaited” from a different prophylaxis trial – the AVERT study – looking at another direct oral anticoagulant in high-risk cancer patients, Dr. Khorana said in a late-breaking abstracts session.
“If the findings of that trial are consistent with ours, then we certainly hope that these findings should inform future recommendations regarding thromboprophylaxis for high-risk ambulatory cancer patients, and then the landscape of anticoagulation in the cancer population should start to shift from management of events to primary prevention,” he said.
In the study by Dr. Khorana and his colleagues, known as CASSINI, 841 patients with various solid tumors and lymphomas were randomized to either rivaroxaban 10 mg or placebo once daily. The patients, enrolled at 143 study centers in 11 countries, all had a Khorana risk score of 2 or greater.
In the primary analysis period of 180 days, the composite endpoint of VTE or VTE-related death occurred in 5.95% of the rivaroxaban-treated group and 8.79% of the placebo group (hazard ratio, 0.66; 95% confidence interval, 0.40-1.09; P = .101). However, a total of 177 patients (43.7%) stopped rivaroxaban earlier than 180 days, and likewise, 203 patients (50.2%) stopped placebo early.
In a prespecified secondary analysis looking just at the period of time when patients were actually taking rivaroxaban or placebo, rivaroxaban did significantly reduce risk of VTE or VTE-related death, Dr. Khorana said. The composite endpoint occurred in 2.62% of the rivaroxaban patients and 6.41% of placebo patients in that on-treatment analysis (HR, 0.40; 95% CI, 0.20-0.80; P = .007).
Rates of major bleeding and clinically relevant nonmajor bleeding were not significantly different between groups, according to results of a safety analysis. Major bleeding occurred in eight rivaroxaban patients and four placebo patients, or 1.98% and 0.99%, respectively (P = .265).
CASSINI was sponsored by Bayer and Janssen. Dr. Khorana reported disclosures related to Janssen, Bayer, PAREXEL, Sanofi, Pfizer, TriSalus Life Sciences, Halozyme, Seattle Genetics, AngioDynamics, and others.
REPORTING FROM ASH 2018
Key clinical point:
Major finding: In an on-treatment analysis, the composite endpoint occurred in 2.62% of the rivaroxaban patients and 6.41% of placebo patients (hazard ratio, 0.40; 95% confidence interval, 0.20-0.80; P = .007).
Study details: The results from CASSINI included 841 patients with various solid tumors and lymphomas randomized to rivaroxaban or placebo daily.
Disclosures: CASSINI was sponsored by Bayer and Janssen. Dr. Khorana reported disclosures related to Janssen, Bayer, PAREXEL, Sanofi, Pfizer, TriSalus Life Sciences, Halozyme, Seattle Genetics, AngioDynamics, and others.

Anesthesia Care Practice Models in the Veterans Health Administration
Although the VHA primarily relies on teams for anesthesia care, unsupervised certified registered nurse anesthetists also are used to meet veterans’ surgical care needs.
Anesthesia care is provided by physician anesthesiologists, certified registered nurse anesthetists (CRNAs), anesthesiology residents, and anesthesiologist assistants. These providers may practice alone (anesthesiologists or CRNAs) or in various combinations of supervised roles and teams. Previous studies reveal mixed findings regarding whether patient outcomes differ by anesthesia practice models.1-7However, little is known about the prevalence of various anesthesia models in the US.
Background
In recent years, anesthesiology has undergone substantial expansion in its scope of services provided, the settings in which it is provided, and the diversity of its workforce.8As the field continues to evolve, especially within the context of value-based health care reform, it is imperative to evaluate how anesthesia care models are used in health systems and how these models may optimize care delivery.
The Veterans Health Administration (VHA) is the largest integrated health care system in the US, providing surgical care in 110 inpatient medical centers and 27 ambulatory surgery centers. Despite national integration, anesthesia practices vary widely among facilities. The question of which model of anesthesia care is associated with the best outcomes and offers the most value is widely debated.1,5,7,9 As an important first step in understanding anesthesia care delivery, a baseline assessment of the practice patterns of anesthesia providers is necessary and may benefit future studies of the impact of these care models on outcomes. Thus, the aim of this work was to understand and describe the previously unassessed landscape of anesthesia care delivery within the VHA.
Methods
As part of a larger evaluation of anesthesia care delivery in the VHA, an observational assessment of anesthesia provider practice patterns was conducted using retrospective surgical data. This project complies with VHA policy pertaining to nonresearch operational activities and did not require institutional review board approval and adheres to the EQUATOR Network guidelines described in Strengthening the Reporting of Observational Studies in Epidemiology (STROBE).10
Data were obtained from the VHA Managerial Cost Accounting National Data Extract for Surgery package for all surgical procedures (n = 726,706) between October 1, 2013 and March 31, 2015. There were 420 facilities represented in these surgical data. The VHA facility records were used to specifically identify inpatient and ambulatory surgery facilities for inclusion. Additionally, to ensure facilities were valid surgical sites with sufficient surgical volume, those with 100 or fewer cases during the period were excluded. In total, 288 facilities with 9,434 surgical cases (representing 1% of cases) were excluded. These excluded facilities included nursing homes (38%), domiciliaries (26%), outpatient clinics (11%), rehabilitation programs (9%), other nonsurgical facilities (8%), and medical centers (8%). The majority (80%) of excluded medical centers had 30 or fewer surgical cases.
In 6 instances, data from subfacilities were combined with their organizationally affiliated main facilities. The final sample included 125 facilities. The VHA assigns a complexity level designation to facilities, defined as follows: 1a (most complex), 1b, 1c, 2, and 3 (least complex).11 Facilities with 1a designation perform the most complex surgical cases, such as cardiovascular surgery or neurosurgery and have more staff and resource support, whereas levels 2 and 3 facilities perform fewer and less complex cases.
Surgical records were excluded when the primary Current Procedural Terminology (CPT) code was missing (n = 85,748, or 12% of cases). This resulted in 631,524 remaining cases. The surgical CPT codes were mapped to anesthesia CPT codes to obtain the associated base unit (BU) values via a published crosswalk by the American Society of Anesthesiologists (ASA).12 A higher number of associated BUs indicates a more complex procedure. For example, procedures such as biopsies, arthroscopies, and laparoscopies receive 3 to 4 BUs, whereas a venous thrombectomy of the leg and a transurethral resection of the prostate are both 5 BUs, a total knee arthroplasty is 7 BUs, a craniotomy is 10 BUs, and a coronary artery bypass receives 18 BUs. Surgical case complexity was defined as low (3 or 4 BUs), medium (5 BUs), and high (≥ 6 BUs). Although the VHA has an existing case complexity assignment process based on CPT codes, it defines complexity differently for inpatient facilities and ambulatory surgery centers. Thus, the BU-defined complexity permitted a standardized complexity categorization across all facilities. Categorization of BUs similar to this has previously been used in the literature as a proxy for case complexity.13,14
Patient-level information included the ASA physical status classification, a measure of overall health status determined by an anesthesia provider preoperatively.15 These classifications included ASA I (healthy), ASA II (mild systemic disease), ASA III (severe systemic disease), ASA IV (severe systemic disease that is a constant threat to life), and ASA V (moribund patient who is not expected to survive without surgery). The last classification, ASA VI: brain-dead with planned organ donation, was excluded. The “E” subcategory denoting “emergency” was subsumed within the corresponding ASA category (eg, ASA V-E was combined with ASA V).
Provider data identified the principal and supervising (if present) anesthetists involved in the case. The provision of anesthesia care was categorized into 3 models: Model 1—a physician anesthesiologist supervising a CRNA; Model 2—a physician anesthesiologist practicing independently or supervising an anesthesiology resident; and Model 3—a CRNA without supervision. Surgical cases were excluded when there was no anesthesia provider (n = 95,795, or 15% of remaining cases), or a nonanesthesia provider (n = 51,647, or 8% of remaining cases) on record. The final sample was 484,082 surgical cases conducted at 125 facilities.
Related: Improving Care and Reducing Length of Stay in Patients Undergoing Total Knee Replacement
Statistical Analysis
The percentage of surgical cases in each anesthesia care model was calculated overall and by the following characteristics: surgical case complexity, ASA classification, and facility complexity. The anesthesia model was determined for each case and summed at the facility level, yielding a total number of cases attributed to each model for each facility, thus identifying the predominant anesthesia model for each facility. The facilities were geographically displayed by their predominant anesthesia model and total number of surgical cases during the period. Because the aim was to present a descriptive representation of anesthesia care models, rather than infer significance, statistical testing was not included.
Results
A total of 484,082 surgical cases met inclusion criteria (Table). These cases were from 109 inpatient facilities and 16 ambulatory surgery facilities. 
The percentage of cases in Model 1 was similar across the levels of surgical case complexity. However, a higher proportion of highly complex cases had a physician anesthesiologist (Model 2, 38.8%) than a CRNA (Model 3, 6.4%) as the primary anesthesia provider. Patients in each ASA classification were most likely to receive anesthesia care via Model 1. As ASA level increased, fewer patients had their anesthesia managed by a CRNA without supervision (Model 3: 18.4% of ASA 1 patients vs 8.3% of ASA 4 patients).
Facility complexity demonstrated notable differences in the proportions of surgical cases within each model. More than half of surgical cases in the largest, most complex facilities used Model 1 (64.9%, 58.2%, and 57.7% of cases in 1a, 1b, and 1c facilities, respectively). In comparison, Model 3 was found almost exclusively among surgical cases in smaller facilities with lower complexity (52% and 74% of cases in level 2 and 3 facilities, respectively).
The Figure displays the 125 facilities by their predominant model of anesthesia care. The diameter of the dots is relative to the facility’s total number of surgical cases. For each facility, the predominant model accounted for about half or more of cases but was not necessarily the only model of care used at a particular facility. 
Related: Initiative to Minimize Pharmaceutical Risk in Older Veterans (IMPROVE) Polypharmacy Clinic
Discussion
Anesthesia care in more than half of surgical cases in VHA facilities was delivered by physician anesthesiologists supervising CRNAs. This model of anesthesia care was the dominant model in 54% of the facilities included in the sample. Consistent with a study of non-VHA facilities, this assessment found that the type of facility may influence the model of anesthesia care, with smaller, less complex facilities more often using a CRNA without supervision model.4 In these data, it was noted that among the 28 facilities that predominantly used Model 3, half had 12% or fewer cases that indicated a physician anesthesiologist model of care, and 6 had no cases with physician anesthesiologist involvement. These findings may reflect the limited scope of surgical services offered at lower complexity facilities and/or the reduced availability and/or utilization of physician anesthesiologists in these facilities.
Limitations
We recognize limitations in our assessment of anesthesia care. The documented presence or absence of a supervising anesthesia provider on the surgical record may not adequately characterize the model of anesthesia care in use at a facility, thus limiting an understanding of care delivery relationships among anesthesia providers. In addition, the patterns of anesthesia care delivery are likely influenced by factors not accounted for in this assessment, including the labor market share and economic forces.16,17 The veteran population tends to be older, male, and with substantial chronic disease burden, thus may have differing surgical needs and experiences than that of the general public.18,19 The surgical services offered in VHA facilities as well as the policies and practice environment surrounding anesthesia care also may vary from those found in nongovernmental facilities. However, as the largest health care system in the US, the VHA provides a diverse and robust surgical program. Many VHA facilities are large teaching hospitals with academic affiliations that would parallel some in the public sector. For example, studies have demonstrated similar surgical outcomes for patients in VHA vs non-VHA facilities.20 Therefore, the findings regarding anesthesia care models in VHA are likely relevant to non-VHA surgical sites.
Related: Improving Team-Based Care Coordination Delivery and Documentation in the Health Record
Conclusion
This preliminary assessment of the different models of anesthesia care demonstrates that although primarily relying on teams of anesthesiologists and CRNAs, the VA also uses unsupervised CRNAs to meet veterans’ surgical care needs. Although CRNA practice without supervision represented only 12% of surgical cases in our data, we identified 28 facilities (22%) that predominantly used CRNAs without supervision. Thus, CRNAs with and without supervision deliver a substantial portion of anesthesia care in the VA. The prevalence of CRNAs in documented VA surgical records and among surgical facilities nationwide highlights the importance of further examining their supervised and unsupervised roles in anesthesia care delivery.21 As the practice of anesthesiology continues to evolve, it is imperative that research efforts further investigate ways anesthesia care models may optimize care delivery, benefit anesthesia providers, and improve health outcomes for patients.
1. Dulisse B, Cromwell J. No harm found when nurse anesthetists work without supervision by physicians. Health Aff (Millwood). 2010;29(8):1469-1475
2. Simonson DC, Ahern MM, Hendryx MS. Anesthesia staffing and anesthetic complications during cesarean delivery: a retrospective analysis. Nurs Res. 2007;56(1):9-17.
3. Smith AF, Kane M, Milne R. Comparative effectiveness and safety of physician and nurse anaesthetists: a narrative systematic review. Br J Anaesth. 2004;93(4):540-545.
4. Needleman J, Minnick AF. Anesthesia provider model, hospital resources, and maternal outcomes. Health Serv Res. 2009;44(2, pt 1):464-482.
5. Lewis SR, Nicholson A, Smith AF, Alderson P. Physician anaesthetists versus non-physician providers of anaesthesia for surgical patients. Cochrane Database Syst Rev. 2014(7):CD010357.
6. Silber JH, Kennedy SK, Even-Shoshan O, et al. Anesthesiologist direction and patient outcomes. Anesthesiology. 2000;93(1):152-163.
7. Negrusa B, Hogan PF, Warner JT, Schroeder CH, Pang B. Scope of practice laws and anesthesia complications: no measurable impact of certified registered nurse anesthetist expanded scope of practice on anesthesia-related complications. Med Care. 2016;54(10):913-920.
8. Prielipp RC, Cohen NH. The future of anesthesiology: implications of the changing healthcare environment. Curr Opin Anaesthesiol. 2016;29(2):198-205.
9. Memtsoudis SG, Ma Y, Swamidoss CP, Edwards AM, Mazumdar M, Liguori GA. Factors influencing unexpected disposition after orthopedic ambulatory surgery. J Clin Anesth. 2012;24(2):89-95.
10. von Elm E, Altman DG, Egger M, Pocock SJ, Gøtzsche PC, Vandenbroucke JP. The Strengthening the Reporting of Observational Studies in Epidemiology (STROBE) statement: guidelines for reporting observational studies. J Clin Epid. 2008;61:344-349.
11. US Department of Veterans Affairs, Veterans Health Administration, Office of Productivity Efficiency & Staffing. Facility Complexity Levels. http://opes.vssc.med.va.gov/FacilityComplexityLevels/Pages/default.aspx. [Nonpublic document; source not verified.
13. Mathis MR, Sathishkumar S, Kheterpal S, et al. Complications, risk factors, and staffing patterns for noncardiac surgery in patients with left ventricular assist devices. Anesthesiology. 2017;126(3):450-460.
14. Chen Y, Gabriel RA, Kodali BS, Urman RD. Effect of anesthesia staffing ratio on first-case surgical start time. J Med Syst. 2016;40(5):115.
15. American Society of Anesthesiologists. Standards, guidelines and related resources. https://www.asahq.org/standards-and-guidelines/asa-physical-status-classification-system. Published October 15, 2014. Accessed November 5, 2018.
16. Kalist DE, Molinari NA, Spurr SJ. Cooperation and conflict between very similar occupations: the case of anesthesia. Health Econ Policy Law. 2011;6(2):237-264.
17. Daugherty L, Fonseca R, Kumar KB, Michaud PC. An analysis of the labor markets for anesthesiology. Rand Health Q. 2011;1(3):18.
18. Yu W, Ravelo A, Wagner TH, et al. Prevalence and costs of chronic conditions in the VA health care system. Med Care Res Rev. 2003;60(suppl 3):146S-167S.
19. Yoon J, Scott JY, Phibbs CS, Wagner TH. Recent trends in Veterans Affairs chronic condition spending. Popul Health Manag. 2011;14(6):293-298.
20. Shekelle PG, Asch S, Glassman P, Matula S, Trivedi A, Miake-Lye I. Comparison of Quality of Care in VA and Non-VA Settings: A Systematic Review. VA Evidence-based Synthesis Program. Washington, DC: Department of Veterans Affairs; 2010.
21. Baird M, Daugherty L, Kumar KB, Arifkhanova A. Regional and gender differences and trends in the anesthesiologist workforce. Anesthesiology. 2015;123(5):997-1012.
Although the VHA primarily relies on teams for anesthesia care, unsupervised certified registered nurse anesthetists also are used to meet veterans’ surgical care needs.
Although the VHA primarily relies on teams for anesthesia care, unsupervised certified registered nurse anesthetists also are used to meet veterans’ surgical care needs.
Anesthesia care is provided by physician anesthesiologists, certified registered nurse anesthetists (CRNAs), anesthesiology residents, and anesthesiologist assistants. These providers may practice alone (anesthesiologists or CRNAs) or in various combinations of supervised roles and teams. Previous studies reveal mixed findings regarding whether patient outcomes differ by anesthesia practice models.1-7However, little is known about the prevalence of various anesthesia models in the US.
Background
In recent years, anesthesiology has undergone substantial expansion in its scope of services provided, the settings in which it is provided, and the diversity of its workforce.8As the field continues to evolve, especially within the context of value-based health care reform, it is imperative to evaluate how anesthesia care models are used in health systems and how these models may optimize care delivery.
The Veterans Health Administration (VHA) is the largest integrated health care system in the US, providing surgical care in 110 inpatient medical centers and 27 ambulatory surgery centers. Despite national integration, anesthesia practices vary widely among facilities. The question of which model of anesthesia care is associated with the best outcomes and offers the most value is widely debated.1,5,7,9 As an important first step in understanding anesthesia care delivery, a baseline assessment of the practice patterns of anesthesia providers is necessary and may benefit future studies of the impact of these care models on outcomes. Thus, the aim of this work was to understand and describe the previously unassessed landscape of anesthesia care delivery within the VHA.
Methods
As part of a larger evaluation of anesthesia care delivery in the VHA, an observational assessment of anesthesia provider practice patterns was conducted using retrospective surgical data. This project complies with VHA policy pertaining to nonresearch operational activities and did not require institutional review board approval and adheres to the EQUATOR Network guidelines described in Strengthening the Reporting of Observational Studies in Epidemiology (STROBE).10
Data were obtained from the VHA Managerial Cost Accounting National Data Extract for Surgery package for all surgical procedures (n = 726,706) between October 1, 2013 and March 31, 2015. There were 420 facilities represented in these surgical data. The VHA facility records were used to specifically identify inpatient and ambulatory surgery facilities for inclusion. Additionally, to ensure facilities were valid surgical sites with sufficient surgical volume, those with 100 or fewer cases during the period were excluded. In total, 288 facilities with 9,434 surgical cases (representing 1% of cases) were excluded. These excluded facilities included nursing homes (38%), domiciliaries (26%), outpatient clinics (11%), rehabilitation programs (9%), other nonsurgical facilities (8%), and medical centers (8%). The majority (80%) of excluded medical centers had 30 or fewer surgical cases.
In 6 instances, data from subfacilities were combined with their organizationally affiliated main facilities. The final sample included 125 facilities. The VHA assigns a complexity level designation to facilities, defined as follows: 1a (most complex), 1b, 1c, 2, and 3 (least complex).11 Facilities with 1a designation perform the most complex surgical cases, such as cardiovascular surgery or neurosurgery and have more staff and resource support, whereas levels 2 and 3 facilities perform fewer and less complex cases.
Surgical records were excluded when the primary Current Procedural Terminology (CPT) code was missing (n = 85,748, or 12% of cases). This resulted in 631,524 remaining cases. The surgical CPT codes were mapped to anesthesia CPT codes to obtain the associated base unit (BU) values via a published crosswalk by the American Society of Anesthesiologists (ASA).12 A higher number of associated BUs indicates a more complex procedure. For example, procedures such as biopsies, arthroscopies, and laparoscopies receive 3 to 4 BUs, whereas a venous thrombectomy of the leg and a transurethral resection of the prostate are both 5 BUs, a total knee arthroplasty is 7 BUs, a craniotomy is 10 BUs, and a coronary artery bypass receives 18 BUs. Surgical case complexity was defined as low (3 or 4 BUs), medium (5 BUs), and high (≥ 6 BUs). Although the VHA has an existing case complexity assignment process based on CPT codes, it defines complexity differently for inpatient facilities and ambulatory surgery centers. Thus, the BU-defined complexity permitted a standardized complexity categorization across all facilities. Categorization of BUs similar to this has previously been used in the literature as a proxy for case complexity.13,14
Patient-level information included the ASA physical status classification, a measure of overall health status determined by an anesthesia provider preoperatively.15 These classifications included ASA I (healthy), ASA II (mild systemic disease), ASA III (severe systemic disease), ASA IV (severe systemic disease that is a constant threat to life), and ASA V (moribund patient who is not expected to survive without surgery). The last classification, ASA VI: brain-dead with planned organ donation, was excluded. The “E” subcategory denoting “emergency” was subsumed within the corresponding ASA category (eg, ASA V-E was combined with ASA V).
Provider data identified the principal and supervising (if present) anesthetists involved in the case. The provision of anesthesia care was categorized into 3 models: Model 1—a physician anesthesiologist supervising a CRNA; Model 2—a physician anesthesiologist practicing independently or supervising an anesthesiology resident; and Model 3—a CRNA without supervision. Surgical cases were excluded when there was no anesthesia provider (n = 95,795, or 15% of remaining cases), or a nonanesthesia provider (n = 51,647, or 8% of remaining cases) on record. The final sample was 484,082 surgical cases conducted at 125 facilities.
Related: Improving Care and Reducing Length of Stay in Patients Undergoing Total Knee Replacement
Statistical Analysis
The percentage of surgical cases in each anesthesia care model was calculated overall and by the following characteristics: surgical case complexity, ASA classification, and facility complexity. The anesthesia model was determined for each case and summed at the facility level, yielding a total number of cases attributed to each model for each facility, thus identifying the predominant anesthesia model for each facility. The facilities were geographically displayed by their predominant anesthesia model and total number of surgical cases during the period. Because the aim was to present a descriptive representation of anesthesia care models, rather than infer significance, statistical testing was not included.
Results
A total of 484,082 surgical cases met inclusion criteria (Table). These cases were from 109 inpatient facilities and 16 ambulatory surgery facilities.
The percentage of cases in Model 1 was similar across the levels of surgical case complexity. However, a higher proportion of highly complex cases had a physician anesthesiologist (Model 2, 38.8%) than a CRNA (Model 3, 6.4%) as the primary anesthesia provider. Patients in each ASA classification were most likely to receive anesthesia care via Model 1. As ASA level increased, fewer patients had their anesthesia managed by a CRNA without supervision (Model 3: 18.4% of ASA 1 patients vs 8.3% of ASA 4 patients).
Facility complexity demonstrated notable differences in the proportions of surgical cases within each model. More than half of surgical cases in the largest, most complex facilities used Model 1 (64.9%, 58.2%, and 57.7% of cases in 1a, 1b, and 1c facilities, respectively). In comparison, Model 3 was found almost exclusively among surgical cases in smaller facilities with lower complexity (52% and 74% of cases in level 2 and 3 facilities, respectively).
The Figure displays the 125 facilities by their predominant model of anesthesia care. The diameter of the dots is relative to the facility’s total number of surgical cases. For each facility, the predominant model accounted for about half or more of cases but was not necessarily the only model of care used at a particular facility.
Related: Initiative to Minimize Pharmaceutical Risk in Older Veterans (IMPROVE) Polypharmacy Clinic
Discussion
Anesthesia care in more than half of surgical cases in VHA facilities was delivered by physician anesthesiologists supervising CRNAs. This model of anesthesia care was the dominant model in 54% of the facilities included in the sample. Consistent with a study of non-VHA facilities, this assessment found that the type of facility may influence the model of anesthesia care, with smaller, less complex facilities more often using a CRNA without supervision model.4 In these data, it was noted that among the 28 facilities that predominantly used Model 3, half had 12% or fewer cases that indicated a physician anesthesiologist model of care, and 6 had no cases with physician anesthesiologist involvement. These findings may reflect the limited scope of surgical services offered at lower complexity facilities and/or the reduced availability and/or utilization of physician anesthesiologists in these facilities.
Limitations
We recognize limitations in our assessment of anesthesia care. The documented presence or absence of a supervising anesthesia provider on the surgical record may not adequately characterize the model of anesthesia care in use at a facility, thus limiting an understanding of care delivery relationships among anesthesia providers. In addition, the patterns of anesthesia care delivery are likely influenced by factors not accounted for in this assessment, including the labor market share and economic forces.16,17 The veteran population tends to be older, male, and with substantial chronic disease burden, thus may have differing surgical needs and experiences than that of the general public.18,19 The surgical services offered in VHA facilities as well as the policies and practice environment surrounding anesthesia care also may vary from those found in nongovernmental facilities. However, as the largest health care system in the US, the VHA provides a diverse and robust surgical program. Many VHA facilities are large teaching hospitals with academic affiliations that would parallel some in the public sector. For example, studies have demonstrated similar surgical outcomes for patients in VHA vs non-VHA facilities.20 Therefore, the findings regarding anesthesia care models in VHA are likely relevant to non-VHA surgical sites.
Related: Improving Team-Based Care Coordination Delivery and Documentation in the Health Record
Conclusion
This preliminary assessment of the different models of anesthesia care demonstrates that although primarily relying on teams of anesthesiologists and CRNAs, the VA also uses unsupervised CRNAs to meet veterans’ surgical care needs. Although CRNA practice without supervision represented only 12% of surgical cases in our data, we identified 28 facilities (22%) that predominantly used CRNAs without supervision. Thus, CRNAs with and without supervision deliver a substantial portion of anesthesia care in the VA. The prevalence of CRNAs in documented VA surgical records and among surgical facilities nationwide highlights the importance of further examining their supervised and unsupervised roles in anesthesia care delivery.21 As the practice of anesthesiology continues to evolve, it is imperative that research efforts further investigate ways anesthesia care models may optimize care delivery, benefit anesthesia providers, and improve health outcomes for patients.
Anesthesia care is provided by physician anesthesiologists, certified registered nurse anesthetists (CRNAs), anesthesiology residents, and anesthesiologist assistants. These providers may practice alone (anesthesiologists or CRNAs) or in various combinations of supervised roles and teams. Previous studies reveal mixed findings regarding whether patient outcomes differ by anesthesia practice models.1-7However, little is known about the prevalence of various anesthesia models in the US.
Background
In recent years, anesthesiology has undergone substantial expansion in its scope of services provided, the settings in which it is provided, and the diversity of its workforce.8As the field continues to evolve, especially within the context of value-based health care reform, it is imperative to evaluate how anesthesia care models are used in health systems and how these models may optimize care delivery.
The Veterans Health Administration (VHA) is the largest integrated health care system in the US, providing surgical care in 110 inpatient medical centers and 27 ambulatory surgery centers. Despite national integration, anesthesia practices vary widely among facilities. The question of which model of anesthesia care is associated with the best outcomes and offers the most value is widely debated.1,5,7,9 As an important first step in understanding anesthesia care delivery, a baseline assessment of the practice patterns of anesthesia providers is necessary and may benefit future studies of the impact of these care models on outcomes. Thus, the aim of this work was to understand and describe the previously unassessed landscape of anesthesia care delivery within the VHA.
Methods
As part of a larger evaluation of anesthesia care delivery in the VHA, an observational assessment of anesthesia provider practice patterns was conducted using retrospective surgical data. This project complies with VHA policy pertaining to nonresearch operational activities and did not require institutional review board approval and adheres to the EQUATOR Network guidelines described in Strengthening the Reporting of Observational Studies in Epidemiology (STROBE).10
Data were obtained from the VHA Managerial Cost Accounting National Data Extract for Surgery package for all surgical procedures (n = 726,706) between October 1, 2013 and March 31, 2015. There were 420 facilities represented in these surgical data. The VHA facility records were used to specifically identify inpatient and ambulatory surgery facilities for inclusion. Additionally, to ensure facilities were valid surgical sites with sufficient surgical volume, those with 100 or fewer cases during the period were excluded. In total, 288 facilities with 9,434 surgical cases (representing 1% of cases) were excluded. These excluded facilities included nursing homes (38%), domiciliaries (26%), outpatient clinics (11%), rehabilitation programs (9%), other nonsurgical facilities (8%), and medical centers (8%). The majority (80%) of excluded medical centers had 30 or fewer surgical cases.
In 6 instances, data from subfacilities were combined with their organizationally affiliated main facilities. The final sample included 125 facilities. The VHA assigns a complexity level designation to facilities, defined as follows: 1a (most complex), 1b, 1c, 2, and 3 (least complex).11 Facilities with 1a designation perform the most complex surgical cases, such as cardiovascular surgery or neurosurgery and have more staff and resource support, whereas levels 2 and 3 facilities perform fewer and less complex cases.
Surgical records were excluded when the primary Current Procedural Terminology (CPT) code was missing (n = 85,748, or 12% of cases). This resulted in 631,524 remaining cases. The surgical CPT codes were mapped to anesthesia CPT codes to obtain the associated base unit (BU) values via a published crosswalk by the American Society of Anesthesiologists (ASA).12 A higher number of associated BUs indicates a more complex procedure. For example, procedures such as biopsies, arthroscopies, and laparoscopies receive 3 to 4 BUs, whereas a venous thrombectomy of the leg and a transurethral resection of the prostate are both 5 BUs, a total knee arthroplasty is 7 BUs, a craniotomy is 10 BUs, and a coronary artery bypass receives 18 BUs. Surgical case complexity was defined as low (3 or 4 BUs), medium (5 BUs), and high (≥ 6 BUs). Although the VHA has an existing case complexity assignment process based on CPT codes, it defines complexity differently for inpatient facilities and ambulatory surgery centers. Thus, the BU-defined complexity permitted a standardized complexity categorization across all facilities. Categorization of BUs similar to this has previously been used in the literature as a proxy for case complexity.13,14
Patient-level information included the ASA physical status classification, a measure of overall health status determined by an anesthesia provider preoperatively.15 These classifications included ASA I (healthy), ASA II (mild systemic disease), ASA III (severe systemic disease), ASA IV (severe systemic disease that is a constant threat to life), and ASA V (moribund patient who is not expected to survive without surgery). The last classification, ASA VI: brain-dead with planned organ donation, was excluded. The “E” subcategory denoting “emergency” was subsumed within the corresponding ASA category (eg, ASA V-E was combined with ASA V).
Provider data identified the principal and supervising (if present) anesthetists involved in the case. The provision of anesthesia care was categorized into 3 models: Model 1—a physician anesthesiologist supervising a CRNA; Model 2—a physician anesthesiologist practicing independently or supervising an anesthesiology resident; and Model 3—a CRNA without supervision. Surgical cases were excluded when there was no anesthesia provider (n = 95,795, or 15% of remaining cases), or a nonanesthesia provider (n = 51,647, or 8% of remaining cases) on record. The final sample was 484,082 surgical cases conducted at 125 facilities.
Related: Improving Care and Reducing Length of Stay in Patients Undergoing Total Knee Replacement
Statistical Analysis
The percentage of surgical cases in each anesthesia care model was calculated overall and by the following characteristics: surgical case complexity, ASA classification, and facility complexity. The anesthesia model was determined for each case and summed at the facility level, yielding a total number of cases attributed to each model for each facility, thus identifying the predominant anesthesia model for each facility. The facilities were geographically displayed by their predominant anesthesia model and total number of surgical cases during the period. Because the aim was to present a descriptive representation of anesthesia care models, rather than infer significance, statistical testing was not included.
Results
A total of 484,082 surgical cases met inclusion criteria (Table). These cases were from 109 inpatient facilities and 16 ambulatory surgery facilities.
The percentage of cases in Model 1 was similar across the levels of surgical case complexity. However, a higher proportion of highly complex cases had a physician anesthesiologist (Model 2, 38.8%) than a CRNA (Model 3, 6.4%) as the primary anesthesia provider. Patients in each ASA classification were most likely to receive anesthesia care via Model 1. As ASA level increased, fewer patients had their anesthesia managed by a CRNA without supervision (Model 3: 18.4% of ASA 1 patients vs 8.3% of ASA 4 patients).
Facility complexity demonstrated notable differences in the proportions of surgical cases within each model. More than half of surgical cases in the largest, most complex facilities used Model 1 (64.9%, 58.2%, and 57.7% of cases in 1a, 1b, and 1c facilities, respectively). In comparison, Model 3 was found almost exclusively among surgical cases in smaller facilities with lower complexity (52% and 74% of cases in level 2 and 3 facilities, respectively).
The Figure displays the 125 facilities by their predominant model of anesthesia care. The diameter of the dots is relative to the facility’s total number of surgical cases. For each facility, the predominant model accounted for about half or more of cases but was not necessarily the only model of care used at a particular facility.
Related: Initiative to Minimize Pharmaceutical Risk in Older Veterans (IMPROVE) Polypharmacy Clinic
Discussion
Anesthesia care in more than half of surgical cases in VHA facilities was delivered by physician anesthesiologists supervising CRNAs. This model of anesthesia care was the dominant model in 54% of the facilities included in the sample. Consistent with a study of non-VHA facilities, this assessment found that the type of facility may influence the model of anesthesia care, with smaller, less complex facilities more often using a CRNA without supervision model.4 In these data, it was noted that among the 28 facilities that predominantly used Model 3, half had 12% or fewer cases that indicated a physician anesthesiologist model of care, and 6 had no cases with physician anesthesiologist involvement. These findings may reflect the limited scope of surgical services offered at lower complexity facilities and/or the reduced availability and/or utilization of physician anesthesiologists in these facilities.
Limitations
We recognize limitations in our assessment of anesthesia care. The documented presence or absence of a supervising anesthesia provider on the surgical record may not adequately characterize the model of anesthesia care in use at a facility, thus limiting an understanding of care delivery relationships among anesthesia providers. In addition, the patterns of anesthesia care delivery are likely influenced by factors not accounted for in this assessment, including the labor market share and economic forces.16,17 The veteran population tends to be older, male, and with substantial chronic disease burden, thus may have differing surgical needs and experiences than that of the general public.18,19 The surgical services offered in VHA facilities as well as the policies and practice environment surrounding anesthesia care also may vary from those found in nongovernmental facilities. However, as the largest health care system in the US, the VHA provides a diverse and robust surgical program. Many VHA facilities are large teaching hospitals with academic affiliations that would parallel some in the public sector. For example, studies have demonstrated similar surgical outcomes for patients in VHA vs non-VHA facilities.20 Therefore, the findings regarding anesthesia care models in VHA are likely relevant to non-VHA surgical sites.
Related: Improving Team-Based Care Coordination Delivery and Documentation in the Health Record
Conclusion
This preliminary assessment of the different models of anesthesia care demonstrates that although primarily relying on teams of anesthesiologists and CRNAs, the VA also uses unsupervised CRNAs to meet veterans’ surgical care needs. Although CRNA practice without supervision represented only 12% of surgical cases in our data, we identified 28 facilities (22%) that predominantly used CRNAs without supervision. Thus, CRNAs with and without supervision deliver a substantial portion of anesthesia care in the VA. The prevalence of CRNAs in documented VA surgical records and among surgical facilities nationwide highlights the importance of further examining their supervised and unsupervised roles in anesthesia care delivery.21 As the practice of anesthesiology continues to evolve, it is imperative that research efforts further investigate ways anesthesia care models may optimize care delivery, benefit anesthesia providers, and improve health outcomes for patients.
1. Dulisse B, Cromwell J. No harm found when nurse anesthetists work without supervision by physicians. Health Aff (Millwood). 2010;29(8):1469-1475
2. Simonson DC, Ahern MM, Hendryx MS. Anesthesia staffing and anesthetic complications during cesarean delivery: a retrospective analysis. Nurs Res. 2007;56(1):9-17.
3. Smith AF, Kane M, Milne R. Comparative effectiveness and safety of physician and nurse anaesthetists: a narrative systematic review. Br J Anaesth. 2004;93(4):540-545.
4. Needleman J, Minnick AF. Anesthesia provider model, hospital resources, and maternal outcomes. Health Serv Res. 2009;44(2, pt 1):464-482.
5. Lewis SR, Nicholson A, Smith AF, Alderson P. Physician anaesthetists versus non-physician providers of anaesthesia for surgical patients. Cochrane Database Syst Rev. 2014(7):CD010357.
6. Silber JH, Kennedy SK, Even-Shoshan O, et al. Anesthesiologist direction and patient outcomes. Anesthesiology. 2000;93(1):152-163.
7. Negrusa B, Hogan PF, Warner JT, Schroeder CH, Pang B. Scope of practice laws and anesthesia complications: no measurable impact of certified registered nurse anesthetist expanded scope of practice on anesthesia-related complications. Med Care. 2016;54(10):913-920.
8. Prielipp RC, Cohen NH. The future of anesthesiology: implications of the changing healthcare environment. Curr Opin Anaesthesiol. 2016;29(2):198-205.
9. Memtsoudis SG, Ma Y, Swamidoss CP, Edwards AM, Mazumdar M, Liguori GA. Factors influencing unexpected disposition after orthopedic ambulatory surgery. J Clin Anesth. 2012;24(2):89-95.
10. von Elm E, Altman DG, Egger M, Pocock SJ, Gøtzsche PC, Vandenbroucke JP. The Strengthening the Reporting of Observational Studies in Epidemiology (STROBE) statement: guidelines for reporting observational studies. J Clin Epid. 2008;61:344-349.
11. US Department of Veterans Affairs, Veterans Health Administration, Office of Productivity Efficiency & Staffing. Facility Complexity Levels. http://opes.vssc.med.va.gov/FacilityComplexityLevels/Pages/default.aspx. [Nonpublic document; source not verified.
13. Mathis MR, Sathishkumar S, Kheterpal S, et al. Complications, risk factors, and staffing patterns for noncardiac surgery in patients with left ventricular assist devices. Anesthesiology. 2017;126(3):450-460.
14. Chen Y, Gabriel RA, Kodali BS, Urman RD. Effect of anesthesia staffing ratio on first-case surgical start time. J Med Syst. 2016;40(5):115.
15. American Society of Anesthesiologists. Standards, guidelines and related resources. https://www.asahq.org/standards-and-guidelines/asa-physical-status-classification-system. Published October 15, 2014. Accessed November 5, 2018.
16. Kalist DE, Molinari NA, Spurr SJ. Cooperation and conflict between very similar occupations: the case of anesthesia. Health Econ Policy Law. 2011;6(2):237-264.
17. Daugherty L, Fonseca R, Kumar KB, Michaud PC. An analysis of the labor markets for anesthesiology. Rand Health Q. 2011;1(3):18.
18. Yu W, Ravelo A, Wagner TH, et al. Prevalence and costs of chronic conditions in the VA health care system. Med Care Res Rev. 2003;60(suppl 3):146S-167S.
19. Yoon J, Scott JY, Phibbs CS, Wagner TH. Recent trends in Veterans Affairs chronic condition spending. Popul Health Manag. 2011;14(6):293-298.
20. Shekelle PG, Asch S, Glassman P, Matula S, Trivedi A, Miake-Lye I. Comparison of Quality of Care in VA and Non-VA Settings: A Systematic Review. VA Evidence-based Synthesis Program. Washington, DC: Department of Veterans Affairs; 2010.
21. Baird M, Daugherty L, Kumar KB, Arifkhanova A. Regional and gender differences and trends in the anesthesiologist workforce. Anesthesiology. 2015;123(5):997-1012.
1. Dulisse B, Cromwell J. No harm found when nurse anesthetists work without supervision by physicians. Health Aff (Millwood). 2010;29(8):1469-1475
2. Simonson DC, Ahern MM, Hendryx MS. Anesthesia staffing and anesthetic complications during cesarean delivery: a retrospective analysis. Nurs Res. 2007;56(1):9-17.
3. Smith AF, Kane M, Milne R. Comparative effectiveness and safety of physician and nurse anaesthetists: a narrative systematic review. Br J Anaesth. 2004;93(4):540-545.
4. Needleman J, Minnick AF. Anesthesia provider model, hospital resources, and maternal outcomes. Health Serv Res. 2009;44(2, pt 1):464-482.
5. Lewis SR, Nicholson A, Smith AF, Alderson P. Physician anaesthetists versus non-physician providers of anaesthesia for surgical patients. Cochrane Database Syst Rev. 2014(7):CD010357.
6. Silber JH, Kennedy SK, Even-Shoshan O, et al. Anesthesiologist direction and patient outcomes. Anesthesiology. 2000;93(1):152-163.
7. Negrusa B, Hogan PF, Warner JT, Schroeder CH, Pang B. Scope of practice laws and anesthesia complications: no measurable impact of certified registered nurse anesthetist expanded scope of practice on anesthesia-related complications. Med Care. 2016;54(10):913-920.
8. Prielipp RC, Cohen NH. The future of anesthesiology: implications of the changing healthcare environment. Curr Opin Anaesthesiol. 2016;29(2):198-205.
9. Memtsoudis SG, Ma Y, Swamidoss CP, Edwards AM, Mazumdar M, Liguori GA. Factors influencing unexpected disposition after orthopedic ambulatory surgery. J Clin Anesth. 2012;24(2):89-95.
10. von Elm E, Altman DG, Egger M, Pocock SJ, Gøtzsche PC, Vandenbroucke JP. The Strengthening the Reporting of Observational Studies in Epidemiology (STROBE) statement: guidelines for reporting observational studies. J Clin Epid. 2008;61:344-349.
11. US Department of Veterans Affairs, Veterans Health Administration, Office of Productivity Efficiency & Staffing. Facility Complexity Levels. http://opes.vssc.med.va.gov/FacilityComplexityLevels/Pages/default.aspx. [Nonpublic document; source not verified.
13. Mathis MR, Sathishkumar S, Kheterpal S, et al. Complications, risk factors, and staffing patterns for noncardiac surgery in patients with left ventricular assist devices. Anesthesiology. 2017;126(3):450-460.
14. Chen Y, Gabriel RA, Kodali BS, Urman RD. Effect of anesthesia staffing ratio on first-case surgical start time. J Med Syst. 2016;40(5):115.
15. American Society of Anesthesiologists. Standards, guidelines and related resources. https://www.asahq.org/standards-and-guidelines/asa-physical-status-classification-system. Published October 15, 2014. Accessed November 5, 2018.
16. Kalist DE, Molinari NA, Spurr SJ. Cooperation and conflict between very similar occupations: the case of anesthesia. Health Econ Policy Law. 2011;6(2):237-264.
17. Daugherty L, Fonseca R, Kumar KB, Michaud PC. An analysis of the labor markets for anesthesiology. Rand Health Q. 2011;1(3):18.
18. Yu W, Ravelo A, Wagner TH, et al. Prevalence and costs of chronic conditions in the VA health care system. Med Care Res Rev. 2003;60(suppl 3):146S-167S.
19. Yoon J, Scott JY, Phibbs CS, Wagner TH. Recent trends in Veterans Affairs chronic condition spending. Popul Health Manag. 2011;14(6):293-298.
20. Shekelle PG, Asch S, Glassman P, Matula S, Trivedi A, Miake-Lye I. Comparison of Quality of Care in VA and Non-VA Settings: A Systematic Review. VA Evidence-based Synthesis Program. Washington, DC: Department of Veterans Affairs; 2010.
21. Baird M, Daugherty L, Kumar KB, Arifkhanova A. Regional and gender differences and trends in the anesthesiologist workforce. Anesthesiology. 2015;123(5):997-1012.
What constitutes a clinically meaningful reduction in seizure frequency?
NEW ORLEANS – according to a study described at the annual meeting of the American Epilepsy Society. A reduction in seizure frequency of between 60% and 68% is associated with Clinical Global Impression of Improvement (CGI-I) ratings of “very much improved,” as assessed by caregivers and investigators.

“Further analyses from other phase III studies in Dravet syndrome and other patient populations should be performed to confirm these findings and explore other potential factors that contribute to caregiver and investigator CGI-I ratings, such as nonseizure outcomes and tolerability,” said Arnold Gammaitoni, PharmD, vice president of medical and scientific affairs at Zogenix in San Diego, and his colleagues.
A 50% reduction in seizure frequency is conventionally considered to be the cutoff for a clinically meaningful change. To develop an evidence-based definition of clinically meaningful seizure reduction, Dr. Gammaitoni and colleagues examined data from a phase III, randomized, double-blind, placebo-controlled trial of fenfluramine HCl oral solution for the adjunctive treatment of seizures associated with Dravet syndrome. The investigators took an anchor-based approach and examined the percentage change in seizure frequency, along with caregiver and investigator CGI-I ratings.
A total of 119 patients with Dravet syndrome were enrolled and randomized in equal groups to placebo, 0.2 mg/kg per day of fenfluramine HCl, or 0.8 mg/kg per day of fenfluramine HCl. After a 2-week titration period, patients entered a 12-week maintenance period. Patients in the 0.8-mg/kg per day group had a 63.9% greater reduction in seizure frequency than controls did.
After the 14-week titration and maintenance period, caregivers and investigators rated the change in participants’ clinical status from baseline, using the CGI-I scale, on which responses range from 1 (very much improved) to 7 (very much worse). The investigators considered patients with CGI-I scores of 1 or 2 (much improved) to have achieved a clinically meaningful response. A score of 3 (minimally improved) was not considered meaningful. The researchers pooled the results of the three treatment groups for this analysis. They estimated the clinically meaningful percentage change in seizure frequency using receiver operating characteristic analysis of binary CGI-I score, compared with percentage change in seizure frequency, and defined it as the cut-point for which specificity and sensitivity were equal or most similar.
Caregivers and investigators provided CGI-I assessments for 112 patients and 114 patients, respectively. The receiver operating characteristic analysis identified a 44% reduction in seizure frequency as a clinically meaningful cutoff point for caregiver and investigator assessments. Using this threshold, 75%, 46%, and 12.5% of patients in the 0.8-mg/kg per day, 0.2-mg/kg per day, and placebo groups, respectively, achieved a clinically meaningful reduction from baseline in seizure frequency in the phase III study.
“The use of external anchors is one method to define a clinically meaningful change in seizure frequency,” said Dr. Gammaitoni. “Having a defined minimum clinically important difference like this allows clinicians to assess impacts of treatments on an individual patient basis.... This is a chance for others to do similar types of analyses to confirm the findings that we have had in this first study with bigger data sets, in terms of using external anchors and data to define what a clinically meaningful change is.”
Zogenix, which is developing the fenfluramine formulation examined in this study, provided funding for this research.
SOURCE: Nabbout R et al. AES 2018, Abstract 3.202.
NEW ORLEANS – according to a study described at the annual meeting of the American Epilepsy Society. A reduction in seizure frequency of between 60% and 68% is associated with Clinical Global Impression of Improvement (CGI-I) ratings of “very much improved,” as assessed by caregivers and investigators.
“Further analyses from other phase III studies in Dravet syndrome and other patient populations should be performed to confirm these findings and explore other potential factors that contribute to caregiver and investigator CGI-I ratings, such as nonseizure outcomes and tolerability,” said Arnold Gammaitoni, PharmD, vice president of medical and scientific affairs at Zogenix in San Diego, and his colleagues.
A 50% reduction in seizure frequency is conventionally considered to be the cutoff for a clinically meaningful change. To develop an evidence-based definition of clinically meaningful seizure reduction, Dr. Gammaitoni and colleagues examined data from a phase III, randomized, double-blind, placebo-controlled trial of fenfluramine HCl oral solution for the adjunctive treatment of seizures associated with Dravet syndrome. The investigators took an anchor-based approach and examined the percentage change in seizure frequency, along with caregiver and investigator CGI-I ratings.
A total of 119 patients with Dravet syndrome were enrolled and randomized in equal groups to placebo, 0.2 mg/kg per day of fenfluramine HCl, or 0.8 mg/kg per day of fenfluramine HCl. After a 2-week titration period, patients entered a 12-week maintenance period. Patients in the 0.8-mg/kg per day group had a 63.9% greater reduction in seizure frequency than controls did.
After the 14-week titration and maintenance period, caregivers and investigators rated the change in participants’ clinical status from baseline, using the CGI-I scale, on which responses range from 1 (very much improved) to 7 (very much worse). The investigators considered patients with CGI-I scores of 1 or 2 (much improved) to have achieved a clinically meaningful response. A score of 3 (minimally improved) was not considered meaningful. The researchers pooled the results of the three treatment groups for this analysis. They estimated the clinically meaningful percentage change in seizure frequency using receiver operating characteristic analysis of binary CGI-I score, compared with percentage change in seizure frequency, and defined it as the cut-point for which specificity and sensitivity were equal or most similar.
Caregivers and investigators provided CGI-I assessments for 112 patients and 114 patients, respectively. The receiver operating characteristic analysis identified a 44% reduction in seizure frequency as a clinically meaningful cutoff point for caregiver and investigator assessments. Using this threshold, 75%, 46%, and 12.5% of patients in the 0.8-mg/kg per day, 0.2-mg/kg per day, and placebo groups, respectively, achieved a clinically meaningful reduction from baseline in seizure frequency in the phase III study.
“The use of external anchors is one method to define a clinically meaningful change in seizure frequency,” said Dr. Gammaitoni. “Having a defined minimum clinically important difference like this allows clinicians to assess impacts of treatments on an individual patient basis.... This is a chance for others to do similar types of analyses to confirm the findings that we have had in this first study with bigger data sets, in terms of using external anchors and data to define what a clinically meaningful change is.”
Zogenix, which is developing the fenfluramine formulation examined in this study, provided funding for this research.
SOURCE: Nabbout R et al. AES 2018, Abstract 3.202.
NEW ORLEANS – according to a study described at the annual meeting of the American Epilepsy Society. A reduction in seizure frequency of between 60% and 68% is associated with Clinical Global Impression of Improvement (CGI-I) ratings of “very much improved,” as assessed by caregivers and investigators.
“Further analyses from other phase III studies in Dravet syndrome and other patient populations should be performed to confirm these findings and explore other potential factors that contribute to caregiver and investigator CGI-I ratings, such as nonseizure outcomes and tolerability,” said Arnold Gammaitoni, PharmD, vice president of medical and scientific affairs at Zogenix in San Diego, and his colleagues.
A 50% reduction in seizure frequency is conventionally considered to be the cutoff for a clinically meaningful change. To develop an evidence-based definition of clinically meaningful seizure reduction, Dr. Gammaitoni and colleagues examined data from a phase III, randomized, double-blind, placebo-controlled trial of fenfluramine HCl oral solution for the adjunctive treatment of seizures associated with Dravet syndrome. The investigators took an anchor-based approach and examined the percentage change in seizure frequency, along with caregiver and investigator CGI-I ratings.
A total of 119 patients with Dravet syndrome were enrolled and randomized in equal groups to placebo, 0.2 mg/kg per day of fenfluramine HCl, or 0.8 mg/kg per day of fenfluramine HCl. After a 2-week titration period, patients entered a 12-week maintenance period. Patients in the 0.8-mg/kg per day group had a 63.9% greater reduction in seizure frequency than controls did.
After the 14-week titration and maintenance period, caregivers and investigators rated the change in participants’ clinical status from baseline, using the CGI-I scale, on which responses range from 1 (very much improved) to 7 (very much worse). The investigators considered patients with CGI-I scores of 1 or 2 (much improved) to have achieved a clinically meaningful response. A score of 3 (minimally improved) was not considered meaningful. The researchers pooled the results of the three treatment groups for this analysis. They estimated the clinically meaningful percentage change in seizure frequency using receiver operating characteristic analysis of binary CGI-I score, compared with percentage change in seizure frequency, and defined it as the cut-point for which specificity and sensitivity were equal or most similar.
Caregivers and investigators provided CGI-I assessments for 112 patients and 114 patients, respectively. The receiver operating characteristic analysis identified a 44% reduction in seizure frequency as a clinically meaningful cutoff point for caregiver and investigator assessments. Using this threshold, 75%, 46%, and 12.5% of patients in the 0.8-mg/kg per day, 0.2-mg/kg per day, and placebo groups, respectively, achieved a clinically meaningful reduction from baseline in seizure frequency in the phase III study.
“The use of external anchors is one method to define a clinically meaningful change in seizure frequency,” said Dr. Gammaitoni. “Having a defined minimum clinically important difference like this allows clinicians to assess impacts of treatments on an individual patient basis.... This is a chance for others to do similar types of analyses to confirm the findings that we have had in this first study with bigger data sets, in terms of using external anchors and data to define what a clinically meaningful change is.”
Zogenix, which is developing the fenfluramine formulation examined in this study, provided funding for this research.
SOURCE: Nabbout R et al. AES 2018, Abstract 3.202.
REPORTING FROM AES 2018
Key clinical point: Data support the convention of considering a 50% reduction in seizure frequency as the cutoff for a clinically meaningful change.
Major finding: Statistical analysis indicates that a 44% reduction in seizure frequency is clinically meaningful.
Study details: A phase III, randomized, double-blind, placebo-controlled clinical trial of fenfluramine HCl that included 119 patients.
Disclosures: Zogenix provided funding for the study.
Source: Nabbout R et al. Abstract 3.202.


Older CLL Patients See Better PFS With Ibrutinib
SAN DIEGO – In the phase 3 Alliance A041202 trial of older patients with previously untreated chronic lymphocytic leukemia (CLL), ibrutinib showed superior progression-free survival (PFS). Results of the trial were reported by Jennifer A. Woyach, MD, of the Ohio State University in Columbus during a press briefing at the recently concluded American Society of Hematology 2018 meeting. The briefing was based on an abstract from the meeting.
“There was no difference in progression-free survival between ibrutinib and ibrutinib plus rituximab,” said Dr. Woyach. “We undertook this study to determine the most effective therapy for older patients with CLL.” She noted that the findings justify the use of ibrutinib as a standard-of-care treatment for CLL patients aged 65 years and older.
Median age of patients in the study was 71 years and 67% of the patient were men, a profile that is similar, to those of patients with CLL seen at the US Department of Veterans Affairs.
The 2-year PFS was 74% in 183 patients randomized to receive standard chemoimmunotherapy with bendamustine and rituximab (BR), compared with 87% in 182 patients randomized to receive ibrutinib alone (hazard ratio, 0.39 vs. BR), and 88% in 182 patients who received ibrutinib and rituximab (IR; HR, 0.38 vs. BR). Median PFS in this study was 43 months in the BR arm, and was not reached in either of the ibrutinib-containing arms, she said. No significant differences in overall survival (OS) were seen among the treatment arms, which may have been because of short follow-up and the fact that patients in the BR arm were allowed to cross over to ibrutinib if they progressed on treatment.
The results suggest that the additional of rituximab provided little benefit to the patients though it does add to both the costs and the chair time in an infusion center, according to former Association of VA Hematology/Oncology Mary Thomas, MS, CNS, AOCN.
“I think this really does indicate that ibrutinib as front-line therapy, which many clinicians have been doing, is a very reasonable practice,” said David P. Steensma, MD, of Dana-Farber Cancer Institute in Boston, who moderated the press briefing.
Dr. Woyach added, however, that while ibrutinib represents a major therapeutic advance, its cost and its toxicities in older patients are a concern that warrant close monitoring and development of strategies to reduce the need for long-term continuous treatment.
Thomas agreed noting that health care providers needs to be aware of the risk of atrial fib and bleeding when using ibrutinib and to ensure that patient will be able to adhere to daily dosing.
Additional phase 3 studies set to open soon will compare ibrutinib in combination with venetoclax and obinutuzumab with standard ibrutinib.
Dr. Woyach and Ms. Thomas reported having no disclosures. Dr. Steensma reported receiving research funding from, and/or serving as a consultant, board member, or adviser for Takeda Pharmaceutical, Syros Pharmaceuticals, Otsuka Pharmaceutical, Onconova Therapeutics, Novartis, Kura Oncology, Janssen, H3 Biosciences, Celgene, Amphivena Therapeutics, and Acceleron Pharma.
SAN DIEGO – In the phase 3 Alliance A041202 trial of older patients with previously untreated chronic lymphocytic leukemia (CLL), ibrutinib showed superior progression-free survival (PFS). Results of the trial were reported by Jennifer A. Woyach, MD, of the Ohio State University in Columbus during a press briefing at the recently concluded American Society of Hematology 2018 meeting. The briefing was based on an abstract from the meeting.
“There was no difference in progression-free survival between ibrutinib and ibrutinib plus rituximab,” said Dr. Woyach. “We undertook this study to determine the most effective therapy for older patients with CLL.” She noted that the findings justify the use of ibrutinib as a standard-of-care treatment for CLL patients aged 65 years and older.
Median age of patients in the study was 71 years and 67% of the patient were men, a profile that is similar, to those of patients with CLL seen at the US Department of Veterans Affairs.
The 2-year PFS was 74% in 183 patients randomized to receive standard chemoimmunotherapy with bendamustine and rituximab (BR), compared with 87% in 182 patients randomized to receive ibrutinib alone (hazard ratio, 0.39 vs. BR), and 88% in 182 patients who received ibrutinib and rituximab (IR; HR, 0.38 vs. BR). Median PFS in this study was 43 months in the BR arm, and was not reached in either of the ibrutinib-containing arms, she said. No significant differences in overall survival (OS) were seen among the treatment arms, which may have been because of short follow-up and the fact that patients in the BR arm were allowed to cross over to ibrutinib if they progressed on treatment.
The results suggest that the additional of rituximab provided little benefit to the patients though it does add to both the costs and the chair time in an infusion center, according to former Association of VA Hematology/Oncology Mary Thomas, MS, CNS, AOCN.
“I think this really does indicate that ibrutinib as front-line therapy, which many clinicians have been doing, is a very reasonable practice,” said David P. Steensma, MD, of Dana-Farber Cancer Institute in Boston, who moderated the press briefing.
Dr. Woyach added, however, that while ibrutinib represents a major therapeutic advance, its cost and its toxicities in older patients are a concern that warrant close monitoring and development of strategies to reduce the need for long-term continuous treatment.
Thomas agreed noting that health care providers needs to be aware of the risk of atrial fib and bleeding when using ibrutinib and to ensure that patient will be able to adhere to daily dosing.
Additional phase 3 studies set to open soon will compare ibrutinib in combination with venetoclax and obinutuzumab with standard ibrutinib.
Dr. Woyach and Ms. Thomas reported having no disclosures. Dr. Steensma reported receiving research funding from, and/or serving as a consultant, board member, or adviser for Takeda Pharmaceutical, Syros Pharmaceuticals, Otsuka Pharmaceutical, Onconova Therapeutics, Novartis, Kura Oncology, Janssen, H3 Biosciences, Celgene, Amphivena Therapeutics, and Acceleron Pharma.
SAN DIEGO – In the phase 3 Alliance A041202 trial of older patients with previously untreated chronic lymphocytic leukemia (CLL), ibrutinib showed superior progression-free survival (PFS). Results of the trial were reported by Jennifer A. Woyach, MD, of the Ohio State University in Columbus during a press briefing at the recently concluded American Society of Hematology 2018 meeting. The briefing was based on an abstract from the meeting.
“There was no difference in progression-free survival between ibrutinib and ibrutinib plus rituximab,” said Dr. Woyach. “We undertook this study to determine the most effective therapy for older patients with CLL.” She noted that the findings justify the use of ibrutinib as a standard-of-care treatment for CLL patients aged 65 years and older.
Median age of patients in the study was 71 years and 67% of the patient were men, a profile that is similar, to those of patients with CLL seen at the US Department of Veterans Affairs.
The 2-year PFS was 74% in 183 patients randomized to receive standard chemoimmunotherapy with bendamustine and rituximab (BR), compared with 87% in 182 patients randomized to receive ibrutinib alone (hazard ratio, 0.39 vs. BR), and 88% in 182 patients who received ibrutinib and rituximab (IR; HR, 0.38 vs. BR). Median PFS in this study was 43 months in the BR arm, and was not reached in either of the ibrutinib-containing arms, she said. No significant differences in overall survival (OS) were seen among the treatment arms, which may have been because of short follow-up and the fact that patients in the BR arm were allowed to cross over to ibrutinib if they progressed on treatment.
The results suggest that the additional of rituximab provided little benefit to the patients though it does add to both the costs and the chair time in an infusion center, according to former Association of VA Hematology/Oncology Mary Thomas, MS, CNS, AOCN.
“I think this really does indicate that ibrutinib as front-line therapy, which many clinicians have been doing, is a very reasonable practice,” said David P. Steensma, MD, of Dana-Farber Cancer Institute in Boston, who moderated the press briefing.
Dr. Woyach added, however, that while ibrutinib represents a major therapeutic advance, its cost and its toxicities in older patients are a concern that warrant close monitoring and development of strategies to reduce the need for long-term continuous treatment.
Thomas agreed noting that health care providers needs to be aware of the risk of atrial fib and bleeding when using ibrutinib and to ensure that patient will be able to adhere to daily dosing.
Additional phase 3 studies set to open soon will compare ibrutinib in combination with venetoclax and obinutuzumab with standard ibrutinib.
Dr. Woyach and Ms. Thomas reported having no disclosures. Dr. Steensma reported receiving research funding from, and/or serving as a consultant, board member, or adviser for Takeda Pharmaceutical, Syros Pharmaceuticals, Otsuka Pharmaceutical, Onconova Therapeutics, Novartis, Kura Oncology, Janssen, H3 Biosciences, Celgene, Amphivena Therapeutics, and Acceleron Pharma.