User login
Cediranib may alter DNA repair capacity
Cediranib was found to confer sensitivity to olaparib through downregulation of the homology-directed DNA repair (HDR) pathway in tumor cells, investigators report.
“The objective of this study was to define the effects of cediranib on the HDR pathway of DNA repair,” wrote Alanna R. Kaplan, MD, of Yale University, New Haven, Conn., and colleagues. The report is in Science Translational Medicine.
The researchers explored the effects of combination cediranib and olaparib therapy at the molecular level using various in vitro and in vivo experiments. Tumor growth studies were conducted in a mouse model with sample sizes selected based on prior experience.
“In vitro experiments were performed in biological triplicate unless otherwise stated,” the researchers wrote. “For in vivo experiments, mice were randomly assigned to treatment groups,” they added.
After analysis, the researchers found that cediranib provides sensitivity to olaparib through suppression of the HDR pathway in malignant cells. The downregulation was explained in part by the inducement of hypoxia, which inhibited gene expression of certain factors in the pathway.
“We noted a decrease in the expression of HDR factors BRCA1, BRCA2, and RAD51 in the cediranib-treated groups compared to controls,” the researchers explained.
In addition, the team reported that cediranib alone exhibits direct effects on the HDR pathway outside of mechanisms related to tumor hypoxia.
“This downregulation was seen in mouse tumor xenografts but not in mouse bone marrow, providing a therapeutic window for combining cediranib and olaparib in cancer therapy,” the team wrote.
The researchers acknowledged that a key limitation of the study was the lack of inquiry into the effects of other mutations on the HDR pathway, which could possibly influence the effects of cediranib in tumor cells.
“These findings identify a pathway by which cediranib can alter the DNA repair capacity of cancer cells that has implications for the design of cancer therapies,” the authors concluded.
The study was supported by grant funding from the National Institutes of Health. One of the researchers reported financial affiliations with Trucode Gene Repair, Cybrexa Therapeutics, and Patrys.
SOURCE: Kaplan AR et al. Sci Transl Med. 2019 May 15. doi: 10.1126/scitranslmed.aav4508.
Cediranib was found to confer sensitivity to olaparib through downregulation of the homology-directed DNA repair (HDR) pathway in tumor cells, investigators report.
“The objective of this study was to define the effects of cediranib on the HDR pathway of DNA repair,” wrote Alanna R. Kaplan, MD, of Yale University, New Haven, Conn., and colleagues. The report is in Science Translational Medicine.
The researchers explored the effects of combination cediranib and olaparib therapy at the molecular level using various in vitro and in vivo experiments. Tumor growth studies were conducted in a mouse model with sample sizes selected based on prior experience.
“In vitro experiments were performed in biological triplicate unless otherwise stated,” the researchers wrote. “For in vivo experiments, mice were randomly assigned to treatment groups,” they added.
After analysis, the researchers found that cediranib provides sensitivity to olaparib through suppression of the HDR pathway in malignant cells. The downregulation was explained in part by the inducement of hypoxia, which inhibited gene expression of certain factors in the pathway.
“We noted a decrease in the expression of HDR factors BRCA1, BRCA2, and RAD51 in the cediranib-treated groups compared to controls,” the researchers explained.
In addition, the team reported that cediranib alone exhibits direct effects on the HDR pathway outside of mechanisms related to tumor hypoxia.
“This downregulation was seen in mouse tumor xenografts but not in mouse bone marrow, providing a therapeutic window for combining cediranib and olaparib in cancer therapy,” the team wrote.
The researchers acknowledged that a key limitation of the study was the lack of inquiry into the effects of other mutations on the HDR pathway, which could possibly influence the effects of cediranib in tumor cells.
“These findings identify a pathway by which cediranib can alter the DNA repair capacity of cancer cells that has implications for the design of cancer therapies,” the authors concluded.
The study was supported by grant funding from the National Institutes of Health. One of the researchers reported financial affiliations with Trucode Gene Repair, Cybrexa Therapeutics, and Patrys.
SOURCE: Kaplan AR et al. Sci Transl Med. 2019 May 15. doi: 10.1126/scitranslmed.aav4508.
Cediranib was found to confer sensitivity to olaparib through downregulation of the homology-directed DNA repair (HDR) pathway in tumor cells, investigators report.
“The objective of this study was to define the effects of cediranib on the HDR pathway of DNA repair,” wrote Alanna R. Kaplan, MD, of Yale University, New Haven, Conn., and colleagues. The report is in Science Translational Medicine.
The researchers explored the effects of combination cediranib and olaparib therapy at the molecular level using various in vitro and in vivo experiments. Tumor growth studies were conducted in a mouse model with sample sizes selected based on prior experience.
“In vitro experiments were performed in biological triplicate unless otherwise stated,” the researchers wrote. “For in vivo experiments, mice were randomly assigned to treatment groups,” they added.
After analysis, the researchers found that cediranib provides sensitivity to olaparib through suppression of the HDR pathway in malignant cells. The downregulation was explained in part by the inducement of hypoxia, which inhibited gene expression of certain factors in the pathway.
“We noted a decrease in the expression of HDR factors BRCA1, BRCA2, and RAD51 in the cediranib-treated groups compared to controls,” the researchers explained.
In addition, the team reported that cediranib alone exhibits direct effects on the HDR pathway outside of mechanisms related to tumor hypoxia.
“This downregulation was seen in mouse tumor xenografts but not in mouse bone marrow, providing a therapeutic window for combining cediranib and olaparib in cancer therapy,” the team wrote.
The researchers acknowledged that a key limitation of the study was the lack of inquiry into the effects of other mutations on the HDR pathway, which could possibly influence the effects of cediranib in tumor cells.
“These findings identify a pathway by which cediranib can alter the DNA repair capacity of cancer cells that has implications for the design of cancer therapies,” the authors concluded.
The study was supported by grant funding from the National Institutes of Health. One of the researchers reported financial affiliations with Trucode Gene Repair, Cybrexa Therapeutics, and Patrys.
SOURCE: Kaplan AR et al. Sci Transl Med. 2019 May 15. doi: 10.1126/scitranslmed.aav4508.
FROM SCIENCE TRANSLATIONAL MEDICINE
Measles: A dangerous vaccine-preventable disease returns
Measles, an ancient, highly contagious disease with a history of successful control by vaccination, is now threatening to have an epidemic resurgence. Until recently, measles vaccination largely controlled outbreaks in the United States. The Global Vaccine Action Plan under the World Health Organization aimed to eliminate measles worldwide. Nonetheless, the vaccine refusal movement and slow rollout of vaccine programs globally have interfered with control of the virus. A record number of measles cases have emerged in recent months: more than 700 since January 2019.1 Approximately 70% of recent cases were in unvaccinated patients, and almost all were in US residents.
This update reviews the history, presentation and diagnosis, complications, management, contagion control, and emerging threat of a measles epidemic. It concludes with recommendations for clinical practice in the context of the current measles outbreaks.
FROM UBIQUITOUS TO ERADICATED—AND BACK
Before the measles vaccine was developed and became available in the 1960s, outbreaks of measles occurred predictably every year in the United States and other temperate regions. During yearly outbreaks, measles was so contagious that household contacts had attack rates above 95%. Most cases occurred in very young children, and because infection with the virus causes lifelong immunity, it could be safely assumed that by adulthood, everyone was immune. In an outbreak in the Faroe Islands in 1846, no one who had been alive in the last major outbreak 65 years earlier became ill, but everyone under age 65 was at high risk with “high attack rates,” estimated as 99% from other outbreaks (reviewed by Krugman et al2).
In isolated regions previously free of measles, adults did not have immunity, and when exposed, they often developed severe disease. When European settlers brought measles and smallpox to the Americas beginning in the late 15th century, these diseases decimated whole populations of native peoples who had never been exposed to them.
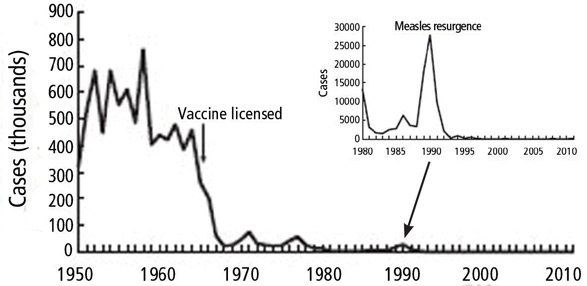
That was premature. A number of outbreaks have occurred since then; the largest in the United States (before 2019) was in 2000. Over half of the 667 cases reported during that outbreak were in an underimmunized Amish community in Ohio.3
Now it emerges again.
PRESENTATION CAN VARY
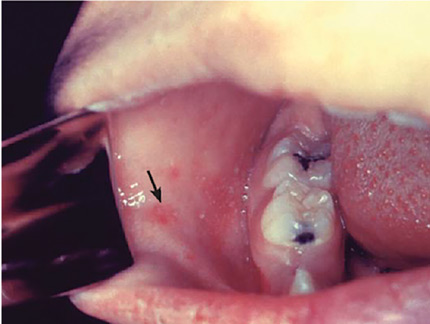
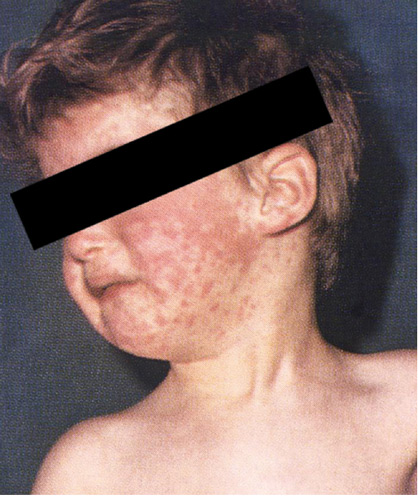
The presentation varies somewhat among certain groups.
Nonimmune pregnant women have an especially severe course, likely related to the relative immune suppression of pregnancy.
In immune-suppressed states, measles is not only more severe, it is also difficult to diagnose because the rash can be absent.
In partially vaccinated children and adults, the disease may present atypically, without cough, conjunctivitis, and coryza, and it may be milder, lacking some of the extreme malaise typical of measles and with a shortened course. Measles infection in people who received the inactivated measles vaccine that was briefly available from 1963 to 1967 is also associated with atypical measles syndrome, a severe hypersensitivity reaction to the measles virus. Atypical measles can be prevented by revaccination with a live-virus vaccine.
DIAGNOSIS MAY NEED TO BE CONFIRMED
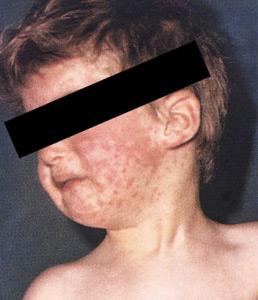
The diagnosis of measles is straightforward when all of the signs and symptoms are present. In partially vaccinated populations, however, the diagnosis may need to be confirmed by serologic or polymerase chain reaction (PCR) testing.
Differential diagnosis
The differential diagnosis of the fever and a rash typical of measles in children, especially when accompanied by severe malaise, includes the following:
Kawasaki disease. However, the red eyes of Kawasaki are an injection of the bulbar conjunctivae with sparing of the limbus. No eye exudate is present, and respiratory illness is not part of the disease.
Drug eruptions can present with a morbilliform rash and sometimes fever, but not the other signs of measles in either adults or children.
Scarlet fever has a different rash, the sandpaper rash typical of toxin-mediated disease.
Rubella tends to cause mild respiratory symptoms and illness rather than the severe disease of measles and other rash-causing viral infections in children and infants.
Confirmation in confusing cases
To confirm a diagnosis of measles, samples from throat, nasal, and posterior nasopharyngeal swabs should be collected with a blood specimen for serology and sent to the state public health laboratory.4 The US Centers for Disease Control and Prevention gives instructions on who should be tested and with which tests.4
Most testing now uses PCR for viral RNA, as viral culture is more costly and takes longer. For accurate diagnosis, samples for PCR must be obtained during the acute illness.
The serologic gold standard for diagnosis is a 4-fold rise or fall in immunoglobulin G (IgG) titer of paired serum samples sent 10 days to 2 weeks apart around the illness. The IgM test may be negative initially, and a negative test cannot be used to rule out the diagnosis. Confirmed cases should be reported to public health authorities.
COMPLICATIONS: EARLY AND LATE
Frequent complications of measles infection include those related to the primary viral infection of respiratory tract mucosal surfaces, as well as bacterial superinfections. Complications are most likely in children under age 5, nonimmune adults, pregnant women, and immunocompromised people. Typical complications include otitis media, laryngotracheobronchitis (presenting as a croupy cough), pneumonia, and diarrhea.
Late sequelae of measles infection are related in part to serious mucosal damage and generalized immune suppression caused by the virus. Even after recovery from acute infection, children can have persistent diarrhea and failure to thrive, with increased mortality risk in the months after infection. Tuberculosis can reactivate in patients already infected, and new tuberculosis infection can be especially severe. Further, tuberculosis skin tests become less reliable immediately after measles infection. Severe disease and fatalities are increased in populations that have baseline vitamin A deficiency and malnutrition.
Death from measles is most often caused by viral pneumonia, secondary bacterial pneumonia, and postviral encephalitis. Before the vaccine era, measles encephalitis occurred in the United States in about 1 in 1,000 measles cases.
Subacute sclerosing panencephalitis is a rare, late, and often fatal complication of measles that presents 7 to 10 years after acute measles infection, usually in adolescence. Beginning with myoclonic jerks, stiffening, and slow mental deterioration, it progresses over 1 to 3 years, with a relentless degenerative course leading to death. Since the introduction of the measles vaccine in 1957, this disease has essentially disappeared in the United States.
SUPPORTIVE CARE, INFECTION CONTROL
Management of measles and its complications is primarily supportive.
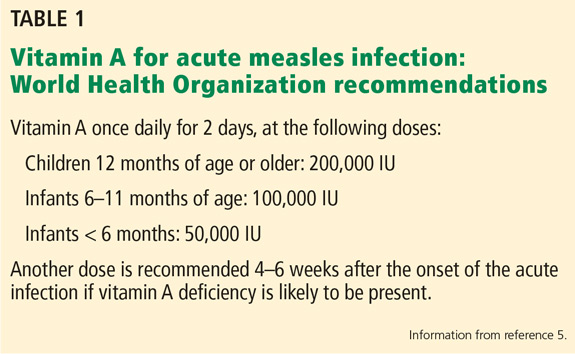
Preventing contagion
Measles infection has an incubation period of 8 to 12 days. Individuals are contagious 4 days before to 4 days after rash onset in the normal host but longer in those lacking immune function. Cases can occur up to 21 days after exposure during the contagious period.
The disease is highly contagious, so hospitalized patients should be cared for with airborne precautions. It is crucial that caretakers be vaccinated properly, so that they can care for patients safely. Recommendations for preventing secondary cases by prompt vaccination and giving immune globulin are detailed below, including specific recommendations for individuals with immune system suppression.
The current US public health policy regarding measles vaccine booster doses began in response to the widespread measles outbreak in the United States from 1989 to 1991. Cases occurred more commonly in unvaccinated individuals and in young adults who had received only 1 dose of vaccine.
Today, the policy in areas where measles has been controlled is to vaccinate between 12 and 15 months of age and to boost with a second dose before starting kindergarten. In outbreak situations, the first dose should be given at 6 months of age, with a repeat dose at 12 to 15 months of age and the usual booster before starting kindergarten.
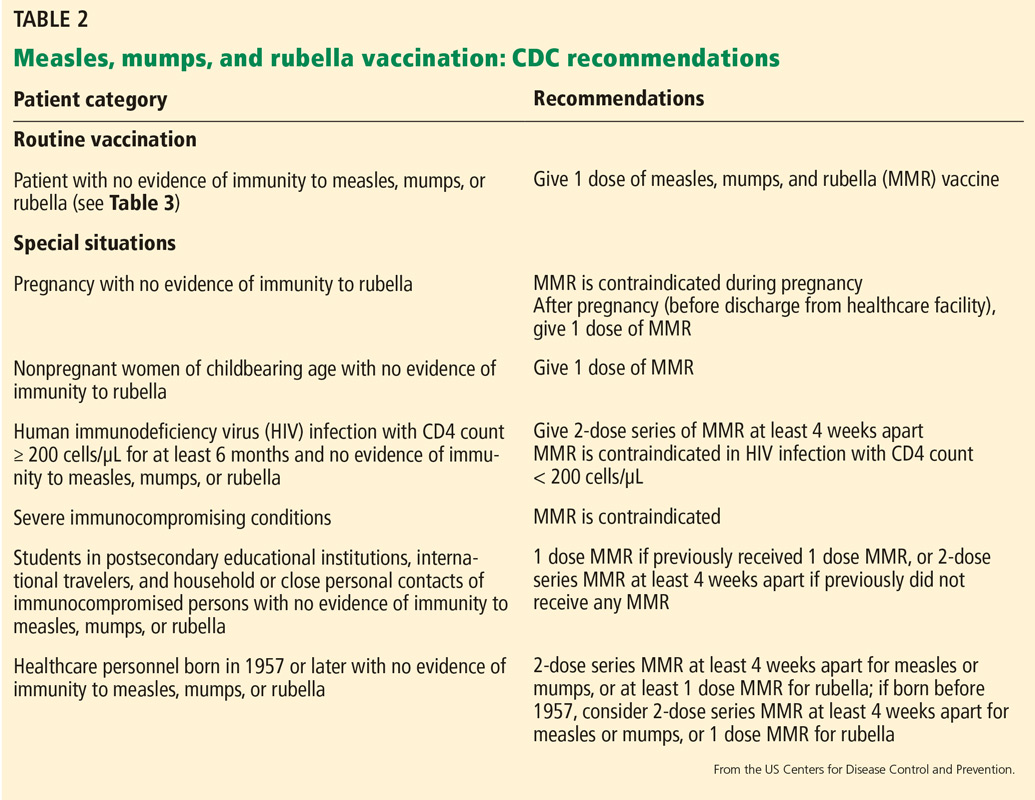

Those born before 1957 can be presumed to have had natural measles, which confers lifelong immunity (Table 3).7
CURRENT THREAT
In 2000, measles was considered controlled in the United States, thanks to the national vaccination policy. But despite overall control, small numbers of cases continued to occur each year, related to exposure to cases imported from areas of the world endemic with measles.
Within the last year, however, major outbreaks have emerged. Incompletely vaccinated populations and unvaccinated individuals are the reason for the progression of current outbreaks.8
Until there is broader acceptance of the vaccine and better adherence to vaccine policies nationally and globally, measles cannot be completely eradicated. But with high vaccination rates, it is predicted that this infection can be controlled and ultimately eradicated.
RECOMMENDATIONS
In the midst of an outbreak and with rising public awareness of the threat of measles, it is important to recognize that MMR vaccination is the most effective way to prevent spread of the virus and maintain measles elimination in the United States. With this in mind, there are several key facts and recommendations regarding vaccination:
Recommendations on vaccination
- In measles-controlled populations, all children should be vaccinated between 12 and 15 months of age and again before kindergarten.
- In outbreak settings, children should receive a first vaccine dose at 6 months of age, a second at 12 to 15 months of age, and a third before kindergarten.
- Children who have received 2 measles vaccine doses can be assumed to be fully vaccinated and thus protected as long as the first dose was after 12 months of age. If the first dose was before 12 months of age, a child needs 3 doses.
- Adults born before 1957 can be assumed to have had measles infection and to be immune.
- Adults who were immunized with the inactivated measles vaccine available between 1963 and 1967 should receive 1 dose of live virus vaccine.
- Boosters are recommended for young adults who did not receive a second dose of vaccine and for adults with an uncertain history of immunization. There is no need to check titers before giving a booster, but if a positive titer is available in an adult, a booster is not needed.
- Heathcare providers should vaccinate unvaccinated or undervaccinated US residents traveling internationally (as long as they do not have contraindications) or traveling within the country to areas with outbreaks of measles.
Recommendations on vaccination after exposure to measles
- Vaccine is recommended for a nonimmune contact, including anyone with a history of only a single dose of vaccine.
- If a child got a first dose of vaccine before 12 months of age, give the second dose as soon as he or she turns 1 year old, or at least 28 days after the first dose.
- Vaccine must be given within 72 hours of exposure to confer protection (or at least decrease disease severity).
- The second dose of vaccine should be given at least 28 days after the first dose.
Recommendations on immune globulin after exposure to measles
- Immune globulin is recommended for anyone with exposure and no history of vaccination or immunity.
- Immune globulin can be given up to 6 days after exposure to prevent or decrease the severity of measles in immunocompromised hosts who have not been previously vaccinated. It is best to give it as early as possible.
- Immune globulin is given intramuscularly at 0.5 mL/kg, up to a to maximum dose of 15 mL.
- Pregnant women and immunocompromised hosts without immunity should receive immunoglobulin intravenously. Children and adults who have had a recent bone marrow transplant and likely do not yet have a reconstituted immune system should be treated with immune globulin to prevent infection, as vaccine cannot be given immediately after transplant. This is also true for other immunocompromised individuals who have not been vaccinated and who are not candidates for vaccine because of the severity of their immune suppression.
- Children with human immunodeficiency virus infection are routinely vaccinated. As long as they have evidence of serologic immunity, they do not need additional treatment.
- Kimberlin DW, Brady MT, Jackson MA, Long SS, editors. Measles. In Red Book: 2018 Report of the Committee on Infectious Diseases. American Academy of Pediatrics 2018; 537–550.
- Krugman S, Giles JP, Friedman H, Stone S. Studies on immunity to measles. J Pediatr 1965; 66:471–488. pmid:14264306.
- Gastañaduy PA, Budd J, Fisher N, et al. A measles outbreak in an underimmunized Amish community in Ohio. N Engl J Med 2016; 375(14):1343–1354. doi:10.1056/NEJMoa1602295
- Centers for Disease Control and Prevention. Measles (rubeola). www.cdc.gov/measles/index.html. Accessed May 16, 2019.
- World Health Organization. Measles vaccines: WHO position paper—April 2017. Wkly Epidemiol Rec 2017; 92(17):205–227. pmid:28459148
- McLean HQ, Fiebelkorn AP, Temte JL, Wallace GS; Centers for Disease Control and Prevention. Prevention of measles, rubella, congenital rubella syndrome and mumps, 2013; summary: recommendations of the Advisory Committee on Immunization Practices ACIP. MMWR Recomm Rep 2013 Jun 14; 62(RR-4)1–34. pmid:23760231
- Advisory Committee on Immunization Practices; Centers for Disease Control and Prevention. Immunization for health-care personnel: recommendations of the Advisory Committee on Immunization Practices (ACIP). MMWR Recomm Rep 2011 Nov 25; 60(RR-7)1–45. pmid:22108587
- Patel M, Lee AD, Redd SB, et al. Increase in measles cases—United States, January 1–April 26, 2019. MMWR Morb Mortal Wkly Rep 2019; May 3; 68(17):402–404. doi:10.15585/mmwr.mm6817e1
Measles, an ancient, highly contagious disease with a history of successful control by vaccination, is now threatening to have an epidemic resurgence. Until recently, measles vaccination largely controlled outbreaks in the United States. The Global Vaccine Action Plan under the World Health Organization aimed to eliminate measles worldwide. Nonetheless, the vaccine refusal movement and slow rollout of vaccine programs globally have interfered with control of the virus. A record number of measles cases have emerged in recent months: more than 700 since January 2019.1 Approximately 70% of recent cases were in unvaccinated patients, and almost all were in US residents.
This update reviews the history, presentation and diagnosis, complications, management, contagion control, and emerging threat of a measles epidemic. It concludes with recommendations for clinical practice in the context of the current measles outbreaks.
FROM UBIQUITOUS TO ERADICATED—AND BACK
Before the measles vaccine was developed and became available in the 1960s, outbreaks of measles occurred predictably every year in the United States and other temperate regions. During yearly outbreaks, measles was so contagious that household contacts had attack rates above 95%. Most cases occurred in very young children, and because infection with the virus causes lifelong immunity, it could be safely assumed that by adulthood, everyone was immune. In an outbreak in the Faroe Islands in 1846, no one who had been alive in the last major outbreak 65 years earlier became ill, but everyone under age 65 was at high risk with “high attack rates,” estimated as 99% from other outbreaks (reviewed by Krugman et al2).
In isolated regions previously free of measles, adults did not have immunity, and when exposed, they often developed severe disease. When European settlers brought measles and smallpox to the Americas beginning in the late 15th century, these diseases decimated whole populations of native peoples who had never been exposed to them.
That was premature. A number of outbreaks have occurred since then; the largest in the United States (before 2019) was in 2000. Over half of the 667 cases reported during that outbreak were in an underimmunized Amish community in Ohio.3
Now it emerges again.
PRESENTATION CAN VARY
The presentation varies somewhat among certain groups.
Nonimmune pregnant women have an especially severe course, likely related to the relative immune suppression of pregnancy.
In immune-suppressed states, measles is not only more severe, it is also difficult to diagnose because the rash can be absent.
In partially vaccinated children and adults, the disease may present atypically, without cough, conjunctivitis, and coryza, and it may be milder, lacking some of the extreme malaise typical of measles and with a shortened course. Measles infection in people who received the inactivated measles vaccine that was briefly available from 1963 to 1967 is also associated with atypical measles syndrome, a severe hypersensitivity reaction to the measles virus. Atypical measles can be prevented by revaccination with a live-virus vaccine.
DIAGNOSIS MAY NEED TO BE CONFIRMED
The diagnosis of measles is straightforward when all of the signs and symptoms are present. In partially vaccinated populations, however, the diagnosis may need to be confirmed by serologic or polymerase chain reaction (PCR) testing.
Differential diagnosis
The differential diagnosis of the fever and a rash typical of measles in children, especially when accompanied by severe malaise, includes the following:
Kawasaki disease. However, the red eyes of Kawasaki are an injection of the bulbar conjunctivae with sparing of the limbus. No eye exudate is present, and respiratory illness is not part of the disease.
Drug eruptions can present with a morbilliform rash and sometimes fever, but not the other signs of measles in either adults or children.
Scarlet fever has a different rash, the sandpaper rash typical of toxin-mediated disease.
Rubella tends to cause mild respiratory symptoms and illness rather than the severe disease of measles and other rash-causing viral infections in children and infants.
Confirmation in confusing cases
To confirm a diagnosis of measles, samples from throat, nasal, and posterior nasopharyngeal swabs should be collected with a blood specimen for serology and sent to the state public health laboratory.4 The US Centers for Disease Control and Prevention gives instructions on who should be tested and with which tests.4
Most testing now uses PCR for viral RNA, as viral culture is more costly and takes longer. For accurate diagnosis, samples for PCR must be obtained during the acute illness.
The serologic gold standard for diagnosis is a 4-fold rise or fall in immunoglobulin G (IgG) titer of paired serum samples sent 10 days to 2 weeks apart around the illness. The IgM test may be negative initially, and a negative test cannot be used to rule out the diagnosis. Confirmed cases should be reported to public health authorities.
COMPLICATIONS: EARLY AND LATE
Frequent complications of measles infection include those related to the primary viral infection of respiratory tract mucosal surfaces, as well as bacterial superinfections. Complications are most likely in children under age 5, nonimmune adults, pregnant women, and immunocompromised people. Typical complications include otitis media, laryngotracheobronchitis (presenting as a croupy cough), pneumonia, and diarrhea.
Late sequelae of measles infection are related in part to serious mucosal damage and generalized immune suppression caused by the virus. Even after recovery from acute infection, children can have persistent diarrhea and failure to thrive, with increased mortality risk in the months after infection. Tuberculosis can reactivate in patients already infected, and new tuberculosis infection can be especially severe. Further, tuberculosis skin tests become less reliable immediately after measles infection. Severe disease and fatalities are increased in populations that have baseline vitamin A deficiency and malnutrition.
Death from measles is most often caused by viral pneumonia, secondary bacterial pneumonia, and postviral encephalitis. Before the vaccine era, measles encephalitis occurred in the United States in about 1 in 1,000 measles cases.
Subacute sclerosing panencephalitis is a rare, late, and often fatal complication of measles that presents 7 to 10 years after acute measles infection, usually in adolescence. Beginning with myoclonic jerks, stiffening, and slow mental deterioration, it progresses over 1 to 3 years, with a relentless degenerative course leading to death. Since the introduction of the measles vaccine in 1957, this disease has essentially disappeared in the United States.
SUPPORTIVE CARE, INFECTION CONTROL
Management of measles and its complications is primarily supportive.
Preventing contagion
Measles infection has an incubation period of 8 to 12 days. Individuals are contagious 4 days before to 4 days after rash onset in the normal host but longer in those lacking immune function. Cases can occur up to 21 days after exposure during the contagious period.
The disease is highly contagious, so hospitalized patients should be cared for with airborne precautions. It is crucial that caretakers be vaccinated properly, so that they can care for patients safely. Recommendations for preventing secondary cases by prompt vaccination and giving immune globulin are detailed below, including specific recommendations for individuals with immune system suppression.
The current US public health policy regarding measles vaccine booster doses began in response to the widespread measles outbreak in the United States from 1989 to 1991. Cases occurred more commonly in unvaccinated individuals and in young adults who had received only 1 dose of vaccine.
Today, the policy in areas where measles has been controlled is to vaccinate between 12 and 15 months of age and to boost with a second dose before starting kindergarten. In outbreak situations, the first dose should be given at 6 months of age, with a repeat dose at 12 to 15 months of age and the usual booster before starting kindergarten.
Those born before 1957 can be presumed to have had natural measles, which confers lifelong immunity (Table 3).7
CURRENT THREAT
In 2000, measles was considered controlled in the United States, thanks to the national vaccination policy. But despite overall control, small numbers of cases continued to occur each year, related to exposure to cases imported from areas of the world endemic with measles.
Within the last year, however, major outbreaks have emerged. Incompletely vaccinated populations and unvaccinated individuals are the reason for the progression of current outbreaks.8
Until there is broader acceptance of the vaccine and better adherence to vaccine policies nationally and globally, measles cannot be completely eradicated. But with high vaccination rates, it is predicted that this infection can be controlled and ultimately eradicated.
RECOMMENDATIONS
In the midst of an outbreak and with rising public awareness of the threat of measles, it is important to recognize that MMR vaccination is the most effective way to prevent spread of the virus and maintain measles elimination in the United States. With this in mind, there are several key facts and recommendations regarding vaccination:
Recommendations on vaccination
- In measles-controlled populations, all children should be vaccinated between 12 and 15 months of age and again before kindergarten.
- In outbreak settings, children should receive a first vaccine dose at 6 months of age, a second at 12 to 15 months of age, and a third before kindergarten.
- Children who have received 2 measles vaccine doses can be assumed to be fully vaccinated and thus protected as long as the first dose was after 12 months of age. If the first dose was before 12 months of age, a child needs 3 doses.
- Adults born before 1957 can be assumed to have had measles infection and to be immune.
- Adults who were immunized with the inactivated measles vaccine available between 1963 and 1967 should receive 1 dose of live virus vaccine.
- Boosters are recommended for young adults who did not receive a second dose of vaccine and for adults with an uncertain history of immunization. There is no need to check titers before giving a booster, but if a positive titer is available in an adult, a booster is not needed.
- Heathcare providers should vaccinate unvaccinated or undervaccinated US residents traveling internationally (as long as they do not have contraindications) or traveling within the country to areas with outbreaks of measles.
Recommendations on vaccination after exposure to measles
- Vaccine is recommended for a nonimmune contact, including anyone with a history of only a single dose of vaccine.
- If a child got a first dose of vaccine before 12 months of age, give the second dose as soon as he or she turns 1 year old, or at least 28 days after the first dose.
- Vaccine must be given within 72 hours of exposure to confer protection (or at least decrease disease severity).
- The second dose of vaccine should be given at least 28 days after the first dose.
Recommendations on immune globulin after exposure to measles
- Immune globulin is recommended for anyone with exposure and no history of vaccination or immunity.
- Immune globulin can be given up to 6 days after exposure to prevent or decrease the severity of measles in immunocompromised hosts who have not been previously vaccinated. It is best to give it as early as possible.
- Immune globulin is given intramuscularly at 0.5 mL/kg, up to a to maximum dose of 15 mL.
- Pregnant women and immunocompromised hosts without immunity should receive immunoglobulin intravenously. Children and adults who have had a recent bone marrow transplant and likely do not yet have a reconstituted immune system should be treated with immune globulin to prevent infection, as vaccine cannot be given immediately after transplant. This is also true for other immunocompromised individuals who have not been vaccinated and who are not candidates for vaccine because of the severity of their immune suppression.
- Children with human immunodeficiency virus infection are routinely vaccinated. As long as they have evidence of serologic immunity, they do not need additional treatment.
Measles, an ancient, highly contagious disease with a history of successful control by vaccination, is now threatening to have an epidemic resurgence. Until recently, measles vaccination largely controlled outbreaks in the United States. The Global Vaccine Action Plan under the World Health Organization aimed to eliminate measles worldwide. Nonetheless, the vaccine refusal movement and slow rollout of vaccine programs globally have interfered with control of the virus. A record number of measles cases have emerged in recent months: more than 700 since January 2019.1 Approximately 70% of recent cases were in unvaccinated patients, and almost all were in US residents.
This update reviews the history, presentation and diagnosis, complications, management, contagion control, and emerging threat of a measles epidemic. It concludes with recommendations for clinical practice in the context of the current measles outbreaks.
FROM UBIQUITOUS TO ERADICATED—AND BACK
Before the measles vaccine was developed and became available in the 1960s, outbreaks of measles occurred predictably every year in the United States and other temperate regions. During yearly outbreaks, measles was so contagious that household contacts had attack rates above 95%. Most cases occurred in very young children, and because infection with the virus causes lifelong immunity, it could be safely assumed that by adulthood, everyone was immune. In an outbreak in the Faroe Islands in 1846, no one who had been alive in the last major outbreak 65 years earlier became ill, but everyone under age 65 was at high risk with “high attack rates,” estimated as 99% from other outbreaks (reviewed by Krugman et al2).
In isolated regions previously free of measles, adults did not have immunity, and when exposed, they often developed severe disease. When European settlers brought measles and smallpox to the Americas beginning in the late 15th century, these diseases decimated whole populations of native peoples who had never been exposed to them.
That was premature. A number of outbreaks have occurred since then; the largest in the United States (before 2019) was in 2000. Over half of the 667 cases reported during that outbreak were in an underimmunized Amish community in Ohio.3
Now it emerges again.
PRESENTATION CAN VARY
The presentation varies somewhat among certain groups.
Nonimmune pregnant women have an especially severe course, likely related to the relative immune suppression of pregnancy.
In immune-suppressed states, measles is not only more severe, it is also difficult to diagnose because the rash can be absent.
In partially vaccinated children and adults, the disease may present atypically, without cough, conjunctivitis, and coryza, and it may be milder, lacking some of the extreme malaise typical of measles and with a shortened course. Measles infection in people who received the inactivated measles vaccine that was briefly available from 1963 to 1967 is also associated with atypical measles syndrome, a severe hypersensitivity reaction to the measles virus. Atypical measles can be prevented by revaccination with a live-virus vaccine.
DIAGNOSIS MAY NEED TO BE CONFIRMED
The diagnosis of measles is straightforward when all of the signs and symptoms are present. In partially vaccinated populations, however, the diagnosis may need to be confirmed by serologic or polymerase chain reaction (PCR) testing.
Differential diagnosis
The differential diagnosis of the fever and a rash typical of measles in children, especially when accompanied by severe malaise, includes the following:
Kawasaki disease. However, the red eyes of Kawasaki are an injection of the bulbar conjunctivae with sparing of the limbus. No eye exudate is present, and respiratory illness is not part of the disease.
Drug eruptions can present with a morbilliform rash and sometimes fever, but not the other signs of measles in either adults or children.
Scarlet fever has a different rash, the sandpaper rash typical of toxin-mediated disease.
Rubella tends to cause mild respiratory symptoms and illness rather than the severe disease of measles and other rash-causing viral infections in children and infants.
Confirmation in confusing cases
To confirm a diagnosis of measles, samples from throat, nasal, and posterior nasopharyngeal swabs should be collected with a blood specimen for serology and sent to the state public health laboratory.4 The US Centers for Disease Control and Prevention gives instructions on who should be tested and with which tests.4
Most testing now uses PCR for viral RNA, as viral culture is more costly and takes longer. For accurate diagnosis, samples for PCR must be obtained during the acute illness.
The serologic gold standard for diagnosis is a 4-fold rise or fall in immunoglobulin G (IgG) titer of paired serum samples sent 10 days to 2 weeks apart around the illness. The IgM test may be negative initially, and a negative test cannot be used to rule out the diagnosis. Confirmed cases should be reported to public health authorities.
COMPLICATIONS: EARLY AND LATE
Frequent complications of measles infection include those related to the primary viral infection of respiratory tract mucosal surfaces, as well as bacterial superinfections. Complications are most likely in children under age 5, nonimmune adults, pregnant women, and immunocompromised people. Typical complications include otitis media, laryngotracheobronchitis (presenting as a croupy cough), pneumonia, and diarrhea.
Late sequelae of measles infection are related in part to serious mucosal damage and generalized immune suppression caused by the virus. Even after recovery from acute infection, children can have persistent diarrhea and failure to thrive, with increased mortality risk in the months after infection. Tuberculosis can reactivate in patients already infected, and new tuberculosis infection can be especially severe. Further, tuberculosis skin tests become less reliable immediately after measles infection. Severe disease and fatalities are increased in populations that have baseline vitamin A deficiency and malnutrition.
Death from measles is most often caused by viral pneumonia, secondary bacterial pneumonia, and postviral encephalitis. Before the vaccine era, measles encephalitis occurred in the United States in about 1 in 1,000 measles cases.
Subacute sclerosing panencephalitis is a rare, late, and often fatal complication of measles that presents 7 to 10 years after acute measles infection, usually in adolescence. Beginning with myoclonic jerks, stiffening, and slow mental deterioration, it progresses over 1 to 3 years, with a relentless degenerative course leading to death. Since the introduction of the measles vaccine in 1957, this disease has essentially disappeared in the United States.
SUPPORTIVE CARE, INFECTION CONTROL
Management of measles and its complications is primarily supportive.
Preventing contagion
Measles infection has an incubation period of 8 to 12 days. Individuals are contagious 4 days before to 4 days after rash onset in the normal host but longer in those lacking immune function. Cases can occur up to 21 days after exposure during the contagious period.
The disease is highly contagious, so hospitalized patients should be cared for with airborne precautions. It is crucial that caretakers be vaccinated properly, so that they can care for patients safely. Recommendations for preventing secondary cases by prompt vaccination and giving immune globulin are detailed below, including specific recommendations for individuals with immune system suppression.
The current US public health policy regarding measles vaccine booster doses began in response to the widespread measles outbreak in the United States from 1989 to 1991. Cases occurred more commonly in unvaccinated individuals and in young adults who had received only 1 dose of vaccine.
Today, the policy in areas where measles has been controlled is to vaccinate between 12 and 15 months of age and to boost with a second dose before starting kindergarten. In outbreak situations, the first dose should be given at 6 months of age, with a repeat dose at 12 to 15 months of age and the usual booster before starting kindergarten.
Those born before 1957 can be presumed to have had natural measles, which confers lifelong immunity (Table 3).7
CURRENT THREAT
In 2000, measles was considered controlled in the United States, thanks to the national vaccination policy. But despite overall control, small numbers of cases continued to occur each year, related to exposure to cases imported from areas of the world endemic with measles.
Within the last year, however, major outbreaks have emerged. Incompletely vaccinated populations and unvaccinated individuals are the reason for the progression of current outbreaks.8
Until there is broader acceptance of the vaccine and better adherence to vaccine policies nationally and globally, measles cannot be completely eradicated. But with high vaccination rates, it is predicted that this infection can be controlled and ultimately eradicated.
RECOMMENDATIONS
In the midst of an outbreak and with rising public awareness of the threat of measles, it is important to recognize that MMR vaccination is the most effective way to prevent spread of the virus and maintain measles elimination in the United States. With this in mind, there are several key facts and recommendations regarding vaccination:
Recommendations on vaccination
- In measles-controlled populations, all children should be vaccinated between 12 and 15 months of age and again before kindergarten.
- In outbreak settings, children should receive a first vaccine dose at 6 months of age, a second at 12 to 15 months of age, and a third before kindergarten.
- Children who have received 2 measles vaccine doses can be assumed to be fully vaccinated and thus protected as long as the first dose was after 12 months of age. If the first dose was before 12 months of age, a child needs 3 doses.
- Adults born before 1957 can be assumed to have had measles infection and to be immune.
- Adults who were immunized with the inactivated measles vaccine available between 1963 and 1967 should receive 1 dose of live virus vaccine.
- Boosters are recommended for young adults who did not receive a second dose of vaccine and for adults with an uncertain history of immunization. There is no need to check titers before giving a booster, but if a positive titer is available in an adult, a booster is not needed.
- Heathcare providers should vaccinate unvaccinated or undervaccinated US residents traveling internationally (as long as they do not have contraindications) or traveling within the country to areas with outbreaks of measles.
Recommendations on vaccination after exposure to measles
- Vaccine is recommended for a nonimmune contact, including anyone with a history of only a single dose of vaccine.
- If a child got a first dose of vaccine before 12 months of age, give the second dose as soon as he or she turns 1 year old, or at least 28 days after the first dose.
- Vaccine must be given within 72 hours of exposure to confer protection (or at least decrease disease severity).
- The second dose of vaccine should be given at least 28 days after the first dose.
Recommendations on immune globulin after exposure to measles
- Immune globulin is recommended for anyone with exposure and no history of vaccination or immunity.
- Immune globulin can be given up to 6 days after exposure to prevent or decrease the severity of measles in immunocompromised hosts who have not been previously vaccinated. It is best to give it as early as possible.
- Immune globulin is given intramuscularly at 0.5 mL/kg, up to a to maximum dose of 15 mL.
- Pregnant women and immunocompromised hosts without immunity should receive immunoglobulin intravenously. Children and adults who have had a recent bone marrow transplant and likely do not yet have a reconstituted immune system should be treated with immune globulin to prevent infection, as vaccine cannot be given immediately after transplant. This is also true for other immunocompromised individuals who have not been vaccinated and who are not candidates for vaccine because of the severity of their immune suppression.
- Children with human immunodeficiency virus infection are routinely vaccinated. As long as they have evidence of serologic immunity, they do not need additional treatment.
- Kimberlin DW, Brady MT, Jackson MA, Long SS, editors. Measles. In Red Book: 2018 Report of the Committee on Infectious Diseases. American Academy of Pediatrics 2018; 537–550.
- Krugman S, Giles JP, Friedman H, Stone S. Studies on immunity to measles. J Pediatr 1965; 66:471–488. pmid:14264306.
- Gastañaduy PA, Budd J, Fisher N, et al. A measles outbreak in an underimmunized Amish community in Ohio. N Engl J Med 2016; 375(14):1343–1354. doi:10.1056/NEJMoa1602295
- Centers for Disease Control and Prevention. Measles (rubeola). www.cdc.gov/measles/index.html. Accessed May 16, 2019.
- World Health Organization. Measles vaccines: WHO position paper—April 2017. Wkly Epidemiol Rec 2017; 92(17):205–227. pmid:28459148
- McLean HQ, Fiebelkorn AP, Temte JL, Wallace GS; Centers for Disease Control and Prevention. Prevention of measles, rubella, congenital rubella syndrome and mumps, 2013; summary: recommendations of the Advisory Committee on Immunization Practices ACIP. MMWR Recomm Rep 2013 Jun 14; 62(RR-4)1–34. pmid:23760231
- Advisory Committee on Immunization Practices; Centers for Disease Control and Prevention. Immunization for health-care personnel: recommendations of the Advisory Committee on Immunization Practices (ACIP). MMWR Recomm Rep 2011 Nov 25; 60(RR-7)1–45. pmid:22108587
- Patel M, Lee AD, Redd SB, et al. Increase in measles cases—United States, January 1–April 26, 2019. MMWR Morb Mortal Wkly Rep 2019; May 3; 68(17):402–404. doi:10.15585/mmwr.mm6817e1
- Kimberlin DW, Brady MT, Jackson MA, Long SS, editors. Measles. In Red Book: 2018 Report of the Committee on Infectious Diseases. American Academy of Pediatrics 2018; 537–550.
- Krugman S, Giles JP, Friedman H, Stone S. Studies on immunity to measles. J Pediatr 1965; 66:471–488. pmid:14264306.
- Gastañaduy PA, Budd J, Fisher N, et al. A measles outbreak in an underimmunized Amish community in Ohio. N Engl J Med 2016; 375(14):1343–1354. doi:10.1056/NEJMoa1602295
- Centers for Disease Control and Prevention. Measles (rubeola). www.cdc.gov/measles/index.html. Accessed May 16, 2019.
- World Health Organization. Measles vaccines: WHO position paper—April 2017. Wkly Epidemiol Rec 2017; 92(17):205–227. pmid:28459148
- McLean HQ, Fiebelkorn AP, Temte JL, Wallace GS; Centers for Disease Control and Prevention. Prevention of measles, rubella, congenital rubella syndrome and mumps, 2013; summary: recommendations of the Advisory Committee on Immunization Practices ACIP. MMWR Recomm Rep 2013 Jun 14; 62(RR-4)1–34. pmid:23760231
- Advisory Committee on Immunization Practices; Centers for Disease Control and Prevention. Immunization for health-care personnel: recommendations of the Advisory Committee on Immunization Practices (ACIP). MMWR Recomm Rep 2011 Nov 25; 60(RR-7)1–45. pmid:22108587
- Patel M, Lee AD, Redd SB, et al. Increase in measles cases—United States, January 1–April 26, 2019. MMWR Morb Mortal Wkly Rep 2019; May 3; 68(17):402–404. doi:10.15585/mmwr.mm6817e1
KEY POINTS
- Measles is highly contagious and can have serious complications, including death.
- Measles vaccine is given in a 2-dose series. People who have received only 1 dose should receive either 1 or 2 more doses, depending on the situation, so that they are protected.
- The diagnosis of measles is straightforward when classic signs and symptoms are present—fever, cough, conjunctivitis, runny nose, and rash—especially after a known exposure or in the setting of outbreak. On the other hand, in partially vaccinated or immunosuppressed people, the illness presents atypically, and confirmation of diagnosis requires laboratory testing.
- Management is mostly supportive. Children—and probably also adults—should receive vitamin A.
- Since disease can be severe in the unvaccinated, immune globulin and vaccine are given to the normal host with an exposure and no history of vaccine or immunity.
Colorectal cancer screening: Choosing the right test
Screening can help prevent colorectal cancer. The United States has seen a steady decline in colorectal cancer incidence and mortality, thanks in large part to screening. Screening rates can be increased with good patient-physician dialogue and by choosing a method the patient prefers and is most likely to complete.
In this article, we review a general approach to screening, focusing on the most commonly used methods in the United States, ie, the guaiac-based fecal occult blood test (FOBT), the fecal immunochemical test (FIT), and colonoscopy. We discuss current colorectal cancer incidence rates, screening recommendations, and how to choose the appropriate screening test.
This article does not discuss patients at high risk of polyps or cancer due to hereditary colon cancer syndromes, a personal history of colorectal neoplasia, inflammatory bowel disease, or primary sclerosing cholangitis.
TRENDS IN INCIDENCE
Colorectal cancer is the second most common type of cancer and cause of cancer-related deaths in the United States, responsible for an estimated 50,000 deaths in 2017. The lifetime risk of its occurrence is estimated to be 1 in 21 men and 1 in 23 women.1 Encouragingly, the incidence has declined by 24% over the last 30 years,2 and by 3% per year from 2004 to 2013.1 Also, as a result of screening and advances in treatment, 5-year survival rates for patients with colorectal cancer have increased, from 48.6% in 1975 to 66.4% in 2009.2
When detected at a localized stage, the 5-year survival rate in colorectal cancer is greater than 90%. Unfortunately, it is diagnosed early in only 39% of patients. And despite advances in treatment and a doubling of the 5-year survival rate in patients with advanced cancers since 1990,3 the latter is only 14%. In most patients, cancer is diagnosed when it has spread to the lymph nodes (36%) or to distant organs (22%), and the survival rate declines to 71% after lymph-node spread, and 14% after metastasis to distant organs.
It is essential to screen people who have no symptoms, as symptoms such as gastrointestinal bleeding, unexplained abdominal pain or weight loss, a persistent change in bowel movements, and bowel obstruction typically do not arise until the disease is advanced and less amenable to cure.
Increasing prevalence in younger adults
Curiously, the incidence of colorectal cancer is increasing in white US adults under age 50. Over the last 30 years, incidence rates have increased from 1.0% to 2.4% annually in adults ages 20 to 39.4 Based on current trends, colon cancer rates are expected to increase by 90% for patients ages 20 to 34 and by 28% for patients 35 to 49 by 2030.5
Although recommendations vary for colorectal cancer screening in patients under age 50, clinicians should investigate symptoms such as rectal bleeding, unexplained iron deficiency anemia, progressive abdominal pain, and persistent changes in bowel movements.
Other challenges
Despite the benefits of screening, it is underutilized. Although rates of compliance with screening recommendations have increased 10% over the last 10 years, only 65% of eligible adults currently comply.1,6
Additionally, certain areas of the country such as Appalachia and the Mississippi Delta have not benefited from the decline in the national rate of colorectal cancer.7
SCREENING GUIDELINES
Most guidelines say that colorectal cancer screening should begin at age 50 in people at average risk with no symptoms. However, the American College of Gastroenterology (ACG) recommends beginning screening at age 45 in African Americans, as this group has higher incidence and mortality rates of colorectal cancer.8 Also, the American Cancer Society recently recommended beginning screening at age 45 for all individuals.9
Screening can stop at age 75 for most patients, according to the ACG,8 the US Multi-Society Task Force on Colorectal Cancer,10 and the US Preventive Services Task Force (USPSTF).11 However, the decision should be individualized for patients ages 76 to 85. Patients within that age group who are in good health and have not previously been screened are more likely to benefit than those who have previously been screened and had a negative screening test. Patients over age 85 should not begin or continue screening, because of diminished benefit of screening in this age group, shorter life expectancy, advanced comorbid conditions, and the risks of colonoscopy and cancer treatment.
Patients and clinicians are encouraged to collaborate in deciding which screening method is appropriate. Patients adhere better when they are given a choice in the matter.12–14 And adherence is the key to effective colorectal cancer screening.
Familiarity with the key characteristics of currently available colorectal cancer screening tests will facilitate discussion with patients.
Opportunistic vs programmatic screening
Screening can be classified according to the approach to the patient or population and the intent of the test. Most screening in the United States is opportunistic rather than programmatic—that is, the physician offers the patient screening at the point of service without systematic follow-up or patient re-engagement.
In a programmatic approach, the patient is offered screening through an organized program that streamlines services, reduces overscreening, and provides systematic follow-up of testing.
DISCUSSING THE OPTIONS
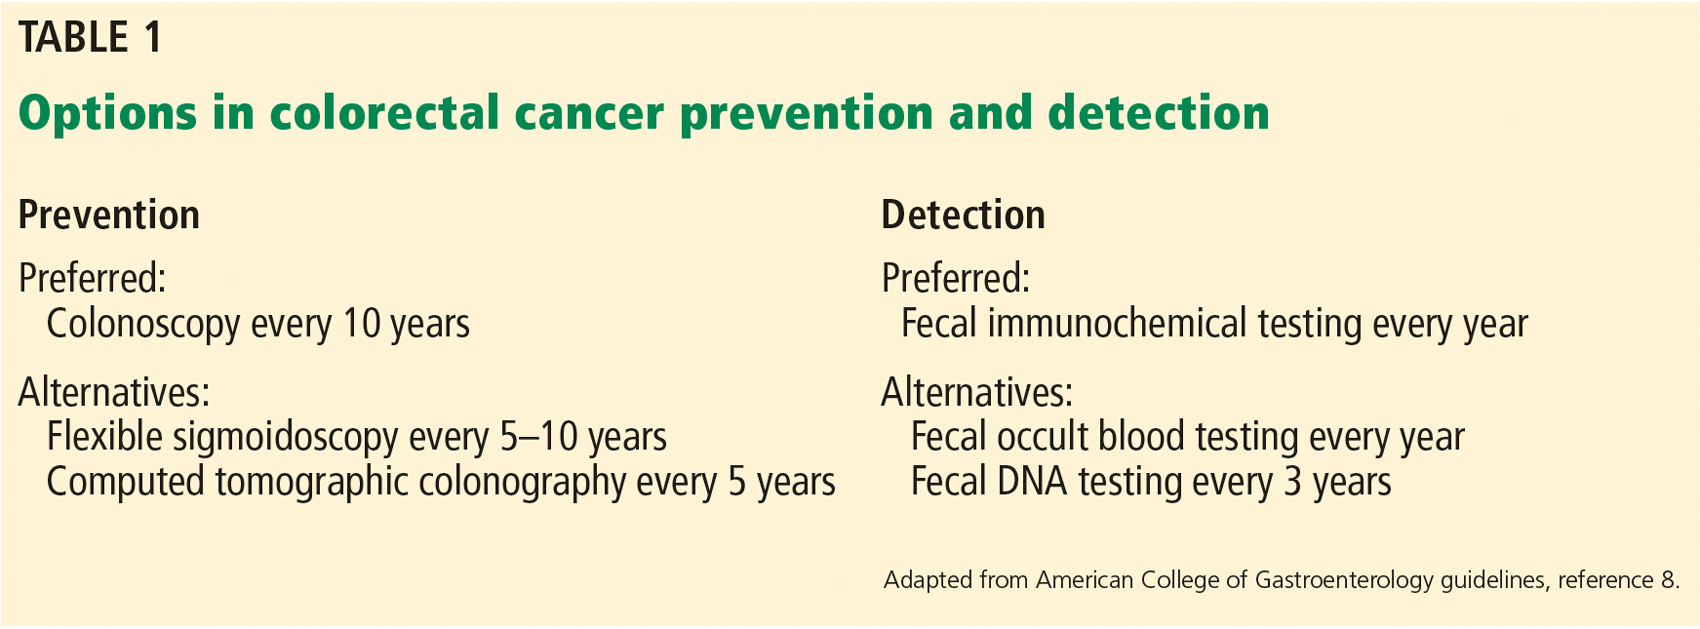
Stool studies such as FOBT and FIT do not reliably detect cancer precursors such as adenomas and serrated neoplasms. If an FOBT is positive, follow-up diagnostic colonoscopy is required. Unlike screening colonoscopy, diagnostic colonoscopy requires a copayment for Medicare patients, and this should be explained to the patient.
FIT and FOBT detect hemolyzed blood within a stool sample, FOBT by a chemical reaction, and FIT by detecting a globin-specific antibody. Colorectal cancer and some large adenomatous polyps may intermittently bleed and result in occult blood in the stool, iron deficiency anemia, or hematochezia.15
Fecal occult blood testing
Historically, FOBT was the stool test of choice for screening. It uses an indirect enzymatic reaction to detect hemolyzed blood in the stool. When a specimen containing hemoglobin is added to guaiac paper and a drop of hydrogen peroxide is added to “develop” it, the peroxidase activity of hemoglobin turns the guaiac blue.
Screening with FOBT involves annual testing of 3 consecutively passed stools from different days; FOBT should not be performed at the time of digital rectal examination or if the patient is having overt rectal, urinary, or menstrual bleeding.
Dietary and medication restrictions before and during the testing period are critical, as red meat contains hemoglobin, and certain vegetables (eg, radishes, turnips, cauliflower, cucumbers) contain peroxidase, all of which can cause a false-positive result. Waiting 3 days after the stool sample is collected to develop it can mitigate the peroxidase activity of vegetables.16 Vitamin C inhibits heme peroxidase activity and leads to false-negative results. Aspirin and high-dose nonsteroidal anti-inflammatory drugs can promote bleeding throughout the intestinal tract.17
In randomized controlled trials,18–21 screening with FOBT reduced colorectal cancer mortality rates by 15% to 33%. The 30-year follow-up of a large US trial22 found a 32% relative reduction in mortality rates in patients randomized to annual screening, and a 22% relative reduction in those randomized to screening every 2 years. Despite the many possibilities for false-positive results, the specificity for detecting cancer has ranged from 86.7% to 97.3%, and the sensitivity from 37.1% to 79.4%, highlighting the benefit of colorectal cancer screening programs in unscreened populations.23–26
FIT vs FOBT in current practice
FIT should replace FOBT as the preferred stool screening method. Instead of an enzymatic reaction that can be altered by food or medication, FIT utilizes an antibody specific to human globin to directly detect hemolyzed blood, thus eliminating the need to modify the diet or medications.27 Additionally, only 1 stool specimen is needed, which may explain why the adherence rate was about 20% higher with FIT than with FOBT in most studies.28–30
FIT has a sensitivity of 69% to 86% for colorectal cancer and a specificity of 92% to 95%.31 The sensitivity can be improved by lowering the threshold value for a positive test, but this is associated with a decrease in specificity. A single FIT has the same sensitivity and specificity as several samples.32
In a large retrospective US cohort study of programmatic screening with FIT, Jensen et al33 reported that 48% of 670,841 people who were offered testing actually did the test. Of the 48% who participated in the first round and remained eligible, 75% to 86% participated in subsequent rounds over 4 years. Those who had a positive result on FIT were supposed to undergo colonoscopy, but 22% did not.
The US Multi-Society Task Force on Colorectal Cancer34 suggests that FIT-based screening programs aim for a target FIT completion rate of more than 60% and a target colonoscopy completion rate of more than 80% of patients with positive FITs. These benchmarks were derived from adherence rates in international FIT screening studies in average-risk populations.35–39 (Note that the large US cohort described above33 did not meet these goals.) Ideally, every patient with a positive FIT should undergo diagnostic colonoscopy, but in reality only 50% to 83% actually do. Methods shown to improve adherence include structured screening programs with routine performance reports, provider feedback, and involvement of patient navigators.40–42
Accordingly, several aspects of stool-based testing need to be stressed with patients. Understanding that FOBT is recommended yearly is integral for optimal impact on colorectal cancer incidence and mortality rates.
Additionally, patients should be advised to undergo colonoscopy soon after a positive FIT, because delaying colonoscopy could give precancerous lesions time to progress in stage. The acceptable time between a positive FIT and colonoscopy has yet to be determined. However, a retrospective cohort study of 1.26 million screened patients with 107,000 positive FIT results demonstrated that the rates of cancer discovered on colonoscopy were similar when performed within 30 days or up to 10 months after a positive test. Detection rates increased from 3% to 4.8% at 10 months and to 7.9% at 12 months.43
In modeling studies, Meester et al44 showed the estimated lifetime risk and mortality rates from colorectal cancer and life-years gained from screening are significantly better when colonoscopy is completed within 2 weeks rather than 1 year after a positive FIT. Each additional month after 2 weeks incrementally affected these outcomes, with a 1.4% increase in cancer mortality. These data suggest that colonoscopy should be done soon after a positive FIT result and at a maximum of 10 months.43,44
Screening with FOBT is a multistep process for patients that includes receiving the test kit, collecting the sample, preparing it, returning it, undergoing colonoscopy after a positive test, and repeating in 1 year if negative. The screening program should identify patients at average risk in whom screening is appropriate, ensure delivery of the test, verify the quality of collected samples for laboratory testing against the manufacturer’s recommendations, and report results. Report of a positive FOBT result should provide recommendations for follow-up.
Though evidence clearly supports screening annually or biennially (every 2 years) with FOBT, the ideal interval for FIT is undetermined. Modeling studies utilized by the USPSTF and Multi-Society Task Force demonstrate that colonoscopy and annual FIT result in similar life-years gained, while 2 population-based screening programs have demonstrated that a 2- or 3-year interval may be equally efficacious by lowering the threshold for a positive test.38,45
Randomized controlled trials of screening colonoscopy vs annual and biennial FIT are currently under way. Cost-effectiveness analysis has shown that offering single-sample FITs at more frequent (annual) intervals performs better than multisample testing at less frequent intervals.45–47
Colonoscopy
Compared with stool-based screening, colonoscopy has advantages, including a 10-year screening interval if bowel preparation is adequate and the examination shows no neoplasia, the ability to inspect the entire colon, and the ability to diagnose and treat lesions in the same session.
Screening colonoscopy visualizes the entire colon in more than 98% of cases, although it requires adequate bowel preparation for maximal polyp detection. It can be done safely with or without sedation.48
While there are no available randomized controlled trial data on the impact of screening colonoscopy on cancer incidence or mortality, extensive case-control and cohort studies consistently show that screening colonoscopy reduces cancer incidence and mortality rates.49–54 A US Veterans Administration study of more than 32,000 patients reported a 50% reduction in overall colorectal cancer mortality.55 In a microsimulation modeling study that assumed 100% adherence, colonoscopy every 10 years and annual FIT in individuals ages 50 to 75 provided similar life-years gained per 1,000 people screened (270 for colonoscopy, 244 for FIT).56
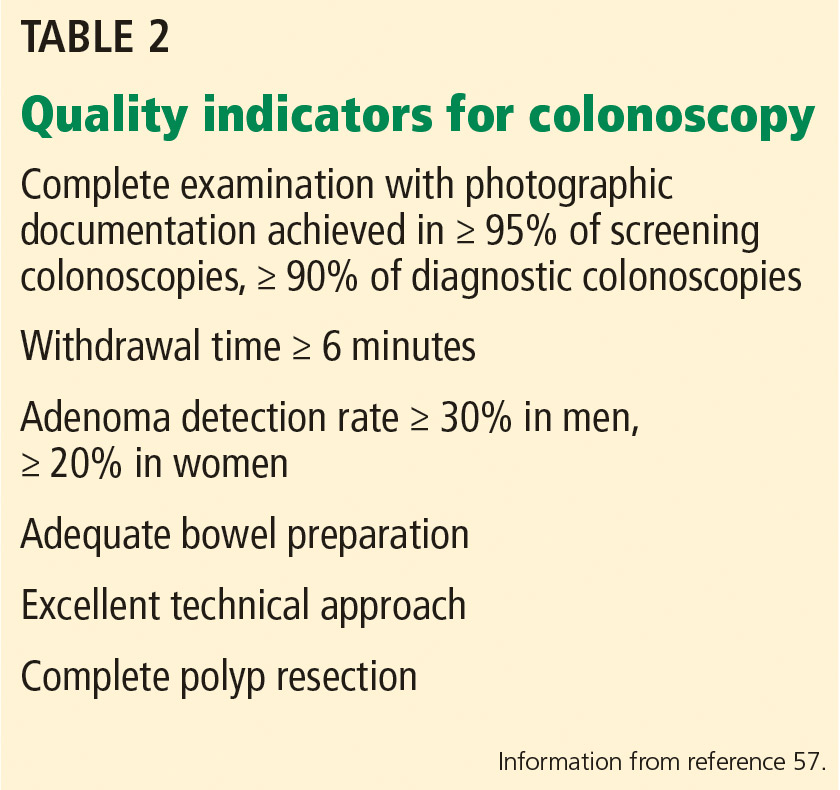
Well-established metrics for maximizing the effectiveness and quality of colonoscopy have been established (Table 2). The most important include the mucosa inspection time (withdrawal time) and adenoma detection rate.57 Withdrawal time is directly correlated with adenoma detection, and a 6-minute minimum withdrawal time is recommended in screening colonoscopy examinations of patients at average risk when no polyps are found.58 The adenoma detection rate is the strongest evidence-based metric, as each 1% increase in the adenoma detection rate over 19% is associated with a 3% decrease in the risk of colorectal cancer and a 5% decrease in death rate.59 The average-risk screening adenoma detection rate differs based on sex: the rate is greater than 20% for women and greater than 30% for men.
Complications from screening, diagnostic, or therapeutic colonoscopy are infrequent but include perforation (4/10,000) and significant intestinal bleeding (8/10,000).56–62
Patients with a first-degree relative under age 60 with advanced adenomas or colorectal cancer are considered at high risk and should begin screening colonoscopy at age 40, with repeat colonoscopy at 5-year intervals, given a trend toward advanced neoplasia detection compared with FIT.63
Guidelines recently published by the Canadian Association of Gastroenterology and endorsed by the American Gastroenterological Association also support starting screening in high-risk individuals at age 40, with a surveillance interval of 5 to 10 years based on the number of first-degree relatives with colorectal cancer or adenomas.64 Consensus statements were based on retrospective cohort, prospective case-controlled, and cross-sectional studies comparing the risk of colorectal cancer in individuals with a family history against those without a family history.
Randomized clinical trials comparing colonoscopy and FIT are under way. Interim analysis of a European trial in which asymptomatic adults ages 50 to 69 were randomized to 1-time colonoscopy (26,703 patients) vs FIT every 2 years (26,599 patients) found significantly higher participation rates in the FIT arm (34.2% vs 24.6%) but higher rates of nonadvanced adenomas (4.2% vs 0.4%) and advanced neoplasia (1.9% vs 0.9%) in the colonoscopy arm.65 Cancer was detected in 0.1% in each arm. These findings correlate with those of another study showing higher participation with FIT but higher advanced neoplasia detection rates with colonoscopy.66
Detection of precursor lesions is vital, as removing neoplasms is the main strategy to reduce colorectal cancer incidence. Accordingly, the advantage of colonoscopy was illustrated by a study that determined that 53 patients would need to undergo screening colonoscopy to detect 1 advanced adenoma or cancerous lesion, compared with 264 for FIT.67
STARTING SCREEING AT AGE 45
The American Cancer Society recently provided a qualified recommendation to start colorectal cancer screening in all individuals at age 45 rather than 50.9 This recommendation was based on modeling studies demonstrating that starting screening at age 45 with colonoscopy every 10 years resulted in 25 life-years gained at the cost of 610 colonoscopies per 1,000 individuals. Alternative strategies included FIT, which resulted in an additional 26 life-years gained per 1,000 individuals screened, flexible sigmoidoscopy (23 life-years gained), and computed tomographic colonoscopy (22 life-years gained).
Rates of colorectal cancer are rising in adults under age 50, and 10,000 new cases are anticipated this year.2,3 Currently, 22 million US adults are between the ages of 45 and 50. The system and support needed to perform screening in all adults over age 45 and a lack of direct evidence to support its benefits in the young population need to be considered before widespread acceptance of the American Cancer Society recommendations. However, if screening is considered, FIT with or without sigmoidoscopy may be appropriate, given that most cancers diagnosed in individuals under age 50 are left-sided.4,5
Screening has not been proven to reduce all-cause mortality. Randomized controlled trials of FOBT and observational studies of colonoscopy show that screening reduces cancer incidence and mortality. Until the currently ongoing randomized controlled trials comparing colonoscopy with FIT are completed, their comparative impact on colorectal cancer end points is unknown.
PATIENT ADHERENCE IS KEY
FIT and colonoscopy are the most prevalent screening methods in the United States. Careful attention should be given to offer the screening option the patient is most likely to complete, as adherence is key to the benefit from colorectal cancer screening.
The National Colorectal Cancer Roundtable (nccrt.org), established in 1997 by the American Cancer Society and the US Centers for Disease Control and Prevention, is a national coalition of public and private organizations dedicated to reducing colorectal cancer incidence and mortality. The Roundtable waged a national campaign to achieve a colorectal cancer screening rate of 80% in eligible adults by 2018, a goal that was not met. Still, the potential for a substantial impact is a compelling reason to endorse adherence to colorectal cancer screening. The Roundtable provides many resources for physicians to enhance screening in their practice.
The United States has seen a steady decline in colorectal cancer incidence and mortality, mainly as a result of screening. Colorectal cancer is preventable with ensuring patients’ adherence to screening. Screening rates have been shown to increase with patient-provider dialogue and with selection of a screening program the patient prefers and is most likely to complete.
- American Cancer Society. Colorectal Cancer Facts & Figures 2017–2019. Atlanta: American Cancer Society; 2017. https://www.cancer.org/content/dam/cancer-org/research/cancer-facts-and-statistics/colorectal-cancer-facts-and-figures/colorectal-cancer-facts-and-figures-2017-2019.pdf. Accessed April 1, 2019.
- Siegel RL, Miller KD, Fedewa SA, et al. Colorectal cancer statistics, 2017. CA Cancer J Clin 2017; 67(3):177–193. doi:10.3322/caac.21395
- Kopetz S, Chang GJ, Overman MJ, et al. Improved survival in metastatic colorectal cancer is associated with adoption of hepatic resection and improved chemotherapy. J Clin Oncol 2009; 27(22):3677–3683. doi:10.1200/JCO.2008.20.5278
- Siegel RL, Jemal A, Ward EM. Increase in incidence of colorectal cancer among young men and women in the United States. Cancer Epidemiol Biomarkers Prev 2009; 18(6):1695–1698. doi:10.1158/1055-9965.EPI-09-0186
- Bailey CE, Hu CY, You YN, et al. Increasing disparities in the age-related incidences of colon and rectal cancers in the United States, 1975-2010. JAMA Surg 2015; 150(1):17–22. doi:10.1001/jamasurg.2014.1756
- Centers for Disease Control and Prevention (CDC). Vital signs: colorectal cancer screening test use—United States, 2012. MMWR Morb Mortal Wkly Rep 2013; 62(44):881–888. pmid:24196665
- Siegel RL, Sahar L, Robbins A, Jemal A. Where can colorectal cancer screening interventions have the most impact? Cancer Epidemiol Biomarkers Prev 2015; 24(8):1151–1156. doi:10.1158/1055-9965.EPI-15-0082
- Agrawal S, Bhupinderjit A, Bhutani MS, et al; Committee of Minority Affairs and Cultural Diversity, American College of Gastroenterology. Colorectal cancer in African Americans. Am J Gastroenterol 2005; 100(3):515–523. doi:10.1111/j.1572-0241.2005.41829.x
- Wolf AMD, Fontham ETH, Church TR, et al. Colorectal cancer screening for average-risk adults: 2018 guideline update from the American Cancer Society. CA Cancer J Clin 2018; 68(4):250–281. doi:10.3322/caac.21457
- Rex DK, Boland CR, Dominitz JA, et al. Colorectal cancer screening: recommendations for physicians and patients from the US Multi-Society Task Force on Colorectal Cancer. Am J Gastroenterol 2017; 112(7):1016–1030. doi:10.1038/ajg.2017.174
- US Preventive Services Task Force; Bibbins-Domingo K, Grossman DC, Curry SJ, et al. Screening for colorectal cancer: US Preventive Services Task Force Recommendation Statement. JAMA 2016; 315(23):2564–2575. doi:10.1001/jama.2016.5989
- Inadomi JM, Vijan S, Janz NK, et al. Adherence to colorectal cancer screening: a randomized clinical trial of competing strategies. Arch Intern Med 2012; 172(7):575–582. doi:10.1001/archinternmed.2012.332
- Steinwachs D, Allen JD, Barlow WE, et al. National Institutes of Health state-of-the-science conference statement: enhancing use and quality of colorectal cancer screening. Ann Intern Med 2010; 152(10):663–667. doi:10.7326/0003-4819-152-10-201005180-00237
- Subramanian S, Klosterman M, Amonkar MM, Hunt TL. Adherence with colorectal cancer screening guidelines: a review. Prev Med 2004; 38(5):536–550. doi:10.1016/j.ypmed.2003.12.011
- Levin B, Lieberman DA, McFarland B, et al; American Cancer Society Colorectal Cancer Advisory Group; US Multi-Society Task Force; American College of Radiology Colon Cancer Committee. Screening and surveillance for the early detection of colorectal cancer and adenomatous polyps, 2008: a joint guideline from the American Cancer Society, the US Multi-Society Task Force on Colorectal Cancer, and the American College of Radiology. CA Cancer J Clin 2008; 58(3):130–160. doi:10.3322/CA.2007.0018
- Sinatra MA, St John DJ, Young GP. Interference of plant peroxidases with guaiac-based fecal occult blood tests is avoidable. Clin Chem 1999; 45(1):123–126. pmid:9895348
- Allison JE, Sakoda LC, Levin TR, et al. Screening for colorectal neoplasms with new fecal occult blood tests: update on performance characteristics. J Natl Cancer Inst 2007; 99(19):1462–1470. doi:10.1093/jnci/djm150
- Mandel JS, Bond JH, Church TR, et al. Reducing mortality from colorectal cancer by screening for fecal occult blood. Minnesota Colon Cancer Control Study. N Engl J Med 1993; 328(19):1365–1371. doi:10.1056/NEJM199305133281901
- Hardcastle JD, Chamberlain JO, Robinson MH, et al. Randomised controlled trial of faecal-occult-blood screening for colorectal cancer. Lancet 1996; 348(9040):1472–1477. doi:10.1016/S0140-6736(96)03386-7
- Kronborg O, Fenger C, Olsen J, Jørgensen OD, Søndergaard O. Randomised study of screening for colorectal cancer with faecal-occult-blood test. Lancet 1996; 348(9040):1467–1471. doi:10.1016/S0140-6736(96)03430-7
- Wilson JMG, Junger G. Principles and practice of screening for disease. Geneva, Switzerland: World Health Organization; 1968. http://apps.who.int/iris/bitstream/handle/10665/37650/WHO_PHP_34.pdf?sequence=17. Accessed April 1, 2019.
- Shaukat A, Mongin SJ, Geisser MS, et al. Long-term mortality after screening for colorectal cancer. N Engl J Med 2013; 369(12):1106–1114. doi:10.1056/NEJMoa1300720
- Allison JE, Tekawa IS, Ransom LJ, Adrain AL. A comparison of fecal occult-blood tests for colorectal-cancer screening. N Engl J Med 1996; 334(3):155–159. doi:10.1056/NEJM199601183340304
- Shapiro JA, Bobo JK, Church TR, et al. A comparison of fecal immunochemical and high-sensitivity guaiac tests for colorectal cancer screening. Am J Gastroenterol 2017; 112(11):1728–1735. doi:10.1038/ajg.2017.285
- Smith A, Young GP, Cole SR, Bampton P. Comparison of a brush-sampling fecal immunochemical test for hemoglobin with a sensitive guaiac-based fecal occult blood test in detection of colorectal neoplasia. Cancer 2006; 107(9):2152–2159. doi:10.1002/cncr.22230
- Brenner H, Tao S. Superior diagnostic performance of faecal immunochemical tests for haemoglobin in a head-to-head comparison with guaiac based faecal occult blood test among 2235 participants of screening colonoscopy. Eur J Cancer 2013; 49(14):3049–3054. doi:10.1016/j.ejca.2013.04.023
- Young GP, Cole S. New stool screening tests for colorectal cancer. Digestion 2007; 76(1):26–33. doi:10.1159/000108391
- van Rossum LG, van Rijn AF, Laheij RJ, et al. Random comparison of guaiac and immunochemical fecal occult blood tests for colorectal cancer in a screening population. Gastroenterology 2008; 135(1):82–90. doi:10.1053/j.gastro.2008.03.040
- Hassan C, Giorgi Rossi P, Camilloni L, et al. Meta-analysis: adherence to colorectal cancer screening and the detection rate for advanced neoplasia, according to the type of screening test. Aliment Pharmacol Ther 2012; 36(10):929–940. doi:10.1111/apt.12071
- Vart G, Banzi R, Minozzi S. Comparing participation rates between immunochemical and guaiac faecal occult blood tests: a systematic review and meta-analysis. Prev Med 2012; 55(2):87–92. doi:10.1016/j.ypmed.2012.05.006
- Imperiale TF, Ransohoff DF, Itzkowitz SH, et al. Multitarget stool DNA testing for colorectal-cancer screening. N Engl J Med 2014; 370(14):1287–1297. doi:10.1056/NEJMoa1311194
- Lee JK, Liles EG, Bent S, Levin TR, Corley DA. Accuracy of fecal immunochemical tests for colorectal cancer: systematic review and meta-analysis. Ann Intern Med 2014; 160(3):171. doi:10.7326/M13-1484
- Jensen CD, Corley DA, Quinn VP, et al. Fecal immunochemical test program performance over 4 rounds of annual screening: a retrospective cohort study. Ann Intern Med 2016; 164(7):456–463. doi:10.7326/M15-0983
- Robertson DJ, Lee JK, Boland CR, et al. Recommendations on fecal immunochemical testing to screen for colorectal neoplasia: a consensus statement by the US Multi-Society Task Force on Colorectal Cancer. Gastroenterology 2017; 152(5):1217–1237.e3. doi:10.1053/j.gastro.2016.08.053
- Rabeneck L, Rumble RB, Thompson F, et al. Fecal immunochemical tests compared with guaiac fecal occult blood tests for population-based colorectal cancer screening. Can J Gastroenterol 2012; 26(3):131–147. pmid:22408764
- Logan RF, Patnick J, Nickerson C, Coleman L, Rutter MD, von Wagner C; English Bowel Cancer Screening Evaluation Committee. Outcomes of the Bowel Cancer Screening Programme (BCSP) in England after the first 1 million tests. Gut 2012; 61(10):1439–1446. doi:10.1136/gutjnl-2011-300843
- Malila N, Oivanen T, Malminiemi O, Hakama M. Test, episode, and programme sensitivities of screening for colorectal cancer as a public health policy in Finland: experimental design. BMJ 2008; 337:a2261. doi:10.1136/bmj.a2261
- Denters MJ, Deutekom M, Bossuyt PM, Stroobants AK, Fockens P, Dekker E. Lower risk of advanced neoplasia among patients with a previous negative result from a fecal test for colorectal cancer. Gastroenterology 2012; 142(3):497–504. doi:10.1053/j.gastro.2011.11.024
- van Roon AH, Goede SL, van Ballegooijen M, et al. Random comparison of repeated faecal immunochemical testing at different intervals for population-based colorectal cancer screening. Gut 2013; 62(3):409–415. doi:10.1136/gutjnl-2011-301583
- Chubak J, Garcia MP, Burnett-Hartman AN, et al; PROSPR consortium. Time to colonoscopy after positive fecal blood test in four US health care systems. Cancer Epidemiol Biomarkers Prev 2016; 25(2):344–350. doi:10.1158/1055-9965.EPI-15-0470
- Carlson CM, Kirby KA, Casadei MA, Partin MR, Kistler CE, Walter LC. Lack of follow-up after fecal occult blood testing in older adults: inappropriate screening or failure to follow up? Arch Intern Med 2011; 171(3):249–256. doi:10.1001/archinternmed.2010.372
- Selby K, Baumgartner C, Levin TR, et al. Interventions to improve follow-up of positive results on fecal blood tests: a systematic review. Ann Intern Med 2017; 167(8):565–575. doi:10.7326/M17-1361
- Corley DA, Jensen CD, Quinn VP, et al. Association between time to colonoscopy after a positive fecal test result and risk of colorectal cancer and cancer stage at diagnosis. JAMA 2017; 317(16):1631–1641. doi:10.1001/jama.2017.3634
- Meester RG, Zauber AG, Doubeni CA, et al. Consequences of increasing time to colonoscopy examination after positive result from fecal colorectal cancer screening test. Clin Gastroenterol Hepatol 2016; 14(10):1445–1451.e8. doi:10.1016/j.cgh.2016.05.017
- Haug U, Grobbee EJ, Lansdorp-Vogelaar I, Spaander MCW, Kuipers EJ. Immunochemical faecal occult blood testing to screen for colorectal cancer: can the screening interval be extended? Gut 2017; 66(7):1262–1267. doi:10.1136/gutjnl-2015-310102
- Goede SL, van Roon AH, Reijerink JC, et al. Cost-effectiveness of one versus two sample faecal immunochemical testing for colorectal cancer screening. Gut 2013; 62(5):727–734. doi:10.1136/gutjnl-2011-301917
- Digby J, Fraser CG, Carey FA, Steele RJC. Can the performance of a quantitative FIT-based colorectal cancer screening programme be enhanced by lowering the threshold and increasing the interval? Gut 2018; 67(5):993–994. doi:10.1136/gutjnl-2017-314862
- Hoffman MS, Butler TW, Shaver T. Colonoscopy without sedation. J Clin Gastroenterol 1998; 26(4):279–282. pmid:9649011
- Zauber AG, Winawer SJ, O’Brien MJ, et al. Colonoscopic polypectomy and long-term prevention of colorectal-cancer deaths. N Engl J Med 2012; 366(8):687–696. doi:10.1056/NEJMoa1100370
- Nishihara R, Wu K, Lochhead P, et al. Long-term colorectal-cancer incidence and mortality after lower endoscopy. N Engl J Med 2013; 369(12):1095–1105. doi:10.1056/NEJMoa1301969
- Løberg M, Kalager M, Holme Ø, Hoff G, Adami HO, Bretthauer M. Long-term colorectal-cancer mortality after adenoma removal. N Engl J Med 2014; 371(9):799–807. doi:10.1056/NEJMoa1315870
- Manser CN, Bachmann LM, Brunner J, Hunold F, Bauerfeind P, Marbet UA. Colonoscopy screening markedly reduces the occurrence of colon carcinomas and carcinoma-related death: a closed cohort study. Gastrointest Endosc 2012; 76(1):110–117. doi:10.1016/j.gie.2012.02.040
- Winawer SJ, Zauber AG, Ho MN, et al. Prevention of colorectal cancer by colonoscopic polypectomy. The National Polyp Study Workgroup. N Engl J Med 1993; 329(27):1977–1981. doi:10.1056/NEJM199312303292701
- Citarda F, Tomaselli G, Capocaccia R, Barcherini S, Crespi M; Italian Multicentre Study Group. Efficacy in standard clinical practice of colonoscopic polypectomy in reducing colorectal cancer incidence. Gut 2001; 48(6):812–815. pmid:11358901
- Muller AD, Sonnenberg A. Prevention of colorectal cancer by flexible endoscopy and polypectomy. A case-control study of 32,702 veterans. Ann Intern Med 1995; 123(12):904–910. pmid:7486484
- Knudsen AB, Zauber AG, Rutter CM, et al. Estimation of benefits, burden, and harms of colorectal cancer screening strategies: modeling study for the US Preventive Services Task Force. JAMA 2016; 315(23):2595–2609. doi:10.1001/jama.2016.6828
- Rex DK, Schoenfeld PS, Cohen J, et al. Quality indicators for colonoscopy. Gastrointest Endosc 2015; 81(1):31–53. doi:10.1016/j.gie.2014.07.058
- Barclay RL, Vicari JJ, Doughty AS, Johanson JF, Greenlaw RL. Colonoscopic withdrawal times and adenoma detection during screening colonoscopy. N Engl J Med 2006; 355(24):2533–2541. doi:10.1056/NEJMoa055498
- Corley DA, Levin TR, Doubeni CA. Adenoma detection rate and risk of colorectal cancer and death. N Engl J Med 2014; 370(26):2541. doi:10.1056/NEJMc1405329
- Lin JS, Piper MA, Perdue LA, et al. Screening for colorectal cancer: updated evidence report and systematic review for the US Preventive Services Task Force. JAMA 2016; 315(23):2576–2594. doi:10.1001/jama.2016.3332
- Gatto NM, Frucht H, Sundararajan V, Jacobson JS, Grann VR, Neugut AI. Risk of perforation after colonoscopy and sigmoidoscopy: a population-based study. J Natl Cancer Inst 2003; 95(3):230–236. pmid:12569145
- Warren JL, Klabunde CN, Mariotto AB, et al. Adverse events after outpatient colonoscopy in the Medicare population. Ann Intern Med 2009; 150(12):849–857, W152. pmid:19528563
- Quintero E, Carrillo M, Gimeno-García AZ, et al. Equivalency of fecal immunochemical tests and colonoscopy in familial colorectal cancer screening. Gastroenterology 2014; 147(5):1021–130.e1. doi:10.1053/j.gastro.2014.08.004
- Leddin D, Lieberman DA, Tse F, et al. Clinical practice guideline on screening for colorectal cancer in individuals with a family history of nonhereditary colorectal cancer or adenoma: the Canadian Association of Gastroenterology Banff Consensus. Gastroenterology 2018; 155(5):1325–1347.e3. doi:10.1053/j.gastro.2018.08.017
- Quintero E, Castells A, Bujanda L, et al; COLONPREV Study Investigators. Colonoscopy versus fecal immunochemical testing in colorectal-cancer screening. N Engl J Med 2012; 366(8):697–706. doi:10.1056/NEJMoa1108895
- Gupta S, Halm EA, Rockey DC, et al. Comparative effectiveness of fecal immunochemical test outreach, colonoscopy outreach, and usual care for boosting colorectal cancer screening among the underserved: a randomized clinical trial. JAMA Intern Med 2013; 173(18):1725–1732. doi:10.1001/jamainternmed.2013.9294
- Segnan N, Senore C, Andreoni B, et al; SCORE3 Working Group-Italy. Comparing attendance and detection rate of colonoscopy with sigmoidoscopy and FIT for colorectal cancer screening. Gastroenterology 2007; 132(7):2304–2312. doi:10.1053/j.gastro.2007.03.030
Screening can help prevent colorectal cancer. The United States has seen a steady decline in colorectal cancer incidence and mortality, thanks in large part to screening. Screening rates can be increased with good patient-physician dialogue and by choosing a method the patient prefers and is most likely to complete.
In this article, we review a general approach to screening, focusing on the most commonly used methods in the United States, ie, the guaiac-based fecal occult blood test (FOBT), the fecal immunochemical test (FIT), and colonoscopy. We discuss current colorectal cancer incidence rates, screening recommendations, and how to choose the appropriate screening test.
This article does not discuss patients at high risk of polyps or cancer due to hereditary colon cancer syndromes, a personal history of colorectal neoplasia, inflammatory bowel disease, or primary sclerosing cholangitis.
TRENDS IN INCIDENCE
Colorectal cancer is the second most common type of cancer and cause of cancer-related deaths in the United States, responsible for an estimated 50,000 deaths in 2017. The lifetime risk of its occurrence is estimated to be 1 in 21 men and 1 in 23 women.1 Encouragingly, the incidence has declined by 24% over the last 30 years,2 and by 3% per year from 2004 to 2013.1 Also, as a result of screening and advances in treatment, 5-year survival rates for patients with colorectal cancer have increased, from 48.6% in 1975 to 66.4% in 2009.2
When detected at a localized stage, the 5-year survival rate in colorectal cancer is greater than 90%. Unfortunately, it is diagnosed early in only 39% of patients. And despite advances in treatment and a doubling of the 5-year survival rate in patients with advanced cancers since 1990,3 the latter is only 14%. In most patients, cancer is diagnosed when it has spread to the lymph nodes (36%) or to distant organs (22%), and the survival rate declines to 71% after lymph-node spread, and 14% after metastasis to distant organs.
It is essential to screen people who have no symptoms, as symptoms such as gastrointestinal bleeding, unexplained abdominal pain or weight loss, a persistent change in bowel movements, and bowel obstruction typically do not arise until the disease is advanced and less amenable to cure.
Increasing prevalence in younger adults
Curiously, the incidence of colorectal cancer is increasing in white US adults under age 50. Over the last 30 years, incidence rates have increased from 1.0% to 2.4% annually in adults ages 20 to 39.4 Based on current trends, colon cancer rates are expected to increase by 90% for patients ages 20 to 34 and by 28% for patients 35 to 49 by 2030.5
Although recommendations vary for colorectal cancer screening in patients under age 50, clinicians should investigate symptoms such as rectal bleeding, unexplained iron deficiency anemia, progressive abdominal pain, and persistent changes in bowel movements.
Other challenges
Despite the benefits of screening, it is underutilized. Although rates of compliance with screening recommendations have increased 10% over the last 10 years, only 65% of eligible adults currently comply.1,6
Additionally, certain areas of the country such as Appalachia and the Mississippi Delta have not benefited from the decline in the national rate of colorectal cancer.7
SCREENING GUIDELINES
Most guidelines say that colorectal cancer screening should begin at age 50 in people at average risk with no symptoms. However, the American College of Gastroenterology (ACG) recommends beginning screening at age 45 in African Americans, as this group has higher incidence and mortality rates of colorectal cancer.8 Also, the American Cancer Society recently recommended beginning screening at age 45 for all individuals.9
Screening can stop at age 75 for most patients, according to the ACG,8 the US Multi-Society Task Force on Colorectal Cancer,10 and the US Preventive Services Task Force (USPSTF).11 However, the decision should be individualized for patients ages 76 to 85. Patients within that age group who are in good health and have not previously been screened are more likely to benefit than those who have previously been screened and had a negative screening test. Patients over age 85 should not begin or continue screening, because of diminished benefit of screening in this age group, shorter life expectancy, advanced comorbid conditions, and the risks of colonoscopy and cancer treatment.
Patients and clinicians are encouraged to collaborate in deciding which screening method is appropriate. Patients adhere better when they are given a choice in the matter.12–14 And adherence is the key to effective colorectal cancer screening.
Familiarity with the key characteristics of currently available colorectal cancer screening tests will facilitate discussion with patients.
Opportunistic vs programmatic screening
Screening can be classified according to the approach to the patient or population and the intent of the test. Most screening in the United States is opportunistic rather than programmatic—that is, the physician offers the patient screening at the point of service without systematic follow-up or patient re-engagement.
In a programmatic approach, the patient is offered screening through an organized program that streamlines services, reduces overscreening, and provides systematic follow-up of testing.
DISCUSSING THE OPTIONS
Stool studies such as FOBT and FIT do not reliably detect cancer precursors such as adenomas and serrated neoplasms. If an FOBT is positive, follow-up diagnostic colonoscopy is required. Unlike screening colonoscopy, diagnostic colonoscopy requires a copayment for Medicare patients, and this should be explained to the patient.
FIT and FOBT detect hemolyzed blood within a stool sample, FOBT by a chemical reaction, and FIT by detecting a globin-specific antibody. Colorectal cancer and some large adenomatous polyps may intermittently bleed and result in occult blood in the stool, iron deficiency anemia, or hematochezia.15
Fecal occult blood testing
Historically, FOBT was the stool test of choice for screening. It uses an indirect enzymatic reaction to detect hemolyzed blood in the stool. When a specimen containing hemoglobin is added to guaiac paper and a drop of hydrogen peroxide is added to “develop” it, the peroxidase activity of hemoglobin turns the guaiac blue.
Screening with FOBT involves annual testing of 3 consecutively passed stools from different days; FOBT should not be performed at the time of digital rectal examination or if the patient is having overt rectal, urinary, or menstrual bleeding.
Dietary and medication restrictions before and during the testing period are critical, as red meat contains hemoglobin, and certain vegetables (eg, radishes, turnips, cauliflower, cucumbers) contain peroxidase, all of which can cause a false-positive result. Waiting 3 days after the stool sample is collected to develop it can mitigate the peroxidase activity of vegetables.16 Vitamin C inhibits heme peroxidase activity and leads to false-negative results. Aspirin and high-dose nonsteroidal anti-inflammatory drugs can promote bleeding throughout the intestinal tract.17
In randomized controlled trials,18–21 screening with FOBT reduced colorectal cancer mortality rates by 15% to 33%. The 30-year follow-up of a large US trial22 found a 32% relative reduction in mortality rates in patients randomized to annual screening, and a 22% relative reduction in those randomized to screening every 2 years. Despite the many possibilities for false-positive results, the specificity for detecting cancer has ranged from 86.7% to 97.3%, and the sensitivity from 37.1% to 79.4%, highlighting the benefit of colorectal cancer screening programs in unscreened populations.23–26
FIT vs FOBT in current practice
FIT should replace FOBT as the preferred stool screening method. Instead of an enzymatic reaction that can be altered by food or medication, FIT utilizes an antibody specific to human globin to directly detect hemolyzed blood, thus eliminating the need to modify the diet or medications.27 Additionally, only 1 stool specimen is needed, which may explain why the adherence rate was about 20% higher with FIT than with FOBT in most studies.28–30
FIT has a sensitivity of 69% to 86% for colorectal cancer and a specificity of 92% to 95%.31 The sensitivity can be improved by lowering the threshold value for a positive test, but this is associated with a decrease in specificity. A single FIT has the same sensitivity and specificity as several samples.32
In a large retrospective US cohort study of programmatic screening with FIT, Jensen et al33 reported that 48% of 670,841 people who were offered testing actually did the test. Of the 48% who participated in the first round and remained eligible, 75% to 86% participated in subsequent rounds over 4 years. Those who had a positive result on FIT were supposed to undergo colonoscopy, but 22% did not.
The US Multi-Society Task Force on Colorectal Cancer34 suggests that FIT-based screening programs aim for a target FIT completion rate of more than 60% and a target colonoscopy completion rate of more than 80% of patients with positive FITs. These benchmarks were derived from adherence rates in international FIT screening studies in average-risk populations.35–39 (Note that the large US cohort described above33 did not meet these goals.) Ideally, every patient with a positive FIT should undergo diagnostic colonoscopy, but in reality only 50% to 83% actually do. Methods shown to improve adherence include structured screening programs with routine performance reports, provider feedback, and involvement of patient navigators.40–42
Accordingly, several aspects of stool-based testing need to be stressed with patients. Understanding that FOBT is recommended yearly is integral for optimal impact on colorectal cancer incidence and mortality rates.
Additionally, patients should be advised to undergo colonoscopy soon after a positive FIT, because delaying colonoscopy could give precancerous lesions time to progress in stage. The acceptable time between a positive FIT and colonoscopy has yet to be determined. However, a retrospective cohort study of 1.26 million screened patients with 107,000 positive FIT results demonstrated that the rates of cancer discovered on colonoscopy were similar when performed within 30 days or up to 10 months after a positive test. Detection rates increased from 3% to 4.8% at 10 months and to 7.9% at 12 months.43
In modeling studies, Meester et al44 showed the estimated lifetime risk and mortality rates from colorectal cancer and life-years gained from screening are significantly better when colonoscopy is completed within 2 weeks rather than 1 year after a positive FIT. Each additional month after 2 weeks incrementally affected these outcomes, with a 1.4% increase in cancer mortality. These data suggest that colonoscopy should be done soon after a positive FIT result and at a maximum of 10 months.43,44
Screening with FOBT is a multistep process for patients that includes receiving the test kit, collecting the sample, preparing it, returning it, undergoing colonoscopy after a positive test, and repeating in 1 year if negative. The screening program should identify patients at average risk in whom screening is appropriate, ensure delivery of the test, verify the quality of collected samples for laboratory testing against the manufacturer’s recommendations, and report results. Report of a positive FOBT result should provide recommendations for follow-up.
Though evidence clearly supports screening annually or biennially (every 2 years) with FOBT, the ideal interval for FIT is undetermined. Modeling studies utilized by the USPSTF and Multi-Society Task Force demonstrate that colonoscopy and annual FIT result in similar life-years gained, while 2 population-based screening programs have demonstrated that a 2- or 3-year interval may be equally efficacious by lowering the threshold for a positive test.38,45
Randomized controlled trials of screening colonoscopy vs annual and biennial FIT are currently under way. Cost-effectiveness analysis has shown that offering single-sample FITs at more frequent (annual) intervals performs better than multisample testing at less frequent intervals.45–47
Colonoscopy
Compared with stool-based screening, colonoscopy has advantages, including a 10-year screening interval if bowel preparation is adequate and the examination shows no neoplasia, the ability to inspect the entire colon, and the ability to diagnose and treat lesions in the same session.
Screening colonoscopy visualizes the entire colon in more than 98% of cases, although it requires adequate bowel preparation for maximal polyp detection. It can be done safely with or without sedation.48
While there are no available randomized controlled trial data on the impact of screening colonoscopy on cancer incidence or mortality, extensive case-control and cohort studies consistently show that screening colonoscopy reduces cancer incidence and mortality rates.49–54 A US Veterans Administration study of more than 32,000 patients reported a 50% reduction in overall colorectal cancer mortality.55 In a microsimulation modeling study that assumed 100% adherence, colonoscopy every 10 years and annual FIT in individuals ages 50 to 75 provided similar life-years gained per 1,000 people screened (270 for colonoscopy, 244 for FIT).56
Well-established metrics for maximizing the effectiveness and quality of colonoscopy have been established (Table 2). The most important include the mucosa inspection time (withdrawal time) and adenoma detection rate.57 Withdrawal time is directly correlated with adenoma detection, and a 6-minute minimum withdrawal time is recommended in screening colonoscopy examinations of patients at average risk when no polyps are found.58 The adenoma detection rate is the strongest evidence-based metric, as each 1% increase in the adenoma detection rate over 19% is associated with a 3% decrease in the risk of colorectal cancer and a 5% decrease in death rate.59 The average-risk screening adenoma detection rate differs based on sex: the rate is greater than 20% for women and greater than 30% for men.
Complications from screening, diagnostic, or therapeutic colonoscopy are infrequent but include perforation (4/10,000) and significant intestinal bleeding (8/10,000).56–62
Patients with a first-degree relative under age 60 with advanced adenomas or colorectal cancer are considered at high risk and should begin screening colonoscopy at age 40, with repeat colonoscopy at 5-year intervals, given a trend toward advanced neoplasia detection compared with FIT.63
Guidelines recently published by the Canadian Association of Gastroenterology and endorsed by the American Gastroenterological Association also support starting screening in high-risk individuals at age 40, with a surveillance interval of 5 to 10 years based on the number of first-degree relatives with colorectal cancer or adenomas.64 Consensus statements were based on retrospective cohort, prospective case-controlled, and cross-sectional studies comparing the risk of colorectal cancer in individuals with a family history against those without a family history.
Randomized clinical trials comparing colonoscopy and FIT are under way. Interim analysis of a European trial in which asymptomatic adults ages 50 to 69 were randomized to 1-time colonoscopy (26,703 patients) vs FIT every 2 years (26,599 patients) found significantly higher participation rates in the FIT arm (34.2% vs 24.6%) but higher rates of nonadvanced adenomas (4.2% vs 0.4%) and advanced neoplasia (1.9% vs 0.9%) in the colonoscopy arm.65 Cancer was detected in 0.1% in each arm. These findings correlate with those of another study showing higher participation with FIT but higher advanced neoplasia detection rates with colonoscopy.66
Detection of precursor lesions is vital, as removing neoplasms is the main strategy to reduce colorectal cancer incidence. Accordingly, the advantage of colonoscopy was illustrated by a study that determined that 53 patients would need to undergo screening colonoscopy to detect 1 advanced adenoma or cancerous lesion, compared with 264 for FIT.67
STARTING SCREEING AT AGE 45
The American Cancer Society recently provided a qualified recommendation to start colorectal cancer screening in all individuals at age 45 rather than 50.9 This recommendation was based on modeling studies demonstrating that starting screening at age 45 with colonoscopy every 10 years resulted in 25 life-years gained at the cost of 610 colonoscopies per 1,000 individuals. Alternative strategies included FIT, which resulted in an additional 26 life-years gained per 1,000 individuals screened, flexible sigmoidoscopy (23 life-years gained), and computed tomographic colonoscopy (22 life-years gained).
Rates of colorectal cancer are rising in adults under age 50, and 10,000 new cases are anticipated this year.2,3 Currently, 22 million US adults are between the ages of 45 and 50. The system and support needed to perform screening in all adults over age 45 and a lack of direct evidence to support its benefits in the young population need to be considered before widespread acceptance of the American Cancer Society recommendations. However, if screening is considered, FIT with or without sigmoidoscopy may be appropriate, given that most cancers diagnosed in individuals under age 50 are left-sided.4,5
Screening has not been proven to reduce all-cause mortality. Randomized controlled trials of FOBT and observational studies of colonoscopy show that screening reduces cancer incidence and mortality. Until the currently ongoing randomized controlled trials comparing colonoscopy with FIT are completed, their comparative impact on colorectal cancer end points is unknown.
PATIENT ADHERENCE IS KEY
FIT and colonoscopy are the most prevalent screening methods in the United States. Careful attention should be given to offer the screening option the patient is most likely to complete, as adherence is key to the benefit from colorectal cancer screening.
The National Colorectal Cancer Roundtable (nccrt.org), established in 1997 by the American Cancer Society and the US Centers for Disease Control and Prevention, is a national coalition of public and private organizations dedicated to reducing colorectal cancer incidence and mortality. The Roundtable waged a national campaign to achieve a colorectal cancer screening rate of 80% in eligible adults by 2018, a goal that was not met. Still, the potential for a substantial impact is a compelling reason to endorse adherence to colorectal cancer screening. The Roundtable provides many resources for physicians to enhance screening in their practice.
The United States has seen a steady decline in colorectal cancer incidence and mortality, mainly as a result of screening. Colorectal cancer is preventable with ensuring patients’ adherence to screening. Screening rates have been shown to increase with patient-provider dialogue and with selection of a screening program the patient prefers and is most likely to complete.
Screening can help prevent colorectal cancer. The United States has seen a steady decline in colorectal cancer incidence and mortality, thanks in large part to screening. Screening rates can be increased with good patient-physician dialogue and by choosing a method the patient prefers and is most likely to complete.
In this article, we review a general approach to screening, focusing on the most commonly used methods in the United States, ie, the guaiac-based fecal occult blood test (FOBT), the fecal immunochemical test (FIT), and colonoscopy. We discuss current colorectal cancer incidence rates, screening recommendations, and how to choose the appropriate screening test.
This article does not discuss patients at high risk of polyps or cancer due to hereditary colon cancer syndromes, a personal history of colorectal neoplasia, inflammatory bowel disease, or primary sclerosing cholangitis.
TRENDS IN INCIDENCE
Colorectal cancer is the second most common type of cancer and cause of cancer-related deaths in the United States, responsible for an estimated 50,000 deaths in 2017. The lifetime risk of its occurrence is estimated to be 1 in 21 men and 1 in 23 women.1 Encouragingly, the incidence has declined by 24% over the last 30 years,2 and by 3% per year from 2004 to 2013.1 Also, as a result of screening and advances in treatment, 5-year survival rates for patients with colorectal cancer have increased, from 48.6% in 1975 to 66.4% in 2009.2
When detected at a localized stage, the 5-year survival rate in colorectal cancer is greater than 90%. Unfortunately, it is diagnosed early in only 39% of patients. And despite advances in treatment and a doubling of the 5-year survival rate in patients with advanced cancers since 1990,3 the latter is only 14%. In most patients, cancer is diagnosed when it has spread to the lymph nodes (36%) or to distant organs (22%), and the survival rate declines to 71% after lymph-node spread, and 14% after metastasis to distant organs.
It is essential to screen people who have no symptoms, as symptoms such as gastrointestinal bleeding, unexplained abdominal pain or weight loss, a persistent change in bowel movements, and bowel obstruction typically do not arise until the disease is advanced and less amenable to cure.
Increasing prevalence in younger adults
Curiously, the incidence of colorectal cancer is increasing in white US adults under age 50. Over the last 30 years, incidence rates have increased from 1.0% to 2.4% annually in adults ages 20 to 39.4 Based on current trends, colon cancer rates are expected to increase by 90% for patients ages 20 to 34 and by 28% for patients 35 to 49 by 2030.5
Although recommendations vary for colorectal cancer screening in patients under age 50, clinicians should investigate symptoms such as rectal bleeding, unexplained iron deficiency anemia, progressive abdominal pain, and persistent changes in bowel movements.
Other challenges
Despite the benefits of screening, it is underutilized. Although rates of compliance with screening recommendations have increased 10% over the last 10 years, only 65% of eligible adults currently comply.1,6
Additionally, certain areas of the country such as Appalachia and the Mississippi Delta have not benefited from the decline in the national rate of colorectal cancer.7
SCREENING GUIDELINES
Most guidelines say that colorectal cancer screening should begin at age 50 in people at average risk with no symptoms. However, the American College of Gastroenterology (ACG) recommends beginning screening at age 45 in African Americans, as this group has higher incidence and mortality rates of colorectal cancer.8 Also, the American Cancer Society recently recommended beginning screening at age 45 for all individuals.9
Screening can stop at age 75 for most patients, according to the ACG,8 the US Multi-Society Task Force on Colorectal Cancer,10 and the US Preventive Services Task Force (USPSTF).11 However, the decision should be individualized for patients ages 76 to 85. Patients within that age group who are in good health and have not previously been screened are more likely to benefit than those who have previously been screened and had a negative screening test. Patients over age 85 should not begin or continue screening, because of diminished benefit of screening in this age group, shorter life expectancy, advanced comorbid conditions, and the risks of colonoscopy and cancer treatment.
Patients and clinicians are encouraged to collaborate in deciding which screening method is appropriate. Patients adhere better when they are given a choice in the matter.12–14 And adherence is the key to effective colorectal cancer screening.
Familiarity with the key characteristics of currently available colorectal cancer screening tests will facilitate discussion with patients.
Opportunistic vs programmatic screening
Screening can be classified according to the approach to the patient or population and the intent of the test. Most screening in the United States is opportunistic rather than programmatic—that is, the physician offers the patient screening at the point of service without systematic follow-up or patient re-engagement.
In a programmatic approach, the patient is offered screening through an organized program that streamlines services, reduces overscreening, and provides systematic follow-up of testing.
DISCUSSING THE OPTIONS
Stool studies such as FOBT and FIT do not reliably detect cancer precursors such as adenomas and serrated neoplasms. If an FOBT is positive, follow-up diagnostic colonoscopy is required. Unlike screening colonoscopy, diagnostic colonoscopy requires a copayment for Medicare patients, and this should be explained to the patient.
FIT and FOBT detect hemolyzed blood within a stool sample, FOBT by a chemical reaction, and FIT by detecting a globin-specific antibody. Colorectal cancer and some large adenomatous polyps may intermittently bleed and result in occult blood in the stool, iron deficiency anemia, or hematochezia.15
Fecal occult blood testing
Historically, FOBT was the stool test of choice for screening. It uses an indirect enzymatic reaction to detect hemolyzed blood in the stool. When a specimen containing hemoglobin is added to guaiac paper and a drop of hydrogen peroxide is added to “develop” it, the peroxidase activity of hemoglobin turns the guaiac blue.
Screening with FOBT involves annual testing of 3 consecutively passed stools from different days; FOBT should not be performed at the time of digital rectal examination or if the patient is having overt rectal, urinary, or menstrual bleeding.
Dietary and medication restrictions before and during the testing period are critical, as red meat contains hemoglobin, and certain vegetables (eg, radishes, turnips, cauliflower, cucumbers) contain peroxidase, all of which can cause a false-positive result. Waiting 3 days after the stool sample is collected to develop it can mitigate the peroxidase activity of vegetables.16 Vitamin C inhibits heme peroxidase activity and leads to false-negative results. Aspirin and high-dose nonsteroidal anti-inflammatory drugs can promote bleeding throughout the intestinal tract.17
In randomized controlled trials,18–21 screening with FOBT reduced colorectal cancer mortality rates by 15% to 33%. The 30-year follow-up of a large US trial22 found a 32% relative reduction in mortality rates in patients randomized to annual screening, and a 22% relative reduction in those randomized to screening every 2 years. Despite the many possibilities for false-positive results, the specificity for detecting cancer has ranged from 86.7% to 97.3%, and the sensitivity from 37.1% to 79.4%, highlighting the benefit of colorectal cancer screening programs in unscreened populations.23–26
FIT vs FOBT in current practice
FIT should replace FOBT as the preferred stool screening method. Instead of an enzymatic reaction that can be altered by food or medication, FIT utilizes an antibody specific to human globin to directly detect hemolyzed blood, thus eliminating the need to modify the diet or medications.27 Additionally, only 1 stool specimen is needed, which may explain why the adherence rate was about 20% higher with FIT than with FOBT in most studies.28–30
FIT has a sensitivity of 69% to 86% for colorectal cancer and a specificity of 92% to 95%.31 The sensitivity can be improved by lowering the threshold value for a positive test, but this is associated with a decrease in specificity. A single FIT has the same sensitivity and specificity as several samples.32
In a large retrospective US cohort study of programmatic screening with FIT, Jensen et al33 reported that 48% of 670,841 people who were offered testing actually did the test. Of the 48% who participated in the first round and remained eligible, 75% to 86% participated in subsequent rounds over 4 years. Those who had a positive result on FIT were supposed to undergo colonoscopy, but 22% did not.
The US Multi-Society Task Force on Colorectal Cancer34 suggests that FIT-based screening programs aim for a target FIT completion rate of more than 60% and a target colonoscopy completion rate of more than 80% of patients with positive FITs. These benchmarks were derived from adherence rates in international FIT screening studies in average-risk populations.35–39 (Note that the large US cohort described above33 did not meet these goals.) Ideally, every patient with a positive FIT should undergo diagnostic colonoscopy, but in reality only 50% to 83% actually do. Methods shown to improve adherence include structured screening programs with routine performance reports, provider feedback, and involvement of patient navigators.40–42
Accordingly, several aspects of stool-based testing need to be stressed with patients. Understanding that FOBT is recommended yearly is integral for optimal impact on colorectal cancer incidence and mortality rates.
Additionally, patients should be advised to undergo colonoscopy soon after a positive FIT, because delaying colonoscopy could give precancerous lesions time to progress in stage. The acceptable time between a positive FIT and colonoscopy has yet to be determined. However, a retrospective cohort study of 1.26 million screened patients with 107,000 positive FIT results demonstrated that the rates of cancer discovered on colonoscopy were similar when performed within 30 days or up to 10 months after a positive test. Detection rates increased from 3% to 4.8% at 10 months and to 7.9% at 12 months.43
In modeling studies, Meester et al44 showed the estimated lifetime risk and mortality rates from colorectal cancer and life-years gained from screening are significantly better when colonoscopy is completed within 2 weeks rather than 1 year after a positive FIT. Each additional month after 2 weeks incrementally affected these outcomes, with a 1.4% increase in cancer mortality. These data suggest that colonoscopy should be done soon after a positive FIT result and at a maximum of 10 months.43,44
Screening with FOBT is a multistep process for patients that includes receiving the test kit, collecting the sample, preparing it, returning it, undergoing colonoscopy after a positive test, and repeating in 1 year if negative. The screening program should identify patients at average risk in whom screening is appropriate, ensure delivery of the test, verify the quality of collected samples for laboratory testing against the manufacturer’s recommendations, and report results. Report of a positive FOBT result should provide recommendations for follow-up.
Though evidence clearly supports screening annually or biennially (every 2 years) with FOBT, the ideal interval for FIT is undetermined. Modeling studies utilized by the USPSTF and Multi-Society Task Force demonstrate that colonoscopy and annual FIT result in similar life-years gained, while 2 population-based screening programs have demonstrated that a 2- or 3-year interval may be equally efficacious by lowering the threshold for a positive test.38,45
Randomized controlled trials of screening colonoscopy vs annual and biennial FIT are currently under way. Cost-effectiveness analysis has shown that offering single-sample FITs at more frequent (annual) intervals performs better than multisample testing at less frequent intervals.45–47
Colonoscopy
Compared with stool-based screening, colonoscopy has advantages, including a 10-year screening interval if bowel preparation is adequate and the examination shows no neoplasia, the ability to inspect the entire colon, and the ability to diagnose and treat lesions in the same session.
Screening colonoscopy visualizes the entire colon in more than 98% of cases, although it requires adequate bowel preparation for maximal polyp detection. It can be done safely with or without sedation.48
While there are no available randomized controlled trial data on the impact of screening colonoscopy on cancer incidence or mortality, extensive case-control and cohort studies consistently show that screening colonoscopy reduces cancer incidence and mortality rates.49–54 A US Veterans Administration study of more than 32,000 patients reported a 50% reduction in overall colorectal cancer mortality.55 In a microsimulation modeling study that assumed 100% adherence, colonoscopy every 10 years and annual FIT in individuals ages 50 to 75 provided similar life-years gained per 1,000 people screened (270 for colonoscopy, 244 for FIT).56
Well-established metrics for maximizing the effectiveness and quality of colonoscopy have been established (Table 2). The most important include the mucosa inspection time (withdrawal time) and adenoma detection rate.57 Withdrawal time is directly correlated with adenoma detection, and a 6-minute minimum withdrawal time is recommended in screening colonoscopy examinations of patients at average risk when no polyps are found.58 The adenoma detection rate is the strongest evidence-based metric, as each 1% increase in the adenoma detection rate over 19% is associated with a 3% decrease in the risk of colorectal cancer and a 5% decrease in death rate.59 The average-risk screening adenoma detection rate differs based on sex: the rate is greater than 20% for women and greater than 30% for men.
Complications from screening, diagnostic, or therapeutic colonoscopy are infrequent but include perforation (4/10,000) and significant intestinal bleeding (8/10,000).56–62
Patients with a first-degree relative under age 60 with advanced adenomas or colorectal cancer are considered at high risk and should begin screening colonoscopy at age 40, with repeat colonoscopy at 5-year intervals, given a trend toward advanced neoplasia detection compared with FIT.63
Guidelines recently published by the Canadian Association of Gastroenterology and endorsed by the American Gastroenterological Association also support starting screening in high-risk individuals at age 40, with a surveillance interval of 5 to 10 years based on the number of first-degree relatives with colorectal cancer or adenomas.64 Consensus statements were based on retrospective cohort, prospective case-controlled, and cross-sectional studies comparing the risk of colorectal cancer in individuals with a family history against those without a family history.
Randomized clinical trials comparing colonoscopy and FIT are under way. Interim analysis of a European trial in which asymptomatic adults ages 50 to 69 were randomized to 1-time colonoscopy (26,703 patients) vs FIT every 2 years (26,599 patients) found significantly higher participation rates in the FIT arm (34.2% vs 24.6%) but higher rates of nonadvanced adenomas (4.2% vs 0.4%) and advanced neoplasia (1.9% vs 0.9%) in the colonoscopy arm.65 Cancer was detected in 0.1% in each arm. These findings correlate with those of another study showing higher participation with FIT but higher advanced neoplasia detection rates with colonoscopy.66
Detection of precursor lesions is vital, as removing neoplasms is the main strategy to reduce colorectal cancer incidence. Accordingly, the advantage of colonoscopy was illustrated by a study that determined that 53 patients would need to undergo screening colonoscopy to detect 1 advanced adenoma or cancerous lesion, compared with 264 for FIT.67
STARTING SCREEING AT AGE 45
The American Cancer Society recently provided a qualified recommendation to start colorectal cancer screening in all individuals at age 45 rather than 50.9 This recommendation was based on modeling studies demonstrating that starting screening at age 45 with colonoscopy every 10 years resulted in 25 life-years gained at the cost of 610 colonoscopies per 1,000 individuals. Alternative strategies included FIT, which resulted in an additional 26 life-years gained per 1,000 individuals screened, flexible sigmoidoscopy (23 life-years gained), and computed tomographic colonoscopy (22 life-years gained).
Rates of colorectal cancer are rising in adults under age 50, and 10,000 new cases are anticipated this year.2,3 Currently, 22 million US adults are between the ages of 45 and 50. The system and support needed to perform screening in all adults over age 45 and a lack of direct evidence to support its benefits in the young population need to be considered before widespread acceptance of the American Cancer Society recommendations. However, if screening is considered, FIT with or without sigmoidoscopy may be appropriate, given that most cancers diagnosed in individuals under age 50 are left-sided.4,5
Screening has not been proven to reduce all-cause mortality. Randomized controlled trials of FOBT and observational studies of colonoscopy show that screening reduces cancer incidence and mortality. Until the currently ongoing randomized controlled trials comparing colonoscopy with FIT are completed, their comparative impact on colorectal cancer end points is unknown.
PATIENT ADHERENCE IS KEY
FIT and colonoscopy are the most prevalent screening methods in the United States. Careful attention should be given to offer the screening option the patient is most likely to complete, as adherence is key to the benefit from colorectal cancer screening.
The National Colorectal Cancer Roundtable (nccrt.org), established in 1997 by the American Cancer Society and the US Centers for Disease Control and Prevention, is a national coalition of public and private organizations dedicated to reducing colorectal cancer incidence and mortality. The Roundtable waged a national campaign to achieve a colorectal cancer screening rate of 80% in eligible adults by 2018, a goal that was not met. Still, the potential for a substantial impact is a compelling reason to endorse adherence to colorectal cancer screening. The Roundtable provides many resources for physicians to enhance screening in their practice.
The United States has seen a steady decline in colorectal cancer incidence and mortality, mainly as a result of screening. Colorectal cancer is preventable with ensuring patients’ adherence to screening. Screening rates have been shown to increase with patient-provider dialogue and with selection of a screening program the patient prefers and is most likely to complete.
- American Cancer Society. Colorectal Cancer Facts & Figures 2017–2019. Atlanta: American Cancer Society; 2017. https://www.cancer.org/content/dam/cancer-org/research/cancer-facts-and-statistics/colorectal-cancer-facts-and-figures/colorectal-cancer-facts-and-figures-2017-2019.pdf. Accessed April 1, 2019.
- Siegel RL, Miller KD, Fedewa SA, et al. Colorectal cancer statistics, 2017. CA Cancer J Clin 2017; 67(3):177–193. doi:10.3322/caac.21395
- Kopetz S, Chang GJ, Overman MJ, et al. Improved survival in metastatic colorectal cancer is associated with adoption of hepatic resection and improved chemotherapy. J Clin Oncol 2009; 27(22):3677–3683. doi:10.1200/JCO.2008.20.5278
- Siegel RL, Jemal A, Ward EM. Increase in incidence of colorectal cancer among young men and women in the United States. Cancer Epidemiol Biomarkers Prev 2009; 18(6):1695–1698. doi:10.1158/1055-9965.EPI-09-0186
- Bailey CE, Hu CY, You YN, et al. Increasing disparities in the age-related incidences of colon and rectal cancers in the United States, 1975-2010. JAMA Surg 2015; 150(1):17–22. doi:10.1001/jamasurg.2014.1756
- Centers for Disease Control and Prevention (CDC). Vital signs: colorectal cancer screening test use—United States, 2012. MMWR Morb Mortal Wkly Rep 2013; 62(44):881–888. pmid:24196665
- Siegel RL, Sahar L, Robbins A, Jemal A. Where can colorectal cancer screening interventions have the most impact? Cancer Epidemiol Biomarkers Prev 2015; 24(8):1151–1156. doi:10.1158/1055-9965.EPI-15-0082
- Agrawal S, Bhupinderjit A, Bhutani MS, et al; Committee of Minority Affairs and Cultural Diversity, American College of Gastroenterology. Colorectal cancer in African Americans. Am J Gastroenterol 2005; 100(3):515–523. doi:10.1111/j.1572-0241.2005.41829.x
- Wolf AMD, Fontham ETH, Church TR, et al. Colorectal cancer screening for average-risk adults: 2018 guideline update from the American Cancer Society. CA Cancer J Clin 2018; 68(4):250–281. doi:10.3322/caac.21457
- Rex DK, Boland CR, Dominitz JA, et al. Colorectal cancer screening: recommendations for physicians and patients from the US Multi-Society Task Force on Colorectal Cancer. Am J Gastroenterol 2017; 112(7):1016–1030. doi:10.1038/ajg.2017.174
- US Preventive Services Task Force; Bibbins-Domingo K, Grossman DC, Curry SJ, et al. Screening for colorectal cancer: US Preventive Services Task Force Recommendation Statement. JAMA 2016; 315(23):2564–2575. doi:10.1001/jama.2016.5989
- Inadomi JM, Vijan S, Janz NK, et al. Adherence to colorectal cancer screening: a randomized clinical trial of competing strategies. Arch Intern Med 2012; 172(7):575–582. doi:10.1001/archinternmed.2012.332
- Steinwachs D, Allen JD, Barlow WE, et al. National Institutes of Health state-of-the-science conference statement: enhancing use and quality of colorectal cancer screening. Ann Intern Med 2010; 152(10):663–667. doi:10.7326/0003-4819-152-10-201005180-00237
- Subramanian S, Klosterman M, Amonkar MM, Hunt TL. Adherence with colorectal cancer screening guidelines: a review. Prev Med 2004; 38(5):536–550. doi:10.1016/j.ypmed.2003.12.011
- Levin B, Lieberman DA, McFarland B, et al; American Cancer Society Colorectal Cancer Advisory Group; US Multi-Society Task Force; American College of Radiology Colon Cancer Committee. Screening and surveillance for the early detection of colorectal cancer and adenomatous polyps, 2008: a joint guideline from the American Cancer Society, the US Multi-Society Task Force on Colorectal Cancer, and the American College of Radiology. CA Cancer J Clin 2008; 58(3):130–160. doi:10.3322/CA.2007.0018
- Sinatra MA, St John DJ, Young GP. Interference of plant peroxidases with guaiac-based fecal occult blood tests is avoidable. Clin Chem 1999; 45(1):123–126. pmid:9895348
- Allison JE, Sakoda LC, Levin TR, et al. Screening for colorectal neoplasms with new fecal occult blood tests: update on performance characteristics. J Natl Cancer Inst 2007; 99(19):1462–1470. doi:10.1093/jnci/djm150
- Mandel JS, Bond JH, Church TR, et al. Reducing mortality from colorectal cancer by screening for fecal occult blood. Minnesota Colon Cancer Control Study. N Engl J Med 1993; 328(19):1365–1371. doi:10.1056/NEJM199305133281901
- Hardcastle JD, Chamberlain JO, Robinson MH, et al. Randomised controlled trial of faecal-occult-blood screening for colorectal cancer. Lancet 1996; 348(9040):1472–1477. doi:10.1016/S0140-6736(96)03386-7
- Kronborg O, Fenger C, Olsen J, Jørgensen OD, Søndergaard O. Randomised study of screening for colorectal cancer with faecal-occult-blood test. Lancet 1996; 348(9040):1467–1471. doi:10.1016/S0140-6736(96)03430-7
- Wilson JMG, Junger G. Principles and practice of screening for disease. Geneva, Switzerland: World Health Organization; 1968. http://apps.who.int/iris/bitstream/handle/10665/37650/WHO_PHP_34.pdf?sequence=17. Accessed April 1, 2019.
- Shaukat A, Mongin SJ, Geisser MS, et al. Long-term mortality after screening for colorectal cancer. N Engl J Med 2013; 369(12):1106–1114. doi:10.1056/NEJMoa1300720
- Allison JE, Tekawa IS, Ransom LJ, Adrain AL. A comparison of fecal occult-blood tests for colorectal-cancer screening. N Engl J Med 1996; 334(3):155–159. doi:10.1056/NEJM199601183340304
- Shapiro JA, Bobo JK, Church TR, et al. A comparison of fecal immunochemical and high-sensitivity guaiac tests for colorectal cancer screening. Am J Gastroenterol 2017; 112(11):1728–1735. doi:10.1038/ajg.2017.285
- Smith A, Young GP, Cole SR, Bampton P. Comparison of a brush-sampling fecal immunochemical test for hemoglobin with a sensitive guaiac-based fecal occult blood test in detection of colorectal neoplasia. Cancer 2006; 107(9):2152–2159. doi:10.1002/cncr.22230
- Brenner H, Tao S. Superior diagnostic performance of faecal immunochemical tests for haemoglobin in a head-to-head comparison with guaiac based faecal occult blood test among 2235 participants of screening colonoscopy. Eur J Cancer 2013; 49(14):3049–3054. doi:10.1016/j.ejca.2013.04.023
- Young GP, Cole S. New stool screening tests for colorectal cancer. Digestion 2007; 76(1):26–33. doi:10.1159/000108391
- van Rossum LG, van Rijn AF, Laheij RJ, et al. Random comparison of guaiac and immunochemical fecal occult blood tests for colorectal cancer in a screening population. Gastroenterology 2008; 135(1):82–90. doi:10.1053/j.gastro.2008.03.040
- Hassan C, Giorgi Rossi P, Camilloni L, et al. Meta-analysis: adherence to colorectal cancer screening and the detection rate for advanced neoplasia, according to the type of screening test. Aliment Pharmacol Ther 2012; 36(10):929–940. doi:10.1111/apt.12071
- Vart G, Banzi R, Minozzi S. Comparing participation rates between immunochemical and guaiac faecal occult blood tests: a systematic review and meta-analysis. Prev Med 2012; 55(2):87–92. doi:10.1016/j.ypmed.2012.05.006
- Imperiale TF, Ransohoff DF, Itzkowitz SH, et al. Multitarget stool DNA testing for colorectal-cancer screening. N Engl J Med 2014; 370(14):1287–1297. doi:10.1056/NEJMoa1311194
- Lee JK, Liles EG, Bent S, Levin TR, Corley DA. Accuracy of fecal immunochemical tests for colorectal cancer: systematic review and meta-analysis. Ann Intern Med 2014; 160(3):171. doi:10.7326/M13-1484
- Jensen CD, Corley DA, Quinn VP, et al. Fecal immunochemical test program performance over 4 rounds of annual screening: a retrospective cohort study. Ann Intern Med 2016; 164(7):456–463. doi:10.7326/M15-0983
- Robertson DJ, Lee JK, Boland CR, et al. Recommendations on fecal immunochemical testing to screen for colorectal neoplasia: a consensus statement by the US Multi-Society Task Force on Colorectal Cancer. Gastroenterology 2017; 152(5):1217–1237.e3. doi:10.1053/j.gastro.2016.08.053
- Rabeneck L, Rumble RB, Thompson F, et al. Fecal immunochemical tests compared with guaiac fecal occult blood tests for population-based colorectal cancer screening. Can J Gastroenterol 2012; 26(3):131–147. pmid:22408764
- Logan RF, Patnick J, Nickerson C, Coleman L, Rutter MD, von Wagner C; English Bowel Cancer Screening Evaluation Committee. Outcomes of the Bowel Cancer Screening Programme (BCSP) in England after the first 1 million tests. Gut 2012; 61(10):1439–1446. doi:10.1136/gutjnl-2011-300843
- Malila N, Oivanen T, Malminiemi O, Hakama M. Test, episode, and programme sensitivities of screening for colorectal cancer as a public health policy in Finland: experimental design. BMJ 2008; 337:a2261. doi:10.1136/bmj.a2261
- Denters MJ, Deutekom M, Bossuyt PM, Stroobants AK, Fockens P, Dekker E. Lower risk of advanced neoplasia among patients with a previous negative result from a fecal test for colorectal cancer. Gastroenterology 2012; 142(3):497–504. doi:10.1053/j.gastro.2011.11.024
- van Roon AH, Goede SL, van Ballegooijen M, et al. Random comparison of repeated faecal immunochemical testing at different intervals for population-based colorectal cancer screening. Gut 2013; 62(3):409–415. doi:10.1136/gutjnl-2011-301583
- Chubak J, Garcia MP, Burnett-Hartman AN, et al; PROSPR consortium. Time to colonoscopy after positive fecal blood test in four US health care systems. Cancer Epidemiol Biomarkers Prev 2016; 25(2):344–350. doi:10.1158/1055-9965.EPI-15-0470
- Carlson CM, Kirby KA, Casadei MA, Partin MR, Kistler CE, Walter LC. Lack of follow-up after fecal occult blood testing in older adults: inappropriate screening or failure to follow up? Arch Intern Med 2011; 171(3):249–256. doi:10.1001/archinternmed.2010.372
- Selby K, Baumgartner C, Levin TR, et al. Interventions to improve follow-up of positive results on fecal blood tests: a systematic review. Ann Intern Med 2017; 167(8):565–575. doi:10.7326/M17-1361
- Corley DA, Jensen CD, Quinn VP, et al. Association between time to colonoscopy after a positive fecal test result and risk of colorectal cancer and cancer stage at diagnosis. JAMA 2017; 317(16):1631–1641. doi:10.1001/jama.2017.3634
- Meester RG, Zauber AG, Doubeni CA, et al. Consequences of increasing time to colonoscopy examination after positive result from fecal colorectal cancer screening test. Clin Gastroenterol Hepatol 2016; 14(10):1445–1451.e8. doi:10.1016/j.cgh.2016.05.017
- Haug U, Grobbee EJ, Lansdorp-Vogelaar I, Spaander MCW, Kuipers EJ. Immunochemical faecal occult blood testing to screen for colorectal cancer: can the screening interval be extended? Gut 2017; 66(7):1262–1267. doi:10.1136/gutjnl-2015-310102
- Goede SL, van Roon AH, Reijerink JC, et al. Cost-effectiveness of one versus two sample faecal immunochemical testing for colorectal cancer screening. Gut 2013; 62(5):727–734. doi:10.1136/gutjnl-2011-301917
- Digby J, Fraser CG, Carey FA, Steele RJC. Can the performance of a quantitative FIT-based colorectal cancer screening programme be enhanced by lowering the threshold and increasing the interval? Gut 2018; 67(5):993–994. doi:10.1136/gutjnl-2017-314862
- Hoffman MS, Butler TW, Shaver T. Colonoscopy without sedation. J Clin Gastroenterol 1998; 26(4):279–282. pmid:9649011
- Zauber AG, Winawer SJ, O’Brien MJ, et al. Colonoscopic polypectomy and long-term prevention of colorectal-cancer deaths. N Engl J Med 2012; 366(8):687–696. doi:10.1056/NEJMoa1100370
- Nishihara R, Wu K, Lochhead P, et al. Long-term colorectal-cancer incidence and mortality after lower endoscopy. N Engl J Med 2013; 369(12):1095–1105. doi:10.1056/NEJMoa1301969
- Løberg M, Kalager M, Holme Ø, Hoff G, Adami HO, Bretthauer M. Long-term colorectal-cancer mortality after adenoma removal. N Engl J Med 2014; 371(9):799–807. doi:10.1056/NEJMoa1315870
- Manser CN, Bachmann LM, Brunner J, Hunold F, Bauerfeind P, Marbet UA. Colonoscopy screening markedly reduces the occurrence of colon carcinomas and carcinoma-related death: a closed cohort study. Gastrointest Endosc 2012; 76(1):110–117. doi:10.1016/j.gie.2012.02.040
- Winawer SJ, Zauber AG, Ho MN, et al. Prevention of colorectal cancer by colonoscopic polypectomy. The National Polyp Study Workgroup. N Engl J Med 1993; 329(27):1977–1981. doi:10.1056/NEJM199312303292701
- Citarda F, Tomaselli G, Capocaccia R, Barcherini S, Crespi M; Italian Multicentre Study Group. Efficacy in standard clinical practice of colonoscopic polypectomy in reducing colorectal cancer incidence. Gut 2001; 48(6):812–815. pmid:11358901
- Muller AD, Sonnenberg A. Prevention of colorectal cancer by flexible endoscopy and polypectomy. A case-control study of 32,702 veterans. Ann Intern Med 1995; 123(12):904–910. pmid:7486484
- Knudsen AB, Zauber AG, Rutter CM, et al. Estimation of benefits, burden, and harms of colorectal cancer screening strategies: modeling study for the US Preventive Services Task Force. JAMA 2016; 315(23):2595–2609. doi:10.1001/jama.2016.6828
- Rex DK, Schoenfeld PS, Cohen J, et al. Quality indicators for colonoscopy. Gastrointest Endosc 2015; 81(1):31–53. doi:10.1016/j.gie.2014.07.058
- Barclay RL, Vicari JJ, Doughty AS, Johanson JF, Greenlaw RL. Colonoscopic withdrawal times and adenoma detection during screening colonoscopy. N Engl J Med 2006; 355(24):2533–2541. doi:10.1056/NEJMoa055498
- Corley DA, Levin TR, Doubeni CA. Adenoma detection rate and risk of colorectal cancer and death. N Engl J Med 2014; 370(26):2541. doi:10.1056/NEJMc1405329
- Lin JS, Piper MA, Perdue LA, et al. Screening for colorectal cancer: updated evidence report and systematic review for the US Preventive Services Task Force. JAMA 2016; 315(23):2576–2594. doi:10.1001/jama.2016.3332
- Gatto NM, Frucht H, Sundararajan V, Jacobson JS, Grann VR, Neugut AI. Risk of perforation after colonoscopy and sigmoidoscopy: a population-based study. J Natl Cancer Inst 2003; 95(3):230–236. pmid:12569145
- Warren JL, Klabunde CN, Mariotto AB, et al. Adverse events after outpatient colonoscopy in the Medicare population. Ann Intern Med 2009; 150(12):849–857, W152. pmid:19528563
- Quintero E, Carrillo M, Gimeno-García AZ, et al. Equivalency of fecal immunochemical tests and colonoscopy in familial colorectal cancer screening. Gastroenterology 2014; 147(5):1021–130.e1. doi:10.1053/j.gastro.2014.08.004
- Leddin D, Lieberman DA, Tse F, et al. Clinical practice guideline on screening for colorectal cancer in individuals with a family history of nonhereditary colorectal cancer or adenoma: the Canadian Association of Gastroenterology Banff Consensus. Gastroenterology 2018; 155(5):1325–1347.e3. doi:10.1053/j.gastro.2018.08.017
- Quintero E, Castells A, Bujanda L, et al; COLONPREV Study Investigators. Colonoscopy versus fecal immunochemical testing in colorectal-cancer screening. N Engl J Med 2012; 366(8):697–706. doi:10.1056/NEJMoa1108895
- Gupta S, Halm EA, Rockey DC, et al. Comparative effectiveness of fecal immunochemical test outreach, colonoscopy outreach, and usual care for boosting colorectal cancer screening among the underserved: a randomized clinical trial. JAMA Intern Med 2013; 173(18):1725–1732. doi:10.1001/jamainternmed.2013.9294
- Segnan N, Senore C, Andreoni B, et al; SCORE3 Working Group-Italy. Comparing attendance and detection rate of colonoscopy with sigmoidoscopy and FIT for colorectal cancer screening. Gastroenterology 2007; 132(7):2304–2312. doi:10.1053/j.gastro.2007.03.030
- American Cancer Society. Colorectal Cancer Facts & Figures 2017–2019. Atlanta: American Cancer Society; 2017. https://www.cancer.org/content/dam/cancer-org/research/cancer-facts-and-statistics/colorectal-cancer-facts-and-figures/colorectal-cancer-facts-and-figures-2017-2019.pdf. Accessed April 1, 2019.
- Siegel RL, Miller KD, Fedewa SA, et al. Colorectal cancer statistics, 2017. CA Cancer J Clin 2017; 67(3):177–193. doi:10.3322/caac.21395
- Kopetz S, Chang GJ, Overman MJ, et al. Improved survival in metastatic colorectal cancer is associated with adoption of hepatic resection and improved chemotherapy. J Clin Oncol 2009; 27(22):3677–3683. doi:10.1200/JCO.2008.20.5278
- Siegel RL, Jemal A, Ward EM. Increase in incidence of colorectal cancer among young men and women in the United States. Cancer Epidemiol Biomarkers Prev 2009; 18(6):1695–1698. doi:10.1158/1055-9965.EPI-09-0186
- Bailey CE, Hu CY, You YN, et al. Increasing disparities in the age-related incidences of colon and rectal cancers in the United States, 1975-2010. JAMA Surg 2015; 150(1):17–22. doi:10.1001/jamasurg.2014.1756
- Centers for Disease Control and Prevention (CDC). Vital signs: colorectal cancer screening test use—United States, 2012. MMWR Morb Mortal Wkly Rep 2013; 62(44):881–888. pmid:24196665
- Siegel RL, Sahar L, Robbins A, Jemal A. Where can colorectal cancer screening interventions have the most impact? Cancer Epidemiol Biomarkers Prev 2015; 24(8):1151–1156. doi:10.1158/1055-9965.EPI-15-0082
- Agrawal S, Bhupinderjit A, Bhutani MS, et al; Committee of Minority Affairs and Cultural Diversity, American College of Gastroenterology. Colorectal cancer in African Americans. Am J Gastroenterol 2005; 100(3):515–523. doi:10.1111/j.1572-0241.2005.41829.x
- Wolf AMD, Fontham ETH, Church TR, et al. Colorectal cancer screening for average-risk adults: 2018 guideline update from the American Cancer Society. CA Cancer J Clin 2018; 68(4):250–281. doi:10.3322/caac.21457
- Rex DK, Boland CR, Dominitz JA, et al. Colorectal cancer screening: recommendations for physicians and patients from the US Multi-Society Task Force on Colorectal Cancer. Am J Gastroenterol 2017; 112(7):1016–1030. doi:10.1038/ajg.2017.174
- US Preventive Services Task Force; Bibbins-Domingo K, Grossman DC, Curry SJ, et al. Screening for colorectal cancer: US Preventive Services Task Force Recommendation Statement. JAMA 2016; 315(23):2564–2575. doi:10.1001/jama.2016.5989
- Inadomi JM, Vijan S, Janz NK, et al. Adherence to colorectal cancer screening: a randomized clinical trial of competing strategies. Arch Intern Med 2012; 172(7):575–582. doi:10.1001/archinternmed.2012.332
- Steinwachs D, Allen JD, Barlow WE, et al. National Institutes of Health state-of-the-science conference statement: enhancing use and quality of colorectal cancer screening. Ann Intern Med 2010; 152(10):663–667. doi:10.7326/0003-4819-152-10-201005180-00237
- Subramanian S, Klosterman M, Amonkar MM, Hunt TL. Adherence with colorectal cancer screening guidelines: a review. Prev Med 2004; 38(5):536–550. doi:10.1016/j.ypmed.2003.12.011
- Levin B, Lieberman DA, McFarland B, et al; American Cancer Society Colorectal Cancer Advisory Group; US Multi-Society Task Force; American College of Radiology Colon Cancer Committee. Screening and surveillance for the early detection of colorectal cancer and adenomatous polyps, 2008: a joint guideline from the American Cancer Society, the US Multi-Society Task Force on Colorectal Cancer, and the American College of Radiology. CA Cancer J Clin 2008; 58(3):130–160. doi:10.3322/CA.2007.0018
- Sinatra MA, St John DJ, Young GP. Interference of plant peroxidases with guaiac-based fecal occult blood tests is avoidable. Clin Chem 1999; 45(1):123–126. pmid:9895348
- Allison JE, Sakoda LC, Levin TR, et al. Screening for colorectal neoplasms with new fecal occult blood tests: update on performance characteristics. J Natl Cancer Inst 2007; 99(19):1462–1470. doi:10.1093/jnci/djm150
- Mandel JS, Bond JH, Church TR, et al. Reducing mortality from colorectal cancer by screening for fecal occult blood. Minnesota Colon Cancer Control Study. N Engl J Med 1993; 328(19):1365–1371. doi:10.1056/NEJM199305133281901
- Hardcastle JD, Chamberlain JO, Robinson MH, et al. Randomised controlled trial of faecal-occult-blood screening for colorectal cancer. Lancet 1996; 348(9040):1472–1477. doi:10.1016/S0140-6736(96)03386-7
- Kronborg O, Fenger C, Olsen J, Jørgensen OD, Søndergaard O. Randomised study of screening for colorectal cancer with faecal-occult-blood test. Lancet 1996; 348(9040):1467–1471. doi:10.1016/S0140-6736(96)03430-7
- Wilson JMG, Junger G. Principles and practice of screening for disease. Geneva, Switzerland: World Health Organization; 1968. http://apps.who.int/iris/bitstream/handle/10665/37650/WHO_PHP_34.pdf?sequence=17. Accessed April 1, 2019.
- Shaukat A, Mongin SJ, Geisser MS, et al. Long-term mortality after screening for colorectal cancer. N Engl J Med 2013; 369(12):1106–1114. doi:10.1056/NEJMoa1300720
- Allison JE, Tekawa IS, Ransom LJ, Adrain AL. A comparison of fecal occult-blood tests for colorectal-cancer screening. N Engl J Med 1996; 334(3):155–159. doi:10.1056/NEJM199601183340304
- Shapiro JA, Bobo JK, Church TR, et al. A comparison of fecal immunochemical and high-sensitivity guaiac tests for colorectal cancer screening. Am J Gastroenterol 2017; 112(11):1728–1735. doi:10.1038/ajg.2017.285
- Smith A, Young GP, Cole SR, Bampton P. Comparison of a brush-sampling fecal immunochemical test for hemoglobin with a sensitive guaiac-based fecal occult blood test in detection of colorectal neoplasia. Cancer 2006; 107(9):2152–2159. doi:10.1002/cncr.22230
- Brenner H, Tao S. Superior diagnostic performance of faecal immunochemical tests for haemoglobin in a head-to-head comparison with guaiac based faecal occult blood test among 2235 participants of screening colonoscopy. Eur J Cancer 2013; 49(14):3049–3054. doi:10.1016/j.ejca.2013.04.023
- Young GP, Cole S. New stool screening tests for colorectal cancer. Digestion 2007; 76(1):26–33. doi:10.1159/000108391
- van Rossum LG, van Rijn AF, Laheij RJ, et al. Random comparison of guaiac and immunochemical fecal occult blood tests for colorectal cancer in a screening population. Gastroenterology 2008; 135(1):82–90. doi:10.1053/j.gastro.2008.03.040
- Hassan C, Giorgi Rossi P, Camilloni L, et al. Meta-analysis: adherence to colorectal cancer screening and the detection rate for advanced neoplasia, according to the type of screening test. Aliment Pharmacol Ther 2012; 36(10):929–940. doi:10.1111/apt.12071
- Vart G, Banzi R, Minozzi S. Comparing participation rates between immunochemical and guaiac faecal occult blood tests: a systematic review and meta-analysis. Prev Med 2012; 55(2):87–92. doi:10.1016/j.ypmed.2012.05.006
- Imperiale TF, Ransohoff DF, Itzkowitz SH, et al. Multitarget stool DNA testing for colorectal-cancer screening. N Engl J Med 2014; 370(14):1287–1297. doi:10.1056/NEJMoa1311194
- Lee JK, Liles EG, Bent S, Levin TR, Corley DA. Accuracy of fecal immunochemical tests for colorectal cancer: systematic review and meta-analysis. Ann Intern Med 2014; 160(3):171. doi:10.7326/M13-1484
- Jensen CD, Corley DA, Quinn VP, et al. Fecal immunochemical test program performance over 4 rounds of annual screening: a retrospective cohort study. Ann Intern Med 2016; 164(7):456–463. doi:10.7326/M15-0983
- Robertson DJ, Lee JK, Boland CR, et al. Recommendations on fecal immunochemical testing to screen for colorectal neoplasia: a consensus statement by the US Multi-Society Task Force on Colorectal Cancer. Gastroenterology 2017; 152(5):1217–1237.e3. doi:10.1053/j.gastro.2016.08.053
- Rabeneck L, Rumble RB, Thompson F, et al. Fecal immunochemical tests compared with guaiac fecal occult blood tests for population-based colorectal cancer screening. Can J Gastroenterol 2012; 26(3):131–147. pmid:22408764
- Logan RF, Patnick J, Nickerson C, Coleman L, Rutter MD, von Wagner C; English Bowel Cancer Screening Evaluation Committee. Outcomes of the Bowel Cancer Screening Programme (BCSP) in England after the first 1 million tests. Gut 2012; 61(10):1439–1446. doi:10.1136/gutjnl-2011-300843
- Malila N, Oivanen T, Malminiemi O, Hakama M. Test, episode, and programme sensitivities of screening for colorectal cancer as a public health policy in Finland: experimental design. BMJ 2008; 337:a2261. doi:10.1136/bmj.a2261
- Denters MJ, Deutekom M, Bossuyt PM, Stroobants AK, Fockens P, Dekker E. Lower risk of advanced neoplasia among patients with a previous negative result from a fecal test for colorectal cancer. Gastroenterology 2012; 142(3):497–504. doi:10.1053/j.gastro.2011.11.024
- van Roon AH, Goede SL, van Ballegooijen M, et al. Random comparison of repeated faecal immunochemical testing at different intervals for population-based colorectal cancer screening. Gut 2013; 62(3):409–415. doi:10.1136/gutjnl-2011-301583
- Chubak J, Garcia MP, Burnett-Hartman AN, et al; PROSPR consortium. Time to colonoscopy after positive fecal blood test in four US health care systems. Cancer Epidemiol Biomarkers Prev 2016; 25(2):344–350. doi:10.1158/1055-9965.EPI-15-0470
- Carlson CM, Kirby KA, Casadei MA, Partin MR, Kistler CE, Walter LC. Lack of follow-up after fecal occult blood testing in older adults: inappropriate screening or failure to follow up? Arch Intern Med 2011; 171(3):249–256. doi:10.1001/archinternmed.2010.372
- Selby K, Baumgartner C, Levin TR, et al. Interventions to improve follow-up of positive results on fecal blood tests: a systematic review. Ann Intern Med 2017; 167(8):565–575. doi:10.7326/M17-1361
- Corley DA, Jensen CD, Quinn VP, et al. Association between time to colonoscopy after a positive fecal test result and risk of colorectal cancer and cancer stage at diagnosis. JAMA 2017; 317(16):1631–1641. doi:10.1001/jama.2017.3634
- Meester RG, Zauber AG, Doubeni CA, et al. Consequences of increasing time to colonoscopy examination after positive result from fecal colorectal cancer screening test. Clin Gastroenterol Hepatol 2016; 14(10):1445–1451.e8. doi:10.1016/j.cgh.2016.05.017
- Haug U, Grobbee EJ, Lansdorp-Vogelaar I, Spaander MCW, Kuipers EJ. Immunochemical faecal occult blood testing to screen for colorectal cancer: can the screening interval be extended? Gut 2017; 66(7):1262–1267. doi:10.1136/gutjnl-2015-310102
- Goede SL, van Roon AH, Reijerink JC, et al. Cost-effectiveness of one versus two sample faecal immunochemical testing for colorectal cancer screening. Gut 2013; 62(5):727–734. doi:10.1136/gutjnl-2011-301917
- Digby J, Fraser CG, Carey FA, Steele RJC. Can the performance of a quantitative FIT-based colorectal cancer screening programme be enhanced by lowering the threshold and increasing the interval? Gut 2018; 67(5):993–994. doi:10.1136/gutjnl-2017-314862
- Hoffman MS, Butler TW, Shaver T. Colonoscopy without sedation. J Clin Gastroenterol 1998; 26(4):279–282. pmid:9649011
- Zauber AG, Winawer SJ, O’Brien MJ, et al. Colonoscopic polypectomy and long-term prevention of colorectal-cancer deaths. N Engl J Med 2012; 366(8):687–696. doi:10.1056/NEJMoa1100370
- Nishihara R, Wu K, Lochhead P, et al. Long-term colorectal-cancer incidence and mortality after lower endoscopy. N Engl J Med 2013; 369(12):1095–1105. doi:10.1056/NEJMoa1301969
- Løberg M, Kalager M, Holme Ø, Hoff G, Adami HO, Bretthauer M. Long-term colorectal-cancer mortality after adenoma removal. N Engl J Med 2014; 371(9):799–807. doi:10.1056/NEJMoa1315870
- Manser CN, Bachmann LM, Brunner J, Hunold F, Bauerfeind P, Marbet UA. Colonoscopy screening markedly reduces the occurrence of colon carcinomas and carcinoma-related death: a closed cohort study. Gastrointest Endosc 2012; 76(1):110–117. doi:10.1016/j.gie.2012.02.040
- Winawer SJ, Zauber AG, Ho MN, et al. Prevention of colorectal cancer by colonoscopic polypectomy. The National Polyp Study Workgroup. N Engl J Med 1993; 329(27):1977–1981. doi:10.1056/NEJM199312303292701
- Citarda F, Tomaselli G, Capocaccia R, Barcherini S, Crespi M; Italian Multicentre Study Group. Efficacy in standard clinical practice of colonoscopic polypectomy in reducing colorectal cancer incidence. Gut 2001; 48(6):812–815. pmid:11358901
- Muller AD, Sonnenberg A. Prevention of colorectal cancer by flexible endoscopy and polypectomy. A case-control study of 32,702 veterans. Ann Intern Med 1995; 123(12):904–910. pmid:7486484
- Knudsen AB, Zauber AG, Rutter CM, et al. Estimation of benefits, burden, and harms of colorectal cancer screening strategies: modeling study for the US Preventive Services Task Force. JAMA 2016; 315(23):2595–2609. doi:10.1001/jama.2016.6828
- Rex DK, Schoenfeld PS, Cohen J, et al. Quality indicators for colonoscopy. Gastrointest Endosc 2015; 81(1):31–53. doi:10.1016/j.gie.2014.07.058
- Barclay RL, Vicari JJ, Doughty AS, Johanson JF, Greenlaw RL. Colonoscopic withdrawal times and adenoma detection during screening colonoscopy. N Engl J Med 2006; 355(24):2533–2541. doi:10.1056/NEJMoa055498
- Corley DA, Levin TR, Doubeni CA. Adenoma detection rate and risk of colorectal cancer and death. N Engl J Med 2014; 370(26):2541. doi:10.1056/NEJMc1405329
- Lin JS, Piper MA, Perdue LA, et al. Screening for colorectal cancer: updated evidence report and systematic review for the US Preventive Services Task Force. JAMA 2016; 315(23):2576–2594. doi:10.1001/jama.2016.3332
- Gatto NM, Frucht H, Sundararajan V, Jacobson JS, Grann VR, Neugut AI. Risk of perforation after colonoscopy and sigmoidoscopy: a population-based study. J Natl Cancer Inst 2003; 95(3):230–236. pmid:12569145
- Warren JL, Klabunde CN, Mariotto AB, et al. Adverse events after outpatient colonoscopy in the Medicare population. Ann Intern Med 2009; 150(12):849–857, W152. pmid:19528563
- Quintero E, Carrillo M, Gimeno-García AZ, et al. Equivalency of fecal immunochemical tests and colonoscopy in familial colorectal cancer screening. Gastroenterology 2014; 147(5):1021–130.e1. doi:10.1053/j.gastro.2014.08.004
- Leddin D, Lieberman DA, Tse F, et al. Clinical practice guideline on screening for colorectal cancer in individuals with a family history of nonhereditary colorectal cancer or adenoma: the Canadian Association of Gastroenterology Banff Consensus. Gastroenterology 2018; 155(5):1325–1347.e3. doi:10.1053/j.gastro.2018.08.017
- Quintero E, Castells A, Bujanda L, et al; COLONPREV Study Investigators. Colonoscopy versus fecal immunochemical testing in colorectal-cancer screening. N Engl J Med 2012; 366(8):697–706. doi:10.1056/NEJMoa1108895
- Gupta S, Halm EA, Rockey DC, et al. Comparative effectiveness of fecal immunochemical test outreach, colonoscopy outreach, and usual care for boosting colorectal cancer screening among the underserved: a randomized clinical trial. JAMA Intern Med 2013; 173(18):1725–1732. doi:10.1001/jamainternmed.2013.9294
- Segnan N, Senore C, Andreoni B, et al; SCORE3 Working Group-Italy. Comparing attendance and detection rate of colonoscopy with sigmoidoscopy and FIT for colorectal cancer screening. Gastroenterology 2007; 132(7):2304–2312. doi:10.1053/j.gastro.2007.03.030
KEY POINTS
- Colorectal cancer rates are increasing in young individuals, with 10,000 new cases reported in 2017 in people ages 20 to 49. The evidence to support screening at ages 45 to 50 is not well established.
- FIT is noninvasive but requires high patient adherence and the ability to follow a multistep process. Preliminary results from one trial showed it inferior to colonoscopy for detecting colorectal cancer precursors.
- Colonoscopy allows visualization and removal of precursor lesions. A positive FIT result requires follow-up colonoscopy within 10 months.

Women’s health 2019: Osteoporosis, breast cancer, contraception, and hormone therapy
Keeping up with current evidence-based healthcare practices is key to providing good clinical care to patients. This review presents 5 vignettes that highlight key issues in women’s health: osteoporosis screening, hormonal contraceptive interactions with antibiotics, hormone replacement therapy in carriers of the BRCA1 gene mutation, risks associated with hormonal contraception, and breast cancer diagnosis using digital tomosynthesis in addition to digital mammography. Supporting articles, all published in 2017 and 2018, were selected from high-impact medical and women’s health journals.
OSTEOPOROSIS SCREENING FOR FRACTURE PREVENTION
A 60-year-old woman reports that her last menstrual period was 7 years ago. She has no history of falls or fractures, and she takes no medications. She smokes 10 cigarettes per day and drinks 3 to 4 alcoholic beverages on most days of the week. She is 5 feet 6 inches (170 cm) tall and weighs 107 lb. Should she be screened for osteoporosis?
Osteoporosis is underdiagnosed
It is estimated that, in the United States, 12.3 million individuals older than 50 will develop osteoporosis by 2020. Missed opportunities to screen high-risk individuals can lead to fractures, including fractures of the hip.1
Updated screening recommendations
In 2018, the US Preventive Services Task Force (USPSTF) developed and published evidence-based recommendations for osteoporosis screening to help providers identify and treat osteoporosis early to prevent fractures.2 Available evidence on screening and treatment in women and men were reviewed with the intention of updating the 2011 USPSTF recommendations. The review also evaluated risk assessment tools, screening intervals, and efficacy of screening and treatment in various subpopulations.
Since the 2011 recommendations, more data have become available on fracture risk assessment with or without bone mineral density measurements. In its 2018 report, the USPSTF recommends that postmenopausal women younger than 65 should undergo screening with a bone density test if their 10-year risk of major osteoporotic fracture is more than 8.4%. This is equivalent to the fracture risk of a 65-year-old white woman with no major risk factors for fracture (grade B recommendation—high certainty that the benefit is moderate, or moderate certainty that the benefit is moderate to substantial).2
Assessment of fracture risk
For postmenopausal women who are under age 65 and who have at least 1 risk factor for fracture, it is reasonable to use a clinical risk assessment tool to determine who should undergo screening with bone mineral density measurement. Risk factors associated with an increased risk of osteoporotic fractures include a parental history of hip fracture, smoking, intake of 3 or more alcoholic drinks per day, low body weight, malabsorption, rheumatoid arthritis, diabetes, and postmenopausal status (not using estrogen replacement). Medications should be carefully reviewed for those that can increase the risk of fractures, including steroids and antiestrogen treatments.
The 10-year risk of a major osteoporotic or hip fracture can be assessed using the Fractional Risk Assessment Tool (FRAX), available at www.sheffield.ac.uk/FRAX/. Other acceptable tools that perform similarly to FRAX include the Osteoporosis Risk Assessment Instrument (ORAI) (10 studies; N = 16,780), Osteoporosis Index of Risk (OSIRIS) (5 studies; N = 5,649), Osteoporosis Self-Assessment Tool (OST) (13 studies; N = 44,323), and Simple Calculated Osteoporosis Risk Estimation (SCORE) (8 studies; N = 15,362).
Should this patient be screened for osteoporosis?
Based on the FRAX, this patient’s 10-year risk of major osteoporosis fracture is 9.2%. She would benefit from osteoporosis screening with a bone density test.
DO ANTIBIOTICS REDUCE EFFECTIVENESS OF HORMONAL CONTRACEPTION?
A 27-year-old woman presents with a dog bite on her right hand and is started on oral antibiotics. She takes an oral contraceptive that contains 35 µg of ethinyl estradiol and 0.25 mg of norgestimate. She asks if she should use condoms while taking antibiotics.
The antibiotics rifampin and rifabutin are known inducers of the hepatic enzymes required for contraceptive steroid metabolism, whereas other antibiotics are not. Despite the lack of compelling evidence that broad-spectrum antibiotics interfere with the efficacy of hormonal contraception, most pharmacists recommend backup contraception for women who use concomitant antibiotics.3 This practice could lead to poor compliance with the contraceptive regimen, the antibiotic regimen, or both.3
Simmons et al3 conducted a systematic review of randomized and nonrandomized studies that assessed pregnancy rates, breakthrough bleeding, ovulation suppression, and hormone pharmacokinetics in women taking oral or vaginal hormonal contraceptives in combination with nonrifamycin antibiotics, including oral, intramuscular, and intravenous forms. Oral contraceptives used in the studies included a range of doses and progestins, but lowest-dose pills, such as those containing less than 30 µg ethinyl estradiol or less than 150 µg levonorgestrel, were not included.
The contraceptive formulations in this systematic review3 included oral contraceptive pills, emergency contraception pills, and the contraceptive vaginal ring. The effect of antibiotics on other nonoral contraceptives, such as the transdermal patch, injectables, and progestin implants was not studied.
Four observational studies3 evaluated pregnancy rates or hormonal contraception failure with any antibiotic use. In 2 of these 4 studies, there was no difference in pregnancy rates in women who used oral contraceptives with and without nonrifamycin antibiotics. However, ethinyl estradiol was shown to have increased clearance when administered with dirithromycin (a macrolide).3 Twenty-five of the studies reported measures of contraceptive effectiveness (ovulation) and pharmacokinetic outcomes.
There were no observed differences in ovulation suppression or breakthrough bleeding in any study that combined hormonal contraceptives with an antibiotic. Furthermore, there was no significant decrease in progestin pharmacokinetic parameters during coadministration with an antibiotic.3 Study limitations included small sample sizes and the observational nature of the data.
How would you counsel this patient?
Available evidence suggests that nonrifamycin antibiotics do not diminish the effectiveness of the vaginal contraceptive ring or an oral hormonal contraceptive that contains at least 30 µg of ethinyl estradiol or 150 µg of levonorgestrel. Current guidelines do not recommend the use of additional backup contraception, regardless of hormonal contraception dose or formulation.4 Likewise, the most recent guidance for dental practitioners (ie, from 2012) no longer advises women to use additional contraceptive protection when taking nonrifamycin antibiotics.5
In our practice, we discuss the option of additional protection when prescribing formulations with lower estrogen doses (< 30 µg), not only because of the limitations of the available data, but also because of the high rates of unintended pregnancy with typical use of combined hormonal contraceptives (9% per year, unrelated to use of antibiotics).4 However, if our patient would rather not use additional barrier methods, she can be reassured that concomitant nonrifamycin antibiotic use is unlikely to affect contraceptive effectiveness.
HORMONE REPLACEMENT THERAPY IN CARRIERS OF THE BRCA1 MUTATION
A 41-year-old healthy mother of 3 was recently found to be a carrier of the BRCA1 mutation. She is planning to undergo prophylactic bilateral salpingo-oophorectomy for ovarian cancer prevention. However, she is apprehensive about undergoing surgical menopause. Should she be started on hormone replacement therapy after oophorectomy? How would hormone replacement therapy affect her risk of breast cancer?
In females who carry the BRCA1 mutation, the cumulative risk of both ovarian and breast cancer approaches 44% (95% confidence interval [CI] 36%–53%) and 72% (95% CI 65%–79%) by age 80.6 Prophylactic salpingo-oophorectomy reduces the risk of breast cancer by 50% and the risk of ovarian cancer by 90%. Unfortunately, premature withdrawal of ovarian hormones has been associated with long-term adverse effects including significant vasomotor symptoms, decreased quality of life, sexual dysfunction, early mortality, bone loss, decline in mood and cognition, and poor cardiovascular outcomes.7 Many of these effects can be avoided or lessened with hormone replacement therapy.
Kotsopoulos et al8 conducted a longitudinal, prospective analysis of BRCA1 mutation carriers in a multicenter study between 1995 and 2017. The mean follow-up period was 7.6 years (range 0.4–22.1). The study assessed associations between the use of hormone replacement therapy and breast cancer risk in carriers of the BRCA1 mutation who underwent prophylactic salpingo-oophorectomy. Study participants did not have a personal history of cancer. Those with a history of prophylactic mastectomy were excluded.
Participants completed a series of questionnaires every 2 years, disclosing updates in personal medical, cancer, and reproductive history. The questionnaires also inquired about the use of hormone replacement therapy, including the type used (estrogen only, progestin only, estrogen plus progestin, other), brand name, duration of use, and dose and route of administration (pill, patch, suppository).
Of the 13,087 BRCA1 mutation carriers identified, 872 met the study criteria. Of those, 377 (43%) reported using some form of hormone replacement therapy after salpingo-oophorectomy, and 495 (57%) did not. The average duration of use was 3.9 years (range 0.5–19), with most (69%) using estrogen alone; 18% used other regimens, including estrogen plus progestin and progestin only. A small percentage of participants did not indicate which formulation they used. On average, women using hormone replacement therapy underwent prophylactic oophorectomy earlier than nonusers (age 43.0 vs 48.4; absolute difference 5.5 years, P < .001).
During follow-up, there was no significant difference noted in the proportion of women diagnosed with breast cancer between hormone replacement therapy users and nonusers (10.3 vs 10.7%; absolute difference 0.4%; P = .86). In fact, for each year of estrogen-containing hormone replacement therapy, there was an 18% reduction in breast cancer risk when oophorectomy was performed before age 45 (95% CI 0.69–0.97). The authors also noted a nonsignificant 14% trend toward an increase in breast cancer risk for each year of progestin use after oophorectomy when surgery was performed before age 45 (95% CI 0.9–1.46).
Although prophylactic hysterectomy was not recommended, the authors noted that hysterectomy would eliminate the need for progestin-containing hormone replacement therapy. For those who underwent oophorectomy after age 45, hormone replacement therapy did not increase or decrease the risk of breast cancer.7
A meta-analysis by Marchetti et al9 also supports the safety of hormone replacement therapy after risk-reducing salpingo-oophorectomy. Three studies that included 1,100 patients were analyzed (including the Kotsopoulos study8 noted above). There was a nonsignificant decrease in breast cancer risk in women on estrogen-only hormone replacement therapy compared with women on estrogen-plus-progestin therapy (odds ratio 0.53, 95% CI 0.25–1.15). Overall, the authors regarded hormone replacement therapy as a safe therapeutic option after prophylactic salpingo-oophorectomy in carriers of the BRCA1 and BRCA2 mutations.9
In a case-control study published in 2016,10 hormone replacement therapy was assessed in 432 postmenopausal BRCA1 mutation carriers with invasive breast cancer (cases) and in 432 BRCA1 mutation carriers without a history of breast cancer (controls). Results showed no difference in breast cancer risk between hormone replacement therapy users and nonusers.10
Rebbeck et al11 evaluated short-term hormone replacement therapy in BRCA1 and BRCA2 gene-mutation carriers after they underwent prophylactic salpingo-oophorectomy. The results showed that hormone replacement did not affect the breast cancer risk-reduction conferred with prophylactic bilateral salpingo-oophorectomy.
Johansen et al12 evaluated hormone replacement therapy in premenopausal women after prophylactic salpingo-oophorectomy. They studied 324 carriers of BRCA gene mutations after they underwent prophylactic salpingo-oophorectomy and a subset of 950 controls who had bilateral salpingo-oophorectomy for reasons unrelated to cancer. In both groups, hormone replacement therapy was underutilized. The authors recommended using it when clinically indicated.
Should your patient start hormone replacement therapy?
This patient is healthy, and in the absence of contraindications, systemic hormone replacement therapy after prophylactic oophorectomy could mitigate the potential adverse effects of surgically induced menopause. The patient can be reassured that estrogen-containing short-term hormone replacement therapy is unlikely to increase her breast cancer risk.
HORMONAL CONTRACEPTION AND THE RISK OF BREAST CANCER
A 44-year-old woman presents to your office for an annual visit. She is sexually active but does not wish to become pregnant. She has a family history of breast cancer: her mother was diagnosed at age 53. She is interested in an oral contraceptive to prevent pregnancy and acne. However, she is nervous about being on any contraceptive that may increase her risk of breast cancer.
To date, studies assessing the effect of hormonal contraception on the risk of breast cancer have produced inconsistent results. Although most studies have shown no associated risk, a few have shown a temporary 20% to 30% increased risk of breast cancer during use.13,14 Case-controlled studies that reported an association between hormonal contraception and breast cancer included populations taking higher-dose combination pills, which are no longer prescribed. Most studies do not evaluate specific formulations of hormonal contraception, and little is known about effects associated with intrauterine devices or progestin-only contraception.
A prospective study performed by Mørch et al13 followed more than 1 million reproductive-aged women for a mean of 10.9 years. The Danish Cancer Registry was used to identify cases of invasive breast cancer. Women who used hormonal contraceptives had a relative risk of breast cancer of 1.20 compared with women not on hormonal contraception (95% CI 1.14–1.26). The study suggested that those who had been on contraceptive agents for more than 5 years had an increased risk and that this risk remained for 5 years after the agents were discontinued. Conversely, no increased risk of cancer was noted in those who used hormonal contraception for less than 5 years. No notable differences were seen among various formulations.
For women using the levonorgestrel-containing intrauterine device, the relative risk of breast cancer was 1.21 (95% CI 1.11–1.33). A few cancers were noted in those who used the progestin-only implant or those using depot medroxyprogesterone acetate. While the study showed an increased relative risk of breast cancer, the absolute risk was low—13 cases per 100,000, or approximately 1 additional case of breast cancer per 7,690 per year.13
This study had several important limitations. The authors did not adjust for common breast cancer risk factors including age at menarche, alcohol use, or breastfeeding. Additionally, the study did not account for the use of hormonal contraception before the study period and conversely, did not account for women who may have stopped taking their contraceptive despite their prescribed duration. The frequency of mammography was not explicitly noted, which could have shifted results for women who had more aggressive screening.
It is also noteworthy that the use of high-dose systemic progestins was not associated with an increased risk, whereas the levonorgestrel intrauterine device, which contains only 1/20th the dose of a low-dose oral contraceptive pill, was associated with an increased risk. This discrepancy in risk warrants further investigation, and clinicians should be aware that this inconsistency needs validation before changing clinical practice.
In an observational cohort study,15 more than 100,000 women ages 50 to 71 were followed prospectively for 15 years to evaluate the association between hormonal contraceptive use and the risk of gynecologic and breast cancers. In this study, the duration of hormonal contraceptive use, smoking status, alcohol use, body mass index, physical activity, and family history of cancer were recorded. Long-term hormonal contraceptive use reduced ovarian and endometrial cancer risks by 40% and 34%, respectively, with no increase in breast cancer risk regardless of family history.
How would you counsel the patient?
The patient should be educated on the benefits of hormonal contraception that extend beyond pregnancy prevention, including regulation of menses, improved acne, decreased risk of endometrial and ovarian cancer, and likely reductions in colorectal cancer and overall mortality risk.13–16 Further, after their own systematic review of the data assessing risk of breast cancer with hormonal contraception, the US Centers for Disease Control and Prevention state in their guidelines that all contraceptives may be used without limitation in those who have a family history of breast cancer.4 Any potential increased risk of breast cancer in women using hormonal contraception is small and would not outweigh the benefits associated with use.
One must consider the impact of an unintended pregnancy in such women, including effects on the health of the fetus and mother. Recent reports on the increasing rates of maternal death in the US (23.8 of 100,000 live births) serve as a reminder of the complications that can arise with pregnancy, especially if a mother’s health is not optimized before conception.17
MAMMOGRAPHY PLUS TOMOSYNTHESIS VS MAMMOGRAPHY ALONE
The same 44-year-old patient now inquires about screening for breast cancer. She is curious about 3-dimensional mammography and whether it would be a better screening test for her.
Digital breast tomosynthesis (DBT) is a newer imaging modality that provides a 3-dimensional reconstruction of the breast using low-dose x-ray imaging. Some studies have shown that combining DBT with digital mammography may be superior to digital mammography alone in detecting cancers.18 However, digital mammography is currently the gold standard for breast cancer screening and is the only test proven to reduce mortality.18,19
In a retrospective US study of 13 medical centers,20 breast cancer detection rates increased by 41% the year after DBT was introduced, from 2.9 to 4.1 per 1,000 cases. DBT was associated with 16 fewer patients recalled for repeat imaging out of 1,000 women screened (as opposed to mammography alone). Two European studies similarly suggested an increase in cancer detection with lower recall rates.21,22
Is 3-D mammography a better option?
In a 2-arm study by Pattacini et al,18 nearly 20,000 women ages 45 to 70 were randomized to undergo either digital mammography or digital mammography plus DBT for primary breast cancer screening. Women were enrolled over a 2-year period and were followed for 4.5 years, and the development of a primary invasive cancer was the primary end point. Recall rates, reading times, and radiation doses were also compared between the 2 groups.
Overall, the cancer detection rate was higher in the digital mammography plus DBT arm compared with digital mammography alone (8.6 vs 4.5 per 1,000). The detection rates were higher in the combined screening group among all age subgroups, with relative risks ranging from 1.83 to 2.04 (P = .93). The recall rate was 3.5% in the 2 arms, with relative risks ranging from 0.93 to 1.11 (P = .52). There was a reduction in the number of false positives seen in women undergoing digital mammography plus DBT when compared with digital mammography alone, from 30 per 1,000 to 27 per 1,000.
Detection of ductal carcinoma in situ increased in the experimental arm (relative detection 2.80, 95% CI 1.01–7.65) compared with invasive cancers. Comparing radiation, the dose was 2.3 times higher in those who underwent digital mammography plus DBT. The average reading times for digital mammography alone were 20 to 85 seconds; adding DBT added 35 to 81 seconds.19
Should you advise 3-D mammography?
The patient should be educated on the benefits of both digital mammography alone and digital mammography plus DBT. The use of digital mammography plus DBT has been supported in various studies and has been shown to increase cancer detection rates, although data are still conflicting regarding recall rates.19,20 More studies are needed to determine its effect on breast cancer morality.
Routine use of DBT in women with or without dense breast tissue has not been recommended by organizations such as the USPSTF and the American College of Obstetricians and Gynecologists.23,24 While there is an increased dose of radiation, it still falls below the US Food and Drug Administration limits and should not be the sole barrier to use.
- Cauley JA. Screening for osteoporosis. JAMA 2018; 319(24):2483–2485. doi:10.1001/jama.2018.5722
- US Preventive Services Task Force, Curry SJ, Krist AH, Owens DK, et al. Screening for osteoporosis to prevent fractures: US Preventive Services Task Force recommendation statement. JAMA 2018; 319(24):2521–2531. doi:10.1001/jama.2018.7498
- Simmons KB, Haddad LB, Nanda K, Curtis KM. Drug interactions between non-rifamycin antibiotics and hormonal contraception: a systematic review. Am J Obstet Gynecol 2018; 218(1):88–97.e14. doi:10.1016/j.ajog.2017.07.003
- Curtis KM, Tepper NK, Jatlaoui TC, et al. US Medical eligibility criteria for contraceptive use, 2016. MMWR Recomm Rep 2016; 65(3):1–103. doi:10.15585/mmwr.rr6503a1
- Taylor J, Pemberton MN. Antibiotics and oral contraceptives: new considerations for dental practice. Br Dent J 2012; 212(10):481–483. doi:10.1038/sj.bdj.2012.414
- Kuchenbaecker KB, Hopper JL, Barnes DR, et al. Risks of breast, ovarian, and contralateral breast cancer for BRCA1 and BRCA2 mutation carriers. JAMA 2017; 317(23):2402–2416. doi:10.1001/jama.2017.7112
- Faubion SS, Kuhle CL, Shuster LT, Rocca WA. Long-term health consequences of premature or early menopause and considerations for management. Climacteric 2015; 18(4):483–491. doi:10.3109/13697137.2015.1020484
- Kotsopoulos J, Gronwald J, Karlan BY, et al; Hereditary Breast Cancer Clinical Study Group. Hormone replacement therapy after oophorectomy and breast cancer risk among BRCA1 mutation carriers. JAMA Oncol 2018; 4(8):1059–1065. doi:10.1001/jamaoncol.2018.0211
- Marchetti C, De Felice F, Boccia S, et al. Hormone replacement therapy after prophylactic risk reducing salpingo-oophorectomy and breast cancer risk in BRCA1 and BRCA2 mutation carriers: a meta-analysis. Crit Rev Oncol Hematol 2018; 132:111–115. doi:10.1016/j.critrevonc.2018.09.018
- Kotsopoulos J, Huzarski T, Gronwald J, et al. Hormone replacement therapy after menopause and risk of breast cancer in BRCA1 mutation carriers: a case-control study. Breast Cancer Res Treat 2016; 155(2):365–373. doi:10.1007/s10549-016-3685-3
- Rebbeck TR, Friebel T, Wagner T, et al; PROSE Study Group. Effect of short-term hormone replacement therapy on breast cancer risk reduction after bilateral prophylactic oophorectomy in BRCA1 and BRCA2 mutation carriers: the PROSE Study Group. J Clin Oncol 2005; 23(31):7804–7810. doi:10.1200/JCO.2004.00.8151
- Johansen N, Liavaag AH, Iversen OE, Dørum A, Braaten T, Michelsen TM. Use of hormone replacement therapy after risk-reducing salpingo-oophorectomy. Acta Obstet Gynecol Scand 2017; 96(5):547–555. doi:10.1111/aogs.13120
- Mørch LS, Skovlund CW, Hannaford PC, Iversen L, Fielding S, Lidegaard Ø. Contemporary hormonal contraception and the risk of breast cancer. N Engl J Med 2017; 377(23):2228–2239. doi:10.1056/NEJMoa1700732
- Batur P, Sikka S, McNamara M. Contraception update: extended use of long acting methods, hormonal contraception risks, and over the counter access. J Womens Health (Larchmt) 2018. doi:10.1089/jwh.2018.7391. [Epub ahead of print]
- Michels KA, Pfeiffer RM, Brinton LA, Trabert B. Modification of the associations between duration of oral contraceptive use and ovarian, endometrial, breast, and colorectal cancers. JAMA Oncol 2018; 4(4):516–521. doi:10.1001/jamaoncol.2017.4942
- Iversen L, Fielding S, Lidegaard Ø, Mørch LS, Skovlund CW, Hannaford PC. Association between contemporary hormonal contraception and ovarian cancer in women of reproductive age in Denmark: prospective, nationwide cohort study. BMJ 2018; 362:k3609. doi:10.1136/bmj.k3609
- MacDorman MF, Declercq E, Cabral H, Morton C. Recent increases in the US maternal mortality rate: disentangling trends from measurement issues. Obstet Gynecol 2016; 128(3):447–455. doi:10.1097/AOG.0000000000001556
- Pattacini P, Nitrosi A, Giorgi Rossi P, et al; RETomo Working Group. Digital mammography versus digital mammography plus tomosynthesis for breast cancer screening: the Reggio Emilia tomosynthesis randomized trial. Radiology 2018; 288(2):375–385. doi:10.1148/radiol.2018172119
- Pace L, Keating NL. A systematic assessment of benefits and risks to guide breast cancer screening decisions. JAMA 2014; 311(13):1327–1335. doi:10.1001/jama.2014.1398
- Friedewald SM, Rafferty EA, Rose SL, et al. Breast cancer screening using tomosynthesis in combination with digital mammography. JAMA 2014; 311(24):2499–2507. doi:10.1001/jama.2014.6095
- Skaane P, Bandos AI, Gullien R, et al. Comparison of digital mammography alone and digital mammography plus tomosynthesis in a population-based screening program. Radiology 2013; 267(1):47–56. doi:10.1148/radiol.12121373
- Ciatto S, Houssami N, Bernardi D, et al. Integration of 3D digital mammography with tomosynthesis for population breast-cancer screening (STORM): a prospective comparison study. Lancet Oncol 2013; 14(7):583–589. doi:10.1016/S1470-2045(13)70134-7
- US Preventive Services Task Force. Final recommendation statement: breast cancer: screening. www.uspreventiveservicestaskforce.org/Page/Document/RecommendationStatementFinal/breast-cancer-screening1. Accessed May 13, 2019.
- American College of Obstetricians and Gynecologists. Breast cancer risk assessment and screening in average-risk women. www.acog.org/Clinical-Guidance-and-Publications/Practice-Bulletins/Committee-on-Practice-Bulletins-Gynecology/Breast-Cancer-Risk-Assessment-and-Screening-in-Average-Risk-Women?IsMobileSet=false#5. Accessed May 13, 2019.
Keeping up with current evidence-based healthcare practices is key to providing good clinical care to patients. This review presents 5 vignettes that highlight key issues in women’s health: osteoporosis screening, hormonal contraceptive interactions with antibiotics, hormone replacement therapy in carriers of the BRCA1 gene mutation, risks associated with hormonal contraception, and breast cancer diagnosis using digital tomosynthesis in addition to digital mammography. Supporting articles, all published in 2017 and 2018, were selected from high-impact medical and women’s health journals.
OSTEOPOROSIS SCREENING FOR FRACTURE PREVENTION
A 60-year-old woman reports that her last menstrual period was 7 years ago. She has no history of falls or fractures, and she takes no medications. She smokes 10 cigarettes per day and drinks 3 to 4 alcoholic beverages on most days of the week. She is 5 feet 6 inches (170 cm) tall and weighs 107 lb. Should she be screened for osteoporosis?
Osteoporosis is underdiagnosed
It is estimated that, in the United States, 12.3 million individuals older than 50 will develop osteoporosis by 2020. Missed opportunities to screen high-risk individuals can lead to fractures, including fractures of the hip.1
Updated screening recommendations
In 2018, the US Preventive Services Task Force (USPSTF) developed and published evidence-based recommendations for osteoporosis screening to help providers identify and treat osteoporosis early to prevent fractures.2 Available evidence on screening and treatment in women and men were reviewed with the intention of updating the 2011 USPSTF recommendations. The review also evaluated risk assessment tools, screening intervals, and efficacy of screening and treatment in various subpopulations.
Since the 2011 recommendations, more data have become available on fracture risk assessment with or without bone mineral density measurements. In its 2018 report, the USPSTF recommends that postmenopausal women younger than 65 should undergo screening with a bone density test if their 10-year risk of major osteoporotic fracture is more than 8.4%. This is equivalent to the fracture risk of a 65-year-old white woman with no major risk factors for fracture (grade B recommendation—high certainty that the benefit is moderate, or moderate certainty that the benefit is moderate to substantial).2
Assessment of fracture risk
For postmenopausal women who are under age 65 and who have at least 1 risk factor for fracture, it is reasonable to use a clinical risk assessment tool to determine who should undergo screening with bone mineral density measurement. Risk factors associated with an increased risk of osteoporotic fractures include a parental history of hip fracture, smoking, intake of 3 or more alcoholic drinks per day, low body weight, malabsorption, rheumatoid arthritis, diabetes, and postmenopausal status (not using estrogen replacement). Medications should be carefully reviewed for those that can increase the risk of fractures, including steroids and antiestrogen treatments.
The 10-year risk of a major osteoporotic or hip fracture can be assessed using the Fractional Risk Assessment Tool (FRAX), available at www.sheffield.ac.uk/FRAX/. Other acceptable tools that perform similarly to FRAX include the Osteoporosis Risk Assessment Instrument (ORAI) (10 studies; N = 16,780), Osteoporosis Index of Risk (OSIRIS) (5 studies; N = 5,649), Osteoporosis Self-Assessment Tool (OST) (13 studies; N = 44,323), and Simple Calculated Osteoporosis Risk Estimation (SCORE) (8 studies; N = 15,362).
Should this patient be screened for osteoporosis?
Based on the FRAX, this patient’s 10-year risk of major osteoporosis fracture is 9.2%. She would benefit from osteoporosis screening with a bone density test.
DO ANTIBIOTICS REDUCE EFFECTIVENESS OF HORMONAL CONTRACEPTION?
A 27-year-old woman presents with a dog bite on her right hand and is started on oral antibiotics. She takes an oral contraceptive that contains 35 µg of ethinyl estradiol and 0.25 mg of norgestimate. She asks if she should use condoms while taking antibiotics.
The antibiotics rifampin and rifabutin are known inducers of the hepatic enzymes required for contraceptive steroid metabolism, whereas other antibiotics are not. Despite the lack of compelling evidence that broad-spectrum antibiotics interfere with the efficacy of hormonal contraception, most pharmacists recommend backup contraception for women who use concomitant antibiotics.3 This practice could lead to poor compliance with the contraceptive regimen, the antibiotic regimen, or both.3
Simmons et al3 conducted a systematic review of randomized and nonrandomized studies that assessed pregnancy rates, breakthrough bleeding, ovulation suppression, and hormone pharmacokinetics in women taking oral or vaginal hormonal contraceptives in combination with nonrifamycin antibiotics, including oral, intramuscular, and intravenous forms. Oral contraceptives used in the studies included a range of doses and progestins, but lowest-dose pills, such as those containing less than 30 µg ethinyl estradiol or less than 150 µg levonorgestrel, were not included.
The contraceptive formulations in this systematic review3 included oral contraceptive pills, emergency contraception pills, and the contraceptive vaginal ring. The effect of antibiotics on other nonoral contraceptives, such as the transdermal patch, injectables, and progestin implants was not studied.
Four observational studies3 evaluated pregnancy rates or hormonal contraception failure with any antibiotic use. In 2 of these 4 studies, there was no difference in pregnancy rates in women who used oral contraceptives with and without nonrifamycin antibiotics. However, ethinyl estradiol was shown to have increased clearance when administered with dirithromycin (a macrolide).3 Twenty-five of the studies reported measures of contraceptive effectiveness (ovulation) and pharmacokinetic outcomes.
There were no observed differences in ovulation suppression or breakthrough bleeding in any study that combined hormonal contraceptives with an antibiotic. Furthermore, there was no significant decrease in progestin pharmacokinetic parameters during coadministration with an antibiotic.3 Study limitations included small sample sizes and the observational nature of the data.
How would you counsel this patient?
Available evidence suggests that nonrifamycin antibiotics do not diminish the effectiveness of the vaginal contraceptive ring or an oral hormonal contraceptive that contains at least 30 µg of ethinyl estradiol or 150 µg of levonorgestrel. Current guidelines do not recommend the use of additional backup contraception, regardless of hormonal contraception dose or formulation.4 Likewise, the most recent guidance for dental practitioners (ie, from 2012) no longer advises women to use additional contraceptive protection when taking nonrifamycin antibiotics.5
In our practice, we discuss the option of additional protection when prescribing formulations with lower estrogen doses (< 30 µg), not only because of the limitations of the available data, but also because of the high rates of unintended pregnancy with typical use of combined hormonal contraceptives (9% per year, unrelated to use of antibiotics).4 However, if our patient would rather not use additional barrier methods, she can be reassured that concomitant nonrifamycin antibiotic use is unlikely to affect contraceptive effectiveness.
HORMONE REPLACEMENT THERAPY IN CARRIERS OF THE BRCA1 MUTATION
A 41-year-old healthy mother of 3 was recently found to be a carrier of the BRCA1 mutation. She is planning to undergo prophylactic bilateral salpingo-oophorectomy for ovarian cancer prevention. However, she is apprehensive about undergoing surgical menopause. Should she be started on hormone replacement therapy after oophorectomy? How would hormone replacement therapy affect her risk of breast cancer?
In females who carry the BRCA1 mutation, the cumulative risk of both ovarian and breast cancer approaches 44% (95% confidence interval [CI] 36%–53%) and 72% (95% CI 65%–79%) by age 80.6 Prophylactic salpingo-oophorectomy reduces the risk of breast cancer by 50% and the risk of ovarian cancer by 90%. Unfortunately, premature withdrawal of ovarian hormones has been associated with long-term adverse effects including significant vasomotor symptoms, decreased quality of life, sexual dysfunction, early mortality, bone loss, decline in mood and cognition, and poor cardiovascular outcomes.7 Many of these effects can be avoided or lessened with hormone replacement therapy.
Kotsopoulos et al8 conducted a longitudinal, prospective analysis of BRCA1 mutation carriers in a multicenter study between 1995 and 2017. The mean follow-up period was 7.6 years (range 0.4–22.1). The study assessed associations between the use of hormone replacement therapy and breast cancer risk in carriers of the BRCA1 mutation who underwent prophylactic salpingo-oophorectomy. Study participants did not have a personal history of cancer. Those with a history of prophylactic mastectomy were excluded.
Participants completed a series of questionnaires every 2 years, disclosing updates in personal medical, cancer, and reproductive history. The questionnaires also inquired about the use of hormone replacement therapy, including the type used (estrogen only, progestin only, estrogen plus progestin, other), brand name, duration of use, and dose and route of administration (pill, patch, suppository).
Of the 13,087 BRCA1 mutation carriers identified, 872 met the study criteria. Of those, 377 (43%) reported using some form of hormone replacement therapy after salpingo-oophorectomy, and 495 (57%) did not. The average duration of use was 3.9 years (range 0.5–19), with most (69%) using estrogen alone; 18% used other regimens, including estrogen plus progestin and progestin only. A small percentage of participants did not indicate which formulation they used. On average, women using hormone replacement therapy underwent prophylactic oophorectomy earlier than nonusers (age 43.0 vs 48.4; absolute difference 5.5 years, P < .001).
During follow-up, there was no significant difference noted in the proportion of women diagnosed with breast cancer between hormone replacement therapy users and nonusers (10.3 vs 10.7%; absolute difference 0.4%; P = .86). In fact, for each year of estrogen-containing hormone replacement therapy, there was an 18% reduction in breast cancer risk when oophorectomy was performed before age 45 (95% CI 0.69–0.97). The authors also noted a nonsignificant 14% trend toward an increase in breast cancer risk for each year of progestin use after oophorectomy when surgery was performed before age 45 (95% CI 0.9–1.46).
Although prophylactic hysterectomy was not recommended, the authors noted that hysterectomy would eliminate the need for progestin-containing hormone replacement therapy. For those who underwent oophorectomy after age 45, hormone replacement therapy did not increase or decrease the risk of breast cancer.7
A meta-analysis by Marchetti et al9 also supports the safety of hormone replacement therapy after risk-reducing salpingo-oophorectomy. Three studies that included 1,100 patients were analyzed (including the Kotsopoulos study8 noted above). There was a nonsignificant decrease in breast cancer risk in women on estrogen-only hormone replacement therapy compared with women on estrogen-plus-progestin therapy (odds ratio 0.53, 95% CI 0.25–1.15). Overall, the authors regarded hormone replacement therapy as a safe therapeutic option after prophylactic salpingo-oophorectomy in carriers of the BRCA1 and BRCA2 mutations.9
In a case-control study published in 2016,10 hormone replacement therapy was assessed in 432 postmenopausal BRCA1 mutation carriers with invasive breast cancer (cases) and in 432 BRCA1 mutation carriers without a history of breast cancer (controls). Results showed no difference in breast cancer risk between hormone replacement therapy users and nonusers.10
Rebbeck et al11 evaluated short-term hormone replacement therapy in BRCA1 and BRCA2 gene-mutation carriers after they underwent prophylactic salpingo-oophorectomy. The results showed that hormone replacement did not affect the breast cancer risk-reduction conferred with prophylactic bilateral salpingo-oophorectomy.
Johansen et al12 evaluated hormone replacement therapy in premenopausal women after prophylactic salpingo-oophorectomy. They studied 324 carriers of BRCA gene mutations after they underwent prophylactic salpingo-oophorectomy and a subset of 950 controls who had bilateral salpingo-oophorectomy for reasons unrelated to cancer. In both groups, hormone replacement therapy was underutilized. The authors recommended using it when clinically indicated.
Should your patient start hormone replacement therapy?
This patient is healthy, and in the absence of contraindications, systemic hormone replacement therapy after prophylactic oophorectomy could mitigate the potential adverse effects of surgically induced menopause. The patient can be reassured that estrogen-containing short-term hormone replacement therapy is unlikely to increase her breast cancer risk.
HORMONAL CONTRACEPTION AND THE RISK OF BREAST CANCER
A 44-year-old woman presents to your office for an annual visit. She is sexually active but does not wish to become pregnant. She has a family history of breast cancer: her mother was diagnosed at age 53. She is interested in an oral contraceptive to prevent pregnancy and acne. However, she is nervous about being on any contraceptive that may increase her risk of breast cancer.
To date, studies assessing the effect of hormonal contraception on the risk of breast cancer have produced inconsistent results. Although most studies have shown no associated risk, a few have shown a temporary 20% to 30% increased risk of breast cancer during use.13,14 Case-controlled studies that reported an association between hormonal contraception and breast cancer included populations taking higher-dose combination pills, which are no longer prescribed. Most studies do not evaluate specific formulations of hormonal contraception, and little is known about effects associated with intrauterine devices or progestin-only contraception.
A prospective study performed by Mørch et al13 followed more than 1 million reproductive-aged women for a mean of 10.9 years. The Danish Cancer Registry was used to identify cases of invasive breast cancer. Women who used hormonal contraceptives had a relative risk of breast cancer of 1.20 compared with women not on hormonal contraception (95% CI 1.14–1.26). The study suggested that those who had been on contraceptive agents for more than 5 years had an increased risk and that this risk remained for 5 years after the agents were discontinued. Conversely, no increased risk of cancer was noted in those who used hormonal contraception for less than 5 years. No notable differences were seen among various formulations.
For women using the levonorgestrel-containing intrauterine device, the relative risk of breast cancer was 1.21 (95% CI 1.11–1.33). A few cancers were noted in those who used the progestin-only implant or those using depot medroxyprogesterone acetate. While the study showed an increased relative risk of breast cancer, the absolute risk was low—13 cases per 100,000, or approximately 1 additional case of breast cancer per 7,690 per year.13
This study had several important limitations. The authors did not adjust for common breast cancer risk factors including age at menarche, alcohol use, or breastfeeding. Additionally, the study did not account for the use of hormonal contraception before the study period and conversely, did not account for women who may have stopped taking their contraceptive despite their prescribed duration. The frequency of mammography was not explicitly noted, which could have shifted results for women who had more aggressive screening.
It is also noteworthy that the use of high-dose systemic progestins was not associated with an increased risk, whereas the levonorgestrel intrauterine device, which contains only 1/20th the dose of a low-dose oral contraceptive pill, was associated with an increased risk. This discrepancy in risk warrants further investigation, and clinicians should be aware that this inconsistency needs validation before changing clinical practice.
In an observational cohort study,15 more than 100,000 women ages 50 to 71 were followed prospectively for 15 years to evaluate the association between hormonal contraceptive use and the risk of gynecologic and breast cancers. In this study, the duration of hormonal contraceptive use, smoking status, alcohol use, body mass index, physical activity, and family history of cancer were recorded. Long-term hormonal contraceptive use reduced ovarian and endometrial cancer risks by 40% and 34%, respectively, with no increase in breast cancer risk regardless of family history.
How would you counsel the patient?
The patient should be educated on the benefits of hormonal contraception that extend beyond pregnancy prevention, including regulation of menses, improved acne, decreased risk of endometrial and ovarian cancer, and likely reductions in colorectal cancer and overall mortality risk.13–16 Further, after their own systematic review of the data assessing risk of breast cancer with hormonal contraception, the US Centers for Disease Control and Prevention state in their guidelines that all contraceptives may be used without limitation in those who have a family history of breast cancer.4 Any potential increased risk of breast cancer in women using hormonal contraception is small and would not outweigh the benefits associated with use.
One must consider the impact of an unintended pregnancy in such women, including effects on the health of the fetus and mother. Recent reports on the increasing rates of maternal death in the US (23.8 of 100,000 live births) serve as a reminder of the complications that can arise with pregnancy, especially if a mother’s health is not optimized before conception.17
MAMMOGRAPHY PLUS TOMOSYNTHESIS VS MAMMOGRAPHY ALONE
The same 44-year-old patient now inquires about screening for breast cancer. She is curious about 3-dimensional mammography and whether it would be a better screening test for her.
Digital breast tomosynthesis (DBT) is a newer imaging modality that provides a 3-dimensional reconstruction of the breast using low-dose x-ray imaging. Some studies have shown that combining DBT with digital mammography may be superior to digital mammography alone in detecting cancers.18 However, digital mammography is currently the gold standard for breast cancer screening and is the only test proven to reduce mortality.18,19
In a retrospective US study of 13 medical centers,20 breast cancer detection rates increased by 41% the year after DBT was introduced, from 2.9 to 4.1 per 1,000 cases. DBT was associated with 16 fewer patients recalled for repeat imaging out of 1,000 women screened (as opposed to mammography alone). Two European studies similarly suggested an increase in cancer detection with lower recall rates.21,22
Is 3-D mammography a better option?
In a 2-arm study by Pattacini et al,18 nearly 20,000 women ages 45 to 70 were randomized to undergo either digital mammography or digital mammography plus DBT for primary breast cancer screening. Women were enrolled over a 2-year period and were followed for 4.5 years, and the development of a primary invasive cancer was the primary end point. Recall rates, reading times, and radiation doses were also compared between the 2 groups.
Overall, the cancer detection rate was higher in the digital mammography plus DBT arm compared with digital mammography alone (8.6 vs 4.5 per 1,000). The detection rates were higher in the combined screening group among all age subgroups, with relative risks ranging from 1.83 to 2.04 (P = .93). The recall rate was 3.5% in the 2 arms, with relative risks ranging from 0.93 to 1.11 (P = .52). There was a reduction in the number of false positives seen in women undergoing digital mammography plus DBT when compared with digital mammography alone, from 30 per 1,000 to 27 per 1,000.
Detection of ductal carcinoma in situ increased in the experimental arm (relative detection 2.80, 95% CI 1.01–7.65) compared with invasive cancers. Comparing radiation, the dose was 2.3 times higher in those who underwent digital mammography plus DBT. The average reading times for digital mammography alone were 20 to 85 seconds; adding DBT added 35 to 81 seconds.19
Should you advise 3-D mammography?
The patient should be educated on the benefits of both digital mammography alone and digital mammography plus DBT. The use of digital mammography plus DBT has been supported in various studies and has been shown to increase cancer detection rates, although data are still conflicting regarding recall rates.19,20 More studies are needed to determine its effect on breast cancer morality.
Routine use of DBT in women with or without dense breast tissue has not been recommended by organizations such as the USPSTF and the American College of Obstetricians and Gynecologists.23,24 While there is an increased dose of radiation, it still falls below the US Food and Drug Administration limits and should not be the sole barrier to use.
Keeping up with current evidence-based healthcare practices is key to providing good clinical care to patients. This review presents 5 vignettes that highlight key issues in women’s health: osteoporosis screening, hormonal contraceptive interactions with antibiotics, hormone replacement therapy in carriers of the BRCA1 gene mutation, risks associated with hormonal contraception, and breast cancer diagnosis using digital tomosynthesis in addition to digital mammography. Supporting articles, all published in 2017 and 2018, were selected from high-impact medical and women’s health journals.
OSTEOPOROSIS SCREENING FOR FRACTURE PREVENTION
A 60-year-old woman reports that her last menstrual period was 7 years ago. She has no history of falls or fractures, and she takes no medications. She smokes 10 cigarettes per day and drinks 3 to 4 alcoholic beverages on most days of the week. She is 5 feet 6 inches (170 cm) tall and weighs 107 lb. Should she be screened for osteoporosis?
Osteoporosis is underdiagnosed
It is estimated that, in the United States, 12.3 million individuals older than 50 will develop osteoporosis by 2020. Missed opportunities to screen high-risk individuals can lead to fractures, including fractures of the hip.1
Updated screening recommendations
In 2018, the US Preventive Services Task Force (USPSTF) developed and published evidence-based recommendations for osteoporosis screening to help providers identify and treat osteoporosis early to prevent fractures.2 Available evidence on screening and treatment in women and men were reviewed with the intention of updating the 2011 USPSTF recommendations. The review also evaluated risk assessment tools, screening intervals, and efficacy of screening and treatment in various subpopulations.
Since the 2011 recommendations, more data have become available on fracture risk assessment with or without bone mineral density measurements. In its 2018 report, the USPSTF recommends that postmenopausal women younger than 65 should undergo screening with a bone density test if their 10-year risk of major osteoporotic fracture is more than 8.4%. This is equivalent to the fracture risk of a 65-year-old white woman with no major risk factors for fracture (grade B recommendation—high certainty that the benefit is moderate, or moderate certainty that the benefit is moderate to substantial).2
Assessment of fracture risk
For postmenopausal women who are under age 65 and who have at least 1 risk factor for fracture, it is reasonable to use a clinical risk assessment tool to determine who should undergo screening with bone mineral density measurement. Risk factors associated with an increased risk of osteoporotic fractures include a parental history of hip fracture, smoking, intake of 3 or more alcoholic drinks per day, low body weight, malabsorption, rheumatoid arthritis, diabetes, and postmenopausal status (not using estrogen replacement). Medications should be carefully reviewed for those that can increase the risk of fractures, including steroids and antiestrogen treatments.
The 10-year risk of a major osteoporotic or hip fracture can be assessed using the Fractional Risk Assessment Tool (FRAX), available at www.sheffield.ac.uk/FRAX/. Other acceptable tools that perform similarly to FRAX include the Osteoporosis Risk Assessment Instrument (ORAI) (10 studies; N = 16,780), Osteoporosis Index of Risk (OSIRIS) (5 studies; N = 5,649), Osteoporosis Self-Assessment Tool (OST) (13 studies; N = 44,323), and Simple Calculated Osteoporosis Risk Estimation (SCORE) (8 studies; N = 15,362).
Should this patient be screened for osteoporosis?
Based on the FRAX, this patient’s 10-year risk of major osteoporosis fracture is 9.2%. She would benefit from osteoporosis screening with a bone density test.
DO ANTIBIOTICS REDUCE EFFECTIVENESS OF HORMONAL CONTRACEPTION?
A 27-year-old woman presents with a dog bite on her right hand and is started on oral antibiotics. She takes an oral contraceptive that contains 35 µg of ethinyl estradiol and 0.25 mg of norgestimate. She asks if she should use condoms while taking antibiotics.
The antibiotics rifampin and rifabutin are known inducers of the hepatic enzymes required for contraceptive steroid metabolism, whereas other antibiotics are not. Despite the lack of compelling evidence that broad-spectrum antibiotics interfere with the efficacy of hormonal contraception, most pharmacists recommend backup contraception for women who use concomitant antibiotics.3 This practice could lead to poor compliance with the contraceptive regimen, the antibiotic regimen, or both.3
Simmons et al3 conducted a systematic review of randomized and nonrandomized studies that assessed pregnancy rates, breakthrough bleeding, ovulation suppression, and hormone pharmacokinetics in women taking oral or vaginal hormonal contraceptives in combination with nonrifamycin antibiotics, including oral, intramuscular, and intravenous forms. Oral contraceptives used in the studies included a range of doses and progestins, but lowest-dose pills, such as those containing less than 30 µg ethinyl estradiol or less than 150 µg levonorgestrel, were not included.
The contraceptive formulations in this systematic review3 included oral contraceptive pills, emergency contraception pills, and the contraceptive vaginal ring. The effect of antibiotics on other nonoral contraceptives, such as the transdermal patch, injectables, and progestin implants was not studied.
Four observational studies3 evaluated pregnancy rates or hormonal contraception failure with any antibiotic use. In 2 of these 4 studies, there was no difference in pregnancy rates in women who used oral contraceptives with and without nonrifamycin antibiotics. However, ethinyl estradiol was shown to have increased clearance when administered with dirithromycin (a macrolide).3 Twenty-five of the studies reported measures of contraceptive effectiveness (ovulation) and pharmacokinetic outcomes.
There were no observed differences in ovulation suppression or breakthrough bleeding in any study that combined hormonal contraceptives with an antibiotic. Furthermore, there was no significant decrease in progestin pharmacokinetic parameters during coadministration with an antibiotic.3 Study limitations included small sample sizes and the observational nature of the data.
How would you counsel this patient?
Available evidence suggests that nonrifamycin antibiotics do not diminish the effectiveness of the vaginal contraceptive ring or an oral hormonal contraceptive that contains at least 30 µg of ethinyl estradiol or 150 µg of levonorgestrel. Current guidelines do not recommend the use of additional backup contraception, regardless of hormonal contraception dose or formulation.4 Likewise, the most recent guidance for dental practitioners (ie, from 2012) no longer advises women to use additional contraceptive protection when taking nonrifamycin antibiotics.5
In our practice, we discuss the option of additional protection when prescribing formulations with lower estrogen doses (< 30 µg), not only because of the limitations of the available data, but also because of the high rates of unintended pregnancy with typical use of combined hormonal contraceptives (9% per year, unrelated to use of antibiotics).4 However, if our patient would rather not use additional barrier methods, she can be reassured that concomitant nonrifamycin antibiotic use is unlikely to affect contraceptive effectiveness.
HORMONE REPLACEMENT THERAPY IN CARRIERS OF THE BRCA1 MUTATION
A 41-year-old healthy mother of 3 was recently found to be a carrier of the BRCA1 mutation. She is planning to undergo prophylactic bilateral salpingo-oophorectomy for ovarian cancer prevention. However, she is apprehensive about undergoing surgical menopause. Should she be started on hormone replacement therapy after oophorectomy? How would hormone replacement therapy affect her risk of breast cancer?
In females who carry the BRCA1 mutation, the cumulative risk of both ovarian and breast cancer approaches 44% (95% confidence interval [CI] 36%–53%) and 72% (95% CI 65%–79%) by age 80.6 Prophylactic salpingo-oophorectomy reduces the risk of breast cancer by 50% and the risk of ovarian cancer by 90%. Unfortunately, premature withdrawal of ovarian hormones has been associated with long-term adverse effects including significant vasomotor symptoms, decreased quality of life, sexual dysfunction, early mortality, bone loss, decline in mood and cognition, and poor cardiovascular outcomes.7 Many of these effects can be avoided or lessened with hormone replacement therapy.
Kotsopoulos et al8 conducted a longitudinal, prospective analysis of BRCA1 mutation carriers in a multicenter study between 1995 and 2017. The mean follow-up period was 7.6 years (range 0.4–22.1). The study assessed associations between the use of hormone replacement therapy and breast cancer risk in carriers of the BRCA1 mutation who underwent prophylactic salpingo-oophorectomy. Study participants did not have a personal history of cancer. Those with a history of prophylactic mastectomy were excluded.
Participants completed a series of questionnaires every 2 years, disclosing updates in personal medical, cancer, and reproductive history. The questionnaires also inquired about the use of hormone replacement therapy, including the type used (estrogen only, progestin only, estrogen plus progestin, other), brand name, duration of use, and dose and route of administration (pill, patch, suppository).
Of the 13,087 BRCA1 mutation carriers identified, 872 met the study criteria. Of those, 377 (43%) reported using some form of hormone replacement therapy after salpingo-oophorectomy, and 495 (57%) did not. The average duration of use was 3.9 years (range 0.5–19), with most (69%) using estrogen alone; 18% used other regimens, including estrogen plus progestin and progestin only. A small percentage of participants did not indicate which formulation they used. On average, women using hormone replacement therapy underwent prophylactic oophorectomy earlier than nonusers (age 43.0 vs 48.4; absolute difference 5.5 years, P < .001).
During follow-up, there was no significant difference noted in the proportion of women diagnosed with breast cancer between hormone replacement therapy users and nonusers (10.3 vs 10.7%; absolute difference 0.4%; P = .86). In fact, for each year of estrogen-containing hormone replacement therapy, there was an 18% reduction in breast cancer risk when oophorectomy was performed before age 45 (95% CI 0.69–0.97). The authors also noted a nonsignificant 14% trend toward an increase in breast cancer risk for each year of progestin use after oophorectomy when surgery was performed before age 45 (95% CI 0.9–1.46).
Although prophylactic hysterectomy was not recommended, the authors noted that hysterectomy would eliminate the need for progestin-containing hormone replacement therapy. For those who underwent oophorectomy after age 45, hormone replacement therapy did not increase or decrease the risk of breast cancer.7
A meta-analysis by Marchetti et al9 also supports the safety of hormone replacement therapy after risk-reducing salpingo-oophorectomy. Three studies that included 1,100 patients were analyzed (including the Kotsopoulos study8 noted above). There was a nonsignificant decrease in breast cancer risk in women on estrogen-only hormone replacement therapy compared with women on estrogen-plus-progestin therapy (odds ratio 0.53, 95% CI 0.25–1.15). Overall, the authors regarded hormone replacement therapy as a safe therapeutic option after prophylactic salpingo-oophorectomy in carriers of the BRCA1 and BRCA2 mutations.9
In a case-control study published in 2016,10 hormone replacement therapy was assessed in 432 postmenopausal BRCA1 mutation carriers with invasive breast cancer (cases) and in 432 BRCA1 mutation carriers without a history of breast cancer (controls). Results showed no difference in breast cancer risk between hormone replacement therapy users and nonusers.10
Rebbeck et al11 evaluated short-term hormone replacement therapy in BRCA1 and BRCA2 gene-mutation carriers after they underwent prophylactic salpingo-oophorectomy. The results showed that hormone replacement did not affect the breast cancer risk-reduction conferred with prophylactic bilateral salpingo-oophorectomy.
Johansen et al12 evaluated hormone replacement therapy in premenopausal women after prophylactic salpingo-oophorectomy. They studied 324 carriers of BRCA gene mutations after they underwent prophylactic salpingo-oophorectomy and a subset of 950 controls who had bilateral salpingo-oophorectomy for reasons unrelated to cancer. In both groups, hormone replacement therapy was underutilized. The authors recommended using it when clinically indicated.
Should your patient start hormone replacement therapy?
This patient is healthy, and in the absence of contraindications, systemic hormone replacement therapy after prophylactic oophorectomy could mitigate the potential adverse effects of surgically induced menopause. The patient can be reassured that estrogen-containing short-term hormone replacement therapy is unlikely to increase her breast cancer risk.
HORMONAL CONTRACEPTION AND THE RISK OF BREAST CANCER
A 44-year-old woman presents to your office for an annual visit. She is sexually active but does not wish to become pregnant. She has a family history of breast cancer: her mother was diagnosed at age 53. She is interested in an oral contraceptive to prevent pregnancy and acne. However, she is nervous about being on any contraceptive that may increase her risk of breast cancer.
To date, studies assessing the effect of hormonal contraception on the risk of breast cancer have produced inconsistent results. Although most studies have shown no associated risk, a few have shown a temporary 20% to 30% increased risk of breast cancer during use.13,14 Case-controlled studies that reported an association between hormonal contraception and breast cancer included populations taking higher-dose combination pills, which are no longer prescribed. Most studies do not evaluate specific formulations of hormonal contraception, and little is known about effects associated with intrauterine devices or progestin-only contraception.
A prospective study performed by Mørch et al13 followed more than 1 million reproductive-aged women for a mean of 10.9 years. The Danish Cancer Registry was used to identify cases of invasive breast cancer. Women who used hormonal contraceptives had a relative risk of breast cancer of 1.20 compared with women not on hormonal contraception (95% CI 1.14–1.26). The study suggested that those who had been on contraceptive agents for more than 5 years had an increased risk and that this risk remained for 5 years after the agents were discontinued. Conversely, no increased risk of cancer was noted in those who used hormonal contraception for less than 5 years. No notable differences were seen among various formulations.
For women using the levonorgestrel-containing intrauterine device, the relative risk of breast cancer was 1.21 (95% CI 1.11–1.33). A few cancers were noted in those who used the progestin-only implant or those using depot medroxyprogesterone acetate. While the study showed an increased relative risk of breast cancer, the absolute risk was low—13 cases per 100,000, or approximately 1 additional case of breast cancer per 7,690 per year.13
This study had several important limitations. The authors did not adjust for common breast cancer risk factors including age at menarche, alcohol use, or breastfeeding. Additionally, the study did not account for the use of hormonal contraception before the study period and conversely, did not account for women who may have stopped taking their contraceptive despite their prescribed duration. The frequency of mammography was not explicitly noted, which could have shifted results for women who had more aggressive screening.
It is also noteworthy that the use of high-dose systemic progestins was not associated with an increased risk, whereas the levonorgestrel intrauterine device, which contains only 1/20th the dose of a low-dose oral contraceptive pill, was associated with an increased risk. This discrepancy in risk warrants further investigation, and clinicians should be aware that this inconsistency needs validation before changing clinical practice.
In an observational cohort study,15 more than 100,000 women ages 50 to 71 were followed prospectively for 15 years to evaluate the association between hormonal contraceptive use and the risk of gynecologic and breast cancers. In this study, the duration of hormonal contraceptive use, smoking status, alcohol use, body mass index, physical activity, and family history of cancer were recorded. Long-term hormonal contraceptive use reduced ovarian and endometrial cancer risks by 40% and 34%, respectively, with no increase in breast cancer risk regardless of family history.
How would you counsel the patient?
The patient should be educated on the benefits of hormonal contraception that extend beyond pregnancy prevention, including regulation of menses, improved acne, decreased risk of endometrial and ovarian cancer, and likely reductions in colorectal cancer and overall mortality risk.13–16 Further, after their own systematic review of the data assessing risk of breast cancer with hormonal contraception, the US Centers for Disease Control and Prevention state in their guidelines that all contraceptives may be used without limitation in those who have a family history of breast cancer.4 Any potential increased risk of breast cancer in women using hormonal contraception is small and would not outweigh the benefits associated with use.
One must consider the impact of an unintended pregnancy in such women, including effects on the health of the fetus and mother. Recent reports on the increasing rates of maternal death in the US (23.8 of 100,000 live births) serve as a reminder of the complications that can arise with pregnancy, especially if a mother’s health is not optimized before conception.17
MAMMOGRAPHY PLUS TOMOSYNTHESIS VS MAMMOGRAPHY ALONE
The same 44-year-old patient now inquires about screening for breast cancer. She is curious about 3-dimensional mammography and whether it would be a better screening test for her.
Digital breast tomosynthesis (DBT) is a newer imaging modality that provides a 3-dimensional reconstruction of the breast using low-dose x-ray imaging. Some studies have shown that combining DBT with digital mammography may be superior to digital mammography alone in detecting cancers.18 However, digital mammography is currently the gold standard for breast cancer screening and is the only test proven to reduce mortality.18,19
In a retrospective US study of 13 medical centers,20 breast cancer detection rates increased by 41% the year after DBT was introduced, from 2.9 to 4.1 per 1,000 cases. DBT was associated with 16 fewer patients recalled for repeat imaging out of 1,000 women screened (as opposed to mammography alone). Two European studies similarly suggested an increase in cancer detection with lower recall rates.21,22
Is 3-D mammography a better option?
In a 2-arm study by Pattacini et al,18 nearly 20,000 women ages 45 to 70 were randomized to undergo either digital mammography or digital mammography plus DBT for primary breast cancer screening. Women were enrolled over a 2-year period and were followed for 4.5 years, and the development of a primary invasive cancer was the primary end point. Recall rates, reading times, and radiation doses were also compared between the 2 groups.
Overall, the cancer detection rate was higher in the digital mammography plus DBT arm compared with digital mammography alone (8.6 vs 4.5 per 1,000). The detection rates were higher in the combined screening group among all age subgroups, with relative risks ranging from 1.83 to 2.04 (P = .93). The recall rate was 3.5% in the 2 arms, with relative risks ranging from 0.93 to 1.11 (P = .52). There was a reduction in the number of false positives seen in women undergoing digital mammography plus DBT when compared with digital mammography alone, from 30 per 1,000 to 27 per 1,000.
Detection of ductal carcinoma in situ increased in the experimental arm (relative detection 2.80, 95% CI 1.01–7.65) compared with invasive cancers. Comparing radiation, the dose was 2.3 times higher in those who underwent digital mammography plus DBT. The average reading times for digital mammography alone were 20 to 85 seconds; adding DBT added 35 to 81 seconds.19
Should you advise 3-D mammography?
The patient should be educated on the benefits of both digital mammography alone and digital mammography plus DBT. The use of digital mammography plus DBT has been supported in various studies and has been shown to increase cancer detection rates, although data are still conflicting regarding recall rates.19,20 More studies are needed to determine its effect on breast cancer morality.
Routine use of DBT in women with or without dense breast tissue has not been recommended by organizations such as the USPSTF and the American College of Obstetricians and Gynecologists.23,24 While there is an increased dose of radiation, it still falls below the US Food and Drug Administration limits and should not be the sole barrier to use.
- Cauley JA. Screening for osteoporosis. JAMA 2018; 319(24):2483–2485. doi:10.1001/jama.2018.5722
- US Preventive Services Task Force, Curry SJ, Krist AH, Owens DK, et al. Screening for osteoporosis to prevent fractures: US Preventive Services Task Force recommendation statement. JAMA 2018; 319(24):2521–2531. doi:10.1001/jama.2018.7498
- Simmons KB, Haddad LB, Nanda K, Curtis KM. Drug interactions between non-rifamycin antibiotics and hormonal contraception: a systematic review. Am J Obstet Gynecol 2018; 218(1):88–97.e14. doi:10.1016/j.ajog.2017.07.003
- Curtis KM, Tepper NK, Jatlaoui TC, et al. US Medical eligibility criteria for contraceptive use, 2016. MMWR Recomm Rep 2016; 65(3):1–103. doi:10.15585/mmwr.rr6503a1
- Taylor J, Pemberton MN. Antibiotics and oral contraceptives: new considerations for dental practice. Br Dent J 2012; 212(10):481–483. doi:10.1038/sj.bdj.2012.414
- Kuchenbaecker KB, Hopper JL, Barnes DR, et al. Risks of breast, ovarian, and contralateral breast cancer for BRCA1 and BRCA2 mutation carriers. JAMA 2017; 317(23):2402–2416. doi:10.1001/jama.2017.7112
- Faubion SS, Kuhle CL, Shuster LT, Rocca WA. Long-term health consequences of premature or early menopause and considerations for management. Climacteric 2015; 18(4):483–491. doi:10.3109/13697137.2015.1020484
- Kotsopoulos J, Gronwald J, Karlan BY, et al; Hereditary Breast Cancer Clinical Study Group. Hormone replacement therapy after oophorectomy and breast cancer risk among BRCA1 mutation carriers. JAMA Oncol 2018; 4(8):1059–1065. doi:10.1001/jamaoncol.2018.0211
- Marchetti C, De Felice F, Boccia S, et al. Hormone replacement therapy after prophylactic risk reducing salpingo-oophorectomy and breast cancer risk in BRCA1 and BRCA2 mutation carriers: a meta-analysis. Crit Rev Oncol Hematol 2018; 132:111–115. doi:10.1016/j.critrevonc.2018.09.018
- Kotsopoulos J, Huzarski T, Gronwald J, et al. Hormone replacement therapy after menopause and risk of breast cancer in BRCA1 mutation carriers: a case-control study. Breast Cancer Res Treat 2016; 155(2):365–373. doi:10.1007/s10549-016-3685-3
- Rebbeck TR, Friebel T, Wagner T, et al; PROSE Study Group. Effect of short-term hormone replacement therapy on breast cancer risk reduction after bilateral prophylactic oophorectomy in BRCA1 and BRCA2 mutation carriers: the PROSE Study Group. J Clin Oncol 2005; 23(31):7804–7810. doi:10.1200/JCO.2004.00.8151
- Johansen N, Liavaag AH, Iversen OE, Dørum A, Braaten T, Michelsen TM. Use of hormone replacement therapy after risk-reducing salpingo-oophorectomy. Acta Obstet Gynecol Scand 2017; 96(5):547–555. doi:10.1111/aogs.13120
- Mørch LS, Skovlund CW, Hannaford PC, Iversen L, Fielding S, Lidegaard Ø. Contemporary hormonal contraception and the risk of breast cancer. N Engl J Med 2017; 377(23):2228–2239. doi:10.1056/NEJMoa1700732
- Batur P, Sikka S, McNamara M. Contraception update: extended use of long acting methods, hormonal contraception risks, and over the counter access. J Womens Health (Larchmt) 2018. doi:10.1089/jwh.2018.7391. [Epub ahead of print]
- Michels KA, Pfeiffer RM, Brinton LA, Trabert B. Modification of the associations between duration of oral contraceptive use and ovarian, endometrial, breast, and colorectal cancers. JAMA Oncol 2018; 4(4):516–521. doi:10.1001/jamaoncol.2017.4942
- Iversen L, Fielding S, Lidegaard Ø, Mørch LS, Skovlund CW, Hannaford PC. Association between contemporary hormonal contraception and ovarian cancer in women of reproductive age in Denmark: prospective, nationwide cohort study. BMJ 2018; 362:k3609. doi:10.1136/bmj.k3609
- MacDorman MF, Declercq E, Cabral H, Morton C. Recent increases in the US maternal mortality rate: disentangling trends from measurement issues. Obstet Gynecol 2016; 128(3):447–455. doi:10.1097/AOG.0000000000001556
- Pattacini P, Nitrosi A, Giorgi Rossi P, et al; RETomo Working Group. Digital mammography versus digital mammography plus tomosynthesis for breast cancer screening: the Reggio Emilia tomosynthesis randomized trial. Radiology 2018; 288(2):375–385. doi:10.1148/radiol.2018172119
- Pace L, Keating NL. A systematic assessment of benefits and risks to guide breast cancer screening decisions. JAMA 2014; 311(13):1327–1335. doi:10.1001/jama.2014.1398
- Friedewald SM, Rafferty EA, Rose SL, et al. Breast cancer screening using tomosynthesis in combination with digital mammography. JAMA 2014; 311(24):2499–2507. doi:10.1001/jama.2014.6095
- Skaane P, Bandos AI, Gullien R, et al. Comparison of digital mammography alone and digital mammography plus tomosynthesis in a population-based screening program. Radiology 2013; 267(1):47–56. doi:10.1148/radiol.12121373
- Ciatto S, Houssami N, Bernardi D, et al. Integration of 3D digital mammography with tomosynthesis for population breast-cancer screening (STORM): a prospective comparison study. Lancet Oncol 2013; 14(7):583–589. doi:10.1016/S1470-2045(13)70134-7
- US Preventive Services Task Force. Final recommendation statement: breast cancer: screening. www.uspreventiveservicestaskforce.org/Page/Document/RecommendationStatementFinal/breast-cancer-screening1. Accessed May 13, 2019.
- American College of Obstetricians and Gynecologists. Breast cancer risk assessment and screening in average-risk women. www.acog.org/Clinical-Guidance-and-Publications/Practice-Bulletins/Committee-on-Practice-Bulletins-Gynecology/Breast-Cancer-Risk-Assessment-and-Screening-in-Average-Risk-Women?IsMobileSet=false#5. Accessed May 13, 2019.
- Cauley JA. Screening for osteoporosis. JAMA 2018; 319(24):2483–2485. doi:10.1001/jama.2018.5722
- US Preventive Services Task Force, Curry SJ, Krist AH, Owens DK, et al. Screening for osteoporosis to prevent fractures: US Preventive Services Task Force recommendation statement. JAMA 2018; 319(24):2521–2531. doi:10.1001/jama.2018.7498
- Simmons KB, Haddad LB, Nanda K, Curtis KM. Drug interactions between non-rifamycin antibiotics and hormonal contraception: a systematic review. Am J Obstet Gynecol 2018; 218(1):88–97.e14. doi:10.1016/j.ajog.2017.07.003
- Curtis KM, Tepper NK, Jatlaoui TC, et al. US Medical eligibility criteria for contraceptive use, 2016. MMWR Recomm Rep 2016; 65(3):1–103. doi:10.15585/mmwr.rr6503a1
- Taylor J, Pemberton MN. Antibiotics and oral contraceptives: new considerations for dental practice. Br Dent J 2012; 212(10):481–483. doi:10.1038/sj.bdj.2012.414
- Kuchenbaecker KB, Hopper JL, Barnes DR, et al. Risks of breast, ovarian, and contralateral breast cancer for BRCA1 and BRCA2 mutation carriers. JAMA 2017; 317(23):2402–2416. doi:10.1001/jama.2017.7112
- Faubion SS, Kuhle CL, Shuster LT, Rocca WA. Long-term health consequences of premature or early menopause and considerations for management. Climacteric 2015; 18(4):483–491. doi:10.3109/13697137.2015.1020484
- Kotsopoulos J, Gronwald J, Karlan BY, et al; Hereditary Breast Cancer Clinical Study Group. Hormone replacement therapy after oophorectomy and breast cancer risk among BRCA1 mutation carriers. JAMA Oncol 2018; 4(8):1059–1065. doi:10.1001/jamaoncol.2018.0211
- Marchetti C, De Felice F, Boccia S, et al. Hormone replacement therapy after prophylactic risk reducing salpingo-oophorectomy and breast cancer risk in BRCA1 and BRCA2 mutation carriers: a meta-analysis. Crit Rev Oncol Hematol 2018; 132:111–115. doi:10.1016/j.critrevonc.2018.09.018
- Kotsopoulos J, Huzarski T, Gronwald J, et al. Hormone replacement therapy after menopause and risk of breast cancer in BRCA1 mutation carriers: a case-control study. Breast Cancer Res Treat 2016; 155(2):365–373. doi:10.1007/s10549-016-3685-3
- Rebbeck TR, Friebel T, Wagner T, et al; PROSE Study Group. Effect of short-term hormone replacement therapy on breast cancer risk reduction after bilateral prophylactic oophorectomy in BRCA1 and BRCA2 mutation carriers: the PROSE Study Group. J Clin Oncol 2005; 23(31):7804–7810. doi:10.1200/JCO.2004.00.8151
- Johansen N, Liavaag AH, Iversen OE, Dørum A, Braaten T, Michelsen TM. Use of hormone replacement therapy after risk-reducing salpingo-oophorectomy. Acta Obstet Gynecol Scand 2017; 96(5):547–555. doi:10.1111/aogs.13120
- Mørch LS, Skovlund CW, Hannaford PC, Iversen L, Fielding S, Lidegaard Ø. Contemporary hormonal contraception and the risk of breast cancer. N Engl J Med 2017; 377(23):2228–2239. doi:10.1056/NEJMoa1700732
- Batur P, Sikka S, McNamara M. Contraception update: extended use of long acting methods, hormonal contraception risks, and over the counter access. J Womens Health (Larchmt) 2018. doi:10.1089/jwh.2018.7391. [Epub ahead of print]
- Michels KA, Pfeiffer RM, Brinton LA, Trabert B. Modification of the associations between duration of oral contraceptive use and ovarian, endometrial, breast, and colorectal cancers. JAMA Oncol 2018; 4(4):516–521. doi:10.1001/jamaoncol.2017.4942
- Iversen L, Fielding S, Lidegaard Ø, Mørch LS, Skovlund CW, Hannaford PC. Association between contemporary hormonal contraception and ovarian cancer in women of reproductive age in Denmark: prospective, nationwide cohort study. BMJ 2018; 362:k3609. doi:10.1136/bmj.k3609
- MacDorman MF, Declercq E, Cabral H, Morton C. Recent increases in the US maternal mortality rate: disentangling trends from measurement issues. Obstet Gynecol 2016; 128(3):447–455. doi:10.1097/AOG.0000000000001556
- Pattacini P, Nitrosi A, Giorgi Rossi P, et al; RETomo Working Group. Digital mammography versus digital mammography plus tomosynthesis for breast cancer screening: the Reggio Emilia tomosynthesis randomized trial. Radiology 2018; 288(2):375–385. doi:10.1148/radiol.2018172119
- Pace L, Keating NL. A systematic assessment of benefits and risks to guide breast cancer screening decisions. JAMA 2014; 311(13):1327–1335. doi:10.1001/jama.2014.1398
- Friedewald SM, Rafferty EA, Rose SL, et al. Breast cancer screening using tomosynthesis in combination with digital mammography. JAMA 2014; 311(24):2499–2507. doi:10.1001/jama.2014.6095
- Skaane P, Bandos AI, Gullien R, et al. Comparison of digital mammography alone and digital mammography plus tomosynthesis in a population-based screening program. Radiology 2013; 267(1):47–56. doi:10.1148/radiol.12121373
- Ciatto S, Houssami N, Bernardi D, et al. Integration of 3D digital mammography with tomosynthesis for population breast-cancer screening (STORM): a prospective comparison study. Lancet Oncol 2013; 14(7):583–589. doi:10.1016/S1470-2045(13)70134-7
- US Preventive Services Task Force. Final recommendation statement: breast cancer: screening. www.uspreventiveservicestaskforce.org/Page/Document/RecommendationStatementFinal/breast-cancer-screening1. Accessed May 13, 2019.
- American College of Obstetricians and Gynecologists. Breast cancer risk assessment and screening in average-risk women. www.acog.org/Clinical-Guidance-and-Publications/Practice-Bulletins/Committee-on-Practice-Bulletins-Gynecology/Breast-Cancer-Risk-Assessment-and-Screening-in-Average-Risk-Women?IsMobileSet=false#5. Accessed May 13, 2019.
KEY POINTS
- The US Preventive Services Task Force recommends screening bone density when the 10-year risk of major osteoporotic fracture is more than 8.4%.
- Women can be reassured that nonrifamycin antibiotics are unlikely to reduce efficacy of hormonal contraception.
- Hormone replacement therapy after prophylactic bilateral salpingo-oophorectomy does not increase breast cancer risk in women who carry the BRCA1 gene mutation.
- Hormonal contraception may increase the risk of breast cancer by 1 extra case per 7,690 women, although most studies suggest there is no increased risk.
- The use of digital breast tomosynthesis along with digital mammography can increase cancer detection in women with dense breast tissue, but it is not yet routinely recommended by most professional societies.

A sleeping beast: Obstructive sleep apnea and stroke
Obstructive sleep apnea (OSA) is an independent risk factor for ischemic stroke and may also, infrequently, be a consequence of stroke. It is significantly underdiagnosed in the general population and is highly prevalent in patients who have had a stroke. Many patients likely had their stroke because of this chronic untreated condition.
This review focuses on OSA and its prevalence, consequences, and treatment in patients after a stroke.
DEFINING AND QUANTIFYING OSA
OSA is the most common type of sleep-disordered breathing.1,2 It involves repeated narrowing or complete collapse of the upper airway despite ongoing respiratory effort.3,4 Apneic episodes are terminated by arousals from hypoxemia or efforts to breathe.5 In contrast, central sleep apnea is characterized by a patent airway but lack of airflow due to absent respiratory effort.5
In OSA, the number of episodes of apnea (absent airflow) and hypopnea (reduced airflow) are added together and divided by hours of sleep to calculate the apnea-hypopnea index (AHI). OSA is diagnosed by either of the following3,4:
- AHI of 5 or higher, with clinical symptoms related to OSA (described below)
- AHI of 15 or higher, regardless of symptoms.
The AHI also defines OSA severity, as follows3:
- Mild: AHI 5 to 15
- Moderate: AHI 15 to 30
- Severe: AHI greater than 30.
Diagnostic criteria (eg, definition of hypopnea, testing methods, and AHI thresholds) have varied over time, an important consideration when reviewing the literature.
OSA IS MORE COMMON THAN EXPECTED AFTER STROKE
In the most methodologically sound and generalizable study of this topic to date, the Wisconsin Sleep Cohort Study6 reported in 2013 that about 14% of men and 5% of women ages 30 to 70 have an AHI greater than 5 (using 4% desaturation to score hypopneic episodes) with daytime sleepiness. Other studies suggest that 80% to 90% of people with OSA are undiagnosed and untreated.1,7
The prevalence of OSA in patients who have had a stroke is much higher, ranging from 30% to 96% depending on the study methods and population.1,8–12 A 2010 meta-analysis11 of 29 studies reported that 72% of patients who had a stroke had an AHI greater than 5, and 29% had severe OSA. In this analysis, 7% of those with sleep-disordered breathing had central sleep apnea; still, these data indicate that the prevalence of OSA in these patients is about 5 times higher than in the general population.
RISK FACTORS MAY DIFFER IN STROKE POPULATION
Several risk factors for OSA have been identified.
Obesity is one of the strongest risk factors, with increasing body mass index (BMI) associated with increased OSA prevalence.4,6,13 However, obesity appears to be a less significant risk factor in patients who have had a stroke than in the general population. In the 2010 meta-analysis11 of OSA after stroke, the average BMI was only 26.4 kg/m2 (with obesity defined as a BMI > 30.0 kg/m2), and increasing BMI was not associated with increasing AHI.
Male sex and advanced age are also OSA risk factors.4,5 They remain significant in patients after a stroke; about 65% of poststroke patients who have OSA are men, and the older the patient, the more likely the AHI is greater than 10.11
Ethnicity and genetics may also play important roles in OSA risk, with roughly 25% of OSA prevalence estimated to have a genetic basis.14,15 Some risk factors for OSA such as craniofacial shape, upper airway anatomy, upper airway muscle dysfunction, increased respiratory chemosensitivity, and poor arousal threshold during sleep are likely determined by genetics and ethnicity.14,15 Compared with people of European origin, Asians have a similar prevalence of OSA, but at a much lower average BMI, suggesting that other factors are significant.14 Possible genetically determined anatomic risk factors have not been specifically studied in the poststroke population, but it can be assumed they remain relevant.
Several studies have tried to find an association between OSA and type, location, etiology, or pattern of stroke.10,11,16–19 Although some suggest links between cardioembolic stroke and OSA,16,20 or thrombolysis and OSA,10 most have found no association between OSA and stroke features.11,12,21,22
HOW DOES OSA INCREASE STROKE RISK?
Untreated severe OSA is associated with increased cardiovascular mortality,21,22 and OSA is an independent risk factor for incident stroke.23 A number of mechanisms may explain these relationships.
Intermittent hypoxemia and recurrent sympathetic arousals resulting from OSA are thought to lead to many of the comorbid conditions with which it is associated: hypertension, coronary artery disease, heart failure, arrhythmias, pulmonary hypertension, and stroke. Repetitive decreases in ventilation lead to oxygen desaturations that result in cycles of increased sympathetic outflow and eventual sustained nocturnal hypertension and daytime chronic hypertension.1,5,9,13 Also implicated are various changes in vasodilator and vasoconstrictor substances due to endothelial dysfunction and inflammation, which are thought to play a role in the atherogenic and prothrombotic states induced by OSA.1,5,13
Cerebral circulation is altered primarily by the changes in partial pressure of carbon dioxide (Pco2). During apnea, the Pco2 rises, causing vasodilation and increased blood flow. After the apnea resolves, there is hyperpnea with resultant decreased Pco2, and vasoconstriction. In a patient who already has vascular disease, the enhanced vasoconstriction could lead to ischemia.1,5
Changes in intrathoracic pressure result in distortion of cardiac architecture. When the patient tries to breathe against an occluded airway, the intrathoracic pressure becomes more and more negative, increasing preload and afterload. When this happens repeatedly every night for years, it leads to remodeling of the heart such as left and right ventricular hypertrophy, with reduced stroke volume, myocardial ischemia, and increased risk of arrhythmia.1,5,13
Untreated OSA is believed to predispose patients to develop atrial fibrillation through sympathetic overactivity, vascular inflammation, heart rate variability, and cardiac remodeling.24 As atrial fibrillation is a major risk factor for stroke, particularly cardioembolic stroke, it may be another pathway of increased stroke risk in OSA.16,20,25
CLINICAL MANIFESTATIONS OF OSA NOT OBVIOUS AFTER STROKE
OSA typically causes both daytime symptoms (excessive sleepiness, poor concentration, morning headache, depressive symptoms) and nighttime signs and symptoms (snoring, choking, gasping, night sweats, insomnia, nocturia, witnessed episodes of apnea).3,4,26 Unfortunately, because these are nonspecific, OSA is often underdiagnosed.4,26
Identifying OSA after a stroke may be a particular challenge, as patients often do not report classic symptoms, and the typical picture of OSA may have less predictive validity in these patients.1,27,28 Within the first 24 hours after a stroke, hypersomnia, snoring history, and age are not predictive of OSA.1 Patients found to have OSA after a stroke frequently do not have the traditional symptoms (sleepiness, snoring) seen in usual OSA patients. And they have higher rates of OSA at a younger age than the usual OSA patients, so age is not a predictive risk factor. In addition, daytime sleepiness and obesity are often absent or less prominent.1,9,27,28 Finally, typical OSA signs and symptoms may be attributed to the stroke itself or to comorbidities affecting the patient, lowering suspicion for OSA.
OSA MAY HINDER STROKE RECOVERY, WORSEN OUTCOMES
OSA, particularly when moderate to severe, is linked to pathophysiologic changes that can hinder recovery from a stroke.
Intermittent hypoxemia during sleep can worsen vascular damage of at-risk tissue: nocturnal hypoxemia correlates with white matter hyperintensities on magnetic resonance imaging, a marker of ischemic demyelination.29 Oxidative stress and release of inflammatory mediators associated with intermittent hypoxemia may impair vascular blood flow to brain tissue attempting to repair itself.30 In addition, sympathetic overactivity and Pco2 fluctuations associated with OSA may impede cerebral circulation.
Taken together, such ongoing nocturnal insults can lead to clinical consequences during this vulnerable period.
A 1996 study31 of patients recovering from a stroke found that an oxygen desaturation index (number of times that the blood oxygen level drops below a certain threshold, as measured by overnight oximetry) of more than 10 per hour was associated with worse functional recovery at discharge and at 3 and 12 months after discharge. This study also noted an association between time spent with oxygen saturations below 90% and the rate of death at 1 year.
A 2003 study32 reported that patients with an AHI greater than 10 by polysomnography spent an average of 13 days longer on the rehabilitation service and had worse functional and cognitive status on discharge, even after controlling for multiple confounders. Several subsequent studies have confirmed these and similar findings.8,33,34
OSA has also been linked to depression,35 which is common after stroke and may worsen outcomes.36 The interaction between OSA, depression, and poststroke outcomes warrants further study.
In the general population, OSA has been independently associated with increased risk of stroke or death from any cause.21,22,37 These associations have also been reported in the poststroke population: a 2014 meta-analysis found that OSA increased the risk of a repeat stroke (relative risk [RR] 1.8, 95% confidence interval [CI] 1.2–2.6) and all-cause mortality (RR 1.69, 95% CI 1.4–2.1).38
TESTING FOR OSA AFTER STROKE
Because of the high prevalence of OSA in patients who have had a stroke and the potential for worse outcomes associated with untreated OSA, there should be a low threshold for evaluating for OSA soon after stroke. Objective testing is required to qualify for therapy, and the gold standard for diagnosis of OSA is formal polysomnography conducted in a sleep laboratory.2–4 Unfortunately, polysomnography may be unacceptable to some patients, is costly, and is resource-intensive, particularly in an inpatient or rehabilitation setting.28 Ideally, to optimize testing efficiency, patients should be screened for the likelihood of OSA before polysomnography is ordered.
Questionnaires can help determine the need for further testing
Questionnaires developed to assess OSA risk39 include the following:
The Berlin questionnaire, developed in 1999, has 10 questions assessing daytime and nighttime signs and symptoms and presence of hypertension.
The STOP questionnaire, developed in 2008, assesses snoring, tiredness, observed apneic episodes, and elevated blood pressure.
The STOP-BANG questionnaire, published in 2010, includes the STOP questions plus BMI over 35 kg/m2, age over 50, neck circumference over 41 cm, and male gender.
A 2017 meta-analysis39 of 108 studies with nearly 50,000 people found that the STOP-BANG questionnaire performed best with regard to sensitivity and diagnostic odds ratio, but with poor specificity.
These screening tools and modified versions of them have also been evaluated in patients who have had a stroke.
In 2015, Boulos et al28 found that the STOP-BAG (a version of STOP-BANG that excludes neck circumference) and the 4-variable (4V) questionnaire (sex, BMI, blood pressure, snoring) had moderate predictive value for OSA within 6 months after sroke.
In 2016, Katzan et al40 found that the STOP-BAG2 (STOP-BAG criteria plus continuous variables for BMI and age) had a high sensitivity for polysomnographically diagnosed OSA within the first year after a stroke. The specificity was significantly better than the STOP-BANG or the STOP-BAG questionnaire, although it remained suboptimal at 60.5%.
In 2017, Sico et al41 developed and assessed the SLEEP Inventory (sex, left heart failure, Epworth Sleepiness Scale, enlarged neck, weight in pounds, insulin resistance or diabetes, and National Institutes of Health Stroke Scale) and found that it outperformed the Berlin and STOP-BANG questionnaires in the poststroke setting. The SLEEP Inventory had the best specificity and negative predictive value, and a slightly better ability to correctly classify patients as having OSA or not, classifying 80% of patients correctly.
These newer screening tools (eg, STOP-BAG, STOP-BAG2, SLEEP) can be used to identify with reasonable accuracy which patients need definitive testing after stroke.
Pulse oximetry is another possible screening tool
Overnight pulse oximetry may also help screen for sleep apnea and stratify risk after a stroke. A 2012 study42 of overnight oximetry to screen patients before surgery found that the oxygen desaturation index was significantly associated with the AHI measured by polysomnography. However, oximetry testing cannot distinguish between OSA and central sleep apnea, so it is insufficient to diagnose OSA or qualify patients for therapy. Further study is needed to examine the ability of overnight pulse oximetry to screen or to stratify risk for OSA after stroke.
Polysomnography vs home testing
Polysomnography is the gold standard for diagnosing OSA. Benefits include technical support and trouble-shooting, determining relationships between OSA, body position, and sleep stage, and the ability to intervene with treatment.2 However, polysomnography can be cumbersome, costly, and resource-intensive.
A home sleep apnea test, ie, an unattended, limited-channel sleep study, may be an acceptable alternative.2–4,43,44 Home testing does not require a sleep technologist to be present during testing, uses fewer sensors, and is less expensive than overnight polysomnography, but its utility can be limited: it fails to accurately discriminate between episodes of OSA and central sleep apnea, there is potential for false-negative results, and it can underestimate sleep apnea burden because it does not measure sleep.2
Institutional resources and logistics may influence the choice of diagnostic modality. No data exist on outcomes from different diagnostic testing methods in poststroke patients. Further research is needed.
POSITIVE AIRWAY PRESSURE THERAPY: BENEFITS, CHALLENGES, ALTERNATIVES
The first-line treatment for OSA is positive airway pressure (PAP).3 For most patients, this is continuous PAP (CPAP) or autoadjusting PAP (APAP). In some instances, particularly for those who cannot tolerate CPAP or who have comorbid hypoventilation, bilevel PAP (BPAP) may be indicated. More advanced PAP therapies are unlikely to be used after stroke.
PAP therapy is associated with reduced daytime sleepiness, improved mood, normalization of sleep architecture, improved systemic and pulmonary artery blood pressure, reduced rates of atrial fibrillation after ablation, and improved insulin sensitivity.45–49 Whether it reduces the risk of cardiovascular events, including stroke, remains controversial; most data suggest that it does not.50,51 However, when adherence to PAP therapy is considered rather than intention to treat, treatment has been found to lead to improved cardiovascular outcomes.52
Mixed evidence of benefits after stroke
Observational studies provide evidence that CPAP may help patients with OSA after stroke, although results are mixed.53–58 The studies ranged in size from 14 to 105 patients, enrolled patients with mostly moderate to severe OSA, and followed patients from 10 days to 7 years. Adherence to therapy was generally good in the short term (50%–70%), but only 15% to 30% of patients remained adherent at 5 to 7 years. Variable outcomes were reported, with some studies finding improved symptoms in the near term and mixed evidence of cardiovascular benefit in the longer ones. However, as these studies lacked randomization, drawing definitive conclusions on CPAP efficacy is difficult.
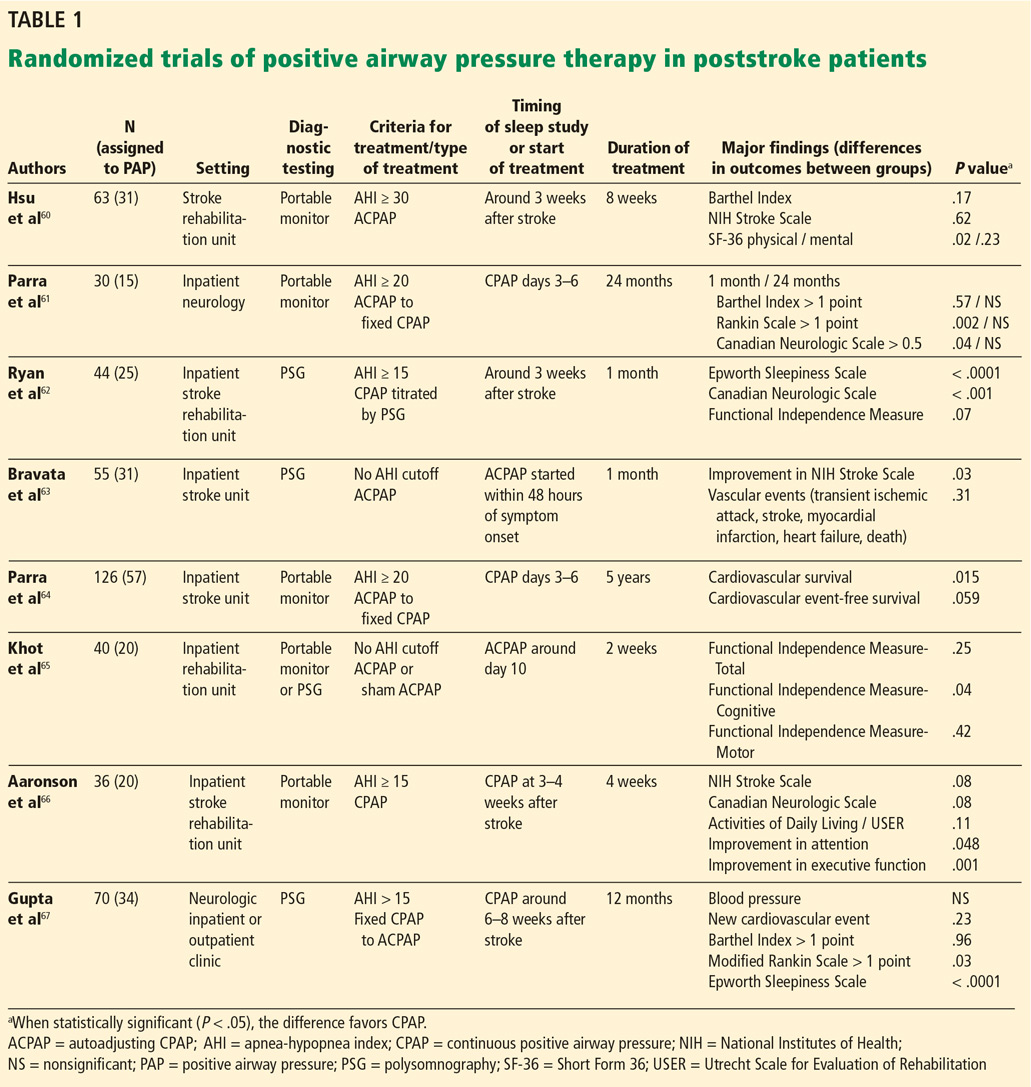
Patients were enrolled in the index admission or when starting a rehabilitation service—generally 2 to 3 weeks after their stroke. No clear association was found between the timing of initiating PAP therapy and outcomes. All patients had ischemic strokes, but few details were provided regarding stroke location, size, and severity. Exclusion criteria included severe underlying cardiopulmonary disease, confusion, severe stroke with marked impairment, and inability to cooperate. Almost all patients had moderate to severe OSA, and patients with central sleep apnea were excluded.
The major outcomes examined were drop-out rates, PAP adherence, and neurologic improvement based on neurologic functional scales (National Institutes of Health Stroke Scale and Canadian Neurologic Scale). As expected, dropout rates were higher in patients randomized to CPAP (OR 1.83, 95% CI 1.05–3.21, P = .03), although overall adherence was better than anticipated, with mean CPAP use across trials of 4.5 hours per night (95% CI 3.97–5.08) and with about 50% to 60% of patients adhering to therapy for at least 4 hours nightly.
Improvement in neurologic outcomes favored CPAP (standard mean difference 0.54, 95% CI 0.026–1.05), although considerable heterogeneity was seen. Improved sleepiness outcomes were inconsistent. Major cardiovascular outcomes were reported in only 2 studies (using the same data set) and showed delayed time to the next cardiovascular event for those treated with CPAP but no difference in cardiovascular event-free survival.
PAP poses more challenges after stroke
The primary limitation to PAP therapy is poor acceptance and adherence to therapy.59 High rates of refusal of therapy and difficulty complying with treatment have been noted in the poststroke population, although recent studies have reported better adherence rates. How rates of adherence play out in real-world settings, outside of the controlled environment of a research study, has yet to be determined.
In general, CPAP adherence is affected by claustrophobia, difficulty tolerating a mask, problems with pressure intolerance, irritating air leaks, nasal congestion, and naso-oral dryness. Many such barriers can be overcome with use of a properly fitted mask, an appropriate pressure setting, heated humidification, nasal sprays (eg, saline, inhaled steroids), and education, encouragement, and reassurance.
After a stroke, additional obstacles may impede the ability to use PAP therapy.68 Facial paresis (hemi- or bifacial) may make fitting of the mask problematic. Paralysis or weakness of the extremities may limit the ability to adjust or remove a mask. Aphasia can impair communication and understanding of the need to use PAP therapy, and upper-airway problems related to stroke, including dysphagia, may lead to pressure intolerance or risk of aspiration. Finally, a lack of perceived benefit, particularly if the patient does not have daytime sleepiness, may limit motivation.
Consider alternatives
For patients unlikely to succeed with PAP therapy, there are alternatives. Surgery and oral appliances are not usually realistic options in the setting of recent stroke, but positional therapy, including the use of body positioners to prevent supine sleep, as well as elevating the head of the bed, may be of some benefit.69,70 A nasopharyngeal airway stenting device (nasal trumpet) may also be tolerated by some patients.
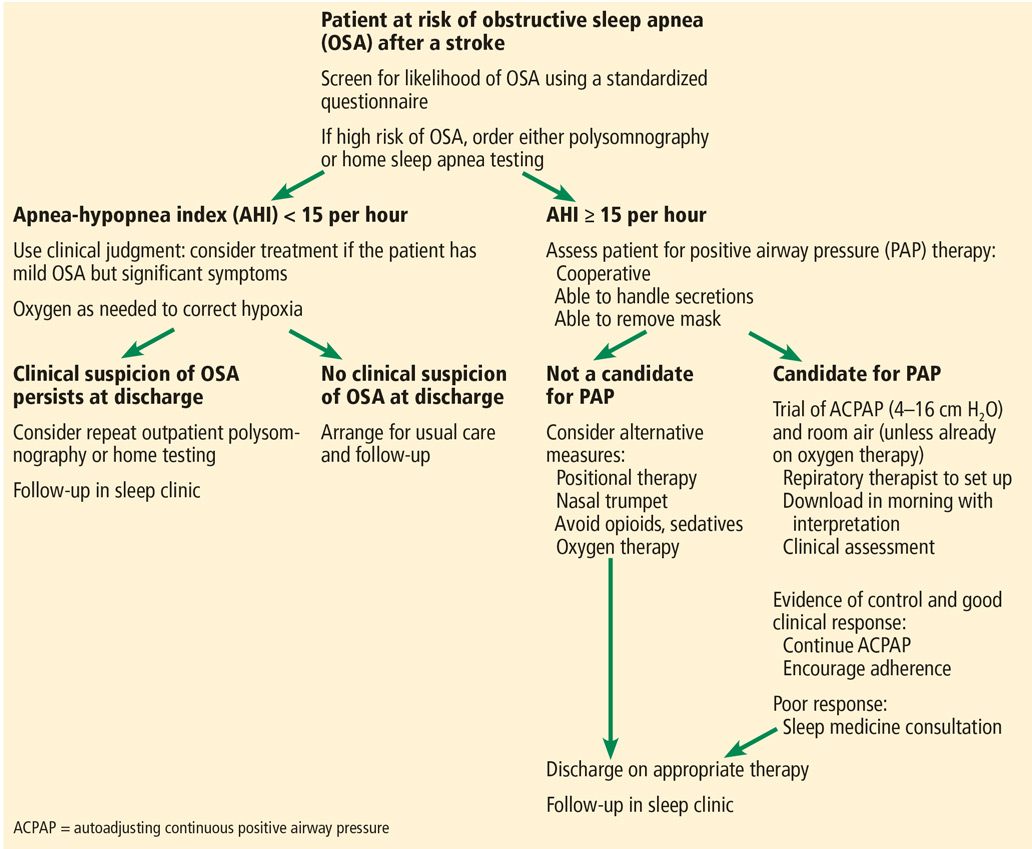
A proposed algorithm for screening, diagnosing, and treating OSA in patients after stroke is presented in Figure 1.
- Selim B, Roux FJ. Stroke and sleep disorders. Sleep Med Clin 2012; 7(4):597–607. doi:10.1016/j.jsmc.2012.08.007
- Kapur VK, Auckley DH, Chowdhuri S, et al. Clinical practice guideline for diagnostic testing for adult obstructive sleep apnea: an American Academy of Sleep Medicine Clinical Practice Guideline. J Clin Sleep Med 2017; 13(3):479–504. doi:10.5664/jcsm.6506
- Epstein LJ, Kristo D, Strollo PJ Jr, et al; Adult Obstructive Sleep Apnea Task Force of the American Academy of Sleep Medicine. Clinical guideline for the evaluation, management, and long-term care of obstructive sleep apnea in adults. J Clin Sleep Med 2009; 5(3):263–276. pmid:19960649
- Patil SP, Schneider H, Schwartz AR, Smith PL. Adult obstructive sleep apnea: pathophysiology and diagnosis. Chest 2007; 132(1):325–337. doi:10.1378/chest.07-0040
- Dempsey JA, Veasey SC, Morgan BJ, O’Donnell CP. Pathophysiology of sleep apnea. Physiol Rev 2010; 90(1):47–112. doi:10.1152/physrev.00043.2008
- Peppard PE, Young T, Barnet JH, Palta M, Hagen EW, Hla KM. Increased prevalence of sleep-disordered breathing in adults. Am J Epidemiol 2013; 177(9):1006–1014. doi:10.1093/aje/kws342
- Redline S, Sotres-Alvarez D, Loredo J, et al. Sleep-disordered breathing in Hispanic/Latino individuals of diverse backgrounds. The Hispanic Community Health Study/Study of Latinos. Am J Resp Crit Care Med 2014; 189(3):335–344. doi:10.1164/rccm.201309-1735OC
- Aaronson JA, van Bennekom CA, Hofman WF, et al. Obstructive sleep apnea is related to impaired cognitive and functional status after stroke. Sleep 2015; 38(9):1431–1437. doi:10.5665/sleep.4984
- Sharma S, Culebras A. Sleep apnoea and stroke. Stroke Vasc Neurol 2016; 1(4):185–191. doi:10.1136/svn-2016-000038
- Huhtakangas JK, Huhtakangas J, Bloigu R, Saaresranta T. Prevalence of sleep apnea at the acute phase of ischemic stroke with or without thrombolysis. Sleep Med 2017; 40:40–46. doi:10.1016/j.sleep.2017.08.018
- Johnson KG, Johnson DC. Frequency of sleep apnea in stroke and TIA patients: a meta-analysis. J Clin Sleep Med 2010; 6(2):131–137. pmid:20411688
- Iranzo A, Santamaria J, Berenguer J, Sanchez M, Chamorro A. Prevalence and clinical importance of sleep apnea in the first night after cerebral infarction. Neurology 2002; 58:911–916. pmid:11914407
- Javaheri S, Barbe F, Campos-Rodriguez F, et al. Sleep apnea: types, mechanisms, and clinical cardiovascular consequences. J Am Coll Cardiol 2017; 69(7):841–858. doi:10.1016/j.jacc.2016.11.069
- Dudley KA, Patel SR. Disparities and genetic risk factors in obstructive sleep apnea. Sleep Med 2016; 18:96–102. doi:10.1016/j.sleep.2015.01.015
- Redline S, Tishler PV. The genetics of sleep apnea. Sleep Med Rev 2000; 4(6):583–602. doi:10.1053/smrv.2000.0120
- Lipford MC, Flemming KD, Calvin AD, et al. Associations between cardioembolic stroke and obstructive sleep apnea. Sleep 2015; 38(11):1699–1705. doi:10.5665/sleep.5146
- Wang Y, Wang Y, Chen J, Yi X, Dong S, Cao L. Stroke patterns, topography, and etiology in patients with obstructive sleep apnea hypopnea syndrome. Int J Clin Exp Med 2017; 10(4):7137–7143.
- Fisse AL, Kemmling A, Teuber A, et al. The association of lesion location and sleep related breathing disorder in patients with acute ischemic stroke. PLoS One 2017; 12(1):e0171243. doi:10.1371/journal.pone.0171243
- Brown DL, Mowla A, McDermott M, et al. Ischemic stroke subtype and presence of sleep-disordered breathing: the BASIC sleep apnea study. J Stroke Cerebrovasc Dis 2015; 24(2):388–393. doi:10.1016/j.jstrokecerebrovasdis.2014.09.007
- Poli M, Philip P, Taillard J, et al. Atrial fibrillation as a major cause of stroke in apneic patients: a prospective study. Sleep Med 2017; 30:251–254. doi:10.1016/j.sleep.2015.07.031
- Young T, Finn L, Peppard PE, et al. Sleep disordered breathing and mortality: eighteen-year follow-up of the Wisconsin Sleep Cohort. Sleep 2008; 31(8):1071–1078. pmid:18714778
- Molnar MZ, Mucsi I, Novak M, et al. Association of incident obstructive sleep apnoea with outcomes in a large cohort of US veterans. Thorax 2015; 70(9):888–895. doi:10.1136/thoraxjnl-2015-206970
- Redline S, Yenokyan G, Gottlieb DJ, et al. Obstructive sleep apnea-hypopnea and incident stroke: the sleep heart health study. Am J Respir Crit Care Med 2010; 182(2):269–277. doi:10.1164/rccm.200911-1746OC
- Marulanda-Londono E, Chaturvedi S. The interplay between obstructive sleep apnea and atrial fibrillation. Fron Neurol 2017; 8:668. doi:10.3389/fneur.2017.00668
- Szymanski FM, Filipiak KJ, Platek AE, Hrynkiewicz-Szymanska A, Karpinski G, Opolski G. Assessment of CHADS2 and CHA 2DS 2-VASc scores in obstructive sleep apnea patients with atrial fibrillation. Sleep Breath 2015; 19(2):531–537. doi:10.1007/s11325-014-1042-5
- Stansbury RC, Strollo PJ. Clinical manifestations of sleep apnea. J Thoracic Dis 2015; 7(9):E298–E310. doi:10.3978/j.issn.2072-1439.2015.09.13
- Chan W, Coutts SB, Hanly P. Sleep apnea in patients with transient ischemic attack and minor stroke: opportunity for risk reduction of recurrent stroke? Stroke 2010; 41(12):2973–2975. doi:10.1161/STROKEAHA.110.596759
- Boulos MI, Wan A, Im J, et al. Identifying obstructive sleep apnea after stroke/TIA: evaluating four simple screening tools. Sleep Med 2016; 21:133–139. doi:10.1016/j.sleep.2015.12.013
- Patel SK, Hanly PJ, Smith EE, Chan W, Coutts SB. Nocturnal hypoxemia is associated with white matter hyperintensities in patients with a minor stroke or transient ischemic attack. J Clin Sleep Med 2015; 11(12):1417–1424. doi:10.5664/jcsm.5278
- McCarty MF, DiNicolantonio JJ, O’Keefe JH. NADPH oxidase, uncoupled endothelial nitric oxide synthase, and NF-KappaB are key mediators of the pathogenic impact of obstructive sleep apnea—therapeutic implications. J Integr Cardiol 2016; 2(5):367–374. doi:10.15761/JIC.1000177
- Good DC, Henkle JQ, Gelber D, Welsh J, Verhulst S. Sleep-disordered breathing and poor functional outcome after stroke. Stroke 1996; 27(2):252–259. pmid:8571419
- Kaneko Y, Hajek VE, Zivanovic V, Raboud J, Bradley TD. Relationship of sleep apnea to functional capacity and length of hospitalization following stroke. Sleep 2003; 26(3):293–297. pmid:12749548
- Yan-fang S, Yu-ping W. Sleep-disordered breathing: impact on functional outcome of ischemic stroke patients. Sleep Med 2009; 10(7):717–719. doi:10.1016/j.sleep.2008.08.006
- Kumar R, Suri JC, Manocha R. Study of association of severity of sleep disordered breathing and functional outcome in stroke patients. Sleep Med 2017; 34:50–56. doi:10.1016/j.sleep.2017.02.025
- Kerner NA, Roose SP. Obstructive sleep apnea is linked to depression and cognitive impairment: evidence and potential mechanisms. Am J Geriatr Psychiatry 2016; 24(6):496–508. doi:10.1016/j.jagp.2016.01.134
- Bartoli F, Lillia N, Lax A, et al. Depression after stroke and risk of mortality: a systematic review and meta-analysis. Stroke Res Treat 2013; 2013:862978. doi:10.1155/2013/862978
- Yaggi HK, Concato J, Kernan WN, Lichtman JH, Brass LM, Mohsenin V. Obstructive sleep apnea as a risk factor for stroke and death. N Engl J Med 2005; 353(19):2034–2041. doi:10.1056/NEJMoa043104
- Xie W, Zheng F, Song X. Obstructive sleep apnea and serious adverse outcomes in patients with cardiovascular or cerebrovascular disease: a PRISMA-compliant systematic review and meta-analysis. Medicine (Baltimore) 2014; 93(29):e336. doi:10.1097/MD.0000000000000336
- Chiu HY, Chen PY, Chuang LP, et al. Diagnostic accuracy of the Berlin questionnaire, STOP-BANG, STOP, and Epworth sleepiness scale in detecting obstructive sleep apnea: a bivariate meta-analysis. Sleep Med Rev 2017; 36:57–70. doi:10.1016/j.smrv.2016.10.004
- Katzan IL, Thompson NR, Uchino K, Foldvary-Schaefer N. A screening tool for obstructive sleep apnea in cerebrovascular patients. Sleep Med 2016; 21:70–76. doi:10.1016/j.sleep.2016.02.001
- Sico JJ, Yaggi HK, Ofner S, et al. Development, validation, and assessment of an ischemic stroke or transient ischemic attack-specific prediction tool for obstructive sleep apnea. J Stroke Cerebrovasc Dis 2017; 26(8):1745–1754. doi:10.1016/j.jstrokecerebrovasdis.2017.03.042
- Chung F, Liao P, Elsaid H, Islam S, Shapiro CM, Sun Y. Oxygen desaturation index from nocturnal oximetry: a sensitive and specific tool to detect sleep-disordered breathing in surgical patients. Anesth Analg 2012; 114(5):993–1000. doi:10.1213/ANE.0b013e318248f4f5
- Boulos MI, Elias S, Wan A, et al. Unattended hospital and home sleep apnea testing following cerebrovascular events. J Stroke Cerebrovasc Dis 2017; 26(1):143–149. doi:10.1016/j.jstrokecerebrovasdis.2016.09.001
- Saletu MT, Kotzian ST, Schwarzinger A, Haider S, Spatt J, Saletu B. Home sleep apnea testing is a feasible and accurate method to diagnose obstructive sleep apnea in stroke patients during in-hospital rehabilitation. J Clin Sleep Med 2018; 14(9):1495–1501. doi:10.5664/jcsm.7322
- Giles TL, Lasserson TJ, Smith BH, White J, Wright J, Cates CJ. Continuous positive airways pressure for obstructive sleep apnoea in adults. Cochrane Database Syst Rev 2006; (3):CD001106. doi:10.1002/14651858.CD001106.pub3
- Fatureto-Borges F, Lorenzi-Filho G, Drager LF. Effectiveness of continuous positive airway pressure in lowering blood pressure in patients with obstructive sleep apnea: a critical review of the literature. Integr Blood Press Control 2016; 9:43–47. doi:10.2147/IBPC.S70402
- Imran TF, Gharzipura M, Liu S, et al. Effect of continuous positive airway pressure treatment on pulmonary artery pressure in patients with isolated obstructive sleep apnea: a meta-analysis. Heart Fail Rev 2016; 21(5):591–598. doi:10.1007/s10741-016-9548-5
- Deng F, Raza A, Guo J. Treating obstructive sleep apnea with continuous positive airway pressure reduces risk of recurrent atrial fibrillation after catheter ablation: a meta-analysis. Sleep Med 2018; 46:5–11. doi:10.1016/j.sleep.2018.02.013
- Seetho IW, Wilding JPH. Sleep-disordered breathing, type 2 diabetes, and the metabolic syndrome. Chronic Resp Dis 2014; 11(4):257–275. doi:10.1177/1479972314552806
- Kim Y, Koo YS, Lee HY, Lee SY. Can continuous positive airway pressure reduce the risk of stroke in obstructive sleep apnea patients? A systematic review and meta-analysis. PloS ONE 2016; 11(1):e0146317. doi:10.1371/journal.pone.0146317
- Yu J, Zhou Z, McEvoy RD, et al. Association of positive airway pressure with cardiovascular events and death in adults with sleep apnea: a systematic review and meta-analysis. JAMA 2017; 318(2):156–166. doi:10.1001/jama.2017.7967
- Peker Y, Glantz H, Eulenburg C, Wegscheider K, Herlitz J, Thunström E. Effect of positive airway pressure on cardiovascular outcomes in coronary artery disease patients with nonsleepy obstructive sleep apnea. The RICCADSA randomized controlled trial. Am J Respir Crit Care Med 2016; 194(5):613–620. doi:10.1164/rccm.201601-0088OC
- Martinez-Garcia MA, Soler-Cataluna JJ, Ejarque-Martinez L, et al. Continuous positive airway pressure treatment reduces mortality in patients with ischemic stroke and obstructive sleep apnea: a 5-year follow-up study. Am J Respir Crit Care Med 2009; 180(1):36–41. doi:10.1164/rccm.200808-1341OC
- Broadley SA, Jorgensen L, Cheek A, et al. Early investigation and treatment of obstructive sleep apnoea after acute stroke. J Clin Neurosci 2007; 14(4):328–333. doi:10.1016/j.jocn.2006.01.017
- Wessendorf TE, Wang YM, Thilmann AF, Sorgenfrei U, Konietzko N, Teschler H. Treatment of obstructive sleep apnoea with nasal continuous positive airway pressure in stroke. Eur Respir J 2001; 18(4):623–629. pmid:11716165
- Bassetti CL, Milanova M, Gugger M. Sleep-disordered breathing and acute ischemic stroke: diagnosis, risk factors, treatment, evolution, and long-term clinical outcome. Stroke 2006; 37(4):967–972. doi:10.1161/01.STR.0000208215.49243.c3
- Palombini L, Guilleminault C. Stroke and treatment with nasal CPAP. Eur J Neurol 2006; 13(2):198–200. doi:10.1111/j.1468-1331.2006.01169.x
- Martínez-García MA, Campos-Rodríguez F, Soler-Cataluña JJ, Catalán-Serra P, Román-Sánchez P, Montserrat JM. Increased incidence of nonfatal cardiovascular events in stroke patients with sleep apnoea: effect of CPAP treatment. Eur Respir J 2012; 39(4):906–912. doi:10.1183/09031936.00011311
- Brill AK, Horvath T, Seiler A, et al. CPAP as treatment of sleep apnea after stroke: a meta-analysis of randomized trials. Neurology 2018; 90(14):e1222–e1230. doi:10.1212/WNL.0000000000005262
- Hsu C, Vennelle M, Li H, Engleman HM, Dennis MS, Douglas NJ. Sleep-disordered breathing after stroke: a randomised controlled trial of continuous positive airway pressure. J Neurol Neurosurg Psychiatry 2006; 77(10):1143–1149. doi:10.1136/jnnp.2005.086686
- Parra O, Sanchez-Armengol A, Bonnin M, et al. Early treatment of obstructive apnoea and stroke outcome: a randomised controlled trial. Eur Resp J 2011; 37(5):1128–1136. doi:10.1183/09031936.00034410
- Ryan CM, Bayley M, Green R, Murray BJ, Bradley TD. Influence of continuous positive airway pressure on outcomes of rehabilitation in stroke patients with obstructive sleep apnea. Stroke 2011; 42(4):1062–1067. doi:10.1161/STROKEAHA.110.597468
- Bravata DM, Concato J, Fried T, et al. Continuous positive airway pressure: evaluation of a novel therapy for patients with acute ischemic stroke. Sleep 2011; 34(9):1271–1277. doi:10.5665/SLEEP.1254
- Parra O, Sanchez-Armengol A, Capote F, et al. Efficacy of continuous positive airway pressure treatment on 5-year survival in patients with ischaemic stroke and obstructive sleep apnea: a randomized controlled trial. J Sleep Res 2015; 24(1):47–53. doi:10.1111/jsr.12181
- Khot SP, Davis AP, Crane DA, et al. Effect of continuous positive airway pressure on stroke rehabilitation: a pilot randomized sham-controlled trial. J Clin Sleep Med 2016; 12(7):1019–1026. doi:10.5664/jcsm.5940
- Aaronson JA, Hofman WF, van Bennekom CA, et al. Effects of continuous positive airway pressure on cognitive and functional outcome of stroke patients with obstructive sleep apnea: a randomized controlled trial. J Clin Sleep Med 2016; 12(4):533–541. doi:10.5664/jcsm.5684
- Gupta A, Shukla G, Afsar M, et al. Role of positive airway pressure therapy for obstructive sleep apnea in patients with stroke: a randomized controlled trial. J Clin Sleep Med 2018; 14(4):511–521. doi:10.5664/jcsm.7034
- Mello-Fujita L, Kim LJ, Palombini Lde O, et al. Treatment of obstructive sleep apnea syndrome associated with stroke. Sleep Med 2015; 16(6):691–696. doi:10.1016/j.sleep.2014.12.017
- Svatikova A, Chervin RD, Wing JJ, Sanchez BN, Migda EM, Brown DL. Positional therapy in ischemic stroke patients with obstructive sleep apnea. Sleep Med 2011; 12(3):262–266. doi:10.1016/j.sleep.2010.12.008
- Souza FJ, Genta PR, de Souza Filho AJ, Wellman A, Lorenzi-Filho G. The influence of head-of-bed elevation in patients with obstructive sleep apnea. Sleep Breath 2017; 21(4):815–820. doi:10.1007/s11325-017-1524-3
Obstructive sleep apnea (OSA) is an independent risk factor for ischemic stroke and may also, infrequently, be a consequence of stroke. It is significantly underdiagnosed in the general population and is highly prevalent in patients who have had a stroke. Many patients likely had their stroke because of this chronic untreated condition.
This review focuses on OSA and its prevalence, consequences, and treatment in patients after a stroke.
DEFINING AND QUANTIFYING OSA
OSA is the most common type of sleep-disordered breathing.1,2 It involves repeated narrowing or complete collapse of the upper airway despite ongoing respiratory effort.3,4 Apneic episodes are terminated by arousals from hypoxemia or efforts to breathe.5 In contrast, central sleep apnea is characterized by a patent airway but lack of airflow due to absent respiratory effort.5
In OSA, the number of episodes of apnea (absent airflow) and hypopnea (reduced airflow) are added together and divided by hours of sleep to calculate the apnea-hypopnea index (AHI). OSA is diagnosed by either of the following3,4:
- AHI of 5 or higher, with clinical symptoms related to OSA (described below)
- AHI of 15 or higher, regardless of symptoms.
The AHI also defines OSA severity, as follows3:
- Mild: AHI 5 to 15
- Moderate: AHI 15 to 30
- Severe: AHI greater than 30.
Diagnostic criteria (eg, definition of hypopnea, testing methods, and AHI thresholds) have varied over time, an important consideration when reviewing the literature.
OSA IS MORE COMMON THAN EXPECTED AFTER STROKE
In the most methodologically sound and generalizable study of this topic to date, the Wisconsin Sleep Cohort Study6 reported in 2013 that about 14% of men and 5% of women ages 30 to 70 have an AHI greater than 5 (using 4% desaturation to score hypopneic episodes) with daytime sleepiness. Other studies suggest that 80% to 90% of people with OSA are undiagnosed and untreated.1,7
The prevalence of OSA in patients who have had a stroke is much higher, ranging from 30% to 96% depending on the study methods and population.1,8–12 A 2010 meta-analysis11 of 29 studies reported that 72% of patients who had a stroke had an AHI greater than 5, and 29% had severe OSA. In this analysis, 7% of those with sleep-disordered breathing had central sleep apnea; still, these data indicate that the prevalence of OSA in these patients is about 5 times higher than in the general population.
RISK FACTORS MAY DIFFER IN STROKE POPULATION
Several risk factors for OSA have been identified.
Obesity is one of the strongest risk factors, with increasing body mass index (BMI) associated with increased OSA prevalence.4,6,13 However, obesity appears to be a less significant risk factor in patients who have had a stroke than in the general population. In the 2010 meta-analysis11 of OSA after stroke, the average BMI was only 26.4 kg/m2 (with obesity defined as a BMI > 30.0 kg/m2), and increasing BMI was not associated with increasing AHI.
Male sex and advanced age are also OSA risk factors.4,5 They remain significant in patients after a stroke; about 65% of poststroke patients who have OSA are men, and the older the patient, the more likely the AHI is greater than 10.11
Ethnicity and genetics may also play important roles in OSA risk, with roughly 25% of OSA prevalence estimated to have a genetic basis.14,15 Some risk factors for OSA such as craniofacial shape, upper airway anatomy, upper airway muscle dysfunction, increased respiratory chemosensitivity, and poor arousal threshold during sleep are likely determined by genetics and ethnicity.14,15 Compared with people of European origin, Asians have a similar prevalence of OSA, but at a much lower average BMI, suggesting that other factors are significant.14 Possible genetically determined anatomic risk factors have not been specifically studied in the poststroke population, but it can be assumed they remain relevant.
Several studies have tried to find an association between OSA and type, location, etiology, or pattern of stroke.10,11,16–19 Although some suggest links between cardioembolic stroke and OSA,16,20 or thrombolysis and OSA,10 most have found no association between OSA and stroke features.11,12,21,22
HOW DOES OSA INCREASE STROKE RISK?
Untreated severe OSA is associated with increased cardiovascular mortality,21,22 and OSA is an independent risk factor for incident stroke.23 A number of mechanisms may explain these relationships.
Intermittent hypoxemia and recurrent sympathetic arousals resulting from OSA are thought to lead to many of the comorbid conditions with which it is associated: hypertension, coronary artery disease, heart failure, arrhythmias, pulmonary hypertension, and stroke. Repetitive decreases in ventilation lead to oxygen desaturations that result in cycles of increased sympathetic outflow and eventual sustained nocturnal hypertension and daytime chronic hypertension.1,5,9,13 Also implicated are various changes in vasodilator and vasoconstrictor substances due to endothelial dysfunction and inflammation, which are thought to play a role in the atherogenic and prothrombotic states induced by OSA.1,5,13
Cerebral circulation is altered primarily by the changes in partial pressure of carbon dioxide (Pco2). During apnea, the Pco2 rises, causing vasodilation and increased blood flow. After the apnea resolves, there is hyperpnea with resultant decreased Pco2, and vasoconstriction. In a patient who already has vascular disease, the enhanced vasoconstriction could lead to ischemia.1,5
Changes in intrathoracic pressure result in distortion of cardiac architecture. When the patient tries to breathe against an occluded airway, the intrathoracic pressure becomes more and more negative, increasing preload and afterload. When this happens repeatedly every night for years, it leads to remodeling of the heart such as left and right ventricular hypertrophy, with reduced stroke volume, myocardial ischemia, and increased risk of arrhythmia.1,5,13
Untreated OSA is believed to predispose patients to develop atrial fibrillation through sympathetic overactivity, vascular inflammation, heart rate variability, and cardiac remodeling.24 As atrial fibrillation is a major risk factor for stroke, particularly cardioembolic stroke, it may be another pathway of increased stroke risk in OSA.16,20,25
CLINICAL MANIFESTATIONS OF OSA NOT OBVIOUS AFTER STROKE
OSA typically causes both daytime symptoms (excessive sleepiness, poor concentration, morning headache, depressive symptoms) and nighttime signs and symptoms (snoring, choking, gasping, night sweats, insomnia, nocturia, witnessed episodes of apnea).3,4,26 Unfortunately, because these are nonspecific, OSA is often underdiagnosed.4,26
Identifying OSA after a stroke may be a particular challenge, as patients often do not report classic symptoms, and the typical picture of OSA may have less predictive validity in these patients.1,27,28 Within the first 24 hours after a stroke, hypersomnia, snoring history, and age are not predictive of OSA.1 Patients found to have OSA after a stroke frequently do not have the traditional symptoms (sleepiness, snoring) seen in usual OSA patients. And they have higher rates of OSA at a younger age than the usual OSA patients, so age is not a predictive risk factor. In addition, daytime sleepiness and obesity are often absent or less prominent.1,9,27,28 Finally, typical OSA signs and symptoms may be attributed to the stroke itself or to comorbidities affecting the patient, lowering suspicion for OSA.
OSA MAY HINDER STROKE RECOVERY, WORSEN OUTCOMES
OSA, particularly when moderate to severe, is linked to pathophysiologic changes that can hinder recovery from a stroke.
Intermittent hypoxemia during sleep can worsen vascular damage of at-risk tissue: nocturnal hypoxemia correlates with white matter hyperintensities on magnetic resonance imaging, a marker of ischemic demyelination.29 Oxidative stress and release of inflammatory mediators associated with intermittent hypoxemia may impair vascular blood flow to brain tissue attempting to repair itself.30 In addition, sympathetic overactivity and Pco2 fluctuations associated with OSA may impede cerebral circulation.
Taken together, such ongoing nocturnal insults can lead to clinical consequences during this vulnerable period.
A 1996 study31 of patients recovering from a stroke found that an oxygen desaturation index (number of times that the blood oxygen level drops below a certain threshold, as measured by overnight oximetry) of more than 10 per hour was associated with worse functional recovery at discharge and at 3 and 12 months after discharge. This study also noted an association between time spent with oxygen saturations below 90% and the rate of death at 1 year.
A 2003 study32 reported that patients with an AHI greater than 10 by polysomnography spent an average of 13 days longer on the rehabilitation service and had worse functional and cognitive status on discharge, even after controlling for multiple confounders. Several subsequent studies have confirmed these and similar findings.8,33,34
OSA has also been linked to depression,35 which is common after stroke and may worsen outcomes.36 The interaction between OSA, depression, and poststroke outcomes warrants further study.
In the general population, OSA has been independently associated with increased risk of stroke or death from any cause.21,22,37 These associations have also been reported in the poststroke population: a 2014 meta-analysis found that OSA increased the risk of a repeat stroke (relative risk [RR] 1.8, 95% confidence interval [CI] 1.2–2.6) and all-cause mortality (RR 1.69, 95% CI 1.4–2.1).38
TESTING FOR OSA AFTER STROKE
Because of the high prevalence of OSA in patients who have had a stroke and the potential for worse outcomes associated with untreated OSA, there should be a low threshold for evaluating for OSA soon after stroke. Objective testing is required to qualify for therapy, and the gold standard for diagnosis of OSA is formal polysomnography conducted in a sleep laboratory.2–4 Unfortunately, polysomnography may be unacceptable to some patients, is costly, and is resource-intensive, particularly in an inpatient or rehabilitation setting.28 Ideally, to optimize testing efficiency, patients should be screened for the likelihood of OSA before polysomnography is ordered.
Questionnaires can help determine the need for further testing
Questionnaires developed to assess OSA risk39 include the following:
The Berlin questionnaire, developed in 1999, has 10 questions assessing daytime and nighttime signs and symptoms and presence of hypertension.
The STOP questionnaire, developed in 2008, assesses snoring, tiredness, observed apneic episodes, and elevated blood pressure.
The STOP-BANG questionnaire, published in 2010, includes the STOP questions plus BMI over 35 kg/m2, age over 50, neck circumference over 41 cm, and male gender.
A 2017 meta-analysis39 of 108 studies with nearly 50,000 people found that the STOP-BANG questionnaire performed best with regard to sensitivity and diagnostic odds ratio, but with poor specificity.
These screening tools and modified versions of them have also been evaluated in patients who have had a stroke.
In 2015, Boulos et al28 found that the STOP-BAG (a version of STOP-BANG that excludes neck circumference) and the 4-variable (4V) questionnaire (sex, BMI, blood pressure, snoring) had moderate predictive value for OSA within 6 months after sroke.
In 2016, Katzan et al40 found that the STOP-BAG2 (STOP-BAG criteria plus continuous variables for BMI and age) had a high sensitivity for polysomnographically diagnosed OSA within the first year after a stroke. The specificity was significantly better than the STOP-BANG or the STOP-BAG questionnaire, although it remained suboptimal at 60.5%.
In 2017, Sico et al41 developed and assessed the SLEEP Inventory (sex, left heart failure, Epworth Sleepiness Scale, enlarged neck, weight in pounds, insulin resistance or diabetes, and National Institutes of Health Stroke Scale) and found that it outperformed the Berlin and STOP-BANG questionnaires in the poststroke setting. The SLEEP Inventory had the best specificity and negative predictive value, and a slightly better ability to correctly classify patients as having OSA or not, classifying 80% of patients correctly.
These newer screening tools (eg, STOP-BAG, STOP-BAG2, SLEEP) can be used to identify with reasonable accuracy which patients need definitive testing after stroke.
Pulse oximetry is another possible screening tool
Overnight pulse oximetry may also help screen for sleep apnea and stratify risk after a stroke. A 2012 study42 of overnight oximetry to screen patients before surgery found that the oxygen desaturation index was significantly associated with the AHI measured by polysomnography. However, oximetry testing cannot distinguish between OSA and central sleep apnea, so it is insufficient to diagnose OSA or qualify patients for therapy. Further study is needed to examine the ability of overnight pulse oximetry to screen or to stratify risk for OSA after stroke.
Polysomnography vs home testing
Polysomnography is the gold standard for diagnosing OSA. Benefits include technical support and trouble-shooting, determining relationships between OSA, body position, and sleep stage, and the ability to intervene with treatment.2 However, polysomnography can be cumbersome, costly, and resource-intensive.
A home sleep apnea test, ie, an unattended, limited-channel sleep study, may be an acceptable alternative.2–4,43,44 Home testing does not require a sleep technologist to be present during testing, uses fewer sensors, and is less expensive than overnight polysomnography, but its utility can be limited: it fails to accurately discriminate between episodes of OSA and central sleep apnea, there is potential for false-negative results, and it can underestimate sleep apnea burden because it does not measure sleep.2
Institutional resources and logistics may influence the choice of diagnostic modality. No data exist on outcomes from different diagnostic testing methods in poststroke patients. Further research is needed.
POSITIVE AIRWAY PRESSURE THERAPY: BENEFITS, CHALLENGES, ALTERNATIVES
The first-line treatment for OSA is positive airway pressure (PAP).3 For most patients, this is continuous PAP (CPAP) or autoadjusting PAP (APAP). In some instances, particularly for those who cannot tolerate CPAP or who have comorbid hypoventilation, bilevel PAP (BPAP) may be indicated. More advanced PAP therapies are unlikely to be used after stroke.
PAP therapy is associated with reduced daytime sleepiness, improved mood, normalization of sleep architecture, improved systemic and pulmonary artery blood pressure, reduced rates of atrial fibrillation after ablation, and improved insulin sensitivity.45–49 Whether it reduces the risk of cardiovascular events, including stroke, remains controversial; most data suggest that it does not.50,51 However, when adherence to PAP therapy is considered rather than intention to treat, treatment has been found to lead to improved cardiovascular outcomes.52
Mixed evidence of benefits after stroke
Observational studies provide evidence that CPAP may help patients with OSA after stroke, although results are mixed.53–58 The studies ranged in size from 14 to 105 patients, enrolled patients with mostly moderate to severe OSA, and followed patients from 10 days to 7 years. Adherence to therapy was generally good in the short term (50%–70%), but only 15% to 30% of patients remained adherent at 5 to 7 years. Variable outcomes were reported, with some studies finding improved symptoms in the near term and mixed evidence of cardiovascular benefit in the longer ones. However, as these studies lacked randomization, drawing definitive conclusions on CPAP efficacy is difficult.
Patients were enrolled in the index admission or when starting a rehabilitation service—generally 2 to 3 weeks after their stroke. No clear association was found between the timing of initiating PAP therapy and outcomes. All patients had ischemic strokes, but few details were provided regarding stroke location, size, and severity. Exclusion criteria included severe underlying cardiopulmonary disease, confusion, severe stroke with marked impairment, and inability to cooperate. Almost all patients had moderate to severe OSA, and patients with central sleep apnea were excluded.
The major outcomes examined were drop-out rates, PAP adherence, and neurologic improvement based on neurologic functional scales (National Institutes of Health Stroke Scale and Canadian Neurologic Scale). As expected, dropout rates were higher in patients randomized to CPAP (OR 1.83, 95% CI 1.05–3.21, P = .03), although overall adherence was better than anticipated, with mean CPAP use across trials of 4.5 hours per night (95% CI 3.97–5.08) and with about 50% to 60% of patients adhering to therapy for at least 4 hours nightly.
Improvement in neurologic outcomes favored CPAP (standard mean difference 0.54, 95% CI 0.026–1.05), although considerable heterogeneity was seen. Improved sleepiness outcomes were inconsistent. Major cardiovascular outcomes were reported in only 2 studies (using the same data set) and showed delayed time to the next cardiovascular event for those treated with CPAP but no difference in cardiovascular event-free survival.
PAP poses more challenges after stroke
The primary limitation to PAP therapy is poor acceptance and adherence to therapy.59 High rates of refusal of therapy and difficulty complying with treatment have been noted in the poststroke population, although recent studies have reported better adherence rates. How rates of adherence play out in real-world settings, outside of the controlled environment of a research study, has yet to be determined.
In general, CPAP adherence is affected by claustrophobia, difficulty tolerating a mask, problems with pressure intolerance, irritating air leaks, nasal congestion, and naso-oral dryness. Many such barriers can be overcome with use of a properly fitted mask, an appropriate pressure setting, heated humidification, nasal sprays (eg, saline, inhaled steroids), and education, encouragement, and reassurance.
After a stroke, additional obstacles may impede the ability to use PAP therapy.68 Facial paresis (hemi- or bifacial) may make fitting of the mask problematic. Paralysis or weakness of the extremities may limit the ability to adjust or remove a mask. Aphasia can impair communication and understanding of the need to use PAP therapy, and upper-airway problems related to stroke, including dysphagia, may lead to pressure intolerance or risk of aspiration. Finally, a lack of perceived benefit, particularly if the patient does not have daytime sleepiness, may limit motivation.
Consider alternatives
For patients unlikely to succeed with PAP therapy, there are alternatives. Surgery and oral appliances are not usually realistic options in the setting of recent stroke, but positional therapy, including the use of body positioners to prevent supine sleep, as well as elevating the head of the bed, may be of some benefit.69,70 A nasopharyngeal airway stenting device (nasal trumpet) may also be tolerated by some patients.
A proposed algorithm for screening, diagnosing, and treating OSA in patients after stroke is presented in Figure 1.
Obstructive sleep apnea (OSA) is an independent risk factor for ischemic stroke and may also, infrequently, be a consequence of stroke. It is significantly underdiagnosed in the general population and is highly prevalent in patients who have had a stroke. Many patients likely had their stroke because of this chronic untreated condition.
This review focuses on OSA and its prevalence, consequences, and treatment in patients after a stroke.
DEFINING AND QUANTIFYING OSA
OSA is the most common type of sleep-disordered breathing.1,2 It involves repeated narrowing or complete collapse of the upper airway despite ongoing respiratory effort.3,4 Apneic episodes are terminated by arousals from hypoxemia or efforts to breathe.5 In contrast, central sleep apnea is characterized by a patent airway but lack of airflow due to absent respiratory effort.5
In OSA, the number of episodes of apnea (absent airflow) and hypopnea (reduced airflow) are added together and divided by hours of sleep to calculate the apnea-hypopnea index (AHI). OSA is diagnosed by either of the following3,4:
- AHI of 5 or higher, with clinical symptoms related to OSA (described below)
- AHI of 15 or higher, regardless of symptoms.
The AHI also defines OSA severity, as follows3:
- Mild: AHI 5 to 15
- Moderate: AHI 15 to 30
- Severe: AHI greater than 30.
Diagnostic criteria (eg, definition of hypopnea, testing methods, and AHI thresholds) have varied over time, an important consideration when reviewing the literature.
OSA IS MORE COMMON THAN EXPECTED AFTER STROKE
In the most methodologically sound and generalizable study of this topic to date, the Wisconsin Sleep Cohort Study6 reported in 2013 that about 14% of men and 5% of women ages 30 to 70 have an AHI greater than 5 (using 4% desaturation to score hypopneic episodes) with daytime sleepiness. Other studies suggest that 80% to 90% of people with OSA are undiagnosed and untreated.1,7
The prevalence of OSA in patients who have had a stroke is much higher, ranging from 30% to 96% depending on the study methods and population.1,8–12 A 2010 meta-analysis11 of 29 studies reported that 72% of patients who had a stroke had an AHI greater than 5, and 29% had severe OSA. In this analysis, 7% of those with sleep-disordered breathing had central sleep apnea; still, these data indicate that the prevalence of OSA in these patients is about 5 times higher than in the general population.
RISK FACTORS MAY DIFFER IN STROKE POPULATION
Several risk factors for OSA have been identified.
Obesity is one of the strongest risk factors, with increasing body mass index (BMI) associated with increased OSA prevalence.4,6,13 However, obesity appears to be a less significant risk factor in patients who have had a stroke than in the general population. In the 2010 meta-analysis11 of OSA after stroke, the average BMI was only 26.4 kg/m2 (with obesity defined as a BMI > 30.0 kg/m2), and increasing BMI was not associated with increasing AHI.
Male sex and advanced age are also OSA risk factors.4,5 They remain significant in patients after a stroke; about 65% of poststroke patients who have OSA are men, and the older the patient, the more likely the AHI is greater than 10.11
Ethnicity and genetics may also play important roles in OSA risk, with roughly 25% of OSA prevalence estimated to have a genetic basis.14,15 Some risk factors for OSA such as craniofacial shape, upper airway anatomy, upper airway muscle dysfunction, increased respiratory chemosensitivity, and poor arousal threshold during sleep are likely determined by genetics and ethnicity.14,15 Compared with people of European origin, Asians have a similar prevalence of OSA, but at a much lower average BMI, suggesting that other factors are significant.14 Possible genetically determined anatomic risk factors have not been specifically studied in the poststroke population, but it can be assumed they remain relevant.
Several studies have tried to find an association between OSA and type, location, etiology, or pattern of stroke.10,11,16–19 Although some suggest links between cardioembolic stroke and OSA,16,20 or thrombolysis and OSA,10 most have found no association between OSA and stroke features.11,12,21,22
HOW DOES OSA INCREASE STROKE RISK?
Untreated severe OSA is associated with increased cardiovascular mortality,21,22 and OSA is an independent risk factor for incident stroke.23 A number of mechanisms may explain these relationships.
Intermittent hypoxemia and recurrent sympathetic arousals resulting from OSA are thought to lead to many of the comorbid conditions with which it is associated: hypertension, coronary artery disease, heart failure, arrhythmias, pulmonary hypertension, and stroke. Repetitive decreases in ventilation lead to oxygen desaturations that result in cycles of increased sympathetic outflow and eventual sustained nocturnal hypertension and daytime chronic hypertension.1,5,9,13 Also implicated are various changes in vasodilator and vasoconstrictor substances due to endothelial dysfunction and inflammation, which are thought to play a role in the atherogenic and prothrombotic states induced by OSA.1,5,13
Cerebral circulation is altered primarily by the changes in partial pressure of carbon dioxide (Pco2). During apnea, the Pco2 rises, causing vasodilation and increased blood flow. After the apnea resolves, there is hyperpnea with resultant decreased Pco2, and vasoconstriction. In a patient who already has vascular disease, the enhanced vasoconstriction could lead to ischemia.1,5
Changes in intrathoracic pressure result in distortion of cardiac architecture. When the patient tries to breathe against an occluded airway, the intrathoracic pressure becomes more and more negative, increasing preload and afterload. When this happens repeatedly every night for years, it leads to remodeling of the heart such as left and right ventricular hypertrophy, with reduced stroke volume, myocardial ischemia, and increased risk of arrhythmia.1,5,13
Untreated OSA is believed to predispose patients to develop atrial fibrillation through sympathetic overactivity, vascular inflammation, heart rate variability, and cardiac remodeling.24 As atrial fibrillation is a major risk factor for stroke, particularly cardioembolic stroke, it may be another pathway of increased stroke risk in OSA.16,20,25
CLINICAL MANIFESTATIONS OF OSA NOT OBVIOUS AFTER STROKE
OSA typically causes both daytime symptoms (excessive sleepiness, poor concentration, morning headache, depressive symptoms) and nighttime signs and symptoms (snoring, choking, gasping, night sweats, insomnia, nocturia, witnessed episodes of apnea).3,4,26 Unfortunately, because these are nonspecific, OSA is often underdiagnosed.4,26
Identifying OSA after a stroke may be a particular challenge, as patients often do not report classic symptoms, and the typical picture of OSA may have less predictive validity in these patients.1,27,28 Within the first 24 hours after a stroke, hypersomnia, snoring history, and age are not predictive of OSA.1 Patients found to have OSA after a stroke frequently do not have the traditional symptoms (sleepiness, snoring) seen in usual OSA patients. And they have higher rates of OSA at a younger age than the usual OSA patients, so age is not a predictive risk factor. In addition, daytime sleepiness and obesity are often absent or less prominent.1,9,27,28 Finally, typical OSA signs and symptoms may be attributed to the stroke itself or to comorbidities affecting the patient, lowering suspicion for OSA.
OSA MAY HINDER STROKE RECOVERY, WORSEN OUTCOMES
OSA, particularly when moderate to severe, is linked to pathophysiologic changes that can hinder recovery from a stroke.
Intermittent hypoxemia during sleep can worsen vascular damage of at-risk tissue: nocturnal hypoxemia correlates with white matter hyperintensities on magnetic resonance imaging, a marker of ischemic demyelination.29 Oxidative stress and release of inflammatory mediators associated with intermittent hypoxemia may impair vascular blood flow to brain tissue attempting to repair itself.30 In addition, sympathetic overactivity and Pco2 fluctuations associated with OSA may impede cerebral circulation.
Taken together, such ongoing nocturnal insults can lead to clinical consequences during this vulnerable period.
A 1996 study31 of patients recovering from a stroke found that an oxygen desaturation index (number of times that the blood oxygen level drops below a certain threshold, as measured by overnight oximetry) of more than 10 per hour was associated with worse functional recovery at discharge and at 3 and 12 months after discharge. This study also noted an association between time spent with oxygen saturations below 90% and the rate of death at 1 year.
A 2003 study32 reported that patients with an AHI greater than 10 by polysomnography spent an average of 13 days longer on the rehabilitation service and had worse functional and cognitive status on discharge, even after controlling for multiple confounders. Several subsequent studies have confirmed these and similar findings.8,33,34
OSA has also been linked to depression,35 which is common after stroke and may worsen outcomes.36 The interaction between OSA, depression, and poststroke outcomes warrants further study.
In the general population, OSA has been independently associated with increased risk of stroke or death from any cause.21,22,37 These associations have also been reported in the poststroke population: a 2014 meta-analysis found that OSA increased the risk of a repeat stroke (relative risk [RR] 1.8, 95% confidence interval [CI] 1.2–2.6) and all-cause mortality (RR 1.69, 95% CI 1.4–2.1).38
TESTING FOR OSA AFTER STROKE
Because of the high prevalence of OSA in patients who have had a stroke and the potential for worse outcomes associated with untreated OSA, there should be a low threshold for evaluating for OSA soon after stroke. Objective testing is required to qualify for therapy, and the gold standard for diagnosis of OSA is formal polysomnography conducted in a sleep laboratory.2–4 Unfortunately, polysomnography may be unacceptable to some patients, is costly, and is resource-intensive, particularly in an inpatient or rehabilitation setting.28 Ideally, to optimize testing efficiency, patients should be screened for the likelihood of OSA before polysomnography is ordered.
Questionnaires can help determine the need for further testing
Questionnaires developed to assess OSA risk39 include the following:
The Berlin questionnaire, developed in 1999, has 10 questions assessing daytime and nighttime signs and symptoms and presence of hypertension.
The STOP questionnaire, developed in 2008, assesses snoring, tiredness, observed apneic episodes, and elevated blood pressure.
The STOP-BANG questionnaire, published in 2010, includes the STOP questions plus BMI over 35 kg/m2, age over 50, neck circumference over 41 cm, and male gender.
A 2017 meta-analysis39 of 108 studies with nearly 50,000 people found that the STOP-BANG questionnaire performed best with regard to sensitivity and diagnostic odds ratio, but with poor specificity.
These screening tools and modified versions of them have also been evaluated in patients who have had a stroke.
In 2015, Boulos et al28 found that the STOP-BAG (a version of STOP-BANG that excludes neck circumference) and the 4-variable (4V) questionnaire (sex, BMI, blood pressure, snoring) had moderate predictive value for OSA within 6 months after sroke.
In 2016, Katzan et al40 found that the STOP-BAG2 (STOP-BAG criteria plus continuous variables for BMI and age) had a high sensitivity for polysomnographically diagnosed OSA within the first year after a stroke. The specificity was significantly better than the STOP-BANG or the STOP-BAG questionnaire, although it remained suboptimal at 60.5%.
In 2017, Sico et al41 developed and assessed the SLEEP Inventory (sex, left heart failure, Epworth Sleepiness Scale, enlarged neck, weight in pounds, insulin resistance or diabetes, and National Institutes of Health Stroke Scale) and found that it outperformed the Berlin and STOP-BANG questionnaires in the poststroke setting. The SLEEP Inventory had the best specificity and negative predictive value, and a slightly better ability to correctly classify patients as having OSA or not, classifying 80% of patients correctly.
These newer screening tools (eg, STOP-BAG, STOP-BAG2, SLEEP) can be used to identify with reasonable accuracy which patients need definitive testing after stroke.
Pulse oximetry is another possible screening tool
Overnight pulse oximetry may also help screen for sleep apnea and stratify risk after a stroke. A 2012 study42 of overnight oximetry to screen patients before surgery found that the oxygen desaturation index was significantly associated with the AHI measured by polysomnography. However, oximetry testing cannot distinguish between OSA and central sleep apnea, so it is insufficient to diagnose OSA or qualify patients for therapy. Further study is needed to examine the ability of overnight pulse oximetry to screen or to stratify risk for OSA after stroke.
Polysomnography vs home testing
Polysomnography is the gold standard for diagnosing OSA. Benefits include technical support and trouble-shooting, determining relationships between OSA, body position, and sleep stage, and the ability to intervene with treatment.2 However, polysomnography can be cumbersome, costly, and resource-intensive.
A home sleep apnea test, ie, an unattended, limited-channel sleep study, may be an acceptable alternative.2–4,43,44 Home testing does not require a sleep technologist to be present during testing, uses fewer sensors, and is less expensive than overnight polysomnography, but its utility can be limited: it fails to accurately discriminate between episodes of OSA and central sleep apnea, there is potential for false-negative results, and it can underestimate sleep apnea burden because it does not measure sleep.2
Institutional resources and logistics may influence the choice of diagnostic modality. No data exist on outcomes from different diagnostic testing methods in poststroke patients. Further research is needed.
POSITIVE AIRWAY PRESSURE THERAPY: BENEFITS, CHALLENGES, ALTERNATIVES
The first-line treatment for OSA is positive airway pressure (PAP).3 For most patients, this is continuous PAP (CPAP) or autoadjusting PAP (APAP). In some instances, particularly for those who cannot tolerate CPAP or who have comorbid hypoventilation, bilevel PAP (BPAP) may be indicated. More advanced PAP therapies are unlikely to be used after stroke.
PAP therapy is associated with reduced daytime sleepiness, improved mood, normalization of sleep architecture, improved systemic and pulmonary artery blood pressure, reduced rates of atrial fibrillation after ablation, and improved insulin sensitivity.45–49 Whether it reduces the risk of cardiovascular events, including stroke, remains controversial; most data suggest that it does not.50,51 However, when adherence to PAP therapy is considered rather than intention to treat, treatment has been found to lead to improved cardiovascular outcomes.52
Mixed evidence of benefits after stroke
Observational studies provide evidence that CPAP may help patients with OSA after stroke, although results are mixed.53–58 The studies ranged in size from 14 to 105 patients, enrolled patients with mostly moderate to severe OSA, and followed patients from 10 days to 7 years. Adherence to therapy was generally good in the short term (50%–70%), but only 15% to 30% of patients remained adherent at 5 to 7 years. Variable outcomes were reported, with some studies finding improved symptoms in the near term and mixed evidence of cardiovascular benefit in the longer ones. However, as these studies lacked randomization, drawing definitive conclusions on CPAP efficacy is difficult.
Patients were enrolled in the index admission or when starting a rehabilitation service—generally 2 to 3 weeks after their stroke. No clear association was found between the timing of initiating PAP therapy and outcomes. All patients had ischemic strokes, but few details were provided regarding stroke location, size, and severity. Exclusion criteria included severe underlying cardiopulmonary disease, confusion, severe stroke with marked impairment, and inability to cooperate. Almost all patients had moderate to severe OSA, and patients with central sleep apnea were excluded.
The major outcomes examined were drop-out rates, PAP adherence, and neurologic improvement based on neurologic functional scales (National Institutes of Health Stroke Scale and Canadian Neurologic Scale). As expected, dropout rates were higher in patients randomized to CPAP (OR 1.83, 95% CI 1.05–3.21, P = .03), although overall adherence was better than anticipated, with mean CPAP use across trials of 4.5 hours per night (95% CI 3.97–5.08) and with about 50% to 60% of patients adhering to therapy for at least 4 hours nightly.
Improvement in neurologic outcomes favored CPAP (standard mean difference 0.54, 95% CI 0.026–1.05), although considerable heterogeneity was seen. Improved sleepiness outcomes were inconsistent. Major cardiovascular outcomes were reported in only 2 studies (using the same data set) and showed delayed time to the next cardiovascular event for those treated with CPAP but no difference in cardiovascular event-free survival.
PAP poses more challenges after stroke
The primary limitation to PAP therapy is poor acceptance and adherence to therapy.59 High rates of refusal of therapy and difficulty complying with treatment have been noted in the poststroke population, although recent studies have reported better adherence rates. How rates of adherence play out in real-world settings, outside of the controlled environment of a research study, has yet to be determined.
In general, CPAP adherence is affected by claustrophobia, difficulty tolerating a mask, problems with pressure intolerance, irritating air leaks, nasal congestion, and naso-oral dryness. Many such barriers can be overcome with use of a properly fitted mask, an appropriate pressure setting, heated humidification, nasal sprays (eg, saline, inhaled steroids), and education, encouragement, and reassurance.
After a stroke, additional obstacles may impede the ability to use PAP therapy.68 Facial paresis (hemi- or bifacial) may make fitting of the mask problematic. Paralysis or weakness of the extremities may limit the ability to adjust or remove a mask. Aphasia can impair communication and understanding of the need to use PAP therapy, and upper-airway problems related to stroke, including dysphagia, may lead to pressure intolerance or risk of aspiration. Finally, a lack of perceived benefit, particularly if the patient does not have daytime sleepiness, may limit motivation.
Consider alternatives
For patients unlikely to succeed with PAP therapy, there are alternatives. Surgery and oral appliances are not usually realistic options in the setting of recent stroke, but positional therapy, including the use of body positioners to prevent supine sleep, as well as elevating the head of the bed, may be of some benefit.69,70 A nasopharyngeal airway stenting device (nasal trumpet) may also be tolerated by some patients.
A proposed algorithm for screening, diagnosing, and treating OSA in patients after stroke is presented in Figure 1.
- Selim B, Roux FJ. Stroke and sleep disorders. Sleep Med Clin 2012; 7(4):597–607. doi:10.1016/j.jsmc.2012.08.007
- Kapur VK, Auckley DH, Chowdhuri S, et al. Clinical practice guideline for diagnostic testing for adult obstructive sleep apnea: an American Academy of Sleep Medicine Clinical Practice Guideline. J Clin Sleep Med 2017; 13(3):479–504. doi:10.5664/jcsm.6506
- Epstein LJ, Kristo D, Strollo PJ Jr, et al; Adult Obstructive Sleep Apnea Task Force of the American Academy of Sleep Medicine. Clinical guideline for the evaluation, management, and long-term care of obstructive sleep apnea in adults. J Clin Sleep Med 2009; 5(3):263–276. pmid:19960649
- Patil SP, Schneider H, Schwartz AR, Smith PL. Adult obstructive sleep apnea: pathophysiology and diagnosis. Chest 2007; 132(1):325–337. doi:10.1378/chest.07-0040
- Dempsey JA, Veasey SC, Morgan BJ, O’Donnell CP. Pathophysiology of sleep apnea. Physiol Rev 2010; 90(1):47–112. doi:10.1152/physrev.00043.2008
- Peppard PE, Young T, Barnet JH, Palta M, Hagen EW, Hla KM. Increased prevalence of sleep-disordered breathing in adults. Am J Epidemiol 2013; 177(9):1006–1014. doi:10.1093/aje/kws342
- Redline S, Sotres-Alvarez D, Loredo J, et al. Sleep-disordered breathing in Hispanic/Latino individuals of diverse backgrounds. The Hispanic Community Health Study/Study of Latinos. Am J Resp Crit Care Med 2014; 189(3):335–344. doi:10.1164/rccm.201309-1735OC
- Aaronson JA, van Bennekom CA, Hofman WF, et al. Obstructive sleep apnea is related to impaired cognitive and functional status after stroke. Sleep 2015; 38(9):1431–1437. doi:10.5665/sleep.4984
- Sharma S, Culebras A. Sleep apnoea and stroke. Stroke Vasc Neurol 2016; 1(4):185–191. doi:10.1136/svn-2016-000038
- Huhtakangas JK, Huhtakangas J, Bloigu R, Saaresranta T. Prevalence of sleep apnea at the acute phase of ischemic stroke with or without thrombolysis. Sleep Med 2017; 40:40–46. doi:10.1016/j.sleep.2017.08.018
- Johnson KG, Johnson DC. Frequency of sleep apnea in stroke and TIA patients: a meta-analysis. J Clin Sleep Med 2010; 6(2):131–137. pmid:20411688
- Iranzo A, Santamaria J, Berenguer J, Sanchez M, Chamorro A. Prevalence and clinical importance of sleep apnea in the first night after cerebral infarction. Neurology 2002; 58:911–916. pmid:11914407
- Javaheri S, Barbe F, Campos-Rodriguez F, et al. Sleep apnea: types, mechanisms, and clinical cardiovascular consequences. J Am Coll Cardiol 2017; 69(7):841–858. doi:10.1016/j.jacc.2016.11.069
- Dudley KA, Patel SR. Disparities and genetic risk factors in obstructive sleep apnea. Sleep Med 2016; 18:96–102. doi:10.1016/j.sleep.2015.01.015
- Redline S, Tishler PV. The genetics of sleep apnea. Sleep Med Rev 2000; 4(6):583–602. doi:10.1053/smrv.2000.0120
- Lipford MC, Flemming KD, Calvin AD, et al. Associations between cardioembolic stroke and obstructive sleep apnea. Sleep 2015; 38(11):1699–1705. doi:10.5665/sleep.5146
- Wang Y, Wang Y, Chen J, Yi X, Dong S, Cao L. Stroke patterns, topography, and etiology in patients with obstructive sleep apnea hypopnea syndrome. Int J Clin Exp Med 2017; 10(4):7137–7143.
- Fisse AL, Kemmling A, Teuber A, et al. The association of lesion location and sleep related breathing disorder in patients with acute ischemic stroke. PLoS One 2017; 12(1):e0171243. doi:10.1371/journal.pone.0171243
- Brown DL, Mowla A, McDermott M, et al. Ischemic stroke subtype and presence of sleep-disordered breathing: the BASIC sleep apnea study. J Stroke Cerebrovasc Dis 2015; 24(2):388–393. doi:10.1016/j.jstrokecerebrovasdis.2014.09.007
- Poli M, Philip P, Taillard J, et al. Atrial fibrillation as a major cause of stroke in apneic patients: a prospective study. Sleep Med 2017; 30:251–254. doi:10.1016/j.sleep.2015.07.031
- Young T, Finn L, Peppard PE, et al. Sleep disordered breathing and mortality: eighteen-year follow-up of the Wisconsin Sleep Cohort. Sleep 2008; 31(8):1071–1078. pmid:18714778
- Molnar MZ, Mucsi I, Novak M, et al. Association of incident obstructive sleep apnoea with outcomes in a large cohort of US veterans. Thorax 2015; 70(9):888–895. doi:10.1136/thoraxjnl-2015-206970
- Redline S, Yenokyan G, Gottlieb DJ, et al. Obstructive sleep apnea-hypopnea and incident stroke: the sleep heart health study. Am J Respir Crit Care Med 2010; 182(2):269–277. doi:10.1164/rccm.200911-1746OC
- Marulanda-Londono E, Chaturvedi S. The interplay between obstructive sleep apnea and atrial fibrillation. Fron Neurol 2017; 8:668. doi:10.3389/fneur.2017.00668
- Szymanski FM, Filipiak KJ, Platek AE, Hrynkiewicz-Szymanska A, Karpinski G, Opolski G. Assessment of CHADS2 and CHA 2DS 2-VASc scores in obstructive sleep apnea patients with atrial fibrillation. Sleep Breath 2015; 19(2):531–537. doi:10.1007/s11325-014-1042-5
- Stansbury RC, Strollo PJ. Clinical manifestations of sleep apnea. J Thoracic Dis 2015; 7(9):E298–E310. doi:10.3978/j.issn.2072-1439.2015.09.13
- Chan W, Coutts SB, Hanly P. Sleep apnea in patients with transient ischemic attack and minor stroke: opportunity for risk reduction of recurrent stroke? Stroke 2010; 41(12):2973–2975. doi:10.1161/STROKEAHA.110.596759
- Boulos MI, Wan A, Im J, et al. Identifying obstructive sleep apnea after stroke/TIA: evaluating four simple screening tools. Sleep Med 2016; 21:133–139. doi:10.1016/j.sleep.2015.12.013
- Patel SK, Hanly PJ, Smith EE, Chan W, Coutts SB. Nocturnal hypoxemia is associated with white matter hyperintensities in patients with a minor stroke or transient ischemic attack. J Clin Sleep Med 2015; 11(12):1417–1424. doi:10.5664/jcsm.5278
- McCarty MF, DiNicolantonio JJ, O’Keefe JH. NADPH oxidase, uncoupled endothelial nitric oxide synthase, and NF-KappaB are key mediators of the pathogenic impact of obstructive sleep apnea—therapeutic implications. J Integr Cardiol 2016; 2(5):367–374. doi:10.15761/JIC.1000177
- Good DC, Henkle JQ, Gelber D, Welsh J, Verhulst S. Sleep-disordered breathing and poor functional outcome after stroke. Stroke 1996; 27(2):252–259. pmid:8571419
- Kaneko Y, Hajek VE, Zivanovic V, Raboud J, Bradley TD. Relationship of sleep apnea to functional capacity and length of hospitalization following stroke. Sleep 2003; 26(3):293–297. pmid:12749548
- Yan-fang S, Yu-ping W. Sleep-disordered breathing: impact on functional outcome of ischemic stroke patients. Sleep Med 2009; 10(7):717–719. doi:10.1016/j.sleep.2008.08.006
- Kumar R, Suri JC, Manocha R. Study of association of severity of sleep disordered breathing and functional outcome in stroke patients. Sleep Med 2017; 34:50–56. doi:10.1016/j.sleep.2017.02.025
- Kerner NA, Roose SP. Obstructive sleep apnea is linked to depression and cognitive impairment: evidence and potential mechanisms. Am J Geriatr Psychiatry 2016; 24(6):496–508. doi:10.1016/j.jagp.2016.01.134
- Bartoli F, Lillia N, Lax A, et al. Depression after stroke and risk of mortality: a systematic review and meta-analysis. Stroke Res Treat 2013; 2013:862978. doi:10.1155/2013/862978
- Yaggi HK, Concato J, Kernan WN, Lichtman JH, Brass LM, Mohsenin V. Obstructive sleep apnea as a risk factor for stroke and death. N Engl J Med 2005; 353(19):2034–2041. doi:10.1056/NEJMoa043104
- Xie W, Zheng F, Song X. Obstructive sleep apnea and serious adverse outcomes in patients with cardiovascular or cerebrovascular disease: a PRISMA-compliant systematic review and meta-analysis. Medicine (Baltimore) 2014; 93(29):e336. doi:10.1097/MD.0000000000000336
- Chiu HY, Chen PY, Chuang LP, et al. Diagnostic accuracy of the Berlin questionnaire, STOP-BANG, STOP, and Epworth sleepiness scale in detecting obstructive sleep apnea: a bivariate meta-analysis. Sleep Med Rev 2017; 36:57–70. doi:10.1016/j.smrv.2016.10.004
- Katzan IL, Thompson NR, Uchino K, Foldvary-Schaefer N. A screening tool for obstructive sleep apnea in cerebrovascular patients. Sleep Med 2016; 21:70–76. doi:10.1016/j.sleep.2016.02.001
- Sico JJ, Yaggi HK, Ofner S, et al. Development, validation, and assessment of an ischemic stroke or transient ischemic attack-specific prediction tool for obstructive sleep apnea. J Stroke Cerebrovasc Dis 2017; 26(8):1745–1754. doi:10.1016/j.jstrokecerebrovasdis.2017.03.042
- Chung F, Liao P, Elsaid H, Islam S, Shapiro CM, Sun Y. Oxygen desaturation index from nocturnal oximetry: a sensitive and specific tool to detect sleep-disordered breathing in surgical patients. Anesth Analg 2012; 114(5):993–1000. doi:10.1213/ANE.0b013e318248f4f5
- Boulos MI, Elias S, Wan A, et al. Unattended hospital and home sleep apnea testing following cerebrovascular events. J Stroke Cerebrovasc Dis 2017; 26(1):143–149. doi:10.1016/j.jstrokecerebrovasdis.2016.09.001
- Saletu MT, Kotzian ST, Schwarzinger A, Haider S, Spatt J, Saletu B. Home sleep apnea testing is a feasible and accurate method to diagnose obstructive sleep apnea in stroke patients during in-hospital rehabilitation. J Clin Sleep Med 2018; 14(9):1495–1501. doi:10.5664/jcsm.7322
- Giles TL, Lasserson TJ, Smith BH, White J, Wright J, Cates CJ. Continuous positive airways pressure for obstructive sleep apnoea in adults. Cochrane Database Syst Rev 2006; (3):CD001106. doi:10.1002/14651858.CD001106.pub3
- Fatureto-Borges F, Lorenzi-Filho G, Drager LF. Effectiveness of continuous positive airway pressure in lowering blood pressure in patients with obstructive sleep apnea: a critical review of the literature. Integr Blood Press Control 2016; 9:43–47. doi:10.2147/IBPC.S70402
- Imran TF, Gharzipura M, Liu S, et al. Effect of continuous positive airway pressure treatment on pulmonary artery pressure in patients with isolated obstructive sleep apnea: a meta-analysis. Heart Fail Rev 2016; 21(5):591–598. doi:10.1007/s10741-016-9548-5
- Deng F, Raza A, Guo J. Treating obstructive sleep apnea with continuous positive airway pressure reduces risk of recurrent atrial fibrillation after catheter ablation: a meta-analysis. Sleep Med 2018; 46:5–11. doi:10.1016/j.sleep.2018.02.013
- Seetho IW, Wilding JPH. Sleep-disordered breathing, type 2 diabetes, and the metabolic syndrome. Chronic Resp Dis 2014; 11(4):257–275. doi:10.1177/1479972314552806
- Kim Y, Koo YS, Lee HY, Lee SY. Can continuous positive airway pressure reduce the risk of stroke in obstructive sleep apnea patients? A systematic review and meta-analysis. PloS ONE 2016; 11(1):e0146317. doi:10.1371/journal.pone.0146317
- Yu J, Zhou Z, McEvoy RD, et al. Association of positive airway pressure with cardiovascular events and death in adults with sleep apnea: a systematic review and meta-analysis. JAMA 2017; 318(2):156–166. doi:10.1001/jama.2017.7967
- Peker Y, Glantz H, Eulenburg C, Wegscheider K, Herlitz J, Thunström E. Effect of positive airway pressure on cardiovascular outcomes in coronary artery disease patients with nonsleepy obstructive sleep apnea. The RICCADSA randomized controlled trial. Am J Respir Crit Care Med 2016; 194(5):613–620. doi:10.1164/rccm.201601-0088OC
- Martinez-Garcia MA, Soler-Cataluna JJ, Ejarque-Martinez L, et al. Continuous positive airway pressure treatment reduces mortality in patients with ischemic stroke and obstructive sleep apnea: a 5-year follow-up study. Am J Respir Crit Care Med 2009; 180(1):36–41. doi:10.1164/rccm.200808-1341OC
- Broadley SA, Jorgensen L, Cheek A, et al. Early investigation and treatment of obstructive sleep apnoea after acute stroke. J Clin Neurosci 2007; 14(4):328–333. doi:10.1016/j.jocn.2006.01.017
- Wessendorf TE, Wang YM, Thilmann AF, Sorgenfrei U, Konietzko N, Teschler H. Treatment of obstructive sleep apnoea with nasal continuous positive airway pressure in stroke. Eur Respir J 2001; 18(4):623–629. pmid:11716165
- Bassetti CL, Milanova M, Gugger M. Sleep-disordered breathing and acute ischemic stroke: diagnosis, risk factors, treatment, evolution, and long-term clinical outcome. Stroke 2006; 37(4):967–972. doi:10.1161/01.STR.0000208215.49243.c3
- Palombini L, Guilleminault C. Stroke and treatment with nasal CPAP. Eur J Neurol 2006; 13(2):198–200. doi:10.1111/j.1468-1331.2006.01169.x
- Martínez-García MA, Campos-Rodríguez F, Soler-Cataluña JJ, Catalán-Serra P, Román-Sánchez P, Montserrat JM. Increased incidence of nonfatal cardiovascular events in stroke patients with sleep apnoea: effect of CPAP treatment. Eur Respir J 2012; 39(4):906–912. doi:10.1183/09031936.00011311
- Brill AK, Horvath T, Seiler A, et al. CPAP as treatment of sleep apnea after stroke: a meta-analysis of randomized trials. Neurology 2018; 90(14):e1222–e1230. doi:10.1212/WNL.0000000000005262
- Hsu C, Vennelle M, Li H, Engleman HM, Dennis MS, Douglas NJ. Sleep-disordered breathing after stroke: a randomised controlled trial of continuous positive airway pressure. J Neurol Neurosurg Psychiatry 2006; 77(10):1143–1149. doi:10.1136/jnnp.2005.086686
- Parra O, Sanchez-Armengol A, Bonnin M, et al. Early treatment of obstructive apnoea and stroke outcome: a randomised controlled trial. Eur Resp J 2011; 37(5):1128–1136. doi:10.1183/09031936.00034410
- Ryan CM, Bayley M, Green R, Murray BJ, Bradley TD. Influence of continuous positive airway pressure on outcomes of rehabilitation in stroke patients with obstructive sleep apnea. Stroke 2011; 42(4):1062–1067. doi:10.1161/STROKEAHA.110.597468
- Bravata DM, Concato J, Fried T, et al. Continuous positive airway pressure: evaluation of a novel therapy for patients with acute ischemic stroke. Sleep 2011; 34(9):1271–1277. doi:10.5665/SLEEP.1254
- Parra O, Sanchez-Armengol A, Capote F, et al. Efficacy of continuous positive airway pressure treatment on 5-year survival in patients with ischaemic stroke and obstructive sleep apnea: a randomized controlled trial. J Sleep Res 2015; 24(1):47–53. doi:10.1111/jsr.12181
- Khot SP, Davis AP, Crane DA, et al. Effect of continuous positive airway pressure on stroke rehabilitation: a pilot randomized sham-controlled trial. J Clin Sleep Med 2016; 12(7):1019–1026. doi:10.5664/jcsm.5940
- Aaronson JA, Hofman WF, van Bennekom CA, et al. Effects of continuous positive airway pressure on cognitive and functional outcome of stroke patients with obstructive sleep apnea: a randomized controlled trial. J Clin Sleep Med 2016; 12(4):533–541. doi:10.5664/jcsm.5684
- Gupta A, Shukla G, Afsar M, et al. Role of positive airway pressure therapy for obstructive sleep apnea in patients with stroke: a randomized controlled trial. J Clin Sleep Med 2018; 14(4):511–521. doi:10.5664/jcsm.7034
- Mello-Fujita L, Kim LJ, Palombini Lde O, et al. Treatment of obstructive sleep apnea syndrome associated with stroke. Sleep Med 2015; 16(6):691–696. doi:10.1016/j.sleep.2014.12.017
- Svatikova A, Chervin RD, Wing JJ, Sanchez BN, Migda EM, Brown DL. Positional therapy in ischemic stroke patients with obstructive sleep apnea. Sleep Med 2011; 12(3):262–266. doi:10.1016/j.sleep.2010.12.008
- Souza FJ, Genta PR, de Souza Filho AJ, Wellman A, Lorenzi-Filho G. The influence of head-of-bed elevation in patients with obstructive sleep apnea. Sleep Breath 2017; 21(4):815–820. doi:10.1007/s11325-017-1524-3
- Selim B, Roux FJ. Stroke and sleep disorders. Sleep Med Clin 2012; 7(4):597–607. doi:10.1016/j.jsmc.2012.08.007
- Kapur VK, Auckley DH, Chowdhuri S, et al. Clinical practice guideline for diagnostic testing for adult obstructive sleep apnea: an American Academy of Sleep Medicine Clinical Practice Guideline. J Clin Sleep Med 2017; 13(3):479–504. doi:10.5664/jcsm.6506
- Epstein LJ, Kristo D, Strollo PJ Jr, et al; Adult Obstructive Sleep Apnea Task Force of the American Academy of Sleep Medicine. Clinical guideline for the evaluation, management, and long-term care of obstructive sleep apnea in adults. J Clin Sleep Med 2009; 5(3):263–276. pmid:19960649
- Patil SP, Schneider H, Schwartz AR, Smith PL. Adult obstructive sleep apnea: pathophysiology and diagnosis. Chest 2007; 132(1):325–337. doi:10.1378/chest.07-0040
- Dempsey JA, Veasey SC, Morgan BJ, O’Donnell CP. Pathophysiology of sleep apnea. Physiol Rev 2010; 90(1):47–112. doi:10.1152/physrev.00043.2008
- Peppard PE, Young T, Barnet JH, Palta M, Hagen EW, Hla KM. Increased prevalence of sleep-disordered breathing in adults. Am J Epidemiol 2013; 177(9):1006–1014. doi:10.1093/aje/kws342
- Redline S, Sotres-Alvarez D, Loredo J, et al. Sleep-disordered breathing in Hispanic/Latino individuals of diverse backgrounds. The Hispanic Community Health Study/Study of Latinos. Am J Resp Crit Care Med 2014; 189(3):335–344. doi:10.1164/rccm.201309-1735OC
- Aaronson JA, van Bennekom CA, Hofman WF, et al. Obstructive sleep apnea is related to impaired cognitive and functional status after stroke. Sleep 2015; 38(9):1431–1437. doi:10.5665/sleep.4984
- Sharma S, Culebras A. Sleep apnoea and stroke. Stroke Vasc Neurol 2016; 1(4):185–191. doi:10.1136/svn-2016-000038
- Huhtakangas JK, Huhtakangas J, Bloigu R, Saaresranta T. Prevalence of sleep apnea at the acute phase of ischemic stroke with or without thrombolysis. Sleep Med 2017; 40:40–46. doi:10.1016/j.sleep.2017.08.018
- Johnson KG, Johnson DC. Frequency of sleep apnea in stroke and TIA patients: a meta-analysis. J Clin Sleep Med 2010; 6(2):131–137. pmid:20411688
- Iranzo A, Santamaria J, Berenguer J, Sanchez M, Chamorro A. Prevalence and clinical importance of sleep apnea in the first night after cerebral infarction. Neurology 2002; 58:911–916. pmid:11914407
- Javaheri S, Barbe F, Campos-Rodriguez F, et al. Sleep apnea: types, mechanisms, and clinical cardiovascular consequences. J Am Coll Cardiol 2017; 69(7):841–858. doi:10.1016/j.jacc.2016.11.069
- Dudley KA, Patel SR. Disparities and genetic risk factors in obstructive sleep apnea. Sleep Med 2016; 18:96–102. doi:10.1016/j.sleep.2015.01.015
- Redline S, Tishler PV. The genetics of sleep apnea. Sleep Med Rev 2000; 4(6):583–602. doi:10.1053/smrv.2000.0120
- Lipford MC, Flemming KD, Calvin AD, et al. Associations between cardioembolic stroke and obstructive sleep apnea. Sleep 2015; 38(11):1699–1705. doi:10.5665/sleep.5146
- Wang Y, Wang Y, Chen J, Yi X, Dong S, Cao L. Stroke patterns, topography, and etiology in patients with obstructive sleep apnea hypopnea syndrome. Int J Clin Exp Med 2017; 10(4):7137–7143.
- Fisse AL, Kemmling A, Teuber A, et al. The association of lesion location and sleep related breathing disorder in patients with acute ischemic stroke. PLoS One 2017; 12(1):e0171243. doi:10.1371/journal.pone.0171243
- Brown DL, Mowla A, McDermott M, et al. Ischemic stroke subtype and presence of sleep-disordered breathing: the BASIC sleep apnea study. J Stroke Cerebrovasc Dis 2015; 24(2):388–393. doi:10.1016/j.jstrokecerebrovasdis.2014.09.007
- Poli M, Philip P, Taillard J, et al. Atrial fibrillation as a major cause of stroke in apneic patients: a prospective study. Sleep Med 2017; 30:251–254. doi:10.1016/j.sleep.2015.07.031
- Young T, Finn L, Peppard PE, et al. Sleep disordered breathing and mortality: eighteen-year follow-up of the Wisconsin Sleep Cohort. Sleep 2008; 31(8):1071–1078. pmid:18714778
- Molnar MZ, Mucsi I, Novak M, et al. Association of incident obstructive sleep apnoea with outcomes in a large cohort of US veterans. Thorax 2015; 70(9):888–895. doi:10.1136/thoraxjnl-2015-206970
- Redline S, Yenokyan G, Gottlieb DJ, et al. Obstructive sleep apnea-hypopnea and incident stroke: the sleep heart health study. Am J Respir Crit Care Med 2010; 182(2):269–277. doi:10.1164/rccm.200911-1746OC
- Marulanda-Londono E, Chaturvedi S. The interplay between obstructive sleep apnea and atrial fibrillation. Fron Neurol 2017; 8:668. doi:10.3389/fneur.2017.00668
- Szymanski FM, Filipiak KJ, Platek AE, Hrynkiewicz-Szymanska A, Karpinski G, Opolski G. Assessment of CHADS2 and CHA 2DS 2-VASc scores in obstructive sleep apnea patients with atrial fibrillation. Sleep Breath 2015; 19(2):531–537. doi:10.1007/s11325-014-1042-5
- Stansbury RC, Strollo PJ. Clinical manifestations of sleep apnea. J Thoracic Dis 2015; 7(9):E298–E310. doi:10.3978/j.issn.2072-1439.2015.09.13
- Chan W, Coutts SB, Hanly P. Sleep apnea in patients with transient ischemic attack and minor stroke: opportunity for risk reduction of recurrent stroke? Stroke 2010; 41(12):2973–2975. doi:10.1161/STROKEAHA.110.596759
- Boulos MI, Wan A, Im J, et al. Identifying obstructive sleep apnea after stroke/TIA: evaluating four simple screening tools. Sleep Med 2016; 21:133–139. doi:10.1016/j.sleep.2015.12.013
- Patel SK, Hanly PJ, Smith EE, Chan W, Coutts SB. Nocturnal hypoxemia is associated with white matter hyperintensities in patients with a minor stroke or transient ischemic attack. J Clin Sleep Med 2015; 11(12):1417–1424. doi:10.5664/jcsm.5278
- McCarty MF, DiNicolantonio JJ, O’Keefe JH. NADPH oxidase, uncoupled endothelial nitric oxide synthase, and NF-KappaB are key mediators of the pathogenic impact of obstructive sleep apnea—therapeutic implications. J Integr Cardiol 2016; 2(5):367–374. doi:10.15761/JIC.1000177
- Good DC, Henkle JQ, Gelber D, Welsh J, Verhulst S. Sleep-disordered breathing and poor functional outcome after stroke. Stroke 1996; 27(2):252–259. pmid:8571419
- Kaneko Y, Hajek VE, Zivanovic V, Raboud J, Bradley TD. Relationship of sleep apnea to functional capacity and length of hospitalization following stroke. Sleep 2003; 26(3):293–297. pmid:12749548
- Yan-fang S, Yu-ping W. Sleep-disordered breathing: impact on functional outcome of ischemic stroke patients. Sleep Med 2009; 10(7):717–719. doi:10.1016/j.sleep.2008.08.006
- Kumar R, Suri JC, Manocha R. Study of association of severity of sleep disordered breathing and functional outcome in stroke patients. Sleep Med 2017; 34:50–56. doi:10.1016/j.sleep.2017.02.025
- Kerner NA, Roose SP. Obstructive sleep apnea is linked to depression and cognitive impairment: evidence and potential mechanisms. Am J Geriatr Psychiatry 2016; 24(6):496–508. doi:10.1016/j.jagp.2016.01.134
- Bartoli F, Lillia N, Lax A, et al. Depression after stroke and risk of mortality: a systematic review and meta-analysis. Stroke Res Treat 2013; 2013:862978. doi:10.1155/2013/862978
- Yaggi HK, Concato J, Kernan WN, Lichtman JH, Brass LM, Mohsenin V. Obstructive sleep apnea as a risk factor for stroke and death. N Engl J Med 2005; 353(19):2034–2041. doi:10.1056/NEJMoa043104
- Xie W, Zheng F, Song X. Obstructive sleep apnea and serious adverse outcomes in patients with cardiovascular or cerebrovascular disease: a PRISMA-compliant systematic review and meta-analysis. Medicine (Baltimore) 2014; 93(29):e336. doi:10.1097/MD.0000000000000336
- Chiu HY, Chen PY, Chuang LP, et al. Diagnostic accuracy of the Berlin questionnaire, STOP-BANG, STOP, and Epworth sleepiness scale in detecting obstructive sleep apnea: a bivariate meta-analysis. Sleep Med Rev 2017; 36:57–70. doi:10.1016/j.smrv.2016.10.004
- Katzan IL, Thompson NR, Uchino K, Foldvary-Schaefer N. A screening tool for obstructive sleep apnea in cerebrovascular patients. Sleep Med 2016; 21:70–76. doi:10.1016/j.sleep.2016.02.001
- Sico JJ, Yaggi HK, Ofner S, et al. Development, validation, and assessment of an ischemic stroke or transient ischemic attack-specific prediction tool for obstructive sleep apnea. J Stroke Cerebrovasc Dis 2017; 26(8):1745–1754. doi:10.1016/j.jstrokecerebrovasdis.2017.03.042
- Chung F, Liao P, Elsaid H, Islam S, Shapiro CM, Sun Y. Oxygen desaturation index from nocturnal oximetry: a sensitive and specific tool to detect sleep-disordered breathing in surgical patients. Anesth Analg 2012; 114(5):993–1000. doi:10.1213/ANE.0b013e318248f4f5
- Boulos MI, Elias S, Wan A, et al. Unattended hospital and home sleep apnea testing following cerebrovascular events. J Stroke Cerebrovasc Dis 2017; 26(1):143–149. doi:10.1016/j.jstrokecerebrovasdis.2016.09.001
- Saletu MT, Kotzian ST, Schwarzinger A, Haider S, Spatt J, Saletu B. Home sleep apnea testing is a feasible and accurate method to diagnose obstructive sleep apnea in stroke patients during in-hospital rehabilitation. J Clin Sleep Med 2018; 14(9):1495–1501. doi:10.5664/jcsm.7322
- Giles TL, Lasserson TJ, Smith BH, White J, Wright J, Cates CJ. Continuous positive airways pressure for obstructive sleep apnoea in adults. Cochrane Database Syst Rev 2006; (3):CD001106. doi:10.1002/14651858.CD001106.pub3
- Fatureto-Borges F, Lorenzi-Filho G, Drager LF. Effectiveness of continuous positive airway pressure in lowering blood pressure in patients with obstructive sleep apnea: a critical review of the literature. Integr Blood Press Control 2016; 9:43–47. doi:10.2147/IBPC.S70402
- Imran TF, Gharzipura M, Liu S, et al. Effect of continuous positive airway pressure treatment on pulmonary artery pressure in patients with isolated obstructive sleep apnea: a meta-analysis. Heart Fail Rev 2016; 21(5):591–598. doi:10.1007/s10741-016-9548-5
- Deng F, Raza A, Guo J. Treating obstructive sleep apnea with continuous positive airway pressure reduces risk of recurrent atrial fibrillation after catheter ablation: a meta-analysis. Sleep Med 2018; 46:5–11. doi:10.1016/j.sleep.2018.02.013
- Seetho IW, Wilding JPH. Sleep-disordered breathing, type 2 diabetes, and the metabolic syndrome. Chronic Resp Dis 2014; 11(4):257–275. doi:10.1177/1479972314552806
- Kim Y, Koo YS, Lee HY, Lee SY. Can continuous positive airway pressure reduce the risk of stroke in obstructive sleep apnea patients? A systematic review and meta-analysis. PloS ONE 2016; 11(1):e0146317. doi:10.1371/journal.pone.0146317
- Yu J, Zhou Z, McEvoy RD, et al. Association of positive airway pressure with cardiovascular events and death in adults with sleep apnea: a systematic review and meta-analysis. JAMA 2017; 318(2):156–166. doi:10.1001/jama.2017.7967
- Peker Y, Glantz H, Eulenburg C, Wegscheider K, Herlitz J, Thunström E. Effect of positive airway pressure on cardiovascular outcomes in coronary artery disease patients with nonsleepy obstructive sleep apnea. The RICCADSA randomized controlled trial. Am J Respir Crit Care Med 2016; 194(5):613–620. doi:10.1164/rccm.201601-0088OC
- Martinez-Garcia MA, Soler-Cataluna JJ, Ejarque-Martinez L, et al. Continuous positive airway pressure treatment reduces mortality in patients with ischemic stroke and obstructive sleep apnea: a 5-year follow-up study. Am J Respir Crit Care Med 2009; 180(1):36–41. doi:10.1164/rccm.200808-1341OC
- Broadley SA, Jorgensen L, Cheek A, et al. Early investigation and treatment of obstructive sleep apnoea after acute stroke. J Clin Neurosci 2007; 14(4):328–333. doi:10.1016/j.jocn.2006.01.017
- Wessendorf TE, Wang YM, Thilmann AF, Sorgenfrei U, Konietzko N, Teschler H. Treatment of obstructive sleep apnoea with nasal continuous positive airway pressure in stroke. Eur Respir J 2001; 18(4):623–629. pmid:11716165
- Bassetti CL, Milanova M, Gugger M. Sleep-disordered breathing and acute ischemic stroke: diagnosis, risk factors, treatment, evolution, and long-term clinical outcome. Stroke 2006; 37(4):967–972. doi:10.1161/01.STR.0000208215.49243.c3
- Palombini L, Guilleminault C. Stroke and treatment with nasal CPAP. Eur J Neurol 2006; 13(2):198–200. doi:10.1111/j.1468-1331.2006.01169.x
- Martínez-García MA, Campos-Rodríguez F, Soler-Cataluña JJ, Catalán-Serra P, Román-Sánchez P, Montserrat JM. Increased incidence of nonfatal cardiovascular events in stroke patients with sleep apnoea: effect of CPAP treatment. Eur Respir J 2012; 39(4):906–912. doi:10.1183/09031936.00011311
- Brill AK, Horvath T, Seiler A, et al. CPAP as treatment of sleep apnea after stroke: a meta-analysis of randomized trials. Neurology 2018; 90(14):e1222–e1230. doi:10.1212/WNL.0000000000005262
- Hsu C, Vennelle M, Li H, Engleman HM, Dennis MS, Douglas NJ. Sleep-disordered breathing after stroke: a randomised controlled trial of continuous positive airway pressure. J Neurol Neurosurg Psychiatry 2006; 77(10):1143–1149. doi:10.1136/jnnp.2005.086686
- Parra O, Sanchez-Armengol A, Bonnin M, et al. Early treatment of obstructive apnoea and stroke outcome: a randomised controlled trial. Eur Resp J 2011; 37(5):1128–1136. doi:10.1183/09031936.00034410
- Ryan CM, Bayley M, Green R, Murray BJ, Bradley TD. Influence of continuous positive airway pressure on outcomes of rehabilitation in stroke patients with obstructive sleep apnea. Stroke 2011; 42(4):1062–1067. doi:10.1161/STROKEAHA.110.597468
- Bravata DM, Concato J, Fried T, et al. Continuous positive airway pressure: evaluation of a novel therapy for patients with acute ischemic stroke. Sleep 2011; 34(9):1271–1277. doi:10.5665/SLEEP.1254
- Parra O, Sanchez-Armengol A, Capote F, et al. Efficacy of continuous positive airway pressure treatment on 5-year survival in patients with ischaemic stroke and obstructive sleep apnea: a randomized controlled trial. J Sleep Res 2015; 24(1):47–53. doi:10.1111/jsr.12181
- Khot SP, Davis AP, Crane DA, et al. Effect of continuous positive airway pressure on stroke rehabilitation: a pilot randomized sham-controlled trial. J Clin Sleep Med 2016; 12(7):1019–1026. doi:10.5664/jcsm.5940
- Aaronson JA, Hofman WF, van Bennekom CA, et al. Effects of continuous positive airway pressure on cognitive and functional outcome of stroke patients with obstructive sleep apnea: a randomized controlled trial. J Clin Sleep Med 2016; 12(4):533–541. doi:10.5664/jcsm.5684
- Gupta A, Shukla G, Afsar M, et al. Role of positive airway pressure therapy for obstructive sleep apnea in patients with stroke: a randomized controlled trial. J Clin Sleep Med 2018; 14(4):511–521. doi:10.5664/jcsm.7034
- Mello-Fujita L, Kim LJ, Palombini Lde O, et al. Treatment of obstructive sleep apnea syndrome associated with stroke. Sleep Med 2015; 16(6):691–696. doi:10.1016/j.sleep.2014.12.017
- Svatikova A, Chervin RD, Wing JJ, Sanchez BN, Migda EM, Brown DL. Positional therapy in ischemic stroke patients with obstructive sleep apnea. Sleep Med 2011; 12(3):262–266. doi:10.1016/j.sleep.2010.12.008
- Souza FJ, Genta PR, de Souza Filho AJ, Wellman A, Lorenzi-Filho G. The influence of head-of-bed elevation in patients with obstructive sleep apnea. Sleep Breath 2017; 21(4):815–820. doi:10.1007/s11325-017-1524-3
KEY POINTS
- A low threshold for evaluating for OSA after a stroke is warranted: the prevalence is high in this population, and risk factors for OSA and its typical clinical picture may not be present.
- Questionnaires can help screen for the likelihood of OSA and the need for more definitive assessment with polysomnography or home sleep apnea testing, tests that pose additional challenges after stroke.
- Positive airway pressure (PAP) therapy remains the first-line treatment for OSA after stroke; it may improve recovery and reduce long-term sequelae of untreated OSA.
- Acceptance of and adherence to PAP therapy can be especially problematic in this population, and alternatives should be considered if needed.
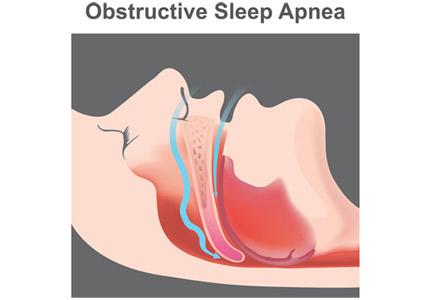
Anti-Xa assays: What is their role today in antithrombotic therapy?
Should clinicians abandon the activated partial thromboplastin time (aPTT) for monitoring heparin therapy in favor of tests that measure the activity of the patient’s plasma against activated factor X (anti-Xa assays)?
Although other anticoagulants are now available for preventing and treating arterial and venous thromboembolism, unfractionated heparin—which requires laboratory monitoring of therapy—is still widely used. And this monitoring can be challenging. Despite its wide use, the aPTT lacks standardization, and the role of alternative monitoring assays such as the anti-Xa assay is not well defined.
This article reviews the advantages, limitations, and clinical applicability of anti-Xa assays for monitoring therapy with unfractionated heparin and other anticoagulants.
UNFRACTIONATED HEPARIN AND WARFARIN ARE STILL WIDELY USED
Until the mid-1990s, unfractionated heparin and oral vitamin K antagonists (eg, warfarin) were the only anticoagulants widely available for clinical use. These agents have complex pharmacokinetic and pharmacodynamic properties, resulting in highly variable dosing requirements (both between patients and in individual patients) and narrow therapeutic windows, making frequent laboratory monitoring and dose adjustments mandatory.
Over the past 3 decades, other anticoagulants have been approved, including low-molecular-weight heparins, fondaparinux, parenteral direct thrombin inhibitors, and direct oral anticoagulants. While these agents have expanded the options for preventing and treating thromboembolism, unfractionated heparin and warfarin are still the most appropriate choices for many patients, eg, those with stage 4 chronic kidney disease and end-stage renal disease on dialysis, and those with mechanical heart valves.
In addition, unfractionated heparin remains the anticoagulant of choice during procedures such as hemodialysis, percutaneous transluminal angioplasty, and cardiopulmonary bypass, as well as in hospitalized and critically ill patients, who often have acute kidney injury or require frequent interruptions of therapy for invasive procedures. In these scenarios, unfractionated heparin is typically preferred because of its short plasma half-life, complete reversibility by protamine, safety regardless of renal function, and low cost compared with parenteral direct thrombin inhibitors.
As long as unfractionated heparin and warfarin remain important therapies, the need for their laboratory monitoring continues. For warfarin monitoring, the prothrombin time and international normalized ratio are validated and widely reproducible methods. But monitoring unfractionated heparin therapy remains a challenge.
UNFRACTIONATED HEPARIN’S EFFECT IS UNPREDICTABLE
Unfractionated heparin, a negatively charged mucopolysaccharide, inhibits coagulation by binding to antithrombin through the high-affinity pentasaccharide sequence.1–6 Such binding induces a conformational change in the antithrombin molecule, converting it to a rapid inhibitor of several coagulation proteins, especially factors IIa and Xa.2–4
Unfractionated heparin inhibits factors IIa and Xa in a 1:1 ratio, but low-molecular-weight heparins inhibit factor Xa more than factor IIa, with IIa-Xa inhibition ratios ranging from 1:2 to 1:4, owing to their smaller molecular size.7
One of the most important reasons for the unpredictable and highly variable individual responses to unfractionated heparin is that, infused into the blood, the large and negatively charged unfractionated heparin molecules bind nonspecifically to positively charged plasma proteins.7 In patients who are critically ill, have acute infections or inflammatory states, or have undergone major surgery, unfractionated heparin binds to acute-phase proteins that are elevated, particularly factor VIII. This results in fewer free heparin molecules and a variable anticoagulant effect.8
In contrast, low-molecular-weight heparins have longer half-lives and bind less to plasma proteins, resulting in more predictable plasma levels following subcutaneous injection.9
MONITORING UNFRACTIONATED HEPARIN IMPROVES OUTCOMES
In 1960, Barritt and Jordan10 conducted a small but landmark trial that established the clinical importance of unfractionated heparin for treating venous thromboembolism. None of the patients who received unfractionated heparin for acute pulmonary embolism developed a recurrence during the subsequent 2 weeks, while 50% of those who did not receive it had recurrent pulmonary embolism, fatal in half of the cases.
The importance of achieving a specific aPTT therapeutic target was not demonstrated until a 1972 study by Basu et al,11 in which 162 patients with venous thromboembolism were treated with heparin with a target aPTT of 1.5 to 2.5 times the control value. Patients who suffered recurrent events had subtherapeutic aPTT values on 71% of treatment days, while the rest of the patients, with no recurrences, had subtherapeutic aPTT values only 28% of treatment days. The different outcomes could not be explained by the average daily dose of unfractionated heparin, which was similar in the patients regardless of recurrence.
Subsequent studies showed that the best outcomes occur when unfractionated heparin is given in doses high enough to rapidly achieve a therapeutic prolongation of the aPTT,12–14 and that the total daily dose is also important in preventing recurrences.15,16 Failure to achieve a target aPTT within 24 hours of starting unfractionated heparin is associated with increased risk of recurrent venous thromboembolism.13,17
Raschke et al17 found that patients prospectively randomized to weight-based doses of intravenous unfractionated heparin (bolus plus infusion) achieved significantly higher rates of therapeutic aPTT within 6 hours and 24 hours after starting the infusion, and had significantly lower rates of recurrent venous thromboembolism than those randomized to a fixed unfractionated heparin protocol, without an increase in major bleeding.
Smith et al,18 in a study of 400 consecutive patients with acute pulmonary embolism treated with unfractionated heparin, found that patients who achieved a therapeutic aPTT within 24 hours had lower in-hospital and 30-day mortality rates than those who did not achieve the first therapeutic aPTT until more than 24 hours after starting unfractionated heparin infusion.
Such data lend support to the widely accepted practice and current guideline recommendation8 of using laboratory assays to adjust the dose of unfractionated heparin to achieve and maintain a therapeutic target. The use of dosing nomograms significantly reduces the time to achieve a therapeutic aPTT while minimizing subtherapeutic and supratherapeutic unfractionated heparin levels.19,20
THE aPTT REFLECTS THROMBIN INHIBITION
The aPTT has a log-linear relationship with plasma concentrations of unfractionated heparin,21 but it was not developed specifically for monitoring unfractionated heparin therapy. Originally described in 1953 as a screening tool for hemophilia,22–24 the aPTT is prolonged in the setting of factor deficiencies (typically with levels < 45%, except for factors VII and XIII), as well as lupus anticoagulants and therapy with parenteral direct thrombin inhibitors.8,25,26
Because thrombin (factor IIa) is 10 times more sensitive than factor Xa to inhibition by the heparin-antithrombin complex,4,7 thrombin inhibition appears to be the most likely mechanism by which unfractionated heparin prolongs the aPTT. In contrast, aPTT is minimally or not at all prolonged by low-molecular-weight heparins, which are predominantly factor Xa inhibitors.7
HEPARIN ASSAYS MEASURE UNFRACTIONATED HEPARIN ACTIVITY
While the aPTT is a surrogate marker of unfractionated heparin activity in plasma, unfractionated heparin activity can be measured more precisely by so-called heparin assays, which are typically not direct measures of the plasma concentration of heparins, but rather functional assays that provide indirect estimates. They include protamine sulfate titration assays and anti-Xa assays.
Protamine sulfate titration assays measure the amount of protamine sulfate required to neutralize heparin: the more protamine required, the greater the estimated concentration of unfractionated heparin in plasma.8,27–29 Protamine titration assays are technically demanding, so they are rarely used clinically.
Anti-Xa assays provide a measure of the functional level of heparins in plasma.29–33 Chromogenic anti-Xa assays are available on automated analyzers with standardized kits29,33,34 and may be faster to perform than the aPTT.35
Experiments in rabbits show that unfractionated heparin inhibits thrombus formation and extension at concentrations of 0.2 to 0.4 U/mL as measured by the protamine titration assay,27 which correlated with an anti-Xa activity of 0.35 to 0.67 U/mL in a randomized controlled trial.32
Assays that directly measure the plasma concentration of heparin exist but are not clinically relevant because they also measure heparin molecules lacking the pentasaccharide sequence, which have no anticoagulant activity.36
ANTI-Xa ASSAY VS THE aPTT
Anti-Xa assays are more expensive than the aPTT and are not available in all hospitals. For these reasons, the aPTT remains the most commonly used laboratory assay for monitoring unfractionated heparin therapy.
However, the aPTT correlates poorly with the activity level of unfractionated heparin in plasma. In one study, an anti-Xa level of 0.3 U/mL corresponded to aPTT results ranging from 47 to 108 seconds.31 Furthermore, in studies that used a heparin therapeutic target based on an aPTT ratio 1.5 to 2.5 times the control aPTT value, the lower end of that target range was often associated with subtherapeutic plasma unfractionated heparin activity measured by anti-Xa and protamine titration assays.28,31
Because of these limitations, individual laboratories should determine their own aPTT therapeutic target ranges for unfractionated heparin based on the response curves obtained with the reagent and coagulometer used. The optimal therapeutic aPTT range for treating acute venous thromboembolism should be defined as the aPTT range (in seconds) that correlates with a plasma activity level of unfractionated heparin of 0.3 to 0.7 U/mL based on a chromogenic anti-Xa assay, or 0.2 to 0.4 U/mL based on a protamine titration assay.32,34–36
Nevertheless, the anticoagulant effect of unfractionated heparin as measured by the aPTT can be unpredictable and can vary widely among individuals and in the same patient.7 This wide variability can be explained by a number of technical and biologic variables. Different commercial aPTT reagents, different lots of the same reagent, and different reagent and instrument combinations have different sensitivities to unfractionated heparin, which can lead to variable aPTT results.37 Moreover, high plasma levels of acute-phase proteins, low plasma antithrombin levels, consumptive coagulopathies, liver failure, and lupus anticoagulants may also affect the aPTT.7,25,32,36–41 These variables account for the poor correlation—ranging from 25% to 66%—reported between aPTT and anti-Xa assays.32,42–48
Such discrepancies may have serious clinical implications: if a patient’s aPTT is low (subtherapeutic) or high (supratherapeutic) but the anti-Xa assay result is within the therapeutic range (0.3–0.7 units/mL), changing the dose of unfractionated heparin (guided by an aPTT nomogram) may increase the risk of bleeding or of recurrent thromboembolism.
CLINICAL APPLICABILITY OF THE ANTI-Xa ASSAY
Neither anti-Xa nor protamine titration assays are standardized across reference laboratories, but chromogenic anti-Xa assays have better interlaboratory correlation than the aPTT49,50 and can be calibrated specifically for unfractionated or low-molecular-weight heparins.29,33
Although reagent costs are higher for chromogenic anti-Xa assays than for the aPTT, some technical variables (described below) may partially offset the cost difference.29,33,41 In addition, unlike the aPTT, anti-Xa assays do not need local calibration; the therapeutic range for unfractionated heparin is the same (0.3–0.7 U/mL) regardless of instrument or reagent.33,41
Most important, studies have found that patients monitored by anti-Xa assay achieve significantly higher rates of therapeutic anticoagulation within 24 and 48 hours after starting unfractionated heparin infusion than those monitored by the aPTT. Fewer dose adjustments and repeat tests are required, which may also result in lower cost.32,51–55
While these studies found chromogenic anti-Xa assays better for achieving laboratory end points, data regarding relevant clinical outcomes are more limited. In a retrospective, observational cohort study,51 the rate of venous thromboembolism or bleeding-related death was 2% in patients receiving unfractionated heparin therapy monitored by anti-Xa assay and 6% in patients monitored by aPTT (P = .62). Rates of major hemorrhage were also not significantly different.
In a randomized controlled trial32 in 131 patients with acute venous thromboembolism and heparin resistance, rates of recurrent venous thromboembolism were 4.6% and 6.1% in the groups randomized to anti-Xa and aPTT monitoring, respectively, whereas overall bleeding rates were 1.5% and 6.1%, respectively. Again, the differences were not statistically significant.
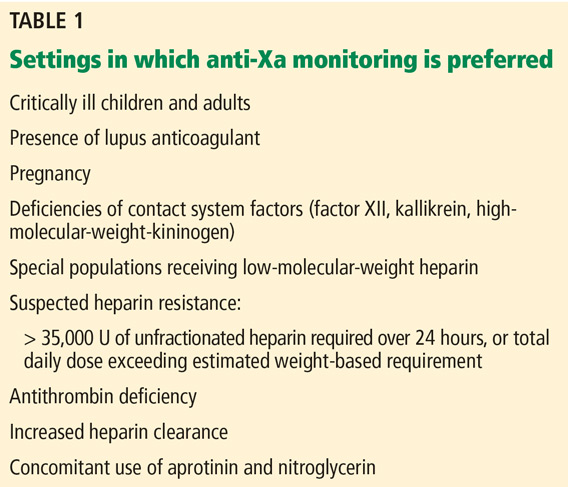
Heparin resistance. Some patients require unusually high doses of unfractionated heparin to achieve a therapeutic aPTT: typically, more than 35,000 U over 24 hours,7,8,32 or total daily doses that exceed their estimated weight-based requirements. Heparin resistance has been observed in various clinical settings.7,8,32,37–40,59–61 Patients with heparin resistance monitored by anti-Xa had similar rates of recurrent venous thromboembolism while receiving significantly lower doses of unfractionated heparin than those monitored by the aPTT.32
Lupus anticoagulant. Patients with the specific antiphospholipid antibody known as lupus anticoagulant frequently have a prolonged baseline aPTT,25 making it an unreliable marker of anticoagulant effect for intravenous unfractionated heparin therapy.
Critically ill infants and children. Arachchillage et al35 found that infants (< 1 year old) treated with intravenous unfractionated heparin in an intensive care department had only a 32.4% correlation between aPTT and anti-Xa levels, which was lower than that found in children ages 1 to 15 (66%) and adults (52%). In two-thirds of cases of discordant aPTT and anti-Xa levels, the aPTT was elevated (supratherapeutic) while the anti-Xa assay was within the therapeutic range (0.3–0.7 U/mL). Despite the lack of data on clinical outcomes (eg, rates of thrombosis and bleeding) with the use of an anti-Xa assay, it has been considered the method of choice for unfractionated heparin monitoring in critically ill children, and especially in those under age 1.41,44,62–64
While anti-Xa assays may also be better for unfractionated heparin monitoring in critically ill adults, the lack of clinical outcome data from large-scale randomized trials has precluded evidence-based recommendations favoring them over the aPTT.8,34
LIMITATIONS OF ANTI-Xa ASSAYS
Anti-Xa assays are hampered by some technical limitations:
Samples must be processed within 1 hour to avoid heparin neutralization.34
Samples must be clear. Hemolyzed or opaque samples (eg, due to bilirubin levels > 6.6 mg/dL or triglyceride levels > 360 mg/dL) cannot be processed, as they can cause falsely low levels.
Exposure to other anticoagulants can interfere with the results. The anti-Xa assay may be unreliable for unfractionated heparin monitoring in patients who are transitioned from low-molecular-weight heparins, fondaparinux, or an oral factor Xa inhibitor (apixaban, betrixaban, edoxaban, rivaroxaban) to intravenous unfractionated heparin, eg, due to hospitalization or acute kidney injury.65,66 Different reports have found that anti-Xa assays may be elevated for as long as 63 to 96 hours after the last dose of oral Xa inhibitors,67–69 potentially resulting in underdosing of unfractionated heparin. In such settings, unfractionated heparin therapy should be monitored by the aPTT.
ANTI-Xa ASSAYS AND LOW-MOLECULAR-WEIGHT HEPARINS
Most patients receiving low-molecular-weight heparins do not need laboratory monitoring.8 Alhenc-Gelas et al70 randomized patients to receive dalteparin in doses either based on weight or guided by anti-Xa assay results, and found that dose adjustments were rare and lacked clinical benefit.
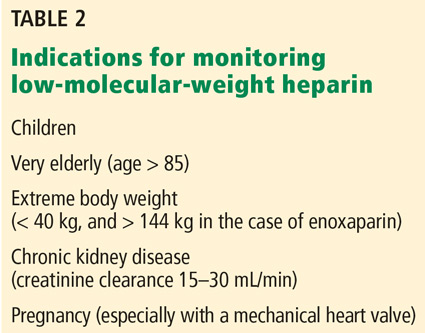
The suggested therapeutic anti-Xa levels for low-molecular-weight heparins are:
- 0.5–1.2 U/mL for twice-daily enoxaparin
- 1.0–2.0 U/mL for once-daily enoxaparin or dalteparin.
Levels should be measured at peak plasma level (ie, 3–4 hours after subcutaneous injection, except during pregnancy, when it is 4–6 hours), and only after at least 3 doses of low-molecular-weight heparin.8,71 Unlike the anti-Xa therapeutic range recommended for unfractionated heparin therapy, these ranges are not based on prospective data, and if the assay result is outside the suggested therapeutic target range, current guidelines offer no advice on safely adjusting the dose.8,71
Measuring anti-Xa activity is particularly important for pregnant women with a mechanical prosthetic heart valve who are treated with low-molecular-weight heparins. In this setting, valve thrombosis and cardioembolic events have been reported in patients with peak low-molecular-weight heparin anti-Xa assay levels below or even at the lower end of the therapeutic range, and increased bleeding risk has been reported with elevated anti-Xa levels.71–74 Measuring trough low-molecular-weight heparin anti-Xa levels has been suggested to guide dose adjustments during pregnancy.75
Clearance of low-molecular-weight heparins as measured by the anti-Xa assay is highly correlated with creatinine clearance.76,77 A strong linear correlation has been demonstrated between creatine clearance and anti-Xa levels of enoxaparin after multiple therapeutic doses, and low-molecular-weight heparins accumulate in the plasma, especially in patients with creatine clearance less than 30 mL/min.78 The risk of major bleeding is significantly increased in patients with severe renal insufficiency (creatinine clearance < 30 mL/min) not on dialysis who are treated with either prophylactic or therapeutic doses of low-molecular-weight heparin.79–81 In a meta-analysis, the risk of bleeding with therapeutic-intensity doses of enoxaparin was 4 times higher than with prophylactic-intensity doses.79 Although bleeding risk appears to be reduced when the enoxaparin dose is reduced by 50%,8 the efficacy and safety of this strategy has not been determined by prospective trials.
ANTI-Xa ASSAYS IN PATIENTS RECEIVING DIRECT ORAL ANTICOAGULANTS
Direct oral factor Xa inhibitors cannot be measured accurately by heparin anti-Xa assays. Nevertheless, such assays may be useful to assess whether clinically relevant plasma levels are present in cases of major bleeding, suspected anticoagulant failure, or patient noncompliance.82
Intense research has focused on developing drug-specific chromogenic anti-Xa assays using calibrators and standards for apixaban, edoxaban, and rivaroxaban,82,83 and good linear correlation has been shown with some assays.82,84 In patients treated with oral factor Xa inhibitors who need to undergo an urgent invasive procedure associated with high bleeding risk, use of a specific reversal agent may be considered with drug concentrations more than 30 ng/mL measured by a drug-specific anti-Xa assay. A similar suggestion has been made for drug concentrations more than 50 ng/mL in the setting of major bleeding.85 Unfortunately, such assays are not widely available at this time.82,86
While drug-specific anti-Xa assays could become clinically important to guide reversal strategies, their relevance for drug monitoring remains uncertain. This is because no therapeutic target ranges have been established for any of the direct oral anticoagulants, which were approved on the basis of favorable clinical trial outcomes that neither measured nor were correlated with specific drug levels in plasma. Therefore, a specific anti-Xa level cannot yet be used as a marker of clinical efficacy for any specific oral direct Xa inhibitor.
- Abildgaard U. Highly purified antithrombin 3 with heparin cofactor activity prepared by disc electrophoresis. Scand J Clin Lab Invest 1968; 21(1):89–91. pmid:5637480
- Rosenberg RD, Lam L. Correlation between structure and function of heparin. Proc Natl Acad Sci USA 1979; 76(3):1218–1222. pmid:286307
- Lindahl U, Bäckström G, Höök M, Thunberg L, Fransson LA, Linker A. Structure of the antithrombin-binding site of heparin. Proc Natl Acad Sci USA 1979; 76(7):3198–3202. pmid:226960
- Rosenberg RD, Rosenberg JS. Natural anticoagulant mechanisms. J Clin Invest 1984; 74(1):1–6. doi:10.1172/JCI111389
- Casu B, Oreste P, Torri G, et al. The structure of heparin oligosaccharide fragments with high anti-(factor Xa) activity containing the minimal antithrombin III-binding sequence. Chemical and 13C nuclear-magnetic-resonance studies. Biochem J 1981; 197(3):599–609. pmid:7325974
- Choay J, Lormeau JC, Petitou M, Sinaÿ P, Fareed J. Structural studies on a biologically active hexasaccharide obtained from heparin. Ann NY Acad Sci 1981; 370: 644–649. pmid:6943974
- Hirsh J, Warkentin TE, Shaughnessy SG, et al. Heparin and low-molecular-weight heparin: mechanisms of action, pharmacokinetics, dosing, monitoring, efficacy, and safety. Chest 2001; 119(suppl 1):64S–94S. pmid:11157643
- Garcia DA, Baglin TP, Weitz JI, Samama MM. Parenteral anticoagulants: antithrombotic therapy and prevention of thrombosis, 9th ed: American College of Chest Physicians Evidence-Based Clinical Practice Guidelines. Chest 2012; 141(suppl 2):e24S–e43S. doi:10.1378/chest.11-2291
- Hirsh J, Levine M. Low-molecular weight heparin. Blood 1992; 79(1):1–17. pmid:1309422
- Barritt DW, Jordan SC. Anticoagulant drugs in the treatment of pulmonary embolism. A controlled trial. Lancet 1960; 1(7138):1309–1312. pmid:13797091
- Basu D, Gallus A, Hirsh J, Cade J. A prospective study of the value of monitoring heparin treatment with the activated partial thromboplastin time. N Engl J Med 1972; 287(7):324–327. doi:10.1056/NEJM197208172870703
- Hull RD, Raskob GE, Hirsh J, et al. Continuous intravenous heparin compared with intermittent subcutaneous heparin in the initial treatment of proximal-vein thrombosis. N Engl J Med 1986; 315(18):1109–1114. doi:10.1056/NEJM198610303151801
- Hull RD, Raskob GE, Brant RF, Pineo GF, Valentine KA. Relation between the time to achieve the lower limit of the APTT therapeutic range and recurrent venous thromboembolism during heparin treatment for deep vein thrombosis. Arch Intern Med 1997; 157(22):2562–2568. pmid:9531224
- Hull RD, Raskob GE, Brant RF, Pineo GF, Valentine KA. The importance of initial heparin treatment on long-term clinical outcomes of antithrombotic therapy. The emerging theme of delayed recurrence. Arch Intern Med 1997; 157(20):2317–2321. pmid:9361572
- Anand S, Ginsberg JS, Kearon C, Gent M, Hirsh J. The relation between the activated partial thromboplastin time response and recurrence in patients with venous thrombosis treated with continuous intravenous heparin. Arch Intern Med 1996; 156(15):1677–1681. pmid:8694666
- Anand SS, Bates S, Ginsberg JS, et al. Recurrent venous thrombosis and heparin therapy: an evaluation of the importance of early activated partial thromboplastin times. Arch Intern Med 1999; 159(17):2029–2032. pmid:10510988
- Raschke RA, Reilly BM, Guidry JR, Fontana JR, Srinivas S. The weight-based heparin dosing nomogram compared with a “standard care” nomogram. A randomized controlled trial. Ann Intern Med 1993; 119(9):874–881. pmid:8214998
- Smith SB, Geske JB, Maguire JM, Zane NA, Carter RE, Morgenthaler TI. Early anticoagulation is associated with reduced mortality for acute pulmonary embolism. Chest 2010; 137(6):1382–1390. doi:10.1378/chest.09-0959
- Cruickshank MK, Levine MN, Hirsh J, Roberts R, Siguenza M. A standard heparin nomogram for the management of heparin therapy. Arch Intern Med 1991; 151(2):333–337. pmid:1789820
- Raschke RA, Gollihare B, Peirce J. The effectiveness of implementing the weight-based heparin nomogram as a practice guideline. Arch Intern Med 1996; 156(15):1645–1649. pmid:8694662
- Simko RJ, Tsung FF, Stanek EJ. Activated clotting time versus activated partial thromboplastin time for therapeutic monitoring of heparin. Ann Pharmacother 1995; 29(10):1015–1021. doi:10.1177/106002809502901012
- Langdell RD, Wagner RH, Brinkhous KM. Effect of antihemophilic factor on one-stage clotting tests; a presumptive test for hemophilia and a simple one-stage antihemophilic factor assy procedure. J Lab Clin Med 1953; 41(4):637–647.
- White GC 2nd. The partial thromboplastin time: defining an era in coagulation. J Thromb Haemost 2003; 1(11):2267–2270. pmid:14629454
- Proctor RR, Rapaport SI. The partial thromboplastin time with kaolin. A simple screening test for first stage plasma clotting factor deficiencies. Am J Clin Pathol 1961; 36:212–219. pmid:13738153
- Brandt JT, Triplett DA, Rock WA, Bovill EG, Arkin CF. Effect of lupus anticoagulants on the activated partial thromboplastin time. Results of the College of American Pathologists survey program. Arch Pathol Lab Med 1991; 115(2):109–114. pmid:1899555
- Tripodi A, Mannucci PM. Activated partial thromboplastin time (APTT). New indications for an old test? J Thromb Haemost 2006; 4(4):750–751. doi:10.1111/j.1538-7836.2006.01857.x
- Chiu HM, Hirsh J, Yung WL, Regoeczi E, Gent M. Relationship between the anticoagulant and antithrombotic effects of heparin in experimental venous thrombosis. Blood 1977; 49(2):171–184. pmid:831872
- Brill-Edwards P, Ginsberg JS, Johnston M, Hirsh J. Establishing a therapeutic range for heparin therapy. Ann Intern Med 1993; 119(2):104–109. pmid:8512158
- Vandiver JW, Vondracek TG. Antifactor Xa levels versus activated partial thromboplastin time for monitoring unfractionated heparin. Pharmacotherapy 2012; 32(6):546–558. doi:10.1002/j.1875-9114.2011.01049.x
- Newall F. Anti-factor Xa (anti-Xa). In: Monagle P, ed. Haemostasis: Methods and Protocols. New York, NY: Springer-Verlag; 2013.
- Bates SM, Weitz JI, Johnston M, Hirsh J, Ginsberg JS. Use of a fixed activated partial thromboplastin time ratio to establish a therapeutic range for unfractionated heparin. Arch Intern Med 2001; 161(3):385–391. pmid:11176764
- Levine MN, Hirsh J, Gent M, et al. A randomized trial comparing activated thromboplastin time with heparin assay in patients with acute venous thromboembolism requiring large doses of heparin. Arch Intern Med 1994; 154(1):49–56. pmid:8267489
- Wool GD, Lu CM; Education Committee of the Academy of Clinical Laboratory Physicians and Scientists. Pathology consultation on anticoagulation monitoring: factor X-related assays. Am J Clin Pathol 2013; 140(5):623–634. doi:10.1309/AJCPR3JTOK7NKDBJ
- Lehman CM, Frank EL. Laboratory monitoring of heparin therapy: partial thromboplastin time or anti-Xa assay? Lab Med 2009; 40(1):47–51. doi:10.1309/LM9NJGW2ZIOLPHY6
- Arachchillage DR, Kamani F, Deplano S, Banya W, Laffan M. Should we abandon the aPTT for monitoring unfractionated heparin? Thromb Res 2017; 157:157–161. doi:10.1016/j.thromres.2017.07.006
- Olson JD, Arkin CA, Brandt JT, et al. College of American Pathologists Conference XXXI on Laboratory Monitoring of Anticoagulant Therapy: laboratory monitoring of unfractionated heparin therapy. Arch Pathol Lab Med 1998; 122(9):782–798. pmid:9740136
- Eikelboom JW, Hirsh J. Monitoring unfractionated heparin with the aPTT: time for a fresh look. Thromb Haemost 2006; 96(5):547–552. pmid:17080209
- Young E, Prins M, Levine MN, Hirsh J. Heparin binding to plasma proteins, an important mechanism of heparin resistance. Thromb Haemost 1992; 67(6):639–643. pmid:1509402
- Edson JR, Krivit W, White JG. Kaolin partial thromboplastin time: high levels of procoagulants producing short clotting times or masking deficiencies of other procoagulants or low concentrations of anticoagulants. J Lab Clin Med 1967; 70(3):463–470. pmid:6072020
- Whitfield LR, Lele AS, Levy G. Effect of pregnancy on the relationship between concentration and anticoagulant action of heparin. Clin Pharmacol Ther 1983; 34(1):23–28. pmid:6861435
- Marci CD, Prager D. A review of the clinical indications for the plasma heparin assay. Am J Clin Pathol 1993; 99(5):546–550.
- Takemoto CM, Streiff MB, Shermock KM, et al. Activated partial thromboplastin time and anti-Xa measurements in heparin monitoring: biochemical basis of discordance. Am J Clin Pathol 2013; 139(4):450–456. doi:10.1309/AJCPS6OW6DYNOGNH
- Adatya S, Uriel N, Yarmohammadi H, et al. Anti-factor Xa and activated partial thromboplastin time measurements for heparin monitoring in mechanical circulatory support. JACC Heart Fail 2015; 3(4):314–322. doi:10.1016/j.jchf.2014.11.009
- Kuhle S, Eulmesekian P, Kavanagh B, et al. Lack of correlation between heparin dose and standard clinical monitoring tests in treatment with unfractionated heparin in critically ill children. Haematologica 2007; 92(4):554–557. pmid:17488668
- Price EA, Jin J, Nguyen HM, Krishnan G, Bowen R, Zehnder JL. Discordant aPTT and anti-Xa values and outcomes in hospitalized patients treated with intravenous unfractionated heparin. Ann Pharmacother 2013; 47(2):151–158. doi:10.1345/aph.1R635
- Baker BA, Adelman MD, Smith PA, Osborn JC. Inability of the activated partial thromboplastin time to predict heparin levels. Arch Intern Med 1997; 157(21):2475–2479. pmid:9385299
- Koerber JM, Smythe MA, Begle RL, Mattson JC, Kershaw BP, Westley SJ. Correlation of activated clotting time and activated partial thromboplastin time to plasma heparin concentration. Pharmacotherapy 1999; 19(8):922–931. pmid:10453963
- Smythe MA, Mattson JC, Koerber JM. The heparin anti-Xa therapeutic range: are we there yet? Chest 2002; 121(1):303–304. pmid:11796474
- Cuker A, Ptashkin B, Konkle A, et al. Interlaboratory agreement in the monitoring of unfractionated heparin using the anti-factor Xa-correlated activated partial thromboplastin time. J Thromb Haemost 2009; 7(1):80–86. doi:10.1111/j.1538-7836.2008.03224.x
- Taylor CT, Petros WP, Ortel TL. Two instruments to determine activated partial thromboplastin time: implications for heparin monitoring. Pharmacotherapy 1999; 19(4):383–387. pmid:10212007
- Guervil DJ, Rosenberg AF, Winterstein AG, Harris NS, Johns TE, Zumberg MS. Activated partial thromboplastin time versus antifactor Xa heparin assay in monitoring unfractionated heparin by continuous intravenous infusion. Ann Pharmacother 2011; 45(7–8):861–868. doi:10.1345/aph.1Q161
- Fruge KS, Lee YR. Comparison of unfractionated heparin protocols using antifactor Xa monitoring or activated partial thrombin time monitoring. Am J Health Syst Pharm 2015; 72(17 suppl 2):S90–S97. doi:10.2146/sp150016
- Rosborough TK. Monitoring unfractionated heparin therapy with antifactor Xa activity results in fewer monitoring tests and dosage changes than monitoring with activated partial thromboplastin time. Pharmacotherapy 1999; 19(6):760–766. pmid:10391423
- Rosborough TK, Shepherd MF. Achieving target antifactor Xa activity with a heparin protocol based on sex, age, height, and weight. Pharmacotherapy 2004; 24(6):713–719. doi:10.1592/phco.24.8.713.36067
- Smith ML, Wheeler KE. Weight-based heparin protocol using antifactor Xa monitoring. Am J Health Syst Pharm 2010; 67(5):371–374. doi:10.2146/ajhp090123
- Bartholomew JR, Kottke-Marchant K. Monitoring anticoagulation therapy in patients with the lupus anticoagulant. J Clin Rheumatol 1998; 4(6):307–312. pmid:19078327
- Wool GD, Lu CM; Education Committee of the Academy of Clinical Laboratory Physicians and Scientists. Pathology consultation on anticoagulation monitoring: factor X-related assays. Am J Clin Pathol 2013; 140(5):623–634. doi:10.1309/AJCPR3JTOK7NKDBJ
- Mehta TP, Smythe MA, Mattson JC. Strategies for managing heparin therapy in patients with antiphospholipid antibody syndrome. Pharmacotherapy 2011; 31(12):1221–1231. doi:10.1592/phco.31.12.1221
- Levine SP, Sorenson RR, Harris MA, Knieriem LK. The effect of platelet factor 4 (PF4) on assays of plasma heparin. Br J Haematol 1984; 57(4):585–596. pmid:6743573
- Fisher AR, Bailey CR, Shannon CN, Wielogorski AK. Heparin resistance after aprotinin. Lancet 1992; 340(8829):1230–1231. pmid:1279335
- Becker RC, Corrao JM, Bovill EG, et al. Intravenous nitroglycerin-induced heparin resistance: a qualitative antithrombin III abnormality. Am Heart J 1990; 119(6):1254–1261. pmid:2112878
- Monagle P, Chan AK, Goldenberg NA, et al. Antithrombotic therapy in neonates and children: Antithrombotic Therapy and Prevention of Thrombosis, 9th ed: American College of Chest Physicians Evidence-Based Clinical Practice Guidelines. Chest 2012; 141(suppl 2):e737S–e801S. doi:10.1378/chest.11-2308
- Long E, Pitfield AF, Kissoon N. Anticoagulation therapy: indications, monitoring, and complications. Pediatr Emerg Care 2011; 27(1):55–61. doi:10.1097/PEC.0b013e31820461b1
- Andrew M, Schmidt B. Use of heparin in newborn infants. Semin Thromb Hemost 1988; 14(1):28–32. doi:10.1055/s-2007-1002752
- Teien AN, Lie M, Abildgaard U. Assay of heparin in plasma using a chromogenic substrate for activated factor X. Thromb Res 1976; 8(3):413–416. pmid:1265712
- Vera-Aguillera J, Yousef H, Beltran-Melgarejo D, et al. Clinical scenarios for discordant anti-Xa. Adv Hematol 2016; 2016:4054806. doi:10.1155/2016/4054806
- Macedo KA, Tatarian P, Eugenio KR. Influence of direct oral anticoagulants on anti-factor Xa measurements utilized for monitoring heparin. Ann Pharmacother 2018; 52(2):154–159. doi:10.1177/1060028017729481
- Wendte J, Voss G, Van Overschelde B. Influence of apixaban on antifactor Xa levels in a patient with acute kidney injury. Am J Health Syst Pharm 2016; 73(8):563–567. doi:10.2146/ajhp150360
- Faust AC, Kanyer D, Wittkowsky AK. Managing transitions from oral factor Xa inhibitors to unfractionated heparin infusions. Am J Health Syst Pharm 2016; 73(24):2037–2041. doi:10.2146/ajhp150596
- Alhenc-Gelas M, Jestin-Le Guernic C, Vitoux JF, Kher A, Aiach M, Fiessinger JN. Adjusted versus fixed doses of the low-molecular-weight heparin fragmin in the treatment of deep vein thrombosis. Fragmin-Study Group. Thromb Haemost 1994; 71(6):698–702. pmid:7974334
- Bates SM, Greer IA, Middeldorp S, Veenstra DL, Prabulos AM, Vandvik PO. VTE, thrombophilia, antithrombotic therapy, and pregnancy: Antithrombotic Therapy and Prevention of Thrombosis, 9th ed: American College of Chest Physicians Evidence-Based Clinical Practice Guidelines. Chest 2012; 141(suppl 2):e691S–e736S. doi:10.1378/chest.11-2300
- Bara L, Leizorovicz A, Picolet H, Samama M. Correlation between anti-Xa and occurrence of thrombosis and haemorrhage in post-surgical patients treated with either Logiparin (LMWH) or unfractionated heparin. Post-surgery Logiparin Study Group. Thromb Res 1992; 65(4–5):641–650. pmid:1319619
- Prandoni P, Lensing AW, Büller HR, et al. Comparison of subcutaneous low-molecular-weight heparin with intravenous standard heparin in proximal deep-vein thrombosis. Lancet 1992; 339(8791):441–445. pmid:1346817
- Walenga JM, Hoppensteadt D, Fareed J. Laboratory monitoring of the clinical effects of low molecular weight heparins. Thromb Res Suppl 1991;14:49–62. pmid:1658970
- Elkayam U. Anticoagulation therapy for pregnant women with mechanical prosthetic heart valves: how to improve safety? J Am Coll Cardiol 2017; 69(22):2692–2695. doi:10.1016/j.jacc.2017.04.034
- Brophy DF, Wazny LD, Gehr TW, Comstock TJ, Venitz J. The pharmacokinetics of subcutaneous enoxaparin in end-stage renal disease. Pharmacotherapy 2001; 21(2):169–174. pmid:11213853
- Becker RC, Spencer FA, Gibson M, et al; TIMI 11A Investigators. Influence of patient characteristics and renal function on factor Xa inhibition pharmacokinetics and pharmacodynamics after enoxaparin administration in non-ST-segment elevation acute coronary syndromes. Am Heart J 2002; 143(5):753–759. pmid:12040334
- Chow SL, Zammit K, West K, Dannenhoffer M, Lopez-Candales A. Correlation of antifactor Xa concentrations with renal function in patients on enoxaparin. J Clin Pharmacol 2003; 43(6):586–590. pmid:12817521
- Lim W, Dentali F, Eikelboom JW, Crowther MA. Meta-analysis: low-molecular-weight heparin and bleeding in patients with severe renal insufficiency. Ann Intern Med 2006; 144(9):673–684. pmid:16670137
- Spinler SA, Inverso SM, Cohen M, Goodman SG, Stringer KA, Antman EM; ESSENCE and TIMI 11B Investigators. Safety and efficacy of unfractionated heparin versus enoxaparin in patients who are obese and patients with severe renal impairment: analysis from the ESSENCE and TIMI 11B studies. Am Heart J 2003; 146(1):33–41. doi:10.1016/S0002-8703(03)00121-2
- Cestac P, Bagheri H, Lapeyre-Mestre M, et al. Utilisation and safety of low molecular weight heparins: prospective observational study in medical inpatients. Drug Saf 2003; 26(3):197–207. doi:10.2165/00002018-200326030-00005
- Douxfils J, Ageno W, Samama CM, et al. Laboratory testing in patients treated with direct oral anticoagulants: a practical guide for clinicians. J Thromb Haemost 2018; 16(2):209–219. doi:10.1111/jth.13912
- Samuelson BT, Cuker A, Siegal DM, Crowther M, Garcia DA. Laboratory assessment of the anticoagulant activity of direct oral anticoagulants: a systematic review. Chest 2017; 151(1):127–138. doi:10.1016/j.chest.2016.08.1462
- Gosselin RC, Francart SJ, Hawes EM, Moll S, Dager WE, Adcock DM. Heparin-calibrated chromogenic anti-Xa activity measurements in patients receiving rivaroxaban: can this test be used to quantify drug level? Ann Pharmacother 2015; 49(7):777–783. doi:10.1177/1060028015578451
- Levy JH, Ageno W, Chan NC, Crowther M, Verhamme P, Weitz JI; Subcommittee on Control of Anticoagulation. When and how to use antidotes for the reversal of direct oral anticoagulants: guidance from the SSC of the ISTH. J Thromb Haemost 2016; 14(3):623–627. doi:10.1111/jth.13227
- Cuker A, Siegal D. Monitoring and reversal of direct oral anticoagulants. Hematology Am Soc Hematol Educ Program 2015; 2015:117–124. doi:10.1182/asheducation-2015.1.117
Should clinicians abandon the activated partial thromboplastin time (aPTT) for monitoring heparin therapy in favor of tests that measure the activity of the patient’s plasma against activated factor X (anti-Xa assays)?
Although other anticoagulants are now available for preventing and treating arterial and venous thromboembolism, unfractionated heparin—which requires laboratory monitoring of therapy—is still widely used. And this monitoring can be challenging. Despite its wide use, the aPTT lacks standardization, and the role of alternative monitoring assays such as the anti-Xa assay is not well defined.
This article reviews the advantages, limitations, and clinical applicability of anti-Xa assays for monitoring therapy with unfractionated heparin and other anticoagulants.
UNFRACTIONATED HEPARIN AND WARFARIN ARE STILL WIDELY USED
Until the mid-1990s, unfractionated heparin and oral vitamin K antagonists (eg, warfarin) were the only anticoagulants widely available for clinical use. These agents have complex pharmacokinetic and pharmacodynamic properties, resulting in highly variable dosing requirements (both between patients and in individual patients) and narrow therapeutic windows, making frequent laboratory monitoring and dose adjustments mandatory.
Over the past 3 decades, other anticoagulants have been approved, including low-molecular-weight heparins, fondaparinux, parenteral direct thrombin inhibitors, and direct oral anticoagulants. While these agents have expanded the options for preventing and treating thromboembolism, unfractionated heparin and warfarin are still the most appropriate choices for many patients, eg, those with stage 4 chronic kidney disease and end-stage renal disease on dialysis, and those with mechanical heart valves.
In addition, unfractionated heparin remains the anticoagulant of choice during procedures such as hemodialysis, percutaneous transluminal angioplasty, and cardiopulmonary bypass, as well as in hospitalized and critically ill patients, who often have acute kidney injury or require frequent interruptions of therapy for invasive procedures. In these scenarios, unfractionated heparin is typically preferred because of its short plasma half-life, complete reversibility by protamine, safety regardless of renal function, and low cost compared with parenteral direct thrombin inhibitors.
As long as unfractionated heparin and warfarin remain important therapies, the need for their laboratory monitoring continues. For warfarin monitoring, the prothrombin time and international normalized ratio are validated and widely reproducible methods. But monitoring unfractionated heparin therapy remains a challenge.
UNFRACTIONATED HEPARIN’S EFFECT IS UNPREDICTABLE
Unfractionated heparin, a negatively charged mucopolysaccharide, inhibits coagulation by binding to antithrombin through the high-affinity pentasaccharide sequence.1–6 Such binding induces a conformational change in the antithrombin molecule, converting it to a rapid inhibitor of several coagulation proteins, especially factors IIa and Xa.2–4
Unfractionated heparin inhibits factors IIa and Xa in a 1:1 ratio, but low-molecular-weight heparins inhibit factor Xa more than factor IIa, with IIa-Xa inhibition ratios ranging from 1:2 to 1:4, owing to their smaller molecular size.7
One of the most important reasons for the unpredictable and highly variable individual responses to unfractionated heparin is that, infused into the blood, the large and negatively charged unfractionated heparin molecules bind nonspecifically to positively charged plasma proteins.7 In patients who are critically ill, have acute infections or inflammatory states, or have undergone major surgery, unfractionated heparin binds to acute-phase proteins that are elevated, particularly factor VIII. This results in fewer free heparin molecules and a variable anticoagulant effect.8
In contrast, low-molecular-weight heparins have longer half-lives and bind less to plasma proteins, resulting in more predictable plasma levels following subcutaneous injection.9
MONITORING UNFRACTIONATED HEPARIN IMPROVES OUTCOMES
In 1960, Barritt and Jordan10 conducted a small but landmark trial that established the clinical importance of unfractionated heparin for treating venous thromboembolism. None of the patients who received unfractionated heparin for acute pulmonary embolism developed a recurrence during the subsequent 2 weeks, while 50% of those who did not receive it had recurrent pulmonary embolism, fatal in half of the cases.
The importance of achieving a specific aPTT therapeutic target was not demonstrated until a 1972 study by Basu et al,11 in which 162 patients with venous thromboembolism were treated with heparin with a target aPTT of 1.5 to 2.5 times the control value. Patients who suffered recurrent events had subtherapeutic aPTT values on 71% of treatment days, while the rest of the patients, with no recurrences, had subtherapeutic aPTT values only 28% of treatment days. The different outcomes could not be explained by the average daily dose of unfractionated heparin, which was similar in the patients regardless of recurrence.
Subsequent studies showed that the best outcomes occur when unfractionated heparin is given in doses high enough to rapidly achieve a therapeutic prolongation of the aPTT,12–14 and that the total daily dose is also important in preventing recurrences.15,16 Failure to achieve a target aPTT within 24 hours of starting unfractionated heparin is associated with increased risk of recurrent venous thromboembolism.13,17
Raschke et al17 found that patients prospectively randomized to weight-based doses of intravenous unfractionated heparin (bolus plus infusion) achieved significantly higher rates of therapeutic aPTT within 6 hours and 24 hours after starting the infusion, and had significantly lower rates of recurrent venous thromboembolism than those randomized to a fixed unfractionated heparin protocol, without an increase in major bleeding.
Smith et al,18 in a study of 400 consecutive patients with acute pulmonary embolism treated with unfractionated heparin, found that patients who achieved a therapeutic aPTT within 24 hours had lower in-hospital and 30-day mortality rates than those who did not achieve the first therapeutic aPTT until more than 24 hours after starting unfractionated heparin infusion.
Such data lend support to the widely accepted practice and current guideline recommendation8 of using laboratory assays to adjust the dose of unfractionated heparin to achieve and maintain a therapeutic target. The use of dosing nomograms significantly reduces the time to achieve a therapeutic aPTT while minimizing subtherapeutic and supratherapeutic unfractionated heparin levels.19,20
THE aPTT REFLECTS THROMBIN INHIBITION
The aPTT has a log-linear relationship with plasma concentrations of unfractionated heparin,21 but it was not developed specifically for monitoring unfractionated heparin therapy. Originally described in 1953 as a screening tool for hemophilia,22–24 the aPTT is prolonged in the setting of factor deficiencies (typically with levels < 45%, except for factors VII and XIII), as well as lupus anticoagulants and therapy with parenteral direct thrombin inhibitors.8,25,26
Because thrombin (factor IIa) is 10 times more sensitive than factor Xa to inhibition by the heparin-antithrombin complex,4,7 thrombin inhibition appears to be the most likely mechanism by which unfractionated heparin prolongs the aPTT. In contrast, aPTT is minimally or not at all prolonged by low-molecular-weight heparins, which are predominantly factor Xa inhibitors.7
HEPARIN ASSAYS MEASURE UNFRACTIONATED HEPARIN ACTIVITY
While the aPTT is a surrogate marker of unfractionated heparin activity in plasma, unfractionated heparin activity can be measured more precisely by so-called heparin assays, which are typically not direct measures of the plasma concentration of heparins, but rather functional assays that provide indirect estimates. They include protamine sulfate titration assays and anti-Xa assays.
Protamine sulfate titration assays measure the amount of protamine sulfate required to neutralize heparin: the more protamine required, the greater the estimated concentration of unfractionated heparin in plasma.8,27–29 Protamine titration assays are technically demanding, so they are rarely used clinically.
Anti-Xa assays provide a measure of the functional level of heparins in plasma.29–33 Chromogenic anti-Xa assays are available on automated analyzers with standardized kits29,33,34 and may be faster to perform than the aPTT.35
Experiments in rabbits show that unfractionated heparin inhibits thrombus formation and extension at concentrations of 0.2 to 0.4 U/mL as measured by the protamine titration assay,27 which correlated with an anti-Xa activity of 0.35 to 0.67 U/mL in a randomized controlled trial.32
Assays that directly measure the plasma concentration of heparin exist but are not clinically relevant because they also measure heparin molecules lacking the pentasaccharide sequence, which have no anticoagulant activity.36
ANTI-Xa ASSAY VS THE aPTT
Anti-Xa assays are more expensive than the aPTT and are not available in all hospitals. For these reasons, the aPTT remains the most commonly used laboratory assay for monitoring unfractionated heparin therapy.
However, the aPTT correlates poorly with the activity level of unfractionated heparin in plasma. In one study, an anti-Xa level of 0.3 U/mL corresponded to aPTT results ranging from 47 to 108 seconds.31 Furthermore, in studies that used a heparin therapeutic target based on an aPTT ratio 1.5 to 2.5 times the control aPTT value, the lower end of that target range was often associated with subtherapeutic plasma unfractionated heparin activity measured by anti-Xa and protamine titration assays.28,31
Because of these limitations, individual laboratories should determine their own aPTT therapeutic target ranges for unfractionated heparin based on the response curves obtained with the reagent and coagulometer used. The optimal therapeutic aPTT range for treating acute venous thromboembolism should be defined as the aPTT range (in seconds) that correlates with a plasma activity level of unfractionated heparin of 0.3 to 0.7 U/mL based on a chromogenic anti-Xa assay, or 0.2 to 0.4 U/mL based on a protamine titration assay.32,34–36
Nevertheless, the anticoagulant effect of unfractionated heparin as measured by the aPTT can be unpredictable and can vary widely among individuals and in the same patient.7 This wide variability can be explained by a number of technical and biologic variables. Different commercial aPTT reagents, different lots of the same reagent, and different reagent and instrument combinations have different sensitivities to unfractionated heparin, which can lead to variable aPTT results.37 Moreover, high plasma levels of acute-phase proteins, low plasma antithrombin levels, consumptive coagulopathies, liver failure, and lupus anticoagulants may also affect the aPTT.7,25,32,36–41 These variables account for the poor correlation—ranging from 25% to 66%—reported between aPTT and anti-Xa assays.32,42–48
Such discrepancies may have serious clinical implications: if a patient’s aPTT is low (subtherapeutic) or high (supratherapeutic) but the anti-Xa assay result is within the therapeutic range (0.3–0.7 units/mL), changing the dose of unfractionated heparin (guided by an aPTT nomogram) may increase the risk of bleeding or of recurrent thromboembolism.
CLINICAL APPLICABILITY OF THE ANTI-Xa ASSAY
Neither anti-Xa nor protamine titration assays are standardized across reference laboratories, but chromogenic anti-Xa assays have better interlaboratory correlation than the aPTT49,50 and can be calibrated specifically for unfractionated or low-molecular-weight heparins.29,33
Although reagent costs are higher for chromogenic anti-Xa assays than for the aPTT, some technical variables (described below) may partially offset the cost difference.29,33,41 In addition, unlike the aPTT, anti-Xa assays do not need local calibration; the therapeutic range for unfractionated heparin is the same (0.3–0.7 U/mL) regardless of instrument or reagent.33,41
Most important, studies have found that patients monitored by anti-Xa assay achieve significantly higher rates of therapeutic anticoagulation within 24 and 48 hours after starting unfractionated heparin infusion than those monitored by the aPTT. Fewer dose adjustments and repeat tests are required, which may also result in lower cost.32,51–55
While these studies found chromogenic anti-Xa assays better for achieving laboratory end points, data regarding relevant clinical outcomes are more limited. In a retrospective, observational cohort study,51 the rate of venous thromboembolism or bleeding-related death was 2% in patients receiving unfractionated heparin therapy monitored by anti-Xa assay and 6% in patients monitored by aPTT (P = .62). Rates of major hemorrhage were also not significantly different.
In a randomized controlled trial32 in 131 patients with acute venous thromboembolism and heparin resistance, rates of recurrent venous thromboembolism were 4.6% and 6.1% in the groups randomized to anti-Xa and aPTT monitoring, respectively, whereas overall bleeding rates were 1.5% and 6.1%, respectively. Again, the differences were not statistically significant.
Heparin resistance. Some patients require unusually high doses of unfractionated heparin to achieve a therapeutic aPTT: typically, more than 35,000 U over 24 hours,7,8,32 or total daily doses that exceed their estimated weight-based requirements. Heparin resistance has been observed in various clinical settings.7,8,32,37–40,59–61 Patients with heparin resistance monitored by anti-Xa had similar rates of recurrent venous thromboembolism while receiving significantly lower doses of unfractionated heparin than those monitored by the aPTT.32
Lupus anticoagulant. Patients with the specific antiphospholipid antibody known as lupus anticoagulant frequently have a prolonged baseline aPTT,25 making it an unreliable marker of anticoagulant effect for intravenous unfractionated heparin therapy.
Critically ill infants and children. Arachchillage et al35 found that infants (< 1 year old) treated with intravenous unfractionated heparin in an intensive care department had only a 32.4% correlation between aPTT and anti-Xa levels, which was lower than that found in children ages 1 to 15 (66%) and adults (52%). In two-thirds of cases of discordant aPTT and anti-Xa levels, the aPTT was elevated (supratherapeutic) while the anti-Xa assay was within the therapeutic range (0.3–0.7 U/mL). Despite the lack of data on clinical outcomes (eg, rates of thrombosis and bleeding) with the use of an anti-Xa assay, it has been considered the method of choice for unfractionated heparin monitoring in critically ill children, and especially in those under age 1.41,44,62–64
While anti-Xa assays may also be better for unfractionated heparin monitoring in critically ill adults, the lack of clinical outcome data from large-scale randomized trials has precluded evidence-based recommendations favoring them over the aPTT.8,34
LIMITATIONS OF ANTI-Xa ASSAYS
Anti-Xa assays are hampered by some technical limitations:
Samples must be processed within 1 hour to avoid heparin neutralization.34
Samples must be clear. Hemolyzed or opaque samples (eg, due to bilirubin levels > 6.6 mg/dL or triglyceride levels > 360 mg/dL) cannot be processed, as they can cause falsely low levels.
Exposure to other anticoagulants can interfere with the results. The anti-Xa assay may be unreliable for unfractionated heparin monitoring in patients who are transitioned from low-molecular-weight heparins, fondaparinux, or an oral factor Xa inhibitor (apixaban, betrixaban, edoxaban, rivaroxaban) to intravenous unfractionated heparin, eg, due to hospitalization or acute kidney injury.65,66 Different reports have found that anti-Xa assays may be elevated for as long as 63 to 96 hours after the last dose of oral Xa inhibitors,67–69 potentially resulting in underdosing of unfractionated heparin. In such settings, unfractionated heparin therapy should be monitored by the aPTT.
ANTI-Xa ASSAYS AND LOW-MOLECULAR-WEIGHT HEPARINS
Most patients receiving low-molecular-weight heparins do not need laboratory monitoring.8 Alhenc-Gelas et al70 randomized patients to receive dalteparin in doses either based on weight or guided by anti-Xa assay results, and found that dose adjustments were rare and lacked clinical benefit.
The suggested therapeutic anti-Xa levels for low-molecular-weight heparins are:
- 0.5–1.2 U/mL for twice-daily enoxaparin
- 1.0–2.0 U/mL for once-daily enoxaparin or dalteparin.
Levels should be measured at peak plasma level (ie, 3–4 hours after subcutaneous injection, except during pregnancy, when it is 4–6 hours), and only after at least 3 doses of low-molecular-weight heparin.8,71 Unlike the anti-Xa therapeutic range recommended for unfractionated heparin therapy, these ranges are not based on prospective data, and if the assay result is outside the suggested therapeutic target range, current guidelines offer no advice on safely adjusting the dose.8,71
Measuring anti-Xa activity is particularly important for pregnant women with a mechanical prosthetic heart valve who are treated with low-molecular-weight heparins. In this setting, valve thrombosis and cardioembolic events have been reported in patients with peak low-molecular-weight heparin anti-Xa assay levels below or even at the lower end of the therapeutic range, and increased bleeding risk has been reported with elevated anti-Xa levels.71–74 Measuring trough low-molecular-weight heparin anti-Xa levels has been suggested to guide dose adjustments during pregnancy.75
Clearance of low-molecular-weight heparins as measured by the anti-Xa assay is highly correlated with creatinine clearance.76,77 A strong linear correlation has been demonstrated between creatine clearance and anti-Xa levels of enoxaparin after multiple therapeutic doses, and low-molecular-weight heparins accumulate in the plasma, especially in patients with creatine clearance less than 30 mL/min.78 The risk of major bleeding is significantly increased in patients with severe renal insufficiency (creatinine clearance < 30 mL/min) not on dialysis who are treated with either prophylactic or therapeutic doses of low-molecular-weight heparin.79–81 In a meta-analysis, the risk of bleeding with therapeutic-intensity doses of enoxaparin was 4 times higher than with prophylactic-intensity doses.79 Although bleeding risk appears to be reduced when the enoxaparin dose is reduced by 50%,8 the efficacy and safety of this strategy has not been determined by prospective trials.
ANTI-Xa ASSAYS IN PATIENTS RECEIVING DIRECT ORAL ANTICOAGULANTS
Direct oral factor Xa inhibitors cannot be measured accurately by heparin anti-Xa assays. Nevertheless, such assays may be useful to assess whether clinically relevant plasma levels are present in cases of major bleeding, suspected anticoagulant failure, or patient noncompliance.82
Intense research has focused on developing drug-specific chromogenic anti-Xa assays using calibrators and standards for apixaban, edoxaban, and rivaroxaban,82,83 and good linear correlation has been shown with some assays.82,84 In patients treated with oral factor Xa inhibitors who need to undergo an urgent invasive procedure associated with high bleeding risk, use of a specific reversal agent may be considered with drug concentrations more than 30 ng/mL measured by a drug-specific anti-Xa assay. A similar suggestion has been made for drug concentrations more than 50 ng/mL in the setting of major bleeding.85 Unfortunately, such assays are not widely available at this time.82,86
While drug-specific anti-Xa assays could become clinically important to guide reversal strategies, their relevance for drug monitoring remains uncertain. This is because no therapeutic target ranges have been established for any of the direct oral anticoagulants, which were approved on the basis of favorable clinical trial outcomes that neither measured nor were correlated with specific drug levels in plasma. Therefore, a specific anti-Xa level cannot yet be used as a marker of clinical efficacy for any specific oral direct Xa inhibitor.
Should clinicians abandon the activated partial thromboplastin time (aPTT) for monitoring heparin therapy in favor of tests that measure the activity of the patient’s plasma against activated factor X (anti-Xa assays)?
Although other anticoagulants are now available for preventing and treating arterial and venous thromboembolism, unfractionated heparin—which requires laboratory monitoring of therapy—is still widely used. And this monitoring can be challenging. Despite its wide use, the aPTT lacks standardization, and the role of alternative monitoring assays such as the anti-Xa assay is not well defined.
This article reviews the advantages, limitations, and clinical applicability of anti-Xa assays for monitoring therapy with unfractionated heparin and other anticoagulants.
UNFRACTIONATED HEPARIN AND WARFARIN ARE STILL WIDELY USED
Until the mid-1990s, unfractionated heparin and oral vitamin K antagonists (eg, warfarin) were the only anticoagulants widely available for clinical use. These agents have complex pharmacokinetic and pharmacodynamic properties, resulting in highly variable dosing requirements (both between patients and in individual patients) and narrow therapeutic windows, making frequent laboratory monitoring and dose adjustments mandatory.
Over the past 3 decades, other anticoagulants have been approved, including low-molecular-weight heparins, fondaparinux, parenteral direct thrombin inhibitors, and direct oral anticoagulants. While these agents have expanded the options for preventing and treating thromboembolism, unfractionated heparin and warfarin are still the most appropriate choices for many patients, eg, those with stage 4 chronic kidney disease and end-stage renal disease on dialysis, and those with mechanical heart valves.
In addition, unfractionated heparin remains the anticoagulant of choice during procedures such as hemodialysis, percutaneous transluminal angioplasty, and cardiopulmonary bypass, as well as in hospitalized and critically ill patients, who often have acute kidney injury or require frequent interruptions of therapy for invasive procedures. In these scenarios, unfractionated heparin is typically preferred because of its short plasma half-life, complete reversibility by protamine, safety regardless of renal function, and low cost compared with parenteral direct thrombin inhibitors.
As long as unfractionated heparin and warfarin remain important therapies, the need for their laboratory monitoring continues. For warfarin monitoring, the prothrombin time and international normalized ratio are validated and widely reproducible methods. But monitoring unfractionated heparin therapy remains a challenge.
UNFRACTIONATED HEPARIN’S EFFECT IS UNPREDICTABLE
Unfractionated heparin, a negatively charged mucopolysaccharide, inhibits coagulation by binding to antithrombin through the high-affinity pentasaccharide sequence.1–6 Such binding induces a conformational change in the antithrombin molecule, converting it to a rapid inhibitor of several coagulation proteins, especially factors IIa and Xa.2–4
Unfractionated heparin inhibits factors IIa and Xa in a 1:1 ratio, but low-molecular-weight heparins inhibit factor Xa more than factor IIa, with IIa-Xa inhibition ratios ranging from 1:2 to 1:4, owing to their smaller molecular size.7
One of the most important reasons for the unpredictable and highly variable individual responses to unfractionated heparin is that, infused into the blood, the large and negatively charged unfractionated heparin molecules bind nonspecifically to positively charged plasma proteins.7 In patients who are critically ill, have acute infections or inflammatory states, or have undergone major surgery, unfractionated heparin binds to acute-phase proteins that are elevated, particularly factor VIII. This results in fewer free heparin molecules and a variable anticoagulant effect.8
In contrast, low-molecular-weight heparins have longer half-lives and bind less to plasma proteins, resulting in more predictable plasma levels following subcutaneous injection.9
MONITORING UNFRACTIONATED HEPARIN IMPROVES OUTCOMES
In 1960, Barritt and Jordan10 conducted a small but landmark trial that established the clinical importance of unfractionated heparin for treating venous thromboembolism. None of the patients who received unfractionated heparin for acute pulmonary embolism developed a recurrence during the subsequent 2 weeks, while 50% of those who did not receive it had recurrent pulmonary embolism, fatal in half of the cases.
The importance of achieving a specific aPTT therapeutic target was not demonstrated until a 1972 study by Basu et al,11 in which 162 patients with venous thromboembolism were treated with heparin with a target aPTT of 1.5 to 2.5 times the control value. Patients who suffered recurrent events had subtherapeutic aPTT values on 71% of treatment days, while the rest of the patients, with no recurrences, had subtherapeutic aPTT values only 28% of treatment days. The different outcomes could not be explained by the average daily dose of unfractionated heparin, which was similar in the patients regardless of recurrence.
Subsequent studies showed that the best outcomes occur when unfractionated heparin is given in doses high enough to rapidly achieve a therapeutic prolongation of the aPTT,12–14 and that the total daily dose is also important in preventing recurrences.15,16 Failure to achieve a target aPTT within 24 hours of starting unfractionated heparin is associated with increased risk of recurrent venous thromboembolism.13,17
Raschke et al17 found that patients prospectively randomized to weight-based doses of intravenous unfractionated heparin (bolus plus infusion) achieved significantly higher rates of therapeutic aPTT within 6 hours and 24 hours after starting the infusion, and had significantly lower rates of recurrent venous thromboembolism than those randomized to a fixed unfractionated heparin protocol, without an increase in major bleeding.
Smith et al,18 in a study of 400 consecutive patients with acute pulmonary embolism treated with unfractionated heparin, found that patients who achieved a therapeutic aPTT within 24 hours had lower in-hospital and 30-day mortality rates than those who did not achieve the first therapeutic aPTT until more than 24 hours after starting unfractionated heparin infusion.
Such data lend support to the widely accepted practice and current guideline recommendation8 of using laboratory assays to adjust the dose of unfractionated heparin to achieve and maintain a therapeutic target. The use of dosing nomograms significantly reduces the time to achieve a therapeutic aPTT while minimizing subtherapeutic and supratherapeutic unfractionated heparin levels.19,20
THE aPTT REFLECTS THROMBIN INHIBITION
The aPTT has a log-linear relationship with plasma concentrations of unfractionated heparin,21 but it was not developed specifically for monitoring unfractionated heparin therapy. Originally described in 1953 as a screening tool for hemophilia,22–24 the aPTT is prolonged in the setting of factor deficiencies (typically with levels < 45%, except for factors VII and XIII), as well as lupus anticoagulants and therapy with parenteral direct thrombin inhibitors.8,25,26
Because thrombin (factor IIa) is 10 times more sensitive than factor Xa to inhibition by the heparin-antithrombin complex,4,7 thrombin inhibition appears to be the most likely mechanism by which unfractionated heparin prolongs the aPTT. In contrast, aPTT is minimally or not at all prolonged by low-molecular-weight heparins, which are predominantly factor Xa inhibitors.7
HEPARIN ASSAYS MEASURE UNFRACTIONATED HEPARIN ACTIVITY
While the aPTT is a surrogate marker of unfractionated heparin activity in plasma, unfractionated heparin activity can be measured more precisely by so-called heparin assays, which are typically not direct measures of the plasma concentration of heparins, but rather functional assays that provide indirect estimates. They include protamine sulfate titration assays and anti-Xa assays.
Protamine sulfate titration assays measure the amount of protamine sulfate required to neutralize heparin: the more protamine required, the greater the estimated concentration of unfractionated heparin in plasma.8,27–29 Protamine titration assays are technically demanding, so they are rarely used clinically.
Anti-Xa assays provide a measure of the functional level of heparins in plasma.29–33 Chromogenic anti-Xa assays are available on automated analyzers with standardized kits29,33,34 and may be faster to perform than the aPTT.35
Experiments in rabbits show that unfractionated heparin inhibits thrombus formation and extension at concentrations of 0.2 to 0.4 U/mL as measured by the protamine titration assay,27 which correlated with an anti-Xa activity of 0.35 to 0.67 U/mL in a randomized controlled trial.32
Assays that directly measure the plasma concentration of heparin exist but are not clinically relevant because they also measure heparin molecules lacking the pentasaccharide sequence, which have no anticoagulant activity.36
ANTI-Xa ASSAY VS THE aPTT
Anti-Xa assays are more expensive than the aPTT and are not available in all hospitals. For these reasons, the aPTT remains the most commonly used laboratory assay for monitoring unfractionated heparin therapy.
However, the aPTT correlates poorly with the activity level of unfractionated heparin in plasma. In one study, an anti-Xa level of 0.3 U/mL corresponded to aPTT results ranging from 47 to 108 seconds.31 Furthermore, in studies that used a heparin therapeutic target based on an aPTT ratio 1.5 to 2.5 times the control aPTT value, the lower end of that target range was often associated with subtherapeutic plasma unfractionated heparin activity measured by anti-Xa and protamine titration assays.28,31
Because of these limitations, individual laboratories should determine their own aPTT therapeutic target ranges for unfractionated heparin based on the response curves obtained with the reagent and coagulometer used. The optimal therapeutic aPTT range for treating acute venous thromboembolism should be defined as the aPTT range (in seconds) that correlates with a plasma activity level of unfractionated heparin of 0.3 to 0.7 U/mL based on a chromogenic anti-Xa assay, or 0.2 to 0.4 U/mL based on a protamine titration assay.32,34–36
Nevertheless, the anticoagulant effect of unfractionated heparin as measured by the aPTT can be unpredictable and can vary widely among individuals and in the same patient.7 This wide variability can be explained by a number of technical and biologic variables. Different commercial aPTT reagents, different lots of the same reagent, and different reagent and instrument combinations have different sensitivities to unfractionated heparin, which can lead to variable aPTT results.37 Moreover, high plasma levels of acute-phase proteins, low plasma antithrombin levels, consumptive coagulopathies, liver failure, and lupus anticoagulants may also affect the aPTT.7,25,32,36–41 These variables account for the poor correlation—ranging from 25% to 66%—reported between aPTT and anti-Xa assays.32,42–48
Such discrepancies may have serious clinical implications: if a patient’s aPTT is low (subtherapeutic) or high (supratherapeutic) but the anti-Xa assay result is within the therapeutic range (0.3–0.7 units/mL), changing the dose of unfractionated heparin (guided by an aPTT nomogram) may increase the risk of bleeding or of recurrent thromboembolism.
CLINICAL APPLICABILITY OF THE ANTI-Xa ASSAY
Neither anti-Xa nor protamine titration assays are standardized across reference laboratories, but chromogenic anti-Xa assays have better interlaboratory correlation than the aPTT49,50 and can be calibrated specifically for unfractionated or low-molecular-weight heparins.29,33
Although reagent costs are higher for chromogenic anti-Xa assays than for the aPTT, some technical variables (described below) may partially offset the cost difference.29,33,41 In addition, unlike the aPTT, anti-Xa assays do not need local calibration; the therapeutic range for unfractionated heparin is the same (0.3–0.7 U/mL) regardless of instrument or reagent.33,41
Most important, studies have found that patients monitored by anti-Xa assay achieve significantly higher rates of therapeutic anticoagulation within 24 and 48 hours after starting unfractionated heparin infusion than those monitored by the aPTT. Fewer dose adjustments and repeat tests are required, which may also result in lower cost.32,51–55
While these studies found chromogenic anti-Xa assays better for achieving laboratory end points, data regarding relevant clinical outcomes are more limited. In a retrospective, observational cohort study,51 the rate of venous thromboembolism or bleeding-related death was 2% in patients receiving unfractionated heparin therapy monitored by anti-Xa assay and 6% in patients monitored by aPTT (P = .62). Rates of major hemorrhage were also not significantly different.
In a randomized controlled trial32 in 131 patients with acute venous thromboembolism and heparin resistance, rates of recurrent venous thromboembolism were 4.6% and 6.1% in the groups randomized to anti-Xa and aPTT monitoring, respectively, whereas overall bleeding rates were 1.5% and 6.1%, respectively. Again, the differences were not statistically significant.
Heparin resistance. Some patients require unusually high doses of unfractionated heparin to achieve a therapeutic aPTT: typically, more than 35,000 U over 24 hours,7,8,32 or total daily doses that exceed their estimated weight-based requirements. Heparin resistance has been observed in various clinical settings.7,8,32,37–40,59–61 Patients with heparin resistance monitored by anti-Xa had similar rates of recurrent venous thromboembolism while receiving significantly lower doses of unfractionated heparin than those monitored by the aPTT.32
Lupus anticoagulant. Patients with the specific antiphospholipid antibody known as lupus anticoagulant frequently have a prolonged baseline aPTT,25 making it an unreliable marker of anticoagulant effect for intravenous unfractionated heparin therapy.
Critically ill infants and children. Arachchillage et al35 found that infants (< 1 year old) treated with intravenous unfractionated heparin in an intensive care department had only a 32.4% correlation between aPTT and anti-Xa levels, which was lower than that found in children ages 1 to 15 (66%) and adults (52%). In two-thirds of cases of discordant aPTT and anti-Xa levels, the aPTT was elevated (supratherapeutic) while the anti-Xa assay was within the therapeutic range (0.3–0.7 U/mL). Despite the lack of data on clinical outcomes (eg, rates of thrombosis and bleeding) with the use of an anti-Xa assay, it has been considered the method of choice for unfractionated heparin monitoring in critically ill children, and especially in those under age 1.41,44,62–64
While anti-Xa assays may also be better for unfractionated heparin monitoring in critically ill adults, the lack of clinical outcome data from large-scale randomized trials has precluded evidence-based recommendations favoring them over the aPTT.8,34
LIMITATIONS OF ANTI-Xa ASSAYS
Anti-Xa assays are hampered by some technical limitations:
Samples must be processed within 1 hour to avoid heparin neutralization.34
Samples must be clear. Hemolyzed or opaque samples (eg, due to bilirubin levels > 6.6 mg/dL or triglyceride levels > 360 mg/dL) cannot be processed, as they can cause falsely low levels.
Exposure to other anticoagulants can interfere with the results. The anti-Xa assay may be unreliable for unfractionated heparin monitoring in patients who are transitioned from low-molecular-weight heparins, fondaparinux, or an oral factor Xa inhibitor (apixaban, betrixaban, edoxaban, rivaroxaban) to intravenous unfractionated heparin, eg, due to hospitalization or acute kidney injury.65,66 Different reports have found that anti-Xa assays may be elevated for as long as 63 to 96 hours after the last dose of oral Xa inhibitors,67–69 potentially resulting in underdosing of unfractionated heparin. In such settings, unfractionated heparin therapy should be monitored by the aPTT.
ANTI-Xa ASSAYS AND LOW-MOLECULAR-WEIGHT HEPARINS
Most patients receiving low-molecular-weight heparins do not need laboratory monitoring.8 Alhenc-Gelas et al70 randomized patients to receive dalteparin in doses either based on weight or guided by anti-Xa assay results, and found that dose adjustments were rare and lacked clinical benefit.
The suggested therapeutic anti-Xa levels for low-molecular-weight heparins are:
- 0.5–1.2 U/mL for twice-daily enoxaparin
- 1.0–2.0 U/mL for once-daily enoxaparin or dalteparin.
Levels should be measured at peak plasma level (ie, 3–4 hours after subcutaneous injection, except during pregnancy, when it is 4–6 hours), and only after at least 3 doses of low-molecular-weight heparin.8,71 Unlike the anti-Xa therapeutic range recommended for unfractionated heparin therapy, these ranges are not based on prospective data, and if the assay result is outside the suggested therapeutic target range, current guidelines offer no advice on safely adjusting the dose.8,71
Measuring anti-Xa activity is particularly important for pregnant women with a mechanical prosthetic heart valve who are treated with low-molecular-weight heparins. In this setting, valve thrombosis and cardioembolic events have been reported in patients with peak low-molecular-weight heparin anti-Xa assay levels below or even at the lower end of the therapeutic range, and increased bleeding risk has been reported with elevated anti-Xa levels.71–74 Measuring trough low-molecular-weight heparin anti-Xa levels has been suggested to guide dose adjustments during pregnancy.75
Clearance of low-molecular-weight heparins as measured by the anti-Xa assay is highly correlated with creatinine clearance.76,77 A strong linear correlation has been demonstrated between creatine clearance and anti-Xa levels of enoxaparin after multiple therapeutic doses, and low-molecular-weight heparins accumulate in the plasma, especially in patients with creatine clearance less than 30 mL/min.78 The risk of major bleeding is significantly increased in patients with severe renal insufficiency (creatinine clearance < 30 mL/min) not on dialysis who are treated with either prophylactic or therapeutic doses of low-molecular-weight heparin.79–81 In a meta-analysis, the risk of bleeding with therapeutic-intensity doses of enoxaparin was 4 times higher than with prophylactic-intensity doses.79 Although bleeding risk appears to be reduced when the enoxaparin dose is reduced by 50%,8 the efficacy and safety of this strategy has not been determined by prospective trials.
ANTI-Xa ASSAYS IN PATIENTS RECEIVING DIRECT ORAL ANTICOAGULANTS
Direct oral factor Xa inhibitors cannot be measured accurately by heparin anti-Xa assays. Nevertheless, such assays may be useful to assess whether clinically relevant plasma levels are present in cases of major bleeding, suspected anticoagulant failure, or patient noncompliance.82
Intense research has focused on developing drug-specific chromogenic anti-Xa assays using calibrators and standards for apixaban, edoxaban, and rivaroxaban,82,83 and good linear correlation has been shown with some assays.82,84 In patients treated with oral factor Xa inhibitors who need to undergo an urgent invasive procedure associated with high bleeding risk, use of a specific reversal agent may be considered with drug concentrations more than 30 ng/mL measured by a drug-specific anti-Xa assay. A similar suggestion has been made for drug concentrations more than 50 ng/mL in the setting of major bleeding.85 Unfortunately, such assays are not widely available at this time.82,86
While drug-specific anti-Xa assays could become clinically important to guide reversal strategies, their relevance for drug monitoring remains uncertain. This is because no therapeutic target ranges have been established for any of the direct oral anticoagulants, which were approved on the basis of favorable clinical trial outcomes that neither measured nor were correlated with specific drug levels in plasma. Therefore, a specific anti-Xa level cannot yet be used as a marker of clinical efficacy for any specific oral direct Xa inhibitor.
- Abildgaard U. Highly purified antithrombin 3 with heparin cofactor activity prepared by disc electrophoresis. Scand J Clin Lab Invest 1968; 21(1):89–91. pmid:5637480
- Rosenberg RD, Lam L. Correlation between structure and function of heparin. Proc Natl Acad Sci USA 1979; 76(3):1218–1222. pmid:286307
- Lindahl U, Bäckström G, Höök M, Thunberg L, Fransson LA, Linker A. Structure of the antithrombin-binding site of heparin. Proc Natl Acad Sci USA 1979; 76(7):3198–3202. pmid:226960
- Rosenberg RD, Rosenberg JS. Natural anticoagulant mechanisms. J Clin Invest 1984; 74(1):1–6. doi:10.1172/JCI111389
- Casu B, Oreste P, Torri G, et al. The structure of heparin oligosaccharide fragments with high anti-(factor Xa) activity containing the minimal antithrombin III-binding sequence. Chemical and 13C nuclear-magnetic-resonance studies. Biochem J 1981; 197(3):599–609. pmid:7325974
- Choay J, Lormeau JC, Petitou M, Sinaÿ P, Fareed J. Structural studies on a biologically active hexasaccharide obtained from heparin. Ann NY Acad Sci 1981; 370: 644–649. pmid:6943974
- Hirsh J, Warkentin TE, Shaughnessy SG, et al. Heparin and low-molecular-weight heparin: mechanisms of action, pharmacokinetics, dosing, monitoring, efficacy, and safety. Chest 2001; 119(suppl 1):64S–94S. pmid:11157643
- Garcia DA, Baglin TP, Weitz JI, Samama MM. Parenteral anticoagulants: antithrombotic therapy and prevention of thrombosis, 9th ed: American College of Chest Physicians Evidence-Based Clinical Practice Guidelines. Chest 2012; 141(suppl 2):e24S–e43S. doi:10.1378/chest.11-2291
- Hirsh J, Levine M. Low-molecular weight heparin. Blood 1992; 79(1):1–17. pmid:1309422
- Barritt DW, Jordan SC. Anticoagulant drugs in the treatment of pulmonary embolism. A controlled trial. Lancet 1960; 1(7138):1309–1312. pmid:13797091
- Basu D, Gallus A, Hirsh J, Cade J. A prospective study of the value of monitoring heparin treatment with the activated partial thromboplastin time. N Engl J Med 1972; 287(7):324–327. doi:10.1056/NEJM197208172870703
- Hull RD, Raskob GE, Hirsh J, et al. Continuous intravenous heparin compared with intermittent subcutaneous heparin in the initial treatment of proximal-vein thrombosis. N Engl J Med 1986; 315(18):1109–1114. doi:10.1056/NEJM198610303151801
- Hull RD, Raskob GE, Brant RF, Pineo GF, Valentine KA. Relation between the time to achieve the lower limit of the APTT therapeutic range and recurrent venous thromboembolism during heparin treatment for deep vein thrombosis. Arch Intern Med 1997; 157(22):2562–2568. pmid:9531224
- Hull RD, Raskob GE, Brant RF, Pineo GF, Valentine KA. The importance of initial heparin treatment on long-term clinical outcomes of antithrombotic therapy. The emerging theme of delayed recurrence. Arch Intern Med 1997; 157(20):2317–2321. pmid:9361572
- Anand S, Ginsberg JS, Kearon C, Gent M, Hirsh J. The relation between the activated partial thromboplastin time response and recurrence in patients with venous thrombosis treated with continuous intravenous heparin. Arch Intern Med 1996; 156(15):1677–1681. pmid:8694666
- Anand SS, Bates S, Ginsberg JS, et al. Recurrent venous thrombosis and heparin therapy: an evaluation of the importance of early activated partial thromboplastin times. Arch Intern Med 1999; 159(17):2029–2032. pmid:10510988
- Raschke RA, Reilly BM, Guidry JR, Fontana JR, Srinivas S. The weight-based heparin dosing nomogram compared with a “standard care” nomogram. A randomized controlled trial. Ann Intern Med 1993; 119(9):874–881. pmid:8214998
- Smith SB, Geske JB, Maguire JM, Zane NA, Carter RE, Morgenthaler TI. Early anticoagulation is associated with reduced mortality for acute pulmonary embolism. Chest 2010; 137(6):1382–1390. doi:10.1378/chest.09-0959
- Cruickshank MK, Levine MN, Hirsh J, Roberts R, Siguenza M. A standard heparin nomogram for the management of heparin therapy. Arch Intern Med 1991; 151(2):333–337. pmid:1789820
- Raschke RA, Gollihare B, Peirce J. The effectiveness of implementing the weight-based heparin nomogram as a practice guideline. Arch Intern Med 1996; 156(15):1645–1649. pmid:8694662
- Simko RJ, Tsung FF, Stanek EJ. Activated clotting time versus activated partial thromboplastin time for therapeutic monitoring of heparin. Ann Pharmacother 1995; 29(10):1015–1021. doi:10.1177/106002809502901012
- Langdell RD, Wagner RH, Brinkhous KM. Effect of antihemophilic factor on one-stage clotting tests; a presumptive test for hemophilia and a simple one-stage antihemophilic factor assy procedure. J Lab Clin Med 1953; 41(4):637–647.
- White GC 2nd. The partial thromboplastin time: defining an era in coagulation. J Thromb Haemost 2003; 1(11):2267–2270. pmid:14629454
- Proctor RR, Rapaport SI. The partial thromboplastin time with kaolin. A simple screening test for first stage plasma clotting factor deficiencies. Am J Clin Pathol 1961; 36:212–219. pmid:13738153
- Brandt JT, Triplett DA, Rock WA, Bovill EG, Arkin CF. Effect of lupus anticoagulants on the activated partial thromboplastin time. Results of the College of American Pathologists survey program. Arch Pathol Lab Med 1991; 115(2):109–114. pmid:1899555
- Tripodi A, Mannucci PM. Activated partial thromboplastin time (APTT). New indications for an old test? J Thromb Haemost 2006; 4(4):750–751. doi:10.1111/j.1538-7836.2006.01857.x
- Chiu HM, Hirsh J, Yung WL, Regoeczi E, Gent M. Relationship between the anticoagulant and antithrombotic effects of heparin in experimental venous thrombosis. Blood 1977; 49(2):171–184. pmid:831872
- Brill-Edwards P, Ginsberg JS, Johnston M, Hirsh J. Establishing a therapeutic range for heparin therapy. Ann Intern Med 1993; 119(2):104–109. pmid:8512158
- Vandiver JW, Vondracek TG. Antifactor Xa levels versus activated partial thromboplastin time for monitoring unfractionated heparin. Pharmacotherapy 2012; 32(6):546–558. doi:10.1002/j.1875-9114.2011.01049.x
- Newall F. Anti-factor Xa (anti-Xa). In: Monagle P, ed. Haemostasis: Methods and Protocols. New York, NY: Springer-Verlag; 2013.
- Bates SM, Weitz JI, Johnston M, Hirsh J, Ginsberg JS. Use of a fixed activated partial thromboplastin time ratio to establish a therapeutic range for unfractionated heparin. Arch Intern Med 2001; 161(3):385–391. pmid:11176764
- Levine MN, Hirsh J, Gent M, et al. A randomized trial comparing activated thromboplastin time with heparin assay in patients with acute venous thromboembolism requiring large doses of heparin. Arch Intern Med 1994; 154(1):49–56. pmid:8267489
- Wool GD, Lu CM; Education Committee of the Academy of Clinical Laboratory Physicians and Scientists. Pathology consultation on anticoagulation monitoring: factor X-related assays. Am J Clin Pathol 2013; 140(5):623–634. doi:10.1309/AJCPR3JTOK7NKDBJ
- Lehman CM, Frank EL. Laboratory monitoring of heparin therapy: partial thromboplastin time or anti-Xa assay? Lab Med 2009; 40(1):47–51. doi:10.1309/LM9NJGW2ZIOLPHY6
- Arachchillage DR, Kamani F, Deplano S, Banya W, Laffan M. Should we abandon the aPTT for monitoring unfractionated heparin? Thromb Res 2017; 157:157–161. doi:10.1016/j.thromres.2017.07.006
- Olson JD, Arkin CA, Brandt JT, et al. College of American Pathologists Conference XXXI on Laboratory Monitoring of Anticoagulant Therapy: laboratory monitoring of unfractionated heparin therapy. Arch Pathol Lab Med 1998; 122(9):782–798. pmid:9740136
- Eikelboom JW, Hirsh J. Monitoring unfractionated heparin with the aPTT: time for a fresh look. Thromb Haemost 2006; 96(5):547–552. pmid:17080209
- Young E, Prins M, Levine MN, Hirsh J. Heparin binding to plasma proteins, an important mechanism of heparin resistance. Thromb Haemost 1992; 67(6):639–643. pmid:1509402
- Edson JR, Krivit W, White JG. Kaolin partial thromboplastin time: high levels of procoagulants producing short clotting times or masking deficiencies of other procoagulants or low concentrations of anticoagulants. J Lab Clin Med 1967; 70(3):463–470. pmid:6072020
- Whitfield LR, Lele AS, Levy G. Effect of pregnancy on the relationship between concentration and anticoagulant action of heparin. Clin Pharmacol Ther 1983; 34(1):23–28. pmid:6861435
- Marci CD, Prager D. A review of the clinical indications for the plasma heparin assay. Am J Clin Pathol 1993; 99(5):546–550.
- Takemoto CM, Streiff MB, Shermock KM, et al. Activated partial thromboplastin time and anti-Xa measurements in heparin monitoring: biochemical basis of discordance. Am J Clin Pathol 2013; 139(4):450–456. doi:10.1309/AJCPS6OW6DYNOGNH
- Adatya S, Uriel N, Yarmohammadi H, et al. Anti-factor Xa and activated partial thromboplastin time measurements for heparin monitoring in mechanical circulatory support. JACC Heart Fail 2015; 3(4):314–322. doi:10.1016/j.jchf.2014.11.009
- Kuhle S, Eulmesekian P, Kavanagh B, et al. Lack of correlation between heparin dose and standard clinical monitoring tests in treatment with unfractionated heparin in critically ill children. Haematologica 2007; 92(4):554–557. pmid:17488668
- Price EA, Jin J, Nguyen HM, Krishnan G, Bowen R, Zehnder JL. Discordant aPTT and anti-Xa values and outcomes in hospitalized patients treated with intravenous unfractionated heparin. Ann Pharmacother 2013; 47(2):151–158. doi:10.1345/aph.1R635
- Baker BA, Adelman MD, Smith PA, Osborn JC. Inability of the activated partial thromboplastin time to predict heparin levels. Arch Intern Med 1997; 157(21):2475–2479. pmid:9385299
- Koerber JM, Smythe MA, Begle RL, Mattson JC, Kershaw BP, Westley SJ. Correlation of activated clotting time and activated partial thromboplastin time to plasma heparin concentration. Pharmacotherapy 1999; 19(8):922–931. pmid:10453963
- Smythe MA, Mattson JC, Koerber JM. The heparin anti-Xa therapeutic range: are we there yet? Chest 2002; 121(1):303–304. pmid:11796474
- Cuker A, Ptashkin B, Konkle A, et al. Interlaboratory agreement in the monitoring of unfractionated heparin using the anti-factor Xa-correlated activated partial thromboplastin time. J Thromb Haemost 2009; 7(1):80–86. doi:10.1111/j.1538-7836.2008.03224.x
- Taylor CT, Petros WP, Ortel TL. Two instruments to determine activated partial thromboplastin time: implications for heparin monitoring. Pharmacotherapy 1999; 19(4):383–387. pmid:10212007
- Guervil DJ, Rosenberg AF, Winterstein AG, Harris NS, Johns TE, Zumberg MS. Activated partial thromboplastin time versus antifactor Xa heparin assay in monitoring unfractionated heparin by continuous intravenous infusion. Ann Pharmacother 2011; 45(7–8):861–868. doi:10.1345/aph.1Q161
- Fruge KS, Lee YR. Comparison of unfractionated heparin protocols using antifactor Xa monitoring or activated partial thrombin time monitoring. Am J Health Syst Pharm 2015; 72(17 suppl 2):S90–S97. doi:10.2146/sp150016
- Rosborough TK. Monitoring unfractionated heparin therapy with antifactor Xa activity results in fewer monitoring tests and dosage changes than monitoring with activated partial thromboplastin time. Pharmacotherapy 1999; 19(6):760–766. pmid:10391423
- Rosborough TK, Shepherd MF. Achieving target antifactor Xa activity with a heparin protocol based on sex, age, height, and weight. Pharmacotherapy 2004; 24(6):713–719. doi:10.1592/phco.24.8.713.36067
- Smith ML, Wheeler KE. Weight-based heparin protocol using antifactor Xa monitoring. Am J Health Syst Pharm 2010; 67(5):371–374. doi:10.2146/ajhp090123
- Bartholomew JR, Kottke-Marchant K. Monitoring anticoagulation therapy in patients with the lupus anticoagulant. J Clin Rheumatol 1998; 4(6):307–312. pmid:19078327
- Wool GD, Lu CM; Education Committee of the Academy of Clinical Laboratory Physicians and Scientists. Pathology consultation on anticoagulation monitoring: factor X-related assays. Am J Clin Pathol 2013; 140(5):623–634. doi:10.1309/AJCPR3JTOK7NKDBJ
- Mehta TP, Smythe MA, Mattson JC. Strategies for managing heparin therapy in patients with antiphospholipid antibody syndrome. Pharmacotherapy 2011; 31(12):1221–1231. doi:10.1592/phco.31.12.1221
- Levine SP, Sorenson RR, Harris MA, Knieriem LK. The effect of platelet factor 4 (PF4) on assays of plasma heparin. Br J Haematol 1984; 57(4):585–596. pmid:6743573
- Fisher AR, Bailey CR, Shannon CN, Wielogorski AK. Heparin resistance after aprotinin. Lancet 1992; 340(8829):1230–1231. pmid:1279335
- Becker RC, Corrao JM, Bovill EG, et al. Intravenous nitroglycerin-induced heparin resistance: a qualitative antithrombin III abnormality. Am Heart J 1990; 119(6):1254–1261. pmid:2112878
- Monagle P, Chan AK, Goldenberg NA, et al. Antithrombotic therapy in neonates and children: Antithrombotic Therapy and Prevention of Thrombosis, 9th ed: American College of Chest Physicians Evidence-Based Clinical Practice Guidelines. Chest 2012; 141(suppl 2):e737S–e801S. doi:10.1378/chest.11-2308
- Long E, Pitfield AF, Kissoon N. Anticoagulation therapy: indications, monitoring, and complications. Pediatr Emerg Care 2011; 27(1):55–61. doi:10.1097/PEC.0b013e31820461b1
- Andrew M, Schmidt B. Use of heparin in newborn infants. Semin Thromb Hemost 1988; 14(1):28–32. doi:10.1055/s-2007-1002752
- Teien AN, Lie M, Abildgaard U. Assay of heparin in plasma using a chromogenic substrate for activated factor X. Thromb Res 1976; 8(3):413–416. pmid:1265712
- Vera-Aguillera J, Yousef H, Beltran-Melgarejo D, et al. Clinical scenarios for discordant anti-Xa. Adv Hematol 2016; 2016:4054806. doi:10.1155/2016/4054806
- Macedo KA, Tatarian P, Eugenio KR. Influence of direct oral anticoagulants on anti-factor Xa measurements utilized for monitoring heparin. Ann Pharmacother 2018; 52(2):154–159. doi:10.1177/1060028017729481
- Wendte J, Voss G, Van Overschelde B. Influence of apixaban on antifactor Xa levels in a patient with acute kidney injury. Am J Health Syst Pharm 2016; 73(8):563–567. doi:10.2146/ajhp150360
- Faust AC, Kanyer D, Wittkowsky AK. Managing transitions from oral factor Xa inhibitors to unfractionated heparin infusions. Am J Health Syst Pharm 2016; 73(24):2037–2041. doi:10.2146/ajhp150596
- Alhenc-Gelas M, Jestin-Le Guernic C, Vitoux JF, Kher A, Aiach M, Fiessinger JN. Adjusted versus fixed doses of the low-molecular-weight heparin fragmin in the treatment of deep vein thrombosis. Fragmin-Study Group. Thromb Haemost 1994; 71(6):698–702. pmid:7974334
- Bates SM, Greer IA, Middeldorp S, Veenstra DL, Prabulos AM, Vandvik PO. VTE, thrombophilia, antithrombotic therapy, and pregnancy: Antithrombotic Therapy and Prevention of Thrombosis, 9th ed: American College of Chest Physicians Evidence-Based Clinical Practice Guidelines. Chest 2012; 141(suppl 2):e691S–e736S. doi:10.1378/chest.11-2300
- Bara L, Leizorovicz A, Picolet H, Samama M. Correlation between anti-Xa and occurrence of thrombosis and haemorrhage in post-surgical patients treated with either Logiparin (LMWH) or unfractionated heparin. Post-surgery Logiparin Study Group. Thromb Res 1992; 65(4–5):641–650. pmid:1319619
- Prandoni P, Lensing AW, Büller HR, et al. Comparison of subcutaneous low-molecular-weight heparin with intravenous standard heparin in proximal deep-vein thrombosis. Lancet 1992; 339(8791):441–445. pmid:1346817
- Walenga JM, Hoppensteadt D, Fareed J. Laboratory monitoring of the clinical effects of low molecular weight heparins. Thromb Res Suppl 1991;14:49–62. pmid:1658970
- Elkayam U. Anticoagulation therapy for pregnant women with mechanical prosthetic heart valves: how to improve safety? J Am Coll Cardiol 2017; 69(22):2692–2695. doi:10.1016/j.jacc.2017.04.034
- Brophy DF, Wazny LD, Gehr TW, Comstock TJ, Venitz J. The pharmacokinetics of subcutaneous enoxaparin in end-stage renal disease. Pharmacotherapy 2001; 21(2):169–174. pmid:11213853
- Becker RC, Spencer FA, Gibson M, et al; TIMI 11A Investigators. Influence of patient characteristics and renal function on factor Xa inhibition pharmacokinetics and pharmacodynamics after enoxaparin administration in non-ST-segment elevation acute coronary syndromes. Am Heart J 2002; 143(5):753–759. pmid:12040334
- Chow SL, Zammit K, West K, Dannenhoffer M, Lopez-Candales A. Correlation of antifactor Xa concentrations with renal function in patients on enoxaparin. J Clin Pharmacol 2003; 43(6):586–590. pmid:12817521
- Lim W, Dentali F, Eikelboom JW, Crowther MA. Meta-analysis: low-molecular-weight heparin and bleeding in patients with severe renal insufficiency. Ann Intern Med 2006; 144(9):673–684. pmid:16670137
- Spinler SA, Inverso SM, Cohen M, Goodman SG, Stringer KA, Antman EM; ESSENCE and TIMI 11B Investigators. Safety and efficacy of unfractionated heparin versus enoxaparin in patients who are obese and patients with severe renal impairment: analysis from the ESSENCE and TIMI 11B studies. Am Heart J 2003; 146(1):33–41. doi:10.1016/S0002-8703(03)00121-2
- Cestac P, Bagheri H, Lapeyre-Mestre M, et al. Utilisation and safety of low molecular weight heparins: prospective observational study in medical inpatients. Drug Saf 2003; 26(3):197–207. doi:10.2165/00002018-200326030-00005
- Douxfils J, Ageno W, Samama CM, et al. Laboratory testing in patients treated with direct oral anticoagulants: a practical guide for clinicians. J Thromb Haemost 2018; 16(2):209–219. doi:10.1111/jth.13912
- Samuelson BT, Cuker A, Siegal DM, Crowther M, Garcia DA. Laboratory assessment of the anticoagulant activity of direct oral anticoagulants: a systematic review. Chest 2017; 151(1):127–138. doi:10.1016/j.chest.2016.08.1462
- Gosselin RC, Francart SJ, Hawes EM, Moll S, Dager WE, Adcock DM. Heparin-calibrated chromogenic anti-Xa activity measurements in patients receiving rivaroxaban: can this test be used to quantify drug level? Ann Pharmacother 2015; 49(7):777–783. doi:10.1177/1060028015578451
- Levy JH, Ageno W, Chan NC, Crowther M, Verhamme P, Weitz JI; Subcommittee on Control of Anticoagulation. When and how to use antidotes for the reversal of direct oral anticoagulants: guidance from the SSC of the ISTH. J Thromb Haemost 2016; 14(3):623–627. doi:10.1111/jth.13227
- Cuker A, Siegal D. Monitoring and reversal of direct oral anticoagulants. Hematology Am Soc Hematol Educ Program 2015; 2015:117–124. doi:10.1182/asheducation-2015.1.117
- Abildgaard U. Highly purified antithrombin 3 with heparin cofactor activity prepared by disc electrophoresis. Scand J Clin Lab Invest 1968; 21(1):89–91. pmid:5637480
- Rosenberg RD, Lam L. Correlation between structure and function of heparin. Proc Natl Acad Sci USA 1979; 76(3):1218–1222. pmid:286307
- Lindahl U, Bäckström G, Höök M, Thunberg L, Fransson LA, Linker A. Structure of the antithrombin-binding site of heparin. Proc Natl Acad Sci USA 1979; 76(7):3198–3202. pmid:226960
- Rosenberg RD, Rosenberg JS. Natural anticoagulant mechanisms. J Clin Invest 1984; 74(1):1–6. doi:10.1172/JCI111389
- Casu B, Oreste P, Torri G, et al. The structure of heparin oligosaccharide fragments with high anti-(factor Xa) activity containing the minimal antithrombin III-binding sequence. Chemical and 13C nuclear-magnetic-resonance studies. Biochem J 1981; 197(3):599–609. pmid:7325974
- Choay J, Lormeau JC, Petitou M, Sinaÿ P, Fareed J. Structural studies on a biologically active hexasaccharide obtained from heparin. Ann NY Acad Sci 1981; 370: 644–649. pmid:6943974
- Hirsh J, Warkentin TE, Shaughnessy SG, et al. Heparin and low-molecular-weight heparin: mechanisms of action, pharmacokinetics, dosing, monitoring, efficacy, and safety. Chest 2001; 119(suppl 1):64S–94S. pmid:11157643
- Garcia DA, Baglin TP, Weitz JI, Samama MM. Parenteral anticoagulants: antithrombotic therapy and prevention of thrombosis, 9th ed: American College of Chest Physicians Evidence-Based Clinical Practice Guidelines. Chest 2012; 141(suppl 2):e24S–e43S. doi:10.1378/chest.11-2291
- Hirsh J, Levine M. Low-molecular weight heparin. Blood 1992; 79(1):1–17. pmid:1309422
- Barritt DW, Jordan SC. Anticoagulant drugs in the treatment of pulmonary embolism. A controlled trial. Lancet 1960; 1(7138):1309–1312. pmid:13797091
- Basu D, Gallus A, Hirsh J, Cade J. A prospective study of the value of monitoring heparin treatment with the activated partial thromboplastin time. N Engl J Med 1972; 287(7):324–327. doi:10.1056/NEJM197208172870703
- Hull RD, Raskob GE, Hirsh J, et al. Continuous intravenous heparin compared with intermittent subcutaneous heparin in the initial treatment of proximal-vein thrombosis. N Engl J Med 1986; 315(18):1109–1114. doi:10.1056/NEJM198610303151801
- Hull RD, Raskob GE, Brant RF, Pineo GF, Valentine KA. Relation between the time to achieve the lower limit of the APTT therapeutic range and recurrent venous thromboembolism during heparin treatment for deep vein thrombosis. Arch Intern Med 1997; 157(22):2562–2568. pmid:9531224
- Hull RD, Raskob GE, Brant RF, Pineo GF, Valentine KA. The importance of initial heparin treatment on long-term clinical outcomes of antithrombotic therapy. The emerging theme of delayed recurrence. Arch Intern Med 1997; 157(20):2317–2321. pmid:9361572
- Anand S, Ginsberg JS, Kearon C, Gent M, Hirsh J. The relation between the activated partial thromboplastin time response and recurrence in patients with venous thrombosis treated with continuous intravenous heparin. Arch Intern Med 1996; 156(15):1677–1681. pmid:8694666
- Anand SS, Bates S, Ginsberg JS, et al. Recurrent venous thrombosis and heparin therapy: an evaluation of the importance of early activated partial thromboplastin times. Arch Intern Med 1999; 159(17):2029–2032. pmid:10510988
- Raschke RA, Reilly BM, Guidry JR, Fontana JR, Srinivas S. The weight-based heparin dosing nomogram compared with a “standard care” nomogram. A randomized controlled trial. Ann Intern Med 1993; 119(9):874–881. pmid:8214998
- Smith SB, Geske JB, Maguire JM, Zane NA, Carter RE, Morgenthaler TI. Early anticoagulation is associated with reduced mortality for acute pulmonary embolism. Chest 2010; 137(6):1382–1390. doi:10.1378/chest.09-0959
- Cruickshank MK, Levine MN, Hirsh J, Roberts R, Siguenza M. A standard heparin nomogram for the management of heparin therapy. Arch Intern Med 1991; 151(2):333–337. pmid:1789820
- Raschke RA, Gollihare B, Peirce J. The effectiveness of implementing the weight-based heparin nomogram as a practice guideline. Arch Intern Med 1996; 156(15):1645–1649. pmid:8694662
- Simko RJ, Tsung FF, Stanek EJ. Activated clotting time versus activated partial thromboplastin time for therapeutic monitoring of heparin. Ann Pharmacother 1995; 29(10):1015–1021. doi:10.1177/106002809502901012
- Langdell RD, Wagner RH, Brinkhous KM. Effect of antihemophilic factor on one-stage clotting tests; a presumptive test for hemophilia and a simple one-stage antihemophilic factor assy procedure. J Lab Clin Med 1953; 41(4):637–647.
- White GC 2nd. The partial thromboplastin time: defining an era in coagulation. J Thromb Haemost 2003; 1(11):2267–2270. pmid:14629454
- Proctor RR, Rapaport SI. The partial thromboplastin time with kaolin. A simple screening test for first stage plasma clotting factor deficiencies. Am J Clin Pathol 1961; 36:212–219. pmid:13738153
- Brandt JT, Triplett DA, Rock WA, Bovill EG, Arkin CF. Effect of lupus anticoagulants on the activated partial thromboplastin time. Results of the College of American Pathologists survey program. Arch Pathol Lab Med 1991; 115(2):109–114. pmid:1899555
- Tripodi A, Mannucci PM. Activated partial thromboplastin time (APTT). New indications for an old test? J Thromb Haemost 2006; 4(4):750–751. doi:10.1111/j.1538-7836.2006.01857.x
- Chiu HM, Hirsh J, Yung WL, Regoeczi E, Gent M. Relationship between the anticoagulant and antithrombotic effects of heparin in experimental venous thrombosis. Blood 1977; 49(2):171–184. pmid:831872
- Brill-Edwards P, Ginsberg JS, Johnston M, Hirsh J. Establishing a therapeutic range for heparin therapy. Ann Intern Med 1993; 119(2):104–109. pmid:8512158
- Vandiver JW, Vondracek TG. Antifactor Xa levels versus activated partial thromboplastin time for monitoring unfractionated heparin. Pharmacotherapy 2012; 32(6):546–558. doi:10.1002/j.1875-9114.2011.01049.x
- Newall F. Anti-factor Xa (anti-Xa). In: Monagle P, ed. Haemostasis: Methods and Protocols. New York, NY: Springer-Verlag; 2013.
- Bates SM, Weitz JI, Johnston M, Hirsh J, Ginsberg JS. Use of a fixed activated partial thromboplastin time ratio to establish a therapeutic range for unfractionated heparin. Arch Intern Med 2001; 161(3):385–391. pmid:11176764
- Levine MN, Hirsh J, Gent M, et al. A randomized trial comparing activated thromboplastin time with heparin assay in patients with acute venous thromboembolism requiring large doses of heparin. Arch Intern Med 1994; 154(1):49–56. pmid:8267489
- Wool GD, Lu CM; Education Committee of the Academy of Clinical Laboratory Physicians and Scientists. Pathology consultation on anticoagulation monitoring: factor X-related assays. Am J Clin Pathol 2013; 140(5):623–634. doi:10.1309/AJCPR3JTOK7NKDBJ
- Lehman CM, Frank EL. Laboratory monitoring of heparin therapy: partial thromboplastin time or anti-Xa assay? Lab Med 2009; 40(1):47–51. doi:10.1309/LM9NJGW2ZIOLPHY6
- Arachchillage DR, Kamani F, Deplano S, Banya W, Laffan M. Should we abandon the aPTT for monitoring unfractionated heparin? Thromb Res 2017; 157:157–161. doi:10.1016/j.thromres.2017.07.006
- Olson JD, Arkin CA, Brandt JT, et al. College of American Pathologists Conference XXXI on Laboratory Monitoring of Anticoagulant Therapy: laboratory monitoring of unfractionated heparin therapy. Arch Pathol Lab Med 1998; 122(9):782–798. pmid:9740136
- Eikelboom JW, Hirsh J. Monitoring unfractionated heparin with the aPTT: time for a fresh look. Thromb Haemost 2006; 96(5):547–552. pmid:17080209
- Young E, Prins M, Levine MN, Hirsh J. Heparin binding to plasma proteins, an important mechanism of heparin resistance. Thromb Haemost 1992; 67(6):639–643. pmid:1509402
- Edson JR, Krivit W, White JG. Kaolin partial thromboplastin time: high levels of procoagulants producing short clotting times or masking deficiencies of other procoagulants or low concentrations of anticoagulants. J Lab Clin Med 1967; 70(3):463–470. pmid:6072020
- Whitfield LR, Lele AS, Levy G. Effect of pregnancy on the relationship between concentration and anticoagulant action of heparin. Clin Pharmacol Ther 1983; 34(1):23–28. pmid:6861435
- Marci CD, Prager D. A review of the clinical indications for the plasma heparin assay. Am J Clin Pathol 1993; 99(5):546–550.
- Takemoto CM, Streiff MB, Shermock KM, et al. Activated partial thromboplastin time and anti-Xa measurements in heparin monitoring: biochemical basis of discordance. Am J Clin Pathol 2013; 139(4):450–456. doi:10.1309/AJCPS6OW6DYNOGNH
- Adatya S, Uriel N, Yarmohammadi H, et al. Anti-factor Xa and activated partial thromboplastin time measurements for heparin monitoring in mechanical circulatory support. JACC Heart Fail 2015; 3(4):314–322. doi:10.1016/j.jchf.2014.11.009
- Kuhle S, Eulmesekian P, Kavanagh B, et al. Lack of correlation between heparin dose and standard clinical monitoring tests in treatment with unfractionated heparin in critically ill children. Haematologica 2007; 92(4):554–557. pmid:17488668
- Price EA, Jin J, Nguyen HM, Krishnan G, Bowen R, Zehnder JL. Discordant aPTT and anti-Xa values and outcomes in hospitalized patients treated with intravenous unfractionated heparin. Ann Pharmacother 2013; 47(2):151–158. doi:10.1345/aph.1R635
- Baker BA, Adelman MD, Smith PA, Osborn JC. Inability of the activated partial thromboplastin time to predict heparin levels. Arch Intern Med 1997; 157(21):2475–2479. pmid:9385299
- Koerber JM, Smythe MA, Begle RL, Mattson JC, Kershaw BP, Westley SJ. Correlation of activated clotting time and activated partial thromboplastin time to plasma heparin concentration. Pharmacotherapy 1999; 19(8):922–931. pmid:10453963
- Smythe MA, Mattson JC, Koerber JM. The heparin anti-Xa therapeutic range: are we there yet? Chest 2002; 121(1):303–304. pmid:11796474
- Cuker A, Ptashkin B, Konkle A, et al. Interlaboratory agreement in the monitoring of unfractionated heparin using the anti-factor Xa-correlated activated partial thromboplastin time. J Thromb Haemost 2009; 7(1):80–86. doi:10.1111/j.1538-7836.2008.03224.x
- Taylor CT, Petros WP, Ortel TL. Two instruments to determine activated partial thromboplastin time: implications for heparin monitoring. Pharmacotherapy 1999; 19(4):383–387. pmid:10212007
- Guervil DJ, Rosenberg AF, Winterstein AG, Harris NS, Johns TE, Zumberg MS. Activated partial thromboplastin time versus antifactor Xa heparin assay in monitoring unfractionated heparin by continuous intravenous infusion. Ann Pharmacother 2011; 45(7–8):861–868. doi:10.1345/aph.1Q161
- Fruge KS, Lee YR. Comparison of unfractionated heparin protocols using antifactor Xa monitoring or activated partial thrombin time monitoring. Am J Health Syst Pharm 2015; 72(17 suppl 2):S90–S97. doi:10.2146/sp150016
- Rosborough TK. Monitoring unfractionated heparin therapy with antifactor Xa activity results in fewer monitoring tests and dosage changes than monitoring with activated partial thromboplastin time. Pharmacotherapy 1999; 19(6):760–766. pmid:10391423
- Rosborough TK, Shepherd MF. Achieving target antifactor Xa activity with a heparin protocol based on sex, age, height, and weight. Pharmacotherapy 2004; 24(6):713–719. doi:10.1592/phco.24.8.713.36067
- Smith ML, Wheeler KE. Weight-based heparin protocol using antifactor Xa monitoring. Am J Health Syst Pharm 2010; 67(5):371–374. doi:10.2146/ajhp090123
- Bartholomew JR, Kottke-Marchant K. Monitoring anticoagulation therapy in patients with the lupus anticoagulant. J Clin Rheumatol 1998; 4(6):307–312. pmid:19078327
- Wool GD, Lu CM; Education Committee of the Academy of Clinical Laboratory Physicians and Scientists. Pathology consultation on anticoagulation monitoring: factor X-related assays. Am J Clin Pathol 2013; 140(5):623–634. doi:10.1309/AJCPR3JTOK7NKDBJ
- Mehta TP, Smythe MA, Mattson JC. Strategies for managing heparin therapy in patients with antiphospholipid antibody syndrome. Pharmacotherapy 2011; 31(12):1221–1231. doi:10.1592/phco.31.12.1221
- Levine SP, Sorenson RR, Harris MA, Knieriem LK. The effect of platelet factor 4 (PF4) on assays of plasma heparin. Br J Haematol 1984; 57(4):585–596. pmid:6743573
- Fisher AR, Bailey CR, Shannon CN, Wielogorski AK. Heparin resistance after aprotinin. Lancet 1992; 340(8829):1230–1231. pmid:1279335
- Becker RC, Corrao JM, Bovill EG, et al. Intravenous nitroglycerin-induced heparin resistance: a qualitative antithrombin III abnormality. Am Heart J 1990; 119(6):1254–1261. pmid:2112878
- Monagle P, Chan AK, Goldenberg NA, et al. Antithrombotic therapy in neonates and children: Antithrombotic Therapy and Prevention of Thrombosis, 9th ed: American College of Chest Physicians Evidence-Based Clinical Practice Guidelines. Chest 2012; 141(suppl 2):e737S–e801S. doi:10.1378/chest.11-2308
- Long E, Pitfield AF, Kissoon N. Anticoagulation therapy: indications, monitoring, and complications. Pediatr Emerg Care 2011; 27(1):55–61. doi:10.1097/PEC.0b013e31820461b1
- Andrew M, Schmidt B. Use of heparin in newborn infants. Semin Thromb Hemost 1988; 14(1):28–32. doi:10.1055/s-2007-1002752
- Teien AN, Lie M, Abildgaard U. Assay of heparin in plasma using a chromogenic substrate for activated factor X. Thromb Res 1976; 8(3):413–416. pmid:1265712
- Vera-Aguillera J, Yousef H, Beltran-Melgarejo D, et al. Clinical scenarios for discordant anti-Xa. Adv Hematol 2016; 2016:4054806. doi:10.1155/2016/4054806
- Macedo KA, Tatarian P, Eugenio KR. Influence of direct oral anticoagulants on anti-factor Xa measurements utilized for monitoring heparin. Ann Pharmacother 2018; 52(2):154–159. doi:10.1177/1060028017729481
- Wendte J, Voss G, Van Overschelde B. Influence of apixaban on antifactor Xa levels in a patient with acute kidney injury. Am J Health Syst Pharm 2016; 73(8):563–567. doi:10.2146/ajhp150360
- Faust AC, Kanyer D, Wittkowsky AK. Managing transitions from oral factor Xa inhibitors to unfractionated heparin infusions. Am J Health Syst Pharm 2016; 73(24):2037–2041. doi:10.2146/ajhp150596
- Alhenc-Gelas M, Jestin-Le Guernic C, Vitoux JF, Kher A, Aiach M, Fiessinger JN. Adjusted versus fixed doses of the low-molecular-weight heparin fragmin in the treatment of deep vein thrombosis. Fragmin-Study Group. Thromb Haemost 1994; 71(6):698–702. pmid:7974334
- Bates SM, Greer IA, Middeldorp S, Veenstra DL, Prabulos AM, Vandvik PO. VTE, thrombophilia, antithrombotic therapy, and pregnancy: Antithrombotic Therapy and Prevention of Thrombosis, 9th ed: American College of Chest Physicians Evidence-Based Clinical Practice Guidelines. Chest 2012; 141(suppl 2):e691S–e736S. doi:10.1378/chest.11-2300
- Bara L, Leizorovicz A, Picolet H, Samama M. Correlation between anti-Xa and occurrence of thrombosis and haemorrhage in post-surgical patients treated with either Logiparin (LMWH) or unfractionated heparin. Post-surgery Logiparin Study Group. Thromb Res 1992; 65(4–5):641–650. pmid:1319619
- Prandoni P, Lensing AW, Büller HR, et al. Comparison of subcutaneous low-molecular-weight heparin with intravenous standard heparin in proximal deep-vein thrombosis. Lancet 1992; 339(8791):441–445. pmid:1346817
- Walenga JM, Hoppensteadt D, Fareed J. Laboratory monitoring of the clinical effects of low molecular weight heparins. Thromb Res Suppl 1991;14:49–62. pmid:1658970
- Elkayam U. Anticoagulation therapy for pregnant women with mechanical prosthetic heart valves: how to improve safety? J Am Coll Cardiol 2017; 69(22):2692–2695. doi:10.1016/j.jacc.2017.04.034
- Brophy DF, Wazny LD, Gehr TW, Comstock TJ, Venitz J. The pharmacokinetics of subcutaneous enoxaparin in end-stage renal disease. Pharmacotherapy 2001; 21(2):169–174. pmid:11213853
- Becker RC, Spencer FA, Gibson M, et al; TIMI 11A Investigators. Influence of patient characteristics and renal function on factor Xa inhibition pharmacokinetics and pharmacodynamics after enoxaparin administration in non-ST-segment elevation acute coronary syndromes. Am Heart J 2002; 143(5):753–759. pmid:12040334
- Chow SL, Zammit K, West K, Dannenhoffer M, Lopez-Candales A. Correlation of antifactor Xa concentrations with renal function in patients on enoxaparin. J Clin Pharmacol 2003; 43(6):586–590. pmid:12817521
- Lim W, Dentali F, Eikelboom JW, Crowther MA. Meta-analysis: low-molecular-weight heparin and bleeding in patients with severe renal insufficiency. Ann Intern Med 2006; 144(9):673–684. pmid:16670137
- Spinler SA, Inverso SM, Cohen M, Goodman SG, Stringer KA, Antman EM; ESSENCE and TIMI 11B Investigators. Safety and efficacy of unfractionated heparin versus enoxaparin in patients who are obese and patients with severe renal impairment: analysis from the ESSENCE and TIMI 11B studies. Am Heart J 2003; 146(1):33–41. doi:10.1016/S0002-8703(03)00121-2
- Cestac P, Bagheri H, Lapeyre-Mestre M, et al. Utilisation and safety of low molecular weight heparins: prospective observational study in medical inpatients. Drug Saf 2003; 26(3):197–207. doi:10.2165/00002018-200326030-00005
- Douxfils J, Ageno W, Samama CM, et al. Laboratory testing in patients treated with direct oral anticoagulants: a practical guide for clinicians. J Thromb Haemost 2018; 16(2):209–219. doi:10.1111/jth.13912
- Samuelson BT, Cuker A, Siegal DM, Crowther M, Garcia DA. Laboratory assessment of the anticoagulant activity of direct oral anticoagulants: a systematic review. Chest 2017; 151(1):127–138. doi:10.1016/j.chest.2016.08.1462
- Gosselin RC, Francart SJ, Hawes EM, Moll S, Dager WE, Adcock DM. Heparin-calibrated chromogenic anti-Xa activity measurements in patients receiving rivaroxaban: can this test be used to quantify drug level? Ann Pharmacother 2015; 49(7):777–783. doi:10.1177/1060028015578451
- Levy JH, Ageno W, Chan NC, Crowther M, Verhamme P, Weitz JI; Subcommittee on Control of Anticoagulation. When and how to use antidotes for the reversal of direct oral anticoagulants: guidance from the SSC of the ISTH. J Thromb Haemost 2016; 14(3):623–627. doi:10.1111/jth.13227
- Cuker A, Siegal D. Monitoring and reversal of direct oral anticoagulants. Hematology Am Soc Hematol Educ Program 2015; 2015:117–124. doi:10.1182/asheducation-2015.1.117
KEY POINTS
- Intravenous unfractionated heparin treatment is typically monitored by the activated partial thromboplastin time (aPTT), with a therapeutic target defined as the range that corresponds to an anti-Xa level of 0.3 to 0.7 U/mL.
- Monitoring unfractionated heparin is important to achieve a therapeutic target within the first 24 hours and to maintain therapeutic levels thereafter.
- The heparin anti-Xa assay is unreliable for unfractionated heparin monitoring when switching from oral factor Xa inhibitor therapy to intravenous unfractionated heparin. In such cases, the aPTT is preferred.
- Most patients receiving low-molecular-weight heparin do not need monitoring, but monitoring should be considered for pregnant women with prosthetic heart valves, using an anti-Xa assay specific for low-molecular-weight heparin.
The return of measles—an unnecessary sequel

So why are we, the trustworthy, having such a tough time convincing people to get routine vaccines for themselves and for their kids? In a sea of truthopenia, we need to do more.
Not everyone refuses vaccines. It is the rare patient in my examination room who, after a discussion, still steadfastly refuses to get a flu shot or pneumonia vaccine. But our dialogue has changed somewhat. Patients still tell me that they or someone they know got the flu from the flu shot or got sick from the pneumonia vaccine (explainable by discussing the immune system’s systemic anamnestic response to a vaccine in the setting of partial immunity—“It’s a good thing”). But more often, I’m hearing detailed stories from the Internet or social media. We heard a less-than-endorsing reflection on the value of vaccines from 2 potential presidential candidates, 1 being a physician, during a televised presidential primary debate. Then there are the tabloid stories, and, of course, there are the celebrity authors and TV talk show doctors touting the unsubstantiated or incompletely substantiated virtues of “anti-inflammatory” and “immune-boosting” diets and supplements as obvious and total truth, while I’m recommending vaccinations and traditional drug therapies. Who can the patient believe? In our limited office-visit time, we must somehow put this external noise into perspective and individualize our suggestions for the patient in front of us.
Certainly the major news media research teams and the on-screen physician consultants to the major news networks have offered up evidence-based discussions on vaccination, the impact of preventable infections on the unvaccinated, and the limitations and reasonable potential benefits of specific dietary interventions and supplements. Unfortunately, their message is being contaminated by the untrusting aura that surrounds mainstream written and TV media.
Despite physicians’ continued high professional rating in the 2018 Gallup poll, some patients, families, and communities are swayed by arguments offered outside of our offices. And when it comes to our summarizing large studies published in major medical journals, the rolling echo of possible fake news and alternative facts comes to the fore. Can they really trust the establishment? There remains doubt in some patients’ minds.
The problem with measles, as Porter and Goldfarb discuss in this issue of the Journal, is that it is extremely contagious. For “herd immunity” to provide protection and prevent outbreaks, nearly everyone must be vaccinated or have natural immunity from childhood infection. Those who are at special risk from infection include the very young, who have an underdeveloped immune system, and adults who were not appropriately vaccinated (eg, those who may only have gotten a single measles vaccination as a child or whose immune system is weakened by disease or immunosuppressive drugs).
What can we do? We need, as a united front, to know the evidence that supports the relative value of vaccination of our child and adult patients and pass it on. We need to confront, accept, and explain to patients that all vaccines are not 100% successful (measles seems to be pretty close, based on the near-eradication of the disease in vaccinated communities up until now), but that even partial immunity is probably beneficial with all vaccines. We need to have a united front when discussing the bulk of evidence that debunks the vaccination-autism connection. We need to support federal and state funding so that all children can get their routine medical exams and vaccinations. We need to support sufficient financial protection for those companies who in good faith continue to develop and test new and improved vaccines for use in this country and around the world; infections can be introduced by travelers who have passed through areas endemic for infections rarely seen in the United States and who may not be aware of their own infection.
We need to live up to our Gallup poll ranking as highly trusted professionals. And we need to partner with our even more highly trusted nursing colleagues to take every opportunity to inform our patients and fight the spread of disinformation.
The morbilliform rash attributed to measles—and not to a sulfa allergy—should have been a phenomenon of the past. We didn’t need to see it again.
So why are we, the trustworthy, having such a tough time convincing people to get routine vaccines for themselves and for their kids? In a sea of truthopenia, we need to do more.
Not everyone refuses vaccines. It is the rare patient in my examination room who, after a discussion, still steadfastly refuses to get a flu shot or pneumonia vaccine. But our dialogue has changed somewhat. Patients still tell me that they or someone they know got the flu from the flu shot or got sick from the pneumonia vaccine (explainable by discussing the immune system’s systemic anamnestic response to a vaccine in the setting of partial immunity—“It’s a good thing”). But more often, I’m hearing detailed stories from the Internet or social media. We heard a less-than-endorsing reflection on the value of vaccines from 2 potential presidential candidates, 1 being a physician, during a televised presidential primary debate. Then there are the tabloid stories, and, of course, there are the celebrity authors and TV talk show doctors touting the unsubstantiated or incompletely substantiated virtues of “anti-inflammatory” and “immune-boosting” diets and supplements as obvious and total truth, while I’m recommending vaccinations and traditional drug therapies. Who can the patient believe? In our limited office-visit time, we must somehow put this external noise into perspective and individualize our suggestions for the patient in front of us.
Certainly the major news media research teams and the on-screen physician consultants to the major news networks have offered up evidence-based discussions on vaccination, the impact of preventable infections on the unvaccinated, and the limitations and reasonable potential benefits of specific dietary interventions and supplements. Unfortunately, their message is being contaminated by the untrusting aura that surrounds mainstream written and TV media.
Despite physicians’ continued high professional rating in the 2018 Gallup poll, some patients, families, and communities are swayed by arguments offered outside of our offices. And when it comes to our summarizing large studies published in major medical journals, the rolling echo of possible fake news and alternative facts comes to the fore. Can they really trust the establishment? There remains doubt in some patients’ minds.
The problem with measles, as Porter and Goldfarb discuss in this issue of the Journal, is that it is extremely contagious. For “herd immunity” to provide protection and prevent outbreaks, nearly everyone must be vaccinated or have natural immunity from childhood infection. Those who are at special risk from infection include the very young, who have an underdeveloped immune system, and adults who were not appropriately vaccinated (eg, those who may only have gotten a single measles vaccination as a child or whose immune system is weakened by disease or immunosuppressive drugs).
What can we do? We need, as a united front, to know the evidence that supports the relative value of vaccination of our child and adult patients and pass it on. We need to confront, accept, and explain to patients that all vaccines are not 100% successful (measles seems to be pretty close, based on the near-eradication of the disease in vaccinated communities up until now), but that even partial immunity is probably beneficial with all vaccines. We need to have a united front when discussing the bulk of evidence that debunks the vaccination-autism connection. We need to support federal and state funding so that all children can get their routine medical exams and vaccinations. We need to support sufficient financial protection for those companies who in good faith continue to develop and test new and improved vaccines for use in this country and around the world; infections can be introduced by travelers who have passed through areas endemic for infections rarely seen in the United States and who may not be aware of their own infection.
We need to live up to our Gallup poll ranking as highly trusted professionals. And we need to partner with our even more highly trusted nursing colleagues to take every opportunity to inform our patients and fight the spread of disinformation.
The morbilliform rash attributed to measles—and not to a sulfa allergy—should have been a phenomenon of the past. We didn’t need to see it again.
So why are we, the trustworthy, having such a tough time convincing people to get routine vaccines for themselves and for their kids? In a sea of truthopenia, we need to do more.
Not everyone refuses vaccines. It is the rare patient in my examination room who, after a discussion, still steadfastly refuses to get a flu shot or pneumonia vaccine. But our dialogue has changed somewhat. Patients still tell me that they or someone they know got the flu from the flu shot or got sick from the pneumonia vaccine (explainable by discussing the immune system’s systemic anamnestic response to a vaccine in the setting of partial immunity—“It’s a good thing”). But more often, I’m hearing detailed stories from the Internet or social media. We heard a less-than-endorsing reflection on the value of vaccines from 2 potential presidential candidates, 1 being a physician, during a televised presidential primary debate. Then there are the tabloid stories, and, of course, there are the celebrity authors and TV talk show doctors touting the unsubstantiated or incompletely substantiated virtues of “anti-inflammatory” and “immune-boosting” diets and supplements as obvious and total truth, while I’m recommending vaccinations and traditional drug therapies. Who can the patient believe? In our limited office-visit time, we must somehow put this external noise into perspective and individualize our suggestions for the patient in front of us.
Certainly the major news media research teams and the on-screen physician consultants to the major news networks have offered up evidence-based discussions on vaccination, the impact of preventable infections on the unvaccinated, and the limitations and reasonable potential benefits of specific dietary interventions and supplements. Unfortunately, their message is being contaminated by the untrusting aura that surrounds mainstream written and TV media.
Despite physicians’ continued high professional rating in the 2018 Gallup poll, some patients, families, and communities are swayed by arguments offered outside of our offices. And when it comes to our summarizing large studies published in major medical journals, the rolling echo of possible fake news and alternative facts comes to the fore. Can they really trust the establishment? There remains doubt in some patients’ minds.
The problem with measles, as Porter and Goldfarb discuss in this issue of the Journal, is that it is extremely contagious. For “herd immunity” to provide protection and prevent outbreaks, nearly everyone must be vaccinated or have natural immunity from childhood infection. Those who are at special risk from infection include the very young, who have an underdeveloped immune system, and adults who were not appropriately vaccinated (eg, those who may only have gotten a single measles vaccination as a child or whose immune system is weakened by disease or immunosuppressive drugs).
What can we do? We need, as a united front, to know the evidence that supports the relative value of vaccination of our child and adult patients and pass it on. We need to confront, accept, and explain to patients that all vaccines are not 100% successful (measles seems to be pretty close, based on the near-eradication of the disease in vaccinated communities up until now), but that even partial immunity is probably beneficial with all vaccines. We need to have a united front when discussing the bulk of evidence that debunks the vaccination-autism connection. We need to support federal and state funding so that all children can get their routine medical exams and vaccinations. We need to support sufficient financial protection for those companies who in good faith continue to develop and test new and improved vaccines for use in this country and around the world; infections can be introduced by travelers who have passed through areas endemic for infections rarely seen in the United States and who may not be aware of their own infection.
We need to live up to our Gallup poll ranking as highly trusted professionals. And we need to partner with our even more highly trusted nursing colleagues to take every opportunity to inform our patients and fight the spread of disinformation.
The morbilliform rash attributed to measles—and not to a sulfa allergy—should have been a phenomenon of the past. We didn’t need to see it again.

Disseminated invasive aspergillosis in an immunocompetent patient
A 57-year-old woman was admitted to our hospital for progressive hypoxic respiratory failure that developed after 10 days of empiric treatment at another hospital for an exacerbation of chronic obstructive pulmonary disease (COPD).
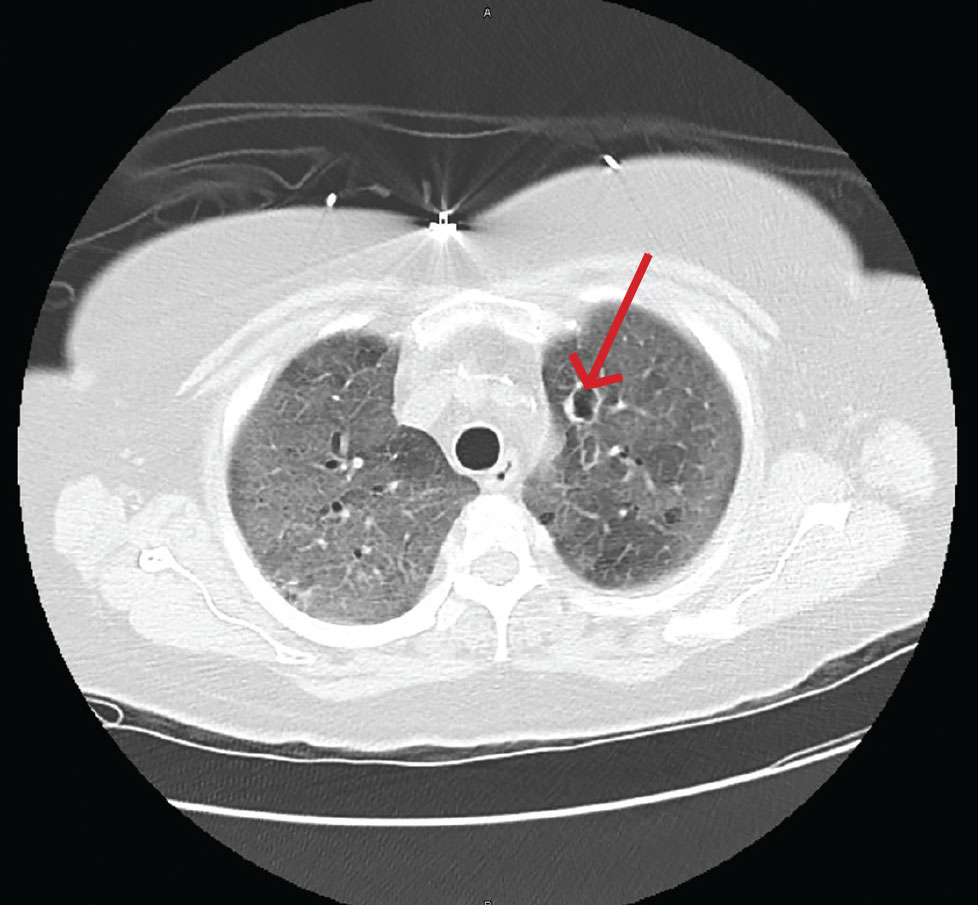
Computed tomography (CT) showed a lesion in the upper lobe of the left lung, with new ground-glass opacities with cystic and cavitary changes raising concern for an inflammatory or infectious cause (Figure 1). Respiratory culture of expectorated secretions grew Aspergillus. Assays for beta-d-glucan and serum Aspergillus immunoglobulin G (IgG) antibodies were positive, although given the improvement in her oxygenation requirements and overall clinical status, these were thought to be trivial. Tests for immunoglobulin deficiencies and human immunodeficiency virus were negative, ruling out primary immunodeficiency. However, within the next 48 hours, her respiratory status declined, and voriconazole was started out of concern for invasive pulmonary aspergillosis based on results of serum IgG testing.
Despite 2 days of treatment with voriconazole, the patient developed respiratory failure. Repeat CT showed that the ground-glass opacities were more dense, especially in the lower lobes, and new patchy infiltrates were noted in the left lung. The patient developed a right tension pneumothorax requiring emergency intubation and chest tube insertion.1 She subsequently developed acute abdominal pain with worsening abdominal distention, diagnosed as pneumoperitoneum. Emergency exploratory laparotomy revealed perforations in the cecum with fecal spillage, requiring ileocecectomy and ileostomy.
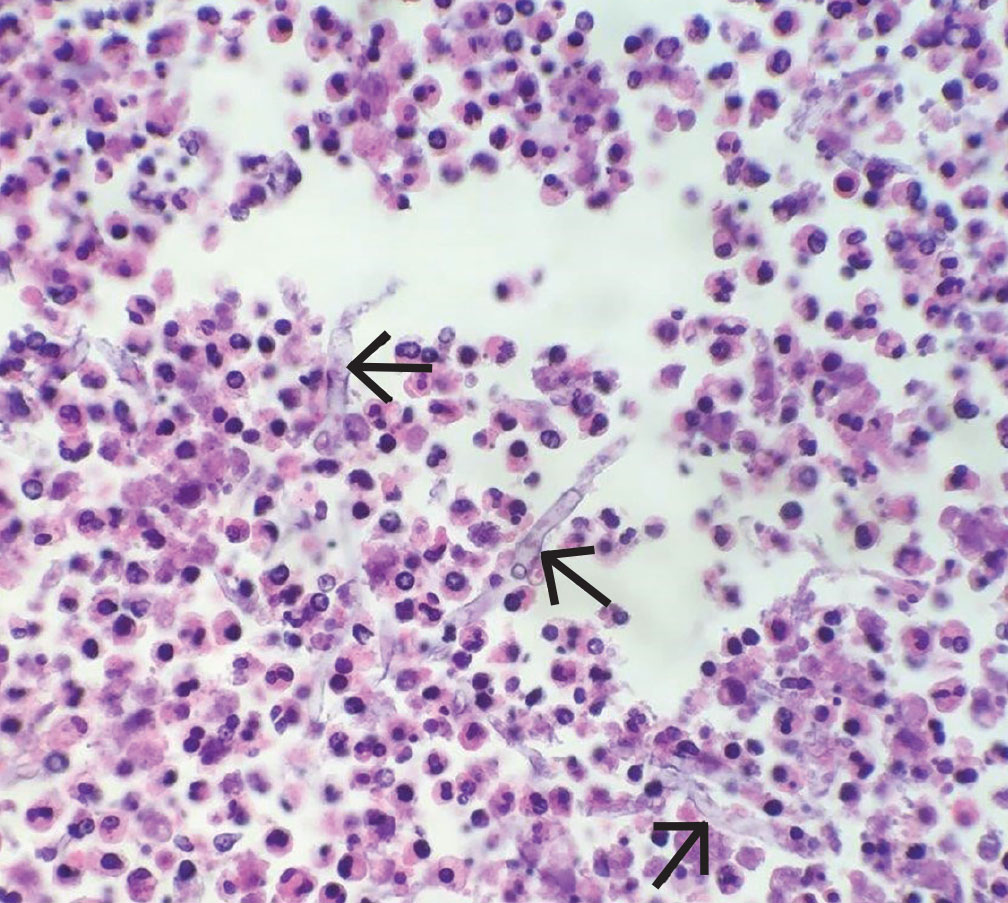
Pathologic study of bowel specimens confirmed fungal hyphae with “tree-branch” structures consistent with fungal infection in the bowel (Figure 2).
Oral voriconazole was continued. The patient’s respiratory status improved, and she no longer required supplemental oxygen. She was discharged on a regimen of oral voriconazole 200 mg twice daily. However, over the next 12 months, she had additional hospitalizations for severe sepsis from abdominal wound infections, pneumonia, and Clostridium difficile infection. She will require lifelong antifungal treatment.
INVASIVE PULMONARY ASPERGILLOSIS
Invasive pulmonary aspergillosis is the most severe form of aspergillosis and is most often seen in immunocompromised patients. The death rate is as high as 50% in neutropenic patients regardless of the time to diagnosis or effective treatment.2 It becomes life-threatening as the infection enters the blood stream, leading to formation of thrombi and precipitating embolism and necrosis in the lungs.3
In immunocompetent patients, COPD, tuberculosis, bronchiectasis, liver disease, severe sepsis, and diabetes mellitus predispose to invasive pulmonary aspergillosis.2 Other risk factors include long-term steroid therapy at doses equivalent to prednisone 20 mg/day for at least 13 weeks4 and viral infection such as influenza.5 Chronic use of inhaled corticosteroids has been hypothesized to increase risk.4
Histopathologic confirmation of fungal elements is the gold standard for diagnosis.3 New biomarkers such as beta-d-glucan have shown promise in enabling earlier diagnosis to allow effective treatment of disseminated aspergillosis, as in our patient.6
TAKE-HOME MESSAGE
Although not common, invasive aspergillosis can occur in immunocompetent and near-immunocompetent patients, particularly those with COPD or other underlying lung disease.
Acknowledgment: The authors thank Kimberley Woodward, MD, Inova Fairfax Hospital, Falls Church, VA, for her study of the bowel specimen and for providing the histology slide.
- Vukicevic TA, Dudvarski-Ilic A, Zugic V, Stevanovic G, Rubino S, Barac A. Subacute invasive pulmonary aspergillosis as a rare cause of pneumothorax in immunocompetent patient: brief report. Infection 2017; 45(3):377–380. doi:10.1007/s15010-017-0994-3
- Moreno-González G, Ricart de Mesones A, Tazi-Mezalek R, Marron-Moya MT, Rosell A, Mañez R. Invasive pulmonary aspergillosis with disseminated infection in immunocompetent patient. Can Respir J 2016; 2016:7984032. doi:10.1155/2016/7984032
- Chen L, Liu Y, Wang W, Liu K. Adrenal and hepatic aspergillosis in an immunocompetent patient. Infect Dis (Lond) 2015; 47(6):428–432. doi:10.3109/00365548.2014.995697
- Taccone FS, Van den Abeele AM, Bulpa P, et al; AspICU Study Investigators. Epidemiology of invasive aspergillosis in critically ill patients: clinical presentation, underlying conditions, and outcomes. Crit Care 2015; 19:7. doi:10.1186/s13054-014-0722-7
- Crum-Cianflone NF. Invasive aspergillosis associated with severe influenza infections. Open Forum Infect Dis 2016; 3(3):ofw171. doi:10.1093/ofid/ofw171
- Ergene U, Akcali Z, Ozbalci D, Nese N, Senol S. Disseminated aspergillosis due to Aspergillus niger in immunocompetent patient: a case report. Case Rep Infect Dis 2013; 2013:385190. doi:10.1155/2013/385190
A 57-year-old woman was admitted to our hospital for progressive hypoxic respiratory failure that developed after 10 days of empiric treatment at another hospital for an exacerbation of chronic obstructive pulmonary disease (COPD).
Computed tomography (CT) showed a lesion in the upper lobe of the left lung, with new ground-glass opacities with cystic and cavitary changes raising concern for an inflammatory or infectious cause (Figure 1). Respiratory culture of expectorated secretions grew Aspergillus. Assays for beta-d-glucan and serum Aspergillus immunoglobulin G (IgG) antibodies were positive, although given the improvement in her oxygenation requirements and overall clinical status, these were thought to be trivial. Tests for immunoglobulin deficiencies and human immunodeficiency virus were negative, ruling out primary immunodeficiency. However, within the next 48 hours, her respiratory status declined, and voriconazole was started out of concern for invasive pulmonary aspergillosis based on results of serum IgG testing.
Despite 2 days of treatment with voriconazole, the patient developed respiratory failure. Repeat CT showed that the ground-glass opacities were more dense, especially in the lower lobes, and new patchy infiltrates were noted in the left lung. The patient developed a right tension pneumothorax requiring emergency intubation and chest tube insertion.1 She subsequently developed acute abdominal pain with worsening abdominal distention, diagnosed as pneumoperitoneum. Emergency exploratory laparotomy revealed perforations in the cecum with fecal spillage, requiring ileocecectomy and ileostomy.
Pathologic study of bowel specimens confirmed fungal hyphae with “tree-branch” structures consistent with fungal infection in the bowel (Figure 2).
Oral voriconazole was continued. The patient’s respiratory status improved, and she no longer required supplemental oxygen. She was discharged on a regimen of oral voriconazole 200 mg twice daily. However, over the next 12 months, she had additional hospitalizations for severe sepsis from abdominal wound infections, pneumonia, and Clostridium difficile infection. She will require lifelong antifungal treatment.
INVASIVE PULMONARY ASPERGILLOSIS
Invasive pulmonary aspergillosis is the most severe form of aspergillosis and is most often seen in immunocompromised patients. The death rate is as high as 50% in neutropenic patients regardless of the time to diagnosis or effective treatment.2 It becomes life-threatening as the infection enters the blood stream, leading to formation of thrombi and precipitating embolism and necrosis in the lungs.3
In immunocompetent patients, COPD, tuberculosis, bronchiectasis, liver disease, severe sepsis, and diabetes mellitus predispose to invasive pulmonary aspergillosis.2 Other risk factors include long-term steroid therapy at doses equivalent to prednisone 20 mg/day for at least 13 weeks4 and viral infection such as influenza.5 Chronic use of inhaled corticosteroids has been hypothesized to increase risk.4
Histopathologic confirmation of fungal elements is the gold standard for diagnosis.3 New biomarkers such as beta-d-glucan have shown promise in enabling earlier diagnosis to allow effective treatment of disseminated aspergillosis, as in our patient.6
TAKE-HOME MESSAGE
Although not common, invasive aspergillosis can occur in immunocompetent and near-immunocompetent patients, particularly those with COPD or other underlying lung disease.
Acknowledgment: The authors thank Kimberley Woodward, MD, Inova Fairfax Hospital, Falls Church, VA, for her study of the bowel specimen and for providing the histology slide.
A 57-year-old woman was admitted to our hospital for progressive hypoxic respiratory failure that developed after 10 days of empiric treatment at another hospital for an exacerbation of chronic obstructive pulmonary disease (COPD).
Computed tomography (CT) showed a lesion in the upper lobe of the left lung, with new ground-glass opacities with cystic and cavitary changes raising concern for an inflammatory or infectious cause (Figure 1). Respiratory culture of expectorated secretions grew Aspergillus. Assays for beta-d-glucan and serum Aspergillus immunoglobulin G (IgG) antibodies were positive, although given the improvement in her oxygenation requirements and overall clinical status, these were thought to be trivial. Tests for immunoglobulin deficiencies and human immunodeficiency virus were negative, ruling out primary immunodeficiency. However, within the next 48 hours, her respiratory status declined, and voriconazole was started out of concern for invasive pulmonary aspergillosis based on results of serum IgG testing.
Despite 2 days of treatment with voriconazole, the patient developed respiratory failure. Repeat CT showed that the ground-glass opacities were more dense, especially in the lower lobes, and new patchy infiltrates were noted in the left lung. The patient developed a right tension pneumothorax requiring emergency intubation and chest tube insertion.1 She subsequently developed acute abdominal pain with worsening abdominal distention, diagnosed as pneumoperitoneum. Emergency exploratory laparotomy revealed perforations in the cecum with fecal spillage, requiring ileocecectomy and ileostomy.
Pathologic study of bowel specimens confirmed fungal hyphae with “tree-branch” structures consistent with fungal infection in the bowel (Figure 2).
Oral voriconazole was continued. The patient’s respiratory status improved, and she no longer required supplemental oxygen. She was discharged on a regimen of oral voriconazole 200 mg twice daily. However, over the next 12 months, she had additional hospitalizations for severe sepsis from abdominal wound infections, pneumonia, and Clostridium difficile infection. She will require lifelong antifungal treatment.
INVASIVE PULMONARY ASPERGILLOSIS
Invasive pulmonary aspergillosis is the most severe form of aspergillosis and is most often seen in immunocompromised patients. The death rate is as high as 50% in neutropenic patients regardless of the time to diagnosis or effective treatment.2 It becomes life-threatening as the infection enters the blood stream, leading to formation of thrombi and precipitating embolism and necrosis in the lungs.3
In immunocompetent patients, COPD, tuberculosis, bronchiectasis, liver disease, severe sepsis, and diabetes mellitus predispose to invasive pulmonary aspergillosis.2 Other risk factors include long-term steroid therapy at doses equivalent to prednisone 20 mg/day for at least 13 weeks4 and viral infection such as influenza.5 Chronic use of inhaled corticosteroids has been hypothesized to increase risk.4
Histopathologic confirmation of fungal elements is the gold standard for diagnosis.3 New biomarkers such as beta-d-glucan have shown promise in enabling earlier diagnosis to allow effective treatment of disseminated aspergillosis, as in our patient.6
TAKE-HOME MESSAGE
Although not common, invasive aspergillosis can occur in immunocompetent and near-immunocompetent patients, particularly those with COPD or other underlying lung disease.
Acknowledgment: The authors thank Kimberley Woodward, MD, Inova Fairfax Hospital, Falls Church, VA, for her study of the bowel specimen and for providing the histology slide.
- Vukicevic TA, Dudvarski-Ilic A, Zugic V, Stevanovic G, Rubino S, Barac A. Subacute invasive pulmonary aspergillosis as a rare cause of pneumothorax in immunocompetent patient: brief report. Infection 2017; 45(3):377–380. doi:10.1007/s15010-017-0994-3
- Moreno-González G, Ricart de Mesones A, Tazi-Mezalek R, Marron-Moya MT, Rosell A, Mañez R. Invasive pulmonary aspergillosis with disseminated infection in immunocompetent patient. Can Respir J 2016; 2016:7984032. doi:10.1155/2016/7984032
- Chen L, Liu Y, Wang W, Liu K. Adrenal and hepatic aspergillosis in an immunocompetent patient. Infect Dis (Lond) 2015; 47(6):428–432. doi:10.3109/00365548.2014.995697
- Taccone FS, Van den Abeele AM, Bulpa P, et al; AspICU Study Investigators. Epidemiology of invasive aspergillosis in critically ill patients: clinical presentation, underlying conditions, and outcomes. Crit Care 2015; 19:7. doi:10.1186/s13054-014-0722-7
- Crum-Cianflone NF. Invasive aspergillosis associated with severe influenza infections. Open Forum Infect Dis 2016; 3(3):ofw171. doi:10.1093/ofid/ofw171
- Ergene U, Akcali Z, Ozbalci D, Nese N, Senol S. Disseminated aspergillosis due to Aspergillus niger in immunocompetent patient: a case report. Case Rep Infect Dis 2013; 2013:385190. doi:10.1155/2013/385190
- Vukicevic TA, Dudvarski-Ilic A, Zugic V, Stevanovic G, Rubino S, Barac A. Subacute invasive pulmonary aspergillosis as a rare cause of pneumothorax in immunocompetent patient: brief report. Infection 2017; 45(3):377–380. doi:10.1007/s15010-017-0994-3
- Moreno-González G, Ricart de Mesones A, Tazi-Mezalek R, Marron-Moya MT, Rosell A, Mañez R. Invasive pulmonary aspergillosis with disseminated infection in immunocompetent patient. Can Respir J 2016; 2016:7984032. doi:10.1155/2016/7984032
- Chen L, Liu Y, Wang W, Liu K. Adrenal and hepatic aspergillosis in an immunocompetent patient. Infect Dis (Lond) 2015; 47(6):428–432. doi:10.3109/00365548.2014.995697
- Taccone FS, Van den Abeele AM, Bulpa P, et al; AspICU Study Investigators. Epidemiology of invasive aspergillosis in critically ill patients: clinical presentation, underlying conditions, and outcomes. Crit Care 2015; 19:7. doi:10.1186/s13054-014-0722-7
- Crum-Cianflone NF. Invasive aspergillosis associated with severe influenza infections. Open Forum Infect Dis 2016; 3(3):ofw171. doi:10.1093/ofid/ofw171
- Ergene U, Akcali Z, Ozbalci D, Nese N, Senol S. Disseminated aspergillosis due to Aspergillus niger in immunocompetent patient: a case report. Case Rep Infect Dis 2013; 2013:385190. doi:10.1155/2013/385190
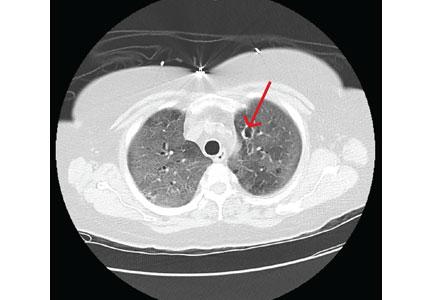
Is chest radiography routinely needed after thoracentesis?
No. After thoracentesis, chest radiography or another lung imaging study should be done only if pneumothorax is suspected, if thoracentesis requires more than 1 attempt, if the patient is on mechanical ventilation or has pre-existing lung disease, or if a large volume (> 1,500 mL) of fluid is removed. Radiography is also usually not necessary after diagnostic thoracentesis in a patient breathing spontaneously. In most cases, pneumothorax found incidentally after thoracentesis does not require decompression and can be managed supportively.
WHAT ARE THE RISKS OF THORACENTESIS?
Thoracentesis is a minimally invasive procedure usually performed at the bedside that involves insertion of a needle into the pleural cavity for drainage of fluid.1 Diagnostic thoracentesis should be done in most cases of a new pleural effusion unless the effusion is small and with a clear diagnosis, or in cases of typical heart failure.
Therapeutic thoracentesis, often called large-volume thoracentesis, aims to improve symptoms such as dyspnea attributed to the pleural effusion by removing at least 1 L of pleural fluid. The presence of active respiratory symptoms and suspicion of infected pleural effusion should lead to thoracentesis as soon as possible.
Complications of thoracentesis may be benign, such as pain and anxiety associated with the procedure and external bleeding at the site of needle insertion. Pneumothorax is the most common serious procedural complication and the principal reason to order postprocedural chest radiography.1 Less common complications include hemothorax, re-expansion pulmonary edema, infection, subdiaphragmatic organ puncture, and procedure-related death. Bleeding complications and hemothorax are rare even in patients with underlying coagulopathy.2
Point-of-care pleural ultrasonography is now considered the standard of care to guide optimal needle location for the procedure and to exclude other conditions that can mimic pleural effusion on chest radiography, such as lung consolidation and atelectasis.3 High proficiency in the use of preprocedural point-of-care ultrasonography reduces the rate of procedural complications, though it does not eliminate the risk entirely.3,4
Factors associated with higher rates of complications include lack of operator proficiency, poor understanding of the anatomy, poor patient positioning, poor patient cooperation with the procedure, lack of availability of bedside ultrasonography, and drainage of more than 1,500 mL of fluid. Addressing these factors has been shown to decrease the risk of pneumothorax and infection.1–5
HOW OFTEN DOES PNEUMOTHORAX OCCUR AFTER THORACENTESIS?
Several early studies have examined the incidence of pneumothorax after thoracentesis. Lack of ultrasonography use likely explains a higher incidence of complications in early studies: rates of pneumothorax after thoracentesis without ultrasonographic guidance ranged from 5.2% to 26%.6,7
Gervais et al8 analyzed thoracentesis with ultrasonographic guidance in 434 patients, 92 of whom were intubated, and reported that pneumothorax occurred in 10 patients, of whom 6 were intubated. Two of the intubated patients required chest tubes. Other studies have confirmed the low incidence of pneumothorax in patients undergoing thoracentesis, with rates such as 0.61%,1 5%,9 and 4%.10
The major predictor of postprocedural pneumothorax was the presence of symptoms such as chest pain and dyspnea. No intervention was necessary for most cases of pneumothorax in asymptomatic patients. The more widespread use of procedural ultrasonography may explain some discrepancies between the early5,6 and more recent studies.1,8–10
Several studies have demonstrated that postprocedural radiography is unnecessary unless a complication is suspected based on the patient’s symptoms or the need to demonstrate lung re-expansion.1,4,9,10 Clinical suspicion and the patient’s symptoms are the major predictors of procedure-related pneumothorax requiring treatment with a chest tube. Otherwise, incidentally discovered pneumothorax can usually be observed and managed supportively.
WHAT MECHANISMS UNDERLIE POSTPROCEDURAL PNEUMOTHORAX?
Major causes of pneumothorax in patients undergoing thoracentesis are direct puncture during needle or catheter insertion, the introduction of air through the needle or catheter into the pleural cavity, and the inability of the ipsilateral lung to fully expand after drainage of a large volume of fluid, known as pneumothorax ex vacuo.5
Pneumothorax ex vacuo may be seen in patients with medical conditions such as endobronchial obstruction, pleural scarring from long-standing pleural effusion, and lung malignancy, all of which can impair the lung’s ability to expand after removal of a large volume of pleural fluid. It is believed that transient parenchymal pleural fistulae form if the lung cannot expand, causing air leakage into the pleural cavity.5,8,9 Pleural manometry to monitor changes in pleural pressure and elastance can decrease the rates of pneumothorax ex vacuo in patients with the above risk factors.5
WHEN IS RADIOGRAPHY INDICATED AFTER THORACENTESIS?
Current literature suggests that imaging to evaluate for postprocedural complications should be done if there is suspicion of a complication, if thoracentesis required multiple attempts, if the procedure caused aspiration of air, if the patient has advanced lung disease, if the patient is scheduled to undergo thoracic radiation, if the patient is on mechanical ventilation, and after therapeutic thoracentesis if a large volume of fluid is removed.1–10 Routine chest radiography after thoracentesis is not supported in the literature in the absence of these risk factors.
Some practitioners order chest imaging after therapeutic thoracentesis to assess for residual pleural fluid and for visualization of other abnormalities previously hidden by pleural effusion, rather than simply to exclude postprocedural pneumothorax. Alternatively, postprocedural bedside pleural ultrasonography with recording of images can be done to assess for complications and residual pleural fluid volume without exposing the patient to radiation.11
Needle decompression and chest tube insertion should be considered in patients with tension pneumothorax, large pneumothorax (distance from the chest wall to the visceral pleural line of at least 2 cm), mechanical ventilation, progressing pneumothorax, and symptoms.
KEY POINTS
- Pneumothorax is a rare complication of thoracentesis when performed by a skilled operator using ultrasonographic guidance.
- Mechanisms behind the occurrence of pneumothorax are direct lung puncture, introduction of air into the pleural cavity, and pneumothorax ex vacuo.
- In asymptomatic patients, pneumothorax after thoracentesis rarely requires intervention beyond supportive care and close observation.
- Factors such as multiple thoracentesis attempts, symptoms, clinical suspicion, air aspiration during thoracentesis, presence of previous lung disease, and removal of a large volume of fluid may require postprocedural lung imaging (eg, bedside ultrasonography, radiography).
- Ault MJ, Rosen BT, Scher J, Feinglass J, Barsuk JH. Thoracentesis outcomes: a 12-year experience. Thorax 2015; 70(2):127–132. doi:10.1136/thoraxjnl-2014-206114
- Hibbert RM, Atwell TD, Lekah A, et al. Safety of ultrasound-guided thoracentesis in patients with abnormal preprocedural coagulation parameters. Chest 2013; 144(2):456–463. doi:10.1378/chest.12-2374
- Barnes TW, Morgenthaler TI, Olson EJ, Hesley GK, Decker PA, Ryu JH. Sonographically guided thoracentesis and rate of pneumothorax. J Clin Ultrasound 2005; 33(9):442–446. doi:10.1002/jcu.20163
- Gordon CE, Feller-Kopman D, Balk EM, Smetana GW. Pneumothorax following thoracentesis: a systematic review and meta-analysis. Arch Intern Med 2010; 170(4):332–339. doi:10.1001/archinternmed.2009.548
- Heidecker J, Huggins JT, Sahn SA, Doelken P. Pathophysiology of pneumothorax following ultrasound-guided thoracentesis. Chest 2006; 130(4):1173–1184. doi:10.1016/S0012-3692(15)51155-0
- Brandstetter RD, Karetzky M, Rastogi R, Lolis JD. Pneumothorax after thoracentesis in chronic obstructive pulmonary disease. Heart Lung 1994; 23(1):67–70. pmid:8150647
- Doyle JJ, Hnatiuk OW, Torrington KG, Slade AR, Howard RS. Necessity of routine chest roentgenography after thoracentesis. Ann Intern Med 1996; 124(9):816–820. pmid:8610950
- Gervais DA, Petersein A, Lee MJ, Hahn PF, Saini S, Mueller PR. US-guided thoracentesis: requirement for postprocedure chest radiography in patients who receive mechanical ventilation versus patients who breathe spontaneously. Radiology 1997; 204(2):503–506. doi:10.1148/radiology.204.2.9240544
- Capizzi SA, Prakash UB. Chest roentgenography after outpatient thoracentesis. Mayo Clin Proc 1998; 73(10):948–950. doi:10.4065/73.10.948
- Alemán C, Alegre J, Armadans L, et al. The value of chest roentgenography in the diagnosis of pneumothorax after thoracentesis. Am J Med 1999; 107(4):340–343. pmid:10527035
- Lichtenstein D. Lung ultrasound in the critically ill. Curr Opin Crit Care 2014; 20(3):315–322. doi:10.1097/MCC.0000000000000096
No. After thoracentesis, chest radiography or another lung imaging study should be done only if pneumothorax is suspected, if thoracentesis requires more than 1 attempt, if the patient is on mechanical ventilation or has pre-existing lung disease, or if a large volume (> 1,500 mL) of fluid is removed. Radiography is also usually not necessary after diagnostic thoracentesis in a patient breathing spontaneously. In most cases, pneumothorax found incidentally after thoracentesis does not require decompression and can be managed supportively.
WHAT ARE THE RISKS OF THORACENTESIS?
Thoracentesis is a minimally invasive procedure usually performed at the bedside that involves insertion of a needle into the pleural cavity for drainage of fluid.1 Diagnostic thoracentesis should be done in most cases of a new pleural effusion unless the effusion is small and with a clear diagnosis, or in cases of typical heart failure.
Therapeutic thoracentesis, often called large-volume thoracentesis, aims to improve symptoms such as dyspnea attributed to the pleural effusion by removing at least 1 L of pleural fluid. The presence of active respiratory symptoms and suspicion of infected pleural effusion should lead to thoracentesis as soon as possible.
Complications of thoracentesis may be benign, such as pain and anxiety associated with the procedure and external bleeding at the site of needle insertion. Pneumothorax is the most common serious procedural complication and the principal reason to order postprocedural chest radiography.1 Less common complications include hemothorax, re-expansion pulmonary edema, infection, subdiaphragmatic organ puncture, and procedure-related death. Bleeding complications and hemothorax are rare even in patients with underlying coagulopathy.2
Point-of-care pleural ultrasonography is now considered the standard of care to guide optimal needle location for the procedure and to exclude other conditions that can mimic pleural effusion on chest radiography, such as lung consolidation and atelectasis.3 High proficiency in the use of preprocedural point-of-care ultrasonography reduces the rate of procedural complications, though it does not eliminate the risk entirely.3,4
Factors associated with higher rates of complications include lack of operator proficiency, poor understanding of the anatomy, poor patient positioning, poor patient cooperation with the procedure, lack of availability of bedside ultrasonography, and drainage of more than 1,500 mL of fluid. Addressing these factors has been shown to decrease the risk of pneumothorax and infection.1–5
HOW OFTEN DOES PNEUMOTHORAX OCCUR AFTER THORACENTESIS?
Several early studies have examined the incidence of pneumothorax after thoracentesis. Lack of ultrasonography use likely explains a higher incidence of complications in early studies: rates of pneumothorax after thoracentesis without ultrasonographic guidance ranged from 5.2% to 26%.6,7
Gervais et al8 analyzed thoracentesis with ultrasonographic guidance in 434 patients, 92 of whom were intubated, and reported that pneumothorax occurred in 10 patients, of whom 6 were intubated. Two of the intubated patients required chest tubes. Other studies have confirmed the low incidence of pneumothorax in patients undergoing thoracentesis, with rates such as 0.61%,1 5%,9 and 4%.10
The major predictor of postprocedural pneumothorax was the presence of symptoms such as chest pain and dyspnea. No intervention was necessary for most cases of pneumothorax in asymptomatic patients. The more widespread use of procedural ultrasonography may explain some discrepancies between the early5,6 and more recent studies.1,8–10
Several studies have demonstrated that postprocedural radiography is unnecessary unless a complication is suspected based on the patient’s symptoms or the need to demonstrate lung re-expansion.1,4,9,10 Clinical suspicion and the patient’s symptoms are the major predictors of procedure-related pneumothorax requiring treatment with a chest tube. Otherwise, incidentally discovered pneumothorax can usually be observed and managed supportively.
WHAT MECHANISMS UNDERLIE POSTPROCEDURAL PNEUMOTHORAX?
Major causes of pneumothorax in patients undergoing thoracentesis are direct puncture during needle or catheter insertion, the introduction of air through the needle or catheter into the pleural cavity, and the inability of the ipsilateral lung to fully expand after drainage of a large volume of fluid, known as pneumothorax ex vacuo.5
Pneumothorax ex vacuo may be seen in patients with medical conditions such as endobronchial obstruction, pleural scarring from long-standing pleural effusion, and lung malignancy, all of which can impair the lung’s ability to expand after removal of a large volume of pleural fluid. It is believed that transient parenchymal pleural fistulae form if the lung cannot expand, causing air leakage into the pleural cavity.5,8,9 Pleural manometry to monitor changes in pleural pressure and elastance can decrease the rates of pneumothorax ex vacuo in patients with the above risk factors.5
WHEN IS RADIOGRAPHY INDICATED AFTER THORACENTESIS?
Current literature suggests that imaging to evaluate for postprocedural complications should be done if there is suspicion of a complication, if thoracentesis required multiple attempts, if the procedure caused aspiration of air, if the patient has advanced lung disease, if the patient is scheduled to undergo thoracic radiation, if the patient is on mechanical ventilation, and after therapeutic thoracentesis if a large volume of fluid is removed.1–10 Routine chest radiography after thoracentesis is not supported in the literature in the absence of these risk factors.
Some practitioners order chest imaging after therapeutic thoracentesis to assess for residual pleural fluid and for visualization of other abnormalities previously hidden by pleural effusion, rather than simply to exclude postprocedural pneumothorax. Alternatively, postprocedural bedside pleural ultrasonography with recording of images can be done to assess for complications and residual pleural fluid volume without exposing the patient to radiation.11
Needle decompression and chest tube insertion should be considered in patients with tension pneumothorax, large pneumothorax (distance from the chest wall to the visceral pleural line of at least 2 cm), mechanical ventilation, progressing pneumothorax, and symptoms.
KEY POINTS
- Pneumothorax is a rare complication of thoracentesis when performed by a skilled operator using ultrasonographic guidance.
- Mechanisms behind the occurrence of pneumothorax are direct lung puncture, introduction of air into the pleural cavity, and pneumothorax ex vacuo.
- In asymptomatic patients, pneumothorax after thoracentesis rarely requires intervention beyond supportive care and close observation.
- Factors such as multiple thoracentesis attempts, symptoms, clinical suspicion, air aspiration during thoracentesis, presence of previous lung disease, and removal of a large volume of fluid may require postprocedural lung imaging (eg, bedside ultrasonography, radiography).
No. After thoracentesis, chest radiography or another lung imaging study should be done only if pneumothorax is suspected, if thoracentesis requires more than 1 attempt, if the patient is on mechanical ventilation or has pre-existing lung disease, or if a large volume (> 1,500 mL) of fluid is removed. Radiography is also usually not necessary after diagnostic thoracentesis in a patient breathing spontaneously. In most cases, pneumothorax found incidentally after thoracentesis does not require decompression and can be managed supportively.
WHAT ARE THE RISKS OF THORACENTESIS?
Thoracentesis is a minimally invasive procedure usually performed at the bedside that involves insertion of a needle into the pleural cavity for drainage of fluid.1 Diagnostic thoracentesis should be done in most cases of a new pleural effusion unless the effusion is small and with a clear diagnosis, or in cases of typical heart failure.
Therapeutic thoracentesis, often called large-volume thoracentesis, aims to improve symptoms such as dyspnea attributed to the pleural effusion by removing at least 1 L of pleural fluid. The presence of active respiratory symptoms and suspicion of infected pleural effusion should lead to thoracentesis as soon as possible.
Complications of thoracentesis may be benign, such as pain and anxiety associated with the procedure and external bleeding at the site of needle insertion. Pneumothorax is the most common serious procedural complication and the principal reason to order postprocedural chest radiography.1 Less common complications include hemothorax, re-expansion pulmonary edema, infection, subdiaphragmatic organ puncture, and procedure-related death. Bleeding complications and hemothorax are rare even in patients with underlying coagulopathy.2
Point-of-care pleural ultrasonography is now considered the standard of care to guide optimal needle location for the procedure and to exclude other conditions that can mimic pleural effusion on chest radiography, such as lung consolidation and atelectasis.3 High proficiency in the use of preprocedural point-of-care ultrasonography reduces the rate of procedural complications, though it does not eliminate the risk entirely.3,4
Factors associated with higher rates of complications include lack of operator proficiency, poor understanding of the anatomy, poor patient positioning, poor patient cooperation with the procedure, lack of availability of bedside ultrasonography, and drainage of more than 1,500 mL of fluid. Addressing these factors has been shown to decrease the risk of pneumothorax and infection.1–5
HOW OFTEN DOES PNEUMOTHORAX OCCUR AFTER THORACENTESIS?
Several early studies have examined the incidence of pneumothorax after thoracentesis. Lack of ultrasonography use likely explains a higher incidence of complications in early studies: rates of pneumothorax after thoracentesis without ultrasonographic guidance ranged from 5.2% to 26%.6,7
Gervais et al8 analyzed thoracentesis with ultrasonographic guidance in 434 patients, 92 of whom were intubated, and reported that pneumothorax occurred in 10 patients, of whom 6 were intubated. Two of the intubated patients required chest tubes. Other studies have confirmed the low incidence of pneumothorax in patients undergoing thoracentesis, with rates such as 0.61%,1 5%,9 and 4%.10
The major predictor of postprocedural pneumothorax was the presence of symptoms such as chest pain and dyspnea. No intervention was necessary for most cases of pneumothorax in asymptomatic patients. The more widespread use of procedural ultrasonography may explain some discrepancies between the early5,6 and more recent studies.1,8–10
Several studies have demonstrated that postprocedural radiography is unnecessary unless a complication is suspected based on the patient’s symptoms or the need to demonstrate lung re-expansion.1,4,9,10 Clinical suspicion and the patient’s symptoms are the major predictors of procedure-related pneumothorax requiring treatment with a chest tube. Otherwise, incidentally discovered pneumothorax can usually be observed and managed supportively.
WHAT MECHANISMS UNDERLIE POSTPROCEDURAL PNEUMOTHORAX?
Major causes of pneumothorax in patients undergoing thoracentesis are direct puncture during needle or catheter insertion, the introduction of air through the needle or catheter into the pleural cavity, and the inability of the ipsilateral lung to fully expand after drainage of a large volume of fluid, known as pneumothorax ex vacuo.5
Pneumothorax ex vacuo may be seen in patients with medical conditions such as endobronchial obstruction, pleural scarring from long-standing pleural effusion, and lung malignancy, all of which can impair the lung’s ability to expand after removal of a large volume of pleural fluid. It is believed that transient parenchymal pleural fistulae form if the lung cannot expand, causing air leakage into the pleural cavity.5,8,9 Pleural manometry to monitor changes in pleural pressure and elastance can decrease the rates of pneumothorax ex vacuo in patients with the above risk factors.5
WHEN IS RADIOGRAPHY INDICATED AFTER THORACENTESIS?
Current literature suggests that imaging to evaluate for postprocedural complications should be done if there is suspicion of a complication, if thoracentesis required multiple attempts, if the procedure caused aspiration of air, if the patient has advanced lung disease, if the patient is scheduled to undergo thoracic radiation, if the patient is on mechanical ventilation, and after therapeutic thoracentesis if a large volume of fluid is removed.1–10 Routine chest radiography after thoracentesis is not supported in the literature in the absence of these risk factors.
Some practitioners order chest imaging after therapeutic thoracentesis to assess for residual pleural fluid and for visualization of other abnormalities previously hidden by pleural effusion, rather than simply to exclude postprocedural pneumothorax. Alternatively, postprocedural bedside pleural ultrasonography with recording of images can be done to assess for complications and residual pleural fluid volume without exposing the patient to radiation.11
Needle decompression and chest tube insertion should be considered in patients with tension pneumothorax, large pneumothorax (distance from the chest wall to the visceral pleural line of at least 2 cm), mechanical ventilation, progressing pneumothorax, and symptoms.
KEY POINTS
- Pneumothorax is a rare complication of thoracentesis when performed by a skilled operator using ultrasonographic guidance.
- Mechanisms behind the occurrence of pneumothorax are direct lung puncture, introduction of air into the pleural cavity, and pneumothorax ex vacuo.
- In asymptomatic patients, pneumothorax after thoracentesis rarely requires intervention beyond supportive care and close observation.
- Factors such as multiple thoracentesis attempts, symptoms, clinical suspicion, air aspiration during thoracentesis, presence of previous lung disease, and removal of a large volume of fluid may require postprocedural lung imaging (eg, bedside ultrasonography, radiography).
- Ault MJ, Rosen BT, Scher J, Feinglass J, Barsuk JH. Thoracentesis outcomes: a 12-year experience. Thorax 2015; 70(2):127–132. doi:10.1136/thoraxjnl-2014-206114
- Hibbert RM, Atwell TD, Lekah A, et al. Safety of ultrasound-guided thoracentesis in patients with abnormal preprocedural coagulation parameters. Chest 2013; 144(2):456–463. doi:10.1378/chest.12-2374
- Barnes TW, Morgenthaler TI, Olson EJ, Hesley GK, Decker PA, Ryu JH. Sonographically guided thoracentesis and rate of pneumothorax. J Clin Ultrasound 2005; 33(9):442–446. doi:10.1002/jcu.20163
- Gordon CE, Feller-Kopman D, Balk EM, Smetana GW. Pneumothorax following thoracentesis: a systematic review and meta-analysis. Arch Intern Med 2010; 170(4):332–339. doi:10.1001/archinternmed.2009.548
- Heidecker J, Huggins JT, Sahn SA, Doelken P. Pathophysiology of pneumothorax following ultrasound-guided thoracentesis. Chest 2006; 130(4):1173–1184. doi:10.1016/S0012-3692(15)51155-0
- Brandstetter RD, Karetzky M, Rastogi R, Lolis JD. Pneumothorax after thoracentesis in chronic obstructive pulmonary disease. Heart Lung 1994; 23(1):67–70. pmid:8150647
- Doyle JJ, Hnatiuk OW, Torrington KG, Slade AR, Howard RS. Necessity of routine chest roentgenography after thoracentesis. Ann Intern Med 1996; 124(9):816–820. pmid:8610950
- Gervais DA, Petersein A, Lee MJ, Hahn PF, Saini S, Mueller PR. US-guided thoracentesis: requirement for postprocedure chest radiography in patients who receive mechanical ventilation versus patients who breathe spontaneously. Radiology 1997; 204(2):503–506. doi:10.1148/radiology.204.2.9240544
- Capizzi SA, Prakash UB. Chest roentgenography after outpatient thoracentesis. Mayo Clin Proc 1998; 73(10):948–950. doi:10.4065/73.10.948
- Alemán C, Alegre J, Armadans L, et al. The value of chest roentgenography in the diagnosis of pneumothorax after thoracentesis. Am J Med 1999; 107(4):340–343. pmid:10527035
- Lichtenstein D. Lung ultrasound in the critically ill. Curr Opin Crit Care 2014; 20(3):315–322. doi:10.1097/MCC.0000000000000096
- Ault MJ, Rosen BT, Scher J, Feinglass J, Barsuk JH. Thoracentesis outcomes: a 12-year experience. Thorax 2015; 70(2):127–132. doi:10.1136/thoraxjnl-2014-206114
- Hibbert RM, Atwell TD, Lekah A, et al. Safety of ultrasound-guided thoracentesis in patients with abnormal preprocedural coagulation parameters. Chest 2013; 144(2):456–463. doi:10.1378/chest.12-2374
- Barnes TW, Morgenthaler TI, Olson EJ, Hesley GK, Decker PA, Ryu JH. Sonographically guided thoracentesis and rate of pneumothorax. J Clin Ultrasound 2005; 33(9):442–446. doi:10.1002/jcu.20163
- Gordon CE, Feller-Kopman D, Balk EM, Smetana GW. Pneumothorax following thoracentesis: a systematic review and meta-analysis. Arch Intern Med 2010; 170(4):332–339. doi:10.1001/archinternmed.2009.548
- Heidecker J, Huggins JT, Sahn SA, Doelken P. Pathophysiology of pneumothorax following ultrasound-guided thoracentesis. Chest 2006; 130(4):1173–1184. doi:10.1016/S0012-3692(15)51155-0
- Brandstetter RD, Karetzky M, Rastogi R, Lolis JD. Pneumothorax after thoracentesis in chronic obstructive pulmonary disease. Heart Lung 1994; 23(1):67–70. pmid:8150647
- Doyle JJ, Hnatiuk OW, Torrington KG, Slade AR, Howard RS. Necessity of routine chest roentgenography after thoracentesis. Ann Intern Med 1996; 124(9):816–820. pmid:8610950
- Gervais DA, Petersein A, Lee MJ, Hahn PF, Saini S, Mueller PR. US-guided thoracentesis: requirement for postprocedure chest radiography in patients who receive mechanical ventilation versus patients who breathe spontaneously. Radiology 1997; 204(2):503–506. doi:10.1148/radiology.204.2.9240544
- Capizzi SA, Prakash UB. Chest roentgenography after outpatient thoracentesis. Mayo Clin Proc 1998; 73(10):948–950. doi:10.4065/73.10.948
- Alemán C, Alegre J, Armadans L, et al. The value of chest roentgenography in the diagnosis of pneumothorax after thoracentesis. Am J Med 1999; 107(4):340–343. pmid:10527035
- Lichtenstein D. Lung ultrasound in the critically ill. Curr Opin Crit Care 2014; 20(3):315–322. doi:10.1097/MCC.0000000000000096
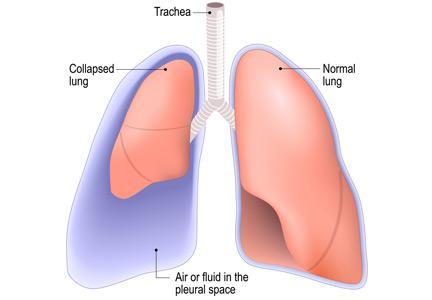
A 69-year-old woman with double vision and lower-extremity weakness
A 69-year-old woman was admitted to the hospital with double vision, weakness in the lower extremities, sensory loss, pain, and falls. Her symptoms started with sudden onset of horizontal diplopia 6 weeks before, followed by gradually worsening lower-extremity weakness, as well as ataxia and patchy and bilateral radicular burning leg pain more pronounced on the right. Her medical history included narcolepsy, obstructive sleep apnea, hypertension, hyperlipidemia, and bilateral knee replacements for osteoarthritis.
Neurologic examination showed inability to abduct the right eye, bilateral hip flexion weakness, decreased pinprick response, decreased proprioception, and diminished muscle stretch reflexes in the lower extremities. Magnetic resonance imaging (MRI) of the brain without contrast and magnetic resonance angiography of the brain and carotid arteries showed no evidence of acute stroke. No abnormalities were noted on electrocardiography and echocardiography.
A diagnosis of idiopathic peripheral neuropathy was made, and outpatient physical therapy was recommended. Over the subsequent 2 weeks, her condition declined to the point where she needed a walker. She continued to have worsening leg weakness with falls, prompting hospital readmission.
INITIAL EVALUATION
In addition to her diplopia and weakness, she said she had lost 15 pounds since the onset of symptoms and had experienced symptoms suggesting urinary retention.
Physical examination
Her temperature was 37°C (98.6°F), heart rate 79 beats per minute, blood pressure 117/86 mm Hg, respiratory rate 14 breaths per minute, and oxygen saturation 98% on room air. Examination of the head, neck, heart, lung, abdomen, lymph nodes, and extremities yielded nothing remarkable except for chronic venous changes in the lower extremities.
The neurologic examination showed incomplete lateral gaze bilaterally (cranial nerve VI dysfunction). Strength in the upper extremities was normal. In the legs, the Medical Research Council scale score for proximal muscle strength was 2 to 3 out of 5, and for distal muscles 3 to 4 out of 5, with the right side worse than the left and flexors and extensors affected equally. Muscle stretch reflexes were absent in both lower extremities and the left upper extremity, but intact in the right upper extremity. No abnormal corticospinal tract reflexes were elicited.
Sensory testing revealed diminished pin-prick perception in a length-dependent fashion in the lower extremities, reduced 50% compared with the hands. Gait could not be assessed due to weakness.
Initial laboratory testing
Results of initial laboratory tests—complete blood cell count, complete metabolic panel, erythrocyte sedimentation rate, C-reactive protein, thyroid-stimulating hormone, and hemoglobin A1c—were unremarkable.
FURTHER EVALUATION AND DIFFERENTIAL DIAGNOSIS
1. Which of the following is the most likely diagnosis at this point?
- Cerebral infarction
- Guillain-Barré syndrome
- Progressive polyneuropathy
- Transverse myelitis
- Polyradiculopathy
In the absence of definitive diagnostic tests, all of the above options were considered in the differential diagnosis for this patient.
Cerebral infarction
Although acute-onset diplopia can be explained by brainstem stroke involving cranial nerve nuclei or their projections, the onset of diplopia with progressive bilateral lower-extremity weakness makes stroke unlikely. Flaccid paralysis, areflexia of the lower extremities, and sensory involvement can also be caused by acute anterior spinal artery occlusion leading to spinal cord infarction; however, the deficits are usually maximal at onset.
Guillain-Barré syndrome
The combination of acute-subacute progressive ascending weakness, sensory involvement, and diminished or absent reflexes is typical of Guillain-Barré syndrome. Cranial nerve involvement can overlap with the more typical features of the syndrome. However, most patients reach the nadir of their disease by 4 weeks after initial symptom onset, even without treatment.1 This patient’s condition continued to worsen over 8 weeks. In addition, the asymmetric lower-extremity weakness and sparing of the arms are atypical for Guillain-Barré syndrome.
Given the progression of symptoms, chronic inflammatory demyelinating polyneuropathy is also a consideration, typically presenting as a relapsing or progressive neuropathy in proximal and distal muscles and worsening over at least an 8-week period.2
The initial workup for Guillain-Barré syndrome or chronic inflammatory demyelinating polyneuropathy includes lumbar puncture to assess for albuminocytologic dissociation (elevated protein with normal white blood cell count) in cerebrospinal fluid (CSF), and electromyography (EMG) to assess for neurophysiologic evidence of peripheral nerve demyelination. In Miller-Fisher syndrome, a rare variant of Guillain-Barré syndrome characterized by ataxia, ophthalmoparesis, and areflexia, serum ganglioside antibodies to GQ1b are found in over 90% of patients.3,4 Although MRI of the spine is not necessary to diagnose Guillain-Barré syndrome, it is often done to exclude other causes of lower-extremity weakness such as spinal cord or cauda equina compression that would require urgent neurosurgical consultation. MRI can support the diagnosis of Guillain-Barré syndrome when it reveals enhancement of the spinal nerve roots or cauda equina.
Other polyneuropathies
Polyneuropathy is caused by a variety of diseases that affect the function of peripheral motor, sensory, or autonomic nerves. The differential diagnosis is broad and involves inflammatory diseases (including autoimmune and paraneoplastic causes), hereditary disorders, infection, toxicity, and ischemic and nutritional deficiencies.5 Polyneuropathy can present in a distal-predominant, generalized, or asymmetric pattern involving individual nerve trunks termed “mononeuropathy multiplex,” as in our patient’s presentation. The initial workup includes EMG and a battery of serologic tests. In cases of severe and progressive polyneuropathy, nerve biopsy can assess for the presence of vasculitis, amyloidosis, and paraprotein deposition.
Transverse myelitis
Transverse myelitis is an inflammatory myelopathy that usually presents with acute or subacute weakness of the upper extremities or lower extremities, or both, corresponding to the level of the lesion, hyperreflexia, bladder and bowel dysfunction, spinal level of sensory loss, and autonomic involvement.6 The differential diagnosis of acute myelopathy includes:
- Infection (eg, herpes simplex virus, West Nile virus, Lyme disease, Mycoplasma pneumoniae, human immunodeficiency virus)
- Systemic inflammatory disease (systemic lupus erythematosus, sarcoidosis, Sjögren syndrome, scleroderma, paraneoplastic syndrome)
- Central nervous system demyelinating disease (acute disseminated encephalomyelitis, multiple sclerosis, neuromyelitis optica)
- Vascular malformation (dural arteriovenous fistula)
- Compression due to tumor, bleeding, disc herniation, infection, or abscess.
The workup involves laboratory tests to exclude systemic inflammatory and infectious causes, as well as MRI of the spine with and without contrast to identify a causative lesion. Lumbar puncture and CSF analysis may show pleocytosis, elevated protein concentration, and increased intrathecal immunoglobulin G (IgG) index.7
Although our patient’s presentation with subacute lower-extremity weakness, sensory changes, and bladder dysfunction were consistent with transverse myelitis, her cranial nerve abnormalities would be atypical for it.
Polyradiculopathy
Polyradiculopathy has many possible causes. In the United States, the most common causes are lumbar spondylosis, lumbar canal stenosis, and diabetic polyradiculoneuropathy.
When multiple spinal segments are affected, leptomeningeal disease involving the arachnoid and pia mater should be considered. Causes include malignant invasion, inflammatory cell accumulation, and protein deposition, leading to patchy but widespread dysfunction of spinal nerve roots and cranial nerves. Specific causes are myriad and include carcinomatous meningitis,8 syphilis, tuberculosis, sarcoidosis, and paraproteinemias. CSF and MRI changes are often nonspecific, leading to the need for meningeal biopsy for diagnosis.
CASE CONTINUED
During her hospitalization, our patient developed acute right upper and lower facial weakness consistent with peripheral facial mononeuropathy. Bilateral lower-extremity weakness progressed to disabling paraparesis.
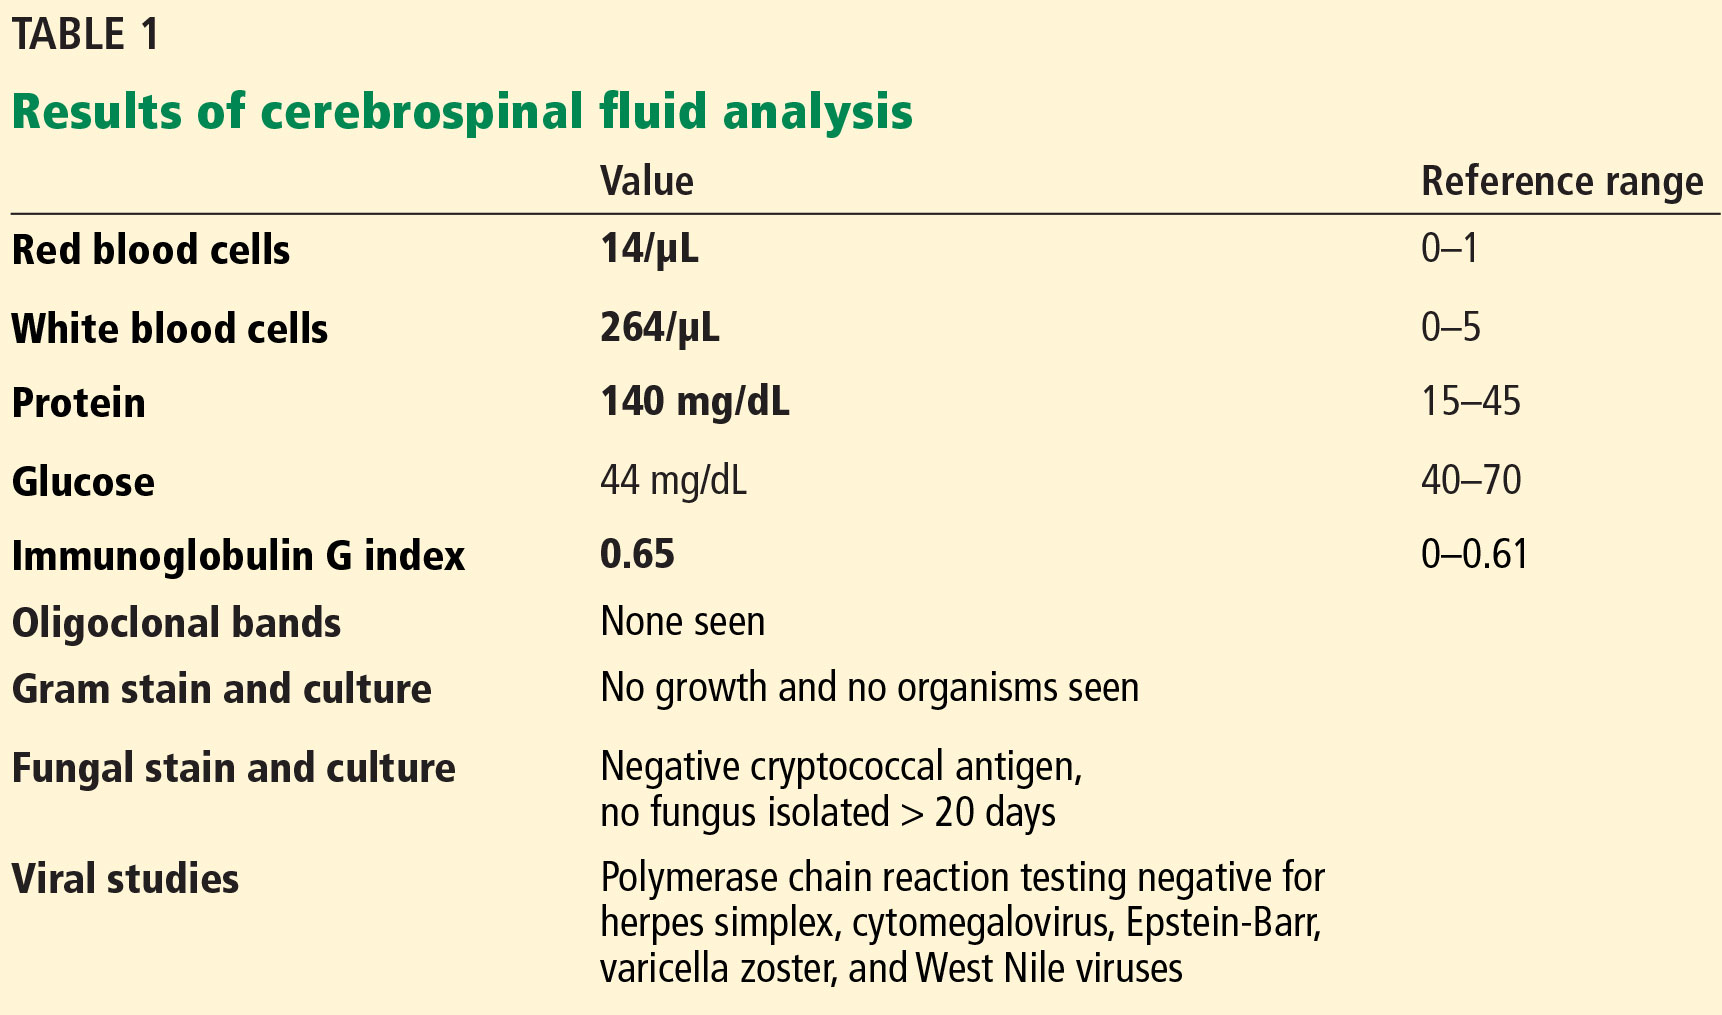
She underwent lumbar puncture and CSF analysis (Table 1). The most notable findings were significant pleocytosis (72% lymphocytic predominance), protein elevation, and elevated IgG index (indicative of elevated intrathecal immunoglobulin synthesis in the central nervous system). Viral, bacterial, and fungal studies were negative. Guillain-Barré syndrome, other polyneuropathies, and spinal cord infarction would not be expected with these CSF features.
Surface EMG demonstrated normal sensory responses, and needle EMG showed chronic and active motor axon loss in the L3 and S1 root distributions, suggesting polyradiculopathy without polyneuropathy. These findings would not be expected in typical acute transverse myelitis but could be seen with spinal cord infarction.
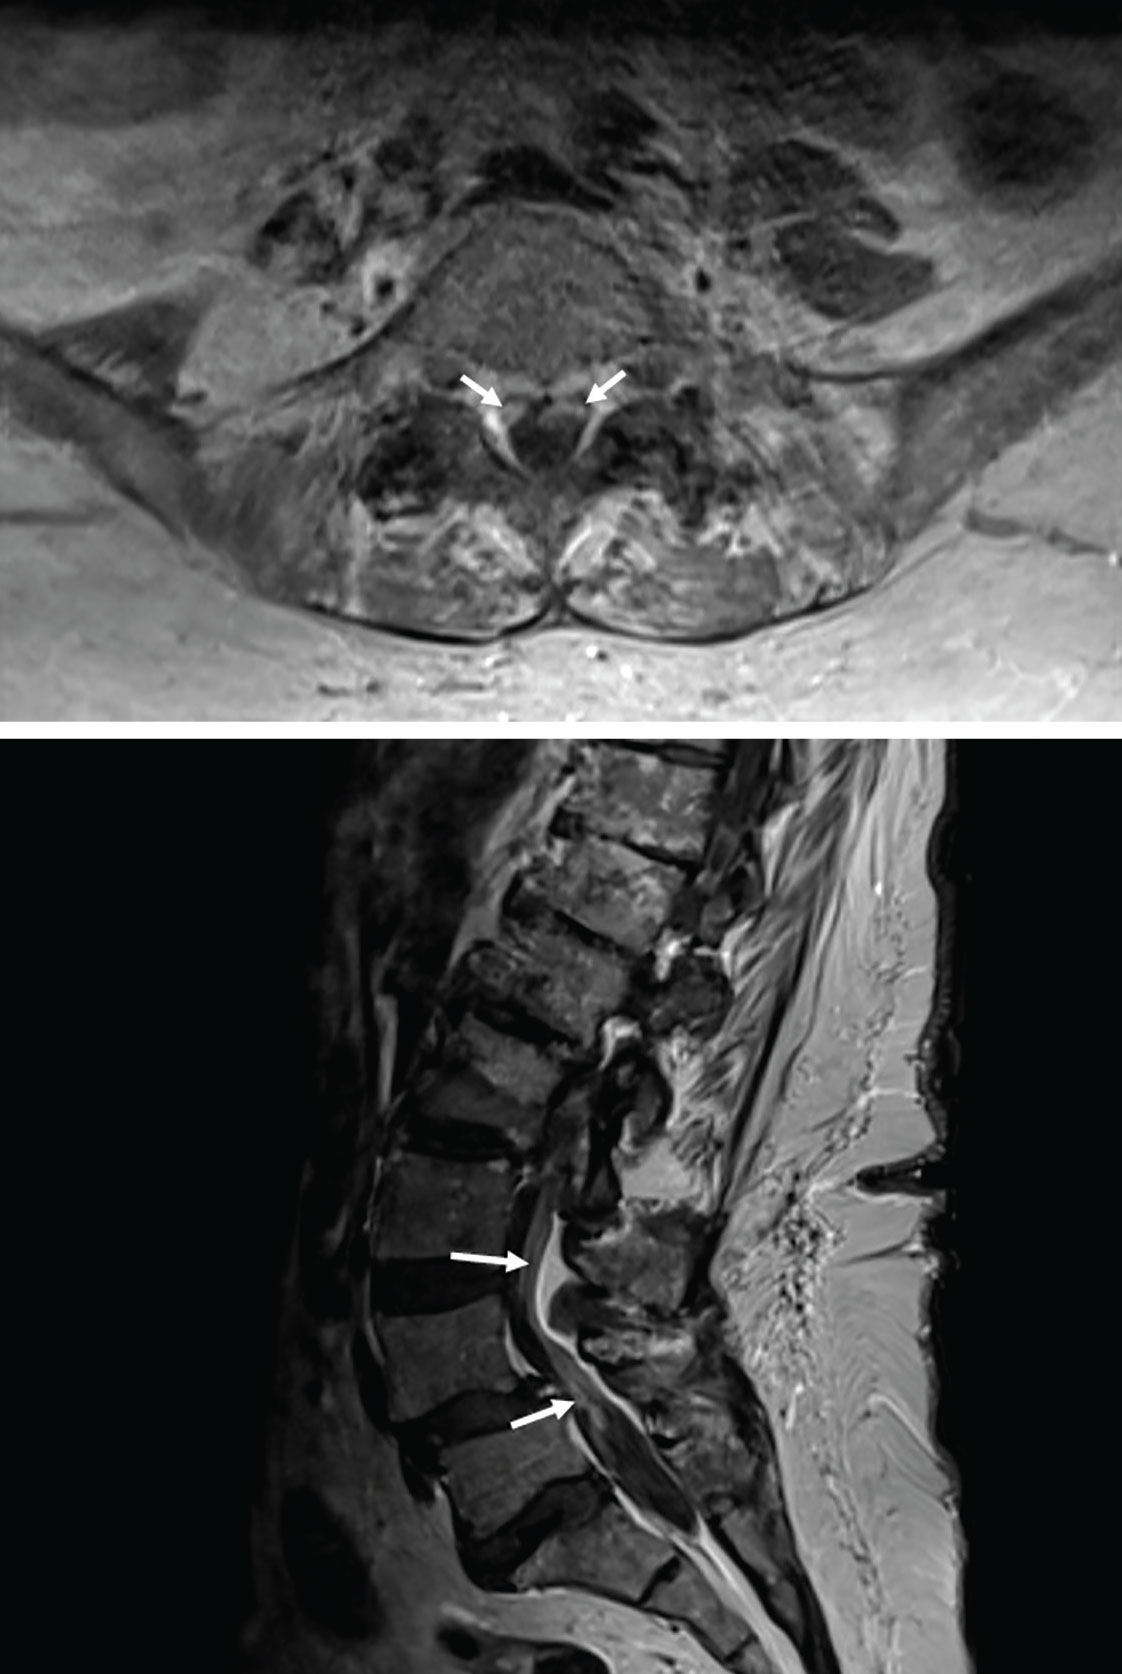
MRI of the entire spine with and without contrast showed cauda equina nerve root thickening and enhancement, especially involving the L5 and S1 roots (Figure 1). The spinal cord appeared normal. These findings further supported polyradiculopathy and a leptomeningeal process.
Further evaluation included chest radiography, erythrocyte sedimentation rate, C-reactive protein, hemoglobin A1c, human immunodeficiency virus testing, antinuclear antibody, antineutrophil cytoplasmic antibody, extractable nuclear antibody, GQ1b antibody, serum and CSF paraneoplastic panels, levels of vitamin B1, B12, and B6, copper, and ceruloplasmin, and a screen for heavy metals. All results were within normal ranges.
ESTABLISHING THE DIAGNOSIS
Serum monoclonal protein analysis with immunofixation revealed IgM kappa monoclonal gammopathy with an IgM level of 1,570 (reference range 53–334 mg/dL) and M-spike 0.75 (0.00 mg/dL), serum free kappa light chains 61.1 (3.30–19.40 mg/L), lambda 9.3 (5.7–26.3 mg/L), and kappa-lambda ratio 6.57 (0.26–1.65).
2. Which is the best next step in this patient’s neurologic evaluation?
- Test CSF angiotensin-converting enzyme level
- CSF cytology
- Meningeal biopsy
- Peripheral nerve biopsy
Given the high suspicion for malignancy, CSF cytology was performed and showed increased numbers of mononuclear chronic inflammatory cells, including a mixture of lymphocytes and monocytes, favoring a reactive lymphoid pleocytosis. Flow cytometry indicated the presence of a monoclonal, CD5- and CD10- negative, B-cell lymphoproliferative disorder. The immunophenotypic findings were not specific for a single diagnosis. The differential diagnosis included marginal zone lymphoma and lymphoplasmacytic lymphoma.
3. Given the presence of serum IgM monoclonal gammopathy in this patient, which is the most likely diagnosis?
- Neurosarcoidosis
- Multiple myeloma
- Waldenström macroglobulinemia
- Carcinomatous meningitis
Study of bone marrow biopsy demonstrated limited bone marrow involvement (1%) by a lymphoproliferative disorder with plasmacytoid features, and DNA testing detected an MYD88 L265P mutation, reported to be present in 90% of patients with Waldenström macroglobulinemia.9 This finding confirmed the diagnosis of Waldenström macroglobulinemia with central nervous system involvement. Our patient began therapy with rituximab and methotrexate, which resulted in some improvement in strength, gait, and vision.
WALDENSTRÖM MACROGLOBULINEMIA AND BING-NEEL SYNDROME
Waldenström macroglobulinemia is a lymphoplasmacytic lymphoma associated with a monoclonal IgM protein.10 It is considered a paraproteinemic disorder, similar to multiple myeloma. The presenting symptoms and complications are related to direct tumor infiltration, hyperviscosity syndrome, and deposition of IgM in various tissues.11,12
Waldenström macroglobulinemia is usually indolent, and treatment is reserved for patients with symptoms.13,14 It includes rituximab, usually in combination with chemotherapy or other targeted agents.15,16
Paraneoplastic antibody-mediated polyneuropathy may occur in these patients. However, the pattern is usually symmetrical clinically, with demyelination on EMG, and is not associated with cranial nerve or meningeal involvement. Management with plasmapheresis, corticosteroids, and intravenous immunoglobulin has not been shown to be effective.17
Involvement of the central nervous system as a complication of Waldenström macroglobulinemia has been described as Bing-Neel syndrome. It can present as diffuse malignant cell infiltration of the leptomeningeal space, white matter, or spinal cord, or in a tumoral form presenting as intraparenchymal masses or nodular lesions. The distinction between the tumoral and diffuse forms is based primarily on imaging findings.18
In a report of 44 patients with Bing-Neel syndrome, 36% presented with the disorder as the initial manifestation of Waldenström macroglobulinemia.18 The primary presenting symptoms were imbalance and gait difficulty (48%) and cranial nerve involvement (36%), which presented as predominantly facial or oculomotor nerve palsy. Cauda equina syndrome with motor involvement (seen in our patient) occurred in 14% of patients. Other presenting symptoms included cognitive impairment, sensory deficits, headache, dysarthria, aphasia, and seizures.
LEARNING POINTS
The differential diagnosis for patients presenting with multifocal neurologic symptoms can be broad, and a systematic approach to the diagnosis is necessary. Localizing the lesion is important in determining the diagnosis for patients presenting with neurologic symptoms. The process of localization begins with taking the history, is further refined during the examination, and is confirmed with diagnostic studies. Atypical presentations of relatively common neurologic diseases such as Guillain-Barré syndrome, transverse myelitis, and peripheral polyneuropathy do occur, but uncommon diagnoses need to be considered when support for the initial diagnosis is lacking.
- Fokke C, van den Berg B, Drenthen J, Walgaard C, van Doorn PA, Jacobs BC. Diagnosis of Guillain-Barre syndrome and validation of Brighton criteria. Brain 2014; 137(Pt 1):33–43. doi:10.1093/brain/awt285
- Mathey EK, Park SB, Hughes RA, et al. Chronic inflammatory demyelinating polyradiculoneuropathy: from pathology to phenotype. J Neurol Neurosurg Psychiatry 2015; 86(9):973–985. doi:10.1136/jnnp-2014-309697
- Chiba A, Kusunoki S, Obata H, Machinami R, Kanazawa I. Serum anti-GQ1b IgG antibody is associated with ophthalmoplegia in Miller Fisher syndrome and Guillain-Barré syndrome: clinical and immunohistochemical studies. Neurology 1993; 43(10):1911–1917. pmid:8413947
- Teener J. Miller Fisher’s syndrome. Semin Neurol 2012; 32(5):512–516. doi:10.1055/s-0033-1334470
- Watson JC, Dyck PJ. Peripheral neuropathy: a practical approach to diagnosis and symptom management. Mayo Clin Proc 2015; 90(7):940–951. doi:10.1016/j.mayocp.2015.05.004
- Greenberg BM. Treatment of acute transverse myelitis and its early complications. Continuum (Minneap Minn) 2011; 17(4):733–743. doi:10.1212/01.CON.0000403792.36161.f5
- West TW. Transverse myelitis—a review of the presentation, diagnosis, and initial management. Discov Med 2013; 16(88):167–177. pmid:24099672
- Le Rhun E, Taillibert S, Chamberlain MC. Carcinomatous meningitis: leptomeningeal metastases in solid tumors. Surg Neurol Int 2013; 4(suppl 4):S265–S288. doi:10.4103/2152-7806.111304
- Treon SP, Xu L, Yang G, et al. MYD88 L265P somatic mutation in Waldenström’s macroglobulinemia. N Engl J Med 2012; 367(9):826–833. doi:10.1056/NEJMoa1200710
- Owen RG, Treon SP, Al-Katib A, et al. Clinicopathological definition of Waldenstrom’s macroglobulinemia: consensus panel recommendations from the Second International Workshop on Waldenstrom’s Macroglobulinemia. Semin Oncol 2003; 30(2):110–115. doi:10.1053/sonc.2003.50082
- Björkholm M, Johansson E, Papamichael D, et al. Patterns of clinical presentation, treatment, and outcome in patients with Waldenstrom’s macroglobulinemia: a two-institution study. Semin Oncol 2003; 30(2):226–230. doi:10.1053/sonc.2003.50054
- Rison RA, Beydoun SR. Paraproteinemic neuropathy: a practical review. BMC Neurol 2016; 16:13. doi:10.1186/s12883-016-0532-4
- Kyle RA, Benson J, Larson D, et al. IgM monoclonal gammopathy of undetermined significance and smoldering Waldenström’s macroglobulinemia. Clin Lymphoma Myeloma 2009; 9(1):17–18. doi:10.3816/CLM.2009.n.002
- Kyle RA, Benson JT, Larson DR, et al. Progression in smoldering Waldenstrom macroglobulinemia: long-term results. Blood 2012; 119(19):4462–4466. doi:10.1182/blood-2011-10-384768
- Leblond V, Kastritis E, Advani R, et al. Treatment recommendations from the Eighth International Workshop on Waldenström’s macroglobulinemia. Blood 2016; 128(10):1321–1328. doi:10.1182/blood-2016-04-711234
- Kapoor P, Ansell SM, Fonseca R, et al. Diagnosis and management of Waldenström macroglobulinemia: Mayo stratification of macroglobulinemia and risk-adapted therapy (mSMART) guidelines 2016. JAMA Oncol 2017; 3(9):1257–1265. doi:10.1001/jamaoncol.2016.5763
- D’Sa S, Kersten MJ, Castillo JJ, et al. Investigation and management of IgM and Waldenström-associated peripheral neuropathies: recommendations from the IWWM-8 consensus panel. Br J Haematol 2017; 176(5):728–742. doi:10.1111/bjh.14492
- Simon L, Fitsiori A, Lemal R, et al. Bing-Neel syndrome, a rare complication of Waldenström macroglobulinemia: analysis of 44 cases and review of the literature. A study on behalf of the French Innovative Leukemia Organization (FILO). Haematologica 2015; 100(12):1587–1594. doi:10.3324/haematol.2015.133744
A 69-year-old woman was admitted to the hospital with double vision, weakness in the lower extremities, sensory loss, pain, and falls. Her symptoms started with sudden onset of horizontal diplopia 6 weeks before, followed by gradually worsening lower-extremity weakness, as well as ataxia and patchy and bilateral radicular burning leg pain more pronounced on the right. Her medical history included narcolepsy, obstructive sleep apnea, hypertension, hyperlipidemia, and bilateral knee replacements for osteoarthritis.
Neurologic examination showed inability to abduct the right eye, bilateral hip flexion weakness, decreased pinprick response, decreased proprioception, and diminished muscle stretch reflexes in the lower extremities. Magnetic resonance imaging (MRI) of the brain without contrast and magnetic resonance angiography of the brain and carotid arteries showed no evidence of acute stroke. No abnormalities were noted on electrocardiography and echocardiography.
A diagnosis of idiopathic peripheral neuropathy was made, and outpatient physical therapy was recommended. Over the subsequent 2 weeks, her condition declined to the point where she needed a walker. She continued to have worsening leg weakness with falls, prompting hospital readmission.
INITIAL EVALUATION
In addition to her diplopia and weakness, she said she had lost 15 pounds since the onset of symptoms and had experienced symptoms suggesting urinary retention.
Physical examination
Her temperature was 37°C (98.6°F), heart rate 79 beats per minute, blood pressure 117/86 mm Hg, respiratory rate 14 breaths per minute, and oxygen saturation 98% on room air. Examination of the head, neck, heart, lung, abdomen, lymph nodes, and extremities yielded nothing remarkable except for chronic venous changes in the lower extremities.
The neurologic examination showed incomplete lateral gaze bilaterally (cranial nerve VI dysfunction). Strength in the upper extremities was normal. In the legs, the Medical Research Council scale score for proximal muscle strength was 2 to 3 out of 5, and for distal muscles 3 to 4 out of 5, with the right side worse than the left and flexors and extensors affected equally. Muscle stretch reflexes were absent in both lower extremities and the left upper extremity, but intact in the right upper extremity. No abnormal corticospinal tract reflexes were elicited.
Sensory testing revealed diminished pin-prick perception in a length-dependent fashion in the lower extremities, reduced 50% compared with the hands. Gait could not be assessed due to weakness.
Initial laboratory testing
Results of initial laboratory tests—complete blood cell count, complete metabolic panel, erythrocyte sedimentation rate, C-reactive protein, thyroid-stimulating hormone, and hemoglobin A1c—were unremarkable.
FURTHER EVALUATION AND DIFFERENTIAL DIAGNOSIS
1. Which of the following is the most likely diagnosis at this point?
- Cerebral infarction
- Guillain-Barré syndrome
- Progressive polyneuropathy
- Transverse myelitis
- Polyradiculopathy
In the absence of definitive diagnostic tests, all of the above options were considered in the differential diagnosis for this patient.
Cerebral infarction
Although acute-onset diplopia can be explained by brainstem stroke involving cranial nerve nuclei or their projections, the onset of diplopia with progressive bilateral lower-extremity weakness makes stroke unlikely. Flaccid paralysis, areflexia of the lower extremities, and sensory involvement can also be caused by acute anterior spinal artery occlusion leading to spinal cord infarction; however, the deficits are usually maximal at onset.
Guillain-Barré syndrome
The combination of acute-subacute progressive ascending weakness, sensory involvement, and diminished or absent reflexes is typical of Guillain-Barré syndrome. Cranial nerve involvement can overlap with the more typical features of the syndrome. However, most patients reach the nadir of their disease by 4 weeks after initial symptom onset, even without treatment.1 This patient’s condition continued to worsen over 8 weeks. In addition, the asymmetric lower-extremity weakness and sparing of the arms are atypical for Guillain-Barré syndrome.
Given the progression of symptoms, chronic inflammatory demyelinating polyneuropathy is also a consideration, typically presenting as a relapsing or progressive neuropathy in proximal and distal muscles and worsening over at least an 8-week period.2
The initial workup for Guillain-Barré syndrome or chronic inflammatory demyelinating polyneuropathy includes lumbar puncture to assess for albuminocytologic dissociation (elevated protein with normal white blood cell count) in cerebrospinal fluid (CSF), and electromyography (EMG) to assess for neurophysiologic evidence of peripheral nerve demyelination. In Miller-Fisher syndrome, a rare variant of Guillain-Barré syndrome characterized by ataxia, ophthalmoparesis, and areflexia, serum ganglioside antibodies to GQ1b are found in over 90% of patients.3,4 Although MRI of the spine is not necessary to diagnose Guillain-Barré syndrome, it is often done to exclude other causes of lower-extremity weakness such as spinal cord or cauda equina compression that would require urgent neurosurgical consultation. MRI can support the diagnosis of Guillain-Barré syndrome when it reveals enhancement of the spinal nerve roots or cauda equina.
Other polyneuropathies
Polyneuropathy is caused by a variety of diseases that affect the function of peripheral motor, sensory, or autonomic nerves. The differential diagnosis is broad and involves inflammatory diseases (including autoimmune and paraneoplastic causes), hereditary disorders, infection, toxicity, and ischemic and nutritional deficiencies.5 Polyneuropathy can present in a distal-predominant, generalized, or asymmetric pattern involving individual nerve trunks termed “mononeuropathy multiplex,” as in our patient’s presentation. The initial workup includes EMG and a battery of serologic tests. In cases of severe and progressive polyneuropathy, nerve biopsy can assess for the presence of vasculitis, amyloidosis, and paraprotein deposition.
Transverse myelitis
Transverse myelitis is an inflammatory myelopathy that usually presents with acute or subacute weakness of the upper extremities or lower extremities, or both, corresponding to the level of the lesion, hyperreflexia, bladder and bowel dysfunction, spinal level of sensory loss, and autonomic involvement.6 The differential diagnosis of acute myelopathy includes:
- Infection (eg, herpes simplex virus, West Nile virus, Lyme disease, Mycoplasma pneumoniae, human immunodeficiency virus)
- Systemic inflammatory disease (systemic lupus erythematosus, sarcoidosis, Sjögren syndrome, scleroderma, paraneoplastic syndrome)
- Central nervous system demyelinating disease (acute disseminated encephalomyelitis, multiple sclerosis, neuromyelitis optica)
- Vascular malformation (dural arteriovenous fistula)
- Compression due to tumor, bleeding, disc herniation, infection, or abscess.
The workup involves laboratory tests to exclude systemic inflammatory and infectious causes, as well as MRI of the spine with and without contrast to identify a causative lesion. Lumbar puncture and CSF analysis may show pleocytosis, elevated protein concentration, and increased intrathecal immunoglobulin G (IgG) index.7
Although our patient’s presentation with subacute lower-extremity weakness, sensory changes, and bladder dysfunction were consistent with transverse myelitis, her cranial nerve abnormalities would be atypical for it.
Polyradiculopathy
Polyradiculopathy has many possible causes. In the United States, the most common causes are lumbar spondylosis, lumbar canal stenosis, and diabetic polyradiculoneuropathy.
When multiple spinal segments are affected, leptomeningeal disease involving the arachnoid and pia mater should be considered. Causes include malignant invasion, inflammatory cell accumulation, and protein deposition, leading to patchy but widespread dysfunction of spinal nerve roots and cranial nerves. Specific causes are myriad and include carcinomatous meningitis,8 syphilis, tuberculosis, sarcoidosis, and paraproteinemias. CSF and MRI changes are often nonspecific, leading to the need for meningeal biopsy for diagnosis.
CASE CONTINUED
During her hospitalization, our patient developed acute right upper and lower facial weakness consistent with peripheral facial mononeuropathy. Bilateral lower-extremity weakness progressed to disabling paraparesis.
She underwent lumbar puncture and CSF analysis (Table 1). The most notable findings were significant pleocytosis (72% lymphocytic predominance), protein elevation, and elevated IgG index (indicative of elevated intrathecal immunoglobulin synthesis in the central nervous system). Viral, bacterial, and fungal studies were negative. Guillain-Barré syndrome, other polyneuropathies, and spinal cord infarction would not be expected with these CSF features.
Surface EMG demonstrated normal sensory responses, and needle EMG showed chronic and active motor axon loss in the L3 and S1 root distributions, suggesting polyradiculopathy without polyneuropathy. These findings would not be expected in typical acute transverse myelitis but could be seen with spinal cord infarction.
MRI of the entire spine with and without contrast showed cauda equina nerve root thickening and enhancement, especially involving the L5 and S1 roots (Figure 1). The spinal cord appeared normal. These findings further supported polyradiculopathy and a leptomeningeal process.
Further evaluation included chest radiography, erythrocyte sedimentation rate, C-reactive protein, hemoglobin A1c, human immunodeficiency virus testing, antinuclear antibody, antineutrophil cytoplasmic antibody, extractable nuclear antibody, GQ1b antibody, serum and CSF paraneoplastic panels, levels of vitamin B1, B12, and B6, copper, and ceruloplasmin, and a screen for heavy metals. All results were within normal ranges.
ESTABLISHING THE DIAGNOSIS
Serum monoclonal protein analysis with immunofixation revealed IgM kappa monoclonal gammopathy with an IgM level of 1,570 (reference range 53–334 mg/dL) and M-spike 0.75 (0.00 mg/dL), serum free kappa light chains 61.1 (3.30–19.40 mg/L), lambda 9.3 (5.7–26.3 mg/L), and kappa-lambda ratio 6.57 (0.26–1.65).
2. Which is the best next step in this patient’s neurologic evaluation?
- Test CSF angiotensin-converting enzyme level
- CSF cytology
- Meningeal biopsy
- Peripheral nerve biopsy
Given the high suspicion for malignancy, CSF cytology was performed and showed increased numbers of mononuclear chronic inflammatory cells, including a mixture of lymphocytes and monocytes, favoring a reactive lymphoid pleocytosis. Flow cytometry indicated the presence of a monoclonal, CD5- and CD10- negative, B-cell lymphoproliferative disorder. The immunophenotypic findings were not specific for a single diagnosis. The differential diagnosis included marginal zone lymphoma and lymphoplasmacytic lymphoma.
3. Given the presence of serum IgM monoclonal gammopathy in this patient, which is the most likely diagnosis?
- Neurosarcoidosis
- Multiple myeloma
- Waldenström macroglobulinemia
- Carcinomatous meningitis
Study of bone marrow biopsy demonstrated limited bone marrow involvement (1%) by a lymphoproliferative disorder with plasmacytoid features, and DNA testing detected an MYD88 L265P mutation, reported to be present in 90% of patients with Waldenström macroglobulinemia.9 This finding confirmed the diagnosis of Waldenström macroglobulinemia with central nervous system involvement. Our patient began therapy with rituximab and methotrexate, which resulted in some improvement in strength, gait, and vision.
WALDENSTRÖM MACROGLOBULINEMIA AND BING-NEEL SYNDROME
Waldenström macroglobulinemia is a lymphoplasmacytic lymphoma associated with a monoclonal IgM protein.10 It is considered a paraproteinemic disorder, similar to multiple myeloma. The presenting symptoms and complications are related to direct tumor infiltration, hyperviscosity syndrome, and deposition of IgM in various tissues.11,12
Waldenström macroglobulinemia is usually indolent, and treatment is reserved for patients with symptoms.13,14 It includes rituximab, usually in combination with chemotherapy or other targeted agents.15,16
Paraneoplastic antibody-mediated polyneuropathy may occur in these patients. However, the pattern is usually symmetrical clinically, with demyelination on EMG, and is not associated with cranial nerve or meningeal involvement. Management with plasmapheresis, corticosteroids, and intravenous immunoglobulin has not been shown to be effective.17
Involvement of the central nervous system as a complication of Waldenström macroglobulinemia has been described as Bing-Neel syndrome. It can present as diffuse malignant cell infiltration of the leptomeningeal space, white matter, or spinal cord, or in a tumoral form presenting as intraparenchymal masses or nodular lesions. The distinction between the tumoral and diffuse forms is based primarily on imaging findings.18
In a report of 44 patients with Bing-Neel syndrome, 36% presented with the disorder as the initial manifestation of Waldenström macroglobulinemia.18 The primary presenting symptoms were imbalance and gait difficulty (48%) and cranial nerve involvement (36%), which presented as predominantly facial or oculomotor nerve palsy. Cauda equina syndrome with motor involvement (seen in our patient) occurred in 14% of patients. Other presenting symptoms included cognitive impairment, sensory deficits, headache, dysarthria, aphasia, and seizures.
LEARNING POINTS
The differential diagnosis for patients presenting with multifocal neurologic symptoms can be broad, and a systematic approach to the diagnosis is necessary. Localizing the lesion is important in determining the diagnosis for patients presenting with neurologic symptoms. The process of localization begins with taking the history, is further refined during the examination, and is confirmed with diagnostic studies. Atypical presentations of relatively common neurologic diseases such as Guillain-Barré syndrome, transverse myelitis, and peripheral polyneuropathy do occur, but uncommon diagnoses need to be considered when support for the initial diagnosis is lacking.
A 69-year-old woman was admitted to the hospital with double vision, weakness in the lower extremities, sensory loss, pain, and falls. Her symptoms started with sudden onset of horizontal diplopia 6 weeks before, followed by gradually worsening lower-extremity weakness, as well as ataxia and patchy and bilateral radicular burning leg pain more pronounced on the right. Her medical history included narcolepsy, obstructive sleep apnea, hypertension, hyperlipidemia, and bilateral knee replacements for osteoarthritis.
Neurologic examination showed inability to abduct the right eye, bilateral hip flexion weakness, decreased pinprick response, decreased proprioception, and diminished muscle stretch reflexes in the lower extremities. Magnetic resonance imaging (MRI) of the brain without contrast and magnetic resonance angiography of the brain and carotid arteries showed no evidence of acute stroke. No abnormalities were noted on electrocardiography and echocardiography.
A diagnosis of idiopathic peripheral neuropathy was made, and outpatient physical therapy was recommended. Over the subsequent 2 weeks, her condition declined to the point where she needed a walker. She continued to have worsening leg weakness with falls, prompting hospital readmission.
INITIAL EVALUATION
In addition to her diplopia and weakness, she said she had lost 15 pounds since the onset of symptoms and had experienced symptoms suggesting urinary retention.
Physical examination
Her temperature was 37°C (98.6°F), heart rate 79 beats per minute, blood pressure 117/86 mm Hg, respiratory rate 14 breaths per minute, and oxygen saturation 98% on room air. Examination of the head, neck, heart, lung, abdomen, lymph nodes, and extremities yielded nothing remarkable except for chronic venous changes in the lower extremities.
The neurologic examination showed incomplete lateral gaze bilaterally (cranial nerve VI dysfunction). Strength in the upper extremities was normal. In the legs, the Medical Research Council scale score for proximal muscle strength was 2 to 3 out of 5, and for distal muscles 3 to 4 out of 5, with the right side worse than the left and flexors and extensors affected equally. Muscle stretch reflexes were absent in both lower extremities and the left upper extremity, but intact in the right upper extremity. No abnormal corticospinal tract reflexes were elicited.
Sensory testing revealed diminished pin-prick perception in a length-dependent fashion in the lower extremities, reduced 50% compared with the hands. Gait could not be assessed due to weakness.
Initial laboratory testing
Results of initial laboratory tests—complete blood cell count, complete metabolic panel, erythrocyte sedimentation rate, C-reactive protein, thyroid-stimulating hormone, and hemoglobin A1c—were unremarkable.
FURTHER EVALUATION AND DIFFERENTIAL DIAGNOSIS
1. Which of the following is the most likely diagnosis at this point?
- Cerebral infarction
- Guillain-Barré syndrome
- Progressive polyneuropathy
- Transverse myelitis
- Polyradiculopathy
In the absence of definitive diagnostic tests, all of the above options were considered in the differential diagnosis for this patient.
Cerebral infarction
Although acute-onset diplopia can be explained by brainstem stroke involving cranial nerve nuclei or their projections, the onset of diplopia with progressive bilateral lower-extremity weakness makes stroke unlikely. Flaccid paralysis, areflexia of the lower extremities, and sensory involvement can also be caused by acute anterior spinal artery occlusion leading to spinal cord infarction; however, the deficits are usually maximal at onset.
Guillain-Barré syndrome
The combination of acute-subacute progressive ascending weakness, sensory involvement, and diminished or absent reflexes is typical of Guillain-Barré syndrome. Cranial nerve involvement can overlap with the more typical features of the syndrome. However, most patients reach the nadir of their disease by 4 weeks after initial symptom onset, even without treatment.1 This patient’s condition continued to worsen over 8 weeks. In addition, the asymmetric lower-extremity weakness and sparing of the arms are atypical for Guillain-Barré syndrome.
Given the progression of symptoms, chronic inflammatory demyelinating polyneuropathy is also a consideration, typically presenting as a relapsing or progressive neuropathy in proximal and distal muscles and worsening over at least an 8-week period.2
The initial workup for Guillain-Barré syndrome or chronic inflammatory demyelinating polyneuropathy includes lumbar puncture to assess for albuminocytologic dissociation (elevated protein with normal white blood cell count) in cerebrospinal fluid (CSF), and electromyography (EMG) to assess for neurophysiologic evidence of peripheral nerve demyelination. In Miller-Fisher syndrome, a rare variant of Guillain-Barré syndrome characterized by ataxia, ophthalmoparesis, and areflexia, serum ganglioside antibodies to GQ1b are found in over 90% of patients.3,4 Although MRI of the spine is not necessary to diagnose Guillain-Barré syndrome, it is often done to exclude other causes of lower-extremity weakness such as spinal cord or cauda equina compression that would require urgent neurosurgical consultation. MRI can support the diagnosis of Guillain-Barré syndrome when it reveals enhancement of the spinal nerve roots or cauda equina.
Other polyneuropathies
Polyneuropathy is caused by a variety of diseases that affect the function of peripheral motor, sensory, or autonomic nerves. The differential diagnosis is broad and involves inflammatory diseases (including autoimmune and paraneoplastic causes), hereditary disorders, infection, toxicity, and ischemic and nutritional deficiencies.5 Polyneuropathy can present in a distal-predominant, generalized, or asymmetric pattern involving individual nerve trunks termed “mononeuropathy multiplex,” as in our patient’s presentation. The initial workup includes EMG and a battery of serologic tests. In cases of severe and progressive polyneuropathy, nerve biopsy can assess for the presence of vasculitis, amyloidosis, and paraprotein deposition.
Transverse myelitis
Transverse myelitis is an inflammatory myelopathy that usually presents with acute or subacute weakness of the upper extremities or lower extremities, or both, corresponding to the level of the lesion, hyperreflexia, bladder and bowel dysfunction, spinal level of sensory loss, and autonomic involvement.6 The differential diagnosis of acute myelopathy includes:
- Infection (eg, herpes simplex virus, West Nile virus, Lyme disease, Mycoplasma pneumoniae, human immunodeficiency virus)
- Systemic inflammatory disease (systemic lupus erythematosus, sarcoidosis, Sjögren syndrome, scleroderma, paraneoplastic syndrome)
- Central nervous system demyelinating disease (acute disseminated encephalomyelitis, multiple sclerosis, neuromyelitis optica)
- Vascular malformation (dural arteriovenous fistula)
- Compression due to tumor, bleeding, disc herniation, infection, or abscess.
The workup involves laboratory tests to exclude systemic inflammatory and infectious causes, as well as MRI of the spine with and without contrast to identify a causative lesion. Lumbar puncture and CSF analysis may show pleocytosis, elevated protein concentration, and increased intrathecal immunoglobulin G (IgG) index.7
Although our patient’s presentation with subacute lower-extremity weakness, sensory changes, and bladder dysfunction were consistent with transverse myelitis, her cranial nerve abnormalities would be atypical for it.
Polyradiculopathy
Polyradiculopathy has many possible causes. In the United States, the most common causes are lumbar spondylosis, lumbar canal stenosis, and diabetic polyradiculoneuropathy.
When multiple spinal segments are affected, leptomeningeal disease involving the arachnoid and pia mater should be considered. Causes include malignant invasion, inflammatory cell accumulation, and protein deposition, leading to patchy but widespread dysfunction of spinal nerve roots and cranial nerves. Specific causes are myriad and include carcinomatous meningitis,8 syphilis, tuberculosis, sarcoidosis, and paraproteinemias. CSF and MRI changes are often nonspecific, leading to the need for meningeal biopsy for diagnosis.
CASE CONTINUED
During her hospitalization, our patient developed acute right upper and lower facial weakness consistent with peripheral facial mononeuropathy. Bilateral lower-extremity weakness progressed to disabling paraparesis.
She underwent lumbar puncture and CSF analysis (Table 1). The most notable findings were significant pleocytosis (72% lymphocytic predominance), protein elevation, and elevated IgG index (indicative of elevated intrathecal immunoglobulin synthesis in the central nervous system). Viral, bacterial, and fungal studies were negative. Guillain-Barré syndrome, other polyneuropathies, and spinal cord infarction would not be expected with these CSF features.
Surface EMG demonstrated normal sensory responses, and needle EMG showed chronic and active motor axon loss in the L3 and S1 root distributions, suggesting polyradiculopathy without polyneuropathy. These findings would not be expected in typical acute transverse myelitis but could be seen with spinal cord infarction.
MRI of the entire spine with and without contrast showed cauda equina nerve root thickening and enhancement, especially involving the L5 and S1 roots (Figure 1). The spinal cord appeared normal. These findings further supported polyradiculopathy and a leptomeningeal process.
Further evaluation included chest radiography, erythrocyte sedimentation rate, C-reactive protein, hemoglobin A1c, human immunodeficiency virus testing, antinuclear antibody, antineutrophil cytoplasmic antibody, extractable nuclear antibody, GQ1b antibody, serum and CSF paraneoplastic panels, levels of vitamin B1, B12, and B6, copper, and ceruloplasmin, and a screen for heavy metals. All results were within normal ranges.
ESTABLISHING THE DIAGNOSIS
Serum monoclonal protein analysis with immunofixation revealed IgM kappa monoclonal gammopathy with an IgM level of 1,570 (reference range 53–334 mg/dL) and M-spike 0.75 (0.00 mg/dL), serum free kappa light chains 61.1 (3.30–19.40 mg/L), lambda 9.3 (5.7–26.3 mg/L), and kappa-lambda ratio 6.57 (0.26–1.65).
2. Which is the best next step in this patient’s neurologic evaluation?
- Test CSF angiotensin-converting enzyme level
- CSF cytology
- Meningeal biopsy
- Peripheral nerve biopsy
Given the high suspicion for malignancy, CSF cytology was performed and showed increased numbers of mononuclear chronic inflammatory cells, including a mixture of lymphocytes and monocytes, favoring a reactive lymphoid pleocytosis. Flow cytometry indicated the presence of a monoclonal, CD5- and CD10- negative, B-cell lymphoproliferative disorder. The immunophenotypic findings were not specific for a single diagnosis. The differential diagnosis included marginal zone lymphoma and lymphoplasmacytic lymphoma.
3. Given the presence of serum IgM monoclonal gammopathy in this patient, which is the most likely diagnosis?
- Neurosarcoidosis
- Multiple myeloma
- Waldenström macroglobulinemia
- Carcinomatous meningitis
Study of bone marrow biopsy demonstrated limited bone marrow involvement (1%) by a lymphoproliferative disorder with plasmacytoid features, and DNA testing detected an MYD88 L265P mutation, reported to be present in 90% of patients with Waldenström macroglobulinemia.9 This finding confirmed the diagnosis of Waldenström macroglobulinemia with central nervous system involvement. Our patient began therapy with rituximab and methotrexate, which resulted in some improvement in strength, gait, and vision.
WALDENSTRÖM MACROGLOBULINEMIA AND BING-NEEL SYNDROME
Waldenström macroglobulinemia is a lymphoplasmacytic lymphoma associated with a monoclonal IgM protein.10 It is considered a paraproteinemic disorder, similar to multiple myeloma. The presenting symptoms and complications are related to direct tumor infiltration, hyperviscosity syndrome, and deposition of IgM in various tissues.11,12
Waldenström macroglobulinemia is usually indolent, and treatment is reserved for patients with symptoms.13,14 It includes rituximab, usually in combination with chemotherapy or other targeted agents.15,16
Paraneoplastic antibody-mediated polyneuropathy may occur in these patients. However, the pattern is usually symmetrical clinically, with demyelination on EMG, and is not associated with cranial nerve or meningeal involvement. Management with plasmapheresis, corticosteroids, and intravenous immunoglobulin has not been shown to be effective.17
Involvement of the central nervous system as a complication of Waldenström macroglobulinemia has been described as Bing-Neel syndrome. It can present as diffuse malignant cell infiltration of the leptomeningeal space, white matter, or spinal cord, or in a tumoral form presenting as intraparenchymal masses or nodular lesions. The distinction between the tumoral and diffuse forms is based primarily on imaging findings.18
In a report of 44 patients with Bing-Neel syndrome, 36% presented with the disorder as the initial manifestation of Waldenström macroglobulinemia.18 The primary presenting symptoms were imbalance and gait difficulty (48%) and cranial nerve involvement (36%), which presented as predominantly facial or oculomotor nerve palsy. Cauda equina syndrome with motor involvement (seen in our patient) occurred in 14% of patients. Other presenting symptoms included cognitive impairment, sensory deficits, headache, dysarthria, aphasia, and seizures.
LEARNING POINTS
The differential diagnosis for patients presenting with multifocal neurologic symptoms can be broad, and a systematic approach to the diagnosis is necessary. Localizing the lesion is important in determining the diagnosis for patients presenting with neurologic symptoms. The process of localization begins with taking the history, is further refined during the examination, and is confirmed with diagnostic studies. Atypical presentations of relatively common neurologic diseases such as Guillain-Barré syndrome, transverse myelitis, and peripheral polyneuropathy do occur, but uncommon diagnoses need to be considered when support for the initial diagnosis is lacking.
- Fokke C, van den Berg B, Drenthen J, Walgaard C, van Doorn PA, Jacobs BC. Diagnosis of Guillain-Barre syndrome and validation of Brighton criteria. Brain 2014; 137(Pt 1):33–43. doi:10.1093/brain/awt285
- Mathey EK, Park SB, Hughes RA, et al. Chronic inflammatory demyelinating polyradiculoneuropathy: from pathology to phenotype. J Neurol Neurosurg Psychiatry 2015; 86(9):973–985. doi:10.1136/jnnp-2014-309697
- Chiba A, Kusunoki S, Obata H, Machinami R, Kanazawa I. Serum anti-GQ1b IgG antibody is associated with ophthalmoplegia in Miller Fisher syndrome and Guillain-Barré syndrome: clinical and immunohistochemical studies. Neurology 1993; 43(10):1911–1917. pmid:8413947
- Teener J. Miller Fisher’s syndrome. Semin Neurol 2012; 32(5):512–516. doi:10.1055/s-0033-1334470
- Watson JC, Dyck PJ. Peripheral neuropathy: a practical approach to diagnosis and symptom management. Mayo Clin Proc 2015; 90(7):940–951. doi:10.1016/j.mayocp.2015.05.004
- Greenberg BM. Treatment of acute transverse myelitis and its early complications. Continuum (Minneap Minn) 2011; 17(4):733–743. doi:10.1212/01.CON.0000403792.36161.f5
- West TW. Transverse myelitis—a review of the presentation, diagnosis, and initial management. Discov Med 2013; 16(88):167–177. pmid:24099672
- Le Rhun E, Taillibert S, Chamberlain MC. Carcinomatous meningitis: leptomeningeal metastases in solid tumors. Surg Neurol Int 2013; 4(suppl 4):S265–S288. doi:10.4103/2152-7806.111304
- Treon SP, Xu L, Yang G, et al. MYD88 L265P somatic mutation in Waldenström’s macroglobulinemia. N Engl J Med 2012; 367(9):826–833. doi:10.1056/NEJMoa1200710
- Owen RG, Treon SP, Al-Katib A, et al. Clinicopathological definition of Waldenstrom’s macroglobulinemia: consensus panel recommendations from the Second International Workshop on Waldenstrom’s Macroglobulinemia. Semin Oncol 2003; 30(2):110–115. doi:10.1053/sonc.2003.50082
- Björkholm M, Johansson E, Papamichael D, et al. Patterns of clinical presentation, treatment, and outcome in patients with Waldenstrom’s macroglobulinemia: a two-institution study. Semin Oncol 2003; 30(2):226–230. doi:10.1053/sonc.2003.50054
- Rison RA, Beydoun SR. Paraproteinemic neuropathy: a practical review. BMC Neurol 2016; 16:13. doi:10.1186/s12883-016-0532-4
- Kyle RA, Benson J, Larson D, et al. IgM monoclonal gammopathy of undetermined significance and smoldering Waldenström’s macroglobulinemia. Clin Lymphoma Myeloma 2009; 9(1):17–18. doi:10.3816/CLM.2009.n.002
- Kyle RA, Benson JT, Larson DR, et al. Progression in smoldering Waldenstrom macroglobulinemia: long-term results. Blood 2012; 119(19):4462–4466. doi:10.1182/blood-2011-10-384768
- Leblond V, Kastritis E, Advani R, et al. Treatment recommendations from the Eighth International Workshop on Waldenström’s macroglobulinemia. Blood 2016; 128(10):1321–1328. doi:10.1182/blood-2016-04-711234
- Kapoor P, Ansell SM, Fonseca R, et al. Diagnosis and management of Waldenström macroglobulinemia: Mayo stratification of macroglobulinemia and risk-adapted therapy (mSMART) guidelines 2016. JAMA Oncol 2017; 3(9):1257–1265. doi:10.1001/jamaoncol.2016.5763
- D’Sa S, Kersten MJ, Castillo JJ, et al. Investigation and management of IgM and Waldenström-associated peripheral neuropathies: recommendations from the IWWM-8 consensus panel. Br J Haematol 2017; 176(5):728–742. doi:10.1111/bjh.14492
- Simon L, Fitsiori A, Lemal R, et al. Bing-Neel syndrome, a rare complication of Waldenström macroglobulinemia: analysis of 44 cases and review of the literature. A study on behalf of the French Innovative Leukemia Organization (FILO). Haematologica 2015; 100(12):1587–1594. doi:10.3324/haematol.2015.133744
- Fokke C, van den Berg B, Drenthen J, Walgaard C, van Doorn PA, Jacobs BC. Diagnosis of Guillain-Barre syndrome and validation of Brighton criteria. Brain 2014; 137(Pt 1):33–43. doi:10.1093/brain/awt285
- Mathey EK, Park SB, Hughes RA, et al. Chronic inflammatory demyelinating polyradiculoneuropathy: from pathology to phenotype. J Neurol Neurosurg Psychiatry 2015; 86(9):973–985. doi:10.1136/jnnp-2014-309697
- Chiba A, Kusunoki S, Obata H, Machinami R, Kanazawa I. Serum anti-GQ1b IgG antibody is associated with ophthalmoplegia in Miller Fisher syndrome and Guillain-Barré syndrome: clinical and immunohistochemical studies. Neurology 1993; 43(10):1911–1917. pmid:8413947
- Teener J. Miller Fisher’s syndrome. Semin Neurol 2012; 32(5):512–516. doi:10.1055/s-0033-1334470
- Watson JC, Dyck PJ. Peripheral neuropathy: a practical approach to diagnosis and symptom management. Mayo Clin Proc 2015; 90(7):940–951. doi:10.1016/j.mayocp.2015.05.004
- Greenberg BM. Treatment of acute transverse myelitis and its early complications. Continuum (Minneap Minn) 2011; 17(4):733–743. doi:10.1212/01.CON.0000403792.36161.f5
- West TW. Transverse myelitis—a review of the presentation, diagnosis, and initial management. Discov Med 2013; 16(88):167–177. pmid:24099672
- Le Rhun E, Taillibert S, Chamberlain MC. Carcinomatous meningitis: leptomeningeal metastases in solid tumors. Surg Neurol Int 2013; 4(suppl 4):S265–S288. doi:10.4103/2152-7806.111304
- Treon SP, Xu L, Yang G, et al. MYD88 L265P somatic mutation in Waldenström’s macroglobulinemia. N Engl J Med 2012; 367(9):826–833. doi:10.1056/NEJMoa1200710
- Owen RG, Treon SP, Al-Katib A, et al. Clinicopathological definition of Waldenstrom’s macroglobulinemia: consensus panel recommendations from the Second International Workshop on Waldenstrom’s Macroglobulinemia. Semin Oncol 2003; 30(2):110–115. doi:10.1053/sonc.2003.50082
- Björkholm M, Johansson E, Papamichael D, et al. Patterns of clinical presentation, treatment, and outcome in patients with Waldenstrom’s macroglobulinemia: a two-institution study. Semin Oncol 2003; 30(2):226–230. doi:10.1053/sonc.2003.50054
- Rison RA, Beydoun SR. Paraproteinemic neuropathy: a practical review. BMC Neurol 2016; 16:13. doi:10.1186/s12883-016-0532-4
- Kyle RA, Benson J, Larson D, et al. IgM monoclonal gammopathy of undetermined significance and smoldering Waldenström’s macroglobulinemia. Clin Lymphoma Myeloma 2009; 9(1):17–18. doi:10.3816/CLM.2009.n.002
- Kyle RA, Benson JT, Larson DR, et al. Progression in smoldering Waldenstrom macroglobulinemia: long-term results. Blood 2012; 119(19):4462–4466. doi:10.1182/blood-2011-10-384768
- Leblond V, Kastritis E, Advani R, et al. Treatment recommendations from the Eighth International Workshop on Waldenström’s macroglobulinemia. Blood 2016; 128(10):1321–1328. doi:10.1182/blood-2016-04-711234
- Kapoor P, Ansell SM, Fonseca R, et al. Diagnosis and management of Waldenström macroglobulinemia: Mayo stratification of macroglobulinemia and risk-adapted therapy (mSMART) guidelines 2016. JAMA Oncol 2017; 3(9):1257–1265. doi:10.1001/jamaoncol.2016.5763
- D’Sa S, Kersten MJ, Castillo JJ, et al. Investigation and management of IgM and Waldenström-associated peripheral neuropathies: recommendations from the IWWM-8 consensus panel. Br J Haematol 2017; 176(5):728–742. doi:10.1111/bjh.14492
- Simon L, Fitsiori A, Lemal R, et al. Bing-Neel syndrome, a rare complication of Waldenström macroglobulinemia: analysis of 44 cases and review of the literature. A study on behalf of the French Innovative Leukemia Organization (FILO). Haematologica 2015; 100(12):1587–1594. doi:10.3324/haematol.2015.133744