User login
Pustular Tinea Id Reaction
To the Editor:
A 17-year-old adolescent girl presented to the dermatology clinic with a tender pruritic rash on the left wrist that was spreading to the bilateral arms and legs of several years’ duration. An area of a prior biopsy on the left wrist was healing well with use of petroleum jelly and halcinonide cream. The patient denied any constitutional symptoms.
Physical examination revealed numerous erythematous papules coalescing into plaques on the bilateral anterior and posterior arms and legs, including some erythematous macules and papules on the palms and soles. The original area of involvement on the left dorsal medial wrist demonstrated a background of erythema with overlying peripheral scaling and resolving violaceous to erythematous papules with signs of serosanguineous crusting (Figure 1). Scattered perifollicular erythema was present on the posterior aspects of the bilateral thighs and arms (Figure 2). Baseline complete blood cell count and complete metabolic panel were within reference range.
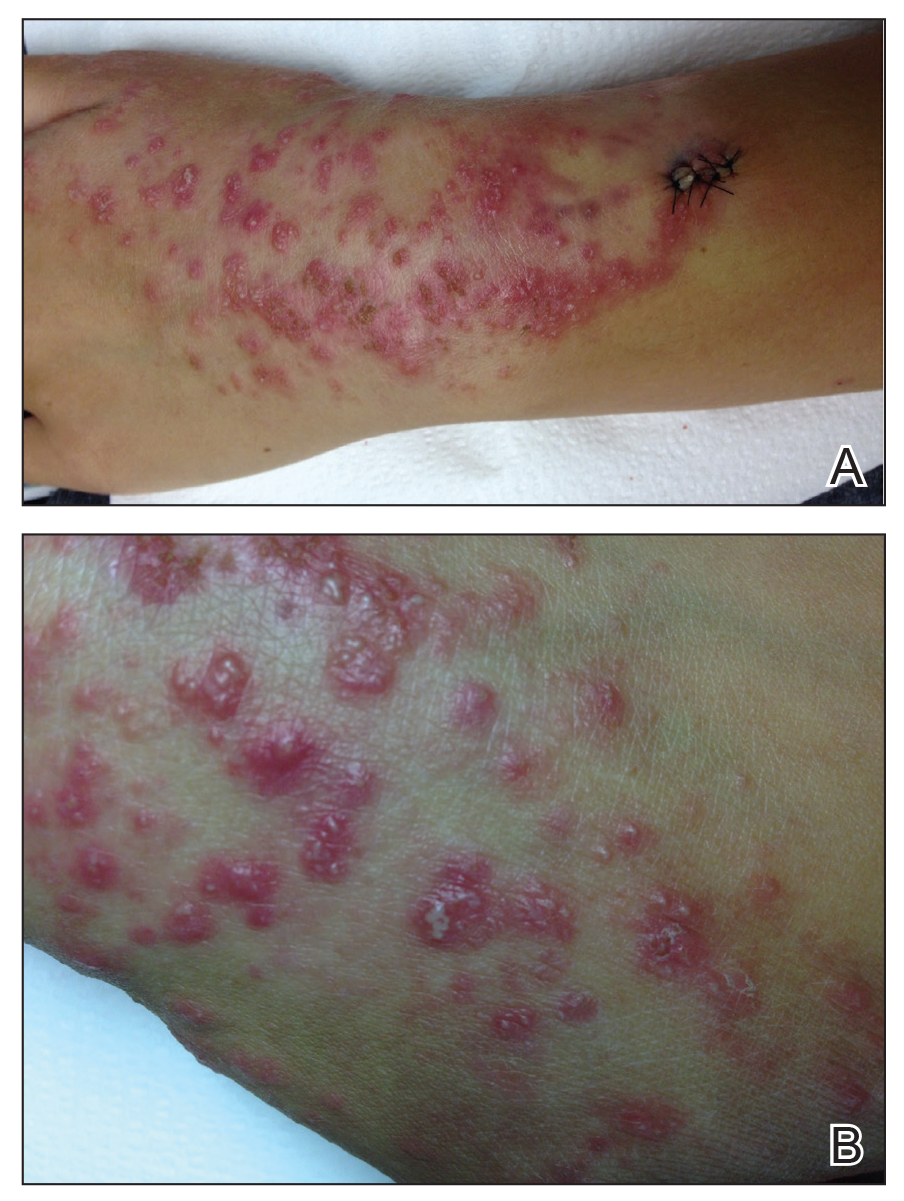

Clinical histopathology showed evidence of a pustular superficial dermatophyte infection, and Grocott-Gomori methenamine-silver stain demonstrated numerous fungal hyphae within subcorneal pustules, indicating pustular tinea. Based on the clinicopathologic correlation, the initial presentation was diagnosed as pustular tinea of the entire left wrist, followed by a generalized id reaction 1 week later.
The patient was prescribed oral terbinafine 250 mg once daily to treat the diffuse involvement of the pustular tinea as well as once-daily oral cetirizine, once-daily oral diphenhydramine, a topical emollient, and a topical nonsteroidal antipruritic gel.
Tinea is a superficial fungal infection commonly caused by the dermatophytes Epidermophyton, Trichophyton, and Microsporum. It has a variety of clinical presentations based on the anatomic location, including tinea capitis (hair/scalp), tinea pedis (feet), tinea corporis (face/trunk/extremities), tinea cruris (groin), and tinea unguium (nails).1 Tinea infections occur in the stratum corneum, hair, and nails, thriving on dead keratin in these areas.2 Tinea corporis usually appears as an erythematous ring-shaped lesion with a scaly border, but atypical cases presenting with vesicles, pustules, and bullae also have been reported.3 Additionally, secondary eruptions called id reactions, or autoeczematization, can present in the setting of dermatophyte infections. Such outbreaks may be due to a delayed hypersensitivity reaction to the fungal antigens. Id reactions can manifest in many forms of tinea with patients generally exhibiting pruritic papulovesicular lesions that can present far from the site of origin.4
Patients with id reactions can have atypical and varied presentations. In a case of id reaction due to tinea corporis, a patient presented with vesicles and pustules that grew in number and coalesced to form annular lesions.5 A case of an id reaction caused by tinea pedis also noted the presence of pustules, which are atypical in this form of tinea.6 In another case of tinea pedis, a generalized id reaction was noted, illustrating that such eruptions do not necessarily appear at the original site of infection.7 Additionally, in a rare presentation of tinea invading the nares, a patient developed an erythema multiforme id reaction.8 Id reactions also were noted in 14 patients with refractory otitis externa, illustrating the ability of this fungal infection to persist and infect distant locations.9
Because the differential diagnoses for tinea infection are extensive, pathology or laboratory confirmation is necessary for diagnosis, and potassium hydroxide preparation often is used to diagnose dermatophyte infections.1,2 Additionally, the possibility of a hypersensitivity drug rash should remain in the differential if the patient received allergy-inducing medications prior to the outbreak, which may in turn complicate the diagnosis.
Tinea infections typically can be treated with topical antifungals such as terbinafine, butenafine,1 and luliconazole10; however, more involved cases may require oral antifungal treatment.1 Systemic treatment of tinea corporis includes itraconazole, terbinafine, and fluconazole,11 all of which exhibit fewer side effects and greater efficacy when compared to griseofulvin.12-15
Treatment of id reactions centers on the proper clearance of the dermatophyte infection, and treatment with oral antifungals generally is sufficient. In the cases of id reaction in patients with refractory otitis, some success was achieved with treatment involving immunotherapy with dermatophyte and dust mite allergen extracts coupled with a yeast elimination diet.9 In acute id reactions, topical corticosteroids and antipruritic agents can be applied.4 Rarely, systemic glucocorticoids are required, such as in cases in which the id reaction persists despite proper treatment of the primary infection.16
- Ely JW, Rosenfeld S, Seabury Stone M. Diagnosis and management of tinea infections. Am Fam Physician. 2014;90:702-710.
- Habif TP. Clinical Dermatology: A Color Guide to Diagnosis and Therapy. 5th ed. Hanover, NH: Elsevier, Inc; 2010.
- Ziemer M, Seyfarth F, Elsner P, et al. Atypical manifestations of tinea corporis. Mycoses. 2007;50(suppl 2):31-35.
- Cheng N, Rucker Wright D, Cohen BA. Dermatophytid in tinea capitis: rarely reported common phenomenon with clinical implications [published online July 4, 2011]. Pediatrics. 2011;128:e453-e457.
- Ohno S, Tanabe H, Kawasaki M, et al. Tinea corporis with acute inflammation caused by Trichophyton tonsurans. J Dermatol. 2008;35:590-593.
- Hirschmann JV, Raugi GJ. Pustular tinea pedis. J Am Acad Dermatol. 2000;42:132-133.
- Iglesias ME, España A, Idoate MA, et al. Generalized skin reaction following tinea pedis (dermatophytids). J Dermatol. 1994;21:31-34.
- Atzori L, Pau M, Aste M. Erythema multiforme ID reaction in atypical dermatophytosis: a case report. J Eur Acad Dermatol Venereol. 2003;17:699-701.
- Derebery J, Berliner KI. Foot and ear disease—the dermatophytid reaction in otology. Laryngoscope. 1996;106(2 Pt 1):181-186.
- Khanna D, Bharti S. Luliconazole for the treatment of fungal infections: an evidence-based review. Core Evid. 2014;9:113-124.
- Korting HC, Schöllmann C. The significance of itraconazole for treatment of fungal infections of skin, nails and mucous membranes. J Dtsch Dermatol Ges. 2009;7:11-20.
- Goldstein AO, Goldstein BG. Dermatophyte (tinea) infections. UpToDate website. https://www.uptodate.com/contents/dermatophyte-tinea-infections. Updated December 28, 2018. Accessed April 24, 2019.
- Cole GW, Stricklin G. A comparison of a new oral antifungal, terbinafine, with griseofulvin as therapy for tinea corporis. Arch Dermatol. 1989;125:1537.
- Panagiotidou D, Kousidou T, Chaidemenos G, et al. A comparison of itraconazole and griseofulvin in the treatment of tinea corporis and tinea cruris: a double-blind study. J Int Med Res. 1992;20:392-400.
- Faergemann J, Mörk NJ, Haglund A, et al. A multicentre (double-blind) comparative study to assess the safety and efficacy of fluconazole and griseofulvin in the treatment of tinea corporis and tinea cruris. Br J Dermatol. 1997;136:575-577.
- Ilkit M, Durdu M, Karakas M. Cutaneous id reactions: a comprehensive review of clinical manifestations, epidemiology, etiology, and management. Crit Rev Microbiol. 2012;38:191-202.
To the Editor:
A 17-year-old adolescent girl presented to the dermatology clinic with a tender pruritic rash on the left wrist that was spreading to the bilateral arms and legs of several years’ duration. An area of a prior biopsy on the left wrist was healing well with use of petroleum jelly and halcinonide cream. The patient denied any constitutional symptoms.
Physical examination revealed numerous erythematous papules coalescing into plaques on the bilateral anterior and posterior arms and legs, including some erythematous macules and papules on the palms and soles. The original area of involvement on the left dorsal medial wrist demonstrated a background of erythema with overlying peripheral scaling and resolving violaceous to erythematous papules with signs of serosanguineous crusting (Figure 1). Scattered perifollicular erythema was present on the posterior aspects of the bilateral thighs and arms (Figure 2). Baseline complete blood cell count and complete metabolic panel were within reference range.
Clinical histopathology showed evidence of a pustular superficial dermatophyte infection, and Grocott-Gomori methenamine-silver stain demonstrated numerous fungal hyphae within subcorneal pustules, indicating pustular tinea. Based on the clinicopathologic correlation, the initial presentation was diagnosed as pustular tinea of the entire left wrist, followed by a generalized id reaction 1 week later.
The patient was prescribed oral terbinafine 250 mg once daily to treat the diffuse involvement of the pustular tinea as well as once-daily oral cetirizine, once-daily oral diphenhydramine, a topical emollient, and a topical nonsteroidal antipruritic gel.
Tinea is a superficial fungal infection commonly caused by the dermatophytes Epidermophyton, Trichophyton, and Microsporum. It has a variety of clinical presentations based on the anatomic location, including tinea capitis (hair/scalp), tinea pedis (feet), tinea corporis (face/trunk/extremities), tinea cruris (groin), and tinea unguium (nails).1 Tinea infections occur in the stratum corneum, hair, and nails, thriving on dead keratin in these areas.2 Tinea corporis usually appears as an erythematous ring-shaped lesion with a scaly border, but atypical cases presenting with vesicles, pustules, and bullae also have been reported.3 Additionally, secondary eruptions called id reactions, or autoeczematization, can present in the setting of dermatophyte infections. Such outbreaks may be due to a delayed hypersensitivity reaction to the fungal antigens. Id reactions can manifest in many forms of tinea with patients generally exhibiting pruritic papulovesicular lesions that can present far from the site of origin.4
Patients with id reactions can have atypical and varied presentations. In a case of id reaction due to tinea corporis, a patient presented with vesicles and pustules that grew in number and coalesced to form annular lesions.5 A case of an id reaction caused by tinea pedis also noted the presence of pustules, which are atypical in this form of tinea.6 In another case of tinea pedis, a generalized id reaction was noted, illustrating that such eruptions do not necessarily appear at the original site of infection.7 Additionally, in a rare presentation of tinea invading the nares, a patient developed an erythema multiforme id reaction.8 Id reactions also were noted in 14 patients with refractory otitis externa, illustrating the ability of this fungal infection to persist and infect distant locations.9
Because the differential diagnoses for tinea infection are extensive, pathology or laboratory confirmation is necessary for diagnosis, and potassium hydroxide preparation often is used to diagnose dermatophyte infections.1,2 Additionally, the possibility of a hypersensitivity drug rash should remain in the differential if the patient received allergy-inducing medications prior to the outbreak, which may in turn complicate the diagnosis.
Tinea infections typically can be treated with topical antifungals such as terbinafine, butenafine,1 and luliconazole10; however, more involved cases may require oral antifungal treatment.1 Systemic treatment of tinea corporis includes itraconazole, terbinafine, and fluconazole,11 all of which exhibit fewer side effects and greater efficacy when compared to griseofulvin.12-15
Treatment of id reactions centers on the proper clearance of the dermatophyte infection, and treatment with oral antifungals generally is sufficient. In the cases of id reaction in patients with refractory otitis, some success was achieved with treatment involving immunotherapy with dermatophyte and dust mite allergen extracts coupled with a yeast elimination diet.9 In acute id reactions, topical corticosteroids and antipruritic agents can be applied.4 Rarely, systemic glucocorticoids are required, such as in cases in which the id reaction persists despite proper treatment of the primary infection.16
To the Editor:
A 17-year-old adolescent girl presented to the dermatology clinic with a tender pruritic rash on the left wrist that was spreading to the bilateral arms and legs of several years’ duration. An area of a prior biopsy on the left wrist was healing well with use of petroleum jelly and halcinonide cream. The patient denied any constitutional symptoms.
Physical examination revealed numerous erythematous papules coalescing into plaques on the bilateral anterior and posterior arms and legs, including some erythematous macules and papules on the palms and soles. The original area of involvement on the left dorsal medial wrist demonstrated a background of erythema with overlying peripheral scaling and resolving violaceous to erythematous papules with signs of serosanguineous crusting (Figure 1). Scattered perifollicular erythema was present on the posterior aspects of the bilateral thighs and arms (Figure 2). Baseline complete blood cell count and complete metabolic panel were within reference range.
Clinical histopathology showed evidence of a pustular superficial dermatophyte infection, and Grocott-Gomori methenamine-silver stain demonstrated numerous fungal hyphae within subcorneal pustules, indicating pustular tinea. Based on the clinicopathologic correlation, the initial presentation was diagnosed as pustular tinea of the entire left wrist, followed by a generalized id reaction 1 week later.
The patient was prescribed oral terbinafine 250 mg once daily to treat the diffuse involvement of the pustular tinea as well as once-daily oral cetirizine, once-daily oral diphenhydramine, a topical emollient, and a topical nonsteroidal antipruritic gel.
Tinea is a superficial fungal infection commonly caused by the dermatophytes Epidermophyton, Trichophyton, and Microsporum. It has a variety of clinical presentations based on the anatomic location, including tinea capitis (hair/scalp), tinea pedis (feet), tinea corporis (face/trunk/extremities), tinea cruris (groin), and tinea unguium (nails).1 Tinea infections occur in the stratum corneum, hair, and nails, thriving on dead keratin in these areas.2 Tinea corporis usually appears as an erythematous ring-shaped lesion with a scaly border, but atypical cases presenting with vesicles, pustules, and bullae also have been reported.3 Additionally, secondary eruptions called id reactions, or autoeczematization, can present in the setting of dermatophyte infections. Such outbreaks may be due to a delayed hypersensitivity reaction to the fungal antigens. Id reactions can manifest in many forms of tinea with patients generally exhibiting pruritic papulovesicular lesions that can present far from the site of origin.4
Patients with id reactions can have atypical and varied presentations. In a case of id reaction due to tinea corporis, a patient presented with vesicles and pustules that grew in number and coalesced to form annular lesions.5 A case of an id reaction caused by tinea pedis also noted the presence of pustules, which are atypical in this form of tinea.6 In another case of tinea pedis, a generalized id reaction was noted, illustrating that such eruptions do not necessarily appear at the original site of infection.7 Additionally, in a rare presentation of tinea invading the nares, a patient developed an erythema multiforme id reaction.8 Id reactions also were noted in 14 patients with refractory otitis externa, illustrating the ability of this fungal infection to persist and infect distant locations.9
Because the differential diagnoses for tinea infection are extensive, pathology or laboratory confirmation is necessary for diagnosis, and potassium hydroxide preparation often is used to diagnose dermatophyte infections.1,2 Additionally, the possibility of a hypersensitivity drug rash should remain in the differential if the patient received allergy-inducing medications prior to the outbreak, which may in turn complicate the diagnosis.
Tinea infections typically can be treated with topical antifungals such as terbinafine, butenafine,1 and luliconazole10; however, more involved cases may require oral antifungal treatment.1 Systemic treatment of tinea corporis includes itraconazole, terbinafine, and fluconazole,11 all of which exhibit fewer side effects and greater efficacy when compared to griseofulvin.12-15
Treatment of id reactions centers on the proper clearance of the dermatophyte infection, and treatment with oral antifungals generally is sufficient. In the cases of id reaction in patients with refractory otitis, some success was achieved with treatment involving immunotherapy with dermatophyte and dust mite allergen extracts coupled with a yeast elimination diet.9 In acute id reactions, topical corticosteroids and antipruritic agents can be applied.4 Rarely, systemic glucocorticoids are required, such as in cases in which the id reaction persists despite proper treatment of the primary infection.16
- Ely JW, Rosenfeld S, Seabury Stone M. Diagnosis and management of tinea infections. Am Fam Physician. 2014;90:702-710.
- Habif TP. Clinical Dermatology: A Color Guide to Diagnosis and Therapy. 5th ed. Hanover, NH: Elsevier, Inc; 2010.
- Ziemer M, Seyfarth F, Elsner P, et al. Atypical manifestations of tinea corporis. Mycoses. 2007;50(suppl 2):31-35.
- Cheng N, Rucker Wright D, Cohen BA. Dermatophytid in tinea capitis: rarely reported common phenomenon with clinical implications [published online July 4, 2011]. Pediatrics. 2011;128:e453-e457.
- Ohno S, Tanabe H, Kawasaki M, et al. Tinea corporis with acute inflammation caused by Trichophyton tonsurans. J Dermatol. 2008;35:590-593.
- Hirschmann JV, Raugi GJ. Pustular tinea pedis. J Am Acad Dermatol. 2000;42:132-133.
- Iglesias ME, España A, Idoate MA, et al. Generalized skin reaction following tinea pedis (dermatophytids). J Dermatol. 1994;21:31-34.
- Atzori L, Pau M, Aste M. Erythema multiforme ID reaction in atypical dermatophytosis: a case report. J Eur Acad Dermatol Venereol. 2003;17:699-701.
- Derebery J, Berliner KI. Foot and ear disease—the dermatophytid reaction in otology. Laryngoscope. 1996;106(2 Pt 1):181-186.
- Khanna D, Bharti S. Luliconazole for the treatment of fungal infections: an evidence-based review. Core Evid. 2014;9:113-124.
- Korting HC, Schöllmann C. The significance of itraconazole for treatment of fungal infections of skin, nails and mucous membranes. J Dtsch Dermatol Ges. 2009;7:11-20.
- Goldstein AO, Goldstein BG. Dermatophyte (tinea) infections. UpToDate website. https://www.uptodate.com/contents/dermatophyte-tinea-infections. Updated December 28, 2018. Accessed April 24, 2019.
- Cole GW, Stricklin G. A comparison of a new oral antifungal, terbinafine, with griseofulvin as therapy for tinea corporis. Arch Dermatol. 1989;125:1537.
- Panagiotidou D, Kousidou T, Chaidemenos G, et al. A comparison of itraconazole and griseofulvin in the treatment of tinea corporis and tinea cruris: a double-blind study. J Int Med Res. 1992;20:392-400.
- Faergemann J, Mörk NJ, Haglund A, et al. A multicentre (double-blind) comparative study to assess the safety and efficacy of fluconazole and griseofulvin in the treatment of tinea corporis and tinea cruris. Br J Dermatol. 1997;136:575-577.
- Ilkit M, Durdu M, Karakas M. Cutaneous id reactions: a comprehensive review of clinical manifestations, epidemiology, etiology, and management. Crit Rev Microbiol. 2012;38:191-202.
- Ely JW, Rosenfeld S, Seabury Stone M. Diagnosis and management of tinea infections. Am Fam Physician. 2014;90:702-710.
- Habif TP. Clinical Dermatology: A Color Guide to Diagnosis and Therapy. 5th ed. Hanover, NH: Elsevier, Inc; 2010.
- Ziemer M, Seyfarth F, Elsner P, et al. Atypical manifestations of tinea corporis. Mycoses. 2007;50(suppl 2):31-35.
- Cheng N, Rucker Wright D, Cohen BA. Dermatophytid in tinea capitis: rarely reported common phenomenon with clinical implications [published online July 4, 2011]. Pediatrics. 2011;128:e453-e457.
- Ohno S, Tanabe H, Kawasaki M, et al. Tinea corporis with acute inflammation caused by Trichophyton tonsurans. J Dermatol. 2008;35:590-593.
- Hirschmann JV, Raugi GJ. Pustular tinea pedis. J Am Acad Dermatol. 2000;42:132-133.
- Iglesias ME, España A, Idoate MA, et al. Generalized skin reaction following tinea pedis (dermatophytids). J Dermatol. 1994;21:31-34.
- Atzori L, Pau M, Aste M. Erythema multiforme ID reaction in atypical dermatophytosis: a case report. J Eur Acad Dermatol Venereol. 2003;17:699-701.
- Derebery J, Berliner KI. Foot and ear disease—the dermatophytid reaction in otology. Laryngoscope. 1996;106(2 Pt 1):181-186.
- Khanna D, Bharti S. Luliconazole for the treatment of fungal infections: an evidence-based review. Core Evid. 2014;9:113-124.
- Korting HC, Schöllmann C. The significance of itraconazole for treatment of fungal infections of skin, nails and mucous membranes. J Dtsch Dermatol Ges. 2009;7:11-20.
- Goldstein AO, Goldstein BG. Dermatophyte (tinea) infections. UpToDate website. https://www.uptodate.com/contents/dermatophyte-tinea-infections. Updated December 28, 2018. Accessed April 24, 2019.
- Cole GW, Stricklin G. A comparison of a new oral antifungal, terbinafine, with griseofulvin as therapy for tinea corporis. Arch Dermatol. 1989;125:1537.
- Panagiotidou D, Kousidou T, Chaidemenos G, et al. A comparison of itraconazole and griseofulvin in the treatment of tinea corporis and tinea cruris: a double-blind study. J Int Med Res. 1992;20:392-400.
- Faergemann J, Mörk NJ, Haglund A, et al. A multicentre (double-blind) comparative study to assess the safety and efficacy of fluconazole and griseofulvin in the treatment of tinea corporis and tinea cruris. Br J Dermatol. 1997;136:575-577.
- Ilkit M, Durdu M, Karakas M. Cutaneous id reactions: a comprehensive review of clinical manifestations, epidemiology, etiology, and management. Crit Rev Microbiol. 2012;38:191-202.
Practice Points
• Id reactions, or autoeczematization, can occur secondary to dermatophyte infections, possibly due to a hypersensitivity reaction to the fungus. These eruptions can occur in many forms of tinea and in a variety of clinical presentations.
• Treatment is based on clearance of the original dermatophyte infection.

In women with late preterm mild hypertensive disorders, does immediate delivery versus expectant management differ in terms of neonatal neurodevelopmental outcomes?
Zwertbroek EF, Franssen MT, Broekhuijsen K, et al; HYPITAT-II Study Group. Neonatal developmental and behavioral outcomes of immediate delivery versus expectant monitoring of mild hypertensive disorders of pregnancy: 2-year outcomes of the HYPITAT-II trial. Am J Obstet Gynecol. doi:10.1016/j.ajog.2019.03.024.
EXPERT COMMENTARY
In women with mild hypertensive disorders in the preterm period, the maternal benefits of delivery should be weighed against the consequences of preterm birth for the neonate. In a recent study, Zwertbroek and colleagues sought to evaluate the long-term neurodevelopmental effects of this decision on the offspring.
Details of the study
The authors conducted a follow-up study of the randomized, controlled Hypertension and Preeclampsia Intervention Trial At Term II (HYPITAT-II), in which 704 women diagnosed with late preterm (34–37 weeks) hypertensive disorders in pregnancy (gestational hypertension, chronic hypertension, or mild preeclampsia) were randomly assigned to immediate delivery or expectant management.
Expectant management consisted of close monitoring until 37 weeks or until an indication for delivery occurred, whichever came first. Children born to those mothers were eligible for this study (women enrolled during 2011–2015) when they reached 2 years of age; 342 children were included in this analysis. Of note, children from the expectant management group had been delivered at a more advanced gestational age (median, 37.0 vs 36.1 weeks; P<.001) than those in the immediate-delivery group.
Survey tools. Parents completed 2 response surveys, the Ages and Stages Questionnaire (ASQ) and the Child Behavior Checklist (CBCL), between 23 and 26 months’ corrected age. The ASQ is designed to detect developmental delay, while the CBCL assesses behavioral and emotional problems. The primary outcome was an abnormal result on either screen.
Results. Based on 330 returned questionnaires, the authors found more abnormal ASQ scores (45 of 162 [28%] vs 27 of 148 [18%] children; P = .045) in the immediate-delivery group versus the expectant management group, most pronounced in the fine motor domain. They found no difference in the CBCL scores. The authors concluded that immediate delivery for women with late preterm mild hypertensive disorders in pregnancy increases the risk of developmental delay in the children.
Study strengths and limitations
This study is unique as a planned follow-up to a randomized, controlled trial, allowing for 2-year outcomes to be assessed on children of enrolled women with mild hypertensive disorders in the late preterm period. The authors used validated surveys that are known to predict long-term neurodevelopmental outcomes.
Continue to: This work has several limitations...
This work has several limitations, however. Randomization was not truly maintained given the less than 50% response rate of original participants. Additionally, parents completed the surveys and provider confirmation of developmental concerns or diagnoses was not obtained. Further, assessments at 2 years of age may be too early to detect subtle differences, with evaluations at 5 years more predictive of long-term outcomes; the authors stated that these data already are being collected.
Finally, while these data importantly reinforce the conclusions of the parent HYPITAT-II trial, which support expectant management for mild hypertensive disorders in the late preterm period,1 clinicians must always take care to individualize decisions in the face of worsening maternal disease.
This follow-up study of the HYPITAT-II randomized, controlled trial demonstrates poorer neurodevelopmental outcomes in offspring of late preterm mild hypertensives who undergo immediate delivery. These data support current practice recommendations to expectantly manage women with late preterm mild hypertensive disease until 37 weeks or signs of clinical worsening, whichever comes first.
- Broekjuijsen K, van Baaren GJ, van Pampus MG, et al; HYPITAT-II Study Group. Immediate delivery versus expectant monitoring for hypertensive disorders of pregnancy between 34 and 37 weeks of gestation (HYPITAT-II): an open-label, randomised controlled trial. Lancet. 2015;385:2492-2501.
Zwertbroek EF, Franssen MT, Broekhuijsen K, et al; HYPITAT-II Study Group. Neonatal developmental and behavioral outcomes of immediate delivery versus expectant monitoring of mild hypertensive disorders of pregnancy: 2-year outcomes of the HYPITAT-II trial. Am J Obstet Gynecol. doi:10.1016/j.ajog.2019.03.024.
EXPERT COMMENTARY
In women with mild hypertensive disorders in the preterm period, the maternal benefits of delivery should be weighed against the consequences of preterm birth for the neonate. In a recent study, Zwertbroek and colleagues sought to evaluate the long-term neurodevelopmental effects of this decision on the offspring.
Details of the study
The authors conducted a follow-up study of the randomized, controlled Hypertension and Preeclampsia Intervention Trial At Term II (HYPITAT-II), in which 704 women diagnosed with late preterm (34–37 weeks) hypertensive disorders in pregnancy (gestational hypertension, chronic hypertension, or mild preeclampsia) were randomly assigned to immediate delivery or expectant management.
Expectant management consisted of close monitoring until 37 weeks or until an indication for delivery occurred, whichever came first. Children born to those mothers were eligible for this study (women enrolled during 2011–2015) when they reached 2 years of age; 342 children were included in this analysis. Of note, children from the expectant management group had been delivered at a more advanced gestational age (median, 37.0 vs 36.1 weeks; P<.001) than those in the immediate-delivery group.
Survey tools. Parents completed 2 response surveys, the Ages and Stages Questionnaire (ASQ) and the Child Behavior Checklist (CBCL), between 23 and 26 months’ corrected age. The ASQ is designed to detect developmental delay, while the CBCL assesses behavioral and emotional problems. The primary outcome was an abnormal result on either screen.
Results. Based on 330 returned questionnaires, the authors found more abnormal ASQ scores (45 of 162 [28%] vs 27 of 148 [18%] children; P = .045) in the immediate-delivery group versus the expectant management group, most pronounced in the fine motor domain. They found no difference in the CBCL scores. The authors concluded that immediate delivery for women with late preterm mild hypertensive disorders in pregnancy increases the risk of developmental delay in the children.
Study strengths and limitations
This study is unique as a planned follow-up to a randomized, controlled trial, allowing for 2-year outcomes to be assessed on children of enrolled women with mild hypertensive disorders in the late preterm period. The authors used validated surveys that are known to predict long-term neurodevelopmental outcomes.
Continue to: This work has several limitations...
This work has several limitations, however. Randomization was not truly maintained given the less than 50% response rate of original participants. Additionally, parents completed the surveys and provider confirmation of developmental concerns or diagnoses was not obtained. Further, assessments at 2 years of age may be too early to detect subtle differences, with evaluations at 5 years more predictive of long-term outcomes; the authors stated that these data already are being collected.
Finally, while these data importantly reinforce the conclusions of the parent HYPITAT-II trial, which support expectant management for mild hypertensive disorders in the late preterm period,1 clinicians must always take care to individualize decisions in the face of worsening maternal disease.
This follow-up study of the HYPITAT-II randomized, controlled trial demonstrates poorer neurodevelopmental outcomes in offspring of late preterm mild hypertensives who undergo immediate delivery. These data support current practice recommendations to expectantly manage women with late preterm mild hypertensive disease until 37 weeks or signs of clinical worsening, whichever comes first.
Zwertbroek EF, Franssen MT, Broekhuijsen K, et al; HYPITAT-II Study Group. Neonatal developmental and behavioral outcomes of immediate delivery versus expectant monitoring of mild hypertensive disorders of pregnancy: 2-year outcomes of the HYPITAT-II trial. Am J Obstet Gynecol. doi:10.1016/j.ajog.2019.03.024.
EXPERT COMMENTARY
In women with mild hypertensive disorders in the preterm period, the maternal benefits of delivery should be weighed against the consequences of preterm birth for the neonate. In a recent study, Zwertbroek and colleagues sought to evaluate the long-term neurodevelopmental effects of this decision on the offspring.
Details of the study
The authors conducted a follow-up study of the randomized, controlled Hypertension and Preeclampsia Intervention Trial At Term II (HYPITAT-II), in which 704 women diagnosed with late preterm (34–37 weeks) hypertensive disorders in pregnancy (gestational hypertension, chronic hypertension, or mild preeclampsia) were randomly assigned to immediate delivery or expectant management.
Expectant management consisted of close monitoring until 37 weeks or until an indication for delivery occurred, whichever came first. Children born to those mothers were eligible for this study (women enrolled during 2011–2015) when they reached 2 years of age; 342 children were included in this analysis. Of note, children from the expectant management group had been delivered at a more advanced gestational age (median, 37.0 vs 36.1 weeks; P<.001) than those in the immediate-delivery group.
Survey tools. Parents completed 2 response surveys, the Ages and Stages Questionnaire (ASQ) and the Child Behavior Checklist (CBCL), between 23 and 26 months’ corrected age. The ASQ is designed to detect developmental delay, while the CBCL assesses behavioral and emotional problems. The primary outcome was an abnormal result on either screen.
Results. Based on 330 returned questionnaires, the authors found more abnormal ASQ scores (45 of 162 [28%] vs 27 of 148 [18%] children; P = .045) in the immediate-delivery group versus the expectant management group, most pronounced in the fine motor domain. They found no difference in the CBCL scores. The authors concluded that immediate delivery for women with late preterm mild hypertensive disorders in pregnancy increases the risk of developmental delay in the children.
Study strengths and limitations
This study is unique as a planned follow-up to a randomized, controlled trial, allowing for 2-year outcomes to be assessed on children of enrolled women with mild hypertensive disorders in the late preterm period. The authors used validated surveys that are known to predict long-term neurodevelopmental outcomes.
Continue to: This work has several limitations...
This work has several limitations, however. Randomization was not truly maintained given the less than 50% response rate of original participants. Additionally, parents completed the surveys and provider confirmation of developmental concerns or diagnoses was not obtained. Further, assessments at 2 years of age may be too early to detect subtle differences, with evaluations at 5 years more predictive of long-term outcomes; the authors stated that these data already are being collected.
Finally, while these data importantly reinforce the conclusions of the parent HYPITAT-II trial, which support expectant management for mild hypertensive disorders in the late preterm period,1 clinicians must always take care to individualize decisions in the face of worsening maternal disease.
This follow-up study of the HYPITAT-II randomized, controlled trial demonstrates poorer neurodevelopmental outcomes in offspring of late preterm mild hypertensives who undergo immediate delivery. These data support current practice recommendations to expectantly manage women with late preterm mild hypertensive disease until 37 weeks or signs of clinical worsening, whichever comes first.
- Broekjuijsen K, van Baaren GJ, van Pampus MG, et al; HYPITAT-II Study Group. Immediate delivery versus expectant monitoring for hypertensive disorders of pregnancy between 34 and 37 weeks of gestation (HYPITAT-II): an open-label, randomised controlled trial. Lancet. 2015;385:2492-2501.
- Broekjuijsen K, van Baaren GJ, van Pampus MG, et al; HYPITAT-II Study Group. Immediate delivery versus expectant monitoring for hypertensive disorders of pregnancy between 34 and 37 weeks of gestation (HYPITAT-II): an open-label, randomised controlled trial. Lancet. 2015;385:2492-2501.

Lack of inhaler at school a major barrier to asthma care
BALTIMORE – frequently because the parent did not provide an inhaler or did not provide a written order for one, according to new research. Only seven U.S. states have laws allowing schools to stock albuterol for students.

“Most students only have access to this lifesaving medication when they bring a personal inhaler,” Alexandra M. Sims, MD, of Children’s National Hospital in Washington and colleagues wrote in their abstract at the annual meeting of Pediatric Academic Societies. “Interventions that address medication availability may be an important step in removing obstacles to asthma care in school.”
One such option is a stock inhaler available for any students to use. National guidelines from the Centers for Disease Control and Prevention recommend that students with asthma have access to inhaled albuterol at school, yet most states do not have legislation related to albuterol stocking in schools, according to the Asthma and Allergy Foundation of America.
Not having access to rescue inhaler medication at school contributes to lost class time and referrals to the emergency department, the authors note in their background information. Yet, “in most U.S. jurisdictions, including the school district we examined, students need both a personal albuterol inhaler and a physician order to receive medication at school.”
To determine what barriers exist regarding students’ asthma care in schools, the authors sent 166 school nurses in an urban school district an anonymous survey during the 2015-2016 school year. The survey asked about 21 factors that could delay or prevent students from returning to class and asked nurses’ agreement or disagreement with 25 additional statements.
The 130 respondents made up a 78% response rate. The institutions represented by the nurses included 44% elementary schools, 9% middle schools, 16% high schools, and 32% other (such as those who may serve multiple schools).
The majority of respondents (72%) agreed that asthma is one of the biggest health problems students face, particularly among middle and high school students (P less than .05). Most (74%) also said an albuterol inhaler at school could reduce the likelihood of students with asthma needing to leave school early.
The largest barrier to students returning to class was parents not providing an albuterol inhaler and/or a written order for an inhaler despite a request from the nurse, according to 69% of the respondents (P less than .05). In high schools in particular, another barrier was students simply not bringing their inhaler to school even though they usually carry one (P less than .01).
Only 15% of nurses saw disease severity as a significant barrier, and 17% cited the staff not adequately recognizing a student’s symptoms.
The researchers did not note use of external funding or author disclosures.
BALTIMORE – frequently because the parent did not provide an inhaler or did not provide a written order for one, according to new research. Only seven U.S. states have laws allowing schools to stock albuterol for students.
“Most students only have access to this lifesaving medication when they bring a personal inhaler,” Alexandra M. Sims, MD, of Children’s National Hospital in Washington and colleagues wrote in their abstract at the annual meeting of Pediatric Academic Societies. “Interventions that address medication availability may be an important step in removing obstacles to asthma care in school.”
One such option is a stock inhaler available for any students to use. National guidelines from the Centers for Disease Control and Prevention recommend that students with asthma have access to inhaled albuterol at school, yet most states do not have legislation related to albuterol stocking in schools, according to the Asthma and Allergy Foundation of America.
Not having access to rescue inhaler medication at school contributes to lost class time and referrals to the emergency department, the authors note in their background information. Yet, “in most U.S. jurisdictions, including the school district we examined, students need both a personal albuterol inhaler and a physician order to receive medication at school.”
To determine what barriers exist regarding students’ asthma care in schools, the authors sent 166 school nurses in an urban school district an anonymous survey during the 2015-2016 school year. The survey asked about 21 factors that could delay or prevent students from returning to class and asked nurses’ agreement or disagreement with 25 additional statements.
The 130 respondents made up a 78% response rate. The institutions represented by the nurses included 44% elementary schools, 9% middle schools, 16% high schools, and 32% other (such as those who may serve multiple schools).
The majority of respondents (72%) agreed that asthma is one of the biggest health problems students face, particularly among middle and high school students (P less than .05). Most (74%) also said an albuterol inhaler at school could reduce the likelihood of students with asthma needing to leave school early.
The largest barrier to students returning to class was parents not providing an albuterol inhaler and/or a written order for an inhaler despite a request from the nurse, according to 69% of the respondents (P less than .05). In high schools in particular, another barrier was students simply not bringing their inhaler to school even though they usually carry one (P less than .01).
Only 15% of nurses saw disease severity as a significant barrier, and 17% cited the staff not adequately recognizing a student’s symptoms.
The researchers did not note use of external funding or author disclosures.
BALTIMORE – frequently because the parent did not provide an inhaler or did not provide a written order for one, according to new research. Only seven U.S. states have laws allowing schools to stock albuterol for students.
“Most students only have access to this lifesaving medication when they bring a personal inhaler,” Alexandra M. Sims, MD, of Children’s National Hospital in Washington and colleagues wrote in their abstract at the annual meeting of Pediatric Academic Societies. “Interventions that address medication availability may be an important step in removing obstacles to asthma care in school.”
One such option is a stock inhaler available for any students to use. National guidelines from the Centers for Disease Control and Prevention recommend that students with asthma have access to inhaled albuterol at school, yet most states do not have legislation related to albuterol stocking in schools, according to the Asthma and Allergy Foundation of America.
Not having access to rescue inhaler medication at school contributes to lost class time and referrals to the emergency department, the authors note in their background information. Yet, “in most U.S. jurisdictions, including the school district we examined, students need both a personal albuterol inhaler and a physician order to receive medication at school.”
To determine what barriers exist regarding students’ asthma care in schools, the authors sent 166 school nurses in an urban school district an anonymous survey during the 2015-2016 school year. The survey asked about 21 factors that could delay or prevent students from returning to class and asked nurses’ agreement or disagreement with 25 additional statements.
The 130 respondents made up a 78% response rate. The institutions represented by the nurses included 44% elementary schools, 9% middle schools, 16% high schools, and 32% other (such as those who may serve multiple schools).
The majority of respondents (72%) agreed that asthma is one of the biggest health problems students face, particularly among middle and high school students (P less than .05). Most (74%) also said an albuterol inhaler at school could reduce the likelihood of students with asthma needing to leave school early.
The largest barrier to students returning to class was parents not providing an albuterol inhaler and/or a written order for an inhaler despite a request from the nurse, according to 69% of the respondents (P less than .05). In high schools in particular, another barrier was students simply not bringing their inhaler to school even though they usually carry one (P less than .01).
Only 15% of nurses saw disease severity as a significant barrier, and 17% cited the staff not adequately recognizing a student’s symptoms.
The researchers did not note use of external funding or author disclosures.
REPORTING FROM PAS 2019

What to do when a patient presents with breast pain
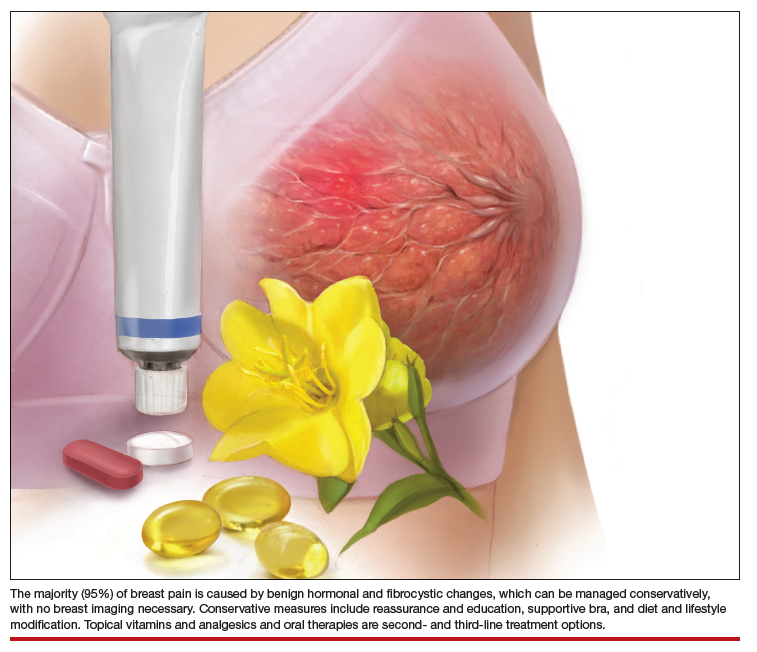
Breast pain is one of the most common breast-related patient complaints and is found to affect at least 50% of the female population.1 Most cases are self-limiting and are related to hormonal and normal fibrocystic changes. The median age of onset of symptoms is 36 years, with most women experiencing pain for 5 to 12 years.2 Because the cause of breast pain is not always clear, its presence can produce anxiety in patients and physicians over the possibility of underlying malignancy. Although breast cancer is not associated with breast pain, many patients presenting with pain are referred for diagnostic imaging (usually with negative results). The majority of women with mastalgia and normal clinical examination findings can be reassured with education about the many benign causes of breast pain.
What are causes of breast pain without an imaging abnormality?
Hormones. Mastalgia can be focal or generalized and is mostly due to hormonal changes. Elevated estrogen can stimulate the growth of breast tissue, which is known as epithelial hyperplasia.3 Fluctuations in hormone levels can occur in perimenopausal women in their forties and can result in new symptoms of breast pain.4 Sometimes starting a new contraceptive medication or hormone replacement therapy can exacerbate the pain. Switching brands or medications may help. Another cause of mastalgia may be elevated prolactin levels, with hypothalamic-pituitary dysfunction.5,6
Diet. There is evidence to link a high-fat diet with breast pain. The pain has been shown to improve when lipid intake is reduced and high- and low-density lipoprotein cholesterol levels are normalized. As estrogen is a steroid hormone that can be synthesized from lipids and fatty acids, elevated lipid metabolism can increase estrogen levels and exacerbate breast pain symptoms.7,8 Essential fatty acids, such as evening primrose oil and vitamin E, have been used to treat mastalgia because they reduce inflammation in fatty breast tissue through the prostaglandin pathway.9,10
Caffeine. Methylxanthines can be found in coffee, tea, and chocolate and can aggravate mastalgia by enhancing the cyclin adenosine monophosphate (cAMP) pathway. This pathway stimulates cellular proliferation and fibrocystic changes which in turn can exacerbate breast pain.11
Smoking. In my clinical practice I have clearly noted a higher incidence of breast pain in patients who smoke. The pain tends to improve significantly when the patient quits or even cuts back on smoking. The exact reasons for smoking’s effects on breast pain are not well known; however, they are thought to be related to acceleration of the cAMP pathway.
Large breast size. Very large breasts will strain and weaken the suspensory ligaments, leading to pain and discomfort. It has been shown that wearing a supportive sports bra during episodes of breast pain is effective.
Types of breast pain
Cyclical
Women with fibrocystic breasts tend to experience more breast pain. Breast sensitivity can be localized to the upper outer quadrants or to the nipple and sub-areolar area. It also can be generalized. The pain tends to peak with ovulation, improve with menses, and to recur every few weeks. Patients who have had partial hysterectomy (with ovaries in situ) or endometrial ablation will be unable to correlate their symptoms to menstruation. Therefore, women are encouraged to keep a diary or calendar of their symptoms to detect any correlation with their ovarian cycle. Such correlation is reassuring.
Continue to: Noncyclical...
Noncyclical
Noncyclical breast pain is not associated with the menstrual cycle and can be unilateral or bilateral. Providers should perform a good history of patients presenting with noncyclicalbreast pain, to include character, onset, duration, location, radiation, alleviating, and aggravating factors. A physical examination may elicit point tenderness at the chest by pushing the breast tissue off of the chest wall while the patient is in supine position and pressing directly over the ribs. Lack of tenderness on palpation of the breast parenchyma, but pain on the chest wall, points to a musculoskeletal etiology. Chest wall pain may be related to muscle spasm or muscle strain, trauma, rib fracture, or costochondritis (Tietze syndrome). Finally, based on history of review of systems and physical examination, referred pain from biliary or cardiac etiology should be considered.
When breast pain occurs with skin changes
Skin changes usually have an underlying pathology. Infectious processes, such as infected epidermal inclusion cyst, hidradenitis of the cleavage and inframammary crease, or breast abscess will present with pain and induration with an acute onset of 5 to 10 days. Large pendulous breasts may develop yeast infection at the inframammary crease. Chronic infectious irritation can lead to hyperpigmentation of that area. Eczema or contact dermatitis frequently can affect the areola and become confused with Paget disease (ductal carcinoma in situ of the nipple). With Paget, the excoriation always starts at the nipple and can then spread to the areola. However, with dermatitis, the rash begins on the peri-areolar skin, without affecting the nipple itself.
When breast pain occurs with nipple discharge
Breast pain with nipple discharge usually is bilateral and more common in patients with significant fibrocystic changes who smoke. If the nipple discharge is bilateral, serous and non-bloody, and multiduct, it is considered benign and physiologic. Physiologic nipple discharge can be multifactorial and hormonal. It may be related to thyroid disorders or medications such as antidepressants, selective serotonin reuptake inhibitors (SSRIs), mood stabilizers, or antipsychotics. The only nipple discharge that is considered pathologic is unilateral spontaneous bloody discharge for which diagnostic imaging and breast surgeon referral is indicated. Women should be discouraged from self-expressing their nipples, as 80% will experience serous nipple discharge upon manual self-expression.
Breast pain is not associated with breast cancer. Most breast cancers do not hurt; they present as firm, painless masses. However, when a woman notices pain in her breast, her first concern is breast cancer. This concern is re-enforced by the medical provider whose first impulse is to order diagnostic imaging. Yet less than 3% of breast cancers are associated with breast pain.
There have been multiple published retrospective and prospective radiologic studies about the utility of breast imaging in women with breast pain without a palpable mass. All of the studies have demonstrated that breast imaging with mammography and ultrasonography in these patients yields mostly negative or benign findings. The incidence of breast cancer during imaging work-up in women with breast pain and no clinical abnormality is only 0.4% to 1.8%.1-3 Some patients may develop future subsequent breast cancer in the symptomatic breast. But this is considered incidental and possibly related to increased cell turnover related to fibrocystic changes. Breast imaging for evaluation of breast pain only provides reassurance to the physician. The patient's reassurance will come from a medical explanation for the symptoms and advice on symptom management from the provider.
Researchers from MD Anderson Cancer Center reported imaging findings and cost analysis for 799 patients presenting with breast pain from 3 large network community-based breast imaging centers in 2014. Breast ultrasound was the initial imaging modality for women younger than age 30. Digital mammography (sometimes with tomosynthesis) was used for those older than age 30 that had not had a mammogram in the last 6 months. Breast magnetic resonance imaging was performed only when ordered by the referring physician. Most of the patients presented for diagnostic imaging, and 95% had negative findings and 5% had a benign finding. Only 1 patient was found to have an incidental cancer in the contralateral breast, which was detected by tomosynthesis. The cost of breast imaging was $87,322 in younger women and $152,732 in women older than age 40, representing overutilization of health care resources and no association between breast pain and breast cancer.4
References
- Chetlan AL, Kapoor MM, Watts MR. Mastalgia: imaging work-up appropriateness. Acad Radiol. 2017;24:345-349.
- Arslan M, Kücükerdem HS, Can H, et al. Retrospective analysis of women with only mastalgia. J Breast Health. 2016;12:151-154.
- Noroozian M, Stein LF, Gaetke-Udager K, et al. Long-term clinical outcomes in women with breast pain in the absence of additional clinical findings: Mammography remains indicated. Breast Cancer Res Treat. 2015;149:417-424.
- Kushwaha AC, Shin K, Kalambo M, et al. Overutilization of health care resources for breast pain. AJR Am J Roentgenol. 2018; 211:217-223.
Management of mastalgia
Appropriate breast pain management begins with a good history and physical examination. The decision to perform imaging should depend on clinical exam findings and not on symptoms of breast pain. If there is a palpable mass, then breast imaging and possible biopsy is appropriate. However, if clinical exam is normal, there is no indication for breast imaging in low-risk women under the age of 40 whose only symptom is breast pain. Women older than age 40 can undergo diagnostic imaging, if they have not had a negative screening mammogram in the past year.
Breast pain with abnormal clinical exam
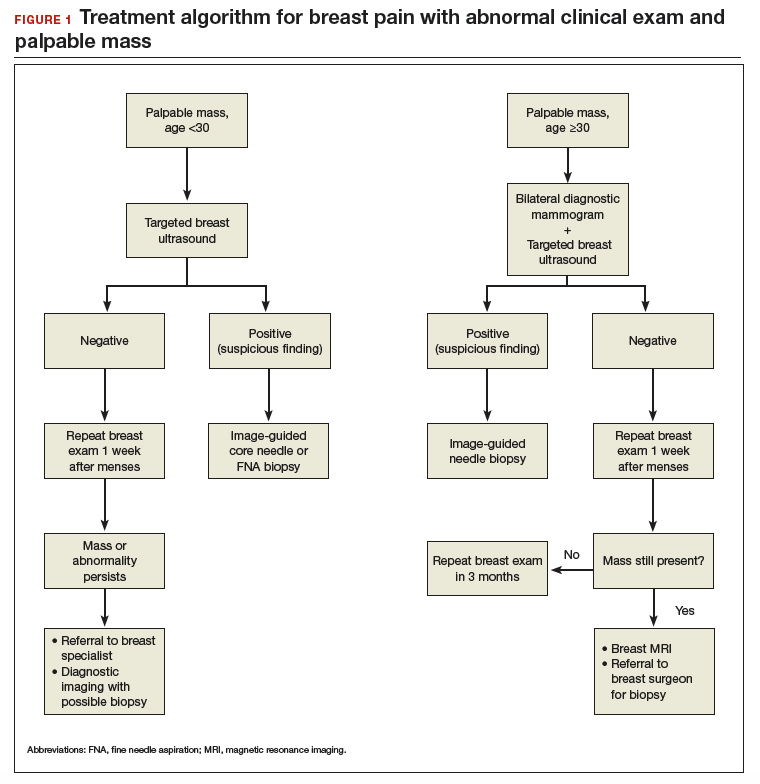
In the patient who is younger than age 30 with a palpable mass. For this patient order targeted breast ultrasound (US) (FIGURE 1). If results are negative, repeat the clinical examination 1 week after menses. If the mass is persistent, refer the patient to a breast surgeon. If diagnostic imaging results are negative, consider breast MRI, especially if there is a strong family history of breast cancer.
In the patient who is aged 30 and older with a palpable mass. For this patient, bilateral diagnostic mammogram and US are in order. The testing is best performed 1 week after menses to reduce false-positive findings. If imaging is negative and the patient still has a clinically suspicious finding or mass, refer her to a breast surgeon and consider breast MRI. At this point if there is a persistent firm dominant mass, a biopsy is indicated as part of the triple test. If the mass resolves with menses, the patient can be reassured that the cause is most likely benign, with clinical examination repeated in 3 months.
Continue to: Breast pain and normal clinical exam...
Breast pain and normal clinical exam
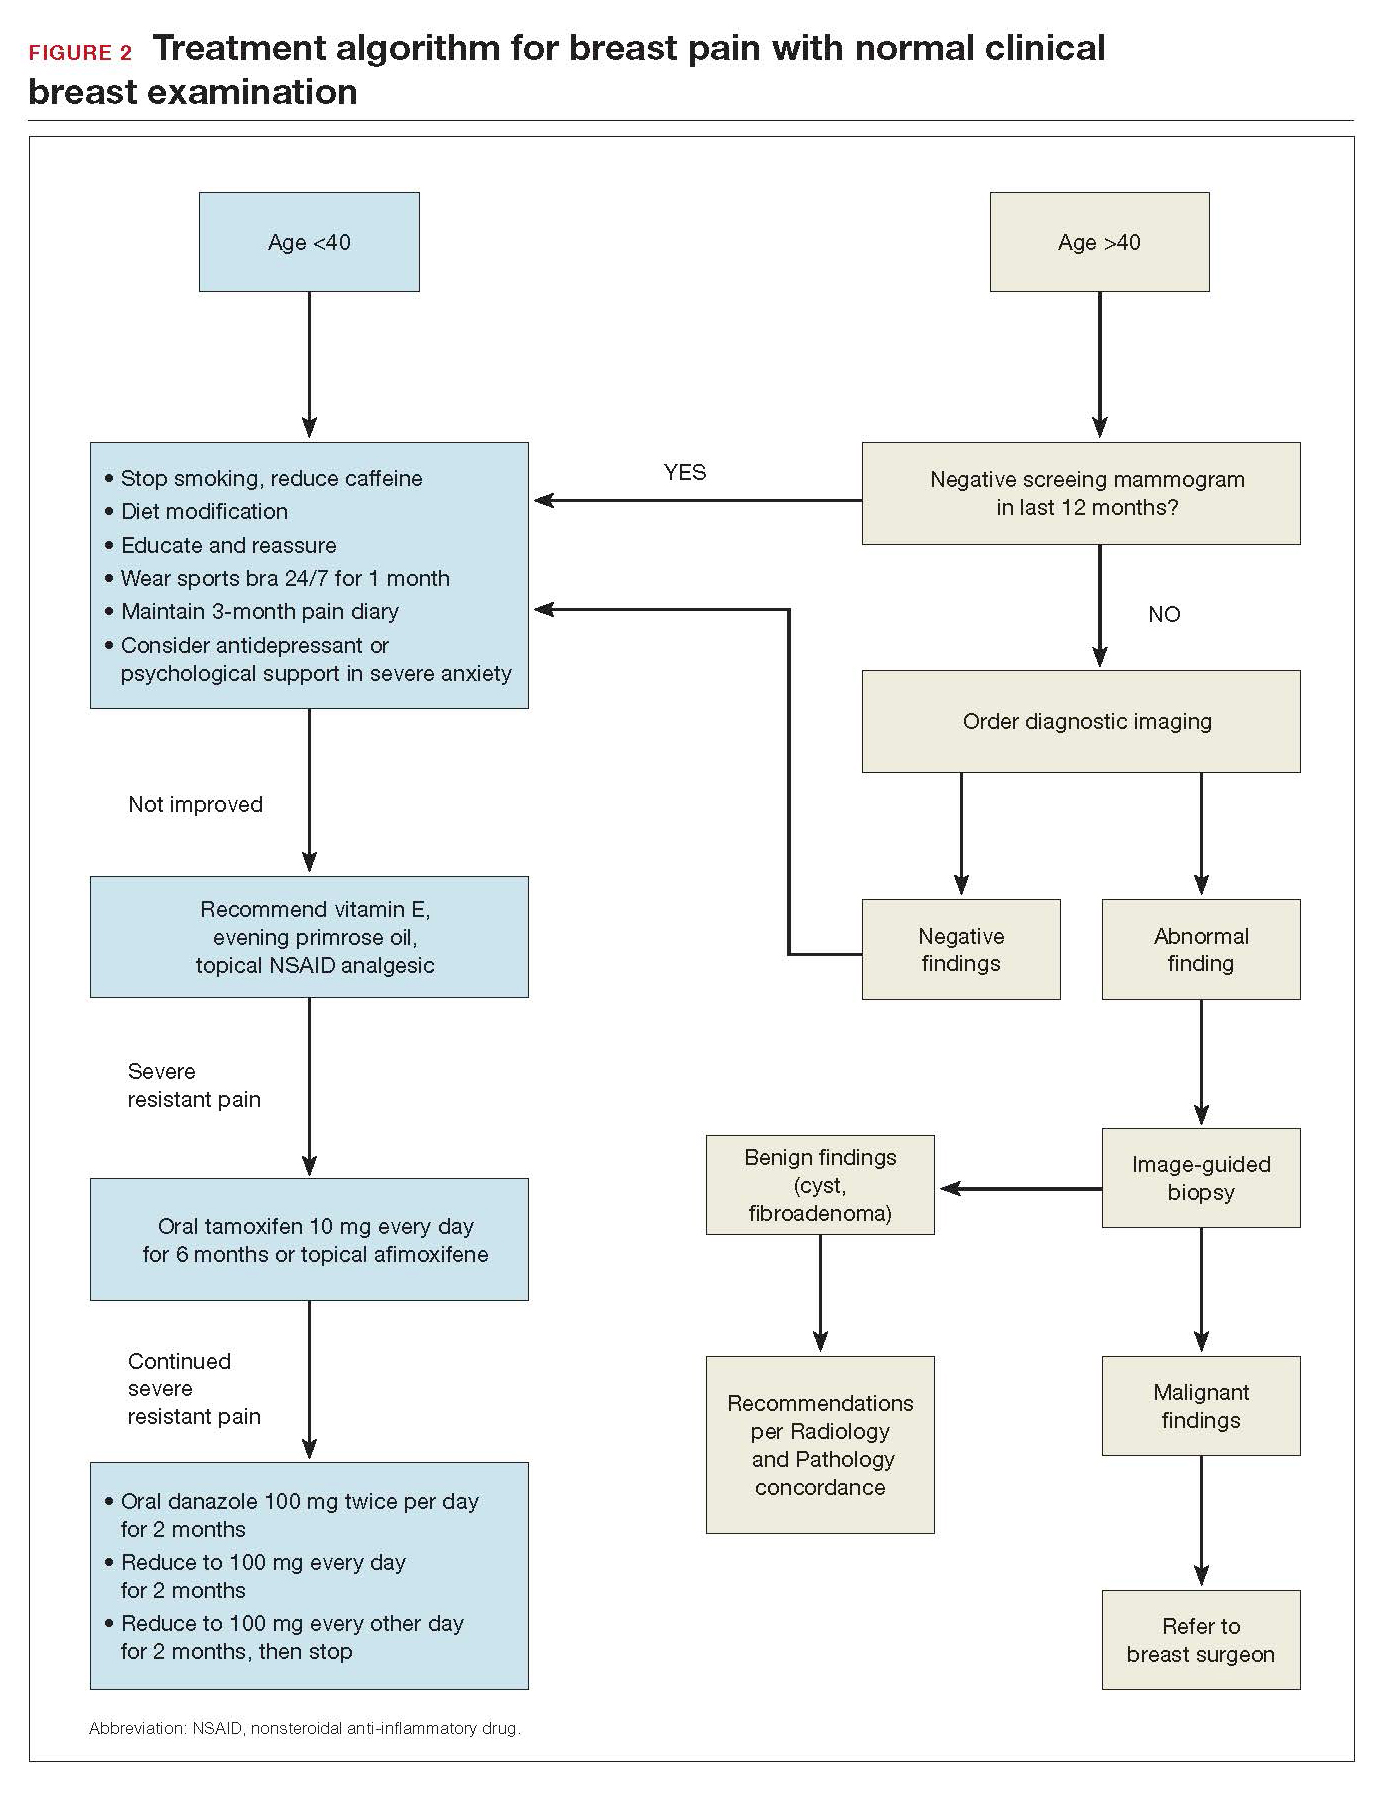
When women who report breast pain have normal clinical examination findings (and have a negative screening mammogram in the past 12 months if older than age 40), there are several management strategies you can offer (FIGURE 2).
Reassurance and education. The majority of women with breast pain can be managed with reassurance and education, which are often sufficient to reduce their anxieties.
Supportive bra. The most effective intervention is to wear and sleep in a well-fitted supportive sports bra for 4 to 12 weeks. In a nonrandomized single-center trial of danazol versus sports bra, 85% of women reported relief of their breast pain with bra alone (vs 58% with danazol).12 A supportive bra is the first-line management of mastalgia (Level II evidence).
Symptom diary/calendar. Many women do not know whether or not their symptoms correspond to their ovarian cycle or are related to hormonal fluctuations. Therefore, it is reassuring and informative for them to keep a calendar or a diary of their symptoms to determine whether their symptoms occur or are exacerbated in a cyclical pattern.
Diet and lifestyle modification. Women should avoid caffeine (especially when having pain). Studies on methylxanthines have demonstrated some symptom relief with reducing caffeine intake.11,13 One cup of coffee or tea per day most likely will not make a difference. However, if a woman is drinking large quantities of caffeinated beverages throughout the day, it will very likely improve her breast pain if she cuts back. This is especially true during the times of exacerbated pain prior to her menses.
In addition, recommend reduced dietary fat (overall good health). This is good advice for any patient. There were 2 small studies that showed improvement in breast pain with a 15% reduction in dietary fat.7,8
Finally, advise that patients stop smoking. Smoking aggravates and exacerbates fibrocystic changes, and these will lead to more breast pain.
Medical management. Over-the-counter medications that are found in the vitamin section of a local drug store are vitamin E and evening primrose oil. There are no significant adverse effects with these treatments. Their efficacy is theoretical, however; 3 randomized controlled trials demonstrated no significant clinical benefit with evening primrose oil versus placebo for treatment of mastalgia.14
Topical or oral nonsteroidal anti-inflammatory drugs (NSAIDs; Voltaren gel, topical compound pain creams) are useful as second-line management after using a supportive bra. Three randomized controlled trials have demonstrated up to 90% improvement of mastalgia with topical NSAIDs.15-17
Tamoxifen is a selective estrogen-receptor modulator (SERM), which is an antagonist to the estrogen receptor (ER) in the breast and an agonist to the ER in the endometrium. Tamoxifen has been found to reduce symptoms of mastalgia by 70% even at a lower dosage of 10-mg per day (for 6 months), or as a topical gel (afimoxifene). The oral form can have some adverse effects, including hot flashes, and has a low risk for thromboembolic events and endometrial neoplasia.18-20
Danazol is very effective in reducing breast pain symptoms (by 80%), with a higher relapse after stopping the medication. Danazol is less tolerated due to its androgenic effects, such as hirsutism, acne, menorrhagia, and voice changes. Both danazol and tamoxifen can be teratogenic and should be used with caution in women of child-bearing age.21
Finally, bromocriptine inhibits serum prolactin and has been reported to provide 65% improvement in breast pain. Its use for breast pain is not US Food and Drug Administration–approved and adverse effects include nausea, dizziness, and hypotension.22
Tamoxifen, danazol, and bromocriptine can be considered as third-line management options for severe treatment-resistant mastalgia.
Continue to: FIGURE 2 Treatment algorithm for breast pain...
In summary
Evaluation and counseling for breast pain should be managed by women’s health care providers in a primary care setting. Most patients need reassurance and medical explanation of their symptoms. They should be educated that more than 95% of the time breast pain is not caused by an underlying malignancy but rather due to hormonal and fibrocystic changes, which can be managed conservatively. If the clinical breast examination and recent screening mammogram (in women over age 40) results are negative, patients should be educated that their pain is benign and undergo a trial of conservative measures: wear and sleep in a supporting bra; keep a calendar of symptoms to determine any relation to cyclical changes; and avoid nicotine, caffeine, and fatty food. Topical pain creams with diclofenac and evening primrose oil also can be effective in ameliorating the symptoms. Breast pain is not a surgical disease; referral to a surgical specialist and diagnostic imaging can be unnecessary and expensive.
- Scurr J, Hedger W, Morris P, et al. The prevalence, severity, and impact of breast pain in the general population. Breast J. 2014;20:508-513.
- Davies EL, Gateley CA, Miers M, et al. The long-term course of mastalgia. J R Soc Med. 1998;91:462-464.
- Singletary SE, Robb GL, Hortobagy GN. Advanced Therapy of Breast Disease. 2nd ed. Ontario, Canada: BC Decker Inc.; 2004.
- Gong C, Song E, Jia W, et al. A double-blind randomized controlled trial of toremifen therapy for mastaglia. Arch Surg. 2006;141:43-47.
- Kumar S, Mansel RE, Scanlon MF, et al. Altered responses of prolactin, luteinizing hormone and follicle stimulating hormone secretion to thyrotrophin releasing hormone/gonadotrophin releasing hormone stimulation in cyclical mastalgia. Br J Surg. 1984;71:870-873.
- Mansel RE, Dogliotti L. European multicentre trial of bromocriptine in cyclical mastalgia. Lancet. 1990;335:190-193.
- Rose DP, Boyar AP, Cohen C, et al. Effect of a low-fat diet on hormone levels in women with cystic breast disease. I. Serum steroids and gonadotropins. J Natl Cancer Inst. 1987;78:623-626.
- Goodwin JP, Miller A, Del Giudice ME, et al. Elevated high-density lipoprotein cholesterol and dietary fat intake in women with cyclic mastopathy. Am J Obstet Gynecol. 1998;179:430-437.
- Goyal A, Mansel RE. Efamast Study Group. A randomized multicenter study of gamolenic acid (Efamast) with and without antioxidant vitamins and minerals in the management of mastalgia. Breast J. 2005;11(1):41-47.
- Parsay S, Olfati F, Nahidi S. Therapeutic effects of vitamin E on cyclic mastalgia. Breast J. 2009;15:510-514.
- Allen SS, Froberg DG. The effect of decreased caffeine consumption on benign proliferative breast disease: a randomized clinical trial. Surgery. 1987;101:720-730.
- Hadi MS. Sports brassiere: is it a solution for mastalgia? Breast J. 2000;6:407-409.
- Russell LC. Caffeine restriction as initial treatment for breast pain. Nurse Pract. 1989; 14(2): 36-7.
- Srivastava A, Mansel RE, Arvind N, et al. Evidence-based management of mastalgia: a meta-analysis of randomised trials. Breast. 2007;16:503-512.
- Irving AD, Morrison SL. Effectiveness of topical non-steroidal anti-inflammatory drugs in the management of breast pain. J R Coll Surg Edinb. 1998;43:158-159.
- Colak T, Ipek T, Kanik A, et al. Efficiency of topical nonsteroidal anti-inflammatory drugs in mastalgia treatment. J Am Coll Surg. 2003;196(4):525-530.
- Kaviani A, Mehrdad N, Najafi M, et al. Comparison of naproxen with placebo for the management of noncyclical breast pain: a randomized, double-blind, controlled trial. World J Surg. 2008;32:2464-2470.
- Fentiman IS, Caleffi M, Brame K, et al. Double-blind controlled trial of tamoxifen therapy for mastalgia. Lancet. 1986;1:287-288.
- Jain BK, Bansal A, Choudhary D, et al. Centchroman vs tamoxifen for regression of mastalgia: a randomized controlled trial. Intl J Surg. 2015;15:11-16.
- Mansel R, Goyal A, Le Nestour EL, et al; Afimoxifene (4-OHT) Breast Pain Research group. A phase II trial of Afimoxifene (4-hydroxyamoxifen gel) for cyclical mastalgia in premenopausal women. Breast Cancer Res Treat. 2007;106:389-397.
- O'Brien PM, Abukhalil IE. Randomized controlled trial of the management of premenstrual syndrome and premenstrual mastalgia using luteal phase-only danazol. Am J Obstet Gynecol. 1999;180:18-23.
- Blichert-Toft M, Andersen AN, Henriksen OB, et al. Treatment of mastalgia with bromocriptine: a double-blind cross-over study. Br Med J. 1979;1:237.

Dr. Samiian is a Breast Surgical Oncologist at Baptist MD Anderson Cancer Center, Jacksonville, Florida.
The author reports no financial relationships relevant to this article.
Dr. Samiian is a Breast Surgical Oncologist at Baptist MD Anderson Cancer Center, Jacksonville, Florida.
The author reports no financial relationships relevant to this article.
Dr. Samiian is a Breast Surgical Oncologist at Baptist MD Anderson Cancer Center, Jacksonville, Florida.
The author reports no financial relationships relevant to this article.
Breast pain is one of the most common breast-related patient complaints and is found to affect at least 50% of the female population.1 Most cases are self-limiting and are related to hormonal and normal fibrocystic changes. The median age of onset of symptoms is 36 years, with most women experiencing pain for 5 to 12 years.2 Because the cause of breast pain is not always clear, its presence can produce anxiety in patients and physicians over the possibility of underlying malignancy. Although breast cancer is not associated with breast pain, many patients presenting with pain are referred for diagnostic imaging (usually with negative results). The majority of women with mastalgia and normal clinical examination findings can be reassured with education about the many benign causes of breast pain.
What are causes of breast pain without an imaging abnormality?
Hormones. Mastalgia can be focal or generalized and is mostly due to hormonal changes. Elevated estrogen can stimulate the growth of breast tissue, which is known as epithelial hyperplasia.3 Fluctuations in hormone levels can occur in perimenopausal women in their forties and can result in new symptoms of breast pain.4 Sometimes starting a new contraceptive medication or hormone replacement therapy can exacerbate the pain. Switching brands or medications may help. Another cause of mastalgia may be elevated prolactin levels, with hypothalamic-pituitary dysfunction.5,6
Diet. There is evidence to link a high-fat diet with breast pain. The pain has been shown to improve when lipid intake is reduced and high- and low-density lipoprotein cholesterol levels are normalized. As estrogen is a steroid hormone that can be synthesized from lipids and fatty acids, elevated lipid metabolism can increase estrogen levels and exacerbate breast pain symptoms.7,8 Essential fatty acids, such as evening primrose oil and vitamin E, have been used to treat mastalgia because they reduce inflammation in fatty breast tissue through the prostaglandin pathway.9,10
Caffeine. Methylxanthines can be found in coffee, tea, and chocolate and can aggravate mastalgia by enhancing the cyclin adenosine monophosphate (cAMP) pathway. This pathway stimulates cellular proliferation and fibrocystic changes which in turn can exacerbate breast pain.11
Smoking. In my clinical practice I have clearly noted a higher incidence of breast pain in patients who smoke. The pain tends to improve significantly when the patient quits or even cuts back on smoking. The exact reasons for smoking’s effects on breast pain are not well known; however, they are thought to be related to acceleration of the cAMP pathway.
Large breast size. Very large breasts will strain and weaken the suspensory ligaments, leading to pain and discomfort. It has been shown that wearing a supportive sports bra during episodes of breast pain is effective.
Types of breast pain
Cyclical
Women with fibrocystic breasts tend to experience more breast pain. Breast sensitivity can be localized to the upper outer quadrants or to the nipple and sub-areolar area. It also can be generalized. The pain tends to peak with ovulation, improve with menses, and to recur every few weeks. Patients who have had partial hysterectomy (with ovaries in situ) or endometrial ablation will be unable to correlate their symptoms to menstruation. Therefore, women are encouraged to keep a diary or calendar of their symptoms to detect any correlation with their ovarian cycle. Such correlation is reassuring.
Continue to: Noncyclical...
Noncyclical
Noncyclical breast pain is not associated with the menstrual cycle and can be unilateral or bilateral. Providers should perform a good history of patients presenting with noncyclicalbreast pain, to include character, onset, duration, location, radiation, alleviating, and aggravating factors. A physical examination may elicit point tenderness at the chest by pushing the breast tissue off of the chest wall while the patient is in supine position and pressing directly over the ribs. Lack of tenderness on palpation of the breast parenchyma, but pain on the chest wall, points to a musculoskeletal etiology. Chest wall pain may be related to muscle spasm or muscle strain, trauma, rib fracture, or costochondritis (Tietze syndrome). Finally, based on history of review of systems and physical examination, referred pain from biliary or cardiac etiology should be considered.
When breast pain occurs with skin changes
Skin changes usually have an underlying pathology. Infectious processes, such as infected epidermal inclusion cyst, hidradenitis of the cleavage and inframammary crease, or breast abscess will present with pain and induration with an acute onset of 5 to 10 days. Large pendulous breasts may develop yeast infection at the inframammary crease. Chronic infectious irritation can lead to hyperpigmentation of that area. Eczema or contact dermatitis frequently can affect the areola and become confused with Paget disease (ductal carcinoma in situ of the nipple). With Paget, the excoriation always starts at the nipple and can then spread to the areola. However, with dermatitis, the rash begins on the peri-areolar skin, without affecting the nipple itself.
When breast pain occurs with nipple discharge
Breast pain with nipple discharge usually is bilateral and more common in patients with significant fibrocystic changes who smoke. If the nipple discharge is bilateral, serous and non-bloody, and multiduct, it is considered benign and physiologic. Physiologic nipple discharge can be multifactorial and hormonal. It may be related to thyroid disorders or medications such as antidepressants, selective serotonin reuptake inhibitors (SSRIs), mood stabilizers, or antipsychotics. The only nipple discharge that is considered pathologic is unilateral spontaneous bloody discharge for which diagnostic imaging and breast surgeon referral is indicated. Women should be discouraged from self-expressing their nipples, as 80% will experience serous nipple discharge upon manual self-expression.
Breast pain is not associated with breast cancer. Most breast cancers do not hurt; they present as firm, painless masses. However, when a woman notices pain in her breast, her first concern is breast cancer. This concern is re-enforced by the medical provider whose first impulse is to order diagnostic imaging. Yet less than 3% of breast cancers are associated with breast pain.
There have been multiple published retrospective and prospective radiologic studies about the utility of breast imaging in women with breast pain without a palpable mass. All of the studies have demonstrated that breast imaging with mammography and ultrasonography in these patients yields mostly negative or benign findings. The incidence of breast cancer during imaging work-up in women with breast pain and no clinical abnormality is only 0.4% to 1.8%.1-3 Some patients may develop future subsequent breast cancer in the symptomatic breast. But this is considered incidental and possibly related to increased cell turnover related to fibrocystic changes. Breast imaging for evaluation of breast pain only provides reassurance to the physician. The patient's reassurance will come from a medical explanation for the symptoms and advice on symptom management from the provider.
Researchers from MD Anderson Cancer Center reported imaging findings and cost analysis for 799 patients presenting with breast pain from 3 large network community-based breast imaging centers in 2014. Breast ultrasound was the initial imaging modality for women younger than age 30. Digital mammography (sometimes with tomosynthesis) was used for those older than age 30 that had not had a mammogram in the last 6 months. Breast magnetic resonance imaging was performed only when ordered by the referring physician. Most of the patients presented for diagnostic imaging, and 95% had negative findings and 5% had a benign finding. Only 1 patient was found to have an incidental cancer in the contralateral breast, which was detected by tomosynthesis. The cost of breast imaging was $87,322 in younger women and $152,732 in women older than age 40, representing overutilization of health care resources and no association between breast pain and breast cancer.4
References
- Chetlan AL, Kapoor MM, Watts MR. Mastalgia: imaging work-up appropriateness. Acad Radiol. 2017;24:345-349.
- Arslan M, Kücükerdem HS, Can H, et al. Retrospective analysis of women with only mastalgia. J Breast Health. 2016;12:151-154.
- Noroozian M, Stein LF, Gaetke-Udager K, et al. Long-term clinical outcomes in women with breast pain in the absence of additional clinical findings: Mammography remains indicated. Breast Cancer Res Treat. 2015;149:417-424.
- Kushwaha AC, Shin K, Kalambo M, et al. Overutilization of health care resources for breast pain. AJR Am J Roentgenol. 2018; 211:217-223.
Management of mastalgia
Appropriate breast pain management begins with a good history and physical examination. The decision to perform imaging should depend on clinical exam findings and not on symptoms of breast pain. If there is a palpable mass, then breast imaging and possible biopsy is appropriate. However, if clinical exam is normal, there is no indication for breast imaging in low-risk women under the age of 40 whose only symptom is breast pain. Women older than age 40 can undergo diagnostic imaging, if they have not had a negative screening mammogram in the past year.
Breast pain with abnormal clinical exam
In the patient who is younger than age 30 with a palpable mass. For this patient order targeted breast ultrasound (US) (FIGURE 1). If results are negative, repeat the clinical examination 1 week after menses. If the mass is persistent, refer the patient to a breast surgeon. If diagnostic imaging results are negative, consider breast MRI, especially if there is a strong family history of breast cancer.
In the patient who is aged 30 and older with a palpable mass. For this patient, bilateral diagnostic mammogram and US are in order. The testing is best performed 1 week after menses to reduce false-positive findings. If imaging is negative and the patient still has a clinically suspicious finding or mass, refer her to a breast surgeon and consider breast MRI. At this point if there is a persistent firm dominant mass, a biopsy is indicated as part of the triple test. If the mass resolves with menses, the patient can be reassured that the cause is most likely benign, with clinical examination repeated in 3 months.
Continue to: Breast pain and normal clinical exam...
Breast pain and normal clinical exam
When women who report breast pain have normal clinical examination findings (and have a negative screening mammogram in the past 12 months if older than age 40), there are several management strategies you can offer (FIGURE 2).
Reassurance and education. The majority of women with breast pain can be managed with reassurance and education, which are often sufficient to reduce their anxieties.
Supportive bra. The most effective intervention is to wear and sleep in a well-fitted supportive sports bra for 4 to 12 weeks. In a nonrandomized single-center trial of danazol versus sports bra, 85% of women reported relief of their breast pain with bra alone (vs 58% with danazol).12 A supportive bra is the first-line management of mastalgia (Level II evidence).
Symptom diary/calendar. Many women do not know whether or not their symptoms correspond to their ovarian cycle or are related to hormonal fluctuations. Therefore, it is reassuring and informative for them to keep a calendar or a diary of their symptoms to determine whether their symptoms occur or are exacerbated in a cyclical pattern.
Diet and lifestyle modification. Women should avoid caffeine (especially when having pain). Studies on methylxanthines have demonstrated some symptom relief with reducing caffeine intake.11,13 One cup of coffee or tea per day most likely will not make a difference. However, if a woman is drinking large quantities of caffeinated beverages throughout the day, it will very likely improve her breast pain if she cuts back. This is especially true during the times of exacerbated pain prior to her menses.
In addition, recommend reduced dietary fat (overall good health). This is good advice for any patient. There were 2 small studies that showed improvement in breast pain with a 15% reduction in dietary fat.7,8
Finally, advise that patients stop smoking. Smoking aggravates and exacerbates fibrocystic changes, and these will lead to more breast pain.
Medical management. Over-the-counter medications that are found in the vitamin section of a local drug store are vitamin E and evening primrose oil. There are no significant adverse effects with these treatments. Their efficacy is theoretical, however; 3 randomized controlled trials demonstrated no significant clinical benefit with evening primrose oil versus placebo for treatment of mastalgia.14
Topical or oral nonsteroidal anti-inflammatory drugs (NSAIDs; Voltaren gel, topical compound pain creams) are useful as second-line management after using a supportive bra. Three randomized controlled trials have demonstrated up to 90% improvement of mastalgia with topical NSAIDs.15-17
Tamoxifen is a selective estrogen-receptor modulator (SERM), which is an antagonist to the estrogen receptor (ER) in the breast and an agonist to the ER in the endometrium. Tamoxifen has been found to reduce symptoms of mastalgia by 70% even at a lower dosage of 10-mg per day (for 6 months), or as a topical gel (afimoxifene). The oral form can have some adverse effects, including hot flashes, and has a low risk for thromboembolic events and endometrial neoplasia.18-20
Danazol is very effective in reducing breast pain symptoms (by 80%), with a higher relapse after stopping the medication. Danazol is less tolerated due to its androgenic effects, such as hirsutism, acne, menorrhagia, and voice changes. Both danazol and tamoxifen can be teratogenic and should be used with caution in women of child-bearing age.21
Finally, bromocriptine inhibits serum prolactin and has been reported to provide 65% improvement in breast pain. Its use for breast pain is not US Food and Drug Administration–approved and adverse effects include nausea, dizziness, and hypotension.22
Tamoxifen, danazol, and bromocriptine can be considered as third-line management options for severe treatment-resistant mastalgia.
Continue to: FIGURE 2 Treatment algorithm for breast pain...
In summary
Evaluation and counseling for breast pain should be managed by women’s health care providers in a primary care setting. Most patients need reassurance and medical explanation of their symptoms. They should be educated that more than 95% of the time breast pain is not caused by an underlying malignancy but rather due to hormonal and fibrocystic changes, which can be managed conservatively. If the clinical breast examination and recent screening mammogram (in women over age 40) results are negative, patients should be educated that their pain is benign and undergo a trial of conservative measures: wear and sleep in a supporting bra; keep a calendar of symptoms to determine any relation to cyclical changes; and avoid nicotine, caffeine, and fatty food. Topical pain creams with diclofenac and evening primrose oil also can be effective in ameliorating the symptoms. Breast pain is not a surgical disease; referral to a surgical specialist and diagnostic imaging can be unnecessary and expensive.
Breast pain is one of the most common breast-related patient complaints and is found to affect at least 50% of the female population.1 Most cases are self-limiting and are related to hormonal and normal fibrocystic changes. The median age of onset of symptoms is 36 years, with most women experiencing pain for 5 to 12 years.2 Because the cause of breast pain is not always clear, its presence can produce anxiety in patients and physicians over the possibility of underlying malignancy. Although breast cancer is not associated with breast pain, many patients presenting with pain are referred for diagnostic imaging (usually with negative results). The majority of women with mastalgia and normal clinical examination findings can be reassured with education about the many benign causes of breast pain.
What are causes of breast pain without an imaging abnormality?
Hormones. Mastalgia can be focal or generalized and is mostly due to hormonal changes. Elevated estrogen can stimulate the growth of breast tissue, which is known as epithelial hyperplasia.3 Fluctuations in hormone levels can occur in perimenopausal women in their forties and can result in new symptoms of breast pain.4 Sometimes starting a new contraceptive medication or hormone replacement therapy can exacerbate the pain. Switching brands or medications may help. Another cause of mastalgia may be elevated prolactin levels, with hypothalamic-pituitary dysfunction.5,6
Diet. There is evidence to link a high-fat diet with breast pain. The pain has been shown to improve when lipid intake is reduced and high- and low-density lipoprotein cholesterol levels are normalized. As estrogen is a steroid hormone that can be synthesized from lipids and fatty acids, elevated lipid metabolism can increase estrogen levels and exacerbate breast pain symptoms.7,8 Essential fatty acids, such as evening primrose oil and vitamin E, have been used to treat mastalgia because they reduce inflammation in fatty breast tissue through the prostaglandin pathway.9,10
Caffeine. Methylxanthines can be found in coffee, tea, and chocolate and can aggravate mastalgia by enhancing the cyclin adenosine monophosphate (cAMP) pathway. This pathway stimulates cellular proliferation and fibrocystic changes which in turn can exacerbate breast pain.11
Smoking. In my clinical practice I have clearly noted a higher incidence of breast pain in patients who smoke. The pain tends to improve significantly when the patient quits or even cuts back on smoking. The exact reasons for smoking’s effects on breast pain are not well known; however, they are thought to be related to acceleration of the cAMP pathway.
Large breast size. Very large breasts will strain and weaken the suspensory ligaments, leading to pain and discomfort. It has been shown that wearing a supportive sports bra during episodes of breast pain is effective.
Types of breast pain
Cyclical
Women with fibrocystic breasts tend to experience more breast pain. Breast sensitivity can be localized to the upper outer quadrants or to the nipple and sub-areolar area. It also can be generalized. The pain tends to peak with ovulation, improve with menses, and to recur every few weeks. Patients who have had partial hysterectomy (with ovaries in situ) or endometrial ablation will be unable to correlate their symptoms to menstruation. Therefore, women are encouraged to keep a diary or calendar of their symptoms to detect any correlation with their ovarian cycle. Such correlation is reassuring.
Continue to: Noncyclical...
Noncyclical
Noncyclical breast pain is not associated with the menstrual cycle and can be unilateral or bilateral. Providers should perform a good history of patients presenting with noncyclicalbreast pain, to include character, onset, duration, location, radiation, alleviating, and aggravating factors. A physical examination may elicit point tenderness at the chest by pushing the breast tissue off of the chest wall while the patient is in supine position and pressing directly over the ribs. Lack of tenderness on palpation of the breast parenchyma, but pain on the chest wall, points to a musculoskeletal etiology. Chest wall pain may be related to muscle spasm or muscle strain, trauma, rib fracture, or costochondritis (Tietze syndrome). Finally, based on history of review of systems and physical examination, referred pain from biliary or cardiac etiology should be considered.
When breast pain occurs with skin changes
Skin changes usually have an underlying pathology. Infectious processes, such as infected epidermal inclusion cyst, hidradenitis of the cleavage and inframammary crease, or breast abscess will present with pain and induration with an acute onset of 5 to 10 days. Large pendulous breasts may develop yeast infection at the inframammary crease. Chronic infectious irritation can lead to hyperpigmentation of that area. Eczema or contact dermatitis frequently can affect the areola and become confused with Paget disease (ductal carcinoma in situ of the nipple). With Paget, the excoriation always starts at the nipple and can then spread to the areola. However, with dermatitis, the rash begins on the peri-areolar skin, without affecting the nipple itself.
When breast pain occurs with nipple discharge
Breast pain with nipple discharge usually is bilateral and more common in patients with significant fibrocystic changes who smoke. If the nipple discharge is bilateral, serous and non-bloody, and multiduct, it is considered benign and physiologic. Physiologic nipple discharge can be multifactorial and hormonal. It may be related to thyroid disorders or medications such as antidepressants, selective serotonin reuptake inhibitors (SSRIs), mood stabilizers, or antipsychotics. The only nipple discharge that is considered pathologic is unilateral spontaneous bloody discharge for which diagnostic imaging and breast surgeon referral is indicated. Women should be discouraged from self-expressing their nipples, as 80% will experience serous nipple discharge upon manual self-expression.
Breast pain is not associated with breast cancer. Most breast cancers do not hurt; they present as firm, painless masses. However, when a woman notices pain in her breast, her first concern is breast cancer. This concern is re-enforced by the medical provider whose first impulse is to order diagnostic imaging. Yet less than 3% of breast cancers are associated with breast pain.
There have been multiple published retrospective and prospective radiologic studies about the utility of breast imaging in women with breast pain without a palpable mass. All of the studies have demonstrated that breast imaging with mammography and ultrasonography in these patients yields mostly negative or benign findings. The incidence of breast cancer during imaging work-up in women with breast pain and no clinical abnormality is only 0.4% to 1.8%.1-3 Some patients may develop future subsequent breast cancer in the symptomatic breast. But this is considered incidental and possibly related to increased cell turnover related to fibrocystic changes. Breast imaging for evaluation of breast pain only provides reassurance to the physician. The patient's reassurance will come from a medical explanation for the symptoms and advice on symptom management from the provider.
Researchers from MD Anderson Cancer Center reported imaging findings and cost analysis for 799 patients presenting with breast pain from 3 large network community-based breast imaging centers in 2014. Breast ultrasound was the initial imaging modality for women younger than age 30. Digital mammography (sometimes with tomosynthesis) was used for those older than age 30 that had not had a mammogram in the last 6 months. Breast magnetic resonance imaging was performed only when ordered by the referring physician. Most of the patients presented for diagnostic imaging, and 95% had negative findings and 5% had a benign finding. Only 1 patient was found to have an incidental cancer in the contralateral breast, which was detected by tomosynthesis. The cost of breast imaging was $87,322 in younger women and $152,732 in women older than age 40, representing overutilization of health care resources and no association between breast pain and breast cancer.4
References
- Chetlan AL, Kapoor MM, Watts MR. Mastalgia: imaging work-up appropriateness. Acad Radiol. 2017;24:345-349.
- Arslan M, Kücükerdem HS, Can H, et al. Retrospective analysis of women with only mastalgia. J Breast Health. 2016;12:151-154.
- Noroozian M, Stein LF, Gaetke-Udager K, et al. Long-term clinical outcomes in women with breast pain in the absence of additional clinical findings: Mammography remains indicated. Breast Cancer Res Treat. 2015;149:417-424.
- Kushwaha AC, Shin K, Kalambo M, et al. Overutilization of health care resources for breast pain. AJR Am J Roentgenol. 2018; 211:217-223.
Management of mastalgia
Appropriate breast pain management begins with a good history and physical examination. The decision to perform imaging should depend on clinical exam findings and not on symptoms of breast pain. If there is a palpable mass, then breast imaging and possible biopsy is appropriate. However, if clinical exam is normal, there is no indication for breast imaging in low-risk women under the age of 40 whose only symptom is breast pain. Women older than age 40 can undergo diagnostic imaging, if they have not had a negative screening mammogram in the past year.
Breast pain with abnormal clinical exam
In the patient who is younger than age 30 with a palpable mass. For this patient order targeted breast ultrasound (US) (FIGURE 1). If results are negative, repeat the clinical examination 1 week after menses. If the mass is persistent, refer the patient to a breast surgeon. If diagnostic imaging results are negative, consider breast MRI, especially if there is a strong family history of breast cancer.
In the patient who is aged 30 and older with a palpable mass. For this patient, bilateral diagnostic mammogram and US are in order. The testing is best performed 1 week after menses to reduce false-positive findings. If imaging is negative and the patient still has a clinically suspicious finding or mass, refer her to a breast surgeon and consider breast MRI. At this point if there is a persistent firm dominant mass, a biopsy is indicated as part of the triple test. If the mass resolves with menses, the patient can be reassured that the cause is most likely benign, with clinical examination repeated in 3 months.
Continue to: Breast pain and normal clinical exam...
Breast pain and normal clinical exam
When women who report breast pain have normal clinical examination findings (and have a negative screening mammogram in the past 12 months if older than age 40), there are several management strategies you can offer (FIGURE 2).
Reassurance and education. The majority of women with breast pain can be managed with reassurance and education, which are often sufficient to reduce their anxieties.
Supportive bra. The most effective intervention is to wear and sleep in a well-fitted supportive sports bra for 4 to 12 weeks. In a nonrandomized single-center trial of danazol versus sports bra, 85% of women reported relief of their breast pain with bra alone (vs 58% with danazol).12 A supportive bra is the first-line management of mastalgia (Level II evidence).
Symptom diary/calendar. Many women do not know whether or not their symptoms correspond to their ovarian cycle or are related to hormonal fluctuations. Therefore, it is reassuring and informative for them to keep a calendar or a diary of their symptoms to determine whether their symptoms occur or are exacerbated in a cyclical pattern.
Diet and lifestyle modification. Women should avoid caffeine (especially when having pain). Studies on methylxanthines have demonstrated some symptom relief with reducing caffeine intake.11,13 One cup of coffee or tea per day most likely will not make a difference. However, if a woman is drinking large quantities of caffeinated beverages throughout the day, it will very likely improve her breast pain if she cuts back. This is especially true during the times of exacerbated pain prior to her menses.
In addition, recommend reduced dietary fat (overall good health). This is good advice for any patient. There were 2 small studies that showed improvement in breast pain with a 15% reduction in dietary fat.7,8
Finally, advise that patients stop smoking. Smoking aggravates and exacerbates fibrocystic changes, and these will lead to more breast pain.
Medical management. Over-the-counter medications that are found in the vitamin section of a local drug store are vitamin E and evening primrose oil. There are no significant adverse effects with these treatments. Their efficacy is theoretical, however; 3 randomized controlled trials demonstrated no significant clinical benefit with evening primrose oil versus placebo for treatment of mastalgia.14
Topical or oral nonsteroidal anti-inflammatory drugs (NSAIDs; Voltaren gel, topical compound pain creams) are useful as second-line management after using a supportive bra. Three randomized controlled trials have demonstrated up to 90% improvement of mastalgia with topical NSAIDs.15-17
Tamoxifen is a selective estrogen-receptor modulator (SERM), which is an antagonist to the estrogen receptor (ER) in the breast and an agonist to the ER in the endometrium. Tamoxifen has been found to reduce symptoms of mastalgia by 70% even at a lower dosage of 10-mg per day (for 6 months), or as a topical gel (afimoxifene). The oral form can have some adverse effects, including hot flashes, and has a low risk for thromboembolic events and endometrial neoplasia.18-20
Danazol is very effective in reducing breast pain symptoms (by 80%), with a higher relapse after stopping the medication. Danazol is less tolerated due to its androgenic effects, such as hirsutism, acne, menorrhagia, and voice changes. Both danazol and tamoxifen can be teratogenic and should be used with caution in women of child-bearing age.21
Finally, bromocriptine inhibits serum prolactin and has been reported to provide 65% improvement in breast pain. Its use for breast pain is not US Food and Drug Administration–approved and adverse effects include nausea, dizziness, and hypotension.22
Tamoxifen, danazol, and bromocriptine can be considered as third-line management options for severe treatment-resistant mastalgia.
Continue to: FIGURE 2 Treatment algorithm for breast pain...
In summary
Evaluation and counseling for breast pain should be managed by women’s health care providers in a primary care setting. Most patients need reassurance and medical explanation of their symptoms. They should be educated that more than 95% of the time breast pain is not caused by an underlying malignancy but rather due to hormonal and fibrocystic changes, which can be managed conservatively. If the clinical breast examination and recent screening mammogram (in women over age 40) results are negative, patients should be educated that their pain is benign and undergo a trial of conservative measures: wear and sleep in a supporting bra; keep a calendar of symptoms to determine any relation to cyclical changes; and avoid nicotine, caffeine, and fatty food. Topical pain creams with diclofenac and evening primrose oil also can be effective in ameliorating the symptoms. Breast pain is not a surgical disease; referral to a surgical specialist and diagnostic imaging can be unnecessary and expensive.
- Scurr J, Hedger W, Morris P, et al. The prevalence, severity, and impact of breast pain in the general population. Breast J. 2014;20:508-513.
- Davies EL, Gateley CA, Miers M, et al. The long-term course of mastalgia. J R Soc Med. 1998;91:462-464.
- Singletary SE, Robb GL, Hortobagy GN. Advanced Therapy of Breast Disease. 2nd ed. Ontario, Canada: BC Decker Inc.; 2004.
- Gong C, Song E, Jia W, et al. A double-blind randomized controlled trial of toremifen therapy for mastaglia. Arch Surg. 2006;141:43-47.
- Kumar S, Mansel RE, Scanlon MF, et al. Altered responses of prolactin, luteinizing hormone and follicle stimulating hormone secretion to thyrotrophin releasing hormone/gonadotrophin releasing hormone stimulation in cyclical mastalgia. Br J Surg. 1984;71:870-873.
- Mansel RE, Dogliotti L. European multicentre trial of bromocriptine in cyclical mastalgia. Lancet. 1990;335:190-193.
- Rose DP, Boyar AP, Cohen C, et al. Effect of a low-fat diet on hormone levels in women with cystic breast disease. I. Serum steroids and gonadotropins. J Natl Cancer Inst. 1987;78:623-626.
- Goodwin JP, Miller A, Del Giudice ME, et al. Elevated high-density lipoprotein cholesterol and dietary fat intake in women with cyclic mastopathy. Am J Obstet Gynecol. 1998;179:430-437.
- Goyal A, Mansel RE. Efamast Study Group. A randomized multicenter study of gamolenic acid (Efamast) with and without antioxidant vitamins and minerals in the management of mastalgia. Breast J. 2005;11(1):41-47.
- Parsay S, Olfati F, Nahidi S. Therapeutic effects of vitamin E on cyclic mastalgia. Breast J. 2009;15:510-514.
- Allen SS, Froberg DG. The effect of decreased caffeine consumption on benign proliferative breast disease: a randomized clinical trial. Surgery. 1987;101:720-730.
- Hadi MS. Sports brassiere: is it a solution for mastalgia? Breast J. 2000;6:407-409.
- Russell LC. Caffeine restriction as initial treatment for breast pain. Nurse Pract. 1989; 14(2): 36-7.
- Srivastava A, Mansel RE, Arvind N, et al. Evidence-based management of mastalgia: a meta-analysis of randomised trials. Breast. 2007;16:503-512.
- Irving AD, Morrison SL. Effectiveness of topical non-steroidal anti-inflammatory drugs in the management of breast pain. J R Coll Surg Edinb. 1998;43:158-159.
- Colak T, Ipek T, Kanik A, et al. Efficiency of topical nonsteroidal anti-inflammatory drugs in mastalgia treatment. J Am Coll Surg. 2003;196(4):525-530.
- Kaviani A, Mehrdad N, Najafi M, et al. Comparison of naproxen with placebo for the management of noncyclical breast pain: a randomized, double-blind, controlled trial. World J Surg. 2008;32:2464-2470.
- Fentiman IS, Caleffi M, Brame K, et al. Double-blind controlled trial of tamoxifen therapy for mastalgia. Lancet. 1986;1:287-288.
- Jain BK, Bansal A, Choudhary D, et al. Centchroman vs tamoxifen for regression of mastalgia: a randomized controlled trial. Intl J Surg. 2015;15:11-16.
- Mansel R, Goyal A, Le Nestour EL, et al; Afimoxifene (4-OHT) Breast Pain Research group. A phase II trial of Afimoxifene (4-hydroxyamoxifen gel) for cyclical mastalgia in premenopausal women. Breast Cancer Res Treat. 2007;106:389-397.
- O'Brien PM, Abukhalil IE. Randomized controlled trial of the management of premenstrual syndrome and premenstrual mastalgia using luteal phase-only danazol. Am J Obstet Gynecol. 1999;180:18-23.
- Blichert-Toft M, Andersen AN, Henriksen OB, et al. Treatment of mastalgia with bromocriptine: a double-blind cross-over study. Br Med J. 1979;1:237.
- Scurr J, Hedger W, Morris P, et al. The prevalence, severity, and impact of breast pain in the general population. Breast J. 2014;20:508-513.
- Davies EL, Gateley CA, Miers M, et al. The long-term course of mastalgia. J R Soc Med. 1998;91:462-464.
- Singletary SE, Robb GL, Hortobagy GN. Advanced Therapy of Breast Disease. 2nd ed. Ontario, Canada: BC Decker Inc.; 2004.
- Gong C, Song E, Jia W, et al. A double-blind randomized controlled trial of toremifen therapy for mastaglia. Arch Surg. 2006;141:43-47.
- Kumar S, Mansel RE, Scanlon MF, et al. Altered responses of prolactin, luteinizing hormone and follicle stimulating hormone secretion to thyrotrophin releasing hormone/gonadotrophin releasing hormone stimulation in cyclical mastalgia. Br J Surg. 1984;71:870-873.
- Mansel RE, Dogliotti L. European multicentre trial of bromocriptine in cyclical mastalgia. Lancet. 1990;335:190-193.
- Rose DP, Boyar AP, Cohen C, et al. Effect of a low-fat diet on hormone levels in women with cystic breast disease. I. Serum steroids and gonadotropins. J Natl Cancer Inst. 1987;78:623-626.
- Goodwin JP, Miller A, Del Giudice ME, et al. Elevated high-density lipoprotein cholesterol and dietary fat intake in women with cyclic mastopathy. Am J Obstet Gynecol. 1998;179:430-437.
- Goyal A, Mansel RE. Efamast Study Group. A randomized multicenter study of gamolenic acid (Efamast) with and without antioxidant vitamins and minerals in the management of mastalgia. Breast J. 2005;11(1):41-47.
- Parsay S, Olfati F, Nahidi S. Therapeutic effects of vitamin E on cyclic mastalgia. Breast J. 2009;15:510-514.
- Allen SS, Froberg DG. The effect of decreased caffeine consumption on benign proliferative breast disease: a randomized clinical trial. Surgery. 1987;101:720-730.
- Hadi MS. Sports brassiere: is it a solution for mastalgia? Breast J. 2000;6:407-409.
- Russell LC. Caffeine restriction as initial treatment for breast pain. Nurse Pract. 1989; 14(2): 36-7.
- Srivastava A, Mansel RE, Arvind N, et al. Evidence-based management of mastalgia: a meta-analysis of randomised trials. Breast. 2007;16:503-512.
- Irving AD, Morrison SL. Effectiveness of topical non-steroidal anti-inflammatory drugs in the management of breast pain. J R Coll Surg Edinb. 1998;43:158-159.
- Colak T, Ipek T, Kanik A, et al. Efficiency of topical nonsteroidal anti-inflammatory drugs in mastalgia treatment. J Am Coll Surg. 2003;196(4):525-530.
- Kaviani A, Mehrdad N, Najafi M, et al. Comparison of naproxen with placebo for the management of noncyclical breast pain: a randomized, double-blind, controlled trial. World J Surg. 2008;32:2464-2470.
- Fentiman IS, Caleffi M, Brame K, et al. Double-blind controlled trial of tamoxifen therapy for mastalgia. Lancet. 1986;1:287-288.
- Jain BK, Bansal A, Choudhary D, et al. Centchroman vs tamoxifen for regression of mastalgia: a randomized controlled trial. Intl J Surg. 2015;15:11-16.
- Mansel R, Goyal A, Le Nestour EL, et al; Afimoxifene (4-OHT) Breast Pain Research group. A phase II trial of Afimoxifene (4-hydroxyamoxifen gel) for cyclical mastalgia in premenopausal women. Breast Cancer Res Treat. 2007;106:389-397.
- O'Brien PM, Abukhalil IE. Randomized controlled trial of the management of premenstrual syndrome and premenstrual mastalgia using luteal phase-only danazol. Am J Obstet Gynecol. 1999;180:18-23.
- Blichert-Toft M, Andersen AN, Henriksen OB, et al. Treatment of mastalgia with bromocriptine: a double-blind cross-over study. Br Med J. 1979;1:237.

Interprofessional Academic Patient Aligned Care Team Panel Management Model
This article is part of a series that illustrates strategies intended to redesign primary care education at the Veterans Health Administration (VHA), using interprofessional workplace learning. All have been implemented in the VA Centers of Excellence in Primary Care Education (CoEPCE). These models embody visionary transformation of clinical and educational environments that have potential for replication and dissemination throughout VA and other primary care clinical educational environments. For an introduction to the series see Klink K. Transforming primary care clinical learning environments to optimize education, outcomes, and satisfaction. Fed Pract. 2018;35(9):8-10.
Background
In 2011, 5 US Department of Veterans Affairs (VA) medical centers were selected by the VA Office of Academic Affiliations (OAA) to establish Centers of Excellence in Primary Care Education (CoEPCE). Part of the New Models of Care initiative, the 5 CoEPCEs use VA primary care settings to develop and test innovative approaches to prepare physician residents, medical students, advanced practice registered nurses, undergraduate nursing students, and other health professions’ trainees, such as social workers, pharmacists, psychologists, and physician assistants, for improved primary care practice. The CoEPCEs are interprofessional Academic PACTs (iAPACTs) with ≥ 2 professions of trainees engaged in learning on the PACT team.

The VA Puget Sound Seattle CoEPCE curriculum is embedded in a well-established academic VA primary care training site.1 Trainees include doctor of nursing practice (DNP) students in adult, family, and psychiatric mental health nurse practitioner (NP) programs; NP residents; internal medicine physician residents; postgraduate pharmacy residents; and other health professions’ trainees. A Seattle CoEPCE priority is to provide DNP students, DNP residents, and physician residents with a longitudinal experience in team-based care as well as interprofessional education and collaborative practice (IPECP). Learners spend the majority of CoEPCE time in supervised, direct patient care, including primary care, women’s health, deployment health, homeless care, and home care. Formal IPECP activities comprise about 20% of time, supported by 3 educational strategies: (1) Panel management (PM)/quality improvement (QI); (2) Team building/ communications; and (3) Clinical content seminars to expand trainee clinical knowledge and skills and curriculum developed with the CoEPCE enterprise core domains in mind (Table).
Panel Management
Clinicians are increasingly being required to proactively optimize the health of an assigned population of patients in addition to assessing and managing the health of individual patients presenting for care. To address the objectives of increased accountability for population health outcomes and improved face-to-face care, Seattle CoEPCE developed curriculum for trainees to learn PM, a set of tools and processes that can be applied in the primary care setting.
PM clinical providers use data to proactively provide care to their patients between traditional clinic visits. The process is proactive in that gaps are identified whether or not an in-person visit occurs and involves an outreach mechanism to increase continuity of care, such as follow-up communications with the patients.2 PM also has been associated with improvements in chronic disease care.3-5
The Seattle CoEPCE developed an interprofessional team approach to PM that teaches trainees about the tools and resources used to close the gaps in care, including the use of clinical team members as health care systems subject matter experts. CoEPCE trainees are taught to analyze the care they provide to their panel of veterans (eg, identifying patients who have not refilled chronic medications or those who use the emergency department [ED] for nonacute conditions) and take action to improve care. PM yields rich discussions on systems resources and processes and is easily applied to a range of health conditions as well as delivery system issues. PM gives learners the tools they can use to close these gaps, such as the expertise of their peers, clinical team, and specialists.6
Planning and Implementation
In addition to completing a literature review to determine the state of PM practice and models, CoEPCE faculty polled recent graduates inquiring about strategies they did not learn prior to graduation. Based on their responses, CoEPCE faculty identified 2 skill deficits: management of chronic diseases and proficiency with data and statistics about performance improvement in panel patient care over time. Addressing these unmet needs became the impetus for developing curriculum for conducting PM. Planning and launching the CoEPCE approach to PM took about 3 months and involved CoEPCE faculty, a data manager, and administrative support. The learning objectives of Seattle’s PM initiative are to:
- Promote preventive health and chronic disease care by use performance data;
- Develop individual- and populationfocused action plans;
- Work collaboratively, strategically, and effectively with an interprofessional care team; and
- Learn how to effectively use system resources.
Curriculum
The PM curriculum is a longitudinal, experiential approach to learning how to manage chronic diseases between visits by using patient data. It is designed for trainees in a continuity clinic to review the care of their patients on a regular basis. Seattle CoEPCE medicine residents are assigned patient panels, which increase from 70 patients in the first year to about 140 patients by the end of the third year. DNP postgraduate trainees are assigned an initial panel of 50 patients that increases incrementally over the year-long residency.
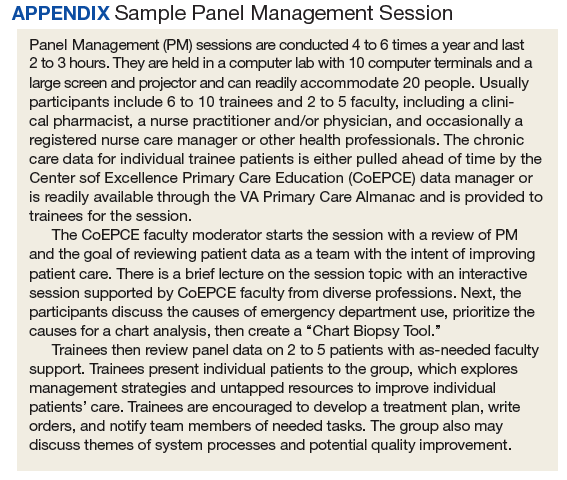
CoEPCE faculty determined the focus of PM sessions to be diabetes mellitus (DM), hypertension, obesity, chronic opioid therapy, and low-acuity ED use. Because PM sessions are designed to allow participants to identify systems issues that may affect multiple patients, some of these topics have expanded into QI projects. PM sessions run 2 to 3 hours per session and are held 4 to 6 times a year. Each session is repeated twice to accommodate diverse trainee schedules. PM participants must have their patient visit time blocked for each session (Appendix).
Faculty Roles and Development
PM faculty involved in any individual session may include a combination of a CoEPCE clinical pharmacy specialist, a registered nurse (RN) care manager, a social worker, a NP, a physician, a clinical psychologist, and a medicine outpatient chief resident (PGY4, termed clinician-teacher fellow at Seattle VA medical center). The chief resident is a medicine residency graduate and takes on teaching responsibilities depending on the topic of the session. The CoEPCE clinical pharmacist role varies depending on the session topic: They may facilitate the session or provide recommendations for medication management for individual cases. The RN care manager often knows the patients and brings a unique perspective that complements that of the primary care providers and ideally participates in every session. The patients of multiple RN care managers may be presented at each session, and it was not feasible to include all RN care managers in every session. After case discussions, trainees often communicated with the RN care managers about the case, using instant messaging, and CoEPCE provides other avenues for patient care discussion through huddles involving the provider, RN care manager, clinical pharmacist, and other clinical professions.
Resources
The primary resource required to support PM is an information technology (IT) system that provides relevant health outcome and health care utilization data on patients assigned to trainees. PM sessions include teaching trainees how to access patient data. Since discussion about the care of panel patients during the learning sessions often results in real-time adjustments in the care plan, modest administrative support required post-PM sessions, such as clerical scheduling of the requested clinic or telephone follow-up with the physician, nurse, or pharmacist.
Monitoring and Assessment
Panel performance is evaluated at each educational session. To assess the CoEPCE PM curriculum, participants provide feedback in 8 questions over 3 domains: trainee perception of curriculum content, confidence in performing PM involving completion of a PM workshop, and likelihood of using PM techniques in the future. CoEPCE faculty use the feedback to improve their instruction of panel management skill and develop new sessions that target additional population groups. Evaluation of the curriculum also includes monitoring of panel patients’ chronic disease measures.
Several partnerships have contributed to the success and integrations of PM into facility activities. First, having the primary care clinic director as a member of the Co- EPCE faculty has encouraged faculty and staff to operationalize and implement PM broadly by distributing data monthly to all clinic staff. Second, high facility staff interest outside the CoEPCE and primary care clinic has facilitated establishing communications outside the CoEPCE regarding clinic data.
Challenges and Solutions
Trainees at earlier academic levels often desire more instruction in clinical knowledge, such as treatment options for DM or goals of therapy in hypertension. In contrast, advanced trainees are able to review patient data, brainstorm, and optimize solutions. Seattle CoEPCE balances these different learning needs via a flexible approach to the 3-hour sessions. For example, advanced trainees progress from structured short lectures to informal sessions, which train them to perform PM on their own. In addition, the flexible design integrates trainees with diverse schedules, particularly among DNP students and residents, pharmacy residents, and physician residents. Some of this work falls on the RN care management team and administrative support staff.
Competing Priorities
The demand for direct patient care points to the importance of indirect patient care activities like PM to demonstrate improved results. Managing chronic conditions and matching appropriate services and resources should improve clinical outcomes and efficiency longterm. In the interim, it is important to note that PM demonstrates the continuous aspect of clinical care, particularly for trainees who have strict guidelines defining clinical care for the experiences to count toward eligibility for licensure. Additionally, PM results in trainees who are making decisions with VA patients and are more efficiently providing and supporting patient care. Therefore, it is critical to secure important resources, such as provider time for conducting PM.
Data Access
No single data system in VA covers the broad range of topics covered in the PM sessions, and not all trainees have their own assigned panels. For example, health professions students are not assigned a panel of patients. While they do not have access to panel data such as those generated by Primary Care Almanac in VSSC (a data source in the VA Support Service Center database),the Seattle CoEPCE data manager pulls a set of patient data from the students’ paired faculty preceptors’ panels for review. Thus they learn PM principles and strategies for improving patient care via PM as part of the unique VA longitudinal clinic experience and the opportunity to learn from a multidisciplinary team that is not available at other clinical sites. Postgraduate NP residents in CoEPCE training have their own panels of patients and thus the ability to directly access their panel performance data.
Success Factors
A key success factor includes CoEPCE faculty’s ability to develop and operationalize a panel management model that simultaneously aligns with the educational goals of an interprofessional education training program and supports VA adoption of the medical home or patient aligned care teams (PACT). The CoEPCE contributes staff expertise in accessing and reporting patient data, accessing appropriate teaching space, managing panels of patients with chronic diseases, and facilitating a team-based approach to care. Additionally, the CoEPCE brand is helpful for getting buy-in from the clinical and academic stakeholders necessary for moving PM forward.
Colocating CoEPCE trainees and faculty in the primary care clinic promotes team identity around the RN care managers and facilitated communications with non-CoEPCE clinical teams that have trainees from other professions. RN care managers serve as the locus of highquality PM since they share patient panels with the trainees and already track admissions, ED visits, and numerous chronic health care metrics. RN care managers offer a level of insight into chronic disease that other providers may not possess, such as the specific details on medication adherence and the impact of adverse effects (AEs) for that particular patient. RN care managers are able to teach about their team role and responsibilities, strengthening the model.
PM is an opportunity to expand CoEPCE interprofessional education capacity by creating colocation of different trainee and faculty professions during the PM sessions; the sharing of data with trainees; and sharing and reflecting on data, strengthening communications between professions and within the PACT. The Seattle CoEPCE now has systems in place that allow the RN care manager to send notes to a physician and DNP resident, and the resident is expected to respond. In addition, the PM approach provides experience with analyzing data to improve care in an interprofessional team setting, which is a requirement of the Accreditation Council for Graduate Medical Education.
Interprofessional Collaboration
PM sessions are intentionally designed to improve communication among team members and foster a team approach to care. PM sessions provide an opportunity for trainees and clinician faculty to be together and learn about each profession’s perspectives. For example, early in the process physician and DNP trainees learn about the importance of clinical pharmacists to the team who prescribe and make medication adjustments within their scope of practice as well as the importance of making appropriate pharmacy referrals. Additionally, the RN care manager and clinical pharmacy specialists who serve as faculty in the CoEPCE provide pertinent information on individual patients, increasing integration with the PACT. Finally, there is anecdotal evidence that faculty also are learning more about interprofessional education and expanding their own skills.
Clinical Performance
CoEPCE trainees, non-CoEPCE physician residents, and CoEPCE faculty participants regularly receive patient data with which they can proactively develop or amend a treatment plan between visits. PM has resulted in improved data sharing with providers. Instead of once a year, providers and clinic staff now receive patient data monthly on chronic conditions from the clinic director. Trainees on ambulatory rotations are expected to review their panel data at least a half day per week. CoEPCE staff evaluate trainee likelihood to use PM and ability to identify patients who benefit from team-based care.
At the population level of chronic disease management, preliminary evidence demonstrates that primary care clinic patient panels are increasingly within target for DM and blood pressure measures, as assessed by periodic clinical reports to providers. Some of the PM topics have resulted in systems-level improvements, such as reducing unnecessary ED use for nonacute conditions and better opioid prescription monitoring. Moreover, PM supports everyone working at the top of his/her professional capability. For example, the RN care manager has the impetus to initiate DM education with a particular patient.
Since CoEPCE began teaching PM, the Seattle primary care clinic has committed to the regular access and review of data. This has encouraged the alignment of standards of care for chronic disease management so that all care providers are working toward the same benchmark goals.
Patient Outcomes
At the individual level, PM provide a mechanism to systemically review trainee panel patients with out-of-target clinical measures, and develop new care approaches involving interprofessional strategies and problem solving. PM also helps identify patients who have missed follow-up, reducing the risk that patients with chronic care needs will be lost to clinical engagement if they are not reminded or do not pursue appointments. The PM-trained PACT reaches out to patients who might not otherwise get care before the next clinic visit and provides new care plans. Second, patients have the benefit of a team that manages their health needs. For example, including the clinical pharmacists in the PM sessions ensures timely identification of medication interactions and the potential AEs. Additionally, PM contributes to the care coordination model by involving individuals on the primary care team who know the patient. These members review the patient’s data between visits and initiate team-based changes to the care plan to improve care. More team members connect with a patient, resulting in more intense care and quicker follow-up to determine the effectiveness of a treatment plan.
PM topics have spun off QI projects resulting in new clinic processes and programs, including processes for managing wounds in primary care and to assure timely post-ED visit follow-ups. Areas for expansion include a follow-up QI project to reduce nonacute ED visits by patients on the homeless PACT panel and interventions for better management of care for women veterans with mental health needs. PM also has extended to non-Co- EPCE teams and to other clinic activities, such as strengthening huddles of team members specifically related to panel data and addressing selected patient cases between visits. Pharmacy residents and faculty are more involved in reviewing the panel before patients are seen to review medication lists and identify duplications.
The Future
Under stage 2 of the program, the Seattle CoEPCE intends to lead in the creation of a PM toolkit as well as a data access guide that will allow VA facilities with limited data management expertise to access chronic disease metrics. Second, the CoEPCE will continue its dissemination efforts locally to other residents in the internal medicine residency program in all of its continuity clinics. Additionally, there is high interest by DNP training programs to expand and export longitudinal training experience PM curriculum to non-VA based students.
1. Kaminetzky CP, Beste LA, Poppe AP, et al. Implementation of a novel panel management curriculum. BMC Med Educ. 2017;17(1):264-269.
2. Neuwirth EB, Schmittdiel JA, Tallman K, Bellows J. Understanding panel management: a comparative study of an emerging approach to population care. Perm J. 2007;11(3):12-20.
3. Loo TS, Davis RB, Lipsitz LA, et al. Electronic medical record reminders and panel management to improve primary care of elderly patients. Arch Intern Med. 2011;171(17):1552-1558.
4. Kanter M, Martinez O, Lindsay G, Andrews K, Denver C. Proactive office encounter: a systematic approach to preventive and chronic care at every patient encounter. Perm J. 2010;14(3):38-43.
5. Kravetz JD, Walsh RF. Team-based hypertension management to improve blood pressure control. J Prim Care Community Health. 2016;7(4):272-275.
6. Kaminetzky CP, Nelson KM. In the office and in-between: the role of panel management in primary care. J Gen Intern Med. 2015;30(7):876-877.
This article is part of a series that illustrates strategies intended to redesign primary care education at the Veterans Health Administration (VHA), using interprofessional workplace learning. All have been implemented in the VA Centers of Excellence in Primary Care Education (CoEPCE). These models embody visionary transformation of clinical and educational environments that have potential for replication and dissemination throughout VA and other primary care clinical educational environments. For an introduction to the series see Klink K. Transforming primary care clinical learning environments to optimize education, outcomes, and satisfaction. Fed Pract. 2018;35(9):8-10.
Background
In 2011, 5 US Department of Veterans Affairs (VA) medical centers were selected by the VA Office of Academic Affiliations (OAA) to establish Centers of Excellence in Primary Care Education (CoEPCE). Part of the New Models of Care initiative, the 5 CoEPCEs use VA primary care settings to develop and test innovative approaches to prepare physician residents, medical students, advanced practice registered nurses, undergraduate nursing students, and other health professions’ trainees, such as social workers, pharmacists, psychologists, and physician assistants, for improved primary care practice. The CoEPCEs are interprofessional Academic PACTs (iAPACTs) with ≥ 2 professions of trainees engaged in learning on the PACT team.
The VA Puget Sound Seattle CoEPCE curriculum is embedded in a well-established academic VA primary care training site.1 Trainees include doctor of nursing practice (DNP) students in adult, family, and psychiatric mental health nurse practitioner (NP) programs; NP residents; internal medicine physician residents; postgraduate pharmacy residents; and other health professions’ trainees. A Seattle CoEPCE priority is to provide DNP students, DNP residents, and physician residents with a longitudinal experience in team-based care as well as interprofessional education and collaborative practice (IPECP). Learners spend the majority of CoEPCE time in supervised, direct patient care, including primary care, women’s health, deployment health, homeless care, and home care. Formal IPECP activities comprise about 20% of time, supported by 3 educational strategies: (1) Panel management (PM)/quality improvement (QI); (2) Team building/ communications; and (3) Clinical content seminars to expand trainee clinical knowledge and skills and curriculum developed with the CoEPCE enterprise core domains in mind (Table).
Panel Management
Clinicians are increasingly being required to proactively optimize the health of an assigned population of patients in addition to assessing and managing the health of individual patients presenting for care. To address the objectives of increased accountability for population health outcomes and improved face-to-face care, Seattle CoEPCE developed curriculum for trainees to learn PM, a set of tools and processes that can be applied in the primary care setting.
PM clinical providers use data to proactively provide care to their patients between traditional clinic visits. The process is proactive in that gaps are identified whether or not an in-person visit occurs and involves an outreach mechanism to increase continuity of care, such as follow-up communications with the patients.2 PM also has been associated with improvements in chronic disease care.3-5
The Seattle CoEPCE developed an interprofessional team approach to PM that teaches trainees about the tools and resources used to close the gaps in care, including the use of clinical team members as health care systems subject matter experts. CoEPCE trainees are taught to analyze the care they provide to their panel of veterans (eg, identifying patients who have not refilled chronic medications or those who use the emergency department [ED] for nonacute conditions) and take action to improve care. PM yields rich discussions on systems resources and processes and is easily applied to a range of health conditions as well as delivery system issues. PM gives learners the tools they can use to close these gaps, such as the expertise of their peers, clinical team, and specialists.6
Planning and Implementation
In addition to completing a literature review to determine the state of PM practice and models, CoEPCE faculty polled recent graduates inquiring about strategies they did not learn prior to graduation. Based on their responses, CoEPCE faculty identified 2 skill deficits: management of chronic diseases and proficiency with data and statistics about performance improvement in panel patient care over time. Addressing these unmet needs became the impetus for developing curriculum for conducting PM. Planning and launching the CoEPCE approach to PM took about 3 months and involved CoEPCE faculty, a data manager, and administrative support. The learning objectives of Seattle’s PM initiative are to:
- Promote preventive health and chronic disease care by use performance data;
- Develop individual- and populationfocused action plans;
- Work collaboratively, strategically, and effectively with an interprofessional care team; and
- Learn how to effectively use system resources.
Curriculum
The PM curriculum is a longitudinal, experiential approach to learning how to manage chronic diseases between visits by using patient data. It is designed for trainees in a continuity clinic to review the care of their patients on a regular basis. Seattle CoEPCE medicine residents are assigned patient panels, which increase from 70 patients in the first year to about 140 patients by the end of the third year. DNP postgraduate trainees are assigned an initial panel of 50 patients that increases incrementally over the year-long residency.
CoEPCE faculty determined the focus of PM sessions to be diabetes mellitus (DM), hypertension, obesity, chronic opioid therapy, and low-acuity ED use. Because PM sessions are designed to allow participants to identify systems issues that may affect multiple patients, some of these topics have expanded into QI projects. PM sessions run 2 to 3 hours per session and are held 4 to 6 times a year. Each session is repeated twice to accommodate diverse trainee schedules. PM participants must have their patient visit time blocked for each session (Appendix).
Faculty Roles and Development
PM faculty involved in any individual session may include a combination of a CoEPCE clinical pharmacy specialist, a registered nurse (RN) care manager, a social worker, a NP, a physician, a clinical psychologist, and a medicine outpatient chief resident (PGY4, termed clinician-teacher fellow at Seattle VA medical center). The chief resident is a medicine residency graduate and takes on teaching responsibilities depending on the topic of the session. The CoEPCE clinical pharmacist role varies depending on the session topic: They may facilitate the session or provide recommendations for medication management for individual cases. The RN care manager often knows the patients and brings a unique perspective that complements that of the primary care providers and ideally participates in every session. The patients of multiple RN care managers may be presented at each session, and it was not feasible to include all RN care managers in every session. After case discussions, trainees often communicated with the RN care managers about the case, using instant messaging, and CoEPCE provides other avenues for patient care discussion through huddles involving the provider, RN care manager, clinical pharmacist, and other clinical professions.
Resources
The primary resource required to support PM is an information technology (IT) system that provides relevant health outcome and health care utilization data on patients assigned to trainees. PM sessions include teaching trainees how to access patient data. Since discussion about the care of panel patients during the learning sessions often results in real-time adjustments in the care plan, modest administrative support required post-PM sessions, such as clerical scheduling of the requested clinic or telephone follow-up with the physician, nurse, or pharmacist.
Monitoring and Assessment
Panel performance is evaluated at each educational session. To assess the CoEPCE PM curriculum, participants provide feedback in 8 questions over 3 domains: trainee perception of curriculum content, confidence in performing PM involving completion of a PM workshop, and likelihood of using PM techniques in the future. CoEPCE faculty use the feedback to improve their instruction of panel management skill and develop new sessions that target additional population groups. Evaluation of the curriculum also includes monitoring of panel patients’ chronic disease measures.
Several partnerships have contributed to the success and integrations of PM into facility activities. First, having the primary care clinic director as a member of the Co- EPCE faculty has encouraged faculty and staff to operationalize and implement PM broadly by distributing data monthly to all clinic staff. Second, high facility staff interest outside the CoEPCE and primary care clinic has facilitated establishing communications outside the CoEPCE regarding clinic data.
Challenges and Solutions
Trainees at earlier academic levels often desire more instruction in clinical knowledge, such as treatment options for DM or goals of therapy in hypertension. In contrast, advanced trainees are able to review patient data, brainstorm, and optimize solutions. Seattle CoEPCE balances these different learning needs via a flexible approach to the 3-hour sessions. For example, advanced trainees progress from structured short lectures to informal sessions, which train them to perform PM on their own. In addition, the flexible design integrates trainees with diverse schedules, particularly among DNP students and residents, pharmacy residents, and physician residents. Some of this work falls on the RN care management team and administrative support staff.
Competing Priorities
The demand for direct patient care points to the importance of indirect patient care activities like PM to demonstrate improved results. Managing chronic conditions and matching appropriate services and resources should improve clinical outcomes and efficiency longterm. In the interim, it is important to note that PM demonstrates the continuous aspect of clinical care, particularly for trainees who have strict guidelines defining clinical care for the experiences to count toward eligibility for licensure. Additionally, PM results in trainees who are making decisions with VA patients and are more efficiently providing and supporting patient care. Therefore, it is critical to secure important resources, such as provider time for conducting PM.
Data Access
No single data system in VA covers the broad range of topics covered in the PM sessions, and not all trainees have their own assigned panels. For example, health professions students are not assigned a panel of patients. While they do not have access to panel data such as those generated by Primary Care Almanac in VSSC (a data source in the VA Support Service Center database),the Seattle CoEPCE data manager pulls a set of patient data from the students’ paired faculty preceptors’ panels for review. Thus they learn PM principles and strategies for improving patient care via PM as part of the unique VA longitudinal clinic experience and the opportunity to learn from a multidisciplinary team that is not available at other clinical sites. Postgraduate NP residents in CoEPCE training have their own panels of patients and thus the ability to directly access their panel performance data.
Success Factors
A key success factor includes CoEPCE faculty’s ability to develop and operationalize a panel management model that simultaneously aligns with the educational goals of an interprofessional education training program and supports VA adoption of the medical home or patient aligned care teams (PACT). The CoEPCE contributes staff expertise in accessing and reporting patient data, accessing appropriate teaching space, managing panels of patients with chronic diseases, and facilitating a team-based approach to care. Additionally, the CoEPCE brand is helpful for getting buy-in from the clinical and academic stakeholders necessary for moving PM forward.
Colocating CoEPCE trainees and faculty in the primary care clinic promotes team identity around the RN care managers and facilitated communications with non-CoEPCE clinical teams that have trainees from other professions. RN care managers serve as the locus of highquality PM since they share patient panels with the trainees and already track admissions, ED visits, and numerous chronic health care metrics. RN care managers offer a level of insight into chronic disease that other providers may not possess, such as the specific details on medication adherence and the impact of adverse effects (AEs) for that particular patient. RN care managers are able to teach about their team role and responsibilities, strengthening the model.
PM is an opportunity to expand CoEPCE interprofessional education capacity by creating colocation of different trainee and faculty professions during the PM sessions; the sharing of data with trainees; and sharing and reflecting on data, strengthening communications between professions and within the PACT. The Seattle CoEPCE now has systems in place that allow the RN care manager to send notes to a physician and DNP resident, and the resident is expected to respond. In addition, the PM approach provides experience with analyzing data to improve care in an interprofessional team setting, which is a requirement of the Accreditation Council for Graduate Medical Education.
Interprofessional Collaboration
PM sessions are intentionally designed to improve communication among team members and foster a team approach to care. PM sessions provide an opportunity for trainees and clinician faculty to be together and learn about each profession’s perspectives. For example, early in the process physician and DNP trainees learn about the importance of clinical pharmacists to the team who prescribe and make medication adjustments within their scope of practice as well as the importance of making appropriate pharmacy referrals. Additionally, the RN care manager and clinical pharmacy specialists who serve as faculty in the CoEPCE provide pertinent information on individual patients, increasing integration with the PACT. Finally, there is anecdotal evidence that faculty also are learning more about interprofessional education and expanding their own skills.
Clinical Performance
CoEPCE trainees, non-CoEPCE physician residents, and CoEPCE faculty participants regularly receive patient data with which they can proactively develop or amend a treatment plan between visits. PM has resulted in improved data sharing with providers. Instead of once a year, providers and clinic staff now receive patient data monthly on chronic conditions from the clinic director. Trainees on ambulatory rotations are expected to review their panel data at least a half day per week. CoEPCE staff evaluate trainee likelihood to use PM and ability to identify patients who benefit from team-based care.
At the population level of chronic disease management, preliminary evidence demonstrates that primary care clinic patient panels are increasingly within target for DM and blood pressure measures, as assessed by periodic clinical reports to providers. Some of the PM topics have resulted in systems-level improvements, such as reducing unnecessary ED use for nonacute conditions and better opioid prescription monitoring. Moreover, PM supports everyone working at the top of his/her professional capability. For example, the RN care manager has the impetus to initiate DM education with a particular patient.
Since CoEPCE began teaching PM, the Seattle primary care clinic has committed to the regular access and review of data. This has encouraged the alignment of standards of care for chronic disease management so that all care providers are working toward the same benchmark goals.
Patient Outcomes
At the individual level, PM provide a mechanism to systemically review trainee panel patients with out-of-target clinical measures, and develop new care approaches involving interprofessional strategies and problem solving. PM also helps identify patients who have missed follow-up, reducing the risk that patients with chronic care needs will be lost to clinical engagement if they are not reminded or do not pursue appointments. The PM-trained PACT reaches out to patients who might not otherwise get care before the next clinic visit and provides new care plans. Second, patients have the benefit of a team that manages their health needs. For example, including the clinical pharmacists in the PM sessions ensures timely identification of medication interactions and the potential AEs. Additionally, PM contributes to the care coordination model by involving individuals on the primary care team who know the patient. These members review the patient’s data between visits and initiate team-based changes to the care plan to improve care. More team members connect with a patient, resulting in more intense care and quicker follow-up to determine the effectiveness of a treatment plan.
PM topics have spun off QI projects resulting in new clinic processes and programs, including processes for managing wounds in primary care and to assure timely post-ED visit follow-ups. Areas for expansion include a follow-up QI project to reduce nonacute ED visits by patients on the homeless PACT panel and interventions for better management of care for women veterans with mental health needs. PM also has extended to non-Co- EPCE teams and to other clinic activities, such as strengthening huddles of team members specifically related to panel data and addressing selected patient cases between visits. Pharmacy residents and faculty are more involved in reviewing the panel before patients are seen to review medication lists and identify duplications.
The Future
Under stage 2 of the program, the Seattle CoEPCE intends to lead in the creation of a PM toolkit as well as a data access guide that will allow VA facilities with limited data management expertise to access chronic disease metrics. Second, the CoEPCE will continue its dissemination efforts locally to other residents in the internal medicine residency program in all of its continuity clinics. Additionally, there is high interest by DNP training programs to expand and export longitudinal training experience PM curriculum to non-VA based students.
This article is part of a series that illustrates strategies intended to redesign primary care education at the Veterans Health Administration (VHA), using interprofessional workplace learning. All have been implemented in the VA Centers of Excellence in Primary Care Education (CoEPCE). These models embody visionary transformation of clinical and educational environments that have potential for replication and dissemination throughout VA and other primary care clinical educational environments. For an introduction to the series see Klink K. Transforming primary care clinical learning environments to optimize education, outcomes, and satisfaction. Fed Pract. 2018;35(9):8-10.
Background
In 2011, 5 US Department of Veterans Affairs (VA) medical centers were selected by the VA Office of Academic Affiliations (OAA) to establish Centers of Excellence in Primary Care Education (CoEPCE). Part of the New Models of Care initiative, the 5 CoEPCEs use VA primary care settings to develop and test innovative approaches to prepare physician residents, medical students, advanced practice registered nurses, undergraduate nursing students, and other health professions’ trainees, such as social workers, pharmacists, psychologists, and physician assistants, for improved primary care practice. The CoEPCEs are interprofessional Academic PACTs (iAPACTs) with ≥ 2 professions of trainees engaged in learning on the PACT team.
The VA Puget Sound Seattle CoEPCE curriculum is embedded in a well-established academic VA primary care training site.1 Trainees include doctor of nursing practice (DNP) students in adult, family, and psychiatric mental health nurse practitioner (NP) programs; NP residents; internal medicine physician residents; postgraduate pharmacy residents; and other health professions’ trainees. A Seattle CoEPCE priority is to provide DNP students, DNP residents, and physician residents with a longitudinal experience in team-based care as well as interprofessional education and collaborative practice (IPECP). Learners spend the majority of CoEPCE time in supervised, direct patient care, including primary care, women’s health, deployment health, homeless care, and home care. Formal IPECP activities comprise about 20% of time, supported by 3 educational strategies: (1) Panel management (PM)/quality improvement (QI); (2) Team building/ communications; and (3) Clinical content seminars to expand trainee clinical knowledge and skills and curriculum developed with the CoEPCE enterprise core domains in mind (Table).
Panel Management
Clinicians are increasingly being required to proactively optimize the health of an assigned population of patients in addition to assessing and managing the health of individual patients presenting for care. To address the objectives of increased accountability for population health outcomes and improved face-to-face care, Seattle CoEPCE developed curriculum for trainees to learn PM, a set of tools and processes that can be applied in the primary care setting.
PM clinical providers use data to proactively provide care to their patients between traditional clinic visits. The process is proactive in that gaps are identified whether or not an in-person visit occurs and involves an outreach mechanism to increase continuity of care, such as follow-up communications with the patients.2 PM also has been associated with improvements in chronic disease care.3-5
The Seattle CoEPCE developed an interprofessional team approach to PM that teaches trainees about the tools and resources used to close the gaps in care, including the use of clinical team members as health care systems subject matter experts. CoEPCE trainees are taught to analyze the care they provide to their panel of veterans (eg, identifying patients who have not refilled chronic medications or those who use the emergency department [ED] for nonacute conditions) and take action to improve care. PM yields rich discussions on systems resources and processes and is easily applied to a range of health conditions as well as delivery system issues. PM gives learners the tools they can use to close these gaps, such as the expertise of their peers, clinical team, and specialists.6
Planning and Implementation
In addition to completing a literature review to determine the state of PM practice and models, CoEPCE faculty polled recent graduates inquiring about strategies they did not learn prior to graduation. Based on their responses, CoEPCE faculty identified 2 skill deficits: management of chronic diseases and proficiency with data and statistics about performance improvement in panel patient care over time. Addressing these unmet needs became the impetus for developing curriculum for conducting PM. Planning and launching the CoEPCE approach to PM took about 3 months and involved CoEPCE faculty, a data manager, and administrative support. The learning objectives of Seattle’s PM initiative are to:
- Promote preventive health and chronic disease care by use performance data;
- Develop individual- and populationfocused action plans;
- Work collaboratively, strategically, and effectively with an interprofessional care team; and
- Learn how to effectively use system resources.
Curriculum
The PM curriculum is a longitudinal, experiential approach to learning how to manage chronic diseases between visits by using patient data. It is designed for trainees in a continuity clinic to review the care of their patients on a regular basis. Seattle CoEPCE medicine residents are assigned patient panels, which increase from 70 patients in the first year to about 140 patients by the end of the third year. DNP postgraduate trainees are assigned an initial panel of 50 patients that increases incrementally over the year-long residency.
CoEPCE faculty determined the focus of PM sessions to be diabetes mellitus (DM), hypertension, obesity, chronic opioid therapy, and low-acuity ED use. Because PM sessions are designed to allow participants to identify systems issues that may affect multiple patients, some of these topics have expanded into QI projects. PM sessions run 2 to 3 hours per session and are held 4 to 6 times a year. Each session is repeated twice to accommodate diverse trainee schedules. PM participants must have their patient visit time blocked for each session (Appendix).
Faculty Roles and Development
PM faculty involved in any individual session may include a combination of a CoEPCE clinical pharmacy specialist, a registered nurse (RN) care manager, a social worker, a NP, a physician, a clinical psychologist, and a medicine outpatient chief resident (PGY4, termed clinician-teacher fellow at Seattle VA medical center). The chief resident is a medicine residency graduate and takes on teaching responsibilities depending on the topic of the session. The CoEPCE clinical pharmacist role varies depending on the session topic: They may facilitate the session or provide recommendations for medication management for individual cases. The RN care manager often knows the patients and brings a unique perspective that complements that of the primary care providers and ideally participates in every session. The patients of multiple RN care managers may be presented at each session, and it was not feasible to include all RN care managers in every session. After case discussions, trainees often communicated with the RN care managers about the case, using instant messaging, and CoEPCE provides other avenues for patient care discussion through huddles involving the provider, RN care manager, clinical pharmacist, and other clinical professions.
Resources
The primary resource required to support PM is an information technology (IT) system that provides relevant health outcome and health care utilization data on patients assigned to trainees. PM sessions include teaching trainees how to access patient data. Since discussion about the care of panel patients during the learning sessions often results in real-time adjustments in the care plan, modest administrative support required post-PM sessions, such as clerical scheduling of the requested clinic or telephone follow-up with the physician, nurse, or pharmacist.
Monitoring and Assessment
Panel performance is evaluated at each educational session. To assess the CoEPCE PM curriculum, participants provide feedback in 8 questions over 3 domains: trainee perception of curriculum content, confidence in performing PM involving completion of a PM workshop, and likelihood of using PM techniques in the future. CoEPCE faculty use the feedback to improve their instruction of panel management skill and develop new sessions that target additional population groups. Evaluation of the curriculum also includes monitoring of panel patients’ chronic disease measures.
Several partnerships have contributed to the success and integrations of PM into facility activities. First, having the primary care clinic director as a member of the Co- EPCE faculty has encouraged faculty and staff to operationalize and implement PM broadly by distributing data monthly to all clinic staff. Second, high facility staff interest outside the CoEPCE and primary care clinic has facilitated establishing communications outside the CoEPCE regarding clinic data.
Challenges and Solutions
Trainees at earlier academic levels often desire more instruction in clinical knowledge, such as treatment options for DM or goals of therapy in hypertension. In contrast, advanced trainees are able to review patient data, brainstorm, and optimize solutions. Seattle CoEPCE balances these different learning needs via a flexible approach to the 3-hour sessions. For example, advanced trainees progress from structured short lectures to informal sessions, which train them to perform PM on their own. In addition, the flexible design integrates trainees with diverse schedules, particularly among DNP students and residents, pharmacy residents, and physician residents. Some of this work falls on the RN care management team and administrative support staff.
Competing Priorities
The demand for direct patient care points to the importance of indirect patient care activities like PM to demonstrate improved results. Managing chronic conditions and matching appropriate services and resources should improve clinical outcomes and efficiency longterm. In the interim, it is important to note that PM demonstrates the continuous aspect of clinical care, particularly for trainees who have strict guidelines defining clinical care for the experiences to count toward eligibility for licensure. Additionally, PM results in trainees who are making decisions with VA patients and are more efficiently providing and supporting patient care. Therefore, it is critical to secure important resources, such as provider time for conducting PM.
Data Access
No single data system in VA covers the broad range of topics covered in the PM sessions, and not all trainees have their own assigned panels. For example, health professions students are not assigned a panel of patients. While they do not have access to panel data such as those generated by Primary Care Almanac in VSSC (a data source in the VA Support Service Center database),the Seattle CoEPCE data manager pulls a set of patient data from the students’ paired faculty preceptors’ panels for review. Thus they learn PM principles and strategies for improving patient care via PM as part of the unique VA longitudinal clinic experience and the opportunity to learn from a multidisciplinary team that is not available at other clinical sites. Postgraduate NP residents in CoEPCE training have their own panels of patients and thus the ability to directly access their panel performance data.
Success Factors
A key success factor includes CoEPCE faculty’s ability to develop and operationalize a panel management model that simultaneously aligns with the educational goals of an interprofessional education training program and supports VA adoption of the medical home or patient aligned care teams (PACT). The CoEPCE contributes staff expertise in accessing and reporting patient data, accessing appropriate teaching space, managing panels of patients with chronic diseases, and facilitating a team-based approach to care. Additionally, the CoEPCE brand is helpful for getting buy-in from the clinical and academic stakeholders necessary for moving PM forward.
Colocating CoEPCE trainees and faculty in the primary care clinic promotes team identity around the RN care managers and facilitated communications with non-CoEPCE clinical teams that have trainees from other professions. RN care managers serve as the locus of highquality PM since they share patient panels with the trainees and already track admissions, ED visits, and numerous chronic health care metrics. RN care managers offer a level of insight into chronic disease that other providers may not possess, such as the specific details on medication adherence and the impact of adverse effects (AEs) for that particular patient. RN care managers are able to teach about their team role and responsibilities, strengthening the model.
PM is an opportunity to expand CoEPCE interprofessional education capacity by creating colocation of different trainee and faculty professions during the PM sessions; the sharing of data with trainees; and sharing and reflecting on data, strengthening communications between professions and within the PACT. The Seattle CoEPCE now has systems in place that allow the RN care manager to send notes to a physician and DNP resident, and the resident is expected to respond. In addition, the PM approach provides experience with analyzing data to improve care in an interprofessional team setting, which is a requirement of the Accreditation Council for Graduate Medical Education.
Interprofessional Collaboration
PM sessions are intentionally designed to improve communication among team members and foster a team approach to care. PM sessions provide an opportunity for trainees and clinician faculty to be together and learn about each profession’s perspectives. For example, early in the process physician and DNP trainees learn about the importance of clinical pharmacists to the team who prescribe and make medication adjustments within their scope of practice as well as the importance of making appropriate pharmacy referrals. Additionally, the RN care manager and clinical pharmacy specialists who serve as faculty in the CoEPCE provide pertinent information on individual patients, increasing integration with the PACT. Finally, there is anecdotal evidence that faculty also are learning more about interprofessional education and expanding their own skills.
Clinical Performance
CoEPCE trainees, non-CoEPCE physician residents, and CoEPCE faculty participants regularly receive patient data with which they can proactively develop or amend a treatment plan between visits. PM has resulted in improved data sharing with providers. Instead of once a year, providers and clinic staff now receive patient data monthly on chronic conditions from the clinic director. Trainees on ambulatory rotations are expected to review their panel data at least a half day per week. CoEPCE staff evaluate trainee likelihood to use PM and ability to identify patients who benefit from team-based care.
At the population level of chronic disease management, preliminary evidence demonstrates that primary care clinic patient panels are increasingly within target for DM and blood pressure measures, as assessed by periodic clinical reports to providers. Some of the PM topics have resulted in systems-level improvements, such as reducing unnecessary ED use for nonacute conditions and better opioid prescription monitoring. Moreover, PM supports everyone working at the top of his/her professional capability. For example, the RN care manager has the impetus to initiate DM education with a particular patient.
Since CoEPCE began teaching PM, the Seattle primary care clinic has committed to the regular access and review of data. This has encouraged the alignment of standards of care for chronic disease management so that all care providers are working toward the same benchmark goals.
Patient Outcomes
At the individual level, PM provide a mechanism to systemically review trainee panel patients with out-of-target clinical measures, and develop new care approaches involving interprofessional strategies and problem solving. PM also helps identify patients who have missed follow-up, reducing the risk that patients with chronic care needs will be lost to clinical engagement if they are not reminded or do not pursue appointments. The PM-trained PACT reaches out to patients who might not otherwise get care before the next clinic visit and provides new care plans. Second, patients have the benefit of a team that manages their health needs. For example, including the clinical pharmacists in the PM sessions ensures timely identification of medication interactions and the potential AEs. Additionally, PM contributes to the care coordination model by involving individuals on the primary care team who know the patient. These members review the patient’s data between visits and initiate team-based changes to the care plan to improve care. More team members connect with a patient, resulting in more intense care and quicker follow-up to determine the effectiveness of a treatment plan.
PM topics have spun off QI projects resulting in new clinic processes and programs, including processes for managing wounds in primary care and to assure timely post-ED visit follow-ups. Areas for expansion include a follow-up QI project to reduce nonacute ED visits by patients on the homeless PACT panel and interventions for better management of care for women veterans with mental health needs. PM also has extended to non-Co- EPCE teams and to other clinic activities, such as strengthening huddles of team members specifically related to panel data and addressing selected patient cases between visits. Pharmacy residents and faculty are more involved in reviewing the panel before patients are seen to review medication lists and identify duplications.
The Future
Under stage 2 of the program, the Seattle CoEPCE intends to lead in the creation of a PM toolkit as well as a data access guide that will allow VA facilities with limited data management expertise to access chronic disease metrics. Second, the CoEPCE will continue its dissemination efforts locally to other residents in the internal medicine residency program in all of its continuity clinics. Additionally, there is high interest by DNP training programs to expand and export longitudinal training experience PM curriculum to non-VA based students.
1. Kaminetzky CP, Beste LA, Poppe AP, et al. Implementation of a novel panel management curriculum. BMC Med Educ. 2017;17(1):264-269.
2. Neuwirth EB, Schmittdiel JA, Tallman K, Bellows J. Understanding panel management: a comparative study of an emerging approach to population care. Perm J. 2007;11(3):12-20.
3. Loo TS, Davis RB, Lipsitz LA, et al. Electronic medical record reminders and panel management to improve primary care of elderly patients. Arch Intern Med. 2011;171(17):1552-1558.
4. Kanter M, Martinez O, Lindsay G, Andrews K, Denver C. Proactive office encounter: a systematic approach to preventive and chronic care at every patient encounter. Perm J. 2010;14(3):38-43.
5. Kravetz JD, Walsh RF. Team-based hypertension management to improve blood pressure control. J Prim Care Community Health. 2016;7(4):272-275.
6. Kaminetzky CP, Nelson KM. In the office and in-between: the role of panel management in primary care. J Gen Intern Med. 2015;30(7):876-877.
1. Kaminetzky CP, Beste LA, Poppe AP, et al. Implementation of a novel panel management curriculum. BMC Med Educ. 2017;17(1):264-269.
2. Neuwirth EB, Schmittdiel JA, Tallman K, Bellows J. Understanding panel management: a comparative study of an emerging approach to population care. Perm J. 2007;11(3):12-20.
3. Loo TS, Davis RB, Lipsitz LA, et al. Electronic medical record reminders and panel management to improve primary care of elderly patients. Arch Intern Med. 2011;171(17):1552-1558.
4. Kanter M, Martinez O, Lindsay G, Andrews K, Denver C. Proactive office encounter: a systematic approach to preventive and chronic care at every patient encounter. Perm J. 2010;14(3):38-43.
5. Kravetz JD, Walsh RF. Team-based hypertension management to improve blood pressure control. J Prim Care Community Health. 2016;7(4):272-275.
6. Kaminetzky CP, Nelson KM. In the office and in-between: the role of panel management in primary care. J Gen Intern Med. 2015;30(7):876-877.
Some “slime”-related contact dermatitis is allergic
The viscous homemade children’s plaything known as “slime” has been associated with allergic, as well as irritant, contact dermatitis of the hands thanks to an array of possible compounds with which it can be made, according to a case report in Pediatric Dermatology. The report details many possible compounds causing the dermatitis reactions seen by health care professionals.

In the case, which was reported by L. Elizabeth Anderson, MD, of the Children’s Hospital of Philadelphia and colleagues, an 11-year-old girl with a history of atopic dermatitis presented with hand dermatitis that was suspected to be related to playing with slime. After her dermatitis failed to respond to strong topical steroids, she was referred for patch testing, with positivity for methylchloroisothiazolinone/methylisothiazolinone (MCI/MI). After all contact with any products containing MCI/MI was eliminated, her hand dermatitis cleared, and bodywide atopic dermatitis improved some as well.
MCI/MI and MI are among the most commonly suspected culprits in cases of slime-related contact dermatitis. Although most cases are irritant contact dermatitis, some are allergic and can be detected using patch tests. MCI/MI is included in the T.R.U.E. Test, but according to the case report, 37% of patients with allergy to MI alone will not have positive response with the T.R.U.E. Test because of the low concentrations of MI in that test. The authors of this case report also listed many other the potential allergens in popular slime recipes; however, many are not included in the T.R.U.E. Test.
“While the T.R.U.E. Test does not capture most of the potential allergens in popular slime recipes, the recently published Pediatric Baseline Patch Test Series by Yu et al. [Dermatitis. 2018;29:206-12] does and is recommended for use in patients suspected of having dermatitis secondary to slime,” Dr. Anderson and associates wrote.
SOURCE: Anderson LE et al. Pediatr Dermatol. 2019 Mar 13. doi: 10.1111/pde.13792.
The viscous homemade children’s plaything known as “slime” has been associated with allergic, as well as irritant, contact dermatitis of the hands thanks to an array of possible compounds with which it can be made, according to a case report in Pediatric Dermatology. The report details many possible compounds causing the dermatitis reactions seen by health care professionals.
In the case, which was reported by L. Elizabeth Anderson, MD, of the Children’s Hospital of Philadelphia and colleagues, an 11-year-old girl with a history of atopic dermatitis presented with hand dermatitis that was suspected to be related to playing with slime. After her dermatitis failed to respond to strong topical steroids, she was referred for patch testing, with positivity for methylchloroisothiazolinone/methylisothiazolinone (MCI/MI). After all contact with any products containing MCI/MI was eliminated, her hand dermatitis cleared, and bodywide atopic dermatitis improved some as well.
MCI/MI and MI are among the most commonly suspected culprits in cases of slime-related contact dermatitis. Although most cases are irritant contact dermatitis, some are allergic and can be detected using patch tests. MCI/MI is included in the T.R.U.E. Test, but according to the case report, 37% of patients with allergy to MI alone will not have positive response with the T.R.U.E. Test because of the low concentrations of MI in that test. The authors of this case report also listed many other the potential allergens in popular slime recipes; however, many are not included in the T.R.U.E. Test.
“While the T.R.U.E. Test does not capture most of the potential allergens in popular slime recipes, the recently published Pediatric Baseline Patch Test Series by Yu et al. [Dermatitis. 2018;29:206-12] does and is recommended for use in patients suspected of having dermatitis secondary to slime,” Dr. Anderson and associates wrote.
SOURCE: Anderson LE et al. Pediatr Dermatol. 2019 Mar 13. doi: 10.1111/pde.13792.
The viscous homemade children’s plaything known as “slime” has been associated with allergic, as well as irritant, contact dermatitis of the hands thanks to an array of possible compounds with which it can be made, according to a case report in Pediatric Dermatology. The report details many possible compounds causing the dermatitis reactions seen by health care professionals.
In the case, which was reported by L. Elizabeth Anderson, MD, of the Children’s Hospital of Philadelphia and colleagues, an 11-year-old girl with a history of atopic dermatitis presented with hand dermatitis that was suspected to be related to playing with slime. After her dermatitis failed to respond to strong topical steroids, she was referred for patch testing, with positivity for methylchloroisothiazolinone/methylisothiazolinone (MCI/MI). After all contact with any products containing MCI/MI was eliminated, her hand dermatitis cleared, and bodywide atopic dermatitis improved some as well.
MCI/MI and MI are among the most commonly suspected culprits in cases of slime-related contact dermatitis. Although most cases are irritant contact dermatitis, some are allergic and can be detected using patch tests. MCI/MI is included in the T.R.U.E. Test, but according to the case report, 37% of patients with allergy to MI alone will not have positive response with the T.R.U.E. Test because of the low concentrations of MI in that test. The authors of this case report also listed many other the potential allergens in popular slime recipes; however, many are not included in the T.R.U.E. Test.
“While the T.R.U.E. Test does not capture most of the potential allergens in popular slime recipes, the recently published Pediatric Baseline Patch Test Series by Yu et al. [Dermatitis. 2018;29:206-12] does and is recommended for use in patients suspected of having dermatitis secondary to slime,” Dr. Anderson and associates wrote.
SOURCE: Anderson LE et al. Pediatr Dermatol. 2019 Mar 13. doi: 10.1111/pde.13792.
FROM PEDIATRIC DERMATOLOGY

Acetyl-coenzyme-A carboxylase inhibition shows early promise for acne vulgaris
A potent oral inhibitor of acetyl-coenzyme-A carboxylase approximately halved the production of facial sebum, most of which arises from de novo lipogenesis, researchers reported.
The production of sebum triglycerides, wax esters, and free fatty acids all depend on local flux through this de novo lipogenesis (DNL) pathway in sebocytes, explained William P. Esler, PhD, and associates. Oral treatment with the investigational agent PF-05175157, a potent inhibitor of acetyl-coenzyme-A carboxylase (ACC) 1 and 2, reduced levels of these sebum components by about 66%, but did not affect levels of compounds that do not depend on the DNL pathway. The results of their mechanistic studies “identify sebocyte DNL as a pathway of importance in the biology of human skin and in the pathogenesis of acne vulgaris,” the researchers wrote in Science Translational Medicine. “Moreover, the observed dependence of human sebum production on local DNL flux and the effectiveness of DNL inhibition by an
Sebum helps moisturize and protect human skin, but increased production is linked to acne vulgaris severity. While sebaceous glands contain ACC and undergo DNL, the role of this pathway in sebum production relative to the recycling of circulating lipids was unknown. For the study, Dr. Esler of Pfizer Global Research and Development in Cambridge, Mass., and associates administered heavy water to 22 healthy volunteers to measure how much stable isotope was incorporated into newly synthesized fatty acids in sebocytes. They found that most skin sebum originated from local flux through the DNL pathway, including 80% of sebum palmitate and more than 80% of sebum sapienate. Furthermore, compared with 10 individuals with acne-free skin, 9 patients with acne vulgaris had about 20% greater sebum production and DNL pathway flux.
Oral therapy for 2 weeks with the ACC inhibitor (200 mg twice daily) was well tolerated and reduced baseline sebum production by 49% when administered to 10 healthy volunteers, the investigators wrote. This effect was not observed in a small placebo comparator group. Importantly, studies of hamsters and guinea pigs failed to implicate the DNL pathway in sebum production, even though these animals have been widely used to model sebum production in humans.
The researchers recommended studying the effects of ACC inhibition in patients with acne vulgaris, the effects of topical ACC inhibition on sebum production, and whether DNL pathway inhibition reduces the number and severity of acne lesions.
Pfizer provided funding; Dr. Esler and 12 coinvestigators are Pfizer employees and stockholders. Two additional coinvestigators are former Pfizer employees while three are current or prior scientific consultants for Pfizer.
SOURCE: Esler WP et al. Sci Transl Med. 2019 May 15. doi: 10.1126/scitranslmed.aau8465.
A potent oral inhibitor of acetyl-coenzyme-A carboxylase approximately halved the production of facial sebum, most of which arises from de novo lipogenesis, researchers reported.
The production of sebum triglycerides, wax esters, and free fatty acids all depend on local flux through this de novo lipogenesis (DNL) pathway in sebocytes, explained William P. Esler, PhD, and associates. Oral treatment with the investigational agent PF-05175157, a potent inhibitor of acetyl-coenzyme-A carboxylase (ACC) 1 and 2, reduced levels of these sebum components by about 66%, but did not affect levels of compounds that do not depend on the DNL pathway. The results of their mechanistic studies “identify sebocyte DNL as a pathway of importance in the biology of human skin and in the pathogenesis of acne vulgaris,” the researchers wrote in Science Translational Medicine. “Moreover, the observed dependence of human sebum production on local DNL flux and the effectiveness of DNL inhibition by an
Sebum helps moisturize and protect human skin, but increased production is linked to acne vulgaris severity. While sebaceous glands contain ACC and undergo DNL, the role of this pathway in sebum production relative to the recycling of circulating lipids was unknown. For the study, Dr. Esler of Pfizer Global Research and Development in Cambridge, Mass., and associates administered heavy water to 22 healthy volunteers to measure how much stable isotope was incorporated into newly synthesized fatty acids in sebocytes. They found that most skin sebum originated from local flux through the DNL pathway, including 80% of sebum palmitate and more than 80% of sebum sapienate. Furthermore, compared with 10 individuals with acne-free skin, 9 patients with acne vulgaris had about 20% greater sebum production and DNL pathway flux.
Oral therapy for 2 weeks with the ACC inhibitor (200 mg twice daily) was well tolerated and reduced baseline sebum production by 49% when administered to 10 healthy volunteers, the investigators wrote. This effect was not observed in a small placebo comparator group. Importantly, studies of hamsters and guinea pigs failed to implicate the DNL pathway in sebum production, even though these animals have been widely used to model sebum production in humans.
The researchers recommended studying the effects of ACC inhibition in patients with acne vulgaris, the effects of topical ACC inhibition on sebum production, and whether DNL pathway inhibition reduces the number and severity of acne lesions.
Pfizer provided funding; Dr. Esler and 12 coinvestigators are Pfizer employees and stockholders. Two additional coinvestigators are former Pfizer employees while three are current or prior scientific consultants for Pfizer.
SOURCE: Esler WP et al. Sci Transl Med. 2019 May 15. doi: 10.1126/scitranslmed.aau8465.
A potent oral inhibitor of acetyl-coenzyme-A carboxylase approximately halved the production of facial sebum, most of which arises from de novo lipogenesis, researchers reported.
The production of sebum triglycerides, wax esters, and free fatty acids all depend on local flux through this de novo lipogenesis (DNL) pathway in sebocytes, explained William P. Esler, PhD, and associates. Oral treatment with the investigational agent PF-05175157, a potent inhibitor of acetyl-coenzyme-A carboxylase (ACC) 1 and 2, reduced levels of these sebum components by about 66%, but did not affect levels of compounds that do not depend on the DNL pathway. The results of their mechanistic studies “identify sebocyte DNL as a pathway of importance in the biology of human skin and in the pathogenesis of acne vulgaris,” the researchers wrote in Science Translational Medicine. “Moreover, the observed dependence of human sebum production on local DNL flux and the effectiveness of DNL inhibition by an
Sebum helps moisturize and protect human skin, but increased production is linked to acne vulgaris severity. While sebaceous glands contain ACC and undergo DNL, the role of this pathway in sebum production relative to the recycling of circulating lipids was unknown. For the study, Dr. Esler of Pfizer Global Research and Development in Cambridge, Mass., and associates administered heavy water to 22 healthy volunteers to measure how much stable isotope was incorporated into newly synthesized fatty acids in sebocytes. They found that most skin sebum originated from local flux through the DNL pathway, including 80% of sebum palmitate and more than 80% of sebum sapienate. Furthermore, compared with 10 individuals with acne-free skin, 9 patients with acne vulgaris had about 20% greater sebum production and DNL pathway flux.
Oral therapy for 2 weeks with the ACC inhibitor (200 mg twice daily) was well tolerated and reduced baseline sebum production by 49% when administered to 10 healthy volunteers, the investigators wrote. This effect was not observed in a small placebo comparator group. Importantly, studies of hamsters and guinea pigs failed to implicate the DNL pathway in sebum production, even though these animals have been widely used to model sebum production in humans.
The researchers recommended studying the effects of ACC inhibition in patients with acne vulgaris, the effects of topical ACC inhibition on sebum production, and whether DNL pathway inhibition reduces the number and severity of acne lesions.
Pfizer provided funding; Dr. Esler and 12 coinvestigators are Pfizer employees and stockholders. Two additional coinvestigators are former Pfizer employees while three are current or prior scientific consultants for Pfizer.
SOURCE: Esler WP et al. Sci Transl Med. 2019 May 15. doi: 10.1126/scitranslmed.aau8465.
FROM SCIENCE TRANSLATIONAL MEDICINE
Consider measles vaccine booster in HIV-positive patients
LJUBLJANA, SLOVENIA – A “surprisingly low” prevalence of protective antibodies against measles is present in adolescents and adults living with HIV infection despite their prior vaccination against the resurgent disease, Raquel M. Simakawa, MD, reported at the annual meeting of the European Society for Paediatric Infectious Diseases.

“With the present concern about the global reemergence of measles, we should consider measuring measles antibodies in people living with HIV, especially those who acquired the infection vertically, and then revaccinating those with low titers,” said Dr. Simakawa of the Federal University of São Paolo.
She presented interim findings of an ongoing study of the measles immunologic status of persons living with HIV, which for this analysis included 57 patients who acquired HIV from their mother via vertical transmission and 24 with horizontally acquired HIV. The vertical-transmission group was significantly younger, with a median age of 20 years, compared with 31 years in the horizontal group, who were diagnosed with HIV infection at an average age of 24 years. The vast majority of subjects were on combination antiretroviral therapy. No detectable HIV viral load had been present for a median of 70 months in the vertical group and 25 months in the horizontal group.
Only a mere 7% of the vertical transmission group had protective levels of measles IgG antibodies as measured by enzyme-linked immunosorbent assay, as did 29% of the horizontal group. The likely explanation for the higher rate of protection in the horizontal group, she said, is that they received their routine measles vaccination before they acquired HIV infection, and some of them didn’t lose their protective antibodies during their immune system’s fight against HIV infection.
Session chair Nico G. Hartwig, MD, of Franciscus Hospital in Rotterdam, the Netherlands, posed a question: Given the sky-high rate of measles seronegativity status among the vertically transmitted HIV-positive group – the patient population pediatricians focus on – why bother to measure their measles antibody level? Why not just give them all a measles booster?
Dr. Simakawa replied that that’s worth considering in routine clinical practice now that her study has shown that this group is more vulnerable to measles because of their poor response to immunization. But the study is ongoing, with larger numbers of patients to be enrolled. Also, in the second phase of the study, which will include a control group, measles IgG antibodies will be remeasured 1 month after administration of a new dose of measles vaccine.
She reported having no financial conflicts regarding this study, conducted free of commercial support.
LJUBLJANA, SLOVENIA – A “surprisingly low” prevalence of protective antibodies against measles is present in adolescents and adults living with HIV infection despite their prior vaccination against the resurgent disease, Raquel M. Simakawa, MD, reported at the annual meeting of the European Society for Paediatric Infectious Diseases.
“With the present concern about the global reemergence of measles, we should consider measuring measles antibodies in people living with HIV, especially those who acquired the infection vertically, and then revaccinating those with low titers,” said Dr. Simakawa of the Federal University of São Paolo.
She presented interim findings of an ongoing study of the measles immunologic status of persons living with HIV, which for this analysis included 57 patients who acquired HIV from their mother via vertical transmission and 24 with horizontally acquired HIV. The vertical-transmission group was significantly younger, with a median age of 20 years, compared with 31 years in the horizontal group, who were diagnosed with HIV infection at an average age of 24 years. The vast majority of subjects were on combination antiretroviral therapy. No detectable HIV viral load had been present for a median of 70 months in the vertical group and 25 months in the horizontal group.
Only a mere 7% of the vertical transmission group had protective levels of measles IgG antibodies as measured by enzyme-linked immunosorbent assay, as did 29% of the horizontal group. The likely explanation for the higher rate of protection in the horizontal group, she said, is that they received their routine measles vaccination before they acquired HIV infection, and some of them didn’t lose their protective antibodies during their immune system’s fight against HIV infection.
Session chair Nico G. Hartwig, MD, of Franciscus Hospital in Rotterdam, the Netherlands, posed a question: Given the sky-high rate of measles seronegativity status among the vertically transmitted HIV-positive group – the patient population pediatricians focus on – why bother to measure their measles antibody level? Why not just give them all a measles booster?
Dr. Simakawa replied that that’s worth considering in routine clinical practice now that her study has shown that this group is more vulnerable to measles because of their poor response to immunization. But the study is ongoing, with larger numbers of patients to be enrolled. Also, in the second phase of the study, which will include a control group, measles IgG antibodies will be remeasured 1 month after administration of a new dose of measles vaccine.
She reported having no financial conflicts regarding this study, conducted free of commercial support.
LJUBLJANA, SLOVENIA – A “surprisingly low” prevalence of protective antibodies against measles is present in adolescents and adults living with HIV infection despite their prior vaccination against the resurgent disease, Raquel M. Simakawa, MD, reported at the annual meeting of the European Society for Paediatric Infectious Diseases.
“With the present concern about the global reemergence of measles, we should consider measuring measles antibodies in people living with HIV, especially those who acquired the infection vertically, and then revaccinating those with low titers,” said Dr. Simakawa of the Federal University of São Paolo.
She presented interim findings of an ongoing study of the measles immunologic status of persons living with HIV, which for this analysis included 57 patients who acquired HIV from their mother via vertical transmission and 24 with horizontally acquired HIV. The vertical-transmission group was significantly younger, with a median age of 20 years, compared with 31 years in the horizontal group, who were diagnosed with HIV infection at an average age of 24 years. The vast majority of subjects were on combination antiretroviral therapy. No detectable HIV viral load had been present for a median of 70 months in the vertical group and 25 months in the horizontal group.
Only a mere 7% of the vertical transmission group had protective levels of measles IgG antibodies as measured by enzyme-linked immunosorbent assay, as did 29% of the horizontal group. The likely explanation for the higher rate of protection in the horizontal group, she said, is that they received their routine measles vaccination before they acquired HIV infection, and some of them didn’t lose their protective antibodies during their immune system’s fight against HIV infection.
Session chair Nico G. Hartwig, MD, of Franciscus Hospital in Rotterdam, the Netherlands, posed a question: Given the sky-high rate of measles seronegativity status among the vertically transmitted HIV-positive group – the patient population pediatricians focus on – why bother to measure their measles antibody level? Why not just give them all a measles booster?
Dr. Simakawa replied that that’s worth considering in routine clinical practice now that her study has shown that this group is more vulnerable to measles because of their poor response to immunization. But the study is ongoing, with larger numbers of patients to be enrolled. Also, in the second phase of the study, which will include a control group, measles IgG antibodies will be remeasured 1 month after administration of a new dose of measles vaccine.
She reported having no financial conflicts regarding this study, conducted free of commercial support.
REPORTING FROM ESPID 2019

Breastfeeding protects against intussusception
LJUBLJANA, SLOVENIA – in a German case-control study.

Two other potent risk factors for intussusception in children less than 1 year old were identified: a family history of intussusception, and an episode of gastroenteritis, Doris F. Oberle, MD, PhD, reported at the annual meeting of the European Society for Paediatric Infectious Diseases.
Dr. Oberle, of the Paul Ehrlich Institute in Langen, Germany, presented a retrospective study of 116 meticulously validated cases of intussusception in infancy treated at 19 German pediatric centers during 2010-2014 and 272 controls matched by birth month, sex, and location. A standardized interview was conducted with the parents of all study participants.
Rotavirus vaccine was added to the German national vaccination schedule in 2013. In a multivariate logistic regression analysis, the risk of intussusception was increased by 5.4-fold following the first dose of the vaccine, compared with nonrecipients. However, subsequent doses of rotavirus vaccine were not associated with any excess risk.
In addition, a family history of intussusception was linked to a 4.2-fold increased risk, while an episode of gastroenteritis during the first year of life was associated with a 4.7-fold elevated risk.
In a novel finding, breastfeeding was independently associated with a 44% reduction in the risk of intussusception, compared with that of bottle-fed babies.
The most common presenting signs and symptoms of intussusception were vomiting, abdominal pain, hematochezia, pallor, and reduced appetite, each present in at least half of affected infants.
Dr. Oberle reported having no financial conflicts regarding her study, supported by the Paul Ehrlich Institute.
LJUBLJANA, SLOVENIA – in a German case-control study.
Two other potent risk factors for intussusception in children less than 1 year old were identified: a family history of intussusception, and an episode of gastroenteritis, Doris F. Oberle, MD, PhD, reported at the annual meeting of the European Society for Paediatric Infectious Diseases.
Dr. Oberle, of the Paul Ehrlich Institute in Langen, Germany, presented a retrospective study of 116 meticulously validated cases of intussusception in infancy treated at 19 German pediatric centers during 2010-2014 and 272 controls matched by birth month, sex, and location. A standardized interview was conducted with the parents of all study participants.
Rotavirus vaccine was added to the German national vaccination schedule in 2013. In a multivariate logistic regression analysis, the risk of intussusception was increased by 5.4-fold following the first dose of the vaccine, compared with nonrecipients. However, subsequent doses of rotavirus vaccine were not associated with any excess risk.
In addition, a family history of intussusception was linked to a 4.2-fold increased risk, while an episode of gastroenteritis during the first year of life was associated with a 4.7-fold elevated risk.
In a novel finding, breastfeeding was independently associated with a 44% reduction in the risk of intussusception, compared with that of bottle-fed babies.
The most common presenting signs and symptoms of intussusception were vomiting, abdominal pain, hematochezia, pallor, and reduced appetite, each present in at least half of affected infants.
Dr. Oberle reported having no financial conflicts regarding her study, supported by the Paul Ehrlich Institute.
LJUBLJANA, SLOVENIA – in a German case-control study.
Two other potent risk factors for intussusception in children less than 1 year old were identified: a family history of intussusception, and an episode of gastroenteritis, Doris F. Oberle, MD, PhD, reported at the annual meeting of the European Society for Paediatric Infectious Diseases.
Dr. Oberle, of the Paul Ehrlich Institute in Langen, Germany, presented a retrospective study of 116 meticulously validated cases of intussusception in infancy treated at 19 German pediatric centers during 2010-2014 and 272 controls matched by birth month, sex, and location. A standardized interview was conducted with the parents of all study participants.
Rotavirus vaccine was added to the German national vaccination schedule in 2013. In a multivariate logistic regression analysis, the risk of intussusception was increased by 5.4-fold following the first dose of the vaccine, compared with nonrecipients. However, subsequent doses of rotavirus vaccine were not associated with any excess risk.
In addition, a family history of intussusception was linked to a 4.2-fold increased risk, while an episode of gastroenteritis during the first year of life was associated with a 4.7-fold elevated risk.
In a novel finding, breastfeeding was independently associated with a 44% reduction in the risk of intussusception, compared with that of bottle-fed babies.
The most common presenting signs and symptoms of intussusception were vomiting, abdominal pain, hematochezia, pallor, and reduced appetite, each present in at least half of affected infants.
Dr. Oberle reported having no financial conflicts regarding her study, supported by the Paul Ehrlich Institute.
REPORTING FROM ESPID 2019

Chronic Myeloid Leukemia: Selecting First-line TKI Therapy
From the Moffitt Cancer Center, Tampa, FL.
Abstract
- Objective: To outline the approach to selecting a tyrosine kinase inhibitor (TKI) for initial treatment of chronic myeloid leukemia (CML) and monitoring patients following initiation of therapy.
- Methods: Review of the literature and evidence-based guidelines.
- Results: The development and availability of TKIs has improved survival for patients diagnosed with CML. The life expectancy of patients diagnosed with chronic-phase CML (CP-CML) is similar to that of the general population, provided they receive appropriate TKI therapy and adhere to treatment. Selection of the most appropriate first-line TKI for newly diagnosed CP-CML requires incorporation of the patient’s baseline karyotype and Sokal or EURO risk score, and a clear understanding of the patient’s comorbidities. The adverse effect profile of all TKIs must be considered in conjunction with the patient’s ongoing medical issues to decrease the likelihood of worsening their current symptoms or causing a severe complication from TKI therapy. After confirming a diagnosis of CML and selecting the most appropriate TKI for first-line therapy, close monitoring and follow-up are necessary to ensure patients are meeting the desired treatment milestones. Responses in CML can be assessed based on hematologic parameters, cytogenetic results, and molecular responses.
- Conclusion: Given the successful treatments available for patients with CML, it is crucial to identify patients with this diagnosis; ensure they receive a complete, appropriate diagnostic workup including a bone marrow biopsy and aspiration with cytogenetic testing; and select the best therapy for each individual patient.
Keywords: chronic myeloid leukemia; CML; tyrosine kinase inhibitor; TKI; cancer; BCR-ABL protein.
Chronic myeloid leukemia (CML) is a rare myeloproliferative neoplasm that is characterized by the presence of the Philadelphia (Ph) chromosome and uninhibited expansion of bone marrow stem cells. The Ph chromosome arises from a reciprocal translocation between the Abelson (ABL) region on chromosome 9 and the breakpoint cluster region (BCR) of chromosome 22 (t(9;22)(q34;q11.2)), resulting in the BCR-ABL1 fusion gene and its protein product, BCR-ABL tyrosine kinase.1 BCR-ABL has constitutive tyrosine kinase activity that promotes growth, replication, and survival of hematopoietic cells through downstream pathways, which is the driving factor in the pathogenesis of CML.1
CML is divided into 3 phases based on the number of myeloblasts observed in the blood or bone marrow: chronic, accelerated, and blast. Most cases of CML are diagnosed in the chronic phase (CP), which is marked by proliferation of primarily the myeloid element.
Typical treatment for CML involves lifelong use of oral BCR-ABL tyrosine kinase inhibitors (TKIs). Currently, 5 TKIs have regulatory approval for treatment of this disease. The advent of TKIs, a class of small molecules targeting the tyrosine kinases, particularly the BCR-ABL tyrosine kinase, led to rapid changes in the management of CML and improved survival for patients. Patients diagnosed with chronic-phase CML (CP-CML) now have a life expectancy that is similar to that of the general population, as long as they receive appropriate TKI therapy and adhere to treatment. As such, it is crucial to identify patients with CML; ensure they receive a complete, appropriate diagnostic workup; and select the best therapy for each patient.
Epidemiology
According to SEER data estimates, 8430 new cases of CML were diagnosed in the United States in 2018. CML is a disease of older adults, with a median age of 65 years at diagnosis, and there is a slight male predominance. Between 2011 and 2015, the number of new CML cases was 1.8 per 100,000 persons. The median overall survival (OS) in patients with newly diagnosed CP-CML has not been reached.2 Given the effective treatments available for managing CML, it is estimated that the prevalence of CML in the United States will plateau at 180,000 patients by 2050.3
Diagnosis
Clinical Features
The diagnosis of CML is often suspected based on an incidental finding of leukocytosis and, in some cases, thrombocytosis. In many cases, this is an incidental finding on routine blood work, but approximately 50% of patients will present with constitutional symptoms associated with the disease. Characteristic features of the white blood cell differential include left-shifted maturation with neutrophilia and immature circulating myeloid cells. Basophilia and eosinophilia are often present as well. Splenomegaly is a common sign, present in 50% to 90% of patients at diagnosis. In those patients with symptoms related to CML at diagnosis, the most common presentation includes increasing fatigue, fevers, night sweats, early satiety, and weight loss. The diagnosis is confirmed by cytogenetic studies showing the Ph chromosome abnormality, t(9; 22)(q3.4;q1.1), and/or reverse transcriptase polymerase chain reaction (PCR) showing BCR-ABL1 transcripts.
Testing
Bone marrow biopsy. There are 3 distinct phases of CML: CP, accelerated phase (AP), and blast phase (BP). Bone marrow biopsy and aspiration at diagnosis are mandatory in order to determine the phase of the disease at diagnosis. This distinction is based on the percentage of blasts, promyelocytes, and basophils present as well as the platelet count and presence or absence of extramedullary disease.4 The vast majority of patients at diagnosis have CML that is in the chronic phase. The typical appearance in CP-CML is a hypercellular marrow with granulocytic and occasionally megakaryocytic hyperplasia. In many cases, basophilia and/or eosinophilia are noted as well. Dysplasia is not a typical finding in CML.5 Bone marrow fibrosis can be seen in up to one-third of patients at diagnosis, and may indicate a slightly worse prognosis.6 Although a diagnosis of CML can be made without a bone marrow biopsy, complete staging and prognostication are only possible with information gained from this test, including baseline karyotype and confirmation of CP versus a more advanced phase of CML.
Diagnostic criteria. The criteria for diagnosing AP-CML has not been agreed upon by various groups, but the modified MD Anderson Cancer Center (MDACC) criteria are used in the majority of clinical trials evaluating the efficacy of TKIs in preventing progression to advanced phases of CML. MDACC criteria define AP-CML as the presence of 1 of the following: 15% to 29% blasts in the peripheral blood or bone marrow, ≥ 30% peripheral blasts plus promyelocytes, ≥ 20% basophils in the blood or bone marrow, platelet count ≤ 100,000/μL unrelated to therapy, and clonal cytogenetic evolution in Ph-positive metaphases (Table).7
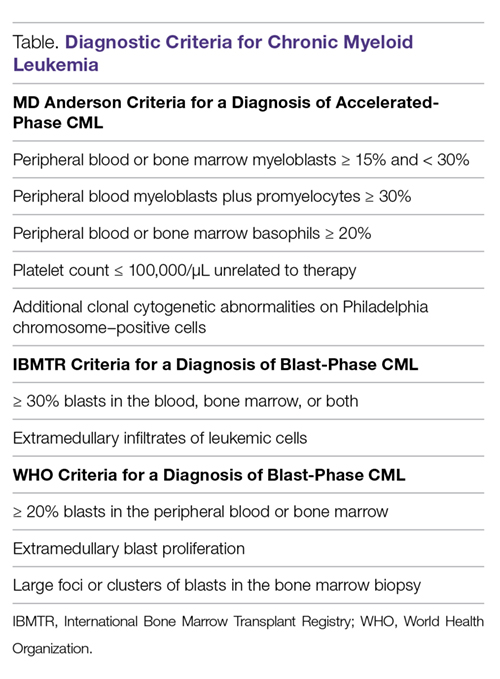
BP-CML is typically defined using the criteria developed by the International Bone Marrow Transplant Registry (IBMTR): ≥ 30% blasts in the peripheral blood and/or the bone marrow or the presence of extramedullary disease.8 Although not typically used in clinical trials, the revised World Health Organization (WHO) criteria for BP-CML include ≥ 20% blasts in the peripheral blood or bone marrow, extramedullary blast proliferation, and large foci or clusters of blasts in the bone marrow biopsy sample (Table).9
The defining feature of CML is the presence of the Ph chromosome abnormality. In a small subset of patients, additional chromosome abnormalities (ACA) in the Ph-positive cells may be identified at diagnosis. Some reports indicate that the presence of “major route” ACA (trisomy 8, isochromosome 17q, a second Ph chromosome, or trisomy 19) at diagnosis may negatively impact prognosis, but other reports contradict these findings.10,11
PCR assay. The typical BCR breakpoint in CML is the major breakpoint cluster region (M-BCR), which results in a 210-kDa protein (p210). Alternate breakpoints that are less frequently identified are the minor BCR (mBCR or p190), which is more commonly found in Ph-positive acute lymphoblastic leukemia (ALL), and the micro BCR (µBCR or p230), which is much less common and is often characterized by chronic neutrophilia.12 Identifying which BCR-ABL1 transcript is present in each patient using qualitative PCR is crucial in order to ensure proper monitoring during treatment.
The most sensitive method for detecting BCR-ABL1 mRNA transcripts is the quantitative real-time PCR (RQ-PCR) assay, which is typically done on peripheral blood. RQ-PCR is capable of detecting a single CML cell in the presence of ≥ 100,000 normal cells. This test should be done during the initial diagnostic workup in order to confirm the presence of BCR-ABL1 transcripts, and it is used as a standard method for monitoring response to TKI therapy.13 The International Scale (IS) is a standardized approach to reporting RQ-PCR results that was developed to allow comparison of results across various laboratories and has become the gold standard for reporting BCR-ABL1 transcript values.14
Determining Risk Scores
Calculating a patient’s Sokal score or EURO risk score at diagnosis remains an important component of the diagnostic workup in CP-CML, as this information has prognostic and therapeutic implications (an online calculator is available through European LeukemiaNet [ELN]). The risk for disease progression to the accelerated or blast phases is higher in patients with intermediate or high risk scores compared to those with a low risk score at diagnosis. The risk of progression in intermediate- or high-risk patients is lower when a second-generation TKI (dasatinib, nilotinib, or bosutinib) is used as frontline therapy compared to imatinib, and therefore, the National Comprehensive Cancer Network (NCCN) CML Panel recommends starting with a second-generation TKI in these patients.15-19
Monitoring Response to Therapy
After confirming a diagnosis of CML and selecting the most appropriate TKI for first-line therapy, the successful management of CML patients relies on close monitoring and follow-up to ensure they are meeting the desired treatment milestones. Responses in CML can be assessed based on hematologic parameters, cytogenetic results, and molecular responses. A complete hematologic response (CHR) implies complete normalization of peripheral blood counts (with the exception of TKI-induced cytopenias) and resolution of any palpable splenomegaly. The majority of patients will achieve a CHR within 4 to 6 weeks after initiating CML-directed therapy.20
Cytogenetic Response
Cytogenetic responses are defined by the decrease in the number of Ph chromosome–positive metaphases when assessed on bone marrow cytogenetics. A partial cytogenetic response (PCyR) is defined as having 1% to 35% Ph-positive metaphases, a major cytogenetic response (MCyR) as having 0% to 35% Ph-positive metaphases, and a complete cytogenetic response (CCyR) implies that no Ph-positive metaphases are identified on bone marrow cytogenetics. An ideal response is the achievement of PCyR after 3 months on a TKI and a CCyR after 12 months on a TKI.21
Molecular Response
Once a patient has achieved a CCyR, monitoring their response to therapy can only be done using RQ-PCR to measure BCR-ABL1 transcripts in the peripheral blood. The NCCN and the ELN recommend monitoring RQ-PCR from the peripheral blood every 3 months in order to assess response to TKIs.19,22 As noted, the IS has become the gold standard reporting system for all BCR-ABL1 transcript levels in the majority of laboratories worldwide.14,23 Molecular responses are based on a log reduction in BCR-ABL1 transcripts from a standardized baseline. Many molecular responses can be correlated with cytogenetic responses such that, if reliable RQ-PCR testing is available, monitoring can be done using only peripheral blood RQ-PCR rather than repeat bone marrow biopsies. For example, an early molecular response (EMR) is defined as a RQ-PCR value of ≤ 10% IS, which is approximately equivalent to a PCyR.24 A value of 1% IS is approximately equivalent to a CCyR. A major molecular response (MMR) is a ≥ 3-log reduction in BCR-ABL1 transcripts from baseline and is a value of ≤ 0.1% IS. Deeper levels of molecular response are best described by the log reduction in BCR-ABL1 transcripts, with a 4-log reduction denoted as MR4.0, a 4.5-log reduction as MR4.5, and so forth. Complete molecular response (CMR) is defined by the level of sensitivity of the RQ-PCR assay being used.14
The definition of relapsed disease in CML is dependent on the type of response the patient had previously achieved. Relapse could be the loss of a hematologic or cytogenetic response, but fluctuations in BCR-ABL1 transcripts on routine RQ-PCR do not necessarily indicate relapsed CML. A 1-log increase in the level of BCR-ABL1 transcripts with a concurrent loss of MMR should prompt a bone marrow biopsy in order to assess for the loss of CCyR, and thus a cytogenetic relapse; however, this loss of MMR does not define relapse in and of itself. In the setting of relapsed disease, testing should be done to look for possible ABL kinase domain mutations, and alternate therapy should be selected.19
Multiple reports have identified the prognostic relevance of achieving an EMR at 3 and 6 months after starting TKI therapy. Marin and colleagues reported that in 282 imatinib-treated patients, there was a significant improvement in 8-year OS, progression-free survival (PFS), and cumulative incidence of CCyR and CMR in patients who had BCR-ABL1 transcripts < 9.84% IS after 3 months on treatment.24 This data highlights the importance of early molecular monitoring in order to ensure the best outcomes for patients with CP-CML.
The NCCN CML guidelines and ELN recommendations both agree that an ideal response after 3 months on a TKI is BCR-ABL1 transcripts < 10% IS, but treatment is not considered to be failing at this point if the patient marginally misses this milestone. After 6 months on treatment, an ideal response is considered BCR-ABL1 transcripts < 1%–10% IS. Ideally, patients will have BCR-ABL1 transcripts < 0.1%–1% IS by the time they complete 12 months of TKI therapy, suggesting that these patients have at least achieved a CCyR.19,22 Even after patients achieve these early milestones, frequent monitoring by RQ-PCR is required to ensure that they are maintaining their response to treatment. This will help to ensure patient compliance with treatment and will also help to identify a select subset of patients who could potentially be considered for an attempt at TKI cessation (not discussed in detail here) after a minimum of 3 years on therapy.19,25
Selecting First-line TKI Therapy
Selection of the most appropriate first-line TKI for newly diagnosed CP-CML patients requires incorporation of many patient-specific factors. These factors include baseline karyotype and confirmation of CP-CML through bone marrow biopsy, Sokal or EURO risk score, and a thorough patient history, including a clear understanding of the patient’s comorbidities. The adverse effect profile of all TKIs must be considered in conjunction with the patient’s ongoing medical issues in order to decrease the likelihood of worsening their current symptoms or causing a severe complication from TKI therapy.
Imatinib
The management of CML was revolutionized by the development and ultimate regulatory approval of imatinib mesylate in 2001. Imatinib was the first small-molecule cancer therapy developed and approved. It acts by binding to the adenosine triphosphate (ATP) binding site in the catalytic domain of BCR-ABL, thus inhibiting the oncoprotein’s tyrosine kinase activity.26
The International Randomized Study of Interferon versus STI571 (IRIS) trial was a randomized phase 3 study that compared imatinib 400 mg daily to interferon alfa (IFNa) plus cytarabine. More than 1000 CP-CML patients were randomly assigned 1:1 to either imatinib or IFNa plus cytarabine and were assessed for event-free survival, hematologic and cytogenetic responses, freedom from progression to AP or BP, and toxicity. Imatinib was superior to the prior standard of care for all these outcomes.21 The long-term follow-up of the IRIS trial reported an 83% estimated 10-year OS and 79% estimated event-free survival for patients on the imatinib arm of this study.15 The cumulative rate of CCyR was 82.8%. Of the 204 imatinib-treated patients who could undergo a molecular response evaluation at 10 years, 93.1% had a MMR and 63.2% had a MR4.5, suggesting durable, deep molecular responses for many patients. The estimated 10-year rate of freedom from progression to AP or BP was 92.1%.
Higher doses of imatinib (600-800 mg daily) have been studied in an attempt to overcome resistance and improve cytogenetic and molecular response rates. The Tyrosine Kinase Inhibitor Optimization and Selectivity (TOPS) trial was a randomized phase 3 study that compared imatinib 800 mg daily to imatinib 400 mg daily. Although the 6-month assessments found increased rates of CCyR and a MMR in the higher-dose imatinib arm, these differences were no longer present at the 12-month assessment. Furthermore, the higher dose of imatinib led to a significantly higher incidence of grade 3/4 hematologic adverse events, and approximately 50% of patients on imatinib 800 mg daily required a dose reduction to less than 600 mg daily because of toxicity.27
The Therapeutic Intensification in De Novo Leukaemia (TIDEL)-II study used plasma trough levels of imatinib on day 22 of treatment with imatinib 600 mg daily to determine if patients should escalate the imatinib dose to 800 mg daily. In patients who did not meet molecular milestones at 3, 6, or 12 months, cohort 1 was dose escalated to imatinib 800 mg daily and subsequently switched to nilotinib 400 mg twice daily for failing the same target 3 months later, and cohort 2 was switched to nilotinib. At 2 years, 73% of patients achieved MMR and 34% achieved MR4.5, suggesting that initial treatment with higher-dose imatinib, followed by a switch to nilotinib in those failing to achieve desired milestones, could be an effective strategy for managing newly diagnosed CP-CML.28
Toxicity. The standard starting dose of imatinib in CP-CML patients is 400 mg. The safety profile of imatinib has been very well established. In the IRIS trial, the most common adverse events (all grades in decreasing order of frequency) were peripheral and periorbital edema (60%), nausea (50%), muscle cramps (49%), musculoskeletal pain (47%), diarrhea (45%), rash (40%), fatigue (39%), abdominal pain (37%), headache (37%), and joint pain (31%). Grade 3/4 liver enzyme elevation can occur in 5% of patients.29 In the event of severe liver toxicity or fluid retention, imatinib should be held until the event resolves. At that time, imatinib can be restarted if deemed appropriate, but this is dependent on the severity of the inciting event. Fluid retention can be managed by the use of supportive care, diuretics, imatinib dose reduction, dose interruption, or imatinib discontinuation if the fluid retention is severe. Muscle cramps can be managed by the use of calcium supplements or tonic water. Management of rash can include topical or systemic steroids, or in some cases imatinib dose reduction, interruption, or discontinuation.19
Grade 3/4 imatinib-induced hematologic toxicity is not uncommon, with 17% of patients experiencing neutropenia, 9% thrombocytopenia, and 4% anemia. These adverse events occurred most commonly during the first year of therapy, and the frequency decreased over time.15,29 Depending on the degree of cytopenias, imatinib dosing should be interrupted until recovery of the absolute neutrophil count or platelet count, and can often be resumed at 400 mg daily. However, if cytopenias recur, imatinib should be held and subsequently restarted at 300 mg daily.19
Dasatinib
Dasatinib is a second-generation TKI that has regulatory approval for treatment of adult patients with newly diagnosed CP-CML or CP-CML in patients with resistance or intolerance to prior TKIs. In addition to dasatinib’s ability to inhibit ABL kinases, it is also known to be a potent inhibitor of Src family kinases. Dasatinib has shown efficacy in patients who have developed imatinib-resistant ABL kinase domain mutations.
Dasatinib was initially approved as second-line therapy in patients with resistance or intolerance to imatinib. This indication was based on the results of the phase 3 CA180-034 trial, which ultimately identified dasatinib 100 mg daily as the optimal dose. In this trial, 74% of patients enrolled had resistance to imatinib and the remainder were intolerant. The 7-year follow-up of patients randomized to dasatinib 100 mg (n = 167) daily indicated that 46% achieved MMR while on study. Of the 124 imatinib-resistant patients on dasatinib 100 mg daily, the 7-year PFS was 39% and OS was 63%. In the 43 imatinib-intolerant patients, the 7-year PFS was 51% and OS was 70%.30
Dasatinib 100 mg daily was compared to imatinib 400 mg daily in newly diagnosed CP-CML patients in the randomized phase 3 DASISION (Dasatinib versus Imatinib Study in Treatment-Naive CML Patients) trial. More patients on the dasatinib arm achieved an EMR of BCR-ABL1 transcripts ≤ 10% IS after 3 months on treatment compared to imatinib (84% versus 64%). Furthermore, the 5-year follow-up reports that the cumulative incidence of MMR and MR4.5 in dasatinib-treated patients was 76% and 42%, and was 64% and 33% with imatinib (P = 0.0022 and P = 0.0251, respectively). Fewer patients treated with dasatinib progressed to AP or BP (4.6%) compared to imatinib (7.3%), but the estimated 5-year OS was similar between the 2 arms (91% for dasatinib versus 90% for imatinib).16 Regulatory approval for dasatinib as first-line therapy in newly diagnosed CML patients was based on results of the DASISION trial.
Toxicity. Most dasatinib-related toxicities are reported as grade 1 or grade 2, but grade 3/4 hematologic adverse events are fairly common. In the DASISION trial, grade 3/4 neutropenia, anemia, and thrombocytopenia occurred in 29%, 13%, and 22% of dasatinib-treated patients, respectively. Cytopenias can generally be managed with temporary dose interruptions or dose reductions.
During the 5-year follow-up of the DASISION trial, pleural effusions were reported in 28% of patients, most of which were grade 1/2. This occurred at a rate of approximately ≤ 8% per year, suggesting a stable incidence over time, and the effusions appear to be dose-dependent.16 Depending on the severity, pleural effusion may be treated with diuretics, dose interruption, and, in some instances, steroids or a thoracentesis. Typically, dasatinib can be restarted at 1 dose level lower than the previous dose once the effusion has resolved.19 Other, less common side effects of dasatinib include pulmonary hypertension (5% of patients), as well as abdominal pain, fluid retention, headaches, fatigue, musculoskeletal pain, rash, nausea, and diarrhea. Pulmonary hypertension is typically reversible after cessation of dasatinib, and thus dasatinib should be permanently discontinued once the diagnosis is confirmed. Fluid retention is often treated with diuretics and supportive care. Nausea and diarrhea are generally manageable and occur less frequently when dasatinib is taken with food and a large glass of water. Antiemetics and antidiarrheals can be used as needed. Troublesome rash can be best managed with topical or systemic steroids as well as possible dose reduction or dose interruption.16,19 In the DASISION trial, adverse events led to therapy discontinuation more often in the dasatinib group than in the imatinib group (16% versus 7%).16 Bleeding, particularly in the setting of thrombocytopenia, has been reported in patients being treated with dasatinib as a result of the drug-induced reversible inhibition of platelet aggregation.31
Nilotinib
The structure of nilotinib is similar to that of imatinib; however, it has a markedly increased affinity for the ATP‐binding site on the BCR-ABL1 protein. It was initially given regulatory approval in the setting of imatinib failure. Nilotinib was studied at a dose of 400 mg twice daily in 321 patients who were imatinib-resistant or -intolerant. It proved to be highly effective at inducing cytogenetic remissions in the second-line setting, with 59% of patients achieving a MCyR and 45% achieving a CCyR. With a median follow-up time of 4 years, the OS was 78%.32
Nilotinib gained regulatory approval for use as a first-line TKI after completion of the randomized phase 3 ENESTnd (Evaluating Nilotinib Efficacy and Safety in Clinical Trials-Newly Diagnosed Patients) trial. ENESTnd was a 3-arm study comparing nilotinib 300 mg twice daily versus nilotinib 400 mg twice daily versus imatinib 400 mg daily in newly diagnosed, previously untreated patients diagnosed with CP-CML. The primary endpoint of this clinical trial was rate of MMR at 12 months.33 Nilotinib surpassed imatinib in this regard, with 44% of patients on nilotinib 300 mg twice daily achieving MMR at 12 months versus 43% of nilotinib 400 mg twice daily patients versus 22% of the imatinib-treated patients (P < 0.001 for both comparisons). Furthermore, the rate of CCyR by 12 months was significantly higher for both nilotinib arms compared with imatinib (80% for nilotinib 300 mg, 78% for nilotinib 400 mg, and 65% for imatinib) (P < 0.001).12 Based on this data, nilotinib 300 mg twice daily was chosen as the standard dose of nilotinib in the first-line setting. After 5 years of follow-up on the ENESTnd study, there were fewer progressions to AP/BP CML in nilotinib-treated patients compared with imatinib. MMR was achieved in 77% of nilotinib 300 mg patients compared with 60.4% of patients on the imatinib arm. MR4.5 was also more common in patients treated with nilotinib 300 mg twice daily, with a rate of 53.5% at 5 years versus 31.4% in the imatinib arm.17 In spite of the deeper cytogenetic and molecular responses achieved with nilotinib, this did not translate into a significant improvement in OS. The 5-year OS rate was 93.7% in nilotinib 300 mg patients versus 91.7% in imatinib-treated patients, and this difference lacked statistical significance.17
Toxicity. Although some similarities exist between the toxicity profiles of nilotinib and imatinib, each drug has some distinct adverse events. On the ENESTnd trial, the rate of any grade 3/4 non-hematologic adverse event was fairly low; however, lower-grade toxicities were not uncommon. Patients treated with nilotinib 300 mg twice daily experienced rash (31%), headache (14%), pruritis (15%), and fatigue (11%) most commonly. The most frequently reported laboratory abnormalities included increased total bilirubin (53%), hypophosphatemia (32%), hyperglycemia (36%), elevated lipase (24%), increased alanine aminotransferase (ALT; 66%), and increased aspartate aminotransferase (AST; 40%). Any grade of neutropenia, thrombocytopenia, or anemia occurred at rates of 43%, 48%, and 38%, respectively.33 Although nilotinib has a Black Box Warning from the US Food and Drug Administration for QT interval prolongation, no patients on the ENESTnd trial experienced a QT interval corrected for heart rate greater than 500 msec.12
More recent concerns have emerged regarding the potential for cardiovascular toxicity after long-term use of nilotinib. The 5-year update of ENESTnd reports cardiovascular events, including ischemic heart disease, ischemic cerebrovascular events, or peripheral arterial disease occurring in 7.5% of patients treated with nilotinib 300 mg twice daily, as compared with a rate of 2.1% in imatinib-treated patients. The frequency of these cardiovascular events increased linearly over time in both arms. Elevations in total cholesterol from baseline occurred in 27.6% of nilotinib patients compared with 3.9% of imatinib patients. Furthermore, clinically meaningful increases in low-density lipoprotein cholesterol and glycated hemoglobin occurred more frequently with nilotinib therapy.33
Nilotinib should be taken on an empty stomach; therefore, patients should be made aware of the need to fast for 2 hours prior to each dose and 1 hour after each dose. Given the potential risk of QT interval prolongation, a baseline electrocardiogram (ECG) is recommended prior to initiating treatment to ensure the QT interval is within a normal range. A repeat ECG should be done approximately 7 days after nilotinib initiation to ensure no prolongation of the QT interval after starting. Close monitoring of potassium and magnesium levels is important to decrease the risk of cardiac arrhythmias, and concomitant use of drugs considered strong CYP3A4 inhibitors should be avoided.19
If the patient experiences any grade 3 or higher laboratory abnormalities, nilotinib should be held until resolution of the toxicity, and then restarted at a lower dose. Similarly, if patients develop significant neutropenia or thrombocytopenia, nilotinib doses should be interrupted until resolution of the cytopenias. At that point, nilotinib can be reinitiated at either the same or a lower dose. Rash can be managed by the use of topical or systemic steroids as well as potential dose reduction, interruption, or discontinuation.
Given the concerns for potential cardiovascular events with long-term use of nilotinib, caution is advised when prescribing it to any patient with a history of cardiovascular disease or peripheral arterial occlusive disease. At the first sign of new occlusive disease, nilotinib should be discontinued.19
Bosutinib
Bosutinib is a second-generation BCR-ABL TKI with activity against the Src family of kinases; it was initially approved to treat patients with CP-, AP-, or BP-CML after resistance or intolerance to imatinib. Long-term data has been reported from the phase 1/2 trial of bosutinib therapy in patients with CP-CML who developed resistance or intolerance to imatinib plus dasatinib and/or nilotinib. A total of 119 patients were included in the 4-year follow-up; 38 were resistant/intolerant to imatinib and resistant to dasatinib, 50 were resistant/intolerant to imatinib and intolerant to dasatinib, 26 were resistant/intolerant to imatinib and resistant to nilotinib, and 5 were resistant/intolerant to imatinib and intolerant to nilotinib or resistant/intolerant to dasatinib and nilotinib. Bosutinib 400 mg daily was studied in this setting. Of the 38 patients with imatinib resistance/intolerance and dasatinib resistance, 39% achieved MCyR, 22% achieved CCyR, and the OS was 67%. Of the 50 patients with imatinib resistance/intolerance and dasatinib intolerance, 42% achieved MCyR, 40% achieved CCyR, and the OS was 80%. Finally, in the 26 patients with imatinib resistance/intolerance and nilotinib resistance, 38% achieved MCyR, 31% achieved CCyR, and the OS was 87%.34
Five-year follow-up from the phase 1/2 clinical trial that studied bosutinib 500 mg daily in CP-CML patients after imatinib failure reported data on 284 patients. By 5 years on study, 60% of patients had achieved MCyR and 50% achieved CCyR with a 71% and 69% probability, respectively, of maintaining these responses at 5 years. The 5-year OS was 84%.35 These data led to the regulatory approval of bosutinib 500 mg daily as second-line or later therapy.
Bosutinib was initially studied in the first-line setting in the randomized phase 3 BELA (Bosutinib Efficacy and Safety in Newly Diagnosed Chronic Myeloid Leukemia) trial. This trial compared bosutinib 500 mg daily to imatinib 400 mg daily in newly diagnosed, previously untreated CP-CML patients. This trial failed to meet its primary endpoint of increased rate of CCyR at 12 months, with 70% of bosutinib patients achieving this response, compared to 68% of imatinib-treated patients (P = 0.601). In spite of this, the rate of MMR at 12 months was significantly higher in the bosutinib arm (41%) compared to the imatinib arm (27%; P = 0.001).36
A second phase 3 trial (BFORE) was designed to study bosutinib 400 mg daily versus imatinib in newly diagnosed, previously untreated CP-CML patients. This study enrolled 536 patients who were randomly assigned 1:1 to bosutinib versus imatinib. The primary endpoint of this trial was rate of MMR at 12 months. A significantly higher number of bosutinib-treated patients achieved this response (47.2%) compared with imatinib-treated patients (36.9%, P = 0.02). Furthermore, by 12 months 77.2% of patients on the bosutinib arm had achieved CCyR compared with 66.4% on the imatinib arm, and this difference did meet statistical significance (P = 0.0075). A lower rate of progression to AP- or BP-CML was noted in bosutinib-treated patients as well (1.6% versus 2.5%). Based on this data, bosutinib gained regulatory approval for first-line therapy in CP-CML at a dose of 400 mg daily.18
Toxicity. On the BFORE trial, the most common treatment-emergent adverse events of any grade reported in the bosutinib-treated patients were diarrhea (70.1%), nausea (35.1%), increased ALT (30.6%), and increased AST (22.8%). Musculoskeletal pain or spasms occurred in 29.5% of patients, rash in 19.8%, fatigue in 19.4%, and headache in 18.7%. Hematologic toxicity was also reported, but most was grade 1/2. Thrombocytopenia was reported in 35.1%, anemia in 18.7%, and neutropenia in 11.2%.18
Cardiovascular events occurred in 5.2% of patients on the bosutinib arm of the BFORE trial, which was similar to the rate observed in imatinib patients. The most common cardiovascular event was QT interval prolongation, which occurred in 1.5% of patients. Pleural effusions were reported in 1.9% of patients treated with bosutinib, and none were grade 3 or higher.18
If liver enzyme elevation occurs at a value greater than 5 times the institutional upper limit of normal, bosutinib should be held until the level recovers to ≤ 2.5 times the upper limit of normal, at which point bosutinib can be restarted at a lower dose. If recovery takes longer than 4 weeks, bosutinib should be permanently discontinued. Liver enzymes elevated greater than 3 times the institutional upper limit of normal and a concurrent elevation in total bilirubin to 2 times the upper limit of normal are consistent with Hy’s law, and bosutinib should be discontinued. Although diarrhea is the most common toxicity associated with bosutinib, it is commonly low grade and transient. Diarrhea occurs most frequently in the first few days after initiating bosutinib. It can often be managed with over-the-counter antidiarrheal medications, but if the diarrhea is grade 3 or higher, bosutinib should be held until recovery to grade 1 or lower. Gastrointestinal side effects may be improved by taking bosutinib with a meal and a large glass of water. Fluid retention can be managed with diuretics and supportive care. Finally, if rash occurs, this can be addressed with topical or systemic steroids as well as bosutinib dose reduction, interruption, or discontinuation.19
Similar to other TKIs, if bosutinib-induced cytopenias occur, treatment should be held and restarted at the same or a lower dose upon blood count recovery.19
Ponatinib
The most common cause of TKI resistance in CP-CML is the development of ABL kinase domain mutations. The majority of imatinib-resistant mutations can be overcome by the use of second-generation TKIs, including dasatinib, nilotinib, or bosutinib. However, ponatinib is the only BCR-ABL TKI able to overcome a T315I mutation. The phase 2 PACE (Ponatinib Ph-positive ALL and CML Evaluation) trial enrolled patients with CP-, AP-, or BP-CML as well as patients with Ph-positive acute lymphoblastic leukemia who were resistant or intolerant to nilotinib or dasatinib, or who had evidence of a T315I mutation. The starting dose of ponatinib on this trial was 45 mg daily.37 The PACE trial enrolled 267 patients with CP-CML: 203 with resistance or intolerance to nilotinib or dasatinib, and 64 with a T315I mutation. The primary endpoint in the CP cohort was rate of MCyR at any time within 12 months of starting ponatinib. The overall rate of MCyR by 12 months in the CP-CML patients was 56%. In those with a T315I mutation, 70% achieved MCyR, which compared favorably with those with resistance or intolerance to nilotinib or dasatinib, 51% of whom achieved MCyR. CCyR was achieved in 46% of CP-CML patients (40% in the resistant/intolerant cohort and 66% in the T315I cohort). In general, patients with T315I mutations received fewer prior therapies than those in the resistant/intolerant cohort, which likely contributed to the higher response rates in the T315I patients. MR4.5 was achieved in 15% of CP-CML patients by 12 months on the PACE trial.37 The 5-year update to this study reported that 60%, 40%, and 24% of CP-CML patients achieved MCyR, MMR, and MR4.5, respectively. In the patients who achieved MCyR, the probability of maintaining this response for 5 years was 82% and the estimated 5-year OS was 73%.19
Toxicity. In 2013, after the regulatory approval of ponatinib, reports became available that the drug can cause an increase in arterial occlusive events, including fatal myocardial infarctions and cerebrovascular accidents. For this reason, dose reductions were implemented in patients who were deriving clinical benefit from ponatinib. In spite of these dose reductions, ≥ 90% of responders maintained their response for up to 40 months.38 Although the likelihood of developing an arterial occlusive event appears higher in the first year after starting ponatinib than in later years, the cumulative incidence of events continues to increase. The 5-year follow-up to the PACE trial reports 31% of patients experiencing any grade of arterial occlusive event while on ponatinib. Aside from these events, the most common treatment-emergent adverse events in ponatinib-treated patients on the PACE trial included rash (47%), abdominal pain (46%), headache (43%), dry skin (42%), constipation (41%), and hypertension (37%). Hematologic toxicity was also common, with 46% of patients experiencing any grade of thrombocytopenia, 20% experiencing neutropenia, and 20% anemia.38
Patients receiving ponatinib therapy should be monitored closely for any evidence of arterial or venous thrombosis. If an occlusive event occurs, ponatinib should be discontinued. Similarly, in the setting of any new or worsening heart failure symptoms, ponatinib should be promptly discontinued. Management of any underlying cardiovascular risk factors, including hypertension, hyperlipidemia, diabetes, or smoking history, is recommended, and these patients should be referred to a cardiologist for a full evaluation. In the absence of any contraindications to aspirin, low-dose aspirin should be considered as a means of decreasing cardiovascular risks associated with ponatinib. In patients with known risk factors, a ponatinib starting dose of 30 mg daily rather than the standard 45 mg daily may be a safer option, resulting in fewer arterial occlusive events, although the efficacy of this dose is still being studied in comparison to 45 mg daily.19
If ponatinib-induced transaminitis greater than 3 times the upper limit of normal occurs, ponatinib should be held until resolution to less than 3 times the upper limit of normal, at which point it should be resumed at a lower dose. Similarly, in the setting of elevated serum lipase or symptomatic pancreatitis, ponatinib should be held and restarted at a lower dose after resolution of symptoms.19
In the event of neutropenia or thrombocytopenia, ponatinib should be held until blood count recovery and then restarted at the same dose. If cytopenias occur for a second time, the dose of ponatinib should be lowered at the time of treatment reinitiation. If rash occurs, it can be addressed with topical or systemic steroids as well as dose reduction, interruption, or discontinuation.19
Conclusion
With the development of imatinib and the subsequent TKIs, dasatinib, nilotinib, bosutinib, and ponatinib, CP-CML has become a chronic disease with a life expectancy that is similar to that of the general population. Given the successful treatments available for these patients, it is crucial to identify patients with this diagnosis, ensure they receive a complete, appropriate diagnostic workup including a bone marrow biopsy and aspiration with cytogenetic testing, and select the best therapy for each individual patient. Once on treatment, the importance of frequent monitoring cannot be overstated. This is the only way to be certain patients are achieving the desired treatment milestones that correlate with the favorable long-term outcomes that have been observed with TKI-based treatment of CP-CML.
Corresponding author: Kendra Sweet, MD, MS, Department of Malignant Hematology, Moffitt Cancer Center, Tampa, FL.
Financial disclosures: Dr. Sweet has served on the Advisory Board and Speakers Bureau of Novartis, Bristol-Meyers Squibb, Ariad Pharmaceuticals, and Pfizer, and has served as a consultant to Pfizer.
1. Faderl S, Talpaz M, Estrov Z, et al. The biology of chronic myeloid leukemia. N Engl J Med. 1999;341:164-172.
2. Surveillance, Epidemiology, and End Results Program. Cancer Stat Facts: Leukemia - Chronic Myeloid Leukemia (CML). 2018.
3. Huang X, Cortes J, Kantarjian H. Estimations of the increasing prevalence and plateau prevalence of chronic myeloid leukemia in the era of tyrosine kinase inhibitor therapy. Cancer. 2012;118:3123-3127.
4. Savage DG, Szydlo RM, Chase A, et al. Bone marrow transplantation for chronic myeloid leukaemia: the effects of differing criteria for defining chronic phase on probabilities of survival and relapse. Br J Haematol. 1997;99:30-35.
5. Knox WF, Bhavnani M, Davson J, Geary CG. Histological classification of chronic granulocytic leukaemia. Clin Lab Haematol. 1984;6:171-175.
6. Kvasnicka HM, Thiele J, Schmitt-Graeff A, et al. Impact of bone marrow morphology on multivariate risk classification in chronic myelogenous leukemia. Acta Haematol. 2003;109:53-56.
7. Cortes JE, Talpaz M, O’Brien S, et al. Staging of chronic myeloid leukemia in the imatinib era: an evaluation of the World Health Organization proposal. Cancer. 2006;106:1306-1315.
8. Druker BJ. Chronic myeloid leukemia. In: DeVita VT, Lawrence TS, Rosenberg SA, eds. DeVita, Hellman, and Rosenberg’s Cancer Principles & Practice of Oncology. 8th ed. Philadelphia, PA: Lippincott, Williams and Wilkins; 2007:2267-2304.
9. Arber DA, Orazi A, Hasserjian R, et al. The 2016 revision to the World Health Organization classification of myeloid neoplasms and acute leukemia. Blood. 2016;127:2391-2405.
10. Fabarius A, Leitner A, Hochhaus A, et al. Impact of additional cytogenetic aberrations at diagnosis on prognosis of CML: long-term observation of 1151 patients from the randomized CML Study IV. Blood. 2011;118:6760-6768.
11. Alhuraiji A, Kantarjian H, Boddu P, et al. Prognostic significance of additional chromosomal abnormalities at the time of diagnosis in patients with chronic myeloid leukemia treated with frontline tyrosine kinase inhibitors. Am J Hematol. 2018;93:84-90.
12. Melo JV. BCR-ABL gene variants. Baillieres Clin Haematol. 1997;10:203-222.
13. Kantarjian HM, Talpaz M, Cortes J, et al. Quantitative polymerase chain reaction monitoring of BCR-ABL during therapy with imatinib mesylate (STI571; gleevec) in chronic-phase chronic myelogenous leukemia. Clin Cancer Res. 2003;9:160-166.
14. Hughes T, Deininger M, Hochhaus A, et al. Monitoring CML patients responding to treatment with tyrosine kinase inhibitors: review and recommendations for harmonizing current methodology for detecting BCR-ABL transcripts and kinase domain mutations and for expressing results. Blood. 2006;108:28-37.
15. Hochhaus A, Larson RA, Guilhot F, et al. Long-term outcomes of imatinib treatment for chronic myeloid leukemia. N Engl J Med. 2017;376:917-927.
16. Cortes JE, Saglio G, Kantarjian HM, et al. Final 5-year study results of DASISION: the Dasatinib Versus Imatinib Study in Treatment-Naive Chronic Myeloid Leukemia Patients trial. J Clin Oncol. 2016;34:2333-2340.
17. Hochhaus A, Saglio G, Hughes TP, et al. Long-term benefits and risks of frontline nilotinib vs imatinib for chronic myeloid leukemia in chronic phase: 5-year update of the randomized ENESTnd trial. Leukemia. 2016;30:1044-1054.
18. Cortes JE, Gambacorti-Passerini C, Deininger MW, et al. Bosutinib versus imatinib for newly diagnosed chronic myeloid leukemia: results from the randomized BFORE trial. J Clin Oncol. 2018;36:231-237.
19. Radich JP, Deininger M, Abboud CN, et al. Chronic Myeloid Leukemia, Version 1.2019, NCCN Clinical Practice Guidelines in Oncology. J Natl Compr Canc Netw. 2018;16:1108-1135.
20. Faderl S, Talpaz M, Estrov Z, Kantarjian HM. Chronic myelogenous leukemia: biology and therapy. Ann Intern Med. 1999;131:207-219.
21. O’Brien SG, Guilhot F, Larson RA, et al. Imatinib compared with interferon and low-dose cytarabine for newly diagnosed chronic-phase chronic myeloid leukemia. N Engl J Med. 2003;348:994-1004.
22. Baccarani M, Deininger MW, Rosti G, et al. European LeukemiaNet recommendations for the management of chronic myeloid leukemia: 2013. Blood. 2013;122:872-884.
23. Larripa I, Ruiz MS, Gutierrez M, Bianchini M. [Guidelines for molecular monitoring of BCR-ABL1 in chronic myeloid leukemia patients by RT-qPCR]. Medicina (B Aires). 2017;77:61-72.
24. Marin D, Ibrahim AR, Lucas C, et al. Assessment of BCR-ABL1 transcript levels at 3 months is the only requirement for predicting outcome for patients with chronic myeloid leukemia treated with tyrosine kinase inhibitors. J Clin Oncol. 2012;30:232-238.
25. Hughes TP, Ross DM. Moving treatment-free remission into mainstream clinical practice in CML. Blood. 2016;128:17-23.
26. Druker BJ, Talpaz M, Resta DJ, et al. Efficacy and safety of a specific inhibitor of the BCR-ABL tyrosine kinase in chronic myeloid leukemia. N Engl J Med. 2001;344:1031-1037.
27. Baccarani M, Druker BJ, Branford S, et al. Long-term response to imatinib is not affected by the initial dose in patients with Philadelphia chromosome-positive chronic myeloid leukemia in chronic phase: final update from the Tyrosine Kinase Inhibitor Optimization and Selectivity (TOPS) study. Int J Hematol. 2014;99:616-624.
28. Yeung DT, Osborn MP, White DL, et al. TIDEL-II: first-line use of imatinib in CML with early switch to nilotinib for failure to achieve time-dependent molecular targets. Blood. 2015;125:915-923.
29. Druker BJ, Guilhot F, O’Brien SG, et al. Five-year follow-up of patients receiving imatinib for chronic myeloid leukemia. N Engl J Med. 2006;355:2408-2417.
30. Shah NP, Rousselot P, Schiffer C, et al. Dasatinib in imatinib-resistant or -intolerant chronic-phase, chronic myeloid leukemia patients: 7-year follow-up of study CA180-034. Am J Hematol. 2016;91:869-874.
31. Quintas-Cardama A, Han X, Kantarjian H, Cortes J. Tyrosine kinase inhibitor-induced platelet dysfunction in patients with chronic myeloid leukemia. Blood. 2009;114:261-263.
32. Giles FJ, le Coutre PD, Pinilla-Ibarz J, et al. Nilotinib in imatinib-resistant or imatinib-intolerant patients with chronic myeloid leukemia in chronic phase: 48-month follow-up results of a phase II study. Leukemia. 2013;27:107-112.
33. Saglio G, Kim DW, Issaragrisil S, et al. Nilotinib versus imatinib for newly diagnosed chronic myeloid leukemia. N Engl J Med. 2010;362:2251-2259.
34. Cortes JE, Khoury HJ, Kantarjian HM, et al. Long-term bosutinib for chronic phase chronic myeloid leukemia after failure of imatinib plus dasatinib and/or nilotinib. Am J Hematol. 2016;91:1206-1214.
35. Gambacorti-Passerini C, Cortes JE, Lipton JH, et al. Safety and efficacy of second-line bosutinib for chronic phase chronic myeloid leukemia over a five-year period: final results of a phase I/II study. Haematologica. 2018;103:1298-1307.
36. Cortes JE, Kim DW, Kantarjian HM, et al. Bosutinib versus imatinib in newly diagnosed chronic-phase chronic myeloid leukemia: results from the BELA trial. J Clin Oncol. 2012;30:3486-3492.
37. Cortes JE, Kim DW, Pinilla-Ibarz J, et al. A phase 2 trial of ponatinib in Philadelphia chromosome-positive leukemias. N Engl J Med. 2013;369:1783-1796.
38. Cortes JE, Kim DW, Pinilla-Ibarz J, et al. Ponatinib efficacy and safety in Philadelphia chromosome-positive leukemia: final 5-year results of the phase 2 PACE trial. Blood. 2018;132:393-404.
From the Moffitt Cancer Center, Tampa, FL.
Abstract
- Objective: To outline the approach to selecting a tyrosine kinase inhibitor (TKI) for initial treatment of chronic myeloid leukemia (CML) and monitoring patients following initiation of therapy.
- Methods: Review of the literature and evidence-based guidelines.
- Results: The development and availability of TKIs has improved survival for patients diagnosed with CML. The life expectancy of patients diagnosed with chronic-phase CML (CP-CML) is similar to that of the general population, provided they receive appropriate TKI therapy and adhere to treatment. Selection of the most appropriate first-line TKI for newly diagnosed CP-CML requires incorporation of the patient’s baseline karyotype and Sokal or EURO risk score, and a clear understanding of the patient’s comorbidities. The adverse effect profile of all TKIs must be considered in conjunction with the patient’s ongoing medical issues to decrease the likelihood of worsening their current symptoms or causing a severe complication from TKI therapy. After confirming a diagnosis of CML and selecting the most appropriate TKI for first-line therapy, close monitoring and follow-up are necessary to ensure patients are meeting the desired treatment milestones. Responses in CML can be assessed based on hematologic parameters, cytogenetic results, and molecular responses.
- Conclusion: Given the successful treatments available for patients with CML, it is crucial to identify patients with this diagnosis; ensure they receive a complete, appropriate diagnostic workup including a bone marrow biopsy and aspiration with cytogenetic testing; and select the best therapy for each individual patient.
Keywords: chronic myeloid leukemia; CML; tyrosine kinase inhibitor; TKI; cancer; BCR-ABL protein.
Chronic myeloid leukemia (CML) is a rare myeloproliferative neoplasm that is characterized by the presence of the Philadelphia (Ph) chromosome and uninhibited expansion of bone marrow stem cells. The Ph chromosome arises from a reciprocal translocation between the Abelson (ABL) region on chromosome 9 and the breakpoint cluster region (BCR) of chromosome 22 (t(9;22)(q34;q11.2)), resulting in the BCR-ABL1 fusion gene and its protein product, BCR-ABL tyrosine kinase.1 BCR-ABL has constitutive tyrosine kinase activity that promotes growth, replication, and survival of hematopoietic cells through downstream pathways, which is the driving factor in the pathogenesis of CML.1
CML is divided into 3 phases based on the number of myeloblasts observed in the blood or bone marrow: chronic, accelerated, and blast. Most cases of CML are diagnosed in the chronic phase (CP), which is marked by proliferation of primarily the myeloid element.
Typical treatment for CML involves lifelong use of oral BCR-ABL tyrosine kinase inhibitors (TKIs). Currently, 5 TKIs have regulatory approval for treatment of this disease. The advent of TKIs, a class of small molecules targeting the tyrosine kinases, particularly the BCR-ABL tyrosine kinase, led to rapid changes in the management of CML and improved survival for patients. Patients diagnosed with chronic-phase CML (CP-CML) now have a life expectancy that is similar to that of the general population, as long as they receive appropriate TKI therapy and adhere to treatment. As such, it is crucial to identify patients with CML; ensure they receive a complete, appropriate diagnostic workup; and select the best therapy for each patient.
Epidemiology
According to SEER data estimates, 8430 new cases of CML were diagnosed in the United States in 2018. CML is a disease of older adults, with a median age of 65 years at diagnosis, and there is a slight male predominance. Between 2011 and 2015, the number of new CML cases was 1.8 per 100,000 persons. The median overall survival (OS) in patients with newly diagnosed CP-CML has not been reached.2 Given the effective treatments available for managing CML, it is estimated that the prevalence of CML in the United States will plateau at 180,000 patients by 2050.3
Diagnosis
Clinical Features
The diagnosis of CML is often suspected based on an incidental finding of leukocytosis and, in some cases, thrombocytosis. In many cases, this is an incidental finding on routine blood work, but approximately 50% of patients will present with constitutional symptoms associated with the disease. Characteristic features of the white blood cell differential include left-shifted maturation with neutrophilia and immature circulating myeloid cells. Basophilia and eosinophilia are often present as well. Splenomegaly is a common sign, present in 50% to 90% of patients at diagnosis. In those patients with symptoms related to CML at diagnosis, the most common presentation includes increasing fatigue, fevers, night sweats, early satiety, and weight loss. The diagnosis is confirmed by cytogenetic studies showing the Ph chromosome abnormality, t(9; 22)(q3.4;q1.1), and/or reverse transcriptase polymerase chain reaction (PCR) showing BCR-ABL1 transcripts.
Testing
Bone marrow biopsy. There are 3 distinct phases of CML: CP, accelerated phase (AP), and blast phase (BP). Bone marrow biopsy and aspiration at diagnosis are mandatory in order to determine the phase of the disease at diagnosis. This distinction is based on the percentage of blasts, promyelocytes, and basophils present as well as the platelet count and presence or absence of extramedullary disease.4 The vast majority of patients at diagnosis have CML that is in the chronic phase. The typical appearance in CP-CML is a hypercellular marrow with granulocytic and occasionally megakaryocytic hyperplasia. In many cases, basophilia and/or eosinophilia are noted as well. Dysplasia is not a typical finding in CML.5 Bone marrow fibrosis can be seen in up to one-third of patients at diagnosis, and may indicate a slightly worse prognosis.6 Although a diagnosis of CML can be made without a bone marrow biopsy, complete staging and prognostication are only possible with information gained from this test, including baseline karyotype and confirmation of CP versus a more advanced phase of CML.
Diagnostic criteria. The criteria for diagnosing AP-CML has not been agreed upon by various groups, but the modified MD Anderson Cancer Center (MDACC) criteria are used in the majority of clinical trials evaluating the efficacy of TKIs in preventing progression to advanced phases of CML. MDACC criteria define AP-CML as the presence of 1 of the following: 15% to 29% blasts in the peripheral blood or bone marrow, ≥ 30% peripheral blasts plus promyelocytes, ≥ 20% basophils in the blood or bone marrow, platelet count ≤ 100,000/μL unrelated to therapy, and clonal cytogenetic evolution in Ph-positive metaphases (Table).7
BP-CML is typically defined using the criteria developed by the International Bone Marrow Transplant Registry (IBMTR): ≥ 30% blasts in the peripheral blood and/or the bone marrow or the presence of extramedullary disease.8 Although not typically used in clinical trials, the revised World Health Organization (WHO) criteria for BP-CML include ≥ 20% blasts in the peripheral blood or bone marrow, extramedullary blast proliferation, and large foci or clusters of blasts in the bone marrow biopsy sample (Table).9
The defining feature of CML is the presence of the Ph chromosome abnormality. In a small subset of patients, additional chromosome abnormalities (ACA) in the Ph-positive cells may be identified at diagnosis. Some reports indicate that the presence of “major route” ACA (trisomy 8, isochromosome 17q, a second Ph chromosome, or trisomy 19) at diagnosis may negatively impact prognosis, but other reports contradict these findings.10,11
PCR assay. The typical BCR breakpoint in CML is the major breakpoint cluster region (M-BCR), which results in a 210-kDa protein (p210). Alternate breakpoints that are less frequently identified are the minor BCR (mBCR or p190), which is more commonly found in Ph-positive acute lymphoblastic leukemia (ALL), and the micro BCR (µBCR or p230), which is much less common and is often characterized by chronic neutrophilia.12 Identifying which BCR-ABL1 transcript is present in each patient using qualitative PCR is crucial in order to ensure proper monitoring during treatment.
The most sensitive method for detecting BCR-ABL1 mRNA transcripts is the quantitative real-time PCR (RQ-PCR) assay, which is typically done on peripheral blood. RQ-PCR is capable of detecting a single CML cell in the presence of ≥ 100,000 normal cells. This test should be done during the initial diagnostic workup in order to confirm the presence of BCR-ABL1 transcripts, and it is used as a standard method for monitoring response to TKI therapy.13 The International Scale (IS) is a standardized approach to reporting RQ-PCR results that was developed to allow comparison of results across various laboratories and has become the gold standard for reporting BCR-ABL1 transcript values.14
Determining Risk Scores
Calculating a patient’s Sokal score or EURO risk score at diagnosis remains an important component of the diagnostic workup in CP-CML, as this information has prognostic and therapeutic implications (an online calculator is available through European LeukemiaNet [ELN]). The risk for disease progression to the accelerated or blast phases is higher in patients with intermediate or high risk scores compared to those with a low risk score at diagnosis. The risk of progression in intermediate- or high-risk patients is lower when a second-generation TKI (dasatinib, nilotinib, or bosutinib) is used as frontline therapy compared to imatinib, and therefore, the National Comprehensive Cancer Network (NCCN) CML Panel recommends starting with a second-generation TKI in these patients.15-19
Monitoring Response to Therapy
After confirming a diagnosis of CML and selecting the most appropriate TKI for first-line therapy, the successful management of CML patients relies on close monitoring and follow-up to ensure they are meeting the desired treatment milestones. Responses in CML can be assessed based on hematologic parameters, cytogenetic results, and molecular responses. A complete hematologic response (CHR) implies complete normalization of peripheral blood counts (with the exception of TKI-induced cytopenias) and resolution of any palpable splenomegaly. The majority of patients will achieve a CHR within 4 to 6 weeks after initiating CML-directed therapy.20
Cytogenetic Response
Cytogenetic responses are defined by the decrease in the number of Ph chromosome–positive metaphases when assessed on bone marrow cytogenetics. A partial cytogenetic response (PCyR) is defined as having 1% to 35% Ph-positive metaphases, a major cytogenetic response (MCyR) as having 0% to 35% Ph-positive metaphases, and a complete cytogenetic response (CCyR) implies that no Ph-positive metaphases are identified on bone marrow cytogenetics. An ideal response is the achievement of PCyR after 3 months on a TKI and a CCyR after 12 months on a TKI.21
Molecular Response
Once a patient has achieved a CCyR, monitoring their response to therapy can only be done using RQ-PCR to measure BCR-ABL1 transcripts in the peripheral blood. The NCCN and the ELN recommend monitoring RQ-PCR from the peripheral blood every 3 months in order to assess response to TKIs.19,22 As noted, the IS has become the gold standard reporting system for all BCR-ABL1 transcript levels in the majority of laboratories worldwide.14,23 Molecular responses are based on a log reduction in BCR-ABL1 transcripts from a standardized baseline. Many molecular responses can be correlated with cytogenetic responses such that, if reliable RQ-PCR testing is available, monitoring can be done using only peripheral blood RQ-PCR rather than repeat bone marrow biopsies. For example, an early molecular response (EMR) is defined as a RQ-PCR value of ≤ 10% IS, which is approximately equivalent to a PCyR.24 A value of 1% IS is approximately equivalent to a CCyR. A major molecular response (MMR) is a ≥ 3-log reduction in BCR-ABL1 transcripts from baseline and is a value of ≤ 0.1% IS. Deeper levels of molecular response are best described by the log reduction in BCR-ABL1 transcripts, with a 4-log reduction denoted as MR4.0, a 4.5-log reduction as MR4.5, and so forth. Complete molecular response (CMR) is defined by the level of sensitivity of the RQ-PCR assay being used.14
The definition of relapsed disease in CML is dependent on the type of response the patient had previously achieved. Relapse could be the loss of a hematologic or cytogenetic response, but fluctuations in BCR-ABL1 transcripts on routine RQ-PCR do not necessarily indicate relapsed CML. A 1-log increase in the level of BCR-ABL1 transcripts with a concurrent loss of MMR should prompt a bone marrow biopsy in order to assess for the loss of CCyR, and thus a cytogenetic relapse; however, this loss of MMR does not define relapse in and of itself. In the setting of relapsed disease, testing should be done to look for possible ABL kinase domain mutations, and alternate therapy should be selected.19
Multiple reports have identified the prognostic relevance of achieving an EMR at 3 and 6 months after starting TKI therapy. Marin and colleagues reported that in 282 imatinib-treated patients, there was a significant improvement in 8-year OS, progression-free survival (PFS), and cumulative incidence of CCyR and CMR in patients who had BCR-ABL1 transcripts < 9.84% IS after 3 months on treatment.24 This data highlights the importance of early molecular monitoring in order to ensure the best outcomes for patients with CP-CML.
The NCCN CML guidelines and ELN recommendations both agree that an ideal response after 3 months on a TKI is BCR-ABL1 transcripts < 10% IS, but treatment is not considered to be failing at this point if the patient marginally misses this milestone. After 6 months on treatment, an ideal response is considered BCR-ABL1 transcripts < 1%–10% IS. Ideally, patients will have BCR-ABL1 transcripts < 0.1%–1% IS by the time they complete 12 months of TKI therapy, suggesting that these patients have at least achieved a CCyR.19,22 Even after patients achieve these early milestones, frequent monitoring by RQ-PCR is required to ensure that they are maintaining their response to treatment. This will help to ensure patient compliance with treatment and will also help to identify a select subset of patients who could potentially be considered for an attempt at TKI cessation (not discussed in detail here) after a minimum of 3 years on therapy.19,25
Selecting First-line TKI Therapy
Selection of the most appropriate first-line TKI for newly diagnosed CP-CML patients requires incorporation of many patient-specific factors. These factors include baseline karyotype and confirmation of CP-CML through bone marrow biopsy, Sokal or EURO risk score, and a thorough patient history, including a clear understanding of the patient’s comorbidities. The adverse effect profile of all TKIs must be considered in conjunction with the patient’s ongoing medical issues in order to decrease the likelihood of worsening their current symptoms or causing a severe complication from TKI therapy.
Imatinib
The management of CML was revolutionized by the development and ultimate regulatory approval of imatinib mesylate in 2001. Imatinib was the first small-molecule cancer therapy developed and approved. It acts by binding to the adenosine triphosphate (ATP) binding site in the catalytic domain of BCR-ABL, thus inhibiting the oncoprotein’s tyrosine kinase activity.26
The International Randomized Study of Interferon versus STI571 (IRIS) trial was a randomized phase 3 study that compared imatinib 400 mg daily to interferon alfa (IFNa) plus cytarabine. More than 1000 CP-CML patients were randomly assigned 1:1 to either imatinib or IFNa plus cytarabine and were assessed for event-free survival, hematologic and cytogenetic responses, freedom from progression to AP or BP, and toxicity. Imatinib was superior to the prior standard of care for all these outcomes.21 The long-term follow-up of the IRIS trial reported an 83% estimated 10-year OS and 79% estimated event-free survival for patients on the imatinib arm of this study.15 The cumulative rate of CCyR was 82.8%. Of the 204 imatinib-treated patients who could undergo a molecular response evaluation at 10 years, 93.1% had a MMR and 63.2% had a MR4.5, suggesting durable, deep molecular responses for many patients. The estimated 10-year rate of freedom from progression to AP or BP was 92.1%.
Higher doses of imatinib (600-800 mg daily) have been studied in an attempt to overcome resistance and improve cytogenetic and molecular response rates. The Tyrosine Kinase Inhibitor Optimization and Selectivity (TOPS) trial was a randomized phase 3 study that compared imatinib 800 mg daily to imatinib 400 mg daily. Although the 6-month assessments found increased rates of CCyR and a MMR in the higher-dose imatinib arm, these differences were no longer present at the 12-month assessment. Furthermore, the higher dose of imatinib led to a significantly higher incidence of grade 3/4 hematologic adverse events, and approximately 50% of patients on imatinib 800 mg daily required a dose reduction to less than 600 mg daily because of toxicity.27
The Therapeutic Intensification in De Novo Leukaemia (TIDEL)-II study used plasma trough levels of imatinib on day 22 of treatment with imatinib 600 mg daily to determine if patients should escalate the imatinib dose to 800 mg daily. In patients who did not meet molecular milestones at 3, 6, or 12 months, cohort 1 was dose escalated to imatinib 800 mg daily and subsequently switched to nilotinib 400 mg twice daily for failing the same target 3 months later, and cohort 2 was switched to nilotinib. At 2 years, 73% of patients achieved MMR and 34% achieved MR4.5, suggesting that initial treatment with higher-dose imatinib, followed by a switch to nilotinib in those failing to achieve desired milestones, could be an effective strategy for managing newly diagnosed CP-CML.28
Toxicity. The standard starting dose of imatinib in CP-CML patients is 400 mg. The safety profile of imatinib has been very well established. In the IRIS trial, the most common adverse events (all grades in decreasing order of frequency) were peripheral and periorbital edema (60%), nausea (50%), muscle cramps (49%), musculoskeletal pain (47%), diarrhea (45%), rash (40%), fatigue (39%), abdominal pain (37%), headache (37%), and joint pain (31%). Grade 3/4 liver enzyme elevation can occur in 5% of patients.29 In the event of severe liver toxicity or fluid retention, imatinib should be held until the event resolves. At that time, imatinib can be restarted if deemed appropriate, but this is dependent on the severity of the inciting event. Fluid retention can be managed by the use of supportive care, diuretics, imatinib dose reduction, dose interruption, or imatinib discontinuation if the fluid retention is severe. Muscle cramps can be managed by the use of calcium supplements or tonic water. Management of rash can include topical or systemic steroids, or in some cases imatinib dose reduction, interruption, or discontinuation.19
Grade 3/4 imatinib-induced hematologic toxicity is not uncommon, with 17% of patients experiencing neutropenia, 9% thrombocytopenia, and 4% anemia. These adverse events occurred most commonly during the first year of therapy, and the frequency decreased over time.15,29 Depending on the degree of cytopenias, imatinib dosing should be interrupted until recovery of the absolute neutrophil count or platelet count, and can often be resumed at 400 mg daily. However, if cytopenias recur, imatinib should be held and subsequently restarted at 300 mg daily.19
Dasatinib
Dasatinib is a second-generation TKI that has regulatory approval for treatment of adult patients with newly diagnosed CP-CML or CP-CML in patients with resistance or intolerance to prior TKIs. In addition to dasatinib’s ability to inhibit ABL kinases, it is also known to be a potent inhibitor of Src family kinases. Dasatinib has shown efficacy in patients who have developed imatinib-resistant ABL kinase domain mutations.
Dasatinib was initially approved as second-line therapy in patients with resistance or intolerance to imatinib. This indication was based on the results of the phase 3 CA180-034 trial, which ultimately identified dasatinib 100 mg daily as the optimal dose. In this trial, 74% of patients enrolled had resistance to imatinib and the remainder were intolerant. The 7-year follow-up of patients randomized to dasatinib 100 mg (n = 167) daily indicated that 46% achieved MMR while on study. Of the 124 imatinib-resistant patients on dasatinib 100 mg daily, the 7-year PFS was 39% and OS was 63%. In the 43 imatinib-intolerant patients, the 7-year PFS was 51% and OS was 70%.30
Dasatinib 100 mg daily was compared to imatinib 400 mg daily in newly diagnosed CP-CML patients in the randomized phase 3 DASISION (Dasatinib versus Imatinib Study in Treatment-Naive CML Patients) trial. More patients on the dasatinib arm achieved an EMR of BCR-ABL1 transcripts ≤ 10% IS after 3 months on treatment compared to imatinib (84% versus 64%). Furthermore, the 5-year follow-up reports that the cumulative incidence of MMR and MR4.5 in dasatinib-treated patients was 76% and 42%, and was 64% and 33% with imatinib (P = 0.0022 and P = 0.0251, respectively). Fewer patients treated with dasatinib progressed to AP or BP (4.6%) compared to imatinib (7.3%), but the estimated 5-year OS was similar between the 2 arms (91% for dasatinib versus 90% for imatinib).16 Regulatory approval for dasatinib as first-line therapy in newly diagnosed CML patients was based on results of the DASISION trial.
Toxicity. Most dasatinib-related toxicities are reported as grade 1 or grade 2, but grade 3/4 hematologic adverse events are fairly common. In the DASISION trial, grade 3/4 neutropenia, anemia, and thrombocytopenia occurred in 29%, 13%, and 22% of dasatinib-treated patients, respectively. Cytopenias can generally be managed with temporary dose interruptions or dose reductions.
During the 5-year follow-up of the DASISION trial, pleural effusions were reported in 28% of patients, most of which were grade 1/2. This occurred at a rate of approximately ≤ 8% per year, suggesting a stable incidence over time, and the effusions appear to be dose-dependent.16 Depending on the severity, pleural effusion may be treated with diuretics, dose interruption, and, in some instances, steroids or a thoracentesis. Typically, dasatinib can be restarted at 1 dose level lower than the previous dose once the effusion has resolved.19 Other, less common side effects of dasatinib include pulmonary hypertension (5% of patients), as well as abdominal pain, fluid retention, headaches, fatigue, musculoskeletal pain, rash, nausea, and diarrhea. Pulmonary hypertension is typically reversible after cessation of dasatinib, and thus dasatinib should be permanently discontinued once the diagnosis is confirmed. Fluid retention is often treated with diuretics and supportive care. Nausea and diarrhea are generally manageable and occur less frequently when dasatinib is taken with food and a large glass of water. Antiemetics and antidiarrheals can be used as needed. Troublesome rash can be best managed with topical or systemic steroids as well as possible dose reduction or dose interruption.16,19 In the DASISION trial, adverse events led to therapy discontinuation more often in the dasatinib group than in the imatinib group (16% versus 7%).16 Bleeding, particularly in the setting of thrombocytopenia, has been reported in patients being treated with dasatinib as a result of the drug-induced reversible inhibition of platelet aggregation.31
Nilotinib
The structure of nilotinib is similar to that of imatinib; however, it has a markedly increased affinity for the ATP‐binding site on the BCR-ABL1 protein. It was initially given regulatory approval in the setting of imatinib failure. Nilotinib was studied at a dose of 400 mg twice daily in 321 patients who were imatinib-resistant or -intolerant. It proved to be highly effective at inducing cytogenetic remissions in the second-line setting, with 59% of patients achieving a MCyR and 45% achieving a CCyR. With a median follow-up time of 4 years, the OS was 78%.32
Nilotinib gained regulatory approval for use as a first-line TKI after completion of the randomized phase 3 ENESTnd (Evaluating Nilotinib Efficacy and Safety in Clinical Trials-Newly Diagnosed Patients) trial. ENESTnd was a 3-arm study comparing nilotinib 300 mg twice daily versus nilotinib 400 mg twice daily versus imatinib 400 mg daily in newly diagnosed, previously untreated patients diagnosed with CP-CML. The primary endpoint of this clinical trial was rate of MMR at 12 months.33 Nilotinib surpassed imatinib in this regard, with 44% of patients on nilotinib 300 mg twice daily achieving MMR at 12 months versus 43% of nilotinib 400 mg twice daily patients versus 22% of the imatinib-treated patients (P < 0.001 for both comparisons). Furthermore, the rate of CCyR by 12 months was significantly higher for both nilotinib arms compared with imatinib (80% for nilotinib 300 mg, 78% for nilotinib 400 mg, and 65% for imatinib) (P < 0.001).12 Based on this data, nilotinib 300 mg twice daily was chosen as the standard dose of nilotinib in the first-line setting. After 5 years of follow-up on the ENESTnd study, there were fewer progressions to AP/BP CML in nilotinib-treated patients compared with imatinib. MMR was achieved in 77% of nilotinib 300 mg patients compared with 60.4% of patients on the imatinib arm. MR4.5 was also more common in patients treated with nilotinib 300 mg twice daily, with a rate of 53.5% at 5 years versus 31.4% in the imatinib arm.17 In spite of the deeper cytogenetic and molecular responses achieved with nilotinib, this did not translate into a significant improvement in OS. The 5-year OS rate was 93.7% in nilotinib 300 mg patients versus 91.7% in imatinib-treated patients, and this difference lacked statistical significance.17
Toxicity. Although some similarities exist between the toxicity profiles of nilotinib and imatinib, each drug has some distinct adverse events. On the ENESTnd trial, the rate of any grade 3/4 non-hematologic adverse event was fairly low; however, lower-grade toxicities were not uncommon. Patients treated with nilotinib 300 mg twice daily experienced rash (31%), headache (14%), pruritis (15%), and fatigue (11%) most commonly. The most frequently reported laboratory abnormalities included increased total bilirubin (53%), hypophosphatemia (32%), hyperglycemia (36%), elevated lipase (24%), increased alanine aminotransferase (ALT; 66%), and increased aspartate aminotransferase (AST; 40%). Any grade of neutropenia, thrombocytopenia, or anemia occurred at rates of 43%, 48%, and 38%, respectively.33 Although nilotinib has a Black Box Warning from the US Food and Drug Administration for QT interval prolongation, no patients on the ENESTnd trial experienced a QT interval corrected for heart rate greater than 500 msec.12
More recent concerns have emerged regarding the potential for cardiovascular toxicity after long-term use of nilotinib. The 5-year update of ENESTnd reports cardiovascular events, including ischemic heart disease, ischemic cerebrovascular events, or peripheral arterial disease occurring in 7.5% of patients treated with nilotinib 300 mg twice daily, as compared with a rate of 2.1% in imatinib-treated patients. The frequency of these cardiovascular events increased linearly over time in both arms. Elevations in total cholesterol from baseline occurred in 27.6% of nilotinib patients compared with 3.9% of imatinib patients. Furthermore, clinically meaningful increases in low-density lipoprotein cholesterol and glycated hemoglobin occurred more frequently with nilotinib therapy.33
Nilotinib should be taken on an empty stomach; therefore, patients should be made aware of the need to fast for 2 hours prior to each dose and 1 hour after each dose. Given the potential risk of QT interval prolongation, a baseline electrocardiogram (ECG) is recommended prior to initiating treatment to ensure the QT interval is within a normal range. A repeat ECG should be done approximately 7 days after nilotinib initiation to ensure no prolongation of the QT interval after starting. Close monitoring of potassium and magnesium levels is important to decrease the risk of cardiac arrhythmias, and concomitant use of drugs considered strong CYP3A4 inhibitors should be avoided.19
If the patient experiences any grade 3 or higher laboratory abnormalities, nilotinib should be held until resolution of the toxicity, and then restarted at a lower dose. Similarly, if patients develop significant neutropenia or thrombocytopenia, nilotinib doses should be interrupted until resolution of the cytopenias. At that point, nilotinib can be reinitiated at either the same or a lower dose. Rash can be managed by the use of topical or systemic steroids as well as potential dose reduction, interruption, or discontinuation.
Given the concerns for potential cardiovascular events with long-term use of nilotinib, caution is advised when prescribing it to any patient with a history of cardiovascular disease or peripheral arterial occlusive disease. At the first sign of new occlusive disease, nilotinib should be discontinued.19
Bosutinib
Bosutinib is a second-generation BCR-ABL TKI with activity against the Src family of kinases; it was initially approved to treat patients with CP-, AP-, or BP-CML after resistance or intolerance to imatinib. Long-term data has been reported from the phase 1/2 trial of bosutinib therapy in patients with CP-CML who developed resistance or intolerance to imatinib plus dasatinib and/or nilotinib. A total of 119 patients were included in the 4-year follow-up; 38 were resistant/intolerant to imatinib and resistant to dasatinib, 50 were resistant/intolerant to imatinib and intolerant to dasatinib, 26 were resistant/intolerant to imatinib and resistant to nilotinib, and 5 were resistant/intolerant to imatinib and intolerant to nilotinib or resistant/intolerant to dasatinib and nilotinib. Bosutinib 400 mg daily was studied in this setting. Of the 38 patients with imatinib resistance/intolerance and dasatinib resistance, 39% achieved MCyR, 22% achieved CCyR, and the OS was 67%. Of the 50 patients with imatinib resistance/intolerance and dasatinib intolerance, 42% achieved MCyR, 40% achieved CCyR, and the OS was 80%. Finally, in the 26 patients with imatinib resistance/intolerance and nilotinib resistance, 38% achieved MCyR, 31% achieved CCyR, and the OS was 87%.34
Five-year follow-up from the phase 1/2 clinical trial that studied bosutinib 500 mg daily in CP-CML patients after imatinib failure reported data on 284 patients. By 5 years on study, 60% of patients had achieved MCyR and 50% achieved CCyR with a 71% and 69% probability, respectively, of maintaining these responses at 5 years. The 5-year OS was 84%.35 These data led to the regulatory approval of bosutinib 500 mg daily as second-line or later therapy.
Bosutinib was initially studied in the first-line setting in the randomized phase 3 BELA (Bosutinib Efficacy and Safety in Newly Diagnosed Chronic Myeloid Leukemia) trial. This trial compared bosutinib 500 mg daily to imatinib 400 mg daily in newly diagnosed, previously untreated CP-CML patients. This trial failed to meet its primary endpoint of increased rate of CCyR at 12 months, with 70% of bosutinib patients achieving this response, compared to 68% of imatinib-treated patients (P = 0.601). In spite of this, the rate of MMR at 12 months was significantly higher in the bosutinib arm (41%) compared to the imatinib arm (27%; P = 0.001).36
A second phase 3 trial (BFORE) was designed to study bosutinib 400 mg daily versus imatinib in newly diagnosed, previously untreated CP-CML patients. This study enrolled 536 patients who were randomly assigned 1:1 to bosutinib versus imatinib. The primary endpoint of this trial was rate of MMR at 12 months. A significantly higher number of bosutinib-treated patients achieved this response (47.2%) compared with imatinib-treated patients (36.9%, P = 0.02). Furthermore, by 12 months 77.2% of patients on the bosutinib arm had achieved CCyR compared with 66.4% on the imatinib arm, and this difference did meet statistical significance (P = 0.0075). A lower rate of progression to AP- or BP-CML was noted in bosutinib-treated patients as well (1.6% versus 2.5%). Based on this data, bosutinib gained regulatory approval for first-line therapy in CP-CML at a dose of 400 mg daily.18
Toxicity. On the BFORE trial, the most common treatment-emergent adverse events of any grade reported in the bosutinib-treated patients were diarrhea (70.1%), nausea (35.1%), increased ALT (30.6%), and increased AST (22.8%). Musculoskeletal pain or spasms occurred in 29.5% of patients, rash in 19.8%, fatigue in 19.4%, and headache in 18.7%. Hematologic toxicity was also reported, but most was grade 1/2. Thrombocytopenia was reported in 35.1%, anemia in 18.7%, and neutropenia in 11.2%.18
Cardiovascular events occurred in 5.2% of patients on the bosutinib arm of the BFORE trial, which was similar to the rate observed in imatinib patients. The most common cardiovascular event was QT interval prolongation, which occurred in 1.5% of patients. Pleural effusions were reported in 1.9% of patients treated with bosutinib, and none were grade 3 or higher.18
If liver enzyme elevation occurs at a value greater than 5 times the institutional upper limit of normal, bosutinib should be held until the level recovers to ≤ 2.5 times the upper limit of normal, at which point bosutinib can be restarted at a lower dose. If recovery takes longer than 4 weeks, bosutinib should be permanently discontinued. Liver enzymes elevated greater than 3 times the institutional upper limit of normal and a concurrent elevation in total bilirubin to 2 times the upper limit of normal are consistent with Hy’s law, and bosutinib should be discontinued. Although diarrhea is the most common toxicity associated with bosutinib, it is commonly low grade and transient. Diarrhea occurs most frequently in the first few days after initiating bosutinib. It can often be managed with over-the-counter antidiarrheal medications, but if the diarrhea is grade 3 or higher, bosutinib should be held until recovery to grade 1 or lower. Gastrointestinal side effects may be improved by taking bosutinib with a meal and a large glass of water. Fluid retention can be managed with diuretics and supportive care. Finally, if rash occurs, this can be addressed with topical or systemic steroids as well as bosutinib dose reduction, interruption, or discontinuation.19
Similar to other TKIs, if bosutinib-induced cytopenias occur, treatment should be held and restarted at the same or a lower dose upon blood count recovery.19
Ponatinib
The most common cause of TKI resistance in CP-CML is the development of ABL kinase domain mutations. The majority of imatinib-resistant mutations can be overcome by the use of second-generation TKIs, including dasatinib, nilotinib, or bosutinib. However, ponatinib is the only BCR-ABL TKI able to overcome a T315I mutation. The phase 2 PACE (Ponatinib Ph-positive ALL and CML Evaluation) trial enrolled patients with CP-, AP-, or BP-CML as well as patients with Ph-positive acute lymphoblastic leukemia who were resistant or intolerant to nilotinib or dasatinib, or who had evidence of a T315I mutation. The starting dose of ponatinib on this trial was 45 mg daily.37 The PACE trial enrolled 267 patients with CP-CML: 203 with resistance or intolerance to nilotinib or dasatinib, and 64 with a T315I mutation. The primary endpoint in the CP cohort was rate of MCyR at any time within 12 months of starting ponatinib. The overall rate of MCyR by 12 months in the CP-CML patients was 56%. In those with a T315I mutation, 70% achieved MCyR, which compared favorably with those with resistance or intolerance to nilotinib or dasatinib, 51% of whom achieved MCyR. CCyR was achieved in 46% of CP-CML patients (40% in the resistant/intolerant cohort and 66% in the T315I cohort). In general, patients with T315I mutations received fewer prior therapies than those in the resistant/intolerant cohort, which likely contributed to the higher response rates in the T315I patients. MR4.5 was achieved in 15% of CP-CML patients by 12 months on the PACE trial.37 The 5-year update to this study reported that 60%, 40%, and 24% of CP-CML patients achieved MCyR, MMR, and MR4.5, respectively. In the patients who achieved MCyR, the probability of maintaining this response for 5 years was 82% and the estimated 5-year OS was 73%.19
Toxicity. In 2013, after the regulatory approval of ponatinib, reports became available that the drug can cause an increase in arterial occlusive events, including fatal myocardial infarctions and cerebrovascular accidents. For this reason, dose reductions were implemented in patients who were deriving clinical benefit from ponatinib. In spite of these dose reductions, ≥ 90% of responders maintained their response for up to 40 months.38 Although the likelihood of developing an arterial occlusive event appears higher in the first year after starting ponatinib than in later years, the cumulative incidence of events continues to increase. The 5-year follow-up to the PACE trial reports 31% of patients experiencing any grade of arterial occlusive event while on ponatinib. Aside from these events, the most common treatment-emergent adverse events in ponatinib-treated patients on the PACE trial included rash (47%), abdominal pain (46%), headache (43%), dry skin (42%), constipation (41%), and hypertension (37%). Hematologic toxicity was also common, with 46% of patients experiencing any grade of thrombocytopenia, 20% experiencing neutropenia, and 20% anemia.38
Patients receiving ponatinib therapy should be monitored closely for any evidence of arterial or venous thrombosis. If an occlusive event occurs, ponatinib should be discontinued. Similarly, in the setting of any new or worsening heart failure symptoms, ponatinib should be promptly discontinued. Management of any underlying cardiovascular risk factors, including hypertension, hyperlipidemia, diabetes, or smoking history, is recommended, and these patients should be referred to a cardiologist for a full evaluation. In the absence of any contraindications to aspirin, low-dose aspirin should be considered as a means of decreasing cardiovascular risks associated with ponatinib. In patients with known risk factors, a ponatinib starting dose of 30 mg daily rather than the standard 45 mg daily may be a safer option, resulting in fewer arterial occlusive events, although the efficacy of this dose is still being studied in comparison to 45 mg daily.19
If ponatinib-induced transaminitis greater than 3 times the upper limit of normal occurs, ponatinib should be held until resolution to less than 3 times the upper limit of normal, at which point it should be resumed at a lower dose. Similarly, in the setting of elevated serum lipase or symptomatic pancreatitis, ponatinib should be held and restarted at a lower dose after resolution of symptoms.19
In the event of neutropenia or thrombocytopenia, ponatinib should be held until blood count recovery and then restarted at the same dose. If cytopenias occur for a second time, the dose of ponatinib should be lowered at the time of treatment reinitiation. If rash occurs, it can be addressed with topical or systemic steroids as well as dose reduction, interruption, or discontinuation.19
Conclusion
With the development of imatinib and the subsequent TKIs, dasatinib, nilotinib, bosutinib, and ponatinib, CP-CML has become a chronic disease with a life expectancy that is similar to that of the general population. Given the successful treatments available for these patients, it is crucial to identify patients with this diagnosis, ensure they receive a complete, appropriate diagnostic workup including a bone marrow biopsy and aspiration with cytogenetic testing, and select the best therapy for each individual patient. Once on treatment, the importance of frequent monitoring cannot be overstated. This is the only way to be certain patients are achieving the desired treatment milestones that correlate with the favorable long-term outcomes that have been observed with TKI-based treatment of CP-CML.
Corresponding author: Kendra Sweet, MD, MS, Department of Malignant Hematology, Moffitt Cancer Center, Tampa, FL.
Financial disclosures: Dr. Sweet has served on the Advisory Board and Speakers Bureau of Novartis, Bristol-Meyers Squibb, Ariad Pharmaceuticals, and Pfizer, and has served as a consultant to Pfizer.
From the Moffitt Cancer Center, Tampa, FL.
Abstract
- Objective: To outline the approach to selecting a tyrosine kinase inhibitor (TKI) for initial treatment of chronic myeloid leukemia (CML) and monitoring patients following initiation of therapy.
- Methods: Review of the literature and evidence-based guidelines.
- Results: The development and availability of TKIs has improved survival for patients diagnosed with CML. The life expectancy of patients diagnosed with chronic-phase CML (CP-CML) is similar to that of the general population, provided they receive appropriate TKI therapy and adhere to treatment. Selection of the most appropriate first-line TKI for newly diagnosed CP-CML requires incorporation of the patient’s baseline karyotype and Sokal or EURO risk score, and a clear understanding of the patient’s comorbidities. The adverse effect profile of all TKIs must be considered in conjunction with the patient’s ongoing medical issues to decrease the likelihood of worsening their current symptoms or causing a severe complication from TKI therapy. After confirming a diagnosis of CML and selecting the most appropriate TKI for first-line therapy, close monitoring and follow-up are necessary to ensure patients are meeting the desired treatment milestones. Responses in CML can be assessed based on hematologic parameters, cytogenetic results, and molecular responses.
- Conclusion: Given the successful treatments available for patients with CML, it is crucial to identify patients with this diagnosis; ensure they receive a complete, appropriate diagnostic workup including a bone marrow biopsy and aspiration with cytogenetic testing; and select the best therapy for each individual patient.
Keywords: chronic myeloid leukemia; CML; tyrosine kinase inhibitor; TKI; cancer; BCR-ABL protein.
Chronic myeloid leukemia (CML) is a rare myeloproliferative neoplasm that is characterized by the presence of the Philadelphia (Ph) chromosome and uninhibited expansion of bone marrow stem cells. The Ph chromosome arises from a reciprocal translocation between the Abelson (ABL) region on chromosome 9 and the breakpoint cluster region (BCR) of chromosome 22 (t(9;22)(q34;q11.2)), resulting in the BCR-ABL1 fusion gene and its protein product, BCR-ABL tyrosine kinase.1 BCR-ABL has constitutive tyrosine kinase activity that promotes growth, replication, and survival of hematopoietic cells through downstream pathways, which is the driving factor in the pathogenesis of CML.1
CML is divided into 3 phases based on the number of myeloblasts observed in the blood or bone marrow: chronic, accelerated, and blast. Most cases of CML are diagnosed in the chronic phase (CP), which is marked by proliferation of primarily the myeloid element.
Typical treatment for CML involves lifelong use of oral BCR-ABL tyrosine kinase inhibitors (TKIs). Currently, 5 TKIs have regulatory approval for treatment of this disease. The advent of TKIs, a class of small molecules targeting the tyrosine kinases, particularly the BCR-ABL tyrosine kinase, led to rapid changes in the management of CML and improved survival for patients. Patients diagnosed with chronic-phase CML (CP-CML) now have a life expectancy that is similar to that of the general population, as long as they receive appropriate TKI therapy and adhere to treatment. As such, it is crucial to identify patients with CML; ensure they receive a complete, appropriate diagnostic workup; and select the best therapy for each patient.
Epidemiology
According to SEER data estimates, 8430 new cases of CML were diagnosed in the United States in 2018. CML is a disease of older adults, with a median age of 65 years at diagnosis, and there is a slight male predominance. Between 2011 and 2015, the number of new CML cases was 1.8 per 100,000 persons. The median overall survival (OS) in patients with newly diagnosed CP-CML has not been reached.2 Given the effective treatments available for managing CML, it is estimated that the prevalence of CML in the United States will plateau at 180,000 patients by 2050.3
Diagnosis
Clinical Features
The diagnosis of CML is often suspected based on an incidental finding of leukocytosis and, in some cases, thrombocytosis. In many cases, this is an incidental finding on routine blood work, but approximately 50% of patients will present with constitutional symptoms associated with the disease. Characteristic features of the white blood cell differential include left-shifted maturation with neutrophilia and immature circulating myeloid cells. Basophilia and eosinophilia are often present as well. Splenomegaly is a common sign, present in 50% to 90% of patients at diagnosis. In those patients with symptoms related to CML at diagnosis, the most common presentation includes increasing fatigue, fevers, night sweats, early satiety, and weight loss. The diagnosis is confirmed by cytogenetic studies showing the Ph chromosome abnormality, t(9; 22)(q3.4;q1.1), and/or reverse transcriptase polymerase chain reaction (PCR) showing BCR-ABL1 transcripts.
Testing
Bone marrow biopsy. There are 3 distinct phases of CML: CP, accelerated phase (AP), and blast phase (BP). Bone marrow biopsy and aspiration at diagnosis are mandatory in order to determine the phase of the disease at diagnosis. This distinction is based on the percentage of blasts, promyelocytes, and basophils present as well as the platelet count and presence or absence of extramedullary disease.4 The vast majority of patients at diagnosis have CML that is in the chronic phase. The typical appearance in CP-CML is a hypercellular marrow with granulocytic and occasionally megakaryocytic hyperplasia. In many cases, basophilia and/or eosinophilia are noted as well. Dysplasia is not a typical finding in CML.5 Bone marrow fibrosis can be seen in up to one-third of patients at diagnosis, and may indicate a slightly worse prognosis.6 Although a diagnosis of CML can be made without a bone marrow biopsy, complete staging and prognostication are only possible with information gained from this test, including baseline karyotype and confirmation of CP versus a more advanced phase of CML.
Diagnostic criteria. The criteria for diagnosing AP-CML has not been agreed upon by various groups, but the modified MD Anderson Cancer Center (MDACC) criteria are used in the majority of clinical trials evaluating the efficacy of TKIs in preventing progression to advanced phases of CML. MDACC criteria define AP-CML as the presence of 1 of the following: 15% to 29% blasts in the peripheral blood or bone marrow, ≥ 30% peripheral blasts plus promyelocytes, ≥ 20% basophils in the blood or bone marrow, platelet count ≤ 100,000/μL unrelated to therapy, and clonal cytogenetic evolution in Ph-positive metaphases (Table).7
BP-CML is typically defined using the criteria developed by the International Bone Marrow Transplant Registry (IBMTR): ≥ 30% blasts in the peripheral blood and/or the bone marrow or the presence of extramedullary disease.8 Although not typically used in clinical trials, the revised World Health Organization (WHO) criteria for BP-CML include ≥ 20% blasts in the peripheral blood or bone marrow, extramedullary blast proliferation, and large foci or clusters of blasts in the bone marrow biopsy sample (Table).9
The defining feature of CML is the presence of the Ph chromosome abnormality. In a small subset of patients, additional chromosome abnormalities (ACA) in the Ph-positive cells may be identified at diagnosis. Some reports indicate that the presence of “major route” ACA (trisomy 8, isochromosome 17q, a second Ph chromosome, or trisomy 19) at diagnosis may negatively impact prognosis, but other reports contradict these findings.10,11
PCR assay. The typical BCR breakpoint in CML is the major breakpoint cluster region (M-BCR), which results in a 210-kDa protein (p210). Alternate breakpoints that are less frequently identified are the minor BCR (mBCR or p190), which is more commonly found in Ph-positive acute lymphoblastic leukemia (ALL), and the micro BCR (µBCR or p230), which is much less common and is often characterized by chronic neutrophilia.12 Identifying which BCR-ABL1 transcript is present in each patient using qualitative PCR is crucial in order to ensure proper monitoring during treatment.
The most sensitive method for detecting BCR-ABL1 mRNA transcripts is the quantitative real-time PCR (RQ-PCR) assay, which is typically done on peripheral blood. RQ-PCR is capable of detecting a single CML cell in the presence of ≥ 100,000 normal cells. This test should be done during the initial diagnostic workup in order to confirm the presence of BCR-ABL1 transcripts, and it is used as a standard method for monitoring response to TKI therapy.13 The International Scale (IS) is a standardized approach to reporting RQ-PCR results that was developed to allow comparison of results across various laboratories and has become the gold standard for reporting BCR-ABL1 transcript values.14
Determining Risk Scores
Calculating a patient’s Sokal score or EURO risk score at diagnosis remains an important component of the diagnostic workup in CP-CML, as this information has prognostic and therapeutic implications (an online calculator is available through European LeukemiaNet [ELN]). The risk for disease progression to the accelerated or blast phases is higher in patients with intermediate or high risk scores compared to those with a low risk score at diagnosis. The risk of progression in intermediate- or high-risk patients is lower when a second-generation TKI (dasatinib, nilotinib, or bosutinib) is used as frontline therapy compared to imatinib, and therefore, the National Comprehensive Cancer Network (NCCN) CML Panel recommends starting with a second-generation TKI in these patients.15-19
Monitoring Response to Therapy
After confirming a diagnosis of CML and selecting the most appropriate TKI for first-line therapy, the successful management of CML patients relies on close monitoring and follow-up to ensure they are meeting the desired treatment milestones. Responses in CML can be assessed based on hematologic parameters, cytogenetic results, and molecular responses. A complete hematologic response (CHR) implies complete normalization of peripheral blood counts (with the exception of TKI-induced cytopenias) and resolution of any palpable splenomegaly. The majority of patients will achieve a CHR within 4 to 6 weeks after initiating CML-directed therapy.20
Cytogenetic Response
Cytogenetic responses are defined by the decrease in the number of Ph chromosome–positive metaphases when assessed on bone marrow cytogenetics. A partial cytogenetic response (PCyR) is defined as having 1% to 35% Ph-positive metaphases, a major cytogenetic response (MCyR) as having 0% to 35% Ph-positive metaphases, and a complete cytogenetic response (CCyR) implies that no Ph-positive metaphases are identified on bone marrow cytogenetics. An ideal response is the achievement of PCyR after 3 months on a TKI and a CCyR after 12 months on a TKI.21
Molecular Response
Once a patient has achieved a CCyR, monitoring their response to therapy can only be done using RQ-PCR to measure BCR-ABL1 transcripts in the peripheral blood. The NCCN and the ELN recommend monitoring RQ-PCR from the peripheral blood every 3 months in order to assess response to TKIs.19,22 As noted, the IS has become the gold standard reporting system for all BCR-ABL1 transcript levels in the majority of laboratories worldwide.14,23 Molecular responses are based on a log reduction in BCR-ABL1 transcripts from a standardized baseline. Many molecular responses can be correlated with cytogenetic responses such that, if reliable RQ-PCR testing is available, monitoring can be done using only peripheral blood RQ-PCR rather than repeat bone marrow biopsies. For example, an early molecular response (EMR) is defined as a RQ-PCR value of ≤ 10% IS, which is approximately equivalent to a PCyR.24 A value of 1% IS is approximately equivalent to a CCyR. A major molecular response (MMR) is a ≥ 3-log reduction in BCR-ABL1 transcripts from baseline and is a value of ≤ 0.1% IS. Deeper levels of molecular response are best described by the log reduction in BCR-ABL1 transcripts, with a 4-log reduction denoted as MR4.0, a 4.5-log reduction as MR4.5, and so forth. Complete molecular response (CMR) is defined by the level of sensitivity of the RQ-PCR assay being used.14
The definition of relapsed disease in CML is dependent on the type of response the patient had previously achieved. Relapse could be the loss of a hematologic or cytogenetic response, but fluctuations in BCR-ABL1 transcripts on routine RQ-PCR do not necessarily indicate relapsed CML. A 1-log increase in the level of BCR-ABL1 transcripts with a concurrent loss of MMR should prompt a bone marrow biopsy in order to assess for the loss of CCyR, and thus a cytogenetic relapse; however, this loss of MMR does not define relapse in and of itself. In the setting of relapsed disease, testing should be done to look for possible ABL kinase domain mutations, and alternate therapy should be selected.19
Multiple reports have identified the prognostic relevance of achieving an EMR at 3 and 6 months after starting TKI therapy. Marin and colleagues reported that in 282 imatinib-treated patients, there was a significant improvement in 8-year OS, progression-free survival (PFS), and cumulative incidence of CCyR and CMR in patients who had BCR-ABL1 transcripts < 9.84% IS after 3 months on treatment.24 This data highlights the importance of early molecular monitoring in order to ensure the best outcomes for patients with CP-CML.
The NCCN CML guidelines and ELN recommendations both agree that an ideal response after 3 months on a TKI is BCR-ABL1 transcripts < 10% IS, but treatment is not considered to be failing at this point if the patient marginally misses this milestone. After 6 months on treatment, an ideal response is considered BCR-ABL1 transcripts < 1%–10% IS. Ideally, patients will have BCR-ABL1 transcripts < 0.1%–1% IS by the time they complete 12 months of TKI therapy, suggesting that these patients have at least achieved a CCyR.19,22 Even after patients achieve these early milestones, frequent monitoring by RQ-PCR is required to ensure that they are maintaining their response to treatment. This will help to ensure patient compliance with treatment and will also help to identify a select subset of patients who could potentially be considered for an attempt at TKI cessation (not discussed in detail here) after a minimum of 3 years on therapy.19,25
Selecting First-line TKI Therapy
Selection of the most appropriate first-line TKI for newly diagnosed CP-CML patients requires incorporation of many patient-specific factors. These factors include baseline karyotype and confirmation of CP-CML through bone marrow biopsy, Sokal or EURO risk score, and a thorough patient history, including a clear understanding of the patient’s comorbidities. The adverse effect profile of all TKIs must be considered in conjunction with the patient’s ongoing medical issues in order to decrease the likelihood of worsening their current symptoms or causing a severe complication from TKI therapy.
Imatinib
The management of CML was revolutionized by the development and ultimate regulatory approval of imatinib mesylate in 2001. Imatinib was the first small-molecule cancer therapy developed and approved. It acts by binding to the adenosine triphosphate (ATP) binding site in the catalytic domain of BCR-ABL, thus inhibiting the oncoprotein’s tyrosine kinase activity.26
The International Randomized Study of Interferon versus STI571 (IRIS) trial was a randomized phase 3 study that compared imatinib 400 mg daily to interferon alfa (IFNa) plus cytarabine. More than 1000 CP-CML patients were randomly assigned 1:1 to either imatinib or IFNa plus cytarabine and were assessed for event-free survival, hematologic and cytogenetic responses, freedom from progression to AP or BP, and toxicity. Imatinib was superior to the prior standard of care for all these outcomes.21 The long-term follow-up of the IRIS trial reported an 83% estimated 10-year OS and 79% estimated event-free survival for patients on the imatinib arm of this study.15 The cumulative rate of CCyR was 82.8%. Of the 204 imatinib-treated patients who could undergo a molecular response evaluation at 10 years, 93.1% had a MMR and 63.2% had a MR4.5, suggesting durable, deep molecular responses for many patients. The estimated 10-year rate of freedom from progression to AP or BP was 92.1%.
Higher doses of imatinib (600-800 mg daily) have been studied in an attempt to overcome resistance and improve cytogenetic and molecular response rates. The Tyrosine Kinase Inhibitor Optimization and Selectivity (TOPS) trial was a randomized phase 3 study that compared imatinib 800 mg daily to imatinib 400 mg daily. Although the 6-month assessments found increased rates of CCyR and a MMR in the higher-dose imatinib arm, these differences were no longer present at the 12-month assessment. Furthermore, the higher dose of imatinib led to a significantly higher incidence of grade 3/4 hematologic adverse events, and approximately 50% of patients on imatinib 800 mg daily required a dose reduction to less than 600 mg daily because of toxicity.27
The Therapeutic Intensification in De Novo Leukaemia (TIDEL)-II study used plasma trough levels of imatinib on day 22 of treatment with imatinib 600 mg daily to determine if patients should escalate the imatinib dose to 800 mg daily. In patients who did not meet molecular milestones at 3, 6, or 12 months, cohort 1 was dose escalated to imatinib 800 mg daily and subsequently switched to nilotinib 400 mg twice daily for failing the same target 3 months later, and cohort 2 was switched to nilotinib. At 2 years, 73% of patients achieved MMR and 34% achieved MR4.5, suggesting that initial treatment with higher-dose imatinib, followed by a switch to nilotinib in those failing to achieve desired milestones, could be an effective strategy for managing newly diagnosed CP-CML.28
Toxicity. The standard starting dose of imatinib in CP-CML patients is 400 mg. The safety profile of imatinib has been very well established. In the IRIS trial, the most common adverse events (all grades in decreasing order of frequency) were peripheral and periorbital edema (60%), nausea (50%), muscle cramps (49%), musculoskeletal pain (47%), diarrhea (45%), rash (40%), fatigue (39%), abdominal pain (37%), headache (37%), and joint pain (31%). Grade 3/4 liver enzyme elevation can occur in 5% of patients.29 In the event of severe liver toxicity or fluid retention, imatinib should be held until the event resolves. At that time, imatinib can be restarted if deemed appropriate, but this is dependent on the severity of the inciting event. Fluid retention can be managed by the use of supportive care, diuretics, imatinib dose reduction, dose interruption, or imatinib discontinuation if the fluid retention is severe. Muscle cramps can be managed by the use of calcium supplements or tonic water. Management of rash can include topical or systemic steroids, or in some cases imatinib dose reduction, interruption, or discontinuation.19
Grade 3/4 imatinib-induced hematologic toxicity is not uncommon, with 17% of patients experiencing neutropenia, 9% thrombocytopenia, and 4% anemia. These adverse events occurred most commonly during the first year of therapy, and the frequency decreased over time.15,29 Depending on the degree of cytopenias, imatinib dosing should be interrupted until recovery of the absolute neutrophil count or platelet count, and can often be resumed at 400 mg daily. However, if cytopenias recur, imatinib should be held and subsequently restarted at 300 mg daily.19
Dasatinib
Dasatinib is a second-generation TKI that has regulatory approval for treatment of adult patients with newly diagnosed CP-CML or CP-CML in patients with resistance or intolerance to prior TKIs. In addition to dasatinib’s ability to inhibit ABL kinases, it is also known to be a potent inhibitor of Src family kinases. Dasatinib has shown efficacy in patients who have developed imatinib-resistant ABL kinase domain mutations.
Dasatinib was initially approved as second-line therapy in patients with resistance or intolerance to imatinib. This indication was based on the results of the phase 3 CA180-034 trial, which ultimately identified dasatinib 100 mg daily as the optimal dose. In this trial, 74% of patients enrolled had resistance to imatinib and the remainder were intolerant. The 7-year follow-up of patients randomized to dasatinib 100 mg (n = 167) daily indicated that 46% achieved MMR while on study. Of the 124 imatinib-resistant patients on dasatinib 100 mg daily, the 7-year PFS was 39% and OS was 63%. In the 43 imatinib-intolerant patients, the 7-year PFS was 51% and OS was 70%.30
Dasatinib 100 mg daily was compared to imatinib 400 mg daily in newly diagnosed CP-CML patients in the randomized phase 3 DASISION (Dasatinib versus Imatinib Study in Treatment-Naive CML Patients) trial. More patients on the dasatinib arm achieved an EMR of BCR-ABL1 transcripts ≤ 10% IS after 3 months on treatment compared to imatinib (84% versus 64%). Furthermore, the 5-year follow-up reports that the cumulative incidence of MMR and MR4.5 in dasatinib-treated patients was 76% and 42%, and was 64% and 33% with imatinib (P = 0.0022 and P = 0.0251, respectively). Fewer patients treated with dasatinib progressed to AP or BP (4.6%) compared to imatinib (7.3%), but the estimated 5-year OS was similar between the 2 arms (91% for dasatinib versus 90% for imatinib).16 Regulatory approval for dasatinib as first-line therapy in newly diagnosed CML patients was based on results of the DASISION trial.
Toxicity. Most dasatinib-related toxicities are reported as grade 1 or grade 2, but grade 3/4 hematologic adverse events are fairly common. In the DASISION trial, grade 3/4 neutropenia, anemia, and thrombocytopenia occurred in 29%, 13%, and 22% of dasatinib-treated patients, respectively. Cytopenias can generally be managed with temporary dose interruptions or dose reductions.
During the 5-year follow-up of the DASISION trial, pleural effusions were reported in 28% of patients, most of which were grade 1/2. This occurred at a rate of approximately ≤ 8% per year, suggesting a stable incidence over time, and the effusions appear to be dose-dependent.16 Depending on the severity, pleural effusion may be treated with diuretics, dose interruption, and, in some instances, steroids or a thoracentesis. Typically, dasatinib can be restarted at 1 dose level lower than the previous dose once the effusion has resolved.19 Other, less common side effects of dasatinib include pulmonary hypertension (5% of patients), as well as abdominal pain, fluid retention, headaches, fatigue, musculoskeletal pain, rash, nausea, and diarrhea. Pulmonary hypertension is typically reversible after cessation of dasatinib, and thus dasatinib should be permanently discontinued once the diagnosis is confirmed. Fluid retention is often treated with diuretics and supportive care. Nausea and diarrhea are generally manageable and occur less frequently when dasatinib is taken with food and a large glass of water. Antiemetics and antidiarrheals can be used as needed. Troublesome rash can be best managed with topical or systemic steroids as well as possible dose reduction or dose interruption.16,19 In the DASISION trial, adverse events led to therapy discontinuation more often in the dasatinib group than in the imatinib group (16% versus 7%).16 Bleeding, particularly in the setting of thrombocytopenia, has been reported in patients being treated with dasatinib as a result of the drug-induced reversible inhibition of platelet aggregation.31
Nilotinib
The structure of nilotinib is similar to that of imatinib; however, it has a markedly increased affinity for the ATP‐binding site on the BCR-ABL1 protein. It was initially given regulatory approval in the setting of imatinib failure. Nilotinib was studied at a dose of 400 mg twice daily in 321 patients who were imatinib-resistant or -intolerant. It proved to be highly effective at inducing cytogenetic remissions in the second-line setting, with 59% of patients achieving a MCyR and 45% achieving a CCyR. With a median follow-up time of 4 years, the OS was 78%.32
Nilotinib gained regulatory approval for use as a first-line TKI after completion of the randomized phase 3 ENESTnd (Evaluating Nilotinib Efficacy and Safety in Clinical Trials-Newly Diagnosed Patients) trial. ENESTnd was a 3-arm study comparing nilotinib 300 mg twice daily versus nilotinib 400 mg twice daily versus imatinib 400 mg daily in newly diagnosed, previously untreated patients diagnosed with CP-CML. The primary endpoint of this clinical trial was rate of MMR at 12 months.33 Nilotinib surpassed imatinib in this regard, with 44% of patients on nilotinib 300 mg twice daily achieving MMR at 12 months versus 43% of nilotinib 400 mg twice daily patients versus 22% of the imatinib-treated patients (P < 0.001 for both comparisons). Furthermore, the rate of CCyR by 12 months was significantly higher for both nilotinib arms compared with imatinib (80% for nilotinib 300 mg, 78% for nilotinib 400 mg, and 65% for imatinib) (P < 0.001).12 Based on this data, nilotinib 300 mg twice daily was chosen as the standard dose of nilotinib in the first-line setting. After 5 years of follow-up on the ENESTnd study, there were fewer progressions to AP/BP CML in nilotinib-treated patients compared with imatinib. MMR was achieved in 77% of nilotinib 300 mg patients compared with 60.4% of patients on the imatinib arm. MR4.5 was also more common in patients treated with nilotinib 300 mg twice daily, with a rate of 53.5% at 5 years versus 31.4% in the imatinib arm.17 In spite of the deeper cytogenetic and molecular responses achieved with nilotinib, this did not translate into a significant improvement in OS. The 5-year OS rate was 93.7% in nilotinib 300 mg patients versus 91.7% in imatinib-treated patients, and this difference lacked statistical significance.17
Toxicity. Although some similarities exist between the toxicity profiles of nilotinib and imatinib, each drug has some distinct adverse events. On the ENESTnd trial, the rate of any grade 3/4 non-hematologic adverse event was fairly low; however, lower-grade toxicities were not uncommon. Patients treated with nilotinib 300 mg twice daily experienced rash (31%), headache (14%), pruritis (15%), and fatigue (11%) most commonly. The most frequently reported laboratory abnormalities included increased total bilirubin (53%), hypophosphatemia (32%), hyperglycemia (36%), elevated lipase (24%), increased alanine aminotransferase (ALT; 66%), and increased aspartate aminotransferase (AST; 40%). Any grade of neutropenia, thrombocytopenia, or anemia occurred at rates of 43%, 48%, and 38%, respectively.33 Although nilotinib has a Black Box Warning from the US Food and Drug Administration for QT interval prolongation, no patients on the ENESTnd trial experienced a QT interval corrected for heart rate greater than 500 msec.12
More recent concerns have emerged regarding the potential for cardiovascular toxicity after long-term use of nilotinib. The 5-year update of ENESTnd reports cardiovascular events, including ischemic heart disease, ischemic cerebrovascular events, or peripheral arterial disease occurring in 7.5% of patients treated with nilotinib 300 mg twice daily, as compared with a rate of 2.1% in imatinib-treated patients. The frequency of these cardiovascular events increased linearly over time in both arms. Elevations in total cholesterol from baseline occurred in 27.6% of nilotinib patients compared with 3.9% of imatinib patients. Furthermore, clinically meaningful increases in low-density lipoprotein cholesterol and glycated hemoglobin occurred more frequently with nilotinib therapy.33
Nilotinib should be taken on an empty stomach; therefore, patients should be made aware of the need to fast for 2 hours prior to each dose and 1 hour after each dose. Given the potential risk of QT interval prolongation, a baseline electrocardiogram (ECG) is recommended prior to initiating treatment to ensure the QT interval is within a normal range. A repeat ECG should be done approximately 7 days after nilotinib initiation to ensure no prolongation of the QT interval after starting. Close monitoring of potassium and magnesium levels is important to decrease the risk of cardiac arrhythmias, and concomitant use of drugs considered strong CYP3A4 inhibitors should be avoided.19
If the patient experiences any grade 3 or higher laboratory abnormalities, nilotinib should be held until resolution of the toxicity, and then restarted at a lower dose. Similarly, if patients develop significant neutropenia or thrombocytopenia, nilotinib doses should be interrupted until resolution of the cytopenias. At that point, nilotinib can be reinitiated at either the same or a lower dose. Rash can be managed by the use of topical or systemic steroids as well as potential dose reduction, interruption, or discontinuation.
Given the concerns for potential cardiovascular events with long-term use of nilotinib, caution is advised when prescribing it to any patient with a history of cardiovascular disease or peripheral arterial occlusive disease. At the first sign of new occlusive disease, nilotinib should be discontinued.19
Bosutinib
Bosutinib is a second-generation BCR-ABL TKI with activity against the Src family of kinases; it was initially approved to treat patients with CP-, AP-, or BP-CML after resistance or intolerance to imatinib. Long-term data has been reported from the phase 1/2 trial of bosutinib therapy in patients with CP-CML who developed resistance or intolerance to imatinib plus dasatinib and/or nilotinib. A total of 119 patients were included in the 4-year follow-up; 38 were resistant/intolerant to imatinib and resistant to dasatinib, 50 were resistant/intolerant to imatinib and intolerant to dasatinib, 26 were resistant/intolerant to imatinib and resistant to nilotinib, and 5 were resistant/intolerant to imatinib and intolerant to nilotinib or resistant/intolerant to dasatinib and nilotinib. Bosutinib 400 mg daily was studied in this setting. Of the 38 patients with imatinib resistance/intolerance and dasatinib resistance, 39% achieved MCyR, 22% achieved CCyR, and the OS was 67%. Of the 50 patients with imatinib resistance/intolerance and dasatinib intolerance, 42% achieved MCyR, 40% achieved CCyR, and the OS was 80%. Finally, in the 26 patients with imatinib resistance/intolerance and nilotinib resistance, 38% achieved MCyR, 31% achieved CCyR, and the OS was 87%.34
Five-year follow-up from the phase 1/2 clinical trial that studied bosutinib 500 mg daily in CP-CML patients after imatinib failure reported data on 284 patients. By 5 years on study, 60% of patients had achieved MCyR and 50% achieved CCyR with a 71% and 69% probability, respectively, of maintaining these responses at 5 years. The 5-year OS was 84%.35 These data led to the regulatory approval of bosutinib 500 mg daily as second-line or later therapy.
Bosutinib was initially studied in the first-line setting in the randomized phase 3 BELA (Bosutinib Efficacy and Safety in Newly Diagnosed Chronic Myeloid Leukemia) trial. This trial compared bosutinib 500 mg daily to imatinib 400 mg daily in newly diagnosed, previously untreated CP-CML patients. This trial failed to meet its primary endpoint of increased rate of CCyR at 12 months, with 70% of bosutinib patients achieving this response, compared to 68% of imatinib-treated patients (P = 0.601). In spite of this, the rate of MMR at 12 months was significantly higher in the bosutinib arm (41%) compared to the imatinib arm (27%; P = 0.001).36
A second phase 3 trial (BFORE) was designed to study bosutinib 400 mg daily versus imatinib in newly diagnosed, previously untreated CP-CML patients. This study enrolled 536 patients who were randomly assigned 1:1 to bosutinib versus imatinib. The primary endpoint of this trial was rate of MMR at 12 months. A significantly higher number of bosutinib-treated patients achieved this response (47.2%) compared with imatinib-treated patients (36.9%, P = 0.02). Furthermore, by 12 months 77.2% of patients on the bosutinib arm had achieved CCyR compared with 66.4% on the imatinib arm, and this difference did meet statistical significance (P = 0.0075). A lower rate of progression to AP- or BP-CML was noted in bosutinib-treated patients as well (1.6% versus 2.5%). Based on this data, bosutinib gained regulatory approval for first-line therapy in CP-CML at a dose of 400 mg daily.18
Toxicity. On the BFORE trial, the most common treatment-emergent adverse events of any grade reported in the bosutinib-treated patients were diarrhea (70.1%), nausea (35.1%), increased ALT (30.6%), and increased AST (22.8%). Musculoskeletal pain or spasms occurred in 29.5% of patients, rash in 19.8%, fatigue in 19.4%, and headache in 18.7%. Hematologic toxicity was also reported, but most was grade 1/2. Thrombocytopenia was reported in 35.1%, anemia in 18.7%, and neutropenia in 11.2%.18
Cardiovascular events occurred in 5.2% of patients on the bosutinib arm of the BFORE trial, which was similar to the rate observed in imatinib patients. The most common cardiovascular event was QT interval prolongation, which occurred in 1.5% of patients. Pleural effusions were reported in 1.9% of patients treated with bosutinib, and none were grade 3 or higher.18
If liver enzyme elevation occurs at a value greater than 5 times the institutional upper limit of normal, bosutinib should be held until the level recovers to ≤ 2.5 times the upper limit of normal, at which point bosutinib can be restarted at a lower dose. If recovery takes longer than 4 weeks, bosutinib should be permanently discontinued. Liver enzymes elevated greater than 3 times the institutional upper limit of normal and a concurrent elevation in total bilirubin to 2 times the upper limit of normal are consistent with Hy’s law, and bosutinib should be discontinued. Although diarrhea is the most common toxicity associated with bosutinib, it is commonly low grade and transient. Diarrhea occurs most frequently in the first few days after initiating bosutinib. It can often be managed with over-the-counter antidiarrheal medications, but if the diarrhea is grade 3 or higher, bosutinib should be held until recovery to grade 1 or lower. Gastrointestinal side effects may be improved by taking bosutinib with a meal and a large glass of water. Fluid retention can be managed with diuretics and supportive care. Finally, if rash occurs, this can be addressed with topical or systemic steroids as well as bosutinib dose reduction, interruption, or discontinuation.19
Similar to other TKIs, if bosutinib-induced cytopenias occur, treatment should be held and restarted at the same or a lower dose upon blood count recovery.19
Ponatinib
The most common cause of TKI resistance in CP-CML is the development of ABL kinase domain mutations. The majority of imatinib-resistant mutations can be overcome by the use of second-generation TKIs, including dasatinib, nilotinib, or bosutinib. However, ponatinib is the only BCR-ABL TKI able to overcome a T315I mutation. The phase 2 PACE (Ponatinib Ph-positive ALL and CML Evaluation) trial enrolled patients with CP-, AP-, or BP-CML as well as patients with Ph-positive acute lymphoblastic leukemia who were resistant or intolerant to nilotinib or dasatinib, or who had evidence of a T315I mutation. The starting dose of ponatinib on this trial was 45 mg daily.37 The PACE trial enrolled 267 patients with CP-CML: 203 with resistance or intolerance to nilotinib or dasatinib, and 64 with a T315I mutation. The primary endpoint in the CP cohort was rate of MCyR at any time within 12 months of starting ponatinib. The overall rate of MCyR by 12 months in the CP-CML patients was 56%. In those with a T315I mutation, 70% achieved MCyR, which compared favorably with those with resistance or intolerance to nilotinib or dasatinib, 51% of whom achieved MCyR. CCyR was achieved in 46% of CP-CML patients (40% in the resistant/intolerant cohort and 66% in the T315I cohort). In general, patients with T315I mutations received fewer prior therapies than those in the resistant/intolerant cohort, which likely contributed to the higher response rates in the T315I patients. MR4.5 was achieved in 15% of CP-CML patients by 12 months on the PACE trial.37 The 5-year update to this study reported that 60%, 40%, and 24% of CP-CML patients achieved MCyR, MMR, and MR4.5, respectively. In the patients who achieved MCyR, the probability of maintaining this response for 5 years was 82% and the estimated 5-year OS was 73%.19
Toxicity. In 2013, after the regulatory approval of ponatinib, reports became available that the drug can cause an increase in arterial occlusive events, including fatal myocardial infarctions and cerebrovascular accidents. For this reason, dose reductions were implemented in patients who were deriving clinical benefit from ponatinib. In spite of these dose reductions, ≥ 90% of responders maintained their response for up to 40 months.38 Although the likelihood of developing an arterial occlusive event appears higher in the first year after starting ponatinib than in later years, the cumulative incidence of events continues to increase. The 5-year follow-up to the PACE trial reports 31% of patients experiencing any grade of arterial occlusive event while on ponatinib. Aside from these events, the most common treatment-emergent adverse events in ponatinib-treated patients on the PACE trial included rash (47%), abdominal pain (46%), headache (43%), dry skin (42%), constipation (41%), and hypertension (37%). Hematologic toxicity was also common, with 46% of patients experiencing any grade of thrombocytopenia, 20% experiencing neutropenia, and 20% anemia.38
Patients receiving ponatinib therapy should be monitored closely for any evidence of arterial or venous thrombosis. If an occlusive event occurs, ponatinib should be discontinued. Similarly, in the setting of any new or worsening heart failure symptoms, ponatinib should be promptly discontinued. Management of any underlying cardiovascular risk factors, including hypertension, hyperlipidemia, diabetes, or smoking history, is recommended, and these patients should be referred to a cardiologist for a full evaluation. In the absence of any contraindications to aspirin, low-dose aspirin should be considered as a means of decreasing cardiovascular risks associated with ponatinib. In patients with known risk factors, a ponatinib starting dose of 30 mg daily rather than the standard 45 mg daily may be a safer option, resulting in fewer arterial occlusive events, although the efficacy of this dose is still being studied in comparison to 45 mg daily.19
If ponatinib-induced transaminitis greater than 3 times the upper limit of normal occurs, ponatinib should be held until resolution to less than 3 times the upper limit of normal, at which point it should be resumed at a lower dose. Similarly, in the setting of elevated serum lipase or symptomatic pancreatitis, ponatinib should be held and restarted at a lower dose after resolution of symptoms.19
In the event of neutropenia or thrombocytopenia, ponatinib should be held until blood count recovery and then restarted at the same dose. If cytopenias occur for a second time, the dose of ponatinib should be lowered at the time of treatment reinitiation. If rash occurs, it can be addressed with topical or systemic steroids as well as dose reduction, interruption, or discontinuation.19
Conclusion
With the development of imatinib and the subsequent TKIs, dasatinib, nilotinib, bosutinib, and ponatinib, CP-CML has become a chronic disease with a life expectancy that is similar to that of the general population. Given the successful treatments available for these patients, it is crucial to identify patients with this diagnosis, ensure they receive a complete, appropriate diagnostic workup including a bone marrow biopsy and aspiration with cytogenetic testing, and select the best therapy for each individual patient. Once on treatment, the importance of frequent monitoring cannot be overstated. This is the only way to be certain patients are achieving the desired treatment milestones that correlate with the favorable long-term outcomes that have been observed with TKI-based treatment of CP-CML.
Corresponding author: Kendra Sweet, MD, MS, Department of Malignant Hematology, Moffitt Cancer Center, Tampa, FL.
Financial disclosures: Dr. Sweet has served on the Advisory Board and Speakers Bureau of Novartis, Bristol-Meyers Squibb, Ariad Pharmaceuticals, and Pfizer, and has served as a consultant to Pfizer.
1. Faderl S, Talpaz M, Estrov Z, et al. The biology of chronic myeloid leukemia. N Engl J Med. 1999;341:164-172.
2. Surveillance, Epidemiology, and End Results Program. Cancer Stat Facts: Leukemia - Chronic Myeloid Leukemia (CML). 2018.
3. Huang X, Cortes J, Kantarjian H. Estimations of the increasing prevalence and plateau prevalence of chronic myeloid leukemia in the era of tyrosine kinase inhibitor therapy. Cancer. 2012;118:3123-3127.
4. Savage DG, Szydlo RM, Chase A, et al. Bone marrow transplantation for chronic myeloid leukaemia: the effects of differing criteria for defining chronic phase on probabilities of survival and relapse. Br J Haematol. 1997;99:30-35.
5. Knox WF, Bhavnani M, Davson J, Geary CG. Histological classification of chronic granulocytic leukaemia. Clin Lab Haematol. 1984;6:171-175.
6. Kvasnicka HM, Thiele J, Schmitt-Graeff A, et al. Impact of bone marrow morphology on multivariate risk classification in chronic myelogenous leukemia. Acta Haematol. 2003;109:53-56.
7. Cortes JE, Talpaz M, O’Brien S, et al. Staging of chronic myeloid leukemia in the imatinib era: an evaluation of the World Health Organization proposal. Cancer. 2006;106:1306-1315.
8. Druker BJ. Chronic myeloid leukemia. In: DeVita VT, Lawrence TS, Rosenberg SA, eds. DeVita, Hellman, and Rosenberg’s Cancer Principles & Practice of Oncology. 8th ed. Philadelphia, PA: Lippincott, Williams and Wilkins; 2007:2267-2304.
9. Arber DA, Orazi A, Hasserjian R, et al. The 2016 revision to the World Health Organization classification of myeloid neoplasms and acute leukemia. Blood. 2016;127:2391-2405.
10. Fabarius A, Leitner A, Hochhaus A, et al. Impact of additional cytogenetic aberrations at diagnosis on prognosis of CML: long-term observation of 1151 patients from the randomized CML Study IV. Blood. 2011;118:6760-6768.
11. Alhuraiji A, Kantarjian H, Boddu P, et al. Prognostic significance of additional chromosomal abnormalities at the time of diagnosis in patients with chronic myeloid leukemia treated with frontline tyrosine kinase inhibitors. Am J Hematol. 2018;93:84-90.
12. Melo JV. BCR-ABL gene variants. Baillieres Clin Haematol. 1997;10:203-222.
13. Kantarjian HM, Talpaz M, Cortes J, et al. Quantitative polymerase chain reaction monitoring of BCR-ABL during therapy with imatinib mesylate (STI571; gleevec) in chronic-phase chronic myelogenous leukemia. Clin Cancer Res. 2003;9:160-166.
14. Hughes T, Deininger M, Hochhaus A, et al. Monitoring CML patients responding to treatment with tyrosine kinase inhibitors: review and recommendations for harmonizing current methodology for detecting BCR-ABL transcripts and kinase domain mutations and for expressing results. Blood. 2006;108:28-37.
15. Hochhaus A, Larson RA, Guilhot F, et al. Long-term outcomes of imatinib treatment for chronic myeloid leukemia. N Engl J Med. 2017;376:917-927.
16. Cortes JE, Saglio G, Kantarjian HM, et al. Final 5-year study results of DASISION: the Dasatinib Versus Imatinib Study in Treatment-Naive Chronic Myeloid Leukemia Patients trial. J Clin Oncol. 2016;34:2333-2340.
17. Hochhaus A, Saglio G, Hughes TP, et al. Long-term benefits and risks of frontline nilotinib vs imatinib for chronic myeloid leukemia in chronic phase: 5-year update of the randomized ENESTnd trial. Leukemia. 2016;30:1044-1054.
18. Cortes JE, Gambacorti-Passerini C, Deininger MW, et al. Bosutinib versus imatinib for newly diagnosed chronic myeloid leukemia: results from the randomized BFORE trial. J Clin Oncol. 2018;36:231-237.
19. Radich JP, Deininger M, Abboud CN, et al. Chronic Myeloid Leukemia, Version 1.2019, NCCN Clinical Practice Guidelines in Oncology. J Natl Compr Canc Netw. 2018;16:1108-1135.
20. Faderl S, Talpaz M, Estrov Z, Kantarjian HM. Chronic myelogenous leukemia: biology and therapy. Ann Intern Med. 1999;131:207-219.
21. O’Brien SG, Guilhot F, Larson RA, et al. Imatinib compared with interferon and low-dose cytarabine for newly diagnosed chronic-phase chronic myeloid leukemia. N Engl J Med. 2003;348:994-1004.
22. Baccarani M, Deininger MW, Rosti G, et al. European LeukemiaNet recommendations for the management of chronic myeloid leukemia: 2013. Blood. 2013;122:872-884.
23. Larripa I, Ruiz MS, Gutierrez M, Bianchini M. [Guidelines for molecular monitoring of BCR-ABL1 in chronic myeloid leukemia patients by RT-qPCR]. Medicina (B Aires). 2017;77:61-72.
24. Marin D, Ibrahim AR, Lucas C, et al. Assessment of BCR-ABL1 transcript levels at 3 months is the only requirement for predicting outcome for patients with chronic myeloid leukemia treated with tyrosine kinase inhibitors. J Clin Oncol. 2012;30:232-238.
25. Hughes TP, Ross DM. Moving treatment-free remission into mainstream clinical practice in CML. Blood. 2016;128:17-23.
26. Druker BJ, Talpaz M, Resta DJ, et al. Efficacy and safety of a specific inhibitor of the BCR-ABL tyrosine kinase in chronic myeloid leukemia. N Engl J Med. 2001;344:1031-1037.
27. Baccarani M, Druker BJ, Branford S, et al. Long-term response to imatinib is not affected by the initial dose in patients with Philadelphia chromosome-positive chronic myeloid leukemia in chronic phase: final update from the Tyrosine Kinase Inhibitor Optimization and Selectivity (TOPS) study. Int J Hematol. 2014;99:616-624.
28. Yeung DT, Osborn MP, White DL, et al. TIDEL-II: first-line use of imatinib in CML with early switch to nilotinib for failure to achieve time-dependent molecular targets. Blood. 2015;125:915-923.
29. Druker BJ, Guilhot F, O’Brien SG, et al. Five-year follow-up of patients receiving imatinib for chronic myeloid leukemia. N Engl J Med. 2006;355:2408-2417.
30. Shah NP, Rousselot P, Schiffer C, et al. Dasatinib in imatinib-resistant or -intolerant chronic-phase, chronic myeloid leukemia patients: 7-year follow-up of study CA180-034. Am J Hematol. 2016;91:869-874.
31. Quintas-Cardama A, Han X, Kantarjian H, Cortes J. Tyrosine kinase inhibitor-induced platelet dysfunction in patients with chronic myeloid leukemia. Blood. 2009;114:261-263.
32. Giles FJ, le Coutre PD, Pinilla-Ibarz J, et al. Nilotinib in imatinib-resistant or imatinib-intolerant patients with chronic myeloid leukemia in chronic phase: 48-month follow-up results of a phase II study. Leukemia. 2013;27:107-112.
33. Saglio G, Kim DW, Issaragrisil S, et al. Nilotinib versus imatinib for newly diagnosed chronic myeloid leukemia. N Engl J Med. 2010;362:2251-2259.
34. Cortes JE, Khoury HJ, Kantarjian HM, et al. Long-term bosutinib for chronic phase chronic myeloid leukemia after failure of imatinib plus dasatinib and/or nilotinib. Am J Hematol. 2016;91:1206-1214.
35. Gambacorti-Passerini C, Cortes JE, Lipton JH, et al. Safety and efficacy of second-line bosutinib for chronic phase chronic myeloid leukemia over a five-year period: final results of a phase I/II study. Haematologica. 2018;103:1298-1307.
36. Cortes JE, Kim DW, Kantarjian HM, et al. Bosutinib versus imatinib in newly diagnosed chronic-phase chronic myeloid leukemia: results from the BELA trial. J Clin Oncol. 2012;30:3486-3492.
37. Cortes JE, Kim DW, Pinilla-Ibarz J, et al. A phase 2 trial of ponatinib in Philadelphia chromosome-positive leukemias. N Engl J Med. 2013;369:1783-1796.
38. Cortes JE, Kim DW, Pinilla-Ibarz J, et al. Ponatinib efficacy and safety in Philadelphia chromosome-positive leukemia: final 5-year results of the phase 2 PACE trial. Blood. 2018;132:393-404.
1. Faderl S, Talpaz M, Estrov Z, et al. The biology of chronic myeloid leukemia. N Engl J Med. 1999;341:164-172.
2. Surveillance, Epidemiology, and End Results Program. Cancer Stat Facts: Leukemia - Chronic Myeloid Leukemia (CML). 2018.
3. Huang X, Cortes J, Kantarjian H. Estimations of the increasing prevalence and plateau prevalence of chronic myeloid leukemia in the era of tyrosine kinase inhibitor therapy. Cancer. 2012;118:3123-3127.
4. Savage DG, Szydlo RM, Chase A, et al. Bone marrow transplantation for chronic myeloid leukaemia: the effects of differing criteria for defining chronic phase on probabilities of survival and relapse. Br J Haematol. 1997;99:30-35.
5. Knox WF, Bhavnani M, Davson J, Geary CG. Histological classification of chronic granulocytic leukaemia. Clin Lab Haematol. 1984;6:171-175.
6. Kvasnicka HM, Thiele J, Schmitt-Graeff A, et al. Impact of bone marrow morphology on multivariate risk classification in chronic myelogenous leukemia. Acta Haematol. 2003;109:53-56.
7. Cortes JE, Talpaz M, O’Brien S, et al. Staging of chronic myeloid leukemia in the imatinib era: an evaluation of the World Health Organization proposal. Cancer. 2006;106:1306-1315.
8. Druker BJ. Chronic myeloid leukemia. In: DeVita VT, Lawrence TS, Rosenberg SA, eds. DeVita, Hellman, and Rosenberg’s Cancer Principles & Practice of Oncology. 8th ed. Philadelphia, PA: Lippincott, Williams and Wilkins; 2007:2267-2304.
9. Arber DA, Orazi A, Hasserjian R, et al. The 2016 revision to the World Health Organization classification of myeloid neoplasms and acute leukemia. Blood. 2016;127:2391-2405.
10. Fabarius A, Leitner A, Hochhaus A, et al. Impact of additional cytogenetic aberrations at diagnosis on prognosis of CML: long-term observation of 1151 patients from the randomized CML Study IV. Blood. 2011;118:6760-6768.
11. Alhuraiji A, Kantarjian H, Boddu P, et al. Prognostic significance of additional chromosomal abnormalities at the time of diagnosis in patients with chronic myeloid leukemia treated with frontline tyrosine kinase inhibitors. Am J Hematol. 2018;93:84-90.
12. Melo JV. BCR-ABL gene variants. Baillieres Clin Haematol. 1997;10:203-222.
13. Kantarjian HM, Talpaz M, Cortes J, et al. Quantitative polymerase chain reaction monitoring of BCR-ABL during therapy with imatinib mesylate (STI571; gleevec) in chronic-phase chronic myelogenous leukemia. Clin Cancer Res. 2003;9:160-166.
14. Hughes T, Deininger M, Hochhaus A, et al. Monitoring CML patients responding to treatment with tyrosine kinase inhibitors: review and recommendations for harmonizing current methodology for detecting BCR-ABL transcripts and kinase domain mutations and for expressing results. Blood. 2006;108:28-37.
15. Hochhaus A, Larson RA, Guilhot F, et al. Long-term outcomes of imatinib treatment for chronic myeloid leukemia. N Engl J Med. 2017;376:917-927.
16. Cortes JE, Saglio G, Kantarjian HM, et al. Final 5-year study results of DASISION: the Dasatinib Versus Imatinib Study in Treatment-Naive Chronic Myeloid Leukemia Patients trial. J Clin Oncol. 2016;34:2333-2340.
17. Hochhaus A, Saglio G, Hughes TP, et al. Long-term benefits and risks of frontline nilotinib vs imatinib for chronic myeloid leukemia in chronic phase: 5-year update of the randomized ENESTnd trial. Leukemia. 2016;30:1044-1054.
18. Cortes JE, Gambacorti-Passerini C, Deininger MW, et al. Bosutinib versus imatinib for newly diagnosed chronic myeloid leukemia: results from the randomized BFORE trial. J Clin Oncol. 2018;36:231-237.
19. Radich JP, Deininger M, Abboud CN, et al. Chronic Myeloid Leukemia, Version 1.2019, NCCN Clinical Practice Guidelines in Oncology. J Natl Compr Canc Netw. 2018;16:1108-1135.
20. Faderl S, Talpaz M, Estrov Z, Kantarjian HM. Chronic myelogenous leukemia: biology and therapy. Ann Intern Med. 1999;131:207-219.
21. O’Brien SG, Guilhot F, Larson RA, et al. Imatinib compared with interferon and low-dose cytarabine for newly diagnosed chronic-phase chronic myeloid leukemia. N Engl J Med. 2003;348:994-1004.
22. Baccarani M, Deininger MW, Rosti G, et al. European LeukemiaNet recommendations for the management of chronic myeloid leukemia: 2013. Blood. 2013;122:872-884.
23. Larripa I, Ruiz MS, Gutierrez M, Bianchini M. [Guidelines for molecular monitoring of BCR-ABL1 in chronic myeloid leukemia patients by RT-qPCR]. Medicina (B Aires). 2017;77:61-72.
24. Marin D, Ibrahim AR, Lucas C, et al. Assessment of BCR-ABL1 transcript levels at 3 months is the only requirement for predicting outcome for patients with chronic myeloid leukemia treated with tyrosine kinase inhibitors. J Clin Oncol. 2012;30:232-238.
25. Hughes TP, Ross DM. Moving treatment-free remission into mainstream clinical practice in CML. Blood. 2016;128:17-23.
26. Druker BJ, Talpaz M, Resta DJ, et al. Efficacy and safety of a specific inhibitor of the BCR-ABL tyrosine kinase in chronic myeloid leukemia. N Engl J Med. 2001;344:1031-1037.
27. Baccarani M, Druker BJ, Branford S, et al. Long-term response to imatinib is not affected by the initial dose in patients with Philadelphia chromosome-positive chronic myeloid leukemia in chronic phase: final update from the Tyrosine Kinase Inhibitor Optimization and Selectivity (TOPS) study. Int J Hematol. 2014;99:616-624.
28. Yeung DT, Osborn MP, White DL, et al. TIDEL-II: first-line use of imatinib in CML with early switch to nilotinib for failure to achieve time-dependent molecular targets. Blood. 2015;125:915-923.
29. Druker BJ, Guilhot F, O’Brien SG, et al. Five-year follow-up of patients receiving imatinib for chronic myeloid leukemia. N Engl J Med. 2006;355:2408-2417.
30. Shah NP, Rousselot P, Schiffer C, et al. Dasatinib in imatinib-resistant or -intolerant chronic-phase, chronic myeloid leukemia patients: 7-year follow-up of study CA180-034. Am J Hematol. 2016;91:869-874.
31. Quintas-Cardama A, Han X, Kantarjian H, Cortes J. Tyrosine kinase inhibitor-induced platelet dysfunction in patients with chronic myeloid leukemia. Blood. 2009;114:261-263.
32. Giles FJ, le Coutre PD, Pinilla-Ibarz J, et al. Nilotinib in imatinib-resistant or imatinib-intolerant patients with chronic myeloid leukemia in chronic phase: 48-month follow-up results of a phase II study. Leukemia. 2013;27:107-112.
33. Saglio G, Kim DW, Issaragrisil S, et al. Nilotinib versus imatinib for newly diagnosed chronic myeloid leukemia. N Engl J Med. 2010;362:2251-2259.
34. Cortes JE, Khoury HJ, Kantarjian HM, et al. Long-term bosutinib for chronic phase chronic myeloid leukemia after failure of imatinib plus dasatinib and/or nilotinib. Am J Hematol. 2016;91:1206-1214.
35. Gambacorti-Passerini C, Cortes JE, Lipton JH, et al. Safety and efficacy of second-line bosutinib for chronic phase chronic myeloid leukemia over a five-year period: final results of a phase I/II study. Haematologica. 2018;103:1298-1307.
36. Cortes JE, Kim DW, Kantarjian HM, et al. Bosutinib versus imatinib in newly diagnosed chronic-phase chronic myeloid leukemia: results from the BELA trial. J Clin Oncol. 2012;30:3486-3492.
37. Cortes JE, Kim DW, Pinilla-Ibarz J, et al. A phase 2 trial of ponatinib in Philadelphia chromosome-positive leukemias. N Engl J Med. 2013;369:1783-1796.
38. Cortes JE, Kim DW, Pinilla-Ibarz J, et al. Ponatinib efficacy and safety in Philadelphia chromosome-positive leukemia: final 5-year results of the phase 2 PACE trial. Blood. 2018;132:393-404.