User login
Quality of Life and Population Health in Behavioral Health Care: A Retrospective, Cross-Sectional Study
From Milwaukee County Behavioral Health Services, Milwaukee, WI.
Abstract
Objectives: The goal of this study was to determine whether a single-item quality of life (QOL) measure could serve as a useful population health–level metric within the Quadruple Aim framework in a publicly funded behavioral health system.
Design: This was a retrospective, cross-sectional study that examined the correlation between the single-item QOL measure and several other key measures of the social determinants of health and a composite measure of acute service utilization for all patients receiving mental health and substance use services in a community behavioral health system.
Methods: Data were collected for 4488 patients who had at least 1 assessment between October 1, 2020, and September 30, 2021. Data on social determinants of health were obtained through patient self-report; acute service use data were obtained from electronic health records.
Results: Statistical analyses revealed results in the expected direction for all relationships tested. Patients with higher QOL were more likely to report “Good” or better self-rated physical health, be employed, have a private residence, and report recent positive social interactions, and were less likely to have received acute services in the previous 90 days.
Conclusion: A single-item QOL measure shows promise as a general, minimally burdensome whole-system metric that can function as a target for population health management efforts in a large behavioral health system. Future research should explore whether this QOL measure is sensitive to change over time and examine its temporal relationship with other key outcome metrics.
Keywords: Quadruple Aim, single-item measures, social determinants of health, acute service utilization metrics.
The Triple Aim for health care—improving the individual experience of care, increasing the health of populations, and reducing the costs of care—was first proposed in 2008.1 More recently, some have advocated for an expanded focus to include a fourth aim: the quality of staff work life.2 Since this seminal paper was published, many health care systems have endeavored to adopt and implement the Quadruple Aim3,4; however, the concepts representing each of the aims are not universally defined,3 nor are the measures needed to populate the Quadruple Aim always available within the health system in question.5
Although several assessment models and frameworks that provide guidance to stakeholders have been developed,6,7 it is ultimately up to organizations themselves to determine which measures they should deploy to best represent the different quadrants of the Quadruple Aim.6 Evidence suggests, however, that quality measurement, and the administrative time required to conduct it, can be both financially and emotionally burdensome to providers and health systems.8-10 Thus, it is incumbent on organizations to select a set of measures that are not only meaningful but as parsimonious as possible.6,11,12
Quality of life (QOL) is a potential candidate to assess the aim of population health. Brief health-related QOL questions have long been used in epidemiological surveys, such as the Behavioral Risk Factor Surveillance System survey.13 Such questions are also a key component of community health frameworks, such as the County Health Rankings developed by the University of Wisconsin Population Health Institute.14 Furthermore, Humana recently revealed that increasing the number of physical and mental health “Healthy Days” (which are among the Centers for Disease Control and Prevention’s Health-Related Quality of Life questions15) among the members enrolled in their insurance plan would become a major goal for the organization.16,17 Many of these measures, while brief, focus on QOL as a function of health, often as a self-rated construct (from “Poor” to “Excellent”) or in the form of days of poor physical or mental health in the past 30 days,15 rather than evaluating QOL itself; however, several authors have pointed out that health status and QOL are related but distinct concepts.18,19
Brief single-item assessments focused specifically on QOL have been developed and implemented within nonclinical20 and clinical populations, including individuals with cancer,21 adults with disabilities,22 individuals with cystic fibrosis,23 and children with epilepsy.24 Despite the long history of QOL assessment in behavioral health treatment,25 single-item measures have not been widely implemented in this population.
Milwaukee County Behavioral Health Services (BHS), a publicly funded, county-based behavioral health care system in Milwaukee, Wisconsin, provides inpatient and ambulatory treatment, psychiatric emergency care, withdrawal management, care management, crisis services, and other support services to individuals in Milwaukee County. In 2018 the community services arm of BHS began implementing a single QOL question from the World Health Organization’s WHOQOL-BREF26: On a 5-point rating scale of “Very Poor” to “Very Good,” “How would you rate your overall quality of life right now?” Previous research by Atroszko and colleagues,20 which used a similar approach with the same item from the WHOQOL-BREF, reported correlations in the expected direction of the single-item QOL measure with perceived stress, depression, anxiety, loneliness, and daily hours of sleep. This study’s sample, however, comprised opportunistically recruited college students, not a clinical population. Further, the researchers did not examine the relationship of QOL with acute service utilization or other measures of the social determinants of health, such as housing, employment, or social connectedness.
The following study was designed to extend these results by focusing on a clinical population—individuals with mental health or substance use issues—being served in a large, publicly funded behavioral health system in Milwaukee, Wisconsin. The objective of this study was to determine whether a single-item QOL measure could be used as a brief, parsimonious measure of overall population health by examining its relationship with other key outcome measures for patients receiving services from BHS. This study was reviewed and approved by BHS’s Institutional Review Board.
Methods
All patients engaged in nonacute community services are offered a standardized assessment that includes, among other measures, items related to QOL, housing status, employment status, self-rated physical health, and social connectedness. This assessment is administered at intake, discharge, and every 6 months while patients are enrolled in services. Patients who received at least 1 assessment between October 1, 2020, and September 30, 2021, were included in the analyses. Patients receiving crisis, inpatient, or withdrawal management services alone (ie, did not receive any other community-based services) were not offered the standard assessment and thus were not included in the analyses. If patients had more than 1 assessment during this time period, QOL data from the last assessment were used. Data on housing (private residence status, defined as adults living alone or with others without supervision in a house or apartment), employment status, self-rated physical health, and social connectedness (measured by asking people whether they have had positive interactions with family or friends in the past 30 days) were extracted from the same timepoint as well.
Also included in the analyses were rates of acute service utilization, in which any patient with at least 1 visit to BHS’s psychiatric emergency department, withdrawal management facility, or psychiatric inpatient facility in the 90 days prior to the date of the assessment received a code of “Yes,” and any patient who did not receive any of these services received a code of “No.” Chi-square analyses were conducted to determine the relationship between QOL rankings (“Very Poor,” “Poor,” “Neither Good nor Poor,” “Good,” and “Very Good”) and housing, employment, self-rated physical health, social connectedness, and 90-day acute service use. All acute service utilization data were obtained from BHS’s electronic health records system. All data used in the study were stored on a secure, password-protected server. All analyses were conducted with SPSS software (SPSS 28; IBM).
Results
Data were available for 4488 patients who received an assessment between October 1, 2020, and September 30, 2021 (total numbers per item vary because some items had missing data; see supplementary eTables 1-3 for sample size per item). Demographics of the patient sample are listed in Table 1; the demographics of the patients who were missing data for specific outcomes are presented in eTables 1-3.


Statistical analyses revealed results in the expected direction for all relationships tested (Table 2). As patients’ self-reported QOL improved, so did the likelihood of higher rates of self-reported “Good” or better physical health, which was 576% higher among individuals who reported “Very Good” QOL relative to those who reported “Very Poor” QOL. Similarly, when compared with individuals with “Very Poor” QOL, individuals who reported “Very Good” QOL were 21.91% more likely to report having a private residence, 126.7% more likely to report being employed, and 29.17% more likely to report having had positive social interactions with family and friends in the past 30 days. There was an inverse relationship between QOL and the likelihood that a patient had received at least 1 admission for an acute service in the previous 90 days, such that patients who reported “Very Good” QOL were 86.34% less likely to have had an admission compared to patients with “Very Poor” QOL (2.8% vs 20.5%, respectively). The relationships among the criterion variables used in this study are presented in Table 3.

Discussion
The results of this preliminary analysis suggest that self-rated QOL is related to key health, social determinants of health, and acute service utilization metrics. These data are important for several reasons. First, because QOL is a diagnostically agnostic measure, it is a cross-cutting measure to use with clinically diverse populations receiving an array of different services. Second, at 1 item, the QOL measure is extremely brief and therefore minimally onerous to implement for both patients and administratively overburdened providers. Third, its correlation with other key metrics suggests that it can function as a broad population health measure for health care organizations because individuals with higher QOL will also likely have better outcomes in other key areas. This suggests that it has the potential to broadly represent the overall status of a population of patients, thus functioning as a type of “whole system” measure, which the Institute for Healthcare Improvement describes as “a small set of measures that reflect a health system’s overall performance on core dimensions of quality guided by the Triple Aim.”7 These whole system measures can help focus an organization’s strategic initiatives and efforts on the issues that matter most to the patients and community it serves.
The relationship of QOL to acute service utilization deserves special mention. As an administrative measure, utilization is not susceptible to the same response bias as the other self-reported variables. Furthermore, acute services are costly to health systems, and hospital readmissions are associated with payment reductions in the Centers for Medicare and Medicaid Services (CMS) Hospital Readmissions Reduction Program for hospitals that fail to meet certain performance targets.27 Thus, because of its alignment with federal mandates, improved QOL (and potentially concomitant decreases in acute service use) may have significant financial implications for health systems as well.
This study was limited by several factors. First, it was focused on a population receiving publicly funded behavioral health services with strict eligibility requirements, one of which stipulated that individuals must be at 200% or less of the Federal Poverty Level; therefore, the results might not be applicable to health systems with a more clinically or socioeconomically diverse patient population. Second, because these data are cross-sectional, it was not possible to determine whether QOL improved over time or whether changes in QOL covaried longitudinally with the other metrics under observation. For example, if patients’ QOL improved from the first to last assessment, did their employment or residential status improve as well, or were these patients more likely to be employed at their first assessment? Furthermore, if there was covariance, did changes in employment, housing status, and so on precede changes in QOL or vice versa? Multiple longitudinal observations would help to address these questions and will be the focus of future analyses.
Conclusion
This preliminary study suggests that a single-item QOL measure may be a valuable population health–level metric for health systems. It requires little administrative effort on the part of either the clinician or patient. It is also agnostic with regard to clinical issue or treatment approach and can therefore admit of a range of diagnoses or patient-specific, idiosyncratic recovery goals. It is correlated with other key health, social determinants of health, and acute service utilization indicators and can therefore serve as a “whole system” measure because of its ability to broadly represent improvements in an entire population. Furthermore, QOL is patient-centered in that data are obtained through patient self-report, which is a high priority for CMS and other health care organizations.28 In summary, a single-item QOL measure holds promise for health care organizations looking to implement the Quadruple Aim and assess the health of the populations they serve in a manner that is simple, efficient, and patient-centered.
Acknowledgments: The author thanks Jennifer Wittwer for her thoughtful comments on the initial draft of this manuscript and Gary Kraft for his help extracting the data used in the analyses.
Corresponding author: Walter Matthew Drymalski, PhD; walter.drymalski@milwaukeecountywi.gov
Disclosures: None reported.
1. Berwick DM, Nolan TW, Whittington J. The triple aim: care, health, and cost. Health Aff (Millwood). 2008;27(3):759-769. doi:10.1377/hlthaff.27.3.759
2. Bodenheimer T, Sinsky C. From triple to quadruple aim: care of the patient requires care of the provider. Ann Fam Med. 2014;12(6):573-576. doi:10.1370/afm.1713
3. Hendrikx RJP, Drewes HW, Spreeuwenberg M, et al. Which triple aim related measures are being used to evaluate population management initiatives? An international comparative analysis. Health Policy. 2016;120(5):471-485. doi:10.1016/j.healthpol.2016.03.008
4. Whittington JW, Nolan K, Lewis N, Torres T. Pursuing the triple aim: the first 7 years. Milbank Q. 2015;93(2):263-300. doi:10.1111/1468-0009.12122
5. Ryan BL, Brown JB, Glazier RH, Hutchison B. Examining primary healthcare performance through a triple aim lens. Healthc Policy. 2016;11(3):19-31.
6. Stiefel M, Nolan K. A guide to measuring the Triple Aim: population health, experience of care, and per capita cost. Institute for Healthcare Improvement; 2012. Accessed November 1, 2022. https://nhchc.org/wp-content/uploads/2019/08/ihiguidetomeasuringtripleaimwhitepaper2012.pdf
7. Martin L, Nelson E, Rakover J, Chase A. Whole system measures 2.0: a compass for health system leaders. Institute for Healthcare Improvement; 2016. Accessed November 1, 2022. http://www.ihi.org:80/resources/Pages/IHIWhitePapers/Whole-System-Measures-Compass-for-Health-System-Leaders.aspx
8. Casalino LP, Gans D, Weber R, et al. US physician practices spend more than $15.4 billion annually to report quality measures. Health Aff (Millwood). 2016;35(3):401-406. doi:10.1377/hlthaff.2015.1258
9. Rao SK, Kimball AB, Lehrhoff SR, et al. The impact of administrative burden on academic physicians: results of a hospital-wide physician survey. Acad Med. 2017;92(2):237-243. doi:10.1097/ACM.0000000000001461
10. Woolhandler S, Himmelstein DU. Administrative work consumes one-sixth of U.S. physicians’ working hours and lowers their career satisfaction. Int J Health Serv. 2014;44(4):635-642. doi:10.2190/HS.44.4.a
11. Meyer GS, Nelson EC, Pryor DB, et al. More quality measures versus measuring what matters: a call for balance and parsimony. BMJ Qual Saf. 2012;21(11):964-968. doi:10.1136/bmjqs-2012-001081
12. Vital Signs: Core Metrics for Health and Health Care Progress. Washington, DC: National Academies Press; 2015. doi:10.17226/19402
13. Centers for Disease Control and Prevention. BRFSS questionnaires. Accessed November 1, 2022. https://www.cdc.gov/brfss/questionnaires/index.htm
14. County Health Rankings and Roadmaps. Measures & data sources. University of Wisconsin Population Health Institute. Accessed November 1, 2022. https://www.countyhealthrankings.org/explore-health-rankings/measures-data-sources
15. Centers for Disease Control and Prevention. Healthy days core module (CDC HRQOL-4). Accessed November 1, 2022. https://www.cdc.gov/hrqol/hrqol14_measure.htm
16. Cordier T, Song Y, Cambon J, et al. A bold goal: more healthy days through improved community health. Popul Health Manag. 2018;21(3):202-208. doi:10.1089/pop.2017.0142
17. Slabaugh SL, Shah M, Zack M, et al. Leveraging health-related quality of life in population health management: the case for healthy days. Popul Health Manag. 2017;20(1):13-22. doi:10.1089/pop.2015.0162
18. Karimi M, Brazier J. Health, health-related quality of life, and quality of life: what is the difference? Pharmacoeconomics. 2016;34(7):645-649. doi:10.1007/s40273-016-0389-9
19. Smith KW, Avis NE, Assmann SF. Distinguishing between quality of life and health status in quality of life research: a meta-analysis. Qual Life Res. 1999;8(5):447-459. doi:10.1023/a:1008928518577
20. Atroszko PA, Baginska P, Mokosinska M, et al. Validity and reliability of single-item self-report measures of general quality of life, general health and sleep quality. In: CER Comparative European Research 2015. Sciemcee Publishing; 2015:207-211.
21. Singh JA, Satele D, Pattabasavaiah S, et al. Normative data and clinically significant effect sizes for single-item numerical linear analogue self-assessment (LASA) scales. Health Qual Life Outcomes. 2014;12:187. doi:10.1186/s12955-014-0187-z
22. Siebens HC, Tsukerman D, Adkins RH, et al. Correlates of a single-item quality-of-life measure in people aging with disabilities. Am J Phys Med Rehabil. 2015;94(12):1065-1074. doi:10.1097/PHM.0000000000000298
23. Yohannes AM, Dodd M, Morris J, Webb K. Reliability and validity of a single item measure of quality of life scale for adult patients with cystic fibrosis. Health Qual Life Outcomes. 2011;9:105. doi:10.1186/1477-7525-9-105
24. Conway L, Widjaja E, Smith ML. Single-item measure for assessing quality of life in children with drug-resistant epilepsy. Epilepsia Open. 2017;3(1):46-54. doi:10.1002/epi4.12088
25. Barry MM, Zissi A. Quality of life as an outcome measure in evaluating mental health services: a review of the empirical evidence. Soc Psychiatry Psychiatr Epidemiol. 1997;32(1):38-47. doi:10.1007/BF00800666
26. Skevington SM, Lotfy M, O’Connell KA. The World Health Organization’s WHOQOL-BREF quality of life assessment: psychometric properties and results of the international field trial. Qual Life Res. 2004;13(2):299-310. doi:10.1023/B:QURE.0000018486.91360.00
27. Centers for Medicare & Medicaid Services. Hospital readmissions reduction program (HRRP). Accessed November 1, 2022. https://www.cms.gov/Medicare/Medicare-Fee-for-Service-Payment/AcuteInpatientPPS/Readmissions-Reduction-Program
28. Centers for Medicare & Medicaid Services. Patient-reported outcome measures. CMS Measures Management System. Published May 2022. Accessed November 1, 2022. https://www.cms.gov/files/document/blueprint-patient-reported-outcome-measures.pdf
From Milwaukee County Behavioral Health Services, Milwaukee, WI.
Abstract
Objectives: The goal of this study was to determine whether a single-item quality of life (QOL) measure could serve as a useful population health–level metric within the Quadruple Aim framework in a publicly funded behavioral health system.
Design: This was a retrospective, cross-sectional study that examined the correlation between the single-item QOL measure and several other key measures of the social determinants of health and a composite measure of acute service utilization for all patients receiving mental health and substance use services in a community behavioral health system.
Methods: Data were collected for 4488 patients who had at least 1 assessment between October 1, 2020, and September 30, 2021. Data on social determinants of health were obtained through patient self-report; acute service use data were obtained from electronic health records.
Results: Statistical analyses revealed results in the expected direction for all relationships tested. Patients with higher QOL were more likely to report “Good” or better self-rated physical health, be employed, have a private residence, and report recent positive social interactions, and were less likely to have received acute services in the previous 90 days.
Conclusion: A single-item QOL measure shows promise as a general, minimally burdensome whole-system metric that can function as a target for population health management efforts in a large behavioral health system. Future research should explore whether this QOL measure is sensitive to change over time and examine its temporal relationship with other key outcome metrics.
Keywords: Quadruple Aim, single-item measures, social determinants of health, acute service utilization metrics.
The Triple Aim for health care—improving the individual experience of care, increasing the health of populations, and reducing the costs of care—was first proposed in 2008.1 More recently, some have advocated for an expanded focus to include a fourth aim: the quality of staff work life.2 Since this seminal paper was published, many health care systems have endeavored to adopt and implement the Quadruple Aim3,4; however, the concepts representing each of the aims are not universally defined,3 nor are the measures needed to populate the Quadruple Aim always available within the health system in question.5
Although several assessment models and frameworks that provide guidance to stakeholders have been developed,6,7 it is ultimately up to organizations themselves to determine which measures they should deploy to best represent the different quadrants of the Quadruple Aim.6 Evidence suggests, however, that quality measurement, and the administrative time required to conduct it, can be both financially and emotionally burdensome to providers and health systems.8-10 Thus, it is incumbent on organizations to select a set of measures that are not only meaningful but as parsimonious as possible.6,11,12
Quality of life (QOL) is a potential candidate to assess the aim of population health. Brief health-related QOL questions have long been used in epidemiological surveys, such as the Behavioral Risk Factor Surveillance System survey.13 Such questions are also a key component of community health frameworks, such as the County Health Rankings developed by the University of Wisconsin Population Health Institute.14 Furthermore, Humana recently revealed that increasing the number of physical and mental health “Healthy Days” (which are among the Centers for Disease Control and Prevention’s Health-Related Quality of Life questions15) among the members enrolled in their insurance plan would become a major goal for the organization.16,17 Many of these measures, while brief, focus on QOL as a function of health, often as a self-rated construct (from “Poor” to “Excellent”) or in the form of days of poor physical or mental health in the past 30 days,15 rather than evaluating QOL itself; however, several authors have pointed out that health status and QOL are related but distinct concepts.18,19
Brief single-item assessments focused specifically on QOL have been developed and implemented within nonclinical20 and clinical populations, including individuals with cancer,21 adults with disabilities,22 individuals with cystic fibrosis,23 and children with epilepsy.24 Despite the long history of QOL assessment in behavioral health treatment,25 single-item measures have not been widely implemented in this population.
Milwaukee County Behavioral Health Services (BHS), a publicly funded, county-based behavioral health care system in Milwaukee, Wisconsin, provides inpatient and ambulatory treatment, psychiatric emergency care, withdrawal management, care management, crisis services, and other support services to individuals in Milwaukee County. In 2018 the community services arm of BHS began implementing a single QOL question from the World Health Organization’s WHOQOL-BREF26: On a 5-point rating scale of “Very Poor” to “Very Good,” “How would you rate your overall quality of life right now?” Previous research by Atroszko and colleagues,20 which used a similar approach with the same item from the WHOQOL-BREF, reported correlations in the expected direction of the single-item QOL measure with perceived stress, depression, anxiety, loneliness, and daily hours of sleep. This study’s sample, however, comprised opportunistically recruited college students, not a clinical population. Further, the researchers did not examine the relationship of QOL with acute service utilization or other measures of the social determinants of health, such as housing, employment, or social connectedness.
The following study was designed to extend these results by focusing on a clinical population—individuals with mental health or substance use issues—being served in a large, publicly funded behavioral health system in Milwaukee, Wisconsin. The objective of this study was to determine whether a single-item QOL measure could be used as a brief, parsimonious measure of overall population health by examining its relationship with other key outcome measures for patients receiving services from BHS. This study was reviewed and approved by BHS’s Institutional Review Board.
Methods
All patients engaged in nonacute community services are offered a standardized assessment that includes, among other measures, items related to QOL, housing status, employment status, self-rated physical health, and social connectedness. This assessment is administered at intake, discharge, and every 6 months while patients are enrolled in services. Patients who received at least 1 assessment between October 1, 2020, and September 30, 2021, were included in the analyses. Patients receiving crisis, inpatient, or withdrawal management services alone (ie, did not receive any other community-based services) were not offered the standard assessment and thus were not included in the analyses. If patients had more than 1 assessment during this time period, QOL data from the last assessment were used. Data on housing (private residence status, defined as adults living alone or with others without supervision in a house or apartment), employment status, self-rated physical health, and social connectedness (measured by asking people whether they have had positive interactions with family or friends in the past 30 days) were extracted from the same timepoint as well.
Also included in the analyses were rates of acute service utilization, in which any patient with at least 1 visit to BHS’s psychiatric emergency department, withdrawal management facility, or psychiatric inpatient facility in the 90 days prior to the date of the assessment received a code of “Yes,” and any patient who did not receive any of these services received a code of “No.” Chi-square analyses were conducted to determine the relationship between QOL rankings (“Very Poor,” “Poor,” “Neither Good nor Poor,” “Good,” and “Very Good”) and housing, employment, self-rated physical health, social connectedness, and 90-day acute service use. All acute service utilization data were obtained from BHS’s electronic health records system. All data used in the study were stored on a secure, password-protected server. All analyses were conducted with SPSS software (SPSS 28; IBM).
Results
Data were available for 4488 patients who received an assessment between October 1, 2020, and September 30, 2021 (total numbers per item vary because some items had missing data; see supplementary eTables 1-3 for sample size per item). Demographics of the patient sample are listed in Table 1; the demographics of the patients who were missing data for specific outcomes are presented in eTables 1-3.
Statistical analyses revealed results in the expected direction for all relationships tested (Table 2). As patients’ self-reported QOL improved, so did the likelihood of higher rates of self-reported “Good” or better physical health, which was 576% higher among individuals who reported “Very Good” QOL relative to those who reported “Very Poor” QOL. Similarly, when compared with individuals with “Very Poor” QOL, individuals who reported “Very Good” QOL were 21.91% more likely to report having a private residence, 126.7% more likely to report being employed, and 29.17% more likely to report having had positive social interactions with family and friends in the past 30 days. There was an inverse relationship between QOL and the likelihood that a patient had received at least 1 admission for an acute service in the previous 90 days, such that patients who reported “Very Good” QOL were 86.34% less likely to have had an admission compared to patients with “Very Poor” QOL (2.8% vs 20.5%, respectively). The relationships among the criterion variables used in this study are presented in Table 3.
Discussion
The results of this preliminary analysis suggest that self-rated QOL is related to key health, social determinants of health, and acute service utilization metrics. These data are important for several reasons. First, because QOL is a diagnostically agnostic measure, it is a cross-cutting measure to use with clinically diverse populations receiving an array of different services. Second, at 1 item, the QOL measure is extremely brief and therefore minimally onerous to implement for both patients and administratively overburdened providers. Third, its correlation with other key metrics suggests that it can function as a broad population health measure for health care organizations because individuals with higher QOL will also likely have better outcomes in other key areas. This suggests that it has the potential to broadly represent the overall status of a population of patients, thus functioning as a type of “whole system” measure, which the Institute for Healthcare Improvement describes as “a small set of measures that reflect a health system’s overall performance on core dimensions of quality guided by the Triple Aim.”7 These whole system measures can help focus an organization’s strategic initiatives and efforts on the issues that matter most to the patients and community it serves.
The relationship of QOL to acute service utilization deserves special mention. As an administrative measure, utilization is not susceptible to the same response bias as the other self-reported variables. Furthermore, acute services are costly to health systems, and hospital readmissions are associated with payment reductions in the Centers for Medicare and Medicaid Services (CMS) Hospital Readmissions Reduction Program for hospitals that fail to meet certain performance targets.27 Thus, because of its alignment with federal mandates, improved QOL (and potentially concomitant decreases in acute service use) may have significant financial implications for health systems as well.
This study was limited by several factors. First, it was focused on a population receiving publicly funded behavioral health services with strict eligibility requirements, one of which stipulated that individuals must be at 200% or less of the Federal Poverty Level; therefore, the results might not be applicable to health systems with a more clinically or socioeconomically diverse patient population. Second, because these data are cross-sectional, it was not possible to determine whether QOL improved over time or whether changes in QOL covaried longitudinally with the other metrics under observation. For example, if patients’ QOL improved from the first to last assessment, did their employment or residential status improve as well, or were these patients more likely to be employed at their first assessment? Furthermore, if there was covariance, did changes in employment, housing status, and so on precede changes in QOL or vice versa? Multiple longitudinal observations would help to address these questions and will be the focus of future analyses.
Conclusion
This preliminary study suggests that a single-item QOL measure may be a valuable population health–level metric for health systems. It requires little administrative effort on the part of either the clinician or patient. It is also agnostic with regard to clinical issue or treatment approach and can therefore admit of a range of diagnoses or patient-specific, idiosyncratic recovery goals. It is correlated with other key health, social determinants of health, and acute service utilization indicators and can therefore serve as a “whole system” measure because of its ability to broadly represent improvements in an entire population. Furthermore, QOL is patient-centered in that data are obtained through patient self-report, which is a high priority for CMS and other health care organizations.28 In summary, a single-item QOL measure holds promise for health care organizations looking to implement the Quadruple Aim and assess the health of the populations they serve in a manner that is simple, efficient, and patient-centered.
Acknowledgments: The author thanks Jennifer Wittwer for her thoughtful comments on the initial draft of this manuscript and Gary Kraft for his help extracting the data used in the analyses.
Corresponding author: Walter Matthew Drymalski, PhD; walter.drymalski@milwaukeecountywi.gov
Disclosures: None reported.
1. Berwick DM, Nolan TW, Whittington J. The triple aim: care, health, and cost. Health Aff (Millwood). 2008;27(3):759-769. doi:10.1377/hlthaff.27.3.759
2. Bodenheimer T, Sinsky C. From triple to quadruple aim: care of the patient requires care of the provider. Ann Fam Med. 2014;12(6):573-576. doi:10.1370/afm.1713
3. Hendrikx RJP, Drewes HW, Spreeuwenberg M, et al. Which triple aim related measures are being used to evaluate population management initiatives? An international comparative analysis. Health Policy. 2016;120(5):471-485. doi:10.1016/j.healthpol.2016.03.008
4. Whittington JW, Nolan K, Lewis N, Torres T. Pursuing the triple aim: the first 7 years. Milbank Q. 2015;93(2):263-300. doi:10.1111/1468-0009.12122
5. Ryan BL, Brown JB, Glazier RH, Hutchison B. Examining primary healthcare performance through a triple aim lens. Healthc Policy. 2016;11(3):19-31.
6. Stiefel M, Nolan K. A guide to measuring the Triple Aim: population health, experience of care, and per capita cost. Institute for Healthcare Improvement; 2012. Accessed November 1, 2022. https://nhchc.org/wp-content/uploads/2019/08/ihiguidetomeasuringtripleaimwhitepaper2012.pdf
7. Martin L, Nelson E, Rakover J, Chase A. Whole system measures 2.0: a compass for health system leaders. Institute for Healthcare Improvement; 2016. Accessed November 1, 2022. http://www.ihi.org:80/resources/Pages/IHIWhitePapers/Whole-System-Measures-Compass-for-Health-System-Leaders.aspx
8. Casalino LP, Gans D, Weber R, et al. US physician practices spend more than $15.4 billion annually to report quality measures. Health Aff (Millwood). 2016;35(3):401-406. doi:10.1377/hlthaff.2015.1258
9. Rao SK, Kimball AB, Lehrhoff SR, et al. The impact of administrative burden on academic physicians: results of a hospital-wide physician survey. Acad Med. 2017;92(2):237-243. doi:10.1097/ACM.0000000000001461
10. Woolhandler S, Himmelstein DU. Administrative work consumes one-sixth of U.S. physicians’ working hours and lowers their career satisfaction. Int J Health Serv. 2014;44(4):635-642. doi:10.2190/HS.44.4.a
11. Meyer GS, Nelson EC, Pryor DB, et al. More quality measures versus measuring what matters: a call for balance and parsimony. BMJ Qual Saf. 2012;21(11):964-968. doi:10.1136/bmjqs-2012-001081
12. Vital Signs: Core Metrics for Health and Health Care Progress. Washington, DC: National Academies Press; 2015. doi:10.17226/19402
13. Centers for Disease Control and Prevention. BRFSS questionnaires. Accessed November 1, 2022. https://www.cdc.gov/brfss/questionnaires/index.htm
14. County Health Rankings and Roadmaps. Measures & data sources. University of Wisconsin Population Health Institute. Accessed November 1, 2022. https://www.countyhealthrankings.org/explore-health-rankings/measures-data-sources
15. Centers for Disease Control and Prevention. Healthy days core module (CDC HRQOL-4). Accessed November 1, 2022. https://www.cdc.gov/hrqol/hrqol14_measure.htm
16. Cordier T, Song Y, Cambon J, et al. A bold goal: more healthy days through improved community health. Popul Health Manag. 2018;21(3):202-208. doi:10.1089/pop.2017.0142
17. Slabaugh SL, Shah M, Zack M, et al. Leveraging health-related quality of life in population health management: the case for healthy days. Popul Health Manag. 2017;20(1):13-22. doi:10.1089/pop.2015.0162
18. Karimi M, Brazier J. Health, health-related quality of life, and quality of life: what is the difference? Pharmacoeconomics. 2016;34(7):645-649. doi:10.1007/s40273-016-0389-9
19. Smith KW, Avis NE, Assmann SF. Distinguishing between quality of life and health status in quality of life research: a meta-analysis. Qual Life Res. 1999;8(5):447-459. doi:10.1023/a:1008928518577
20. Atroszko PA, Baginska P, Mokosinska M, et al. Validity and reliability of single-item self-report measures of general quality of life, general health and sleep quality. In: CER Comparative European Research 2015. Sciemcee Publishing; 2015:207-211.
21. Singh JA, Satele D, Pattabasavaiah S, et al. Normative data and clinically significant effect sizes for single-item numerical linear analogue self-assessment (LASA) scales. Health Qual Life Outcomes. 2014;12:187. doi:10.1186/s12955-014-0187-z
22. Siebens HC, Tsukerman D, Adkins RH, et al. Correlates of a single-item quality-of-life measure in people aging with disabilities. Am J Phys Med Rehabil. 2015;94(12):1065-1074. doi:10.1097/PHM.0000000000000298
23. Yohannes AM, Dodd M, Morris J, Webb K. Reliability and validity of a single item measure of quality of life scale for adult patients with cystic fibrosis. Health Qual Life Outcomes. 2011;9:105. doi:10.1186/1477-7525-9-105
24. Conway L, Widjaja E, Smith ML. Single-item measure for assessing quality of life in children with drug-resistant epilepsy. Epilepsia Open. 2017;3(1):46-54. doi:10.1002/epi4.12088
25. Barry MM, Zissi A. Quality of life as an outcome measure in evaluating mental health services: a review of the empirical evidence. Soc Psychiatry Psychiatr Epidemiol. 1997;32(1):38-47. doi:10.1007/BF00800666
26. Skevington SM, Lotfy M, O’Connell KA. The World Health Organization’s WHOQOL-BREF quality of life assessment: psychometric properties and results of the international field trial. Qual Life Res. 2004;13(2):299-310. doi:10.1023/B:QURE.0000018486.91360.00
27. Centers for Medicare & Medicaid Services. Hospital readmissions reduction program (HRRP). Accessed November 1, 2022. https://www.cms.gov/Medicare/Medicare-Fee-for-Service-Payment/AcuteInpatientPPS/Readmissions-Reduction-Program
28. Centers for Medicare & Medicaid Services. Patient-reported outcome measures. CMS Measures Management System. Published May 2022. Accessed November 1, 2022. https://www.cms.gov/files/document/blueprint-patient-reported-outcome-measures.pdf
Neurosurgery Operating Room Efficiency During the COVID-19 Era
From the Department of Neurological Surgery, Vanderbilt University Medical Center, Nashville, TN (Stefan W. Koester, Puja Jagasia, and Drs. Liles, Dambrino IV, Feldman, and Chambless), and the Department of Anesthesiology, Vanderbilt University Medical Center, Nashville, TN (Drs. Mathews and Tiwari).
ABSTRACT
Background: The COVID-19 pandemic has had broad effects on surgical care, including operating room (OR) staffing, personal protective equipment (PPE) utilization, and newly implemented anti-infective measures. Our aim was to assess neurosurgery OR efficiency before the COVID-19 pandemic, during peak COVID-19, and during current times.
Methods: Institutional perioperative databases at a single, high-volume neurosurgical center were queried for operations performed from December 2019 until October 2021. March 12, 2020, the day that the state of Tennessee declared a state of emergency, was chosen as the onset of the COVID-19 pandemic. The 90-day periods before and after this day were used to define the pre-COVID-19, peak-COVID-19, and post-peak restrictions time periods for comparative analysis. Outcomes included delay in first-start and OR turnover time between neurosurgical cases. Preset threshold times were used in analyses to adjust for normal leniency in OR scheduling (15 minutes for first start and 90 minutes for turnover). Univariate analysis used Wilcoxon rank-sum test for continuous outcomes, while chi-square test and Fisher’s exact test were used for categorical comparisons. Significance was defined as P < .05.
Results: First-start time was analyzed in 426 pre-COVID-19, 357 peak-restrictions, and 2304 post-peak-restrictions cases. The unadjusted mean delay length was found to be significantly different between the time periods, but the magnitude of increase in minutes was immaterial (mean [SD] minutes, 6 [18] vs 10 [21] vs 8 [20], respectively; P = .004). The adjusted average delay length and proportion of cases delayed beyond the 15-minute threshold were not significantly different. The proportion of cases that started early, as well as significantly early past a 15-minute threshold, have not been impacted. There was no significant change in turnover time during peak restrictions relative to the pre-COVID-19 period (88 [100] minutes vs 85 [95] minutes), and turnover time has since remained unchanged (83 [87] minutes).
Conclusion: Our center was able to maintain OR efficiency before, during, and after peak restrictions even while instituting advanced infection-control strategies. While there were significant changes, delays were relatively small in magnitude.
Keywords: operating room timing, hospital efficiency, socioeconomics, pandemic.
The COVID-19 pandemic has led to major changes in patient care both from a surgical perspective and in regard to inpatient hospital course. Safety protocols nationwide have been implemented to protect both patients and providers. Some elements of surgical care have drastically changed, including operating room (OR) staffing, personal protective equipment (PPE) utilization, and increased sterilization measures. Furloughs, layoffs, and reassignments due to the focus on nonelective and COVID-19–related cases challenged OR staffing and efficiency. Operating room staff with COVID-19 exposures or COVID-19 infections also caused last-minute changes in staffing. All of these scenarios can cause issues due to actual understaffing or due to staff members being pushed into highly specialized areas, such as neurosurgery, in which they have very little experience. A further obstacle to OR efficiency included policy changes involving PPE utilization, sterilization measures, and supply chain shortages of necessary resources such as PPE.
Neurosurgery in particular has been susceptible to COVID-19–related system-wide changes given operator proximity to the patient’s respiratory passages, frequency of emergent cases, and varying anesthetic needs, as well as the high level of specialization needed to perform neurosurgical care. Previous studies have shown a change in the makeup of neurosurgical patients seeking care, as well as in the acuity of neurological consult of these patients.1 A study in orthopedic surgery by Andreata et al demonstrated worsened OR efficiency, with significantly increased first-start and turnover times.2 In the COVID-19 era, OR quality and safety are crucially important to both patients and providers. Providing this safe and effective care in an efficient manner is important for optimal neurosurgical management in the long term.3 Moreover, the financial burden of implementing new protocols and standards can be compounded by additional financial losses due to reduced OR efficiency.
Methods
To analyze the effect of COVID-19 on neurosurgical OR efficiency, institutional perioperative databases at a single high-volume center were queried for operations performed from December 2019 until October 2021. March 12, 2020, was chosen as the onset of COVID-19 for analytic purposes, as this was the date when the state of Tennessee declared a state of emergency. The 90-day periods before and after this date were used for comparative analysis for pre-COVID-19, peak COVID-19, and post-peak-restrictions time periods. The peak COVID-19 period was defined as the 90-day period following the initial onset of COVID-19 and the surge of cases. For comparison purposes, post-peak COVID-19 was defined as the months following the first peak until October 2021 (approximately 17 months). COVID-19 burden was determined using a COVID-19 single-institution census of confirmed cases by polymerase chain reaction (PCR) for which the average number of cases of COVID-19 during a given month was determined. This number is a scaled trend, and a true number of COVID-19 cases in our hospital was not reported.
Neurosurgical and neuroendovascular cases were included in the analysis. Outcomes included delay in first-start and OR turnover time between neurosurgical cases, defined as the time from the patient leaving the room until the next patient entered the room. Preset threshold times were used in analyses to adjust for normal leniency in OR scheduling (15 minutes for first start and 90 minutes for turnover, which is a standard for our single-institution perioperative center). Statistical analyses, including data aggregation, were performed using R, version 4.0.1 (R Foundation for Statistical Computing). Patients’ demographic and clinical characteristics were analyzed using an independent 2-sample t-test for interval variables and a chi-square test for categorical variables. Significance was defined as P < .05.
Results
First-Start Time
First-start time was analyzed in 426 pre-COVID-19, 357 peak-COVID-19, and 2304 post-peak-COVID-19 cases. The unadjusted mean delay length was significantly different between the time periods, but the magnitude of increase in minutes was immaterial (mean [SD] minutes, 6 [18] vs 10 [21] vs 8 [20], respectively; P = .004) (Table 1). 
The adjusted average delay length and proportion of cases delayed beyond the 15-minute threshold were not significantly different, but they have been slightly higher since the onset of COVID-19. The proportion of cases that have started early, as well as significantly early past a 15-minute threshold, have also trended down since the onset of the COVID-19 pandemic, but this difference was again not significant. The temporal relationship of first-start delay, both unadjusted and adjusted, from December 2019 to October 2021 is shown in Figure 1. The trend of increasing delay is loosely associated with the COVID-19 burden experienced by our hospital. The start of COVID-19 as well as both COVID-19 peaks have been associated with increased delays in our hospital. Unadjusted and (B) adjusted first-start delay in operating room efficiency relative to COVID-19 census.")
Turnover Time
Turnover time was assessed in 437 pre-COVID-19, 278 peak-restrictions, and 2411 post-peak-restrictions cases. Turnover time during peak restrictions was not significantly different from pre-COVID-19 (88 [100] vs 85 [95]) and has since remained relatively unchanged (83 [87], P = .78). A similar trend held for comparisons of proportion of cases with turnover time past 90 minutes and average times past the 90-minute threshold (Table 2). The temporal relationship between COVID-19 burden and turnover time, both unadjusted and adjusted, from December 2019 to October 2021 is shown in Figure 2. Both figures demonstrate a slight initial increase in turnover time delay at the start of COVID-19, which stabilized with little variation thereafter.

 Unadjusted and (B) adjusted turnover time in operating room efficiency relative to COVID-19 census.")
Discussion
We analyzed the OR efficiency metrics of first-start and turnover time during the 90-day period before COVID-19 (pre-COVID-19), the 90 days following Tennessee declaring a state of emergency (peak COVID-19), and the time following this period (post-COVID-19) for all neurosurgical and neuroendovascular cases at Vanderbilt University Medical Center (VUMC). We found a significant difference in unadjusted mean delay length in first-start time between the time periods, but the magnitude of increase in minutes was immaterial (mean [SD] minutes for pre-COVID-19, peak-COVID-19, and post-COVID-19: 6 [18] vs 10 [21] vs 8 [20], respectively; P = .004). No significant increase in turnover time between cases was found between these 3 time periods. Based on metrics from first-start delay and turnover time, our center was able to maintain OR efficiency before, during, and after peak COVID-19.
After the Centers for Disease Control and Prevention released guidelines recommending deferring elective procedures to conserve beds and PPE, VUMC made the decision to suspend all elective surgical procedures from March 18 to April 24, 2020. Prior research conducted during the COVID-19 pandemic has demonstrated more than 400 types of surgical procedures with negatively impacted outcomes when compared to surgical outcomes from the same time frame in 2018 and 2019.4 For more than 20 of these types of procedures, there was a significant association between procedure delay and adverse patient outcomes.4 Testing protocols for patients prior to surgery varied throughout the pandemic based on vaccination status and type of procedure. Before vaccines became widely available, all patients were required to obtain a PCR SARS-CoV-2 test within 48 to 72 hours of the scheduled procedure. If the patient’s procedure was urgent and testing was not feasible, the patient was treated as a SARS-CoV-2–positive patient, which required all health care workers involved in the case to wear gowns, gloves, surgical masks, and eye protection. Testing patients preoperatively likely helped to maintain OR efficiency since not all patients received test results prior to the scheduled procedure, leading to cancellations of cases and therefore more staff available for fewer cases.
After vaccines became widely available to the public, testing requirements for patients preoperatively were relaxed, and only patients who were not fully vaccinated or severely immunocompromised were required to test prior to procedures. However, approximately 40% of the population in Tennessee was fully vaccinated in 2021, which reflects the patient population of VUMC.5 This means that many patients who received care at VUMC were still tested prior to procedures.
Adopting adequate safety protocols was found to be key for OR efficiency during the COVID-19 pandemic since performing surgery increased the risk of infection for each health care worker in the OR.6 VUMC protocols identified procedures that required enhanced safety measures to prevent infection of health care workers and avoid staffing shortages, which would decrease OR efficiency. Protocols mandated that only anesthesia team members were allowed to be in the OR during intubation and extubation of patients, which could be one factor leading to increased delays and decreased efficiency for some institutions. Methods for neurosurgeons to decrease risk of infection in the OR include postponing all nonurgent cases, reappraising the necessity for general anesthesia and endotracheal intubation, considering alternative surgical approaches that avoid the respiratory tract, and limiting the use of aerosol-generating instruments.7,8 VUMC’s success in implementing these protocols likely explains why our center was able to maintain OR efficiency throughout the COVID-19 pandemic.
A study conducted by Andreata et al showed a significantly increased mean first-case delay and a nonsignificant increased turnover time in orthopedic surgeries in Northern Italy when comparing surgeries performed during the COVID-19 pandemic to those performed prior to COVID-19.2 Other studies have indicated a similar trend in decreased OR efficiency during COVID-19 in other areas around the world.9,10 These findings are not consistent with our own findings for neurosurgical and neuroendovascular surgeries at VUMC, and any change at our institution was relatively immaterial. Factors that threatened to change OR efficiency—but did not result in meaningful changes in our institutional experience—include delays due to pending COVID-19 test results, safety procedures such as PPE donning, and planning difficulties to ensure the existence of teams with non-overlapping providers in the case of a surgeon being infected.2,11-13
Globally, many surgery centers halted all elective surgeries during the initial COVID-19 spike to prevent a PPE shortage and mitigate risk of infection of patients and health care workers.8,12,14 However, there is no centralized definition of which neurosurgical procedures are elective, so that decision was made on a surgeon or center level, which could lead to variability in efficiency trends.14 One study on neurosurgical procedures during COVID-19 found a 30% decline in all cases and a 23% decline in emergent procedures, showing that the decrease in volume was not only due to cancellation of elective procedures.15 This decrease in elective and emergent surgeries created a backlog of surgeries as well as a loss in health care revenue, and caused many patients to go without adequate health care.10 Looking forward, it is imperative that surgical centers study trends in OR efficiency from COVID-19 and learn how to better maintain OR efficiency during future pandemic conditions to prevent a backlog of cases, loss of health care revenue, and decreased health care access.
Limitations
Our data are from a single center and therefore may not be representative of experiences of other hospitals due to different populations and different impacts from COVID-19. However, given our center’s high volume and diverse patient population, we believe our analysis highlights important trends in neurosurgery practice. Notably, data for patient and OR timing are digitally generated and are entered manually by nurses in the electronic medical record, making it prone to errors and variability. This is in our experience, and if any error is present, we believe it is minimal.
Conclusion
The COVID-19 pandemic has had far-reaching effects on health care worldwide, including neurosurgical care. OR efficiency across the United States generally worsened given the stresses of supply chain issues, staffing shortages, and cancellations. At our institution, we were able to maintain OR efficiency during the known COVID-19 peaks until October 2021. Continually functional neurosurgical ORs are important in preventing delays in care and maintaining a steady revenue in order for hospitals and other health care entities to remain solvent. Further study of OR efficiency is needed for health care systems to prepare for future pandemics and other resource-straining events in order to provide optimal patient care.
Corresponding author: Campbell Liles, MD, Vanderbilt University Medical Center, Department of Neurological Surgery, 1161 21st Ave. South, T4224 Medical Center North, Nashville, TN 37232-2380; david.c.liles.1@vumc.org
Disclosures: None reported.
1. Koester SW, Catapano JS, Ma KL, et al. COVID-19 and neurosurgery consultation call volume at a single large tertiary center with a propensity- adjusted analysis. World Neurosurg. 2021;146:e768-e772. doi:10.1016/j.wneu.2020.11.017
2. Andreata M, Faraldi M, Bucci E, Lombardi G, Zagra L. Operating room efficiency and timing during coronavirus disease 2019 outbreak in a referral orthopaedic hospital in Northern Italy. Int Orthop. 2020;44(12):2499-2504. doi:10.1007/s00264-020-04772-x
3. Dexter F, Abouleish AE, Epstein RH, et al. Use of operating room information system data to predict the impact of reducing turnover times on staffing costs. Anesth Analg. 2003;97(4):1119-1126. doi:10.1213/01.ANE.0000082520.68800.79
4. Zheng NS, Warner JL, Osterman TJ, et al. A retrospective approach to evaluating potential adverse outcomes associated with delay of procedures for cardiovascular and cancer-related diagnoses in the context of COVID-19. J Biomed Inform. 2021;113:103657. doi:10.1016/j.jbi.2020.103657
5. Alcendor DJ. Targeting COVID-19 vaccine hesitancy in rural communities in Tennessee: implications for extending the COVID- 19 pandemic in the South. Vaccines (Basel). 2021;9(11):1279. doi:10.3390/vaccines9111279
6. Perrone G, Giuffrida M, Bellini V, et al. Operating room setup: how to improve health care professionals safety during pandemic COVID- 19: a quality improvement study. J Laparoendosc Adv Surg Tech A. 2021;31(1):85-89. doi:10.1089/lap.2020.0592
7. Iorio-Morin C, Hodaie M, Sarica C, et al. Letter: the risk of COVID-19 infection during neurosurgical procedures: a review of severe acute respiratory distress syndrome coronavirus 2 (SARS-CoV-2) modes of transmission and proposed neurosurgery-specific measures for mitigation. Neurosurgery. 2020;87(2):E178-E185. doi:10.1093/ neuros/nyaa157
8. Gupta P, Muthukumar N, Rajshekhar V, et al. Neurosurgery and neurology practices during the novel COVID-19 pandemic: a consensus statement from India. Neurol India. 2020;68(2):246-254. doi:10.4103/0028-3886.283130
9. Mercer ST, Agarwal R, Dayananda KSS, et al. A comparative study looking at trauma and orthopaedic operating efficiency in the COVID-19 era. Perioper Care Oper Room Manag. 2020;21:100142. doi:10.1016/j.pcorm.2020.100142
10. Rozario N, Rozario D. Can machine learning optimize the efficiency of the operating room in the era of COVID-19? Can J Surg. 2020;63(6):E527-E529. doi:10.1503/cjs.016520
11. Toh KHQ, Barazanchi A, Rajaretnam NS, et al. COVID-19 response by New Zealand general surgical departments in tertiary metropolitan hospitals. ANZ J Surg. 2021;91(7-8):1352-1357. doi:10.1111/ ans.17044
12. Moorthy RK, Rajshekhar V. Impact of COVID-19 pandemic on neurosurgical practice in India: a survey on personal protective equipment usage, testing, and perceptions on disease transmission. Neurol India. 2020;68(5):1133-1138. doi:10.4103/0028- 3886.299173
13. Meneghini RM. Techniques and strategies to optimize efficiencies in the office and operating room: getting through the patient backlog and preserving hospital resources. J Arthroplasty. 2021;36(7S):S49-S51. doi:10.1016/j.arth.2021.03.010
14. Jean WC, Ironside NT, Sack KD, et al. The impact of COVID- 19 on neurosurgeons and the strategy for triaging non-emergent operations: a global neurosurgery study. Acta Neurochir (Wien). 2020;162(6):1229-1240. doi:10.1007/s00701-020- 04342-5
15. Raneri F, Rustemi O, Zambon G, et al. Neurosurgery in times of a pandemic: a survey of neurosurgical services during the COVID-19 outbreak in the Veneto region in Italy. Neurosurg Focus. 2020;49(6):E9. doi:10.3171/2020.9.FOCUS20691
From the Department of Neurological Surgery, Vanderbilt University Medical Center, Nashville, TN (Stefan W. Koester, Puja Jagasia, and Drs. Liles, Dambrino IV, Feldman, and Chambless), and the Department of Anesthesiology, Vanderbilt University Medical Center, Nashville, TN (Drs. Mathews and Tiwari).
ABSTRACT
Background: The COVID-19 pandemic has had broad effects on surgical care, including operating room (OR) staffing, personal protective equipment (PPE) utilization, and newly implemented anti-infective measures. Our aim was to assess neurosurgery OR efficiency before the COVID-19 pandemic, during peak COVID-19, and during current times.
Methods: Institutional perioperative databases at a single, high-volume neurosurgical center were queried for operations performed from December 2019 until October 2021. March 12, 2020, the day that the state of Tennessee declared a state of emergency, was chosen as the onset of the COVID-19 pandemic. The 90-day periods before and after this day were used to define the pre-COVID-19, peak-COVID-19, and post-peak restrictions time periods for comparative analysis. Outcomes included delay in first-start and OR turnover time between neurosurgical cases. Preset threshold times were used in analyses to adjust for normal leniency in OR scheduling (15 minutes for first start and 90 minutes for turnover). Univariate analysis used Wilcoxon rank-sum test for continuous outcomes, while chi-square test and Fisher’s exact test were used for categorical comparisons. Significance was defined as P < .05.
Results: First-start time was analyzed in 426 pre-COVID-19, 357 peak-restrictions, and 2304 post-peak-restrictions cases. The unadjusted mean delay length was found to be significantly different between the time periods, but the magnitude of increase in minutes was immaterial (mean [SD] minutes, 6 [18] vs 10 [21] vs 8 [20], respectively; P = .004). The adjusted average delay length and proportion of cases delayed beyond the 15-minute threshold were not significantly different. The proportion of cases that started early, as well as significantly early past a 15-minute threshold, have not been impacted. There was no significant change in turnover time during peak restrictions relative to the pre-COVID-19 period (88 [100] minutes vs 85 [95] minutes), and turnover time has since remained unchanged (83 [87] minutes).
Conclusion: Our center was able to maintain OR efficiency before, during, and after peak restrictions even while instituting advanced infection-control strategies. While there were significant changes, delays were relatively small in magnitude.
Keywords: operating room timing, hospital efficiency, socioeconomics, pandemic.
The COVID-19 pandemic has led to major changes in patient care both from a surgical perspective and in regard to inpatient hospital course. Safety protocols nationwide have been implemented to protect both patients and providers. Some elements of surgical care have drastically changed, including operating room (OR) staffing, personal protective equipment (PPE) utilization, and increased sterilization measures. Furloughs, layoffs, and reassignments due to the focus on nonelective and COVID-19–related cases challenged OR staffing and efficiency. Operating room staff with COVID-19 exposures or COVID-19 infections also caused last-minute changes in staffing. All of these scenarios can cause issues due to actual understaffing or due to staff members being pushed into highly specialized areas, such as neurosurgery, in which they have very little experience. A further obstacle to OR efficiency included policy changes involving PPE utilization, sterilization measures, and supply chain shortages of necessary resources such as PPE.
Neurosurgery in particular has been susceptible to COVID-19–related system-wide changes given operator proximity to the patient’s respiratory passages, frequency of emergent cases, and varying anesthetic needs, as well as the high level of specialization needed to perform neurosurgical care. Previous studies have shown a change in the makeup of neurosurgical patients seeking care, as well as in the acuity of neurological consult of these patients.1 A study in orthopedic surgery by Andreata et al demonstrated worsened OR efficiency, with significantly increased first-start and turnover times.2 In the COVID-19 era, OR quality and safety are crucially important to both patients and providers. Providing this safe and effective care in an efficient manner is important for optimal neurosurgical management in the long term.3 Moreover, the financial burden of implementing new protocols and standards can be compounded by additional financial losses due to reduced OR efficiency.
Methods
To analyze the effect of COVID-19 on neurosurgical OR efficiency, institutional perioperative databases at a single high-volume center were queried for operations performed from December 2019 until October 2021. March 12, 2020, was chosen as the onset of COVID-19 for analytic purposes, as this was the date when the state of Tennessee declared a state of emergency. The 90-day periods before and after this date were used for comparative analysis for pre-COVID-19, peak COVID-19, and post-peak-restrictions time periods. The peak COVID-19 period was defined as the 90-day period following the initial onset of COVID-19 and the surge of cases. For comparison purposes, post-peak COVID-19 was defined as the months following the first peak until October 2021 (approximately 17 months). COVID-19 burden was determined using a COVID-19 single-institution census of confirmed cases by polymerase chain reaction (PCR) for which the average number of cases of COVID-19 during a given month was determined. This number is a scaled trend, and a true number of COVID-19 cases in our hospital was not reported.
Neurosurgical and neuroendovascular cases were included in the analysis. Outcomes included delay in first-start and OR turnover time between neurosurgical cases, defined as the time from the patient leaving the room until the next patient entered the room. Preset threshold times were used in analyses to adjust for normal leniency in OR scheduling (15 minutes for first start and 90 minutes for turnover, which is a standard for our single-institution perioperative center). Statistical analyses, including data aggregation, were performed using R, version 4.0.1 (R Foundation for Statistical Computing). Patients’ demographic and clinical characteristics were analyzed using an independent 2-sample t-test for interval variables and a chi-square test for categorical variables. Significance was defined as P < .05.
Results
First-Start Time
First-start time was analyzed in 426 pre-COVID-19, 357 peak-COVID-19, and 2304 post-peak-COVID-19 cases. The unadjusted mean delay length was significantly different between the time periods, but the magnitude of increase in minutes was immaterial (mean [SD] minutes, 6 [18] vs 10 [21] vs 8 [20], respectively; P = .004) (Table 1).
The adjusted average delay length and proportion of cases delayed beyond the 15-minute threshold were not significantly different, but they have been slightly higher since the onset of COVID-19. The proportion of cases that have started early, as well as significantly early past a 15-minute threshold, have also trended down since the onset of the COVID-19 pandemic, but this difference was again not significant. The temporal relationship of first-start delay, both unadjusted and adjusted, from December 2019 to October 2021 is shown in Figure 1. The trend of increasing delay is loosely associated with the COVID-19 burden experienced by our hospital. The start of COVID-19 as well as both COVID-19 peaks have been associated with increased delays in our hospital.
Turnover Time
Turnover time was assessed in 437 pre-COVID-19, 278 peak-restrictions, and 2411 post-peak-restrictions cases. Turnover time during peak restrictions was not significantly different from pre-COVID-19 (88 [100] vs 85 [95]) and has since remained relatively unchanged (83 [87], P = .78). A similar trend held for comparisons of proportion of cases with turnover time past 90 minutes and average times past the 90-minute threshold (Table 2). The temporal relationship between COVID-19 burden and turnover time, both unadjusted and adjusted, from December 2019 to October 2021 is shown in Figure 2. Both figures demonstrate a slight initial increase in turnover time delay at the start of COVID-19, which stabilized with little variation thereafter.
Discussion
We analyzed the OR efficiency metrics of first-start and turnover time during the 90-day period before COVID-19 (pre-COVID-19), the 90 days following Tennessee declaring a state of emergency (peak COVID-19), and the time following this period (post-COVID-19) for all neurosurgical and neuroendovascular cases at Vanderbilt University Medical Center (VUMC). We found a significant difference in unadjusted mean delay length in first-start time between the time periods, but the magnitude of increase in minutes was immaterial (mean [SD] minutes for pre-COVID-19, peak-COVID-19, and post-COVID-19: 6 [18] vs 10 [21] vs 8 [20], respectively; P = .004). No significant increase in turnover time between cases was found between these 3 time periods. Based on metrics from first-start delay and turnover time, our center was able to maintain OR efficiency before, during, and after peak COVID-19.
After the Centers for Disease Control and Prevention released guidelines recommending deferring elective procedures to conserve beds and PPE, VUMC made the decision to suspend all elective surgical procedures from March 18 to April 24, 2020. Prior research conducted during the COVID-19 pandemic has demonstrated more than 400 types of surgical procedures with negatively impacted outcomes when compared to surgical outcomes from the same time frame in 2018 and 2019.4 For more than 20 of these types of procedures, there was a significant association between procedure delay and adverse patient outcomes.4 Testing protocols for patients prior to surgery varied throughout the pandemic based on vaccination status and type of procedure. Before vaccines became widely available, all patients were required to obtain a PCR SARS-CoV-2 test within 48 to 72 hours of the scheduled procedure. If the patient’s procedure was urgent and testing was not feasible, the patient was treated as a SARS-CoV-2–positive patient, which required all health care workers involved in the case to wear gowns, gloves, surgical masks, and eye protection. Testing patients preoperatively likely helped to maintain OR efficiency since not all patients received test results prior to the scheduled procedure, leading to cancellations of cases and therefore more staff available for fewer cases.
After vaccines became widely available to the public, testing requirements for patients preoperatively were relaxed, and only patients who were not fully vaccinated or severely immunocompromised were required to test prior to procedures. However, approximately 40% of the population in Tennessee was fully vaccinated in 2021, which reflects the patient population of VUMC.5 This means that many patients who received care at VUMC were still tested prior to procedures.
Adopting adequate safety protocols was found to be key for OR efficiency during the COVID-19 pandemic since performing surgery increased the risk of infection for each health care worker in the OR.6 VUMC protocols identified procedures that required enhanced safety measures to prevent infection of health care workers and avoid staffing shortages, which would decrease OR efficiency. Protocols mandated that only anesthesia team members were allowed to be in the OR during intubation and extubation of patients, which could be one factor leading to increased delays and decreased efficiency for some institutions. Methods for neurosurgeons to decrease risk of infection in the OR include postponing all nonurgent cases, reappraising the necessity for general anesthesia and endotracheal intubation, considering alternative surgical approaches that avoid the respiratory tract, and limiting the use of aerosol-generating instruments.7,8 VUMC’s success in implementing these protocols likely explains why our center was able to maintain OR efficiency throughout the COVID-19 pandemic.
A study conducted by Andreata et al showed a significantly increased mean first-case delay and a nonsignificant increased turnover time in orthopedic surgeries in Northern Italy when comparing surgeries performed during the COVID-19 pandemic to those performed prior to COVID-19.2 Other studies have indicated a similar trend in decreased OR efficiency during COVID-19 in other areas around the world.9,10 These findings are not consistent with our own findings for neurosurgical and neuroendovascular surgeries at VUMC, and any change at our institution was relatively immaterial. Factors that threatened to change OR efficiency—but did not result in meaningful changes in our institutional experience—include delays due to pending COVID-19 test results, safety procedures such as PPE donning, and planning difficulties to ensure the existence of teams with non-overlapping providers in the case of a surgeon being infected.2,11-13
Globally, many surgery centers halted all elective surgeries during the initial COVID-19 spike to prevent a PPE shortage and mitigate risk of infection of patients and health care workers.8,12,14 However, there is no centralized definition of which neurosurgical procedures are elective, so that decision was made on a surgeon or center level, which could lead to variability in efficiency trends.14 One study on neurosurgical procedures during COVID-19 found a 30% decline in all cases and a 23% decline in emergent procedures, showing that the decrease in volume was not only due to cancellation of elective procedures.15 This decrease in elective and emergent surgeries created a backlog of surgeries as well as a loss in health care revenue, and caused many patients to go without adequate health care.10 Looking forward, it is imperative that surgical centers study trends in OR efficiency from COVID-19 and learn how to better maintain OR efficiency during future pandemic conditions to prevent a backlog of cases, loss of health care revenue, and decreased health care access.
Limitations
Our data are from a single center and therefore may not be representative of experiences of other hospitals due to different populations and different impacts from COVID-19. However, given our center’s high volume and diverse patient population, we believe our analysis highlights important trends in neurosurgery practice. Notably, data for patient and OR timing are digitally generated and are entered manually by nurses in the electronic medical record, making it prone to errors and variability. This is in our experience, and if any error is present, we believe it is minimal.
Conclusion
The COVID-19 pandemic has had far-reaching effects on health care worldwide, including neurosurgical care. OR efficiency across the United States generally worsened given the stresses of supply chain issues, staffing shortages, and cancellations. At our institution, we were able to maintain OR efficiency during the known COVID-19 peaks until October 2021. Continually functional neurosurgical ORs are important in preventing delays in care and maintaining a steady revenue in order for hospitals and other health care entities to remain solvent. Further study of OR efficiency is needed for health care systems to prepare for future pandemics and other resource-straining events in order to provide optimal patient care.
Corresponding author: Campbell Liles, MD, Vanderbilt University Medical Center, Department of Neurological Surgery, 1161 21st Ave. South, T4224 Medical Center North, Nashville, TN 37232-2380; david.c.liles.1@vumc.org
Disclosures: None reported.
1. Koester SW, Catapano JS, Ma KL, et al. COVID-19 and neurosurgery consultation call volume at a single large tertiary center with a propensity- adjusted analysis. World Neurosurg. 2021;146:e768-e772. doi:10.1016/j.wneu.2020.11.017
2. Andreata M, Faraldi M, Bucci E, Lombardi G, Zagra L. Operating room efficiency and timing during coronavirus disease 2019 outbreak in a referral orthopaedic hospital in Northern Italy. Int Orthop. 2020;44(12):2499-2504. doi:10.1007/s00264-020-04772-x
3. Dexter F, Abouleish AE, Epstein RH, et al. Use of operating room information system data to predict the impact of reducing turnover times on staffing costs. Anesth Analg. 2003;97(4):1119-1126. doi:10.1213/01.ANE.0000082520.68800.79
4. Zheng NS, Warner JL, Osterman TJ, et al. A retrospective approach to evaluating potential adverse outcomes associated with delay of procedures for cardiovascular and cancer-related diagnoses in the context of COVID-19. J Biomed Inform. 2021;113:103657. doi:10.1016/j.jbi.2020.103657
5. Alcendor DJ. Targeting COVID-19 vaccine hesitancy in rural communities in Tennessee: implications for extending the COVID- 19 pandemic in the South. Vaccines (Basel). 2021;9(11):1279. doi:10.3390/vaccines9111279
6. Perrone G, Giuffrida M, Bellini V, et al. Operating room setup: how to improve health care professionals safety during pandemic COVID- 19: a quality improvement study. J Laparoendosc Adv Surg Tech A. 2021;31(1):85-89. doi:10.1089/lap.2020.0592
7. Iorio-Morin C, Hodaie M, Sarica C, et al. Letter: the risk of COVID-19 infection during neurosurgical procedures: a review of severe acute respiratory distress syndrome coronavirus 2 (SARS-CoV-2) modes of transmission and proposed neurosurgery-specific measures for mitigation. Neurosurgery. 2020;87(2):E178-E185. doi:10.1093/ neuros/nyaa157
8. Gupta P, Muthukumar N, Rajshekhar V, et al. Neurosurgery and neurology practices during the novel COVID-19 pandemic: a consensus statement from India. Neurol India. 2020;68(2):246-254. doi:10.4103/0028-3886.283130
9. Mercer ST, Agarwal R, Dayananda KSS, et al. A comparative study looking at trauma and orthopaedic operating efficiency in the COVID-19 era. Perioper Care Oper Room Manag. 2020;21:100142. doi:10.1016/j.pcorm.2020.100142
10. Rozario N, Rozario D. Can machine learning optimize the efficiency of the operating room in the era of COVID-19? Can J Surg. 2020;63(6):E527-E529. doi:10.1503/cjs.016520
11. Toh KHQ, Barazanchi A, Rajaretnam NS, et al. COVID-19 response by New Zealand general surgical departments in tertiary metropolitan hospitals. ANZ J Surg. 2021;91(7-8):1352-1357. doi:10.1111/ ans.17044
12. Moorthy RK, Rajshekhar V. Impact of COVID-19 pandemic on neurosurgical practice in India: a survey on personal protective equipment usage, testing, and perceptions on disease transmission. Neurol India. 2020;68(5):1133-1138. doi:10.4103/0028- 3886.299173
13. Meneghini RM. Techniques and strategies to optimize efficiencies in the office and operating room: getting through the patient backlog and preserving hospital resources. J Arthroplasty. 2021;36(7S):S49-S51. doi:10.1016/j.arth.2021.03.010
14. Jean WC, Ironside NT, Sack KD, et al. The impact of COVID- 19 on neurosurgeons and the strategy for triaging non-emergent operations: a global neurosurgery study. Acta Neurochir (Wien). 2020;162(6):1229-1240. doi:10.1007/s00701-020- 04342-5
15. Raneri F, Rustemi O, Zambon G, et al. Neurosurgery in times of a pandemic: a survey of neurosurgical services during the COVID-19 outbreak in the Veneto region in Italy. Neurosurg Focus. 2020;49(6):E9. doi:10.3171/2020.9.FOCUS20691

Best Practice Implementation and Clinical Inertia
From the Department of Medicine, Brigham and Women’s Hospital, and Harvard Medical School, Boston, MA.
Clinical inertia is defined as the failure of clinicians to initiate or escalate guideline-directed medical therapy to achieve treatment goals for well-defined clinical conditions.1,2 Evidence-based guidelines recommend optimal disease management with readily available medical therapies throughout the phases of clinical care. Unfortunately, the care provided to individual patients undergoes multiple modifications throughout the disease course, resulting in divergent pathways, significant deviations from treatment guidelines, and failure of “safeguard” checkpoints to reinstate, initiate, optimize, or stop treatments. Clinical inertia generally describes rigidity or resistance to change around implementing evidence-based guidelines. Furthermore, this term describes treatment behavior on the part of an individual clinician, not organizational inertia, which generally encompasses both internal (immediate clinical practice settings) and external factors (national and international guidelines and recommendations), eventually leading to resistance to optimizing disease treatment and therapeutic regimens. Individual clinicians’ clinical inertia in the form of resistance to guideline implementation and evidence-based principles can be one factor that drives organizational inertia. In turn, such individual behavior can be dictated by personal beliefs, knowledge, interpretation, skills, management principles, and biases. The terms therapeutic inertia or clinical inertia should not be confused with nonadherence from the patient’s standpoint when the clinician follows the best practice guidelines.3
Clinical inertia has been described in several clinical domains, including diabetes,4,5 hypertension,6,7 heart failure,8 depression,9 pulmonary medicine,10 and complex disease management.11 Clinicians can set suboptimal treatment goals due to specific beliefs and attitudes around optimal therapeutic goals. For example, when treating a patient with a chronic disease that is presently stable, a clinician could elect to initiate suboptimal treatment, as escalation of treatment might not be the priority in stable disease; they also may have concerns about overtreatment. Other factors that can contribute to clinical inertia (ie, undertreatment in the presence of indications for treatment) include those related to the patient, the clinical setting, and the organization, along with the importance of individualizing therapies in specific patients. Organizational inertia is the initial global resistance by the system to implementation, which can slow the dissemination and adaptation of best practices but eventually declines over time. Individual clinical inertia, on the other hand, will likely persist after the system-level rollout of guideline-based approaches.
The trajectory of dissemination, implementation, and adaptation of innovations and best practices is illustrated in the Figure. When the guidelines and medical societies endorse the adaptation of innovations or practice change after the benefits of such innovations/change have been established by the regulatory bodies, uptake can be hindered by both organizational and clinical inertia. Overcoming inertia to system-level changes requires addressing individual clinicians, along with practice and organizational factors, in order to ensure systematic adaptations. From the clinicians’ view, training and cognitive interventions to improve the adaptation and coping skills can improve understanding of treatment options through standardized educational and behavioral modification tools, direct and indirect feedback around performance, and decision support through a continuous improvement approach on both individual and system levels.

Addressing inertia in clinical practice requires a deep understanding of the individual and organizational elements that foster resistance to adapting best practice models. Research that explores tools and approaches to overcome inertia in managing complex diseases is a key step in advancing clinical innovation and disseminating best practices.
Corresponding author: Ebrahim Barkoudah, MD, MPH; ebarkoudah@bwh.harvard.edu
Disclosures: None reported.
1. Phillips LS, Branch WT, Cook CB, et al. Clinical inertia. Ann Intern Med. 2001;135(9):825-834. doi:10.7326/0003-4819-135-9-200111060-00012
2. Allen JD, Curtiss FR, Fairman KA. Nonadherence, clinical inertia, or therapeutic inertia? J Manag Care Pharm. 2009;15(8):690-695. doi:10.18553/jmcp.2009.15.8.690
3. Zafar A, Davies M, Azhar A, Khunti K. Clinical inertia in management of T2DM. Prim Care Diabetes. 2010;4(4):203-207. doi:10.1016/j.pcd.2010.07.003
4. Khunti K, Davies MJ. Clinical inertia—time to reappraise the terminology? Prim Care Diabetes. 2017;11(2):105-106. doi:10.1016/j.pcd.2017.01.007
5. O’Connor PJ. Overcome clinical inertia to control systolic blood pressure. Arch Intern Med. 2003;163(22):2677-2678. doi:10.1001/archinte.163.22.2677
6. Faria C, Wenzel M, Lee KW, et al. A narrative review of clinical inertia: focus on hypertension. J Am Soc Hypertens. 2009;3(4):267-276. doi:10.1016/j.jash.2009.03.001
7. Jarjour M, Henri C, de Denus S, et al. Care gaps in adherence to heart failure guidelines: clinical inertia or physiological limitations? JACC Heart Fail. 2020;8(9):725-738. doi:10.1016/j.jchf.2020.04.019
8. Henke RM, Zaslavsky AM, McGuire TG, et al. Clinical inertia in depression treatment. Med Care. 2009;47(9):959-67. doi:10.1097/MLR.0b013e31819a5da0
9. Cooke CE, Sidel M, Belletti DA, Fuhlbrigge AL. Clinical inertia in the management of chronic obstructive pulmonary disease. COPD. 2012;9(1):73-80. doi:10.3109/15412555.2011.631957
10. Whitford DL, Al-Anjawi HA, Al-Baharna MM. Impact of clinical inertia on cardiovascular risk factors in patients with diabetes. Prim Care Diabetes. 2014;8(2):133-138. doi:10.1016/j.pcd.2013.10.007
From the Department of Medicine, Brigham and Women’s Hospital, and Harvard Medical School, Boston, MA.
Clinical inertia is defined as the failure of clinicians to initiate or escalate guideline-directed medical therapy to achieve treatment goals for well-defined clinical conditions.1,2 Evidence-based guidelines recommend optimal disease management with readily available medical therapies throughout the phases of clinical care. Unfortunately, the care provided to individual patients undergoes multiple modifications throughout the disease course, resulting in divergent pathways, significant deviations from treatment guidelines, and failure of “safeguard” checkpoints to reinstate, initiate, optimize, or stop treatments. Clinical inertia generally describes rigidity or resistance to change around implementing evidence-based guidelines. Furthermore, this term describes treatment behavior on the part of an individual clinician, not organizational inertia, which generally encompasses both internal (immediate clinical practice settings) and external factors (national and international guidelines and recommendations), eventually leading to resistance to optimizing disease treatment and therapeutic regimens. Individual clinicians’ clinical inertia in the form of resistance to guideline implementation and evidence-based principles can be one factor that drives organizational inertia. In turn, such individual behavior can be dictated by personal beliefs, knowledge, interpretation, skills, management principles, and biases. The terms therapeutic inertia or clinical inertia should not be confused with nonadherence from the patient’s standpoint when the clinician follows the best practice guidelines.3
Clinical inertia has been described in several clinical domains, including diabetes,4,5 hypertension,6,7 heart failure,8 depression,9 pulmonary medicine,10 and complex disease management.11 Clinicians can set suboptimal treatment goals due to specific beliefs and attitudes around optimal therapeutic goals. For example, when treating a patient with a chronic disease that is presently stable, a clinician could elect to initiate suboptimal treatment, as escalation of treatment might not be the priority in stable disease; they also may have concerns about overtreatment. Other factors that can contribute to clinical inertia (ie, undertreatment in the presence of indications for treatment) include those related to the patient, the clinical setting, and the organization, along with the importance of individualizing therapies in specific patients. Organizational inertia is the initial global resistance by the system to implementation, which can slow the dissemination and adaptation of best practices but eventually declines over time. Individual clinical inertia, on the other hand, will likely persist after the system-level rollout of guideline-based approaches.
The trajectory of dissemination, implementation, and adaptation of innovations and best practices is illustrated in the Figure. When the guidelines and medical societies endorse the adaptation of innovations or practice change after the benefits of such innovations/change have been established by the regulatory bodies, uptake can be hindered by both organizational and clinical inertia. Overcoming inertia to system-level changes requires addressing individual clinicians, along with practice and organizational factors, in order to ensure systematic adaptations. From the clinicians’ view, training and cognitive interventions to improve the adaptation and coping skills can improve understanding of treatment options through standardized educational and behavioral modification tools, direct and indirect feedback around performance, and decision support through a continuous improvement approach on both individual and system levels.
Addressing inertia in clinical practice requires a deep understanding of the individual and organizational elements that foster resistance to adapting best practice models. Research that explores tools and approaches to overcome inertia in managing complex diseases is a key step in advancing clinical innovation and disseminating best practices.
Corresponding author: Ebrahim Barkoudah, MD, MPH; ebarkoudah@bwh.harvard.edu
Disclosures: None reported.
1. Phillips LS, Branch WT, Cook CB, et al. Clinical inertia. Ann Intern Med. 2001;135(9):825-834. doi:10.7326/0003-4819-135-9-200111060-00012
2. Allen JD, Curtiss FR, Fairman KA. Nonadherence, clinical inertia, or therapeutic inertia? J Manag Care Pharm. 2009;15(8):690-695. doi:10.18553/jmcp.2009.15.8.690
3. Zafar A, Davies M, Azhar A, Khunti K. Clinical inertia in management of T2DM. Prim Care Diabetes. 2010;4(4):203-207. doi:10.1016/j.pcd.2010.07.003
4. Khunti K, Davies MJ. Clinical inertia—time to reappraise the terminology? Prim Care Diabetes. 2017;11(2):105-106. doi:10.1016/j.pcd.2017.01.007
5. O’Connor PJ. Overcome clinical inertia to control systolic blood pressure. Arch Intern Med. 2003;163(22):2677-2678. doi:10.1001/archinte.163.22.2677
6. Faria C, Wenzel M, Lee KW, et al. A narrative review of clinical inertia: focus on hypertension. J Am Soc Hypertens. 2009;3(4):267-276. doi:10.1016/j.jash.2009.03.001
7. Jarjour M, Henri C, de Denus S, et al. Care gaps in adherence to heart failure guidelines: clinical inertia or physiological limitations? JACC Heart Fail. 2020;8(9):725-738. doi:10.1016/j.jchf.2020.04.019
8. Henke RM, Zaslavsky AM, McGuire TG, et al. Clinical inertia in depression treatment. Med Care. 2009;47(9):959-67. doi:10.1097/MLR.0b013e31819a5da0
9. Cooke CE, Sidel M, Belletti DA, Fuhlbrigge AL. Clinical inertia in the management of chronic obstructive pulmonary disease. COPD. 2012;9(1):73-80. doi:10.3109/15412555.2011.631957
10. Whitford DL, Al-Anjawi HA, Al-Baharna MM. Impact of clinical inertia on cardiovascular risk factors in patients with diabetes. Prim Care Diabetes. 2014;8(2):133-138. doi:10.1016/j.pcd.2013.10.007
A plane crash interrupts a doctor’s vacation
Emergencies happen anywhere, anytime – and sometimes physicians find themselves in situations where they are the only ones who can help. “Is There a Doctor in the House?” is a new series telling these stories.
When the plane crashed, I was asleep. I had arrived the evening before with my wife and three sons at a house on Kezar Lake on the Maine–New Hampshire border. I jumped out of bed and ran downstairs. My kids had been watching a float plane circling and gliding along the lake. It had crashed into the water and flipped upside down. My oldest brother-in-law jumped into his ski boat and we sped out to the scene.
All we can see are the plane’s pontoons. The rest is underwater. A woman has already surfaced, screaming. I dive in.
I find the woman’s husband and 3-year-old son struggling to get free from the plane through the smashed windshield. They manage to get to the surface. The pilot is dead, impaled through the chest by the left wing strut.
The big problem: A little girl, whom I would learn later is named Lauren, remained trapped. The water is murky but I can see her, a 5- or 6-year-old girl with this long hair, strapped in upside down and unconscious.
The mom and I dive down over and over, pulling and ripping at the door. We cannot get it open. Finally, I’m able to bend the door open enough where I can reach in, but I can’t undo the seatbelt. In my mind, I’m debating, should I try and go through the front windshield? I’m getting really tired, I can tell there’s fuel in the water, and I don’t want to drown in the plane. So I pop up to the surface and yell, “Does anyone have a knife?”
My brother-in-law shoots back to shore in the boat, screaming, “Get a knife!” My niece gets in the boat with one. I’m standing on the pontoon, and my niece is in the front of the boat calling, “Uncle Todd! Uncle Todd!” and she throws the knife. It goes way over my head. I can’t even jump for it, it’s so high.
I have to get the knife. So, I dive into the water to try and find it. Somehow, the black knife has landed on the white wing, 4 or 5 feet under the water. Pure luck. It could have sunk down a hundred feet into the lake. I grab the knife and hand it to the mom, Beth. She’s able to cut the seatbelt, and we both pull Lauren to the surface.
I lay her out on the pontoon. She has no pulse and her pupils are fixed and dilated. Her mom is yelling, “She’s dead, isn’t she?” I start CPR. My skin and eyes are burning from the airplane fuel in the water. I get her breathing, and her heart comes back very quickly. Lauren starts to vomit and I’m trying to keep her airway clear. She’s breathing spontaneously and she has a pulse, so I decide it’s time to move her to shore.
We pull the boat up to the dock and Lauren’s now having anoxic seizures. Her brain has been without oxygen, and now she’s getting perfused again. We get her to shore and lay her on the lawn. I’m still doing mouth-to-mouth, but she’s seizing like crazy, and I don’t have any way to control that. Beth is crying and wants to hold her daughter gently while I’m working.
Someone had called 911, and finally this dude shows up with an ambulance, and it’s like something out of World War II. All he has is an oxygen tank, but the mask is old and cracked. It’s too big for Lauren, but it sort of fits me, so I’m sucking in oxygen and blowing it into the girl’s mouth. I’m doing whatever I can, but I don’t have an IV to start. I have no fluids. I got nothing.
As it happens, I’d done my emergency medicine training at Maine Medical Center, so I tell someone to call them and get a Life Flight chopper. We have to drive somewhere where the chopper can land, so we take the ambulance to the parking lot of the closest store called the Wicked Good Store. That’s a common thing in Maine. Everything is “wicked good.”
The whole town is there by that point. The chopper arrives. The ambulance doors pop open and a woman says, “Todd?” And I say, “Heather?”
Heather is an emergency flight nurse whom I’d trained with many years ago. There’s immediate trust. She has all the right equipment. We put in breathing tubes and IVs. We stop Lauren from seizing. The kid is soon stable.
There is only one extra seat in the chopper, so I tell Beth to go. They take off.
Suddenly, I begin to doubt my decision. Lauren had been underwater for 15 minutes at minimum. I know how long that is. Did I do the right thing? Did I resuscitate a brain-dead child? I didn’t think about it at the time, but if that patient had come to me in the emergency department, I’m honestly not sure what I would have done.
So, I go home. And I don’t get a call. The FAA and sheriff arrive to take statements from us. I don’t hear from anyone.
The next day I start calling. No one will tell me anything, so I finally get to one of the pediatric ICU attendings who had trained me. He says Lauren literally woke up and said, “I have to go pee.” And that was it. She was 100% normal. I couldn’t believe it.
Here’s a theory: In kids, there’s something called the glottic reflex. I think her glottic reflex went off as soon as she hit the water, which basically closed her airway. So when she passed out, she could never get enough water in her lungs and still had enough air in there to keep her alive. Later, I got a call from her uncle. He could barely get the words out because he was in tears. He said Lauren was doing beautifully.
Three days later, I drove to Lauren’s house with my wife and kids. I had her read to me. I watched her play on the jungle gym for motor function. All sorts of stuff. She was totally normal.
Beth told us that the night before the accident, her mother had given the women in her family what she called a “miracle bracelet,” a bracelet that is supposed to give you one miracle in your life. Beth said she had the bracelet on her wrist the day of the accident, and now it’s gone. “Saving Lauren’s life was my miracle,” she said.
Funny thing: For 20 years, I ran all the EMS, police, fire, ambulance, in Boulder, Colo., where I live. I wrote all the protocols, and I would never advise any of my paramedics to dive into jet fuel to save someone. That was risky. But at the time, it was totally automatic. I think it taught me not to give up in certain situations, because you really don’t know.
Dr. Dorfman is an emergency medicine physician in Boulder, Colo., and medical director at Cedalion Health.
A version of this article first appeared on Medscape.com.
Is there a doctor on the plane? Tips for providing in-flight assistance
In most cases, passengers on an airline flight are representative of the general population, which means that anyone could have an emergency at any time.
as determined on the basis of in-flight medical emergencies that resulted in calls to a physician-directed medical communications center, said Amy Faith Ho, MD, MPH of Integrative Emergency Services, Dallas–Fort Worth, in a presentation at the annual meeting of the American College of Emergency Physicians.
The study authors reviewed records of 11,920 in-flight medical emergencies between Jan. 1, 2008, and Oct. 31, 2010. The data showed that physician passengers provided medical assistance in nearly half of in-flight emergencies (48.1%) and that flights were diverted because of the emergency in 7.3% of cases.
The majority of the in-flight emergencies involved syncope or presyncope (37.4% of cases), followed by respiratory symptoms (12.1%) and nausea or vomiting (9.5%), according to the study.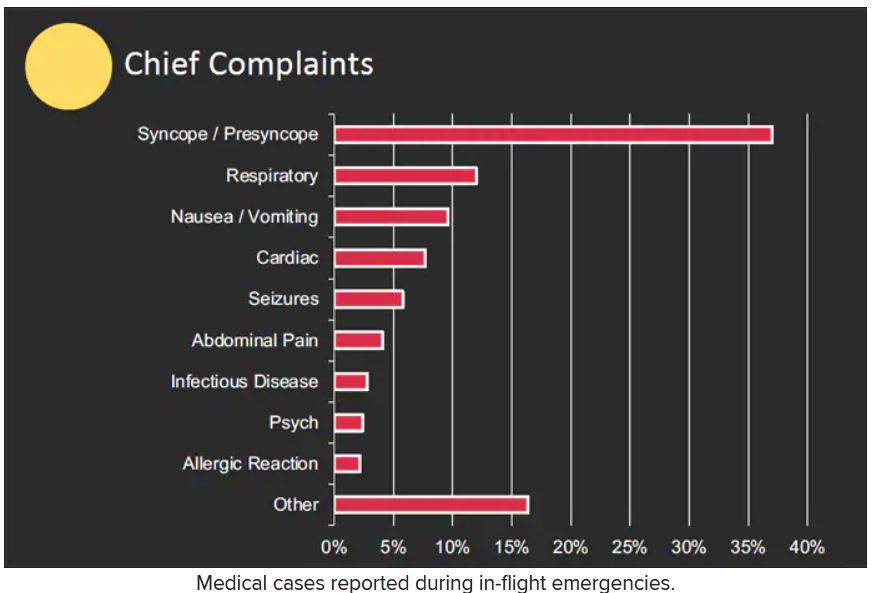
When a physician is faced with an in-flight emergency, the medical team includes the physician himself, medical ground control, and the flight attendants, said Dr. Ho. Requirements may vary among airlines, but all flight attendants will be trained in cardiopulmonary resuscitation (CPR) or basic life support, as well as use of automated external defibrillators (AEDs).
Physician call centers (medical ground control) can provide additional assistance remotely, she said.
The in-flight medical bag
Tools in a physician’s in-flight toolbox start with the first-aid kit. Airplanes also have an emergency medical kit (EMK), an oxygen tank, and an AED.
The minimum EMK contents are mandated by the Federal Aviation Administration, said Dr. Ho. The standard equipment includes a stethoscope, a sphygmomanometer, and three sizes of oropharyngeal airways. Other items include self-inflating manual resuscitation devices and CPR masks in thee sizes, alcohol sponges, gloves, adhesive tape, scissors, a tourniquet, as well as saline solution, needles, syringes, and an intravenous administration set consisting of tubing and two Y connectors.
An EMK also should contain the following medications: nonnarcotic analgesic tablets, antihistamine tablets, an injectable antihistamine, atropine, aspirin tablets, a bronchodilator, and epinephrine (both 1:1000; 1 injectable cc and 1:10,000; two injectable cc). Nitroglycerin tablets and 5 cc of 20 mg/mL injectable cardiac lidocaine are part of the mandated kit as well, according to Dr. Ho.
Some airlines carry additional supplies on all their flights, said Dr. Ho. Notably, American Airlines and British Airways carry EpiPens for adults and children, as well as opioid reversal medication (naloxone) and glucose for managing low blood sugar. American Airlines and Delta stock antiemetics, and Delta also carries naloxone. British Airways is unique in stocking additional cardiac medications, both oral and injectable.
How to handle an in-flight emergency
Physicians should always carry a copy of their medical license when traveling for documentation by the airline if they assist in a medical emergency during a flight, Dr. Ho emphasized. “Staff” personnel should be used. These include the flight attendants, medical ground control, and other passengers who might have useful skills, such as nursing, the ability to perform CPR, or therapy/counseling to calm a frightened patient. If needed, “crowdsource additional supplies from passengers,” such as a glucometer or pulse oximeter.
Legal lessons
Physicians are not obligated to assist during an in-flight medical emergency, said Dr. Ho. Legal jurisdiction can vary. In the United States, a bystander who assists in an emergency is generally protected by Good Samaritan laws; for international airlines, the laws may vary; those where the airline is based usually apply.
The Aviation Medical Assistance Act, passed in 1998, protects individuals from being sued for negligence while providing medical assistance, “unless the individual, while rendering such assistance, is guilty of gross negligence of willful misconduct,” Dr. Ho noted. The Aviation Medical Assistance Act also protects the airline itself “if the carrier in good faith believes that the passenger is a medically qualified individual.”
Dr. Ho disclosed no relevant financial relationships.
A version of this article first appeared on Medscape.com.
FROM ACEP 2022
Downward trend in Medicare payments for GI services
“When Medicare reimbursements decrease, health outcomes, health care access, and patient satisfaction may be affected, particularly in light of high inflation and increased costs due to staffing shortages, increased staffing salaries, and additional equipment necessary for COVID-19 safety,” researchers wrote in The American Journal of Gastroenterology.
Samir A. Shah, MD, of Brown University, Providence, R.I., and colleagues evaluated trends from 2007 to 2022 in Medicare reimbursement for the top 10 common GI procedures.
These procedures, which included colonoscopies, endoscopies, and gastrostomy tube placement, were identified through a joint list published by the American College of Gastroenterology, the American Society of Gastrointestinal Endoscopy, and the American Gastroenterological Association (AGA).
From 2007 to 2022, unadjusted and adjusted reimbursement for GI procedures declined by 7% and 33%, respectively, on average.
The adjusted change in physician reimbursement ranged from a decrease of roughly 29% for esophagus endoscopy to 38% for colonoscopy and biopsy, the study team found.
They found that the decline in reimbursement of GI procedures was significantly larger after 2015 (P < .001).
From 2007 to 2014, the mean decrease in physician reimbursement for GI services was 6.7%, and the annual growth rate in reimbursement was –1.0%.
In comparison, from 2015 to 2022, the mean decrease in physician reimbursement was 28.2%, and the mean annual growth rate in reimbursement was –4.7%.
To examine trends in reimbursement for office and inpatient visits from 2007 to 2022, the researchers identified the top five current procedural terminology (CPT) codes from outpatient office and inpatient consult visits provided to Medicare Part B beneficiaries by gastroenterologists.
In contrast to the reimbursement trends for GI procedures, the unadjusted physician reimbursement for inpatient and outpatient visits showed an average increase of 32%.
However, after adjustment for inflation, physician reimbursement for patient visits showed an average decline of 4.9%.
Overall, reimbursement for outpatient visits increased by 4.3%, while reimbursement for inpatient visits decreased by 18.8%.
Dr. Shah and colleagues said their findings are important, given that Medicare patients make up a substantial and growing proportion of patients with GI problems and because fewer than 1% of gastroenterologists have opted out of Medicare.
They noted that the trends in GI reimbursement they observed mirror trends in other specialties, which have also noted a decrease in adjusted reimbursement for care.
Physicians are once again facing cuts of at least 4.5% on Jan. 1, 2023, unless Congress acts. AGA and the entire medical community continue to call on Congress to make statutory changes to the Medicare payment system to address these payment challenges. Specifically, AGA and the physician community have recommended that payment rates include an inflationary adjustment similar to what other providers, such as hospitals, nursing homes, and ambulatory surgery centers, receive to account for practice, equipment, labor, and other costs associated with running a clinical practice.
AGA continues to urge physicians to write federal lawmakers to educate Congress about the detrimental effects of payment cuts, noting that the cuts, when coupled with rising inflation, increased administrative burdens, and staffing shortages, will negatively impact patients’ access to care.
The study had no financial support. The authors have disclosed no relevant financial relationships.
--From Staff Reports
FROM THE AMERICAN JOURNAL OF GASTROENTEROLOGY
Physicians react: Climate change and other social issues
Around half of them rated climate change among their five most important issues. Slightly lower percentages of doctors prioritized domestic violence and immigration/refugee policies that highly, and about 40% did so regarding reproductive rights in the United States.
Survey responses and comments left on the Physicians’ Views on Today’s Divisive Social Issues 2022 report provide insights into doctors’ attitudes and thinking about these four social challenges.
Relevance of climate change to health care
In the Medscape report, 61% of physicians described themselves as “very concerned” or “concerned” about climate change, and about 7 in 10 agreed with the statement that it should be a top worldwide priority. “Climate change is the most pressing issue of this century,” a psychiatrist respondent wrote.
What about direct effects on patients’ health? An internist worried that rising temperatures will cause “pathogens to spread and infect disadvantaged people who do not have health access and have immunocompromised conditions.” A family medicine physician predicted “more weather disasters, more asthma, more hormonal changes, and more obesity.”
However, physician viewpoints ran the gamut with an issue that has become politically and emotionally charged. Descriptions such as “overblown,” “hysteria,” “hoax,” and “farce” were used. “Climate change is a natural phenomenon under God’s purview,” an emergency medicine physician said.
And there was some middle-ground thinking. “It’s overstated but quite real,” a pediatrician respondent wrote. Added an ophthalmologist: “It has gone on for ages. We must work to decrease man-made conditions that affect climate change, but it must be done in an intelligent fashion.”
Domestic violence: What physicians can do
About 7 in 10 physicians surveyed by Medscape said they don’t think the United States is adequately tackling domestic violence. “It is underrecognized and ignored,” a psychiatrist respondent argued. The problem is “rampant and unacceptable, pushed into a closet and normalized, with associated shame,” an emergency medicine doctor wrote.
Many respondents noted that physicians are under a mandate to report abuse of or a suspicious injury to a patient. Some shared anecdotes about how they reported action they had taken when they suspected it. “I’ve told patients who may be in dangerous situations that I’m a safe person and provide a safe space,” a radiologist added. An internist said, “I’ve recently started to ask about safety at home during triage on every patient.”
Other doctors bemoaned a lack of adequate education on detecting and managing domestic violence and abuse. “Domestic violence is often not recognized by health care providers,” a psychiatrist respondent observed.
Expanding legal immigration
In the Medscape report, 34% of physicians felt U.S. immigration/refugee policies need to be tougher, while 28% said they are too restrictive, and about a fifth saw them as appropriate.
“As an immigrant, I can tell you that the system is flawed and needs a complete overhaul, which will take a bipartisan effort,” an endocrinologist respondent wrote.
A number of respondents argued that it’s critical to simplify the process of obtaining U.S. citizenship so that fewer will feel forced to enter the country illegally. “For a country that relies very heavily on immigrants to sustain our health care system, we behave like idiots in denying safe harbor,” a nephrologist asserted.
A neurologist concurred. “Legal immigration needs to be encouraged. It should be easier to exchange visitor or student visa to immigrant visa in order to retain talent in the health care and technology fields, which would alleviate the shortage of workers in health care.”
Reproductive rights: No easy answers
Medscape’s survey was conducted before the U.S. Supreme Court in June reversed Roe v. Wade. In the report, 71% of physicians described themselves as very to somewhat concerned about women’s reproductive rights, but their viewpoints became nuanced after that. “There is a big disparity among physicians on this topic,” an oncologist respondent wrote.
At one end of the spectrum, 3% of doctors felt that abortions should never be permitted. “The human baby in the womb is an independent person with the right to life,” a pathologist said. At the other end, nearly one-fourth of physicians believed abortion should be accessible under all circumstances, regardless of trimester or reason. “I am just here to support the woman and make her decision a reality,” an internist said.
While saying an abortion should be granted after “fetal viability” only “in extenuating circumstances,” an ob.gyn. respondent said she is “extremely concerned” about attacks on abortion rights. “Some of us are old enough to remember women coming to the ER in extremis after illegal procedures, prior to Roe v. Wade.”
A version of this article first appeared on Medscape.com.
Med students dismayed that residency match process won’t change
– mostly medical students, residents, and fellows – who supported the change.
The program’s decision comes after nearly 3 months of feedback from the public, medical students, and education community. Although about 60% of public respondents believed the change could reduce stress and allow students more time for momentous career decisions, the program’s board of directors decided the disadvantages were “of greater consequence,” according to a Oct. 28 statement.
Those disadvantages included introducing application or interview behaviors that could increase students’ stress; potentially identifying partially matched or unmatched applicants, which could lead to bias; and extending the match process time for those applicants.
In addition, members of 12 medical education and student organizations raised other concerns, such as the proposed change not addressing high application numbers, according to the statement. NRMP has reported record numbers of applicants over the past few years, typically with more applicants than available program slots.
“While the testimony gave nod to the positive aspects of the proposal ... there was substantially more concern voiced about the potential negative consequences identified in the public comments,” NRMP President and CEO Donna L. Lamb, DHSc, MBA, BSN, told this news organization. Some of those issues could not be addressed without further study, so the board decided not to proceed with the proposal, she explained.
The proposal would have separated the Main Residency Match into two phases and replaced the Supplemental Offer and Acceptance Program (SOAP), in which unmatched or partially matched applicants apply for unfilled residency positions. Under the proposed change, each phase would have operated the same way, from rank order lists and using a matching algorithm to a pair of Match Days instead of a single day.
The two-phase process would have given students who didn’t match more time to carefully weigh residency programs – they can apply to up to 45 placements as part of SOAP – that will guide their career path for the next few years, PGY-1 intern Asim A., who asked not to be identified further, told this news organization. The alternative is a hasty decision once students learn which residency spots are available, he added. “Applicants would have breathing room to make a more informed decision.”
Asim, who is Canadian, said he is participating in a transitional year in internal medicine in the hopes of being matched into internal medicine or psychiatry. He said Canada’s two-phase match is a “lot less stressful” than the U.S. system.
Meanwhile, students on Reddit’s medical school community also questioned NRMP’s decision.
“A significant majority of those surveyed thought it would be beneficial. But NRMP decides to not go through with it,” one Reddit user wrote. Another posted, “The one thing that could have improved the match and they chose not to do it.”
Others supported the decision to retain a 1-day match.
“I think this was the right call,” Bryan Carmody, MD, an outspoken medical education blogger, tweeted after learning of NRMP’s decision. Dr. Carmody, a pediatric nephrologist, previously expressed to this news organization misgivings about whether the two-phase match would make it difficult for programs to thoroughly review candidates and vice versa. He was concerned that it would compress the interview season and pressure programs to rapidly review applicants and conduct interviews.
More than 8,000 people responded to the public survey that began in August and ran for a month. Nearly two-thirds of the respondents (60%) were students, residents, or fellows. About 25% included faculty, program directors, and staff. Among the survey findings, respondents were equally divided between whether the two-phase match would be modestly advantageous (30%) or significantly advantageous (30%) compared to 20% who viewed it as modestly or significantly disadvantageous.
The NRMP said it would continue engaging with the community through focus groups and other means to improve the match experience and transition to residency.
“It is important to remember that a proposal is just that,” Dr. Lamb told this news orgnization, “an opportunity to discuss the pros and cons of an idea or framework ... and to mitigate unwanted consequences determined to be detrimental to learners and programs.”
The NRMP will involve the community in future discussions “to continue to give learners a voice,” she said.
A version of this article first appeared on Medscape.com.
Switching to Disposable Duodenoscopes: Risks and Rewards
- US Food and Drug Administration. Infections associated with reprocessed duodenoscopes. Updated June 30, 2022. Accessed July 28, 2022. https://www.fda.gov/medical-devices/reprocessing-reusable-medical-devices/infections-associated-reprocessed-duodenoscopes
- Heuvelmans M, Wunderink HF, van der Mei HC, Monkelbaan JF. A narrative review on current duodenoscope reprocessing techniques and novel developments. Antimicrob Resist Infect Control. 2021;10(1):171. doi:10.1186/s13756-021-01037-z
- US Food and Drug Administration. Use duodenoscopes with innovative designs to enhance safety: FDA safety communication. Updated June 30, 2022. Accessed July 28, 2022. https://www.fda.gov/medical-devices/safety-communications/use-duodenoscopes-innovative-designs-enhance-safety-fda-safety-communication
- Pass W. Weighing the pros and cons of disposable duodenoscopes. MDedge News. Published May 19, 2021. Accessed July 28, 2022. https://www.mdedge.com/gihepnews/article/240339/endoscopy
- Le NNT, Hernandez L, Vakil N, Guda N, Patnode C, Jolliet O. Environmental and health outcomes of single-use versus reusable duodenoscopes. Gastrointest Endosc. 2022;S0016-5107(22)01765-5. doi:10.1016/j.gie.2022.06.014
- Ridtitid W, Thummongkol T, Chatsuwan T, et al. Bacterial contamination and organic residue after reprocessing in duodenoscopes with disposable distal caps compared to duodenoscopes with fixed distal caps: a randomized trial. Gastrointest Endosc. 2022;S0016-5107(22)01766-7. doi:10.1016/j.gie.2022.06.015
- Naryzhny I, Silas D, Chi K. Impact of ethylene oxide gas sterilization of duodenoscopes after a carbapenem-resistant Enterobacteriaceae outbreak. Gastrointest Endosc. 2016;84(2):259-262. doi:10.1016/j.gie.2016.01.055
- Muthusamy VR, Bruno MJ, Kozarek RA, et al. Clinical evaluation of a single-use duodenoscope for endoscopic retrograde cholangiopancreatography. Clin Gastroenterol Hepatol. 2020;18(9):2108-2117.e3. doi:10.1016/j.cgh.2019.10.052
- Bang JY, Hawes R, Varadarajulu S. Equivalent performance of single-use and reusable duodenoscopes in a randomised trial. Gut. 2021;70(5):838-844. doi:10.1136/gutjnl-2020-321836
- Bhatt A, Thosani N, Patil P. ID: 3527241. Ergonomic study analyzing differences in endoscopy styles between female and male gastroenterologists [abstract]. Gastrointest Endosc. 2021;93(6 Suppl):AB42-AB43. doi:10.1016/j.gie.2021.03.148
- Trindade AJ, Copland A, Bhatt A, et al. Single-use duodenoscopes and duodenoscopes with disposable end caps. Gastrointest Endosc. 2021;93(5):997-1005. doi:10.1016/j.gie.2020.12.033
- Namburar S, von Renteln D, Damianos J, et al. Estimating the environmental impact of disposable endoscopic equipment and endoscopes. Gut. 2022;71(7):1326-1331. doi:10.1136/gutjnl-2021-324729
- Kröner PT, Bilal M, Samuel R, et al. Use of ERCP in the United States over the past decade. Endosc Int Open. 2020;8(6):E761-E769. doi:10.1055/a-1134-4873
- Patel K, Lad M, Siddiqui E, Ahlawat S. National trends in reimbursement and utilization of advanced endoscopic procedures in the Medicare population [abstract S0904]. Am J Gastroenterol. 2020;115:S465-S466. doi:10.14309/01.ajg.0000705664.35696.6e
- Bang JY, Sutton B, Hawes R, Varadarajulu S. Concept of disposable duodenoscope: at what cost? Gut. 2019;68(11):1915-1917. doi:10.1136/gutjnl-2019-318227
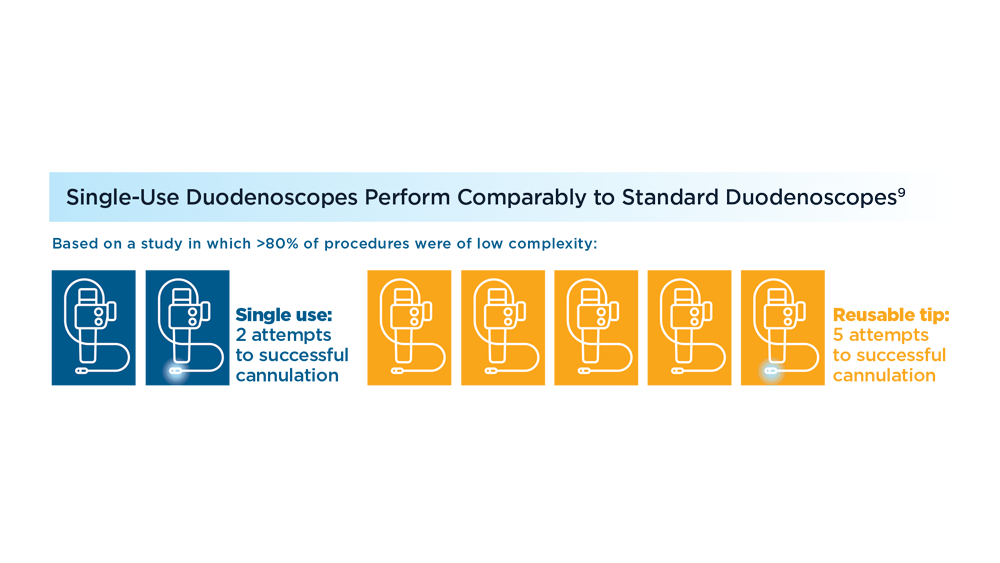
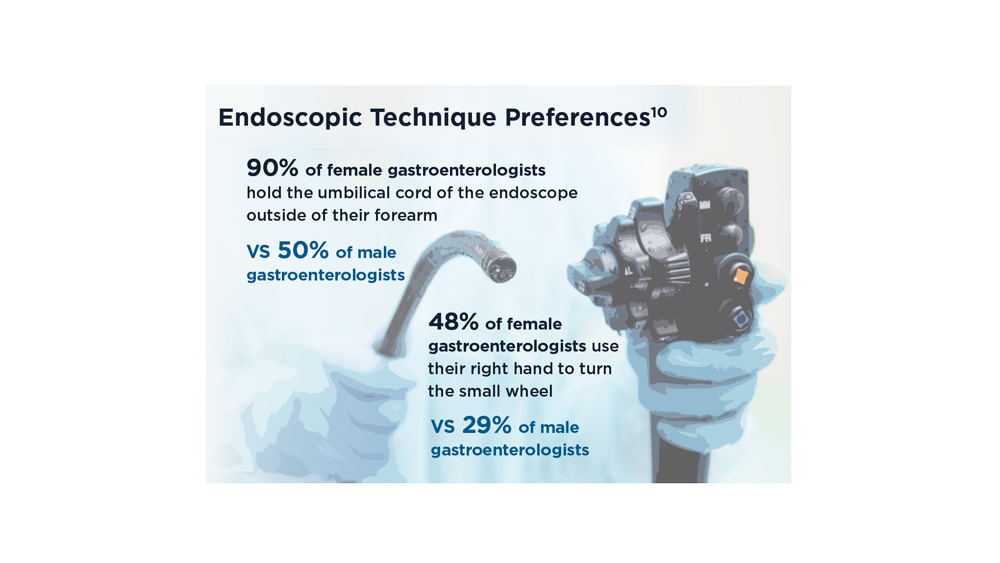


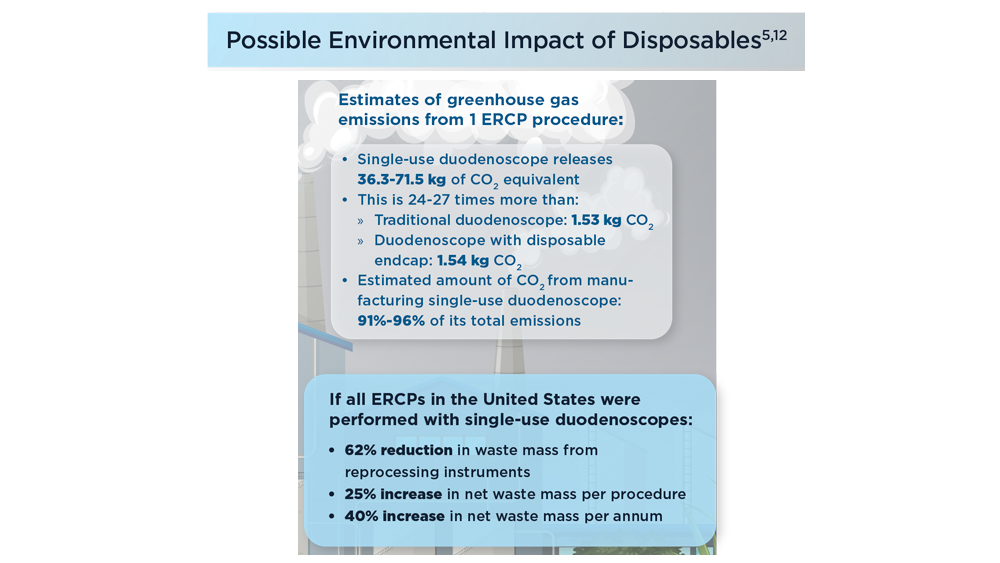
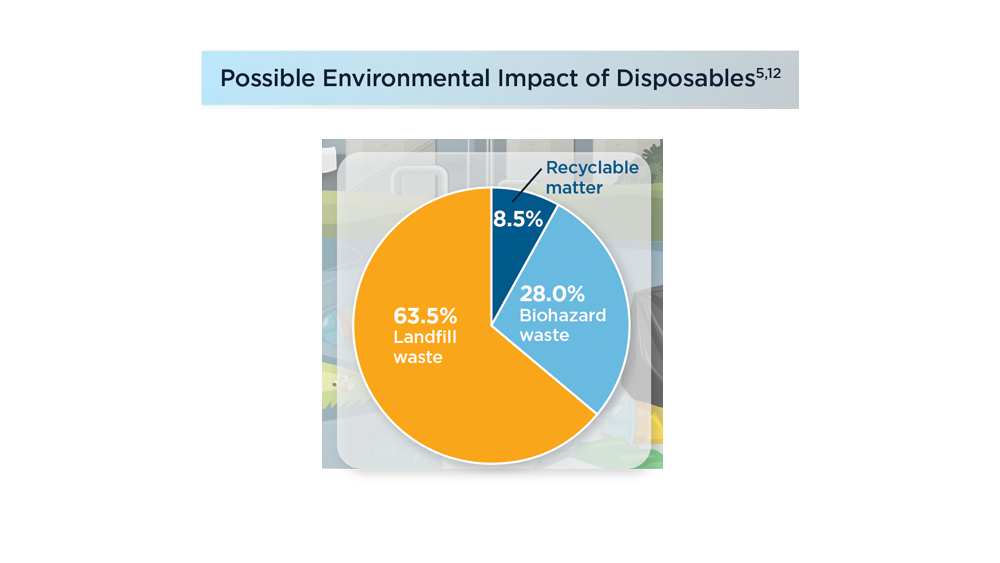
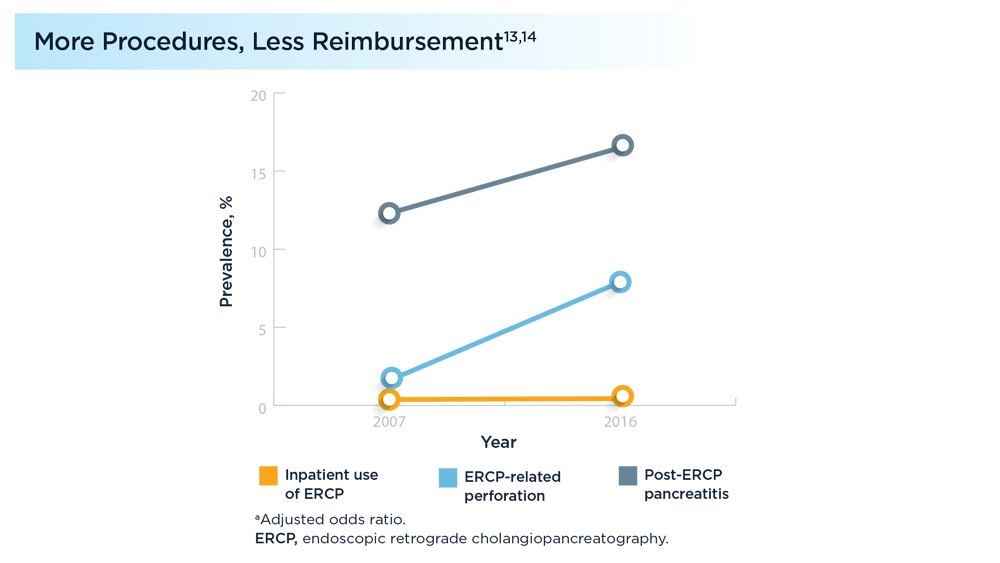
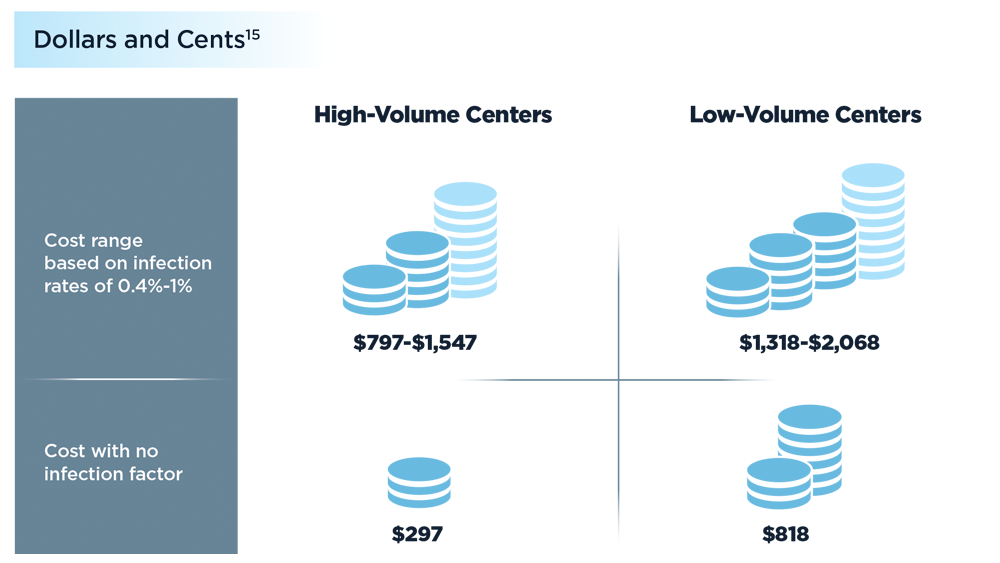
Diversity in the Gastroenterology Workforce and its Implications for Patients
- Welch M. Required curricula in diversity and cross-cultural medicine: the time is now. J Am Med Womens Assoc (1972). 1998;53(3 Suppl):121-3, 130. PMID:17598289.
- Carethers JM. Toward realizing diversity in academic medicine. J Clin Invest. 2020;130(11):5626-5628. doi:10.1172/JCI144527
- Guevara JP, Adanga E, Avakame E, Carthon MB. Minority faculty development programs and underrepresented minority faculty representation at US medical schools. JAMA. 2013;310(21):2297-2304. doi:10.1001/jama.2013.282116
- Guevara JP, Wade R, Aysola J. Racial and ethnic diversity at medical schools – why aren’t we there yet? N Engl J Med. 2021;385(19):1732-1734. doi:10.1056/NEJMp2105578
- Dill J, Akosionu O, Karbeah JM, Henning-Smith C. Addressing systemic racial inequity in the health care workforce. Health Affairs. September 10, 2020. Accessed July 12, 2022. https://www.healthaffairs.org/do/10.1377/forefront.20200908.133196/full/
- Carr RM, Quezada SM, Gangarosa LM, et al; Governing Board of the American Gastroenterological Association. From intention to action: operationalizing AGA diversity policy to combat racism and health disparities in gastroenterology. Gastroenterology. 2020;159(5):1637-1647. doi:10.1053/j.gastro.2020.07.044
- American Gastroenterological Association. AGA equity project. Accessed July 11, 2022. https://gastro.org/aga-leadership/initiatives-and-programs/aga-equity-project/
- Barnes EL, Loftus EV Jr, Kappelman MD. Effects of race and ethnicity on diagnosis and management of inflammatory bowel diseases. Gastroenterology. 2021;160(3):677-689. doi:10.1053/j.gastro.2020.08.064
- White PM, Iroku U, Carr RM, May FP; Association of Black Gastroenterologists and Hepatologists Board of Directors. Advancing health equity: The Association of Black Gastroenterologists and Hepatologists. Nat Rev Gastroenterol Hepatol. 2021;18(7):449-450. doi: 10.1038/s41575-021-00464-y
- Ogunyemi D, Okekpe CC, Barrientos DR, Bui T, Au MN, Lamba S. United States medical school academic faculty workforce diversity, institutional characteristics, and geographical distributions from 2014-2018. Cureus. 2022;14(2):e22292. doi:10.7759/cureus.22292
- Weiss J, Balasuriya L, Cramer LD, et al. Medical students’ demographic characteristics and their perceptions of faculty role modeling of respect for diversity. JAMA Netw Open. 2021;4(6):e2112795. doi:10.1001/jamanetworkopen.2021.12795
- Association of American Medical Colleges (AAMC). Medical school enrollment more diverse in 2021. December 8, 2021. Accessed June 29, 2022. https://www.aamc.org/news-insights/press-releases/medical-school-enrollment-more-diverse-2021
- Silvernale C, Kuo B, Staller K. Racial disparity in healthcare utilization among patients with irritable bowel syndrome: results from a multicenter cohort. Neurogastroenterol Motil. 2020;33(5):e14039. doi: 10.1111/nmo.14039
- Robinett K, Kareem R, Reavis K, Quezada S. A multi-pronged, antiracist approach to optimize equity in medical school admissions. Med Educ. 2021;55(12):1376-1382. doi:10.1111/medu.14589