User login
Researchers propose new risk groups for NK-AML
NEWPORT BEACH, CALIF. – New research suggests patients with normal karyotype acute myeloid leukemia (NK-AML) can be divided into four risk groups associated with overall survival.
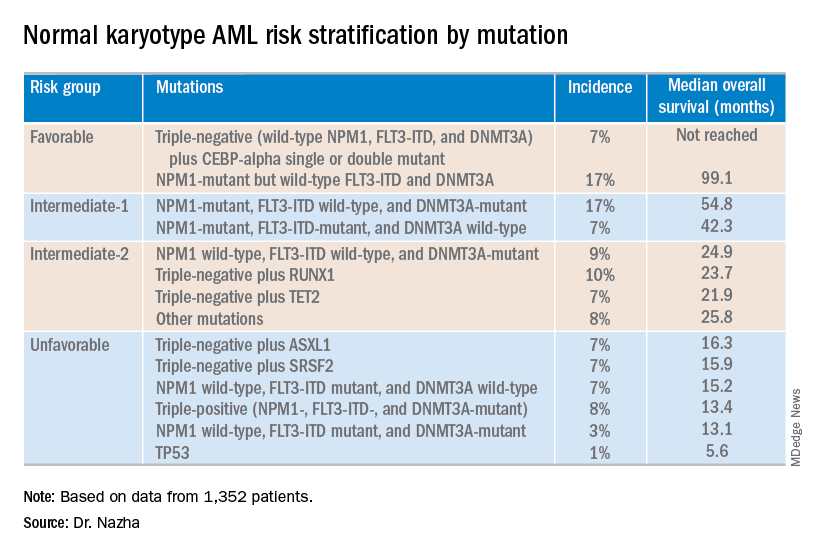
Investigators used machine learning algorithms to study the association between mutations and overall survival in 1,352 patients with NK-AML. The analysis revealed combinations of mutations that could be used to classify NK-AML patients into favorable, intermediate-1, intermediate-2, and unfavorable risk groups.
For example, patients who had NPM1 mutations but wild-type FLT3-ITD and DNMT3A, had a median overall survival of 99.1 months and could be classified as favorable risk. Conversely, patients who had NPM1, FLT3-ITD, and DNMT3A mutations, had a median overall survival of 13.4 months and could be classified as unfavorable risk.
Aziz Nazha, MD, of the Cleveland Clinic, and his colleagues conducted this research and presented the findings at the Acute Leukemia Forum of Hemedicus.
The investigators looked at genomic and clinical data from 1,352 patients with NK-AML. The patients were a median age of 55 years and had a median white blood cell count of 21.3 x 10⁹/L, a median hemoglobin of 9.1 g/dL, and a median platelet count of 61 x 109/L. More than half of patients (57.3%) were male.
The patients were screened for 35 genes that are commonly mutated in AML and other myeloid malignancies. The investigators used machine learning algorithms, including random survival forest and recommender system algorithms, to study the association between mutations and overall survival in an “unbiased” way.
Dr. Nazha said there were a median of three mutations per patient sample, and “there are some competing interests between those mutations to impact the prognosis of the patient.”
The investigators used the mutations and their associations with overall survival to classify patients into the risk groups outlined in the table below.
These findings can improve the risk stratification of NK-AML and may aid physicians in making treatment decisions, according to Dr. Nazha and his colleagues. To move this work forward, the investigators are attempting to develop a personalized model that can make predictions specific to an individual patient based on that patient’s mutation information.
Dr. Nazha reported having no financial disclosures relevant to this research. Other investigators reported relationships with the Munich Leukemia Laboratory.
The Acute Leukemia Forum is held by Hemedicus, which is owned by the same company as this news organization.
NEWPORT BEACH, CALIF. – New research suggests patients with normal karyotype acute myeloid leukemia (NK-AML) can be divided into four risk groups associated with overall survival.
Investigators used machine learning algorithms to study the association between mutations and overall survival in 1,352 patients with NK-AML. The analysis revealed combinations of mutations that could be used to classify NK-AML patients into favorable, intermediate-1, intermediate-2, and unfavorable risk groups.
For example, patients who had NPM1 mutations but wild-type FLT3-ITD and DNMT3A, had a median overall survival of 99.1 months and could be classified as favorable risk. Conversely, patients who had NPM1, FLT3-ITD, and DNMT3A mutations, had a median overall survival of 13.4 months and could be classified as unfavorable risk.
Aziz Nazha, MD, of the Cleveland Clinic, and his colleagues conducted this research and presented the findings at the Acute Leukemia Forum of Hemedicus.
The investigators looked at genomic and clinical data from 1,352 patients with NK-AML. The patients were a median age of 55 years and had a median white blood cell count of 21.3 x 10⁹/L, a median hemoglobin of 9.1 g/dL, and a median platelet count of 61 x 109/L. More than half of patients (57.3%) were male.
The patients were screened for 35 genes that are commonly mutated in AML and other myeloid malignancies. The investigators used machine learning algorithms, including random survival forest and recommender system algorithms, to study the association between mutations and overall survival in an “unbiased” way.
Dr. Nazha said there were a median of three mutations per patient sample, and “there are some competing interests between those mutations to impact the prognosis of the patient.”
The investigators used the mutations and their associations with overall survival to classify patients into the risk groups outlined in the table below.
These findings can improve the risk stratification of NK-AML and may aid physicians in making treatment decisions, according to Dr. Nazha and his colleagues. To move this work forward, the investigators are attempting to develop a personalized model that can make predictions specific to an individual patient based on that patient’s mutation information.
Dr. Nazha reported having no financial disclosures relevant to this research. Other investigators reported relationships with the Munich Leukemia Laboratory.
The Acute Leukemia Forum is held by Hemedicus, which is owned by the same company as this news organization.
REPORTING FROM ALF 2019
Gabapentin falls short in treating sickle cell pain
NEW ORLEANS – Adding gabapentin to standard therapy did not significantly reduce vaso-occlusive pain in most patients with sickle cell disease enrolled in a phase 2 trial.
In the entire cohort, there were no significant differences in pain response between patients who received gabapentin and those who received placebo. However, patients with the HbSS genotype had a significantly greater decrease in pain score from baseline to discharge if they received gabapentin rather than placebo.
Additional studies are needed to confirm these findings because this trial was limited by a small sample size, according to study investigator Latika Puri, MD, of St. Jude Children’s Research Hospital in Memphis. Dr. Puri presented the trial at the annual meeting of the American Society of Pediatric Hematology/Oncology.
The trial included 86 evaluable patients who had vaso-occlusive pain and a pain score of at least 4. All patients received standard therapy for vaso-occlusive pain and were randomized to receive placebo (n = 44) or a single oral dose of gabapentin at 15 mg/kg (n = 42).
Baseline characteristics were similar between the treatment arms. For the entire cohort, the mean age was 11.8 years (range, 1-21 years), and 51% of patients were male. Forty-four patients had the HbSS genotype, 25 had the HbSC genotype, 8 had HbS/beta0-thalassemia, and 9 had other genotypes.
The mean pain score at baseline was 7.8 for the entire cohort, 8.0 for the gabapentin arm, and 7.7 for the placebo arm.
For the entire cohort, there was no significant difference in pain response between the gabapentin and placebo arms.
The proportion of patients who experienced a greater than 33% decrease in pain from baseline to 3 hours posttreatment was 67% in the gabapentin arm and 59% in the placebo arm (P = .23). The proportion of patients who experienced a greater than 33% decrease from baseline to discharge from the acute care clinic was 75% and 61%, respectively (P = .18).
In the entire cohort, decreases in pain scores from baseline to 3 hours posttreatment were not significantly different between the gabapentin and placebo arms, at 1.3 and 0.7, respectively (P = .74). Likewise, decreases in pain scores from baseline to discharge were not significantly different, at 1.6 and 0.8 (P = .38).
Among patients who had the HbSS genotype, there was a significantly greater decrease in pain score from baseline to discharge in the gabapentin arm than in the placebo arm, 5.9 versus 3.6 (P = .03). However, there were no other significant differences in pain response for the HbSS subgroup.
There were no significant differences in opioid consumption or hospitalization for the HbSS subgroup or the entire cohort. For the entire cohort, the mean morphine equivalent dose from baseline to 3 hours posttreatment was 0.16 mg/kg in the gabapentin arm and 0.17 mg/kg in the placebo arm (P = .89). For the HbSS subgroup, the mean dose was 0.16 mg/kg and 0.15 mg/kg, respectively (P = .93).
In the entire cohort, 24% of patients in the gabapentin arm and 27% of those in the placebo arm were hospitalized (P = .71). In the HbSS subgroup, hospitalizations occurred in 11% and 35% (P = .15).
Dr. Puri pointed out several challenges that led to limitations in this study. Specifically, the investigators had to obtain patient consent while delivering standard treatment, while patients were in pain and distress, and from patients who had already received opioids and were sleepy. Additionally, gabapentin had to be delivered within 1 hour of opioid administration, and a lack of after-hours staff limited enrollment.
“These challenges led to one of our biggest limitations, which was a small sample size, leading to a limited power to observe real differences,” Dr. Puri said. “We also defined a very short time period of evaluation for the primary outcomes; that was 3 hours from the gabapentin dose or placebo dose. This limited our capability to see real differences if they existed.”
Dr. Puri said additional studies with larger sample sizes are needed to confirm these findings. She added that efforts to better characterize pain in sickle cell disease could reveal patients who may benefit from gabapentin because they have a neuropathic component to their pain.
The trial was sponsored by St. Jude Children’s Research Hospital in collaboration with Scan|Design Foundation. Dr. Puri did not provide disclosure information at the meeting.
SOURCE: Puri L et al. ASPHO 2019, Abstract 2011.
REPORTING FROM THE 2019 ASPHO CONFERENCE
Key clinical point:
Major finding: The proportion of patients who experienced a greater than 33% decrease in pain from baseline to 3 hours posttreatment was 67% in the gabapentin arm and 59% in the placebo arm (P = .23).
Study details: A phase 2 trial of 86 evaluable patients.
Disclosures: The trial was sponsored by St. Jude Children’s Research Hospital in collaboration with Scan|Design Foundation. The speaker did not provide disclosure information at the meeting.
Source: Puri L et al. 2019 ASPHO Conference, Abstract 2011.
CMS proposes payment increase for administering CAR T in the hospital
Hospitals could get a payment bump for administering chimeric antigen receptor (CAR) T-cell therapies under a proposed rule issued by the Centers for Medicare & Medicaid Services.

The proposal calls for raising the new technology add-on payment (NTAP) associated with the therapies from 50% of the technology to 65%, an increase from $186,500 to $242,450.
Beginning with discharges on Oct. 1, 2019, if discharge costs involving a new medical service or technology exceed the full Medicare Severity Diagnosis-Related Group (DRG) payment, Medicare would make an add-on payment of either 65% of the cost of the new medical service or technology, or 65% of the amount by which the costs of the case exceed the standard DRG payment, whichever is less.
Roy Silverstein, MD, president of the American Society of Hematology, said the group was pleased that the CMS is examining its existing payment policies to identify more realistic ways to account for the costs of administering CAR T-cell therapies.
“While ASH had originally suggested a higher [new technology] payment, any increase is an improvement,” Dr. Silverstein said in a statement. “While the proposal from CMS is promising, it is not a one-stop solution for making CAR T more accessible to patients. Just as these therapies are innovative, it is going to take some innovation on the part of CMS to develop a plan that equitably compensates providers and institutions so that offering the therapy is sustainable.”
The agency’s proposal follows an August 2018 final rule by the CMS that set a new payment scheme for inpatient administration of two CAR T-cell therapies. The rule categorized CAR T-cell therapies under the umbrella of the renamed Medicare Severity–Diagnosis Related Groups (MS-DRG) 016 – Autologous Bone Marrow Transplant with CC/MCC or T-cell Immunotherapy – and assigned ICD-10 PCS procedure codes XW033C3 and XW043C3 to the use of axicabtagene ciloleucel (Yescarta) and tisagenlecleucel (Kymriah) in the inpatient setting for fiscal year 2019, which began in October 2018.
In April 2018, the CMS announced payment rates for outpatient administration of the two drugs, settling on $395,380 for axicabtagene ciloleucel and $500,839 for tisagenlecleucel. The two medications have list prices of $373,000 and $475,000, respectively.
In February 2019, the CMS also proposed to cover CAR T-cell therapy for cancer patients participating in clinical trials that study the treatment’s effectiveness. A final decision on the proposal is expected in May 2019.
In the current proposal, the CMS acknowledged requests calling for the agency to create a new MS-DRG for procedures involving CAR T-cell therapies to improve payment in the inpatient setting. However, the agency declined to create a new MS-DRG for CAR T-cell cases, writing that the move is premature given the relative newness of CAR T-cell therapy and the agency’s proposal to continue new technology add-on payments for fiscal 2020 for Kymriah and Yescarta.
However, the agency is requesting public comments on whether, in light of additional experience with billing and payment for cases involving CAR T-cell therapies to Medicare patients, the CMS should consider using a specific cost-to-charge ratio for ICD-10-PCS procedure codes used to report the performance of procedures involving CAR T-cell therapies.
Comments on the proposed rule will be accepted until June 24.
Hospitals could get a payment bump for administering chimeric antigen receptor (CAR) T-cell therapies under a proposed rule issued by the Centers for Medicare & Medicaid Services.
The proposal calls for raising the new technology add-on payment (NTAP) associated with the therapies from 50% of the technology to 65%, an increase from $186,500 to $242,450.
Beginning with discharges on Oct. 1, 2019, if discharge costs involving a new medical service or technology exceed the full Medicare Severity Diagnosis-Related Group (DRG) payment, Medicare would make an add-on payment of either 65% of the cost of the new medical service or technology, or 65% of the amount by which the costs of the case exceed the standard DRG payment, whichever is less.
Roy Silverstein, MD, president of the American Society of Hematology, said the group was pleased that the CMS is examining its existing payment policies to identify more realistic ways to account for the costs of administering CAR T-cell therapies.
“While ASH had originally suggested a higher [new technology] payment, any increase is an improvement,” Dr. Silverstein said in a statement. “While the proposal from CMS is promising, it is not a one-stop solution for making CAR T more accessible to patients. Just as these therapies are innovative, it is going to take some innovation on the part of CMS to develop a plan that equitably compensates providers and institutions so that offering the therapy is sustainable.”
The agency’s proposal follows an August 2018 final rule by the CMS that set a new payment scheme for inpatient administration of two CAR T-cell therapies. The rule categorized CAR T-cell therapies under the umbrella of the renamed Medicare Severity–Diagnosis Related Groups (MS-DRG) 016 – Autologous Bone Marrow Transplant with CC/MCC or T-cell Immunotherapy – and assigned ICD-10 PCS procedure codes XW033C3 and XW043C3 to the use of axicabtagene ciloleucel (Yescarta) and tisagenlecleucel (Kymriah) in the inpatient setting for fiscal year 2019, which began in October 2018.
In April 2018, the CMS announced payment rates for outpatient administration of the two drugs, settling on $395,380 for axicabtagene ciloleucel and $500,839 for tisagenlecleucel. The two medications have list prices of $373,000 and $475,000, respectively.
In February 2019, the CMS also proposed to cover CAR T-cell therapy for cancer patients participating in clinical trials that study the treatment’s effectiveness. A final decision on the proposal is expected in May 2019.
In the current proposal, the CMS acknowledged requests calling for the agency to create a new MS-DRG for procedures involving CAR T-cell therapies to improve payment in the inpatient setting. However, the agency declined to create a new MS-DRG for CAR T-cell cases, writing that the move is premature given the relative newness of CAR T-cell therapy and the agency’s proposal to continue new technology add-on payments for fiscal 2020 for Kymriah and Yescarta.
However, the agency is requesting public comments on whether, in light of additional experience with billing and payment for cases involving CAR T-cell therapies to Medicare patients, the CMS should consider using a specific cost-to-charge ratio for ICD-10-PCS procedure codes used to report the performance of procedures involving CAR T-cell therapies.
Comments on the proposed rule will be accepted until June 24.

Aleukemic leukemia cutis
To the Editor: I read with great interest the article “Aleukemic leukemia cutis” by Abraham et al,1 as we recently had a case of this at my institution. The case is unique and quite intriguing; however, I found the pathologic description confusing and imprecise.
The authors state, “The findings were consistent with leukemic T cells with monocytic differentiation.”1 This is based on their findings that the tumor cells expressed CD4, CD43, CD68, and lysozyme. However, the cells were negative for CD30, ALK-1, CD2, and CD3.
First, I must contest the authors’ claim that “the cells co-expressed T-cell markers (CD4 and CD43)”: CD4 and CD43 are not specific for T cells and are almost invariably seen on monocytes, especially in acute monoblastic/monocytic leukemia (AMoL; also known as M5 in the French-American-British classification system).2,3 Therefore, the immunophenotype is perfect for an AMoL, but since there was no significant blood or bone marrow involvement and it was limited to the skin, this would best fit with a myeloid sarcoma, which frequently has a monocytic immunoprofile.3,4
Additionally, this would not be a mixed-phenotype acute leukemia, T/myeloid, not otherwise specified, as that requires positivity for cytoplasmic CD3 or surface CD3, and that was conspicuously absent.5 Therefore, the appropriate workup and treatment should have essentially followed the course for acute myeloid leukemia,4 which is unclear from the present report as there is no mention of a molecular workup (eg, for FLT3 and NPM1 mutations). This would, in turn, have important treatment and prognostic implications.6
The reason for my comments is to bring to light the importance of exact pathologic diagnosis, especially when dealing with leukemia. We currently have a host of treatment options and prognostic tools for the various types of acute myeloid leukemia, but only when a clear and precise pathologic diagnosis is given.5
- Abraham TN, Morawiecki P, Flischel A, Agrawal B. Aleukemic leukemia cutis. Cleve Clin J Med 2019; 86(2):85–86. doi:10.3949/ccjm.86a.18057
- Xu Y, McKenna RW, Wilson KS, Karandikar NJ, Schultz RA, Kroft SH. Immunophenotypic identification of acute myeloid leukemia with monocytic differentiation. Leukemia 2006; 20(7):1321–1324. doi:10.1038/sj.leu.2404242
- Cronin DMP, George TI, Sundram UN. An updated approach to the diagnosis of myeloid leukemia cutis. Am J Clin Pathol 2009; 132(1):101–110. doi:10.1309/AJCP6GR8BDEXPKHR
- Avni B, Koren-Michowitz M. Myeloid sarcoma: current approach and therapeutic options. Ther Adv Hematol 2011; 2(5):309–316. doi:10.1177/2040620711410774
- Weir EG, Ali Ansari-Lari M, Batista DAS, et al. Acute bilineal leukemia: a rare disease with poor outcome. Leukemia 2007; 21(11):2264–2270. doi:10.1038/sj.leu.2404848
- De Kouchkovsky I, Abdul-Hay M. Acute myeloid leukemia: a comprehensive review and 2016 update. Blood Cancer J 2016; 6(7):e441. doi:10.1038/bcj.2016.50
To the Editor: I read with great interest the article “Aleukemic leukemia cutis” by Abraham et al,1 as we recently had a case of this at my institution. The case is unique and quite intriguing; however, I found the pathologic description confusing and imprecise.
The authors state, “The findings were consistent with leukemic T cells with monocytic differentiation.”1 This is based on their findings that the tumor cells expressed CD4, CD43, CD68, and lysozyme. However, the cells were negative for CD30, ALK-1, CD2, and CD3.
First, I must contest the authors’ claim that “the cells co-expressed T-cell markers (CD4 and CD43)”: CD4 and CD43 are not specific for T cells and are almost invariably seen on monocytes, especially in acute monoblastic/monocytic leukemia (AMoL; also known as M5 in the French-American-British classification system).2,3 Therefore, the immunophenotype is perfect for an AMoL, but since there was no significant blood or bone marrow involvement and it was limited to the skin, this would best fit with a myeloid sarcoma, which frequently has a monocytic immunoprofile.3,4
Additionally, this would not be a mixed-phenotype acute leukemia, T/myeloid, not otherwise specified, as that requires positivity for cytoplasmic CD3 or surface CD3, and that was conspicuously absent.5 Therefore, the appropriate workup and treatment should have essentially followed the course for acute myeloid leukemia,4 which is unclear from the present report as there is no mention of a molecular workup (eg, for FLT3 and NPM1 mutations). This would, in turn, have important treatment and prognostic implications.6
The reason for my comments is to bring to light the importance of exact pathologic diagnosis, especially when dealing with leukemia. We currently have a host of treatment options and prognostic tools for the various types of acute myeloid leukemia, but only when a clear and precise pathologic diagnosis is given.5
- Abraham TN, Morawiecki P, Flischel A, Agrawal B. Aleukemic leukemia cutis. Cleve Clin J Med 2019; 86(2):85–86. doi:10.3949/ccjm.86a.18057
- Xu Y, McKenna RW, Wilson KS, Karandikar NJ, Schultz RA, Kroft SH. Immunophenotypic identification of acute myeloid leukemia with monocytic differentiation. Leukemia 2006; 20(7):1321–1324. doi:10.1038/sj.leu.2404242
- Cronin DMP, George TI, Sundram UN. An updated approach to the diagnosis of myeloid leukemia cutis. Am J Clin Pathol 2009; 132(1):101–110. doi:10.1309/AJCP6GR8BDEXPKHR
- Avni B, Koren-Michowitz M. Myeloid sarcoma: current approach and therapeutic options. Ther Adv Hematol 2011; 2(5):309–316. doi:10.1177/2040620711410774
- Weir EG, Ali Ansari-Lari M, Batista DAS, et al. Acute bilineal leukemia: a rare disease with poor outcome. Leukemia 2007; 21(11):2264–2270. doi:10.1038/sj.leu.2404848
- De Kouchkovsky I, Abdul-Hay M. Acute myeloid leukemia: a comprehensive review and 2016 update. Blood Cancer J 2016; 6(7):e441. doi:10.1038/bcj.2016.50

In reply: Aleukemic leukemia cutis
In Reply: We greatly appreciate our reader’s interest and response. He brings up a very good point. We have reviewed the reports and discussed it with our pathologists. On page 85, the sentence that begins, “The findings were consistent with leukemic T cells with monocytic differentiation” should actually read, “The findings were consistent with leukemic cells with monocytic differentiation.” The patient was appropriately treated for acute myeloid leukemia.
In Reply: We greatly appreciate our reader’s interest and response. He brings up a very good point. We have reviewed the reports and discussed it with our pathologists. On page 85, the sentence that begins, “The findings were consistent with leukemic T cells with monocytic differentiation” should actually read, “The findings were consistent with leukemic cells with monocytic differentiation.” The patient was appropriately treated for acute myeloid leukemia.
In Reply: We greatly appreciate our reader’s interest and response. He brings up a very good point. We have reviewed the reports and discussed it with our pathologists. On page 85, the sentence that begins, “The findings were consistent with leukemic T cells with monocytic differentiation” should actually read, “The findings were consistent with leukemic cells with monocytic differentiation.” The patient was appropriately treated for acute myeloid leukemia.

Lymphoma rate in RA patients is falling
MAUI, HAWAII – The incidence of lymphoma in patients with RA appears to have been dropping during the past 2 decades – and for rheumatologists, that’s news you can use.

“I think this is encouraging data about where we’re headed with therapy. And it’s encouraging data for your patients, that maybe more effective therapies can lead to a lower risk of cancer,” John J. Cush, MD, commented at the 2019 Rheumatology Winter Clinical Symposium.
“Patients are always worried about cancer,” observed symposium director Arthur Kavanaugh, MD. “I think this is very useful data to bring to a discussion with patients.”
The study they highlighted was presented at the 2018 annual meeting of the American College of Rheumatology by Namrata Singh, MD, of the University of Iowa, Iowa City and coinvestigators from Veterans Affairs medical centers around the country. They analyzed the incidence of lymphomas as well as all-site cancers in 50,870 men with RA in the national VA health care system during 2001-2015 and compared the rates with the background rates in the general U.S. population as captured in the National Cancer Institute’s Surveillance, Epidemiology, and End Results (SEER) program.
The key finding: While the standardized incidence ratio for the development of lymphoma in the RA patients during 2001-2005 was 190% greater than in the SEER population, the SIR dropped to 1.6 in 2006-2010 and stayed low in 2011-2015.
“These are the only data I’m aware of that say maybe lymphomas are becoming less frequent among RA patients,” said Dr. Kavanaugh, professor of medicine at the University of California, San Diego.
Historically, RA has been associated with roughly a 100% increased risk of lymphoma. The source of the increased risk has been a matter of controversy: Is it the result of immunostimulation triggered by high RA disease activity, or a side effect of the drugs employed in treatment of the disease? The clear implication of the VA study is that it’s all about disease activity.
“The lymphoma rate is higher early in the use of our new therapies, in 2001-2005, because the patients who went on TNF [tumor necrosis factor] inhibitors then had the most disease activity. But with time, patients are getting those treatments earlier. Does this [lower lymphoma rate] reflect a change in the practice of rheumatology? I think it does,” according to Dr. Cush, professor of medicine and rheumatology at Baylor University Medical Center, Dallas.
Dr. Kavanaugh agreed. “Now, if we’re treating early and treating to target, we should see less lymphomas than we did back in the day.”
The rate of cancers at all sites in the VA RA patients has been going down as well, with the SIR dropping from 1.8 in 2001-2005 to close to 1, the background rate in the general population.
“What’s great about this study is this is a large data set. You really can’t compare an RA population on and off treatment. The right comparison is to a normal population – and SEER accounts for something like 14% of the U.S. population,” Dr. Cush said.
Previous support for the notion that the increased lymphoma risk associated with RA was a function of disease activity came from a Swedish study of 378 RA patients in the prebiologic era who developed lymphoma and a matched cohort of 378 others without lymphoma. The investigators found that patients with moderate overall RA disease activity were at a 700% increased risk of lymphoma, compared with those with low overall disease activity, and that patients with high RA disease activity were at a 6,900% increased risk (Arthritis Rheum. 2006 Mar;54[3]:692-701). But that was a cross-sectional study, whereas the VA study examined trends over time.
The VA RA cohort had a mean age of 64 years. About 60% were current or ex-smokers, 65% were positive for rheumatoid factor, and 62% were positive for anticyclic citrullinated peptide.
Dr. Kavanaugh said that, because of the potential for referral bias in the VA study, he’s eager to see the findings reproduced in another data set.
Both Dr. Cush and Dr. Kavanaugh reported serving as a consultant to and/or receiving research funding from numerous pharmaceutical companies.
MAUI, HAWAII – The incidence of lymphoma in patients with RA appears to have been dropping during the past 2 decades – and for rheumatologists, that’s news you can use.
“I think this is encouraging data about where we’re headed with therapy. And it’s encouraging data for your patients, that maybe more effective therapies can lead to a lower risk of cancer,” John J. Cush, MD, commented at the 2019 Rheumatology Winter Clinical Symposium.
“Patients are always worried about cancer,” observed symposium director Arthur Kavanaugh, MD. “I think this is very useful data to bring to a discussion with patients.”
The study they highlighted was presented at the 2018 annual meeting of the American College of Rheumatology by Namrata Singh, MD, of the University of Iowa, Iowa City and coinvestigators from Veterans Affairs medical centers around the country. They analyzed the incidence of lymphomas as well as all-site cancers in 50,870 men with RA in the national VA health care system during 2001-2015 and compared the rates with the background rates in the general U.S. population as captured in the National Cancer Institute’s Surveillance, Epidemiology, and End Results (SEER) program.
The key finding: While the standardized incidence ratio for the development of lymphoma in the RA patients during 2001-2005 was 190% greater than in the SEER population, the SIR dropped to 1.6 in 2006-2010 and stayed low in 2011-2015.
“These are the only data I’m aware of that say maybe lymphomas are becoming less frequent among RA patients,” said Dr. Kavanaugh, professor of medicine at the University of California, San Diego.
Historically, RA has been associated with roughly a 100% increased risk of lymphoma. The source of the increased risk has been a matter of controversy: Is it the result of immunostimulation triggered by high RA disease activity, or a side effect of the drugs employed in treatment of the disease? The clear implication of the VA study is that it’s all about disease activity.
“The lymphoma rate is higher early in the use of our new therapies, in 2001-2005, because the patients who went on TNF [tumor necrosis factor] inhibitors then had the most disease activity. But with time, patients are getting those treatments earlier. Does this [lower lymphoma rate] reflect a change in the practice of rheumatology? I think it does,” according to Dr. Cush, professor of medicine and rheumatology at Baylor University Medical Center, Dallas.
Dr. Kavanaugh agreed. “Now, if we’re treating early and treating to target, we should see less lymphomas than we did back in the day.”
The rate of cancers at all sites in the VA RA patients has been going down as well, with the SIR dropping from 1.8 in 2001-2005 to close to 1, the background rate in the general population.
“What’s great about this study is this is a large data set. You really can’t compare an RA population on and off treatment. The right comparison is to a normal population – and SEER accounts for something like 14% of the U.S. population,” Dr. Cush said.
Previous support for the notion that the increased lymphoma risk associated with RA was a function of disease activity came from a Swedish study of 378 RA patients in the prebiologic era who developed lymphoma and a matched cohort of 378 others without lymphoma. The investigators found that patients with moderate overall RA disease activity were at a 700% increased risk of lymphoma, compared with those with low overall disease activity, and that patients with high RA disease activity were at a 6,900% increased risk (Arthritis Rheum. 2006 Mar;54[3]:692-701). But that was a cross-sectional study, whereas the VA study examined trends over time.
The VA RA cohort had a mean age of 64 years. About 60% were current or ex-smokers, 65% were positive for rheumatoid factor, and 62% were positive for anticyclic citrullinated peptide.
Dr. Kavanaugh said that, because of the potential for referral bias in the VA study, he’s eager to see the findings reproduced in another data set.
Both Dr. Cush and Dr. Kavanaugh reported serving as a consultant to and/or receiving research funding from numerous pharmaceutical companies.
REPORTING FROM RWCS 2019
Navigating the Oncology Care Model
Care of the cancer patient is complex and expensive. During 2001-2011, medical spending to treat cancer increased from $56.8 billion to $88.3 billion in the United States. During this time, ambulatory expenditures for care and treatment increased while inpatient hospital expenditures decreased.1,2 Treatments for cancer have advanced, but costs do not correlate with outcomes. Advanced payment models aimed at ensuring high quality while lowering costs may be the vehicle to help mitigate the financial burden of cancer treatment on patients and society at large.
Oncology Care Model
The Center for Medicare and Medicaid Innovation designed the Oncology Care Model (OCM), which allows practices and payers in the United States to partner with the Centers for Medicare & Medicaid Services. The goal of the OCM is to provide high quality, highly coordinated cancer care at the same or lower cost. Practice partnerships with the CMS involve payment arrangements that include financial and performance accountability for episodes of cancer care surrounding chemotherapy delivery to patients.3
Practices that have been selected by the CMS have attested to providing a number of enhanced services from 24/7 patient access to an appropriate clinician who can access medical records to having a documented care plan for every patient.4
Payment methodology
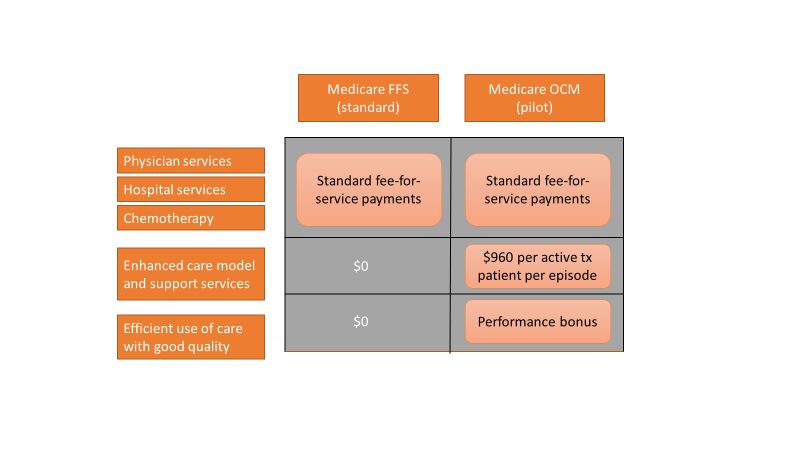
An episode of care is defined as a 6-month period that starts at the time of chemotherapy administration. In addition to the standard fee-for-service payment, practices have the ability to earn two other types of payments during an oncology episode.
The per-beneficiary Monthly Enhanced Oncology Services payment is $960 for the entire episode but is paid to practices at $160 per month.
Practices have the potential to earn additional performance-based payments (PBP) based on the difference in cost between the projected and actual cost of the episode. The PBP also incorporates performance on quality metrics, based on Medicare claims and other information submitted by the practice. For example, claims-based measures include hospital, emergency department (ED), and hospice utilization.
To participate in the OCM, practices must choose either a one-sided or two-sided risk model. In the one-sided risk model, practices take on no downside risk but need to achieve a greater reduction in expenditures (4% below the benchmark price). In the two-side risk model, practices need only to reduce expenditures by 2.75% below the benchmark price. But if they fail to meet their savings goals, they must pay the difference to the CMS. The recoupment is capped at 20% of the benchmark amount.
Feedback reports
The CMS sends quarterly feedback reports that contain information on practice demographics, outcomes, expenditures, chemotherapy use, and patient satisfaction. The outcomes include the mortality rate for Medicare beneficiaries treated at the practice, compared with other practices nationally. In addition, the reports include end-of-life metrics and patient satisfaction, as well as details of expenditures on drugs, hospital use, imaging and laboratory services, and a description of chemotherapy usage.
These reports can be a helpful tool for measuring your own use of services, as well as benchmarking it against national figures.
Practice modifications
According to CMS feedback reports, the cost of care per beneficiary per month has increased across all practices since the inception of the OCM. However, there are practices that have been successful in reducing cost of care without negatively affecting mortality.
Drugs, hospital, and ED visits, along with imaging and laboratory evaluation, account for 75% of the cost. Some strategies to reduce expenditure involve targeting those areas.
Consider prescribing drugs conservatively without affecting outcomes. For instance, bisphosphonates for bone metastasis can be given every 12 weeks instead of 4 weeks.5 Similarly, adjuvant chemotherapy can be given for 3 months, instead of 6 months in appropriate stage 3 colon cancer patients.6
Another potential opportunity for savings is the judicious use of pertuzumab in early-stage breast cancer patients.7 These are all evidence-based recommendations with potential for cost savings. Clinical pathways can aid in this process, but physician buy-in is imperative.
In terms of imaging, avoid PET scans when they will not affect your clinical decision making, avoid staging scans in early-stage breast and prostate cancer patients, and avoid surveillance scans among early-stage breast cancer and lymphoma patients. The Choosing Wisely campaign can help guide some of these decisions.8

Another area where good care meets cost effective care is in the early engagement of palliative care. Several studies have shown that early involvement of palliative care improves survival and quality of life.9,10 Palliative care involvement also decreases the emotional burden for patients and oncologists. Appropriate symptom control, particularly of pain, decreases hospitalizations during treatment.
Investing in a robust supportive care team – financial advocates, social work, nutrition, behavioral health, as well as various community services – can help reduce the financial, physical, and emotional distress levels for patients. All of these services ultimately lead to reduced hospitalizations.11 The Monthly Enhanced Oncology Services payment can be put toward these expenses.
Care teams working at the highest level of competence and license can also save time and money. Consider using registered nurses to implement triage pathways to assess side effects and symptom management, or using nurse practitioners, registered nurses, and physician assistants for same-day appointments and to assess symptoms rather than referring patients to the emergency department.
Avoid the ED and hospitalizations by using the infusion center to provide hydration and blood transfusions in a timely fashion.
Telemedicine can be used for symptom management as well as leveraging supportive care services.
Cost for cancer care is very difficult to sustain. The OCM provides early insights into expenditures, challenges, and opportunities. Practices should use this information to build infrastructure and provide high quality, cost-effective care. Value-based cancer care should be the overarching goal for oncology practices and health care organizations.
Dr. Mahesh is the director of hematology-oncology and program director of the Oncology Care Model at Summa Health in Akron, Ohio.
References
1. Siegel RL et al. Cancer statistics, 2018. CA Cancer J Clin. 2018 Jan;68(1):7-30.
2. Medical Expenditure Panel Survey, Statistical Brief #443. 2014 Jun.
3. CMS: Oncology Care Model.
4. CMS: OCM Frequently Asked Questions.
5. Himelstein AL et al. Effect of longer-interval vs. standard dosing of zoledronic acid on skeletal events in patients with bone metastases. JAMA. 2017 Jan 3;317(1):48-58.
6. Grothey A et al. Duration of adjuvant chemotherapy for stage III colon cancer. N Engl J Med. 2018;378(13):1177-88.
7. Von Minckwitz G et al. Adjuvant pertuzumab and trastuzumab in early HER2-positive breast cancer. N Engl J Med. 2017;377(2):122-31.
8. American Society of Clinical Oncology: Ten Things Physician and Patients Should Question.
9. Temel JS et al. Early palliative care for patients with metastatic non–small cell lung cancer. N Engl J Med. 2010;363(8):733-42.
10. Blayney DW et al. Critical lessons from high-value oncology practices. JAMA Oncol. 2018 Feb 1;4(2):164-71.
11. Sherman DE. Transforming practices through the oncology care model: financial toxicity and counseling. J Oncol Pract. 2017 Aug;13(8):519-22.
Care of the cancer patient is complex and expensive. During 2001-2011, medical spending to treat cancer increased from $56.8 billion to $88.3 billion in the United States. During this time, ambulatory expenditures for care and treatment increased while inpatient hospital expenditures decreased.1,2 Treatments for cancer have advanced, but costs do not correlate with outcomes. Advanced payment models aimed at ensuring high quality while lowering costs may be the vehicle to help mitigate the financial burden of cancer treatment on patients and society at large.
Oncology Care Model
The Center for Medicare and Medicaid Innovation designed the Oncology Care Model (OCM), which allows practices and payers in the United States to partner with the Centers for Medicare & Medicaid Services. The goal of the OCM is to provide high quality, highly coordinated cancer care at the same or lower cost. Practice partnerships with the CMS involve payment arrangements that include financial and performance accountability for episodes of cancer care surrounding chemotherapy delivery to patients.3
Practices that have been selected by the CMS have attested to providing a number of enhanced services from 24/7 patient access to an appropriate clinician who can access medical records to having a documented care plan for every patient.4
Payment methodology
An episode of care is defined as a 6-month period that starts at the time of chemotherapy administration. In addition to the standard fee-for-service payment, practices have the ability to earn two other types of payments during an oncology episode.
The per-beneficiary Monthly Enhanced Oncology Services payment is $960 for the entire episode but is paid to practices at $160 per month.
Practices have the potential to earn additional performance-based payments (PBP) based on the difference in cost between the projected and actual cost of the episode. The PBP also incorporates performance on quality metrics, based on Medicare claims and other information submitted by the practice. For example, claims-based measures include hospital, emergency department (ED), and hospice utilization.
To participate in the OCM, practices must choose either a one-sided or two-sided risk model. In the one-sided risk model, practices take on no downside risk but need to achieve a greater reduction in expenditures (4% below the benchmark price). In the two-side risk model, practices need only to reduce expenditures by 2.75% below the benchmark price. But if they fail to meet their savings goals, they must pay the difference to the CMS. The recoupment is capped at 20% of the benchmark amount.
Feedback reports
The CMS sends quarterly feedback reports that contain information on practice demographics, outcomes, expenditures, chemotherapy use, and patient satisfaction. The outcomes include the mortality rate for Medicare beneficiaries treated at the practice, compared with other practices nationally. In addition, the reports include end-of-life metrics and patient satisfaction, as well as details of expenditures on drugs, hospital use, imaging and laboratory services, and a description of chemotherapy usage.
These reports can be a helpful tool for measuring your own use of services, as well as benchmarking it against national figures.
Practice modifications
According to CMS feedback reports, the cost of care per beneficiary per month has increased across all practices since the inception of the OCM. However, there are practices that have been successful in reducing cost of care without negatively affecting mortality.
Drugs, hospital, and ED visits, along with imaging and laboratory evaluation, account for 75% of the cost. Some strategies to reduce expenditure involve targeting those areas.
Consider prescribing drugs conservatively without affecting outcomes. For instance, bisphosphonates for bone metastasis can be given every 12 weeks instead of 4 weeks.5 Similarly, adjuvant chemotherapy can be given for 3 months, instead of 6 months in appropriate stage 3 colon cancer patients.6
Another potential opportunity for savings is the judicious use of pertuzumab in early-stage breast cancer patients.7 These are all evidence-based recommendations with potential for cost savings. Clinical pathways can aid in this process, but physician buy-in is imperative.
In terms of imaging, avoid PET scans when they will not affect your clinical decision making, avoid staging scans in early-stage breast and prostate cancer patients, and avoid surveillance scans among early-stage breast cancer and lymphoma patients. The Choosing Wisely campaign can help guide some of these decisions.8
Another area where good care meets cost effective care is in the early engagement of palliative care. Several studies have shown that early involvement of palliative care improves survival and quality of life.9,10 Palliative care involvement also decreases the emotional burden for patients and oncologists. Appropriate symptom control, particularly of pain, decreases hospitalizations during treatment.
Investing in a robust supportive care team – financial advocates, social work, nutrition, behavioral health, as well as various community services – can help reduce the financial, physical, and emotional distress levels for patients. All of these services ultimately lead to reduced hospitalizations.11 The Monthly Enhanced Oncology Services payment can be put toward these expenses.
Care teams working at the highest level of competence and license can also save time and money. Consider using registered nurses to implement triage pathways to assess side effects and symptom management, or using nurse practitioners, registered nurses, and physician assistants for same-day appointments and to assess symptoms rather than referring patients to the emergency department.
Avoid the ED and hospitalizations by using the infusion center to provide hydration and blood transfusions in a timely fashion.
Telemedicine can be used for symptom management as well as leveraging supportive care services.
Cost for cancer care is very difficult to sustain. The OCM provides early insights into expenditures, challenges, and opportunities. Practices should use this information to build infrastructure and provide high quality, cost-effective care. Value-based cancer care should be the overarching goal for oncology practices and health care organizations.
Dr. Mahesh is the director of hematology-oncology and program director of the Oncology Care Model at Summa Health in Akron, Ohio.
References
1. Siegel RL et al. Cancer statistics, 2018. CA Cancer J Clin. 2018 Jan;68(1):7-30.
2. Medical Expenditure Panel Survey, Statistical Brief #443. 2014 Jun.
3. CMS: Oncology Care Model.
4. CMS: OCM Frequently Asked Questions.
5. Himelstein AL et al. Effect of longer-interval vs. standard dosing of zoledronic acid on skeletal events in patients with bone metastases. JAMA. 2017 Jan 3;317(1):48-58.
6. Grothey A et al. Duration of adjuvant chemotherapy for stage III colon cancer. N Engl J Med. 2018;378(13):1177-88.
7. Von Minckwitz G et al. Adjuvant pertuzumab and trastuzumab in early HER2-positive breast cancer. N Engl J Med. 2017;377(2):122-31.
8. American Society of Clinical Oncology: Ten Things Physician and Patients Should Question.
9. Temel JS et al. Early palliative care for patients with metastatic non–small cell lung cancer. N Engl J Med. 2010;363(8):733-42.
10. Blayney DW et al. Critical lessons from high-value oncology practices. JAMA Oncol. 2018 Feb 1;4(2):164-71.
11. Sherman DE. Transforming practices through the oncology care model: financial toxicity and counseling. J Oncol Pract. 2017 Aug;13(8):519-22.
Idelalisib shows long-term safety, efficacy for relapsed CLL
For patients with relapsed/refractory chronic lymphocytic leukemia (CLL), long-term treatment with the phosphoinositol 3-kinase inhibitor idelalisib appears safe and effective, according to investigators.
Final results from a phase 3 trial confirmed survival advantages when idelalisib is used in combination with rituximab, reported lead author Jeff P. Sharman, MD, of Willamette Valley Cancer Institute and Research Center in Springfield, Ore., and colleagues.
During follow-up, which exceeded 5 years in some patients, no new idelalisib-related adverse events were encountered, supporting the safety of long-term use, the investigators noted. The report is in the Journal of Clinical Oncology.
This study was “pivotal” for treating elderly patients with relapsed CLL, the investigators wrote, as these patients previously had few treatment options beyond supportive or palliative care.
Earlier results from the study showed that adding idelalisib to rituximab raised overall response rates from about 15.5% to 83.6% and median progression-free survival from 6.5 months to 19.4 months, resulting in “significantly better clinical outcomes compared with those seen with rituximab alone,” leading to approval by the Food and Drug Administration.
During the primary study, 110 patients received a combination of idelalisib and rituximab, while 108 patients received rituximab and placebo. The median patient age was 71 years, with a median of three lines of prior therapy. The present analysis focused on the 110 patients in the combination group who received at least one dose of idelalisib, whether or not they elected to participate in the extension phase.
After a median follow-up of 18 months, ranging from 0.3 months to 67.6 months, the overall response rate was 85.5% and the median progression-free survival was 20.3 months, both of which are similar to earlier findings. Median overall survival was 40.6 months.
With a median duration of exposure of 16.2 months, the safety analysis revealed no new idelalisib-related adverse events.
However, the investigators pointed out that prolonged therapy often led to diarrhea, which ultimately occurred in about half of patients (46.4%). Roughly equal amounts of patients experienced grade 2 (17.3%) or grade 3 or greater diarrhea (16.4%). In cases of grade 3 or greater diarrhea, steroid therapy was recommended, typically resulting in symptom resolution within 2 weeks; however, “there were insufficient numbers of patients to determine if steroid therapy affected the duration of symptoms,” the investigators wrote.
“The longer-term data presented here confirm the previously reported efficacy of targeting PI3K with idelalisib in patients with relapsed/refractory CLL and support the use of [idelalisib and rituximab] in this patient population with careful management of potential [adverse events],” they wrote.
Gilead Sciences funded the study. Dr. Sharman reported financial relationships with Gilead and other companies.
SOURCE: Sharman JP et al. J Clin Oncol. 2019 Apr 17. doi: 10.1200/JCO.18.01460.
FROM THE JOURNAL OF CLINICAL ONCOLOGY
TTP death linked to elevated troponin and neurological signs
GLASGOW – , according to retrospective analysis of 475 patients from the United Kingdom TTP registry.

In addition, low ADAMTS13 activity (less than 10%) was present in 92% of immune-mediated of TTP upon acute presentation, reported lead author Jin-Sup Shin, MD, of University College London Hospital, and colleagues.
Presenting at the annual meeting of the British Society for Haematology, Dr. Shin provided some background on TTP, a condition that most clinicians encounter infrequently.
“As recently as the 1980s and 90s, when etiology was not that well understood, TTP was associated with an untreated mortality of up to 90%,” Dr. Shin said. “However, based on improved understanding of pathophysiology, and through the creation of TTP registries worldwide, there have been major advances in diagnosis, treatment, and outcomes.”
To gain insight into diagnostic and prognostic characteristics of TTP, the investigators turned to data from 602 patients with clinically suspected TTP, based on an ADAMTS13 activity level less than 10% of normal and associated clinical signs. Out of these 602 patients, 475 consented to registry participation and data analysis.
The analysis revealed a mortality rate of 4%, although Dr. Shin said that “this is probably an underestimate of the true figure,” as it excludes those who died before treatment could be initiated.
Nearly three-quarters of patients were female. The median age at presentation was 43 years, with a range of 1-93 years. The most commonly represented racial/ethnic groups were white (60%) and Afro-Caribbean (22%). Some cases were congenital (16%), but the majority were immune mediated (84%).
The immune-mediated group was the primary focus of Dr. Shin’s report. In this cohort, 76% of cases were idiopathic, while the remainder had a defined precipitant; most common were infection, autoimmune disease, pregnancy, and HIV. The relapse rate among those with immune-mediated TTP was 19%, after a median time to relapse of 26 months.
In total, 71% of patients presented with neurological abnormalities, while slightly less than half (48%) had symptomatic thrombocytopenia (bleeding/petechiae).
Diagnostic tools showed that 64% of patients had an elevated troponin level, 92% had ADAMTS13 activity less than 10%, and 25% had a platelet count lower than 10 x 109/L.
Median platelet count upon presentation was 15 x 109/L, and median lactate dehydrogenase (LDH) exceeded 1,000 units/L. After 7 days of therapy, 58% of patients were still severely deficient in ADAMTS13 activity and 36% of patients still had a platelet count lower than 150 x 109/L.
Where information was available, 30% of patients had positive auto-antibody screens, although not necessarily with signs or symptoms of autoimmune disease. A total of 93% of patients had elevated ADAMTS13 IgG antibody upon presentation. The median ADAMTS13 IgG antibody level at presentation was 37%, with a normal value being less than 6%.
Nearly half of patients with immune-mediated TTP (45%) required intensive care, and 10% of these patients were intubated and ventilated. Most patients were treated with steroids upon admission (81%). On average, 11 plasma exchanges (PEXs) were required before remission.
The investigators noted that “[t]he number of PEXs to remission appears to have decreased over the years.” As an example, a median of 14 PEXs were needed from 2009 to 2010, compared with 8 from 2017 to 2018.
Although rituximab usage in the acute setting held steady over the 10-year period, elective use increased. Out of 89 instances of subacute relapse, elective rituximab was given twice from 2009 to 2010, compared with 26 times from 2017 to 2018.
Comparing features of survival, the investigators found that the median ADAMTS13 IgG antibody level was higher among those who died. Other factors related to increased mortality risk included raised troponin (sevenfold increased risk) and neurological abnormalities, defined by reduced Glasgow Coma Scale score (sixfold increased risk).
“Our data confirm other registries worldwide; in particular, increased susceptibility in women, the Afro-Caribbean population, and those who are middle-aged,” Dr. Shin said. “Our data also show that elevated cardiac troponin and neurological involvement are indicators of poor prognosis. Also, raised antibody levels appear to be associated with a worse clinical outcome and increased mortality rate. These are clearly valuable markers in clinical practice, allowing for intensive care of high-risk patients.”
The investigators reported having no conflicts of interest.
GLASGOW – , according to retrospective analysis of 475 patients from the United Kingdom TTP registry.
In addition, low ADAMTS13 activity (less than 10%) was present in 92% of immune-mediated of TTP upon acute presentation, reported lead author Jin-Sup Shin, MD, of University College London Hospital, and colleagues.
Presenting at the annual meeting of the British Society for Haematology, Dr. Shin provided some background on TTP, a condition that most clinicians encounter infrequently.
“As recently as the 1980s and 90s, when etiology was not that well understood, TTP was associated with an untreated mortality of up to 90%,” Dr. Shin said. “However, based on improved understanding of pathophysiology, and through the creation of TTP registries worldwide, there have been major advances in diagnosis, treatment, and outcomes.”
To gain insight into diagnostic and prognostic characteristics of TTP, the investigators turned to data from 602 patients with clinically suspected TTP, based on an ADAMTS13 activity level less than 10% of normal and associated clinical signs. Out of these 602 patients, 475 consented to registry participation and data analysis.
The analysis revealed a mortality rate of 4%, although Dr. Shin said that “this is probably an underestimate of the true figure,” as it excludes those who died before treatment could be initiated.
Nearly three-quarters of patients were female. The median age at presentation was 43 years, with a range of 1-93 years. The most commonly represented racial/ethnic groups were white (60%) and Afro-Caribbean (22%). Some cases were congenital (16%), but the majority were immune mediated (84%).
The immune-mediated group was the primary focus of Dr. Shin’s report. In this cohort, 76% of cases were idiopathic, while the remainder had a defined precipitant; most common were infection, autoimmune disease, pregnancy, and HIV. The relapse rate among those with immune-mediated TTP was 19%, after a median time to relapse of 26 months.
In total, 71% of patients presented with neurological abnormalities, while slightly less than half (48%) had symptomatic thrombocytopenia (bleeding/petechiae).
Diagnostic tools showed that 64% of patients had an elevated troponin level, 92% had ADAMTS13 activity less than 10%, and 25% had a platelet count lower than 10 x 109/L.
Median platelet count upon presentation was 15 x 109/L, and median lactate dehydrogenase (LDH) exceeded 1,000 units/L. After 7 days of therapy, 58% of patients were still severely deficient in ADAMTS13 activity and 36% of patients still had a platelet count lower than 150 x 109/L.
Where information was available, 30% of patients had positive auto-antibody screens, although not necessarily with signs or symptoms of autoimmune disease. A total of 93% of patients had elevated ADAMTS13 IgG antibody upon presentation. The median ADAMTS13 IgG antibody level at presentation was 37%, with a normal value being less than 6%.
Nearly half of patients with immune-mediated TTP (45%) required intensive care, and 10% of these patients were intubated and ventilated. Most patients were treated with steroids upon admission (81%). On average, 11 plasma exchanges (PEXs) were required before remission.
The investigators noted that “[t]he number of PEXs to remission appears to have decreased over the years.” As an example, a median of 14 PEXs were needed from 2009 to 2010, compared with 8 from 2017 to 2018.
Although rituximab usage in the acute setting held steady over the 10-year period, elective use increased. Out of 89 instances of subacute relapse, elective rituximab was given twice from 2009 to 2010, compared with 26 times from 2017 to 2018.
Comparing features of survival, the investigators found that the median ADAMTS13 IgG antibody level was higher among those who died. Other factors related to increased mortality risk included raised troponin (sevenfold increased risk) and neurological abnormalities, defined by reduced Glasgow Coma Scale score (sixfold increased risk).
“Our data confirm other registries worldwide; in particular, increased susceptibility in women, the Afro-Caribbean population, and those who are middle-aged,” Dr. Shin said. “Our data also show that elevated cardiac troponin and neurological involvement are indicators of poor prognosis. Also, raised antibody levels appear to be associated with a worse clinical outcome and increased mortality rate. These are clearly valuable markers in clinical practice, allowing for intensive care of high-risk patients.”
The investigators reported having no conflicts of interest.
REPORTING FROM BSH 2019
Key clinical point: Neurological abnormalities and elevated troponin predict mortality in patients with thrombotic thrombocytopenic purpura (TTP).
Major finding: ADAMTS13 IgG antibody level, elevated troponin, and neurological abnormalities were all linked to an increased mortality risk.
Study details: A retrospective analysis of 475 patients with clinically suspected thrombotic thrombocytopenic purpura (TTP) from the U.K. registry (2009-2018).
Disclosures: The investigators reported having no conflicts of interest.
CDC warns against misuse of opioid-prescribing guideline
Officials at the Centers for Disease Control and Prevention are warning against the misapplication of the agency’s 2016 guidelines on opioid prescribing, as well as clarifying dosage recommendations for patients starting or stopping pain medications.
![]()
In a perspective published in the New England Journal of Medicine on April 24, lead author Deborah Dowell, MD, chief medical officer for the CDC’s National Center for Injury Prevention and Control, conveyed concern that some policies and practices derived from the 2016 CDC Guideline for Prescribing Opioids for Chronic Pain are inconsistent with the recommendations and often go beyond their scope.
Misapplication examples include inappropriately applying the guideline to patients in active cancer treatment, patients experiencing acute sickle cell crises, or patients experiencing postsurgical pain, Dr. Dowell wrote.
The guideline offers guidance to clinicians treating chronic pain in adults who are already receiving opioids long-term at high dosages, she noted. It includes advice on maximizing nonopioid treatment, reviewing risks associated with continuing high-dose opioids, and collaborating with patients who agree to taper dosage, among other guidance.
Any application of the guideline’s dosage recommendation that results in hard limits or “cutting off” opioids is also an incorrect use of the recommendations, according to Dr. Dowell.
While the guideline advises clinicians to start opioids at the lowest effective dosage and avoid increasing dosage to 90 morphine milligram equivalents per day or more, that statement does not suggest discontinuation of opioids already prescribed at high dosages, according to the CDC’s clarification.
The guidance also does not apply to patients receiving or starting medication-assisted treatment for opioid use disorder.
The commentary comes after a trio of organizations raised concerns that insurers are inappropriately applying the recommendations to active cancer patients when making coverage determinations.
The American Society of Clinical Oncology, the National Comprehensive Cancer Network, and the American Society of Hematology, raised the issue in a letter to the CDC in February. In response, Dr. Dowell clarified that the recommendations are not intended to deny clinically appropriate opioid therapy to any patients who suffer chronic pain, but rather to ensure that physicians and patients consider all safe and effective treatment options.
In the perspective, Dr. Dowell wrote that the CDC is evaluating the intended and unintended impact of the 2016 opioid-prescribing guideline on clinician and patient outcomes and that the agency is committed to updating the recommendations when new evidence is available.