User login
Antiviral Therapy Improves Hepatocellular Cancer Survival
Hepatocellular cancer (HCC) is the most common type of hepatic cancers, accounting for 65% of all hepatic cancers.1 Among all cancers, HCC is one of the fastest growing causes of death in the United States, and the rate of new HCC cases are on the rise over several decades.2 There are many risk factors leading to HCC, including alcohol use, obesity, and smoking. Infection with hepatitis C virus (HCV) poses a significant risk.1
The pathogenesis of HCV-induced carcinogenesis is mediated by a unique host-induced immunologic response. Viral replication induces production of inflammatory factors, such as tumor necrosis factor (TNF-α), interferon (IFN), and oxidative stress on hepatocytes, resulting in cell injury, death, and regeneration. Repetitive cycles of cellular death and regeneration induce fibrosis, which may lead to cirrhosis.3 Hence, early treatment of HCV infection and achieving sustained virologic response (SVR) may lead to decreased incidence and mortality associated with HCC.
Treatment of HCV infection has become more effective with the development of direct-acting antivirals (DAAs) leading to SVR in > 90% of patients compared with 40 to 50% with IFN-based treatment.4,5 DAAs have been proved safe and highly effective in eradicating HCV infection even in patients with advanced liver disease with decompensated cirrhosis.6 Although achieving SVR indicates a complete cure from chronic HCV infection, several studies have shown subsequent risk of developing HCC persists even after successful HCV treatment.7-9 Some studies show that using DAAs to achieve SVR in patients with HCV infection leads to a decreased relative risk of HCC development compared with patients who do not receive treatment.10-12 But data on HCC risk following DAA-induced SVR vs IFN-induced SVR are somewhat conflicting.
Much of the information regarding the association between SVR and HCC has been gleaned from large data banks without accounting for individual patient characteristics that can be obtained through full chart review. Due to small sample sizes in many chart review studies, the impact that SVR from DAA therapy has on the progression and severity of HCC is not entirely clear. The aim of our study is to evaluate the effect of HCV treatment and SVR status on overall survival (OS) in patients with HCC. Second, we aim to compare survival benefits, if any exist, among the 2 major HCV treatment modalities (IFN vs DAA).
Methods
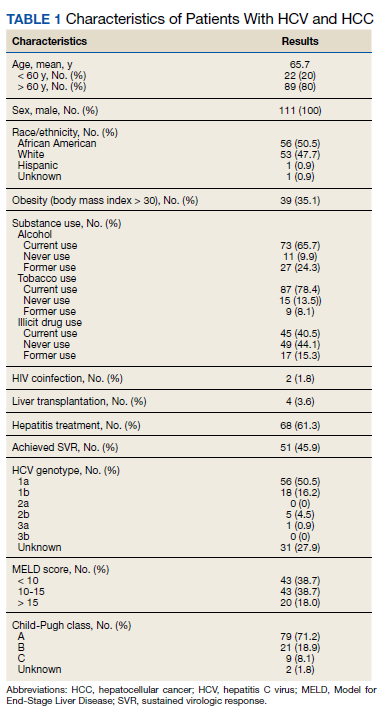
We performed a retrospective review of patients at Memphis Veterans Affairs Medical Center (VAMC) in Tennessee to determine whether treatment for HCV infection in general, and achieving SVR in particular, makes a difference in progression, recurrence, or OS among patients with HCV infection who develop HCC. We identified 111 patients with a diagnosis of both HCV and new or recurrent HCC lesions from November 2008 to March 2019 (Table 1). We divided these patients based on their HCV treatment status, SVR status, and treatment types (IFN vs DAA).
The inclusion criteria were patients aged > 18 years treated at the Memphis VAMC who have HCV infection and developed HCC. Exclusion criteria were patients who developed HCC from other causes such as alcoholic steatohepatitis, hepatitis B virus infection, hemochromatosis, patients without HCV infection, and patients who were not established at the Memphis VAMC. This protocol was approved by the Memphis VAMC Institutional Review Board.
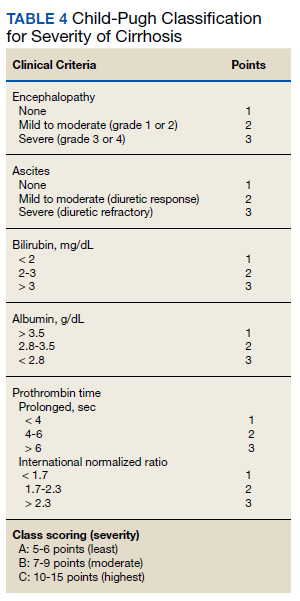
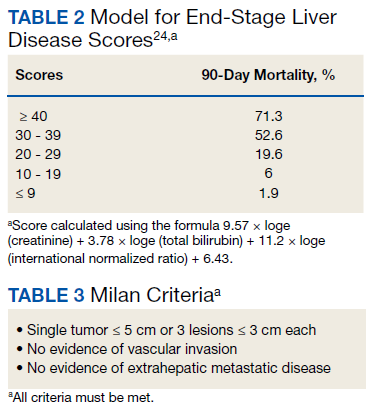
HCC diagnosis was determined using International Classification of Diseases codes (9th revision: 155 and 155.2; 10th revision: CD 22 and 22.9). We also used records of multidisciplinary gastrointestinal malignancy tumor conferences to identify patient who had been diagnosed and treated for HCV infection. We identified patients who were treated with DAA vs IFN as well as patients who had achieved SVR (classified as having negative HCV RNA tests at the end of DAA treatment). We were unable to evaluate Barcelona Clinic Liver Cancer staging since this required documented performance status that was not available in many patient records. We selected cases consistent with both treatment for HCV infection and subsequent development of HCC. Patient data included age; OS time; HIV status HCV genotype; time and status of progression to HCC; type and duration of treatment; and alcohol, tobacco, and drug use. Disease status was measured using the Model for End-Stage Liver Disease (MELD) score (Table 2), Milan criteria (Table 3), and Child-Pugh score (Table 4).
Statistical Analysis
OS was measured from the date of HCC diagnosis to the date of death or last follow-up. Progression-free survival (PFS) was defined from the date of HCC treatment initiation to the date of first HCC recurrence. We compared survival data for the SVR and non-SVR subgroups, the HCV treatment vs non-HCV treatment subgroups, and the IFN therapy vs DAA therapy subgroups, using the Kaplan-Meier method. The differences between subgroups were assessed using a log-rank test. Multivariate analysis using Cox proportional hazards regression model was used to identify factors that had significant impact on OS. Those factors included age; race; alcohol, tobacco, and illicit drug use; SVR status; HCV treatment status; IFN-based regimen vs DAA; MELD, and Child-Pugh scores. The results were expressed as hazard ratios (HRs) and 95% CI. Calculations were made using Statistical Analysis SAS and IBM SPSS software.
Results
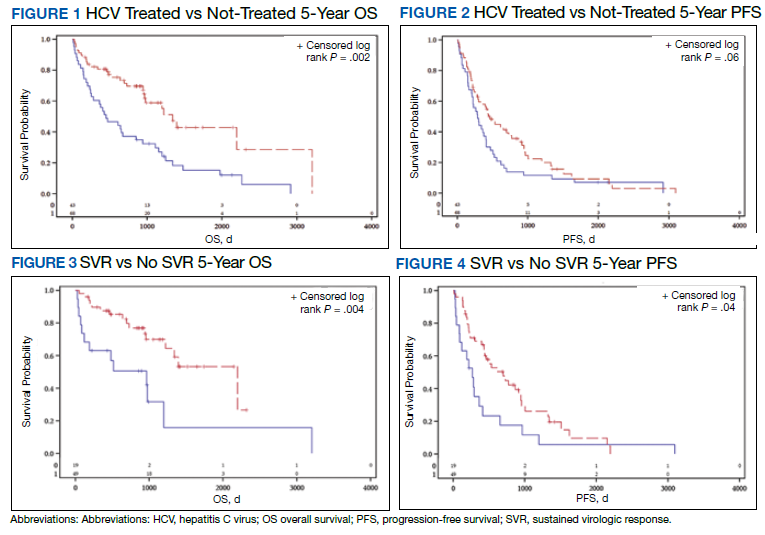
The study included 111 patients. The mean age was 65.7 years; all were male and half of were Black patients. The gender imbalance was due to the predominantly male patient population at Memphis VAMC. Among 111 patients with HCV infection and HCC, 68 patients were treated for HCV infection and had significantly improved OS and PFS compared with the nontreatment group. The median 5-year OS was 44.6 months (95% CI, 966-3202) in the treated HCV infection group compared with 15.1 months in the untreated HCV infection group with a Wilcoxon P = .0005 (Figure 1). Similarly, patients treated for HCV infection had a significantly better 5-year PFS of 15.3 months (95% CI, 294-726) compared with the nontreatment group 9.5 months (95% CI, 205-405) with a Wilcoxon P = .04 (Figure 2).
Among 68 patients treated for HCV infection, 51 achieved SVR, and 34 achieved SVR after the diagnosis of HCC. Patients who achieved SVR had an improved 5-year OS when compared with patients who did not achieve SVR (median 65.8 months [95% CI, 1222-NA] vs 15.7 months [95% CI, 242-853], Wilcoxon P < .001) (Figure 3). Similarly, patients with SVR had improved 5-year PFS when compared with the non-SVR group (median 20.5 months [95% CI, 431-914] vs 8.9 months [95% CI, 191-340], Wilcoxon P = .007 (Figure 4). Achievement of SVR after HCC diagnosis suggests a significantly improved OS (HR 0.37) compared with achievement prior to HCC diagnosis (HR, 0.65; 95% CI, 0.23-1.82, P = .41)
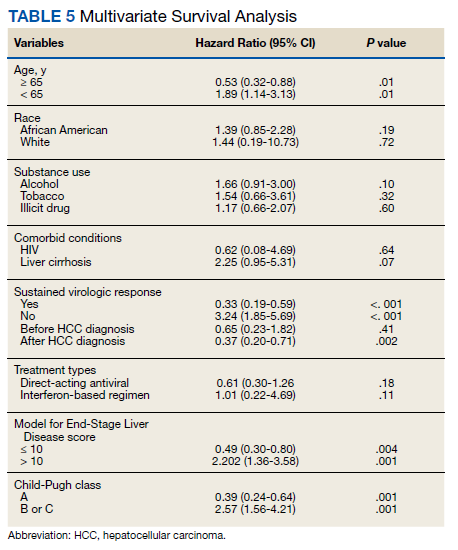
Multivariate Cox regression was used to determine factors with significant survival impact. Advanced age at diagnosis (aged ≥ 65 years) (HR, 0.53; 95% CI, 0.320-0.880; P = .01), SVR status (HR, 0.33; 95% CI, 0.190-0.587; P < .001), achieving SVR after HCC diagnosis (HR, 0.37; 95% CI, 0.20-0.71; P = .002), low MELD score (< 10) (HR, 0.49; 95% CI, 0.30-0.80; P = .004) and low Child-Pugh score (class A) (HR, 0.39; 95% CI, 0.24-0.64; P = .001) have a significant positive impact on OS. Survival was not significantly influenced by race, tobacco, drug use, HIV or cirrhosis status, or HCV treatment type. In addition, higher Child-Pugh class (B or C), higher MELD score (> 10), and younger age at diagnosis (< 65 years) have a negative impact on survival outcome (Table 5).
Discussion
The survival benefit of HCV eradication and achieving SVR status has been well established in patients with HCC.13 In a retrospective cohort study of 250 patients with HCV infection who had received curative treatment for HCC, multivariate analysis demonstrated that achieving SVR is an independent predictor of OS.14 The 3-year and 5-year OS rates were 97% and 94% for the SVR group, and 91% and 60% for the non‐SVR group, respectively (P < .001). Similarly, according to Sou and colleagues, of 122 patients with HCV-related HCC, patients with SVR had longer OS than patients with no SVR (P = .04).15 One of the hypotheses that could explain the survival benefit in patients who achieved SVR is the effect of achieving SVR in reducing persistent liver inflammation and associated liver mortality, and therefore lowering risks of complication in patients with HCC.16 In our study, multivariate analysis shows that achieving SVR is associated with significant improved OS (HR, 0.33). In contrast, patients with HCC who have not achieved SVR are associated with worse survival (HR, 3.24). This finding supports early treatment of HCV to obtain SVR in HCV-related patients with HCC, even after development of HCC.
Among 68 patients treated for HCV infection, 45 patients were treated after HCC diagnosis, and 34 patients achieved SVR after HCC diagnosis. The average time between HCV infection treatment after HCC diagnosis was 6 months. Our data suggested that achievement of SVR after HCC diagnosis suggests an improved OS (HR, 0.37) compared with achievement prior to HCC diagnosis (HR, 0.65; 95% CI,0.23-1.82; P = .41). This lack of statistical significance is likely due to small sample size of patients achieving SVR prior to HCC diagnosis. Our results are consistent with the findings regarding the efficacy and timing of DAA treatment in patients with active HCC. According to Singal and colleagues, achieving SVR after DAA therapy may result in improved liver function and facilitate additional HCC-directed therapy, which potentially improves survival.17-19
Nagaoki and colleagues found that there was no significant difference in OS in patients with HCC between the DAA and IFN groups. According to the study, the 3-year and 5-year OS rates were 96% and 96% for DAA patients and 93% and 73% for IFN patients, respectively (P = .16).14 This finding is consistent with the results of our study. HCV treatment type (IFN vs DAA) was not found to be associated with either OS or PFS time, regardless of time period.
A higher MELD score (> 10) and a higher Child-Pugh class (B or C) score are associated with worse survival outcome regardless of SVR status. While patients with a low MELD score (≤ 10) have a better survival rate (HR 0.49), a higher MELD score has a significantly higher HR and therefore worse survival outcomes (HR, 2.20). Similarly, patients with Child-Pugh A (HR, 0.39) have a better survival outcome compared with those patients with Child-Pugh class B or C (HR, 2.57). This finding is consistent with results of multiple studies indicating that advanced liver disease, as measured by a high MELD score and Child-Pugh class score, can be used to predict the survival outcome in patients with HCV-related HCC.20-22
Unlike other studies that look at a single prognostic variable, our study evaluated prognostic impacts of multiple variables (age, SVR status, the order of SVR in relation to HCC development, HCV treatment type, MELD score and Child-Pugh class) in patients with HCC. The study included patients treated for HCV after development of HCC along with other multiple variables leading to OS benefit. It is one of the only studies in the United States that compared 5-year OS and PFS among patients with HCC treated for HCV and achieved SVR. The studies by Nagaoki and colleagues and Sou and colleagues were conducted in Japan, and some of their subset analyses were univariate. Among our study population of veterans, 50% were African American patients, suggesting that they may have similar OS benefit when compared to White patients with HCC and HCV treatment.
Limitations
Our findings were limited in that our study population is too small to conduct further subset analysis that would allow statistical significance of those subsets, such as the suggested benefit of SVR in patients who presented with HCC after antiviral therapy. Another limitation is the all-male population, likely a result of the older veteran population at the Memphis VAMC. The mean age at diagnosis was 65 years, which is slightly higher than the general population. Compared to the SEER database, HCC is most frequently diagnosed among people aged 55 to 64 years.23 The age difference was likely due to our aging veteran population.
Further studies are needed to determine the significance of SVR on HCC recurrence and treatment. Immunotherapy is now first-line treatment for patients with local advanced HCC. All the immunotherapy studies excluded patients with active HCV infection. Hence, we need more data on HCV treatment timing among patients scheduled to start treatment with immunotherapy.
Conclusions
In a population of older veterans, treatment of HCV infection leads to OS benefit among patients with HCC. In addition, patients with HCV infection who achieve SVR have an OS benefit over patients unable to achieve SVR. The type of treatment, DAA vs IFN-based regimen, did not show significant survival benefit.
1. Ghouri YA, Mian I, Rowe JH. Review of hepatocellular carcinoma: epidemiology, etiology, and carcinogenesis. J Carcinog. 2017;16:1. Published 2017 May 29. doi:10.4103/jcar.JCar_9_16
2. Bray F, Ferlay J, Soerjomataram I, Siegel RL, Torre LA, Jemal A. Global cancer statistics 2018: GLOBOCAN estimates of incidence and mortality worldwide for 36 cancers in 185 countries. CA Cancer J Clin. 2018;68(6):394-424. doi:10.3322/caac.21492
3. Farazi PA, DePinho RA. Hepatocellular carcinoma pathogenesis: from genes to environment. Nat Rev Cancer. 2006;6(9):674-687. doi:10.1038/nrc1934
4. Falade-Nwulia O, Suarez-Cuervo C, Nelson DR, Fried MW, Segal JB, Sulkowski MS. Oral direct-acting agent therapy for hepatitis c virus infection: a systematic review. Ann Intern Med. 2017;166(9):637-648. doi:10.7326/M16-2575
5. Kouris G, Hydery T, Greenwood BC, et al. Effectiveness of Ledipasvir/Sofosbuvir and predictors of treatment failure in members with hepatitis C genotype 1 infection: a retrospective cohort study in a medicaid population. J Manag Care Spec Pharm. 2018;24(7):591-597. doi:10.18553/jmcp.2018.24.7.591
6. Jacobson IM, Lawitz E, Kwo PY, et al. Safety and efficacy of elbasvir/grazoprevir in patients with hepatitis c virus infection and compensated cirrhosis: an integrated analysis. Gastroenterology. 2017;152(6):1372-1382.e2. doi:10.1053/j.gastro.2017.01.050
7. Nahon P, Layese R, Bourcier V, et al. Incidence of hepatocellular carcinoma after direct antiviral therapy for HCV in patients with cirrhosis included in surveillance programs. Gastroenterology. 2018;155(5):1436-1450.e6. doi:10.1053/j.gastro.2018.07.01510.
8. Innes H, Barclay ST, Hayes PC, et al. The risk of hepatocellular carcinoma in cirrhotic patients with hepatitis C and sustained viral response: role of the treatment regimen. J Hepatol. 2018;68(4):646-654. doi:10.1016/j.jhep.2017.10.033
9. Romano A, Angeli P, Piovesan S, et al. Newly diagnosed hepatocellular carcinoma in patients with advanced hepatitis C treated with DAAs: a prospective population study. J Hepatol. 2018;69(2):345-352. doi:10.1016/j.jhep.2018.03.009
10. Kanwal F, Kramer J, Asch SM, Chayanupatkul M, Cao Y, El-Serag HB. Risk of hepatocellular cancer in HCV patients treated with direct-acting antiviral agents. Gastroenterology. 2017;153(4):996-1005.e1. doi:10.1053/j.gastro.2017.06.0122
11. Singh S, Nautiyal A, Loke YK. Oral direct-acting antivirals and the incidence or recurrence of hepatocellular carcinoma: a systematic review and meta-analysis. Frontline Gastroenterol. 2018;9(4):262-270. doi:10.1136/flgastro-2018-101017
12. Kuftinec G, Loehfelm T, Corwin M, et al. De novo hepatocellular carcinoma occurrence in hepatitis C cirrhotics treated with direct-acting antiviral agents. Hepat Oncol. 2018;5(1):HEP06. Published 2018 Jul 25. doi:10.2217/hep-2018-00033
13. Morgan RL, Baack B, Smith BD, Yartel A, Pitasi M, Falck-Ytter Y. Eradication of hepatitis C virus infection and the development of hepatocellular carcinoma: a meta-analysis of observational studies. Ann Intern Med. 2013;158(5 Pt 1):329-337. doi:10.7326/0003-4819-158-5-201303050-00005
14. Nagaoki Y, Imamura M, Nishida Y, et al. The impact of interferon-free direct-acting antivirals on clinical outcome after curative treatment for hepatitis C virus-associated hepatocellular carcinoma: comparison with interferon-based therapy. J Med Virol. 2019;91(4):650-658. doi:10.1002/jmv.25352
15. Sou FM, Wu CK, Chang KC, et al. Clinical characteristics and prognosis of HCC occurrence after antiviral therapy for HCV patients between sustained and non-sustained responders. J Formos Med Assoc. 2019;118(1 Pt 3):504-513. doi:10.1016/j.jfma.2018.10.017
16. Roche B, Coilly A, Duclos-Vallee JC, Samuel D. The impact of treatment of hepatitis C with DAAs on the occurrence of HCC. Liver Int. 2018;38(suppl 1):139-145. doi:10.1111/liv.13659
17. Singal AG, Lim JK, Kanwal F. AGA clinical practice update on interaction between oral direct-acting antivirals for chronic hepatitis C infection and hepatocellular carcinoma: expert review. Gastroenterology. 2019;156(8):2149-2157. doi:10.1053/j.gastro.2019.02.046
18. Toyoda H, Kumada T, Hayashi K, et al. Characteristics and prognosis of hepatocellular carcinoma detected in sustained responders to interferon therapy for chronic hepatitis C. Cancer Detect Prev. 2003;27(6):498-502. doi:10.1016/j.cdp.2003.09.00719. Okamura Y, Sugiura T, Ito T, et al. The achievement of a sustained virological response either before or after hepatectomy improves the prognosis of patients with primary hepatitis C virus-related hepatocellular carcinoma. Ann Surg Oncol. 2019; 26(13):4566-4575. doi:10.1245/s10434-019-07911-w
20. Wray CJ, Harvin JA, Silberfein EJ, Ko TC, Kao LS. Pilot prognostic model of extremely poor survival among high-risk hepatocellular carcinoma patients. Cancer. 2012;118(24):6118-6125. doi:10.1002/cncr.27649
21. Kim JH, Kim JH, Choi JH, et al. Value of the model for end-stage liver disease for predicting survival in hepatocellular carcinoma patients treated with transarterial chemoembolization. Scand J Gastroenterol. 2009;44(3):346-357. doi:10.1080/00365520802530838
22. Vogeler M, Mohr I, Pfeiffenberger J, et al. Applicability of scoring systems predicting outcome of transarterial chemoembolization for hepatocellular carcinoma. J Cancer Res Clin Oncol. 2020;146(4):1033-1050. doi:10.1007/s00432-020-03135-8
23. National Institutes of Health, Surveillance, Epidemiology, and End Results. Cancer stat facts: cancer of the liver and intrahepatic bile duct. Accessed July 15, 2021. https://seer.cancer.gov/statfacts/html/livibd.html
24. Singal AK, Kamath PS. Model for End-stage Liver Disease. J Clin Exp Hepatol. 2013;3(1):50-60. doi:10.1016/j.jceh.2012.11.002
Hepatocellular cancer (HCC) is the most common type of hepatic cancers, accounting for 65% of all hepatic cancers.1 Among all cancers, HCC is one of the fastest growing causes of death in the United States, and the rate of new HCC cases are on the rise over several decades.2 There are many risk factors leading to HCC, including alcohol use, obesity, and smoking. Infection with hepatitis C virus (HCV) poses a significant risk.1
The pathogenesis of HCV-induced carcinogenesis is mediated by a unique host-induced immunologic response. Viral replication induces production of inflammatory factors, such as tumor necrosis factor (TNF-α), interferon (IFN), and oxidative stress on hepatocytes, resulting in cell injury, death, and regeneration. Repetitive cycles of cellular death and regeneration induce fibrosis, which may lead to cirrhosis.3 Hence, early treatment of HCV infection and achieving sustained virologic response (SVR) may lead to decreased incidence and mortality associated with HCC.
Treatment of HCV infection has become more effective with the development of direct-acting antivirals (DAAs) leading to SVR in > 90% of patients compared with 40 to 50% with IFN-based treatment.4,5 DAAs have been proved safe and highly effective in eradicating HCV infection even in patients with advanced liver disease with decompensated cirrhosis.6 Although achieving SVR indicates a complete cure from chronic HCV infection, several studies have shown subsequent risk of developing HCC persists even after successful HCV treatment.7-9 Some studies show that using DAAs to achieve SVR in patients with HCV infection leads to a decreased relative risk of HCC development compared with patients who do not receive treatment.10-12 But data on HCC risk following DAA-induced SVR vs IFN-induced SVR are somewhat conflicting.
Much of the information regarding the association between SVR and HCC has been gleaned from large data banks without accounting for individual patient characteristics that can be obtained through full chart review. Due to small sample sizes in many chart review studies, the impact that SVR from DAA therapy has on the progression and severity of HCC is not entirely clear. The aim of our study is to evaluate the effect of HCV treatment and SVR status on overall survival (OS) in patients with HCC. Second, we aim to compare survival benefits, if any exist, among the 2 major HCV treatment modalities (IFN vs DAA).
Methods
We performed a retrospective review of patients at Memphis Veterans Affairs Medical Center (VAMC) in Tennessee to determine whether treatment for HCV infection in general, and achieving SVR in particular, makes a difference in progression, recurrence, or OS among patients with HCV infection who develop HCC. We identified 111 patients with a diagnosis of both HCV and new or recurrent HCC lesions from November 2008 to March 2019 (Table 1). We divided these patients based on their HCV treatment status, SVR status, and treatment types (IFN vs DAA).
The inclusion criteria were patients aged > 18 years treated at the Memphis VAMC who have HCV infection and developed HCC. Exclusion criteria were patients who developed HCC from other causes such as alcoholic steatohepatitis, hepatitis B virus infection, hemochromatosis, patients without HCV infection, and patients who were not established at the Memphis VAMC. This protocol was approved by the Memphis VAMC Institutional Review Board.
HCC diagnosis was determined using International Classification of Diseases codes (9th revision: 155 and 155.2; 10th revision: CD 22 and 22.9). We also used records of multidisciplinary gastrointestinal malignancy tumor conferences to identify patient who had been diagnosed and treated for HCV infection. We identified patients who were treated with DAA vs IFN as well as patients who had achieved SVR (classified as having negative HCV RNA tests at the end of DAA treatment). We were unable to evaluate Barcelona Clinic Liver Cancer staging since this required documented performance status that was not available in many patient records. We selected cases consistent with both treatment for HCV infection and subsequent development of HCC. Patient data included age; OS time; HIV status HCV genotype; time and status of progression to HCC; type and duration of treatment; and alcohol, tobacco, and drug use. Disease status was measured using the Model for End-Stage Liver Disease (MELD) score (Table 2), Milan criteria (Table 3), and Child-Pugh score (Table 4).
Statistical Analysis
OS was measured from the date of HCC diagnosis to the date of death or last follow-up. Progression-free survival (PFS) was defined from the date of HCC treatment initiation to the date of first HCC recurrence. We compared survival data for the SVR and non-SVR subgroups, the HCV treatment vs non-HCV treatment subgroups, and the IFN therapy vs DAA therapy subgroups, using the Kaplan-Meier method. The differences between subgroups were assessed using a log-rank test. Multivariate analysis using Cox proportional hazards regression model was used to identify factors that had significant impact on OS. Those factors included age; race; alcohol, tobacco, and illicit drug use; SVR status; HCV treatment status; IFN-based regimen vs DAA; MELD, and Child-Pugh scores. The results were expressed as hazard ratios (HRs) and 95% CI. Calculations were made using Statistical Analysis SAS and IBM SPSS software.
Results
The study included 111 patients. The mean age was 65.7 years; all were male and half of were Black patients. The gender imbalance was due to the predominantly male patient population at Memphis VAMC. Among 111 patients with HCV infection and HCC, 68 patients were treated for HCV infection and had significantly improved OS and PFS compared with the nontreatment group. The median 5-year OS was 44.6 months (95% CI, 966-3202) in the treated HCV infection group compared with 15.1 months in the untreated HCV infection group with a Wilcoxon P = .0005 (Figure 1). Similarly, patients treated for HCV infection had a significantly better 5-year PFS of 15.3 months (95% CI, 294-726) compared with the nontreatment group 9.5 months (95% CI, 205-405) with a Wilcoxon P = .04 (Figure 2).
Among 68 patients treated for HCV infection, 51 achieved SVR, and 34 achieved SVR after the diagnosis of HCC. Patients who achieved SVR had an improved 5-year OS when compared with patients who did not achieve SVR (median 65.8 months [95% CI, 1222-NA] vs 15.7 months [95% CI, 242-853], Wilcoxon P < .001) (Figure 3). Similarly, patients with SVR had improved 5-year PFS when compared with the non-SVR group (median 20.5 months [95% CI, 431-914] vs 8.9 months [95% CI, 191-340], Wilcoxon P = .007 (Figure 4). Achievement of SVR after HCC diagnosis suggests a significantly improved OS (HR 0.37) compared with achievement prior to HCC diagnosis (HR, 0.65; 95% CI, 0.23-1.82, P = .41)
Multivariate Cox regression was used to determine factors with significant survival impact. Advanced age at diagnosis (aged ≥ 65 years) (HR, 0.53; 95% CI, 0.320-0.880; P = .01), SVR status (HR, 0.33; 95% CI, 0.190-0.587; P < .001), achieving SVR after HCC diagnosis (HR, 0.37; 95% CI, 0.20-0.71; P = .002), low MELD score (< 10) (HR, 0.49; 95% CI, 0.30-0.80; P = .004) and low Child-Pugh score (class A) (HR, 0.39; 95% CI, 0.24-0.64; P = .001) have a significant positive impact on OS. Survival was not significantly influenced by race, tobacco, drug use, HIV or cirrhosis status, or HCV treatment type. In addition, higher Child-Pugh class (B or C), higher MELD score (> 10), and younger age at diagnosis (< 65 years) have a negative impact on survival outcome (Table 5).
Discussion
The survival benefit of HCV eradication and achieving SVR status has been well established in patients with HCC.13 In a retrospective cohort study of 250 patients with HCV infection who had received curative treatment for HCC, multivariate analysis demonstrated that achieving SVR is an independent predictor of OS.14 The 3-year and 5-year OS rates were 97% and 94% for the SVR group, and 91% and 60% for the non‐SVR group, respectively (P < .001). Similarly, according to Sou and colleagues, of 122 patients with HCV-related HCC, patients with SVR had longer OS than patients with no SVR (P = .04).15 One of the hypotheses that could explain the survival benefit in patients who achieved SVR is the effect of achieving SVR in reducing persistent liver inflammation and associated liver mortality, and therefore lowering risks of complication in patients with HCC.16 In our study, multivariate analysis shows that achieving SVR is associated with significant improved OS (HR, 0.33). In contrast, patients with HCC who have not achieved SVR are associated with worse survival (HR, 3.24). This finding supports early treatment of HCV to obtain SVR in HCV-related patients with HCC, even after development of HCC.
Among 68 patients treated for HCV infection, 45 patients were treated after HCC diagnosis, and 34 patients achieved SVR after HCC diagnosis. The average time between HCV infection treatment after HCC diagnosis was 6 months. Our data suggested that achievement of SVR after HCC diagnosis suggests an improved OS (HR, 0.37) compared with achievement prior to HCC diagnosis (HR, 0.65; 95% CI,0.23-1.82; P = .41). This lack of statistical significance is likely due to small sample size of patients achieving SVR prior to HCC diagnosis. Our results are consistent with the findings regarding the efficacy and timing of DAA treatment in patients with active HCC. According to Singal and colleagues, achieving SVR after DAA therapy may result in improved liver function and facilitate additional HCC-directed therapy, which potentially improves survival.17-19
Nagaoki and colleagues found that there was no significant difference in OS in patients with HCC between the DAA and IFN groups. According to the study, the 3-year and 5-year OS rates were 96% and 96% for DAA patients and 93% and 73% for IFN patients, respectively (P = .16).14 This finding is consistent with the results of our study. HCV treatment type (IFN vs DAA) was not found to be associated with either OS or PFS time, regardless of time period.
A higher MELD score (> 10) and a higher Child-Pugh class (B or C) score are associated with worse survival outcome regardless of SVR status. While patients with a low MELD score (≤ 10) have a better survival rate (HR 0.49), a higher MELD score has a significantly higher HR and therefore worse survival outcomes (HR, 2.20). Similarly, patients with Child-Pugh A (HR, 0.39) have a better survival outcome compared with those patients with Child-Pugh class B or C (HR, 2.57). This finding is consistent with results of multiple studies indicating that advanced liver disease, as measured by a high MELD score and Child-Pugh class score, can be used to predict the survival outcome in patients with HCV-related HCC.20-22
Unlike other studies that look at a single prognostic variable, our study evaluated prognostic impacts of multiple variables (age, SVR status, the order of SVR in relation to HCC development, HCV treatment type, MELD score and Child-Pugh class) in patients with HCC. The study included patients treated for HCV after development of HCC along with other multiple variables leading to OS benefit. It is one of the only studies in the United States that compared 5-year OS and PFS among patients with HCC treated for HCV and achieved SVR. The studies by Nagaoki and colleagues and Sou and colleagues were conducted in Japan, and some of their subset analyses were univariate. Among our study population of veterans, 50% were African American patients, suggesting that they may have similar OS benefit when compared to White patients with HCC and HCV treatment.
Limitations
Our findings were limited in that our study population is too small to conduct further subset analysis that would allow statistical significance of those subsets, such as the suggested benefit of SVR in patients who presented with HCC after antiviral therapy. Another limitation is the all-male population, likely a result of the older veteran population at the Memphis VAMC. The mean age at diagnosis was 65 years, which is slightly higher than the general population. Compared to the SEER database, HCC is most frequently diagnosed among people aged 55 to 64 years.23 The age difference was likely due to our aging veteran population.
Further studies are needed to determine the significance of SVR on HCC recurrence and treatment. Immunotherapy is now first-line treatment for patients with local advanced HCC. All the immunotherapy studies excluded patients with active HCV infection. Hence, we need more data on HCV treatment timing among patients scheduled to start treatment with immunotherapy.
Conclusions
In a population of older veterans, treatment of HCV infection leads to OS benefit among patients with HCC. In addition, patients with HCV infection who achieve SVR have an OS benefit over patients unable to achieve SVR. The type of treatment, DAA vs IFN-based regimen, did not show significant survival benefit.
1. Ghouri YA, Mian I, Rowe JH. Review of hepatocellular carcinoma: epidemiology, etiology, and carcinogenesis. J Carcinog. 2017;16:1. Published 2017 May 29. doi:10.4103/jcar.JCar_9_16
2. Bray F, Ferlay J, Soerjomataram I, Siegel RL, Torre LA, Jemal A. Global cancer statistics 2018: GLOBOCAN estimates of incidence and mortality worldwide for 36 cancers in 185 countries. CA Cancer J Clin. 2018;68(6):394-424. doi:10.3322/caac.21492
3. Farazi PA, DePinho RA. Hepatocellular carcinoma pathogenesis: from genes to environment. Nat Rev Cancer. 2006;6(9):674-687. doi:10.1038/nrc1934
4. Falade-Nwulia O, Suarez-Cuervo C, Nelson DR, Fried MW, Segal JB, Sulkowski MS. Oral direct-acting agent therapy for hepatitis c virus infection: a systematic review. Ann Intern Med. 2017;166(9):637-648. doi:10.7326/M16-2575
5. Kouris G, Hydery T, Greenwood BC, et al. Effectiveness of Ledipasvir/Sofosbuvir and predictors of treatment failure in members with hepatitis C genotype 1 infection: a retrospective cohort study in a medicaid population. J Manag Care Spec Pharm. 2018;24(7):591-597. doi:10.18553/jmcp.2018.24.7.591
6. Jacobson IM, Lawitz E, Kwo PY, et al. Safety and efficacy of elbasvir/grazoprevir in patients with hepatitis c virus infection and compensated cirrhosis: an integrated analysis. Gastroenterology. 2017;152(6):1372-1382.e2. doi:10.1053/j.gastro.2017.01.050
7. Nahon P, Layese R, Bourcier V, et al. Incidence of hepatocellular carcinoma after direct antiviral therapy for HCV in patients with cirrhosis included in surveillance programs. Gastroenterology. 2018;155(5):1436-1450.e6. doi:10.1053/j.gastro.2018.07.01510.
8. Innes H, Barclay ST, Hayes PC, et al. The risk of hepatocellular carcinoma in cirrhotic patients with hepatitis C and sustained viral response: role of the treatment regimen. J Hepatol. 2018;68(4):646-654. doi:10.1016/j.jhep.2017.10.033
9. Romano A, Angeli P, Piovesan S, et al. Newly diagnosed hepatocellular carcinoma in patients with advanced hepatitis C treated with DAAs: a prospective population study. J Hepatol. 2018;69(2):345-352. doi:10.1016/j.jhep.2018.03.009
10. Kanwal F, Kramer J, Asch SM, Chayanupatkul M, Cao Y, El-Serag HB. Risk of hepatocellular cancer in HCV patients treated with direct-acting antiviral agents. Gastroenterology. 2017;153(4):996-1005.e1. doi:10.1053/j.gastro.2017.06.0122
11. Singh S, Nautiyal A, Loke YK. Oral direct-acting antivirals and the incidence or recurrence of hepatocellular carcinoma: a systematic review and meta-analysis. Frontline Gastroenterol. 2018;9(4):262-270. doi:10.1136/flgastro-2018-101017
12. Kuftinec G, Loehfelm T, Corwin M, et al. De novo hepatocellular carcinoma occurrence in hepatitis C cirrhotics treated with direct-acting antiviral agents. Hepat Oncol. 2018;5(1):HEP06. Published 2018 Jul 25. doi:10.2217/hep-2018-00033
13. Morgan RL, Baack B, Smith BD, Yartel A, Pitasi M, Falck-Ytter Y. Eradication of hepatitis C virus infection and the development of hepatocellular carcinoma: a meta-analysis of observational studies. Ann Intern Med. 2013;158(5 Pt 1):329-337. doi:10.7326/0003-4819-158-5-201303050-00005
14. Nagaoki Y, Imamura M, Nishida Y, et al. The impact of interferon-free direct-acting antivirals on clinical outcome after curative treatment for hepatitis C virus-associated hepatocellular carcinoma: comparison with interferon-based therapy. J Med Virol. 2019;91(4):650-658. doi:10.1002/jmv.25352
15. Sou FM, Wu CK, Chang KC, et al. Clinical characteristics and prognosis of HCC occurrence after antiviral therapy for HCV patients between sustained and non-sustained responders. J Formos Med Assoc. 2019;118(1 Pt 3):504-513. doi:10.1016/j.jfma.2018.10.017
16. Roche B, Coilly A, Duclos-Vallee JC, Samuel D. The impact of treatment of hepatitis C with DAAs on the occurrence of HCC. Liver Int. 2018;38(suppl 1):139-145. doi:10.1111/liv.13659
17. Singal AG, Lim JK, Kanwal F. AGA clinical practice update on interaction between oral direct-acting antivirals for chronic hepatitis C infection and hepatocellular carcinoma: expert review. Gastroenterology. 2019;156(8):2149-2157. doi:10.1053/j.gastro.2019.02.046
18. Toyoda H, Kumada T, Hayashi K, et al. Characteristics and prognosis of hepatocellular carcinoma detected in sustained responders to interferon therapy for chronic hepatitis C. Cancer Detect Prev. 2003;27(6):498-502. doi:10.1016/j.cdp.2003.09.00719. Okamura Y, Sugiura T, Ito T, et al. The achievement of a sustained virological response either before or after hepatectomy improves the prognosis of patients with primary hepatitis C virus-related hepatocellular carcinoma. Ann Surg Oncol. 2019; 26(13):4566-4575. doi:10.1245/s10434-019-07911-w
20. Wray CJ, Harvin JA, Silberfein EJ, Ko TC, Kao LS. Pilot prognostic model of extremely poor survival among high-risk hepatocellular carcinoma patients. Cancer. 2012;118(24):6118-6125. doi:10.1002/cncr.27649
21. Kim JH, Kim JH, Choi JH, et al. Value of the model for end-stage liver disease for predicting survival in hepatocellular carcinoma patients treated with transarterial chemoembolization. Scand J Gastroenterol. 2009;44(3):346-357. doi:10.1080/00365520802530838
22. Vogeler M, Mohr I, Pfeiffenberger J, et al. Applicability of scoring systems predicting outcome of transarterial chemoembolization for hepatocellular carcinoma. J Cancer Res Clin Oncol. 2020;146(4):1033-1050. doi:10.1007/s00432-020-03135-8
23. National Institutes of Health, Surveillance, Epidemiology, and End Results. Cancer stat facts: cancer of the liver and intrahepatic bile duct. Accessed July 15, 2021. https://seer.cancer.gov/statfacts/html/livibd.html
24. Singal AK, Kamath PS. Model for End-stage Liver Disease. J Clin Exp Hepatol. 2013;3(1):50-60. doi:10.1016/j.jceh.2012.11.002
Use and Toxicity of Checkpoint Inhibitors for Solid Tumor Treatment in a Veteran Population
Due to the high cost of newer chemotherapy agents, institutions search for strategies to minimize drug cost and drug waste. Programmed death-1 (PD-1) inhibitors, nivolumab and pembrolizumab, are commonly used in the treatment of solid tumors; however, the agents cost thousands of dollars per dose. Nivolumab and pembrolizumab were initially approved using weight-based dosing, but package labeling for both agents now includes fixed dosing.1,2 A combination of these 2 dosing strategies could be used by institutions depending on individual patient’s weight to maximize cost savings, minimize drug waste, and maintain safety and efficacy of PD-1 inhibitors. Irrespective of dosing strategy, the development of immune-related adverse events (IrAEs) has been demonstrated with PD-1 inhibitors as a result of the mechanism of action.
PD-1 expression suppresses T cell activity to prevent the development of autoimmunity; however, this is also a mechanism in which tumor cells can evade the host immune system.3-5 Binding of PD-1 and programmed death-ligand 1 (PD-L1) suppresses T cell activity, whereas the inhibition of PD-1 and PD-L1 results in T cell activation.4,5 Increased T cell activity elicits the anticancer effect, but also contributes to the development of IrAEs.4,5 Hypothyroidism is one of the most common IrAEs, with a reported incidence of 9% with nivolumab therapy and 8.5% with pembrolizumab.1,2
Data from the US Department of Veterans Affairs (VA) medical centers is stored in the centralized Corporate Data Warehouse (CDW). VA researchers can obtain approval to use CDW data, which allows for large scale retrospective review of veterans who have received care at VA medical centers (VAMCs). This study aimed to describe the PD-1 inhibitor dosing used within VAMCs and identify actual and potential cost savings. Due to the frequency of immunemediated hypothyroidism and objective data that can be obtained from CDW reports, the study estimated the incidence of immune-mediated hypothyroidism within the veteran population as a safety outcome.
Background
The US Food and Drug Administration (FDA) initially approved dosing for IV nivolumab at 3 mg/kg of patient body weight every 2 weeks and for IV pembrolizumab 2 mg/kg of patient body weight every 3 weeks.1,2 Subsequent pharmacokinetic studies found that these agents have similar exposure and efficacy with fixed doses of nivolumab 240 mg IV every 2 weeks and pembrolizumab 200 mg IV every 3 weeks; in 2016, FDA labeling shifted from weight-based dosing to fixed dosing for most solid tumor indications.6-9 Depending on patient weight, a combination of weightbased and fixed dosing could be used by institutions to maximize cost-savings opportunities, minimize drug waste, and maintain clinical efficacy with PD-1 inhibitors. For example, a patient initiating nivolumab who weighs 80 kg would receive 240 mg for both weight-based (3 mg/kg x 80 kg = 240 mg) and fixed dosing; therefore, no cost-savings opportunities would be available. However, for a patient who weighs ≤ 73.3 kg, it would be more costeffective to use weight-based dosing vs the fixed dose. Since nivolumab is available in 40- mg, 100-mg, and 240-mg vials with similar unit prices, a combination of vial sizes could be used to minimize drug waste. Alternatively, for a patient who weighs ≥ 86.7 kg, it would be more cost-effective to administer the fixed, 240 mg dose when compared with the weightbased dose. Pembrolizumab is available only in a 100-mg vial; therefore, weight-based dosing may result in drug waste.
IrAEs can be seen with PD-1 inhibitors due to increased T cell activity, which is independent of dosing strategy and can affect any organ system. However, immune-mediated hypothyroidism has been commonly seen with PD-1 inhibitors. For patients with immunemediated hypothyroidism, levothyroxine can be considered for asymptomatic patients with thyroid- stimulating hormone (TSH) > 10 uIU/mL with normal thyroxine (T4), or patients with clinical primary hypothyroidism (TSH > 10 uIU/mL with low free T4 and clinical symptoms). Additionally, since hypothyroidism usually follows immunotherapy induced thyrotoxicosis, thyroid function tests should be monitored and levothyroxine initiated if TSH is > 10 uIU/mL for these patients.10,11
Hypothyroidism also can be graded according to the National Cancer Institute (NCI) Common Terminology Criteria for Adverse Events. Hypothyroidism is considered grade 1 when hypothyroidism is demonstrated through clinical or diagnostic observations only and the patient is asymptomatic and no intervention needed. Grade 2 occurs when the patient is symptomatic and limits instrumental activities of daily living (ADLs), prompting thyroid replacement therapy. In grade 3, patients experience severe symptoms that restrict self-care ADLs, and hospitalization is indicated. Grade 4 has life-threatening consequences, and urgent intervention is indicated. Grade 5 results in the death of the patient.12
Electronic health records (EHRs) of veterans who receive care at a VAMC are stored in CDW and available through the VA Informatics and Computing Infrastructure (VINCI), which provides access to data while ensuring veterans’ privacy and data security. This feature of the VA EHR allows for analysis of data across the VA health care system, and larger data sets can be used for retrospective chart reviews.
Using reports from CDW, the primary objective of this study was to describe the dosing strategy used for PD-1 inhibitors, and the primary safety outcome was to determine the incidence of immune-mediated hypothyroidism. The secondary objective was to estimate potential cost-savings opportunities using a combination of PD-1 inhibitor dosing strategies.
Methods
This was a retrospective study including data stored in CDW. The study was approved by the Durham VA Health Care System Institutional Review Board and VINCI/Data Access request tracker. Data were limited to nivolumab and pembrolizumab because they received earlier FDA approval, had multiple solid tumor indications, and 2 FDA-approved dosing strategies. The incidence of IrAEs was limited to hypothyroidism, which could be objectively verified with laboratory monitoring of thyroid function tests, including TSH, free or total T4, and triiodothyronine (T3), all of which were available in CDW data. Additionally, most patients with hypothyroidism initiate treatment with levothyroxine. Prescription refill history could also be retrieved using CDW reports.
Hypothyroidism was defined as T4 below lower limit of normal (LLN), TSH above upper limit of normal (ULN), or any increase in levothyroxine dosage. Patients were excluded if they received PD-1 inhibitor for an indication other than solid tumor treatment, such as hematologic malignancy, or if dosing did not follow weight-based or fixed-dosing strategies, such as nivolumab 1 mg/kg when used in combination with ipilimumab, or pembrolizumab 10 mg/kg. The primary endpoint was the percentage of orders for each dosing strategy, and the primary safety outcome was the incidence of immune-mediated hypothyroidism. Secondary endpoints included estimated cost savings and cost-savings opportunities through nivolumab dose rounding and incidence of levothyroxine initiation or dose change. Descriptive statistics were used for the primary and secondary endpoints.
A report in CDW identified patients who received a dose of nivolumab or pembrolizumab between January 1, 2015 and July 1, 2017 at any VAMC. The CDW report obtained weight at time of PD-1 inhibitor therapy initiation, dose of PD-1 inhibitor given, administration date of PD-1 inhibitor, and VA site. Depending on PD-1 inhibitor administered, weight in kg was multiplied by 3 mg/kg or 2 mg/kg to obtain patient’s anticipated weight-based nivolumab and pembrolizumab dose, respectively. The calculated weight-based dose, fixed dose, and administered dose were compared to infer dosing strategy used at the time of ordering. If the patient’s weight-based dose was within 10% of the fixed dose, the order was categorized as converging because the doses were too similar to determine which dosing strategy was intended.
After determination of dosing strategy, the nivolumab orders were evaluated for actual vs missed cost savings. The cost-savings evaluation included only nivolumab orders because nivolumab is available in a 40-mg, 100-mg, and 240-mg vials and, therefore, has more potential for dose-rounding opportunities with minimal drug waste compared with pembrolizumab, which is available only in a 100-mg vial. Actual cost savings included patients who weighed ≤ 73.3 kg and received nivolumab dose based on 3 mg/kg or patients who weighed ≥ 86.7 kg and received nivolumab 240 mg (fixed dose). Missed cost savings comprised patients who weighed ≤ 73.3 kg who received 240 mg nivolumab or patients who weighed ≥ 86.7 kg and received a nivolumab dose > 240 mg. The cost difference between the dose given and theoretical cost-effective dose was calculated to determine actual and potential cost savings. Converging orders were not included in the cost-savings analysis as the intended nivolumab dose could not be determined. An additional cost analysis of nivolumab orders prescribed between September 1, 2016 and July 1, 2017 was also performed because nivolumab fixed dosing was FDA-approved for most solid tumor indications in September 2016.
To determine the incidence of immunemediated hypothyroidism for patients who received a dose of a PD-1 inhibitor at a VAMC, a CDW report with thyroid function laboratory values (TSH, T4, or T3), including reference range values based on specific VA site, and levothyroxine prescriptions issued during PD-1 inhibitor therapy was obtained. A patient was considered to have experienced immune-mediated hypothyroidism if the patient’s laboratory values demonstrated T4 below the LLN, TSH above the ULN, or if the medication fill history demonstrated levothyroxine initiation or a levothyroxine dose increase.
Results
The CDW report identified 32,769 total PD-1 inhibitor orders. There were 3982 orders that did not meet inclusion criteria or inadequate data were obtained with CDW report and were excluded (Figure). The remaining 28,787 PD-1 inhibitor orders were evaluated for actual or missed cost savings. The distribution of dosing strategies can be found in Table 1.
Nivolumab accounted for 81.5% of all PD-1 inhibitor orders. Using the most cost-effective nivolumab dosing, the actual cost savings was estimated to be $8,514,300 with potential additional $5,591,250 of missed cost-savings opportunities. There were 8013 nivolumab orders written between September 1, 2016 and July 1, 2017. Cost-effective dosing was used in 4687 of these orders, which accounted for a cost savings of $5,198,570. The remaining 3326 orders had a missed cost-savings opportunity, which accounted for an additional $2,907,180 potential cost savings (Table 2).
PD-1 inhibitors were used for the treatment of 3249 unique patients. Based on abnormal thyroid function tests and levothyroxine initiation or dose increase, it is estimated that 514 (15.8%) patients experienced hypothyroidism during PD-1 inhibitor therapy. However, prior to PD-1 inhibitor therapy, 274 patients were receiving levothyroxine, suggesting baseline thyroid dysfunction. Of these patients, 152 (55.5%) patients maintained the same levothyroxine dose during PD-1 inhibitor therapy, but 91 (33.2%) required a levothyroxine dose increase. There were 187 patients who initiated levothyroxine during PD-1 inhibitor therapy (Table 3).
Discussion
Changes in FDA-approved dosing for PD-1 inhibitors allowed a combination of dosing strategies. Depending on patient weight, a weight-based or fixed-dosing strategy can be used to reduce drug cost while maintaining equivalent efficacy. This study evaluated use of dose rounding for PD-1 inhibitors within the VA health care system to identify actual and potential cost savings. To our knowledge, this is the first study to demonstrate cost savings through use of a combination of PD-1 inhibitor dosing strategies. Using CDW, researchers were able to review PD-1 dosing from all VAMCs and include a larger number of orders in a single retrospective study.
Nivolumab was the primary agent used within VAMCs. Depending on the indication, pembrolizumab requires PD-1 expression testing prior to its use in several solid tumor indications. Consequently, additional testing and patient eligibility is needed prior to use. Both PD-1 inhibitors were primarily dosed based on patient weight since this was the first FDAapproved dosing strategy. Nivolumab had more orders categorized as converging, which may be due to the therapeutic weight-based dose of 3 mg/kg for nivolumab vs 2 mg/kg for pembrolizumab. The calculated weight-based dose of nivolumab for an 80-kg patient is 240 mg, which also is the fixed dose. A 80-kg patient on pembrolizumab at 2 mg/kg would receive a 160-mg dose, whereas the fixed dose of pembrolizumab is 200 mg. Pembrolizumab is available only in a 100-mg vial, which limits opportunities for dose rounding without drug waste and could explain the higher amount of pembrolizumab orders in the fixed-dose category.
In this review of PD-1 inhibitor orders over approximately a 2.5-year study period, we identified $8,514,300 estimated cost savings with $5,591,250 estimated missed cost savings. When looking at orders administered after FDA approval for nivolumab-fixed dosing in September 2016, there was substantial cost savings of $5,198,570 with the potential for an additional $2,907,180 missed cost savings. Due to lower drug acquisition costs within the VA health care system, there may be higher cost-savings opportunities within other health care systems.
Through review of abnormal thyroid laboratory values and levothyroxine initiation or dose changes, this study estimated the incidence of hypothyroidism in patients receiving PD-1 inhibitor therapy at the VA. The incidence of primary hypothyroidism identified in this study was slightly higher at 15.8% compared with the 8.5 to 9.0% incidence reported from clinical trials.1,2 There are several reasons why the incidence of hypothyroidism appeared higher in this study. Abnormal laboratory values were not assessed for the degree of deviation from the reference range; any TSH above the ULN, T4 below the LLN, or levothyroxine dose increase was included as thyroid dysfunction in this review. There is also the potential for endogenous age-related thyroid fluctuation, and the development of hypothyroidism may not have been related to PD-1 inhibitor therapy. Within this patient population, 8.4% were receiving levothyroxine prior to PD-1 inhibitor initiation indicating baseline thyroid dysfunction, and it is unclear whether levothyroxine dose increases were due to PD-1 inhibitor or endogenous fluctuation.
Limitations
There are several limitations to acknowledge. The dosing strategy and apparent dose rounding was determined by investigator inference and may not accurately represent the intended dosing strategy. This study did not address efficacy of PD-1 inhibitor and dosing strategy; however, clinical trials have demonstrated equivalent efficacy to generate the change in FDA-approved dosing. Additionally, FDA approval for nivolumab fixed dosing was indication specific. Starting in September 2016, many solid tumor indications had fixed dosing approved, but this approval was not necessarily all encompassing.
While the use of CDW allowed for a greater number of PD-1 inhibitor orders to be included in retrospective review, there also were limitations of the CDW report. The patient weight was limited to weight at time of therapy initiation. Due to the potential for weight changes, nivolumab dosing may have seemed inappropriate to investigators, and thereby excluded. Based on data available from CDW reports, hypothyroidism could not be graded according to NCI Common Terminology Criteria for Adverse Events, and the incidence of clinically significant hypothyroidism could not be determined.
Conclusions
With increasing drug acquisition costs, particularly among antineoplastic agents, health care systems frequently seek out cost-savings opportunities. Using a combination of weightbased and fixed-dosing strategies for PD-1 inhibitors can be a mechanism to achieve costsavings. Through the identification of the dosing strategy used for PD-1 inhibitors, we were able to identify and report instances for potential cost-savings opportunities among veterans treated within VA health care system. Use of CDW allows for data from all VAMCs to be evaluated in a single retrospective chart review, which allows for the inclusion of a larger sample size. This study identified a substantial cost savings for nivolumab through a combination of weight-based and fixed-dosing strategies. Due to the novel mechanism of action, ongoing realworld evaluation of adverse events and IrAEs is warranted.
Dosing strategies with nivolumab and pembrolizumab continue to evolve. In March 2018, nivolumab 480 mg IV every 4 weeks was FDA approved and in April 2020, pembrolizumab 400 mg IV every 6 weeks was FDA approved.13,14 While the drug costs will remain the same, extended interval dosing strategies have cost avoidance such as fewer clinic appointments, resulting in decreased staffing costs and decreased patient travel. Additional studies will be needed to evaluate the cost and safety of the recently approved dosing strategies
1. OPDIVO (nivolumab) injection, for intravenous infusion. Package Insert. Princeton, NJ: Bristol-Myers Squibb Company; 2014.
2. Keytruda (pembrolizumab) injection, for intravenous infusion. Package Insert. Whitehouse Station, NJ: Merck & Co, Inc; 2016
3. Pardoll DM. The blockade of immune checkpoints in cancer immunotherapy. Nat Rev Cancer. 2012;12(4):252-264. doi:10.1038/nrc3239
4. Yao H, Wang H, Li C, Fang J-Y, Xu J. Cancer cellintrinsic PD-1 and implications in combinatorial immunotherapy. Front Immunol. 2018;9:1774. doi:10.3389/fimmu.2018.01774
5. Wang Y, Wang H, Yao H, Li C, Fang J-Y, Xu J. Regulation of PD-L1: emerging routes for targeting tumor immune evasion. Front Pharmacol. 2018;9:536. doi:10.3389/fphar.2018.00536
6. Patnaik A, Kang SP, Rasco D, et al. Phase I study of pembrolizumab (MK-3475; anti-PD-1 monocolonal antibody) in patients with advanced solid tumors. Clin Cancer Res. 2015;21(19):4286-4293. doi:10.1158/1078-0432.CCR-14-2607
7. Zhao X, Suryawanshi S, Hruska M, et al. Assessment of nivolumab benefit-risk profile of a 240-mg flat dose relative to a 3-mg/kg dosing regimen in patients with advanced tumors. Ann Oncol. 2017;28(8):2002-2008. doi:10.1093/annonc/mdx235
8. Freshwater T, Kondic A, Ahamadi M, et al. Evaluation of dosing strategy for pembrolizumab for oncology indications. J Immunother Cancer. 2017;5:43. doi:10.1186/s40425-017-0242-5
9. US Food and Drug Administration. Modification of the dosage regimen for nivolumab. Updated September 15, 2016. Accessed July 8, 2021. https://www.fda.gov/drugs /resources-information-approved-drugs/modification -dosage-regimen-nivolumab
10. Brahmer JR, Lacchetti C, Schneider BJ, et al. Management of immune-related adverse events in patients treated with immune checkpoint inhibitor therapy: American Society of Clinical Oncology Clinical Practice Guideline. J Clin Oncol. 2018;36(17):1714-1768. doi:10.1200/JCO.2017.77.6385
11. National Comprehensive Cancer Network. Clinical Practice Guidelines in Oncology: Management of immunotherapy- related toxicities. version 3.2021. Updated May 14, 2021. Accessed July 8,2021.https://www.nccn.org/professionals/physician_gls/pdf/immunotherapy.pdf
12. National Institutes of Health, National Cancer Institute. Common terminology criteria for adverse events (CTCAE) version 5.0. Updated November 17, 2017. Accessed July 8, 2021. https://ctep.cancer.gov /protocoldevelopment/electronic_applications/docs /CTCAE_v5_Quick_Reference_8.5x11.pdf
13. Zhao X, Ivaturi V, Gopalakrishnan M, Shen J, et al. A model-based exposure-response (E-R) assessment of a nivolumab (NIVO) 4-weekly dosing schedule across multiple tumor types. Abstract presented at: American Association of Cancer Research Annual Meeting 2017; April 1-5, 2017; Washington, DC. doi:10.1158/1538-7445.AM2017-CT101
14. US Food and Drug Administration approves new dosing regimen for pembrolizumab. Updated April 29, 2020. Accessed July 8, 2021. https://www.fda.gov/drugs/drug -approvals-and-databases/fda-approves-new-dosing -regimen-pembrolizumab
Due to the high cost of newer chemotherapy agents, institutions search for strategies to minimize drug cost and drug waste. Programmed death-1 (PD-1) inhibitors, nivolumab and pembrolizumab, are commonly used in the treatment of solid tumors; however, the agents cost thousands of dollars per dose. Nivolumab and pembrolizumab were initially approved using weight-based dosing, but package labeling for both agents now includes fixed dosing.1,2 A combination of these 2 dosing strategies could be used by institutions depending on individual patient’s weight to maximize cost savings, minimize drug waste, and maintain safety and efficacy of PD-1 inhibitors. Irrespective of dosing strategy, the development of immune-related adverse events (IrAEs) has been demonstrated with PD-1 inhibitors as a result of the mechanism of action.
PD-1 expression suppresses T cell activity to prevent the development of autoimmunity; however, this is also a mechanism in which tumor cells can evade the host immune system.3-5 Binding of PD-1 and programmed death-ligand 1 (PD-L1) suppresses T cell activity, whereas the inhibition of PD-1 and PD-L1 results in T cell activation.4,5 Increased T cell activity elicits the anticancer effect, but also contributes to the development of IrAEs.4,5 Hypothyroidism is one of the most common IrAEs, with a reported incidence of 9% with nivolumab therapy and 8.5% with pembrolizumab.1,2
Data from the US Department of Veterans Affairs (VA) medical centers is stored in the centralized Corporate Data Warehouse (CDW). VA researchers can obtain approval to use CDW data, which allows for large scale retrospective review of veterans who have received care at VA medical centers (VAMCs). This study aimed to describe the PD-1 inhibitor dosing used within VAMCs and identify actual and potential cost savings. Due to the frequency of immunemediated hypothyroidism and objective data that can be obtained from CDW reports, the study estimated the incidence of immune-mediated hypothyroidism within the veteran population as a safety outcome.
Background
The US Food and Drug Administration (FDA) initially approved dosing for IV nivolumab at 3 mg/kg of patient body weight every 2 weeks and for IV pembrolizumab 2 mg/kg of patient body weight every 3 weeks.1,2 Subsequent pharmacokinetic studies found that these agents have similar exposure and efficacy with fixed doses of nivolumab 240 mg IV every 2 weeks and pembrolizumab 200 mg IV every 3 weeks; in 2016, FDA labeling shifted from weight-based dosing to fixed dosing for most solid tumor indications.6-9 Depending on patient weight, a combination of weightbased and fixed dosing could be used by institutions to maximize cost-savings opportunities, minimize drug waste, and maintain clinical efficacy with PD-1 inhibitors. For example, a patient initiating nivolumab who weighs 80 kg would receive 240 mg for both weight-based (3 mg/kg x 80 kg = 240 mg) and fixed dosing; therefore, no cost-savings opportunities would be available. However, for a patient who weighs ≤ 73.3 kg, it would be more costeffective to use weight-based dosing vs the fixed dose. Since nivolumab is available in 40- mg, 100-mg, and 240-mg vials with similar unit prices, a combination of vial sizes could be used to minimize drug waste. Alternatively, for a patient who weighs ≥ 86.7 kg, it would be more cost-effective to administer the fixed, 240 mg dose when compared with the weightbased dose. Pembrolizumab is available only in a 100-mg vial; therefore, weight-based dosing may result in drug waste.
IrAEs can be seen with PD-1 inhibitors due to increased T cell activity, which is independent of dosing strategy and can affect any organ system. However, immune-mediated hypothyroidism has been commonly seen with PD-1 inhibitors. For patients with immunemediated hypothyroidism, levothyroxine can be considered for asymptomatic patients with thyroid- stimulating hormone (TSH) > 10 uIU/mL with normal thyroxine (T4), or patients with clinical primary hypothyroidism (TSH > 10 uIU/mL with low free T4 and clinical symptoms). Additionally, since hypothyroidism usually follows immunotherapy induced thyrotoxicosis, thyroid function tests should be monitored and levothyroxine initiated if TSH is > 10 uIU/mL for these patients.10,11
Hypothyroidism also can be graded according to the National Cancer Institute (NCI) Common Terminology Criteria for Adverse Events. Hypothyroidism is considered grade 1 when hypothyroidism is demonstrated through clinical or diagnostic observations only and the patient is asymptomatic and no intervention needed. Grade 2 occurs when the patient is symptomatic and limits instrumental activities of daily living (ADLs), prompting thyroid replacement therapy. In grade 3, patients experience severe symptoms that restrict self-care ADLs, and hospitalization is indicated. Grade 4 has life-threatening consequences, and urgent intervention is indicated. Grade 5 results in the death of the patient.12
Electronic health records (EHRs) of veterans who receive care at a VAMC are stored in CDW and available through the VA Informatics and Computing Infrastructure (VINCI), which provides access to data while ensuring veterans’ privacy and data security. This feature of the VA EHR allows for analysis of data across the VA health care system, and larger data sets can be used for retrospective chart reviews.
Using reports from CDW, the primary objective of this study was to describe the dosing strategy used for PD-1 inhibitors, and the primary safety outcome was to determine the incidence of immune-mediated hypothyroidism. The secondary objective was to estimate potential cost-savings opportunities using a combination of PD-1 inhibitor dosing strategies.
Methods
This was a retrospective study including data stored in CDW. The study was approved by the Durham VA Health Care System Institutional Review Board and VINCI/Data Access request tracker. Data were limited to nivolumab and pembrolizumab because they received earlier FDA approval, had multiple solid tumor indications, and 2 FDA-approved dosing strategies. The incidence of IrAEs was limited to hypothyroidism, which could be objectively verified with laboratory monitoring of thyroid function tests, including TSH, free or total T4, and triiodothyronine (T3), all of which were available in CDW data. Additionally, most patients with hypothyroidism initiate treatment with levothyroxine. Prescription refill history could also be retrieved using CDW reports.
Hypothyroidism was defined as T4 below lower limit of normal (LLN), TSH above upper limit of normal (ULN), or any increase in levothyroxine dosage. Patients were excluded if they received PD-1 inhibitor for an indication other than solid tumor treatment, such as hematologic malignancy, or if dosing did not follow weight-based or fixed-dosing strategies, such as nivolumab 1 mg/kg when used in combination with ipilimumab, or pembrolizumab 10 mg/kg. The primary endpoint was the percentage of orders for each dosing strategy, and the primary safety outcome was the incidence of immune-mediated hypothyroidism. Secondary endpoints included estimated cost savings and cost-savings opportunities through nivolumab dose rounding and incidence of levothyroxine initiation or dose change. Descriptive statistics were used for the primary and secondary endpoints.
A report in CDW identified patients who received a dose of nivolumab or pembrolizumab between January 1, 2015 and July 1, 2017 at any VAMC. The CDW report obtained weight at time of PD-1 inhibitor therapy initiation, dose of PD-1 inhibitor given, administration date of PD-1 inhibitor, and VA site. Depending on PD-1 inhibitor administered, weight in kg was multiplied by 3 mg/kg or 2 mg/kg to obtain patient’s anticipated weight-based nivolumab and pembrolizumab dose, respectively. The calculated weight-based dose, fixed dose, and administered dose were compared to infer dosing strategy used at the time of ordering. If the patient’s weight-based dose was within 10% of the fixed dose, the order was categorized as converging because the doses were too similar to determine which dosing strategy was intended.
After determination of dosing strategy, the nivolumab orders were evaluated for actual vs missed cost savings. The cost-savings evaluation included only nivolumab orders because nivolumab is available in a 40-mg, 100-mg, and 240-mg vials and, therefore, has more potential for dose-rounding opportunities with minimal drug waste compared with pembrolizumab, which is available only in a 100-mg vial. Actual cost savings included patients who weighed ≤ 73.3 kg and received nivolumab dose based on 3 mg/kg or patients who weighed ≥ 86.7 kg and received nivolumab 240 mg (fixed dose). Missed cost savings comprised patients who weighed ≤ 73.3 kg who received 240 mg nivolumab or patients who weighed ≥ 86.7 kg and received a nivolumab dose > 240 mg. The cost difference between the dose given and theoretical cost-effective dose was calculated to determine actual and potential cost savings. Converging orders were not included in the cost-savings analysis as the intended nivolumab dose could not be determined. An additional cost analysis of nivolumab orders prescribed between September 1, 2016 and July 1, 2017 was also performed because nivolumab fixed dosing was FDA-approved for most solid tumor indications in September 2016.
To determine the incidence of immunemediated hypothyroidism for patients who received a dose of a PD-1 inhibitor at a VAMC, a CDW report with thyroid function laboratory values (TSH, T4, or T3), including reference range values based on specific VA site, and levothyroxine prescriptions issued during PD-1 inhibitor therapy was obtained. A patient was considered to have experienced immune-mediated hypothyroidism if the patient’s laboratory values demonstrated T4 below the LLN, TSH above the ULN, or if the medication fill history demonstrated levothyroxine initiation or a levothyroxine dose increase.
Results
The CDW report identified 32,769 total PD-1 inhibitor orders. There were 3982 orders that did not meet inclusion criteria or inadequate data were obtained with CDW report and were excluded (Figure). The remaining 28,787 PD-1 inhibitor orders were evaluated for actual or missed cost savings. The distribution of dosing strategies can be found in Table 1.
Nivolumab accounted for 81.5% of all PD-1 inhibitor orders. Using the most cost-effective nivolumab dosing, the actual cost savings was estimated to be $8,514,300 with potential additional $5,591,250 of missed cost-savings opportunities. There were 8013 nivolumab orders written between September 1, 2016 and July 1, 2017. Cost-effective dosing was used in 4687 of these orders, which accounted for a cost savings of $5,198,570. The remaining 3326 orders had a missed cost-savings opportunity, which accounted for an additional $2,907,180 potential cost savings (Table 2).
PD-1 inhibitors were used for the treatment of 3249 unique patients. Based on abnormal thyroid function tests and levothyroxine initiation or dose increase, it is estimated that 514 (15.8%) patients experienced hypothyroidism during PD-1 inhibitor therapy. However, prior to PD-1 inhibitor therapy, 274 patients were receiving levothyroxine, suggesting baseline thyroid dysfunction. Of these patients, 152 (55.5%) patients maintained the same levothyroxine dose during PD-1 inhibitor therapy, but 91 (33.2%) required a levothyroxine dose increase. There were 187 patients who initiated levothyroxine during PD-1 inhibitor therapy (Table 3).
Discussion
Changes in FDA-approved dosing for PD-1 inhibitors allowed a combination of dosing strategies. Depending on patient weight, a weight-based or fixed-dosing strategy can be used to reduce drug cost while maintaining equivalent efficacy. This study evaluated use of dose rounding for PD-1 inhibitors within the VA health care system to identify actual and potential cost savings. To our knowledge, this is the first study to demonstrate cost savings through use of a combination of PD-1 inhibitor dosing strategies. Using CDW, researchers were able to review PD-1 dosing from all VAMCs and include a larger number of orders in a single retrospective study.
Nivolumab was the primary agent used within VAMCs. Depending on the indication, pembrolizumab requires PD-1 expression testing prior to its use in several solid tumor indications. Consequently, additional testing and patient eligibility is needed prior to use. Both PD-1 inhibitors were primarily dosed based on patient weight since this was the first FDAapproved dosing strategy. Nivolumab had more orders categorized as converging, which may be due to the therapeutic weight-based dose of 3 mg/kg for nivolumab vs 2 mg/kg for pembrolizumab. The calculated weight-based dose of nivolumab for an 80-kg patient is 240 mg, which also is the fixed dose. A 80-kg patient on pembrolizumab at 2 mg/kg would receive a 160-mg dose, whereas the fixed dose of pembrolizumab is 200 mg. Pembrolizumab is available only in a 100-mg vial, which limits opportunities for dose rounding without drug waste and could explain the higher amount of pembrolizumab orders in the fixed-dose category.
In this review of PD-1 inhibitor orders over approximately a 2.5-year study period, we identified $8,514,300 estimated cost savings with $5,591,250 estimated missed cost savings. When looking at orders administered after FDA approval for nivolumab-fixed dosing in September 2016, there was substantial cost savings of $5,198,570 with the potential for an additional $2,907,180 missed cost savings. Due to lower drug acquisition costs within the VA health care system, there may be higher cost-savings opportunities within other health care systems.
Through review of abnormal thyroid laboratory values and levothyroxine initiation or dose changes, this study estimated the incidence of hypothyroidism in patients receiving PD-1 inhibitor therapy at the VA. The incidence of primary hypothyroidism identified in this study was slightly higher at 15.8% compared with the 8.5 to 9.0% incidence reported from clinical trials.1,2 There are several reasons why the incidence of hypothyroidism appeared higher in this study. Abnormal laboratory values were not assessed for the degree of deviation from the reference range; any TSH above the ULN, T4 below the LLN, or levothyroxine dose increase was included as thyroid dysfunction in this review. There is also the potential for endogenous age-related thyroid fluctuation, and the development of hypothyroidism may not have been related to PD-1 inhibitor therapy. Within this patient population, 8.4% were receiving levothyroxine prior to PD-1 inhibitor initiation indicating baseline thyroid dysfunction, and it is unclear whether levothyroxine dose increases were due to PD-1 inhibitor or endogenous fluctuation.
Limitations
There are several limitations to acknowledge. The dosing strategy and apparent dose rounding was determined by investigator inference and may not accurately represent the intended dosing strategy. This study did not address efficacy of PD-1 inhibitor and dosing strategy; however, clinical trials have demonstrated equivalent efficacy to generate the change in FDA-approved dosing. Additionally, FDA approval for nivolumab fixed dosing was indication specific. Starting in September 2016, many solid tumor indications had fixed dosing approved, but this approval was not necessarily all encompassing.
While the use of CDW allowed for a greater number of PD-1 inhibitor orders to be included in retrospective review, there also were limitations of the CDW report. The patient weight was limited to weight at time of therapy initiation. Due to the potential for weight changes, nivolumab dosing may have seemed inappropriate to investigators, and thereby excluded. Based on data available from CDW reports, hypothyroidism could not be graded according to NCI Common Terminology Criteria for Adverse Events, and the incidence of clinically significant hypothyroidism could not be determined.
Conclusions
With increasing drug acquisition costs, particularly among antineoplastic agents, health care systems frequently seek out cost-savings opportunities. Using a combination of weightbased and fixed-dosing strategies for PD-1 inhibitors can be a mechanism to achieve costsavings. Through the identification of the dosing strategy used for PD-1 inhibitors, we were able to identify and report instances for potential cost-savings opportunities among veterans treated within VA health care system. Use of CDW allows for data from all VAMCs to be evaluated in a single retrospective chart review, which allows for the inclusion of a larger sample size. This study identified a substantial cost savings for nivolumab through a combination of weight-based and fixed-dosing strategies. Due to the novel mechanism of action, ongoing realworld evaluation of adverse events and IrAEs is warranted.
Dosing strategies with nivolumab and pembrolizumab continue to evolve. In March 2018, nivolumab 480 mg IV every 4 weeks was FDA approved and in April 2020, pembrolizumab 400 mg IV every 6 weeks was FDA approved.13,14 While the drug costs will remain the same, extended interval dosing strategies have cost avoidance such as fewer clinic appointments, resulting in decreased staffing costs and decreased patient travel. Additional studies will be needed to evaluate the cost and safety of the recently approved dosing strategies
1. OPDIVO (nivolumab) injection, for intravenous infusion. Package Insert. Princeton, NJ: Bristol-Myers Squibb Company; 2014.
2. Keytruda (pembrolizumab) injection, for intravenous infusion. Package Insert. Whitehouse Station, NJ: Merck & Co, Inc; 2016
3. Pardoll DM. The blockade of immune checkpoints in cancer immunotherapy. Nat Rev Cancer. 2012;12(4):252-264. doi:10.1038/nrc3239
4. Yao H, Wang H, Li C, Fang J-Y, Xu J. Cancer cellintrinsic PD-1 and implications in combinatorial immunotherapy. Front Immunol. 2018;9:1774. doi:10.3389/fimmu.2018.01774
5. Wang Y, Wang H, Yao H, Li C, Fang J-Y, Xu J. Regulation of PD-L1: emerging routes for targeting tumor immune evasion. Front Pharmacol. 2018;9:536. doi:10.3389/fphar.2018.00536
6. Patnaik A, Kang SP, Rasco D, et al. Phase I study of pembrolizumab (MK-3475; anti-PD-1 monocolonal antibody) in patients with advanced solid tumors. Clin Cancer Res. 2015;21(19):4286-4293. doi:10.1158/1078-0432.CCR-14-2607
7. Zhao X, Suryawanshi S, Hruska M, et al. Assessment of nivolumab benefit-risk profile of a 240-mg flat dose relative to a 3-mg/kg dosing regimen in patients with advanced tumors. Ann Oncol. 2017;28(8):2002-2008. doi:10.1093/annonc/mdx235
8. Freshwater T, Kondic A, Ahamadi M, et al. Evaluation of dosing strategy for pembrolizumab for oncology indications. J Immunother Cancer. 2017;5:43. doi:10.1186/s40425-017-0242-5
9. US Food and Drug Administration. Modification of the dosage regimen for nivolumab. Updated September 15, 2016. Accessed July 8, 2021. https://www.fda.gov/drugs /resources-information-approved-drugs/modification -dosage-regimen-nivolumab
10. Brahmer JR, Lacchetti C, Schneider BJ, et al. Management of immune-related adverse events in patients treated with immune checkpoint inhibitor therapy: American Society of Clinical Oncology Clinical Practice Guideline. J Clin Oncol. 2018;36(17):1714-1768. doi:10.1200/JCO.2017.77.6385
11. National Comprehensive Cancer Network. Clinical Practice Guidelines in Oncology: Management of immunotherapy- related toxicities. version 3.2021. Updated May 14, 2021. Accessed July 8,2021.https://www.nccn.org/professionals/physician_gls/pdf/immunotherapy.pdf
12. National Institutes of Health, National Cancer Institute. Common terminology criteria for adverse events (CTCAE) version 5.0. Updated November 17, 2017. Accessed July 8, 2021. https://ctep.cancer.gov /protocoldevelopment/electronic_applications/docs /CTCAE_v5_Quick_Reference_8.5x11.pdf
13. Zhao X, Ivaturi V, Gopalakrishnan M, Shen J, et al. A model-based exposure-response (E-R) assessment of a nivolumab (NIVO) 4-weekly dosing schedule across multiple tumor types. Abstract presented at: American Association of Cancer Research Annual Meeting 2017; April 1-5, 2017; Washington, DC. doi:10.1158/1538-7445.AM2017-CT101
14. US Food and Drug Administration approves new dosing regimen for pembrolizumab. Updated April 29, 2020. Accessed July 8, 2021. https://www.fda.gov/drugs/drug -approvals-and-databases/fda-approves-new-dosing -regimen-pembrolizumab
Business Education in Dermatology Residency: A Survey of Program Directors
Globally, the United States has the highest per-capita cost of health care; total costs are expected to account for approximately 20% of the nation’s gross domestic product by 2025.1 These rising costs have prompted residency programs and medical schools to incorporate business education into their curricula.2-5 Although medical training is demanding—with little room to add curricular components—these business-focused curricula have consistently received positive feedback from residents.5,6
In dermatology, more than 50% of residents opt to join a private practice upon graduation.7 In the United States, there also is an upward trend of practice acquisition and consolidation by private equity firms. Therefore, dermatology trainees are uniquely positioned to benefit from business education to make well-informed decisions about joining or starting a practice.Furthermore, whether in a private or academic setting, knowledge of foundational economics, business strategy, finance, marketing, and health care policy can equip dermatologists to more effectively advocate for local and national policies that benefit their patient population.7
We conducted a survey of dermatology program directors (PDs) to determine the availability of and perceptions regarding business education during residency training.
Materials and Methods
Institutional review board (Vanderbilt University Medical Center, Nashville, Tennessee) approval was obtained. The survey was distributed weekly during a 5-week period from July 2020 to August 2020 through the Research Electronic Data Capture survey application (www.project-redcap.org). Program director email addresses were obtained through the Accreditation Council for Graduate Medical Education (ACGME) program list. A PD was included in the survey if they were employed by an accredited US osteopathic or allopathic program and their email address was provided in the ACGME program list or on their program’s faculty web page; a PD was excluded if an email address was not provided in the ACGME program list or on their program’s faculty web page.
The 8-part questionnaire was designed to assess the following characteristics: details about the respondent’s residency program (institutional affiliation, number of residents), the respondent’s professional background (number of years as a PD, business training experience), resources for business education provided by the program, the respondent’s opinion about business education for residents, and the respondent’s perception of the most important topics to include in a dermatology curriculum’s business education component, which included economics/finance, health care policy/government, management, marketing, negotiation, private equity involvement in health care, business strategy, supply chain/operations, and technology/product development. Responses were kept anonymous. Categorical and continuous variables were analyzed with medians and proportions.
Results
Of the 139 surveys distributed, 35 were completed and returned (response rate, 25.2%). Most programs were university-affiliated (71.4%) or community-affiliated (22.9%). The median number of residents was 12. The respondents had a median of 5 years’ experience in their role. Most respondents (65.7%) had no business training, although 20.0% had completed undergraduate business coursework, and 8.6% had attended formal seminars on business topics; 5.7% were self-taught on business topics.
Business Education Availability
Approximately half (51.4%) of programs offered business training to residents, primarily through seminars or lectures (94.4%) and take-home modules (16.7%). None of the programs offered a formal gap year during which residents could pursue a professional business degree. Most respondents thought business education during residency was important (82.8%) and that programs should implement more training (57.1%). When asked whether residents were competent to handle business aspects of dermatology upon graduation, most respondents disagreed somewhat (22.9%) or were neutral (40.0%).
Topics for Business Education
The most important topics identified for inclusion in a business curriculum were economics or finance (68.6%), management (68.6%), and health care policy or government (57.1%). Other identified topics included negotiation (40.0%), private equity involvement in health care (40.0%), strategy (11.4%), supply chain or operations (11.4%), marketing (2.9%), and technology (2.9%).
Comment
Residency programs and medical schools in the United States have started to integrate formal business training into their curricula; however, the state of business training in dermatology has not been characterized. Overall, this survey revealed largely positive perceptions about business education and identified a demand for more resources.
Whereas most PDs identified business education as important, only one half (51.4%) of the representative programs offered structured training. Notably, most PDs did not agree that graduating residents were competent to handle the business demands of dermatology practice. These responses highlight a gap in the demand and resources available for business training.
Identifying Curricular Resources
During an already demanding residency, additional curricular components need to be beneficial and worthwhile. To avoid significant disruption, business training could take place in the form of online lectures or take-home modules. Most programs represented in the survey responses had an academic affiliation and therefore commonly have access to an affiliated graduate business school and/or hospital administrators who have clinical and business training.
Community dermatologists who own or run their own practice also are uniquely positioned to provide residents with practical, dermatology-specific business education. Programs can utilize their institutional and local colleagues to aid in curricular design and implementation. In addition, a potential long-term solution to obtaining resources for business education is to coordinate with a national dermatology organization to create standardized modules that are available to all residency programs.
Key Curriculum Topics
Our survey identified the most important topics to include in a business curriculum for dermatology residents. Economics and finance, management, and health care policy would be valuable to a trainee regardless of whether they ultimately choose a career in academia or private practice. A thorough understanding of complex health care policy reinforces knowledge about insurance and regional and national regulations, which could ultimately benefit patient care. As an example, the American Academy of Dermatology outlines several advocacy priorities such as Medicare reimbursement policies, access to dermatologic care through public and private insurance, medication access and pricing, and preservation of private practice in the setting of market consolidation. Having a better understanding of health care policy and business could better equip dermatologists to lead these often business-driven advocacy efforts to ultimately improve patient care and advance the specialty.8
Limitations
There were notable limitations to this survey, primarily related to its design. With a 25% response rate, there was the potential for response and selection biases; therefore, these results might not be generalizable to all programs. In addition, views held by PDs might not be consistent with those of other members of the dermatology community; for example, surveying residents, other faculty members, and dermatologists in private practice would have provided a more comprehensive characterization of the topic.
Conclusion
This study assessed residency program directors’ perceptions of business education in dermatology training. There appears to be an imbalance between the perceived importance of such education and the resources that are available to provide it. More attention is needed to address this gap to ensure that dermatologists are prepared to manage a rapidly changing health care environment. Results of this survey should encourage efforts to establish (1) a standardized, dermatology-specific business curriculum and (2) a plan to make that curriculum accessible to trainees and other members of the dermatology community.
- Branning G, Vater M. Healthcare spending: plenty of blame to go around. Am Health Drug Benefits. 2016;9:445-447.
- Bayard M, Peeples CR, Holt J, et al. An interactive approach to teaching practice management to family practice residents. Fam Med. 2003;35:622-624.
- Chan S. Management education during radiology residency: development of an educational practice. Acad Radiol. 2004;11:1308-1317.
- Ninan D, Patel D. Career and leadership education in anesthesia residency training. Cureus. 2018;10:e2546.
- Yu-Chin R. Teaching administration and management within psychiatric residency training. Acad Psychiatry. 2002;26:245-252.
- Winkelman JW, Brugnara C. Management training for pathology residents. II. experience with a focused curriculum. Am J Clin Pathol. 1994;101:564-568.
- Tan S, Seiger K, Renehan P, et al. Trends in private equity acquisition of dermatology practices in the United States. JAMA Dermatol. 2019;155:1013-1021.
- Academy advocacy priorities. American Academy of Dermatology website. Accessed August 11, 2021. www.aad.org/member/advocacy/priorities
Globally, the United States has the highest per-capita cost of health care; total costs are expected to account for approximately 20% of the nation’s gross domestic product by 2025.1 These rising costs have prompted residency programs and medical schools to incorporate business education into their curricula.2-5 Although medical training is demanding—with little room to add curricular components—these business-focused curricula have consistently received positive feedback from residents.5,6
In dermatology, more than 50% of residents opt to join a private practice upon graduation.7 In the United States, there also is an upward trend of practice acquisition and consolidation by private equity firms. Therefore, dermatology trainees are uniquely positioned to benefit from business education to make well-informed decisions about joining or starting a practice.Furthermore, whether in a private or academic setting, knowledge of foundational economics, business strategy, finance, marketing, and health care policy can equip dermatologists to more effectively advocate for local and national policies that benefit their patient population.7
We conducted a survey of dermatology program directors (PDs) to determine the availability of and perceptions regarding business education during residency training.
Materials and Methods
Institutional review board (Vanderbilt University Medical Center, Nashville, Tennessee) approval was obtained. The survey was distributed weekly during a 5-week period from July 2020 to August 2020 through the Research Electronic Data Capture survey application (www.project-redcap.org). Program director email addresses were obtained through the Accreditation Council for Graduate Medical Education (ACGME) program list. A PD was included in the survey if they were employed by an accredited US osteopathic or allopathic program and their email address was provided in the ACGME program list or on their program’s faculty web page; a PD was excluded if an email address was not provided in the ACGME program list or on their program’s faculty web page.
The 8-part questionnaire was designed to assess the following characteristics: details about the respondent’s residency program (institutional affiliation, number of residents), the respondent’s professional background (number of years as a PD, business training experience), resources for business education provided by the program, the respondent’s opinion about business education for residents, and the respondent’s perception of the most important topics to include in a dermatology curriculum’s business education component, which included economics/finance, health care policy/government, management, marketing, negotiation, private equity involvement in health care, business strategy, supply chain/operations, and technology/product development. Responses were kept anonymous. Categorical and continuous variables were analyzed with medians and proportions.
Results
Of the 139 surveys distributed, 35 were completed and returned (response rate, 25.2%). Most programs were university-affiliated (71.4%) or community-affiliated (22.9%). The median number of residents was 12. The respondents had a median of 5 years’ experience in their role. Most respondents (65.7%) had no business training, although 20.0% had completed undergraduate business coursework, and 8.6% had attended formal seminars on business topics; 5.7% were self-taught on business topics.
Business Education Availability
Approximately half (51.4%) of programs offered business training to residents, primarily through seminars or lectures (94.4%) and take-home modules (16.7%). None of the programs offered a formal gap year during which residents could pursue a professional business degree. Most respondents thought business education during residency was important (82.8%) and that programs should implement more training (57.1%). When asked whether residents were competent to handle business aspects of dermatology upon graduation, most respondents disagreed somewhat (22.9%) or were neutral (40.0%).
Topics for Business Education
The most important topics identified for inclusion in a business curriculum were economics or finance (68.6%), management (68.6%), and health care policy or government (57.1%). Other identified topics included negotiation (40.0%), private equity involvement in health care (40.0%), strategy (11.4%), supply chain or operations (11.4%), marketing (2.9%), and technology (2.9%).
Comment
Residency programs and medical schools in the United States have started to integrate formal business training into their curricula; however, the state of business training in dermatology has not been characterized. Overall, this survey revealed largely positive perceptions about business education and identified a demand for more resources.
Whereas most PDs identified business education as important, only one half (51.4%) of the representative programs offered structured training. Notably, most PDs did not agree that graduating residents were competent to handle the business demands of dermatology practice. These responses highlight a gap in the demand and resources available for business training.
Identifying Curricular Resources
During an already demanding residency, additional curricular components need to be beneficial and worthwhile. To avoid significant disruption, business training could take place in the form of online lectures or take-home modules. Most programs represented in the survey responses had an academic affiliation and therefore commonly have access to an affiliated graduate business school and/or hospital administrators who have clinical and business training.
Community dermatologists who own or run their own practice also are uniquely positioned to provide residents with practical, dermatology-specific business education. Programs can utilize their institutional and local colleagues to aid in curricular design and implementation. In addition, a potential long-term solution to obtaining resources for business education is to coordinate with a national dermatology organization to create standardized modules that are available to all residency programs.
Key Curriculum Topics
Our survey identified the most important topics to include in a business curriculum for dermatology residents. Economics and finance, management, and health care policy would be valuable to a trainee regardless of whether they ultimately choose a career in academia or private practice. A thorough understanding of complex health care policy reinforces knowledge about insurance and regional and national regulations, which could ultimately benefit patient care. As an example, the American Academy of Dermatology outlines several advocacy priorities such as Medicare reimbursement policies, access to dermatologic care through public and private insurance, medication access and pricing, and preservation of private practice in the setting of market consolidation. Having a better understanding of health care policy and business could better equip dermatologists to lead these often business-driven advocacy efforts to ultimately improve patient care and advance the specialty.8
Limitations
There were notable limitations to this survey, primarily related to its design. With a 25% response rate, there was the potential for response and selection biases; therefore, these results might not be generalizable to all programs. In addition, views held by PDs might not be consistent with those of other members of the dermatology community; for example, surveying residents, other faculty members, and dermatologists in private practice would have provided a more comprehensive characterization of the topic.
Conclusion
This study assessed residency program directors’ perceptions of business education in dermatology training. There appears to be an imbalance between the perceived importance of such education and the resources that are available to provide it. More attention is needed to address this gap to ensure that dermatologists are prepared to manage a rapidly changing health care environment. Results of this survey should encourage efforts to establish (1) a standardized, dermatology-specific business curriculum and (2) a plan to make that curriculum accessible to trainees and other members of the dermatology community.
- Branning G, Vater M. Healthcare spending: plenty of blame to go around. Am Health Drug Benefits. 2016;9:445-447.
- Bayard M, Peeples CR, Holt J, et al. An interactive approach to teaching practice management to family practice residents. Fam Med. 2003;35:622-624.
- Chan S. Management education during radiology residency: development of an educational practice. Acad Radiol. 2004;11:1308-1317.
- Ninan D, Patel D. Career and leadership education in anesthesia residency training. Cureus. 2018;10:e2546.
- Yu-Chin R. Teaching administration and management within psychiatric residency training. Acad Psychiatry. 2002;26:245-252.
- Winkelman JW, Brugnara C. Management training for pathology residents. II. experience with a focused curriculum. Am J Clin Pathol. 1994;101:564-568.
- Tan S, Seiger K, Renehan P, et al. Trends in private equity acquisition of dermatology practices in the United States. JAMA Dermatol. 2019;155:1013-1021.
- Academy advocacy priorities. American Academy of Dermatology website. Accessed August 11, 2021. www.aad.org/member/advocacy/priorities
Practice Points
- In our survey of dermatology program directors, most felt inclusion of business education in residency training was important.
- Approximately half of the dermatology programs that responded to our survey offer business training to their residents.
- Economics and finance, management, and health care policy were the most important topics identified to include in a business curriculum for dermatology residents
Anecdote Increases Patient Willingness to Take a Biologic Medication for Psoriasis
Biologic medications are highly effective in treating moderate to severe psoriasis, yet many patients are apprehensive about taking a biologic medication for a variety of reasons, such as hearing negative information about the drug from friends or family, being nervous about injection, or seeing the drug or its side effects negatively portrayed in the media.1-3 Because biologic medications are costly, many patients may fear needing to discontinue use of the medication owing to lack of affordability, which may result in subsequent rebound of psoriasis. Because patients’ fear of a drug is inherently subjective, it can be modified with appropriate reassurance and presentation of evidence. By understanding what information increases patients’ confidence in their willingness to take a biologic medication, patients may be more willing to initiate use of the drug and improve treatment outcomes.
There are mixed findings about whether statistical evidence or an anecdote is more effective in persuasion.4-6 The specific context in which the persuasion takes place may be important in determining which method is superior. In most nonthreatening situations, people appear to be more easily persuaded by statistical evidence rather than an anecdote. However, in circumstances where emotional engagement is high, such as regarding one’s own health, an anecdote tends to be more persuasive compared to statistical evidence.7 The purpose of this study was to evaluate patients’ willingness to take a biologic medication for the management of their psoriasis if presented with either clinical trial evidence of the agent’s efficacy and safety, an anecdote of a single patient’s positive experience, or both.
Methods
Patient Inclusion Criteria
Following Wake Forest School of Medicine institutional review board approval, a prospective parallel-arm survey study was performed on eligible patients 18 years or older with a self-reported diagnosis of psoriasis. Patients were required to have a working knowledge of English and not have been previously prescribed a biologic medication for their psoriasis. If patients did not meet inclusion criteria after answering the survey eligibility screening questions, then they were unable to complete the remainder of the survey and were excluded from the analysis.
Survey Administration
A total of 222 patients were recruited through Amazon Mechanical Turk, an online crowdsourcing platform. (Amazon Mechanical Turk is a validated tool in conducting research in psychology and other social sciences and is considered as diverse as and perhaps more representative than traditional samples.8,9) Patients received a fact sheet and were taken to the survey hosted on Qualtrics, a secure web-based survey software that supports data collection for research studies. Amazon Mechanical Turk requires some amount of compensation to patients; therefore, recruited patients were compensated $0.03.
Statistical Analysis
Patients were randomized using SPSS Statistics version 23.0 (IBM) in a 1:1 ratio to assess how willing they would be to take a biologic medication for their psoriasis if presented with one of the following: (1) a control that queried patients about their willingness to take treatment without having been informed on its efficacy or safety, (2) clinical trial evidence of the agent’s efficacy and safety, (3) an anecdote of a single patient’s positive experience, or (4) both clinical trial evidence of the agent’s efficacy and safety and an anecdote of a single patient’s positive experience (Table 1). Demographic information including sex, age, ethnicity, and education level was collected, in addition to other baseline characteristics such as having friends or family with a history of psoriasis, history of participation in a clinical trial with use of an experimental drug, and the number of years since clinical diagnosis of psoriasis.
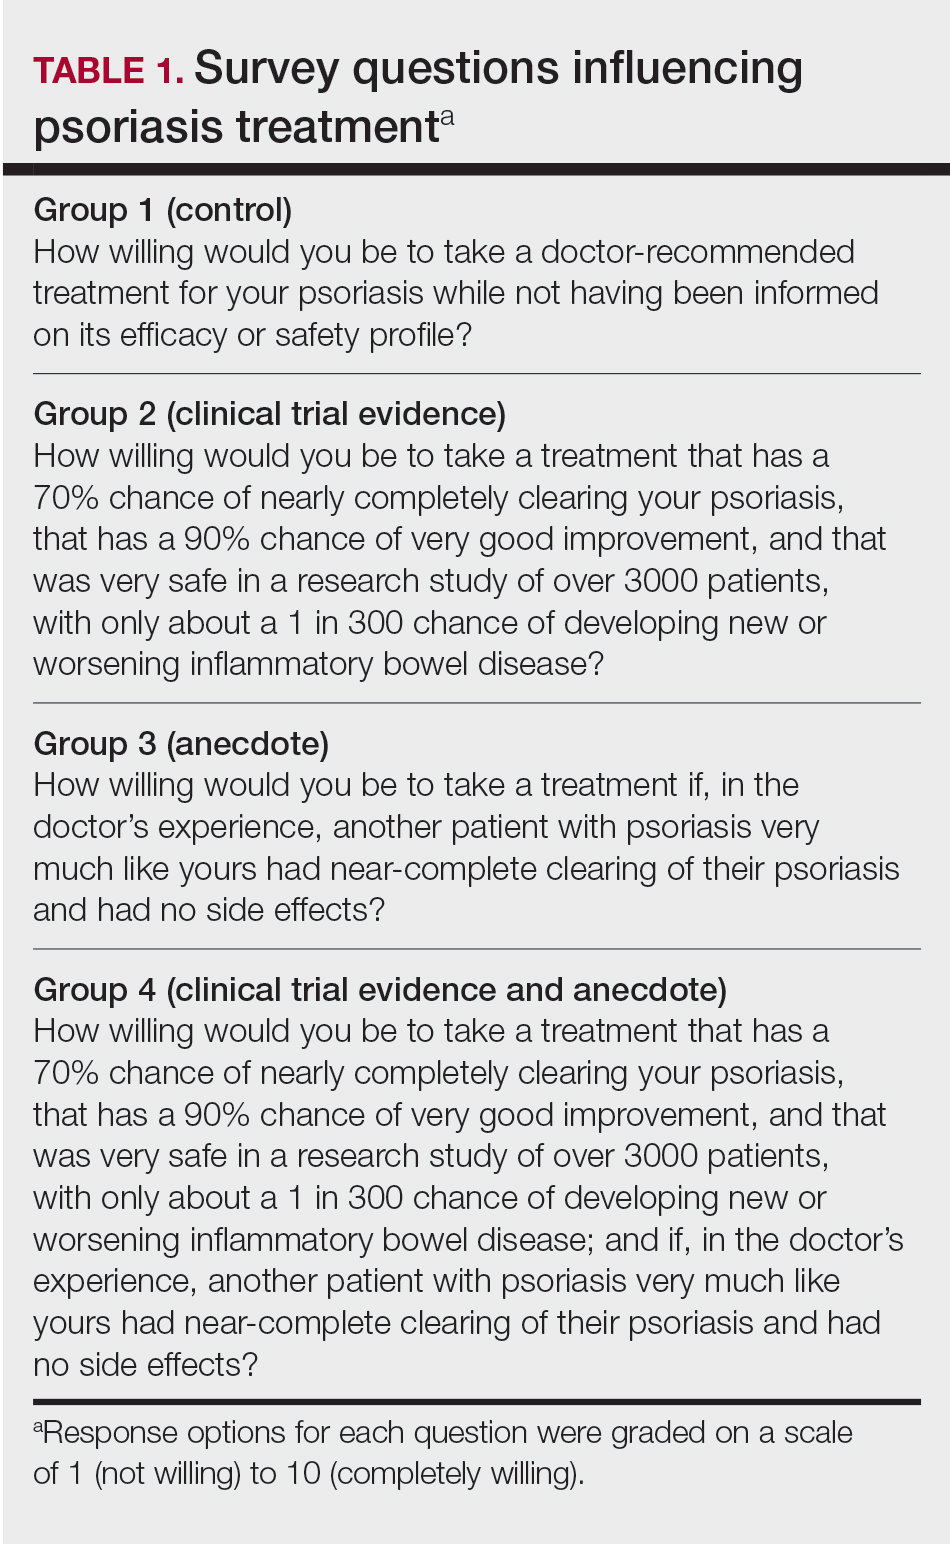
Outcome measures were recorded as patients’ responses regarding their willingness to take a biologic medication on a 10-point Likert scale (1=not willing; 10=completely willing). Scores were treated as ordinal data and evaluated using the Kruskal-Wallis test followed by the Dunn test. Descriptive statistics were tabulated on all variables. Baseline characteristics were analyzed using a 2-tailed, unpaired t test for continuous variables and the χ2 and Fisher exact tests for categorical variables. Ordinal linear regression analysis was performed to determine whether reported willingness to take a biologic medication was related to patients’ demographics, including age, sex, having family or friends with a history of psoriasis, history of participation in a clinical trial with use of an experimental drug, and the number of years since clinical diagnosis of psoriasis. Answers on the ordinal scale were binarized. The data were analyzed with SPSS Statistics version 23.0.
Results
There were no statistically significant differences among the baseline characteristics of the 4 information assignment groups (Table 2). Patients in the control group not given either clinical trial evidence of a biologic medication’s efficacy and safety or anecdote of a single patient’s positive experience had the lowest reported willingness to take treatment (median, 4.0)(Figure).
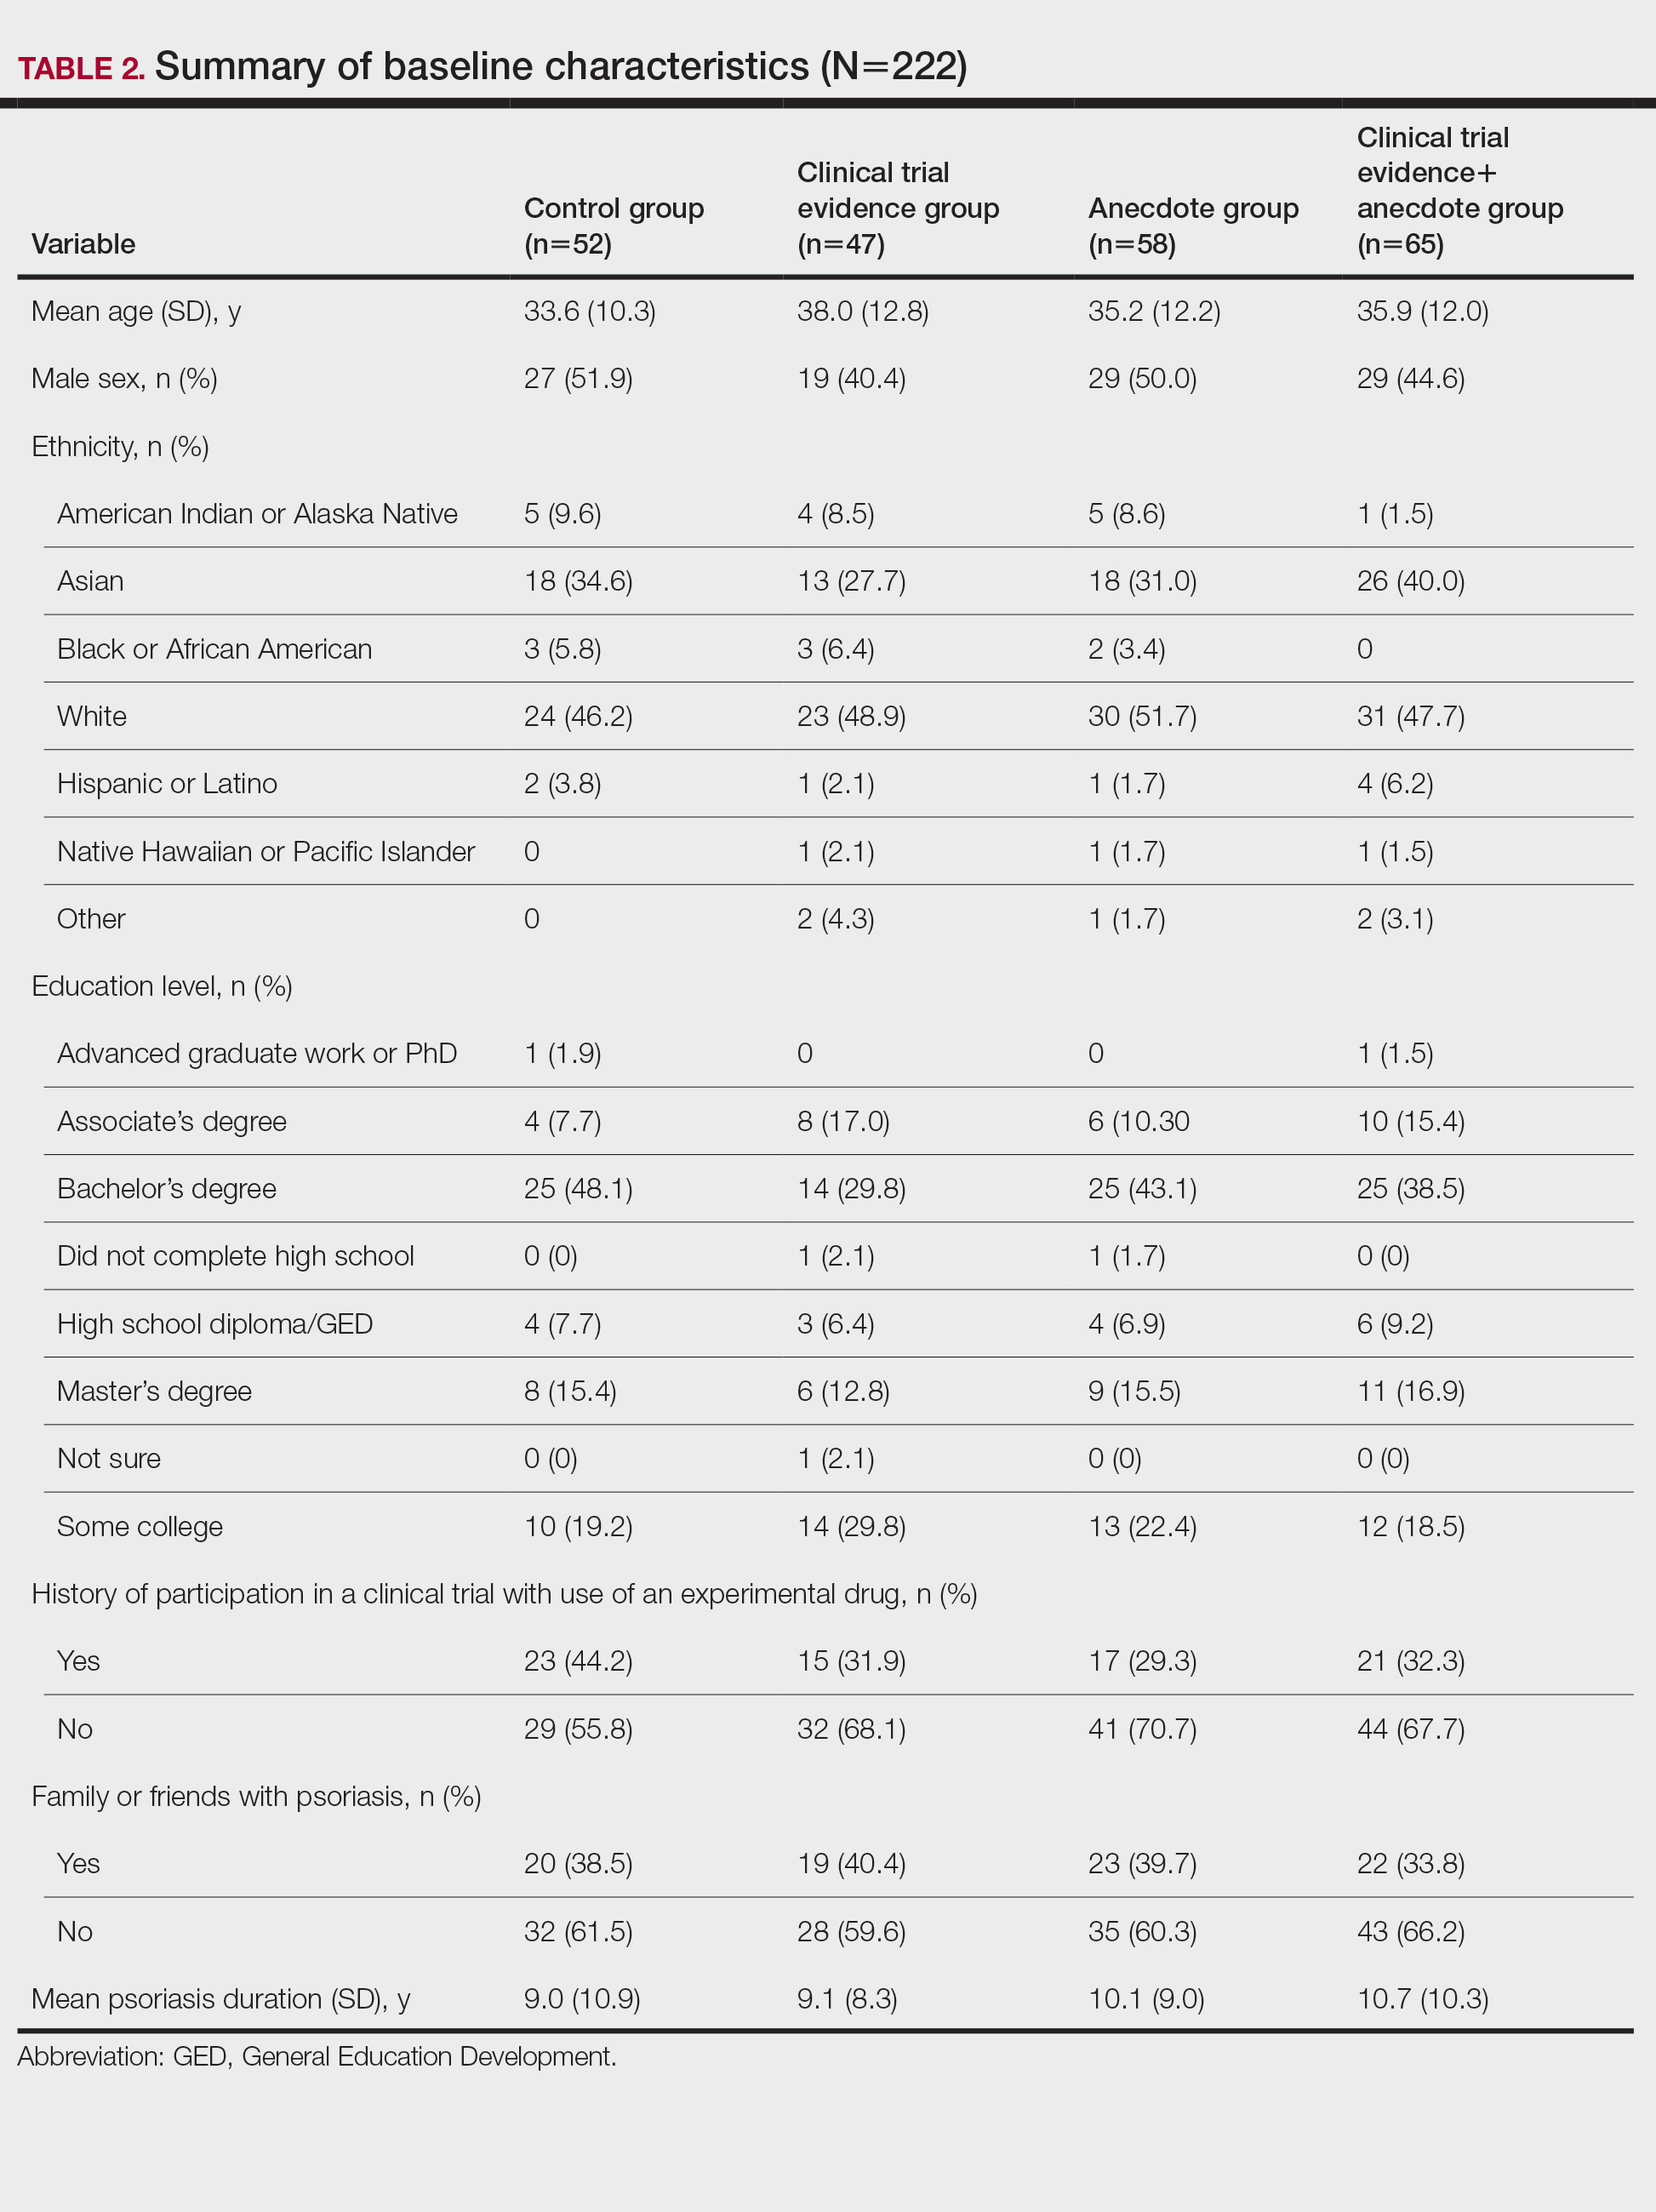
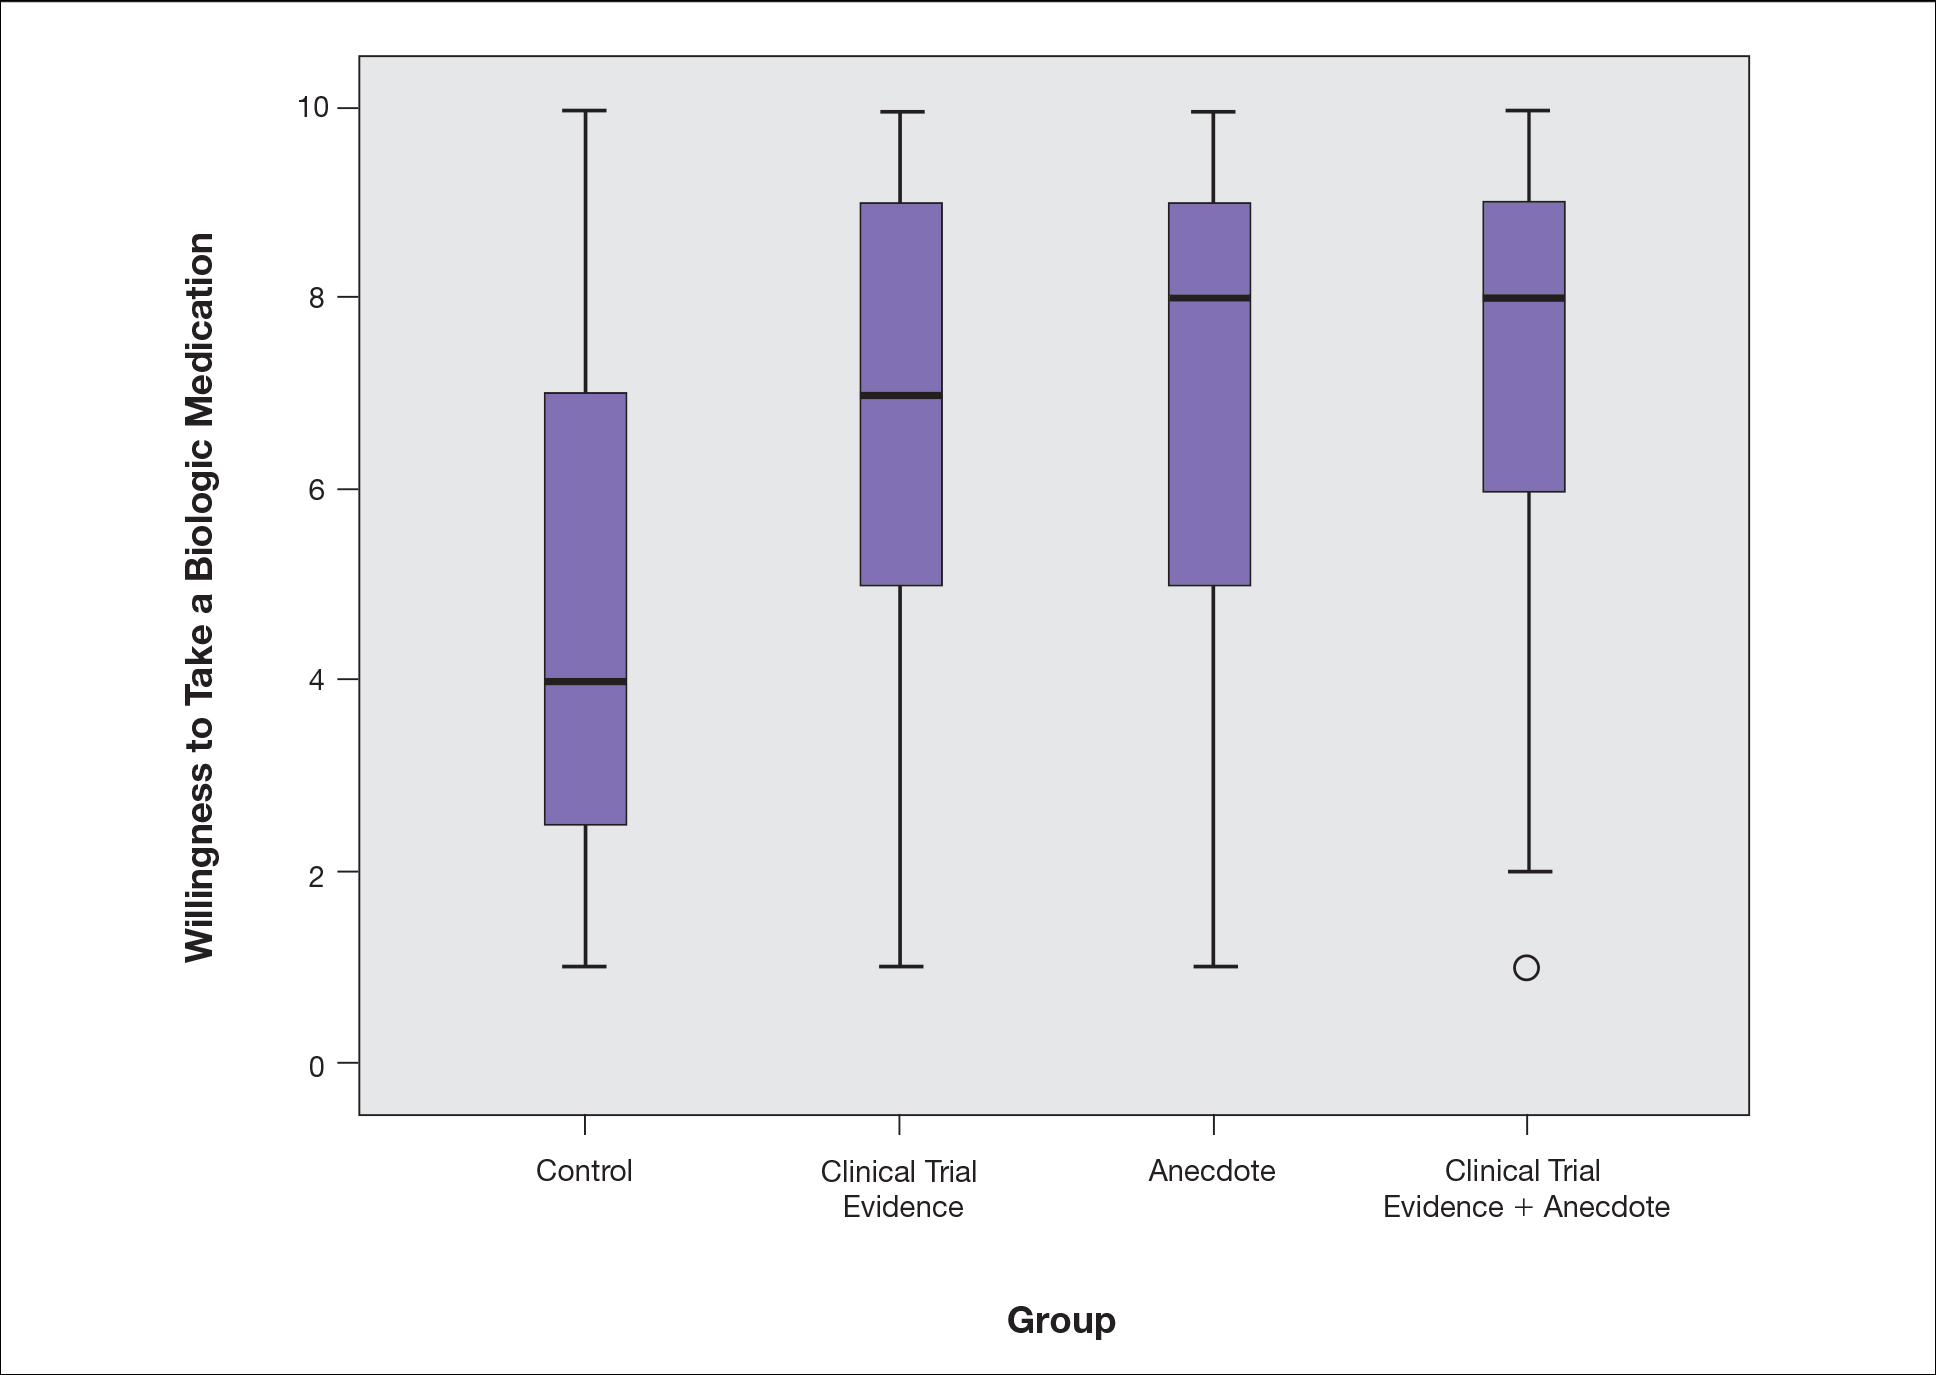
Based on regression analysis, age, sex, and having friends or family with a history of psoriasis were not significantly associated with patients’ responses (eTable). The number of years since clinical diagnosis of psoriasis (P=.034) and history of participation in a clinical trial with use of an experimental drug (P=.018) were significantly associated with the willingness of patients presented with an anecdote to take a biologic medication.
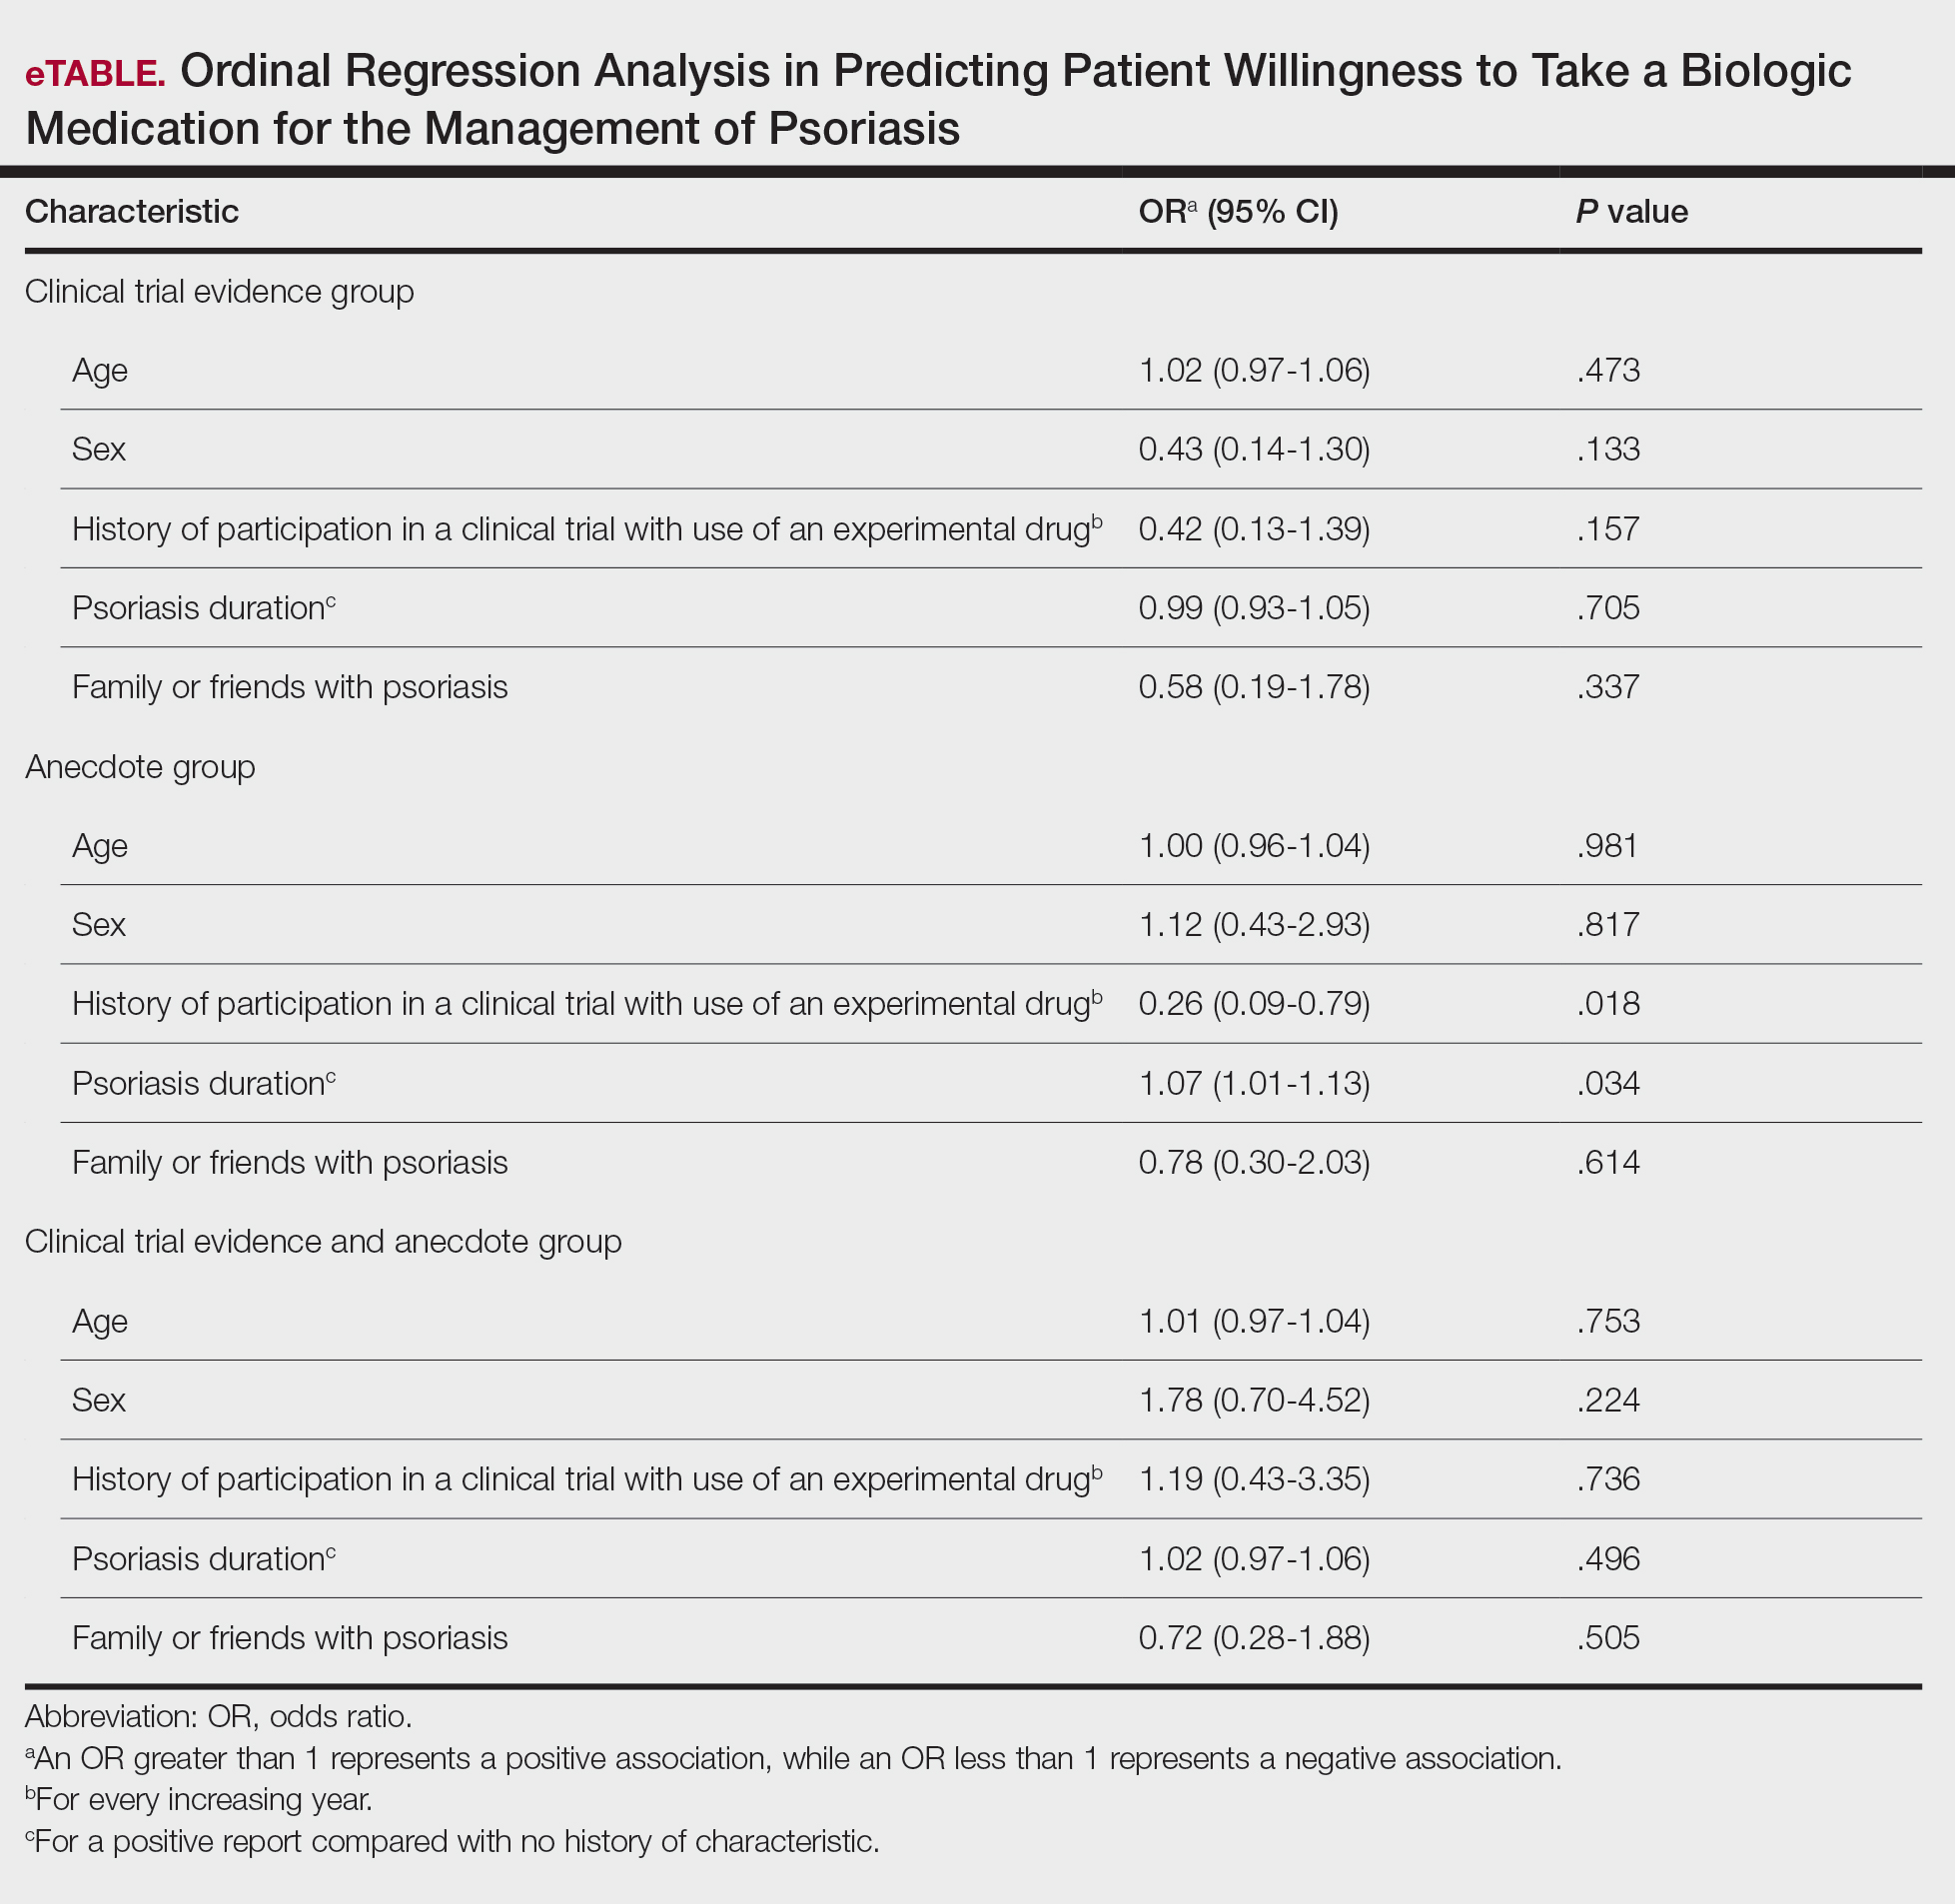
Comment
Anecdotal Reassurance
The presentation of clinical trial and/or anecdotal evidence had a strong effect on patients’ willingness to take a biologic medication for their psoriasis. Human perception of a treatment is inherently subjective, and such perceptions can be modified with appropriate reassurance and presentation of evidence.1 Across the population we studied, presenting a brief anecdote of a single patient’s positive experience is a quick and efficient means—and as or more effective as giving details on efficacy and safety—to help patients decide to take a treatment for their psoriasis.
Anecdotal reassurance is powerful. Both health care providers and patients have a natural tendency to focus on anecdotal experiences rather than statistical reasoning when making treatment decisions.10-12 Although negative anecdotal experiences may make patients unwilling to take a medication (or may make them overly desirous of an inappropriate treatment), clinicians can harness this psychological phenomenon to both increase patient willingness to take potentially beneficial treatments or to deter them from engaging in activities that can be harmful to their health, such as tanning and smoking.
Psoriasis Duration and Willingness to Take a Biologic Medication
In general, patient demographics did not appear to have an association with reported willingness to take a biologic medication for psoriasis. However, the number of years since clinical diagnosis of psoriasis had an effect on willingness to take a biologic medication, with patients with a longer personal history of psoriasis showing a higher willingness to take a treatment after being presented with an anecdote than patients with a shorter personal history of psoriasis. We can only speculate on the reasons why. Patients with a longer personal history of psoriasis may have tried and failed more treatments and therefore have a distrust in the validity of clinical trial evidence. These patients may feel their psoriasis is different than that of other clinical trial participants and thus may be more willing to rely on the success stories of individual patients.
Prior participation in a clinical trial with use of an experimental drug was associated with a lower willingness to choose treatment after being presented with anecdotal reassurance. This finding may be attributable to these patients understanding the subjective nature of anecdotes and preferring more objective information in the form of randomized clinical trials in making treatment decisions. Overall, the presentation of evidence about the efficacy and safety of biologic medications in the treatment of psoriasis has a greater impact on patient decision-making than patients’ age, sex, and having friends or family with a history of psoriasis.
Limitations
Limitations of the study were typical of survey-based research. With closed-ended questions, patients were not able to explain their responses. In addition, hypothetical informational statements of a biologic’s efficacy and safety may not always imitate clinical reality. However, we believe the study is valid in exploring the power of an anecdote in influencing patients’ willingness to take biologic medications for psoriasis. Furthermore, educational level and ethnicity were excluded from the ordinal regression analysis because the assumption of parallel lines was not met.
Ethics Behind an Anecdote
An important consideration is the ethical implications of sharing an anecdote to guide patients’ perceptions of treatment and behavior. Although clinicians rely heavily on the available data to determine the best course of treatment, providing patients with comprehensive information on all risks and benefits is rarely, if ever, feasible. Moreover, even objective clinical data will inevitably be subjectively interpreted by patients. For example, describing a medication side effect as occurring in 1 in 100 patients may discourage patients from pursuing treatment, whereas describing that risk as not occurring in 99 in 100 patients may encourage patients, despite these 2 choices being mathematically identical.13 Because the subjective interpretation of data is inevitable, presenting patients with subjective information in the form of an anecdote to help them overcome fears of starting treatment and achieve their desired clinical outcomes may be one of the appropriate approaches to present what is objectively the best option, particularly if the anecdote is representative of the expected treatment response. Clinicians can harness this understanding of human psychology to better educate patients about their treatment options while fulfilling their ethical duty to act in their patients’ best interest.
Conclusion
Using an anecdote to help patients overcome fears of starting a biologic medication may be appropriate if the anecdote is reasonably representative of an expected treatment outcome. Patients should have an accurate understanding of the common risks and benefits of a medication for purposes of shared decision-making.
- Oussedik E, Cardwell LA, Patel NU, et al. An anchoring-based intervention to increase patient willingness to use injectable medication in psoriasis. JAMA Dermatol. 2017;153:932-934. doi:10.1001/jamadermatol.2017.1271
- Brown KK, Rehmus WE, Kimball AB. Determining the relative importance of patient motivations for nonadherence to topical corticosteroid therapy in psoriasis. J Am Acad Dermatol. 2006;55:607-613. doi:10.1016/j.jaad.2005.12.021
- Im H, Huh J. Does health information in mass media help or hurt patients? Investigation of potential negative influence of mass media health information on patients’ beliefs and medication regimen adherence. J Health Commun. 2017;22:214-222. doi:10.1080/10810730.2016.1261970
- Hornikx J. A review of experimental research on the relative persuasiveness of anecdotal, statistical, causal, and expert evidence. Studies Commun Sci. 2005;5:205-216.
- Allen M, Preiss RW. Comparing the persuasiveness of narrative and statistical evidence using meta-analysis. Int J Phytoremediation Commun Res Rep. 1997;14:125-131. doi:10.1080/08824099709388654
- Shen F, Sheer VC, Li R. Impact of narratives on persuasion in health communication: a meta-analysis. J Advert. 2015;44:105-113. doi:10.1080/00913367.2015.1018467
- Freling TH, Yang Z, Saini R, et al. When poignant stories outweigh cold hard facts: a meta-analysis of the anecdotal bias. Organ Behav Hum Decis Process. 2020;160:51-67. doi:10.1016/j.obhdp.2020.01.006
- Buhrmester M, Kwang T, Gosling SD. Amazon’s Mechanical Turk. Perspect Psychol Sci. 2011;6:3-5. doi:10.1177/1745691610393980
- Berry K, Butt M, Kirby JS. Influence of information framing on patient decisions to treat actinic keratosis. JAMA Dermatol. 2017;153:421-426. doi:10.1001/jamadermatol.2016.5245
- Landon BE, Reschovsky J, Reed M, et al. Personal, organizational, and market level influences on physicians’ practice patterns: results of a national survey of primary care physicians. Med Care. 2001;39:889-905. doi:10.1097/00005650-200108000-00014
- Borgida E, Nisbett RE. The differential impact of abstract vs. concrete information on decisions. J Appl Soc Psychol. 1977;7:258-271. doi:10.1111/j.1559-1816.1977.tb00750.x
- Fagerlin A, Wang C, Ubel PA. Reducing the influence of anecdotal reasoning on people’s health care decisions: is a picture worth a thousand statistics? Med Decis Making. 2005;25:398-405. doi:10.1177/0272989X05278931
- Gurm HS, Litaker DG. Framing procedural risks to patients: Is 99% safe the same as a risk of 1 in 100? Acad Med. 2000;75:840-842. doi:10.1097/00001888-200008000-00018
Biologic medications are highly effective in treating moderate to severe psoriasis, yet many patients are apprehensive about taking a biologic medication for a variety of reasons, such as hearing negative information about the drug from friends or family, being nervous about injection, or seeing the drug or its side effects negatively portrayed in the media.1-3 Because biologic medications are costly, many patients may fear needing to discontinue use of the medication owing to lack of affordability, which may result in subsequent rebound of psoriasis. Because patients’ fear of a drug is inherently subjective, it can be modified with appropriate reassurance and presentation of evidence. By understanding what information increases patients’ confidence in their willingness to take a biologic medication, patients may be more willing to initiate use of the drug and improve treatment outcomes.
There are mixed findings about whether statistical evidence or an anecdote is more effective in persuasion.4-6 The specific context in which the persuasion takes place may be important in determining which method is superior. In most nonthreatening situations, people appear to be more easily persuaded by statistical evidence rather than an anecdote. However, in circumstances where emotional engagement is high, such as regarding one’s own health, an anecdote tends to be more persuasive compared to statistical evidence.7 The purpose of this study was to evaluate patients’ willingness to take a biologic medication for the management of their psoriasis if presented with either clinical trial evidence of the agent’s efficacy and safety, an anecdote of a single patient’s positive experience, or both.
Methods
Patient Inclusion Criteria
Following Wake Forest School of Medicine institutional review board approval, a prospective parallel-arm survey study was performed on eligible patients 18 years or older with a self-reported diagnosis of psoriasis. Patients were required to have a working knowledge of English and not have been previously prescribed a biologic medication for their psoriasis. If patients did not meet inclusion criteria after answering the survey eligibility screening questions, then they were unable to complete the remainder of the survey and were excluded from the analysis.
Survey Administration
A total of 222 patients were recruited through Amazon Mechanical Turk, an online crowdsourcing platform. (Amazon Mechanical Turk is a validated tool in conducting research in psychology and other social sciences and is considered as diverse as and perhaps more representative than traditional samples.8,9) Patients received a fact sheet and were taken to the survey hosted on Qualtrics, a secure web-based survey software that supports data collection for research studies. Amazon Mechanical Turk requires some amount of compensation to patients; therefore, recruited patients were compensated $0.03.
Statistical Analysis
Patients were randomized using SPSS Statistics version 23.0 (IBM) in a 1:1 ratio to assess how willing they would be to take a biologic medication for their psoriasis if presented with one of the following: (1) a control that queried patients about their willingness to take treatment without having been informed on its efficacy or safety, (2) clinical trial evidence of the agent’s efficacy and safety, (3) an anecdote of a single patient’s positive experience, or (4) both clinical trial evidence of the agent’s efficacy and safety and an anecdote of a single patient’s positive experience (Table 1). Demographic information including sex, age, ethnicity, and education level was collected, in addition to other baseline characteristics such as having friends or family with a history of psoriasis, history of participation in a clinical trial with use of an experimental drug, and the number of years since clinical diagnosis of psoriasis.
Outcome measures were recorded as patients’ responses regarding their willingness to take a biologic medication on a 10-point Likert scale (1=not willing; 10=completely willing). Scores were treated as ordinal data and evaluated using the Kruskal-Wallis test followed by the Dunn test. Descriptive statistics were tabulated on all variables. Baseline characteristics were analyzed using a 2-tailed, unpaired t test for continuous variables and the χ2 and Fisher exact tests for categorical variables. Ordinal linear regression analysis was performed to determine whether reported willingness to take a biologic medication was related to patients’ demographics, including age, sex, having family or friends with a history of psoriasis, history of participation in a clinical trial with use of an experimental drug, and the number of years since clinical diagnosis of psoriasis. Answers on the ordinal scale were binarized. The data were analyzed with SPSS Statistics version 23.0.
Results
There were no statistically significant differences among the baseline characteristics of the 4 information assignment groups (Table 2). Patients in the control group not given either clinical trial evidence of a biologic medication’s efficacy and safety or anecdote of a single patient’s positive experience had the lowest reported willingness to take treatment (median, 4.0)(Figure).
Based on regression analysis, age, sex, and having friends or family with a history of psoriasis were not significantly associated with patients’ responses (eTable). The number of years since clinical diagnosis of psoriasis (P=.034) and history of participation in a clinical trial with use of an experimental drug (P=.018) were significantly associated with the willingness of patients presented with an anecdote to take a biologic medication.
Comment
Anecdotal Reassurance
The presentation of clinical trial and/or anecdotal evidence had a strong effect on patients’ willingness to take a biologic medication for their psoriasis. Human perception of a treatment is inherently subjective, and such perceptions can be modified with appropriate reassurance and presentation of evidence.1 Across the population we studied, presenting a brief anecdote of a single patient’s positive experience is a quick and efficient means—and as or more effective as giving details on efficacy and safety—to help patients decide to take a treatment for their psoriasis.
Anecdotal reassurance is powerful. Both health care providers and patients have a natural tendency to focus on anecdotal experiences rather than statistical reasoning when making treatment decisions.10-12 Although negative anecdotal experiences may make patients unwilling to take a medication (or may make them overly desirous of an inappropriate treatment), clinicians can harness this psychological phenomenon to both increase patient willingness to take potentially beneficial treatments or to deter them from engaging in activities that can be harmful to their health, such as tanning and smoking.
Psoriasis Duration and Willingness to Take a Biologic Medication
In general, patient demographics did not appear to have an association with reported willingness to take a biologic medication for psoriasis. However, the number of years since clinical diagnosis of psoriasis had an effect on willingness to take a biologic medication, with patients with a longer personal history of psoriasis showing a higher willingness to take a treatment after being presented with an anecdote than patients with a shorter personal history of psoriasis. We can only speculate on the reasons why. Patients with a longer personal history of psoriasis may have tried and failed more treatments and therefore have a distrust in the validity of clinical trial evidence. These patients may feel their psoriasis is different than that of other clinical trial participants and thus may be more willing to rely on the success stories of individual patients.
Prior participation in a clinical trial with use of an experimental drug was associated with a lower willingness to choose treatment after being presented with anecdotal reassurance. This finding may be attributable to these patients understanding the subjective nature of anecdotes and preferring more objective information in the form of randomized clinical trials in making treatment decisions. Overall, the presentation of evidence about the efficacy and safety of biologic medications in the treatment of psoriasis has a greater impact on patient decision-making than patients’ age, sex, and having friends or family with a history of psoriasis.
Limitations
Limitations of the study were typical of survey-based research. With closed-ended questions, patients were not able to explain their responses. In addition, hypothetical informational statements of a biologic’s efficacy and safety may not always imitate clinical reality. However, we believe the study is valid in exploring the power of an anecdote in influencing patients’ willingness to take biologic medications for psoriasis. Furthermore, educational level and ethnicity were excluded from the ordinal regression analysis because the assumption of parallel lines was not met.
Ethics Behind an Anecdote
An important consideration is the ethical implications of sharing an anecdote to guide patients’ perceptions of treatment and behavior. Although clinicians rely heavily on the available data to determine the best course of treatment, providing patients with comprehensive information on all risks and benefits is rarely, if ever, feasible. Moreover, even objective clinical data will inevitably be subjectively interpreted by patients. For example, describing a medication side effect as occurring in 1 in 100 patients may discourage patients from pursuing treatment, whereas describing that risk as not occurring in 99 in 100 patients may encourage patients, despite these 2 choices being mathematically identical.13 Because the subjective interpretation of data is inevitable, presenting patients with subjective information in the form of an anecdote to help them overcome fears of starting treatment and achieve their desired clinical outcomes may be one of the appropriate approaches to present what is objectively the best option, particularly if the anecdote is representative of the expected treatment response. Clinicians can harness this understanding of human psychology to better educate patients about their treatment options while fulfilling their ethical duty to act in their patients’ best interest.
Conclusion
Using an anecdote to help patients overcome fears of starting a biologic medication may be appropriate if the anecdote is reasonably representative of an expected treatment outcome. Patients should have an accurate understanding of the common risks and benefits of a medication for purposes of shared decision-making.
- Oussedik E, Cardwell LA, Patel NU, et al. An anchoring-based intervention to increase patient willingness to use injectable medication in psoriasis. JAMA Dermatol. 2017;153:932-934. doi:10.1001/jamadermatol.2017.1271
- Brown KK, Rehmus WE, Kimball AB. Determining the relative importance of patient motivations for nonadherence to topical corticosteroid therapy in psoriasis. J Am Acad Dermatol. 2006;55:607-613. doi:10.1016/j.jaad.2005.12.021
- Im H, Huh J. Does health information in mass media help or hurt patients? Investigation of potential negative influence of mass media health information on patients’ beliefs and medication regimen adherence. J Health Commun. 2017;22:214-222. doi:10.1080/10810730.2016.1261970
- Hornikx J. A review of experimental research on the relative persuasiveness of anecdotal, statistical, causal, and expert evidence. Studies Commun Sci. 2005;5:205-216.
- Allen M, Preiss RW. Comparing the persuasiveness of narrative and statistical evidence using meta-analysis. Int J Phytoremediation Commun Res Rep. 1997;14:125-131. doi:10.1080/08824099709388654
- Shen F, Sheer VC, Li R. Impact of narratives on persuasion in health communication: a meta-analysis. J Advert. 2015;44:105-113. doi:10.1080/00913367.2015.1018467
- Freling TH, Yang Z, Saini R, et al. When poignant stories outweigh cold hard facts: a meta-analysis of the anecdotal bias. Organ Behav Hum Decis Process. 2020;160:51-67. doi:10.1016/j.obhdp.2020.01.006
- Buhrmester M, Kwang T, Gosling SD. Amazon’s Mechanical Turk. Perspect Psychol Sci. 2011;6:3-5. doi:10.1177/1745691610393980
- Berry K, Butt M, Kirby JS. Influence of information framing on patient decisions to treat actinic keratosis. JAMA Dermatol. 2017;153:421-426. doi:10.1001/jamadermatol.2016.5245
- Landon BE, Reschovsky J, Reed M, et al. Personal, organizational, and market level influences on physicians’ practice patterns: results of a national survey of primary care physicians. Med Care. 2001;39:889-905. doi:10.1097/00005650-200108000-00014
- Borgida E, Nisbett RE. The differential impact of abstract vs. concrete information on decisions. J Appl Soc Psychol. 1977;7:258-271. doi:10.1111/j.1559-1816.1977.tb00750.x
- Fagerlin A, Wang C, Ubel PA. Reducing the influence of anecdotal reasoning on people’s health care decisions: is a picture worth a thousand statistics? Med Decis Making. 2005;25:398-405. doi:10.1177/0272989X05278931
- Gurm HS, Litaker DG. Framing procedural risks to patients: Is 99% safe the same as a risk of 1 in 100? Acad Med. 2000;75:840-842. doi:10.1097/00001888-200008000-00018
Practice Points
- Patients often are apprehensive to start biologic medications for their psoriasis.
- Clinical trial evidence of a biologic medication’s efficacy and safety as well as anecdotes of patient experiences appear to be important factors for patients when considering taking a medication.
- The use of an anecdote—alone or in combination with clinical trial evidence—to help patients overcome fears of starting a biologic medication for their psoriasis may be an effective way to improve patients’ willingness to take treatment.
Health-Related Quality of Life and Toxicity After Definitive High-Dose-Rate Brachytherapy Among Veterans With Prostate Cancer
Nearly 50,000 veterans are diagnosed with cancer within the Veterans Health Administration annually with prostate cancer (PC) being the most frequently diagnosed, accounting for 29% of all cancers diagnosed.1 The treatment of PC depends on the stage and risk group at presentation and patient preference. Men with early stage, localized PC can be managed with prostatectomy, radiation therapy, or active surveillance.2
Within the Veterans Health Administration, more patients are treated with radiation therapy than with radical prostatectomy.3 This is in contrast to the civil health system, where more patients are treated with radical prostatectomy than with radiation therapy.4,5 Radiation therapy for PC can be given externally with external beam radiation therapy or internally with brachytherapy (BT). BT is categorized by the rate at which the radiation dose is delivered and generally grouped as low-dose rate (LDR) or high-dose rate (HDR). LDRBT consists of permanently implanting radioactive seeds, which slowly deliver a radiation dose over an extended period. HDRBT consists of implanting catheters that allow delivery of a radioactive source to be placed temporarily in the prostate and removed after treatment. The utilization of HDRBT has become more common as treatment has evolved to consist of fewer, larger fractions in a shorter time, making it a convenient treatment option for men with PC.6 The veteran population has singular medical challenges. These patients differ from the general population and are often underrepresented in medical research and published studies.7 There are no studies exploring the treatment-associated toxicities from HDRBT treatment for PC specifically in the veteran population. The objective of this study is to report our findings regarding the veteran-reported and physician-graded toxicities associated with HDRBT as monotherapy in veterans treated through the US Department of Veterans Affairs (VA) for PC.
Methods
We performed a retrospective cohort study of a prospectively maintained, institutional review board-approved database of patients treated with HDRBT for PC. Veterans were seen in consultation at Edward Hines, Jr. VA Hospital (EHJVAH) in Hines, Illinois. This is the only VA hospital in Illinois that offers radiation therapy, so it acted as a tertiary center, receiving referrals from other, neighboring VA hospitals. If the veteran was deemed a good BT candidate and elected to proceed with HDRBT, HDR treatment was performed at a partnering academic institution equipped to provide HDRBT (Loyola University Medical Center).
We selected patients with National Cancer Center Network (NCCN) low- or intermediate-risk PC undergoing definitive HDRBT as monotherapy using 13.5 Gy x 2 fractions delivered over 2 implants that were 1 to 2 weeks apart. Patients who received androgen deprivation therapy (ADT) were excluded from this study. No patients received supplemental external beam radiation. Men with unfavorable intermediate risk PC were offered ADT and BT in accordance with NCCN guidelines. However, patients with unfavorable intermediate-risk PC who declined ADT or who were deemed poor ADT candidates due to comorbidities were treated with HDR as monotherapy and included in this study.8
HDR Treatment
Our HDRBT implant procedure and treatment planning details have been previously described.9 In brief, patients were implanted with between 17 and 22 catheters based on gland size under transrectal ultrasound guidance. After implantation, computed tomography and, when possible, magnetic resonance imaging of the prostate were obtained and registered for target delineation. The prostate was segmented, and an asymmetric planning target volume of 0 to 5 mm was created and extended to encompass the proximal seminal vesicles. The second fraction was given 1 to 2 weeks after initial treatment, based on patient, physician, and operating room availability.
Health-Related Quality of Life Assessment
Veteran-reported genitourinary (GU), gastrointestinal (GI), and sexual health-related quality of life (hrQOL) were assessed using the validated International Prostate Symptom Score (IPSS) and the Expanded Prostate Cancer Index Composite Short Form (EPIC-26) instruments.10,11 Baseline veteran-reported hrQOL scores in the GU, GI, and sexual domains were obtained prior to each veteran’s first HDR treatment. Veteran-reported hrQOL scores were assessed at each of the patient’s follow-up appointments. Physician-graded toxicity was assessed Common Terminology Criteria for Adverse Events (CTCAE) v 4.03 criteria.12 Physician-graded toxicity was assessed at each follow-up visit and reported as the highest grade reported during any follow-up examination.
Follow-up appointments typically occurred at 1 month, 3 months, 6 months, 12 months, and subsequently every 6 months after the second HDR treatment. Follow-up appointments were conducted in the radiation oncology department at EHJVAH.
Minimal Clinically Important Differences
To evaluate the veteran-reported hrQOL, we characterized statistically significant differences in IPSS or EPIC-26 scores over time as compared with baseline values as clinically important or not clinically important through the use of reported minimal clinically important difference (MCID) assessments.13-15 For the IPSS, we used reported data that showed a change of ≥ 3.0 points represented a clinically meaningful change in urinary function.14 For the EPIC-26 scores, we used reported data that showed a change of ≥ 6 points for urinary incontinence score, ≥ 5 points for urinary obstruction score, ≥ 4 points for bowel score, and ≥ 10 points for sexual score to represent an MCID.15
Statistical Analysis
Changes in veteran-reported hrQOL over time were compared using mixed linear effects models, with the time since the last BT implant serving as the fixed variable. Effects were deemed statistically significant if P < .05. If a statistically significant difference from baseline was found at any time point, additional evaluation was done to see if the numerical difference in the assessment led to an MCID as described above. IBM SPSS Statistics for Windows, version 25.0 was used for data analysis.
Results
Seventy-four veterans were included in the study. The median follow-up was 18 months (range 1-43). The demographic and oncologic specifics of the treated veterans are outlined in Table 1.

There was a significant increase in IPSS (P < .001) with reciprocal decline in EPIC-26 urinary incontinence (P = .008) and EPIC-26 urinary obstruction scores (P = .001) from baseline over time (Table 2 and Figure 1). At the 18-month follow-up assessment, there was no longer a significant difference in the EPIC-26 urinary obstruction score from baseline (88.7 vs 84.0, P = .31). The increases in IPSS at the 1-, 3-, and 6-month assessments met the criteria for MCID. The decrease in EPIC-26 urinary incontinence scores at the 1-, 3-, 6-, 12-, and 18-month assessments were found to be an MCID, as were the decrease in EPIC-26 urinary obstruction scores at the 1-, 3-, 6-, and 12-month assessments.
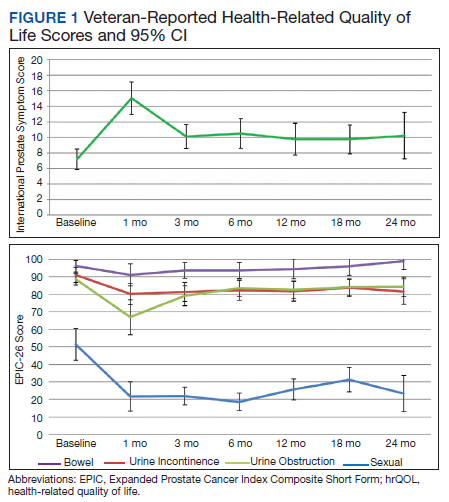

There was a significant decline in EPIC-26 bowel scores from baseline over time (P = .03). The decline in the EPIC-26 bowel hrQOL scores at the 1-, 3-, and 6-month follow-up assessment were significantly different from the baseline value. However, only the decrease seen at the 1-month assessment met criteria for MCID.
There was a significant decline in EPIC-26 sexual scores from baseline over time (P < .001). The decline in EPIC-26 sexual score noted at each follow-up compared with baseline was statistically significant. Each of these declines met criteria for an MCID.
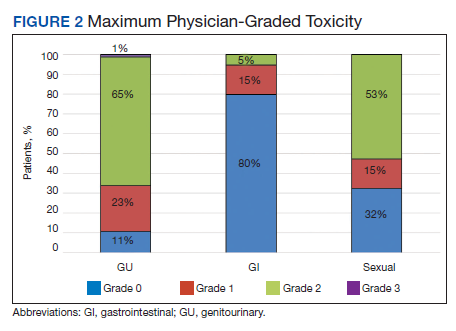
The rate of grade 2 GU, GI, and sexual physician-graded toxicity was 65%, 5%, and 53%, respectively (Figure 2). There was a single incident of grade 3 GU toxicity, which was a urethral stricture. There were no reported grade 3 GI or sexual toxicities, nor were there grade 4 or 5 toxicities. There were 5 total incidents of acute urinary retention for a 6.8% rate overall.
Discussion
We performed a retrospective study of veterans with low- or intermediate-risk PC undergoing definitive HDR prostate BT as monotherapy. We found that veterans experienced immediate declines in GU, GI, and sexual hrQOL after treatment. However, each trended toward a return to baseline over time, with the EPIC-26 urinary obstruction and the EPIC-26 bowel scores showing no difference from the baseline value within 18 months and 12 months, respectively. The physician-reported toxicities were low, with only 1 incidence of grade 3 GU toxicity, no grade 3 GI or sexual toxicities, and no grade 4 or 5 toxicity. This suggests that HDRBT is a well-tolerated and safe, definitive treatment for veterans with localized PC.
In a series similar to ours, Gaudet and colleagues reported on their single institutional results of treating 30 low- or intermediate-risk PC patients with HDRBT as monotherapy.16 Patients included in their study were civilians from the general population, treated in a similar fashion to the veterans treated in our study. Each patient received 27 Gy in 2 fractions given over 2 implants. The authors collected patient-reported hrQOL results using the IPSS and EPIC questionnaires and found that 57% of patients treated experienced moderate-to-severe urinary symptoms at the 1-month assessment after implantation, with a rapid recovery toward baseline over time. In contrast, GI symptoms did not change from baseline, while sexual symptoms worsened after implantation and failed to return to baseline.
Our results mirror this experience, with similar rates of patient-reported hrQOL scores and physician-graded toxicities. Patients reported similar rates of decline in GU, GI, and sexual hrQOL after treatment. The patient-reported GU and GI hrQOL scores worsened immediately after treatment, with a return toward baseline over time. However, the patient-reported sexual hrQOL dropped after treatment and had a subtle trend toward a return to baseline. Our data show higher rates of maximum physician-graded GU toxicity rates of 23%, 65%, and 1% grade 1, 2, and 3, respectively. This is likely due in part to our prophylactic use of tamsulosin. Patients who continued tamsulosin after the implant out of preference were technically grade 2 based on CTCAE v5.0 criteria. GI and sexual toxicity were substantially lower with rates of 15% and 5% grade 1 and grade 2 bowel toxicity with no grade 3 events, and 15% and 52% grade 1 and grade 2 sexual toxicity, respectively.
Contreras and colleagues also reported on treating civilian patients with HDRBT as monotherapy for PC.17 They, too, found similar results as in our veteran study, with a rapid decline in GU, GI, and sexual hrQOL scores immediately after treatment. They also found a gradual return to baseline in the GU hrQOL scores. Contrary to our results, they reported a return to baseline in sexual hrQOL scores, while their patients did not report a return to baseline in the GI hrQOL scores.
Limitations
To the authors’ knowledge, there are no other studies exploring HDR prostate BT toxicity in a veteran-specific population, and our study is novel in addressing this question. One limitation of the study is the relatively short median follow-up time of 18 months. With this limitation, our data were not yet sufficiently mature to perform biochemical control or overall survival analyses. The next step in our study is to calculate these clinical endpoints from our data after longer follow-up.
An additional limitation to our study is the single institutional nature of the design. While veterans from neighboring VA hospitals were included in the study by way of referral and treatment at our center, the only VA hospital in the state to provide radiation therapy, our patient population remains limited. Further multi-institutional and prospective data are needed to validate our findings.
Conclusions
HDR prostate BT as monotherapy is feasible with a favorable veteran-reported hrQOL and physician-graded toxicity profile. Veterans should be educated about this treatment modality when considering the optimal treatment for their localized prostate cancer.
1. Zullig LL, Sims KJ, McNeil R, et al. Cancer incidence among patients of the U.S. Veterans Affairs health care system: 2010 update. Mil Med. 2017;182(7):e1883‐e1891. doi:10.7205/MILMED-D-16-00371
2. Skolarus TA, Hawley ST. Prostate cancer survivorship care in the Veterans Health Administration. Fed Pract. 2014;31(8):10‐17.
3. Nambudiri VE, Landrum MB, Lamont EB, et al. Understanding variation in primary prostate cancer treatment within the Veterans Health Administration. Urology. 2012;79(3):537‐545. doi:10.1016/j.urology.2011.11.013
4. Harlan LC, Potosky A, Gilliland FD, et al. Factors associated with initial therapy for clinically localized prostate cancer: prostate cancer outcomes study. J Natl Cancer Inst. 2001;93(24):1864-1871. doi:10.1093/jnci/93.24.1864
5. Burt LM, Shrieve DC, Tward JD. Factors influencing prostate cancer patterns of care: an analysis of treatment variation using the SEER database. Adv Radiat Oncol. 2018;3(2):170-180. doi:10.1016/j.adro.2017.12.008
6. Crook J, Marbán M, Batchelar D. HDR prostate brachytherapy. Semin Radiat Oncol. 2020;30(1):49‐60. doi:10.1016/j.semradonc.2019.08.003
7. Agha Z, Lofgren RP, VanRuiswyk JV, Layde PM. Are patients at Veterans Affairs medical centers sicker? A comparative analysis of health status and medical resource use. Arch Intern Med. 2000;160(21):3252-3257. doi: 10.1001/archinte.160.21.3252.
8. D’Amico AV, Chen MH, Renshaw AA, Loffredo M, Kantoff PW. Androgen suppression and radiation vs radiation alone for prostate cancer: a randomized trial. JAMA. 2008;299(3):289-295. doi:10.1001/jama.299.3.289
9. Solanki AA, Mysz ML, Patel R, et al. Transitioning from a low-dose-rate to a high-dose-rate prostate brachytherapy program: comparing initial dosimetry and improving workflow efficiency through targeted interventions. Adv Radiat Oncol. 2019;4(1):103-111. doi:10.1016/j.adro.2018.10.004
10. Barry MJ, Fowler FJ Jr, O’Leary MP, et al. The American Urological Association symptom index for benign prostatic hyperplasia. The Measurement Committee of the American Urological Association. J Urol. 1992;148(5):1549‐1564. doi:10.1016/s0022-5347(17)36966-5
11. Wei JT, Dunn RL, Litwin MS, Sandler HM, Sanda MG. Development and validation of the expanded prostate cancer index composite (EPIC) for comprehensive assessment of health-related quality of life in men with prostate cancer. Urology. 2000;56(6):899‐905. doi:10.1016/s0090-4295(00)00858-x
12. US Department of Health and Human Services. Common terminology criteria for adverse events (CTCAE). version 4.03. Updated June 14, 2010. Accessed June 15, 2021. https://evs.nci.nih.gov/ftp1/CTCAE/CTCAE_4.03/CTCAE_4.03_2010-06-14_QuickReference_5x7.pdf
13. McGlothlin AE, Lewis RJ. Minimal clinically important difference: defining what really matters to patients. JAMA. 2014;312(13):1342-1343. doi:10.1001/jama.2014.13128
14. Barry MJ, Williford WO, Chang Y, et al. Benign prostatic hyperplasia specific health status measures in clinical research: how much change in the American Urological Association Symptom Index and the Benign Prostatic Hyperplasia Impact Index is perceptible to patients? J Urol. 1995;154(5):1770-1774. doi:10.1016/S0022-5347(01)66780-6
15. Skolarus TA, Dunn RL, Sanda MG, et al. Minimally important difference for the Expanded Prostate Cancer Index Composite Short Form. Urology. 2015;85(1):101–105. doi:10.1016/j.urology.2014.08.044
16. Gaudet M, Pharand-Charbonneau M, Desrosiers MP, Wright D, Haddad A. Early toxicity and health-related quality of life results of high-dose-rate brachytherapy as monotherapy for low and intermediate-risk prostate cancer. Brachytherapy. 2018;17(3):524-529. doi:10.1016/j.brachy.2018.01.009
17. Contreras JA, Wilder RB, Mellon EA, Strom TJ, Fernandez DC, Biagioli MC. Quality of life after high-dose-rate brachytherapy monotherapy for prostate cancer. Int Braz J Urol. 2015;41(1):40-45. doi:10.1590/S1677-5538.IBJU.2015.01.07
Nearly 50,000 veterans are diagnosed with cancer within the Veterans Health Administration annually with prostate cancer (PC) being the most frequently diagnosed, accounting for 29% of all cancers diagnosed.1 The treatment of PC depends on the stage and risk group at presentation and patient preference. Men with early stage, localized PC can be managed with prostatectomy, radiation therapy, or active surveillance.2
Within the Veterans Health Administration, more patients are treated with radiation therapy than with radical prostatectomy.3 This is in contrast to the civil health system, where more patients are treated with radical prostatectomy than with radiation therapy.4,5 Radiation therapy for PC can be given externally with external beam radiation therapy or internally with brachytherapy (BT). BT is categorized by the rate at which the radiation dose is delivered and generally grouped as low-dose rate (LDR) or high-dose rate (HDR). LDRBT consists of permanently implanting radioactive seeds, which slowly deliver a radiation dose over an extended period. HDRBT consists of implanting catheters that allow delivery of a radioactive source to be placed temporarily in the prostate and removed after treatment. The utilization of HDRBT has become more common as treatment has evolved to consist of fewer, larger fractions in a shorter time, making it a convenient treatment option for men with PC.6 The veteran population has singular medical challenges. These patients differ from the general population and are often underrepresented in medical research and published studies.7 There are no studies exploring the treatment-associated toxicities from HDRBT treatment for PC specifically in the veteran population. The objective of this study is to report our findings regarding the veteran-reported and physician-graded toxicities associated with HDRBT as monotherapy in veterans treated through the US Department of Veterans Affairs (VA) for PC.
Methods
We performed a retrospective cohort study of a prospectively maintained, institutional review board-approved database of patients treated with HDRBT for PC. Veterans were seen in consultation at Edward Hines, Jr. VA Hospital (EHJVAH) in Hines, Illinois. This is the only VA hospital in Illinois that offers radiation therapy, so it acted as a tertiary center, receiving referrals from other, neighboring VA hospitals. If the veteran was deemed a good BT candidate and elected to proceed with HDRBT, HDR treatment was performed at a partnering academic institution equipped to provide HDRBT (Loyola University Medical Center).
We selected patients with National Cancer Center Network (NCCN) low- or intermediate-risk PC undergoing definitive HDRBT as monotherapy using 13.5 Gy x 2 fractions delivered over 2 implants that were 1 to 2 weeks apart. Patients who received androgen deprivation therapy (ADT) were excluded from this study. No patients received supplemental external beam radiation. Men with unfavorable intermediate risk PC were offered ADT and BT in accordance with NCCN guidelines. However, patients with unfavorable intermediate-risk PC who declined ADT or who were deemed poor ADT candidates due to comorbidities were treated with HDR as monotherapy and included in this study.8
HDR Treatment
Our HDRBT implant procedure and treatment planning details have been previously described.9 In brief, patients were implanted with between 17 and 22 catheters based on gland size under transrectal ultrasound guidance. After implantation, computed tomography and, when possible, magnetic resonance imaging of the prostate were obtained and registered for target delineation. The prostate was segmented, and an asymmetric planning target volume of 0 to 5 mm was created and extended to encompass the proximal seminal vesicles. The second fraction was given 1 to 2 weeks after initial treatment, based on patient, physician, and operating room availability.
Health-Related Quality of Life Assessment
Veteran-reported genitourinary (GU), gastrointestinal (GI), and sexual health-related quality of life (hrQOL) were assessed using the validated International Prostate Symptom Score (IPSS) and the Expanded Prostate Cancer Index Composite Short Form (EPIC-26) instruments.10,11 Baseline veteran-reported hrQOL scores in the GU, GI, and sexual domains were obtained prior to each veteran’s first HDR treatment. Veteran-reported hrQOL scores were assessed at each of the patient’s follow-up appointments. Physician-graded toxicity was assessed Common Terminology Criteria for Adverse Events (CTCAE) v 4.03 criteria.12 Physician-graded toxicity was assessed at each follow-up visit and reported as the highest grade reported during any follow-up examination.
Follow-up appointments typically occurred at 1 month, 3 months, 6 months, 12 months, and subsequently every 6 months after the second HDR treatment. Follow-up appointments were conducted in the radiation oncology department at EHJVAH.
Minimal Clinically Important Differences
To evaluate the veteran-reported hrQOL, we characterized statistically significant differences in IPSS or EPIC-26 scores over time as compared with baseline values as clinically important or not clinically important through the use of reported minimal clinically important difference (MCID) assessments.13-15 For the IPSS, we used reported data that showed a change of ≥ 3.0 points represented a clinically meaningful change in urinary function.14 For the EPIC-26 scores, we used reported data that showed a change of ≥ 6 points for urinary incontinence score, ≥ 5 points for urinary obstruction score, ≥ 4 points for bowel score, and ≥ 10 points for sexual score to represent an MCID.15
Statistical Analysis
Changes in veteran-reported hrQOL over time were compared using mixed linear effects models, with the time since the last BT implant serving as the fixed variable. Effects were deemed statistically significant if P < .05. If a statistically significant difference from baseline was found at any time point, additional evaluation was done to see if the numerical difference in the assessment led to an MCID as described above. IBM SPSS Statistics for Windows, version 25.0 was used for data analysis.
Results
Seventy-four veterans were included in the study. The median follow-up was 18 months (range 1-43). The demographic and oncologic specifics of the treated veterans are outlined in Table 1.
There was a significant increase in IPSS (P < .001) with reciprocal decline in EPIC-26 urinary incontinence (P = .008) and EPIC-26 urinary obstruction scores (P = .001) from baseline over time (Table 2 and Figure 1). At the 18-month follow-up assessment, there was no longer a significant difference in the EPIC-26 urinary obstruction score from baseline (88.7 vs 84.0, P = .31). The increases in IPSS at the 1-, 3-, and 6-month assessments met the criteria for MCID. The decrease in EPIC-26 urinary incontinence scores at the 1-, 3-, 6-, 12-, and 18-month assessments were found to be an MCID, as were the decrease in EPIC-26 urinary obstruction scores at the 1-, 3-, 6-, and 12-month assessments.
There was a significant decline in EPIC-26 bowel scores from baseline over time (P = .03). The decline in the EPIC-26 bowel hrQOL scores at the 1-, 3-, and 6-month follow-up assessment were significantly different from the baseline value. However, only the decrease seen at the 1-month assessment met criteria for MCID.
There was a significant decline in EPIC-26 sexual scores from baseline over time (P < .001). The decline in EPIC-26 sexual score noted at each follow-up compared with baseline was statistically significant. Each of these declines met criteria for an MCID.
The rate of grade 2 GU, GI, and sexual physician-graded toxicity was 65%, 5%, and 53%, respectively (Figure 2). There was a single incident of grade 3 GU toxicity, which was a urethral stricture. There were no reported grade 3 GI or sexual toxicities, nor were there grade 4 or 5 toxicities. There were 5 total incidents of acute urinary retention for a 6.8% rate overall.
Discussion
We performed a retrospective study of veterans with low- or intermediate-risk PC undergoing definitive HDR prostate BT as monotherapy. We found that veterans experienced immediate declines in GU, GI, and sexual hrQOL after treatment. However, each trended toward a return to baseline over time, with the EPIC-26 urinary obstruction and the EPIC-26 bowel scores showing no difference from the baseline value within 18 months and 12 months, respectively. The physician-reported toxicities were low, with only 1 incidence of grade 3 GU toxicity, no grade 3 GI or sexual toxicities, and no grade 4 or 5 toxicity. This suggests that HDRBT is a well-tolerated and safe, definitive treatment for veterans with localized PC.
In a series similar to ours, Gaudet and colleagues reported on their single institutional results of treating 30 low- or intermediate-risk PC patients with HDRBT as monotherapy.16 Patients included in their study were civilians from the general population, treated in a similar fashion to the veterans treated in our study. Each patient received 27 Gy in 2 fractions given over 2 implants. The authors collected patient-reported hrQOL results using the IPSS and EPIC questionnaires and found that 57% of patients treated experienced moderate-to-severe urinary symptoms at the 1-month assessment after implantation, with a rapid recovery toward baseline over time. In contrast, GI symptoms did not change from baseline, while sexual symptoms worsened after implantation and failed to return to baseline.
Our results mirror this experience, with similar rates of patient-reported hrQOL scores and physician-graded toxicities. Patients reported similar rates of decline in GU, GI, and sexual hrQOL after treatment. The patient-reported GU and GI hrQOL scores worsened immediately after treatment, with a return toward baseline over time. However, the patient-reported sexual hrQOL dropped after treatment and had a subtle trend toward a return to baseline. Our data show higher rates of maximum physician-graded GU toxicity rates of 23%, 65%, and 1% grade 1, 2, and 3, respectively. This is likely due in part to our prophylactic use of tamsulosin. Patients who continued tamsulosin after the implant out of preference were technically grade 2 based on CTCAE v5.0 criteria. GI and sexual toxicity were substantially lower with rates of 15% and 5% grade 1 and grade 2 bowel toxicity with no grade 3 events, and 15% and 52% grade 1 and grade 2 sexual toxicity, respectively.
Contreras and colleagues also reported on treating civilian patients with HDRBT as monotherapy for PC.17 They, too, found similar results as in our veteran study, with a rapid decline in GU, GI, and sexual hrQOL scores immediately after treatment. They also found a gradual return to baseline in the GU hrQOL scores. Contrary to our results, they reported a return to baseline in sexual hrQOL scores, while their patients did not report a return to baseline in the GI hrQOL scores.
Limitations
To the authors’ knowledge, there are no other studies exploring HDR prostate BT toxicity in a veteran-specific population, and our study is novel in addressing this question. One limitation of the study is the relatively short median follow-up time of 18 months. With this limitation, our data were not yet sufficiently mature to perform biochemical control or overall survival analyses. The next step in our study is to calculate these clinical endpoints from our data after longer follow-up.
An additional limitation to our study is the single institutional nature of the design. While veterans from neighboring VA hospitals were included in the study by way of referral and treatment at our center, the only VA hospital in the state to provide radiation therapy, our patient population remains limited. Further multi-institutional and prospective data are needed to validate our findings.
Conclusions
HDR prostate BT as monotherapy is feasible with a favorable veteran-reported hrQOL and physician-graded toxicity profile. Veterans should be educated about this treatment modality when considering the optimal treatment for their localized prostate cancer.
1. Zullig LL, Sims KJ, McNeil R, et al. Cancer incidence among patients of the U.S. Veterans Affairs health care system: 2010 update. Mil Med. 2017;182(7):e1883‐e1891. doi:10.7205/MILMED-D-16-00371
2. Skolarus TA, Hawley ST. Prostate cancer survivorship care in the Veterans Health Administration. Fed Pract. 2014;31(8):10‐17.
3. Nambudiri VE, Landrum MB, Lamont EB, et al. Understanding variation in primary prostate cancer treatment within the Veterans Health Administration. Urology. 2012;79(3):537‐545. doi:10.1016/j.urology.2011.11.013
4. Harlan LC, Potosky A, Gilliland FD, et al. Factors associated with initial therapy for clinically localized prostate cancer: prostate cancer outcomes study. J Natl Cancer Inst. 2001;93(24):1864-1871. doi:10.1093/jnci/93.24.1864
5. Burt LM, Shrieve DC, Tward JD. Factors influencing prostate cancer patterns of care: an analysis of treatment variation using the SEER database. Adv Radiat Oncol. 2018;3(2):170-180. doi:10.1016/j.adro.2017.12.008
6. Crook J, Marbán M, Batchelar D. HDR prostate brachytherapy. Semin Radiat Oncol. 2020;30(1):49‐60. doi:10.1016/j.semradonc.2019.08.003
7. Agha Z, Lofgren RP, VanRuiswyk JV, Layde PM. Are patients at Veterans Affairs medical centers sicker? A comparative analysis of health status and medical resource use. Arch Intern Med. 2000;160(21):3252-3257. doi: 10.1001/archinte.160.21.3252.
8. D’Amico AV, Chen MH, Renshaw AA, Loffredo M, Kantoff PW. Androgen suppression and radiation vs radiation alone for prostate cancer: a randomized trial. JAMA. 2008;299(3):289-295. doi:10.1001/jama.299.3.289
9. Solanki AA, Mysz ML, Patel R, et al. Transitioning from a low-dose-rate to a high-dose-rate prostate brachytherapy program: comparing initial dosimetry and improving workflow efficiency through targeted interventions. Adv Radiat Oncol. 2019;4(1):103-111. doi:10.1016/j.adro.2018.10.004
10. Barry MJ, Fowler FJ Jr, O’Leary MP, et al. The American Urological Association symptom index for benign prostatic hyperplasia. The Measurement Committee of the American Urological Association. J Urol. 1992;148(5):1549‐1564. doi:10.1016/s0022-5347(17)36966-5
11. Wei JT, Dunn RL, Litwin MS, Sandler HM, Sanda MG. Development and validation of the expanded prostate cancer index composite (EPIC) for comprehensive assessment of health-related quality of life in men with prostate cancer. Urology. 2000;56(6):899‐905. doi:10.1016/s0090-4295(00)00858-x
12. US Department of Health and Human Services. Common terminology criteria for adverse events (CTCAE). version 4.03. Updated June 14, 2010. Accessed June 15, 2021. https://evs.nci.nih.gov/ftp1/CTCAE/CTCAE_4.03/CTCAE_4.03_2010-06-14_QuickReference_5x7.pdf
13. McGlothlin AE, Lewis RJ. Minimal clinically important difference: defining what really matters to patients. JAMA. 2014;312(13):1342-1343. doi:10.1001/jama.2014.13128
14. Barry MJ, Williford WO, Chang Y, et al. Benign prostatic hyperplasia specific health status measures in clinical research: how much change in the American Urological Association Symptom Index and the Benign Prostatic Hyperplasia Impact Index is perceptible to patients? J Urol. 1995;154(5):1770-1774. doi:10.1016/S0022-5347(01)66780-6
15. Skolarus TA, Dunn RL, Sanda MG, et al. Minimally important difference for the Expanded Prostate Cancer Index Composite Short Form. Urology. 2015;85(1):101–105. doi:10.1016/j.urology.2014.08.044
16. Gaudet M, Pharand-Charbonneau M, Desrosiers MP, Wright D, Haddad A. Early toxicity and health-related quality of life results of high-dose-rate brachytherapy as monotherapy for low and intermediate-risk prostate cancer. Brachytherapy. 2018;17(3):524-529. doi:10.1016/j.brachy.2018.01.009
17. Contreras JA, Wilder RB, Mellon EA, Strom TJ, Fernandez DC, Biagioli MC. Quality of life after high-dose-rate brachytherapy monotherapy for prostate cancer. Int Braz J Urol. 2015;41(1):40-45. doi:10.1590/S1677-5538.IBJU.2015.01.07
An Interdisciplinary Approach to Metastatic Pancreatic Cancer and Comorbid Opioid Use Disorder Treatment Within a VA Health Care System
A multidisciplinary approach provided safe and feasible cancer treatment in a patient with advanced pancreatic cancer and coexisting active substance use disorder.
Substance use disorders (SUDs) are an important but understudied aspect of treating patients diagnosed with cancer. Substance use can affect cancer treatment outcomes, including morbidity and mortality.1,2 Additionally, patients with cancer and SUD may have unique psychosocial needs that require close attention and management. There is a paucity of data regarding the best approach to treating such patients. For example, cocaine use may increase the cardiovascular and hematologic risk of some traditional chemotherapy agents.3,4 Newer targeted agents and immunotherapies remain understudied with respect to SUD risk.
Although the US Department of Veterans Affairs (VA) has established helpful clinical practice guidelines for the treatment of SUD, there are no guidelines for treating patients with SUD and cancer.5 Clinicians have limited confidence in treatment approach, and treatment is inconsistent among oncologists nationwide even within the same practice. Furthermore, it can be challenging to safely prescribe opioids for cancer-related pain in individuals with SUD. There is a high risk of SUD and mental health disorders in veterans, making this population particularly vulnerable. We report a case of a male with metastatic pancreatic cancer, severe opioid use disorder (OUD) and moderate cocaine use disorder (CUD) who received pain management and cancer treatment under the direction of a multidisciplinary team approach.
Case Report
A 63-year-old male with a medical history of HIV treated with highly active antiretroviral therapy (HAART), compensated cirrhosis, severe OUD, moderate CUD, and sedative use disorder in sustained remission was admitted to the West Haven campus of the VA Connecticut Healthcare System (VACHS) with abdominal pain, weight loss and fatigue. He used heroin 1 month prior to his admission and reported regular cocaine and marijuana use (Table 1). He was diagnosed with HIV in 1989, and his medical history included herpes zoster and oral candidiasis but no other opportunistic infections. Several months prior to this admission, he had an undetectable viral load and CD4 count of 688.
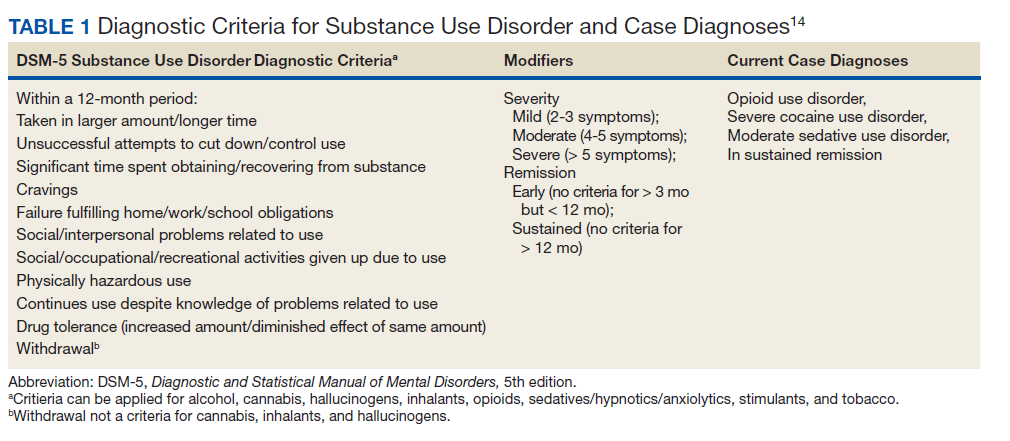
At the time of this admission, the patient was adherent to methadone treatment. He reported increased abdominal pain. Computed tomography (CT) showed a 2.4-cm mass in the pancreatic uncinate process, multiple liver metastases, retroperitoneal lymphadenopathy, and small lung nodules. A CT-guided liver biopsy showed adenocarcinoma consistent with a primary cancer of the pancreas. Given the complexity of the case, a multidisciplinary team approach was used to treat his cancer and the sequelae safely, including the oncology team, community living center team, palliative care team, and interprofessional opioid reassessment clinic team (ORC).
Cancer Treatment
Chemotherapy with FOLFIRINOX (leucovorin calcium, fluorouracil, irinotecan hydrochloride, and oxaliplatin) was recommended. The first cycle of treatment originally was planned for the outpatient setting, and a peripherally inserted central catheter (PICC) line was placed. However, after a urine toxicology test was positive for cocaine, the PICC line was removed due to concern for possible use of PICC line for nonprescribed substance use. The patient expressed suicidal ideation at the time and was admitted for psychiatric consult and pain control. Cycle 1 FOLFIRINOX was started during this admission. A PICC line was again put in place and then removed before discharge. A celiac plexus block was performed several days after this admission for pain control.
Given concern about cocaine use increasing the risk of cardiac toxicity with FOLFIRINOX treatment, treating providers sconsulted with the community living center (CLC) about possible admission for future chemotherapy administration and pain management. The CLC at VACHS has 38 beds for rehabilitation, long-term care, and hospice with the mission to restore each veteran to his or her highest level of well-being. After discussion with this patient and CLC staff, he agreed to a CLC admission. The patient agreed to remain in the facility, wear a secure care device, and not leave without staff accompaniment. He was able to obtain a 2-hour pass to pay bills and rent. During the 2 months he was admitted to the CLC he would present to the VACHS Cancer Center for chemotherapy every 2 weeks. He completed 6 cycles of chemotherapy while admitted. During the admission, he was transferred to active medical service for 2 days for fever and malaise, and then returned to the CLC. The patient elected to leave the CLC after 2 months as the inability to see close friends was interfering with his quality of life.
Upon being discharged from the CLC, shared decision making took place with the patient to establish a new treatment plan. In collaboration with the patient, a plan was made to admit him every 2 weeks for continued chemotherapy. A PICC line was placed on each day of admission and removed prior to discharge. It was also agreed that treatment would be delayed if a urine drug test was positive for cocaine on the morning of admission. The patient was also seen by ORC every 2 weeks after being discharged from the CLC.
Imaging after cycle 6 showed decreased size of liver metastases, retroperitoneal lymph nodes, and pancreas mass. Cancer antigen 19-9 (CA19-9) tumor marker was reduced from 3513 U/mL pretreatment to 50 U/mL after cycle 7. Chemotherapy cycle 7 was delayed 6 days due to active cocaine and heroin use. A repeat urine was obtained several days later, which was negative for cocaine, and he was admitted for cycle 7 chemotherapy. Using this treatment approach of admissions for every cycle, the patient was able to receive 11 cycles of FOLFIRINOX with clinical benefit.
Palliative Care/Pain Management
Safely treating the patient’s malignant pain in the context of his OUD was critically important. In order to do this the palliative care team worked closely alongside ORC, is a multidisciplinary team consisting of health care providers (HCPs) from addiction psychiatry, internal medicine, health psychology and pharmacy who are consulted to evaluate veterans’ current opioid regimens and make recommendations to optimize both safety and efficacy. ORC followed this particular veteran as an outpatient and consulted on pain issues during his admission. They recommended the continuation of methadone at 120 mg daily and increased oral oxycodone to 30 mg every 6 hours, and then further increased to 45 mg every 6 hours. He continued to have increased pain despite higher doses of oxycodone, and pain medication was changed to oral hydromorphone 28 mg every 6 hours with the continuation of methadone. ORC and the palliative care team obtained consent from the veteran and a release of Information form signed by the patient to contact his community methadone clinic for further collaboration around pain management throughout the time caring for the veteran.
Even with improvement in disease based on imaging and tumor markers, opioid medications could not be decreased in this case. This is likely in part due to the multidimensional nature of pain. Careful assessment of the biologic, emotional, social, and spiritual contributors to pain is needed in the management of pain, especially at end of life.6 Nonpharmacologic pain management strategies used in this case included a transcutaneous electrical nerve stimulation unit, moist heat, celiac plexus block, and emotional support.
Psychosocial Issues/Substance Use
Psychosocial support for the patient was provided by the interdisciplinary palliative care team and the ORC team in both the inpatient and outpatient settings. Despite efforts from case management to get the veteran home services once discharged from the CLC, he declined repeatedly. Thus, the CLC social worker obtained a guardian alert for the veteran on discharge.
Close outpatient follow-up for medical and psychosocial support was very critical. When an outpatient, the veteran was scheduled for biweekly appointments with palliative care or ORC. When admitted to the hospital, the palliative care team medical director and psychologist conducted joint visits with him. Although he denied depressed mood and anxiety throughout his treatment, he often reflected on regrets that he had as he faced the end of his life. Specifically, he shared thoughts about being estranged from his surviving brother given his long struggle with substance use. Although he did not think a relationship was possible with his brother at the end of life, he still cared deeply for him and wanted to make him aware of his pancreatic cancer diagnosis. This was particularly important to him because their late brother had also died of pancreatic cancer. It was the patient’s wish at the end of his life to alert his surviving brother of his diagnosis so he and his children could get adequate screening throughout their lives. Although he had spoken of this desire often, it wasn’t until his disease progressed and he elected to transition to hospice that he felt ready to write the letter. The palliative care team assisted the veteran in writing and mailing a letter to his brother informing him of his diagnosis and transition to hospice as well as communicating that his brother and his family had been in his thoughts at the end of his life. The patient’s brother received this letter and with assistance from the CLC social worker made arrangements to visit the veteran at bedside at the inpatient CLC hospice unit the final days of his life.
Discussion
There are very little data on the safety of cancer-directed therapy in patients with active SUD. The limited studies that have been done showed conflicting results.
A retrospective study among women with co-occurring SUD and locally advanced cervical cancer who were undergoing primary radiation therapy found that SUD was not associated with a difference in toxicity or survival outcomes.7 However, other research suggests that SUD may be associated with an increase in all-cause mortality as well as other adverse outcomes for patients and health care systems (eg, emergency department visits, hospitalizations).8 A retrospective study of patients with a history of SUD and nonsmall cell lung cancer showed that these patients had higher rates of depression, less family support, increased rates of missed appointments, more emergency department visits and more hospitalizations.9 Patients with chronic myeloid leukemia or myelodysplastic syndromes who had long-term cocaine use had a 6-fold increased risk of death, which was not found in patients who had long-term alcohol or marijuana use.2
The limited data highlight the need for careful consideration of ways to mitigate potentially adverse outcomes in this population while still providing clinically indicated cancer treatment. Integrated VA health care systems provide unique resources that can maximize veteran safety during cancer treatment. Utilization of VA resources and close interdisciplinary collaboration across VA HCPs can help to ensure equitable access to state-of-the-art cancer therapies for veterans with comorbid SUD.
VA Services for Patients With Comorbidities
This case highlights several distinct aspects of VA health care that make it possible to safely treat individuals with complex comorbidities. One important aspect of this was collaboration with the CLC to admit the veteran for his initial treatment after a positive cocaine test. CLC admission was nonpunitive and allowed ongoing involvement in the VA community. This provided an essential, safe, and structured environment in which 6 cycles of chemotherapy could be delivered.
Although the patient left the CLC after 2 months due to floor restrictions negatively impacting his quality of life and ability to spend time with close friends, several important events occurred during this stay. First, the patient established close relationships with the CLC staff and the palliative care team; both groups followed him throughout his inpatient and outpatient care. These relationships proved essential throughout his care as they were the foundation of difficult conversations about substance use, treatment adherence, and eventually, transition to hospice.
In addition, the opportunity to administer 6 cycles of chemotherapy at the CLC was enough to lead to clinical benefit and radiographic response to treatment. Clinical benefits while in the CLC included maintenance of a good appetite, 15-lb weight gain and preserved performance status (ECOG [Eastern Cooperative Group]-1), which allowed him to actively participate in multiple social and recreational activities while in the CLC. From early conversations, this patient was clear that he wanted treatment as long as his life could be prolonged with good quality of life. Having evidence of the benefit of treatment, at least initially, increased the patient’s confidence in treatment. There were a few conversations when the challenges of treatment mounted (eg, pain, needs for abstinence from cocaine prior to admission for chemotherapy, frequent doctor appointments), and the patient would remind himself of these data to recommit himself to treatment. The opportunity to admit him to the inpatient VA facility, including bed availability for 3 days during his treatment once he left the CLC was important. This plan to admit the patient following a negative urine toxicology test for cocaine was made collaboratively with the veteran and the oncology and palliative care teams. The plan allowed the patient to achieve his treatment goals while maintaining his safety and reducing theoretical cardiac toxicities with his cancer treatment.
Finally, the availability of a multidisciplinary team approach including palliative care, oncology, psychology, addiction medicine and addiction psychiatry, was critical for addressing the veteran’s malignant pain. Palliative care worked in close collaboration with the ORC to prescribe and renew pain medications. ORC offered ongoing consultation on pain management in the context of OUD. As the veteran’s cancer progressed and functional decline prohibited his daily attendance at the community methadone clinic, palliative care and ORC met with the methadone clinic to arrange a less frequent methadone pickup schedule (the patient previously needed daily pickup). Non-VA settings may not have access to these resources to safely treat the biopsychosocial issues that arise in complex cases.
Substance Use and Cancer Treatments
This case raises several critical questions for oncologic care. Cocaine and fluorouracil are both associated with cardiotoxicity, and many oncologists would not feel it is safe to administer a regimen containing fluorouracil to a patient with active cocaine use. The National Comprehensive Cancer Network (NCCN) panel recommends FOLFIRINOX as a preferred category 1 recommendation for first-line treatment of patients with advanced pancreas cancer with good performance status.10 This recommendation is based on the PRODIGE trial, which has shown improved overall survival (OS): 11.1 vs 6.8 months for patients who received single-agent gemcitabine.11 If patients are not candidates for FOLFIRINOX and have good performance status, the NCCN recommends gemcitabine plus albumin-bound paclitaxel with category 1 level of evidence based on the IMPACT trial, which showed improvement in OS (8.7 vs 6.6 months compared with single-agent gemcitabine).12
Some oncologists may have additional concerns administering fluorouracil treatment alternatives (such as gemcitabine and albumin-bound paclitaxel) to individuals with active SUD because of concerns about altered mental status impacting the ability to report important adverse effects. In the absence of sufficient data, HCPs must determine whether they feel it is safe to administer these agents in individuals with active cocaine use. However, denying these patients the possible benefits of standard-of-care life-prolonging therapies without established data raises concerns regarding the ethics of such practices. There is concern that the stigma surrounding cocaine use might contribute to withholding treatment, while treatment is continued for individuals taking prescribed stimulant medications that also have cardiotoxicity risks. VA health care facilities are uniquely situated to use all available resources to address these issues using interprofessional patient-centered care and determine the most optimal treatment based on a risk/benefit discussion between the patient and the HCP.
Similarly, this case also raised questions among HCPs about the safety of using an indwelling port for treatment in a patient with SUD. In the current case there was concern about keeping in a port for a patient with a history of IV drug use; therefore, a PICC line was initiated and removed at each admission. Without guidelines in these situations, HCPs are left to weigh the risks and benefits of using a port or a PICC for individuals with recent or current substance use without formal data, which can lead to inconsistent access to care. More guidance is needed for these situations.
SUD Screening
This case begs the question of whether oncologists are adequately screening for a range of SUDs, and when they encounter an issue, how they are addressing it. Many oncologists do not receive adequate training on assessment of current or recent substance use. There are health care and systems-level practices that may increase patient safety for individuals with ongoing substance use who are undergoing cancer treatment. Training on obtaining appropriate substance use histories, motivational interviewing to resolve ambivalence about substance use in the direction of change, and shared decision making about treatment options could increase confidence in understanding and addressing substance use issues. It is also important to educate oncologists on how to address patients who return to or continued substance use during treatment. In this case the collaboration from palliative care, psychology, addiction medicine, and addiction psychiatry through the ORC was essential in assisting with ongoing assessment of substance use, guiding difficult conversations about the impact of substance use on the treatment plan, and identifying risk-mitigation strategies. Close collaboration and full utilization of all VA resources allowed this patient to receive first-line treatment for pancreatic cancer in order to reach his goal of prolonging his life while maintaining acceptable quality of life. Table 2 provides best practices for management of patients with comorbid SUD and cancer.
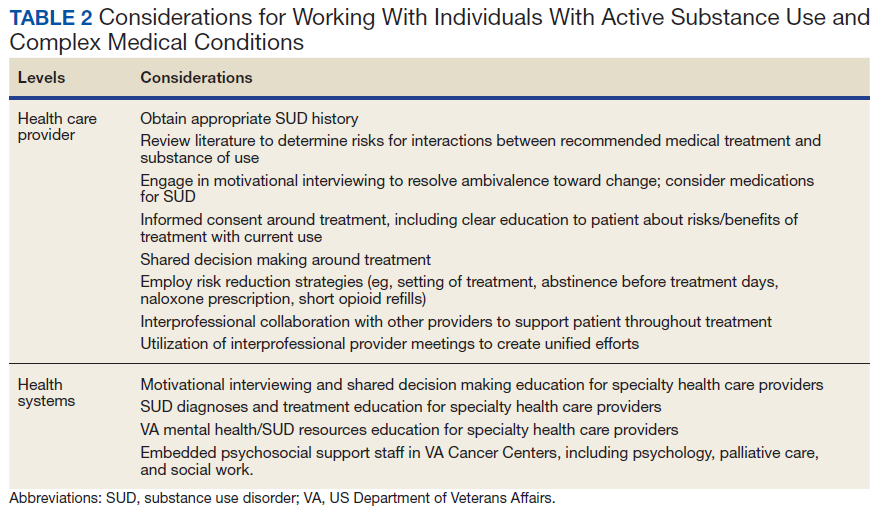
More research is needed into cancer treatment for patients with SUD, especially in the current era of cancer care using novel cancer treatments leading to significantly improved survival in many cancer types. Ideally, oncologists should be routinely or consistently screening patients for substance use, including alcohol. The patient should participate in this decision-making process after being educated about the risks and benefits. These patients can be followed using a multimodal approach to increase their rates of success and improve their quality of life. Although the literature is limited and no formal guidelines are available, VA oncologists are fortunate to have a range of resources available to them to navigate these difficult cases. Veterans have elevated rates of SUD, making this a critical issue to consider in the VA.13 It is the hope that this case can highlight how to take advantage of the many VA resources in order to ensure equitable cancer care for all veterans.
Conclusions
This case demonstrates that cancer-directed treatment is safe and feasible in a patient with advanced pancreatic cancer and coexisting active SUD by using a multidisciplinary approach. The multidisciplinary team included palliative care, oncology, psychology, addiction medicine, and addiction psychiatry. Critical steps for a successful outcome include gathering history about SUD; motivational interviewing to resolve ambivalence about treatment for SUD; shared decision making about cancer treatment; and risk-reduction strategies in pain and SUD management.
Treatment advancements in many cancer types have led to significantly longer survival, and it is critical to develop safe protocols to treat patients with active SUD so they also can derive benefit from these very significant medical advancements.
Acknowledgments
Michal Rose, MD, Director of VACHS Cancer Center, and Chandrika Kumar, MD, Director of VACHS Community Living Center, for their collaboration in care for this veteran.
1. Chang G, Meadows ME, Jones JA, Antin JH, Orav EJ. Substance use and survival after treatment for chronic myelogenous leukemia (CML) or myelodysplastic syndrome (MDS). Am J Drug Alcohol Ab. 2010;36(1):1-6. doi:10.3109/00952990903490758
2. Stagno S, Busby K, Shapiro A, Kotz M. Patients at risk: addressing addiction in patients undergoing hematopoietic SCT. Bone Marrow Transplant. 2008;42(4):221-226. doi:10.1038/bmt.2008.211
3. Arora NP. Cutaneous vasculopathy and neutropenia associated with levamisole-adulterated cocaine. Am J Med Sci. 2013;345(1):45-51. doi:10.1097/MAJ.0b013e31825b2b50
4. Schwartz BG, Rezkalla S, Kloner RA. Cardiovascular effects of cocaine. Circulation. 2010;122(24):2558-2569. doi:10.1161/CIRCULATIONAHA.110.940569
5. US Department of Veterans Affairs, US Department of Defense. VA/DoD clinical practice guideline for the management of substance use disorders. Published 2015. Accessed July 8, 2021. https://www.healthquality.va.gov/guidelines/MH/sud/VADODSUDCPGRevised22216.pdf
6. Mehta A, Chan LS. Understanding of the concept of “total pain”: a prerequisite for pain control. J Hosp Palliat Nurs. 2008;10(1):26-32. doi:10.1097/01.NJH.0000306714.50539.1a
7. Rubinsak LA, Terplan M, Martin CE, Fields EC, McGuire WP, Temkin SM. Co-occurring substance use disorder: The impact on treatment adherence in women with locally advanced cervical cancer. Gynecol Oncol Rep. 2019;28:116-119. Published 2019 Mar 27. doi:10.1016/j.gore.2019.03.016
8. Chhatre S, Metzger DS, Malkowicz SB, Woody G, Jayadevappa R. Substance use disorder and its effects on outcomes in men with advanced-stage prostate cancer. Cancer. 2014;120(21):3338-3345. doi:10.1002/cncr.28861
9. Concannon K, Thayer JH, Hicks R, et al. Outcomes among patients with a history of substance abuse in non-small cell lung cancer: a county hospital experience. J Clin Onc. 2019;37(15)(suppl):e20031-e20031. doi:10.1200/JCO.2019.37.15
10. National Comprehensive Cancer Network. NCCN clinical practice guidelines in oncology: pancreatic adenocarcinoma. Version 2.2021. Updated February 25, 2021. Accessed July 8, 2021. https://www.nccn.org/professionals/physician_gls/pdf/pancreatic.pdf
11. Conroy T, Desseigne F, Ychou M, et al. FOLFIRINOX versus gemcitabine for metastatic pancreatic cancer. N Engl J Med. 2011;364(19):1817-1825. doi:10.1056/NEJMoa1011923
12. Von Hoff DD, Ervin T, Arena FP, et al. Increased survival in pancreatic cancer with nab-paclitaxel plus gemcitabine. N Engl J Med. 2013;369(18):1691-1703. doi:10.1056/NEJMoa1304369
13. Seal KH, Cohen G, Waldrop A, Cohen BE, Maguen S, Ren L. Substance use disorders in Iraq and Afghanistan veterans in VA healthcare, 2001-2010: Implications for screening, diagnosis and treatment. Drug Alcohol Depend. 2011;116(1-3):93-101. doi:10.1016/j.drugalcdep.2010.11.027
14. American Psychiatric Association. Diagnostic and Statistical Manual of Mental Disorders, 5th ed. American Psychiatric Association; 2013.
A multidisciplinary approach provided safe and feasible cancer treatment in a patient with advanced pancreatic cancer and coexisting active substance use disorder.
A multidisciplinary approach provided safe and feasible cancer treatment in a patient with advanced pancreatic cancer and coexisting active substance use disorder.
Substance use disorders (SUDs) are an important but understudied aspect of treating patients diagnosed with cancer. Substance use can affect cancer treatment outcomes, including morbidity and mortality.1,2 Additionally, patients with cancer and SUD may have unique psychosocial needs that require close attention and management. There is a paucity of data regarding the best approach to treating such patients. For example, cocaine use may increase the cardiovascular and hematologic risk of some traditional chemotherapy agents.3,4 Newer targeted agents and immunotherapies remain understudied with respect to SUD risk.
Although the US Department of Veterans Affairs (VA) has established helpful clinical practice guidelines for the treatment of SUD, there are no guidelines for treating patients with SUD and cancer.5 Clinicians have limited confidence in treatment approach, and treatment is inconsistent among oncologists nationwide even within the same practice. Furthermore, it can be challenging to safely prescribe opioids for cancer-related pain in individuals with SUD. There is a high risk of SUD and mental health disorders in veterans, making this population particularly vulnerable. We report a case of a male with metastatic pancreatic cancer, severe opioid use disorder (OUD) and moderate cocaine use disorder (CUD) who received pain management and cancer treatment under the direction of a multidisciplinary team approach.
Case Report
A 63-year-old male with a medical history of HIV treated with highly active antiretroviral therapy (HAART), compensated cirrhosis, severe OUD, moderate CUD, and sedative use disorder in sustained remission was admitted to the West Haven campus of the VA Connecticut Healthcare System (VACHS) with abdominal pain, weight loss and fatigue. He used heroin 1 month prior to his admission and reported regular cocaine and marijuana use (Table 1). He was diagnosed with HIV in 1989, and his medical history included herpes zoster and oral candidiasis but no other opportunistic infections. Several months prior to this admission, he had an undetectable viral load and CD4 count of 688.
At the time of this admission, the patient was adherent to methadone treatment. He reported increased abdominal pain. Computed tomography (CT) showed a 2.4-cm mass in the pancreatic uncinate process, multiple liver metastases, retroperitoneal lymphadenopathy, and small lung nodules. A CT-guided liver biopsy showed adenocarcinoma consistent with a primary cancer of the pancreas. Given the complexity of the case, a multidisciplinary team approach was used to treat his cancer and the sequelae safely, including the oncology team, community living center team, palliative care team, and interprofessional opioid reassessment clinic team (ORC).
Cancer Treatment
Chemotherapy with FOLFIRINOX (leucovorin calcium, fluorouracil, irinotecan hydrochloride, and oxaliplatin) was recommended. The first cycle of treatment originally was planned for the outpatient setting, and a peripherally inserted central catheter (PICC) line was placed. However, after a urine toxicology test was positive for cocaine, the PICC line was removed due to concern for possible use of PICC line for nonprescribed substance use. The patient expressed suicidal ideation at the time and was admitted for psychiatric consult and pain control. Cycle 1 FOLFIRINOX was started during this admission. A PICC line was again put in place and then removed before discharge. A celiac plexus block was performed several days after this admission for pain control.
Given concern about cocaine use increasing the risk of cardiac toxicity with FOLFIRINOX treatment, treating providers sconsulted with the community living center (CLC) about possible admission for future chemotherapy administration and pain management. The CLC at VACHS has 38 beds for rehabilitation, long-term care, and hospice with the mission to restore each veteran to his or her highest level of well-being. After discussion with this patient and CLC staff, he agreed to a CLC admission. The patient agreed to remain in the facility, wear a secure care device, and not leave without staff accompaniment. He was able to obtain a 2-hour pass to pay bills and rent. During the 2 months he was admitted to the CLC he would present to the VACHS Cancer Center for chemotherapy every 2 weeks. He completed 6 cycles of chemotherapy while admitted. During the admission, he was transferred to active medical service for 2 days for fever and malaise, and then returned to the CLC. The patient elected to leave the CLC after 2 months as the inability to see close friends was interfering with his quality of life.
Upon being discharged from the CLC, shared decision making took place with the patient to establish a new treatment plan. In collaboration with the patient, a plan was made to admit him every 2 weeks for continued chemotherapy. A PICC line was placed on each day of admission and removed prior to discharge. It was also agreed that treatment would be delayed if a urine drug test was positive for cocaine on the morning of admission. The patient was also seen by ORC every 2 weeks after being discharged from the CLC.
Imaging after cycle 6 showed decreased size of liver metastases, retroperitoneal lymph nodes, and pancreas mass. Cancer antigen 19-9 (CA19-9) tumor marker was reduced from 3513 U/mL pretreatment to 50 U/mL after cycle 7. Chemotherapy cycle 7 was delayed 6 days due to active cocaine and heroin use. A repeat urine was obtained several days later, which was negative for cocaine, and he was admitted for cycle 7 chemotherapy. Using this treatment approach of admissions for every cycle, the patient was able to receive 11 cycles of FOLFIRINOX with clinical benefit.
Palliative Care/Pain Management
Safely treating the patient’s malignant pain in the context of his OUD was critically important. In order to do this the palliative care team worked closely alongside ORC, is a multidisciplinary team consisting of health care providers (HCPs) from addiction psychiatry, internal medicine, health psychology and pharmacy who are consulted to evaluate veterans’ current opioid regimens and make recommendations to optimize both safety and efficacy. ORC followed this particular veteran as an outpatient and consulted on pain issues during his admission. They recommended the continuation of methadone at 120 mg daily and increased oral oxycodone to 30 mg every 6 hours, and then further increased to 45 mg every 6 hours. He continued to have increased pain despite higher doses of oxycodone, and pain medication was changed to oral hydromorphone 28 mg every 6 hours with the continuation of methadone. ORC and the palliative care team obtained consent from the veteran and a release of Information form signed by the patient to contact his community methadone clinic for further collaboration around pain management throughout the time caring for the veteran.
Even with improvement in disease based on imaging and tumor markers, opioid medications could not be decreased in this case. This is likely in part due to the multidimensional nature of pain. Careful assessment of the biologic, emotional, social, and spiritual contributors to pain is needed in the management of pain, especially at end of life.6 Nonpharmacologic pain management strategies used in this case included a transcutaneous electrical nerve stimulation unit, moist heat, celiac plexus block, and emotional support.
Psychosocial Issues/Substance Use
Psychosocial support for the patient was provided by the interdisciplinary palliative care team and the ORC team in both the inpatient and outpatient settings. Despite efforts from case management to get the veteran home services once discharged from the CLC, he declined repeatedly. Thus, the CLC social worker obtained a guardian alert for the veteran on discharge.
Close outpatient follow-up for medical and psychosocial support was very critical. When an outpatient, the veteran was scheduled for biweekly appointments with palliative care or ORC. When admitted to the hospital, the palliative care team medical director and psychologist conducted joint visits with him. Although he denied depressed mood and anxiety throughout his treatment, he often reflected on regrets that he had as he faced the end of his life. Specifically, he shared thoughts about being estranged from his surviving brother given his long struggle with substance use. Although he did not think a relationship was possible with his brother at the end of life, he still cared deeply for him and wanted to make him aware of his pancreatic cancer diagnosis. This was particularly important to him because their late brother had also died of pancreatic cancer. It was the patient’s wish at the end of his life to alert his surviving brother of his diagnosis so he and his children could get adequate screening throughout their lives. Although he had spoken of this desire often, it wasn’t until his disease progressed and he elected to transition to hospice that he felt ready to write the letter. The palliative care team assisted the veteran in writing and mailing a letter to his brother informing him of his diagnosis and transition to hospice as well as communicating that his brother and his family had been in his thoughts at the end of his life. The patient’s brother received this letter and with assistance from the CLC social worker made arrangements to visit the veteran at bedside at the inpatient CLC hospice unit the final days of his life.
Discussion
There are very little data on the safety of cancer-directed therapy in patients with active SUD. The limited studies that have been done showed conflicting results.
A retrospective study among women with co-occurring SUD and locally advanced cervical cancer who were undergoing primary radiation therapy found that SUD was not associated with a difference in toxicity or survival outcomes.7 However, other research suggests that SUD may be associated with an increase in all-cause mortality as well as other adverse outcomes for patients and health care systems (eg, emergency department visits, hospitalizations).8 A retrospective study of patients with a history of SUD and nonsmall cell lung cancer showed that these patients had higher rates of depression, less family support, increased rates of missed appointments, more emergency department visits and more hospitalizations.9 Patients with chronic myeloid leukemia or myelodysplastic syndromes who had long-term cocaine use had a 6-fold increased risk of death, which was not found in patients who had long-term alcohol or marijuana use.2
The limited data highlight the need for careful consideration of ways to mitigate potentially adverse outcomes in this population while still providing clinically indicated cancer treatment. Integrated VA health care systems provide unique resources that can maximize veteran safety during cancer treatment. Utilization of VA resources and close interdisciplinary collaboration across VA HCPs can help to ensure equitable access to state-of-the-art cancer therapies for veterans with comorbid SUD.
VA Services for Patients With Comorbidities
This case highlights several distinct aspects of VA health care that make it possible to safely treat individuals with complex comorbidities. One important aspect of this was collaboration with the CLC to admit the veteran for his initial treatment after a positive cocaine test. CLC admission was nonpunitive and allowed ongoing involvement in the VA community. This provided an essential, safe, and structured environment in which 6 cycles of chemotherapy could be delivered.
Although the patient left the CLC after 2 months due to floor restrictions negatively impacting his quality of life and ability to spend time with close friends, several important events occurred during this stay. First, the patient established close relationships with the CLC staff and the palliative care team; both groups followed him throughout his inpatient and outpatient care. These relationships proved essential throughout his care as they were the foundation of difficult conversations about substance use, treatment adherence, and eventually, transition to hospice.
In addition, the opportunity to administer 6 cycles of chemotherapy at the CLC was enough to lead to clinical benefit and radiographic response to treatment. Clinical benefits while in the CLC included maintenance of a good appetite, 15-lb weight gain and preserved performance status (ECOG [Eastern Cooperative Group]-1), which allowed him to actively participate in multiple social and recreational activities while in the CLC. From early conversations, this patient was clear that he wanted treatment as long as his life could be prolonged with good quality of life. Having evidence of the benefit of treatment, at least initially, increased the patient’s confidence in treatment. There were a few conversations when the challenges of treatment mounted (eg, pain, needs for abstinence from cocaine prior to admission for chemotherapy, frequent doctor appointments), and the patient would remind himself of these data to recommit himself to treatment. The opportunity to admit him to the inpatient VA facility, including bed availability for 3 days during his treatment once he left the CLC was important. This plan to admit the patient following a negative urine toxicology test for cocaine was made collaboratively with the veteran and the oncology and palliative care teams. The plan allowed the patient to achieve his treatment goals while maintaining his safety and reducing theoretical cardiac toxicities with his cancer treatment.
Finally, the availability of a multidisciplinary team approach including palliative care, oncology, psychology, addiction medicine and addiction psychiatry, was critical for addressing the veteran’s malignant pain. Palliative care worked in close collaboration with the ORC to prescribe and renew pain medications. ORC offered ongoing consultation on pain management in the context of OUD. As the veteran’s cancer progressed and functional decline prohibited his daily attendance at the community methadone clinic, palliative care and ORC met with the methadone clinic to arrange a less frequent methadone pickup schedule (the patient previously needed daily pickup). Non-VA settings may not have access to these resources to safely treat the biopsychosocial issues that arise in complex cases.
Substance Use and Cancer Treatments
This case raises several critical questions for oncologic care. Cocaine and fluorouracil are both associated with cardiotoxicity, and many oncologists would not feel it is safe to administer a regimen containing fluorouracil to a patient with active cocaine use. The National Comprehensive Cancer Network (NCCN) panel recommends FOLFIRINOX as a preferred category 1 recommendation for first-line treatment of patients with advanced pancreas cancer with good performance status.10 This recommendation is based on the PRODIGE trial, which has shown improved overall survival (OS): 11.1 vs 6.8 months for patients who received single-agent gemcitabine.11 If patients are not candidates for FOLFIRINOX and have good performance status, the NCCN recommends gemcitabine plus albumin-bound paclitaxel with category 1 level of evidence based on the IMPACT trial, which showed improvement in OS (8.7 vs 6.6 months compared with single-agent gemcitabine).12
Some oncologists may have additional concerns administering fluorouracil treatment alternatives (such as gemcitabine and albumin-bound paclitaxel) to individuals with active SUD because of concerns about altered mental status impacting the ability to report important adverse effects. In the absence of sufficient data, HCPs must determine whether they feel it is safe to administer these agents in individuals with active cocaine use. However, denying these patients the possible benefits of standard-of-care life-prolonging therapies without established data raises concerns regarding the ethics of such practices. There is concern that the stigma surrounding cocaine use might contribute to withholding treatment, while treatment is continued for individuals taking prescribed stimulant medications that also have cardiotoxicity risks. VA health care facilities are uniquely situated to use all available resources to address these issues using interprofessional patient-centered care and determine the most optimal treatment based on a risk/benefit discussion between the patient and the HCP.
Similarly, this case also raised questions among HCPs about the safety of using an indwelling port for treatment in a patient with SUD. In the current case there was concern about keeping in a port for a patient with a history of IV drug use; therefore, a PICC line was initiated and removed at each admission. Without guidelines in these situations, HCPs are left to weigh the risks and benefits of using a port or a PICC for individuals with recent or current substance use without formal data, which can lead to inconsistent access to care. More guidance is needed for these situations.
SUD Screening
This case begs the question of whether oncologists are adequately screening for a range of SUDs, and when they encounter an issue, how they are addressing it. Many oncologists do not receive adequate training on assessment of current or recent substance use. There are health care and systems-level practices that may increase patient safety for individuals with ongoing substance use who are undergoing cancer treatment. Training on obtaining appropriate substance use histories, motivational interviewing to resolve ambivalence about substance use in the direction of change, and shared decision making about treatment options could increase confidence in understanding and addressing substance use issues. It is also important to educate oncologists on how to address patients who return to or continued substance use during treatment. In this case the collaboration from palliative care, psychology, addiction medicine, and addiction psychiatry through the ORC was essential in assisting with ongoing assessment of substance use, guiding difficult conversations about the impact of substance use on the treatment plan, and identifying risk-mitigation strategies. Close collaboration and full utilization of all VA resources allowed this patient to receive first-line treatment for pancreatic cancer in order to reach his goal of prolonging his life while maintaining acceptable quality of life. Table 2 provides best practices for management of patients with comorbid SUD and cancer.
More research is needed into cancer treatment for patients with SUD, especially in the current era of cancer care using novel cancer treatments leading to significantly improved survival in many cancer types. Ideally, oncologists should be routinely or consistently screening patients for substance use, including alcohol. The patient should participate in this decision-making process after being educated about the risks and benefits. These patients can be followed using a multimodal approach to increase their rates of success and improve their quality of life. Although the literature is limited and no formal guidelines are available, VA oncologists are fortunate to have a range of resources available to them to navigate these difficult cases. Veterans have elevated rates of SUD, making this a critical issue to consider in the VA.13 It is the hope that this case can highlight how to take advantage of the many VA resources in order to ensure equitable cancer care for all veterans.
Conclusions
This case demonstrates that cancer-directed treatment is safe and feasible in a patient with advanced pancreatic cancer and coexisting active SUD by using a multidisciplinary approach. The multidisciplinary team included palliative care, oncology, psychology, addiction medicine, and addiction psychiatry. Critical steps for a successful outcome include gathering history about SUD; motivational interviewing to resolve ambivalence about treatment for SUD; shared decision making about cancer treatment; and risk-reduction strategies in pain and SUD management.
Treatment advancements in many cancer types have led to significantly longer survival, and it is critical to develop safe protocols to treat patients with active SUD so they also can derive benefit from these very significant medical advancements.
Acknowledgments
Michal Rose, MD, Director of VACHS Cancer Center, and Chandrika Kumar, MD, Director of VACHS Community Living Center, for their collaboration in care for this veteran.
1. Chang G, Meadows ME, Jones JA, Antin JH, Orav EJ. Substance use and survival after treatment for chronic myelogenous leukemia (CML) or myelodysplastic syndrome (MDS). Am J Drug Alcohol Ab. 2010;36(1):1-6. doi:10.3109/00952990903490758
2. Stagno S, Busby K, Shapiro A, Kotz M. Patients at risk: addressing addiction in patients undergoing hematopoietic SCT. Bone Marrow Transplant. 2008;42(4):221-226. doi:10.1038/bmt.2008.211
3. Arora NP. Cutaneous vasculopathy and neutropenia associated with levamisole-adulterated cocaine. Am J Med Sci. 2013;345(1):45-51. doi:10.1097/MAJ.0b013e31825b2b50
4. Schwartz BG, Rezkalla S, Kloner RA. Cardiovascular effects of cocaine. Circulation. 2010;122(24):2558-2569. doi:10.1161/CIRCULATIONAHA.110.940569
5. US Department of Veterans Affairs, US Department of Defense. VA/DoD clinical practice guideline for the management of substance use disorders. Published 2015. Accessed July 8, 2021. https://www.healthquality.va.gov/guidelines/MH/sud/VADODSUDCPGRevised22216.pdf
6. Mehta A, Chan LS. Understanding of the concept of “total pain”: a prerequisite for pain control. J Hosp Palliat Nurs. 2008;10(1):26-32. doi:10.1097/01.NJH.0000306714.50539.1a
7. Rubinsak LA, Terplan M, Martin CE, Fields EC, McGuire WP, Temkin SM. Co-occurring substance use disorder: The impact on treatment adherence in women with locally advanced cervical cancer. Gynecol Oncol Rep. 2019;28:116-119. Published 2019 Mar 27. doi:10.1016/j.gore.2019.03.016
8. Chhatre S, Metzger DS, Malkowicz SB, Woody G, Jayadevappa R. Substance use disorder and its effects on outcomes in men with advanced-stage prostate cancer. Cancer. 2014;120(21):3338-3345. doi:10.1002/cncr.28861
9. Concannon K, Thayer JH, Hicks R, et al. Outcomes among patients with a history of substance abuse in non-small cell lung cancer: a county hospital experience. J Clin Onc. 2019;37(15)(suppl):e20031-e20031. doi:10.1200/JCO.2019.37.15
10. National Comprehensive Cancer Network. NCCN clinical practice guidelines in oncology: pancreatic adenocarcinoma. Version 2.2021. Updated February 25, 2021. Accessed July 8, 2021. https://www.nccn.org/professionals/physician_gls/pdf/pancreatic.pdf
11. Conroy T, Desseigne F, Ychou M, et al. FOLFIRINOX versus gemcitabine for metastatic pancreatic cancer. N Engl J Med. 2011;364(19):1817-1825. doi:10.1056/NEJMoa1011923
12. Von Hoff DD, Ervin T, Arena FP, et al. Increased survival in pancreatic cancer with nab-paclitaxel plus gemcitabine. N Engl J Med. 2013;369(18):1691-1703. doi:10.1056/NEJMoa1304369
13. Seal KH, Cohen G, Waldrop A, Cohen BE, Maguen S, Ren L. Substance use disorders in Iraq and Afghanistan veterans in VA healthcare, 2001-2010: Implications for screening, diagnosis and treatment. Drug Alcohol Depend. 2011;116(1-3):93-101. doi:10.1016/j.drugalcdep.2010.11.027
14. American Psychiatric Association. Diagnostic and Statistical Manual of Mental Disorders, 5th ed. American Psychiatric Association; 2013.
Safe Transitions and Congregate Living in the Age of COVID-19: A Retrospective Cohort Study
The COVID-19 outbreak in February 2020 at a congregate living facility near Seattle, Washington, signaled the beginning of the pandemic in the United States. In that facility, infected residents had a 54.5% hospitalization rate and 33.7% case-fatality rate.1 Similar to the experience in Washington, all congregate living facilities have proved particularly vulnerable to the effects of COVID-19,2-7 with residents at increased risk for disease severity and mortality.2-7
Due to the COVID-19 emergency, NorthShore University HealthSystem (NUHS), a multihospital, integrated health system in northern Illinois, established a best practice for appropriate use of congregate living facilities after hospitalization. This focused on the safety of discharged patients and mitigation of COVID-19 by putting in place a referral process to a newly established congregate living review committee (CLRC) for review prior to discharge. Although all discharges to congregate living settings are at high risk,2 new placements to skilled nursing facilities (SNFs) were the primary focus of the committee and the sole focus of this study. In this study, we sought to determine whether establishment of the CLRC was associated with a reduction in SNF utilization, whether this was safe and efficient, and whether it was associated with a reduction in COVID-19 incidence in the 30 days following discharge.
METHODS
Setting and Case Review Intervention
We conducted a retrospective cohort study for patients hospitalized within NUHS from March 19, 2019 to July 16, 2020, designed as an interrupted time series. The study was approved by the NUHS Institutional Review Board (EH21-022).
The study exposure was creation of a referral and review process for all patients with expected discharge to a SNF and was implemented as part of usual discharge planning during the COVID-19 pandemic. The key intervention was to establish a multidisciplinary committee, the CLRC, to review all potential discharges to SNFs. The CLRC had dual goals of preventing COVID-19 spread in facilities by limiting placement of new residents and protecting a vulnerable population from a setting that conferred a higher risk of acquiring COVID-19. The CLRC was organized as a multidisciplinary committee with physicians, case managers, social workers, physical therapists, occupational therapists, and the director of NUHS home health agency. Physician members were evenly split as half hospitalists and half ambulatory physicians. The CLRC review was initiated by a patient’s assigned case manager or social worker by consult through a referral in the electronic medical record (EMR). Each case was summarized and then presented to the full CLRC. The CLRC met for 1 hour per day, 6 days per week, to review all planned discharges that met criteria for review. A committee physician chaired each meeting. Three other members were needed for a quorum, with one other member with a title of director or higher. Time required was the 1-hour daily meeting, as well as one full-time position for case review, preparation, and program administration. The case presentation included a clinical summary of the hospitalization as well as COVID-19 status and testing history, previous living situation, level of home support, functional level, psychosocial needs, barrier(s) to discharging home, and long-term residential plans. A structured assessment was then made by each CLRC member in accordance with their professional expertise. Unanimous consensus would be reached before finalizing any recommended adjustments to the discharge, which would be communicated to the inpatient care team via a structured note within the EMR, along with direct communication to the assigned case manager or social worker. When the CLRC suggested adjustments to the discharge, they would work with the assigned case manager or social worker to communicate an appropriate post–acute care plan with the patient or appropriate representative. If there was disagreement or the recommendations could not be followed, the case manager or social worker would place a new referral with additional information for reconsideration. Following a recommendation for SNF, verification would be completed by the CLRC prior to discharge. This process is detailed in Figure 1.
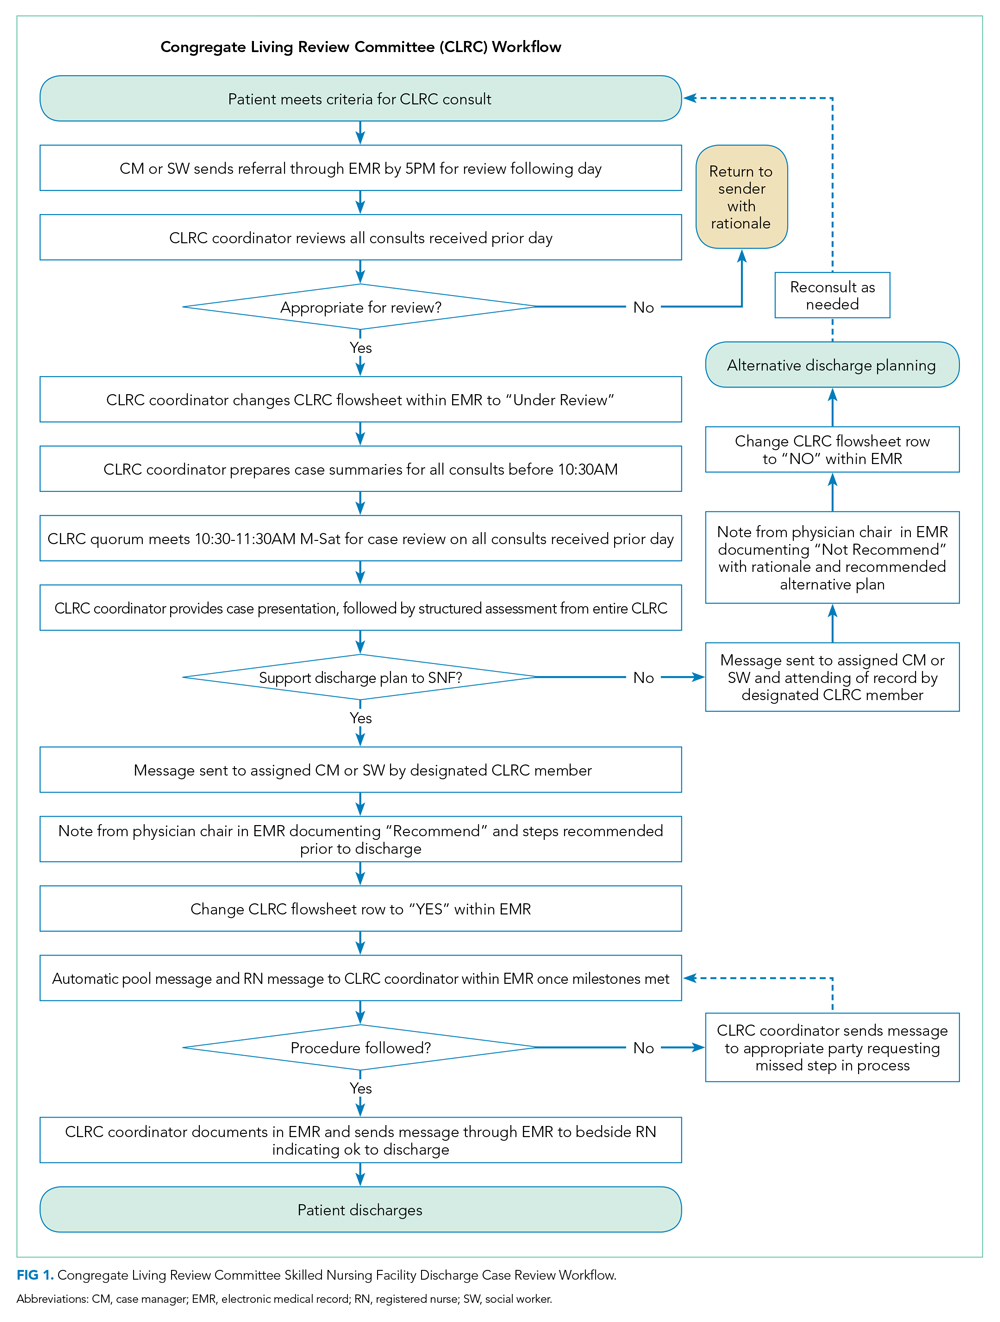
Patient Population
Inclusion criteria for the study were: (1) inpatient hospitalization and (2) eligibility for risk scoring via the organization’s clinical analytics prediction engine (CAPE).8 CAPE is a validated predictive model that includes risk of readmission, in-hospital mortality, and out-of-hospital mortality,8 with extensive adoption at NUHS. CAPE score eligibility was used as an inclusion criterion so that CAPE could be applied for derivation of a matched control. CAPE eligibility criteria include admission age of at least 18 years and that hospitalization is not psychiatric, rehabilitative, or obstetric. Patients must not be enrolled in hospice and must be discharged alive.
Exclusions were patients who tested positive for SARS-CoV-2 prior to or during index hospitalization. Excluding COVID-19 patients from the analysis eliminated a confounder not present in the preintervention group.
For patients with multiple inpatient admissions, the first admission was the only admission used for analysis. Additionally, if a patient had an admission that occurred in both the preintervention and postintervention periods, they were included only in the postintervention period. This was done to avoid any within-subject correlation and ensure unique patients in each group. Confounding from this approach was mitigated through the process of deriving a matched control.
Outcomes Measurement
The primary outcome of interest was total discharges to SNF across NUHS facilities after hospital admission. Patients were identified as discharging to a SNF if discharge destination codes 03, 64, or 83 appeared on the hospital bill. Additionally, new discharges to SNFs were assessed and identified if documentation indicated that the patient’s living arrangement prior to admission was not a SNF but discharge billing destination codes 03, 64, or 83 appeared on the hospital bill.
Secondary outcomes were measurement of readmissions, days to readmission, and median length of stay (LOS). Readmissions and LOS were balancing measures for the primary outcome, with readmissions measured to evaluate the safety of the CLRC process and LOS measured to evaluate its efficiency. A readmission was any patient who had an unplanned inpatient admission at an NUHS facility within 30 days after an index admission. LOS was measured in days from arrival on a hospital unit to time of discharge.
Additional analysis was done to estimate the effect of the intervention on the incidence of COVID-19 in the 30 days following discharge by comparing the observed to expected incidence of COVID-19 by discharge destination. The expected values were derived by estimating COVID-19 cases that would have been expected to occur with rates of preintervention SNF utilization. This was accomplished by multiplying the observed incidence of COVID-19 in the 30 days following discharge by the number of patients who were discharged to SNFs or home/other in the preintervention period. This expected value was then compared with the observed values to estimate the effect size of the intervention on COVID-19 incidence following discharge. This method of deriving an expected value from the observed incidence was utilized because the preintervention period was before COVID-19 was widespread in the community. It was therefore not possible to directly measure COVID-19 incidence in the preintervention period.
Data Source
Data were retrieved from the NUHS Enterprise Data Warehouse, NUHS’s central data repository, which contains a nightly upload of clinical and financial data from the EMR. Data were collected between March 19, 2019, and July 16, 2020.
The preintervention period was defined as March 19, 2019, to March 18, 2020. Data from that interval were compared with the postintervention period, which was from March 19, 2020, to July 16, 2020. The preintervention period, 1 year immediately prior to the intervention, was chosen to limit any effect of temporal trends while also providing a large sample size. The postintervention period began on the first day NUHS implemented the revised approach to SNF use and ended on the last day before the review process was modified.
Data Analysis
An interrupted time series was used to measure the impact of adoption of the CLRC protocol. A matched control was derived from the preintervention population. To derive this matched control, there was an assessment of covariates in the preintervention and postintervention groups using a standardized mean difference (SMD)9 that indicated an imbalance (SMD ≥ 0.1) in some covariates. A propensity score–matching technique10 was applied to address this imbalance and lack of randomization.
The candidate variables for propensity matching were chosen if they had an association with 30-day readmission. Readmission was chosen to find candidate variables because, of the possible outcomes, this was the only one that was not directly impacted by any CLRC decision. Each covariate was assessed using a logistic regression model while controlling for the postintervention group. If there was an association between a covariate and the outcome, it was chosen for propensity matching. Propensity scores were calculated using a logistic regression model with the treatment (1/0) variable as the dependent variable and the chosen covariates as predictors.
There were no indications of strong multicollinearity. The propensity scores generated were then used to derive a matched control using paired matching. MatchIt package in R (R Foundation for Statistical Computing) was used to create a matched dataset with a logit distance and standard caliper of 0.2 times the standard deviations of the logit of the propensity score. If a match was not found within the caliper, the nearest available match was used.
Regression adjustment11 was then performed using multivariate linear/logistic regression with LOS, readmission rate, days to readmission, total SNF discharges, and new SNF discharges as the outcomes. Treatment (1/0) variable and propensity score were used as the predictors. The adjusted coefficients or odds ratios (ORs) of the intervention variable were thus derived, and their associated P values were used to assess the impact of the intervention on the respective outcomes.
RESULTS
The unmatched preintervention population included 14,468 patients, with 4424 patients in the postintervention population. A matched population was derived and, after matching, the population sizes for pre and post intervention were 4424 each. In the matched population, all measured preintervention characteristics had SMDs and P values that were statistically equivalent. Patient characteristics for the unmatched and matched populations are detailed in Table 1.
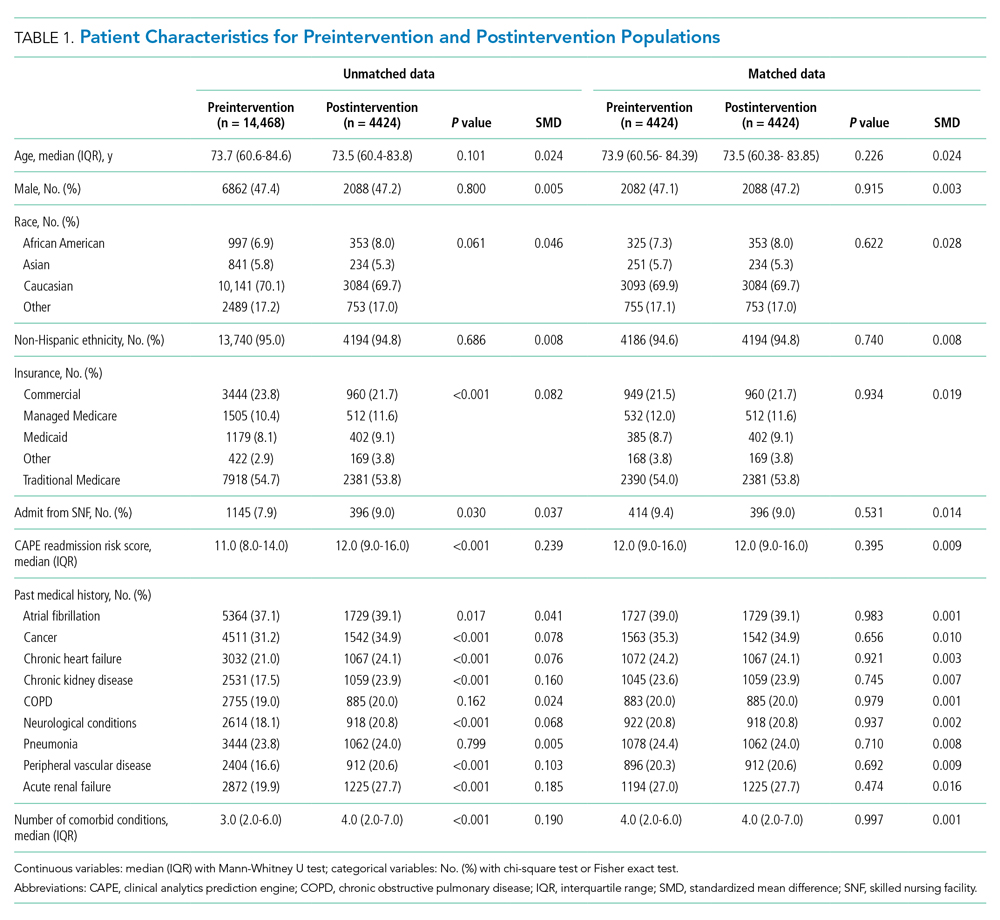
During the preintervention period, 1130 (25.5%) patients were discharged to a SNF, with 776 (17.5%) patients being new SNF discharges. In the postintervention period, 568 (12.8%) patients were discharged to a SNF, with 257 (5.8%) patients being new SNF discharges. Total SNF discharges postintervention saw a 49.7% relative reduction (OR, 0.42; 95% CI, 0.38-0.47), while new SNF discharges saw a 66.9% relative reduction (OR, 0.29; 95% CI, 0.25-0.34). These results for both total and new SNF discharges were statistically significant, with P values of <.001, respectively.
Readmissions in the preintervention period were 529 (12.0%) patients, compared with 559 (12.6%) patients in the postintervention period (OR, 1.06; 95% CI, 0.93-1.20; P =.406). An OR was also calculated for readmissions, adjusting for discharge disposition, to account for changes observed in SNF use in the postintervention period. This OR was 1.11 (95% CI, 0.97-1.26; P = .131). Days to readmission in the preintervention and postintervention groups were 11.0 days and 12.0 days, respectively (OR, 0.41; 95% CI, –0.61 to 1.43; P = .429).
LOS was 3.61 days in the preintervention group and 3.64 days in the postintervention group, with an interquartile range (IQR) of 2.14 to 5.69 days in the preintervention group and 2.08 to 5.95 in the postintervention group (OR, 0.09; 95% CI, –0.09 to 0.27; P =.316). These results are summarized in Table 2. 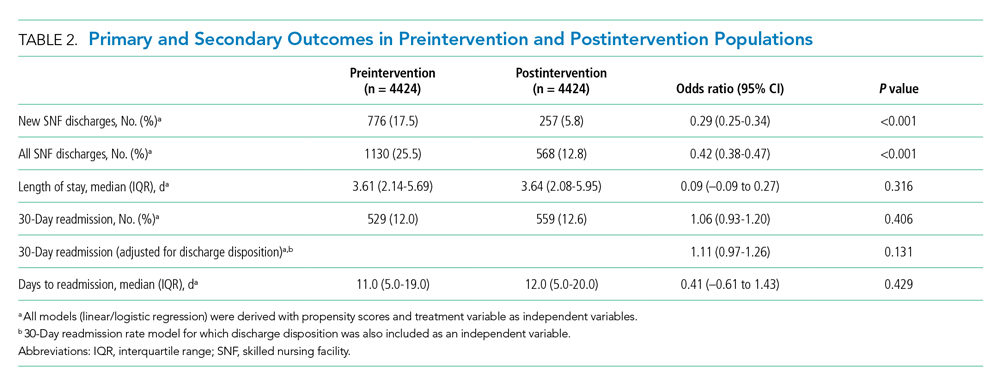
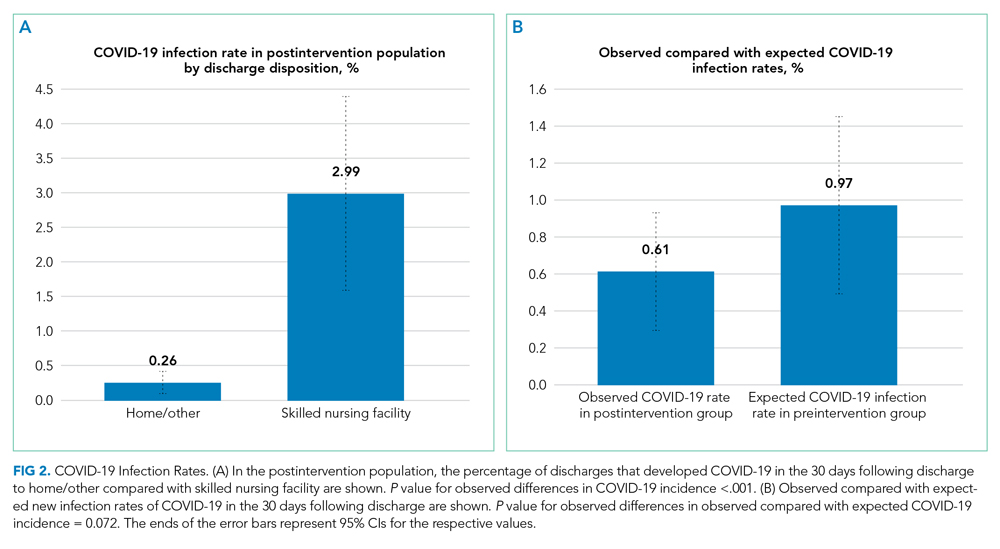
DISCUSSION
A COVID-19 outbreak in a SNF presents a grave risk to residents and patients discharged to these facilities. It is critical for healthcare systems to do the utmost to protect the health of this vulnerable population and the public in efforts to limit COVID-19 within SNFs.12-14
In this study, we observed that at NUHS, establishing a multidisciplinary review committee, the CLRC, to assess the appropriateness of discharge to a SNF after hospitalization resulted in a nearly 50% reduction in total SNF discharges and a greater than two-thirds reduction in new SNF discharges, without any increase in LOS or readmissions. Additionally, it was observed that discharging to settings other than a SNF greatly reduced a patient’s risk of being diagnosed with COVID-19 within 30 days, a result that reached statistical significance. Based on the observed 37.2% relative reduction in COVID-19 cases, we estimate that there may have been one COVID-19 infection prevented every 5.6 days from this intervention. Based on published COVID-19 mortality rates for SNF residents,1 the intervention may have prevented one death every 2.6 weeks. Beyond the risk of COVID-19, other benefits of reducing SNF use are patient and family well-being. Although not measured in this study, others have published about the significant psychological burdens placed on SNF residents, who were at high risk for social isolation, anxiety, and depression during the COVID-19 pandemic2,15-19 Family members also may have had increased stress, as they were deprived of the opportunity to visit loved ones, advocate for them, and help maintain their identity, humanity, and quality of life.20
Although other hospitals have established a structured approach to reduce COVID-19 in SNFs,21 to the best of the authors’ knowledge, the approach described in this article is a unique response to the COVID-19 pandemic. As we have demonstrated, it is highly effective and safe and likely prevented many COVID-19 cases and deaths.
Furthermore, a review committee, such as the one we have described, has value well beyond the COVID-19 pandemic. The health and affordability of care for patients, provider success in value-based care models, and the long-term sustainability of the US healthcare system require close attention to appropriate use of expensive services and to ensuring that their use creates high value. SNF use after a hospitalization is one such service that is frequently targeted and thought to contribute to a substantial portion of wasteful medical spending.22,23 Additionally, SNFs are known to be high risk for communicable disease outbreaks other than COVID-19,24,25 as well as a high-risk environment for many other preventable adverse events.25,26 This review committee ultimately serves to help determine the most appropriate postacute setting for patients being discharged with a determination made through considerations for patient safety, rehabilitation potential, and mental and physical well-being. From a population health perspective, this can lead to better outcomes and lower costs.22,23 Therefore, although the risks of COVID-19 infection in SNFs are expected to subside, the work of evaluating appropriate use of SNFs after hospitalization at our institution continues. The broader focus now extends beyond postacute level of service toward ensuring a high-value discharge that results in both appropriate resource use and safe patient care transitions.
Limitations of this study include its retrospective nature, results from a single center, and a number of potentially unmeasured confounders that the COVID-19 pandemic created. One possible confounder is that the reduction in SNF use we observed was a temporal trend related to changing preferences. In addressing this, we reviewed Medicare claims data from the US Department of Health and Human Services in April 2020 and July 2020 compared with the same period in 2019. These data demonstrated only a modest reduction in spending on SNFs in April 2020 that was smaller than the reduction seen in Part A inpatient hospital spending during that same month.27 By July 2020, the spending from Medicare on SNFs exceeded the levels seen in 2019,27 suggesting that the percentage of acute care admissions discharging to SNFs was no lower for Medicare patients in response to COVD-19. We also considered more stringent SNF admission standards as another potential confounder; however, this was not seen at the SNFs in the NUHS geography, where the referral process became less stringent because of COVID-19 waivers for a qualifying stay or skilled need from the Centers for Medicare and Medicaid Services. We were also not able to account for readmissions outside of NUHS, and therefore there may have been differences in the readmission rate that were unmeasured. To address this limitation, we reviewed a data extract from the Illinois Health and Hospital Association and found that the percentage of patients who returned for readmission to a NUHS facility in the year prior to the intervention and during the intervention period were 92.8% and 95.3%, respectively. From this we concluded the unmeasured readmission rate appears to be low, stable, and unlikely to have altered the results of this study. Additionally, when calculating potential COVID-19 cases avoided, the expected number was, by necessity, derived from the observed outcome, given the absence of COVID-19 in the preintervention population. This may have introduced unmeasured confounders, limiting the ability to precisely measure the effect size or draw conclusions on causation. Finally, there may be limitations to the generalizability of these results based on the payor mix of the population at NUHS, which is predominantly insured through Medicare or commercial payors.
CONCLUSION
We believe this model is replicable and the results generalizable and could serve as both a template for reducing the risks of COVID-19 in SNFs and as part of a larger infection-control strategy to mitigate disease spread in vulnerable populations. It could also be applied as a component of value-improvement programs to foster appropriate use of postacute services after an acute care hospitalization, ensuring safe transitions of care through promotion of high-value care practices.
Acknowledgment
The authors thank Wei Ning Chi for editorial assistance.
1. McMichael TM, Currie DW, Clark S, et al. Epidemiology of Covid-19 in a long-term care facility in King County, Washington. N Engl J Med. 2020;382(21):2005-2011. https://doi.org/10.1056/NEJMoa2005412
2. Ouslander JG, Grabowski DC. COVID-19 in nursing homes: calming the perfect storm. J Am Geriatr Soc. 2020;68(10):2153-2162. https://doi.org/10.1111/jgs.16784
3. CDC COVID-19 Response Team. Severe outcomes among patients with coronavirus disease 2019 (COVID-19) - United States, February 12-March 16, 2020. MMWR Morb Mortal Wkly Rep. 2020;69(12):343-346. https://doi.org/10.15585/mmwr.mm6912e2
4. Ko JY, Danielson ML, Town M, et al. Risk factors for coronavirus disease 2019 (COVID-19)-associated hospitalization: COVID-19-Associated Hospitalization Surveillance Network and Behavioral Risk Factor Surveillance System. Clin Infect Dis. 2020;72(11):e695-e703. https://doi.org/10.1093/cid/ciaa1419
5. Davidson PM, Szanton SL. Nursing homes and COVID-19: we can and should do better. J Clin Nurs. 2020;29(15-16):2758-2759. https://doi.org/10.1111/jocn.15297
6. Dosa D, Jump RLP, LaPlante K, Gravenstein S. Long-term care facilities and the coronavirus epidemic: practical guidelines for a population at highest risk. J Am Med Dir Assoc. 2020;21(5):569-571. https://doi.org/10.1016/j.jamda.2020.03.004
7. Fallon A, Dukelow T, Kennelly SP, O’Neill D. COVID-19 in nursing homes. QJM. 2020;113(6):391-392. https://doi.org/10.1093/qjmed/hcaa136
8. Shah N, Konchak C, Chertok D, et al. Clinical Analytics Prediction Engine (CAPE): development, electronic health record integration and prospective validation of hospital mortality, 180-day mortality and 30-day readmission risk prediction models. PLoS One. 2020;15(8):e0238065. https://doi.org/10.1371/journal.pone.0238065
9. Austin PC. Using the standardized difference to compare the prevalence of a binary variable between two groups in observational research. Commun Stat Simul Comput. 2009;38(6):1228-1234. https://doi.org/10.1080/03610910902859574
10. Rosenbaum PR, Rubin DB. Constructing a control group using multivariate matched sampling methods that incorporate the propensity score. Am Stat. 1985;39(1):33-38. https://doi.org/10.2307/2683903
11. Myers JA, Louis TA. Regression adjustment and stratification by propensity score in treatment effect estimation. Johns Hopkins University, Dept of Biostatistics Working Papers. 2010 203(Working Papers):1-27.
12. Lansbury LE, Brown CS, Nguyen-Van-Tam JS. Influenza in long-term care facilities. Influenza Other Respir Viruses. 2017;11(5):356-366. https://doi.org/10.1111/irv.12464
13. Sáez-López E, Marques R, Rodrigues N, et al. Lessons learned from a prolonged norovirus GII.P16-GII.4 Sydney 2012 variant outbreak in a long-term care facility in Portugal, 2017. Infect Control Hosp Epidemiol. 2019;40(10):1164-1169. https://doi.org/10.1017/ice.2019.201
14. Gaspard P, Mosnier A, Stoll-Keller F, Roth C, Larocca S, Bertrand X. Influenza prevention in nursing homes: great significance of seasonal variability and spatio-temporal pattern. Presse Med. 2015;44(10):e311-e319. https://doi.org/10.1016/j.lpm.2015.04.041
15. Pfefferbaum B, North CS. Mental health and the Covid-19 pandemic. N Engl J Med. 2020;383(6):510-512. https://doi.org/10.1056/NEJMp2008017
16. Galea S, Merchant RM, Lurie N. The mental health consequences of COVID-19 and physical distancing: the need for prevention and early intervention. JAMA Intern Med. 2020;180(6):817-818. https://doi.org/10.1001/jamainternmed.2020.1562
17. Armitage R, Nellums LB. COVID-19 and the consequences of isolating the elderly. Lancet Public Health. 2020;5(5):e256. https://doi.org/10.1016/s2468-2667(20)30061-x
18. El Haj M, Altintas E, Chapelet G, Kapogiannis D, Gallouj K. High depression and anxiety in people with Alzheimer’s disease living in retirement homes during the covid-19 crisis. Psychiatry Res. 2020;291:113294. https://doi.org/10.1016/j.psychres.2020.113294
19. Santini ZI, Jose PE, York Cornwell E, et al. Social disconnectedness, perceived isolation, and symptoms of depression and anxiety among older Americans (NSHAP): a longitudinal mediation analysis. Lancet Public Health. 2020;5(1):e62-e70. https://doi.org/10.1016/s2468-2667(19)30230-0
20. Gaugler JE, Anderson KA, Zarit SH, Pearlin LI. Family involvement in nursing homes: effects on stress and well-being. Aging Ment Health. 2004;8(1):65-75. https://doi.org/10.1080/13607860310001613356
21. Kim G, Wang M, Pan H, et al. A health system response to COVID-19 in long-term care and post-acute care: a three-phase approach. J Am Geriatr Soc. 2020;68(6):1155-1161. https://doi.org/10.1111/jgs.16513
22. McWilliams JM, Gilstrap LG, Stevenson DG, Chernew ME, Huskamp HA, Grabowski DC. Changes in postacute care in the Medicare Shared Savings Program. JAMA Intern Med. 2017;177(4):518-526. https://doi.org/10.1001/jamainternmed.2016.9115
23. Ackerly DC, Grabowski DC. Post-acute care reform--beyond the ACA. N Engl J Med. 2014;370(8):689-691. https://doi.org/10.1056/NEJMp1315350
24. Strausbaugh LJ, Sukumar SR, Joseph CL. Infectious disease outbreaks in nursing homes: an unappreciated hazard for frail elderly persons. Clin Infect Dis. 2003;36(7):870-876. https://doi.org/10.1086/368197
25. Kapoor A, Field T, Handler S, et al. Adverse events in long-term care residents transitioning from hospital back to nursing home. JAMA Intern Med. 2019;179(9):1254-1261. https://doi.org/10.1001/jamainternmed.2019.2005
26. Adverse Events in Skilled Nursing Facilities: National Incidence Among Medicare Beneficiaries. Office of Inspector General, US Dept of Health & Human Services; 2014.
27. The Impact of the COVID-19 Pandemic on Medicare Beneficiary Use of Health Care Services and Payments to Providers: Early Data for the First 6 Months of 2020. Office of the Assistant Secretary for Planning and Evaluation, US Dept of Health & Human Services; 2020.
The COVID-19 outbreak in February 2020 at a congregate living facility near Seattle, Washington, signaled the beginning of the pandemic in the United States. In that facility, infected residents had a 54.5% hospitalization rate and 33.7% case-fatality rate.1 Similar to the experience in Washington, all congregate living facilities have proved particularly vulnerable to the effects of COVID-19,2-7 with residents at increased risk for disease severity and mortality.2-7
Due to the COVID-19 emergency, NorthShore University HealthSystem (NUHS), a multihospital, integrated health system in northern Illinois, established a best practice for appropriate use of congregate living facilities after hospitalization. This focused on the safety of discharged patients and mitigation of COVID-19 by putting in place a referral process to a newly established congregate living review committee (CLRC) for review prior to discharge. Although all discharges to congregate living settings are at high risk,2 new placements to skilled nursing facilities (SNFs) were the primary focus of the committee and the sole focus of this study. In this study, we sought to determine whether establishment of the CLRC was associated with a reduction in SNF utilization, whether this was safe and efficient, and whether it was associated with a reduction in COVID-19 incidence in the 30 days following discharge.
METHODS
Setting and Case Review Intervention
We conducted a retrospective cohort study for patients hospitalized within NUHS from March 19, 2019 to July 16, 2020, designed as an interrupted time series. The study was approved by the NUHS Institutional Review Board (EH21-022).
The study exposure was creation of a referral and review process for all patients with expected discharge to a SNF and was implemented as part of usual discharge planning during the COVID-19 pandemic. The key intervention was to establish a multidisciplinary committee, the CLRC, to review all potential discharges to SNFs. The CLRC had dual goals of preventing COVID-19 spread in facilities by limiting placement of new residents and protecting a vulnerable population from a setting that conferred a higher risk of acquiring COVID-19. The CLRC was organized as a multidisciplinary committee with physicians, case managers, social workers, physical therapists, occupational therapists, and the director of NUHS home health agency. Physician members were evenly split as half hospitalists and half ambulatory physicians. The CLRC review was initiated by a patient’s assigned case manager or social worker by consult through a referral in the electronic medical record (EMR). Each case was summarized and then presented to the full CLRC. The CLRC met for 1 hour per day, 6 days per week, to review all planned discharges that met criteria for review. A committee physician chaired each meeting. Three other members were needed for a quorum, with one other member with a title of director or higher. Time required was the 1-hour daily meeting, as well as one full-time position for case review, preparation, and program administration. The case presentation included a clinical summary of the hospitalization as well as COVID-19 status and testing history, previous living situation, level of home support, functional level, psychosocial needs, barrier(s) to discharging home, and long-term residential plans. A structured assessment was then made by each CLRC member in accordance with their professional expertise. Unanimous consensus would be reached before finalizing any recommended adjustments to the discharge, which would be communicated to the inpatient care team via a structured note within the EMR, along with direct communication to the assigned case manager or social worker. When the CLRC suggested adjustments to the discharge, they would work with the assigned case manager or social worker to communicate an appropriate post–acute care plan with the patient or appropriate representative. If there was disagreement or the recommendations could not be followed, the case manager or social worker would place a new referral with additional information for reconsideration. Following a recommendation for SNF, verification would be completed by the CLRC prior to discharge. This process is detailed in Figure 1.
Patient Population
Inclusion criteria for the study were: (1) inpatient hospitalization and (2) eligibility for risk scoring via the organization’s clinical analytics prediction engine (CAPE).8 CAPE is a validated predictive model that includes risk of readmission, in-hospital mortality, and out-of-hospital mortality,8 with extensive adoption at NUHS. CAPE score eligibility was used as an inclusion criterion so that CAPE could be applied for derivation of a matched control. CAPE eligibility criteria include admission age of at least 18 years and that hospitalization is not psychiatric, rehabilitative, or obstetric. Patients must not be enrolled in hospice and must be discharged alive.
Exclusions were patients who tested positive for SARS-CoV-2 prior to or during index hospitalization. Excluding COVID-19 patients from the analysis eliminated a confounder not present in the preintervention group.
For patients with multiple inpatient admissions, the first admission was the only admission used for analysis. Additionally, if a patient had an admission that occurred in both the preintervention and postintervention periods, they were included only in the postintervention period. This was done to avoid any within-subject correlation and ensure unique patients in each group. Confounding from this approach was mitigated through the process of deriving a matched control.
Outcomes Measurement
The primary outcome of interest was total discharges to SNF across NUHS facilities after hospital admission. Patients were identified as discharging to a SNF if discharge destination codes 03, 64, or 83 appeared on the hospital bill. Additionally, new discharges to SNFs were assessed and identified if documentation indicated that the patient’s living arrangement prior to admission was not a SNF but discharge billing destination codes 03, 64, or 83 appeared on the hospital bill.
Secondary outcomes were measurement of readmissions, days to readmission, and median length of stay (LOS). Readmissions and LOS were balancing measures for the primary outcome, with readmissions measured to evaluate the safety of the CLRC process and LOS measured to evaluate its efficiency. A readmission was any patient who had an unplanned inpatient admission at an NUHS facility within 30 days after an index admission. LOS was measured in days from arrival on a hospital unit to time of discharge.
Additional analysis was done to estimate the effect of the intervention on the incidence of COVID-19 in the 30 days following discharge by comparing the observed to expected incidence of COVID-19 by discharge destination. The expected values were derived by estimating COVID-19 cases that would have been expected to occur with rates of preintervention SNF utilization. This was accomplished by multiplying the observed incidence of COVID-19 in the 30 days following discharge by the number of patients who were discharged to SNFs or home/other in the preintervention period. This expected value was then compared with the observed values to estimate the effect size of the intervention on COVID-19 incidence following discharge. This method of deriving an expected value from the observed incidence was utilized because the preintervention period was before COVID-19 was widespread in the community. It was therefore not possible to directly measure COVID-19 incidence in the preintervention period.
Data Source
Data were retrieved from the NUHS Enterprise Data Warehouse, NUHS’s central data repository, which contains a nightly upload of clinical and financial data from the EMR. Data were collected between March 19, 2019, and July 16, 2020.
The preintervention period was defined as March 19, 2019, to March 18, 2020. Data from that interval were compared with the postintervention period, which was from March 19, 2020, to July 16, 2020. The preintervention period, 1 year immediately prior to the intervention, was chosen to limit any effect of temporal trends while also providing a large sample size. The postintervention period began on the first day NUHS implemented the revised approach to SNF use and ended on the last day before the review process was modified.
Data Analysis
An interrupted time series was used to measure the impact of adoption of the CLRC protocol. A matched control was derived from the preintervention population. To derive this matched control, there was an assessment of covariates in the preintervention and postintervention groups using a standardized mean difference (SMD)9 that indicated an imbalance (SMD ≥ 0.1) in some covariates. A propensity score–matching technique10 was applied to address this imbalance and lack of randomization.
The candidate variables for propensity matching were chosen if they had an association with 30-day readmission. Readmission was chosen to find candidate variables because, of the possible outcomes, this was the only one that was not directly impacted by any CLRC decision. Each covariate was assessed using a logistic regression model while controlling for the postintervention group. If there was an association between a covariate and the outcome, it was chosen for propensity matching. Propensity scores were calculated using a logistic regression model with the treatment (1/0) variable as the dependent variable and the chosen covariates as predictors.
There were no indications of strong multicollinearity. The propensity scores generated were then used to derive a matched control using paired matching. MatchIt package in R (R Foundation for Statistical Computing) was used to create a matched dataset with a logit distance and standard caliper of 0.2 times the standard deviations of the logit of the propensity score. If a match was not found within the caliper, the nearest available match was used.
Regression adjustment11 was then performed using multivariate linear/logistic regression with LOS, readmission rate, days to readmission, total SNF discharges, and new SNF discharges as the outcomes. Treatment (1/0) variable and propensity score were used as the predictors. The adjusted coefficients or odds ratios (ORs) of the intervention variable were thus derived, and their associated P values were used to assess the impact of the intervention on the respective outcomes.
RESULTS
The unmatched preintervention population included 14,468 patients, with 4424 patients in the postintervention population. A matched population was derived and, after matching, the population sizes for pre and post intervention were 4424 each. In the matched population, all measured preintervention characteristics had SMDs and P values that were statistically equivalent. Patient characteristics for the unmatched and matched populations are detailed in Table 1.
During the preintervention period, 1130 (25.5%) patients were discharged to a SNF, with 776 (17.5%) patients being new SNF discharges. In the postintervention period, 568 (12.8%) patients were discharged to a SNF, with 257 (5.8%) patients being new SNF discharges. Total SNF discharges postintervention saw a 49.7% relative reduction (OR, 0.42; 95% CI, 0.38-0.47), while new SNF discharges saw a 66.9% relative reduction (OR, 0.29; 95% CI, 0.25-0.34). These results for both total and new SNF discharges were statistically significant, with P values of <.001, respectively.
Readmissions in the preintervention period were 529 (12.0%) patients, compared with 559 (12.6%) patients in the postintervention period (OR, 1.06; 95% CI, 0.93-1.20; P =.406). An OR was also calculated for readmissions, adjusting for discharge disposition, to account for changes observed in SNF use in the postintervention period. This OR was 1.11 (95% CI, 0.97-1.26; P = .131). Days to readmission in the preintervention and postintervention groups were 11.0 days and 12.0 days, respectively (OR, 0.41; 95% CI, –0.61 to 1.43; P = .429).
LOS was 3.61 days in the preintervention group and 3.64 days in the postintervention group, with an interquartile range (IQR) of 2.14 to 5.69 days in the preintervention group and 2.08 to 5.95 in the postintervention group (OR, 0.09; 95% CI, –0.09 to 0.27; P =.316). These results are summarized in Table 2.
DISCUSSION
A COVID-19 outbreak in a SNF presents a grave risk to residents and patients discharged to these facilities. It is critical for healthcare systems to do the utmost to protect the health of this vulnerable population and the public in efforts to limit COVID-19 within SNFs.12-14
In this study, we observed that at NUHS, establishing a multidisciplinary review committee, the CLRC, to assess the appropriateness of discharge to a SNF after hospitalization resulted in a nearly 50% reduction in total SNF discharges and a greater than two-thirds reduction in new SNF discharges, without any increase in LOS or readmissions. Additionally, it was observed that discharging to settings other than a SNF greatly reduced a patient’s risk of being diagnosed with COVID-19 within 30 days, a result that reached statistical significance. Based on the observed 37.2% relative reduction in COVID-19 cases, we estimate that there may have been one COVID-19 infection prevented every 5.6 days from this intervention. Based on published COVID-19 mortality rates for SNF residents,1 the intervention may have prevented one death every 2.6 weeks. Beyond the risk of COVID-19, other benefits of reducing SNF use are patient and family well-being. Although not measured in this study, others have published about the significant psychological burdens placed on SNF residents, who were at high risk for social isolation, anxiety, and depression during the COVID-19 pandemic2,15-19 Family members also may have had increased stress, as they were deprived of the opportunity to visit loved ones, advocate for them, and help maintain their identity, humanity, and quality of life.20
Although other hospitals have established a structured approach to reduce COVID-19 in SNFs,21 to the best of the authors’ knowledge, the approach described in this article is a unique response to the COVID-19 pandemic. As we have demonstrated, it is highly effective and safe and likely prevented many COVID-19 cases and deaths.
Furthermore, a review committee, such as the one we have described, has value well beyond the COVID-19 pandemic. The health and affordability of care for patients, provider success in value-based care models, and the long-term sustainability of the US healthcare system require close attention to appropriate use of expensive services and to ensuring that their use creates high value. SNF use after a hospitalization is one such service that is frequently targeted and thought to contribute to a substantial portion of wasteful medical spending.22,23 Additionally, SNFs are known to be high risk for communicable disease outbreaks other than COVID-19,24,25 as well as a high-risk environment for many other preventable adverse events.25,26 This review committee ultimately serves to help determine the most appropriate postacute setting for patients being discharged with a determination made through considerations for patient safety, rehabilitation potential, and mental and physical well-being. From a population health perspective, this can lead to better outcomes and lower costs.22,23 Therefore, although the risks of COVID-19 infection in SNFs are expected to subside, the work of evaluating appropriate use of SNFs after hospitalization at our institution continues. The broader focus now extends beyond postacute level of service toward ensuring a high-value discharge that results in both appropriate resource use and safe patient care transitions.
Limitations of this study include its retrospective nature, results from a single center, and a number of potentially unmeasured confounders that the COVID-19 pandemic created. One possible confounder is that the reduction in SNF use we observed was a temporal trend related to changing preferences. In addressing this, we reviewed Medicare claims data from the US Department of Health and Human Services in April 2020 and July 2020 compared with the same period in 2019. These data demonstrated only a modest reduction in spending on SNFs in April 2020 that was smaller than the reduction seen in Part A inpatient hospital spending during that same month.27 By July 2020, the spending from Medicare on SNFs exceeded the levels seen in 2019,27 suggesting that the percentage of acute care admissions discharging to SNFs was no lower for Medicare patients in response to COVD-19. We also considered more stringent SNF admission standards as another potential confounder; however, this was not seen at the SNFs in the NUHS geography, where the referral process became less stringent because of COVID-19 waivers for a qualifying stay or skilled need from the Centers for Medicare and Medicaid Services. We were also not able to account for readmissions outside of NUHS, and therefore there may have been differences in the readmission rate that were unmeasured. To address this limitation, we reviewed a data extract from the Illinois Health and Hospital Association and found that the percentage of patients who returned for readmission to a NUHS facility in the year prior to the intervention and during the intervention period were 92.8% and 95.3%, respectively. From this we concluded the unmeasured readmission rate appears to be low, stable, and unlikely to have altered the results of this study. Additionally, when calculating potential COVID-19 cases avoided, the expected number was, by necessity, derived from the observed outcome, given the absence of COVID-19 in the preintervention population. This may have introduced unmeasured confounders, limiting the ability to precisely measure the effect size or draw conclusions on causation. Finally, there may be limitations to the generalizability of these results based on the payor mix of the population at NUHS, which is predominantly insured through Medicare or commercial payors.
CONCLUSION
We believe this model is replicable and the results generalizable and could serve as both a template for reducing the risks of COVID-19 in SNFs and as part of a larger infection-control strategy to mitigate disease spread in vulnerable populations. It could also be applied as a component of value-improvement programs to foster appropriate use of postacute services after an acute care hospitalization, ensuring safe transitions of care through promotion of high-value care practices.
Acknowledgment
The authors thank Wei Ning Chi for editorial assistance.
1. McMichael TM, Currie DW, Clark S, et al. Epidemiology of Covid-19 in a long-term care facility in King County, Washington. N Engl J Med. 2020;382(21):2005-2011. https://doi.org/10.1056/NEJMoa2005412
2. Ouslander JG, Grabowski DC. COVID-19 in nursing homes: calming the perfect storm. J Am Geriatr Soc. 2020;68(10):2153-2162. https://doi.org/10.1111/jgs.16784
3. CDC COVID-19 Response Team. Severe outcomes among patients with coronavirus disease 2019 (COVID-19) - United States, February 12-March 16, 2020. MMWR Morb Mortal Wkly Rep. 2020;69(12):343-346. https://doi.org/10.15585/mmwr.mm6912e2
4. Ko JY, Danielson ML, Town M, et al. Risk factors for coronavirus disease 2019 (COVID-19)-associated hospitalization: COVID-19-Associated Hospitalization Surveillance Network and Behavioral Risk Factor Surveillance System. Clin Infect Dis. 2020;72(11):e695-e703. https://doi.org/10.1093/cid/ciaa1419
5. Davidson PM, Szanton SL. Nursing homes and COVID-19: we can and should do better. J Clin Nurs. 2020;29(15-16):2758-2759. https://doi.org/10.1111/jocn.15297
6. Dosa D, Jump RLP, LaPlante K, Gravenstein S. Long-term care facilities and the coronavirus epidemic: practical guidelines for a population at highest risk. J Am Med Dir Assoc. 2020;21(5):569-571. https://doi.org/10.1016/j.jamda.2020.03.004
7. Fallon A, Dukelow T, Kennelly SP, O’Neill D. COVID-19 in nursing homes. QJM. 2020;113(6):391-392. https://doi.org/10.1093/qjmed/hcaa136
8. Shah N, Konchak C, Chertok D, et al. Clinical Analytics Prediction Engine (CAPE): development, electronic health record integration and prospective validation of hospital mortality, 180-day mortality and 30-day readmission risk prediction models. PLoS One. 2020;15(8):e0238065. https://doi.org/10.1371/journal.pone.0238065
9. Austin PC. Using the standardized difference to compare the prevalence of a binary variable between two groups in observational research. Commun Stat Simul Comput. 2009;38(6):1228-1234. https://doi.org/10.1080/03610910902859574
10. Rosenbaum PR, Rubin DB. Constructing a control group using multivariate matched sampling methods that incorporate the propensity score. Am Stat. 1985;39(1):33-38. https://doi.org/10.2307/2683903
11. Myers JA, Louis TA. Regression adjustment and stratification by propensity score in treatment effect estimation. Johns Hopkins University, Dept of Biostatistics Working Papers. 2010 203(Working Papers):1-27.
12. Lansbury LE, Brown CS, Nguyen-Van-Tam JS. Influenza in long-term care facilities. Influenza Other Respir Viruses. 2017;11(5):356-366. https://doi.org/10.1111/irv.12464
13. Sáez-López E, Marques R, Rodrigues N, et al. Lessons learned from a prolonged norovirus GII.P16-GII.4 Sydney 2012 variant outbreak in a long-term care facility in Portugal, 2017. Infect Control Hosp Epidemiol. 2019;40(10):1164-1169. https://doi.org/10.1017/ice.2019.201
14. Gaspard P, Mosnier A, Stoll-Keller F, Roth C, Larocca S, Bertrand X. Influenza prevention in nursing homes: great significance of seasonal variability and spatio-temporal pattern. Presse Med. 2015;44(10):e311-e319. https://doi.org/10.1016/j.lpm.2015.04.041
15. Pfefferbaum B, North CS. Mental health and the Covid-19 pandemic. N Engl J Med. 2020;383(6):510-512. https://doi.org/10.1056/NEJMp2008017
16. Galea S, Merchant RM, Lurie N. The mental health consequences of COVID-19 and physical distancing: the need for prevention and early intervention. JAMA Intern Med. 2020;180(6):817-818. https://doi.org/10.1001/jamainternmed.2020.1562
17. Armitage R, Nellums LB. COVID-19 and the consequences of isolating the elderly. Lancet Public Health. 2020;5(5):e256. https://doi.org/10.1016/s2468-2667(20)30061-x
18. El Haj M, Altintas E, Chapelet G, Kapogiannis D, Gallouj K. High depression and anxiety in people with Alzheimer’s disease living in retirement homes during the covid-19 crisis. Psychiatry Res. 2020;291:113294. https://doi.org/10.1016/j.psychres.2020.113294
19. Santini ZI, Jose PE, York Cornwell E, et al. Social disconnectedness, perceived isolation, and symptoms of depression and anxiety among older Americans (NSHAP): a longitudinal mediation analysis. Lancet Public Health. 2020;5(1):e62-e70. https://doi.org/10.1016/s2468-2667(19)30230-0
20. Gaugler JE, Anderson KA, Zarit SH, Pearlin LI. Family involvement in nursing homes: effects on stress and well-being. Aging Ment Health. 2004;8(1):65-75. https://doi.org/10.1080/13607860310001613356
21. Kim G, Wang M, Pan H, et al. A health system response to COVID-19 in long-term care and post-acute care: a three-phase approach. J Am Geriatr Soc. 2020;68(6):1155-1161. https://doi.org/10.1111/jgs.16513
22. McWilliams JM, Gilstrap LG, Stevenson DG, Chernew ME, Huskamp HA, Grabowski DC. Changes in postacute care in the Medicare Shared Savings Program. JAMA Intern Med. 2017;177(4):518-526. https://doi.org/10.1001/jamainternmed.2016.9115
23. Ackerly DC, Grabowski DC. Post-acute care reform--beyond the ACA. N Engl J Med. 2014;370(8):689-691. https://doi.org/10.1056/NEJMp1315350
24. Strausbaugh LJ, Sukumar SR, Joseph CL. Infectious disease outbreaks in nursing homes: an unappreciated hazard for frail elderly persons. Clin Infect Dis. 2003;36(7):870-876. https://doi.org/10.1086/368197
25. Kapoor A, Field T, Handler S, et al. Adverse events in long-term care residents transitioning from hospital back to nursing home. JAMA Intern Med. 2019;179(9):1254-1261. https://doi.org/10.1001/jamainternmed.2019.2005
26. Adverse Events in Skilled Nursing Facilities: National Incidence Among Medicare Beneficiaries. Office of Inspector General, US Dept of Health & Human Services; 2014.
27. The Impact of the COVID-19 Pandemic on Medicare Beneficiary Use of Health Care Services and Payments to Providers: Early Data for the First 6 Months of 2020. Office of the Assistant Secretary for Planning and Evaluation, US Dept of Health & Human Services; 2020.
© 2021 Society of Hospital Medicine
An Initiative to Improve 30-Day Readmission Rates Using a Transitions-of-Care Clinic Among a Mixed Urban and Rural Veteran Population
Hospital readmissions are a significant problem in the United States, affecting 15% to 30% of discharges and incurring costs of more than $17 billion annually.1 Timely posthospitalization follow-up visits are critical to ensure the effective transfer of patients to the outpatient setting; such visits reduce readmission rates as well as hospital length of stay and overall health care resource utilization.2-4 Patients who receive inadequate follow-up care (ie, within 4 weeks of discharge) are significantly more likely to be readmitted than those who receive close follow-up care.5
Due to the large clinical and financial consequences associated with hospital readmission, a variety of interventions have been studied, including home visits, telemonitoring, medication management, telephone calls, and postdischarge clinics.6,7 While studies have not shown postdischarge clinics to be universally efficacious in reducing readmission rates, there is increasing evidence of reduced readmission rates in clinics that target high-risk patients (eg, patients with congestive heart failure [CHF]) rather than the total population.2 A study by Hernandez et al that evaluated the relationship between early physician follow-up and 30-day readmissions showed a significantly lower readmission rate among hospitals with higher follow-up rates.8 Similarly, patients with CHF in a large, integrated health system who were seen within 7 days of discharge had an odds ratio (OR) of 0.81 (95% CI, 0.70-0.94) for 30-day readmissions.9
Transitions-of-care clinics (TOCC), designed to provide early postdischarge follow-up to high-risk patients, have been shown to reduce 30-day readmission rates,3,4,10,11 especially in clinics that have same-physician follow-up visits rather than follow-up visits with a community primary care physician (PCP).12 The most pronounced impact of postdischarge follow-up is seen in high-risk patients with high complexity or high severity of disease; however, complex rural patients are less likely to have access to specialty care.13 As a result, since rural residents must travel farther for specialty care, they are seen less frequently than their urban counterparts.14,15
Prior to our TOCC initiative, the Iowa City VA (ICVA) ranked in the fifth quintile of the Veterans Health Administration (VHA)
To meet these challenges, we implemented a TOCC to deliver timely postdischarge care focusing on high-risk and high-complexity patients. To address access-to-care issues of patients living in rural areas within the ICVA, we included virtual follow-up visits as a key component of our intervention.16,17 The aim of this project was to decrease 30-day readmission rates of ICVA patients by 20% within 12 months of implementation.
METHODS
Setting/Study Population
The ICVA serves 184,000 veterans stretched over 50 counties in eastern Iowa, western Illinois, and northern Missouri, with more than 60% of these patients residing in rural areas. Patients were initially eligible for the TOCC if they had an admission diagnosis of CHF and a CAN score > 85 at the time of discharge. The CAN score, developed by the VA to assess the risk of hospital readmission in individual patients, factors in several variables, including demographics, coexisting conditions, vital signs, utilization of services, pharmacy visits, and laboratory results. Patients in the top 5% (95-99) have a readmission rate of 20% at 90 days. Since the CAN is a proprietary tool, it may not be published in full; however, this assessment tool is commonly used and frequently cited in VA research.18-22 The CAN score is expressed as a percentile ranging from 0 (lowest risk) to 99 (highest risk). Patient eligibility was expanded during subsequent Plan-Do-Study-Act (PDSA) cycles, as outlined below. Patient eligibility was expanded during subsequent PDSA cycles (also outlined below). A review by a local institutional review board was obtained, and the study was classified as exempt due to the use of deidentified data. Standards for Quality Improvement Reporting Excellence 2.0 guidelines were used to construct the manuscript.
Magnitude Assessment
The numbers of discharges, readmissions within 30 days, emergency department (ED) visits by all discharged veterans, and veterans discharged with a CHF hospital diagnosis were recorded from February 2017 to February 2018, which were the 12 months immediately preceding the pilot implementation.
Intervention
The primary intervention was referral to the newly formed ICVA TOCC. The multidisciplinary TOCC team consisted of hospitalists, pharmacists, schedulers, and discharge planners/care managers. Patients were identified by the hospitalist team during admission; prior to hospital discharge, these patients were referred to TOCC discharge planners to schedule appropriate follow-up appointments. Virtual follow-up visits were conducted using a patient’s home technology; in cases where a patient lacked adequate technology capabilities (eg, no computer or internet access), the ICVA provided a tablet device with cellular internet capability for temporary use. Specific clinical activities included medication reconciliation by a pharmacist, follow-up of pending laboratory studies, imaging studies, pathology results, medical diagnosis education, counseling regarding dietary restrictions, and contingency planning outside of an ED visit in the event of a change in clinical status. In addition, the TOCC aimed to facilitate a smooth transition of care back to the PCP by arranging follow-up appointments, providing visit summaries, and scheduling consults with specialty care, as appropriate.
Measures
The primary objective measure was the 30-day readmission rate in the ICVA hospital. Secondary measures included the number of VHA ED visits within 30 days of discharge. The main process measures were the number of hospital discharges per month, the number of TOCC referrals, the number of TOCC appointments made, the number of virtual and in-person visits, and the percentage of appointment “no-shows.”
Implementation
The TOCC was piloted from April 2018 to October 2018. During the pilot phase, TOCC enrollment was limited to virtual appointments and to patients with an admission diagnosis of CHF and a CAN score of > 85. The TOCC had staff on-site 2 days a week; this included pharmacists to reconcile medications and hospitalists to address follow-up care needs.
The TOCC clinic was temporarily closed at the end of October 2018 to analyze pilot results. Based on stakeholder feedback, changes made as part of the second PDSA cycle included expanding eligibility criteria to any hospital admission diagnosis and to patients with a CAN score < 85 if the hospitalist team felt the patient was likely to benefit from TOCC follow-up. In addition, on-site clinic staffing was expanded from 2 to 5 days per week to improve access, and the option for an in-person visit was added based on concerns some veterans expressed regarding the use of the technology at home. Finally, a formal resident program was added, and the order set for referrals was simplified. The TOCC was restarted in February 2019, and TOCC metrics were reviewed monthly. By July 2019, we identified issues with TOCC referrals and appointment creation that required additional modifications to the intervention.
A third PDSA cycle was initiated in July 2019 and included major changes, notably the formation of a designated TOCC committee. The committee appointed a dedicated TOCC scheduler whose role was to reduce confusion regarding scheduling, to update the discharge instructions/orders template to lower incidences of “double-booking” that occurred with PCP and TOCC appointments, to modify discharge educational instruction regarding virtual visits and tablet use, to adjust the TOCC-PCP handoff, and to formalize interactions between discharge coordinators and residents to review possible referrals every morning (Appendix Figure 1).
Statistical Analysis
Run charts were constructed by plotting monthly primary outcome values and monthly process metrics (Figure, Appendix Figure 2, Appendix Figure 3). Chi-square tests were used to compare 30-day readmission rates before and after the intervention.
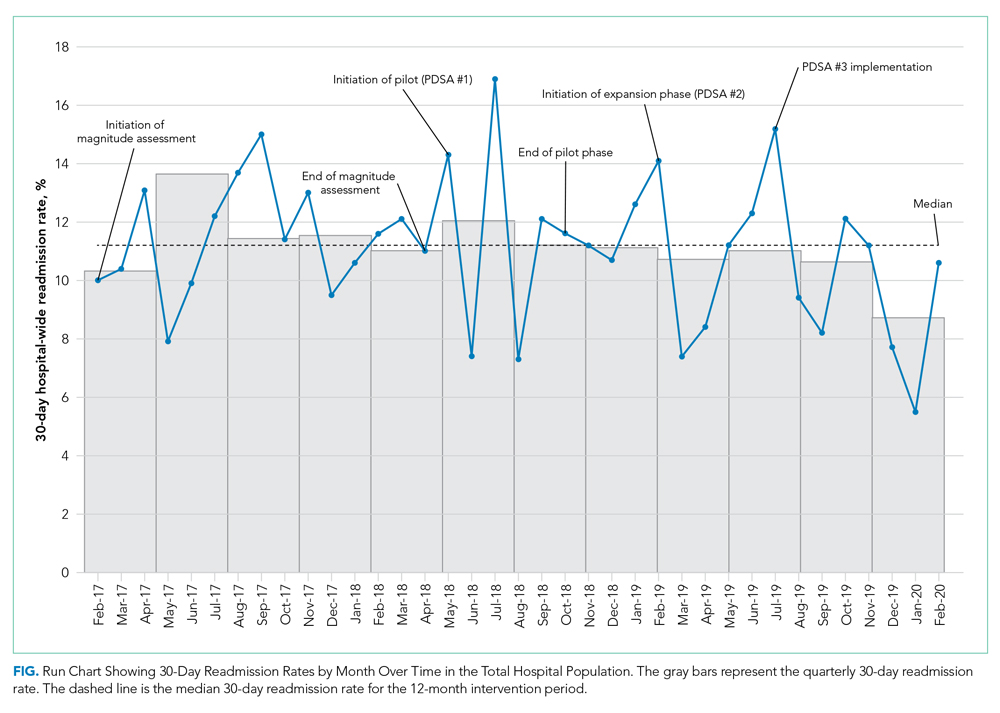
Mean (SD) or counts and percentages were used to describe the distribution of continuous and categorical variables, respectively. Kruskal-Wallis test, t test, or chi-square tests were used, as appropriate, across categories. Generalized linear models with a logistic link function were used to test for differences between patients who kept their appointment at the TOCC and those who did not keep their TOCC appointment (both unadjusted and adjusted for all of the covariates previously mentioned). In addition, generalized linear models were also used to compare outcomes between TOCC patients seen virtually vs those seen in-person (both unadjusted and adjusted for all the covariates previously mentioned). All statistical tests were considered significant at a two-sided P < .05. All analyses were performed using SAS software version 9.4 (SAS Institute Inc).
RESULTS
Magnitude Assessment
During the preimplementation period (February 2017-February 2018), there were 3014 patient discharges from ICVA and 343 readmissions, resulting in a readmission rate of 11.4%. Among patients with a hospital-admission diagnosis of cardiorespiratory disease, which included patients with CHF, there were 381 discharges and 46 readmissions, resulting in a readmission rate of 12.1%.
Primary Outcome
During the pilot phase, which was conducted from April 2018 to October 2018, 142 patients who met inclusion criteria (CHF diagnosis and a CAN score > 85) were discharged from ICVA, and 56 referrals to the TOCC were placed. The readmission rate among the cardiorespiratory cohort of veterans was 9.5%.
During the expansion of the intervention from February 2019 to February 2020, there were 2844 discharges from the ICVA and 291 readmissions, resulting in a readmission rate of 10.2%. However, there was a further decrease in the readmission rate after the third PDSA cycle was initiated in July 2019 (Appendix Figure 1). The readmission rate was 9.2% in the final 6 months of the intervention period, and 7.9% in the final 3 months.
When comparing the 6 months following the third PDSA cycle to the magnitude assessment period, there was a relative readmission reduction of 19.3% (P = .04), and an absolute reduction of 2.2%. If the final 3 months of the intervention period are included, there was an absolute reduction of 3.5% and a relative reduction of 30.7% (P = .01). Notably, before the pilot phase, ICVA was in the fifth quintile for HWR among VA hospitals but improved to the second quintile by the end of the expansion phase.
Process Outcomes
Process metrics for TOCC referrals, the number of patients seen, and the number of virtual and in-person visits over time are shown in Appendix Figure 3. Rates of TOCC referrals and the number of TOCC visits were lower than anticipated during the first 5 months of the intervention. However, TOCC referrals increased significantly after we implemented the previously described changes as part of the third PDSA cycle. As a result, total, virtual, and in-person visits also significantly increased from July 2019 to February 2020. The proportion of patients choosing virtual vs in-person visits fluctuated over time, but virtual visits were generally chosen more often than in-person visits.
Statistical Modeling
Baseline Data
Cohort characteristics are shown in Table 1. The cohort, which reflected the ICVA population, was predominantly male (96%) and White (93%), with a mean age of 67 years. The population was approximately half urban and half rural in composition, and the most common reason for hospital admission was cardiac. Other than a small but statistically significant difference in CAN scores, there were no significant differences between patients who kept their TOCC appointment and those who did not. There were also no differences in baseline characteristics between patients who chose virtual follow-up and patients who chose in-person follow-up, including the proportion of urban and rural patients.
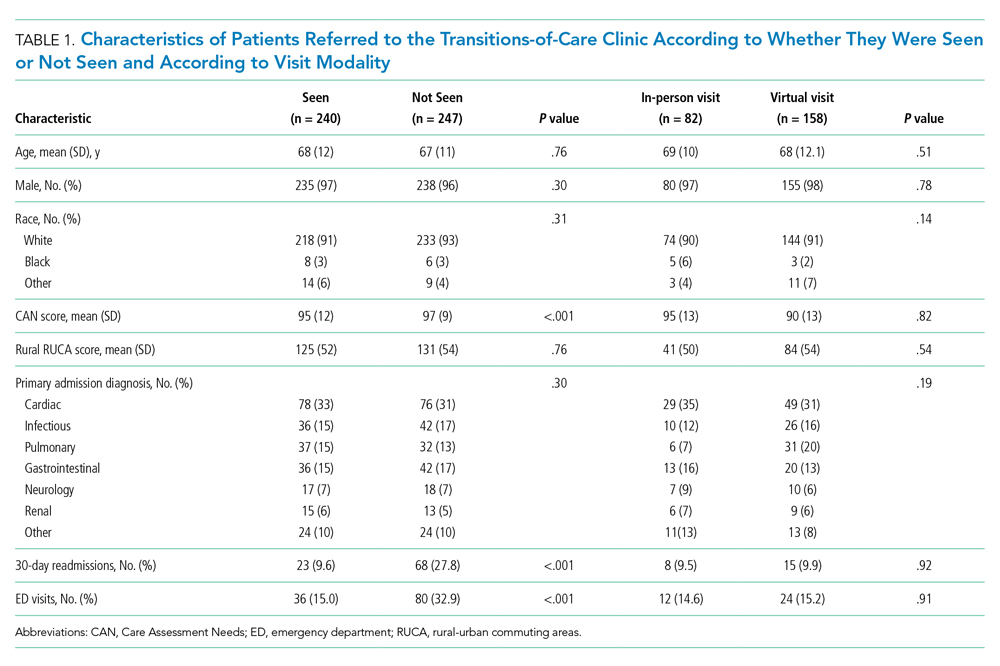
Outcomes
Patients who kept their TOCC appointments had a 30-day readmission rate of 9.6%, which was significantly lower than the 30-day readmission rate of 27% in the group that did not keep their TOCC appointment (P < .001). Similarly, the percentage of patients treated in the ED was 15% in the TOCC group compared to 31.2% in the group that canceled their appointment (P < .001) (Table 1). In the multivariable analysis, patients who were seen in the TOCC group had an OR for 30-day readmission of 0.35 (95% CI, 0.19-0.62, P < .001), and an OR for ED visits of 0.39 (95% CI, 0.23-0.65; P < .001) (Table 2). There was no statistically significant difference in 6-month mortality between the two groups. In the virtual group compared to the in-person group, there were no statistically significant differences in outcomes between the two groups in the unadjusted or adjusted analysis (Table 2).
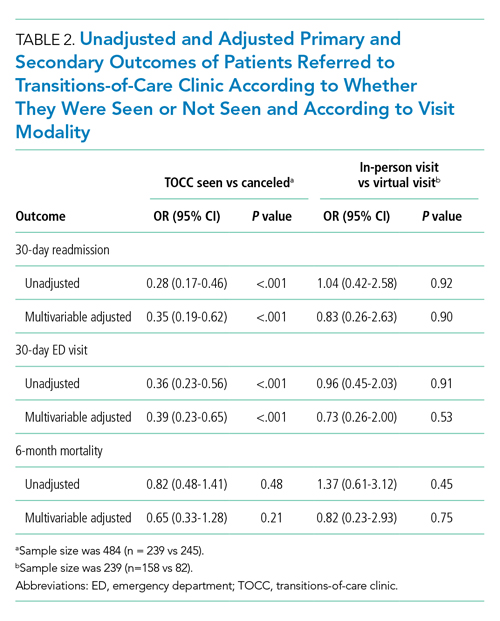
DISCUSSION
In the expansion phase, eligibility was expanded to include any hospital indication but continued to focus on high-risk patients. Existing literature suggests that providing postdischarge care to all patients, including low- or medium-risk patients, may not be as impactful as enrolling high-risk patients only. For instance, a postdischarge clinic offered to all patients at a VA system in Colorado did not reduce readmission rates compared to PCP follow-up.23 In contrast, a study of more than 10,000 high-risk urban patients demonstrated that postdischarge care resulted in a 9.3% reduction in readmission risk.24 Our data are consistent with the previously published studies, as the average CAN score of patients seen in TOCC was 90, suggesting a high risk of readmission. In the final 12 months of the intervention, 15% of discharged patients were seen at the TOCC clinic, suggesting that targeted intervention within the small subset of high-risk patients was sufficient to achieve our primary aim. Of note, among patients who did not meet the inclusion criteria for TOCC referral (ie, patients not considered high risk [CAN score ≤ 85]), the rate of readmissions was 8.6%.
Most of the available research on the efficacy of postdischarge clinics was conducted in urban environments. Our ICVA population sees a large proportion of rural veterans, who account for just over 50% of the discharge population. In a study of more than 2 million Medicare patients discharged from US hospitals, the 30-day readmission rates and adjusted mortality rates were higher among patients in rural counties, and post–acute care seemed to have a greater impact in rural rather than urban settings.25 Previous studies have demonstrated that virtual visits have the potential to improve readmission rates, especially in patients with CHF26 and in patients at the highest risk for readmission.27 In our study, the pilot phase offered only virtual visits, but we subsequently added an in-person option based on veteran feedback. Interestingly, over the next 12 months, virtual visits were more popular with both urban and rural veterans, and there were no differences in the number of rural patients in the in-person vs the virtual group. These findings suggest factors other than rurality influenced the decision to choose virtual follow-up visits over in-person visits. Future studies should seek to determine the extent to which factors such as age, race, educational level, and socioeconomic circumstances impact veterans’ follow-up decisions. Not only were outcomes among patients who chose virtual visits the same as those of patients who chose in-person visits, but both of these groups had better outcomes compared to the non-TOCC group (Table 2). This finding demonstrating the efficacy of virtual visits among rural and urban patients has taken on increased significance due to the COVID-19 pandemic, as virtual visits offer a safer option, one that minimizes physical contact.
Our quality improvement analysis included a statistical comparison of patients seen vs those not seen at the TOCC. Patients who were referred to the TOCC but chose not to keep their appointment were similar to those seen in TOCC in terms of age, CAN score, rurality, and hospital diagnosis, but readmission rates were substantially higher in this group even after adjustments for covariates (Table 2). Evaluating causality in interventions aimed to reduce hospital readmission rates is complicated.28 Our findings add greater plausibility to the utility of TOCC in accounting for at least a portion of the reported decrease in ICVA 30-day readmissions.
Our study has several strengths, including an observation period longer than 2 years, a large population of discharged veterans within an integrated healthcare system, and a large proportion of patients living in rural areas. Another strength of our study is the innovative nature of the intervention, which features a multidisciplinary team and the option of virtual or in-person visits. Nevertheless, this study also has several important limitations. As a single-center study, our findings may not be generalizable to other institutions, especially those outside the VHA system. Similarly, our study population reflected that of the ICVA, which may limit generalizability to a more diverse population. While we attempted to account in our statistical modeling for baseline differences between referred patients seen by the TOCC and those referred but not seen, we cannot exclude residual confounding between the groups. Specifically, the comparison of patients who did and did not choose TOCC follow-up introduces the possibility of selection bias. Future randomized/controlled studies will need to evaluate whether TOCC is more effective than the standard of care to reduce readmissions. Finally, since the analysis period following the final PDSA cycle was compressed due to the onset of the COVID-19 pandemic in the United States, no data are available regarding the sustained impacts of changes made during this cycle.
CONCLUSION
A multidisciplinary TOCC within the ICVA, featuring both virtual and in-person visits, reduced 30-day readmission rates by 19.3%; this approach to care was especially effective in patients with CHF. Virtual visits were the follow-up mode of choice for both urban and rural veterans, and there was no difference in outcomes between these two follow-up options. Future studies will focus on additional quality metrics, including cost-effectiveness and patient satisfaction.
1. Jencks SF, Williams MV, Coleman EA. Rehospitalizations among patients in the Medicare fee-for-service program. N Engl J Med. 2009;360(14):1418-1428. https://doi.org/10.1056/nejmsa0803563
2. Doctoroff L. Postdischarge clinics and hospitalists: a review of the evidence and existing models. J Hosp Med. 2017;12(6):467-471. https://doi.org/10.12788/jhm.2750
3. Koehler BE, Richter KM, Youngblood L, et al. Reduction of 30-day postdischarge hospital readmission or emergency department (ED) visit rates in high-risk elderly medical patients through delivery of a targeted care bundle. J Hosp Med. 2009;4(4):211-218. https://doi.org/10.1002/jhm.427
4. Abrashkin KA, Cho HJ, Torgalkar S, Markoff B. Improving transitions of care from hospital to home: what works? Mt Sinai J Med. 2012;79(5):535-544. https://doi.org/10.1002/msj.21332
5. Misky GJ, Wald HL, Coleman EA. Post-hospitalization transitions: examining the effects of timing of primary care provider follow-up. J Hosp Med. 2010;5(7):392-397. https://doi.org/10.1002/jhm.666
6. Greysen SR, Harrison JD, Kripalani S, et al. Understanding patient-centred readmission factors: a multi-site, mixed-methods study. BMJ Qual Saf. 2017;26(1):33-41. https://doi.org/10.1136/bmjqs-2015-004570
7. Hansen LO, Young RS, Hinami K, Leung A, Williams MV. Interventions to reduce 30-day rehospitalization: a systematic review. Ann Intern Med. 2011;155(8):520-528. https://doi.org/10.7326/0003-4819-155-8-201110180-00008
8. Hernandez AF, Greiner MA, Fonarow GC, et al. Relationship between early physician follow-up and 30-day readmission among Medicare beneficiaries hospitalized for heart failure. JAMA. 2010;303(17):1716-1722. https://doi.org/10.1001/jama.2010.533
9. Lee KK, Yang J, Hernandez AF, Steimle AE, Go AS. Post-discharge follow-up characteristics associated with 30-day readmission after heart failure hospitalization. Med Care. 2016;54(4):365-372. https://doi.org/10.1097/mlr.0000000000000492
10. Balaban RB, Williams MV. Improving care transitions: hospitalists partnering with primary care. J Hosp Med. 2010;5(7):375-377. https://doi.org/10.1002/jhm.824
11. Rodrigues CR, Harrington AR, Murdock N, et al. Effect of pharmacy-supported transition-of-care interventions on 30-day readmissions: a systematic review and meta-analysis. Ann Pharmacother. 2017;51(10):866-889. https://doi.org/10.1177/1060028017712725
12. van Walraven C, Taljaard M, Etchells E, et al. The independent association of provider and information continuity on outcomes after hospital discharge: implications for hospitalists. J Hosp Med. 2010;5(7):398-405. https://doi.org/10.1002/jhm.716
13. Gruca TS, Pyo TH, Nelson GC. Providing cardiology care in rural areas through vsiting consultant clinics. J Am Heart Assoc. 2016;5(7):e002909. https://doi.org/10.1161/jaha.115.002909
14. Chan L, Hart LG, Goodman DC. Geographic access to health care for rural Medicare beneficiaries. J Rural Health. 2006;22(2):140-146. https://doi.org/10.1111/j.1748-0361.2006.00022.x
15. Burke RE, Jones CD, Coleman EA, Falvey JR, Stevens-Lapsley JE, Ginde AA. Use of post-acute care after hospital discharge in urban and rural hospitals. Am J Accountable Care. 2017;5(1):16-22.
16. Jetty A, Moore MA, Coffman M, Petterson S, Bazemore A. Rural family physicians are twice as likely to use telehealth as urban family physicians. Telemed J E Health. 2018;24(4):268-276. https://doi.org/10.1089/tmj.2017.0161
17. Harrison PL, Hara PA, Pope JE, Young MC, Rula EY. The impact of postdischarge telephonic follow-up on hospital readmissions. Popul Health Manag. 2011;14(1):27-32. https://doi.org/10.1089/pop.2009.0076
18. Wang L, Porter B, Maynard C, et al. Predicting risk of hospitalization or death among patients receiving primary care in the Veterans Health Administration. Med Care. 2013;51(4):368-373. https://doi.org/10.1097/mlr.0b013e31827da95a
19. Spece LJ, Donovan LM, Griffith MF, et al. Initiating low-value inhaled corticosteroids in an inception cohort with chronic obstructive pulmonary disease. Ann Am Thorac Soc. 2020;17(5):589-595. https://doi.org/10.1513/annalsats.201911-854oc
20. Osborne TF, Suarez P, Edwards D, Hernandez-Boussard T, Curtin C. Patient electronic health records score for preoperative risk assessment before total knee arthroplasty. JB JS Open Access. 2020;5(2):e0061. https://doi.org/10.2106/jbjs.oa.19.00061
21. Levy C, Ersek M, Scott W, et al. Life-sustaining treatment decisions initiative: early implementation results of a national Veterans Affairs program to honor veterans’ care preferences. J Gen Intern Med. 2020;35(6):1803-1812. https://doi.org/10.1007/s11606-020-05697-2
22. Ibrahim SA. High-risk patients and utilization of primary care in the US Veterans Affairs health system. JAMA Netw Open. 2020;3(6):e209518. https://doi.org/10.1001/jamanetworkopen.2020.9518
23. Burke RE, Whitfield E, Prochazka AV. Effect of a hospitalist-run postdischarge clinic on outcomes. J Hosp Med. 2014;9(1):7-12. https://doi.org/10.1002/jhm.2099
24. Jenq GY, Doyle MM, Belton BM, Herrin J, Horwitz LI. Quasi-experimental evaluation of the effectiveness of a large-scale readmission reduction program. JAMA Intern Med. 2016;176(5):681-690. https://doi.org/10.1001/jamainternmed.2016.0833
25. Kosar CM, Loomer L, Ferdows NB, Trivedi AN, Panagiotou OA, Rahman M. Assessment of rural-urban differences in postacute care utilization and outcomes among older US adults. JAMA Netw Open. 2020;3(1):e1918738. https://doi.org/10.1001/jamanetworkopen.2019.18738
26. Pandor A, Thokala P, Gomersall T, et al. Home telemonitoring or structured telephone support programmes after recent discharge in patients with heart failure: systematic review and economic evaluation. Health Technol Assess. 2013;17(32):1-207, v-vi. https://doi.org/10.3310/hta17320
27. Low LL, Tan SY, Ng MJM, et al. Applying the integrated practice unit concept to a modified virtual ward model of care for patients at highest risk of readmission: a randomized controlled trial. PloS One. 2017;12(1):e0168757. https://doi.org/10.1371/journal.pone.0168757
28. McIlvennan CK, Eapen ZJ, Allen LA. Hospital readmissions reduction program. Circulation. 2015;131(20):1796-1803. https://doi.org/10.1161/circulationaha.114.010270
Hospital readmissions are a significant problem in the United States, affecting 15% to 30% of discharges and incurring costs of more than $17 billion annually.1 Timely posthospitalization follow-up visits are critical to ensure the effective transfer of patients to the outpatient setting; such visits reduce readmission rates as well as hospital length of stay and overall health care resource utilization.2-4 Patients who receive inadequate follow-up care (ie, within 4 weeks of discharge) are significantly more likely to be readmitted than those who receive close follow-up care.5
Due to the large clinical and financial consequences associated with hospital readmission, a variety of interventions have been studied, including home visits, telemonitoring, medication management, telephone calls, and postdischarge clinics.6,7 While studies have not shown postdischarge clinics to be universally efficacious in reducing readmission rates, there is increasing evidence of reduced readmission rates in clinics that target high-risk patients (eg, patients with congestive heart failure [CHF]) rather than the total population.2 A study by Hernandez et al that evaluated the relationship between early physician follow-up and 30-day readmissions showed a significantly lower readmission rate among hospitals with higher follow-up rates.8 Similarly, patients with CHF in a large, integrated health system who were seen within 7 days of discharge had an odds ratio (OR) of 0.81 (95% CI, 0.70-0.94) for 30-day readmissions.9
Transitions-of-care clinics (TOCC), designed to provide early postdischarge follow-up to high-risk patients, have been shown to reduce 30-day readmission rates,3,4,10,11 especially in clinics that have same-physician follow-up visits rather than follow-up visits with a community primary care physician (PCP).12 The most pronounced impact of postdischarge follow-up is seen in high-risk patients with high complexity or high severity of disease; however, complex rural patients are less likely to have access to specialty care.13 As a result, since rural residents must travel farther for specialty care, they are seen less frequently than their urban counterparts.14,15
Prior to our TOCC initiative, the Iowa City VA (ICVA) ranked in the fifth quintile of the Veterans Health Administration (VHA)
To meet these challenges, we implemented a TOCC to deliver timely postdischarge care focusing on high-risk and high-complexity patients. To address access-to-care issues of patients living in rural areas within the ICVA, we included virtual follow-up visits as a key component of our intervention.16,17 The aim of this project was to decrease 30-day readmission rates of ICVA patients by 20% within 12 months of implementation.
METHODS
Setting/Study Population
The ICVA serves 184,000 veterans stretched over 50 counties in eastern Iowa, western Illinois, and northern Missouri, with more than 60% of these patients residing in rural areas. Patients were initially eligible for the TOCC if they had an admission diagnosis of CHF and a CAN score > 85 at the time of discharge. The CAN score, developed by the VA to assess the risk of hospital readmission in individual patients, factors in several variables, including demographics, coexisting conditions, vital signs, utilization of services, pharmacy visits, and laboratory results. Patients in the top 5% (95-99) have a readmission rate of 20% at 90 days. Since the CAN is a proprietary tool, it may not be published in full; however, this assessment tool is commonly used and frequently cited in VA research.18-22 The CAN score is expressed as a percentile ranging from 0 (lowest risk) to 99 (highest risk). Patient eligibility was expanded during subsequent Plan-Do-Study-Act (PDSA) cycles, as outlined below. Patient eligibility was expanded during subsequent PDSA cycles (also outlined below). A review by a local institutional review board was obtained, and the study was classified as exempt due to the use of deidentified data. Standards for Quality Improvement Reporting Excellence 2.0 guidelines were used to construct the manuscript.
Magnitude Assessment
The numbers of discharges, readmissions within 30 days, emergency department (ED) visits by all discharged veterans, and veterans discharged with a CHF hospital diagnosis were recorded from February 2017 to February 2018, which were the 12 months immediately preceding the pilot implementation.
Intervention
The primary intervention was referral to the newly formed ICVA TOCC. The multidisciplinary TOCC team consisted of hospitalists, pharmacists, schedulers, and discharge planners/care managers. Patients were identified by the hospitalist team during admission; prior to hospital discharge, these patients were referred to TOCC discharge planners to schedule appropriate follow-up appointments. Virtual follow-up visits were conducted using a patient’s home technology; in cases where a patient lacked adequate technology capabilities (eg, no computer or internet access), the ICVA provided a tablet device with cellular internet capability for temporary use. Specific clinical activities included medication reconciliation by a pharmacist, follow-up of pending laboratory studies, imaging studies, pathology results, medical diagnosis education, counseling regarding dietary restrictions, and contingency planning outside of an ED visit in the event of a change in clinical status. In addition, the TOCC aimed to facilitate a smooth transition of care back to the PCP by arranging follow-up appointments, providing visit summaries, and scheduling consults with specialty care, as appropriate.
Measures
The primary objective measure was the 30-day readmission rate in the ICVA hospital. Secondary measures included the number of VHA ED visits within 30 days of discharge. The main process measures were the number of hospital discharges per month, the number of TOCC referrals, the number of TOCC appointments made, the number of virtual and in-person visits, and the percentage of appointment “no-shows.”
Implementation
The TOCC was piloted from April 2018 to October 2018. During the pilot phase, TOCC enrollment was limited to virtual appointments and to patients with an admission diagnosis of CHF and a CAN score of > 85. The TOCC had staff on-site 2 days a week; this included pharmacists to reconcile medications and hospitalists to address follow-up care needs.
The TOCC clinic was temporarily closed at the end of October 2018 to analyze pilot results. Based on stakeholder feedback, changes made as part of the second PDSA cycle included expanding eligibility criteria to any hospital admission diagnosis and to patients with a CAN score < 85 if the hospitalist team felt the patient was likely to benefit from TOCC follow-up. In addition, on-site clinic staffing was expanded from 2 to 5 days per week to improve access, and the option for an in-person visit was added based on concerns some veterans expressed regarding the use of the technology at home. Finally, a formal resident program was added, and the order set for referrals was simplified. The TOCC was restarted in February 2019, and TOCC metrics were reviewed monthly. By July 2019, we identified issues with TOCC referrals and appointment creation that required additional modifications to the intervention.
A third PDSA cycle was initiated in July 2019 and included major changes, notably the formation of a designated TOCC committee. The committee appointed a dedicated TOCC scheduler whose role was to reduce confusion regarding scheduling, to update the discharge instructions/orders template to lower incidences of “double-booking” that occurred with PCP and TOCC appointments, to modify discharge educational instruction regarding virtual visits and tablet use, to adjust the TOCC-PCP handoff, and to formalize interactions between discharge coordinators and residents to review possible referrals every morning (Appendix Figure 1).
Statistical Analysis
Run charts were constructed by plotting monthly primary outcome values and monthly process metrics (Figure, Appendix Figure 2, Appendix Figure 3). Chi-square tests were used to compare 30-day readmission rates before and after the intervention.
Mean (SD) or counts and percentages were used to describe the distribution of continuous and categorical variables, respectively. Kruskal-Wallis test, t test, or chi-square tests were used, as appropriate, across categories. Generalized linear models with a logistic link function were used to test for differences between patients who kept their appointment at the TOCC and those who did not keep their TOCC appointment (both unadjusted and adjusted for all of the covariates previously mentioned). In addition, generalized linear models were also used to compare outcomes between TOCC patients seen virtually vs those seen in-person (both unadjusted and adjusted for all the covariates previously mentioned). All statistical tests were considered significant at a two-sided P < .05. All analyses were performed using SAS software version 9.4 (SAS Institute Inc).
RESULTS
Magnitude Assessment
During the preimplementation period (February 2017-February 2018), there were 3014 patient discharges from ICVA and 343 readmissions, resulting in a readmission rate of 11.4%. Among patients with a hospital-admission diagnosis of cardiorespiratory disease, which included patients with CHF, there were 381 discharges and 46 readmissions, resulting in a readmission rate of 12.1%.
Primary Outcome
During the pilot phase, which was conducted from April 2018 to October 2018, 142 patients who met inclusion criteria (CHF diagnosis and a CAN score > 85) were discharged from ICVA, and 56 referrals to the TOCC were placed. The readmission rate among the cardiorespiratory cohort of veterans was 9.5%.
During the expansion of the intervention from February 2019 to February 2020, there were 2844 discharges from the ICVA and 291 readmissions, resulting in a readmission rate of 10.2%. However, there was a further decrease in the readmission rate after the third PDSA cycle was initiated in July 2019 (Appendix Figure 1). The readmission rate was 9.2% in the final 6 months of the intervention period, and 7.9% in the final 3 months.
When comparing the 6 months following the third PDSA cycle to the magnitude assessment period, there was a relative readmission reduction of 19.3% (P = .04), and an absolute reduction of 2.2%. If the final 3 months of the intervention period are included, there was an absolute reduction of 3.5% and a relative reduction of 30.7% (P = .01). Notably, before the pilot phase, ICVA was in the fifth quintile for HWR among VA hospitals but improved to the second quintile by the end of the expansion phase.
Process Outcomes
Process metrics for TOCC referrals, the number of patients seen, and the number of virtual and in-person visits over time are shown in Appendix Figure 3. Rates of TOCC referrals and the number of TOCC visits were lower than anticipated during the first 5 months of the intervention. However, TOCC referrals increased significantly after we implemented the previously described changes as part of the third PDSA cycle. As a result, total, virtual, and in-person visits also significantly increased from July 2019 to February 2020. The proportion of patients choosing virtual vs in-person visits fluctuated over time, but virtual visits were generally chosen more often than in-person visits.
Statistical Modeling
Baseline Data
Cohort characteristics are shown in Table 1. The cohort, which reflected the ICVA population, was predominantly male (96%) and White (93%), with a mean age of 67 years. The population was approximately half urban and half rural in composition, and the most common reason for hospital admission was cardiac. Other than a small but statistically significant difference in CAN scores, there were no significant differences between patients who kept their TOCC appointment and those who did not. There were also no differences in baseline characteristics between patients who chose virtual follow-up and patients who chose in-person follow-up, including the proportion of urban and rural patients.
Outcomes
Patients who kept their TOCC appointments had a 30-day readmission rate of 9.6%, which was significantly lower than the 30-day readmission rate of 27% in the group that did not keep their TOCC appointment (P < .001). Similarly, the percentage of patients treated in the ED was 15% in the TOCC group compared to 31.2% in the group that canceled their appointment (P < .001) (Table 1). In the multivariable analysis, patients who were seen in the TOCC group had an OR for 30-day readmission of 0.35 (95% CI, 0.19-0.62, P < .001), and an OR for ED visits of 0.39 (95% CI, 0.23-0.65; P < .001) (Table 2). There was no statistically significant difference in 6-month mortality between the two groups. In the virtual group compared to the in-person group, there were no statistically significant differences in outcomes between the two groups in the unadjusted or adjusted analysis (Table 2).
DISCUSSION
In the expansion phase, eligibility was expanded to include any hospital indication but continued to focus on high-risk patients. Existing literature suggests that providing postdischarge care to all patients, including low- or medium-risk patients, may not be as impactful as enrolling high-risk patients only. For instance, a postdischarge clinic offered to all patients at a VA system in Colorado did not reduce readmission rates compared to PCP follow-up.23 In contrast, a study of more than 10,000 high-risk urban patients demonstrated that postdischarge care resulted in a 9.3% reduction in readmission risk.24 Our data are consistent with the previously published studies, as the average CAN score of patients seen in TOCC was 90, suggesting a high risk of readmission. In the final 12 months of the intervention, 15% of discharged patients were seen at the TOCC clinic, suggesting that targeted intervention within the small subset of high-risk patients was sufficient to achieve our primary aim. Of note, among patients who did not meet the inclusion criteria for TOCC referral (ie, patients not considered high risk [CAN score ≤ 85]), the rate of readmissions was 8.6%.
Most of the available research on the efficacy of postdischarge clinics was conducted in urban environments. Our ICVA population sees a large proportion of rural veterans, who account for just over 50% of the discharge population. In a study of more than 2 million Medicare patients discharged from US hospitals, the 30-day readmission rates and adjusted mortality rates were higher among patients in rural counties, and post–acute care seemed to have a greater impact in rural rather than urban settings.25 Previous studies have demonstrated that virtual visits have the potential to improve readmission rates, especially in patients with CHF26 and in patients at the highest risk for readmission.27 In our study, the pilot phase offered only virtual visits, but we subsequently added an in-person option based on veteran feedback. Interestingly, over the next 12 months, virtual visits were more popular with both urban and rural veterans, and there were no differences in the number of rural patients in the in-person vs the virtual group. These findings suggest factors other than rurality influenced the decision to choose virtual follow-up visits over in-person visits. Future studies should seek to determine the extent to which factors such as age, race, educational level, and socioeconomic circumstances impact veterans’ follow-up decisions. Not only were outcomes among patients who chose virtual visits the same as those of patients who chose in-person visits, but both of these groups had better outcomes compared to the non-TOCC group (Table 2). This finding demonstrating the efficacy of virtual visits among rural and urban patients has taken on increased significance due to the COVID-19 pandemic, as virtual visits offer a safer option, one that minimizes physical contact.
Our quality improvement analysis included a statistical comparison of patients seen vs those not seen at the TOCC. Patients who were referred to the TOCC but chose not to keep their appointment were similar to those seen in TOCC in terms of age, CAN score, rurality, and hospital diagnosis, but readmission rates were substantially higher in this group even after adjustments for covariates (Table 2). Evaluating causality in interventions aimed to reduce hospital readmission rates is complicated.28 Our findings add greater plausibility to the utility of TOCC in accounting for at least a portion of the reported decrease in ICVA 30-day readmissions.
Our study has several strengths, including an observation period longer than 2 years, a large population of discharged veterans within an integrated healthcare system, and a large proportion of patients living in rural areas. Another strength of our study is the innovative nature of the intervention, which features a multidisciplinary team and the option of virtual or in-person visits. Nevertheless, this study also has several important limitations. As a single-center study, our findings may not be generalizable to other institutions, especially those outside the VHA system. Similarly, our study population reflected that of the ICVA, which may limit generalizability to a more diverse population. While we attempted to account in our statistical modeling for baseline differences between referred patients seen by the TOCC and those referred but not seen, we cannot exclude residual confounding between the groups. Specifically, the comparison of patients who did and did not choose TOCC follow-up introduces the possibility of selection bias. Future randomized/controlled studies will need to evaluate whether TOCC is more effective than the standard of care to reduce readmissions. Finally, since the analysis period following the final PDSA cycle was compressed due to the onset of the COVID-19 pandemic in the United States, no data are available regarding the sustained impacts of changes made during this cycle.
CONCLUSION
A multidisciplinary TOCC within the ICVA, featuring both virtual and in-person visits, reduced 30-day readmission rates by 19.3%; this approach to care was especially effective in patients with CHF. Virtual visits were the follow-up mode of choice for both urban and rural veterans, and there was no difference in outcomes between these two follow-up options. Future studies will focus on additional quality metrics, including cost-effectiveness and patient satisfaction.
1. Jencks SF, Williams MV, Coleman EA. Rehospitalizations among patients in the Medicare fee-for-service program. N Engl J Med. 2009;360(14):1418-1428. https://doi.org/10.1056/nejmsa0803563
2. Doctoroff L. Postdischarge clinics and hospitalists: a review of the evidence and existing models. J Hosp Med. 2017;12(6):467-471. https://doi.org/10.12788/jhm.2750
3. Koehler BE, Richter KM, Youngblood L, et al. Reduction of 30-day postdischarge hospital readmission or emergency department (ED) visit rates in high-risk elderly medical patients through delivery of a targeted care bundle. J Hosp Med. 2009;4(4):211-218. https://doi.org/10.1002/jhm.427
4. Abrashkin KA, Cho HJ, Torgalkar S, Markoff B. Improving transitions of care from hospital to home: what works? Mt Sinai J Med. 2012;79(5):535-544. https://doi.org/10.1002/msj.21332
5. Misky GJ, Wald HL, Coleman EA. Post-hospitalization transitions: examining the effects of timing of primary care provider follow-up. J Hosp Med. 2010;5(7):392-397. https://doi.org/10.1002/jhm.666
6. Greysen SR, Harrison JD, Kripalani S, et al. Understanding patient-centred readmission factors: a multi-site, mixed-methods study. BMJ Qual Saf. 2017;26(1):33-41. https://doi.org/10.1136/bmjqs-2015-004570
7. Hansen LO, Young RS, Hinami K, Leung A, Williams MV. Interventions to reduce 30-day rehospitalization: a systematic review. Ann Intern Med. 2011;155(8):520-528. https://doi.org/10.7326/0003-4819-155-8-201110180-00008
8. Hernandez AF, Greiner MA, Fonarow GC, et al. Relationship between early physician follow-up and 30-day readmission among Medicare beneficiaries hospitalized for heart failure. JAMA. 2010;303(17):1716-1722. https://doi.org/10.1001/jama.2010.533
9. Lee KK, Yang J, Hernandez AF, Steimle AE, Go AS. Post-discharge follow-up characteristics associated with 30-day readmission after heart failure hospitalization. Med Care. 2016;54(4):365-372. https://doi.org/10.1097/mlr.0000000000000492
10. Balaban RB, Williams MV. Improving care transitions: hospitalists partnering with primary care. J Hosp Med. 2010;5(7):375-377. https://doi.org/10.1002/jhm.824
11. Rodrigues CR, Harrington AR, Murdock N, et al. Effect of pharmacy-supported transition-of-care interventions on 30-day readmissions: a systematic review and meta-analysis. Ann Pharmacother. 2017;51(10):866-889. https://doi.org/10.1177/1060028017712725
12. van Walraven C, Taljaard M, Etchells E, et al. The independent association of provider and information continuity on outcomes after hospital discharge: implications for hospitalists. J Hosp Med. 2010;5(7):398-405. https://doi.org/10.1002/jhm.716
13. Gruca TS, Pyo TH, Nelson GC. Providing cardiology care in rural areas through vsiting consultant clinics. J Am Heart Assoc. 2016;5(7):e002909. https://doi.org/10.1161/jaha.115.002909
14. Chan L, Hart LG, Goodman DC. Geographic access to health care for rural Medicare beneficiaries. J Rural Health. 2006;22(2):140-146. https://doi.org/10.1111/j.1748-0361.2006.00022.x
15. Burke RE, Jones CD, Coleman EA, Falvey JR, Stevens-Lapsley JE, Ginde AA. Use of post-acute care after hospital discharge in urban and rural hospitals. Am J Accountable Care. 2017;5(1):16-22.
16. Jetty A, Moore MA, Coffman M, Petterson S, Bazemore A. Rural family physicians are twice as likely to use telehealth as urban family physicians. Telemed J E Health. 2018;24(4):268-276. https://doi.org/10.1089/tmj.2017.0161
17. Harrison PL, Hara PA, Pope JE, Young MC, Rula EY. The impact of postdischarge telephonic follow-up on hospital readmissions. Popul Health Manag. 2011;14(1):27-32. https://doi.org/10.1089/pop.2009.0076
18. Wang L, Porter B, Maynard C, et al. Predicting risk of hospitalization or death among patients receiving primary care in the Veterans Health Administration. Med Care. 2013;51(4):368-373. https://doi.org/10.1097/mlr.0b013e31827da95a
19. Spece LJ, Donovan LM, Griffith MF, et al. Initiating low-value inhaled corticosteroids in an inception cohort with chronic obstructive pulmonary disease. Ann Am Thorac Soc. 2020;17(5):589-595. https://doi.org/10.1513/annalsats.201911-854oc
20. Osborne TF, Suarez P, Edwards D, Hernandez-Boussard T, Curtin C. Patient electronic health records score for preoperative risk assessment before total knee arthroplasty. JB JS Open Access. 2020;5(2):e0061. https://doi.org/10.2106/jbjs.oa.19.00061
21. Levy C, Ersek M, Scott W, et al. Life-sustaining treatment decisions initiative: early implementation results of a national Veterans Affairs program to honor veterans’ care preferences. J Gen Intern Med. 2020;35(6):1803-1812. https://doi.org/10.1007/s11606-020-05697-2
22. Ibrahim SA. High-risk patients and utilization of primary care in the US Veterans Affairs health system. JAMA Netw Open. 2020;3(6):e209518. https://doi.org/10.1001/jamanetworkopen.2020.9518
23. Burke RE, Whitfield E, Prochazka AV. Effect of a hospitalist-run postdischarge clinic on outcomes. J Hosp Med. 2014;9(1):7-12. https://doi.org/10.1002/jhm.2099
24. Jenq GY, Doyle MM, Belton BM, Herrin J, Horwitz LI. Quasi-experimental evaluation of the effectiveness of a large-scale readmission reduction program. JAMA Intern Med. 2016;176(5):681-690. https://doi.org/10.1001/jamainternmed.2016.0833
25. Kosar CM, Loomer L, Ferdows NB, Trivedi AN, Panagiotou OA, Rahman M. Assessment of rural-urban differences in postacute care utilization and outcomes among older US adults. JAMA Netw Open. 2020;3(1):e1918738. https://doi.org/10.1001/jamanetworkopen.2019.18738
26. Pandor A, Thokala P, Gomersall T, et al. Home telemonitoring or structured telephone support programmes after recent discharge in patients with heart failure: systematic review and economic evaluation. Health Technol Assess. 2013;17(32):1-207, v-vi. https://doi.org/10.3310/hta17320
27. Low LL, Tan SY, Ng MJM, et al. Applying the integrated practice unit concept to a modified virtual ward model of care for patients at highest risk of readmission: a randomized controlled trial. PloS One. 2017;12(1):e0168757. https://doi.org/10.1371/journal.pone.0168757
28. McIlvennan CK, Eapen ZJ, Allen LA. Hospital readmissions reduction program. Circulation. 2015;131(20):1796-1803. https://doi.org/10.1161/circulationaha.114.010270
© 2021 Society of Hospital Medicine
Socioeconomic and Racial Disparities in Diabetic Ketoacidosis Admissions in Youth With Type 1 Diabetes
Type 1 diabetes mellitus (T1D) is a common chronic condition of childhood. Its incidence has risen steadily over the past two decades.1 Treatment requires complex daily tasks, including blood glucose monitoring and insulin administration. The potential long-term complications of T1D—kidney failure, retinopathy, cardiovascular disease, and death—are grave but can be attenuated with effective glycemic management.2 Still, less than 25% of youths aged 13 to 19 years achieve target hemoglobin A1c (HbA1c) levels.3
Diabetic ketoacidosis (DKA) is an acute, life-threatening complication of T1D associated with suboptimal glycemic management. In the United States, DKA hospitalizations increased during 2009-2014.4 One study found the average standardized cost of a DKA-related pediatric hospitalization exceeded $7000,5 an amount not including missed school days, parent/caregiver workdays, and social and family disruptions. Costs extend to psychological well-being, with patients reporting that they “keep thinking [DKA] may happen again.”6
The burden of T1D-related morbidity is not equitably distributed. Recent evidence suggests that racial/ethnic minorities and those with public insurance experience disproportionately high rates of DKA.7,8 Neighborhood socioeconomic measures, like poverty, add an important dimension illustrative of ecological conditions in which patients reside. These measures have been studied in relation to hospitalization rates for chronic conditions like asthma and heart failure.9,10 For example, one recent study found links between area-level poverty in the United States and the likelihood of readmissions for pediatric patients following an admission for DKA.11 We sought to build on this finding by investigating whether area-level poverty, which we measured as the census tract poverty rate, patient race, and insurance status were associated with the likelihood of initial DKA hospitalization and severity of DKA presentation.
METHODS
Design
We conducted a single-center, retrospective cohort study that examined data on youth with T1D extracted from the Cincinnati Children’s Hospital Medical Center (CCHMC) electronic medical record (EMR). CCHMC is an urban, tertiary-care, freestanding pediatric hospital, with near-complete market penetration in Hamilton County, Ohio, particularly for subspecialty care. The racial and ethnic breakdown of Hamilton County’s general population is 68% White, 27% Black/African American, 3% Asian, and 4% Hispanic or Latino (adds to more than 100% due to rounding).12 The CCHMC Institutional Review Board approved this study.
Study Population
We identified eligible patients through a clinical registry within the EMR, which includes all T1D patients seen at CCHMC within the preceding 24 months. Patients are added to this registry upon initial T1D diagnosis by a research nurse who evaluates autoantibody status and clinical presentation. All patients ≤18 years old who had T1D, were active on the registry, and had an address within Hamilton County as of December 31, 2017, were included. Those with type 2 diabetes mellitus or secondary causes of diabetes were excluded. We captured patients on the registry as of December 31, 2017, and then examined whether they had been hospitalized from January 1, 2011, to December 31, 2017.
Covariates
We extracted demographic and clinical data for patients within the T1D registry as of December 31, 2017, and, for those hospitalized, at the time of their admission. Specifically, we extracted date of birth (to calculate age at encounter), sex, and ethnicity. Age was treated as a continuous variable. We defined ethnicity as Latinx (inclusive of Hispanic) or non-Latinx. We calculated duration of T1D diagnosis for patients within the registry by taking the difference of the diabetes onset date and the end of the study period. We extracted whether registry patients had an insulin pump or a continuous glucose monitor (CGM). Hospitalized patients were identified as new-onset or established T1D by comparing their hospitalization with the T1D diagnosis onset date.
For the entire T1D registry, we also assessed a key clinical characteristic: a patient’s median HbA1c. We enumerated the median HbA1c of all patients’ medians within the calendar year 2017, consistent with the methodology of a large international T1D registry.13 Among the subset of patients who were hospitalized, we obtained the HbA1c value during or prior to hospitalization.
Exposures
We captured exposure variables from EMR documentation of patients’ address, race, and insurance status. Given the small regional population of Latinx patients, we did not include ethnicity as an exposure. We used the address and insurance status at the beginning of the study period for established T1D patients, or at the time of diagnosis for new-onset patients, for analyses related to the likelihood of DKA admission. We used the address at the time of hospitalization for analyses of DKA presentation severity. We geocoded home addresses using ArcGIS software (Version 10.5.1; Esri), successfully geocoding >95% to the street level and assigning patients to a corresponding census tract—a census-defined geography consisting of approximately 4000 people.14 Census tracts, when drawn after the decennial (every 10 years) census, are designed to be sociodemographically homogenous15 and have long been used in medical and public health research.16 We connected geocoded addresses to the census tract poverty rate, defined as the percentage of individuals within a tract living below the federal poverty level. For our analyses, we primarily treated census tract poverty as a continuous variable ranging from 0% to 100%. We visualized the distribution of census tract poverty across Hamilton County using a choropleth map (Figure, part A). We also grouped the registry population into quartiles, ordered by census tract poverty levels, to ease the graphical display for Figure, part B. We defined race as White, Black (inclusive of African American), or other. We categorized insurance as Medicaid/public or Non-Medicaid/private.
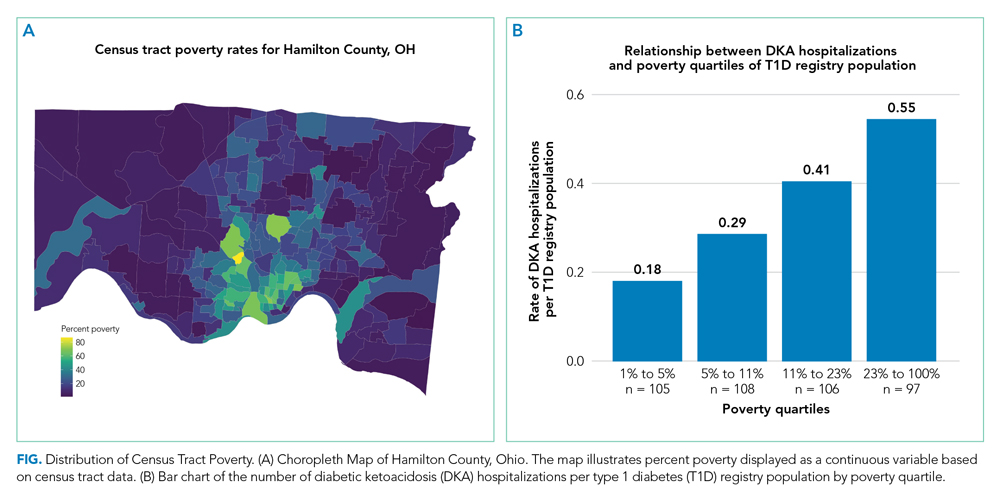
Outcomes
The primary outcome was a hospitalization for DKA during the study period. We identified eligible events by admission diagnosis of DKA (International Classification of Disease, 10th Revision, Clinical Modification, E13.10 or E10.10). Secondarily, we assessed admission severity for each patient’s first DKA hospitalization using initial pH from a venous blood gas and initial bicarbonate from the basic metabolic panel. These measures were chosen in accordance with the American Diabetes Association’s published classification of DKA severity, which uses pH, bicarbonate, and mental status.17 We defined the time for correction as the minutes from admission time until the anion gap was ≤12 or the bicarbonate was ≥18. We calculated total inpatient bed-days and pediatric intensive care unit (PICU) bed-days, and identified whether a patient was readmitted for DKA during the study period.
Statistical Analyses
We used descriptive statistics to characterize demographic and clinical information for patients within the T1D registry and for the hospitalized subset. We examined DKA severity data for all admitted patients by diagnosis status (new-onset T1D vs established). Associations between categorical outcomes were assessed using the Chi-square or Fisher exact test, and continuous outcomes were evaluated using the Mann-Whitney Rank Sum test.
We individually examined the effects of census tract poverty, race, and insurance on the odds of hospitalization through logistic regression. After confirming overlap and variability in census tract poverty rates by race and admission status (Appendix Table 1), we included these exposures in a multivariable model to capture their independent effects. Because the impact of census tract poverty, race, and insurance on hospitalization odds could vary depending on T1D diagnosis status, we conducted a sensitivity analysis by repeating the multivariable model with only established T1D patients.
Given that median HbA1c levels differed for T1D registry patients based on census tract poverty, race, and insurance, we used linear regression in a post-hoc analysis to evaluate associations between those exposures and median HbA1c. Age, gender, ethnicity, and duration of diabetes were not included in the models given that these variables did not differ by outcome variables. Diabetes technology—CGM and insulin pumps—was not included as a confounder because we hypothesized it mediated the effect of area-level poverty. For analyses, SigmaPlot (Version 14.0; SPSS Inc.) and R statistical software were used (The R Project for Statistical Computing).
RESULTS
A total of 439 patients were in the T1D registry and lived in Hamilton County as of December 31, 2017. Their demographic characteristics are listed in Table 1. Their median age was 14 years; 48% were female. The median poverty rate of the census tracts in which these youth lived was 11%. A total of 24.6% of patients identified as Black, 73.1% as White, and 2.3% as Hispanic; 35.8% were publicly insured. Patients had a median duration of T1D of 61 months (5 years, 1 month), with a median HbA1c (of all patients’ medians) of 8.7%. A total of 58.1% had a CGM, and 56% used an insulin pump.
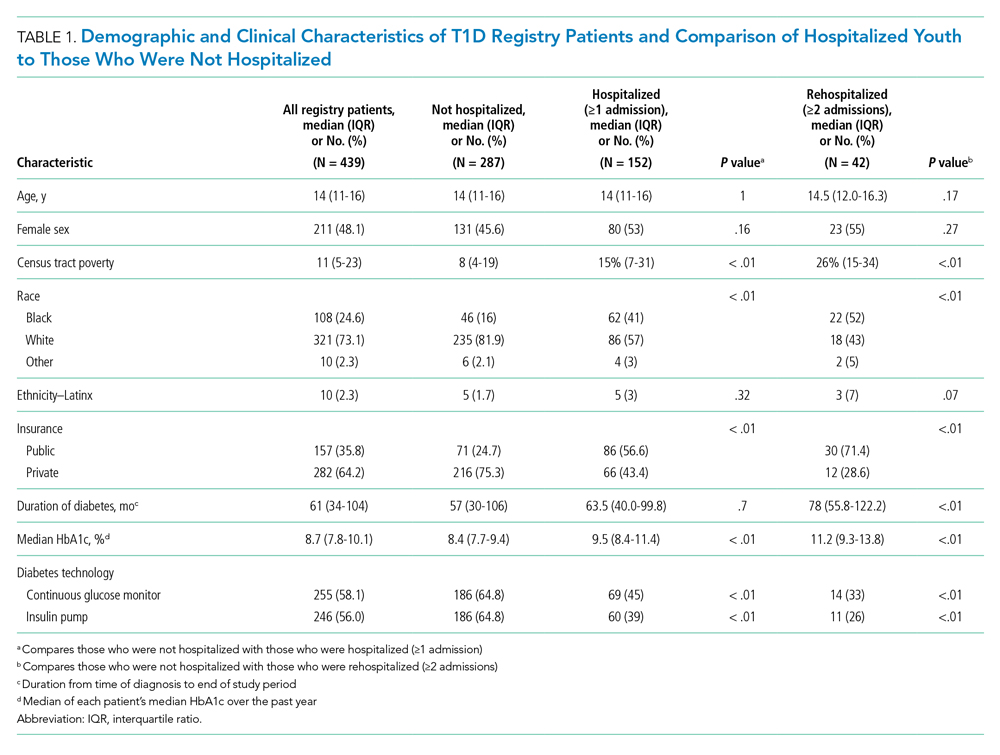
Hospitalization Characteristics of Those in the T1D Registry
Approximately one-third of registry patients (n = 152) experienced ≥1 hospitalization for DKA during the study period (inclusive of new-onset and established diagnosis). Age, gender, ethnicity, and duration of T1D diagnosis were similar between those who experienced a hospitalization and those who did not. The median census tract poverty rate was higher among those who were hospitalized compared to those who were not (15% vs 8%, P < .01). Among hospitalized patients, 41% identified as Black; among all who were not hospitalized, 16% identified as Black (P < .01). Among all hospitalized patients, 56.6% were covered by public insurance, while 24.7% of non-hospitalized patients were covered by public insurance (P < .01). Hospitalized patients were more likely to have a higher median HbA1c (9.5% vs 8.4%, P < .01) and were significantly less likely to have a CGM or insulin pump (both P < .01). These associations were magnified among the roughly 10% of the T1D registry population (n = 42) who experienced ≥2 hospitalizations.
Figure, part A is a choropleth map depicting the distribution of poverty by census tract across Hamilton County. The map is complemented by part B of the Figure, which displays the T1D registry population split into poverty quartiles and each quartile’s DKA admission rate per T1D registry population. As census tract poverty increases, so too does the rate of DKA hospitalizations. There is an almost threefold difference between the hospitalization rate of the highest poverty quartile and that of the lowest.
Likelihood of Hospitalization
We examined the exposures of interest—census tract poverty, race, and insurance—and odds of hospitalization at a patient level using logistic regression models (Table 2). In the multivariable model that included these exposures, we found that for every 10% increase in the census tract poverty rate, the odds of being hospitalized for DKA increased by 22% (95% CI, 1.03-1.47). Race was not significantly associated with odds of DKA hospitalization in the multivariable model. Public insurance was associated with a 2.71-times higher odds of hospitalization compared to those with private insurance (95% CI, 1.62-4.55). Our sensitivity analysis of only those with established T1D diagnoses showed similar results to that of the entire T1D registry population.
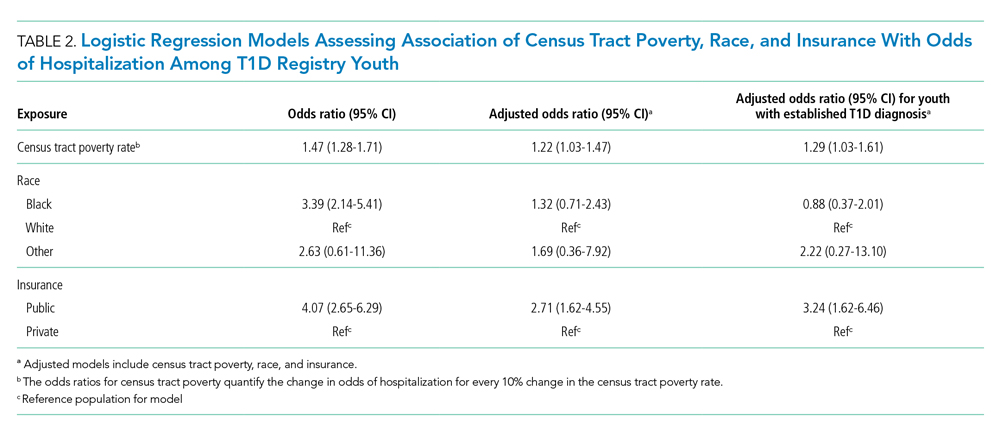
Severity of DKA Presentation
A total of 152 registry patients were admitted; 89 patients had new-onset T1D, and 63 had an established T1D diagnosis. We examined presenting factors (initial pH, initial bicarbonate, HbA1c) and clinical characteristics (time to correction, inpatient bed-days, PICU bed-days) by census tract poverty, race, and insurance for all hospitalized patients. There were no significant differences in presenting factors or outcomes by census tract poverty or insurance. However, we did note certain differences by race. Indeed, though initial pH, bicarbonate, and time to correction did not meaningfully differ by race, Black patients had a longer length of stay than their White peers (Appendix Table 2; 3.06 vs 2.16 days, P < .01). We further examined this by diagnosis status, as newly diagnosed patients often stay longer for diabetes education.18 Black patients had a longer length of stay than White patients, regardless of whether they had new-onset (3.85 vs 2.99 days, P < .01) or established T1D (1.83 vs 0.97 days, P < .01). Additionally, we found that the HbA1c was significantly higher in Black versus White patients (12.4% vs 10.8%, P = .01). HbA1c was significantly different between established T1D patients identifying as Black and those identifying as White (11.7% vs 9.5%, P < .01); however, HbA1c did not differ by race for newly diagnosed patients (12.5% vs 13.0%, P = .63).
Median HbA1c of All T1D Registry Patients
Given the suggestion of HbA1c variability by exposure variables, we performed a post-hoc linear regression analysis. Table 3 displays the linear regression models assessing associations of census tract poverty, race, and insurance on median HbA1c for all T1D registry patients. In the multivariable model, census tract poverty was no longer associated with higher HbA1c levels (0.13, 95% CI, –0.01 to 0.26). However, Black patients continued to have significantly higher HbA1c levels than White patients (1.09% higher; 95% CI, 0.59-1.59). Also, those with public insurance had significantly higher HbA1c levels than those with private insurance (0.93% higher; 95% CI, 0.51-1.35).
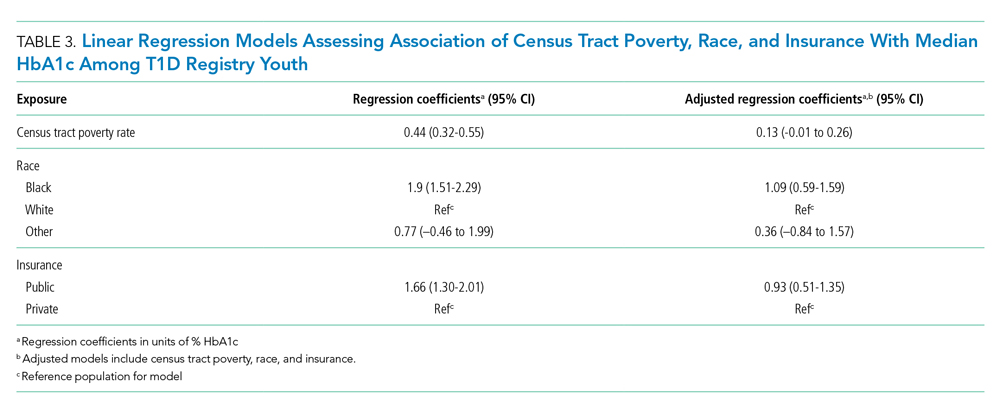
DISCUSSION
Living in high poverty areas, identifying as Black, and having public insurance were each associated with a higher likelihood of hospitalization for DKA in an unadjusted model. When we examined these exposures together in a multivariable model, census tract poverty and insurance remained associated with a higher likelihood of hospitalization for DKA. Race—with a wide confidence interval—was no longer associated with a higher likelihood of hospitalization. The increased likelihood of hospitalization initially seen for Black patients may be because they are more likely to reside in high poverty areas and be on public insurance—inequities associated with structural racism.
These results mirror those of other studies that have found area-level poverty to be associated with higher rates of intensive care admissions and hospitalizations for conditions like asthma.10,19 Our findings are also similar to those of a previous study that found that area-level deprivation was associated with a greater likelihood of DKA readmissions in pediatric and adult patients, as well as an adult study that showed increased neighborhood deprivation was associated with higher odds of DKA hospitalization.11,20 Further examination of the mechanisms underlying DKA hospitalization is clearly warranted and would be informed by a deeper awareness of the social determinants of health—such as community context and the neighborhood/built environment21—and their links to racial inequities.
Neighborhood socioeconomic status, here measured as census tract poverty, is likely linked to hospitalization for DKA through contextual factors like food insecurity, limited access to supportive care (eg, presence of a school nurse who can co-manage T1D with the patient/family and medical team), and adverse environmental exposures.22-24 To improve the health of patients, prevent hospitalizations, and achieve health equity, we suggest that both individual factors and these contextual factors need to be evaluated and addressed through community-connected interventions.25,26 For example, interventions that deploy community health workers to navigate the complexities of health systems have been effective in reducing HbA1c levels in adults with type 2 diabetes mellitus27 and are beginning to be studied in pediatrics.28
Black patients had a higher median HbA1c compared to their White counterparts in the T1D registry. One study has previously shown that hemoglobin glycation biologically differed by around 0.5% in Black patients compared to White patients.29 Despite this purported biological difference, a greater difference in HbA1c—nearly 2 points—was seen in the univariate model, illustrating that contextual factors such as socioeconomic status and treatment patterns, like the use of diabetes technology, exceed this biological difference.30-32 Our multivariable results support the importance of these contextual factors, as the HbA1c difference decreased from 1.9 to 1.09 after census tract poverty and insurance were included.
Such differences by race also emerge from experiences of discrimination and bias. Thus, to improve outcomes and equity, we must understand and address racism and its many ill effects. Different levels of racism, such as structural or personally mediated racism, interact with social determinants of health in various ways.33,34 For example, redlining—racially discriminatory grading of neighborhoods’ creditworthiness in the 1930s—is an example of structural racism that continues to affect the health of patients today.35,36 Black families are more likely to live in areas with higher poverty, even after controlling for household income level.37 The interaction between race and poverty is complex given these historical underpinnings of structural racism, as evidenced by race no longer being associated with an increased likelihood of DKA hospitalization in our multivariable analysis. The longer length of stay for Black patients despite similar presenting severity also exemplifies this complexity. For example, longer stays could result from explicit or implicit biases that lead providers to keep patients longer due to preconceived beliefs that the caregiver does not understand diabetes management.38 However, it also could be that the caregiver takes longer to complete diabetes education due to systemic barriers, such as work-related obligations during business hours when diabetes educators are present, or transportation and childcare needs.39 These barriers are often tied to socioeconomic status, making it more difficult for those in poverty to complete required education. We cannot conclude from our study the reasons for the difference in length of stay, just that differences exist. Moving forward, we suggest that design of interventions aimed at achieving health equity consider the complex interplay between health, healthcare systems, racism, and neighborhood context.
There were limitations to our study. First, given that this was an observational study, unmeasured confounders like patient or parental education and personal income could affect the strength of associations seen in our models. Second, although the CCHMC’s Diabetes Center treats nearly all children with T1D in Hamilton County, some patients, or hospitalizations at other centers, could have been missed. Third, the demographics of Hamilton County may not generalize to other diabetes centers. Fourth, although more granular data—such as census block groups or blocks—are available from the US Census Bureau, we chose census tracts as our unit of analysis to reduce sampling error that emerges from the use of such smaller geographies. Last, we measured census tract poverty rather than other contextual markers of one’s neighborhood, like vacant housing or the proportion of those receiving public benefits. However, these measures are often highly correlated with census tract poverty.40
CONCLUSION
Census tract poverty, race, and insurance were each associated with an increased likelihood of hospitalization for DKA. However, in a multivariable model, the effect of race was reduced so it was no longer significant, indicating that racial differences in DKA hospitalization are at least partially explained by differences in socioeconomic factors. The severity of DKA presentation did not differ by census tract poverty or insurance, although Black patients experienced differences in care despite similar markers of DKA severity. Addressing contextual factors—such as social determinants of health and racism—is warranted for future interventions that aim to eliminate equity gaps for T1D patients.
1. Mayer-Davis EJ, Lawrence JM, Dabelea D, et al. Incidence trends of type 1 and type 2 diabetes among youths, 2002–2012. N Engl J Med. 2017;376(15):1419-1429. https://doi.org/10.1056/NEJMoa1610187
2. Writing Group for the DCCT/EDIC Research Group, Orchard TJ, Nathan DM, et al. Association between 7 years of intensive treatment of type 1 diabetes and long-term mortality. JAMA. 2015;313(1):45-53. https://doi.org/10.1001/jama.2014.16107
3. Wood JR, Miller KM, Maahs DM, et al. Most youth with type 1 diabetes in the T1D Exchange Clinic Registry do not meet American Diabetes Association or International Society for Pediatric and Adolescent Diabetes clinical guidelines. Diabetes Care. 2013;36(7):2035-2037. https://doi.org/10.2337/dc12-1959
4. Benoit SR. Trends in diabetic ketoacidosis hospitalizations and in-hospital mortality—United States, 2000–2014. MMWR Morb Mortal Wkly Rep. 2018;67(12):362-365. https://doi.org/10.15585/mmwr.mm6712a3
5. Tieder JS, McLeod L, Keren R, et al. Variation in resource use and readmission for diabetic ketoacidosis in children’s hospitals. Pediatrics. 2013;132(2):229-236. https://doi.org/10.1542/peds.2013-0359
6. Moffett MA, Buckingham JC, Baker CR, Hawthorne G, Leech NJ. Patients’ experience of admission to hospital with diabetic ketoacidosis and its psychological impact: an exploratory qualitative study. Practical Diabetes. 2013;30(5):203-207. https://doi.org/10.1002/pdi.1777
7. Maahs DM, Hermann JM, Holman N, et al. Rates of diabetic ketoacidosis: international comparison with 49,859 pediatric patients with type 1 diabetes from England, Wales, the U.S., Austria, and Germany. Diabetes Care. 2015;38(10):1876-1882. https://doi.org/10.2337/dc15-0780
8. Malik FS, Hall M, Mangione-Smith R, et al. Patient characteristics associated with differences in admission frequency for diabetic ketoacidosis in United States children’s hospitals. J Pediatr. 2016;171:104-110. https://doi.org/10.1016/j.jpeds.2015.12.015
9. Manickam RN, Mu Y, Kshirsagar AV, Bang H. Area-level poverty and excess hospital readmission ratios. Am J Med. 2017;130(4):e153-e155. https://doi.org/10.1016/j.amjmed.2016.08.047
10. Beck AF, Moncrief T, Huang B, et al. Inequalities in neighborhood child asthma admission rates and underlying community characteristics in one US county. J Pediatr. 2013;163(2):574-580.e1. https://doi.org/10.1016/j.jpeds.2013.01.064
11. Everett E, Mathioudakis N. Association of area deprivation and diabetic ketoacidosis readmissions: comparative risk analysis of adults vs children with type 1 diabetes. J Clin Endocrinol Metab. 2019;104(8):3473-3480. https://doi.org/10.1210/jc.2018-02232
12. U.S. Census Bureau. QuickFacts: Hamilton County, Ohio. Accessed March 2, 2020. https://www.census.gov/quickfacts/hamiltoncountyohio
13. Witsch M, Kosteria I, Kordonouri O, et al. Possibilities and challenges of a large international benchmarking in pediatric diabetology—the SWEET experience. Pediatr Diabetes. 2016;17(S23):7-15. https://doi.org/10.1111/pedi.12432
14. U.S. Census Bureau. Glossary. Accessed April 22, 2021. https://www.census.gov/programs-surveys/geography/about/glossary.html
15. U.S. Census Bureau. Geographic areas reference manual. Chapter 10: Census tracts and block numbering areas. Accessed April 22, 2021. https://www.census.gov/programs-surveys/geography/guidance/geographic-areas-reference-manual.html
16. Krieger N, Chen JT, Waterman PD, Rehkopf DH, Subramanian SV. Painting a truer picture of US socioeconomic and racial/ethnic health inequalities: The Public Health Disparities Geocoding Project. Am J Public Health. 2005;95(2):312-323. https://doi.org/10.2105/AJPH.2003.032482
17. Kitabchi AE, Umpierrez GE, Murphy MB, et al. Management of hyperglycemic crises in patients with diabetes. Diabetes Care. 2001;24(1):131-153. https://doi.org/10.2337/diacare.24.1.131
18. Lawson S, Redel JM, Smego A, et al. Assessment of a day hospital management program for children with type 1 diabetes. JAMA Netw Open. 2020;3(3):e200347. https://doi.org/10.1001/jamanetworkopen.2020.0347
19. Andrist E, Riley CL, Brokamp C, Taylor S, Beck AF. Neighborhood poverty and pediatric intensive care use. Pediatrics. 2019;144(6):e20190748. https://doi.org/10.1542/peds.2019-0748
20. Govan L, Maietti E, Torsney B, et al. The effect of deprivation and HbA1c on admission to hospital for diabetic ketoacidosis in type 1 diabetes. Diabetologia. 2012;55(9):2356-2360. https://doi.org/10.1007/s00125-012-2601-6
21. U.S. Department of Health and Human Services. Healthy People 2030—Social Determinants of Health. Accessed May 13, 2021. https://health.gov/healthypeople/objectives-and-data/social-determinants-health
22. Berkowitz SA, Karter AJ, Corbie-Smith G, et al. Food insecurity, food “deserts,” and glycemic control in patients with diabetes: a longitudinal analysis. Diabetes Care. 2018;41(6):1188-1195. https://doi.org/10.2337/dc17-1981
23. Nguyen TM, Mason KJ, Sanders CG, Yazdani P, Heptulla RA. Targeting blood glucose management in school improves glycemic control in children with poorly controlled type 1 diabetes mellitus. J Pediatr. 2008;153(4):575-578. https://doi.org/10.1016/j.jpeds.2008.04.066
24. Izquierdo R, Morin PC, Bratt K, et al. School-centered telemedicine for children with type 1 diabetes mellitus. J Pediatr. 2009;155(3):374-379. https://doi.org/10.1016/j.jpeds.2009.03.014
25. Council on Community Pediatrics and Committee on Native American Child Health. Policy statement—health equity and children’s rights. Pediatrics. 2010;125(4):838-849. https://doi.org/10.1542/peds.2010-0235
26. Braveman P. What are health disparities and health equity? We need to be clear. Public Health Rep. 2014;129(suppl 2):5-8.
27. Palmas W, March D, Darakjy S, et al. Community health worker interventions to improve glycemic control in people with diabetes: a systematic review and meta-analysis. J Gen Intern Med. 2015;30(7):1004-1012. https://doi.org/10.1007/s11606-015-3247-0
28. Lipman TH, Smith JA, Hawkes CP. Community health workers and the care of children with type 1 diabetes. J Pediatr Nurs. 2019;49:111-112. https://doi.org/10.1016/j.pedn.2019.08.014
29. Bergenstal RM, Gal RL, Connor CG, et al. Racial differences in the relationship of glucose concentrations and hemoglobin A1c levels. Ann Intern Med. 2017;167(2):95-102. https://doi.org/10.7326/M16-2596
30. Agarwal S, Kanapka LG, Raymond JK, et al. Racial-ethnic inequity in young adults with type 1 diabetes. J Clin Endocrinol Metab. 2020;105(8):e2960-e2969. https://doi.org/10.1210/clinem/dgaa236
31. Addala A, Auzanneau M, Miller K, et al. A decade of disparities in diabetes technology use and HbA1c in pediatric type 1 diabetes: a transatlantic comparison. Diabetes Care. 2021;44(1):133-140. https://doi.org/10.2337/dc20-0257
32. Lipman TH, Smith JA, Patil O, Willi SM, Hawkes CP. Racial disparities in treatment and outcomes of children with type 1 diabetes. Pediatr Diabetes. 2021;22(2):241-248. https://doi.org/10.1111/pedi.13139
33. Boyd RW, Lindo EG, Weeks LD, McLemore MR. On racism: a new standard for publishing on racial health inequities. Health Affairs. Accessed July 9, 2020. https://www.healthaffairs.org/do/10.1377/hblog20200630.939347/full/
34. Jones CP. Levels of racism: a theoretic framework and a gardener’s tale. Am J Public Health. 2000;90(8):1212-1215. https://doi.org/10.2105/AJPH.90.8.1212
35. Jacoby SF, Dong B, Beard JH, Wiebe DJ, Morrison CN. The enduring impact of historical and structural racism on urban violence in Philadelphia. Soc Sci Med. 2018;199:87-95. https://doi.org/10.1016/j.socscimed.2017.05.038
36. Bailey ZD, Krieger N, Agénor M, Graves J, Linos N, Bassett MT. Structural racism and health inequities in the USA: evidence and interventions. Lancet. 2017;389(10077):1453-1463. https://doi.org/10.1016/S0140-6736(17)30569-X
37. Reardon SF, Fox L, Townsend J. Neighborhood income composition by household race and income, 1990–2009. Ann Am Acad Pol Soc Sci. 2015;660(1):78-97. https://doi.org/10.1177/0002716215576104
38. Cooper LA, Roter DL, Carson KA, et al. The associations of clinicians’ implicit attitudes about race with medical visit communication and patient ratings of interpersonal care. Am J Public Health. 2012;102(5):979-987. https://doi.org/10.2105/AJPH.2011.300558
39. Lawton J, Waugh N, Noyes K, et al. Improving communication and recall of information in paediatric diabetes consultations: a qualitative study of parents’ experiences and views. BMC Pediatr. 2015;15:67. https://doi.org/10.1186/s12887-015-0388-6
40. Brokamp C, Beck AF, Goyal NK, Ryan P, Greenberg JM, Hall ES. Material community deprivation and hospital utilization during the first year of life: an urban population-based cohort study. Ann Epidemiol. 2019;30:37-43. https://doi.org/10.1016/j.annepidem.2018.11.008
Type 1 diabetes mellitus (T1D) is a common chronic condition of childhood. Its incidence has risen steadily over the past two decades.1 Treatment requires complex daily tasks, including blood glucose monitoring and insulin administration. The potential long-term complications of T1D—kidney failure, retinopathy, cardiovascular disease, and death—are grave but can be attenuated with effective glycemic management.2 Still, less than 25% of youths aged 13 to 19 years achieve target hemoglobin A1c (HbA1c) levels.3
Diabetic ketoacidosis (DKA) is an acute, life-threatening complication of T1D associated with suboptimal glycemic management. In the United States, DKA hospitalizations increased during 2009-2014.4 One study found the average standardized cost of a DKA-related pediatric hospitalization exceeded $7000,5 an amount not including missed school days, parent/caregiver workdays, and social and family disruptions. Costs extend to psychological well-being, with patients reporting that they “keep thinking [DKA] may happen again.”6
The burden of T1D-related morbidity is not equitably distributed. Recent evidence suggests that racial/ethnic minorities and those with public insurance experience disproportionately high rates of DKA.7,8 Neighborhood socioeconomic measures, like poverty, add an important dimension illustrative of ecological conditions in which patients reside. These measures have been studied in relation to hospitalization rates for chronic conditions like asthma and heart failure.9,10 For example, one recent study found links between area-level poverty in the United States and the likelihood of readmissions for pediatric patients following an admission for DKA.11 We sought to build on this finding by investigating whether area-level poverty, which we measured as the census tract poverty rate, patient race, and insurance status were associated with the likelihood of initial DKA hospitalization and severity of DKA presentation.
METHODS
Design
We conducted a single-center, retrospective cohort study that examined data on youth with T1D extracted from the Cincinnati Children’s Hospital Medical Center (CCHMC) electronic medical record (EMR). CCHMC is an urban, tertiary-care, freestanding pediatric hospital, with near-complete market penetration in Hamilton County, Ohio, particularly for subspecialty care. The racial and ethnic breakdown of Hamilton County’s general population is 68% White, 27% Black/African American, 3% Asian, and 4% Hispanic or Latino (adds to more than 100% due to rounding).12 The CCHMC Institutional Review Board approved this study.
Study Population
We identified eligible patients through a clinical registry within the EMR, which includes all T1D patients seen at CCHMC within the preceding 24 months. Patients are added to this registry upon initial T1D diagnosis by a research nurse who evaluates autoantibody status and clinical presentation. All patients ≤18 years old who had T1D, were active on the registry, and had an address within Hamilton County as of December 31, 2017, were included. Those with type 2 diabetes mellitus or secondary causes of diabetes were excluded. We captured patients on the registry as of December 31, 2017, and then examined whether they had been hospitalized from January 1, 2011, to December 31, 2017.
Covariates
We extracted demographic and clinical data for patients within the T1D registry as of December 31, 2017, and, for those hospitalized, at the time of their admission. Specifically, we extracted date of birth (to calculate age at encounter), sex, and ethnicity. Age was treated as a continuous variable. We defined ethnicity as Latinx (inclusive of Hispanic) or non-Latinx. We calculated duration of T1D diagnosis for patients within the registry by taking the difference of the diabetes onset date and the end of the study period. We extracted whether registry patients had an insulin pump or a continuous glucose monitor (CGM). Hospitalized patients were identified as new-onset or established T1D by comparing their hospitalization with the T1D diagnosis onset date.
For the entire T1D registry, we also assessed a key clinical characteristic: a patient’s median HbA1c. We enumerated the median HbA1c of all patients’ medians within the calendar year 2017, consistent with the methodology of a large international T1D registry.13 Among the subset of patients who were hospitalized, we obtained the HbA1c value during or prior to hospitalization.
Exposures
We captured exposure variables from EMR documentation of patients’ address, race, and insurance status. Given the small regional population of Latinx patients, we did not include ethnicity as an exposure. We used the address and insurance status at the beginning of the study period for established T1D patients, or at the time of diagnosis for new-onset patients, for analyses related to the likelihood of DKA admission. We used the address at the time of hospitalization for analyses of DKA presentation severity. We geocoded home addresses using ArcGIS software (Version 10.5.1; Esri), successfully geocoding >95% to the street level and assigning patients to a corresponding census tract—a census-defined geography consisting of approximately 4000 people.14 Census tracts, when drawn after the decennial (every 10 years) census, are designed to be sociodemographically homogenous15 and have long been used in medical and public health research.16 We connected geocoded addresses to the census tract poverty rate, defined as the percentage of individuals within a tract living below the federal poverty level. For our analyses, we primarily treated census tract poverty as a continuous variable ranging from 0% to 100%. We visualized the distribution of census tract poverty across Hamilton County using a choropleth map (Figure, part A). We also grouped the registry population into quartiles, ordered by census tract poverty levels, to ease the graphical display for Figure, part B. We defined race as White, Black (inclusive of African American), or other. We categorized insurance as Medicaid/public or Non-Medicaid/private.
Outcomes
The primary outcome was a hospitalization for DKA during the study period. We identified eligible events by admission diagnosis of DKA (International Classification of Disease, 10th Revision, Clinical Modification, E13.10 or E10.10). Secondarily, we assessed admission severity for each patient’s first DKA hospitalization using initial pH from a venous blood gas and initial bicarbonate from the basic metabolic panel. These measures were chosen in accordance with the American Diabetes Association’s published classification of DKA severity, which uses pH, bicarbonate, and mental status.17 We defined the time for correction as the minutes from admission time until the anion gap was ≤12 or the bicarbonate was ≥18. We calculated total inpatient bed-days and pediatric intensive care unit (PICU) bed-days, and identified whether a patient was readmitted for DKA during the study period.
Statistical Analyses
We used descriptive statistics to characterize demographic and clinical information for patients within the T1D registry and for the hospitalized subset. We examined DKA severity data for all admitted patients by diagnosis status (new-onset T1D vs established). Associations between categorical outcomes were assessed using the Chi-square or Fisher exact test, and continuous outcomes were evaluated using the Mann-Whitney Rank Sum test.
We individually examined the effects of census tract poverty, race, and insurance on the odds of hospitalization through logistic regression. After confirming overlap and variability in census tract poverty rates by race and admission status (Appendix Table 1), we included these exposures in a multivariable model to capture their independent effects. Because the impact of census tract poverty, race, and insurance on hospitalization odds could vary depending on T1D diagnosis status, we conducted a sensitivity analysis by repeating the multivariable model with only established T1D patients.
Given that median HbA1c levels differed for T1D registry patients based on census tract poverty, race, and insurance, we used linear regression in a post-hoc analysis to evaluate associations between those exposures and median HbA1c. Age, gender, ethnicity, and duration of diabetes were not included in the models given that these variables did not differ by outcome variables. Diabetes technology—CGM and insulin pumps—was not included as a confounder because we hypothesized it mediated the effect of area-level poverty. For analyses, SigmaPlot (Version 14.0; SPSS Inc.) and R statistical software were used (The R Project for Statistical Computing).
RESULTS
A total of 439 patients were in the T1D registry and lived in Hamilton County as of December 31, 2017. Their demographic characteristics are listed in Table 1. Their median age was 14 years; 48% were female. The median poverty rate of the census tracts in which these youth lived was 11%. A total of 24.6% of patients identified as Black, 73.1% as White, and 2.3% as Hispanic; 35.8% were publicly insured. Patients had a median duration of T1D of 61 months (5 years, 1 month), with a median HbA1c (of all patients’ medians) of 8.7%. A total of 58.1% had a CGM, and 56% used an insulin pump.
Hospitalization Characteristics of Those in the T1D Registry
Approximately one-third of registry patients (n = 152) experienced ≥1 hospitalization for DKA during the study period (inclusive of new-onset and established diagnosis). Age, gender, ethnicity, and duration of T1D diagnosis were similar between those who experienced a hospitalization and those who did not. The median census tract poverty rate was higher among those who were hospitalized compared to those who were not (15% vs 8%, P < .01). Among hospitalized patients, 41% identified as Black; among all who were not hospitalized, 16% identified as Black (P < .01). Among all hospitalized patients, 56.6% were covered by public insurance, while 24.7% of non-hospitalized patients were covered by public insurance (P < .01). Hospitalized patients were more likely to have a higher median HbA1c (9.5% vs 8.4%, P < .01) and were significantly less likely to have a CGM or insulin pump (both P < .01). These associations were magnified among the roughly 10% of the T1D registry population (n = 42) who experienced ≥2 hospitalizations.
Figure, part A is a choropleth map depicting the distribution of poverty by census tract across Hamilton County. The map is complemented by part B of the Figure, which displays the T1D registry population split into poverty quartiles and each quartile’s DKA admission rate per T1D registry population. As census tract poverty increases, so too does the rate of DKA hospitalizations. There is an almost threefold difference between the hospitalization rate of the highest poverty quartile and that of the lowest.
Likelihood of Hospitalization
We examined the exposures of interest—census tract poverty, race, and insurance—and odds of hospitalization at a patient level using logistic regression models (Table 2). In the multivariable model that included these exposures, we found that for every 10% increase in the census tract poverty rate, the odds of being hospitalized for DKA increased by 22% (95% CI, 1.03-1.47). Race was not significantly associated with odds of DKA hospitalization in the multivariable model. Public insurance was associated with a 2.71-times higher odds of hospitalization compared to those with private insurance (95% CI, 1.62-4.55). Our sensitivity analysis of only those with established T1D diagnoses showed similar results to that of the entire T1D registry population.
Severity of DKA Presentation
A total of 152 registry patients were admitted; 89 patients had new-onset T1D, and 63 had an established T1D diagnosis. We examined presenting factors (initial pH, initial bicarbonate, HbA1c) and clinical characteristics (time to correction, inpatient bed-days, PICU bed-days) by census tract poverty, race, and insurance for all hospitalized patients. There were no significant differences in presenting factors or outcomes by census tract poverty or insurance. However, we did note certain differences by race. Indeed, though initial pH, bicarbonate, and time to correction did not meaningfully differ by race, Black patients had a longer length of stay than their White peers (Appendix Table 2; 3.06 vs 2.16 days, P < .01). We further examined this by diagnosis status, as newly diagnosed patients often stay longer for diabetes education.18 Black patients had a longer length of stay than White patients, regardless of whether they had new-onset (3.85 vs 2.99 days, P < .01) or established T1D (1.83 vs 0.97 days, P < .01). Additionally, we found that the HbA1c was significantly higher in Black versus White patients (12.4% vs 10.8%, P = .01). HbA1c was significantly different between established T1D patients identifying as Black and those identifying as White (11.7% vs 9.5%, P < .01); however, HbA1c did not differ by race for newly diagnosed patients (12.5% vs 13.0%, P = .63).
Median HbA1c of All T1D Registry Patients
Given the suggestion of HbA1c variability by exposure variables, we performed a post-hoc linear regression analysis. Table 3 displays the linear regression models assessing associations of census tract poverty, race, and insurance on median HbA1c for all T1D registry patients. In the multivariable model, census tract poverty was no longer associated with higher HbA1c levels (0.13, 95% CI, –0.01 to 0.26). However, Black patients continued to have significantly higher HbA1c levels than White patients (1.09% higher; 95% CI, 0.59-1.59). Also, those with public insurance had significantly higher HbA1c levels than those with private insurance (0.93% higher; 95% CI, 0.51-1.35).
DISCUSSION
Living in high poverty areas, identifying as Black, and having public insurance were each associated with a higher likelihood of hospitalization for DKA in an unadjusted model. When we examined these exposures together in a multivariable model, census tract poverty and insurance remained associated with a higher likelihood of hospitalization for DKA. Race—with a wide confidence interval—was no longer associated with a higher likelihood of hospitalization. The increased likelihood of hospitalization initially seen for Black patients may be because they are more likely to reside in high poverty areas and be on public insurance—inequities associated with structural racism.
These results mirror those of other studies that have found area-level poverty to be associated with higher rates of intensive care admissions and hospitalizations for conditions like asthma.10,19 Our findings are also similar to those of a previous study that found that area-level deprivation was associated with a greater likelihood of DKA readmissions in pediatric and adult patients, as well as an adult study that showed increased neighborhood deprivation was associated with higher odds of DKA hospitalization.11,20 Further examination of the mechanisms underlying DKA hospitalization is clearly warranted and would be informed by a deeper awareness of the social determinants of health—such as community context and the neighborhood/built environment21—and their links to racial inequities.
Neighborhood socioeconomic status, here measured as census tract poverty, is likely linked to hospitalization for DKA through contextual factors like food insecurity, limited access to supportive care (eg, presence of a school nurse who can co-manage T1D with the patient/family and medical team), and adverse environmental exposures.22-24 To improve the health of patients, prevent hospitalizations, and achieve health equity, we suggest that both individual factors and these contextual factors need to be evaluated and addressed through community-connected interventions.25,26 For example, interventions that deploy community health workers to navigate the complexities of health systems have been effective in reducing HbA1c levels in adults with type 2 diabetes mellitus27 and are beginning to be studied in pediatrics.28
Black patients had a higher median HbA1c compared to their White counterparts in the T1D registry. One study has previously shown that hemoglobin glycation biologically differed by around 0.5% in Black patients compared to White patients.29 Despite this purported biological difference, a greater difference in HbA1c—nearly 2 points—was seen in the univariate model, illustrating that contextual factors such as socioeconomic status and treatment patterns, like the use of diabetes technology, exceed this biological difference.30-32 Our multivariable results support the importance of these contextual factors, as the HbA1c difference decreased from 1.9 to 1.09 after census tract poverty and insurance were included.
Such differences by race also emerge from experiences of discrimination and bias. Thus, to improve outcomes and equity, we must understand and address racism and its many ill effects. Different levels of racism, such as structural or personally mediated racism, interact with social determinants of health in various ways.33,34 For example, redlining—racially discriminatory grading of neighborhoods’ creditworthiness in the 1930s—is an example of structural racism that continues to affect the health of patients today.35,36 Black families are more likely to live in areas with higher poverty, even after controlling for household income level.37 The interaction between race and poverty is complex given these historical underpinnings of structural racism, as evidenced by race no longer being associated with an increased likelihood of DKA hospitalization in our multivariable analysis. The longer length of stay for Black patients despite similar presenting severity also exemplifies this complexity. For example, longer stays could result from explicit or implicit biases that lead providers to keep patients longer due to preconceived beliefs that the caregiver does not understand diabetes management.38 However, it also could be that the caregiver takes longer to complete diabetes education due to systemic barriers, such as work-related obligations during business hours when diabetes educators are present, or transportation and childcare needs.39 These barriers are often tied to socioeconomic status, making it more difficult for those in poverty to complete required education. We cannot conclude from our study the reasons for the difference in length of stay, just that differences exist. Moving forward, we suggest that design of interventions aimed at achieving health equity consider the complex interplay between health, healthcare systems, racism, and neighborhood context.
There were limitations to our study. First, given that this was an observational study, unmeasured confounders like patient or parental education and personal income could affect the strength of associations seen in our models. Second, although the CCHMC’s Diabetes Center treats nearly all children with T1D in Hamilton County, some patients, or hospitalizations at other centers, could have been missed. Third, the demographics of Hamilton County may not generalize to other diabetes centers. Fourth, although more granular data—such as census block groups or blocks—are available from the US Census Bureau, we chose census tracts as our unit of analysis to reduce sampling error that emerges from the use of such smaller geographies. Last, we measured census tract poverty rather than other contextual markers of one’s neighborhood, like vacant housing or the proportion of those receiving public benefits. However, these measures are often highly correlated with census tract poverty.40
CONCLUSION
Census tract poverty, race, and insurance were each associated with an increased likelihood of hospitalization for DKA. However, in a multivariable model, the effect of race was reduced so it was no longer significant, indicating that racial differences in DKA hospitalization are at least partially explained by differences in socioeconomic factors. The severity of DKA presentation did not differ by census tract poverty or insurance, although Black patients experienced differences in care despite similar markers of DKA severity. Addressing contextual factors—such as social determinants of health and racism—is warranted for future interventions that aim to eliminate equity gaps for T1D patients.
1. Mayer-Davis EJ, Lawrence JM, Dabelea D, et al. Incidence trends of type 1 and type 2 diabetes among youths, 2002–2012. N Engl J Med. 2017;376(15):1419-1429. https://doi.org/10.1056/NEJMoa1610187
2. Writing Group for the DCCT/EDIC Research Group, Orchard TJ, Nathan DM, et al. Association between 7 years of intensive treatment of type 1 diabetes and long-term mortality. JAMA. 2015;313(1):45-53. https://doi.org/10.1001/jama.2014.16107
3. Wood JR, Miller KM, Maahs DM, et al. Most youth with type 1 diabetes in the T1D Exchange Clinic Registry do not meet American Diabetes Association or International Society for Pediatric and Adolescent Diabetes clinical guidelines. Diabetes Care. 2013;36(7):2035-2037. https://doi.org/10.2337/dc12-1959
4. Benoit SR. Trends in diabetic ketoacidosis hospitalizations and in-hospital mortality—United States, 2000–2014. MMWR Morb Mortal Wkly Rep. 2018;67(12):362-365. https://doi.org/10.15585/mmwr.mm6712a3
5. Tieder JS, McLeod L, Keren R, et al. Variation in resource use and readmission for diabetic ketoacidosis in children’s hospitals. Pediatrics. 2013;132(2):229-236. https://doi.org/10.1542/peds.2013-0359
6. Moffett MA, Buckingham JC, Baker CR, Hawthorne G, Leech NJ. Patients’ experience of admission to hospital with diabetic ketoacidosis and its psychological impact: an exploratory qualitative study. Practical Diabetes. 2013;30(5):203-207. https://doi.org/10.1002/pdi.1777
7. Maahs DM, Hermann JM, Holman N, et al. Rates of diabetic ketoacidosis: international comparison with 49,859 pediatric patients with type 1 diabetes from England, Wales, the U.S., Austria, and Germany. Diabetes Care. 2015;38(10):1876-1882. https://doi.org/10.2337/dc15-0780
8. Malik FS, Hall M, Mangione-Smith R, et al. Patient characteristics associated with differences in admission frequency for diabetic ketoacidosis in United States children’s hospitals. J Pediatr. 2016;171:104-110. https://doi.org/10.1016/j.jpeds.2015.12.015
9. Manickam RN, Mu Y, Kshirsagar AV, Bang H. Area-level poverty and excess hospital readmission ratios. Am J Med. 2017;130(4):e153-e155. https://doi.org/10.1016/j.amjmed.2016.08.047
10. Beck AF, Moncrief T, Huang B, et al. Inequalities in neighborhood child asthma admission rates and underlying community characteristics in one US county. J Pediatr. 2013;163(2):574-580.e1. https://doi.org/10.1016/j.jpeds.2013.01.064
11. Everett E, Mathioudakis N. Association of area deprivation and diabetic ketoacidosis readmissions: comparative risk analysis of adults vs children with type 1 diabetes. J Clin Endocrinol Metab. 2019;104(8):3473-3480. https://doi.org/10.1210/jc.2018-02232
12. U.S. Census Bureau. QuickFacts: Hamilton County, Ohio. Accessed March 2, 2020. https://www.census.gov/quickfacts/hamiltoncountyohio
13. Witsch M, Kosteria I, Kordonouri O, et al. Possibilities and challenges of a large international benchmarking in pediatric diabetology—the SWEET experience. Pediatr Diabetes. 2016;17(S23):7-15. https://doi.org/10.1111/pedi.12432
14. U.S. Census Bureau. Glossary. Accessed April 22, 2021. https://www.census.gov/programs-surveys/geography/about/glossary.html
15. U.S. Census Bureau. Geographic areas reference manual. Chapter 10: Census tracts and block numbering areas. Accessed April 22, 2021. https://www.census.gov/programs-surveys/geography/guidance/geographic-areas-reference-manual.html
16. Krieger N, Chen JT, Waterman PD, Rehkopf DH, Subramanian SV. Painting a truer picture of US socioeconomic and racial/ethnic health inequalities: The Public Health Disparities Geocoding Project. Am J Public Health. 2005;95(2):312-323. https://doi.org/10.2105/AJPH.2003.032482
17. Kitabchi AE, Umpierrez GE, Murphy MB, et al. Management of hyperglycemic crises in patients with diabetes. Diabetes Care. 2001;24(1):131-153. https://doi.org/10.2337/diacare.24.1.131
18. Lawson S, Redel JM, Smego A, et al. Assessment of a day hospital management program for children with type 1 diabetes. JAMA Netw Open. 2020;3(3):e200347. https://doi.org/10.1001/jamanetworkopen.2020.0347
19. Andrist E, Riley CL, Brokamp C, Taylor S, Beck AF. Neighborhood poverty and pediatric intensive care use. Pediatrics. 2019;144(6):e20190748. https://doi.org/10.1542/peds.2019-0748
20. Govan L, Maietti E, Torsney B, et al. The effect of deprivation and HbA1c on admission to hospital for diabetic ketoacidosis in type 1 diabetes. Diabetologia. 2012;55(9):2356-2360. https://doi.org/10.1007/s00125-012-2601-6
21. U.S. Department of Health and Human Services. Healthy People 2030—Social Determinants of Health. Accessed May 13, 2021. https://health.gov/healthypeople/objectives-and-data/social-determinants-health
22. Berkowitz SA, Karter AJ, Corbie-Smith G, et al. Food insecurity, food “deserts,” and glycemic control in patients with diabetes: a longitudinal analysis. Diabetes Care. 2018;41(6):1188-1195. https://doi.org/10.2337/dc17-1981
23. Nguyen TM, Mason KJ, Sanders CG, Yazdani P, Heptulla RA. Targeting blood glucose management in school improves glycemic control in children with poorly controlled type 1 diabetes mellitus. J Pediatr. 2008;153(4):575-578. https://doi.org/10.1016/j.jpeds.2008.04.066
24. Izquierdo R, Morin PC, Bratt K, et al. School-centered telemedicine for children with type 1 diabetes mellitus. J Pediatr. 2009;155(3):374-379. https://doi.org/10.1016/j.jpeds.2009.03.014
25. Council on Community Pediatrics and Committee on Native American Child Health. Policy statement—health equity and children’s rights. Pediatrics. 2010;125(4):838-849. https://doi.org/10.1542/peds.2010-0235
26. Braveman P. What are health disparities and health equity? We need to be clear. Public Health Rep. 2014;129(suppl 2):5-8.
27. Palmas W, March D, Darakjy S, et al. Community health worker interventions to improve glycemic control in people with diabetes: a systematic review and meta-analysis. J Gen Intern Med. 2015;30(7):1004-1012. https://doi.org/10.1007/s11606-015-3247-0
28. Lipman TH, Smith JA, Hawkes CP. Community health workers and the care of children with type 1 diabetes. J Pediatr Nurs. 2019;49:111-112. https://doi.org/10.1016/j.pedn.2019.08.014
29. Bergenstal RM, Gal RL, Connor CG, et al. Racial differences in the relationship of glucose concentrations and hemoglobin A1c levels. Ann Intern Med. 2017;167(2):95-102. https://doi.org/10.7326/M16-2596
30. Agarwal S, Kanapka LG, Raymond JK, et al. Racial-ethnic inequity in young adults with type 1 diabetes. J Clin Endocrinol Metab. 2020;105(8):e2960-e2969. https://doi.org/10.1210/clinem/dgaa236
31. Addala A, Auzanneau M, Miller K, et al. A decade of disparities in diabetes technology use and HbA1c in pediatric type 1 diabetes: a transatlantic comparison. Diabetes Care. 2021;44(1):133-140. https://doi.org/10.2337/dc20-0257
32. Lipman TH, Smith JA, Patil O, Willi SM, Hawkes CP. Racial disparities in treatment and outcomes of children with type 1 diabetes. Pediatr Diabetes. 2021;22(2):241-248. https://doi.org/10.1111/pedi.13139
33. Boyd RW, Lindo EG, Weeks LD, McLemore MR. On racism: a new standard for publishing on racial health inequities. Health Affairs. Accessed July 9, 2020. https://www.healthaffairs.org/do/10.1377/hblog20200630.939347/full/
34. Jones CP. Levels of racism: a theoretic framework and a gardener’s tale. Am J Public Health. 2000;90(8):1212-1215. https://doi.org/10.2105/AJPH.90.8.1212
35. Jacoby SF, Dong B, Beard JH, Wiebe DJ, Morrison CN. The enduring impact of historical and structural racism on urban violence in Philadelphia. Soc Sci Med. 2018;199:87-95. https://doi.org/10.1016/j.socscimed.2017.05.038
36. Bailey ZD, Krieger N, Agénor M, Graves J, Linos N, Bassett MT. Structural racism and health inequities in the USA: evidence and interventions. Lancet. 2017;389(10077):1453-1463. https://doi.org/10.1016/S0140-6736(17)30569-X
37. Reardon SF, Fox L, Townsend J. Neighborhood income composition by household race and income, 1990–2009. Ann Am Acad Pol Soc Sci. 2015;660(1):78-97. https://doi.org/10.1177/0002716215576104
38. Cooper LA, Roter DL, Carson KA, et al. The associations of clinicians’ implicit attitudes about race with medical visit communication and patient ratings of interpersonal care. Am J Public Health. 2012;102(5):979-987. https://doi.org/10.2105/AJPH.2011.300558
39. Lawton J, Waugh N, Noyes K, et al. Improving communication and recall of information in paediatric diabetes consultations: a qualitative study of parents’ experiences and views. BMC Pediatr. 2015;15:67. https://doi.org/10.1186/s12887-015-0388-6
40. Brokamp C, Beck AF, Goyal NK, Ryan P, Greenberg JM, Hall ES. Material community deprivation and hospital utilization during the first year of life: an urban population-based cohort study. Ann Epidemiol. 2019;30:37-43. https://doi.org/10.1016/j.annepidem.2018.11.008
© 2021 Society of Hospital Medicine
Continuing Cardiopulmonary Symptoms, Disability, and Financial Toxicity 1 Month After Hospitalization for Third-Wave COVID-19: Early Results From a US Nationwide Cohort
For many patients hospitalized with COVID-19, the impact of the illness continues well beyond hospital discharge.1 Heavy burdens of persistent symptoms have been reported, albeit often from regional and single-hospital samples.2-7 Critically, not all initial reports capture information on pre-COVID-19 symptom burden, so it is unclear whether these highly prevalent problems are truly new; an alternative explanation might be that patients already with symptoms were more likely to be infected with or seek care for SARS-CoV-2.8
Fewer data are available about patients’ abilities to go about the activities of their lives, nor is as much known about the relationships between new symptoms and other impacts. Most of the available information is from health systems during the initial surge of COVID-19 in early 2020—when testing for SARS-CoV-2 was limited even in the inpatient setting; when hospitals’ postdischarge care systems may have been heavily disrupted; and when clinicians were often reasonably focused primarily on reducing mortality in their first cases of COVID-19 rather than promoting recovery from an often-survivable illness. Increasing evidence shows that the inpatient case-fatality rate of COVID-19 is improving over time9,10; this makes unclear the generalizability of outcomes data from early COVID-19 patients to more recent patients.11
Therefore, we report multicenter measurements of incident levels of persistent cardiopulmonary symptoms, disability, return to baseline, and impact on employment among a recent cohort of COVID-19 patients hospitalized around the United States during the “third wave” of COVID-19—fall and winter 2020-2021. We focus on the 1-month time point after hospital discharge, as this time point is still in the early vulnerable period during which hospital transition-of-care programs are understood to have responsibility.
METHODS
The first 253 patients who completed 1-month postdischarge telephone follow-up surveys from the ongoing nationwide BLUE CORAL study were included. BLUE CORAL will enroll up to 1,500 hospitalized COVID-19 patients at 36 US centers (the identities of which are reported in Appendix 1) as a part of the National Heart, Lung, and Blood Institute’s Prevention and Early Treatment of Acute Lung Injury (PETAL) Network. We report here on survey questions that allowed for a clear comparison to be made between 1-month follow-up responses and pre-COVID baseline variables; these comparisons were based on (1) previous in-hospital assessment; (2) explicitly asking patients to compare to pre-COVID-19 levels; or (3) explicitly asking patients for changes in relation to their COVID-19 hospitalization. Items were chosen for inclusion in this report without looking at their association with other variables.
This research was approved by the Vanderbilt Institutional Review Board (IRB), serving as central IRB for the PETAL Network; patients or their surrogates provided informed consent.
Participants
Patients with COVID-19 were identified during hospitalization and within 14 days of a positive molecular test for SARS-CoV-2. Eligible patients presented with fever and/or respiratory signs/symptoms, such as hypoxemia, shortness of breath, or infiltrates on chest imaging. Patients were enrolled within the first 72 hours of hospitalization (in order to avoid oversampling patients with relatively longer stays, and to study the biology of early COVID-19), and excluded if they had comfort-care orders (because of their limited likelihood of surviving to follow-up), or were incarcerated (because of difficulties in obtaining truly open informed consent and likely difficulties in follow-up). Pertinently, patients were not required to be in the intensive care unit.
Surviving patients who spoke English or Spanish, were not homeless on hospital admission, and were neither significantly disabled nor significantly cognitively impaired were eligible for follow-up. “Not significantly disabled” was defined as having limitations due to health on no more than three activities of daily living before their COVID-19 hospitalization, as assessed at BLUE CORAL enrollment; this was chosen because of the potentially limited sensitivity of many of our questionnaires to detect an impact of COVID-19 in patients with greater than this level of disability. We included patients who were able to consent for themselves in the study, or for whom the legally appointed representative consenting on their behalf in the hospital reported no evidence of cognitive impairment, defined as no more than four of the problems on the eight-item Alzheimer’s Dementia (AD8) scale.12-14
Data Collection
One-month surveys were administered to patients or, when necessary, their proxies; the complete English- and Spanish-language instruments are presented in Appendix 2. Study data were collected and managed using REDCap electronic data capture tools hosted at the University of Michigan.15,16
Patients were contacted via phone by trained interviewers beginning 21 days after hospital discharge; interviews were completed a median of 47 days after discharge (interquartile range [IQR], 26-61). Efforts prioritized former patients completing surveys themselves by phone, but a well-informed proxy was approached if needed. Proxies, who included spouses, adult children, or other relatives, family friends, or primary caregivers, were in regular contact with the patient and understood the patient’s health status. If necessary, the survey could be completed over multiple phone calls, and a written, mail-back option was available. Other best practices in accurate survey data collection and cohort retention were used.17-19 Participants were given a $10 gift card.
New cardiopulmonary symptoms were queried with symptom-targeted questions informed by the Airways Questionnaire 20,20 the Kansas City Cardiomyopathy Questionnaire,21,22 and the Seattle Angina Questionnaire.23 Whenever a respondent reported a given symptom, they were asked, “Compared to 1 month before your COVID-19 hospitalization, is this better, worse, or about the same?” We counted the number of symptoms which the patient reported as worse.
Using wording from the Health and Retirement Study,24 disability was assessed based on a self-report of any of 14 health-related limitations in activities of daily living or instrumental activities of daily living, as in past studies25: dressing, walking across a room, bathing, eating, getting out of bed, using a toilet, using a map, preparing a hot meal, shopping for groceries, making a phone call, taking medications, paying bills, carrying 10 lb (eg, a heavy bag of groceries), and, as a combined single item, stooping, kneeling, or crouching. Well-chosen proxy reports appear reliable for these items.26 We counted the number of activities for which the patient reported a limitation, comparing those reported at 1 month to those reported during the in-hospital survey assessing pre-illness functioning.
The financial consequences of the COVID-19 hospitalization were assessed in two ways. First, we used a modified version of a World Health Organization Disability Assessment Schedule (WHODAS) 2.0 question27: “Since your COVID-19 hospitalization, how much has your health been a drain on the financial resources of you or your family?” Second, we used the financial toxicity items developed with the Mi-COVID19 study3 based on extensive qualitative interviews with respiratory failure survivors28; these questions were anchored explicitly on “the financial cost of dealing with your COVID-19 hospitalization and related care.”
Data Analysis
There were few missing data, and almost all were on outcome variables. Where present, the degree of missingness is reported and casewise deletion used. Because this was a planned early look at responses to an ongoing survey, with analysis based on the number of accrued responses, the ultimate denominator for response rate calculation is unknown. Therefore, two bounds are presented—the minimum, on the assumption that all remaining uncompleted surveys will be missed; and the maximum, as if the uncompleted surveys were not yet in the eligible denominator.
Variables were summarized with medians and IQRs. Multilevel logistic regression was used to test for differences across demographic characteristics in the rates of development of any new symptom or disability; site-level differences were modeled using a random effect. Gender, race/ethnicity, and age were included in all regressions unless noted otherwise; age was included with both linear and quadratic terms when used as a control variable. For the degree of return to baseline and for the number of new limitations in activities of daily living, we explored associations as dichotomized variables (any/none, using multilevel logistic regression) and as continuous variables (using multilevel linear regression). Percent of variance explained was calculated using the R2 in unadjusted linear regression, and Spearman rank correlations were used to allow nonlinearities in comparisons across outcomes. All adjusted models are presented in Appendix Table 1. Analyses were conducted in Stata 16.1 (StataCorp, 2020); analytic code is presented in Appendix 3, and a log file of all analyses is in Appendix 4.
RESULTS
The 250th 1-month follow-up was completed on February 26, 2021. One month prior, 647 patients had been recruited at 26 centers in the inpatient phase of the study. Patient demographics for the 253 patients surveyed through that date are shown in Appendix Table 2. On the day of the early look at the data, 460 patients had become eligible for 1-month follow-up and 64 patients had been missed for 1-month follow-up (maximum response rate of 79.8%, minimum possible final response rate of 55.0%) (Figure 1). Seven surveys were completed by proxies. Respondents’ median age was 60 years (IQR, 45-68), and 111 (43.4%) were female. Their median hospital length of stay was 5 days(IQR, 3-8) . A total of 236 (93.3%) patients were discharged home, including 197 (77.9%) without home care services and 39 (15.4%) with home care services.
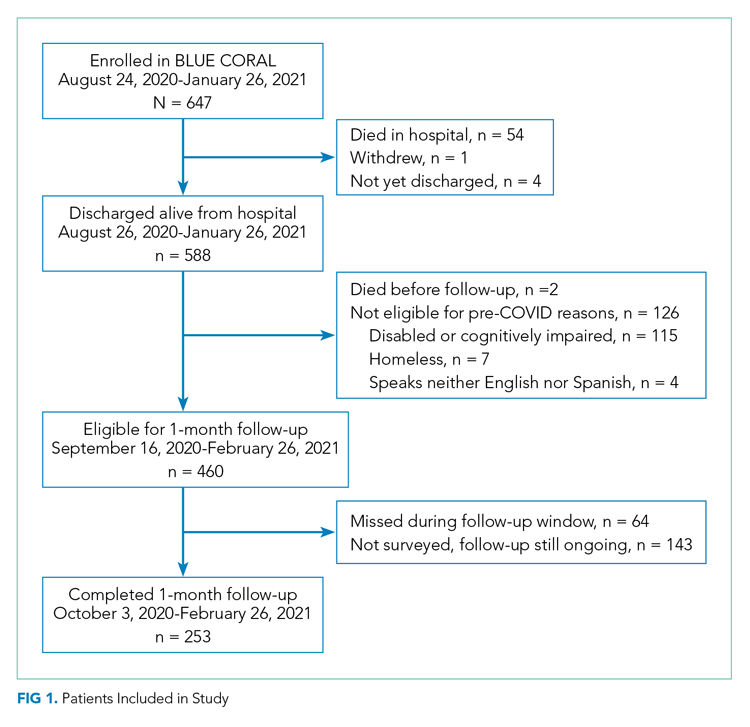
One hundred and thirty-nine patients (56.5%; 95% CI, 50.1%-62.8%) reported at least one new or worsened cardiopulmonary symptom after their COVID-19 hospitalization (Table; seven patients did not respond to these questions). Most patients with new symptoms had one (48 [19.5%]; 95% CI, 14.8%-25.0%) or two (32 [13%]; 95% CI, 9.7%-17.7%) of the new symptoms queried. The most common new cardiopulmonary symptom was cough, reported by 57 (23.2%; 95% CI, 18.0%-29.0%) patients. New oxygen use was reported by 28 (11.4%; 95% CI, 7.7%-16.0%) patients, with another 11 (4.5%; 95% CI, 2.3%-7.9%) reporting increased oxygen requirements. Women were twice as likely as men to report any new cardiopulmonary symptom (adjusted odds ratio [aOR], 2.24; 95% CI, 1.29-3.90) and non-Hispanic Black and Hispanic patients were less likely than White patients to report new symptoms (aOR, 0.31; 95% CI, 0.12-0.83; and aOR, 0.38; 95% CI, 0.21-0.71, respectively). Longer lengths of hospital stay were associated with greater 1-month cardiopulmonary symptoms (aOR, 1.82 per additional week in the hospital; 95% CI, 1.11-2.98), but discharge destination was not (aOR, 0.92; 95% CI, 0.39-1.71).
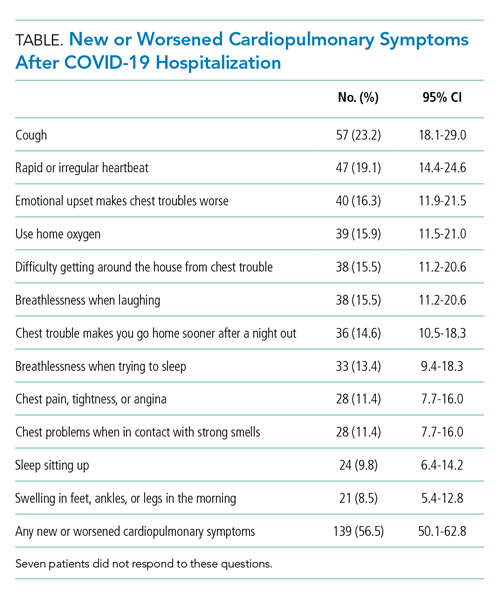
New limitations in activities of daily living or instrumental activities of daily living were present in 130 (52.8%; 95% CI, 46.4%-59.5%) patients (seven not responding), all of whom had 0 to 3 limitations before their COVID-19 hospitalization. Indeed, 62 (25.2%; 95% CI, 19.9%-31.1%) reported 3 or more new health-related limitations in activities of daily living or instrumental activities of daily living compared to their pre-COVID-19 baseline, as assessed separately during their hospitalization (Figure 2; rates of limitations in individual activities are shown in Appendix Table 3). Older patients were more likely to report a new health-related limitation, and Hispanic patients were less likely to have a new limitation. New limitations were common among patients discharged home without home health services. The number of new cardiopulmonary symptoms explained 11.2% of the variance in the number of new limitations in activities of daily living, a Spearman rank correlation of 0.30 (P < .0001; see Appendix Table 4). More than three in four COVID-19 patients reported new or worsened cardiopulmonary symptoms or new health-related limitations in activities of daily living at 1 month—only 62 (24.5%) patients reported neither.
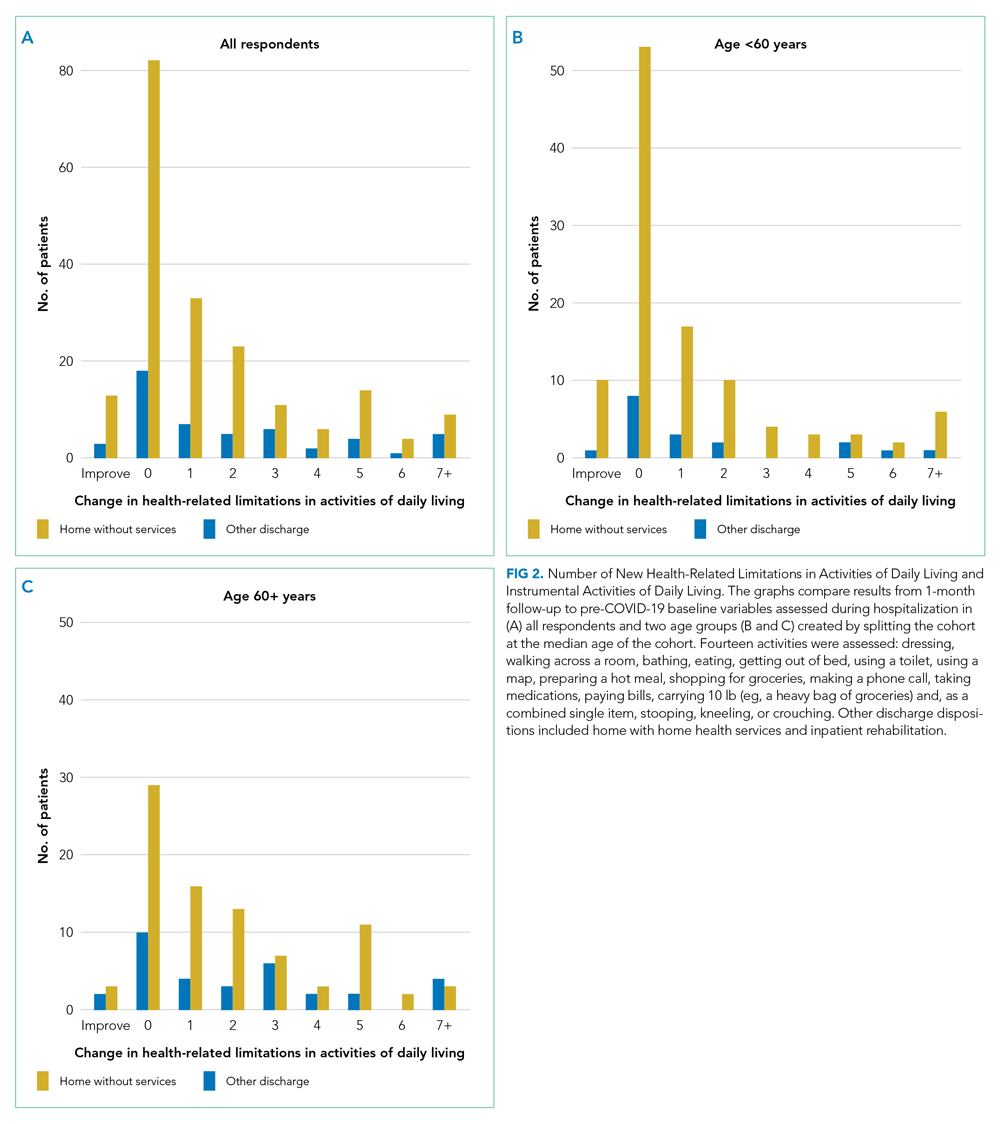
At 1 month after hospital discharge, 213 (84.2%) patients reported that they were not fully back to their pre-COVID-19 level of functioning (3 declined to answer the question). When asked, “On a scale of 1 to 100, with 100 being all the way back to what you could do before COVID, how close to being back are you?” the median response was 80, with an IQR of 64-95 (Figure 3). Forty-two (16.8%; 95% CI, 12.4%-22.0%) patients reported a level of 50 or below. Women and older patients reported lower levels of return of functioning, as did those with longer hospital stays and new or worsened cardiopulmonary symptoms. Each additional week in hospital length of stay was associated with a 7.5-point lower response to the question (95% CI, –11.2 to –3.8), but discharge destination was not associated with the answer after adjusting for demographics. Patients with and without new limitations in activities of daily living and with and without new cardiopulmonary symptoms were found across the range of self-reported degree of recovery, although patients without a new problem in one of those domains were rarer among those reporting recovery of less than 70. The number of new cardiopulmonary symptoms explained 19.7% of the variance in the response to this question, a Spearman rank correlation of 0.47 (P < .0001).
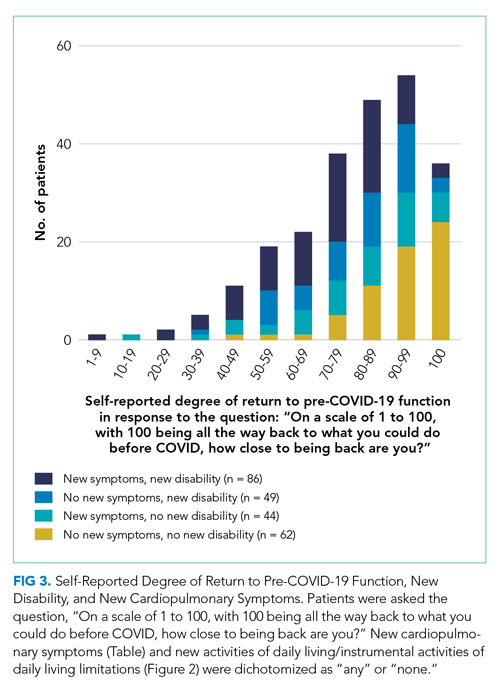
More than half of respondents (115 [55.0%]; 95% CI, 48.0%-61.9%; 44 not responding) stated that their COVID-19 hospitalization had been a drain on the finances of their family; 53 (25.4%; 95% CI, 19.6%-31.8%; 44 not responding) rated that drain as moderate, severe, or extreme within the first month after hospital discharge. Forty-nine patients (19.8%; 95% CI, 15.1%-25.4%; 6 not responding) reported that they had to change their work because of their COVID-19 hospitalization, and 93 patients (37.8%; 95% CI, 31.7%-44.2%; 7 not responding) reported that a loved one had taken time off work to care for them. Altogether, one in five COVID-19 patients reported that, within the first month after hospital discharge, they used all or most of their savings because of their COVID-19 illness or hospitalization (58 [23.2%]; 95% CI, 18.1%-29.9%; 3 not responding). There were no demographic differences in the likelihood of losing a job or having a loved one take time off for caregiving, but non-Hispanic Black and Hispanic patients were much more likely to report having used all or most of their savings (aOR, 2.96; 95% CI, 1.09-8.04; and aOR, 2.68; 95% CI, 1.35-5.31, respectively) than White patients. Hospital length of stay and discharge destination were not consistently associated with these financial toxicities. The development of new or worsened cardiopulmonary symptoms was not associated with job change or having a caregiver take time off but was associated with increased likelihood of having used all or most savings (aOR, 2.30; 95% CI, 1.12-4.37).
DISCUSSION
In a geographically and demographically diverse national US cohort, we found that a decline in perceived health, new or worsened cardiopulmonary symptoms, new limitations in activities of daily living, and new financial stresses were common among patients hospitalized during the US third wave of COVID-19 at 1 month after hospital discharge. The new cardiopulmonary symptoms were significantly associated with the self-report of incomplete recovery and financial stress, but less closely associated with incident disability, inability to work, and caregiving receipt. There were not consistent differences between any demographic groups on these outcomes. Patients with longer lengths of stay generally reported more problems. New problems were very common among patients discharged directly home without home health services.
These data suggest a broad range of new problems among survivors of COVID-19 hospitalization. Moreover, these problems are not well-correlated with each other. This raises the possibility that there may be multiple phenotypes of post-acute sequelae after COVID-19 hospitalization. It is not clear to what extent these differences are mediated by differences in tissue damage from or immunologic response to SARS-CoV-2, distinct from or interacting with other elements of treatment, hospitalization, or the illness experience. The degree of financial stress, savings loss, and job dislocation reported here suggests these patients will face substantial challenges in guiding their own recovery in the absence of a dedicated set of services.28,29The persistent symptoms faced by these COVID-19 patients can be considered in the context of post-acute sequelae among survivors of community-acquired pneumonia in previous studies, as summarized in a recent systematic review.30 For example, only 35% of a large cohort of adults with community-acquired pneumonia who were evaluated in the emergency department were completely free of pneumonia-related symptoms 6 weeks after antibiotic therapy.31,32 Limitations in activities of daily living have been reported at 1 month after community-acquired pneumonia33; rehospitalization and early post-discharge mortality rates may also be similar.34,35 These findings suggest that the persistent problems of both COVID-19 and other pneumonia patients may highlight important opportunities for improvements in healthcare systems,36 and that burdensome postacute sequelae of COVID-19 may not be attributable solely to distinctive features of the SARS-CoV-2 virus.
A majority of patients discharged home without home health services reported new difficulties in their activities of daily living; 77% of patients with new disability at 1 month had been discharged without home services. These data, however, do not show to what extent this lack of home health services resulted from lack of referral for services, home health provider unavailability, or patient refusal of recommended services. Nonetheless, this nonreceipt of home health services may have been consequential. Among hospitalized patients recovering from pneumonia pre-COVID, the use of post-hospital physical and occupational therapy was associated with reduced risk of readmissions and death.37 This association was greater among patients with lower baseline mobility scores and in patients discharged to home directly. Further, the risk of poor outcomes decreased in a dose-response fashion with increased post-hospital therapy delivery. Failure to provide services for postdischarge disability was previously identified as a potential vulnerability of patients during COVID-19.38
This study adds to the literature. The focus on sequelae perceived by the patient to be incident, as distinguished from symptoms and disability existing before COVID-19, increases the likelihood that these data reflect the influence of the COVID-19 hospitalization. These data emphasize that, despite relatively brief hospitalizations, diverse problems are quite common and consequential for patients’ ability to return to their pre-COVID-19 roles. They further add to the literature by demonstrating the relatively loose coupling between various ways in which postacute sequelae of COVID-19 might be defined: the cardiopulmonary symptoms examined here, the patient’s reported completeness of recovery, the financial stresses the hospitalization placed on the patient and their family, or the development of new limitations in activities of daily living.
Our findings highlight a potential second public health crisis from COVID, related to post-COVID recovery, resulting from the incident disability and economic loss among COVID survivors. While much attention is paid to deaths from COVID, there is less (albeit growing) recognition of the long-term consequences in survivors of COVID-19.39 The downstream economic impacts from job loss and financial insolvency for COVID-19 survivors have ramifications for caregivers, family units that include dependents, and the broader US economy—and may do so for generations if uncorrected, as has been suggested after the 1918 influenza pandemic.40 These data may, indeed, look worse at later follow-up given the delay in hospital billing and new expenses in the wake of illness and hospitalization.28,36,41 It is important that the healthcare system and policymakers consider early investments in post-hospital rehabilitation and adaptive services to allow workers to return to the workforce as soon as possible, and prepare for an increased need for financial support for recovering COVID patients.42
Importantly, these data cannot distinguish between the impact of SARS-CoV-2 infection itself from the treatment received for COVID-19 or other non-COVID-19-specific aspects of hospital care. COVID-19 inpatient case fatality rates and management have changed over time, and so generalizability to future cohorts is unknown.9-11 This cohort was recruited in the inpatient setting at largely teaching hospitals; therefore, these patients’ experience may be not be representative of all hospitalized COVID-19 patients during this time period. The generalizability of hospital-based studies to patients not hospitalized for COVID-19 remains a subject of active inquiry. We only interviewed patients who were not homeless (excluding 7 of 588 eligible, 1.2%) and who spoke English or Spanish (excluding 4 of 588 eligible, 0.7%); these and other inclusion/exclusion criteria should be considered when evaluating the generalizability of these findings to other patients. We did not prospectively collect measures of fatigue to examine this important and complex symptom, nor did we evaluate outpatient therapy. Finally, self-report was used, rather than using objective measurements of what the patient did or did not do in their home environment. This is consistent with clinical practice that emphasizes patients as primary reporters of their present state, but may introduce measurement error compared to more invasive strategies if those are considered the gold standard.
Conclusion
Patients who survived hospitalization from COVID-19 during the period of August 2020 to January 2021 continued to face significant burdens of new cardiopulmonary symptoms, incomplete recovery, disability, and financial toxicity, all of which extend to patients discharged directly home without services. The correlations between these potential symptoms are no more than partial, and an exclusive focus on one area may neglect other areas of patient need.
Acknowledgments
The authors thank the patients and families of the Biology and Longitudinal Epidemiology: COVID-19 Observational (BLUE CORAL) study for their generous sharing of their time with us. We acknowledge Hallie C Prescott (University of Michigan and VA Ann Arbor) for her assistance in developing the financial toxicity questions.
1. Rajan S, Khunti K, Alwan N, et al. In the Wake of the Pandemic: Preparing for Long COVID. World Health Organization, Regional Office for Europe; 2021.
2. Bowles KH, McDonald M, Barrón Y, Kennedy E, O’Connor M, Mikkelsen M. Surviving COVID-19 after hospital discharge: symptom, functional, and adverse outcomes of home health recipients. Ann Intern Med. 2021;174(3):316-325. https://doi.org/10.7326/M20-5206
3. Chopra V, Flanders SA, O’Malley M, Malani AN, Prescott HC. Sixty-day outcomes among patients hospitalized with COVID-19. Ann Intern Med. 2021;174(4):576-578. https://doi.org/10.7326/M20-5661
4. Bellan M, Soddu D, Balbo PE, et al. Respiratory and psychophysical sequelae among patients with COVID-19 four months after hospital discharge. JAMA Netw Open. 2021;4(1):e2036142. https://doi.org/10.1001/jamanetworkopen.2020.36142
5. Huang C, Huang L, Wang Y, et al. 6-month consequences of COVID-19 in patients discharged from hospital: a cohort study. Lancet. 2021;397(10270):220-232. https://doi.org/10.1016/S0140-6736(20)32656-8
6. Robillard R, Daros AR, Phillips JL, et al. Emerging new psychiatric symptoms and the worsening of pre-existing mental disorders during the COVID-19 pandemic: a Canadian multisite study. Can J Psychiatry. 2021 Jan 19. [Epub ahead of print] https://doi.org/10.1177/0706743720986786
7. Logue JK, Franko NM, McCulloch DJ, et al. Sequelae in adults at 6 months after COVID-19 infection. JAMA Netw Open. 2021;4(2):e210830. https://doi.org/10.1001/jamanetworkopen.2021.0830
8. Fan VS, Dominitz JA, Eastment MC, et al. Risk factors for testing positive for SARS-CoV-2 in a national US healthcare system. Clin Infect Dis. 2020 Oct 27. [Epub ahead of print] https://doi.org/10.1093/cid/ciaa1624
9. Prescott HC, Levy MM. Survival from severe coronavirus disease 2019: is it changing? Crit Care Med. 2021;49(2):351-353. https://doi.org/10.1097/CCM.0000000000004753
10. Nguyen NT, Chinn J, Nahmias J, et al. Outcomes and mortality among adults hospitalized with COVID-19 at US medical centers. JAMA Netw Open. 2021;4(3):e210417. https://doi.org/10.1001/jamanetworkopen.2021.0417
11. Iwashyna TJ, Angus DC. Declining case fatality rates for severe sepsis: good data bring good news with ambiguous implications. JAMA. 2014;311(13):1295-1297. https://doi.org/10.1001/jama.2014.2639
12. Galvin JE, Roe CM, Coats MA, Morris JC. Patient’s rating of cognitive ability: using the AD8, a brief informant interview, as a self-rating tool to detect dementia. Arch Neurol. 2007;64(5):725-730. https://doi.org/10.1001/archneur.64.5.725
13. Galvin JE, Roe CM, Xiong C, Morris JC. Validity and reliability of the AD8 informant interview in dementia. Neurology. 2006;67(11):1942-1948. https://doi.org/10.1212/01.wnl.0000247042.15547.eb
14. Galvin JE, Roe CM, Powlishta KK, et al. The AD8: a brief informant interview to detect dementia. Neurology. 2005;65(4):559-564. https://doi.org/10.1212/01.wnl.0000172958.95282.2a
15. Harris PA, Taylor R, Thielke R, Payne J, Gonzalez N, Conde JG. Research electronic data capture (REDCap)--a metadata-driven methodology and workflow process for providing translational research informatics support. J Biomed Inform. 2009;42(2):377-381. https://doi.org/10.1016/j.jbi.2008.08.010
16. Harris PA, Taylor R, Minor BL, et al. The REDCap consortium: building an international community of software platform partners. J Biomed Inform. 2019;95:103208. https://doi.org/10.1016/j.jbi.2019.103208
17. Robinson KA, Dinglas VD, Sukrithan V, et al. Updated systematic review identifies substantial number of retention strategies: using more strategies retains more study participants. J Clin Epidemiol. 2015;68(12):1481-1487. https://doi.org/10.1016/j.jclinepi.2015.04.013
18. Groves RM, Fowler FJ, Couper MP, Lepkowski JM, Singer E, Tourangeau R. Survey Methodology. 2nd ed. Wiley; 2009.
19. Lynn P. Methodology of Longitudinal Studies. Wiley; 2009.
20. Quirk F, Jones P. Repeatability of two new short airways questionnaires. Thorax. 1994;49:1075.
21. Pettersen KI, Reikvam A, Rollag A, Stavem K. Reliability and validity of the Kansas City cardiomyopathy questionnaire in patients with previous myocardial infarction. Eur J Heart Fail. 2005;7(2):235-242. https://doi.org/10.1016/j.ejheart.2004.05.012
22. Green CP, Porter CB, Bresnahan DR, Spertus JA. Development and evaluation of the Kansas City Cardiomyopathy Questionnaire: a new health status measure for heart failure. J Am Coll Cardiol. 2000;35(5):1245-1255. https://doi.org/10.1016/s0735-1097(00)00531-3
23. Spertus JA, Winder JA, Dewhurst TA, et al. Development and evaluation of the Seattle Angina Questionnaire: a new functional status measure for coronary artery disease. J Am Coll Cardiol. 1995;25(2):333-341. https://doi.org/10.1016/0735-1097(94)00397-9
24. Fonda S, Herzog AR. Documentation of Physical Functioning Measured in the Health and Retirement Study and the Asset and Health Dynamics Among the Oldest Old Study. Institute for Social Research Survey Research Center; 2004.
25. National Heart, Lung, and Blood Institute PETAL Clinical Trials Network; Moss M, Huang DT, Brower RG, et al. Early neuromuscular blockade in the acute respiratory distress syndrome. N Engl J Med. 2019;380(21):1997-2008. https://doi.org/10.1056/NEJMoa1901686
26. Ahasic AM, Van Ness PH, Murphy TE, Araujo KL, Pisani MA. Functional status after critical illness: agreement between patient and proxy assessments. Age Ageing. 2015;44(3):506-510. https://doi.org/10.1093/ageing/afu163
27. Üstün T, Kostanjsek N, Chatterji S, Rehm J. Measuring Health and Disability: Manual for WHO Disability Assessment Schedule WHODAS 2.0. World Health Organization; 2010.
28. Hauschildt KE, Seigworth C, Kamphuis LA, et al. Financial toxicity after acute respiratory distress syndrome: a national qualitative cohort study. Crit Care Med. 2020;48(8):1103-1110. https://doi.org/10.1097/CCM.0000000000004378
29. Watkins-Taylor C. Remaking a Life: How Women Living with HIV/AIDS Confront Inequality. University of California Press; 2019.
30. Pick HJ, Bolton CE, Lim WS, McKeever TM. Patient-reported outcome measures in the recovery of adults hospitalised with community-acquired pneumonia: a systematic review. Eur Respir J. 2019;53(3):1802165. https://doi.org/1183/13993003.02165-2018
31. Marrie TJ, Lau CY, Wheeler SL, Wong CJ, Feagan BG. Predictors of symptom resolution in patients with community-acquired pneumonia. Clin Infect Dis. 2000;31(6):1362-1367. https://doi.org/10.1086/317495
32. Wyrwich KW, Yu H, Sato R, Powers JH. Observational longitudinal study of symptom burden and time for recovery from community-acquired pneumonia reported by older adults surveyed nationwide using the CAP Burden of Illness Questionnaire. Patient Relat Outcome Meas. 2015;6:215-223. https://doi.org/10.2147/PROM.S85779
33. Daniel P, Bewick T, McKeever TM, et al. Healthcare reconsultation in working-age adults following hospitalisation for community-acquired pneumonia. Clin Med (Lond). 2018;18(1):41-46. https://doi.org/10.7861/clinmedicine.18-1-41
34. Donnelly JP, Wang XQ, Iwashyna TJ, Prescott HC. Readmission and death after hospitalization for COVID-19 in a large multihospital system. JAMA. 2021;325(3):304-306. https://doi.org/10.1001/jama.2020.21465
35. Viglianti EM, Prescott HC, Liu V, Escobar GJ, Iwashyna TJ. Individual and health system variation in rehospitalizations the year after pneumonia. Medicine (Baltimore). 2017;96(31):e7695. https://doi.org/10.1097/MD.0000000000007695
36. McPeake J, Boehm LM, Hibbert E, et al. Key components of ICU recovery programs: what did patients report provided benefit? Crit Care Explor. 2020;2(4):e0088. https://doi.org/10.1097/CCE.0000000000000088
37. Freburger JK, Chou A, Euloth T, Matcho B. Variation in acute care rehabilitation and 30-day hospital readmission or mortality in adult patients with pneumonia. JAMA Netw Open. 2020;3(9):e2012979. https://doi.org/10.1001/jamanetworkopen.2020.12979
38. Iwashyna TJ, Johnson AB, McPeake JM, McSparron J, Prescott HC, Sevin C. The dirty dozen: common errors on discharging patients recovering from critical illness. Life in the Fastlane. November 3, 2020. Accessed July 1, 2021. https://litfl.com/the-dirty-dozen-common-errors-on-discharging-patients-recovering-from-critical-illness/
39. Lowenstein F, Davis H. Long Covid is not rare. It’s a health crisis. New York Times. March 17, 2021. Accessed July 1, 2021. https://www.nytimes.com/2021/03/17/opinion/long-covid.html
40. Cook CJ, Fletcher JM, Forgues A. Multigenerational effects of early-life health shocks. Demography. 2019;56(5):1855-1874. https://doi.org/10.1007/s13524-019-00804-3
41. McPeake J, Mikkelsen ME, Quasim T, et al. Return to employment after critical illness and its association with psychosocial outcomes. A systematic review and meta-analysis. Ann Am Thorac Soc. 2019;16(10):1304-1311. https://doi.org/10.1513/AnnalsATS.201903-248OC
42. McPeake JM, Henderson P, Darroch G, et al. Social and economic problems of ICU survivors identified by a structured social welfare consultation. Crit Care. 2019;23(1):153. https://doi.org/10.1186/s13054-019-2442-5
For many patients hospitalized with COVID-19, the impact of the illness continues well beyond hospital discharge.1 Heavy burdens of persistent symptoms have been reported, albeit often from regional and single-hospital samples.2-7 Critically, not all initial reports capture information on pre-COVID-19 symptom burden, so it is unclear whether these highly prevalent problems are truly new; an alternative explanation might be that patients already with symptoms were more likely to be infected with or seek care for SARS-CoV-2.8
Fewer data are available about patients’ abilities to go about the activities of their lives, nor is as much known about the relationships between new symptoms and other impacts. Most of the available information is from health systems during the initial surge of COVID-19 in early 2020—when testing for SARS-CoV-2 was limited even in the inpatient setting; when hospitals’ postdischarge care systems may have been heavily disrupted; and when clinicians were often reasonably focused primarily on reducing mortality in their first cases of COVID-19 rather than promoting recovery from an often-survivable illness. Increasing evidence shows that the inpatient case-fatality rate of COVID-19 is improving over time9,10; this makes unclear the generalizability of outcomes data from early COVID-19 patients to more recent patients.11
Therefore, we report multicenter measurements of incident levels of persistent cardiopulmonary symptoms, disability, return to baseline, and impact on employment among a recent cohort of COVID-19 patients hospitalized around the United States during the “third wave” of COVID-19—fall and winter 2020-2021. We focus on the 1-month time point after hospital discharge, as this time point is still in the early vulnerable period during which hospital transition-of-care programs are understood to have responsibility.
METHODS
The first 253 patients who completed 1-month postdischarge telephone follow-up surveys from the ongoing nationwide BLUE CORAL study were included. BLUE CORAL will enroll up to 1,500 hospitalized COVID-19 patients at 36 US centers (the identities of which are reported in Appendix 1) as a part of the National Heart, Lung, and Blood Institute’s Prevention and Early Treatment of Acute Lung Injury (PETAL) Network. We report here on survey questions that allowed for a clear comparison to be made between 1-month follow-up responses and pre-COVID baseline variables; these comparisons were based on (1) previous in-hospital assessment; (2) explicitly asking patients to compare to pre-COVID-19 levels; or (3) explicitly asking patients for changes in relation to their COVID-19 hospitalization. Items were chosen for inclusion in this report without looking at their association with other variables.
This research was approved by the Vanderbilt Institutional Review Board (IRB), serving as central IRB for the PETAL Network; patients or their surrogates provided informed consent.
Participants
Patients with COVID-19 were identified during hospitalization and within 14 days of a positive molecular test for SARS-CoV-2. Eligible patients presented with fever and/or respiratory signs/symptoms, such as hypoxemia, shortness of breath, or infiltrates on chest imaging. Patients were enrolled within the first 72 hours of hospitalization (in order to avoid oversampling patients with relatively longer stays, and to study the biology of early COVID-19), and excluded if they had comfort-care orders (because of their limited likelihood of surviving to follow-up), or were incarcerated (because of difficulties in obtaining truly open informed consent and likely difficulties in follow-up). Pertinently, patients were not required to be in the intensive care unit.
Surviving patients who spoke English or Spanish, were not homeless on hospital admission, and were neither significantly disabled nor significantly cognitively impaired were eligible for follow-up. “Not significantly disabled” was defined as having limitations due to health on no more than three activities of daily living before their COVID-19 hospitalization, as assessed at BLUE CORAL enrollment; this was chosen because of the potentially limited sensitivity of many of our questionnaires to detect an impact of COVID-19 in patients with greater than this level of disability. We included patients who were able to consent for themselves in the study, or for whom the legally appointed representative consenting on their behalf in the hospital reported no evidence of cognitive impairment, defined as no more than four of the problems on the eight-item Alzheimer’s Dementia (AD8) scale.12-14
Data Collection
One-month surveys were administered to patients or, when necessary, their proxies; the complete English- and Spanish-language instruments are presented in Appendix 2. Study data were collected and managed using REDCap electronic data capture tools hosted at the University of Michigan.15,16
Patients were contacted via phone by trained interviewers beginning 21 days after hospital discharge; interviews were completed a median of 47 days after discharge (interquartile range [IQR], 26-61). Efforts prioritized former patients completing surveys themselves by phone, but a well-informed proxy was approached if needed. Proxies, who included spouses, adult children, or other relatives, family friends, or primary caregivers, were in regular contact with the patient and understood the patient’s health status. If necessary, the survey could be completed over multiple phone calls, and a written, mail-back option was available. Other best practices in accurate survey data collection and cohort retention were used.17-19 Participants were given a $10 gift card.
New cardiopulmonary symptoms were queried with symptom-targeted questions informed by the Airways Questionnaire 20,20 the Kansas City Cardiomyopathy Questionnaire,21,22 and the Seattle Angina Questionnaire.23 Whenever a respondent reported a given symptom, they were asked, “Compared to 1 month before your COVID-19 hospitalization, is this better, worse, or about the same?” We counted the number of symptoms which the patient reported as worse.
Using wording from the Health and Retirement Study,24 disability was assessed based on a self-report of any of 14 health-related limitations in activities of daily living or instrumental activities of daily living, as in past studies25: dressing, walking across a room, bathing, eating, getting out of bed, using a toilet, using a map, preparing a hot meal, shopping for groceries, making a phone call, taking medications, paying bills, carrying 10 lb (eg, a heavy bag of groceries), and, as a combined single item, stooping, kneeling, or crouching. Well-chosen proxy reports appear reliable for these items.26 We counted the number of activities for which the patient reported a limitation, comparing those reported at 1 month to those reported during the in-hospital survey assessing pre-illness functioning.
The financial consequences of the COVID-19 hospitalization were assessed in two ways. First, we used a modified version of a World Health Organization Disability Assessment Schedule (WHODAS) 2.0 question27: “Since your COVID-19 hospitalization, how much has your health been a drain on the financial resources of you or your family?” Second, we used the financial toxicity items developed with the Mi-COVID19 study3 based on extensive qualitative interviews with respiratory failure survivors28; these questions were anchored explicitly on “the financial cost of dealing with your COVID-19 hospitalization and related care.”
Data Analysis
There were few missing data, and almost all were on outcome variables. Where present, the degree of missingness is reported and casewise deletion used. Because this was a planned early look at responses to an ongoing survey, with analysis based on the number of accrued responses, the ultimate denominator for response rate calculation is unknown. Therefore, two bounds are presented—the minimum, on the assumption that all remaining uncompleted surveys will be missed; and the maximum, as if the uncompleted surveys were not yet in the eligible denominator.
Variables were summarized with medians and IQRs. Multilevel logistic regression was used to test for differences across demographic characteristics in the rates of development of any new symptom or disability; site-level differences were modeled using a random effect. Gender, race/ethnicity, and age were included in all regressions unless noted otherwise; age was included with both linear and quadratic terms when used as a control variable. For the degree of return to baseline and for the number of new limitations in activities of daily living, we explored associations as dichotomized variables (any/none, using multilevel logistic regression) and as continuous variables (using multilevel linear regression). Percent of variance explained was calculated using the R2 in unadjusted linear regression, and Spearman rank correlations were used to allow nonlinearities in comparisons across outcomes. All adjusted models are presented in Appendix Table 1. Analyses were conducted in Stata 16.1 (StataCorp, 2020); analytic code is presented in Appendix 3, and a log file of all analyses is in Appendix 4.
RESULTS
The 250th 1-month follow-up was completed on February 26, 2021. One month prior, 647 patients had been recruited at 26 centers in the inpatient phase of the study. Patient demographics for the 253 patients surveyed through that date are shown in Appendix Table 2. On the day of the early look at the data, 460 patients had become eligible for 1-month follow-up and 64 patients had been missed for 1-month follow-up (maximum response rate of 79.8%, minimum possible final response rate of 55.0%) (Figure 1). Seven surveys were completed by proxies. Respondents’ median age was 60 years (IQR, 45-68), and 111 (43.4%) were female. Their median hospital length of stay was 5 days(IQR, 3-8) . A total of 236 (93.3%) patients were discharged home, including 197 (77.9%) without home care services and 39 (15.4%) with home care services.
One hundred and thirty-nine patients (56.5%; 95% CI, 50.1%-62.8%) reported at least one new or worsened cardiopulmonary symptom after their COVID-19 hospitalization (Table; seven patients did not respond to these questions). Most patients with new symptoms had one (48 [19.5%]; 95% CI, 14.8%-25.0%) or two (32 [13%]; 95% CI, 9.7%-17.7%) of the new symptoms queried. The most common new cardiopulmonary symptom was cough, reported by 57 (23.2%; 95% CI, 18.0%-29.0%) patients. New oxygen use was reported by 28 (11.4%; 95% CI, 7.7%-16.0%) patients, with another 11 (4.5%; 95% CI, 2.3%-7.9%) reporting increased oxygen requirements. Women were twice as likely as men to report any new cardiopulmonary symptom (adjusted odds ratio [aOR], 2.24; 95% CI, 1.29-3.90) and non-Hispanic Black and Hispanic patients were less likely than White patients to report new symptoms (aOR, 0.31; 95% CI, 0.12-0.83; and aOR, 0.38; 95% CI, 0.21-0.71, respectively). Longer lengths of hospital stay were associated with greater 1-month cardiopulmonary symptoms (aOR, 1.82 per additional week in the hospital; 95% CI, 1.11-2.98), but discharge destination was not (aOR, 0.92; 95% CI, 0.39-1.71).
New limitations in activities of daily living or instrumental activities of daily living were present in 130 (52.8%; 95% CI, 46.4%-59.5%) patients (seven not responding), all of whom had 0 to 3 limitations before their COVID-19 hospitalization. Indeed, 62 (25.2%; 95% CI, 19.9%-31.1%) reported 3 or more new health-related limitations in activities of daily living or instrumental activities of daily living compared to their pre-COVID-19 baseline, as assessed separately during their hospitalization (Figure 2; rates of limitations in individual activities are shown in Appendix Table 3). Older patients were more likely to report a new health-related limitation, and Hispanic patients were less likely to have a new limitation. New limitations were common among patients discharged home without home health services. The number of new cardiopulmonary symptoms explained 11.2% of the variance in the number of new limitations in activities of daily living, a Spearman rank correlation of 0.30 (P < .0001; see Appendix Table 4). More than three in four COVID-19 patients reported new or worsened cardiopulmonary symptoms or new health-related limitations in activities of daily living at 1 month—only 62 (24.5%) patients reported neither.
At 1 month after hospital discharge, 213 (84.2%) patients reported that they were not fully back to their pre-COVID-19 level of functioning (3 declined to answer the question). When asked, “On a scale of 1 to 100, with 100 being all the way back to what you could do before COVID, how close to being back are you?” the median response was 80, with an IQR of 64-95 (Figure 3). Forty-two (16.8%; 95% CI, 12.4%-22.0%) patients reported a level of 50 or below. Women and older patients reported lower levels of return of functioning, as did those with longer hospital stays and new or worsened cardiopulmonary symptoms. Each additional week in hospital length of stay was associated with a 7.5-point lower response to the question (95% CI, –11.2 to –3.8), but discharge destination was not associated with the answer after adjusting for demographics. Patients with and without new limitations in activities of daily living and with and without new cardiopulmonary symptoms were found across the range of self-reported degree of recovery, although patients without a new problem in one of those domains were rarer among those reporting recovery of less than 70. The number of new cardiopulmonary symptoms explained 19.7% of the variance in the response to this question, a Spearman rank correlation of 0.47 (P < .0001).
More than half of respondents (115 [55.0%]; 95% CI, 48.0%-61.9%; 44 not responding) stated that their COVID-19 hospitalization had been a drain on the finances of their family; 53 (25.4%; 95% CI, 19.6%-31.8%; 44 not responding) rated that drain as moderate, severe, or extreme within the first month after hospital discharge. Forty-nine patients (19.8%; 95% CI, 15.1%-25.4%; 6 not responding) reported that they had to change their work because of their COVID-19 hospitalization, and 93 patients (37.8%; 95% CI, 31.7%-44.2%; 7 not responding) reported that a loved one had taken time off work to care for them. Altogether, one in five COVID-19 patients reported that, within the first month after hospital discharge, they used all or most of their savings because of their COVID-19 illness or hospitalization (58 [23.2%]; 95% CI, 18.1%-29.9%; 3 not responding). There were no demographic differences in the likelihood of losing a job or having a loved one take time off for caregiving, but non-Hispanic Black and Hispanic patients were much more likely to report having used all or most of their savings (aOR, 2.96; 95% CI, 1.09-8.04; and aOR, 2.68; 95% CI, 1.35-5.31, respectively) than White patients. Hospital length of stay and discharge destination were not consistently associated with these financial toxicities. The development of new or worsened cardiopulmonary symptoms was not associated with job change or having a caregiver take time off but was associated with increased likelihood of having used all or most savings (aOR, 2.30; 95% CI, 1.12-4.37).
DISCUSSION
In a geographically and demographically diverse national US cohort, we found that a decline in perceived health, new or worsened cardiopulmonary symptoms, new limitations in activities of daily living, and new financial stresses were common among patients hospitalized during the US third wave of COVID-19 at 1 month after hospital discharge. The new cardiopulmonary symptoms were significantly associated with the self-report of incomplete recovery and financial stress, but less closely associated with incident disability, inability to work, and caregiving receipt. There were not consistent differences between any demographic groups on these outcomes. Patients with longer lengths of stay generally reported more problems. New problems were very common among patients discharged directly home without home health services.
These data suggest a broad range of new problems among survivors of COVID-19 hospitalization. Moreover, these problems are not well-correlated with each other. This raises the possibility that there may be multiple phenotypes of post-acute sequelae after COVID-19 hospitalization. It is not clear to what extent these differences are mediated by differences in tissue damage from or immunologic response to SARS-CoV-2, distinct from or interacting with other elements of treatment, hospitalization, or the illness experience. The degree of financial stress, savings loss, and job dislocation reported here suggests these patients will face substantial challenges in guiding their own recovery in the absence of a dedicated set of services.28,29The persistent symptoms faced by these COVID-19 patients can be considered in the context of post-acute sequelae among survivors of community-acquired pneumonia in previous studies, as summarized in a recent systematic review.30 For example, only 35% of a large cohort of adults with community-acquired pneumonia who were evaluated in the emergency department were completely free of pneumonia-related symptoms 6 weeks after antibiotic therapy.31,32 Limitations in activities of daily living have been reported at 1 month after community-acquired pneumonia33; rehospitalization and early post-discharge mortality rates may also be similar.34,35 These findings suggest that the persistent problems of both COVID-19 and other pneumonia patients may highlight important opportunities for improvements in healthcare systems,36 and that burdensome postacute sequelae of COVID-19 may not be attributable solely to distinctive features of the SARS-CoV-2 virus.
A majority of patients discharged home without home health services reported new difficulties in their activities of daily living; 77% of patients with new disability at 1 month had been discharged without home services. These data, however, do not show to what extent this lack of home health services resulted from lack of referral for services, home health provider unavailability, or patient refusal of recommended services. Nonetheless, this nonreceipt of home health services may have been consequential. Among hospitalized patients recovering from pneumonia pre-COVID, the use of post-hospital physical and occupational therapy was associated with reduced risk of readmissions and death.37 This association was greater among patients with lower baseline mobility scores and in patients discharged to home directly. Further, the risk of poor outcomes decreased in a dose-response fashion with increased post-hospital therapy delivery. Failure to provide services for postdischarge disability was previously identified as a potential vulnerability of patients during COVID-19.38
This study adds to the literature. The focus on sequelae perceived by the patient to be incident, as distinguished from symptoms and disability existing before COVID-19, increases the likelihood that these data reflect the influence of the COVID-19 hospitalization. These data emphasize that, despite relatively brief hospitalizations, diverse problems are quite common and consequential for patients’ ability to return to their pre-COVID-19 roles. They further add to the literature by demonstrating the relatively loose coupling between various ways in which postacute sequelae of COVID-19 might be defined: the cardiopulmonary symptoms examined here, the patient’s reported completeness of recovery, the financial stresses the hospitalization placed on the patient and their family, or the development of new limitations in activities of daily living.
Our findings highlight a potential second public health crisis from COVID, related to post-COVID recovery, resulting from the incident disability and economic loss among COVID survivors. While much attention is paid to deaths from COVID, there is less (albeit growing) recognition of the long-term consequences in survivors of COVID-19.39 The downstream economic impacts from job loss and financial insolvency for COVID-19 survivors have ramifications for caregivers, family units that include dependents, and the broader US economy—and may do so for generations if uncorrected, as has been suggested after the 1918 influenza pandemic.40 These data may, indeed, look worse at later follow-up given the delay in hospital billing and new expenses in the wake of illness and hospitalization.28,36,41 It is important that the healthcare system and policymakers consider early investments in post-hospital rehabilitation and adaptive services to allow workers to return to the workforce as soon as possible, and prepare for an increased need for financial support for recovering COVID patients.42
Importantly, these data cannot distinguish between the impact of SARS-CoV-2 infection itself from the treatment received for COVID-19 or other non-COVID-19-specific aspects of hospital care. COVID-19 inpatient case fatality rates and management have changed over time, and so generalizability to future cohorts is unknown.9-11 This cohort was recruited in the inpatient setting at largely teaching hospitals; therefore, these patients’ experience may be not be representative of all hospitalized COVID-19 patients during this time period. The generalizability of hospital-based studies to patients not hospitalized for COVID-19 remains a subject of active inquiry. We only interviewed patients who were not homeless (excluding 7 of 588 eligible, 1.2%) and who spoke English or Spanish (excluding 4 of 588 eligible, 0.7%); these and other inclusion/exclusion criteria should be considered when evaluating the generalizability of these findings to other patients. We did not prospectively collect measures of fatigue to examine this important and complex symptom, nor did we evaluate outpatient therapy. Finally, self-report was used, rather than using objective measurements of what the patient did or did not do in their home environment. This is consistent with clinical practice that emphasizes patients as primary reporters of their present state, but may introduce measurement error compared to more invasive strategies if those are considered the gold standard.
Conclusion
Patients who survived hospitalization from COVID-19 during the period of August 2020 to January 2021 continued to face significant burdens of new cardiopulmonary symptoms, incomplete recovery, disability, and financial toxicity, all of which extend to patients discharged directly home without services. The correlations between these potential symptoms are no more than partial, and an exclusive focus on one area may neglect other areas of patient need.
Acknowledgments
The authors thank the patients and families of the Biology and Longitudinal Epidemiology: COVID-19 Observational (BLUE CORAL) study for their generous sharing of their time with us. We acknowledge Hallie C Prescott (University of Michigan and VA Ann Arbor) for her assistance in developing the financial toxicity questions.
1. Rajan S, Khunti K, Alwan N, et al. In the Wake of the Pandemic: Preparing for Long COVID. World Health Organization, Regional Office for Europe; 2021.
2. Bowles KH, McDonald M, Barrón Y, Kennedy E, O’Connor M, Mikkelsen M. Surviving COVID-19 after hospital discharge: symptom, functional, and adverse outcomes of home health recipients. Ann Intern Med. 2021;174(3):316-325. https://doi.org/10.7326/M20-5206
3. Chopra V, Flanders SA, O’Malley M, Malani AN, Prescott HC. Sixty-day outcomes among patients hospitalized with COVID-19. Ann Intern Med. 2021;174(4):576-578. https://doi.org/10.7326/M20-5661
4. Bellan M, Soddu D, Balbo PE, et al. Respiratory and psychophysical sequelae among patients with COVID-19 four months after hospital discharge. JAMA Netw Open. 2021;4(1):e2036142. https://doi.org/10.1001/jamanetworkopen.2020.36142
5. Huang C, Huang L, Wang Y, et al. 6-month consequences of COVID-19 in patients discharged from hospital: a cohort study. Lancet. 2021;397(10270):220-232. https://doi.org/10.1016/S0140-6736(20)32656-8
6. Robillard R, Daros AR, Phillips JL, et al. Emerging new psychiatric symptoms and the worsening of pre-existing mental disorders during the COVID-19 pandemic: a Canadian multisite study. Can J Psychiatry. 2021 Jan 19. [Epub ahead of print] https://doi.org/10.1177/0706743720986786
7. Logue JK, Franko NM, McCulloch DJ, et al. Sequelae in adults at 6 months after COVID-19 infection. JAMA Netw Open. 2021;4(2):e210830. https://doi.org/10.1001/jamanetworkopen.2021.0830
8. Fan VS, Dominitz JA, Eastment MC, et al. Risk factors for testing positive for SARS-CoV-2 in a national US healthcare system. Clin Infect Dis. 2020 Oct 27. [Epub ahead of print] https://doi.org/10.1093/cid/ciaa1624
9. Prescott HC, Levy MM. Survival from severe coronavirus disease 2019: is it changing? Crit Care Med. 2021;49(2):351-353. https://doi.org/10.1097/CCM.0000000000004753
10. Nguyen NT, Chinn J, Nahmias J, et al. Outcomes and mortality among adults hospitalized with COVID-19 at US medical centers. JAMA Netw Open. 2021;4(3):e210417. https://doi.org/10.1001/jamanetworkopen.2021.0417
11. Iwashyna TJ, Angus DC. Declining case fatality rates for severe sepsis: good data bring good news with ambiguous implications. JAMA. 2014;311(13):1295-1297. https://doi.org/10.1001/jama.2014.2639
12. Galvin JE, Roe CM, Coats MA, Morris JC. Patient’s rating of cognitive ability: using the AD8, a brief informant interview, as a self-rating tool to detect dementia. Arch Neurol. 2007;64(5):725-730. https://doi.org/10.1001/archneur.64.5.725
13. Galvin JE, Roe CM, Xiong C, Morris JC. Validity and reliability of the AD8 informant interview in dementia. Neurology. 2006;67(11):1942-1948. https://doi.org/10.1212/01.wnl.0000247042.15547.eb
14. Galvin JE, Roe CM, Powlishta KK, et al. The AD8: a brief informant interview to detect dementia. Neurology. 2005;65(4):559-564. https://doi.org/10.1212/01.wnl.0000172958.95282.2a
15. Harris PA, Taylor R, Thielke R, Payne J, Gonzalez N, Conde JG. Research electronic data capture (REDCap)--a metadata-driven methodology and workflow process for providing translational research informatics support. J Biomed Inform. 2009;42(2):377-381. https://doi.org/10.1016/j.jbi.2008.08.010
16. Harris PA, Taylor R, Minor BL, et al. The REDCap consortium: building an international community of software platform partners. J Biomed Inform. 2019;95:103208. https://doi.org/10.1016/j.jbi.2019.103208
17. Robinson KA, Dinglas VD, Sukrithan V, et al. Updated systematic review identifies substantial number of retention strategies: using more strategies retains more study participants. J Clin Epidemiol. 2015;68(12):1481-1487. https://doi.org/10.1016/j.jclinepi.2015.04.013
18. Groves RM, Fowler FJ, Couper MP, Lepkowski JM, Singer E, Tourangeau R. Survey Methodology. 2nd ed. Wiley; 2009.
19. Lynn P. Methodology of Longitudinal Studies. Wiley; 2009.
20. Quirk F, Jones P. Repeatability of two new short airways questionnaires. Thorax. 1994;49:1075.
21. Pettersen KI, Reikvam A, Rollag A, Stavem K. Reliability and validity of the Kansas City cardiomyopathy questionnaire in patients with previous myocardial infarction. Eur J Heart Fail. 2005;7(2):235-242. https://doi.org/10.1016/j.ejheart.2004.05.012
22. Green CP, Porter CB, Bresnahan DR, Spertus JA. Development and evaluation of the Kansas City Cardiomyopathy Questionnaire: a new health status measure for heart failure. J Am Coll Cardiol. 2000;35(5):1245-1255. https://doi.org/10.1016/s0735-1097(00)00531-3
23. Spertus JA, Winder JA, Dewhurst TA, et al. Development and evaluation of the Seattle Angina Questionnaire: a new functional status measure for coronary artery disease. J Am Coll Cardiol. 1995;25(2):333-341. https://doi.org/10.1016/0735-1097(94)00397-9
24. Fonda S, Herzog AR. Documentation of Physical Functioning Measured in the Health and Retirement Study and the Asset and Health Dynamics Among the Oldest Old Study. Institute for Social Research Survey Research Center; 2004.
25. National Heart, Lung, and Blood Institute PETAL Clinical Trials Network; Moss M, Huang DT, Brower RG, et al. Early neuromuscular blockade in the acute respiratory distress syndrome. N Engl J Med. 2019;380(21):1997-2008. https://doi.org/10.1056/NEJMoa1901686
26. Ahasic AM, Van Ness PH, Murphy TE, Araujo KL, Pisani MA. Functional status after critical illness: agreement between patient and proxy assessments. Age Ageing. 2015;44(3):506-510. https://doi.org/10.1093/ageing/afu163
27. Üstün T, Kostanjsek N, Chatterji S, Rehm J. Measuring Health and Disability: Manual for WHO Disability Assessment Schedule WHODAS 2.0. World Health Organization; 2010.
28. Hauschildt KE, Seigworth C, Kamphuis LA, et al. Financial toxicity after acute respiratory distress syndrome: a national qualitative cohort study. Crit Care Med. 2020;48(8):1103-1110. https://doi.org/10.1097/CCM.0000000000004378
29. Watkins-Taylor C. Remaking a Life: How Women Living with HIV/AIDS Confront Inequality. University of California Press; 2019.
30. Pick HJ, Bolton CE, Lim WS, McKeever TM. Patient-reported outcome measures in the recovery of adults hospitalised with community-acquired pneumonia: a systematic review. Eur Respir J. 2019;53(3):1802165. https://doi.org/1183/13993003.02165-2018
31. Marrie TJ, Lau CY, Wheeler SL, Wong CJ, Feagan BG. Predictors of symptom resolution in patients with community-acquired pneumonia. Clin Infect Dis. 2000;31(6):1362-1367. https://doi.org/10.1086/317495
32. Wyrwich KW, Yu H, Sato R, Powers JH. Observational longitudinal study of symptom burden and time for recovery from community-acquired pneumonia reported by older adults surveyed nationwide using the CAP Burden of Illness Questionnaire. Patient Relat Outcome Meas. 2015;6:215-223. https://doi.org/10.2147/PROM.S85779
33. Daniel P, Bewick T, McKeever TM, et al. Healthcare reconsultation in working-age adults following hospitalisation for community-acquired pneumonia. Clin Med (Lond). 2018;18(1):41-46. https://doi.org/10.7861/clinmedicine.18-1-41
34. Donnelly JP, Wang XQ, Iwashyna TJ, Prescott HC. Readmission and death after hospitalization for COVID-19 in a large multihospital system. JAMA. 2021;325(3):304-306. https://doi.org/10.1001/jama.2020.21465
35. Viglianti EM, Prescott HC, Liu V, Escobar GJ, Iwashyna TJ. Individual and health system variation in rehospitalizations the year after pneumonia. Medicine (Baltimore). 2017;96(31):e7695. https://doi.org/10.1097/MD.0000000000007695
36. McPeake J, Boehm LM, Hibbert E, et al. Key components of ICU recovery programs: what did patients report provided benefit? Crit Care Explor. 2020;2(4):e0088. https://doi.org/10.1097/CCE.0000000000000088
37. Freburger JK, Chou A, Euloth T, Matcho B. Variation in acute care rehabilitation and 30-day hospital readmission or mortality in adult patients with pneumonia. JAMA Netw Open. 2020;3(9):e2012979. https://doi.org/10.1001/jamanetworkopen.2020.12979
38. Iwashyna TJ, Johnson AB, McPeake JM, McSparron J, Prescott HC, Sevin C. The dirty dozen: common errors on discharging patients recovering from critical illness. Life in the Fastlane. November 3, 2020. Accessed July 1, 2021. https://litfl.com/the-dirty-dozen-common-errors-on-discharging-patients-recovering-from-critical-illness/
39. Lowenstein F, Davis H. Long Covid is not rare. It’s a health crisis. New York Times. March 17, 2021. Accessed July 1, 2021. https://www.nytimes.com/2021/03/17/opinion/long-covid.html
40. Cook CJ, Fletcher JM, Forgues A. Multigenerational effects of early-life health shocks. Demography. 2019;56(5):1855-1874. https://doi.org/10.1007/s13524-019-00804-3
41. McPeake J, Mikkelsen ME, Quasim T, et al. Return to employment after critical illness and its association with psychosocial outcomes. A systematic review and meta-analysis. Ann Am Thorac Soc. 2019;16(10):1304-1311. https://doi.org/10.1513/AnnalsATS.201903-248OC
42. McPeake JM, Henderson P, Darroch G, et al. Social and economic problems of ICU survivors identified by a structured social welfare consultation. Crit Care. 2019;23(1):153. https://doi.org/10.1186/s13054-019-2442-5
© 2021 Society of Hospital Medicine